Coal Run Village, KY Map & Demographics
Coal Run Village Map
Coal Run Village Overview
$30,991
PER CAPITA INCOME
$56,042
AVG FAMILY INCOME
$43,315
AVG HOUSEHOLD INCOME
45.1%
WAGE / INCOME GAP [ % ]
54.9¢/ $1
WAGE / INCOME GAP [ $ ]
$9,123
FAMILY INCOME DEFICIT
0.54
INEQUALITY / GINI INDEX
1,519
TOTAL POPULATION
692
MALE POPULATION
827
FEMALE POPULATION
83.68
MALES / 100 FEMALES
119.51
FEMALES / 100 MALES
42.4
MEDIAN AGE
2.7
AVG FAMILY SIZE
2.3
AVG HOUSEHOLD SIZE
666
LABOR FORCE [ PEOPLE ]
55.3%
PERCENT IN LABOR FORCE
3.0%
UNEMPLOYMENT RATE
Income in Coal Run Village
Income Overview in Coal Run Village
Per Capita Income in Coal Run Village is $30,991, while median incomes of families and households are $56,042 and $43,315 respectively.
| Characteristic | Number | Measure |
| Per Capita Income | 1,519 | $30,991 |
| Median Family Income | 451 | $56,042 |
| Mean Family Income | 451 | $64,660 |
| Median Household Income | 656 | $43,315 |
| Mean Household Income | 656 | $71,489 |
| Income Deficit | 451 | $9,123 |
| Wage / Income Gap (%) | 1,519 | 45.05% |
| Wage / Income Gap ($) | 1,519 | 54.95¢ per $1 |
| Gini / Inequality Index | 1,519 | 0.54 |
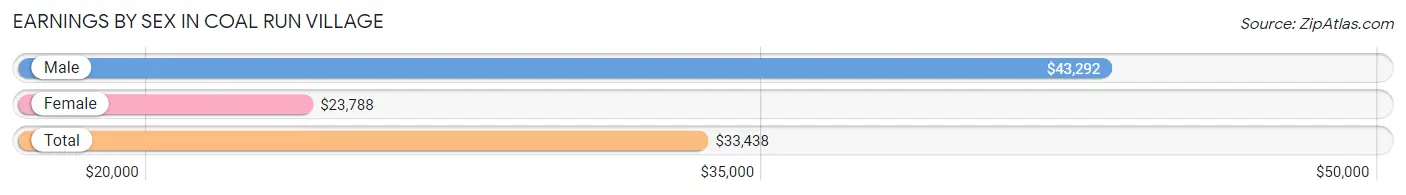
Earnings by Sex in Coal Run Village
Average Earnings in Coal Run Village are $33,438, $43,292 for men and $23,788 for women, a difference of 45.1%.
| Sex | Number | Average Earnings |
| Male | 311 (46.5%) | $43,292 |
| Female | 358 (53.5%) | $23,788 |
| Total | 669 (100.0%) | $33,438 |
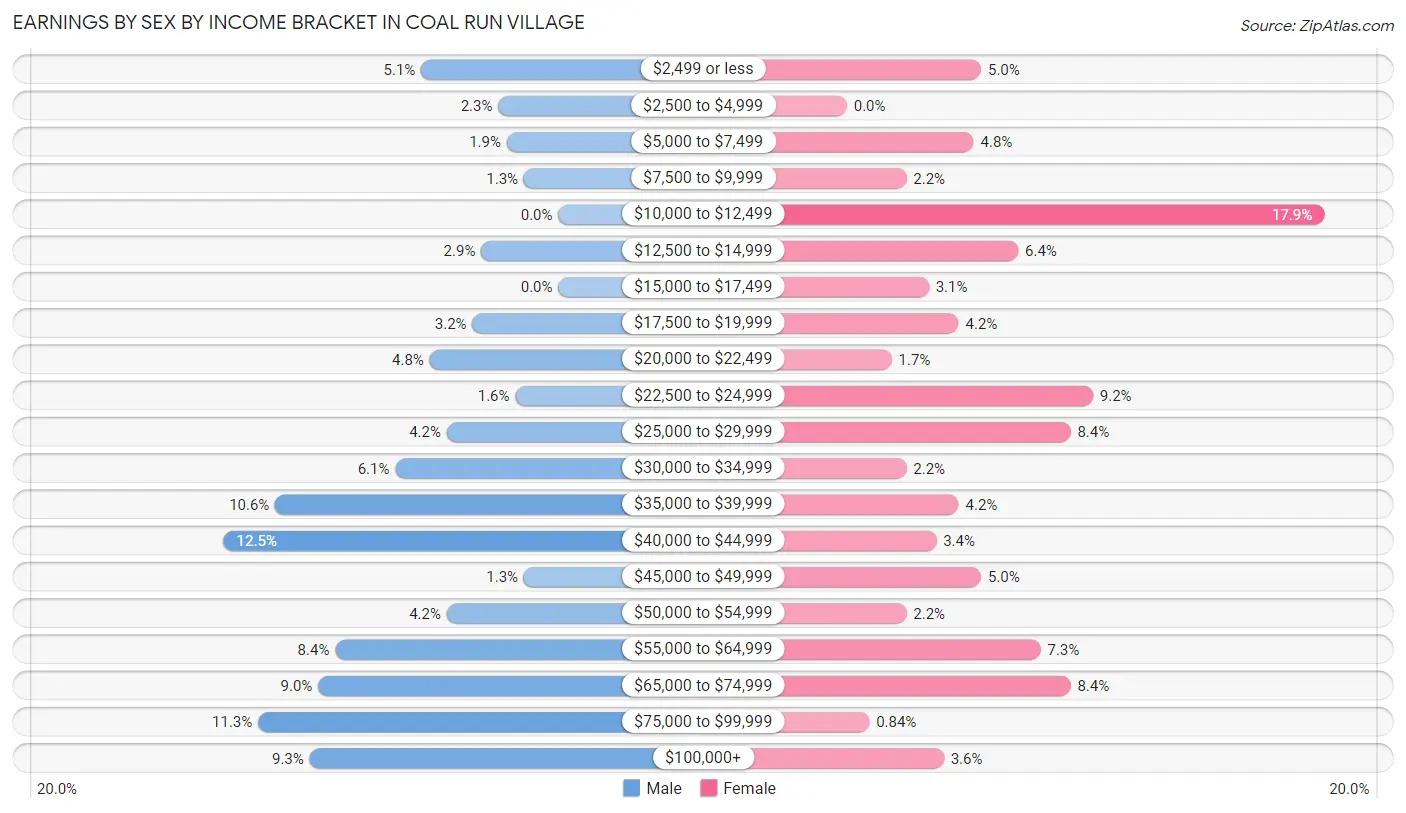
Earnings by Sex by Income Bracket in Coal Run Village
The most common earnings brackets in Coal Run Village are $40,000 to $44,999 for men (39 | 12.5%) and $10,000 to $12,499 for women (64 | 17.9%).
| Income | Male | Female |
| $2,499 or less | 16 (5.1%) | 18 (5.0%) |
| $2,500 to $4,999 | 7 (2.2%) | 0 (0.0%) |
| $5,000 to $7,499 | 6 (1.9%) | 17 (4.8%) |
| $7,500 to $9,999 | 4 (1.3%) | 8 (2.2%) |
| $10,000 to $12,499 | 0 (0.0%) | 64 (17.9%) |
| $12,500 to $14,999 | 9 (2.9%) | 23 (6.4%) |
| $15,000 to $17,499 | 0 (0.0%) | 11 (3.1%) |
| $17,500 to $19,999 | 10 (3.2%) | 15 (4.2%) |
| $20,000 to $22,499 | 15 (4.8%) | 6 (1.7%) |
| $22,500 to $24,999 | 5 (1.6%) | 33 (9.2%) |
| $25,000 to $29,999 | 13 (4.2%) | 30 (8.4%) |
| $30,000 to $34,999 | 19 (6.1%) | 8 (2.2%) |
| $35,000 to $39,999 | 33 (10.6%) | 15 (4.2%) |
| $40,000 to $44,999 | 39 (12.5%) | 12 (3.4%) |
| $45,000 to $49,999 | 4 (1.3%) | 18 (5.0%) |
| $50,000 to $54,999 | 13 (4.2%) | 8 (2.2%) |
| $55,000 to $64,999 | 26 (8.4%) | 26 (7.3%) |
| $65,000 to $74,999 | 28 (9.0%) | 30 (8.4%) |
| $75,000 to $99,999 | 35 (11.3%) | 3 (0.8%) |
| $100,000+ | 29 (9.3%) | 13 (3.6%) |
| Total | 311 (100.0%) | 358 (100.0%) |
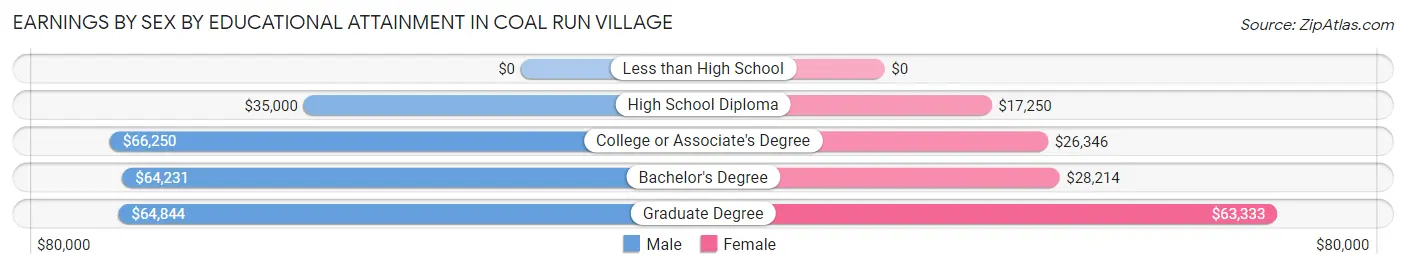
Earnings by Sex by Educational Attainment in Coal Run Village
Average earnings in Coal Run Village are $52,981 for men and $25,598 for women, a difference of 51.7%. Men with an educational attainment of college or associate's degree enjoy the highest average annual earnings of $66,250, while those with high school diploma education earn the least with $35,000. Women with an educational attainment of graduate degree earn the most with the average annual earnings of $63,333, while those with high school diploma education have the smallest earnings of $17,250.
| Educational Attainment | Male Income | Female Income |
| Less than High School | - | - |
| High School Diploma | $35,000 | $17,250 |
| College or Associate's Degree | $66,250 | $26,346 |
| Bachelor's Degree | $64,231 | $28,214 |
| Graduate Degree | $64,844 | $63,333 |
| Total | $52,981 | $25,598 |
Family Income in Coal Run Village
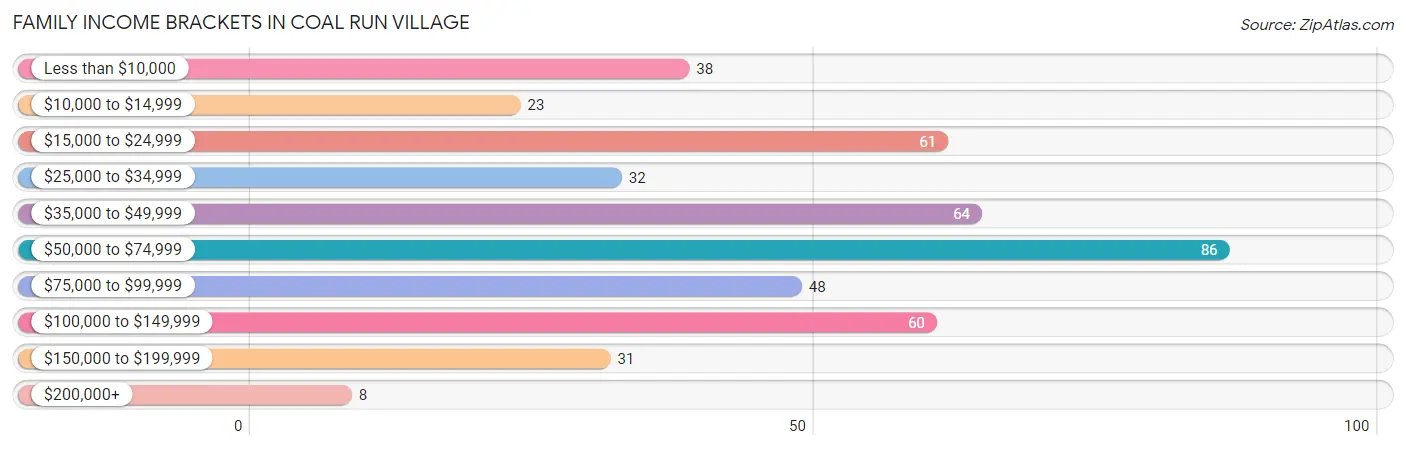
Family Income Brackets in Coal Run Village
According to the Coal Run Village family income data, there are 86 families falling into the $50,000 to $74,999 income range, which is the most common income bracket and makes up 19.1% of all families. Conversely, the $200,000+ income bracket is the least frequent group with only 8 families (1.8%) belonging to this category.
| Income Bracket | # Families | % Families |
| Less than $10,000 | 38 | 8.4% |
| $10,000 to $14,999 | 23 | 5.1% |
| $15,000 to $24,999 | 61 | 13.5% |
| $25,000 to $34,999 | 32 | 7.1% |
| $35,000 to $49,999 | 64 | 14.2% |
| $50,000 to $74,999 | 86 | 19.1% |
| $75,000 to $99,999 | 48 | 10.6% |
| $100,000 to $149,999 | 60 | 13.3% |
| $150,000 to $199,999 | 31 | 6.9% |
| $200,000+ | 8 | 1.8% |
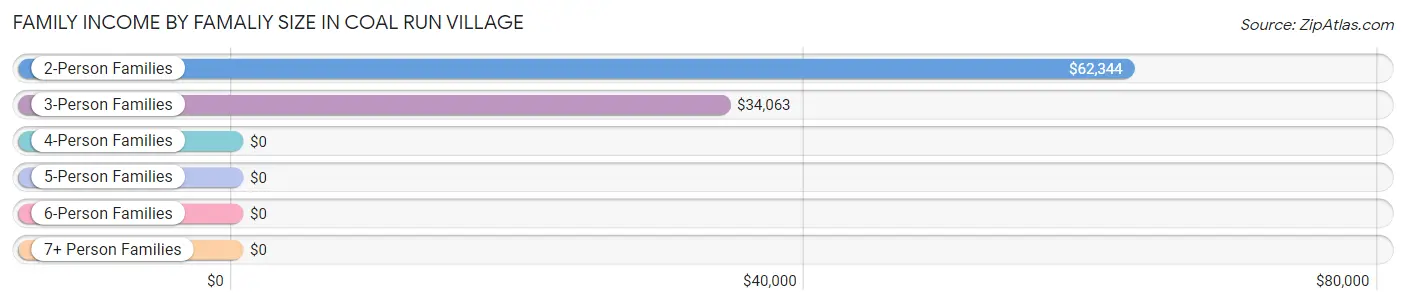
Family Income by Famaliy Size in Coal Run Village
2-person families (281 | 62.3%) account for the highest median family income in Coal Run Village with $62,344 per family, while 2-person families (281 | 62.3%) have the highest median income of $31,172 per family member.
| Income Bracket | # Families | Median Income |
| 2-Person Families | 281 (62.3%) | $62,344 |
| 3-Person Families | 93 (20.6%) | $34,063 |
| 4-Person Families | 47 (10.4%) | $0 |
| 5-Person Families | 20 (4.4%) | $0 |
| 6-Person Families | 4 (0.9%) | $0 |
| 7+ Person Families | 6 (1.3%) | $0 |
| Total | 451 (100.0%) | $56,042 |
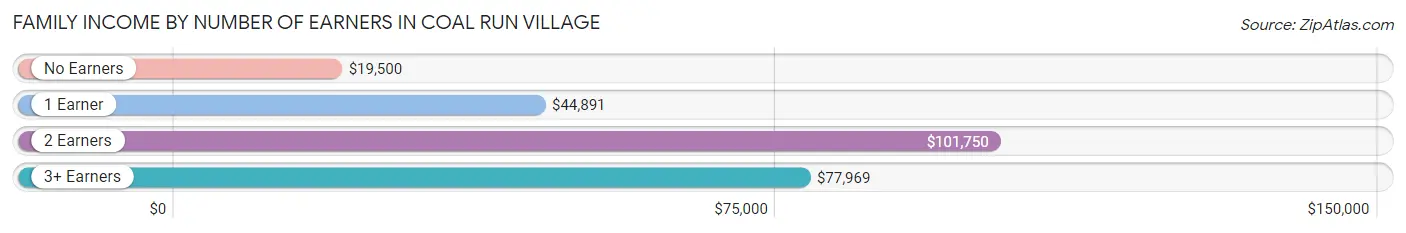
Family Income by Number of Earners in Coal Run Village
The median family income in Coal Run Village is $56,042, with families comprising 2 earners (132) having the highest median family income of $101,750, while families with no earners (152) have the lowest median family income of $19,500, accounting for 29.3% and 33.7% of families, respectively.
| Number of Earners | # Families | Median Income |
| No Earners | 152 (33.7%) | $19,500 |
| 1 Earner | 140 (31.0%) | $44,891 |
| 2 Earners | 132 (29.3%) | $101,750 |
| 3+ Earners | 27 (6.0%) | $77,969 |
| Total | 451 (100.0%) | $56,042 |
Household Income in Coal Run Village
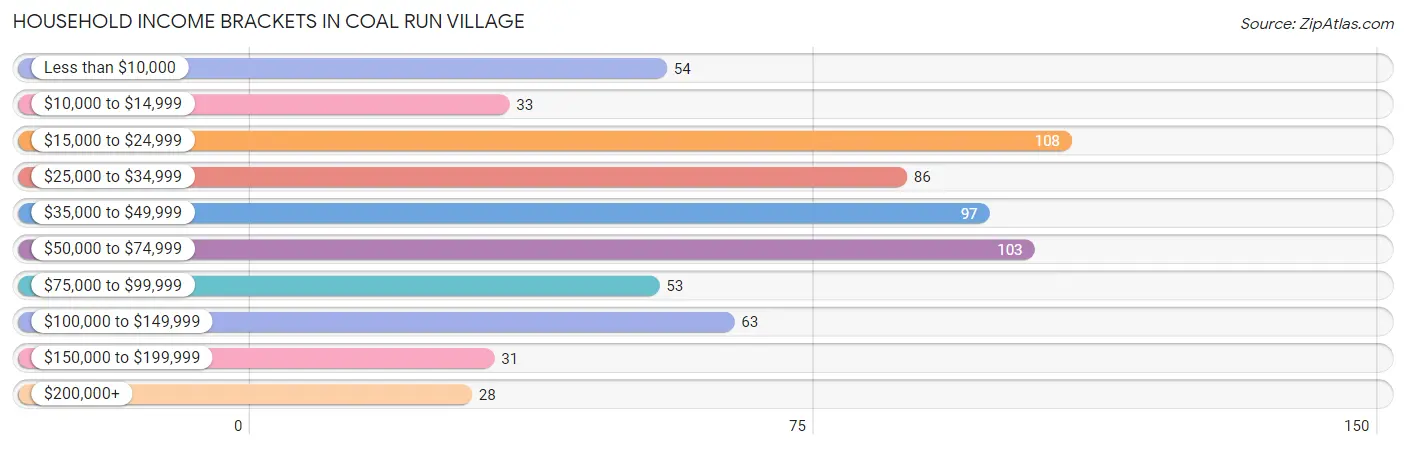
Household Income Brackets in Coal Run Village
With 108 households falling in the category, the $15,000 to $24,999 income range is the most frequent in Coal Run Village, accounting for 16.5% of all households. In contrast, only 28 households (4.3%) fall into the $200,000+ income bracket, making it the least populous group.
| Income Bracket | # Households | % Households |
| Less than $10,000 | 54 | 8.2% |
| $10,000 to $14,999 | 33 | 5.0% |
| $15,000 to $24,999 | 108 | 16.5% |
| $25,000 to $34,999 | 86 | 13.1% |
| $35,000 to $49,999 | 97 | 14.8% |
| $50,000 to $74,999 | 103 | 15.7% |
| $75,000 to $99,999 | 53 | 8.1% |
| $100,000 to $149,999 | 63 | 9.6% |
| $150,000 to $199,999 | 31 | 4.7% |
| $200,000+ | 28 | 4.3% |
Household Income by Householder Age in Coal Run Village
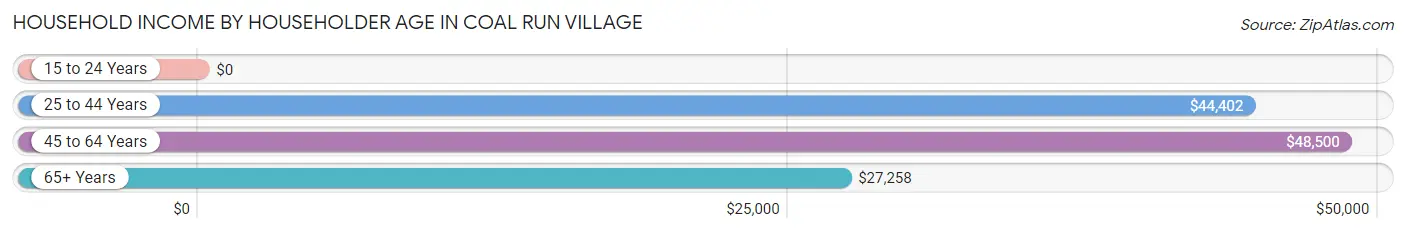
The median household income in Coal Run Village is $43,315, with the highest median household income of $48,500 found in the 45 to 64 years age bracket for the primary householder. A total of 228 households (34.8%) fall into this category. Meanwhile, the 15 to 24 years age bracket for the primary householder has the lowest median household income of $0, with 33 households (5.0%) in this group.
| Income Bracket | # Households | Median Income |
| 15 to 24 Years | 33 (5.0%) | $0 |
| 25 to 44 Years | 195 (29.7%) | $44,402 |
| 45 to 64 Years | 228 (34.8%) | $48,500 |
| 65+ Years | 200 (30.5%) | $27,258 |
| Total | 656 (100.0%) | $43,315 |
Poverty in Coal Run Village
Income Below Poverty by Sex and Age in Coal Run Village
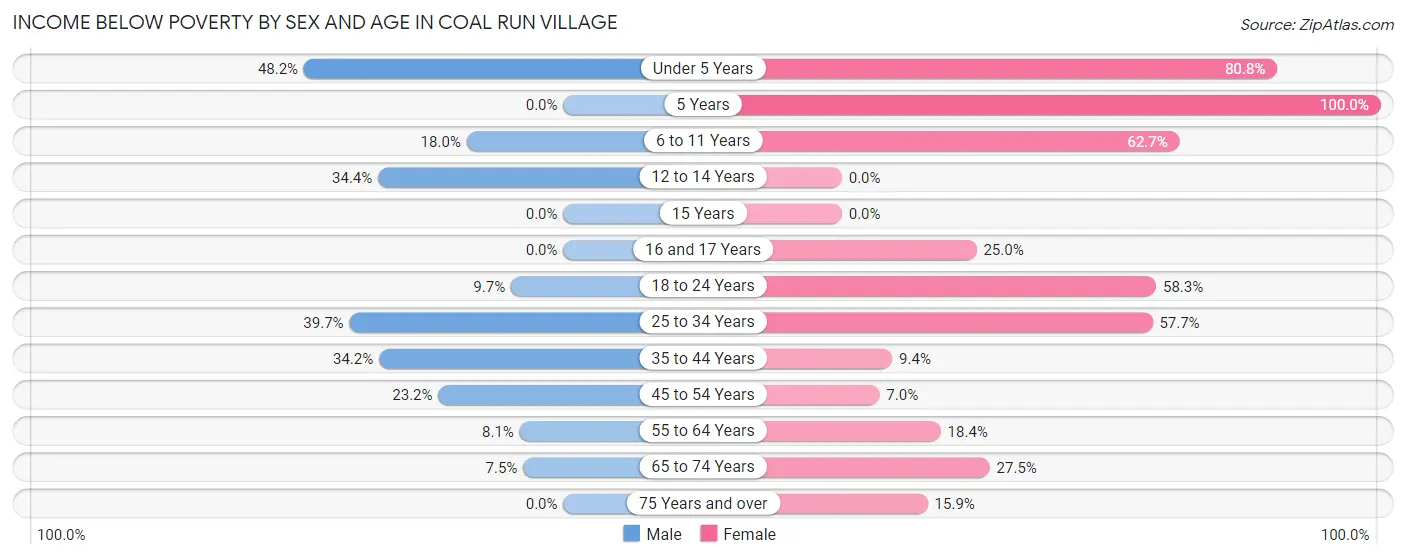
With 21.1% poverty level for males and 33.0% for females among the residents of Coal Run Village, under 5 year old males and 5 year old females are the most vulnerable to poverty, with 26 males (48.1%) and 3 females (100.0%) in their respective age groups living below the poverty level.
| Age Bracket | Male | Female |
| Under 5 Years | 26 (48.1%) | 59 (80.8%) |
| 5 Years | 0 (0.0%) | 3 (100.0%) |
| 6 to 11 Years | 7 (17.9%) | 42 (62.7%) |
| 12 to 14 Years | 11 (34.4%) | 0 (0.0%) |
| 15 Years | 0 (0.0%) | 0 (0.0%) |
| 16 and 17 Years | 0 (0.0%) | 7 (25.0%) |
| 18 to 24 Years | 7 (9.7%) | 21 (58.3%) |
| 25 to 34 Years | 27 (39.7%) | 64 (57.7%) |
| 35 to 44 Years | 26 (34.2%) | 10 (9.3%) |
| 45 to 54 Years | 29 (23.2%) | 6 (7.0%) |
| 55 to 64 Years | 6 (8.1%) | 20 (18.3%) |
| 65 to 74 Years | 7 (7.4%) | 28 (27.5%) |
| 75 Years and over | 0 (0.0%) | 11 (15.9%) |
| Total | 146 (21.1%) | 271 (33.0%) |
Income Above Poverty by Sex and Age in Coal Run Village
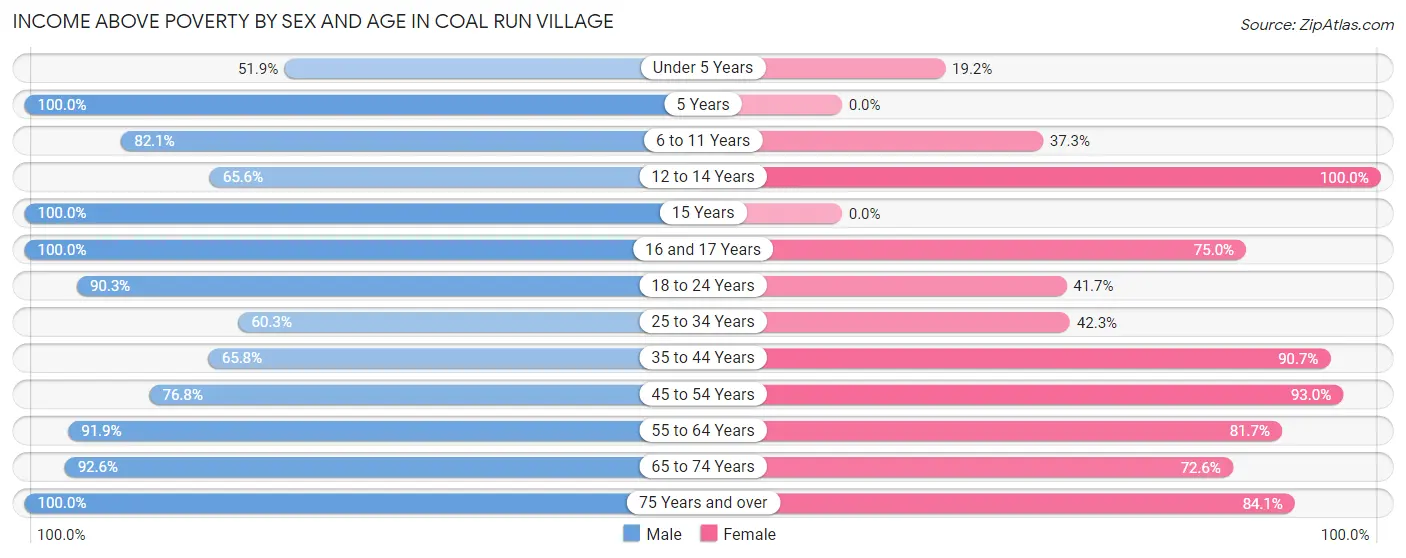
According to the poverty statistics in Coal Run Village, males aged 5 years and females aged 12 to 14 years are the age groups that are most secure financially, with 100.0% of males and 100.0% of females in these age groups living above the poverty line.
| Age Bracket | Male | Female |
| Under 5 Years | 28 (51.8%) | 14 (19.2%) |
| 5 Years | 4 (100.0%) | 0 (0.0%) |
| 6 to 11 Years | 32 (82.1%) | 25 (37.3%) |
| 12 to 14 Years | 21 (65.6%) | 30 (100.0%) |
| 15 Years | 6 (100.0%) | 0 (0.0%) |
| 16 and 17 Years | 7 (100.0%) | 21 (75.0%) |
| 18 to 24 Years | 65 (90.3%) | 15 (41.7%) |
| 25 to 34 Years | 41 (60.3%) | 47 (42.3%) |
| 35 to 44 Years | 50 (65.8%) | 97 (90.6%) |
| 45 to 54 Years | 96 (76.8%) | 80 (93.0%) |
| 55 to 64 Years | 68 (91.9%) | 89 (81.7%) |
| 65 to 74 Years | 87 (92.5%) | 74 (72.6%) |
| 75 Years and over | 41 (100.0%) | 58 (84.1%) |
| Total | 546 (78.9%) | 550 (67.0%) |
Income Below Poverty Among Married-Couple Families in Coal Run Village
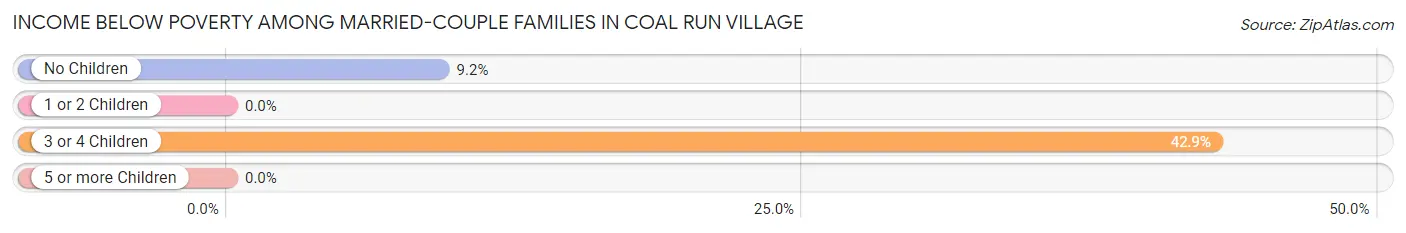
The poverty statistics for married-couple families in Coal Run Village show that 8.6% or 27 of the total 314 families live below the poverty line. Families with 3 or 4 children have the highest poverty rate of 42.9%, comprising of 6 families. On the other hand, families with 1 or 2 children have the lowest poverty rate of 0.0%, which includes 0 families.
| Children | Above Poverty | Below Poverty |
| No Children | 207 (90.8%) | 21 (9.2%) |
| 1 or 2 Children | 72 (100.0%) | 0 (0.0%) |
| 3 or 4 Children | 8 (57.1%) | 6 (42.9%) |
| 5 or more Children | 0 (0.0%) | 0 (0.0%) |
| Total | 287 (91.4%) | 27 (8.6%) |
Income Below Poverty Among Single-Parent Households in Coal Run Village
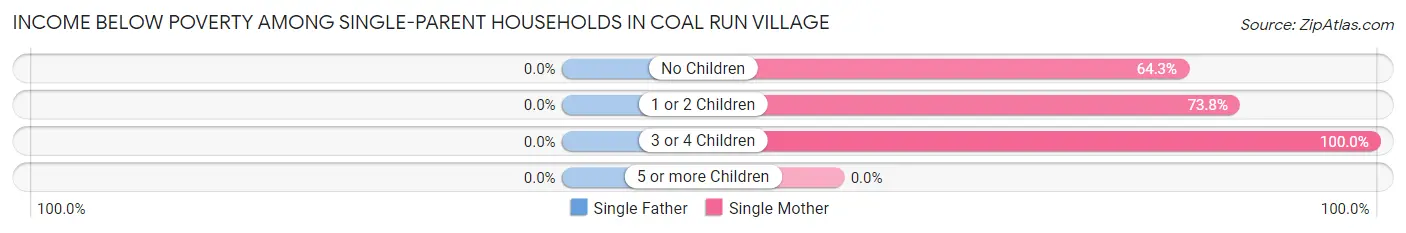
| Children | Single Father | Single Mother |
| No Children | 0 (0.0%) | 27 (64.3%) |
| 1 or 2 Children | 0 (0.0%) | 45 (73.8%) |
| 3 or 4 Children | 0 (0.0%) | 3 (100.0%) |
| 5 or more Children | 0 (0.0%) | 0 (0.0%) |
| Total | 0 (0.0%) | 75 (70.8%) |
Income Below Poverty Among Married-Couple vs Single-Parent Households in Coal Run Village
The poverty data for Coal Run Village shows that 27 of the married-couple family households (8.6%) and 75 of the single-parent households (54.7%) are living below the poverty level. Within the married-couple family households, those with 3 or 4 children have the highest poverty rate, with 6 households (42.9%) falling below the poverty line. Among the single-parent households, those with 1 or 2 children have the highest poverty rate, with 45 household (70.3%) living below poverty.
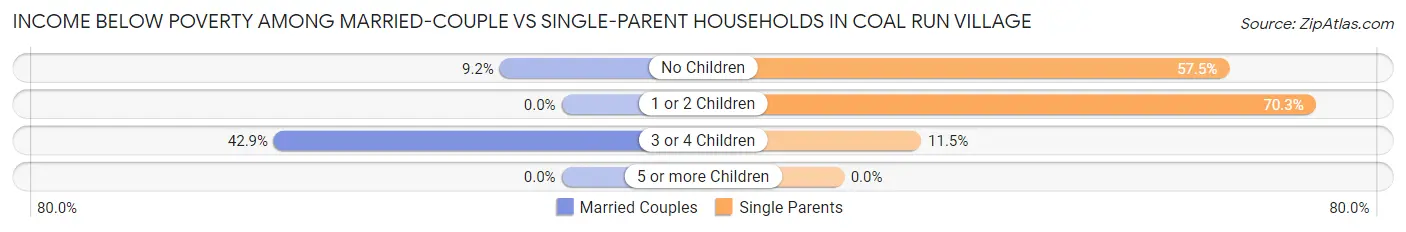
| Children | Married-Couple Families | Single-Parent Households |
| No Children | 21 (9.2%) | 27 (57.5%) |
| 1 or 2 Children | 0 (0.0%) | 45 (70.3%) |
| 3 or 4 Children | 6 (42.9%) | 3 (11.5%) |
| 5 or more Children | 0 (0.0%) | 0 (0.0%) |
| Total | 27 (8.6%) | 75 (54.7%) |
Race in Coal Run Village
The most populous races in Coal Run Village are White / Caucasian (1,395 | 91.8%), Hispanic or Latino (147 | 9.7%), and Some other Race (91 | 6.0%).
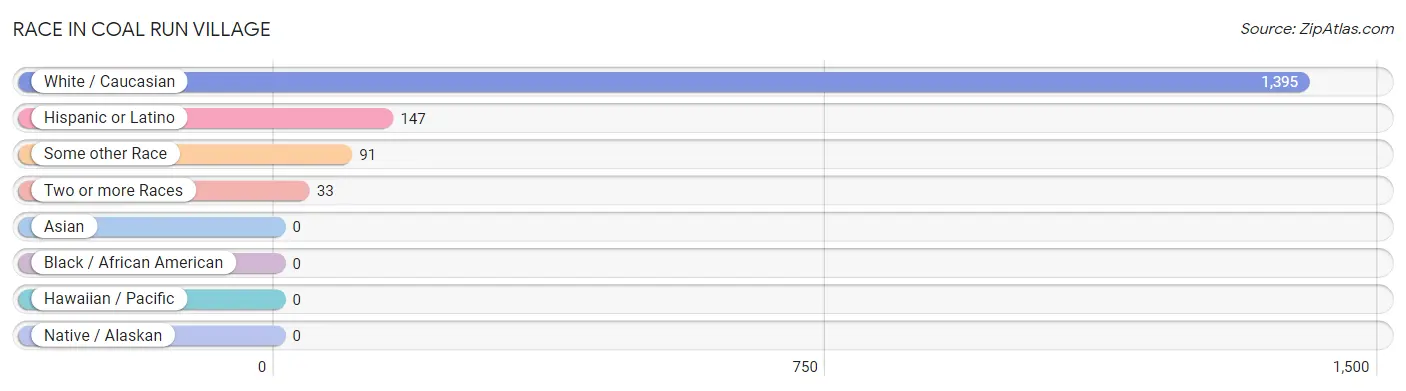
| Race | # Population | % Population |
| Asian | 0 | 0.0% |
| Black / African American | 0 | 0.0% |
| Hawaiian / Pacific | 0 | 0.0% |
| Hispanic or Latino | 147 | 9.7% |
| Native / Alaskan | 0 | 0.0% |
| White / Caucasian | 1,395 | 91.8% |
| Two or more Races | 33 | 2.2% |
| Some other Race | 91 | 6.0% |
| Total | 1,519 | 100.0% |
Ancestry in Coal Run Village
The most populous ancestries reported in Coal Run Village are American (294 | 19.4%), Irish (194 | 12.8%), English (173 | 11.4%), German (155 | 10.2%), and Mexican (125 | 8.2%), together accounting for 61.9% of all Coal Run Village residents.
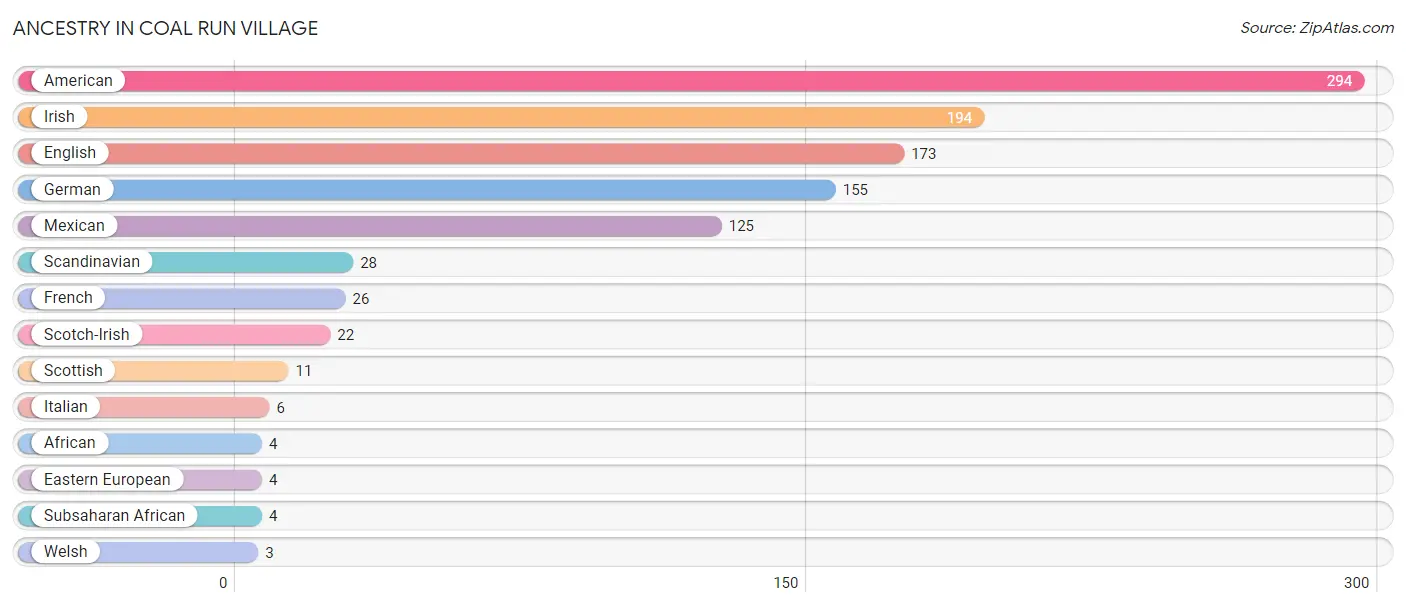
| Ancestry | # Population | % Population |
| African | 4 | 0.3% |
| American | 294 | 19.4% |
| Eastern European | 4 | 0.3% |
| English | 173 | 11.4% |
| French | 26 | 1.7% |
| German | 155 | 10.2% |
| Irish | 194 | 12.8% |
| Italian | 6 | 0.4% |
| Mexican | 125 | 8.2% |
| Scandinavian | 28 | 1.8% |
| Scotch-Irish | 22 | 1.5% |
| Scottish | 11 | 0.7% |
| Subsaharan African | 4 | 0.3% |
| Welsh | 3 | 0.2% | View All 14 Rows |
Immigrants in Coal Run Village
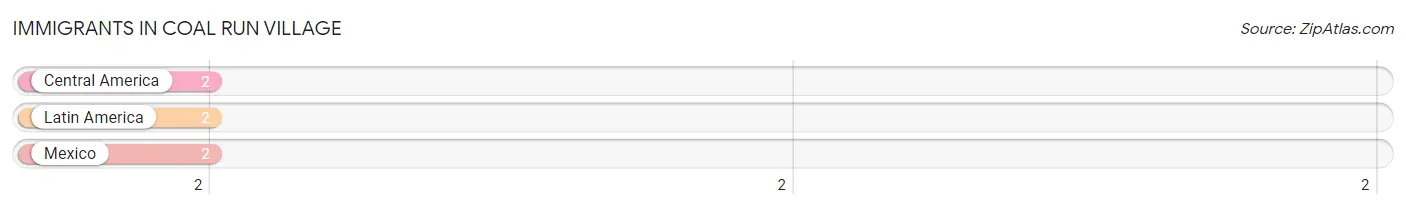
The most numerous immigrant groups reported in Coal Run Village came from Central America (2 | 0.1%), Latin America (2 | 0.1%), and Mexico (2 | 0.1%), together accounting for 0.4% of all Coal Run Village residents.
| Immigration Origin | # Population | % Population |
| Central America | 2 | 0.1% |
| Latin America | 2 | 0.1% |
| Mexico | 2 | 0.1% | View All 3 Rows |
Sex and Age in Coal Run Village
Sex and Age in Coal Run Village
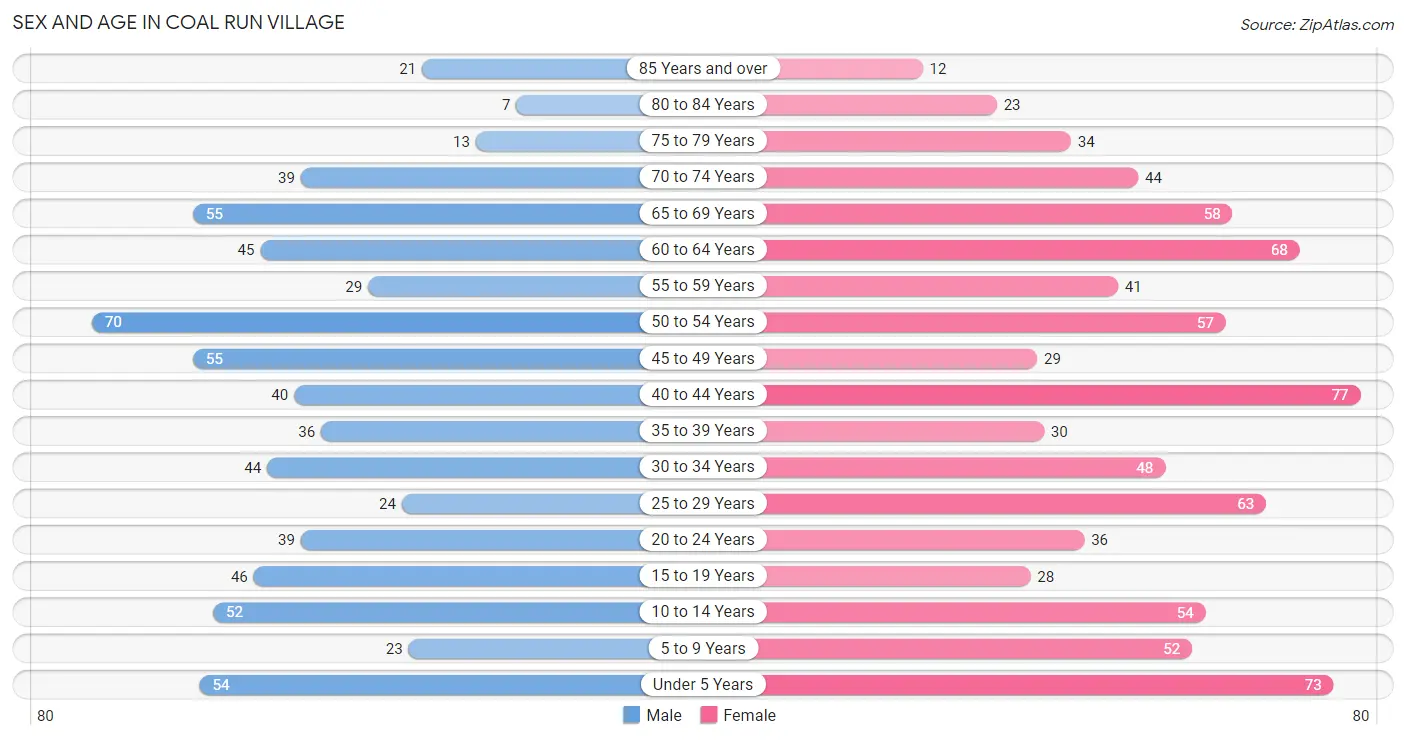
The most populous age groups in Coal Run Village are 50 to 54 Years (70 | 10.1%) for men and 40 to 44 Years (77 | 9.3%) for women.
| Age Bracket | Male | Female |
| Under 5 Years | 54 (7.8%) | 73 (8.8%) |
| 5 to 9 Years | 23 (3.3%) | 52 (6.3%) |
| 10 to 14 Years | 52 (7.5%) | 54 (6.5%) |
| 15 to 19 Years | 46 (6.7%) | 28 (3.4%) |
| 20 to 24 Years | 39 (5.6%) | 36 (4.3%) |
| 25 to 29 Years | 24 (3.5%) | 63 (7.6%) |
| 30 to 34 Years | 44 (6.4%) | 48 (5.8%) |
| 35 to 39 Years | 36 (5.2%) | 30 (3.6%) |
| 40 to 44 Years | 40 (5.8%) | 77 (9.3%) |
| 45 to 49 Years | 55 (8.0%) | 29 (3.5%) |
| 50 to 54 Years | 70 (10.1%) | 57 (6.9%) |
| 55 to 59 Years | 29 (4.2%) | 41 (5.0%) |
| 60 to 64 Years | 45 (6.5%) | 68 (8.2%) |
| 65 to 69 Years | 55 (8.0%) | 58 (7.0%) |
| 70 to 74 Years | 39 (5.6%) | 44 (5.3%) |
| 75 to 79 Years | 13 (1.9%) | 34 (4.1%) |
| 80 to 84 Years | 7 (1.0%) | 23 (2.8%) |
| 85 Years and over | 21 (3.0%) | 12 (1.5%) |
| Total | 692 (100.0%) | 827 (100.0%) |
Families and Households in Coal Run Village
Median Family Size in Coal Run Village
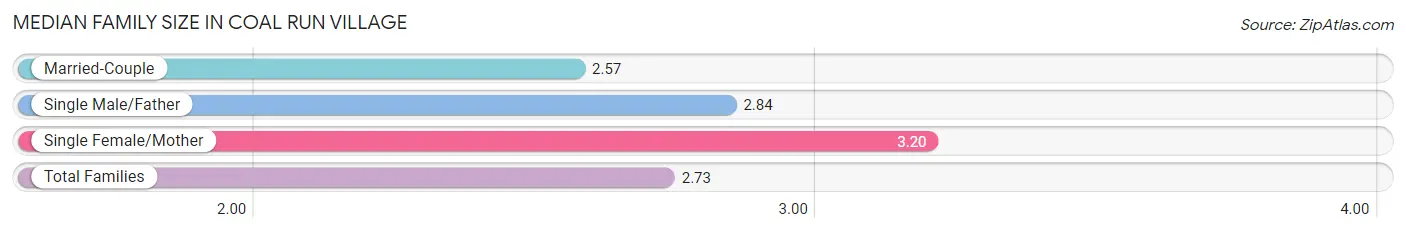
The median family size in Coal Run Village is 2.73 persons per family, with single female/mother families (106 | 23.5%) accounting for the largest median family size of 3.2 persons per family. On the other hand, married-couple families (314 | 69.6%) represent the smallest median family size with 2.57 persons per family.
| Family Type | # Families | Family Size |
| Married-Couple | 314 (69.6%) | 2.57 |
| Single Male/Father | 31 (6.9%) | 2.84 |
| Single Female/Mother | 106 (23.5%) | 3.20 |
| Total Families | 451 (100.0%) | 2.73 |
Median Household Size in Coal Run Village
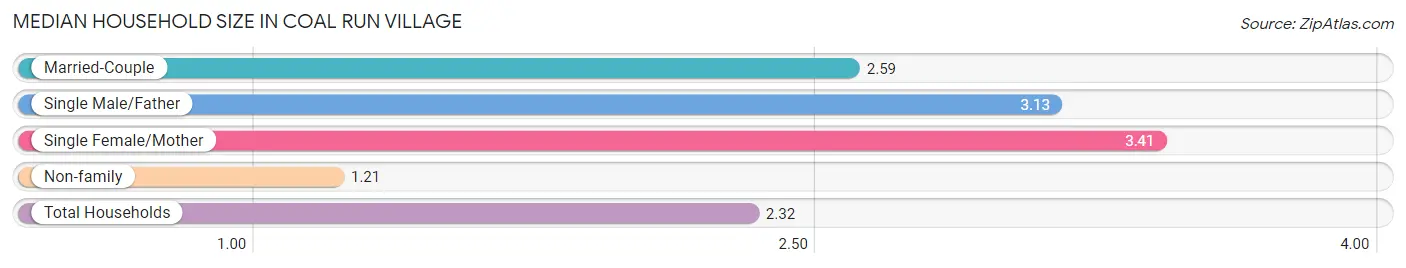
The median household size in Coal Run Village is 2.32 persons per household, with single female/mother households (106 | 16.2%) accounting for the largest median household size of 3.41 persons per household. non-family households (205 | 31.2%) represent the smallest median household size with 1.21 persons per household.
| Household Type | # Households | Household Size |
| Married-Couple | 314 (47.9%) | 2.59 |
| Single Male/Father | 31 (4.7%) | 3.13 |
| Single Female/Mother | 106 (16.2%) | 3.41 |
| Non-family | 205 (31.2%) | 1.21 |
| Total Households | 656 (100.0%) | 2.32 |
Household Size by Marriage Status in Coal Run Village
Out of a total of 656 households in Coal Run Village, 451 (68.8%) are family households, while 205 (31.2%) are nonfamily households. The most numerous type of family households are 2-person households, comprising 259, and the most common type of nonfamily households are 1-person households, comprising 172.
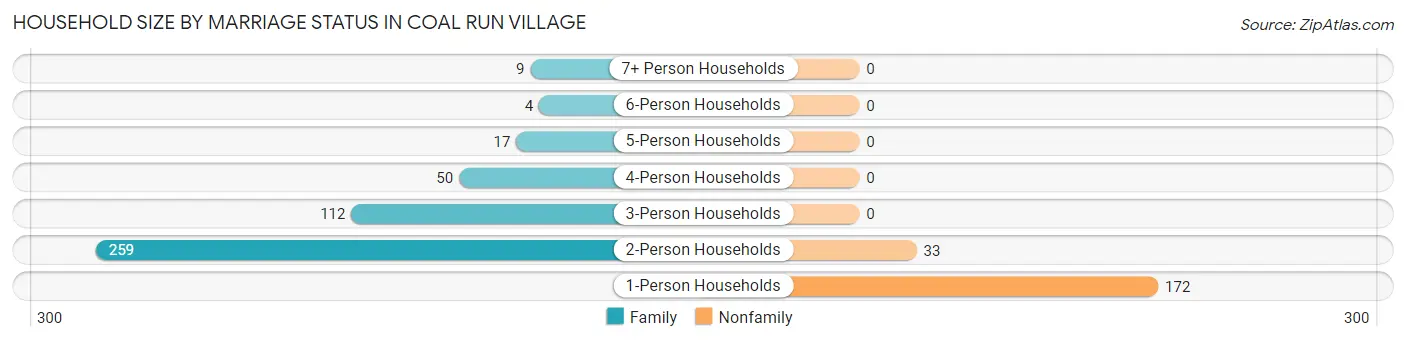
| Household Size | Family Households | Nonfamily Households |
| 1-Person Households | - | 172 (26.2%) |
| 2-Person Households | 259 (39.5%) | 33 (5.0%) |
| 3-Person Households | 112 (17.1%) | 0 (0.0%) |
| 4-Person Households | 50 (7.6%) | 0 (0.0%) |
| 5-Person Households | 17 (2.6%) | 0 (0.0%) |
| 6-Person Households | 4 (0.6%) | 0 (0.0%) |
| 7+ Person Households | 9 (1.4%) | 0 (0.0%) |
| Total | 451 (68.8%) | 205 (31.2%) |
Female Fertility in Coal Run Village
Fertility by Age in Coal Run Village
Average fertility rate in Coal Run Village is 25.0 births per 1,000 women. Women in the age bracket of 35 to 50 years have the highest fertility rate with 28.0 births per 1,000 women. Women in the age bracket of 20 to 34 years acount for 50.0% of all women with births.
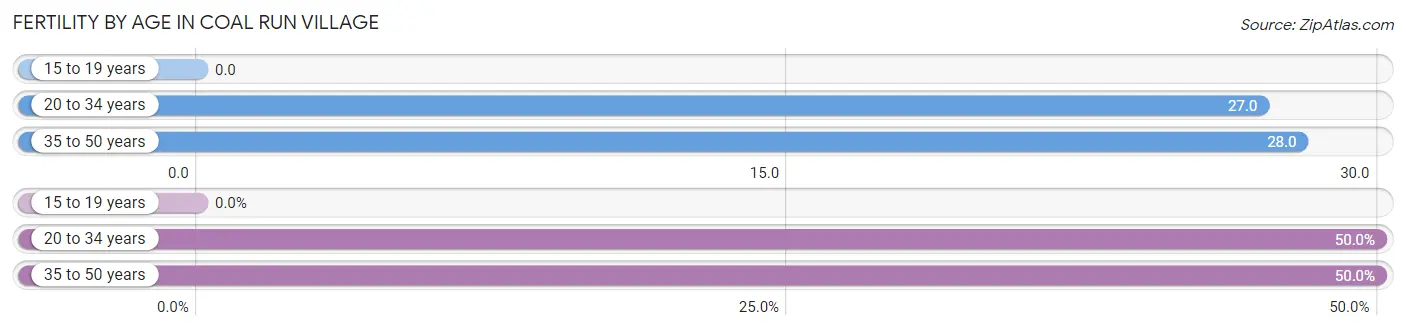
| Age Bracket | Women with Births | Births / 1,000 Women |
| 15 to 19 years | 0 (0.0%) | 0.0 |
| 20 to 34 years | 4 (50.0%) | 27.0 |
| 35 to 50 years | 4 (50.0%) | 28.0 |
| Total | 8 (100.0%) | 25.0 |
Fertility by Age by Marriage Status in Coal Run Village
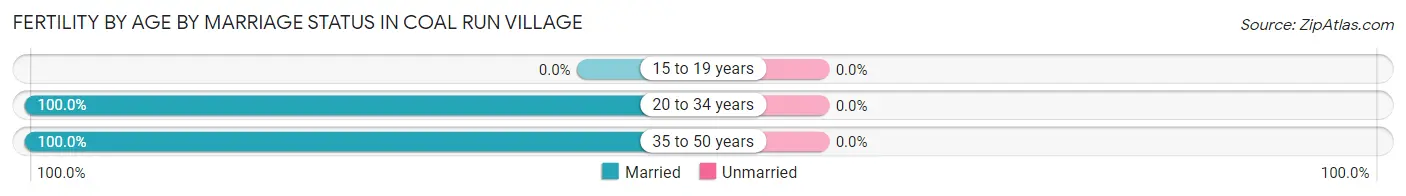
| Age Bracket | Married | Unmarried |
| 15 to 19 years | 0 (0.0%) | 0 (0.0%) |
| 20 to 34 years | 4 (100.0%) | 0 (0.0%) |
| 35 to 50 years | 4 (100.0%) | 0 (0.0%) |
| Total | 8 (100.0%) | 0 (0.0%) |
Fertility by Education in Coal Run Village
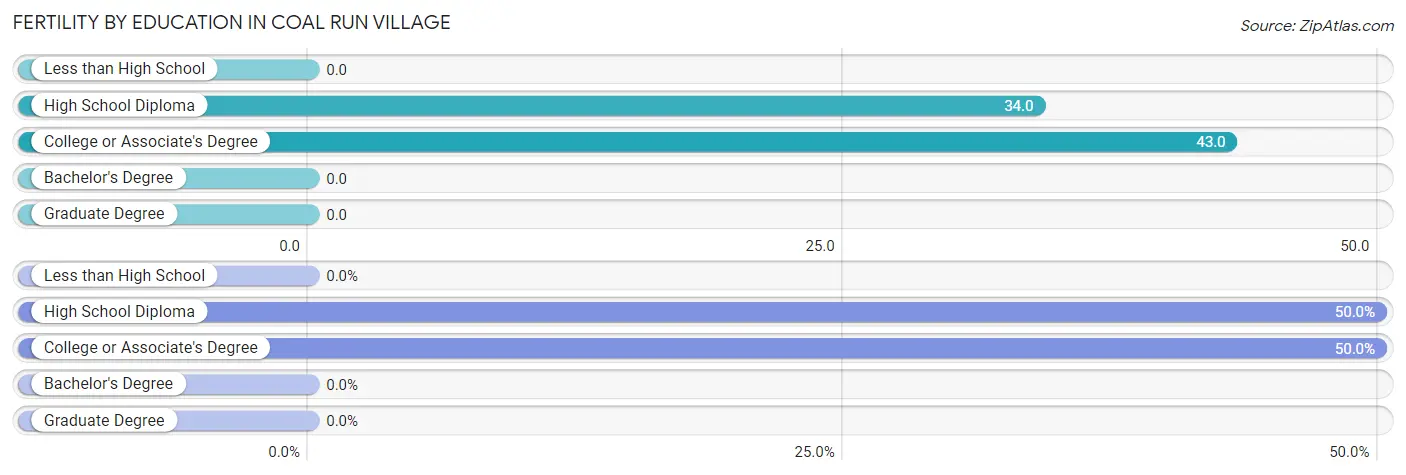
| Educational Attainment | Women with Births | Births / 1,000 Women |
| Less than High School | 0 (0.0%) | 0.0 |
| High School Diploma | 4 (50.0%) | 34.0 |
| College or Associate's Degree | 4 (50.0%) | 43.0 |
| Bachelor's Degree | 0 (0.0%) | 0.0 |
| Graduate Degree | 0 (0.0%) | 0.0 |
| Total | 8 (100.0%) | 25.0 |
Fertility by Education by Marriage Status in Coal Run Village
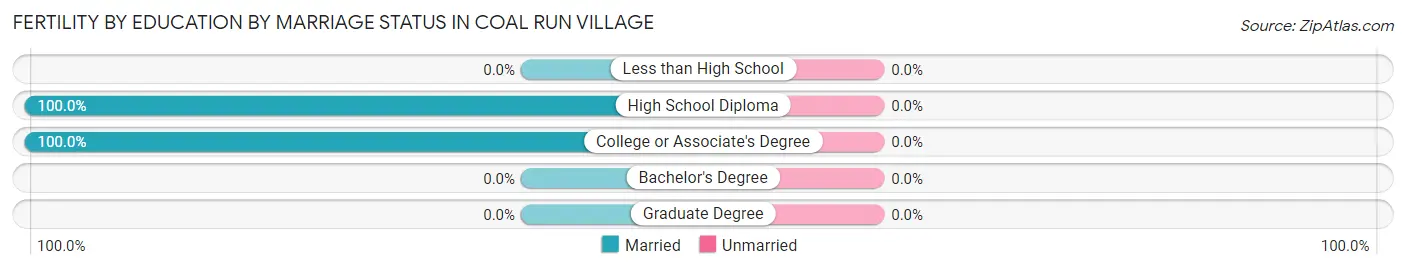
| Educational Attainment | Married | Unmarried |
| Less than High School | 0 (0.0%) | 0 (0.0%) |
| High School Diploma | 4 (100.0%) | 0 (0.0%) |
| College or Associate's Degree | 4 (100.0%) | 0 (0.0%) |
| Bachelor's Degree | 0 (0.0%) | 0 (0.0%) |
| Graduate Degree | 0 (0.0%) | 0 (0.0%) |
| Total | 8 (100.0%) | 0 (0.0%) |
Employment Characteristics in Coal Run Village
Employment by Class of Employer in Coal Run Village
Among the 646 employed individuals in Coal Run Village, private company employees (472 | 73.1%), not-for-profit organizations (70 | 10.8%), and state government employees (47 | 7.3%) make up the most common classes of employment.
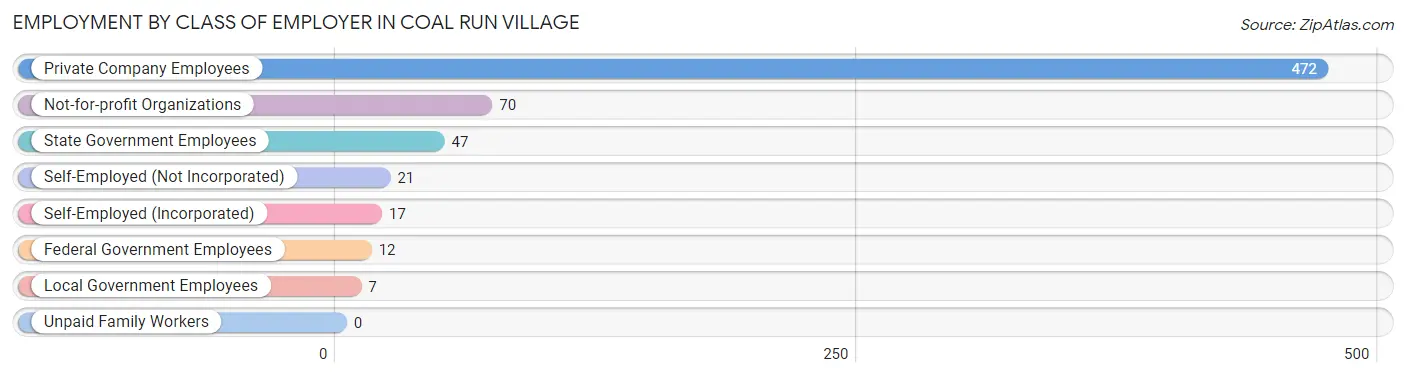
| Employer Class | # Employees | % Employees |
| Private Company Employees | 472 | 73.1% |
| Self-Employed (Incorporated) | 17 | 2.6% |
| Self-Employed (Not Incorporated) | 21 | 3.3% |
| Not-for-profit Organizations | 70 | 10.8% |
| Local Government Employees | 7 | 1.1% |
| State Government Employees | 47 | 7.3% |
| Federal Government Employees | 12 | 1.9% |
| Unpaid Family Workers | 0 | 0.0% |
| Total | 646 | 100.0% |
Employment Status by Age in Coal Run Village
According to the labor force statistics for Coal Run Village, out of the total population over 16 years of age (1,205), 55.3% or 666 individuals are in the labor force, with 3.0% or 20 of them unemployed. The age group with the highest labor force participation rate is 30 to 34 years, with 83.7% or 77 individuals in the labor force. Within the labor force, the 16 to 19 years age range has the highest percentage of unemployed individuals, with 11.3% or 6 of them being unemployed.
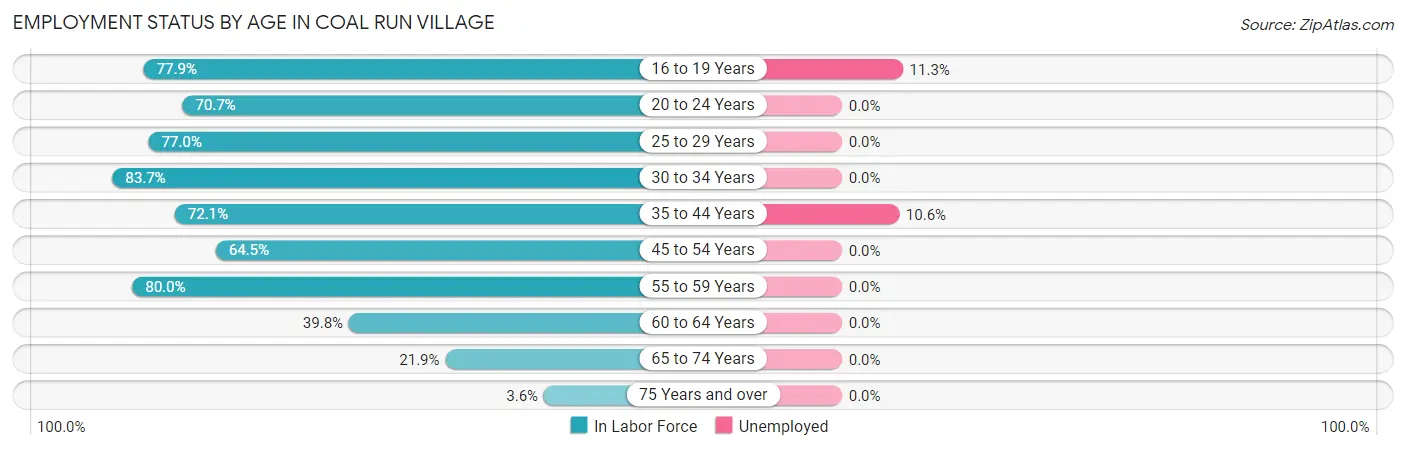
| Age Bracket | In Labor Force | Unemployed |
| 16 to 19 Years | 53 (77.9%) | 6 (11.3%) |
| 20 to 24 Years | 53 (70.7%) | 0 (0.0%) |
| 25 to 29 Years | 67 (77.0%) | 0 (0.0%) |
| 30 to 34 Years | 77 (83.7%) | 0 (0.0%) |
| 35 to 44 Years | 132 (72.1%) | 14 (10.6%) |
| 45 to 54 Years | 136 (64.5%) | 0 (0.0%) |
| 55 to 59 Years | 56 (80.0%) | 0 (0.0%) |
| 60 to 64 Years | 45 (39.8%) | 0 (0.0%) |
| 65 to 74 Years | 43 (21.9%) | 0 (0.0%) |
| 75 Years and over | 4 (3.6%) | 0 (0.0%) |
| Total | 666 (55.3%) | 20 (3.0%) |
Employment Status by Educational Attainment in Coal Run Village
According to labor force statistics for Coal Run Village, 67.9% of individuals (513) out of the total population between 25 and 64 years of age (756) are in the labor force, with 2.7% or 14 of them being unemployed. The group with the highest labor force participation rate are those with the educational attainment of bachelor's degree or higher, with 79.4% or 139 individuals in the labor force. Within the labor force, individuals with less than high school education have the highest percentage of unemployment, with 10.0% or 3 of them being unemployed.
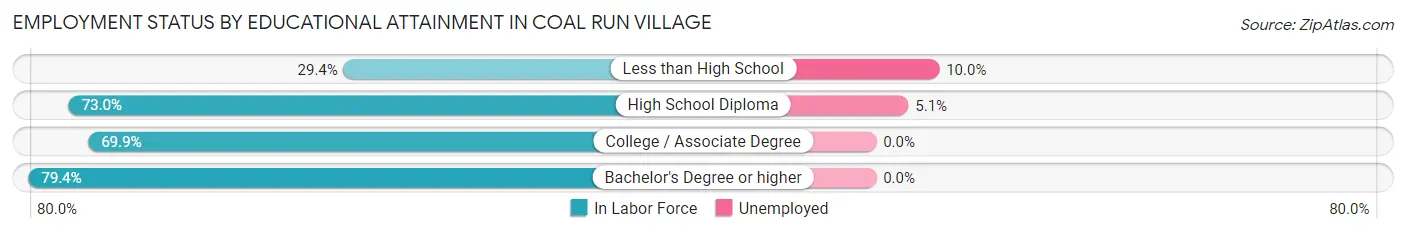
| Educational Attainment | In Labor Force | Unemployed |
| Less than High School | 30 (29.4%) | 10 (10.0%) |
| High School Diploma | 216 (73.0%) | 15 (5.1%) |
| College / Associate Degree | 128 (69.9%) | 0 (0.0%) |
| Bachelor's Degree or higher | 139 (79.4%) | 0 (0.0%) |
| Total | 513 (67.9%) | 20 (2.7%) |
Employment Occupations by Sex in Coal Run Village
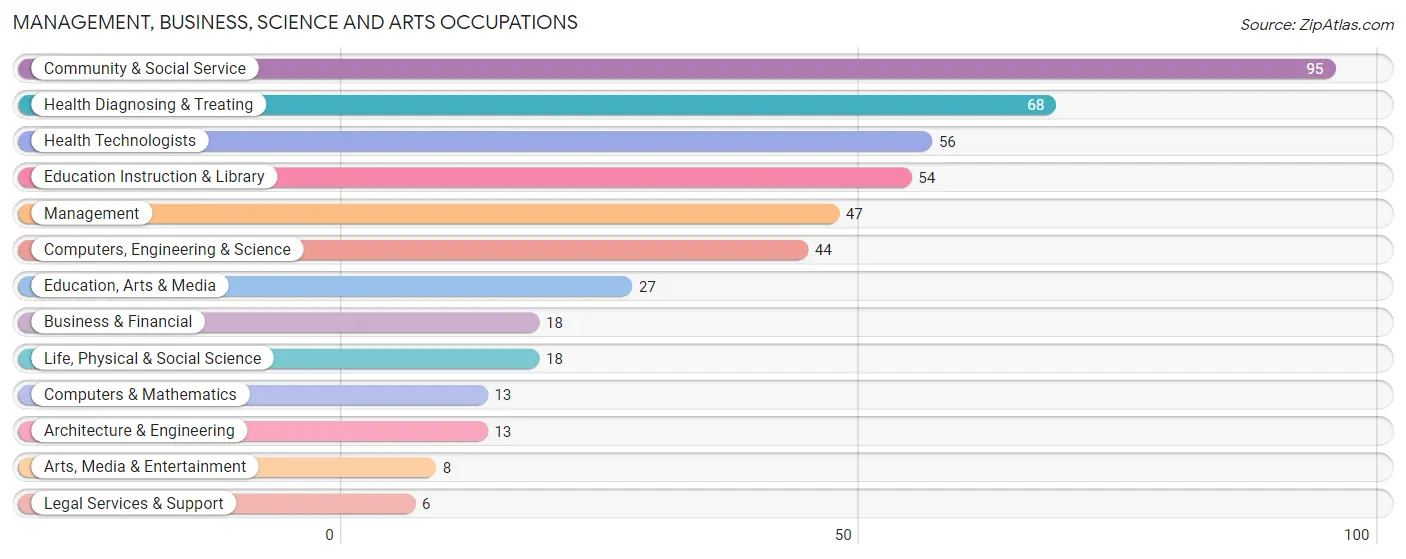
Management, Business, Science and Arts Occupations
The most common Management, Business, Science and Arts occupations in Coal Run Village are Community & Social Service (95 | 14.7%), Health Diagnosing & Treating (68 | 10.5%), Health Technologists (56 | 8.7%), Education Instruction & Library (54 | 8.4%), and Management (47 | 7.3%).
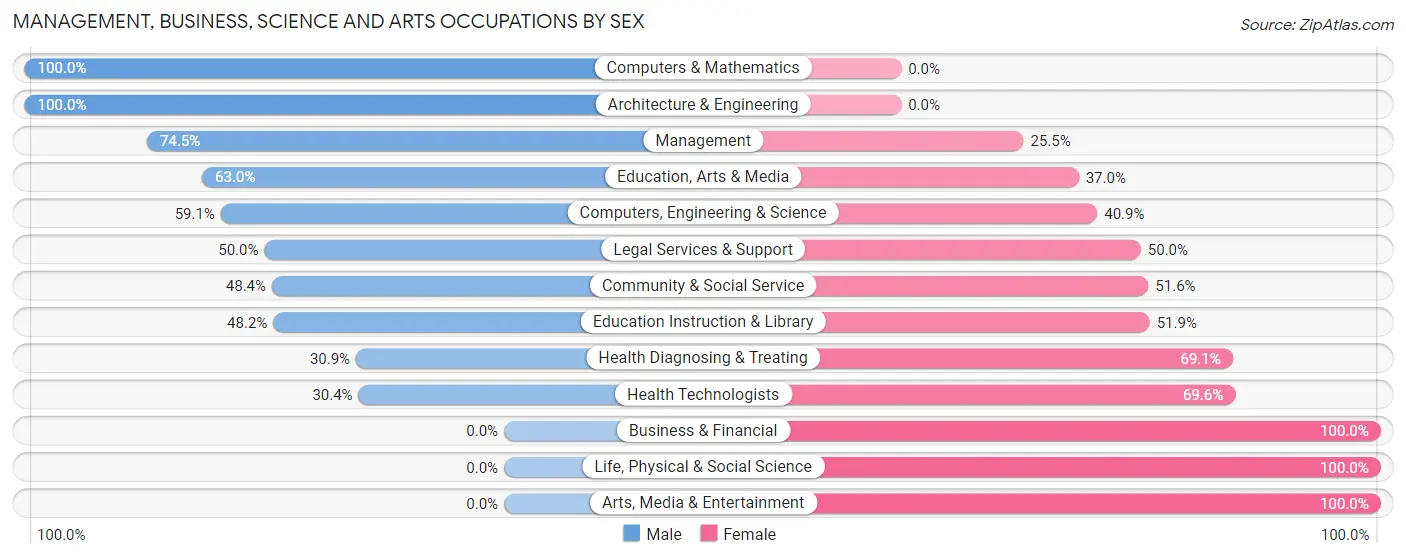
Management, Business, Science and Arts Occupations by Sex
Within the Management, Business, Science and Arts occupations in Coal Run Village, the most male-oriented occupations are Computers & Mathematics (100.0%), Architecture & Engineering (100.0%), and Management (74.5%), while the most female-oriented occupations are Business & Financial (100.0%), Life, Physical & Social Science (100.0%), and Arts, Media & Entertainment (100.0%).
| Occupation | Male | Female |
| Management | 35 (74.5%) | 12 (25.5%) |
| Business & Financial | 0 (0.0%) | 18 (100.0%) |
| Computers, Engineering & Science | 26 (59.1%) | 18 (40.9%) |
| Computers & Mathematics | 13 (100.0%) | 0 (0.0%) |
| Architecture & Engineering | 13 (100.0%) | 0 (0.0%) |
| Life, Physical & Social Science | 0 (0.0%) | 18 (100.0%) |
| Community & Social Service | 46 (48.4%) | 49 (51.6%) |
| Education, Arts & Media | 17 (63.0%) | 10 (37.0%) |
| Legal Services & Support | 3 (50.0%) | 3 (50.0%) |
| Education Instruction & Library | 26 (48.1%) | 28 (51.8%) |
| Arts, Media & Entertainment | 0 (0.0%) | 8 (100.0%) |
| Health Diagnosing & Treating | 21 (30.9%) | 47 (69.1%) |
| Health Technologists | 17 (30.4%) | 39 (69.6%) |
| Total (Category) | 128 (47.1%) | 144 (52.9%) |
| Total (Overall) | 302 (46.8%) | 344 (53.2%) |
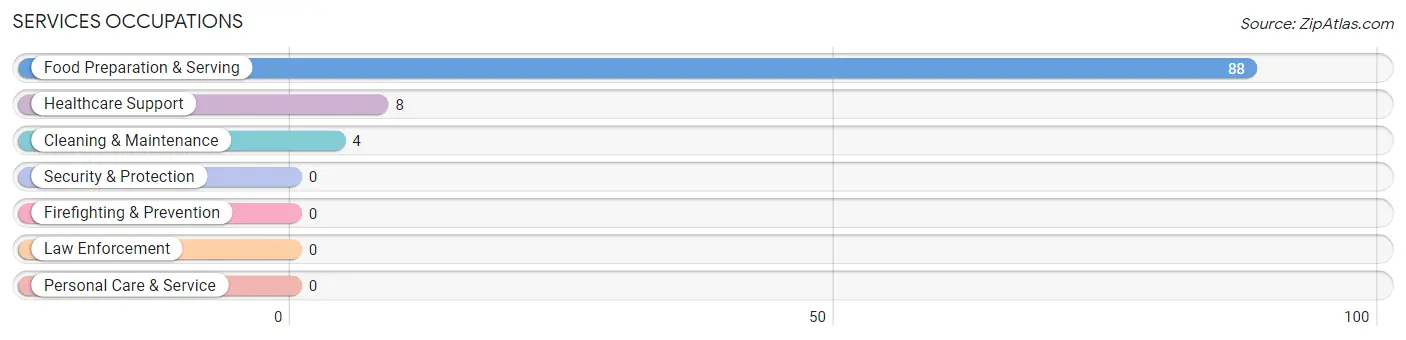
Services Occupations
The most common Services occupations in Coal Run Village are Food Preparation & Serving (88 | 13.6%), Healthcare Support (8 | 1.2%), and Cleaning & Maintenance (4 | 0.6%).
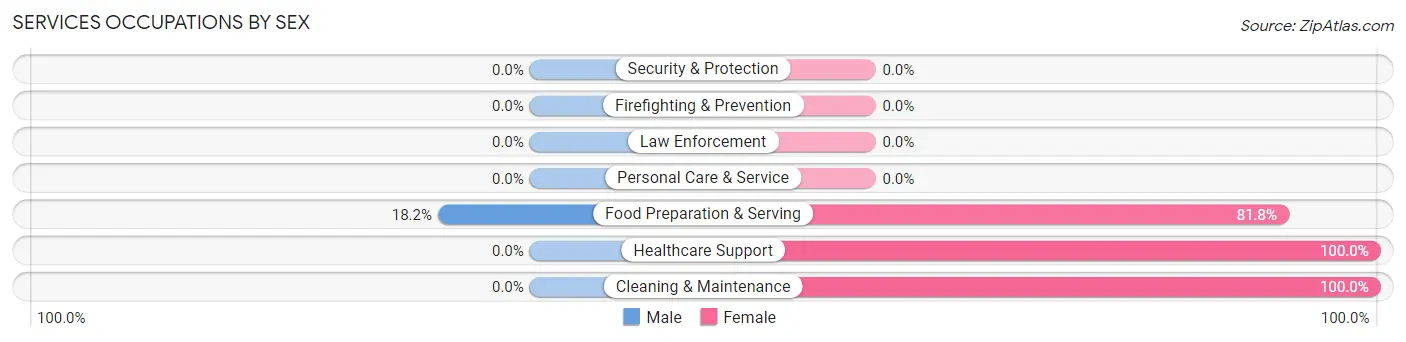
Services Occupations by Sex
| Occupation | Male | Female |
| Healthcare Support | 0 (0.0%) | 8 (100.0%) |
| Security & Protection | 0 (0.0%) | 0 (0.0%) |
| Firefighting & Prevention | 0 (0.0%) | 0 (0.0%) |
| Law Enforcement | 0 (0.0%) | 0 (0.0%) |
| Food Preparation & Serving | 16 (18.2%) | 72 (81.8%) |
| Cleaning & Maintenance | 0 (0.0%) | 4 (100.0%) |
| Personal Care & Service | 0 (0.0%) | 0 (0.0%) |
| Total (Category) | 16 (16.0%) | 84 (84.0%) |
| Total (Overall) | 302 (46.8%) | 344 (53.2%) |
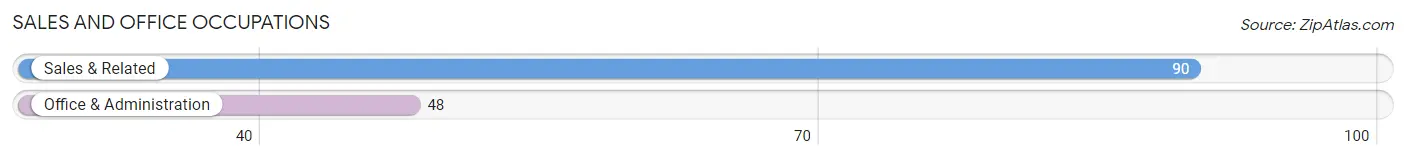
Sales and Office Occupations
The most common Sales and Office occupations in Coal Run Village are Sales & Related (90 | 13.9%), and Office & Administration (48 | 7.4%).
Sales and Office Occupations by Sex
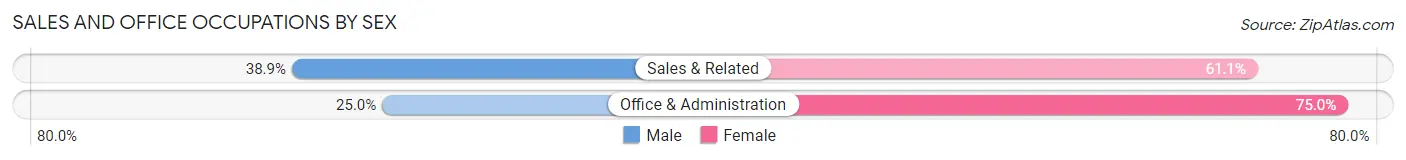
| Occupation | Male | Female |
| Sales & Related | 35 (38.9%) | 55 (61.1%) |
| Office & Administration | 12 (25.0%) | 36 (75.0%) |
| Total (Category) | 47 (34.1%) | 91 (65.9%) |
| Total (Overall) | 302 (46.8%) | 344 (53.2%) |
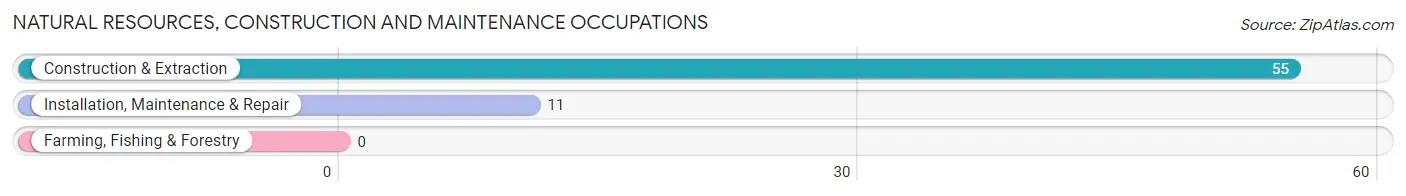
Natural Resources, Construction and Maintenance Occupations
The most common Natural Resources, Construction and Maintenance occupations in Coal Run Village are Construction & Extraction (55 | 8.5%), and Installation, Maintenance & Repair (11 | 1.7%).
Natural Resources, Construction and Maintenance Occupations by Sex
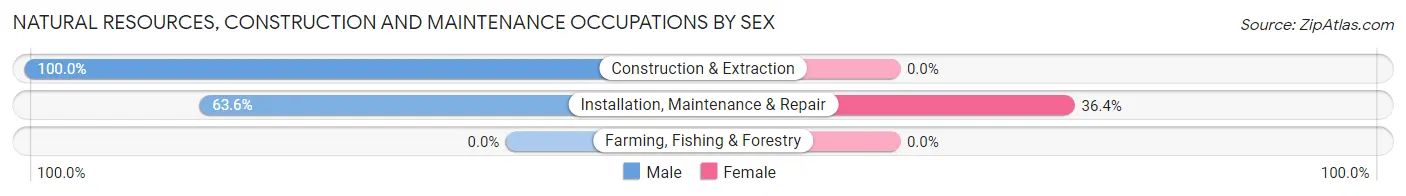
| Occupation | Male | Female |
| Farming, Fishing & Forestry | 0 (0.0%) | 0 (0.0%) |
| Construction & Extraction | 55 (100.0%) | 0 (0.0%) |
| Installation, Maintenance & Repair | 7 (63.6%) | 4 (36.4%) |
| Total (Category) | 62 (93.9%) | 4 (6.1%) |
| Total (Overall) | 302 (46.8%) | 344 (53.2%) |
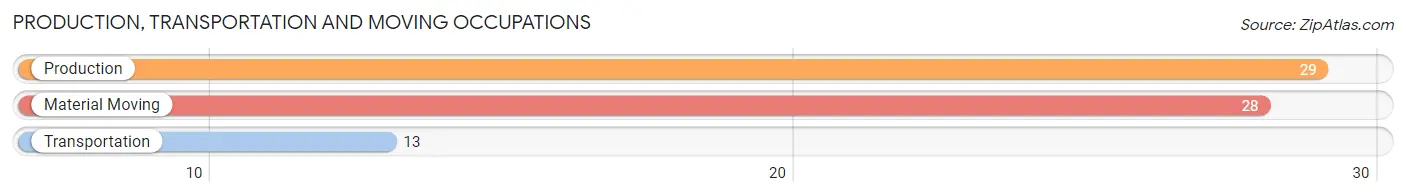
Production, Transportation and Moving Occupations
The most common Production, Transportation and Moving occupations in Coal Run Village are Production (29 | 4.5%), Material Moving (28 | 4.3%), and Transportation (13 | 2.0%).
Production, Transportation and Moving Occupations by Sex
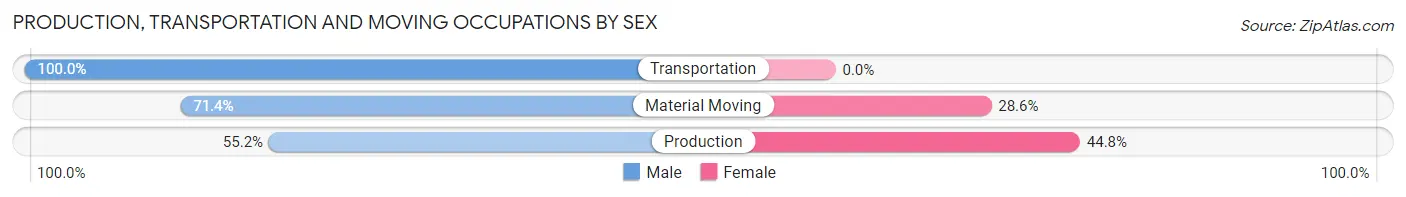
| Occupation | Male | Female |
| Production | 16 (55.2%) | 13 (44.8%) |
| Transportation | 13 (100.0%) | 0 (0.0%) |
| Material Moving | 20 (71.4%) | 8 (28.6%) |
| Total (Category) | 49 (70.0%) | 21 (30.0%) |
| Total (Overall) | 302 (46.8%) | 344 (53.2%) |
Employment Industries by Sex in Coal Run Village
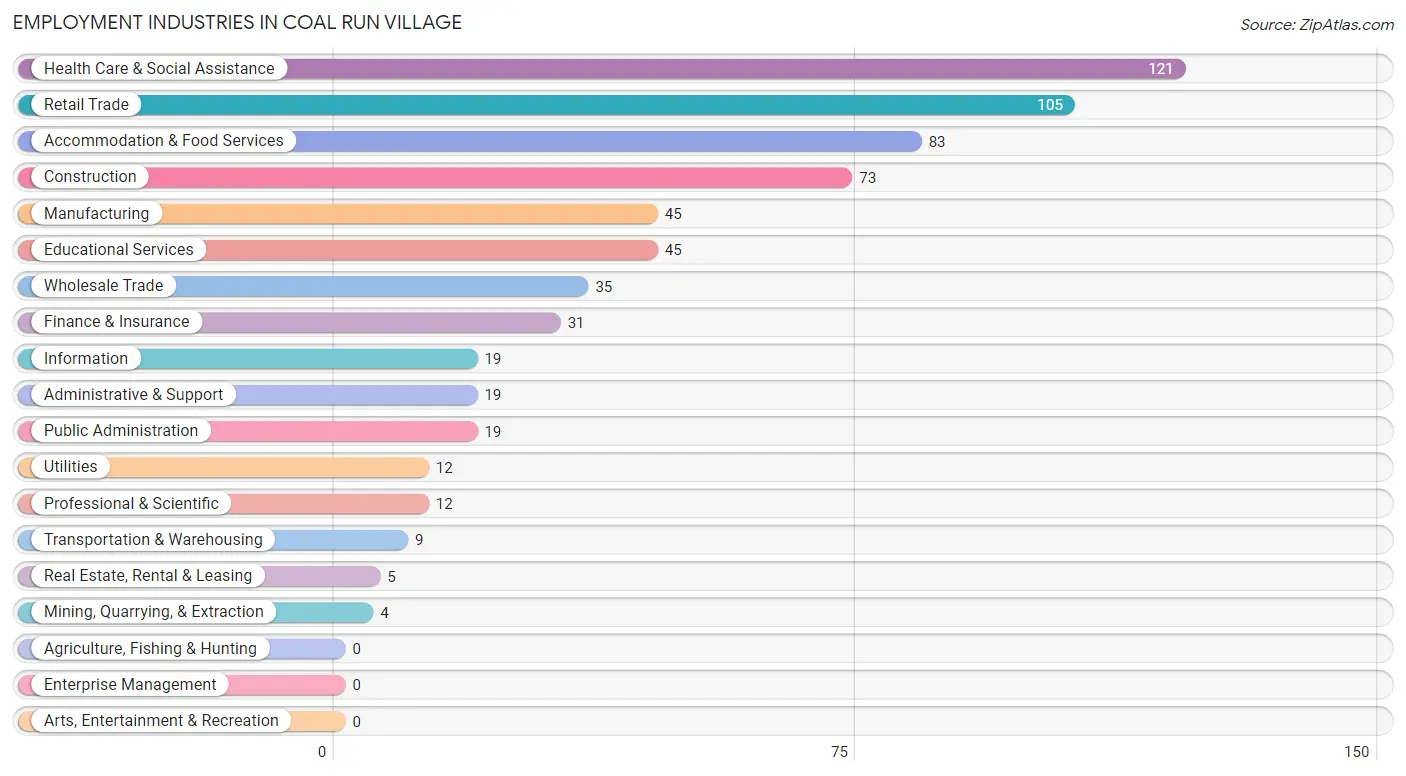
Employment Industries in Coal Run Village
The major employment industries in Coal Run Village include Health Care & Social Assistance (121 | 18.7%), Retail Trade (105 | 16.3%), Accommodation & Food Services (83 | 12.9%), Construction (73 | 11.3%), and Manufacturing (45 | 7.0%).
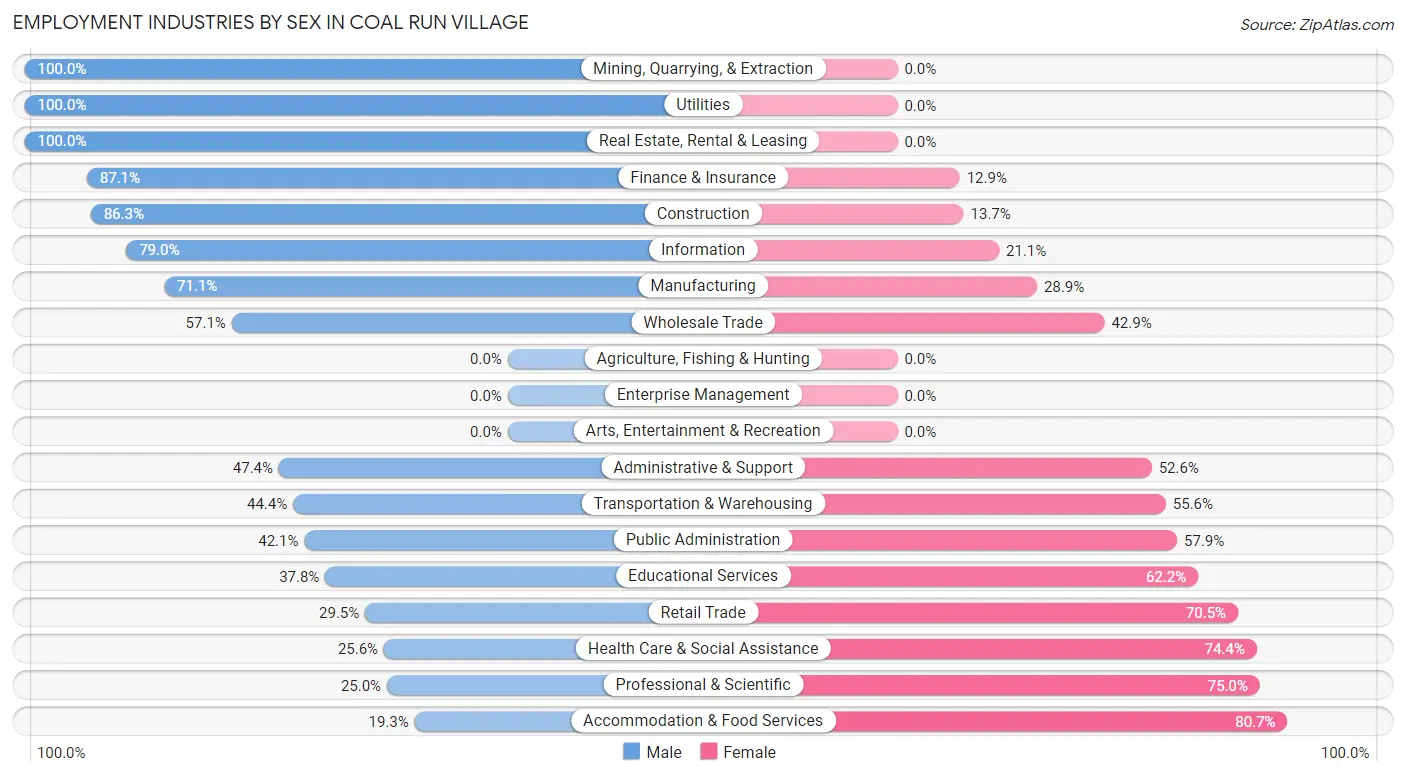
Employment Industries by Sex in Coal Run Village
The Coal Run Village industries that see more men than women are Mining, Quarrying, & Extraction (100.0%), Utilities (100.0%), and Real Estate, Rental & Leasing (100.0%), whereas the industries that tend to have a higher number of women are Accommodation & Food Services (80.7%), Professional & Scientific (75.0%), and Health Care & Social Assistance (74.4%).
| Industry | Male | Female |
| Agriculture, Fishing & Hunting | 0 (0.0%) | 0 (0.0%) |
| Mining, Quarrying, & Extraction | 4 (100.0%) | 0 (0.0%) |
| Construction | 63 (86.3%) | 10 (13.7%) |
| Manufacturing | 32 (71.1%) | 13 (28.9%) |
| Wholesale Trade | 20 (57.1%) | 15 (42.9%) |
| Retail Trade | 31 (29.5%) | 74 (70.5%) |
| Transportation & Warehousing | 4 (44.4%) | 5 (55.6%) |
| Utilities | 12 (100.0%) | 0 (0.0%) |
| Information | 15 (78.9%) | 4 (21.0%) |
| Finance & Insurance | 27 (87.1%) | 4 (12.9%) |
| Real Estate, Rental & Leasing | 5 (100.0%) | 0 (0.0%) |
| Professional & Scientific | 3 (25.0%) | 9 (75.0%) |
| Enterprise Management | 0 (0.0%) | 0 (0.0%) |
| Administrative & Support | 9 (47.4%) | 10 (52.6%) |
| Educational Services | 17 (37.8%) | 28 (62.2%) |
| Health Care & Social Assistance | 31 (25.6%) | 90 (74.4%) |
| Arts, Entertainment & Recreation | 0 (0.0%) | 0 (0.0%) |
| Accommodation & Food Services | 16 (19.3%) | 67 (80.7%) |
| Public Administration | 8 (42.1%) | 11 (57.9%) |
| Total | 302 (46.8%) | 344 (53.2%) |
Education in Coal Run Village
School Enrollment in Coal Run Village
The most common levels of schooling among the 295 students in Coal Run Village are elementary school (79 | 26.8%), high school (76 | 25.8%), and middle school (71 | 24.1%).
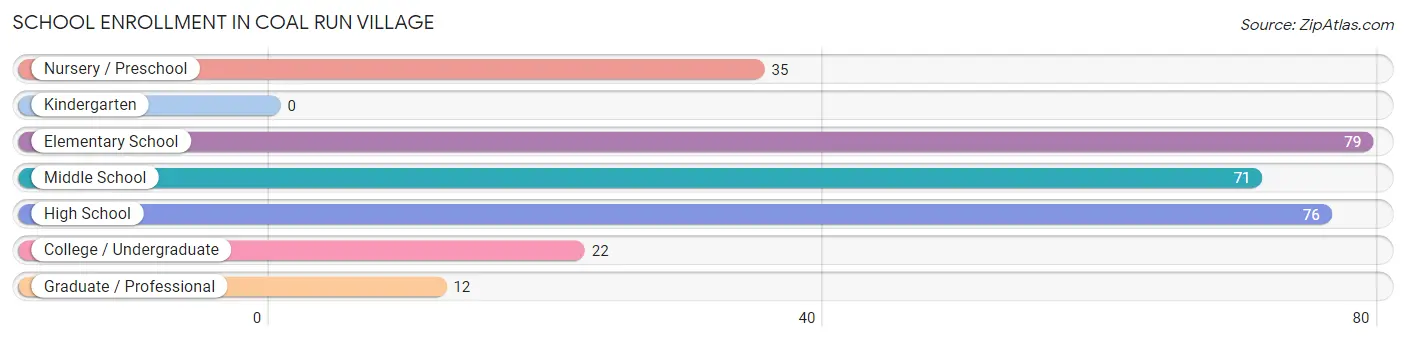
| School Level | # Students | % Students |
| Nursery / Preschool | 35 | 11.9% |
| Kindergarten | 0 | 0.0% |
| Elementary School | 79 | 26.8% |
| Middle School | 71 | 24.1% |
| High School | 76 | 25.8% |
| College / Undergraduate | 22 | 7.5% |
| Graduate / Professional | 12 | 4.1% |
| Total | 295 | 100.0% |
School Enrollment by Age by Funding Source in Coal Run Village
Out of a total of 295 students who are enrolled in schools in Coal Run Village, 37 (12.5%) attend a private institution, while the remaining 258 (87.5%) are enrolled in public schools. The age group of 25 to 34 year olds has the highest likelihood of being enrolled in private schools, with 12 (100.0% in the age bracket) enrolled. Conversely, the age group of 3 to 4 year olds has the lowest likelihood of being enrolled in a private school, with 32 (100.0% in the age bracket) attending a public institution.
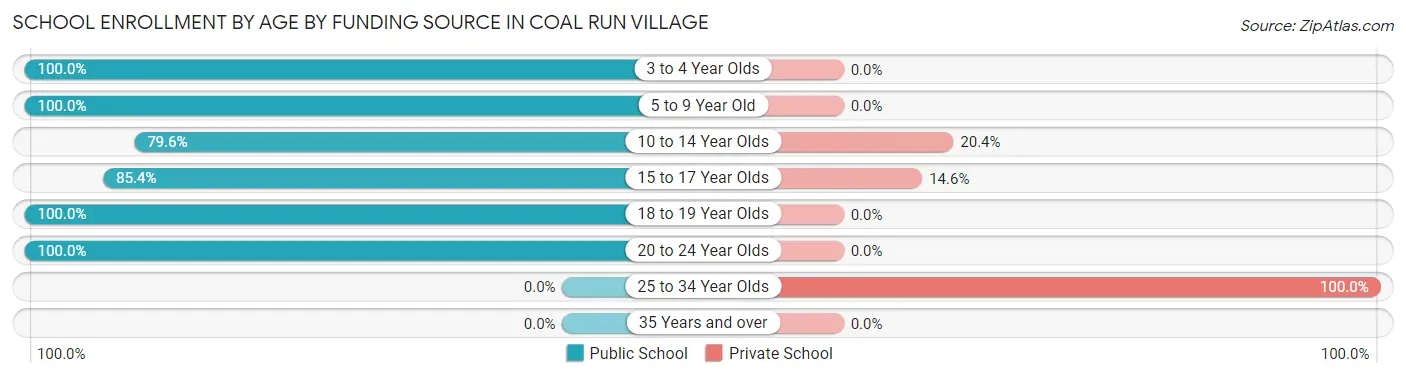
| Age Bracket | Public School | Private School |
| 3 to 4 Year Olds | 32 (100.0%) | 0 (0.0%) |
| 5 to 9 Year Old | 71 (100.0%) | 0 (0.0%) |
| 10 to 14 Year Olds | 74 (79.6%) | 19 (20.4%) |
| 15 to 17 Year Olds | 35 (85.4%) | 6 (14.6%) |
| 18 to 19 Year Olds | 24 (100.0%) | 0 (0.0%) |
| 20 to 24 Year Olds | 22 (100.0%) | 0 (0.0%) |
| 25 to 34 Year Olds | 0 (0.0%) | 12 (100.0%) |
| 35 Years and over | 0 (0.0%) | 0 (0.0%) |
| Total | 258 (87.5%) | 37 (12.5%) |
Educational Attainment by Field of Study in Coal Run Village
Business (47 | 20.1%), bio, nature & agricultural (43 | 18.4%), education (40 | 17.1%), liberal arts & history (22 | 9.4%), and science & technology (19 | 8.1%) are the most common fields of study among 234 individuals in Coal Run Village who have obtained a bachelor's degree or higher.
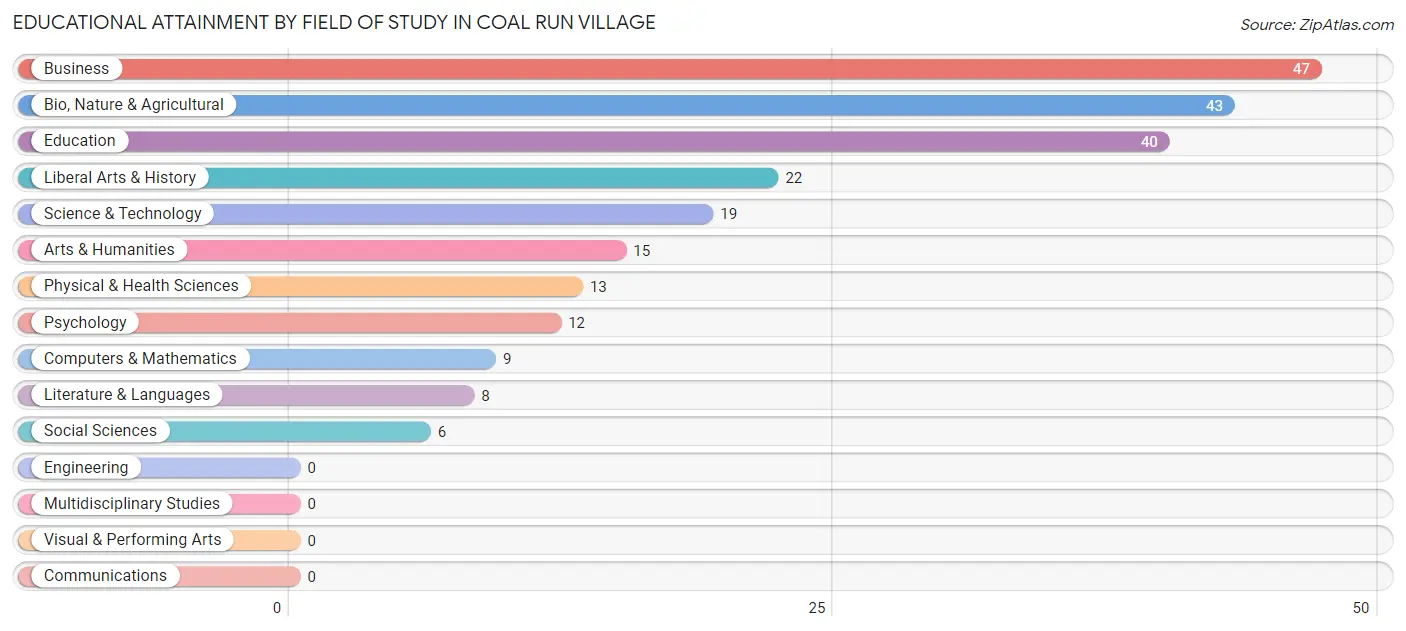
| Field of Study | # Graduates | % Graduates |
| Computers & Mathematics | 9 | 3.8% |
| Bio, Nature & Agricultural | 43 | 18.4% |
| Physical & Health Sciences | 13 | 5.6% |
| Psychology | 12 | 5.1% |
| Social Sciences | 6 | 2.6% |
| Engineering | 0 | 0.0% |
| Multidisciplinary Studies | 0 | 0.0% |
| Science & Technology | 19 | 8.1% |
| Business | 47 | 20.1% |
| Education | 40 | 17.1% |
| Literature & Languages | 8 | 3.4% |
| Liberal Arts & History | 22 | 9.4% |
| Visual & Performing Arts | 0 | 0.0% |
| Communications | 0 | 0.0% |
| Arts & Humanities | 15 | 6.4% |
| Total | 234 | 100.0% |
Transportation & Commute in Coal Run Village
Vehicle Availability by Sex in Coal Run Village
The most prevalent vehicle ownership categories in Coal Run Village are males with 2 vehicles (129, accounting for 42.7%) and females with 2 vehicles (119, making up 37.5%).
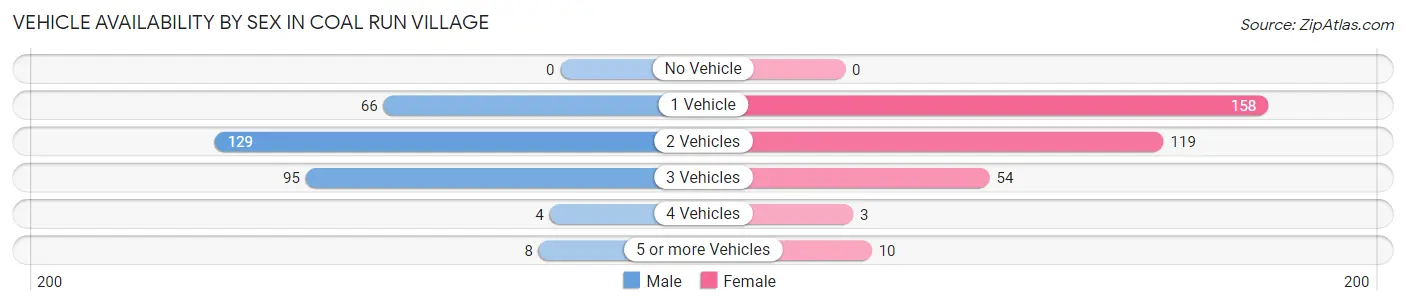
| Vehicles Available | Male | Female |
| No Vehicle | 0 (0.0%) | 0 (0.0%) |
| 1 Vehicle | 66 (21.8%) | 158 (45.9%) |
| 2 Vehicles | 129 (42.7%) | 119 (34.6%) |
| 3 Vehicles | 95 (31.5%) | 54 (15.7%) |
| 4 Vehicles | 4 (1.3%) | 3 (0.9%) |
| 5 or more Vehicles | 8 (2.6%) | 10 (2.9%) |
| Total | 302 (100.0%) | 344 (100.0%) |
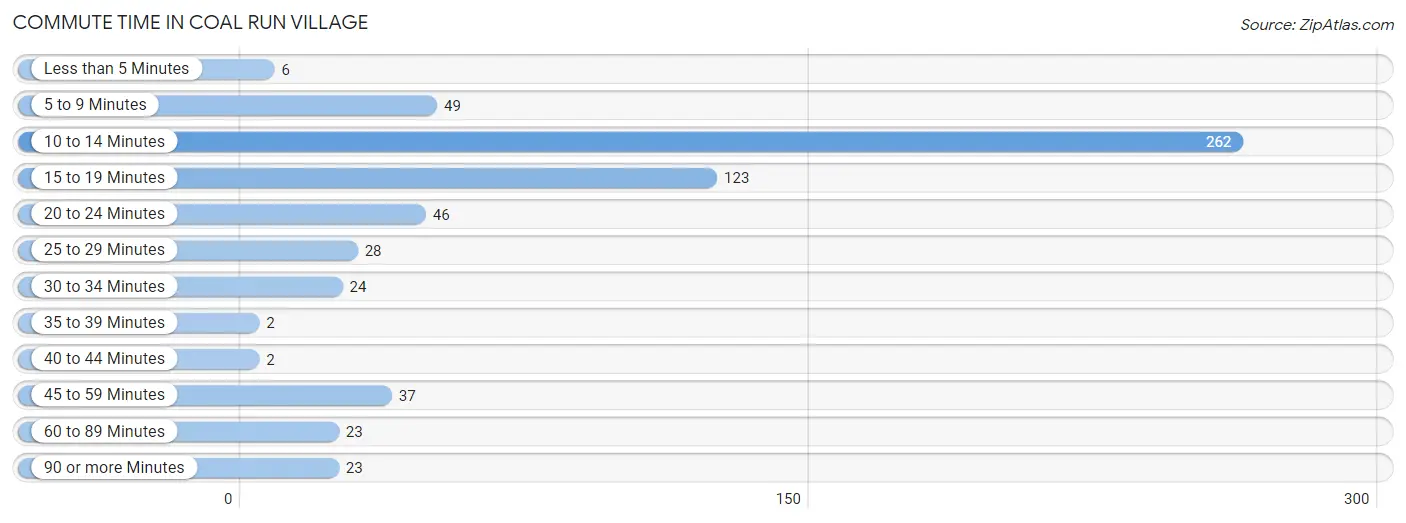
Commute Time in Coal Run Village
The most frequently occuring commute durations in Coal Run Village are 10 to 14 minutes (262 commuters, 41.9%), 15 to 19 minutes (123 commuters, 19.7%), and 5 to 9 minutes (49 commuters, 7.8%).
| Commute Time | # Commuters | % Commuters |
| Less than 5 Minutes | 6 | 1.0% |
| 5 to 9 Minutes | 49 | 7.8% |
| 10 to 14 Minutes | 262 | 41.9% |
| 15 to 19 Minutes | 123 | 19.7% |
| 20 to 24 Minutes | 46 | 7.4% |
| 25 to 29 Minutes | 28 | 4.5% |
| 30 to 34 Minutes | 24 | 3.8% |
| 35 to 39 Minutes | 2 | 0.3% |
| 40 to 44 Minutes | 2 | 0.3% |
| 45 to 59 Minutes | 37 | 5.9% |
| 60 to 89 Minutes | 23 | 3.7% |
| 90 or more Minutes | 23 | 3.7% |
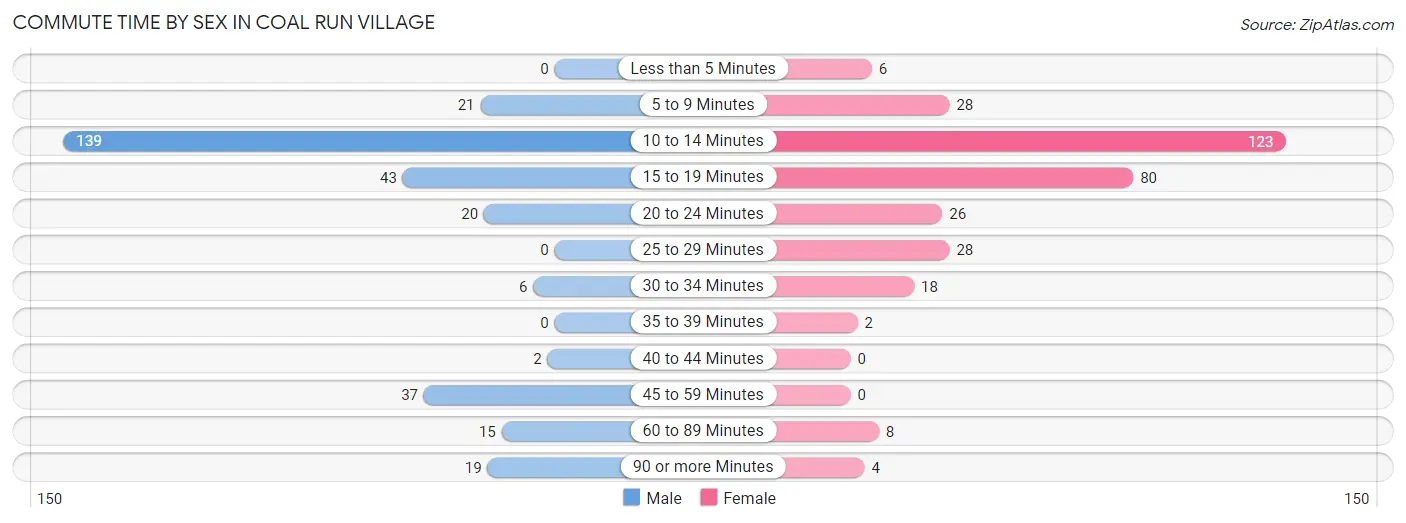
Commute Time by Sex in Coal Run Village
The most common commute times in Coal Run Village are 10 to 14 minutes (139 commuters, 46.0%) for males and 10 to 14 minutes (123 commuters, 38.1%) for females.
| Commute Time | Male | Female |
| Less than 5 Minutes | 0 (0.0%) | 6 (1.9%) |
| 5 to 9 Minutes | 21 (7.0%) | 28 (8.7%) |
| 10 to 14 Minutes | 139 (46.0%) | 123 (38.1%) |
| 15 to 19 Minutes | 43 (14.2%) | 80 (24.8%) |
| 20 to 24 Minutes | 20 (6.6%) | 26 (8.1%) |
| 25 to 29 Minutes | 0 (0.0%) | 28 (8.7%) |
| 30 to 34 Minutes | 6 (2.0%) | 18 (5.6%) |
| 35 to 39 Minutes | 0 (0.0%) | 2 (0.6%) |
| 40 to 44 Minutes | 2 (0.7%) | 0 (0.0%) |
| 45 to 59 Minutes | 37 (12.2%) | 0 (0.0%) |
| 60 to 89 Minutes | 15 (5.0%) | 8 (2.5%) |
| 90 or more Minutes | 19 (6.3%) | 4 (1.2%) |
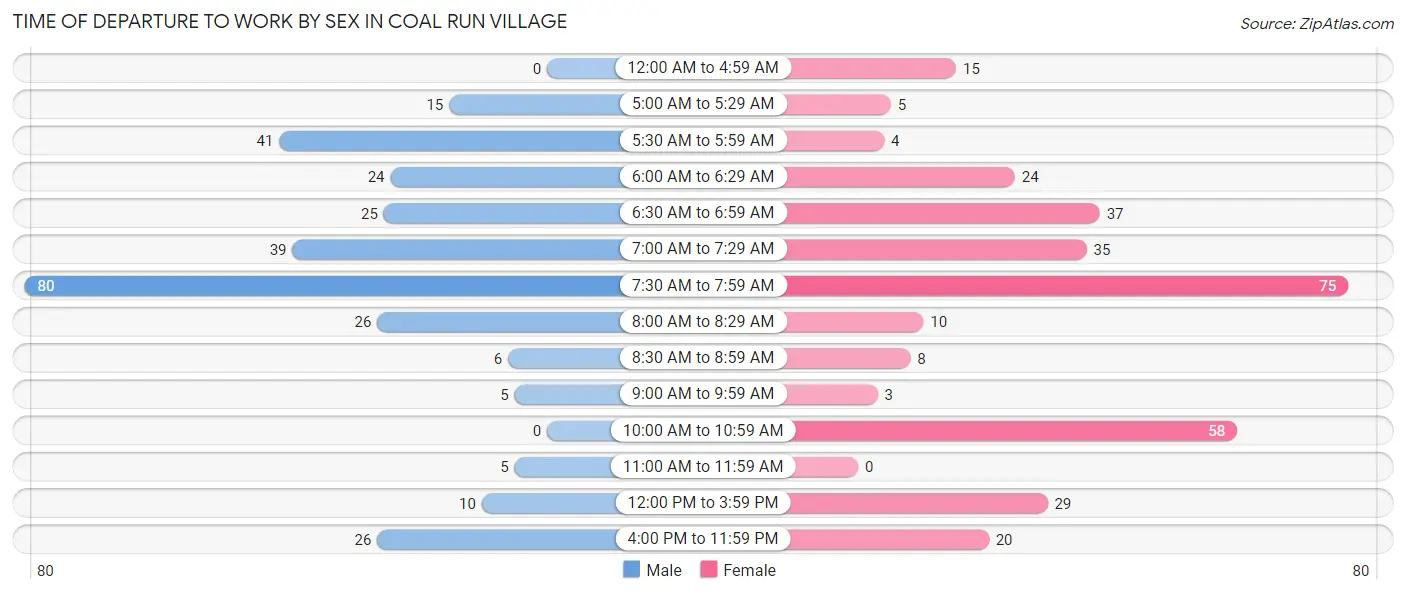
Time of Departure to Work by Sex in Coal Run Village
The most frequent times of departure to work in Coal Run Village are 7:30 AM to 7:59 AM (80, 26.5%) for males and 7:30 AM to 7:59 AM (75, 23.2%) for females.
| Time of Departure | Male | Female |
| 12:00 AM to 4:59 AM | 0 (0.0%) | 15 (4.6%) |
| 5:00 AM to 5:29 AM | 15 (5.0%) | 5 (1.5%) |
| 5:30 AM to 5:59 AM | 41 (13.6%) | 4 (1.2%) |
| 6:00 AM to 6:29 AM | 24 (8.0%) | 24 (7.4%) |
| 6:30 AM to 6:59 AM | 25 (8.3%) | 37 (11.5%) |
| 7:00 AM to 7:29 AM | 39 (12.9%) | 35 (10.8%) |
| 7:30 AM to 7:59 AM | 80 (26.5%) | 75 (23.2%) |
| 8:00 AM to 8:29 AM | 26 (8.6%) | 10 (3.1%) |
| 8:30 AM to 8:59 AM | 6 (2.0%) | 8 (2.5%) |
| 9:00 AM to 9:59 AM | 5 (1.7%) | 3 (0.9%) |
| 10:00 AM to 10:59 AM | 0 (0.0%) | 58 (18.0%) |
| 11:00 AM to 11:59 AM | 5 (1.7%) | 0 (0.0%) |
| 12:00 PM to 3:59 PM | 10 (3.3%) | 29 (9.0%) |
| 4:00 PM to 11:59 PM | 26 (8.6%) | 20 (6.2%) |
| Total | 302 (100.0%) | 323 (100.0%) |
Housing Occupancy in Coal Run Village
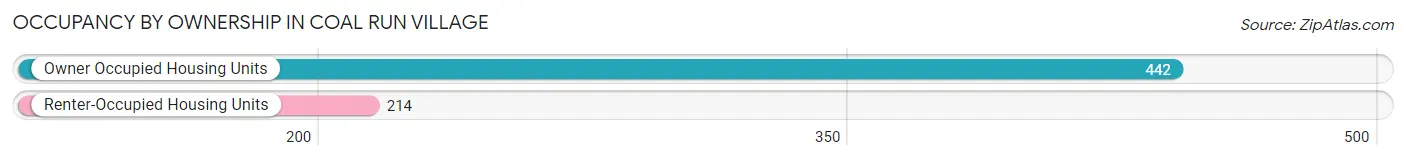
Occupancy by Ownership in Coal Run Village
Of the total 656 dwellings in Coal Run Village, owner-occupied units account for 442 (67.4%), while renter-occupied units make up 214 (32.6%).
| Occupancy | # Housing Units | % Housing Units |
| Owner Occupied Housing Units | 442 | 67.4% |
| Renter-Occupied Housing Units | 214 | 32.6% |
| Total Occupied Housing Units | 656 | 100.0% |
Occupancy by Household Size in Coal Run Village
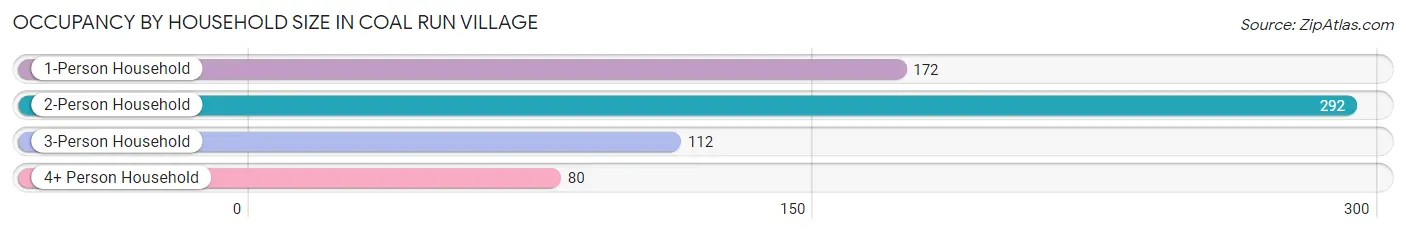
| Household Size | # Housing Units | % Housing Units |
| 1-Person Household | 172 | 26.2% |
| 2-Person Household | 292 | 44.5% |
| 3-Person Household | 112 | 17.1% |
| 4+ Person Household | 80 | 12.2% |
| Total Housing Units | 656 | 100.0% |
Occupancy by Ownership by Household Size in Coal Run Village
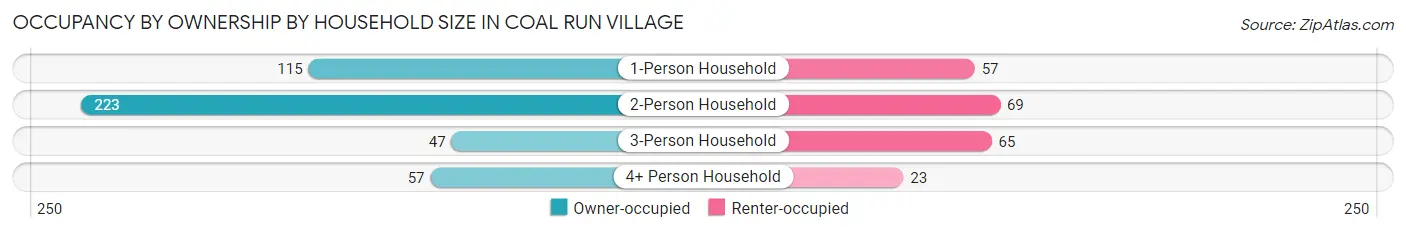
| Household Size | Owner-occupied | Renter-occupied |
| 1-Person Household | 115 (66.9%) | 57 (33.1%) |
| 2-Person Household | 223 (76.4%) | 69 (23.6%) |
| 3-Person Household | 47 (42.0%) | 65 (58.0%) |
| 4+ Person Household | 57 (71.3%) | 23 (28.7%) |
| Total Housing Units | 442 (67.4%) | 214 (32.6%) |
Occupancy by Educational Attainment in Coal Run Village
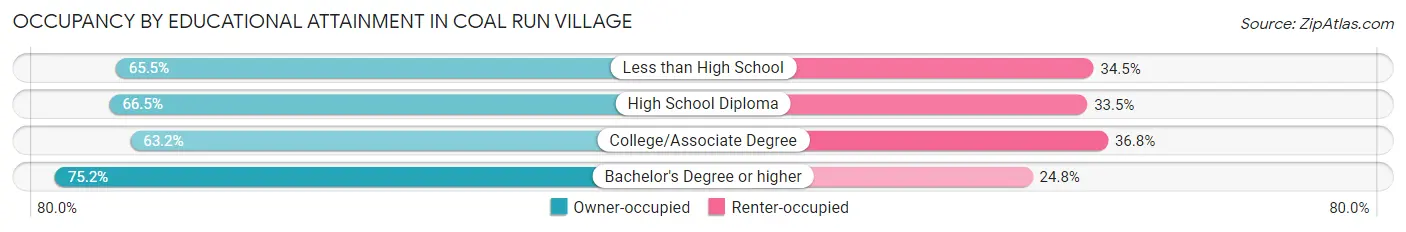
| Household Size | Owner-occupied | Renter-occupied |
| Less than High School | 76 (65.5%) | 40 (34.5%) |
| High School Diploma | 165 (66.5%) | 83 (33.5%) |
| College/Associate Degree | 98 (63.2%) | 57 (36.8%) |
| Bachelor's Degree or higher | 103 (75.2%) | 34 (24.8%) |
Occupancy by Age of Householder in Coal Run Village
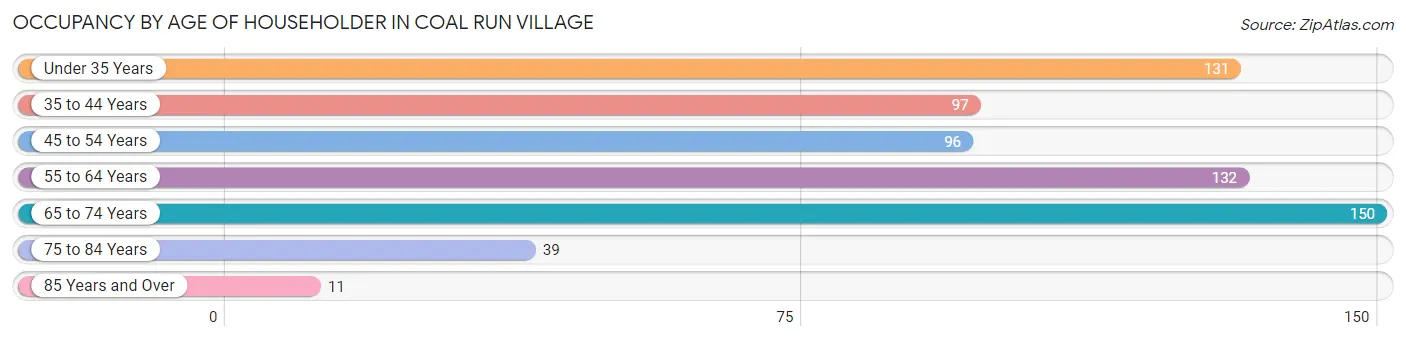
| Age Bracket | # Households | % Households |
| Under 35 Years | 131 | 20.0% |
| 35 to 44 Years | 97 | 14.8% |
| 45 to 54 Years | 96 | 14.6% |
| 55 to 64 Years | 132 | 20.1% |
| 65 to 74 Years | 150 | 22.9% |
| 75 to 84 Years | 39 | 5.9% |
| 85 Years and Over | 11 | 1.7% |
| Total | 656 | 100.0% |
Housing Finances in Coal Run Village
Median Income by Occupancy in Coal Run Village
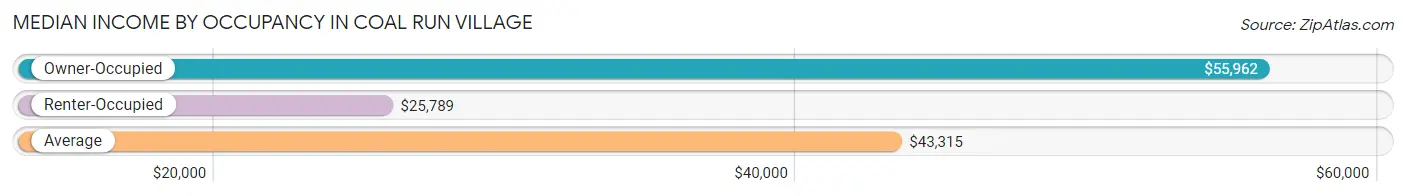
| Occupancy Type | # Households | Median Income |
| Owner-Occupied | 442 (67.4%) | $55,962 |
| Renter-Occupied | 214 (32.6%) | $25,789 |
| Average | 656 (100.0%) | $43,315 |
Occupancy by Householder Income Bracket in Coal Run Village
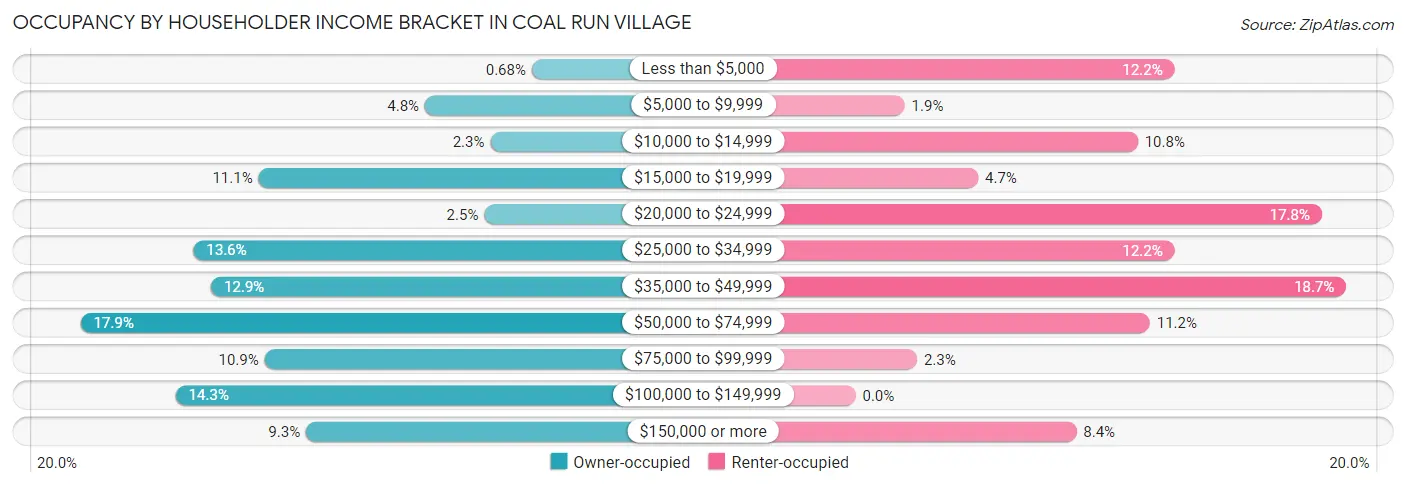
| Income Bracket | Owner-occupied | Renter-occupied |
| Less than $5,000 | 3 (0.7%) | 26 (12.1%) |
| $5,000 to $9,999 | 21 (4.8%) | 4 (1.9%) |
| $10,000 to $14,999 | 10 (2.3%) | 23 (10.7%) |
| $15,000 to $19,999 | 49 (11.1%) | 10 (4.7%) |
| $20,000 to $24,999 | 11 (2.5%) | 38 (17.8%) |
| $25,000 to $34,999 | 60 (13.6%) | 26 (12.1%) |
| $35,000 to $49,999 | 57 (12.9%) | 40 (18.7%) |
| $50,000 to $74,999 | 79 (17.9%) | 24 (11.2%) |
| $75,000 to $99,999 | 48 (10.9%) | 5 (2.3%) |
| $100,000 to $149,999 | 63 (14.2%) | 0 (0.0%) |
| $150,000 or more | 41 (9.3%) | 18 (8.4%) |
| Total | 442 (100.0%) | 214 (100.0%) |
Monthly Housing Cost Tiers in Coal Run Village
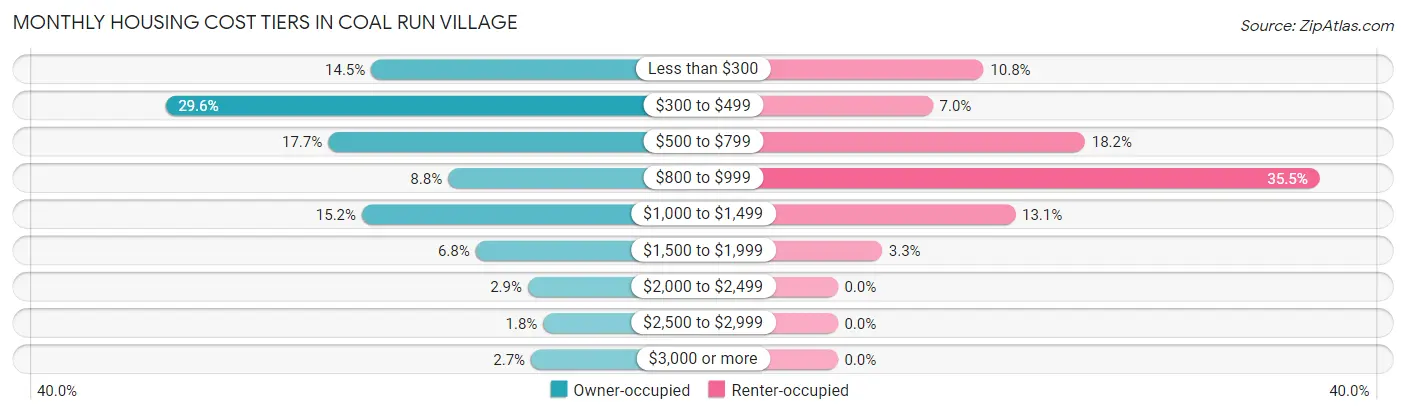
| Monthly Cost | Owner-occupied | Renter-occupied |
| Less than $300 | 64 (14.5%) | 23 (10.7%) |
| $300 to $499 | 131 (29.6%) | 15 (7.0%) |
| $500 to $799 | 78 (17.6%) | 39 (18.2%) |
| $800 to $999 | 39 (8.8%) | 76 (35.5%) |
| $1,000 to $1,499 | 67 (15.2%) | 28 (13.1%) |
| $1,500 to $1,999 | 30 (6.8%) | 7 (3.3%) |
| $2,000 to $2,499 | 13 (2.9%) | 0 (0.0%) |
| $2,500 to $2,999 | 8 (1.8%) | 0 (0.0%) |
| $3,000 or more | 12 (2.7%) | 0 (0.0%) |
| Total | 442 (100.0%) | 214 (100.0%) |
Physical Housing Characteristics in Coal Run Village
Housing Structures in Coal Run Village
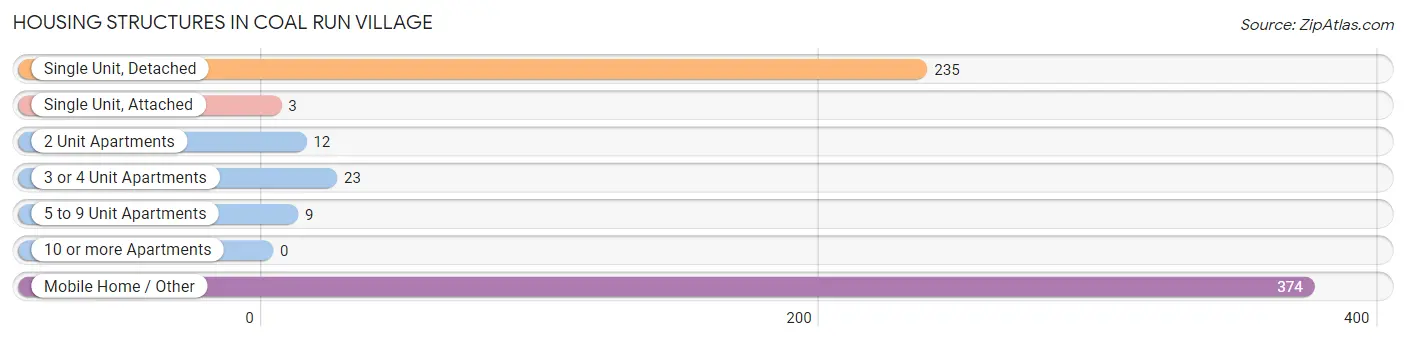
| Structure Type | # Housing Units | % Housing Units |
| Single Unit, Detached | 235 | 35.8% |
| Single Unit, Attached | 3 | 0.5% |
| 2 Unit Apartments | 12 | 1.8% |
| 3 or 4 Unit Apartments | 23 | 3.5% |
| 5 to 9 Unit Apartments | 9 | 1.4% |
| 10 or more Apartments | 0 | 0.0% |
| Mobile Home / Other | 374 | 57.0% |
| Total | 656 | 100.0% |
Housing Structures by Occupancy in Coal Run Village
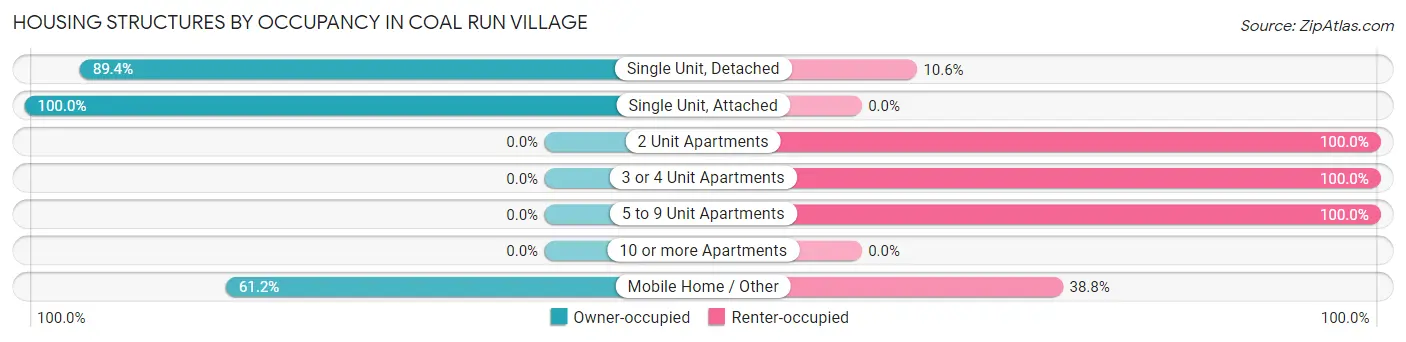
| Structure Type | Owner-occupied | Renter-occupied |
| Single Unit, Detached | 210 (89.4%) | 25 (10.6%) |
| Single Unit, Attached | 3 (100.0%) | 0 (0.0%) |
| 2 Unit Apartments | 0 (0.0%) | 12 (100.0%) |
| 3 or 4 Unit Apartments | 0 (0.0%) | 23 (100.0%) |
| 5 to 9 Unit Apartments | 0 (0.0%) | 9 (100.0%) |
| 10 or more Apartments | 0 (0.0%) | 0 (0.0%) |
| Mobile Home / Other | 229 (61.2%) | 145 (38.8%) |
| Total | 442 (67.4%) | 214 (32.6%) |
Housing Structures by Number of Rooms in Coal Run Village
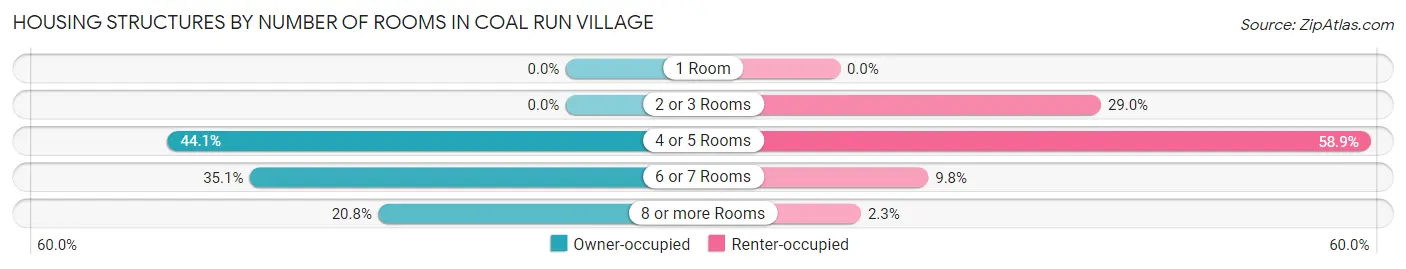
| Number of Rooms | Owner-occupied | Renter-occupied |
| 1 Room | 0 (0.0%) | 0 (0.0%) |
| 2 or 3 Rooms | 0 (0.0%) | 62 (29.0%) |
| 4 or 5 Rooms | 195 (44.1%) | 126 (58.9%) |
| 6 or 7 Rooms | 155 (35.1%) | 21 (9.8%) |
| 8 or more Rooms | 92 (20.8%) | 5 (2.3%) |
| Total | 442 (100.0%) | 214 (100.0%) |
Housing Structure by Heating Type in Coal Run Village
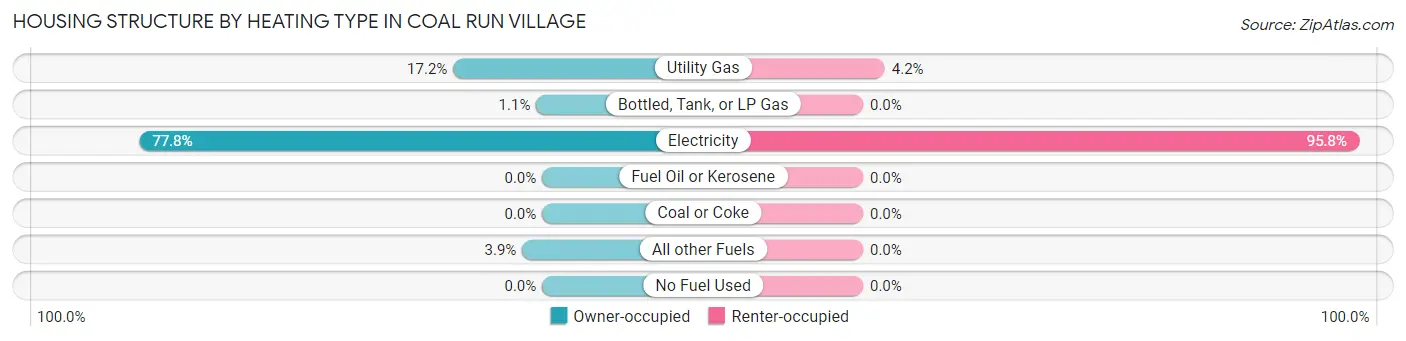
| Heating Type | Owner-occupied | Renter-occupied |
| Utility Gas | 76 (17.2%) | 9 (4.2%) |
| Bottled, Tank, or LP Gas | 5 (1.1%) | 0 (0.0%) |
| Electricity | 344 (77.8%) | 205 (95.8%) |
| Fuel Oil or Kerosene | 0 (0.0%) | 0 (0.0%) |
| Coal or Coke | 0 (0.0%) | 0 (0.0%) |
| All other Fuels | 17 (3.8%) | 0 (0.0%) |
| No Fuel Used | 0 (0.0%) | 0 (0.0%) |
| Total | 442 (100.0%) | 214 (100.0%) |
Household Vehicle Usage in Coal Run Village
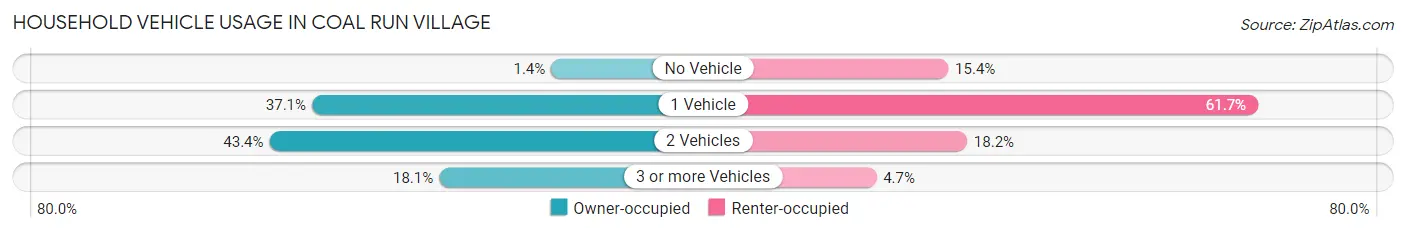
| Vehicles per Household | Owner-occupied | Renter-occupied |
| No Vehicle | 6 (1.4%) | 33 (15.4%) |
| 1 Vehicle | 164 (37.1%) | 132 (61.7%) |
| 2 Vehicles | 192 (43.4%) | 39 (18.2%) |
| 3 or more Vehicles | 80 (18.1%) | 10 (4.7%) |
| Total | 442 (100.0%) | 214 (100.0%) |
Real Estate & Mortgages in Coal Run Village
Real Estate and Mortgage Overview in Coal Run Village
| Characteristic | Without Mortgage | With Mortgage |
| Housing Units | 274 | 168 |
| Median Property Value | $46,700 | $163,500 |
| Median Household Income | $39,722 | $29 |
| Monthly Housing Costs | $426 | $9 |
| Real Estate Taxes | $563 | $7 |
Property Value by Mortgage Status in Coal Run Village
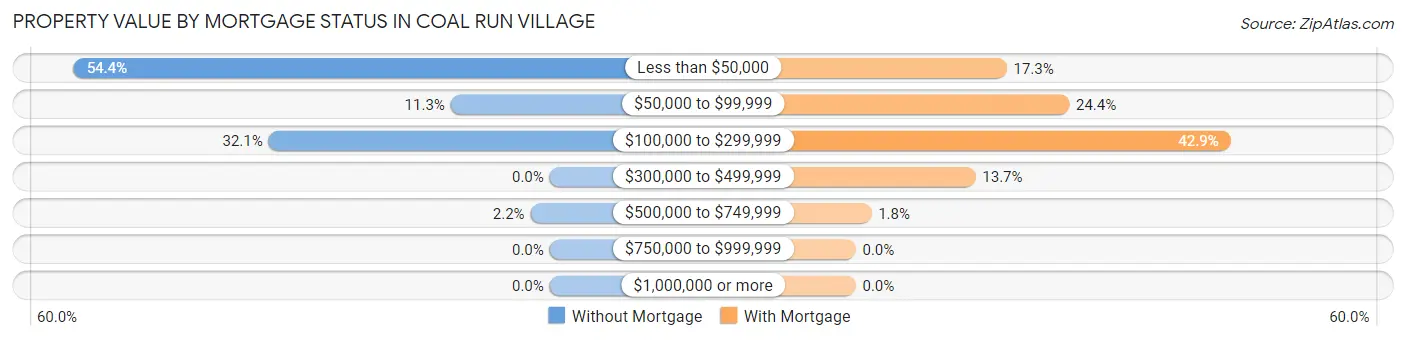
| Property Value | Without Mortgage | With Mortgage |
| Less than $50,000 | 149 (54.4%) | 29 (17.3%) |
| $50,000 to $99,999 | 31 (11.3%) | 41 (24.4%) |
| $100,000 to $299,999 | 88 (32.1%) | 72 (42.9%) |
| $300,000 to $499,999 | 0 (0.0%) | 23 (13.7%) |
| $500,000 to $749,999 | 6 (2.2%) | 3 (1.8%) |
| $750,000 to $999,999 | 0 (0.0%) | 0 (0.0%) |
| $1,000,000 or more | 0 (0.0%) | 0 (0.0%) |
| Total | 274 (100.0%) | 168 (100.0%) |
Household Income by Mortgage Status in Coal Run Village
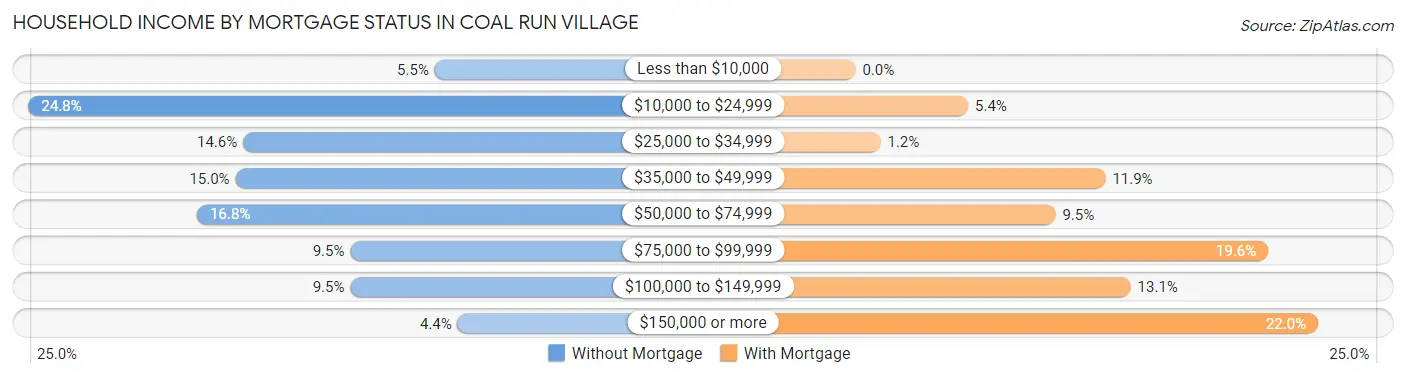
| Household Income | Without Mortgage | With Mortgage |
| Less than $10,000 | 15 (5.5%) | 0 (0.0%) |
| $10,000 to $24,999 | 68 (24.8%) | 9 (5.4%) |
| $25,000 to $34,999 | 40 (14.6%) | 2 (1.2%) |
| $35,000 to $49,999 | 41 (15.0%) | 20 (11.9%) |
| $50,000 to $74,999 | 46 (16.8%) | 16 (9.5%) |
| $75,000 to $99,999 | 26 (9.5%) | 33 (19.6%) |
| $100,000 to $149,999 | 26 (9.5%) | 22 (13.1%) |
| $150,000 or more | 12 (4.4%) | 37 (22.0%) |
| Total | 274 (100.0%) | 168 (100.0%) |
Property Value to Household Income Ratio in Coal Run Village
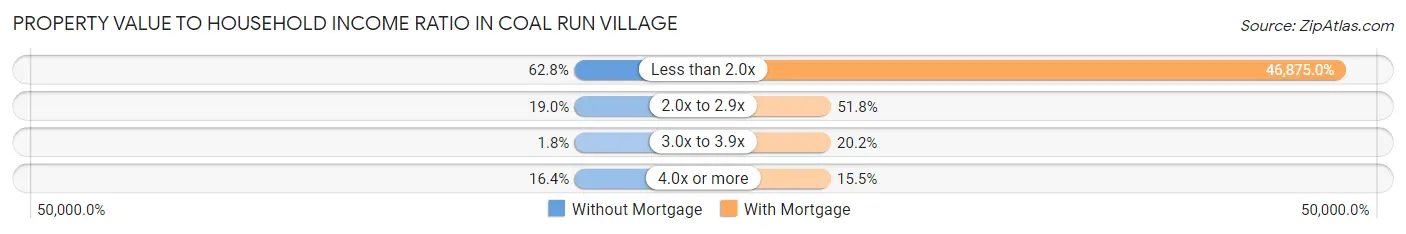
| Value-to-Income Ratio | Without Mortgage | With Mortgage |
| Less than 2.0x | 172 (62.8%) | 78,750 (46,875.0%) |
| 2.0x to 2.9x | 52 (19.0%) | 87 (51.8%) |
| 3.0x to 3.9x | 5 (1.8%) | 34 (20.2%) |
| 4.0x or more | 45 (16.4%) | 26 (15.5%) |
| Total | 274 (100.0%) | 168 (100.0%) |
Real Estate Taxes by Mortgage Status in Coal Run Village
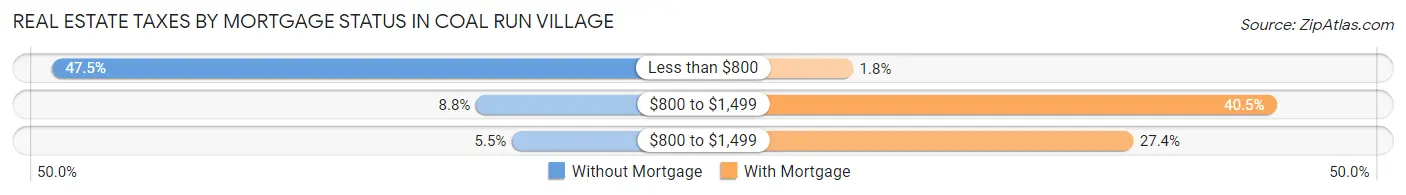
| Property Taxes | Without Mortgage | With Mortgage |
| Less than $800 | 130 (47.4%) | 3 (1.8%) |
| $800 to $1,499 | 24 (8.8%) | 68 (40.5%) |
| $800 to $1,499 | 15 (5.5%) | 46 (27.4%) |
| Total | 274 (100.0%) | 168 (100.0%) |
Health & Disability in Coal Run Village
Health Insurance Coverage by Age in Coal Run Village
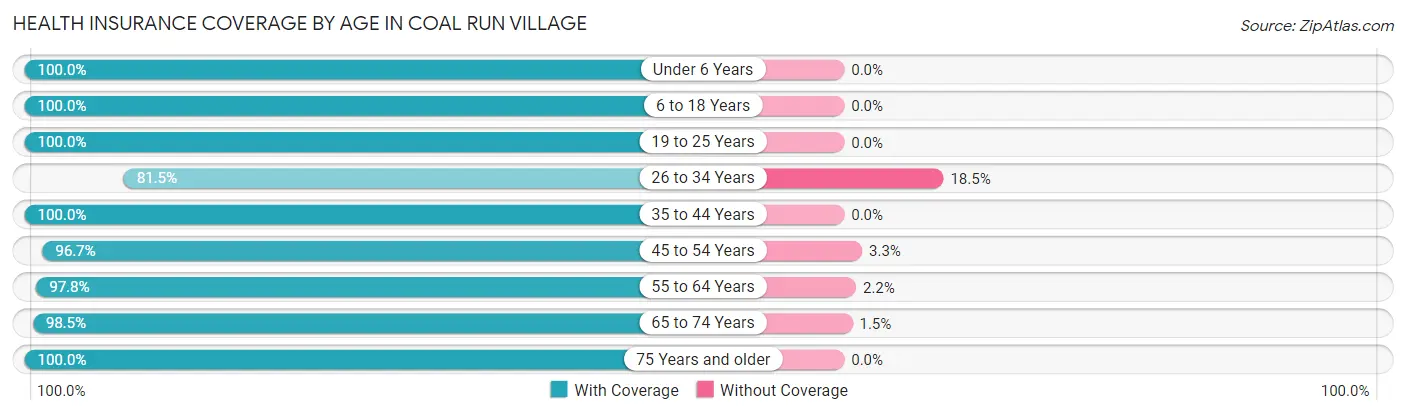
| Age Bracket | With Coverage | Without Coverage |
| Under 6 Years | 134 (100.0%) | 0 (0.0%) |
| 6 to 18 Years | 239 (100.0%) | 0 (0.0%) |
| 19 to 25 Years | 90 (100.0%) | 0 (0.0%) |
| 26 to 34 Years | 141 (81.5%) | 32 (18.5%) |
| 35 to 44 Years | 183 (100.0%) | 0 (0.0%) |
| 45 to 54 Years | 204 (96.7%) | 7 (3.3%) |
| 55 to 64 Years | 179 (97.8%) | 4 (2.2%) |
| 65 to 74 Years | 193 (98.5%) | 3 (1.5%) |
| 75 Years and older | 110 (100.0%) | 0 (0.0%) |
| Total | 1,473 (97.0%) | 46 (3.0%) |
Health Insurance Coverage by Citizenship Status in Coal Run Village
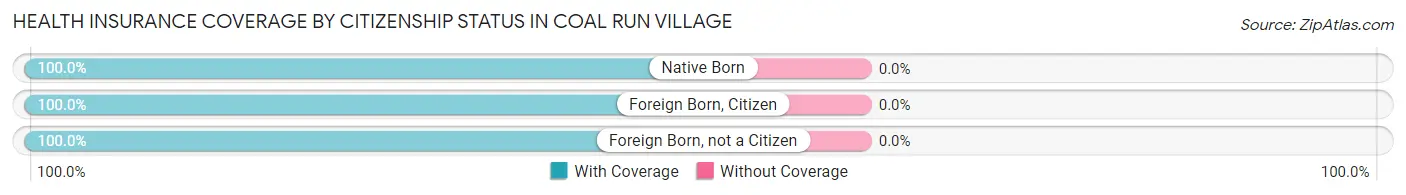
| Citizenship Status | With Coverage | Without Coverage |
| Native Born | 134 (100.0%) | 0 (0.0%) |
| Foreign Born, Citizen | 239 (100.0%) | 0 (0.0%) |
| Foreign Born, not a Citizen | 90 (100.0%) | 0 (0.0%) |
Health Insurance Coverage by Household Income in Coal Run Village
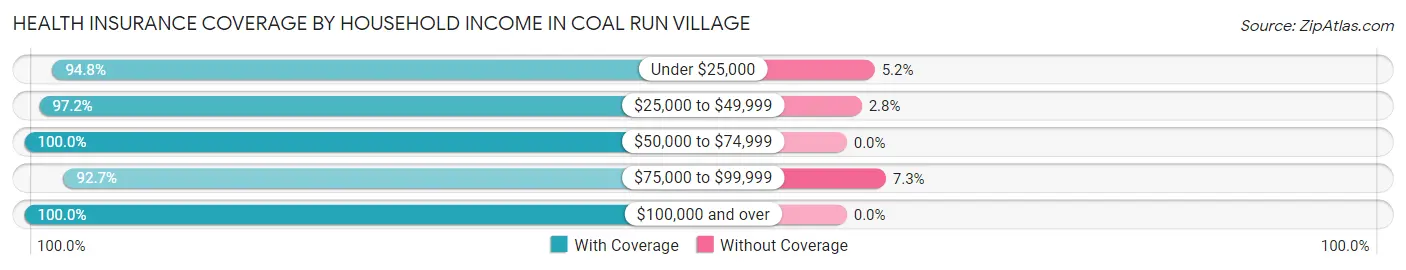
| Household Income | With Coverage | Without Coverage |
| Under $25,000 | 417 (94.8%) | 23 (5.2%) |
| $25,000 to $49,999 | 383 (97.2%) | 11 (2.8%) |
| $50,000 to $74,999 | 192 (100.0%) | 0 (0.0%) |
| $75,000 to $99,999 | 152 (92.7%) | 12 (7.3%) |
| $100,000 and over | 329 (100.0%) | 0 (0.0%) |
Public vs Private Health Insurance Coverage by Age in Coal Run Village
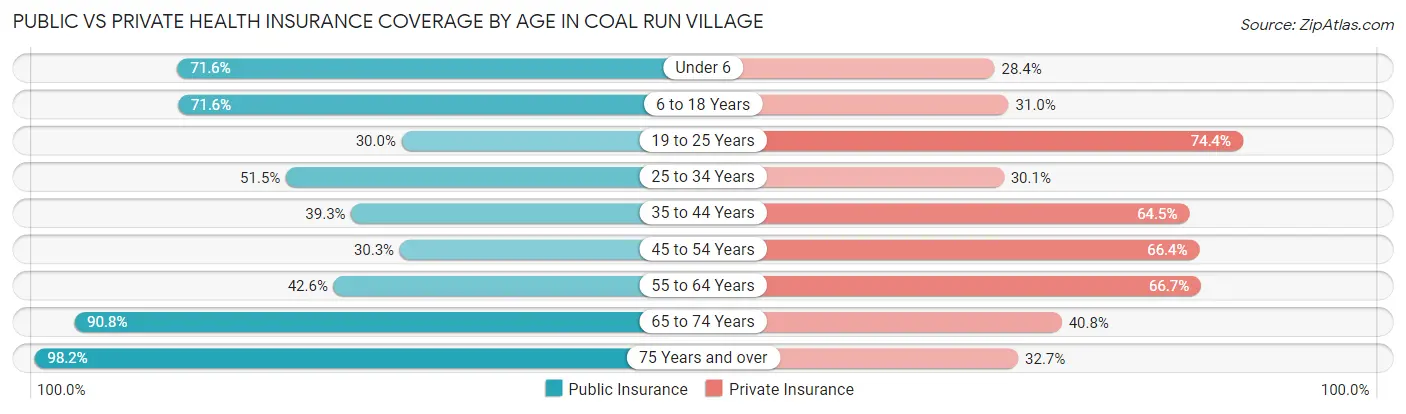
| Age Bracket | Public Insurance | Private Insurance |
| Under 6 | 96 (71.6%) | 38 (28.4%) |
| 6 to 18 Years | 171 (71.6%) | 74 (31.0%) |
| 19 to 25 Years | 27 (30.0%) | 67 (74.4%) |
| 25 to 34 Years | 89 (51.4%) | 52 (30.1%) |
| 35 to 44 Years | 72 (39.3%) | 118 (64.5%) |
| 45 to 54 Years | 64 (30.3%) | 140 (66.3%) |
| 55 to 64 Years | 78 (42.6%) | 122 (66.7%) |
| 65 to 74 Years | 178 (90.8%) | 80 (40.8%) |
| 75 Years and over | 108 (98.2%) | 36 (32.7%) |
| Total | 883 (58.1%) | 727 (47.9%) |
Disability Status by Sex by Age in Coal Run Village
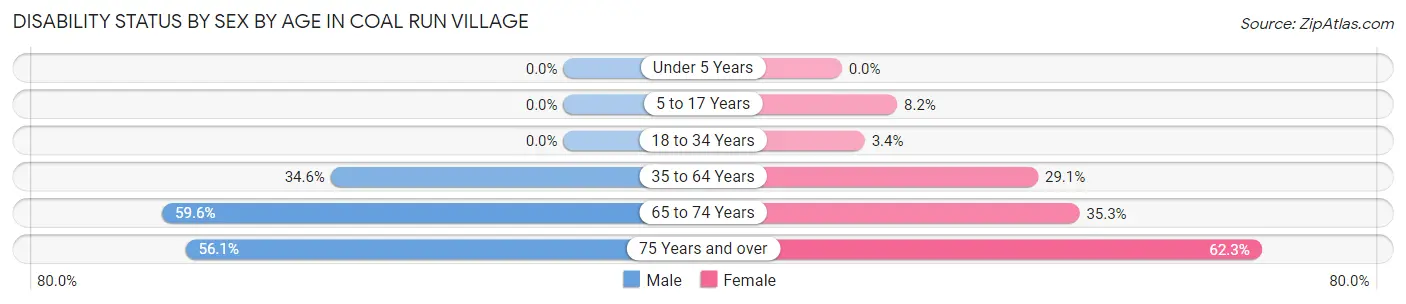
| Age Bracket | Male | Female |
| Under 5 Years | 0 (0.0%) | 0 (0.0%) |
| 5 to 17 Years | 0 (0.0%) | 11 (8.2%) |
| 18 to 34 Years | 0 (0.0%) | 5 (3.4%) |
| 35 to 64 Years | 95 (34.5%) | 88 (29.1%) |
| 65 to 74 Years | 56 (59.6%) | 36 (35.3%) |
| 75 Years and over | 23 (56.1%) | 43 (62.3%) |
Disability Class by Sex by Age in Coal Run Village
Disability Class: Hearing Difficulty
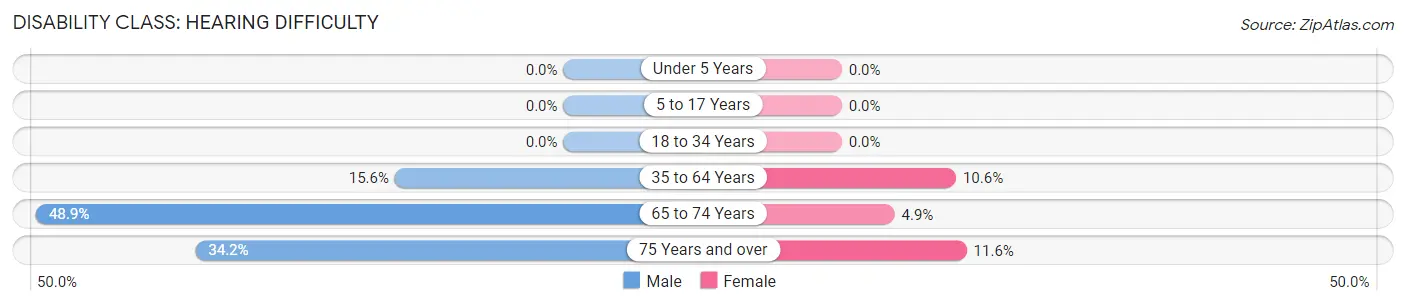
| Age Bracket | Male | Female |
| Under 5 Years | 0 (0.0%) | 0 (0.0%) |
| 5 to 17 Years | 0 (0.0%) | 0 (0.0%) |
| 18 to 34 Years | 0 (0.0%) | 0 (0.0%) |
| 35 to 64 Years | 43 (15.6%) | 32 (10.6%) |
| 65 to 74 Years | 46 (48.9%) | 5 (4.9%) |
| 75 Years and over | 14 (34.2%) | 8 (11.6%) |
Disability Class: Vision Difficulty
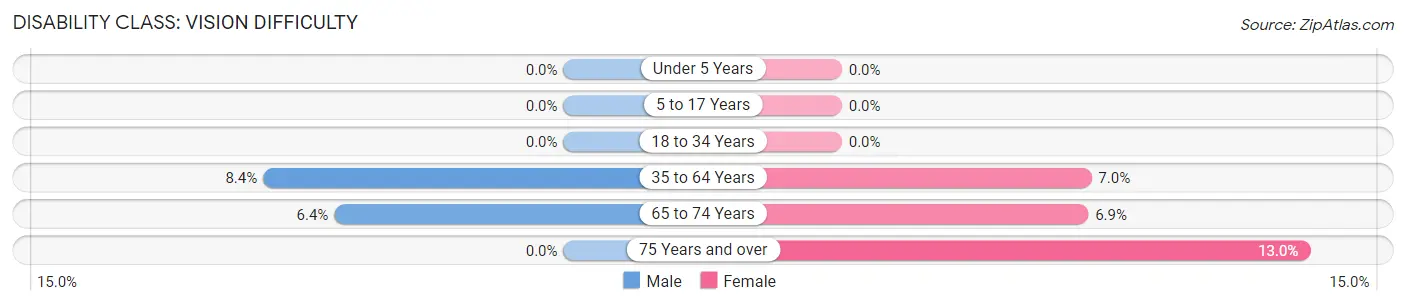
| Age Bracket | Male | Female |
| Under 5 Years | 0 (0.0%) | 0 (0.0%) |
| 5 to 17 Years | 0 (0.0%) | 0 (0.0%) |
| 18 to 34 Years | 0 (0.0%) | 0 (0.0%) |
| 35 to 64 Years | 23 (8.4%) | 21 (7.0%) |
| 65 to 74 Years | 6 (6.4%) | 7 (6.9%) |
| 75 Years and over | 0 (0.0%) | 9 (13.0%) |
Disability Class: Cognitive Difficulty
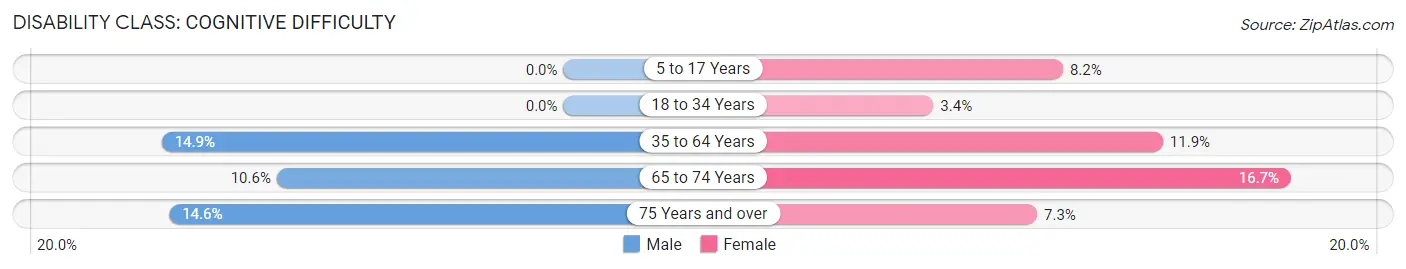
| Age Bracket | Male | Female |
| 5 to 17 Years | 0 (0.0%) | 11 (8.2%) |
| 18 to 34 Years | 0 (0.0%) | 5 (3.4%) |
| 35 to 64 Years | 41 (14.9%) | 36 (11.9%) |
| 65 to 74 Years | 10 (10.6%) | 17 (16.7%) |
| 75 Years and over | 6 (14.6%) | 5 (7.2%) |
Disability Class: Ambulatory Difficulty
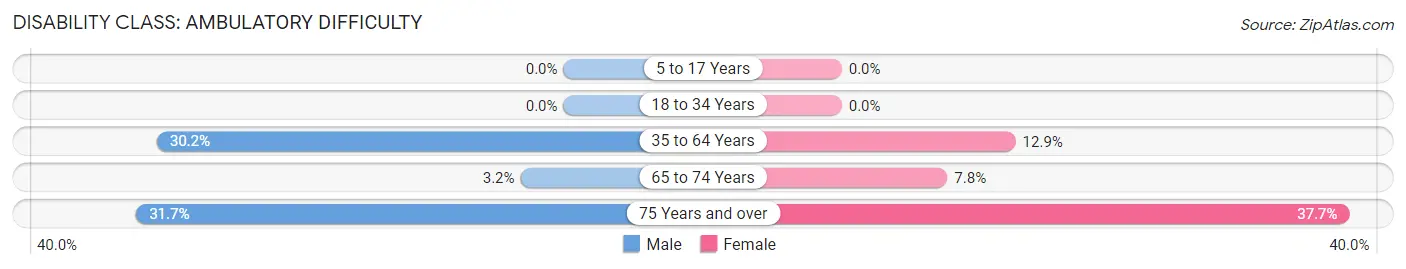
| Age Bracket | Male | Female |
| 5 to 17 Years | 0 (0.0%) | 0 (0.0%) |
| 18 to 34 Years | 0 (0.0%) | 0 (0.0%) |
| 35 to 64 Years | 83 (30.2%) | 39 (12.9%) |
| 65 to 74 Years | 3 (3.2%) | 8 (7.8%) |
| 75 Years and over | 13 (31.7%) | 26 (37.7%) |
Disability Class: Self-Care Difficulty
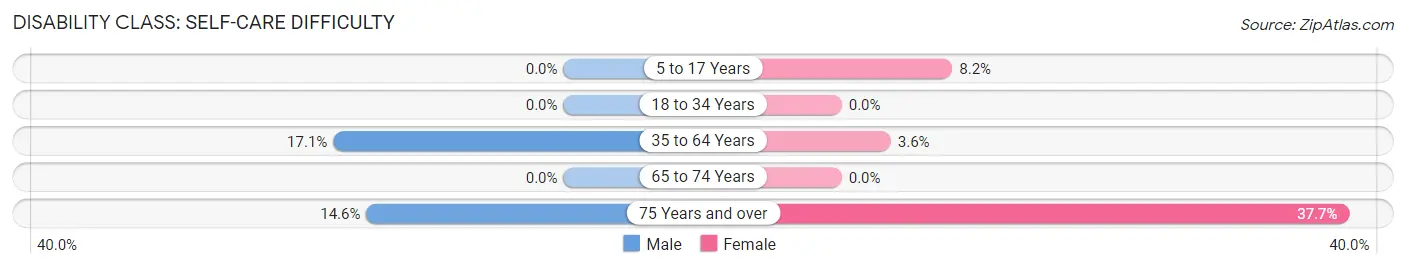
| Age Bracket | Male | Female |
| 5 to 17 Years | 0 (0.0%) | 11 (8.2%) |
| 18 to 34 Years | 0 (0.0%) | 0 (0.0%) |
| 35 to 64 Years | 47 (17.1%) | 11 (3.6%) |
| 65 to 74 Years | 0 (0.0%) | 0 (0.0%) |
| 75 Years and over | 6 (14.6%) | 26 (37.7%) |
Technology Access in Coal Run Village
Computing Device Access in Coal Run Village
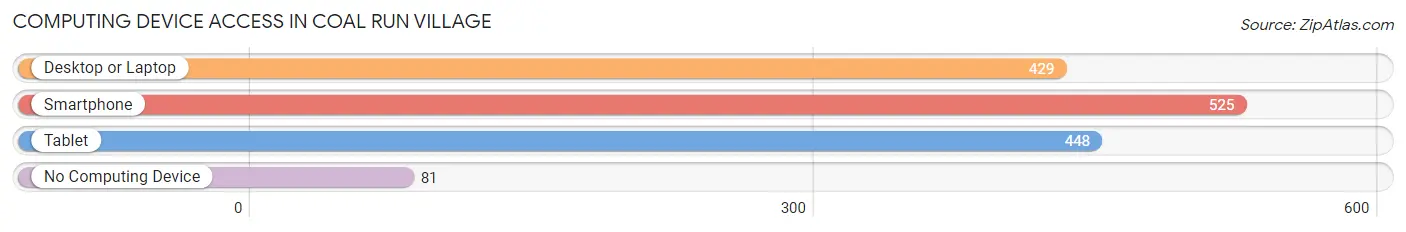
| Device Type | # Households | % Households |
| Desktop or Laptop | 429 | 65.4% |
| Smartphone | 525 | 80.0% |
| Tablet | 448 | 68.3% |
| No Computing Device | 81 | 12.3% |
| Total | 656 | 100.0% |
Internet Access in Coal Run Village
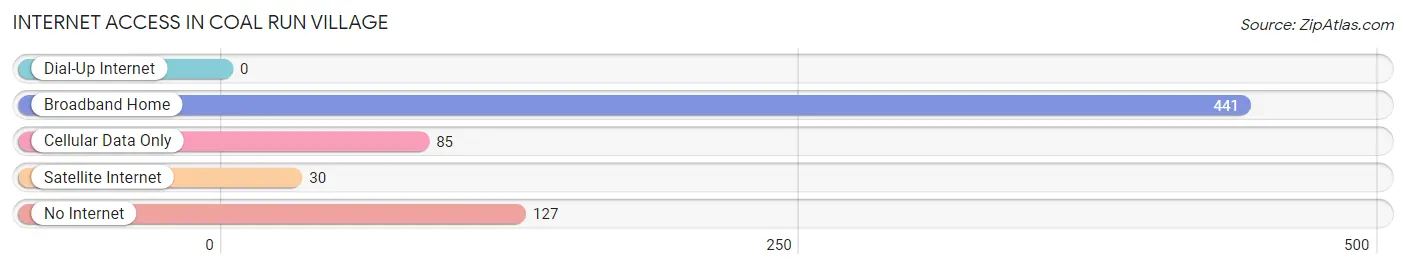
| Internet Type | # Households | % Households |
| Dial-Up Internet | 0 | 0.0% |
| Broadband Home | 441 | 67.2% |
| Cellular Data Only | 85 | 13.0% |
| Satellite Internet | 30 | 4.6% |
| No Internet | 127 | 19.4% |
| Total | 656 | 100.0% |
Coal Run Village Summary
Coal Run Village is a small unincorporated community located in Pike County, Kentucky. It is situated along the banks of the Levisa Fork of the Big Sandy River, approximately five miles south of Pikeville. The village was established in the late 1800s and has a population of approximately 1,000 people.
History
Coal Run Village was established in the late 1800s as a coal mining town. The town was named after the nearby Coal Run Creek, which was used to transport coal from the mines to the nearby railroad. The town was home to several coal mines, including the Coal Run Mine, which was the largest in the area. The town was also home to several stores, churches, and a post office.
In the early 1900s, the town began to decline as the coal industry began to decline. The town was eventually abandoned in the 1950s, and the remaining buildings were demolished. In the late 1970s, the town was re-established as a residential community.
Geography
Coal Run Village is located in Pike County, Kentucky, approximately five miles south of Pikeville. The village is situated along the banks of the Levisa Fork of the Big Sandy River. The terrain in the area is mostly hilly and forested, with some flat areas. The climate in the area is humid subtropical, with hot summers and mild winters.
Economy
The economy of Coal Run Village is largely based on tourism and agriculture. The town is home to several small businesses, including restaurants, stores, and a post office. The town is also home to several farms, which produce a variety of crops, including corn, soybeans, and hay.
Demographics
As of the 2010 census, the population of Coal Run Village was 1,000 people. The racial makeup of the town was 97.2% White, 0.7% African American, 0.3% Native American, 0.2% Asian, and 1.6% from other races. The median household income in the town was $25,000, and the median age was 40 years.
Conclusion
Coal Run Village is a small unincorporated community located in Pike County, Kentucky. It was established in the late 1800s as a coal mining town, but has since become a residential community. The economy of the town is largely based on tourism and agriculture, and the population is approximately 1,000 people. The town is home to several small businesses, farms, and a post office.
Common Questions
What is Per Capita Income in Coal Run Village?
Per Capita income in Coal Run Village is $30,991.
What is the Median Family Income in Coal Run Village?
Median Family Income in Coal Run Village is $56,042.
What is the Median Household income in Coal Run Village?
Median Household Income in Coal Run Village is $43,315.
What is Income or Wage Gap in Coal Run Village?
Income or Wage Gap in Coal Run Village is 45.1%.
Women in Coal Run Village earn 54.9 cents for every dollar earned by a man.
What is Family Income Deficit in Coal Run Village?
Family Income Deficit in Coal Run Village is $9,123.
Families that are below poverty line in Coal Run Village earn $9,123 less on average than the poverty threshold level.
What is Inequality or Gini Index in Coal Run Village?
Inequality or Gini Index in Coal Run Village is 0.54.
What is the Total Population of Coal Run Village?
Total Population of Coal Run Village is 1,519.
What is the Total Male Population of Coal Run Village?
Total Male Population of Coal Run Village is 692.
What is the Total Female Population of Coal Run Village?
Total Female Population of Coal Run Village is 827.
What is the Ratio of Males per 100 Females in Coal Run Village?
There are 83.68 Males per 100 Females in Coal Run Village.
What is the Ratio of Females per 100 Males in Coal Run Village?
There are 119.51 Females per 100 Males in Coal Run Village.
What is the Median Population Age in Coal Run Village?
Median Population Age in Coal Run Village is 42.4 Years.
What is the Average Family Size in Coal Run Village
Average Family Size in Coal Run Village is 2.7 People.
What is the Average Household Size in Coal Run Village
Average Household Size in Coal Run Village is 2.3 People.
How Large is the Labor Force in Coal Run Village?
There are 666 People in the Labor Forcein in Coal Run Village.
What is the Percentage of People in the Labor Force in Coal Run Village?
55.3% of People are in the Labor Force in Coal Run Village.
What is the Unemployment Rate in Coal Run Village?
Unemployment Rate in Coal Run Village is 3.0%.