Morehead, KY Map & Demographics
Morehead Map
Morehead Overview
$23,049
PER CAPITA INCOME
$88,450
AVG FAMILY INCOME
$32,020
AVG HOUSEHOLD INCOME
49.5%
WAGE / INCOME GAP [ % ]
50.5¢/ $1
WAGE / INCOME GAP [ $ ]
0.65
INEQUALITY / GINI INDEX
7,001
TOTAL POPULATION
3,317
MALE POPULATION
3,684
FEMALE POPULATION
90.04
MALES / 100 FEMALES
111.06
FEMALES / 100 MALES
22.0
MEDIAN AGE
3.5
AVG FAMILY SIZE
2.4
AVG HOUSEHOLD SIZE
3,346
LABOR FORCE [ PEOPLE ]
53.2%
PERCENT IN LABOR FORCE
5.2%
UNEMPLOYMENT RATE
Morehead Zip Codes
Morehead Area Codes
Income in Morehead
Income Overview in Morehead
Per Capita Income in Morehead is $23,049, while median incomes of families and households are $88,450 and $32,020 respectively.
| Characteristic | Number | Measure |
| Per Capita Income | 7,001 | $23,049 |
| Median Family Income | 783 | $88,450 |
| Mean Family Income | 783 | $129,841 |
| Median Household Income | 1,766 | $32,020 |
| Mean Household Income | 1,766 | $76,903 |
| Income Deficit | 783 | $0 |
| Wage / Income Gap (%) | 7,001 | 49.52% |
| Wage / Income Gap ($) | 7,001 | 50.48¢ per $1 |
| Gini / Inequality Index | 7,001 | 0.65 |
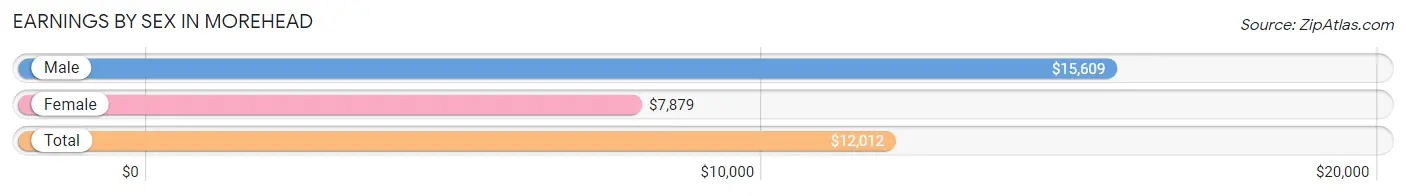
Earnings by Sex in Morehead
Average Earnings in Morehead are $12,012, $15,609 for men and $7,879 for women, a difference of 49.5%.
| Sex | Number | Average Earnings |
| Male | 2,014 (47.8%) | $15,609 |
| Female | 2,202 (52.2%) | $7,879 |
| Total | 4,216 (100.0%) | $12,012 |
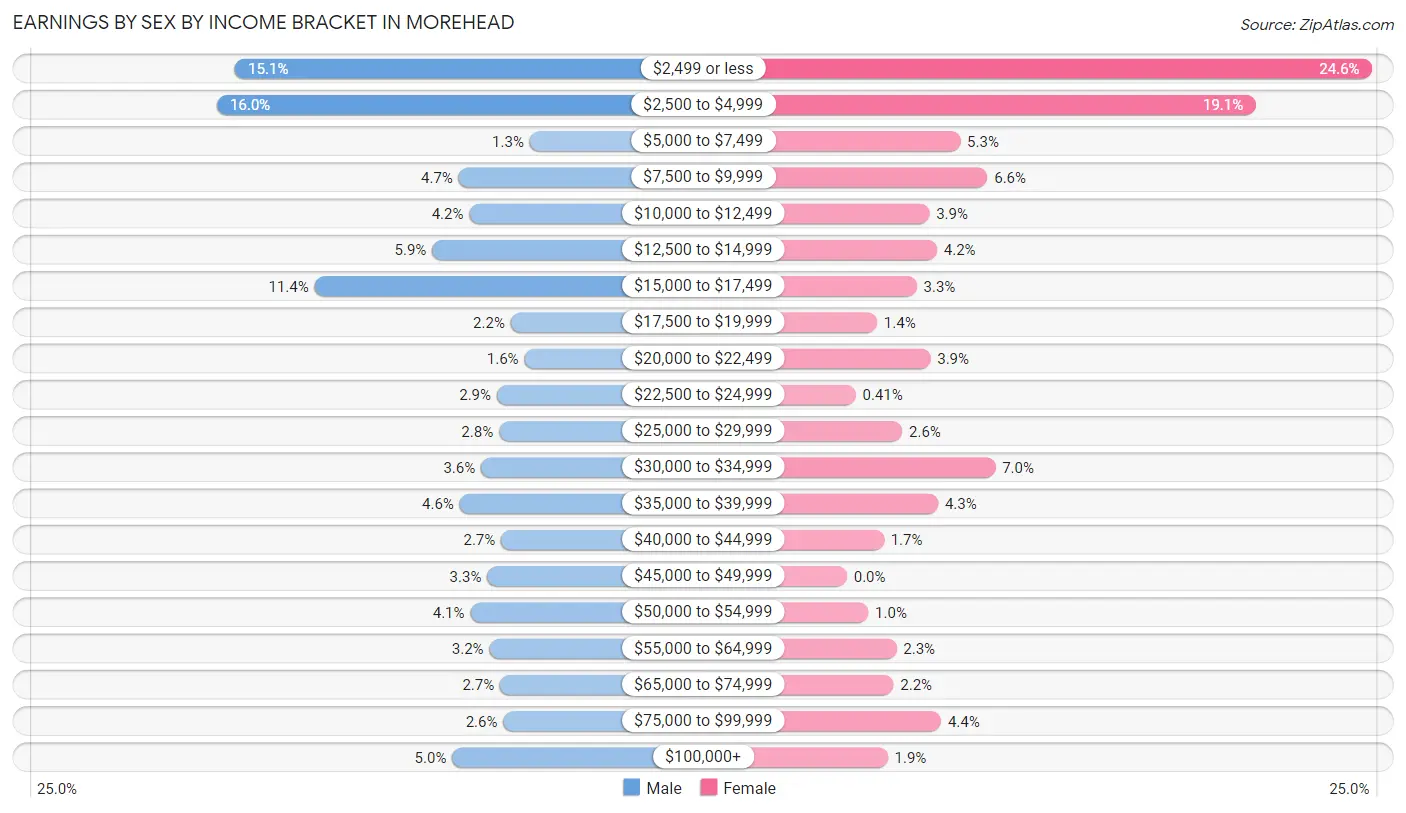
Earnings by Sex by Income Bracket in Morehead
The most common earnings brackets in Morehead are $2,500 to $4,999 for men (322 | 16.0%) and $2,499 or less for women (541 | 24.6%).
| Income | Male | Female |
| $2,499 or less | 305 (15.1%) | 541 (24.6%) |
| $2,500 to $4,999 | 322 (16.0%) | 421 (19.1%) |
| $5,000 to $7,499 | 27 (1.3%) | 117 (5.3%) |
| $7,500 to $9,999 | 94 (4.7%) | 145 (6.6%) |
| $10,000 to $12,499 | 84 (4.2%) | 85 (3.9%) |
| $12,500 to $14,999 | 119 (5.9%) | 93 (4.2%) |
| $15,000 to $17,499 | 230 (11.4%) | 72 (3.3%) |
| $17,500 to $19,999 | 45 (2.2%) | 31 (1.4%) |
| $20,000 to $22,499 | 32 (1.6%) | 86 (3.9%) |
| $22,500 to $24,999 | 58 (2.9%) | 9 (0.4%) |
| $25,000 to $29,999 | 56 (2.8%) | 57 (2.6%) |
| $30,000 to $34,999 | 73 (3.6%) | 153 (7.0%) |
| $35,000 to $39,999 | 93 (4.6%) | 94 (4.3%) |
| $40,000 to $44,999 | 54 (2.7%) | 38 (1.7%) |
| $45,000 to $49,999 | 67 (3.3%) | 0 (0.0%) |
| $50,000 to $54,999 | 83 (4.1%) | 22 (1.0%) |
| $55,000 to $64,999 | 65 (3.2%) | 51 (2.3%) |
| $65,000 to $74,999 | 55 (2.7%) | 48 (2.2%) |
| $75,000 to $99,999 | 52 (2.6%) | 97 (4.4%) |
| $100,000+ | 100 (5.0%) | 42 (1.9%) |
| Total | 2,014 (100.0%) | 2,202 (100.0%) |
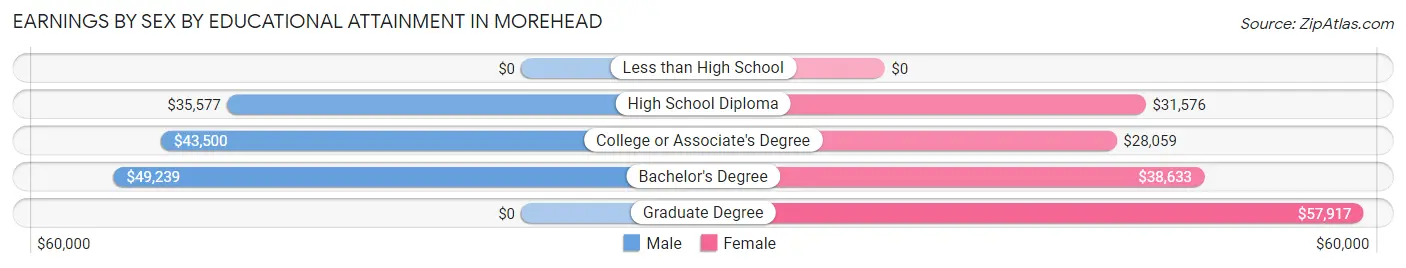
Earnings by Sex by Educational Attainment in Morehead
Average earnings in Morehead are $42,742 for men and $33,700 for women, a difference of 21.1%. Men with an educational attainment of bachelor's degree enjoy the highest average annual earnings of $49,239, while those with high school diploma education earn the least with $35,577. Women with an educational attainment of graduate degree earn the most with the average annual earnings of $57,917, while those with college or associate's degree education have the smallest earnings of $28,059.
| Educational Attainment | Male Income | Female Income |
| Less than High School | - | - |
| High School Diploma | $35,577 | $31,576 |
| College or Associate's Degree | $43,500 | $28,059 |
| Bachelor's Degree | $49,239 | $38,633 |
| Graduate Degree | - | - |
| Total | $42,742 | $33,700 |
Family Income in Morehead
Family Income Brackets in Morehead
According to the Morehead family income data, there are 185 families falling into the $100,000 to $149,999 income range, which is the most common income bracket and makes up 23.6% of all families.
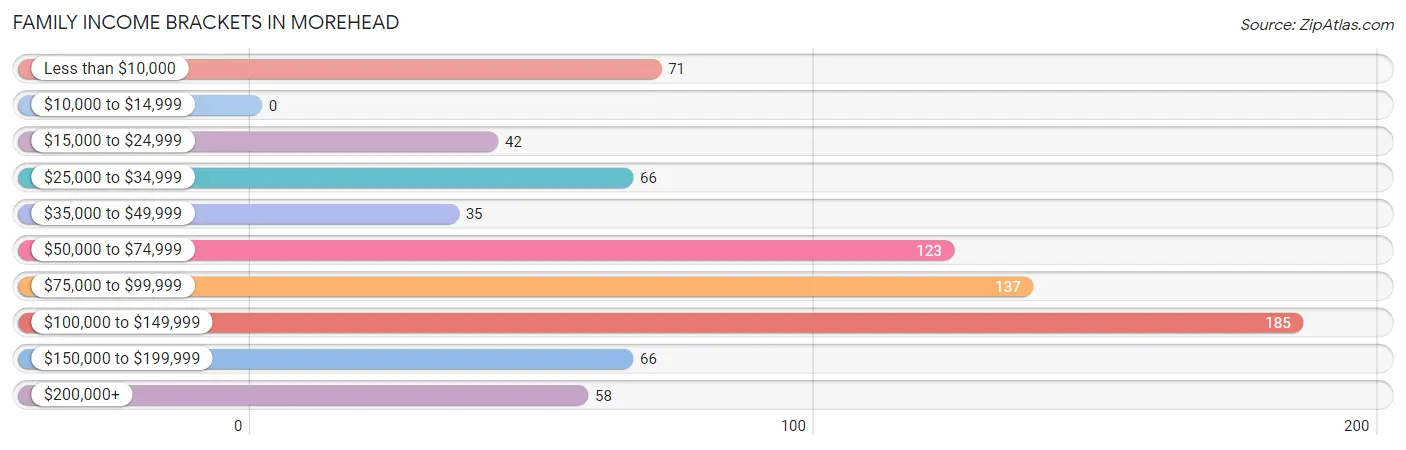
| Income Bracket | # Families | % Families |
| Less than $10,000 | 71 | 9.1% |
| $10,000 to $14,999 | 0 | 0.0% |
| $15,000 to $24,999 | 42 | 5.4% |
| $25,000 to $34,999 | 66 | 8.4% |
| $35,000 to $49,999 | 35 | 4.5% |
| $50,000 to $74,999 | 123 | 15.7% |
| $75,000 to $99,999 | 137 | 17.5% |
| $100,000 to $149,999 | 185 | 23.6% |
| $150,000 to $199,999 | 66 | 8.4% |
| $200,000+ | 58 | 7.4% |
Family Income by Famaliy Size in Morehead
2-person families (255 | 32.6%) account for the highest median family income in Morehead with $115,473 per family, while 2-person families (255 | 32.6%) have the highest median income of $57,736 per family member.
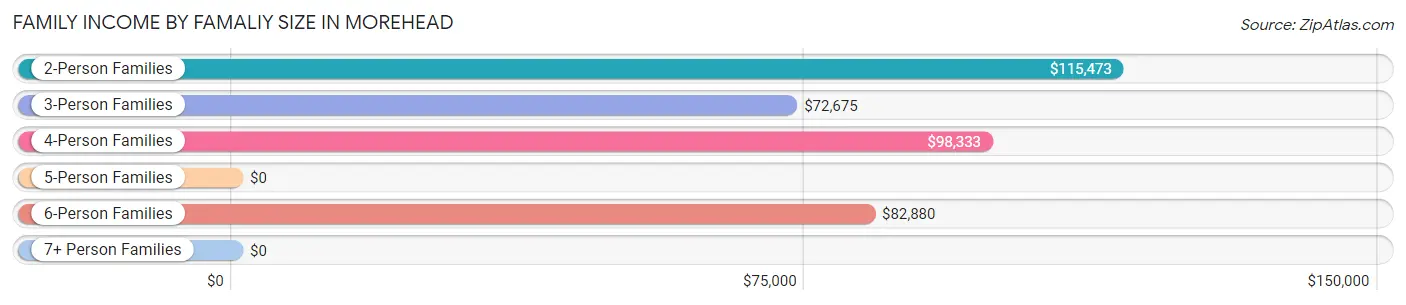
| Income Bracket | # Families | Median Income |
| 2-Person Families | 255 (32.6%) | $115,473 |
| 3-Person Families | 181 (23.1%) | $72,675 |
| 4-Person Families | 236 (30.1%) | $98,333 |
| 5-Person Families | 44 (5.6%) | $0 |
| 6-Person Families | 53 (6.8%) | $82,880 |
| 7+ Person Families | 14 (1.8%) | $0 |
| Total | 783 (100.0%) | $88,450 |
Family Income by Number of Earners in Morehead
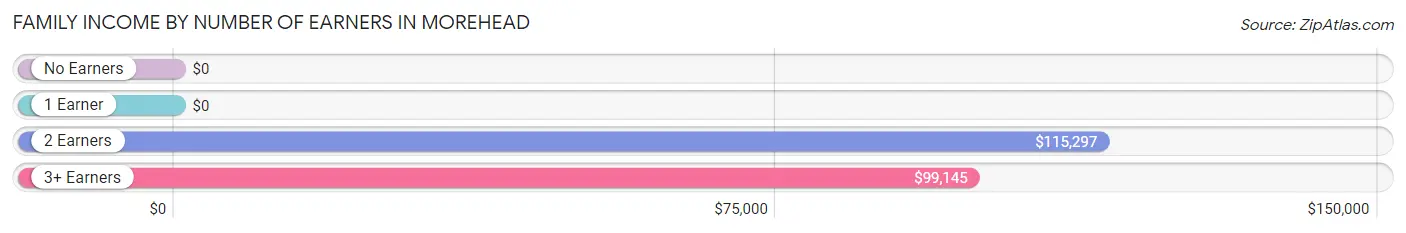
| Number of Earners | # Families | Median Income |
| No Earners | 103 (13.2%) | $0 |
| 1 Earner | 150 (19.2%) | $0 |
| 2 Earners | 399 (51.0%) | $115,297 |
| 3+ Earners | 131 (16.7%) | $99,145 |
| Total | 783 (100.0%) | $88,450 |
Household Income in Morehead
Household Income Brackets in Morehead
With 291 households falling in the category, the less than $10,000 income range is the most frequent in Morehead, accounting for 16.5% of all households. In contrast, only 72 households (4.1%) fall into the $150,000 to $199,999 income bracket, making it the least populous group.
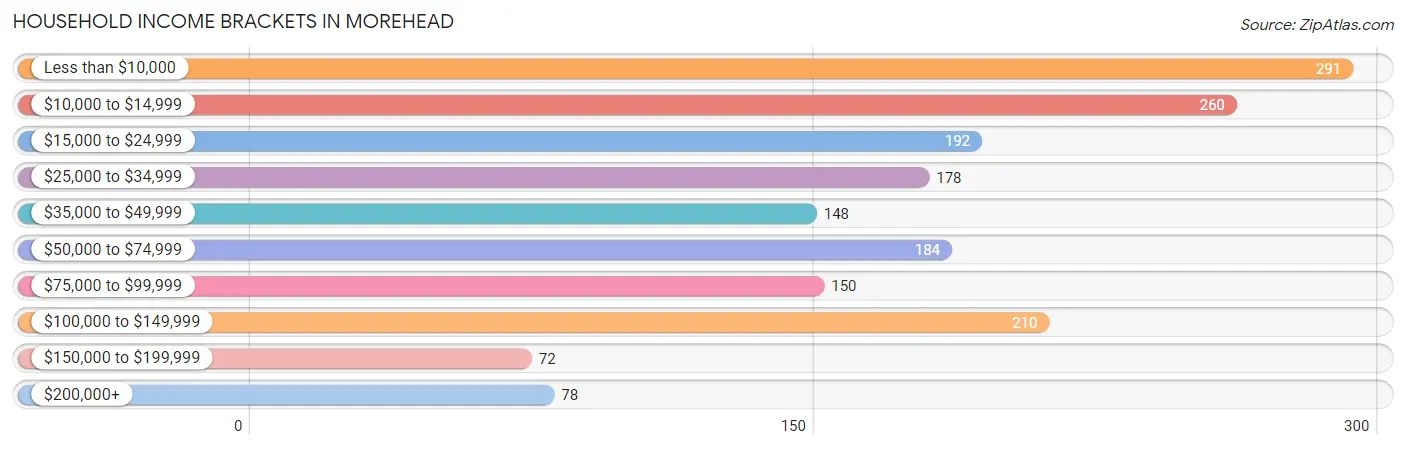
| Income Bracket | # Households | % Households |
| Less than $10,000 | 291 | 16.5% |
| $10,000 to $14,999 | 260 | 14.7% |
| $15,000 to $24,999 | 192 | 10.9% |
| $25,000 to $34,999 | 178 | 10.1% |
| $35,000 to $49,999 | 148 | 8.4% |
| $50,000 to $74,999 | 184 | 10.4% |
| $75,000 to $99,999 | 150 | 8.5% |
| $100,000 to $149,999 | 210 | 11.9% |
| $150,000 to $199,999 | 72 | 4.1% |
| $200,000+ | 78 | 4.4% |
Household Income by Householder Age in Morehead
The median household income in Morehead is $32,020, with the highest median household income of $72,404 found in the 45 to 64 years age bracket for the primary householder. A total of 504 households (28.5%) fall into this category. Meanwhile, the 65+ years age bracket for the primary householder has the lowest median household income of $0, with 271 households (15.3%) in this group.
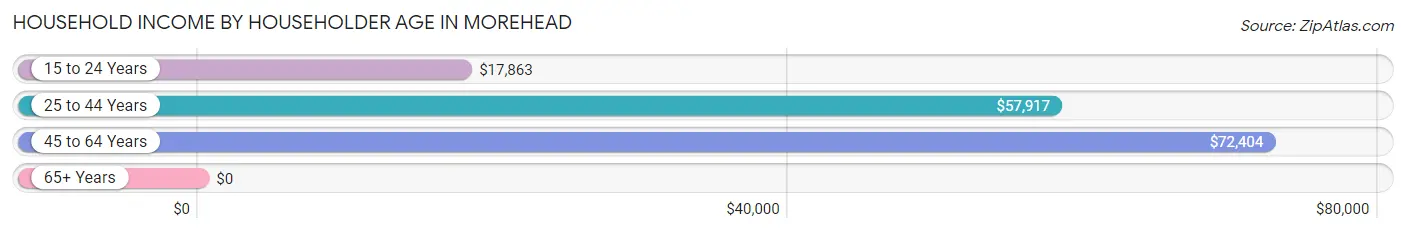
| Income Bracket | # Households | Median Income |
| 15 to 24 Years | 443 (25.1%) | $17,863 |
| 25 to 44 Years | 548 (31.0%) | $57,917 |
| 45 to 64 Years | 504 (28.5%) | $72,404 |
| 65+ Years | 271 (15.3%) | $0 |
| Total | 1,766 (100.0%) | $32,020 |
Poverty in Morehead
Income Below Poverty by Sex and Age in Morehead
With 32.4% poverty level for males and 36.8% for females among the residents of Morehead, 12 to 14 year old males and 12 to 14 year old females are the most vulnerable to poverty, with 58 males (75.3%) and 46 females (100.0%) in their respective age groups living below the poverty level.
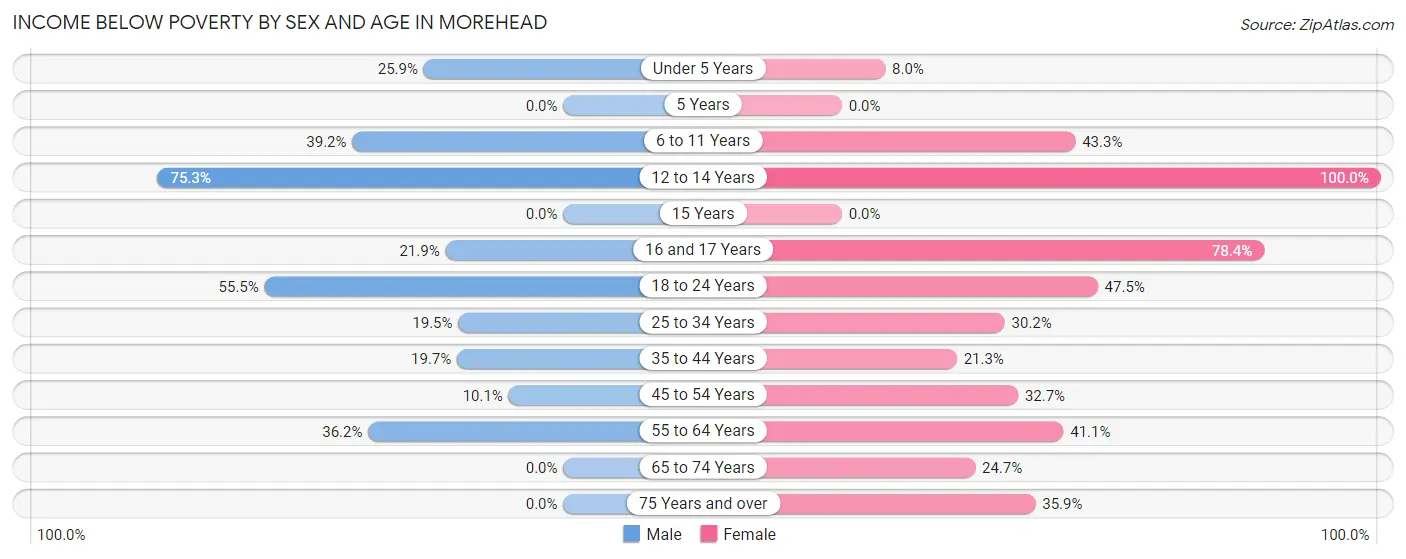
| Age Bracket | Male | Female |
| Under 5 Years | 43 (25.9%) | 9 (8.0%) |
| 5 Years | 0 (0.0%) | 0 (0.0%) |
| 6 to 11 Years | 56 (39.2%) | 39 (43.3%) |
| 12 to 14 Years | 58 (75.3%) | 46 (100.0%) |
| 15 Years | 0 (0.0%) | 0 (0.0%) |
| 16 and 17 Years | 7 (21.9%) | 58 (78.4%) |
| 18 to 24 Years | 356 (55.4%) | 255 (47.5%) |
| 25 to 34 Years | 69 (19.5%) | 110 (30.2%) |
| 35 to 44 Years | 42 (19.7%) | 48 (21.3%) |
| 45 to 54 Years | 22 (10.1%) | 52 (32.7%) |
| 55 to 64 Years | 59 (36.2%) | 81 (41.1%) |
| 65 to 74 Years | 0 (0.0%) | 23 (24.7%) |
| 75 Years and over | 0 (0.0%) | 51 (35.9%) |
| Total | 712 (32.4%) | 772 (36.8%) |
Income Above Poverty by Sex and Age in Morehead
According to the poverty statistics in Morehead, males aged 5 years and females aged 15 years are the age groups that are most secure financially, with 100.0% of males and 100.0% of females in these age groups living above the poverty line.
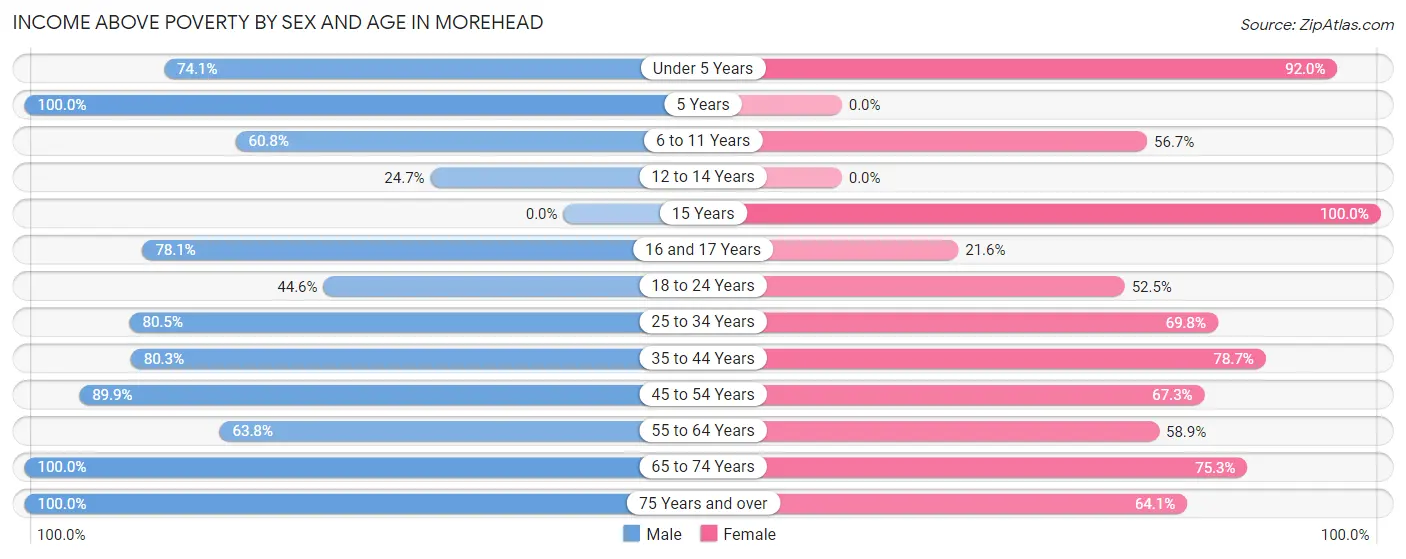
| Age Bracket | Male | Female |
| Under 5 Years | 123 (74.1%) | 103 (92.0%) |
| 5 Years | 8 (100.0%) | 0 (0.0%) |
| 6 to 11 Years | 87 (60.8%) | 51 (56.7%) |
| 12 to 14 Years | 19 (24.7%) | 0 (0.0%) |
| 15 Years | 0 (0.0%) | 56 (100.0%) |
| 16 and 17 Years | 25 (78.1%) | 16 (21.6%) |
| 18 to 24 Years | 286 (44.6%) | 282 (52.5%) |
| 25 to 34 Years | 285 (80.5%) | 254 (69.8%) |
| 35 to 44 Years | 171 (80.3%) | 177 (78.7%) |
| 45 to 54 Years | 195 (89.9%) | 107 (67.3%) |
| 55 to 64 Years | 104 (63.8%) | 116 (58.9%) |
| 65 to 74 Years | 142 (100.0%) | 70 (75.3%) |
| 75 Years and over | 44 (100.0%) | 91 (64.1%) |
| Total | 1,489 (67.6%) | 1,323 (63.1%) |
Income Below Poverty Among Married-Couple Families in Morehead
The poverty statistics for married-couple families in Morehead show that 12.2% or 77 of the total 632 families live below the poverty line. Families with 3 or 4 children have the highest poverty rate of 17.5%, comprising of 10 families. On the other hand, families with 5 or more children have the lowest poverty rate of 0.0%, which includes 0 families.
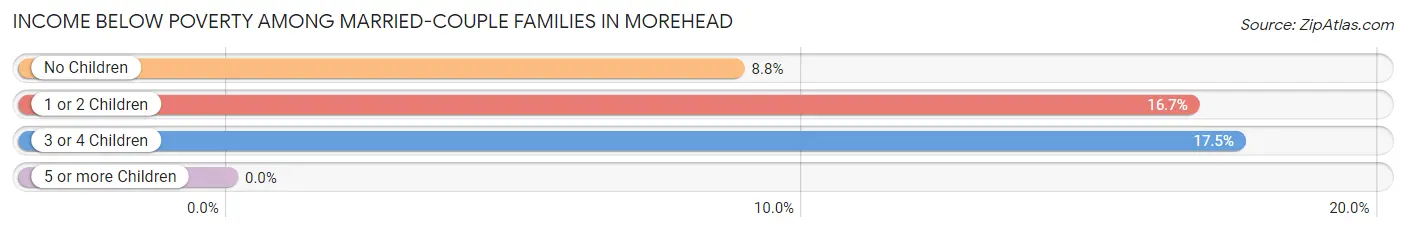
| Children | Above Poverty | Below Poverty |
| No Children | 310 (91.2%) | 30 (8.8%) |
| 1 or 2 Children | 184 (83.3%) | 37 (16.7%) |
| 3 or 4 Children | 47 (82.5%) | 10 (17.5%) |
| 5 or more Children | 14 (100.0%) | 0 (0.0%) |
| Total | 555 (87.8%) | 77 (12.2%) |
Income Below Poverty Among Single-Parent Households in Morehead
According to the poverty data in Morehead, 22.6% or 21 single-father households and 86.2% or 50 single-mother households are living below the poverty line. Among single-father households, those with 1 or 2 children have the highest poverty rate, with 14 households (100.0%) experiencing poverty. Likewise, among single-mother households, those with 1 or 2 children have the highest poverty rate, with 15 households (100.0%) falling below the poverty line.
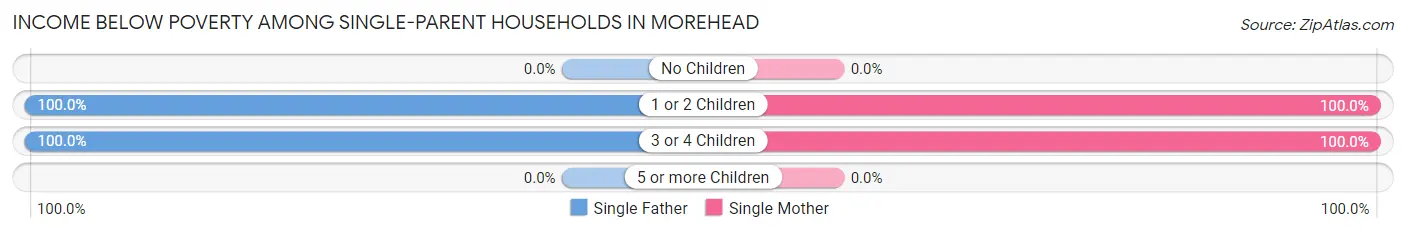
| Children | Single Father | Single Mother |
| No Children | 0 (0.0%) | 0 (0.0%) |
| 1 or 2 Children | 14 (100.0%) | 15 (100.0%) |
| 3 or 4 Children | 7 (100.0%) | 35 (100.0%) |
| 5 or more Children | 0 (0.0%) | 0 (0.0%) |
| Total | 21 (22.6%) | 50 (86.2%) |
Income Below Poverty Among Married-Couple vs Single-Parent Households in Morehead
The poverty data for Morehead shows that 77 of the married-couple family households (12.2%) and 71 of the single-parent households (47.0%) are living below the poverty level. Within the married-couple family households, those with 3 or 4 children have the highest poverty rate, with 10 households (17.5%) falling below the poverty line. Among the single-parent households, those with 1 or 2 children have the highest poverty rate, with 29 household (100.0%) living below poverty.
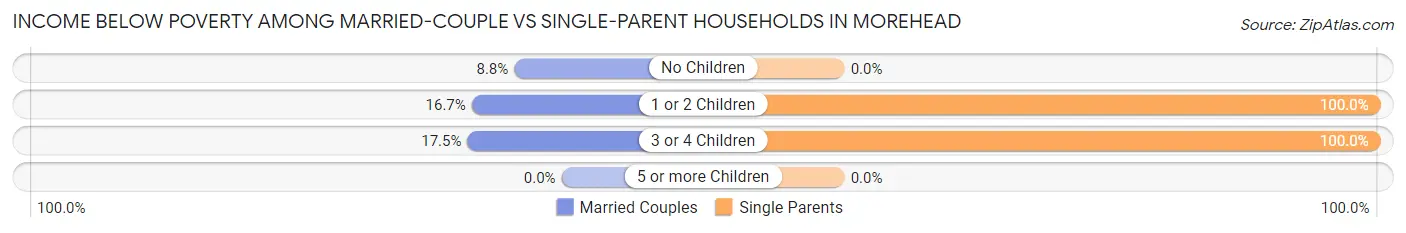
| Children | Married-Couple Families | Single-Parent Households |
| No Children | 30 (8.8%) | 0 (0.0%) |
| 1 or 2 Children | 37 (16.7%) | 29 (100.0%) |
| 3 or 4 Children | 10 (17.5%) | 42 (100.0%) |
| 5 or more Children | 0 (0.0%) | 0 (0.0%) |
| Total | 77 (12.2%) | 71 (47.0%) |
Race in Morehead
The most populous races in Morehead are White / Caucasian (6,382 | 91.2%), Hispanic or Latino (377 | 5.4%), and Black / African American (266 | 3.8%).
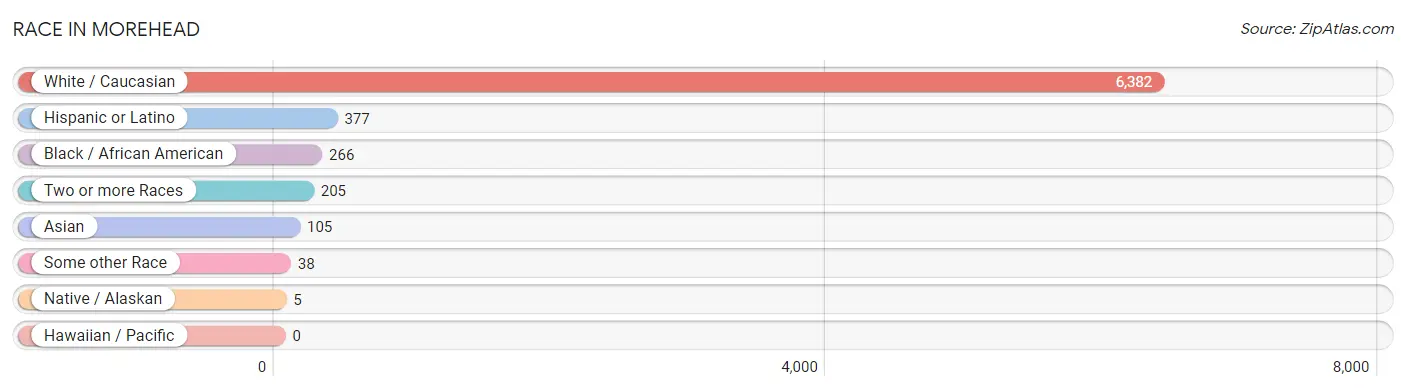
| Race | # Population | % Population |
| Asian | 105 | 1.5% |
| Black / African American | 266 | 3.8% |
| Hawaiian / Pacific | 0 | 0.0% |
| Hispanic or Latino | 377 | 5.4% |
| Native / Alaskan | 5 | 0.1% |
| White / Caucasian | 6,382 | 91.2% |
| Two or more Races | 205 | 2.9% |
| Some other Race | 38 | 0.5% |
| Total | 7,001 | 100.0% |
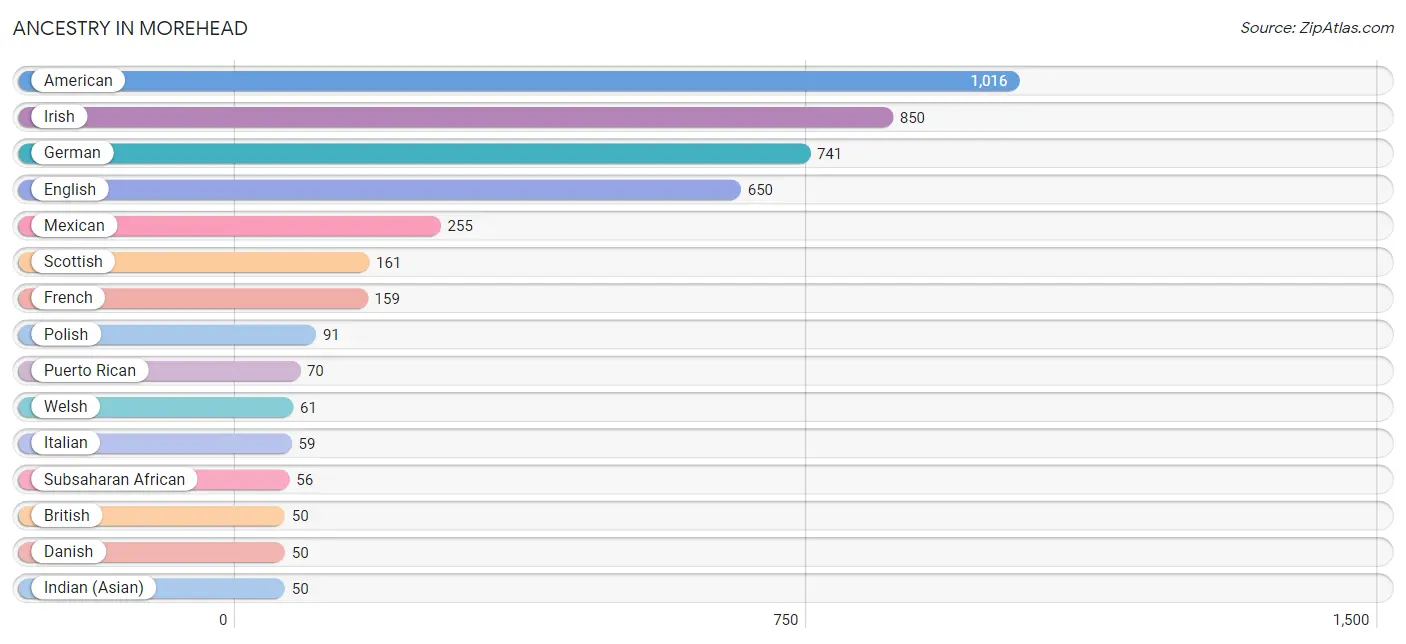
Ancestry in Morehead
The most populous ancestries reported in Morehead are American (1,016 | 14.5%), Irish (850 | 12.1%), German (741 | 10.6%), English (650 | 9.3%), and Mexican (255 | 3.6%), together accounting for 50.2% of all Morehead residents.
| Ancestry | # Population | % Population |
| African | 31 | 0.4% |
| American | 1,016 | 14.5% |
| Austrian | 7 | 0.1% |
| Bahamian | 31 | 0.4% |
| Bhutanese | 11 | 0.2% |
| Blackfeet | 3 | 0.0% |
| British | 50 | 0.7% |
| Celtic | 32 | 0.5% |
| Central American | 31 | 0.4% |
| Cherokee | 42 | 0.6% |
| Czech | 8 | 0.1% |
| Danish | 50 | 0.7% |
| Dutch | 43 | 0.6% |
| English | 650 | 9.3% |
| European | 34 | 0.5% |
| Finnish | 12 | 0.2% |
| French | 159 | 2.3% |
| German | 741 | 10.6% |
| Greek | 1 | 0.0% |
| Guatemalan | 31 | 0.4% |
| Hungarian | 11 | 0.2% |
| Indian (Asian) | 50 | 0.7% |
| Irish | 850 | 12.1% |
| Iroquois | 8 | 0.1% |
| Italian | 59 | 0.8% |
| Jamaican | 1 | 0.0% |
| Japanese | 14 | 0.2% |
| Korean | 20 | 0.3% |
| Mexican | 255 | 3.6% |
| Mongolian | 16 | 0.2% |
| Nigerian | 25 | 0.4% |
| Northern European | 17 | 0.2% |
| Norwegian | 14 | 0.2% |
| Polish | 91 | 1.3% |
| Puerto Rican | 70 | 1.0% |
| Russian | 16 | 0.2% |
| Scotch-Irish | 48 | 0.7% |
| Scottish | 161 | 2.3% |
| Spanish | 21 | 0.3% |
| Sri Lankan | 3 | 0.0% |
| Subsaharan African | 56 | 0.8% |
| Swedish | 17 | 0.2% |
| Swiss | 14 | 0.2% |
| Thai | 45 | 0.6% |
| Ukrainian | 1 | 0.0% |
| Welsh | 61 | 0.9% | View All 46 Rows |
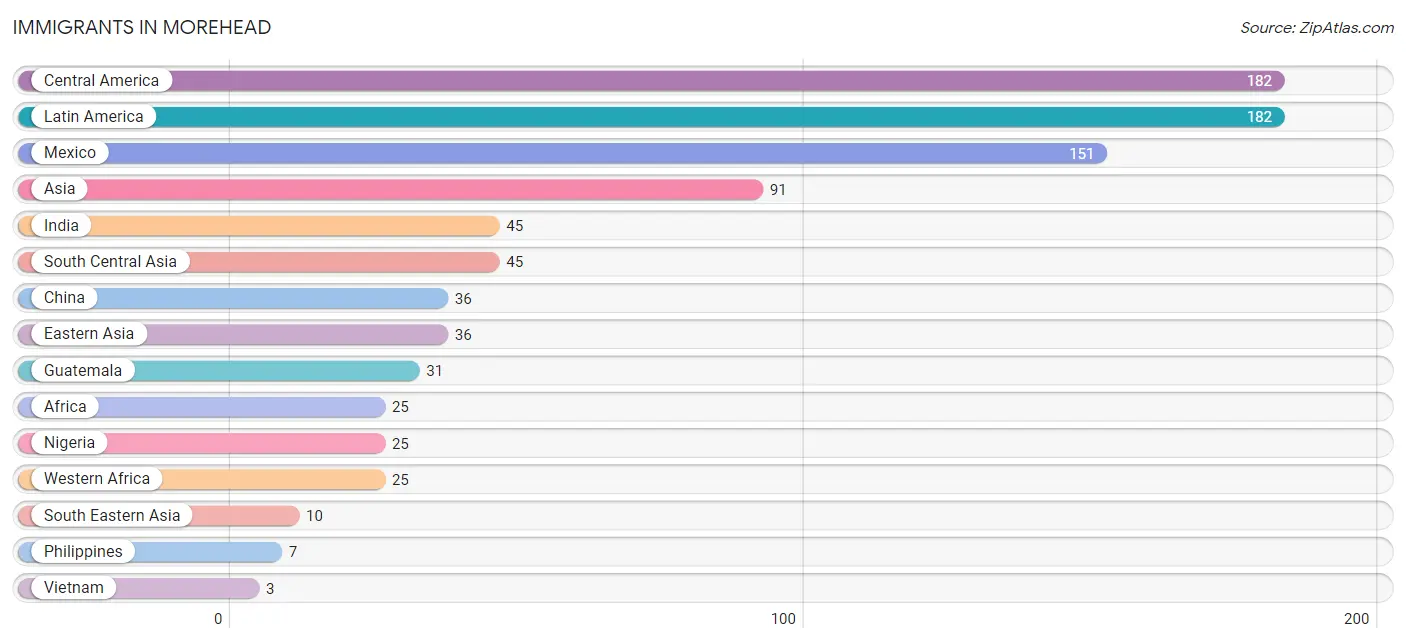
Immigrants in Morehead
The most numerous immigrant groups reported in Morehead came from Central America (182 | 2.6%), Latin America (182 | 2.6%), Mexico (151 | 2.2%), Asia (91 | 1.3%), and India (45 | 0.6%), together accounting for 9.3% of all Morehead residents.
| Immigration Origin | # Population | % Population |
| Africa | 25 | 0.4% |
| Asia | 91 | 1.3% |
| Central America | 182 | 2.6% |
| China | 36 | 0.5% |
| Eastern Asia | 36 | 0.5% |
| Europe | 1 | 0.0% |
| Germany | 1 | 0.0% |
| Guatemala | 31 | 0.4% |
| India | 45 | 0.6% |
| Latin America | 182 | 2.6% |
| Mexico | 151 | 2.2% |
| Nigeria | 25 | 0.4% |
| Philippines | 7 | 0.1% |
| South Central Asia | 45 | 0.6% |
| South Eastern Asia | 10 | 0.1% |
| Vietnam | 3 | 0.0% |
| Western Africa | 25 | 0.4% |
| Western Europe | 1 | 0.0% | View All 18 Rows |
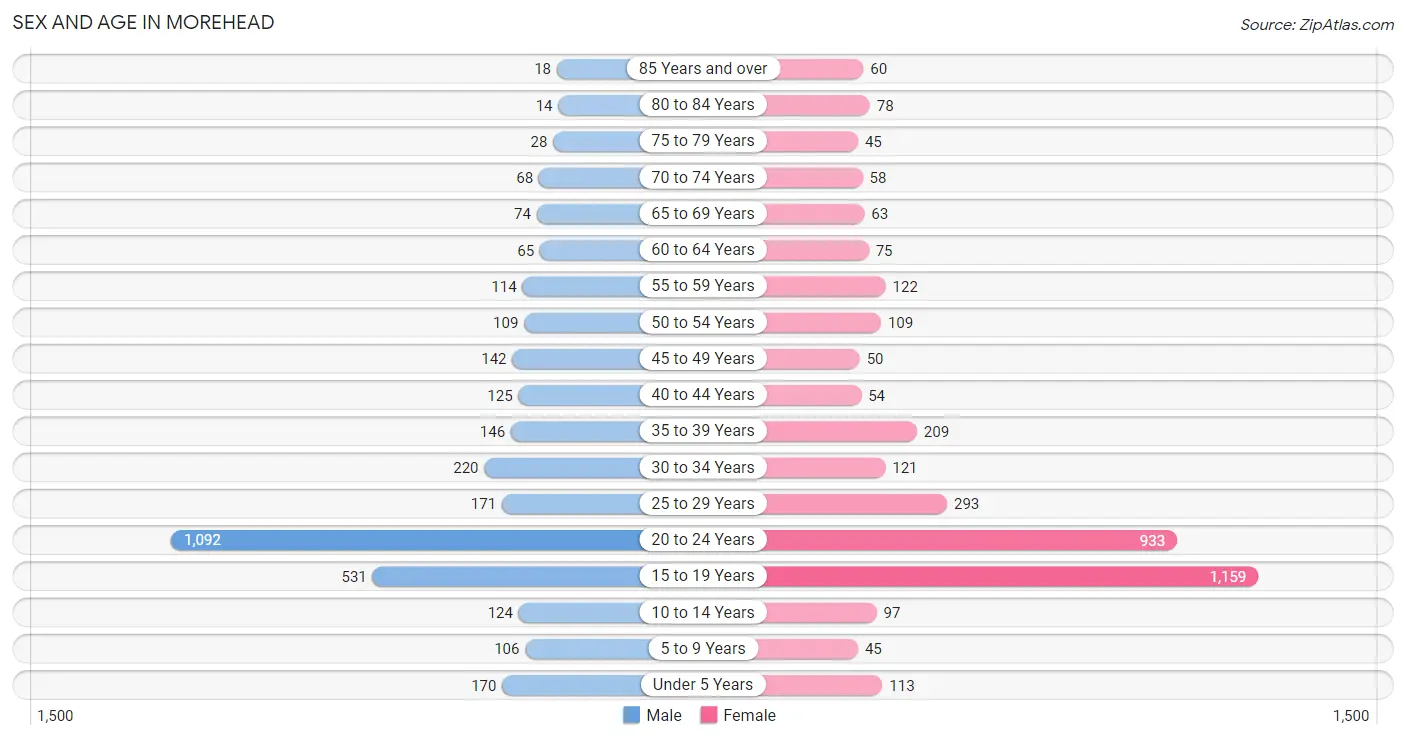
Sex and Age in Morehead
Sex and Age in Morehead
The most populous age groups in Morehead are 20 to 24 Years (1,092 | 32.9%) for men and 15 to 19 Years (1,159 | 31.5%) for women.
| Age Bracket | Male | Female |
| Under 5 Years | 170 (5.1%) | 113 (3.1%) |
| 5 to 9 Years | 106 (3.2%) | 45 (1.2%) |
| 10 to 14 Years | 124 (3.7%) | 97 (2.6%) |
| 15 to 19 Years | 531 (16.0%) | 1,159 (31.5%) |
| 20 to 24 Years | 1,092 (32.9%) | 933 (25.3%) |
| 25 to 29 Years | 171 (5.2%) | 293 (8.0%) |
| 30 to 34 Years | 220 (6.6%) | 121 (3.3%) |
| 35 to 39 Years | 146 (4.4%) | 209 (5.7%) |
| 40 to 44 Years | 125 (3.8%) | 54 (1.5%) |
| 45 to 49 Years | 142 (4.3%) | 50 (1.4%) |
| 50 to 54 Years | 109 (3.3%) | 109 (3.0%) |
| 55 to 59 Years | 114 (3.4%) | 122 (3.3%) |
| 60 to 64 Years | 65 (2.0%) | 75 (2.0%) |
| 65 to 69 Years | 74 (2.2%) | 63 (1.7%) |
| 70 to 74 Years | 68 (2.1%) | 58 (1.6%) |
| 75 to 79 Years | 28 (0.8%) | 45 (1.2%) |
| 80 to 84 Years | 14 (0.4%) | 78 (2.1%) |
| 85 Years and over | 18 (0.5%) | 60 (1.6%) |
| Total | 3,317 (100.0%) | 3,684 (100.0%) |
Families and Households in Morehead
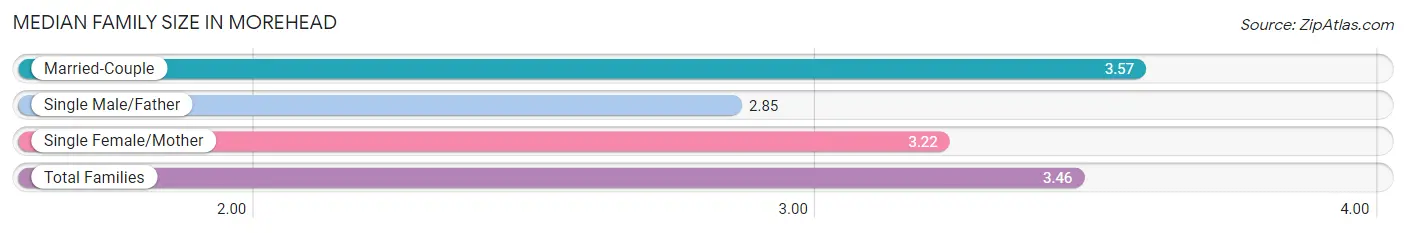
Median Family Size in Morehead
The median family size in Morehead is 3.46 persons per family, with married-couple families (632 | 80.7%) accounting for the largest median family size of 3.57 persons per family. On the other hand, single male/father families (93 | 11.9%) represent the smallest median family size with 2.85 persons per family.
| Family Type | # Families | Family Size |
| Married-Couple | 632 (80.7%) | 3.57 |
| Single Male/Father | 93 (11.9%) | 2.85 |
| Single Female/Mother | 58 (7.4%) | 3.22 |
| Total Families | 783 (100.0%) | 3.46 |
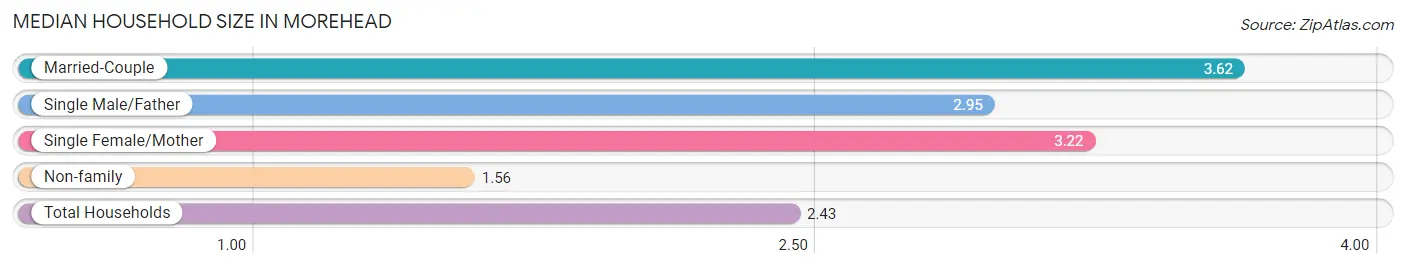
Median Household Size in Morehead
The median household size in Morehead is 2.43 persons per household, with married-couple households (632 | 35.8%) accounting for the largest median household size of 3.62 persons per household. non-family households (983 | 55.7%) represent the smallest median household size with 1.56 persons per household.
| Household Type | # Households | Household Size |
| Married-Couple | 632 (35.8%) | 3.62 |
| Single Male/Father | 93 (5.3%) | 2.95 |
| Single Female/Mother | 58 (3.3%) | 3.22 |
| Non-family | 983 (55.7%) | 1.56 |
| Total Households | 1,766 (100.0%) | 2.43 |
Household Size by Marriage Status in Morehead
Out of a total of 1,766 households in Morehead, 783 (44.3%) are family households, while 983 (55.7%) are nonfamily households. The most numerous type of family households are 2-person households, comprising 255, and the most common type of nonfamily households are 1-person households, comprising 710.
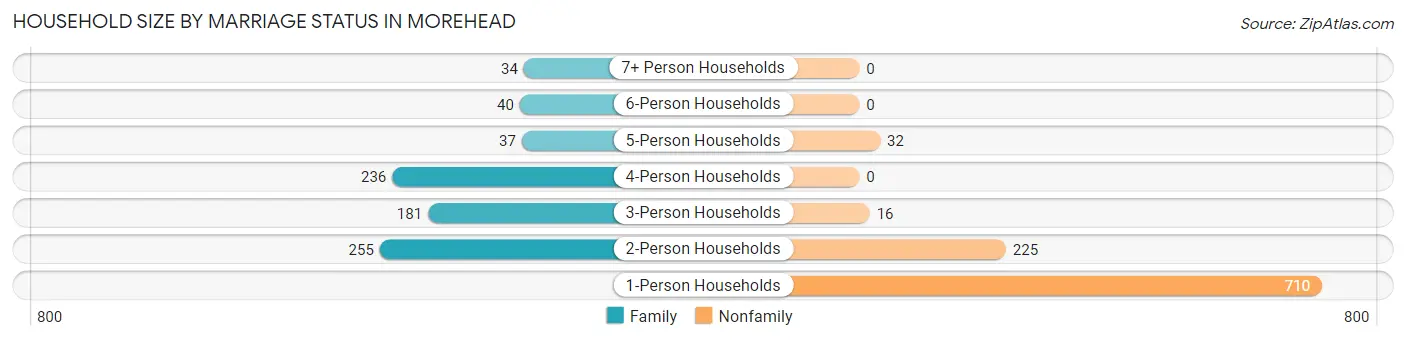
| Household Size | Family Households | Nonfamily Households |
| 1-Person Households | - | 710 (40.2%) |
| 2-Person Households | 255 (14.4%) | 225 (12.7%) |
| 3-Person Households | 181 (10.2%) | 16 (0.9%) |
| 4-Person Households | 236 (13.4%) | 0 (0.0%) |
| 5-Person Households | 37 (2.1%) | 32 (1.8%) |
| 6-Person Households | 40 (2.3%) | 0 (0.0%) |
| 7+ Person Households | 34 (1.9%) | 0 (0.0%) |
| Total | 783 (44.3%) | 983 (55.7%) |
Female Fertility in Morehead
Fertility by Age in Morehead
Average fertility rate in Morehead is 18.0 births per 1,000 women. Women in the age bracket of 20 to 34 years have the highest fertility rate with 33.0 births per 1,000 women. Women in the age bracket of 20 to 34 years acount for 86.3% of all women with births.
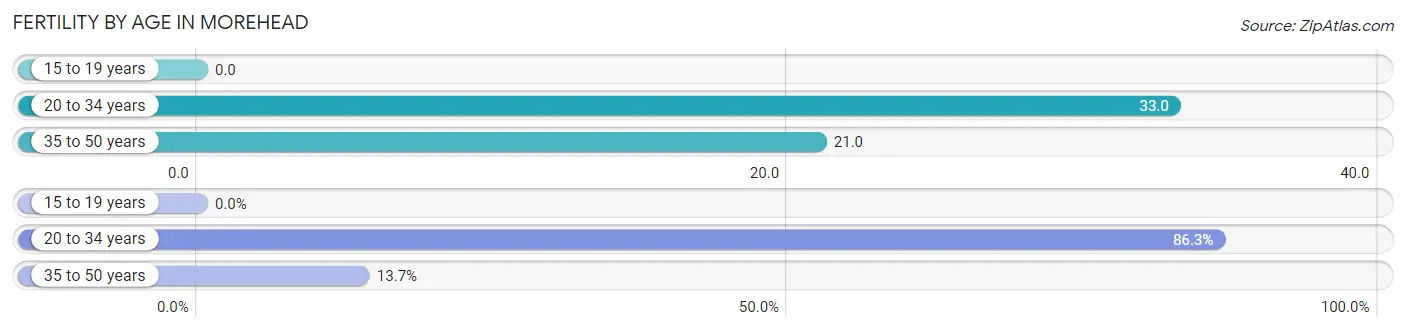
| Age Bracket | Women with Births | Births / 1,000 Women |
| 15 to 19 years | 0 (0.0%) | 0.0 |
| 20 to 34 years | 44 (86.3%) | 33.0 |
| 35 to 50 years | 7 (13.7%) | 21.0 |
| Total | 51 (100.0%) | 18.0 |
Fertility by Age by Marriage Status in Morehead
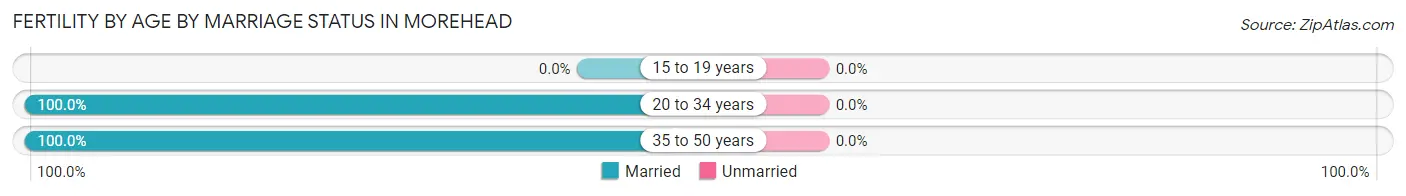
| Age Bracket | Married | Unmarried |
| 15 to 19 years | 0 (0.0%) | 0 (0.0%) |
| 20 to 34 years | 44 (100.0%) | 0 (0.0%) |
| 35 to 50 years | 7 (100.0%) | 0 (0.0%) |
| Total | 51 (100.0%) | 0 (0.0%) |
Fertility by Education in Morehead
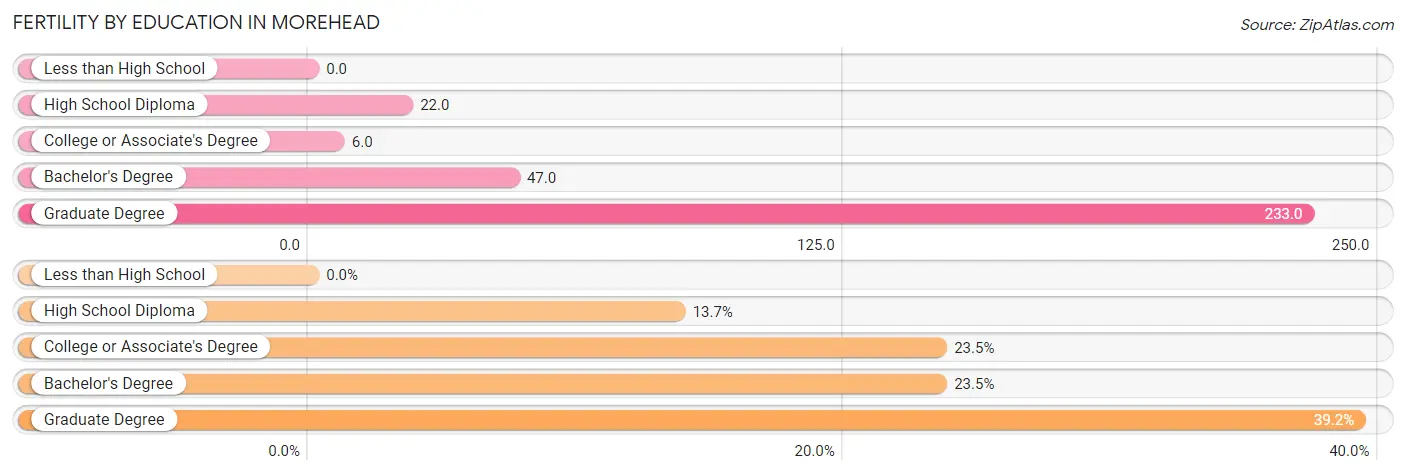
| Educational Attainment | Women with Births | Births / 1,000 Women |
| Less than High School | 0 (0.0%) | 0.0 |
| High School Diploma | 7 (13.7%) | 22.0 |
| College or Associate's Degree | 12 (23.5%) | 6.0 |
| Bachelor's Degree | 12 (23.5%) | 47.0 |
| Graduate Degree | 20 (39.2%) | 233.0 |
| Total | 51 (100.0%) | 18.0 |
Fertility by Education by Marriage Status in Morehead
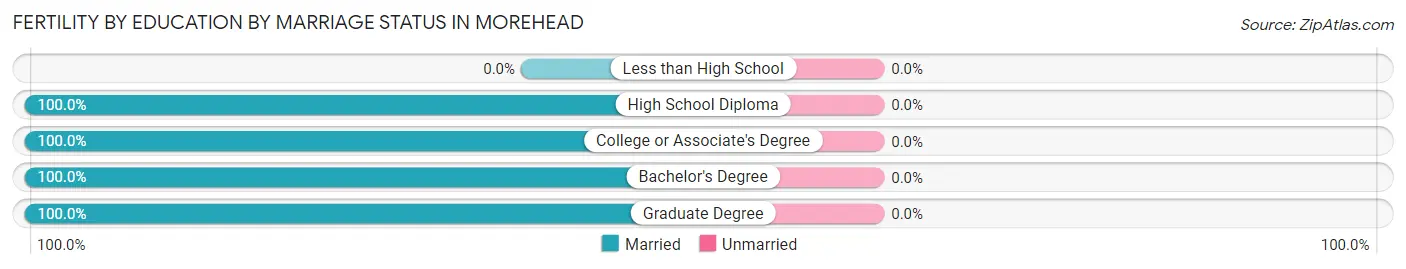
| Educational Attainment | Married | Unmarried |
| Less than High School | 0 (0.0%) | 0 (0.0%) |
| High School Diploma | 7 (100.0%) | 0 (0.0%) |
| College or Associate's Degree | 12 (100.0%) | 0 (0.0%) |
| Bachelor's Degree | 12 (100.0%) | 0 (0.0%) |
| Graduate Degree | 20 (100.0%) | 0 (0.0%) |
| Total | 51 (100.0%) | 0 (0.0%) |
Employment Characteristics in Morehead
Employment by Class of Employer in Morehead
Among the 3,037 employed individuals in Morehead, private company employees (1,730 | 57.0%), state government employees (690 | 22.7%), and not-for-profit organizations (335 | 11.0%) make up the most common classes of employment.
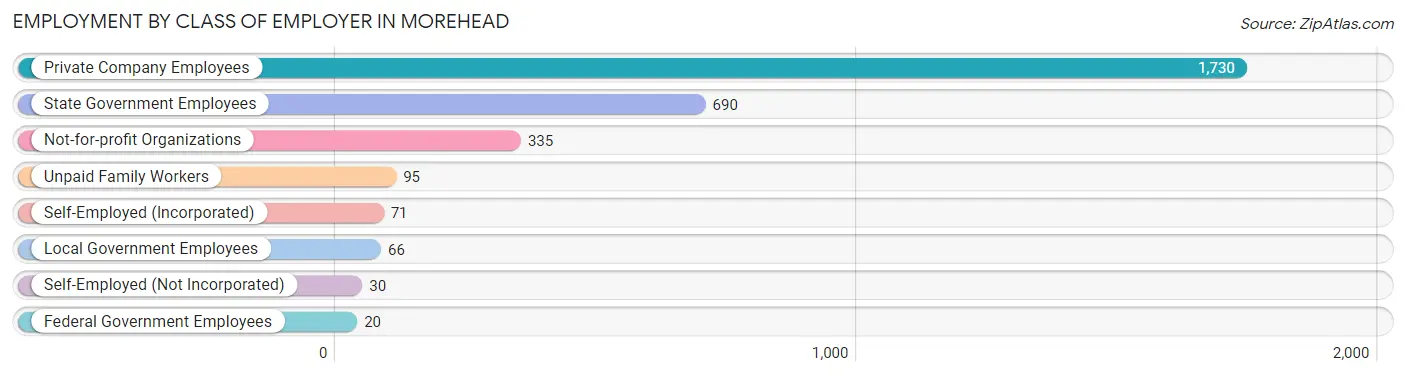
| Employer Class | # Employees | % Employees |
| Private Company Employees | 1,730 | 57.0% |
| Self-Employed (Incorporated) | 71 | 2.3% |
| Self-Employed (Not Incorporated) | 30 | 1.0% |
| Not-for-profit Organizations | 335 | 11.0% |
| Local Government Employees | 66 | 2.2% |
| State Government Employees | 690 | 22.7% |
| Federal Government Employees | 20 | 0.7% |
| Unpaid Family Workers | 95 | 3.1% |
| Total | 3,037 | 100.0% |
Employment Status by Age in Morehead
According to the labor force statistics for Morehead, out of the total population over 16 years of age (6,289), 53.2% or 3,346 individuals are in the labor force, with 5.2% or 174 of them unemployed. The age group with the highest labor force participation rate is 30 to 34 years, with 82.1% or 280 individuals in the labor force. Within the labor force, the 16 to 19 years age range has the highest percentage of unemployed individuals, with 12.0% or 59 of them being unemployed.
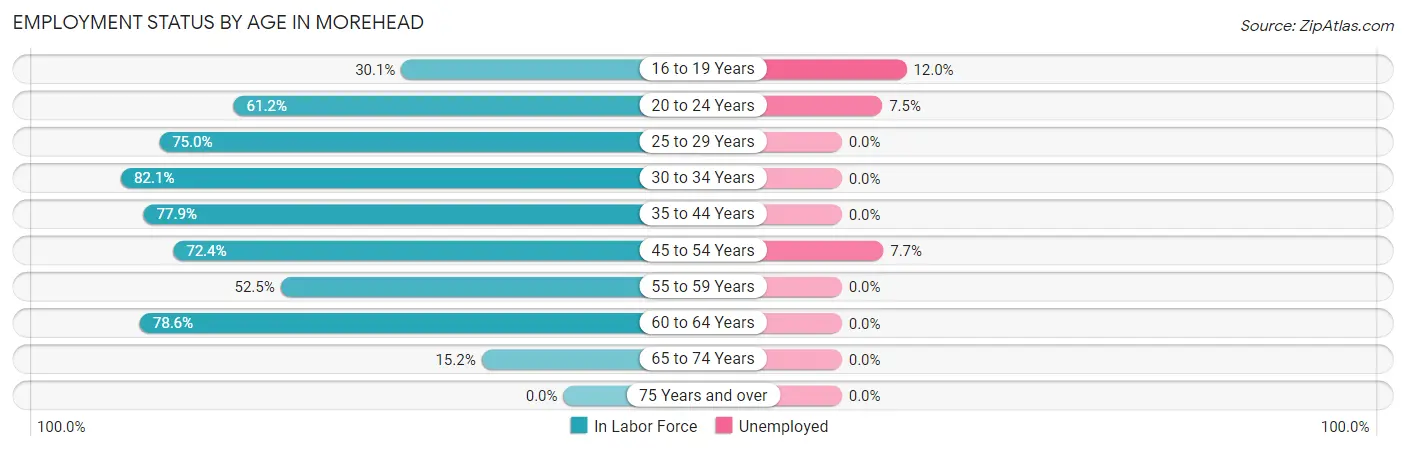
| Age Bracket | In Labor Force | Unemployed |
| 16 to 19 Years | 492 (30.1%) | 59 (12.0%) |
| 20 to 24 Years | 1,239 (61.2%) | 93 (7.5%) |
| 25 to 29 Years | 348 (75.0%) | 0 (0.0%) |
| 30 to 34 Years | 280 (82.1%) | 0 (0.0%) |
| 35 to 44 Years | 416 (77.9%) | 0 (0.0%) |
| 45 to 54 Years | 297 (72.4%) | 23 (7.7%) |
| 55 to 59 Years | 124 (52.5%) | 0 (0.0%) |
| 60 to 64 Years | 110 (78.6%) | 0 (0.0%) |
| 65 to 74 Years | 40 (15.2%) | 0 (0.0%) |
| 75 Years and over | 0 (0.0%) | 0 (0.0%) |
| Total | 3,346 (53.2%) | 174 (5.2%) |
Employment Status by Educational Attainment in Morehead
According to labor force statistics for Morehead, 74.1% of individuals (1,575) out of the total population between 25 and 64 years of age (2,125) are in the labor force, with 1.5% or 24 of them being unemployed. The group with the highest labor force participation rate are those with the educational attainment of bachelor's degree or higher, with 92.3% or 586 individuals in the labor force. Within the labor force, individuals with bachelor's degree or higher education have the highest percentage of unemployment, with 2.2% or 13 of them being unemployed.
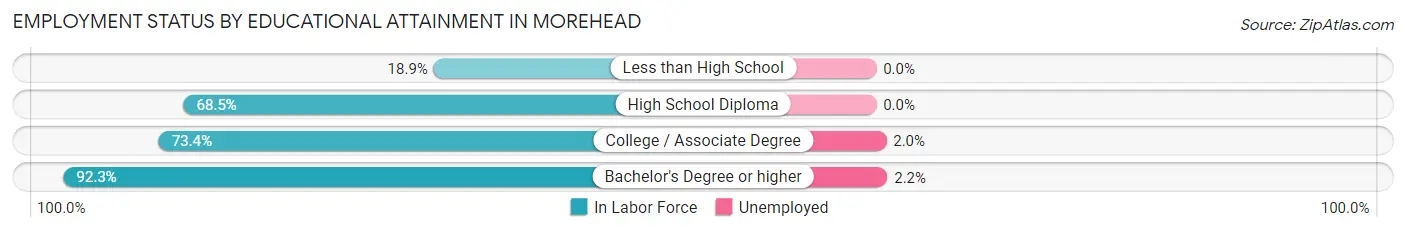
| Educational Attainment | In Labor Force | Unemployed |
| Less than High School | 25 (18.9%) | 0 (0.0%) |
| High School Diploma | 461 (68.5%) | 0 (0.0%) |
| College / Associate Degree | 503 (73.4%) | 14 (2.0%) |
| Bachelor's Degree or higher | 586 (92.3%) | 14 (2.2%) |
| Total | 1,575 (74.1%) | 32 (1.5%) |
Employment Occupations by Sex in Morehead
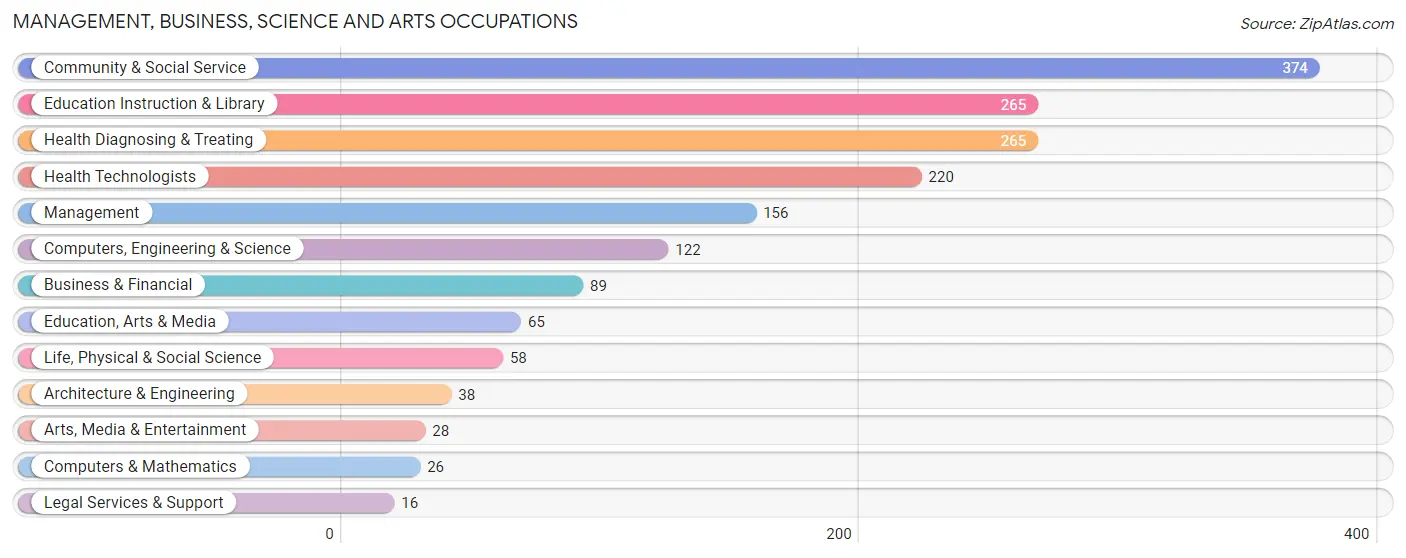
Management, Business, Science and Arts Occupations
The most common Management, Business, Science and Arts occupations in Morehead are Community & Social Service (374 | 11.8%), Education Instruction & Library (265 | 8.4%), Health Diagnosing & Treating (265 | 8.4%), Health Technologists (220 | 6.9%), and Management (156 | 4.9%).
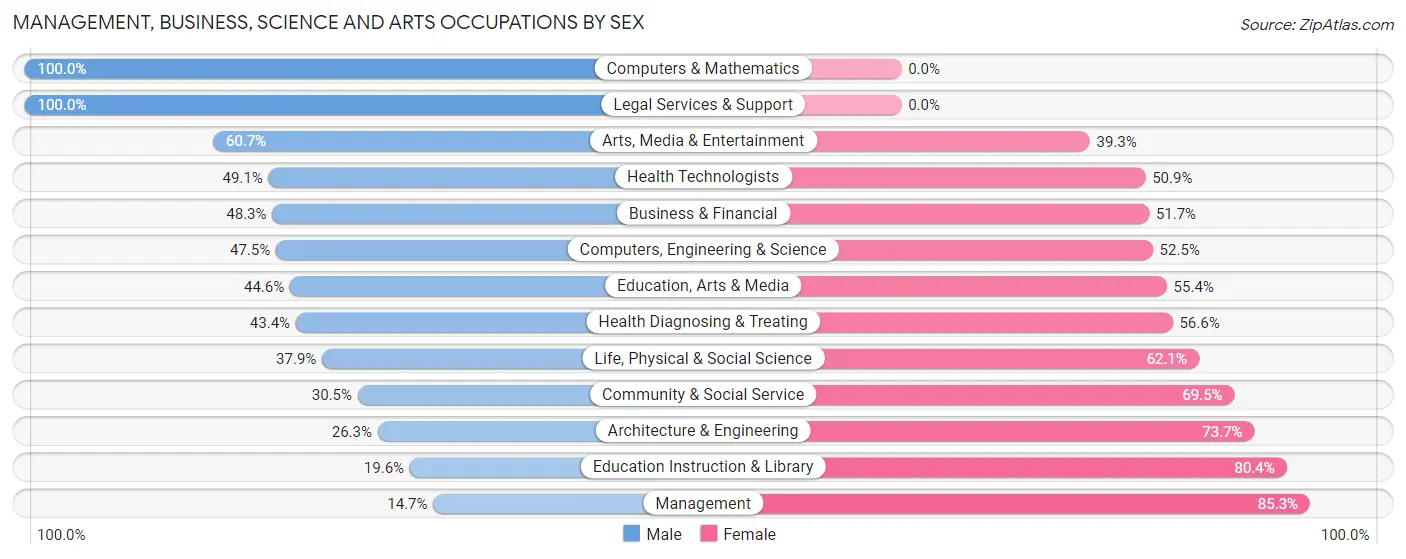
Management, Business, Science and Arts Occupations by Sex
Within the Management, Business, Science and Arts occupations in Morehead, the most male-oriented occupations are Computers & Mathematics (100.0%), Legal Services & Support (100.0%), and Arts, Media & Entertainment (60.7%), while the most female-oriented occupations are Management (85.3%), Education Instruction & Library (80.4%), and Architecture & Engineering (73.7%).
| Occupation | Male | Female |
| Management | 23 (14.7%) | 133 (85.3%) |
| Business & Financial | 43 (48.3%) | 46 (51.7%) |
| Computers, Engineering & Science | 58 (47.5%) | 64 (52.5%) |
| Computers & Mathematics | 26 (100.0%) | 0 (0.0%) |
| Architecture & Engineering | 10 (26.3%) | 28 (73.7%) |
| Life, Physical & Social Science | 22 (37.9%) | 36 (62.1%) |
| Community & Social Service | 114 (30.5%) | 260 (69.5%) |
| Education, Arts & Media | 29 (44.6%) | 36 (55.4%) |
| Legal Services & Support | 16 (100.0%) | 0 (0.0%) |
| Education Instruction & Library | 52 (19.6%) | 213 (80.4%) |
| Arts, Media & Entertainment | 17 (60.7%) | 11 (39.3%) |
| Health Diagnosing & Treating | 115 (43.4%) | 150 (56.6%) |
| Health Technologists | 108 (49.1%) | 112 (50.9%) |
| Total (Category) | 353 (35.1%) | 653 (64.9%) |
| Total (Overall) | 1,438 (45.4%) | 1,733 (54.6%) |
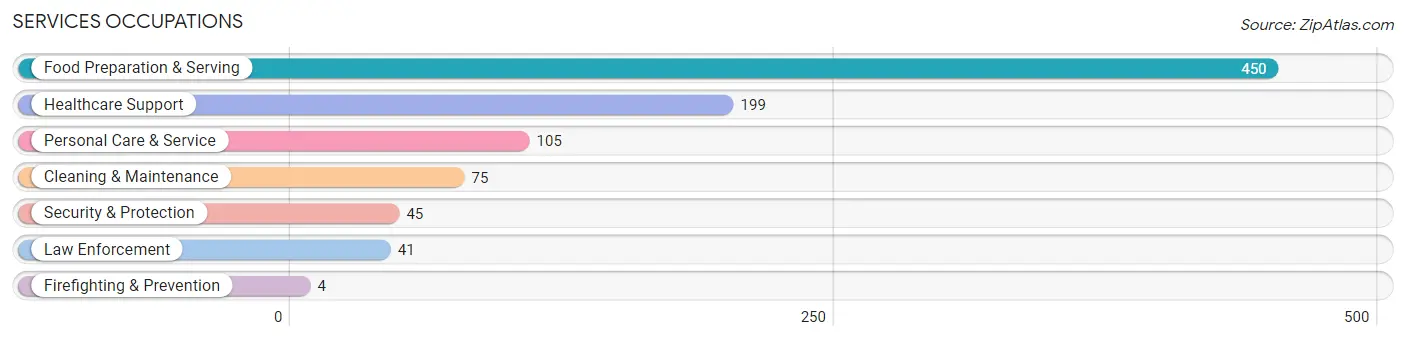
Services Occupations
The most common Services occupations in Morehead are Food Preparation & Serving (450 | 14.2%), Healthcare Support (199 | 6.3%), Personal Care & Service (105 | 3.3%), Cleaning & Maintenance (75 | 2.4%), and Security & Protection (45 | 1.4%).
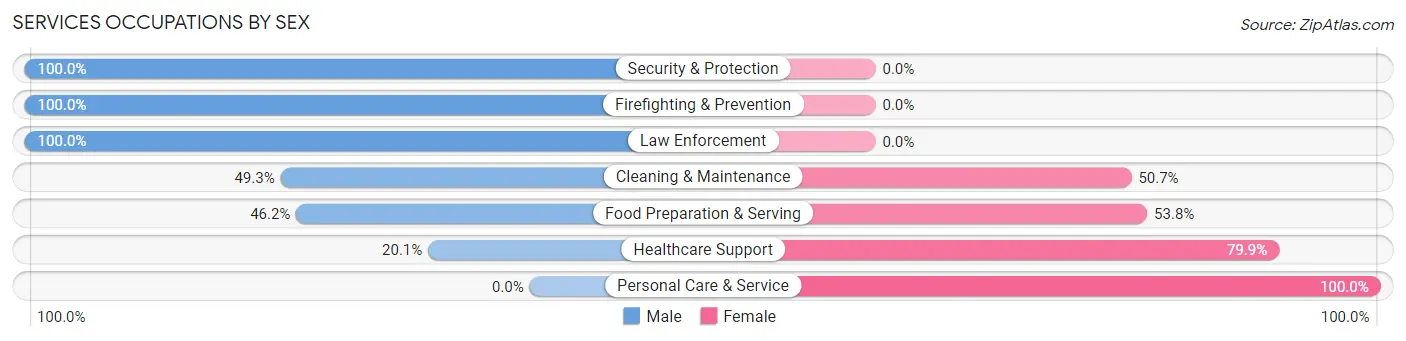
Services Occupations by Sex
Within the Services occupations in Morehead, the most male-oriented occupations are Security & Protection (100.0%), Firefighting & Prevention (100.0%), and Law Enforcement (100.0%), while the most female-oriented occupations are Personal Care & Service (100.0%), Healthcare Support (79.9%), and Food Preparation & Serving (53.8%).
| Occupation | Male | Female |
| Healthcare Support | 40 (20.1%) | 159 (79.9%) |
| Security & Protection | 45 (100.0%) | 0 (0.0%) |
| Firefighting & Prevention | 4 (100.0%) | 0 (0.0%) |
| Law Enforcement | 41 (100.0%) | 0 (0.0%) |
| Food Preparation & Serving | 208 (46.2%) | 242 (53.8%) |
| Cleaning & Maintenance | 37 (49.3%) | 38 (50.7%) |
| Personal Care & Service | 0 (0.0%) | 105 (100.0%) |
| Total (Category) | 330 (37.8%) | 544 (62.2%) |
| Total (Overall) | 1,438 (45.4%) | 1,733 (54.6%) |
Sales and Office Occupations
The most common Sales and Office occupations in Morehead are Sales & Related (418 | 13.2%), and Office & Administration (337 | 10.6%).
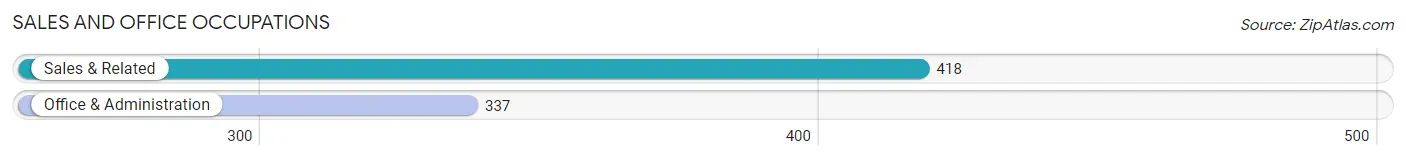
Sales and Office Occupations by Sex
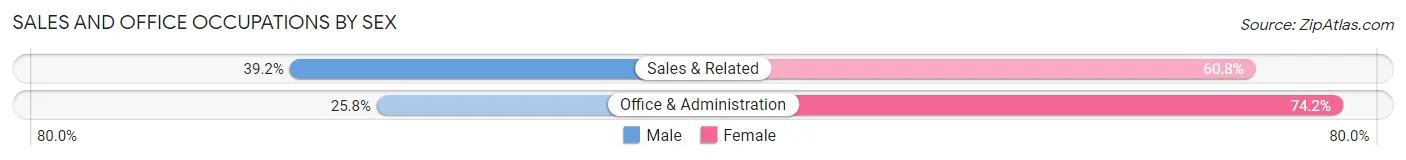
| Occupation | Male | Female |
| Sales & Related | 164 (39.2%) | 254 (60.8%) |
| Office & Administration | 87 (25.8%) | 250 (74.2%) |
| Total (Category) | 251 (33.3%) | 504 (66.7%) |
| Total (Overall) | 1,438 (45.4%) | 1,733 (54.6%) |
Natural Resources, Construction and Maintenance Occupations
The most common Natural Resources, Construction and Maintenance occupations in Morehead are , and Construction & Extraction (98 | 3.1%).
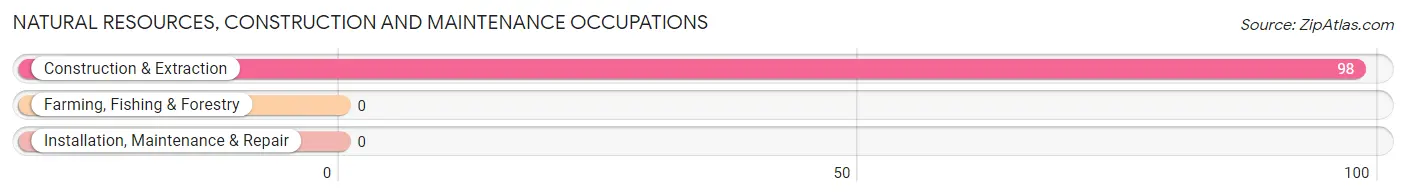
Natural Resources, Construction and Maintenance Occupations by Sex
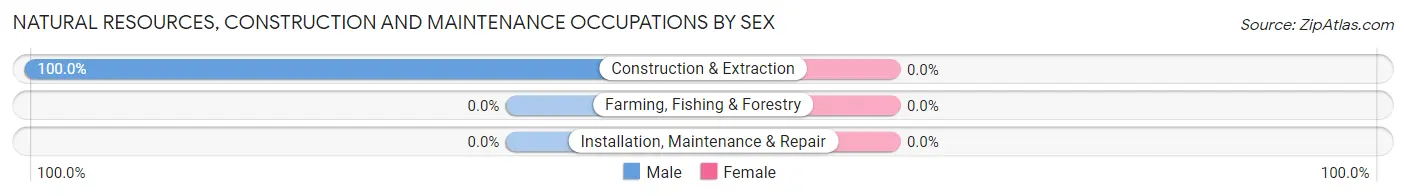
| Occupation | Male | Female |
| Farming, Fishing & Forestry | 0 (0.0%) | 0 (0.0%) |
| Construction & Extraction | 98 (100.0%) | 0 (0.0%) |
| Installation, Maintenance & Repair | 0 (0.0%) | 0 (0.0%) |
| Total (Category) | 98 (100.0%) | 0 (0.0%) |
| Total (Overall) | 1,438 (45.4%) | 1,733 (54.6%) |
Production, Transportation and Moving Occupations
The most common Production, Transportation and Moving occupations in Morehead are Transportation (175 | 5.5%), Material Moving (136 | 4.3%), and Production (127 | 4.0%).
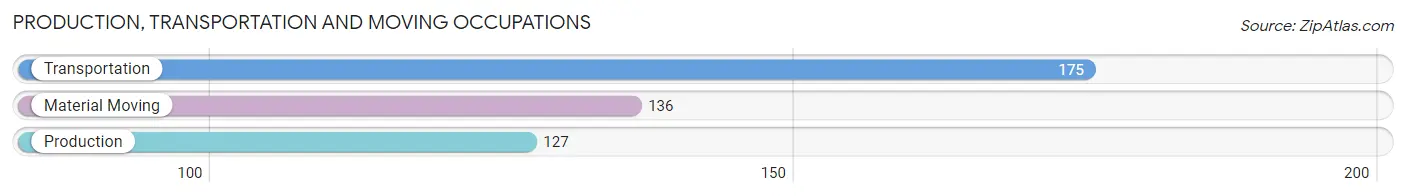
Production, Transportation and Moving Occupations by Sex
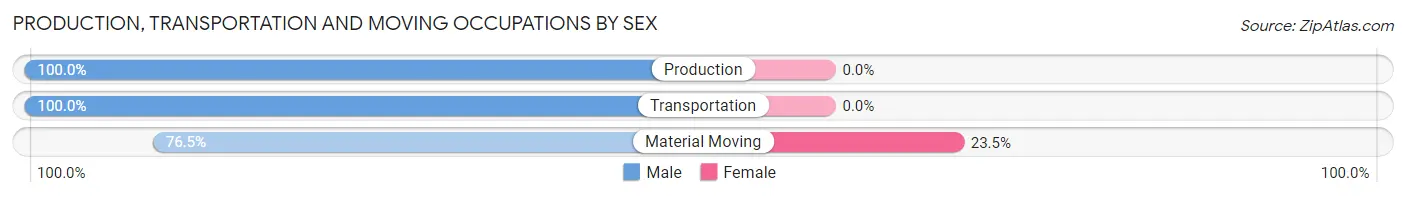
| Occupation | Male | Female |
| Production | 127 (100.0%) | 0 (0.0%) |
| Transportation | 175 (100.0%) | 0 (0.0%) |
| Material Moving | 104 (76.5%) | 32 (23.5%) |
| Total (Category) | 406 (92.7%) | 32 (7.3%) |
| Total (Overall) | 1,438 (45.4%) | 1,733 (54.6%) |
Employment Industries by Sex in Morehead
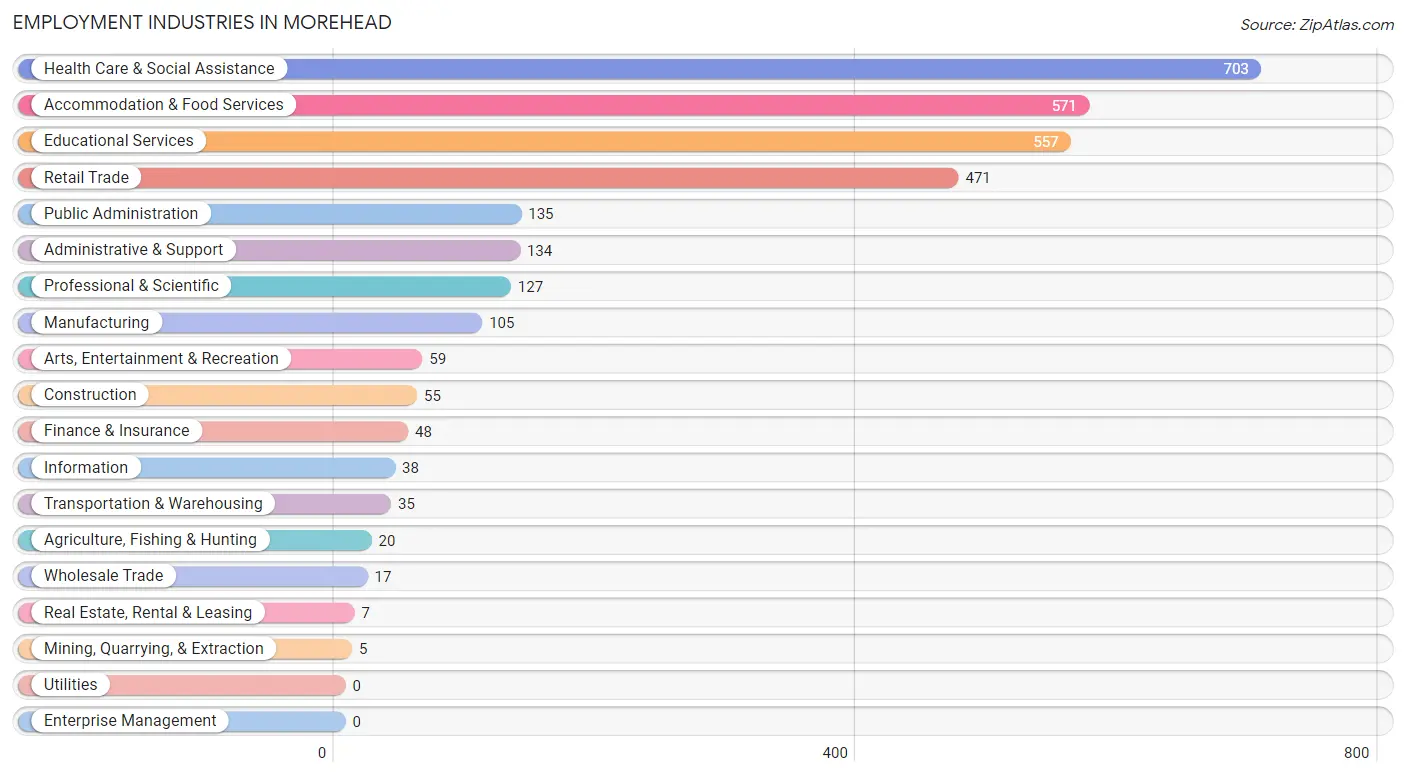
Employment Industries in Morehead
The major employment industries in Morehead include Health Care & Social Assistance (703 | 22.2%), Accommodation & Food Services (571 | 18.0%), Educational Services (557 | 17.6%), Retail Trade (471 | 14.8%), and Public Administration (135 | 4.3%).
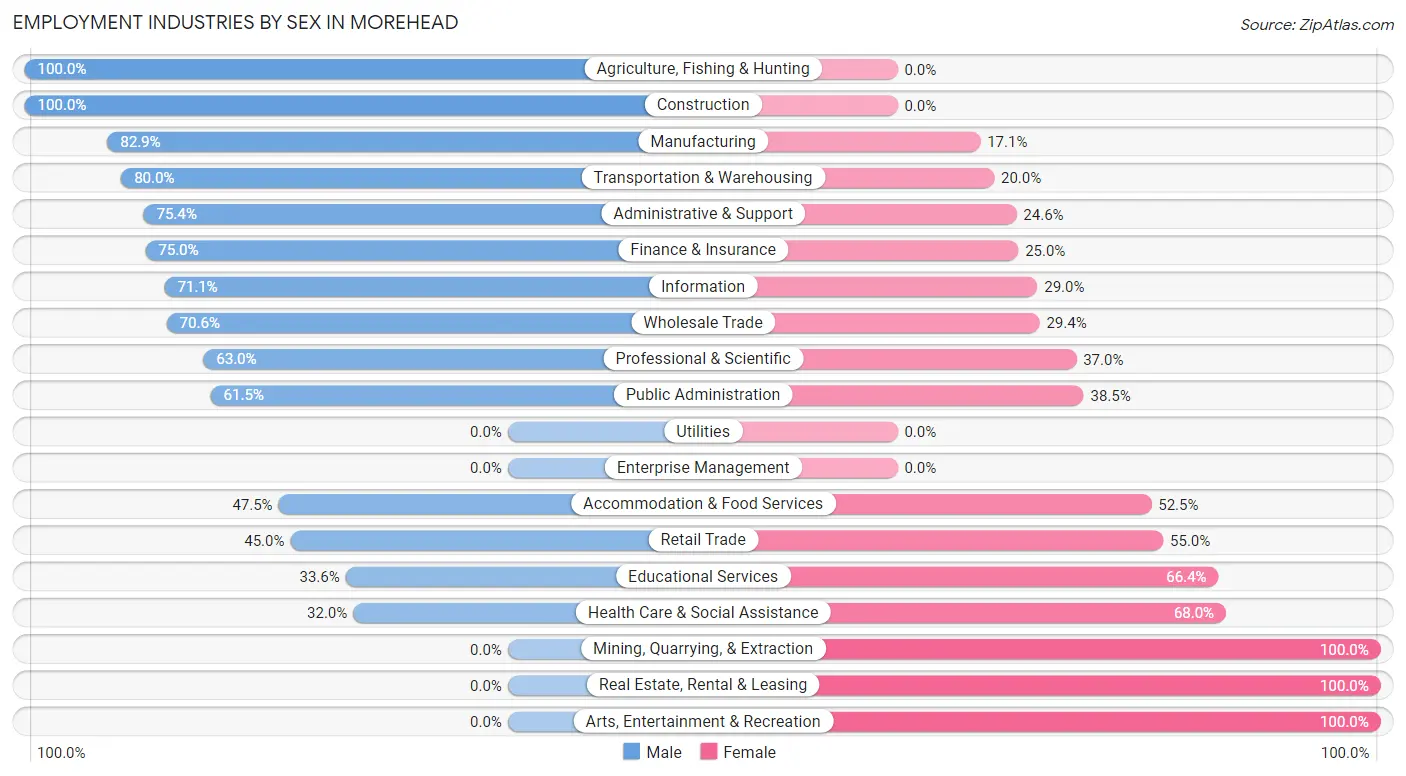
Employment Industries by Sex in Morehead
The Morehead industries that see more men than women are Agriculture, Fishing & Hunting (100.0%), Construction (100.0%), and Manufacturing (82.9%), whereas the industries that tend to have a higher number of women are Mining, Quarrying, & Extraction (100.0%), Real Estate, Rental & Leasing (100.0%), and Arts, Entertainment & Recreation (100.0%).
| Industry | Male | Female |
| Agriculture, Fishing & Hunting | 20 (100.0%) | 0 (0.0%) |
| Mining, Quarrying, & Extraction | 0 (0.0%) | 5 (100.0%) |
| Construction | 55 (100.0%) | 0 (0.0%) |
| Manufacturing | 87 (82.9%) | 18 (17.1%) |
| Wholesale Trade | 12 (70.6%) | 5 (29.4%) |
| Retail Trade | 212 (45.0%) | 259 (55.0%) |
| Transportation & Warehousing | 28 (80.0%) | 7 (20.0%) |
| Utilities | 0 (0.0%) | 0 (0.0%) |
| Information | 27 (71.1%) | 11 (28.9%) |
| Finance & Insurance | 36 (75.0%) | 12 (25.0%) |
| Real Estate, Rental & Leasing | 0 (0.0%) | 7 (100.0%) |
| Professional & Scientific | 80 (63.0%) | 47 (37.0%) |
| Enterprise Management | 0 (0.0%) | 0 (0.0%) |
| Administrative & Support | 101 (75.4%) | 33 (24.6%) |
| Educational Services | 187 (33.6%) | 370 (66.4%) |
| Health Care & Social Assistance | 225 (32.0%) | 478 (68.0%) |
| Arts, Entertainment & Recreation | 0 (0.0%) | 59 (100.0%) |
| Accommodation & Food Services | 271 (47.5%) | 300 (52.5%) |
| Public Administration | 83 (61.5%) | 52 (38.5%) |
| Total | 1,438 (45.4%) | 1,733 (54.6%) |
Education in Morehead
School Enrollment in Morehead
The most common levels of schooling among the 3,926 students in Morehead are college / undergraduate (3,227 | 82.2%), high school (264 | 6.7%), and middle school (200 | 5.1%).
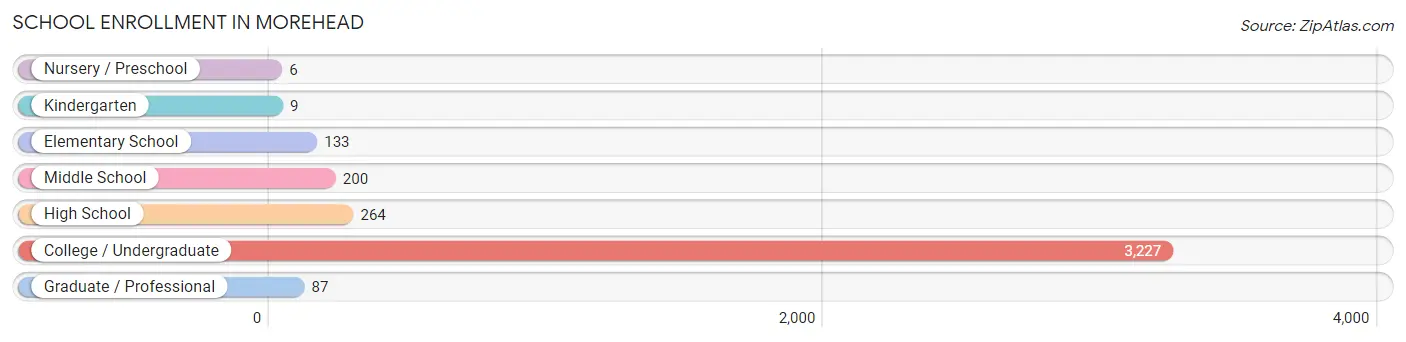
| School Level | # Students | % Students |
| Nursery / Preschool | 6 | 0.2% |
| Kindergarten | 9 | 0.2% |
| Elementary School | 133 | 3.4% |
| Middle School | 200 | 5.1% |
| High School | 264 | 6.7% |
| College / Undergraduate | 3,227 | 82.2% |
| Graduate / Professional | 87 | 2.2% |
| Total | 3,926 | 100.0% |
School Enrollment by Age by Funding Source in Morehead
Out of a total of 3,926 students who are enrolled in schools in Morehead, 86 (2.2%) attend a private institution, while the remaining 3,840 (97.8%) are enrolled in public schools. The age group of 5 to 9 year old has the highest likelihood of being enrolled in private schools, with 15 (10.6% in the age bracket) enrolled. Conversely, the age group of 3 to 4 year olds has the lowest likelihood of being enrolled in a private school, with 3 (100.0% in the age bracket) attending a public institution.
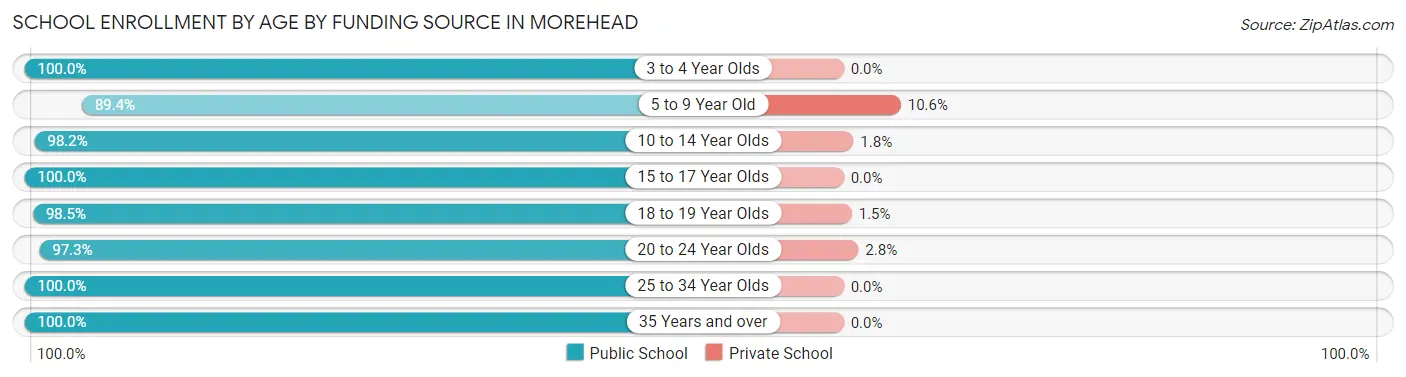
| Age Bracket | Public School | Private School |
| 3 to 4 Year Olds | 3 (100.0%) | 0 (0.0%) |
| 5 to 9 Year Old | 126 (89.4%) | 15 (10.6%) |
| 10 to 14 Year Olds | 217 (98.2%) | 4 (1.8%) |
| 15 to 17 Year Olds | 301 (100.0%) | 0 (0.0%) |
| 18 to 19 Year Olds | 1,302 (98.5%) | 20 (1.5%) |
| 20 to 24 Year Olds | 1,697 (97.3%) | 48 (2.8%) |
| 25 to 34 Year Olds | 140 (100.0%) | 0 (0.0%) |
| 35 Years and over | 53 (100.0%) | 0 (0.0%) |
| Total | 3,840 (97.8%) | 86 (2.2%) |
Educational Attainment by Field of Study in Morehead
Business (148 | 17.8%), bio, nature & agricultural (115 | 13.8%), education (112 | 13.5%), science & technology (86 | 10.3%), and physical & health sciences (55 | 6.6%) are the most common fields of study among 832 individuals in Morehead who have obtained a bachelor's degree or higher.
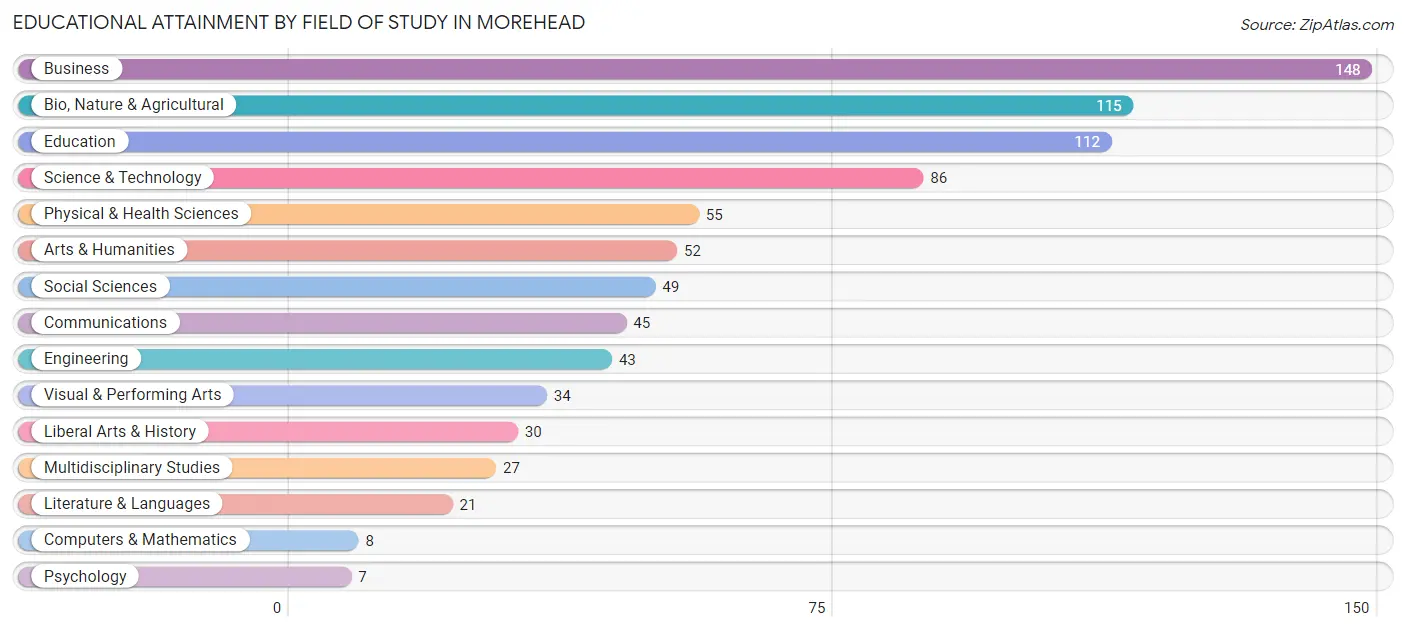
| Field of Study | # Graduates | % Graduates |
| Computers & Mathematics | 8 | 1.0% |
| Bio, Nature & Agricultural | 115 | 13.8% |
| Physical & Health Sciences | 55 | 6.6% |
| Psychology | 7 | 0.8% |
| Social Sciences | 49 | 5.9% |
| Engineering | 43 | 5.2% |
| Multidisciplinary Studies | 27 | 3.3% |
| Science & Technology | 86 | 10.3% |
| Business | 148 | 17.8% |
| Education | 112 | 13.5% |
| Literature & Languages | 21 | 2.5% |
| Liberal Arts & History | 30 | 3.6% |
| Visual & Performing Arts | 34 | 4.1% |
| Communications | 45 | 5.4% |
| Arts & Humanities | 52 | 6.2% |
| Total | 832 | 100.0% |
Transportation & Commute in Morehead
Vehicle Availability by Sex in Morehead
The most prevalent vehicle ownership categories in Morehead are males with 2 vehicles (382, accounting for 30.7%) and females with 2 vehicles (436, making up 33.7%).
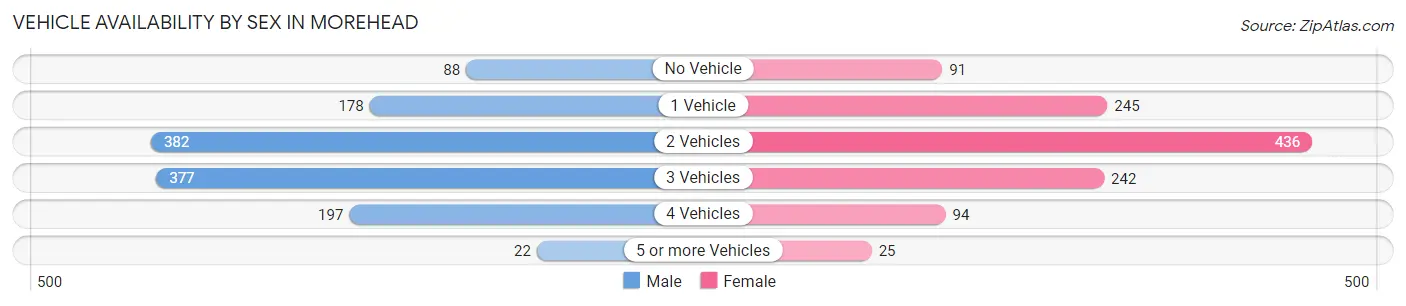
| Vehicles Available | Male | Female |
| No Vehicle | 88 (7.1%) | 91 (8.0%) |
| 1 Vehicle | 178 (14.3%) | 245 (21.6%) |
| 2 Vehicles | 382 (30.7%) | 436 (38.5%) |
| 3 Vehicles | 377 (30.3%) | 242 (21.4%) |
| 4 Vehicles | 197 (15.8%) | 94 (8.3%) |
| 5 or more Vehicles | 22 (1.8%) | 25 (2.2%) |
| Total | 1,244 (100.0%) | 1,133 (100.0%) |
Commute Time in Morehead
The most frequently occuring commute durations in Morehead are 5 to 9 minutes (929 commuters, 34.2%), 10 to 14 minutes (719 commuters, 26.4%), and less than 5 minutes (387 commuters, 14.2%).
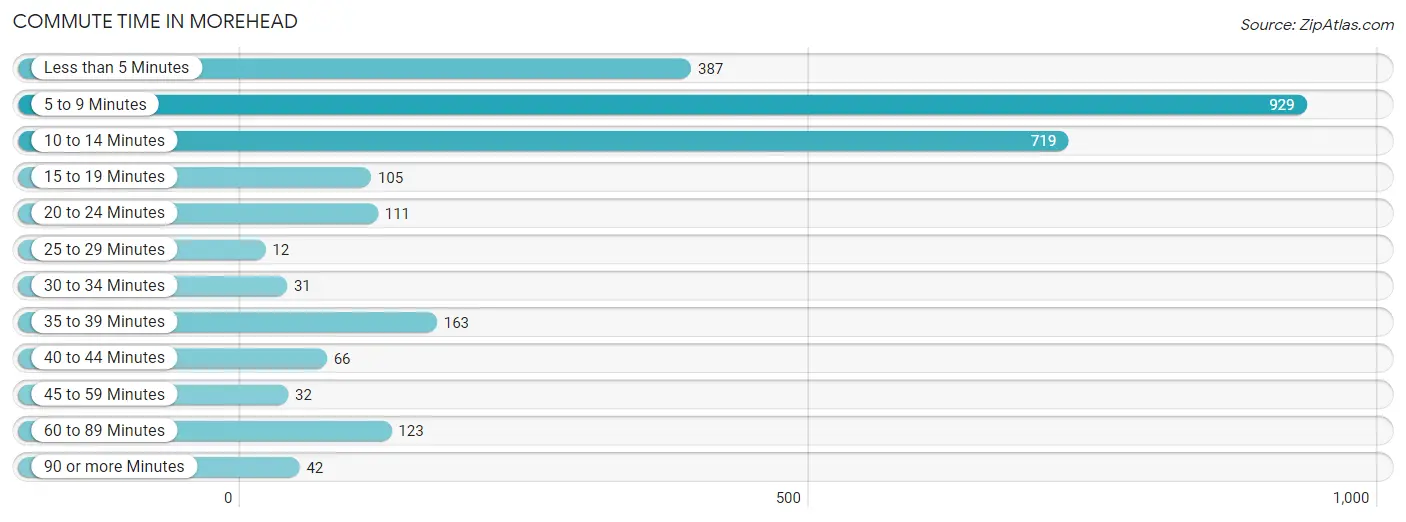
| Commute Time | # Commuters | % Commuters |
| Less than 5 Minutes | 387 | 14.2% |
| 5 to 9 Minutes | 929 | 34.2% |
| 10 to 14 Minutes | 719 | 26.4% |
| 15 to 19 Minutes | 105 | 3.9% |
| 20 to 24 Minutes | 111 | 4.1% |
| 25 to 29 Minutes | 12 | 0.4% |
| 30 to 34 Minutes | 31 | 1.1% |
| 35 to 39 Minutes | 163 | 6.0% |
| 40 to 44 Minutes | 66 | 2.4% |
| 45 to 59 Minutes | 32 | 1.2% |
| 60 to 89 Minutes | 123 | 4.5% |
| 90 or more Minutes | 42 | 1.5% |
Commute Time by Sex in Morehead
The most common commute times in Morehead are 5 to 9 minutes (387 commuters, 31.5%) for males and 5 to 9 minutes (542 commuters, 36.3%) for females.
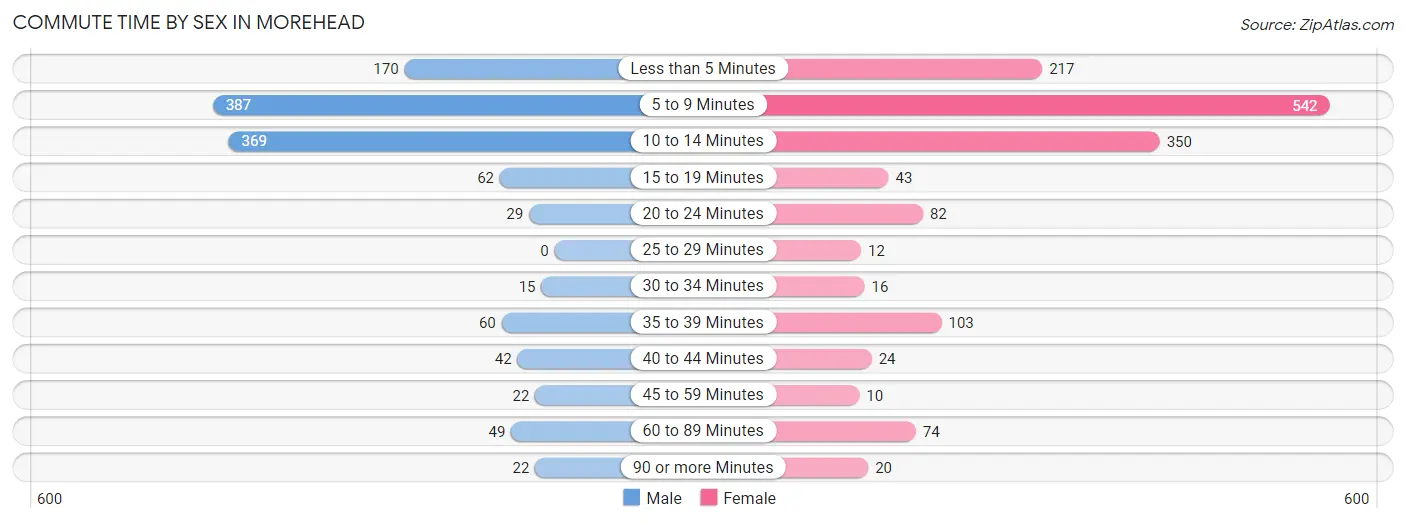
| Commute Time | Male | Female |
| Less than 5 Minutes | 170 (13.9%) | 217 (14.5%) |
| 5 to 9 Minutes | 387 (31.5%) | 542 (36.3%) |
| 10 to 14 Minutes | 369 (30.1%) | 350 (23.4%) |
| 15 to 19 Minutes | 62 (5.1%) | 43 (2.9%) |
| 20 to 24 Minutes | 29 (2.4%) | 82 (5.5%) |
| 25 to 29 Minutes | 0 (0.0%) | 12 (0.8%) |
| 30 to 34 Minutes | 15 (1.2%) | 16 (1.1%) |
| 35 to 39 Minutes | 60 (4.9%) | 103 (6.9%) |
| 40 to 44 Minutes | 42 (3.4%) | 24 (1.6%) |
| 45 to 59 Minutes | 22 (1.8%) | 10 (0.7%) |
| 60 to 89 Minutes | 49 (4.0%) | 74 (5.0%) |
| 90 or more Minutes | 22 (1.8%) | 20 (1.3%) |
Time of Departure to Work by Sex in Morehead
The most frequent times of departure to work in Morehead are 12:00 PM to 3:59 PM (223, 18.2%) for males and 4:00 PM to 11:59 PM (220, 14.7%) for females.
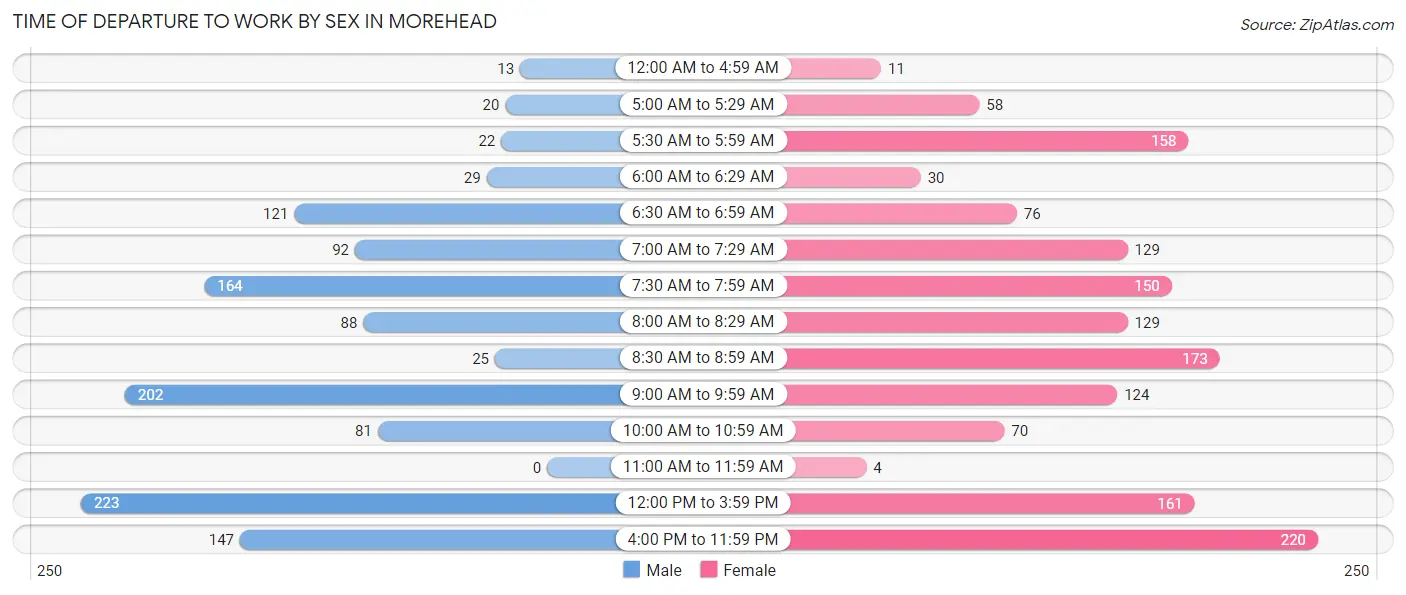
| Time of Departure | Male | Female |
| 12:00 AM to 4:59 AM | 13 (1.1%) | 11 (0.7%) |
| 5:00 AM to 5:29 AM | 20 (1.6%) | 58 (3.9%) |
| 5:30 AM to 5:59 AM | 22 (1.8%) | 158 (10.6%) |
| 6:00 AM to 6:29 AM | 29 (2.4%) | 30 (2.0%) |
| 6:30 AM to 6:59 AM | 121 (9.9%) | 76 (5.1%) |
| 7:00 AM to 7:29 AM | 92 (7.5%) | 129 (8.6%) |
| 7:30 AM to 7:59 AM | 164 (13.4%) | 150 (10.1%) |
| 8:00 AM to 8:29 AM | 88 (7.2%) | 129 (8.6%) |
| 8:30 AM to 8:59 AM | 25 (2.0%) | 173 (11.6%) |
| 9:00 AM to 9:59 AM | 202 (16.5%) | 124 (8.3%) |
| 10:00 AM to 10:59 AM | 81 (6.6%) | 70 (4.7%) |
| 11:00 AM to 11:59 AM | 0 (0.0%) | 4 (0.3%) |
| 12:00 PM to 3:59 PM | 223 (18.2%) | 161 (10.8%) |
| 4:00 PM to 11:59 PM | 147 (12.0%) | 220 (14.7%) |
| Total | 1,227 (100.0%) | 1,493 (100.0%) |
Housing Occupancy in Morehead
Occupancy by Ownership in Morehead
Of the total 1,766 dwellings in Morehead, owner-occupied units account for 583 (33.0%), while renter-occupied units make up 1,183 (67.0%).
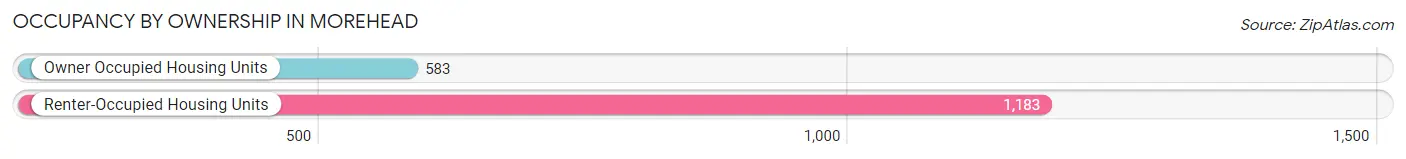
| Occupancy | # Housing Units | % Housing Units |
| Owner Occupied Housing Units | 583 | 33.0% |
| Renter-Occupied Housing Units | 1,183 | 67.0% |
| Total Occupied Housing Units | 1,766 | 100.0% |
Occupancy by Household Size in Morehead
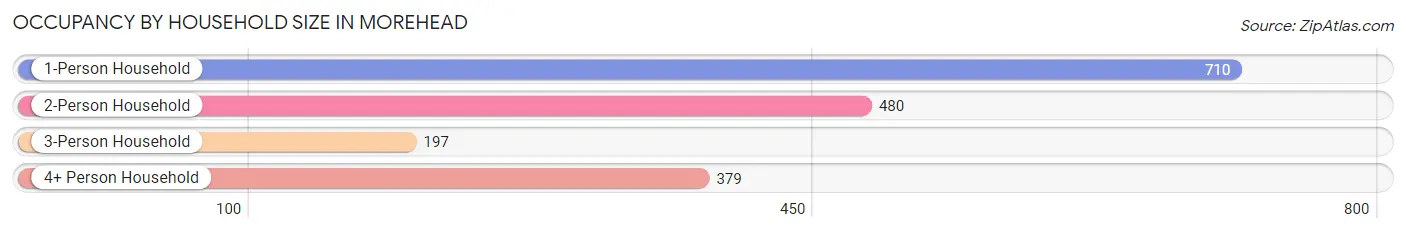
| Household Size | # Housing Units | % Housing Units |
| 1-Person Household | 710 | 40.2% |
| 2-Person Household | 480 | 27.2% |
| 3-Person Household | 197 | 11.2% |
| 4+ Person Household | 379 | 21.5% |
| Total Housing Units | 1,766 | 100.0% |
Occupancy by Ownership by Household Size in Morehead
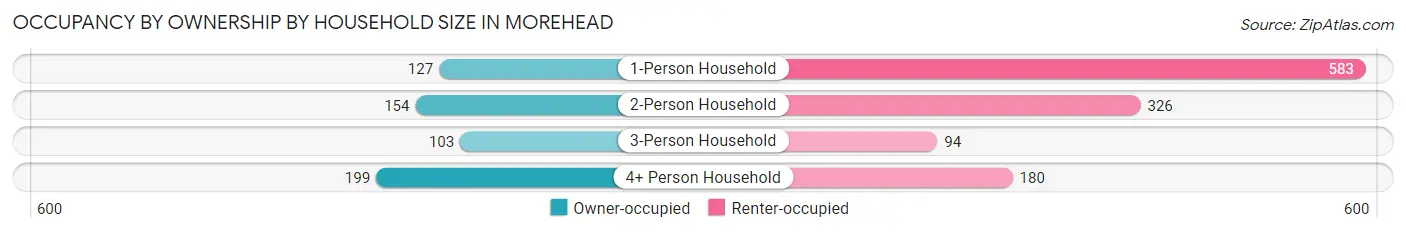
| Household Size | Owner-occupied | Renter-occupied |
| 1-Person Household | 127 (17.9%) | 583 (82.1%) |
| 2-Person Household | 154 (32.1%) | 326 (67.9%) |
| 3-Person Household | 103 (52.3%) | 94 (47.7%) |
| 4+ Person Household | 199 (52.5%) | 180 (47.5%) |
| Total Housing Units | 583 (33.0%) | 1,183 (67.0%) |
Occupancy by Educational Attainment in Morehead
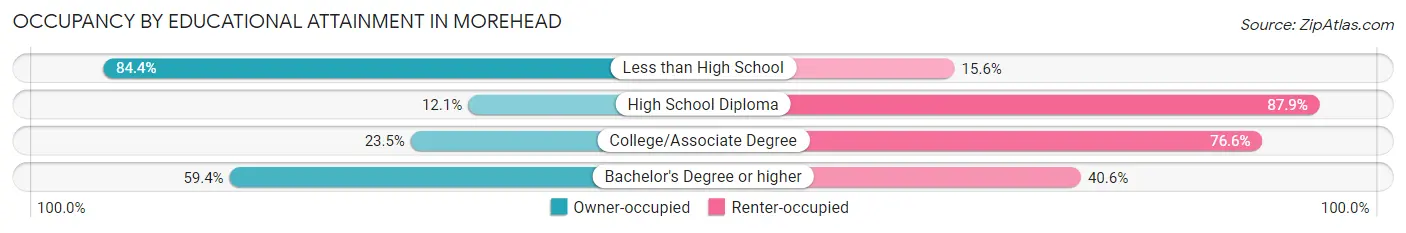
| Household Size | Owner-occupied | Renter-occupied |
| Less than High School | 38 (84.4%) | 7 (15.6%) |
| High School Diploma | 51 (12.1%) | 371 (87.9%) |
| College/Associate Degree | 181 (23.4%) | 591 (76.5%) |
| Bachelor's Degree or higher | 313 (59.4%) | 214 (40.6%) |
Occupancy by Age of Householder in Morehead
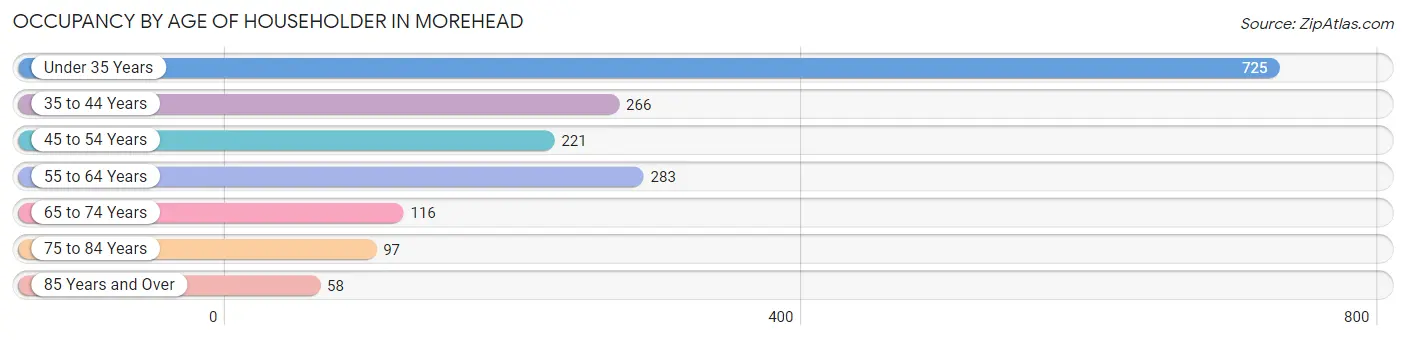
| Age Bracket | # Households | % Households |
| Under 35 Years | 725 | 41.0% |
| 35 to 44 Years | 266 | 15.1% |
| 45 to 54 Years | 221 | 12.5% |
| 55 to 64 Years | 283 | 16.0% |
| 65 to 74 Years | 116 | 6.6% |
| 75 to 84 Years | 97 | 5.5% |
| 85 Years and Over | 58 | 3.3% |
| Total | 1,766 | 100.0% |
Housing Finances in Morehead
Median Income by Occupancy in Morehead
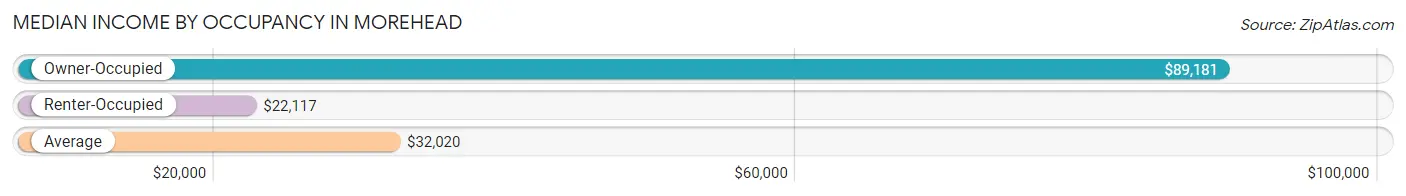
| Occupancy Type | # Households | Median Income |
| Owner-Occupied | 583 (33.0%) | $89,181 |
| Renter-Occupied | 1,183 (67.0%) | $22,117 |
| Average | 1,766 (100.0%) | $32,020 |
Occupancy by Householder Income Bracket in Morehead
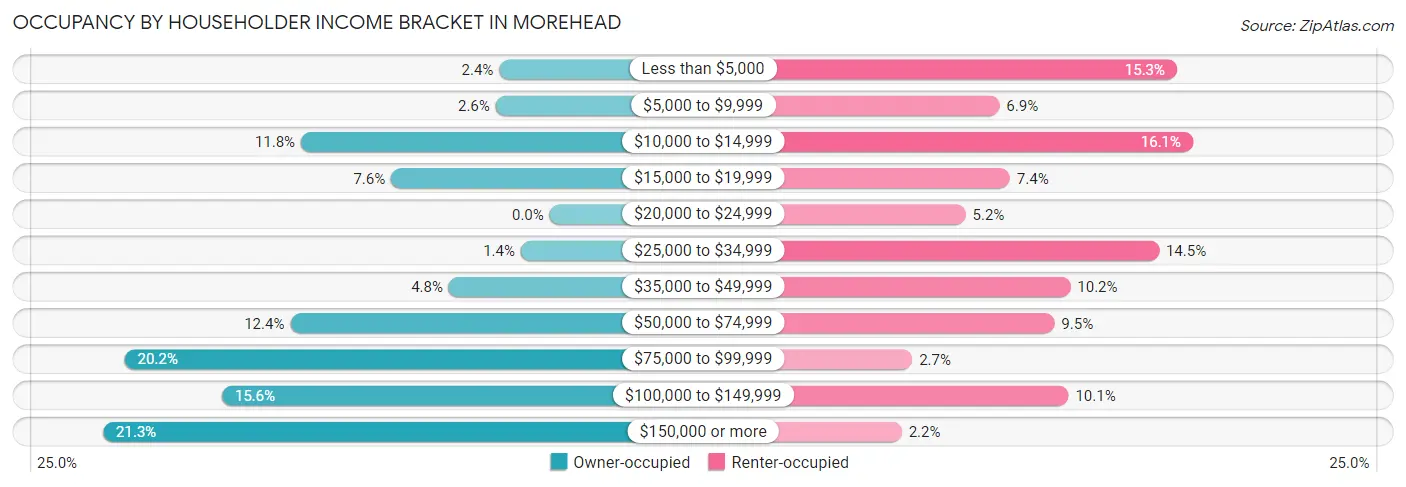
| Income Bracket | Owner-occupied | Renter-occupied |
| Less than $5,000 | 14 (2.4%) | 181 (15.3%) |
| $5,000 to $9,999 | 15 (2.6%) | 81 (6.9%) |
| $10,000 to $14,999 | 69 (11.8%) | 190 (16.1%) |
| $15,000 to $19,999 | 44 (7.5%) | 87 (7.3%) |
| $20,000 to $24,999 | 0 (0.0%) | 62 (5.2%) |
| $25,000 to $34,999 | 8 (1.4%) | 171 (14.4%) |
| $35,000 to $49,999 | 28 (4.8%) | 121 (10.2%) |
| $50,000 to $74,999 | 72 (12.3%) | 112 (9.5%) |
| $75,000 to $99,999 | 118 (20.2%) | 32 (2.7%) |
| $100,000 to $149,999 | 91 (15.6%) | 120 (10.1%) |
| $150,000 or more | 124 (21.3%) | 26 (2.2%) |
| Total | 583 (100.0%) | 1,183 (100.0%) |
Monthly Housing Cost Tiers in Morehead
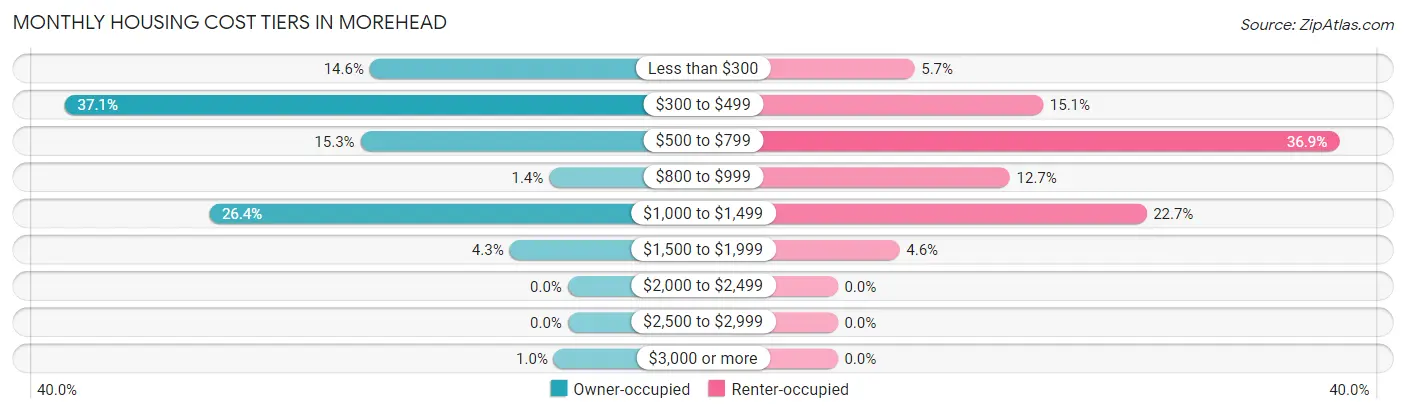
| Monthly Cost | Owner-occupied | Renter-occupied |
| Less than $300 | 85 (14.6%) | 67 (5.7%) |
| $300 to $499 | 216 (37.0%) | 179 (15.1%) |
| $500 to $799 | 89 (15.3%) | 437 (36.9%) |
| $800 to $999 | 8 (1.4%) | 150 (12.7%) |
| $1,000 to $1,499 | 154 (26.4%) | 269 (22.7%) |
| $1,500 to $1,999 | 25 (4.3%) | 54 (4.6%) |
| $2,000 to $2,499 | 0 (0.0%) | 0 (0.0%) |
| $2,500 to $2,999 | 0 (0.0%) | 0 (0.0%) |
| $3,000 or more | 6 (1.0%) | 0 (0.0%) |
| Total | 583 (100.0%) | 1,183 (100.0%) |
Physical Housing Characteristics in Morehead
Housing Structures in Morehead
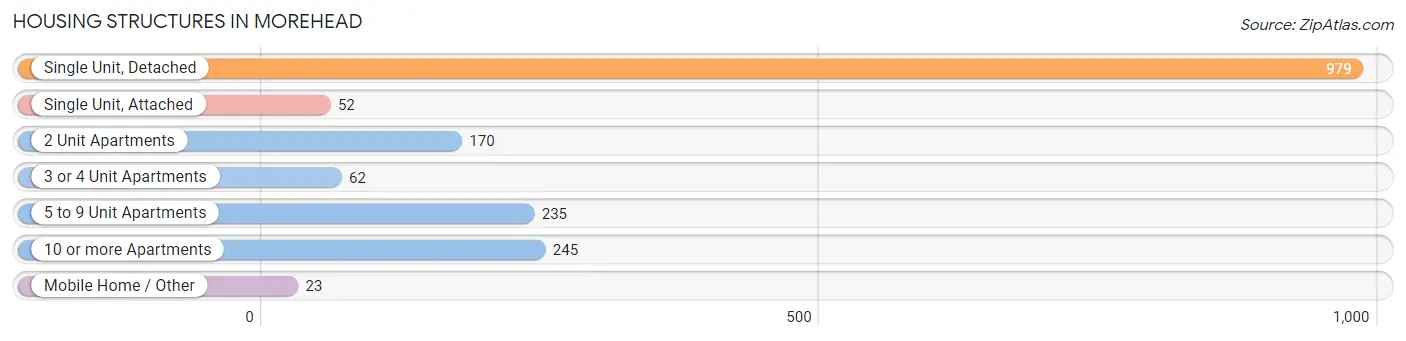
| Structure Type | # Housing Units | % Housing Units |
| Single Unit, Detached | 979 | 55.4% |
| Single Unit, Attached | 52 | 2.9% |
| 2 Unit Apartments | 170 | 9.6% |
| 3 or 4 Unit Apartments | 62 | 3.5% |
| 5 to 9 Unit Apartments | 235 | 13.3% |
| 10 or more Apartments | 245 | 13.9% |
| Mobile Home / Other | 23 | 1.3% |
| Total | 1,766 | 100.0% |
Housing Structures by Occupancy in Morehead

| Structure Type | Owner-occupied | Renter-occupied |
| Single Unit, Detached | 549 (56.1%) | 430 (43.9%) |
| Single Unit, Attached | 11 (21.1%) | 41 (78.8%) |
| 2 Unit Apartments | 0 (0.0%) | 170 (100.0%) |
| 3 or 4 Unit Apartments | 0 (0.0%) | 62 (100.0%) |
| 5 to 9 Unit Apartments | 0 (0.0%) | 235 (100.0%) |
| 10 or more Apartments | 0 (0.0%) | 245 (100.0%) |
| Mobile Home / Other | 23 (100.0%) | 0 (0.0%) |
| Total | 583 (33.0%) | 1,183 (67.0%) |
Housing Structures by Number of Rooms in Morehead
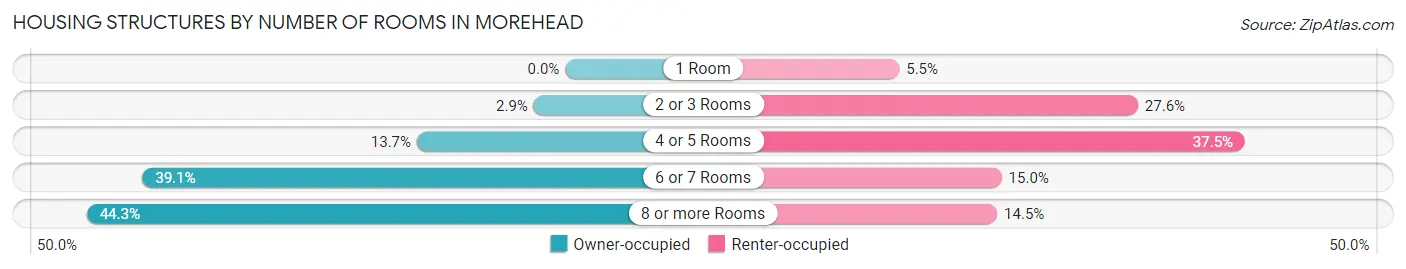
| Number of Rooms | Owner-occupied | Renter-occupied |
| 1 Room | 0 (0.0%) | 65 (5.5%) |
| 2 or 3 Rooms | 17 (2.9%) | 326 (27.6%) |
| 4 or 5 Rooms | 80 (13.7%) | 443 (37.4%) |
| 6 or 7 Rooms | 228 (39.1%) | 177 (15.0%) |
| 8 or more Rooms | 258 (44.3%) | 172 (14.5%) |
| Total | 583 (100.0%) | 1,183 (100.0%) |
Housing Structure by Heating Type in Morehead
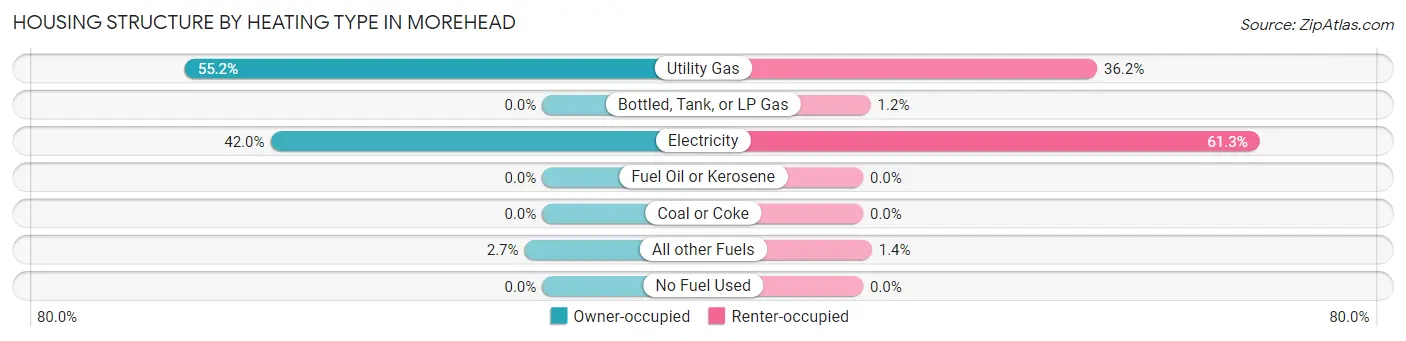
| Heating Type | Owner-occupied | Renter-occupied |
| Utility Gas | 322 (55.2%) | 428 (36.2%) |
| Bottled, Tank, or LP Gas | 0 (0.0%) | 14 (1.2%) |
| Electricity | 245 (42.0%) | 725 (61.3%) |
| Fuel Oil or Kerosene | 0 (0.0%) | 0 (0.0%) |
| Coal or Coke | 0 (0.0%) | 0 (0.0%) |
| All other Fuels | 16 (2.7%) | 16 (1.3%) |
| No Fuel Used | 0 (0.0%) | 0 (0.0%) |
| Total | 583 (100.0%) | 1,183 (100.0%) |
Household Vehicle Usage in Morehead
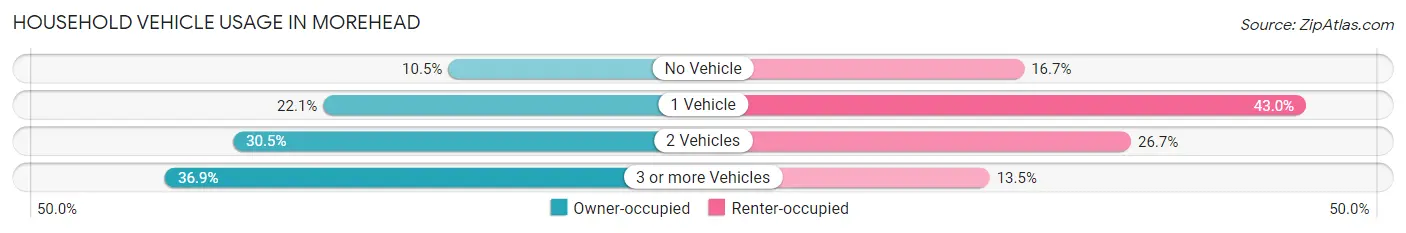
| Vehicles per Household | Owner-occupied | Renter-occupied |
| No Vehicle | 61 (10.5%) | 198 (16.7%) |
| 1 Vehicle | 129 (22.1%) | 509 (43.0%) |
| 2 Vehicles | 178 (30.5%) | 316 (26.7%) |
| 3 or more Vehicles | 215 (36.9%) | 160 (13.5%) |
| Total | 583 (100.0%) | 1,183 (100.0%) |
Real Estate & Mortgages in Morehead
Real Estate and Mortgage Overview in Morehead
| Characteristic | Without Mortgage | With Mortgage |
| Housing Units | 317 | 266 |
| Median Property Value | $161,200 | $157,100 |
| Median Household Income | $87,386 | $89 |
| Monthly Housing Costs | $425 | $6 |
| Real Estate Taxes | $1,343 | $0 |
Property Value by Mortgage Status in Morehead
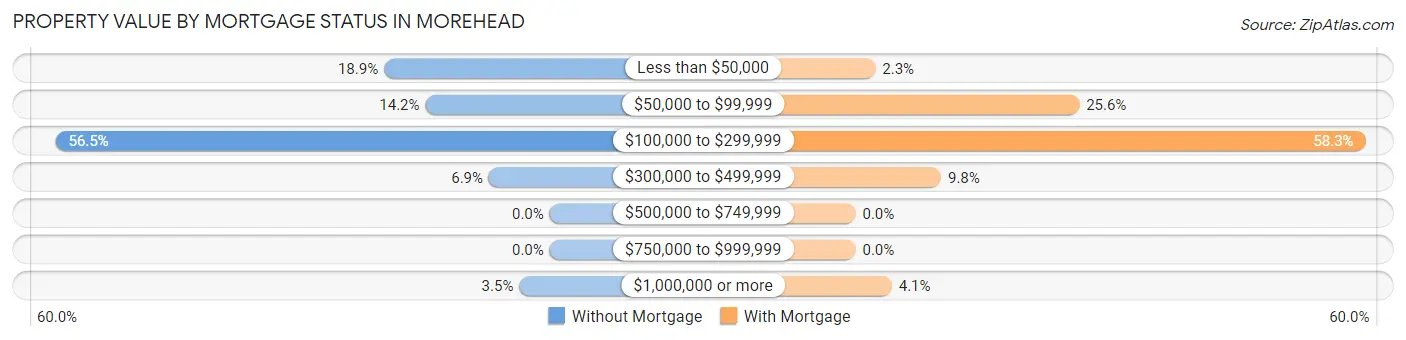
| Property Value | Without Mortgage | With Mortgage |
| Less than $50,000 | 60 (18.9%) | 6 (2.3%) |
| $50,000 to $99,999 | 45 (14.2%) | 68 (25.6%) |
| $100,000 to $299,999 | 179 (56.5%) | 155 (58.3%) |
| $300,000 to $499,999 | 22 (6.9%) | 26 (9.8%) |
| $500,000 to $749,999 | 0 (0.0%) | 0 (0.0%) |
| $750,000 to $999,999 | 0 (0.0%) | 0 (0.0%) |
| $1,000,000 or more | 11 (3.5%) | 11 (4.1%) |
| Total | 317 (100.0%) | 266 (100.0%) |
Household Income by Mortgage Status in Morehead
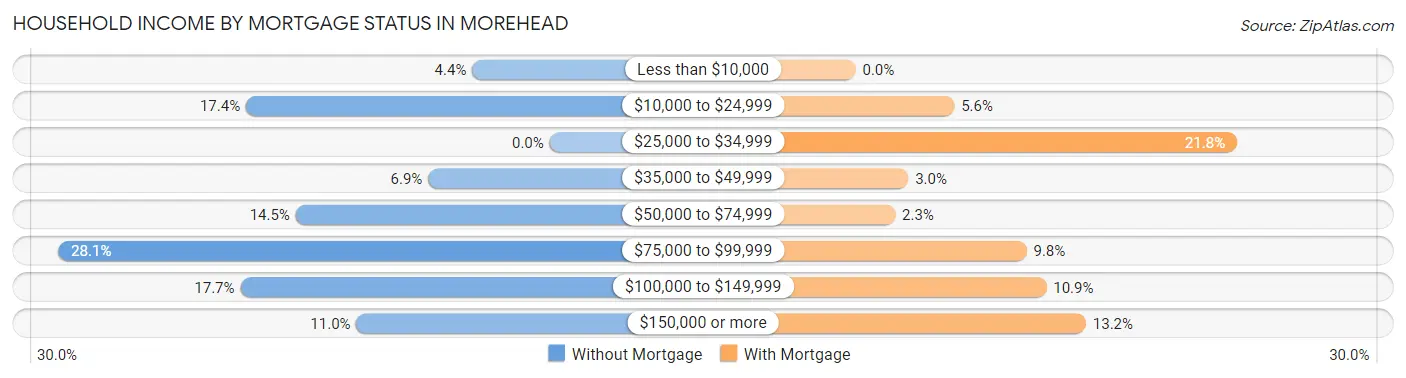
| Household Income | Without Mortgage | With Mortgage |
| Less than $10,000 | 14 (4.4%) | 0 (0.0%) |
| $10,000 to $24,999 | 55 (17.3%) | 15 (5.6%) |
| $25,000 to $34,999 | 0 (0.0%) | 58 (21.8%) |
| $35,000 to $49,999 | 22 (6.9%) | 8 (3.0%) |
| $50,000 to $74,999 | 46 (14.5%) | 6 (2.3%) |
| $75,000 to $99,999 | 89 (28.1%) | 26 (9.8%) |
| $100,000 to $149,999 | 56 (17.7%) | 29 (10.9%) |
| $150,000 or more | 35 (11.0%) | 35 (13.2%) |
| Total | 317 (100.0%) | 266 (100.0%) |
Property Value to Household Income Ratio in Morehead
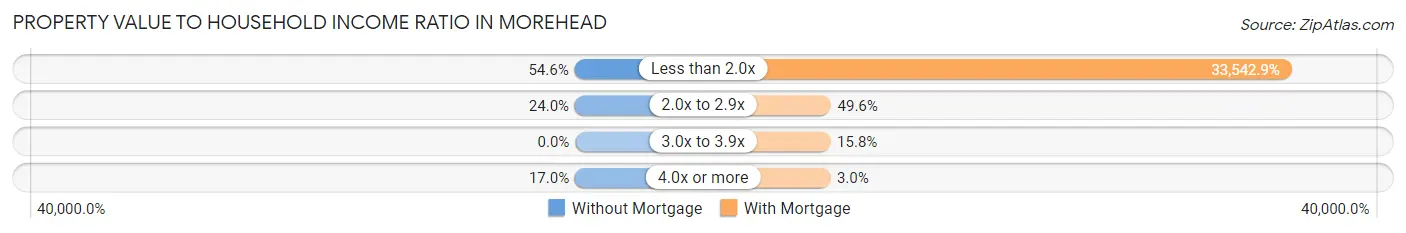
| Value-to-Income Ratio | Without Mortgage | With Mortgage |
| Less than 2.0x | 173 (54.6%) | 89,224 (33,542.9%) |
| 2.0x to 2.9x | 76 (24.0%) | 132 (49.6%) |
| 3.0x to 3.9x | 0 (0.0%) | 42 (15.8%) |
| 4.0x or more | 54 (17.0%) | 8 (3.0%) |
| Total | 317 (100.0%) | 266 (100.0%) |
Real Estate Taxes by Mortgage Status in Morehead
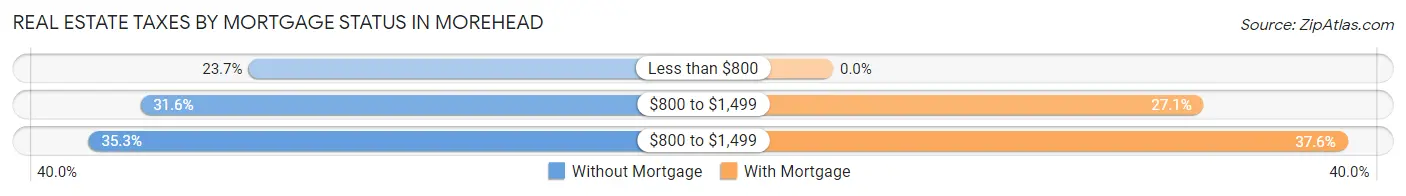
| Property Taxes | Without Mortgage | With Mortgage |
| Less than $800 | 75 (23.7%) | 0 (0.0%) |
| $800 to $1,499 | 100 (31.6%) | 72 (27.1%) |
| $800 to $1,499 | 112 (35.3%) | 100 (37.6%) |
| Total | 317 (100.0%) | 266 (100.0%) |
Health & Disability in Morehead
Health Insurance Coverage by Age in Morehead
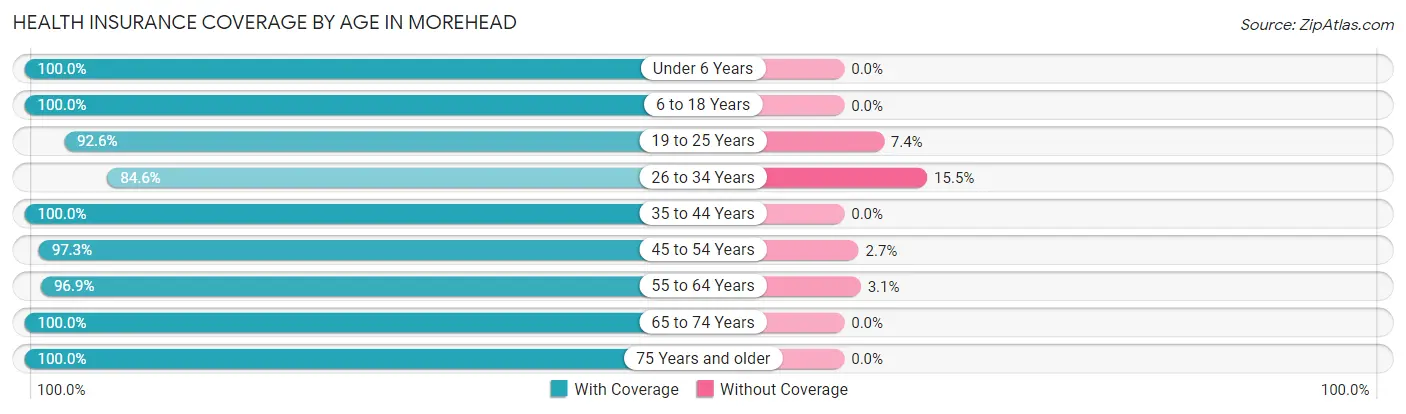
| Age Bracket | With Coverage | Without Coverage |
| Under 6 Years | 291 (100.0%) | 0 (0.0%) |
| 6 to 18 Years | 1,313 (100.0%) | 0 (0.0%) |
| 19 to 25 Years | 2,585 (92.6%) | 206 (7.4%) |
| 26 to 34 Years | 580 (84.6%) | 106 (15.4%) |
| 35 to 44 Years | 449 (100.0%) | 0 (0.0%) |
| 45 to 54 Years | 366 (97.3%) | 10 (2.7%) |
| 55 to 64 Years | 349 (96.9%) | 11 (3.1%) |
| 65 to 74 Years | 235 (100.0%) | 0 (0.0%) |
| 75 Years and older | 186 (100.0%) | 0 (0.0%) |
| Total | 6,354 (95.0%) | 333 (5.0%) |
Health Insurance Coverage by Citizenship Status in Morehead
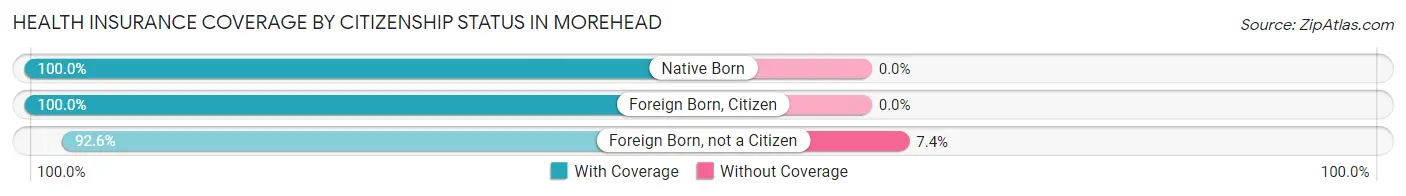
| Citizenship Status | With Coverage | Without Coverage |
| Native Born | 291 (100.0%) | 0 (0.0%) |
| Foreign Born, Citizen | 1,313 (100.0%) | 0 (0.0%) |
| Foreign Born, not a Citizen | 2,585 (92.6%) | 206 (7.4%) |
Health Insurance Coverage by Household Income in Morehead
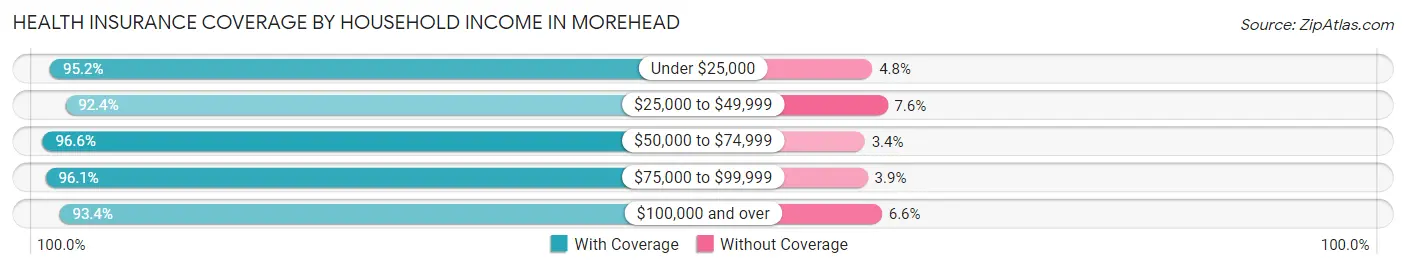
| Household Income | With Coverage | Without Coverage |
| Under $25,000 | 1,097 (95.2%) | 55 (4.8%) |
| $25,000 to $49,999 | 837 (92.4%) | 69 (7.6%) |
| $50,000 to $74,999 | 546 (96.6%) | 19 (3.4%) |
| $75,000 to $99,999 | 541 (96.1%) | 22 (3.9%) |
| $100,000 and over | 1,025 (93.4%) | 72 (6.6%) |
Public vs Private Health Insurance Coverage by Age in Morehead
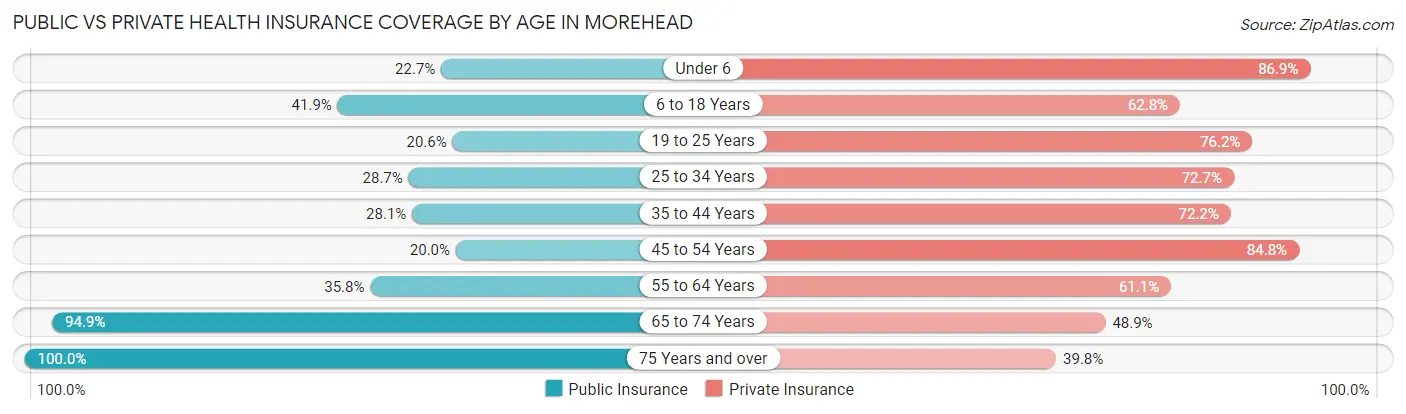
| Age Bracket | Public Insurance | Private Insurance |
| Under 6 | 66 (22.7%) | 253 (86.9%) |
| 6 to 18 Years | 550 (41.9%) | 824 (62.8%) |
| 19 to 25 Years | 574 (20.6%) | 2,126 (76.2%) |
| 25 to 34 Years | 197 (28.7%) | 499 (72.7%) |
| 35 to 44 Years | 126 (28.1%) | 324 (72.2%) |
| 45 to 54 Years | 75 (20.0%) | 319 (84.8%) |
| 55 to 64 Years | 129 (35.8%) | 220 (61.1%) |
| 65 to 74 Years | 223 (94.9%) | 115 (48.9%) |
| 75 Years and over | 186 (100.0%) | 74 (39.8%) |
| Total | 2,126 (31.8%) | 4,754 (71.1%) |
Disability Status by Sex by Age in Morehead
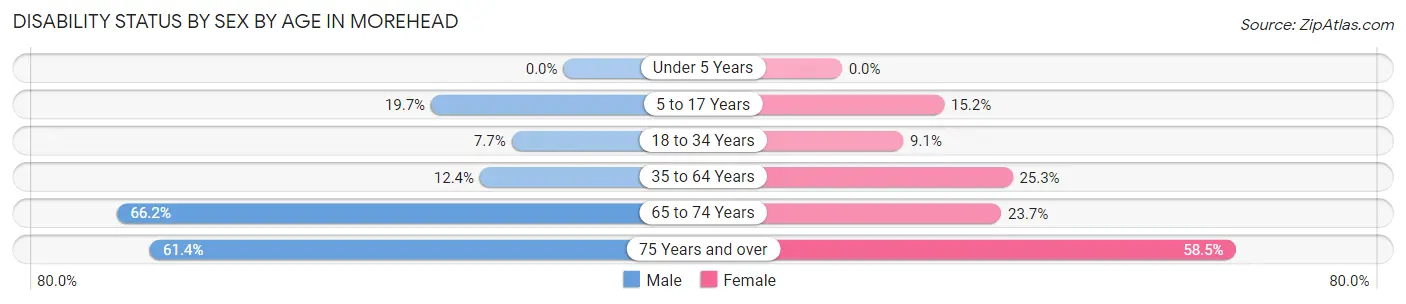
| Age Bracket | Male | Female |
| Under 5 Years | 0 (0.0%) | 0 (0.0%) |
| 5 to 17 Years | 58 (19.7%) | 56 (15.2%) |
| 18 to 34 Years | 145 (7.7%) | 205 (9.1%) |
| 35 to 64 Years | 74 (12.4%) | 149 (25.3%) |
| 65 to 74 Years | 94 (66.2%) | 22 (23.7%) |
| 75 Years and over | 27 (61.4%) | 83 (58.5%) |
Disability Class by Sex by Age in Morehead
Disability Class: Hearing Difficulty
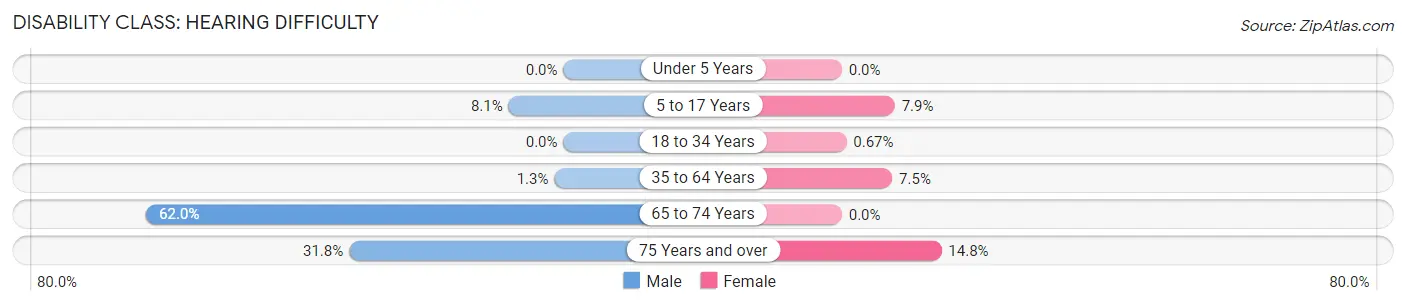
| Age Bracket | Male | Female |
| Under 5 Years | 0 (0.0%) | 0 (0.0%) |
| 5 to 17 Years | 24 (8.1%) | 29 (7.9%) |
| 18 to 34 Years | 0 (0.0%) | 15 (0.7%) |
| 35 to 64 Years | 8 (1.3%) | 44 (7.5%) |
| 65 to 74 Years | 88 (62.0%) | 0 (0.0%) |
| 75 Years and over | 14 (31.8%) | 21 (14.8%) |
Disability Class: Vision Difficulty
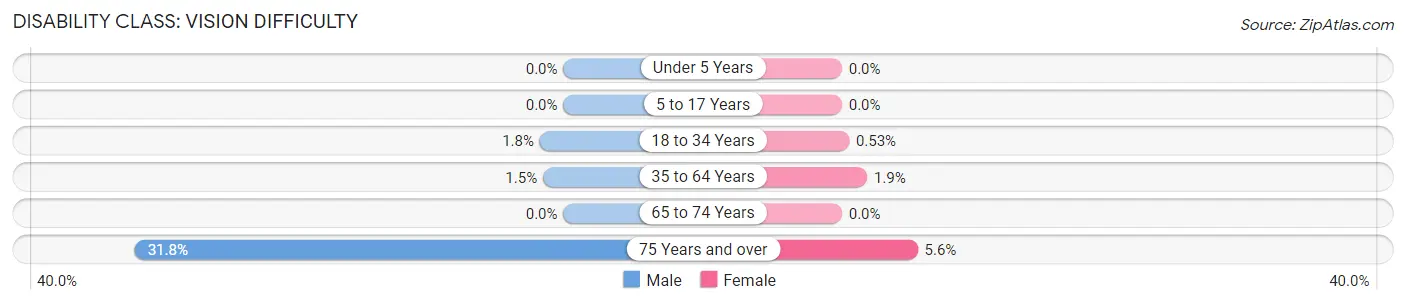
| Age Bracket | Male | Female |
| Under 5 Years | 0 (0.0%) | 0 (0.0%) |
| 5 to 17 Years | 0 (0.0%) | 0 (0.0%) |
| 18 to 34 Years | 33 (1.8%) | 12 (0.5%) |
| 35 to 64 Years | 9 (1.5%) | 11 (1.9%) |
| 65 to 74 Years | 0 (0.0%) | 0 (0.0%) |
| 75 Years and over | 14 (31.8%) | 8 (5.6%) |
Disability Class: Cognitive Difficulty
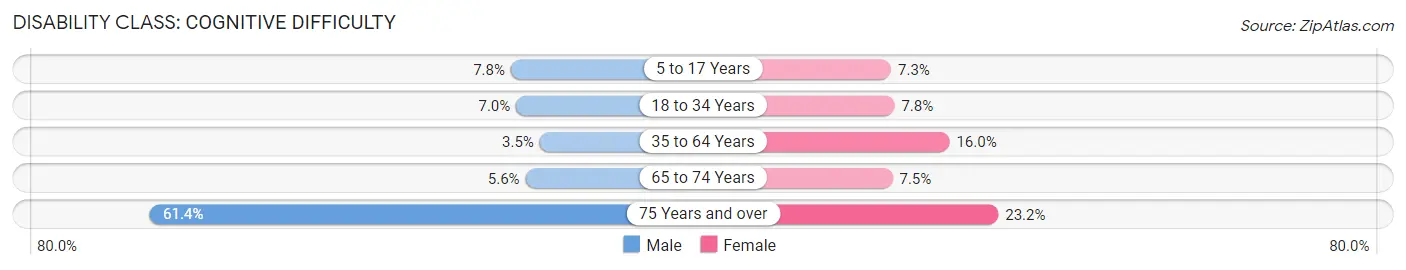
| Age Bracket | Male | Female |
| 5 to 17 Years | 23 (7.8%) | 27 (7.3%) |
| 18 to 34 Years | 132 (7.0%) | 176 (7.8%) |
| 35 to 64 Years | 21 (3.5%) | 94 (16.0%) |
| 65 to 74 Years | 8 (5.6%) | 7 (7.5%) |
| 75 Years and over | 27 (61.4%) | 33 (23.2%) |
Disability Class: Ambulatory Difficulty
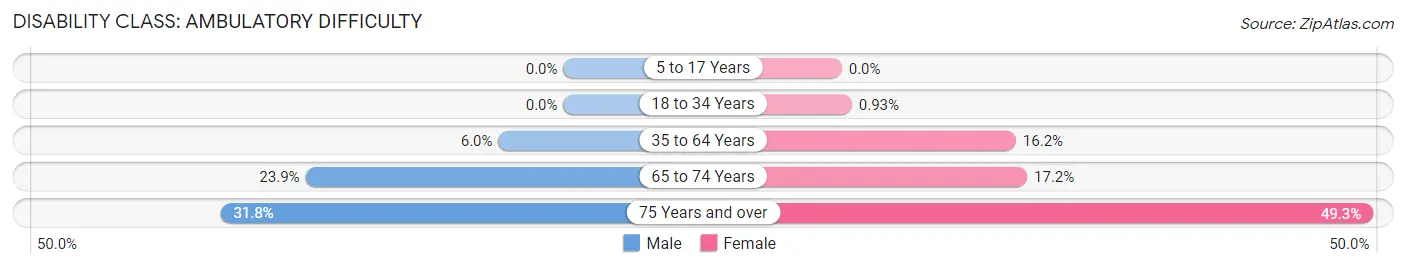
| Age Bracket | Male | Female |
| 5 to 17 Years | 0 (0.0%) | 0 (0.0%) |
| 18 to 34 Years | 0 (0.0%) | 21 (0.9%) |
| 35 to 64 Years | 36 (6.0%) | 95 (16.2%) |
| 65 to 74 Years | 34 (23.9%) | 16 (17.2%) |
| 75 Years and over | 14 (31.8%) | 70 (49.3%) |
Disability Class: Self-Care Difficulty
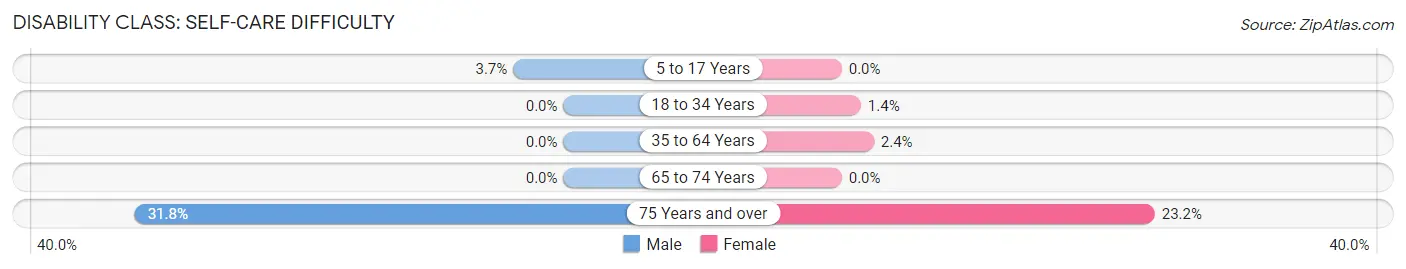
| Age Bracket | Male | Female |
| 5 to 17 Years | 11 (3.7%) | 0 (0.0%) |
| 18 to 34 Years | 0 (0.0%) | 32 (1.4%) |
| 35 to 64 Years | 0 (0.0%) | 14 (2.4%) |
| 65 to 74 Years | 0 (0.0%) | 0 (0.0%) |
| 75 Years and over | 14 (31.8%) | 33 (23.2%) |
Technology Access in Morehead
Computing Device Access in Morehead
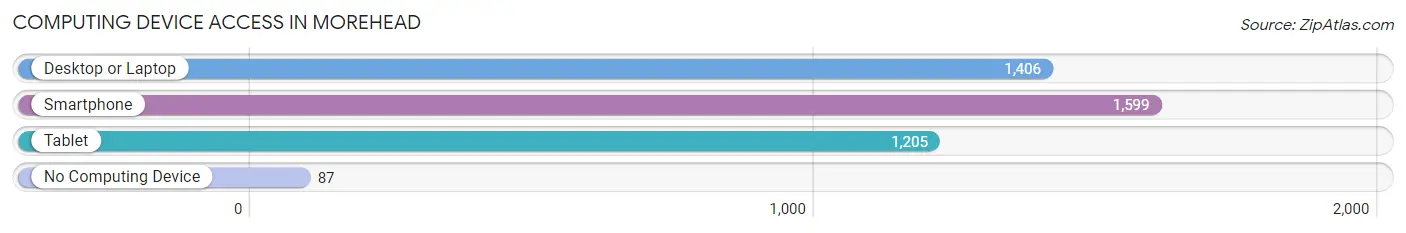
| Device Type | # Households | % Households |
| Desktop or Laptop | 1,406 | 79.6% |
| Smartphone | 1,599 | 90.5% |
| Tablet | 1,205 | 68.2% |
| No Computing Device | 87 | 4.9% |
| Total | 1,766 | 100.0% |
Internet Access in Morehead
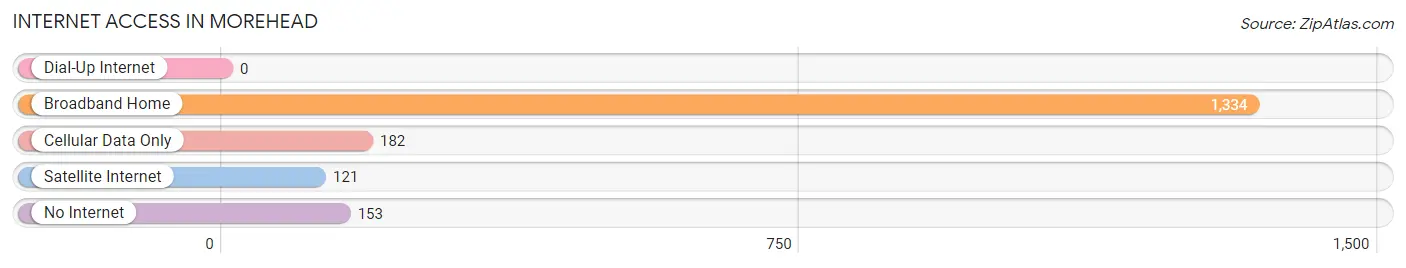
| Internet Type | # Households | % Households |
| Dial-Up Internet | 0 | 0.0% |
| Broadband Home | 1,334 | 75.5% |
| Cellular Data Only | 182 | 10.3% |
| Satellite Internet | 121 | 6.9% |
| No Internet | 153 | 8.7% |
| Total | 1,766 | 100.0% |
Morehead Summary
Morehead is a city located in Rowan County, Kentucky, United States. It is the county seat of Rowan County and the principal city of the Morehead Micropolitan Statistical Area, which includes all of Rowan County. As of the 2010 census, the population of Morehead was 6,845.
History
Morehead was founded in 1854 by Dr. James Hargis and named after James T. Morehead, the Governor of Kentucky from 1834 to 1836. The city was incorporated in 1856 and became the county seat of Rowan County in 1858.
Morehead was a major stop on the Louisville and Nashville Railroad, which connected the city to the rest of the state and the nation. The railroad was a major factor in the growth of the city, and it was the site of the first railroad station in the state.
The city was also home to the Morehead Normal School, which was established in 1887 and later became Morehead State University. The university has grown to become one of the largest in the state, with an enrollment of over 11,000 students.
Geography
Morehead is located in the foothills of the Appalachian Mountains in eastern Kentucky. The city is situated on the banks of the Licking River, which flows through the city and is a major source of recreation for the area.
The city has a total area of 8.2 square miles, all of which is land. The city is located at an elevation of 845 feet above sea level.
Economy
Morehead’s economy is largely based on the education and health care industries. Morehead State University is the largest employer in the city, with over 3,000 employees. Other major employers include St. Claire Regional Medical Center, Morehead Memorial Hospital, and the Rowan County School System.
The city is also home to several manufacturing companies, including Morehead Plastics, Morehead Tool and Die, and Morehead Foundry.
Demographics
As of the 2010 census, the population of Morehead was 6,845. The racial makeup of the city was 92.3% White, 4.2% African American, 0.5% Native American, 0.7% Asian, 0.1% Pacific Islander, 0.7% from other races, and 1.5% from two or more races. Hispanic or Latino of any race were 1.7% of the population.
The median income for a household in the city was $30,938, and the median income for a family was $41,944. The per capita income for the city was $17,845. About 17.2% of families and 22.2% of the population were below the poverty line, including 28.3% of those under age 18 and 16.2% of those age 65 or over.
Common Questions
What is Per Capita Income in Morehead?
Per Capita income in Morehead is $23,049.
What is the Median Family Income in Morehead?
Median Family Income in Morehead is $88,450.
What is the Median Household income in Morehead?
Median Household Income in Morehead is $32,020.
What is Income or Wage Gap in Morehead?
Income or Wage Gap in Morehead is 49.5%.
Women in Morehead earn 50.5 cents for every dollar earned by a man.
What is Inequality or Gini Index in Morehead?
Inequality or Gini Index in Morehead is 0.65.
What is the Total Population of Morehead?
Total Population of Morehead is 7,001.
What is the Total Male Population of Morehead?
Total Male Population of Morehead is 3,317.
What is the Total Female Population of Morehead?
Total Female Population of Morehead is 3,684.
What is the Ratio of Males per 100 Females in Morehead?
There are 90.04 Males per 100 Females in Morehead.
What is the Ratio of Females per 100 Males in Morehead?
There are 111.06 Females per 100 Males in Morehead.
What is the Median Population Age in Morehead?
Median Population Age in Morehead is 22.0 Years.
What is the Average Family Size in Morehead
Average Family Size in Morehead is 3.5 People.
What is the Average Household Size in Morehead
Average Household Size in Morehead is 2.4 People.
How Large is the Labor Force in Morehead?
There are 3,346 People in the Labor Forcein in Morehead.
What is the Percentage of People in the Labor Force in Morehead?
53.2% of People are in the Labor Force in Morehead.
What is the Unemployment Rate in Morehead?
Unemployment Rate in Morehead is 5.2%.