Plano, KY Map & Demographics
Plano Map
Plano Overview
$31,703
PER CAPITA INCOME
$121,531
AVG FAMILY INCOME
$120,536
AVG HOUSEHOLD INCOME
44.3%
WAGE / INCOME GAP [ % ]
55.7¢/ $1
WAGE / INCOME GAP [ $ ]
0.29
INEQUALITY / GINI INDEX
1,314
TOTAL POPULATION
676
MALE POPULATION
638
FEMALE POPULATION
105.96
MALES / 100 FEMALES
94.38
FEMALES / 100 MALES
30.7
MEDIAN AGE
3.9
AVG FAMILY SIZE
3.3
AVG HOUSEHOLD SIZE
725
LABOR FORCE [ PEOPLE ]
83.0%
PERCENT IN LABOR FORCE
5.0%
UNEMPLOYMENT RATE
Income in Plano
Income Overview in Plano
Per Capita Income in Plano is $31,703, while median incomes of families and households are $121,531 and $120,536 respectively.
| Characteristic | Number | Measure |
| Per Capita Income | 1,314 | $31,703 |
| Median Family Income | 306 | $121,531 |
| Mean Family Income | 306 | $116,389 |
| Median Household Income | 393 | $120,536 |
| Mean Household Income | 393 | $106,648 |
| Income Deficit | 306 | $0 |
| Wage / Income Gap (%) | 1,314 | 44.26% |
| Wage / Income Gap ($) | 1,314 | 55.74¢ per $1 |
| Gini / Inequality Index | 1,314 | 0.29 |
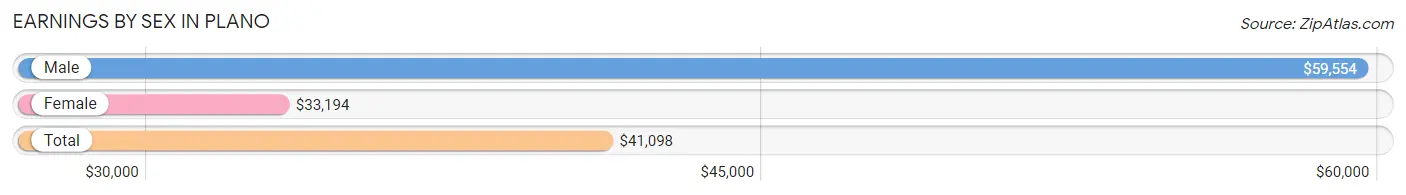
Earnings by Sex in Plano
Average Earnings in Plano are $41,098, $59,554 for men and $33,194 for women, a difference of 44.3%.
| Sex | Number | Average Earnings |
| Male | 431 (56.8%) | $59,554 |
| Female | 328 (43.2%) | $33,194 |
| Total | 759 (100.0%) | $41,098 |
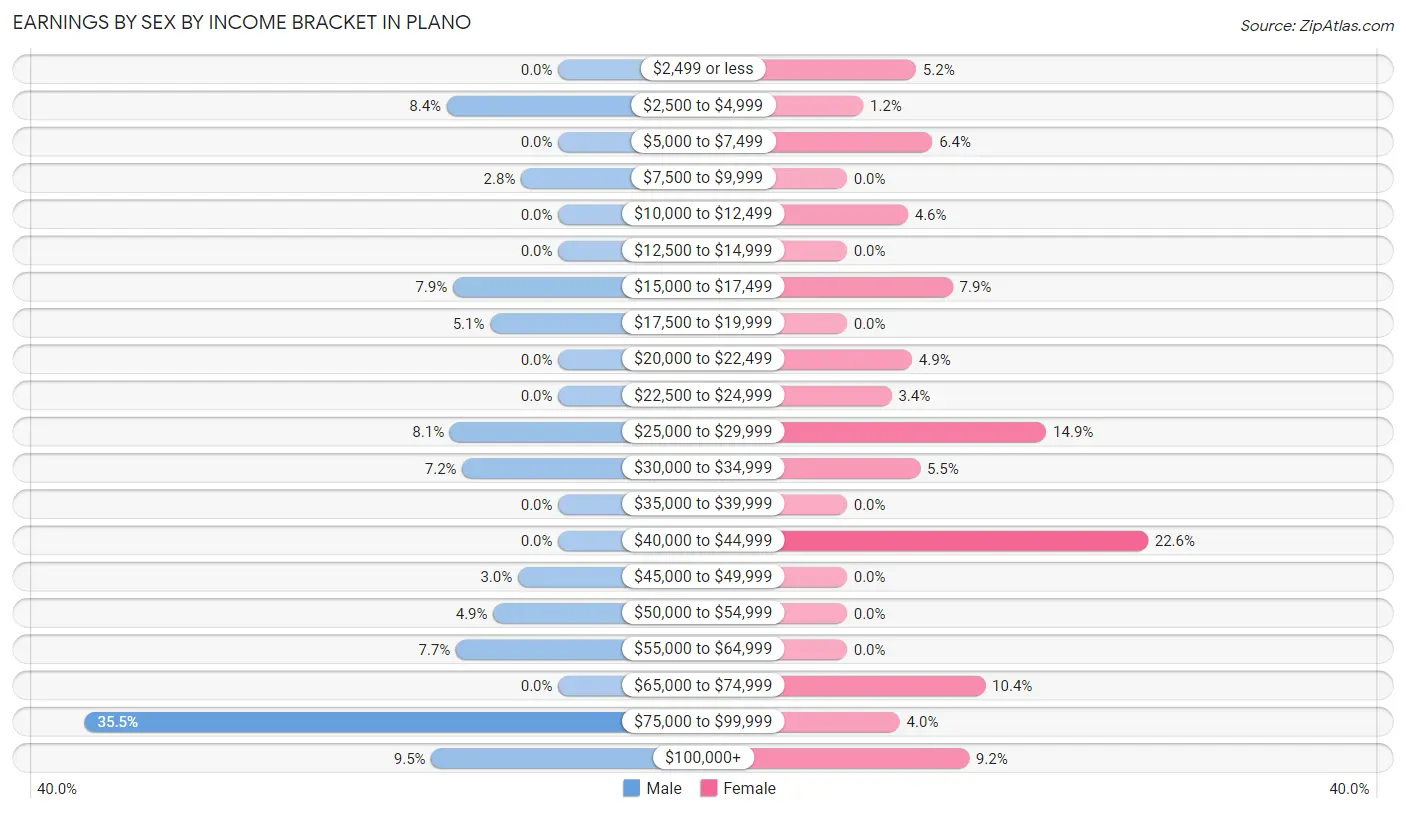
Earnings by Sex by Income Bracket in Plano
The most common earnings brackets in Plano are $75,000 to $99,999 for men (153 | 35.5%) and $40,000 to $44,999 for women (74 | 22.6%).
| Income | Male | Female |
| $2,499 or less | 0 (0.0%) | 17 (5.2%) |
| $2,500 to $4,999 | 36 (8.4%) | 4 (1.2%) |
| $5,000 to $7,499 | 0 (0.0%) | 21 (6.4%) |
| $7,500 to $9,999 | 12 (2.8%) | 0 (0.0%) |
| $10,000 to $12,499 | 0 (0.0%) | 15 (4.6%) |
| $12,500 to $14,999 | 0 (0.0%) | 0 (0.0%) |
| $15,000 to $17,499 | 34 (7.9%) | 26 (7.9%) |
| $17,500 to $19,999 | 22 (5.1%) | 0 (0.0%) |
| $20,000 to $22,499 | 0 (0.0%) | 16 (4.9%) |
| $22,500 to $24,999 | 0 (0.0%) | 11 (3.4%) |
| $25,000 to $29,999 | 35 (8.1%) | 49 (14.9%) |
| $30,000 to $34,999 | 31 (7.2%) | 18 (5.5%) |
| $35,000 to $39,999 | 0 (0.0%) | 0 (0.0%) |
| $40,000 to $44,999 | 0 (0.0%) | 74 (22.6%) |
| $45,000 to $49,999 | 13 (3.0%) | 0 (0.0%) |
| $50,000 to $54,999 | 21 (4.9%) | 0 (0.0%) |
| $55,000 to $64,999 | 33 (7.7%) | 0 (0.0%) |
| $65,000 to $74,999 | 0 (0.0%) | 34 (10.4%) |
| $75,000 to $99,999 | 153 (35.5%) | 13 (4.0%) |
| $100,000+ | 41 (9.5%) | 30 (9.1%) |
| Total | 431 (100.0%) | 328 (100.0%) |
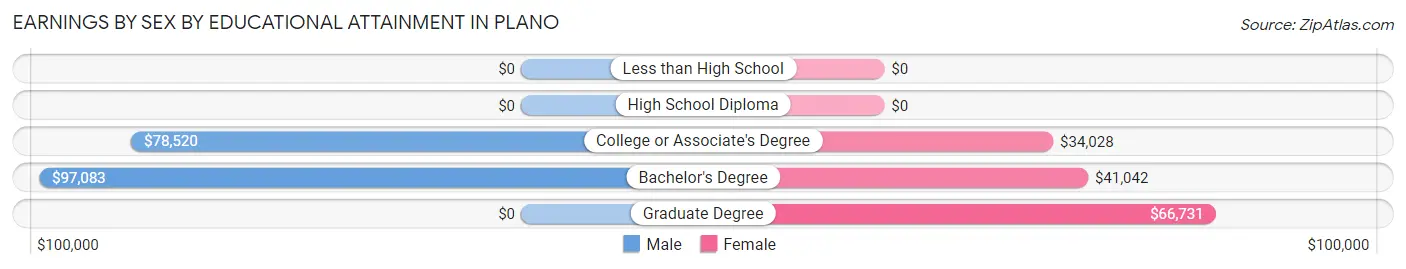
Earnings by Sex by Educational Attainment in Plano
Average earnings in Plano are $61,908 for men and $40,355 for women, a difference of 34.8%. Men with an educational attainment of bachelor's degree enjoy the highest average annual earnings of $97,083, while those with college or associate's degree education earn the least with $78,520. Women with an educational attainment of graduate degree earn the most with the average annual earnings of $66,731, while those with college or associate's degree education have the smallest earnings of $34,028.
| Educational Attainment | Male Income | Female Income |
| Less than High School | - | - |
| High School Diploma | - | - |
| College or Associate's Degree | $78,520 | $34,028 |
| Bachelor's Degree | $97,083 | $41,042 |
| Graduate Degree | - | - |
| Total | $61,908 | $40,355 |
Family Income in Plano
Family Income Brackets in Plano
According to the Plano family income data, there are 122 families falling into the $100,000 to $149,999 income range, which is the most common income bracket and makes up 39.9% of all families.
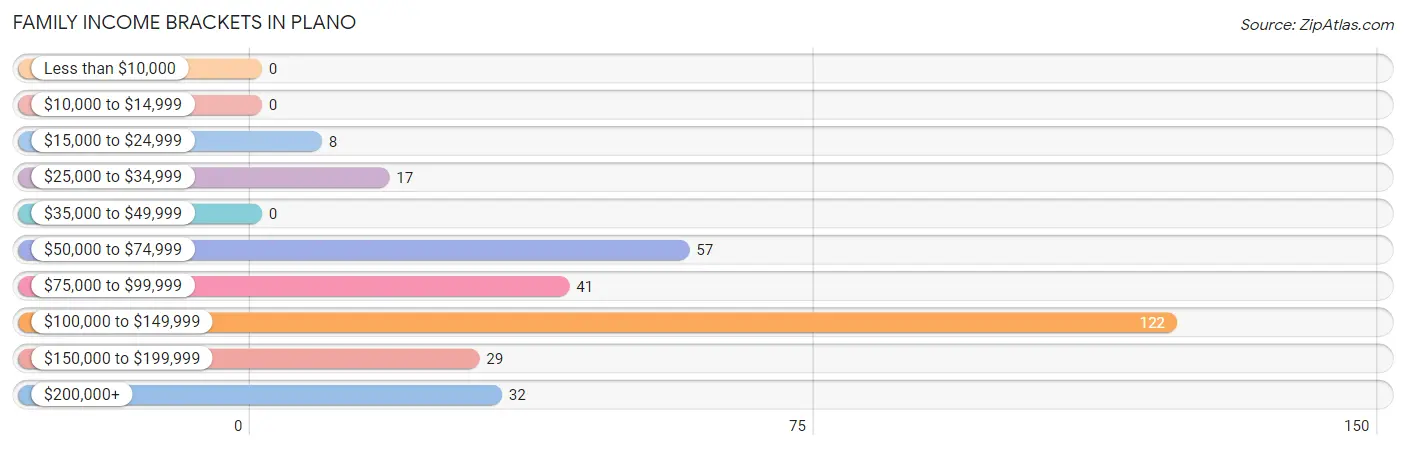
| Income Bracket | # Families | % Families |
| Less than $10,000 | 0 | 0.0% |
| $10,000 to $14,999 | 0 | 0.0% |
| $15,000 to $24,999 | 8 | 2.6% |
| $25,000 to $34,999 | 17 | 5.6% |
| $35,000 to $49,999 | 0 | 0.0% |
| $50,000 to $74,999 | 57 | 18.6% |
| $75,000 to $99,999 | 41 | 13.4% |
| $100,000 to $149,999 | 122 | 39.9% |
| $150,000 to $199,999 | 29 | 9.5% |
| $200,000+ | 32 | 10.5% |
Family Income by Famaliy Size in Plano
3-person families (98 | 32.0%) account for the highest median family income in Plano with $138,786 per family, while 3-person families (98 | 32.0%) have the highest median income of $46,262 per family member.
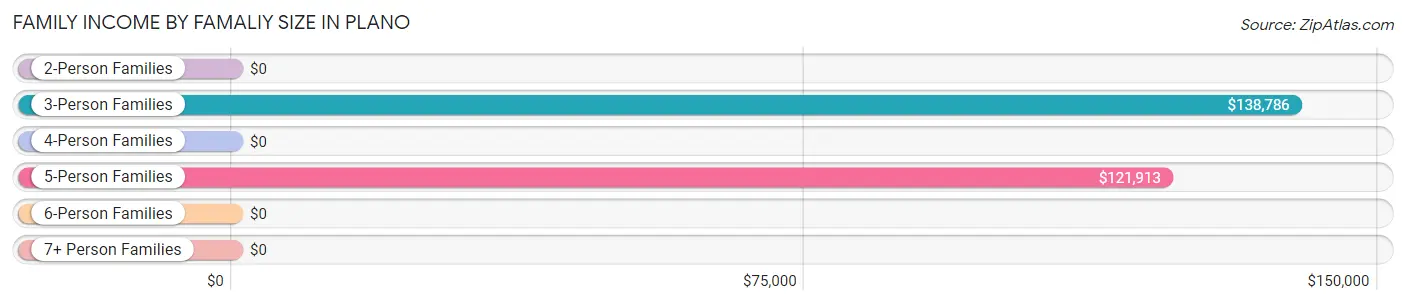
| Income Bracket | # Families | Median Income |
| 2-Person Families | 61 (19.9%) | $0 |
| 3-Person Families | 98 (32.0%) | $138,786 |
| 4-Person Families | 26 (8.5%) | $0 |
| 5-Person Families | 107 (35.0%) | $121,913 |
| 6-Person Families | 14 (4.6%) | $0 |
| 7+ Person Families | 0 (0.0%) | $0 |
| Total | 306 (100.0%) | $121,531 |
Family Income by Number of Earners in Plano
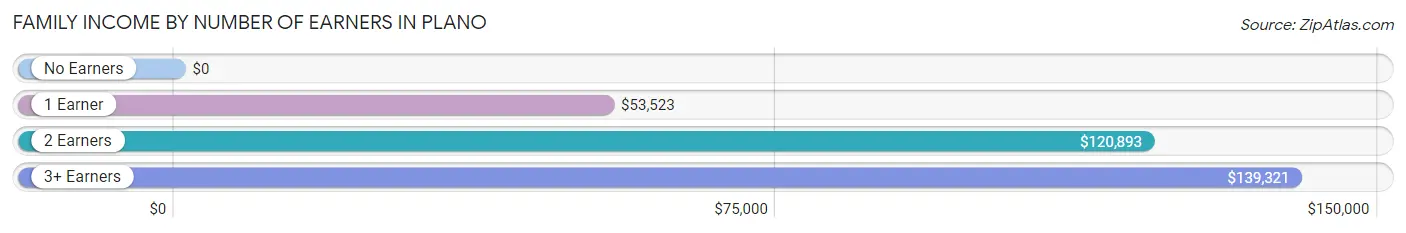
| Number of Earners | # Families | Median Income |
| No Earners | 0 (0.0%) | $0 |
| 1 Earner | 52 (17.0%) | $53,523 |
| 2 Earners | 179 (58.5%) | $120,893 |
| 3+ Earners | 75 (24.5%) | $139,321 |
| Total | 306 (100.0%) | $121,531 |
Household Income in Plano
Household Income Brackets in Plano
With 146 households falling in the category, the $100,000 to $149,999 income range is the most frequent in Plano, accounting for 37.1% of all households.
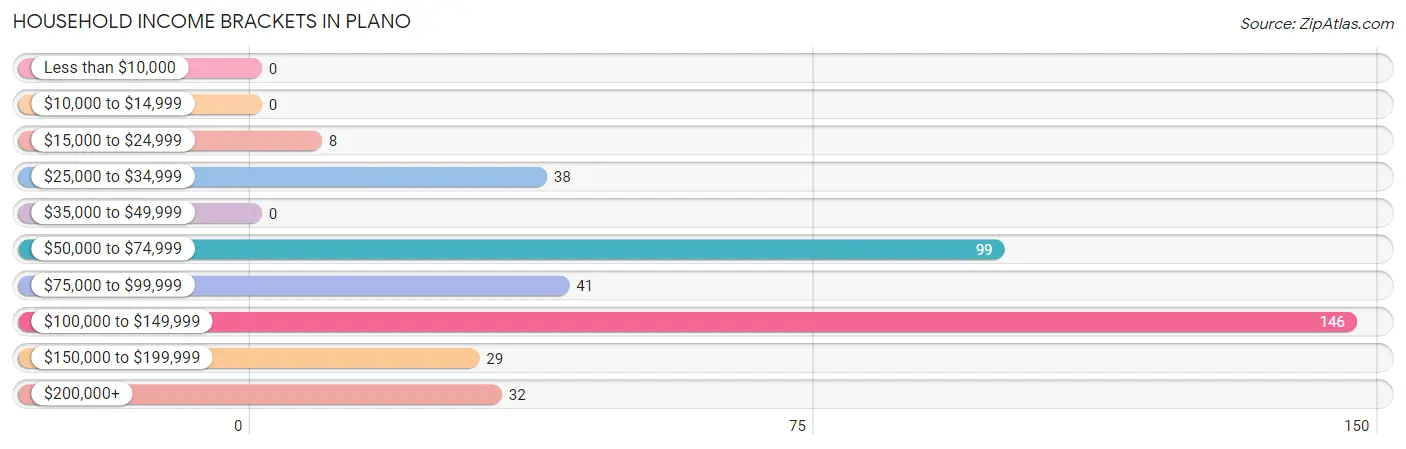
| Income Bracket | # Households | % Households |
| Less than $10,000 | 0 | 0.0% |
| $10,000 to $14,999 | 0 | 0.0% |
| $15,000 to $24,999 | 8 | 2.0% |
| $25,000 to $34,999 | 38 | 9.7% |
| $35,000 to $49,999 | 0 | 0.0% |
| $50,000 to $74,999 | 99 | 25.2% |
| $75,000 to $99,999 | 41 | 10.4% |
| $100,000 to $149,999 | 146 | 37.2% |
| $150,000 to $199,999 | 29 | 7.4% |
| $200,000+ | 32 | 8.1% |
Household Income by Householder Age in Plano
The median household income in Plano is $120,536, with the highest median household income of $135,227 found in the 45 to 64 years age bracket for the primary householder. A total of 174 households (44.3%) fall into this category.
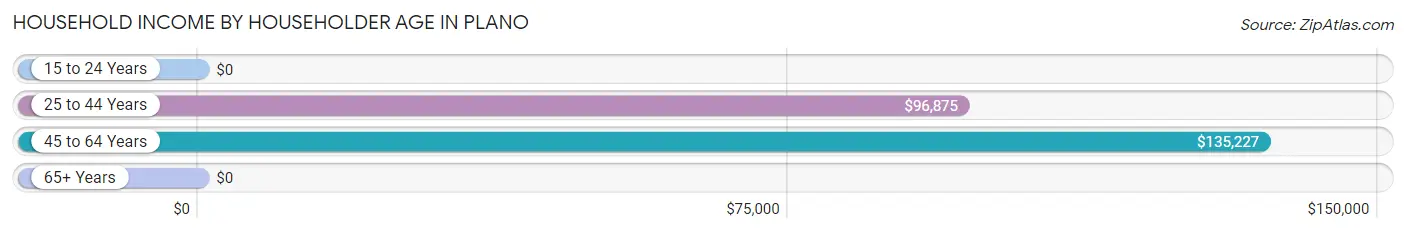
| Income Bracket | # Households | Median Income |
| 15 to 24 Years | 0 (0.0%) | $0 |
| 25 to 44 Years | 173 (44.0%) | $96,875 |
| 45 to 64 Years | 174 (44.3%) | $135,227 |
| 65+ Years | 46 (11.7%) | $0 |
| Total | 393 (100.0%) | $120,536 |
Poverty in Plano
Income Below Poverty by Sex and Age in Plano
With 8.3% poverty level for males and 2.8% for females among the residents of Plano, 25 to 34 year old males and 16 and 17 year old females are the most vulnerable to poverty, with 36 males (53.7%) and 4 females (21.0%) in their respective age groups living below the poverty level.
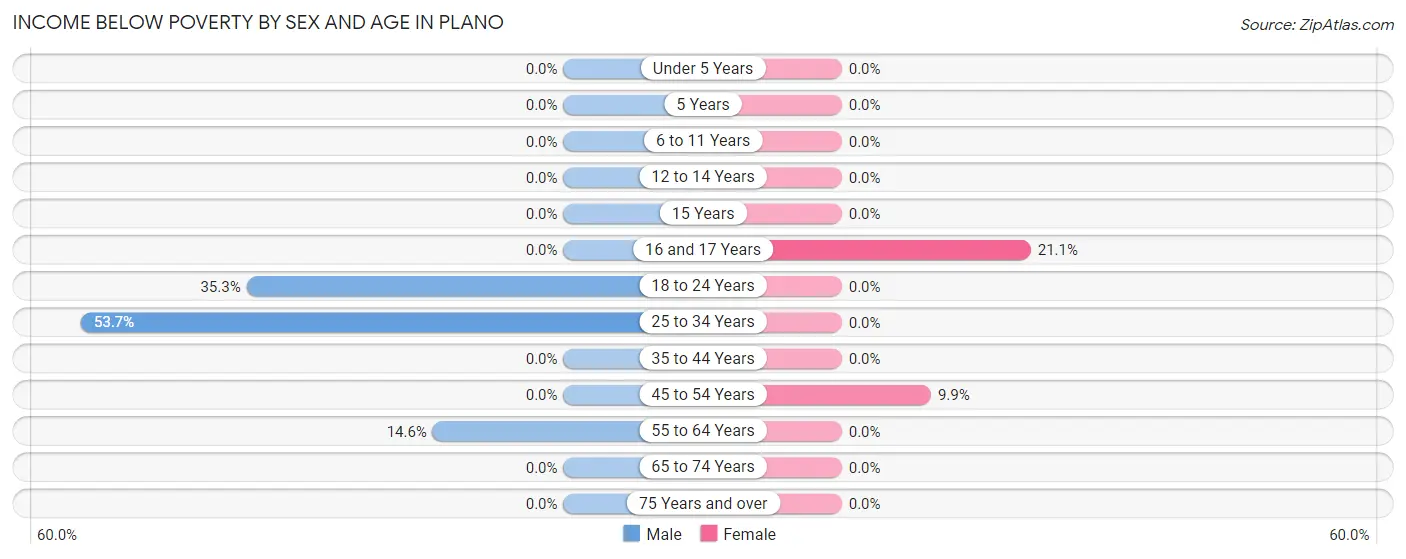
| Age Bracket | Male | Female |
| Under 5 Years | 0 (0.0%) | 0 (0.0%) |
| 5 Years | 0 (0.0%) | 0 (0.0%) |
| 6 to 11 Years | 0 (0.0%) | 0 (0.0%) |
| 12 to 14 Years | 0 (0.0%) | 0 (0.0%) |
| 15 Years | 0 (0.0%) | 0 (0.0%) |
| 16 and 17 Years | 0 (0.0%) | 4 (21.0%) |
| 18 to 24 Years | 12 (35.3%) | 0 (0.0%) |
| 25 to 34 Years | 36 (53.7%) | 0 (0.0%) |
| 35 to 44 Years | 0 (0.0%) | 0 (0.0%) |
| 45 to 54 Years | 0 (0.0%) | 14 (9.9%) |
| 55 to 64 Years | 8 (14.5%) | 0 (0.0%) |
| 65 to 74 Years | 0 (0.0%) | 0 (0.0%) |
| 75 Years and over | 0 (0.0%) | 0 (0.0%) |
| Total | 56 (8.3%) | 18 (2.8%) |
Income Above Poverty by Sex and Age in Plano
According to the poverty statistics in Plano, males aged under 5 years and females aged under 5 years are the age groups that are most secure financially, with 100.0% of males and 100.0% of females in these age groups living above the poverty line.
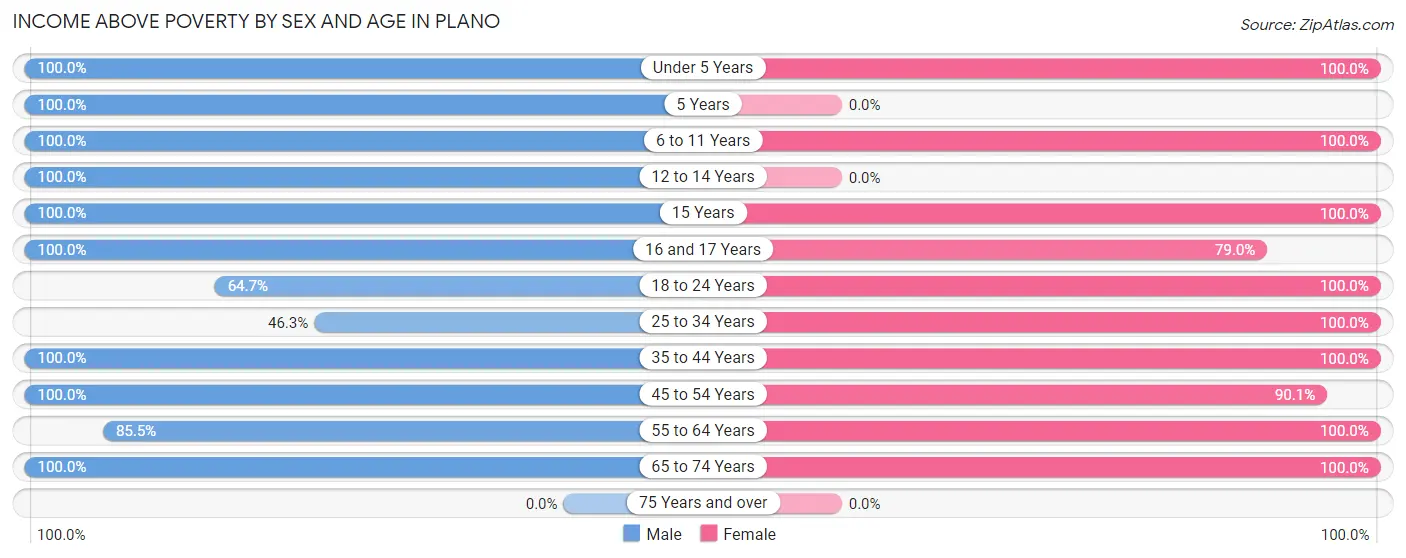
| Age Bracket | Male | Female |
| Under 5 Years | 67 (100.0%) | 39 (100.0%) |
| 5 Years | 20 (100.0%) | 0 (0.0%) |
| 6 to 11 Years | 36 (100.0%) | 175 (100.0%) |
| 12 to 14 Years | 63 (100.0%) | 0 (0.0%) |
| 15 Years | 25 (100.0%) | 15 (100.0%) |
| 16 and 17 Years | 26 (100.0%) | 15 (78.9%) |
| 18 to 24 Years | 22 (64.7%) | 43 (100.0%) |
| 25 to 34 Years | 31 (46.3%) | 41 (100.0%) |
| 35 to 44 Years | 136 (100.0%) | 120 (100.0%) |
| 45 to 54 Years | 101 (100.0%) | 127 (90.1%) |
| 55 to 64 Years | 47 (85.5%) | 26 (100.0%) |
| 65 to 74 Years | 46 (100.0%) | 19 (100.0%) |
| 75 Years and over | 0 (0.0%) | 0 (0.0%) |
| Total | 620 (91.7%) | 620 (97.2%) |
Income Below Poverty Among Married-Couple Families in Plano
The poverty statistics for married-couple families in Plano show that 2.6% or 8 of the total 306 families live below the poverty line. Families with 1 or 2 children have the highest poverty rate of 10.1%, comprising of 8 families. On the other hand, families with no children have the lowest poverty rate of 0.0%, which includes 0 families.
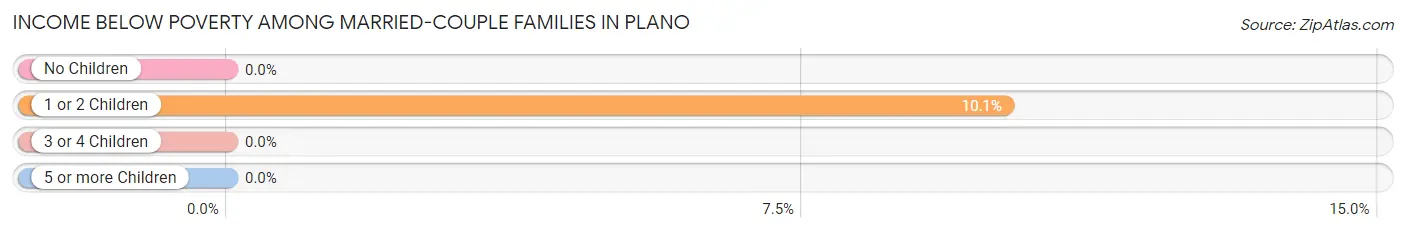
| Children | Above Poverty | Below Poverty |
| No Children | 121 (100.0%) | 0 (0.0%) |
| 1 or 2 Children | 71 (89.9%) | 8 (10.1%) |
| 3 or 4 Children | 106 (100.0%) | 0 (0.0%) |
| 5 or more Children | 0 (0.0%) | 0 (0.0%) |
| Total | 298 (97.4%) | 8 (2.6%) |
Income Below Poverty Among Single-Parent Households in Plano
| Children | Single Father | Single Mother |
| No Children | 0 (0.0%) | 0 (0.0%) |
| 1 or 2 Children | 0 (0.0%) | 0 (0.0%) |
| 3 or 4 Children | 0 (0.0%) | 0 (0.0%) |
| 5 or more Children | 0 (0.0%) | 0 (0.0%) |
| Total | 0 (0.0%) | 0 (0.0%) |
Income Below Poverty Among Married-Couple vs Single-Parent Households in Plano
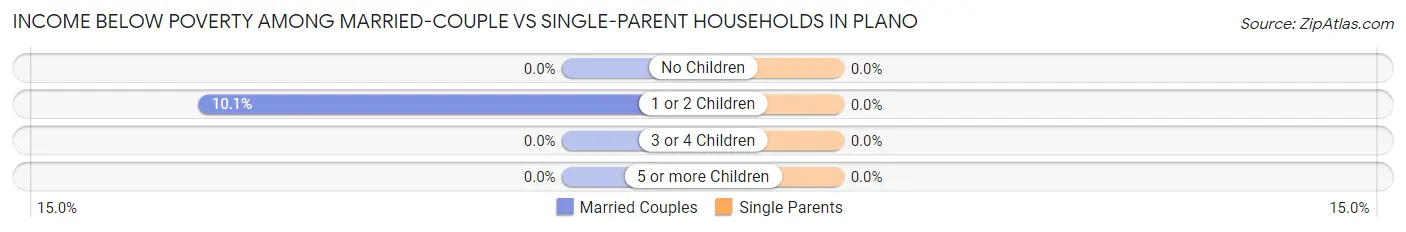
| Children | Married-Couple Families | Single-Parent Households |
| No Children | 0 (0.0%) | 0 (0.0%) |
| 1 or 2 Children | 8 (10.1%) | 0 (0.0%) |
| 3 or 4 Children | 0 (0.0%) | 0 (0.0%) |
| 5 or more Children | 0 (0.0%) | 0 (0.0%) |
| Total | 8 (2.6%) | 0 (0.0%) |
Race in Plano
The most populous races in Plano are White / Caucasian (1,254 | 95.4%), Black / African American (36 | 2.7%), and Two or more Races (24 | 1.8%).
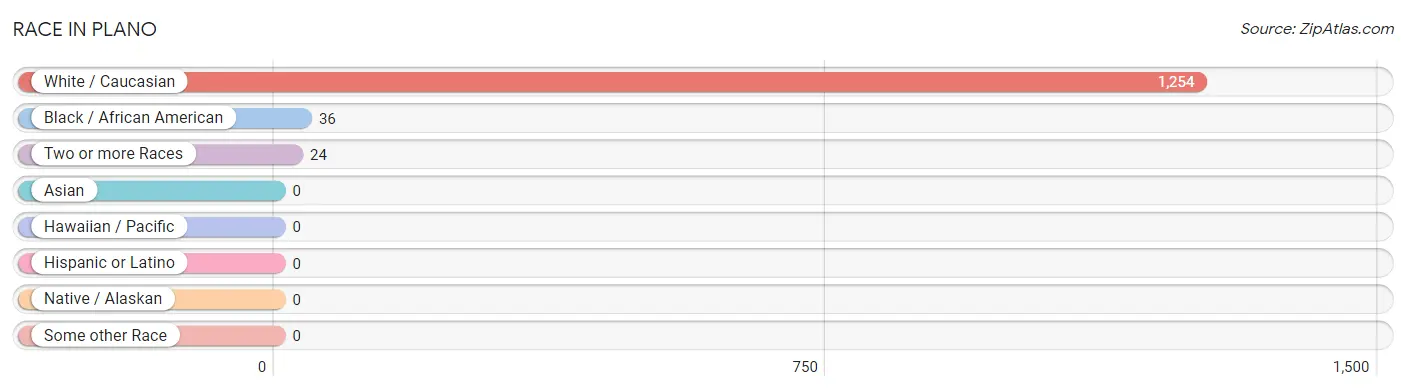
| Race | # Population | % Population |
| Asian | 0 | 0.0% |
| Black / African American | 36 | 2.7% |
| Hawaiian / Pacific | 0 | 0.0% |
| Hispanic or Latino | 0 | 0.0% |
| Native / Alaskan | 0 | 0.0% |
| White / Caucasian | 1,254 | 95.4% |
| Two or more Races | 24 | 1.8% |
| Some other Race | 0 | 0.0% |
| Total | 1,314 | 100.0% |
Ancestry in Plano
The most populous ancestries reported in Plano are German (295 | 22.5%), Polish (209 | 15.9%), American (175 | 13.3%), English (160 | 12.2%), and Irish (82 | 6.2%), together accounting for 70.1% of all Plano residents.
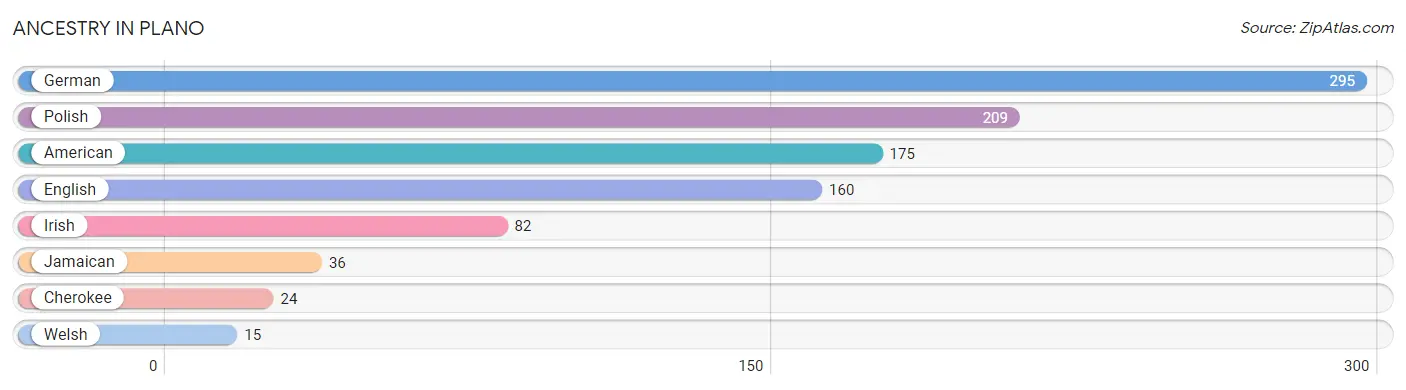
| Ancestry | # Population | % Population |
| American | 175 | 13.3% |
| Cherokee | 24 | 1.8% |
| English | 160 | 12.2% |
| German | 295 | 22.5% |
| Irish | 82 | 6.2% |
| Jamaican | 36 | 2.7% |
| Polish | 209 | 15.9% |
| Welsh | 15 | 1.1% | View All 8 Rows |
Immigrants in Plano

| Immigration Origin | # Population | % Population | View All 0 Rows |
Sex and Age in Plano
Sex and Age in Plano
The most populous age groups in Plano are 35 to 39 Years (105 | 15.5%) for men and 5 to 9 Years (122 | 19.1%) for women.
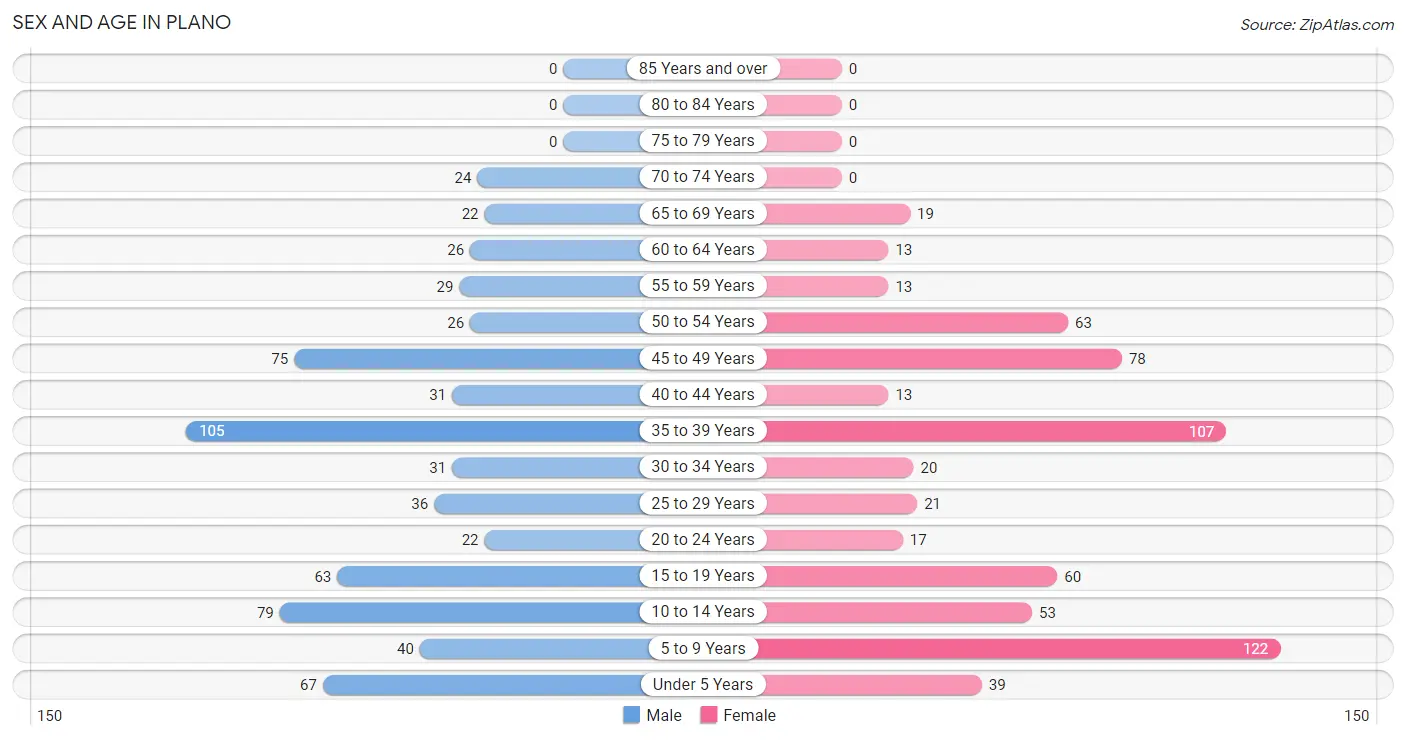
| Age Bracket | Male | Female |
| Under 5 Years | 67 (9.9%) | 39 (6.1%) |
| 5 to 9 Years | 40 (5.9%) | 122 (19.1%) |
| 10 to 14 Years | 79 (11.7%) | 53 (8.3%) |
| 15 to 19 Years | 63 (9.3%) | 60 (9.4%) |
| 20 to 24 Years | 22 (3.3%) | 17 (2.7%) |
| 25 to 29 Years | 36 (5.3%) | 21 (3.3%) |
| 30 to 34 Years | 31 (4.6%) | 20 (3.1%) |
| 35 to 39 Years | 105 (15.5%) | 107 (16.8%) |
| 40 to 44 Years | 31 (4.6%) | 13 (2.0%) |
| 45 to 49 Years | 75 (11.1%) | 78 (12.2%) |
| 50 to 54 Years | 26 (3.8%) | 63 (9.9%) |
| 55 to 59 Years | 29 (4.3%) | 13 (2.0%) |
| 60 to 64 Years | 26 (3.8%) | 13 (2.0%) |
| 65 to 69 Years | 22 (3.3%) | 19 (3.0%) |
| 70 to 74 Years | 24 (3.5%) | 0 (0.0%) |
| 75 to 79 Years | 0 (0.0%) | 0 (0.0%) |
| 80 to 84 Years | 0 (0.0%) | 0 (0.0%) |
| 85 Years and over | 0 (0.0%) | 0 (0.0%) |
| Total | 676 (100.0%) | 638 (100.0%) |
Families and Households in Plano
Median Family Size in Plano
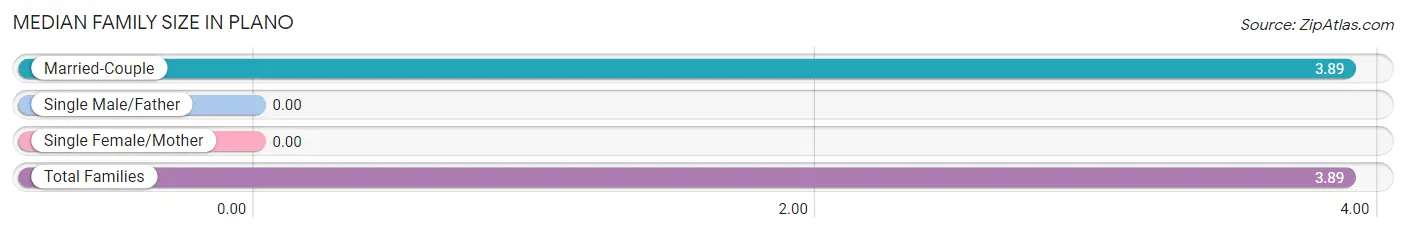
| Family Type | # Families | Family Size |
| Married-Couple | 306 (100.0%) | 3.89 |
| Single Male/Father | 0 (0.0%) | - |
| Single Female/Mother | 0 (0.0%) | - |
| Total Families | 306 (100.0%) | 3.89 |
Median Household Size in Plano
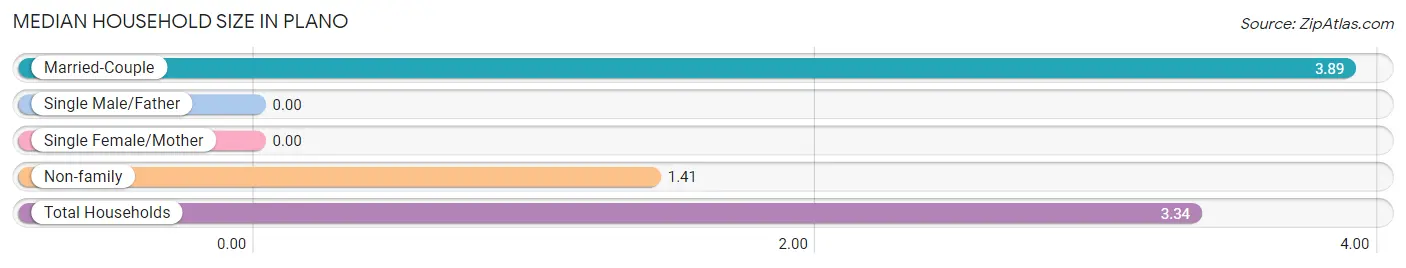
| Household Type | # Households | Household Size |
| Married-Couple | 306 (77.9%) | 3.89 |
| Single Male/Father | 0 (0.0%) | - |
| Single Female/Mother | 0 (0.0%) | - |
| Non-family | 87 (22.1%) | 1.41 |
| Total Households | 393 (100.0%) | 3.34 |
Household Size by Marriage Status in Plano
Out of a total of 393 households in Plano, 306 (77.9%) are family households, while 87 (22.1%) are nonfamily households. The most numerous type of family households are 5-person households, comprising 107, and the most common type of nonfamily households are 1-person households, comprising 66.
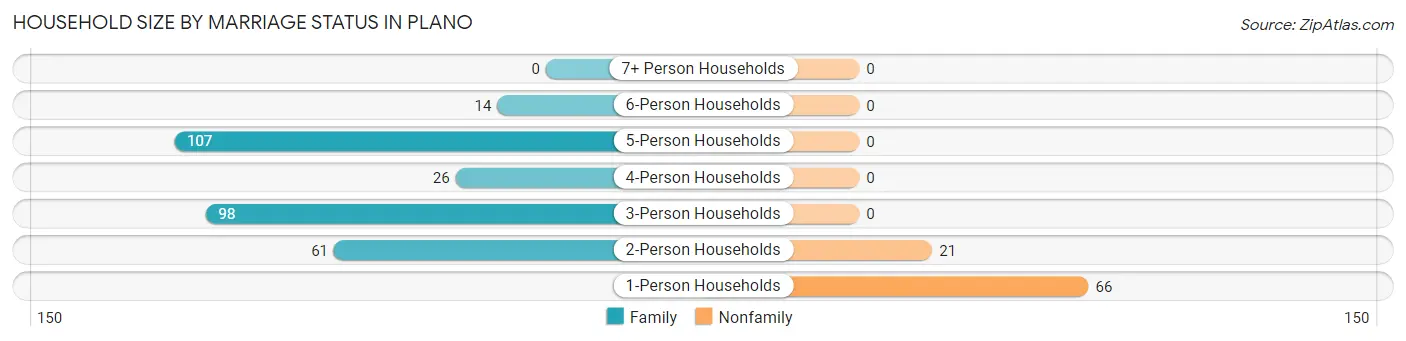
| Household Size | Family Households | Nonfamily Households |
| 1-Person Households | - | 66 (16.8%) |
| 2-Person Households | 61 (15.5%) | 21 (5.3%) |
| 3-Person Households | 98 (24.9%) | 0 (0.0%) |
| 4-Person Households | 26 (6.6%) | 0 (0.0%) |
| 5-Person Households | 107 (27.2%) | 0 (0.0%) |
| 6-Person Households | 14 (3.6%) | 0 (0.0%) |
| 7+ Person Households | 0 (0.0%) | 0 (0.0%) |
| Total | 306 (77.9%) | 87 (22.1%) |
Female Fertility in Plano
Fertility by Age in Plano
| Age Bracket | Women with Births | Births / 1,000 Women |
| 15 to 19 years | 0 (0.0%) | 0.0 |
| 20 to 34 years | 0 (0.0%) | 0.0 |
| 35 to 50 years | 0 (0.0%) | 0.0 |
| Total | 0 (0.0%) | 0.0 |
Fertility by Age by Marriage Status in Plano
| Age Bracket | Married | Unmarried |
| 15 to 19 years | 0 (0.0%) | 0 (0.0%) |
| 20 to 34 years | 0 (0.0%) | 0 (0.0%) |
| 35 to 50 years | 0 (0.0%) | 0 (0.0%) |
| Total | 0 (0.0%) | 0 (0.0%) |
Fertility by Education in Plano
| Educational Attainment | Women with Births | Births / 1,000 Women |
| Less than High School | 0 (0.0%) | 0.0 |
| High School Diploma | 0 (0.0%) | 0.0 |
| College or Associate's Degree | 0 (0.0%) | 0.0 |
| Bachelor's Degree | 0 (0.0%) | 0.0 |
| Graduate Degree | 0 (0.0%) | 0.0 |
| Total | 0 (0.0%) | 0.0 |
Fertility by Education by Marriage Status in Plano
| Educational Attainment | Married | Unmarried |
| Less than High School | 0 (0.0%) | 0 (0.0%) |
| High School Diploma | 0 (0.0%) | 0 (0.0%) |
| College or Associate's Degree | 0 (0.0%) | 0 (0.0%) |
| Bachelor's Degree | 0 (0.0%) | 0 (0.0%) |
| Graduate Degree | 0 (0.0%) | 0 (0.0%) |
| Total | 0 (0.0%) | 0 (0.0%) |
Employment Characteristics in Plano
Employment by Class of Employer in Plano
Among the 689 employed individuals in Plano, private company employees (391 | 56.8%), local government employees (96 | 13.9%), and not-for-profit organizations (95 | 13.8%) make up the most common classes of employment.
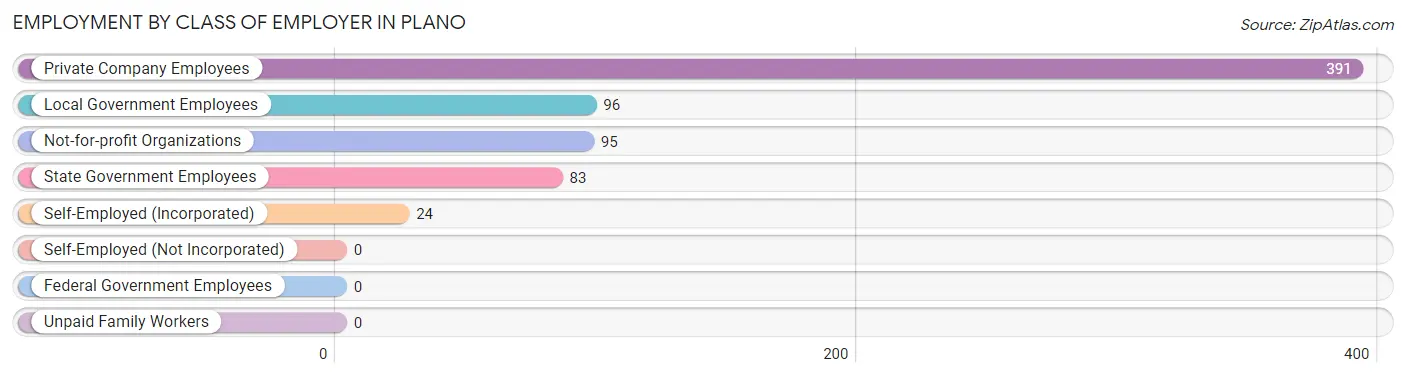
| Employer Class | # Employees | % Employees |
| Private Company Employees | 391 | 56.8% |
| Self-Employed (Incorporated) | 24 | 3.5% |
| Self-Employed (Not Incorporated) | 0 | 0.0% |
| Not-for-profit Organizations | 95 | 13.8% |
| Local Government Employees | 96 | 13.9% |
| State Government Employees | 83 | 12.0% |
| Federal Government Employees | 0 | 0.0% |
| Unpaid Family Workers | 0 | 0.0% |
| Total | 689 | 100.0% |
Employment Status by Age in Plano
According to the labor force statistics for Plano, out of the total population over 16 years of age (874), 83.0% or 725 individuals are in the labor force, with 5.0% or 36 of them unemployed. The age group with the highest labor force participation rate is 25 to 29 years, with 100.0% or 57 individuals in the labor force. Within the labor force, the 25 to 29 years age range has the highest percentage of unemployed individuals, with 63.2% or 36 of them being unemployed.
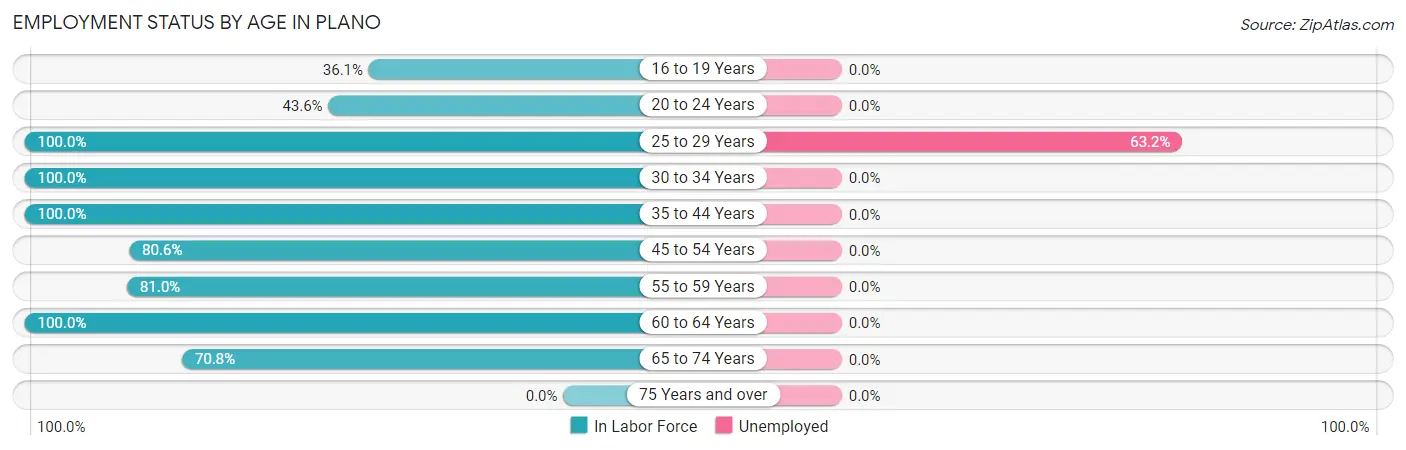
| Age Bracket | In Labor Force | Unemployed |
| 16 to 19 Years | 30 (36.1%) | 0 (0.0%) |
| 20 to 24 Years | 17 (43.6%) | 0 (0.0%) |
| 25 to 29 Years | 57 (100.0%) | 36 (63.2%) |
| 30 to 34 Years | 51 (100.0%) | 0 (0.0%) |
| 35 to 44 Years | 256 (100.0%) | 0 (0.0%) |
| 45 to 54 Years | 195 (80.6%) | 0 (0.0%) |
| 55 to 59 Years | 34 (81.0%) | 0 (0.0%) |
| 60 to 64 Years | 39 (100.0%) | 0 (0.0%) |
| 65 to 74 Years | 46 (70.8%) | 0 (0.0%) |
| 75 Years and over | 0 (0.0%) | 0 (0.0%) |
| Total | 725 (83.0%) | 36 (5.0%) |
Employment Status by Educational Attainment in Plano
According to labor force statistics for Plano, 92.0% of individuals (632) out of the total population between 25 and 64 years of age (687) are in the labor force, with 5.7% or 36 of them being unemployed. The group with the highest labor force participation rate are those with the educational attainment of bachelor's degree or higher, with 94.9% or 243 individuals in the labor force. Within the labor force, individuals with high school diploma education have the highest percentage of unemployment, with 19.7% or 36 of them being unemployed.
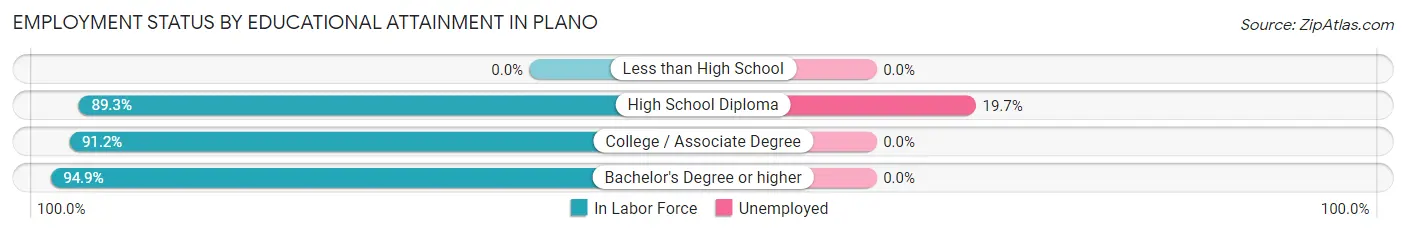
| Educational Attainment | In Labor Force | Unemployed |
| Less than High School | 0 (0.0%) | 0 (0.0%) |
| High School Diploma | 183 (89.3%) | 40 (19.7%) |
| College / Associate Degree | 206 (91.2%) | 0 (0.0%) |
| Bachelor's Degree or higher | 243 (94.9%) | 0 (0.0%) |
| Total | 632 (92.0%) | 39 (5.7%) |
Employment Occupations by Sex in Plano
Management, Business, Science and Arts Occupations
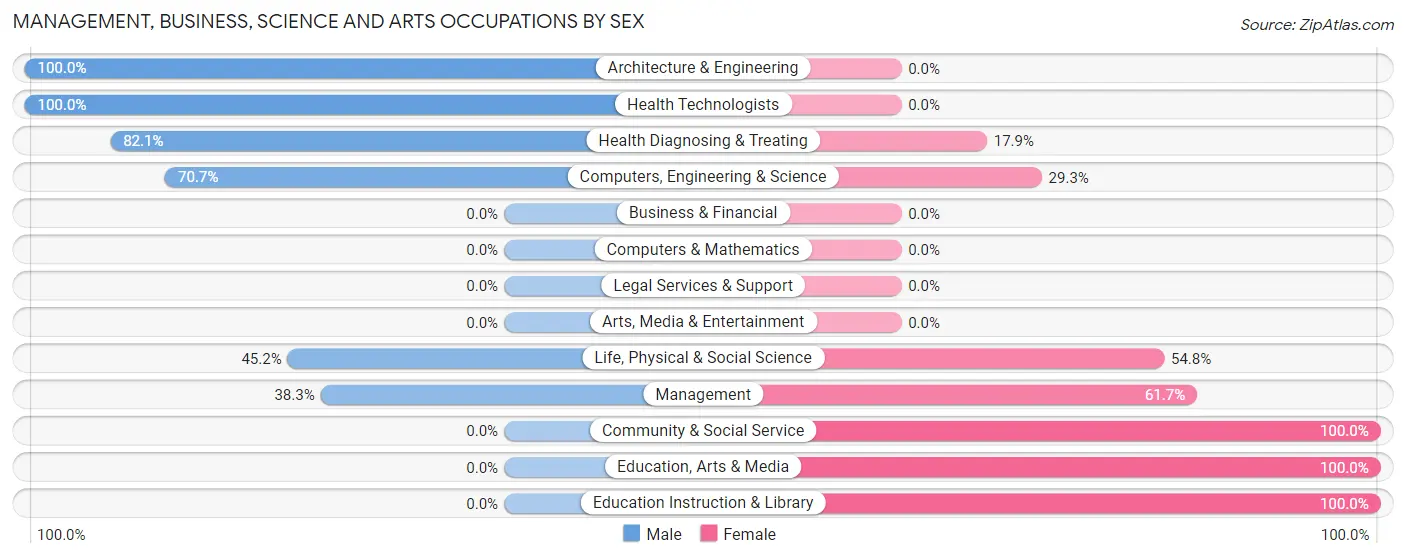
The most common Management, Business, Science and Arts occupations in Plano are Management (128 | 18.6%), Health Diagnosing & Treating (112 | 16.3%), Community & Social Service (88 | 12.8%), Health Technologists (73 | 10.6%), and Education Instruction & Library (67 | 9.7%).
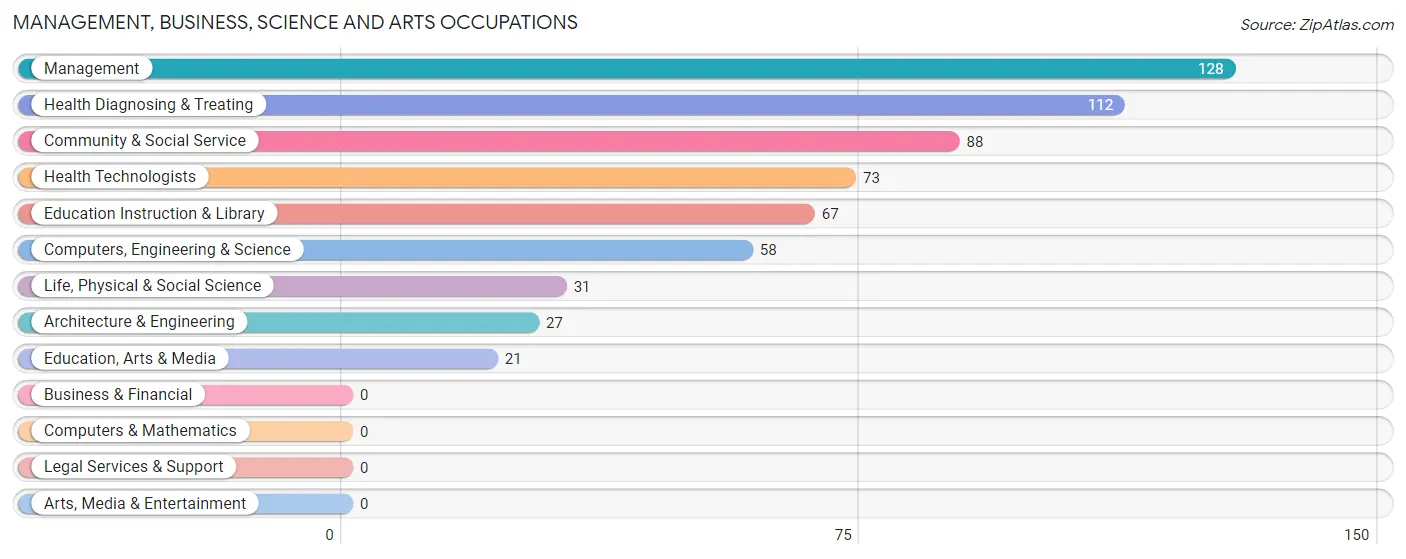
Management, Business, Science and Arts Occupations by Sex
Within the Management, Business, Science and Arts occupations in Plano, the most male-oriented occupations are Architecture & Engineering (100.0%), Health Technologists (100.0%), and Health Diagnosing & Treating (82.1%), while the most female-oriented occupations are Community & Social Service (100.0%), Education, Arts & Media (100.0%), and Education Instruction & Library (100.0%).
| Occupation | Male | Female |
| Management | 49 (38.3%) | 79 (61.7%) |
| Business & Financial | 0 (0.0%) | 0 (0.0%) |
| Computers, Engineering & Science | 41 (70.7%) | 17 (29.3%) |
| Computers & Mathematics | 0 (0.0%) | 0 (0.0%) |
| Architecture & Engineering | 27 (100.0%) | 0 (0.0%) |
| Life, Physical & Social Science | 14 (45.2%) | 17 (54.8%) |
| Community & Social Service | 0 (0.0%) | 88 (100.0%) |
| Education, Arts & Media | 0 (0.0%) | 21 (100.0%) |
| Legal Services & Support | 0 (0.0%) | 0 (0.0%) |
| Education Instruction & Library | 0 (0.0%) | 67 (100.0%) |
| Arts, Media & Entertainment | 0 (0.0%) | 0 (0.0%) |
| Health Diagnosing & Treating | 92 (82.1%) | 20 (17.9%) |
| Health Technologists | 73 (100.0%) | 0 (0.0%) |
| Total (Category) | 182 (47.1%) | 204 (52.8%) |
| Total (Overall) | 361 (52.4%) | 328 (47.6%) |
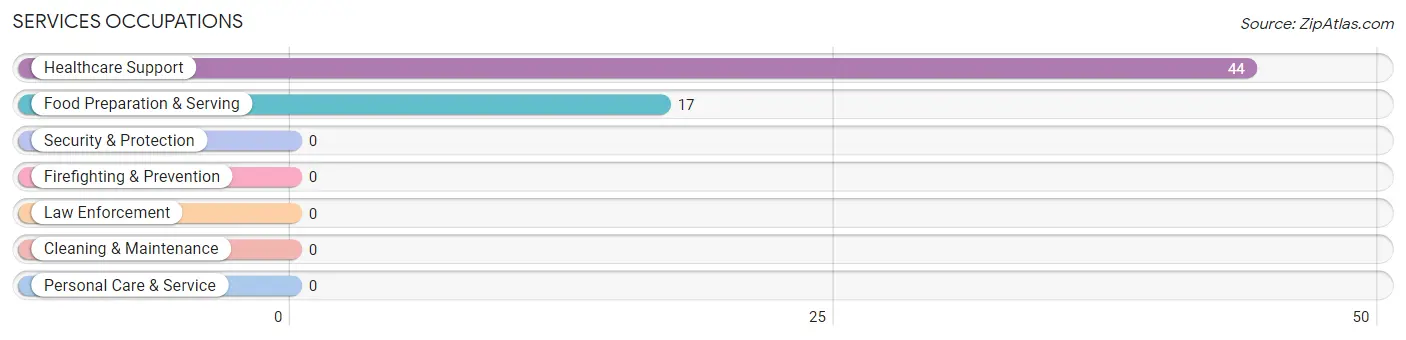
Services Occupations
The most common Services occupations in Plano are Healthcare Support (44 | 6.4%), and Food Preparation & Serving (17 | 2.5%).
Services Occupations by Sex
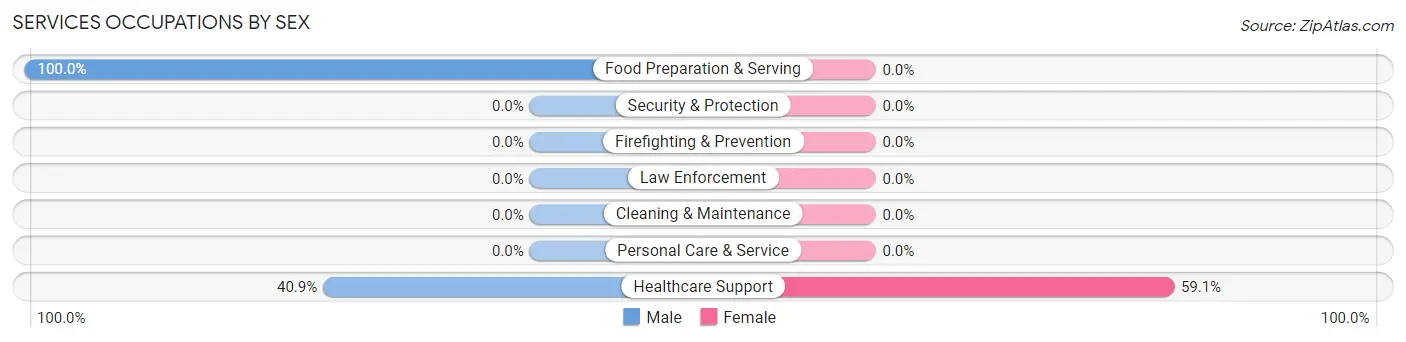
| Occupation | Male | Female |
| Healthcare Support | 18 (40.9%) | 26 (59.1%) |
| Security & Protection | 0 (0.0%) | 0 (0.0%) |
| Firefighting & Prevention | 0 (0.0%) | 0 (0.0%) |
| Law Enforcement | 0 (0.0%) | 0 (0.0%) |
| Food Preparation & Serving | 17 (100.0%) | 0 (0.0%) |
| Cleaning & Maintenance | 0 (0.0%) | 0 (0.0%) |
| Personal Care & Service | 0 (0.0%) | 0 (0.0%) |
| Total (Category) | 35 (57.4%) | 26 (42.6%) |
| Total (Overall) | 361 (52.4%) | 328 (47.6%) |
Sales and Office Occupations
The most common Sales and Office occupations in Plano are Sales & Related (73 | 10.6%), and Office & Administration (59 | 8.6%).

Sales and Office Occupations by Sex

| Occupation | Male | Female |
| Sales & Related | 34 (46.6%) | 39 (53.4%) |
| Office & Administration | 0 (0.0%) | 59 (100.0%) |
| Total (Category) | 34 (25.8%) | 98 (74.2%) |
| Total (Overall) | 361 (52.4%) | 328 (47.6%) |
Natural Resources, Construction and Maintenance Occupations
Natural Resources, Construction and Maintenance Occupations by Sex
| Occupation | Male | Female |
| Farming, Fishing & Forestry | 0 (0.0%) | 0 (0.0%) |
| Construction & Extraction | 0 (0.0%) | 0 (0.0%) |
| Installation, Maintenance & Repair | 0 (0.0%) | 0 (0.0%) |
| Total (Category) | 0 (0.0%) | 0 (0.0%) |
| Total (Overall) | 361 (52.4%) | 328 (47.6%) |
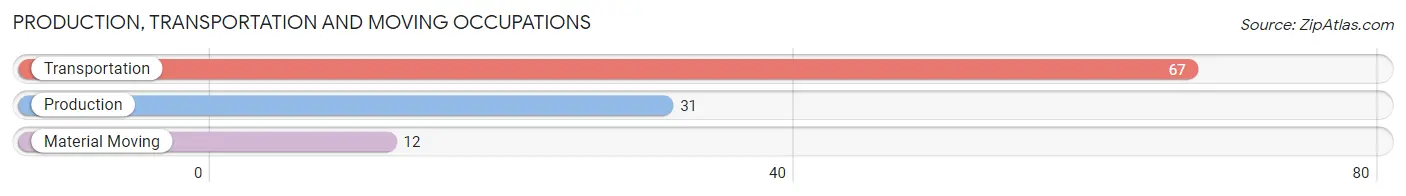
Production, Transportation and Moving Occupations
The most common Production, Transportation and Moving occupations in Plano are Transportation (67 | 9.7%), Production (31 | 4.5%), and Material Moving (12 | 1.7%).
Production, Transportation and Moving Occupations by Sex
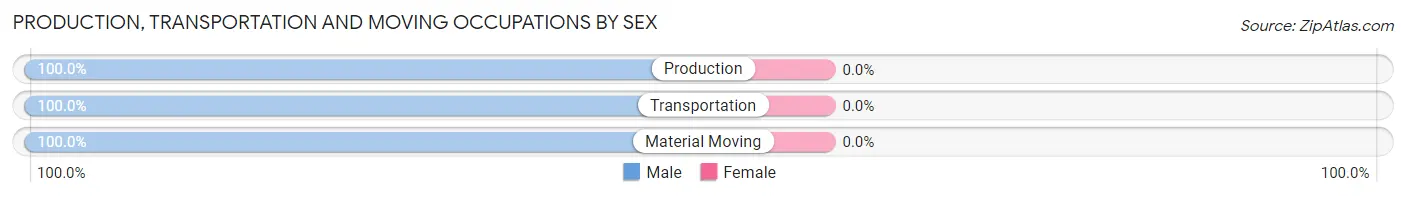
| Occupation | Male | Female |
| Production | 31 (100.0%) | 0 (0.0%) |
| Transportation | 67 (100.0%) | 0 (0.0%) |
| Material Moving | 12 (100.0%) | 0 (0.0%) |
| Total (Category) | 110 (100.0%) | 0 (0.0%) |
| Total (Overall) | 361 (52.4%) | 328 (47.6%) |
Employment Industries by Sex in Plano
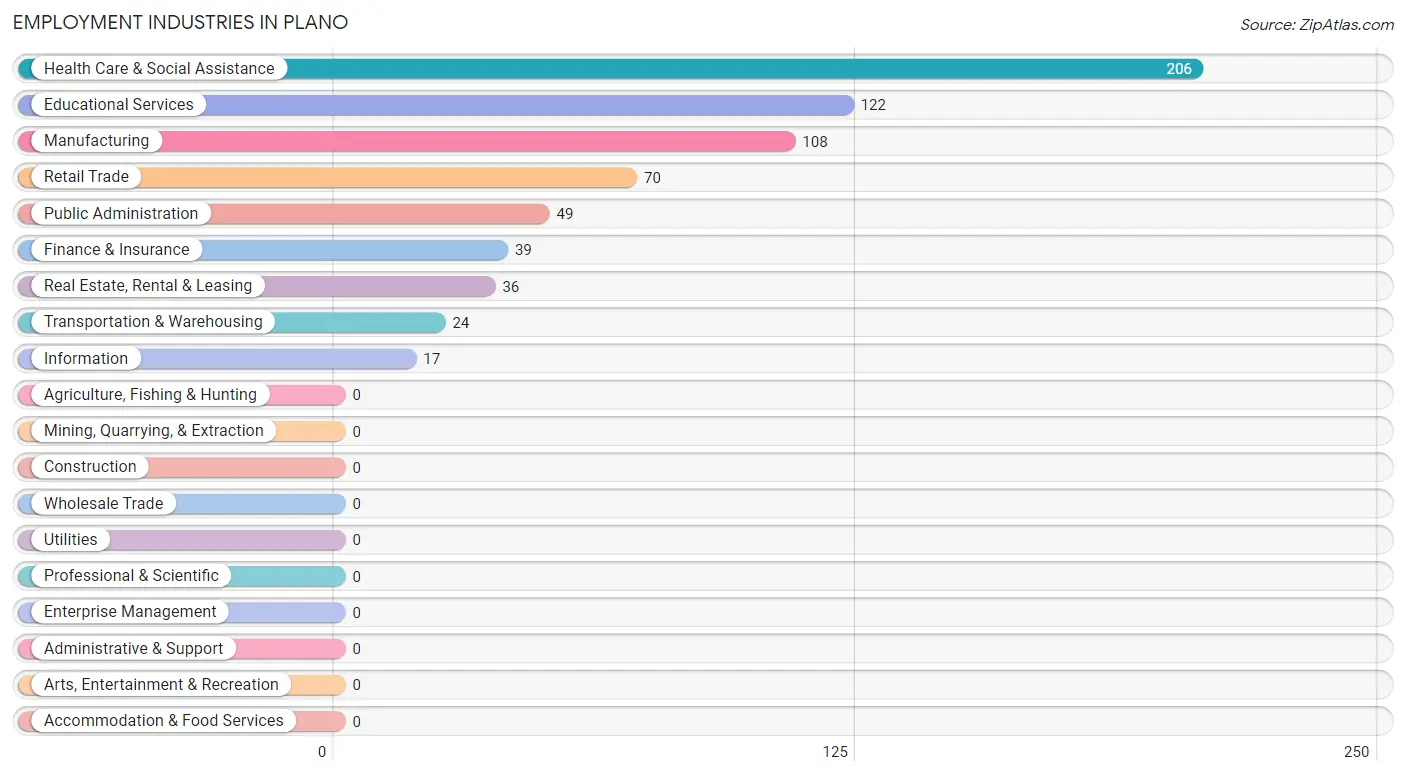
Employment Industries in Plano
The major employment industries in Plano include Health Care & Social Assistance (206 | 29.9%), Educational Services (122 | 17.7%), Manufacturing (108 | 15.7%), Retail Trade (70 | 10.2%), and Public Administration (49 | 7.1%).
Employment Industries by Sex in Plano
The Plano industries that see more men than women are Manufacturing (100.0%), Transportation & Warehousing (100.0%), and Public Administration (100.0%), whereas the industries that tend to have a higher number of women are Finance & Insurance (100.0%), Real Estate, Rental & Leasing (100.0%), and Health Care & Social Assistance (70.9%).
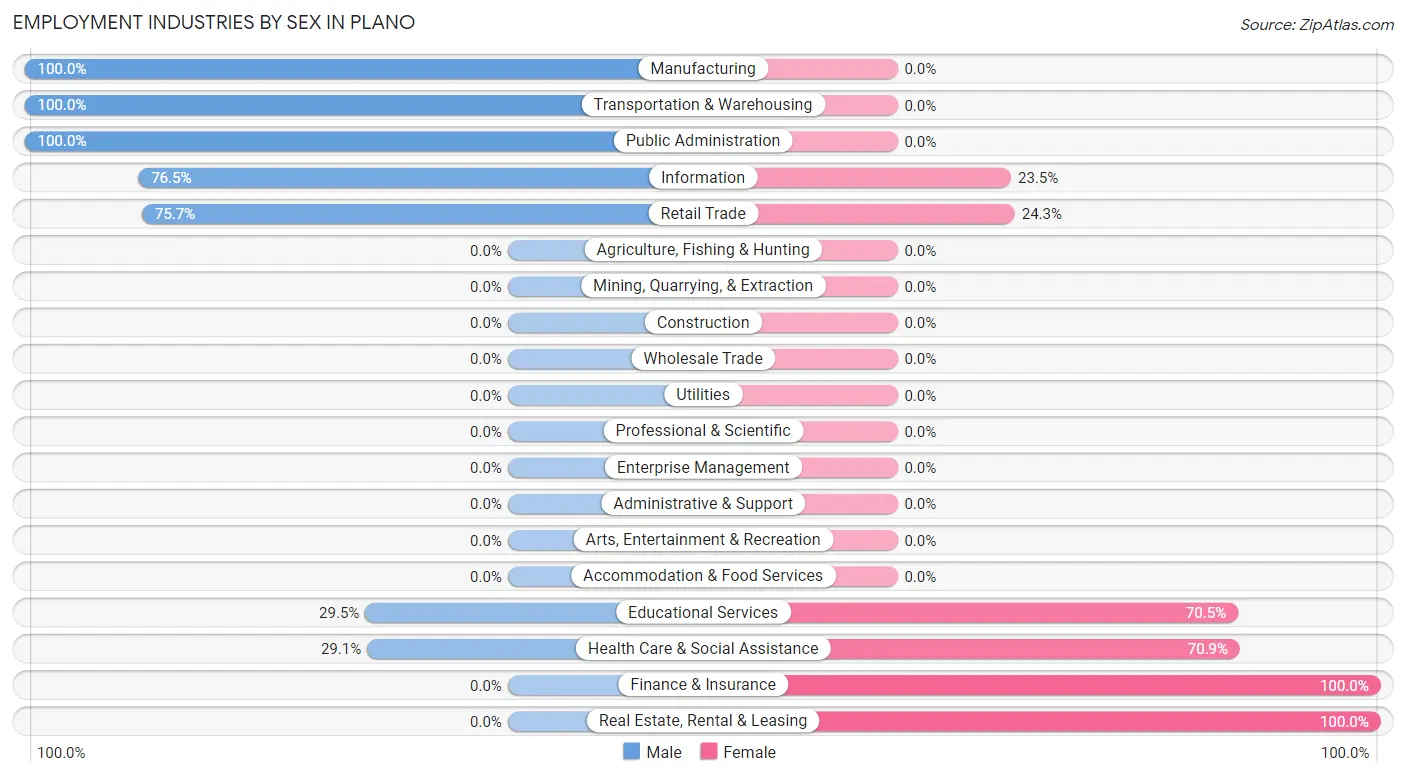
| Industry | Male | Female |
| Agriculture, Fishing & Hunting | 0 (0.0%) | 0 (0.0%) |
| Mining, Quarrying, & Extraction | 0 (0.0%) | 0 (0.0%) |
| Construction | 0 (0.0%) | 0 (0.0%) |
| Manufacturing | 108 (100.0%) | 0 (0.0%) |
| Wholesale Trade | 0 (0.0%) | 0 (0.0%) |
| Retail Trade | 53 (75.7%) | 17 (24.3%) |
| Transportation & Warehousing | 24 (100.0%) | 0 (0.0%) |
| Utilities | 0 (0.0%) | 0 (0.0%) |
| Information | 13 (76.5%) | 4 (23.5%) |
| Finance & Insurance | 0 (0.0%) | 39 (100.0%) |
| Real Estate, Rental & Leasing | 0 (0.0%) | 36 (100.0%) |
| Professional & Scientific | 0 (0.0%) | 0 (0.0%) |
| Enterprise Management | 0 (0.0%) | 0 (0.0%) |
| Administrative & Support | 0 (0.0%) | 0 (0.0%) |
| Educational Services | 36 (29.5%) | 86 (70.5%) |
| Health Care & Social Assistance | 60 (29.1%) | 146 (70.9%) |
| Arts, Entertainment & Recreation | 0 (0.0%) | 0 (0.0%) |
| Accommodation & Food Services | 0 (0.0%) | 0 (0.0%) |
| Public Administration | 49 (100.0%) | 0 (0.0%) |
| Total | 361 (52.4%) | 328 (47.6%) |
Education in Plano
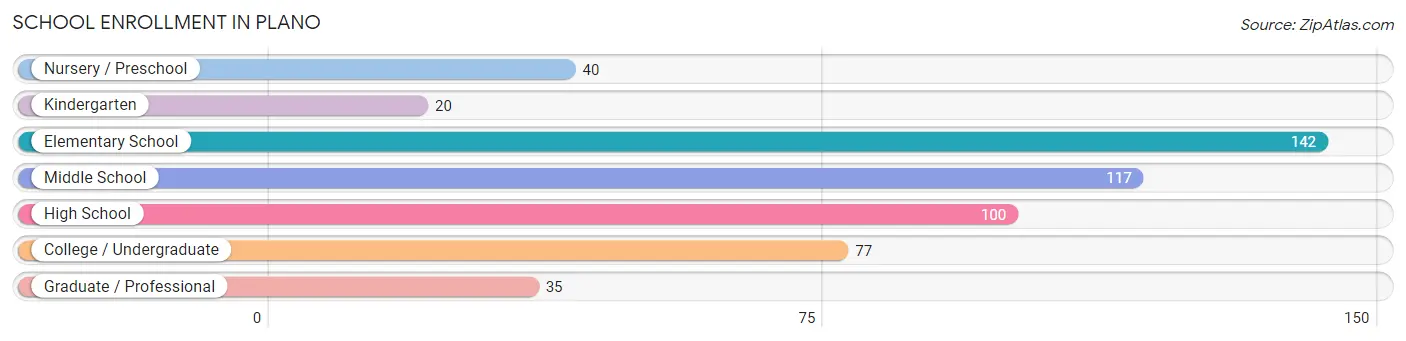
School Enrollment in Plano
The most common levels of schooling among the 531 students in Plano are elementary school (142 | 26.7%), middle school (117 | 22.0%), and high school (100 | 18.8%).
| School Level | # Students | % Students |
| Nursery / Preschool | 40 | 7.5% |
| Kindergarten | 20 | 3.8% |
| Elementary School | 142 | 26.7% |
| Middle School | 117 | 22.0% |
| High School | 100 | 18.8% |
| College / Undergraduate | 77 | 14.5% |
| Graduate / Professional | 35 | 6.6% |
| Total | 531 | 100.0% |
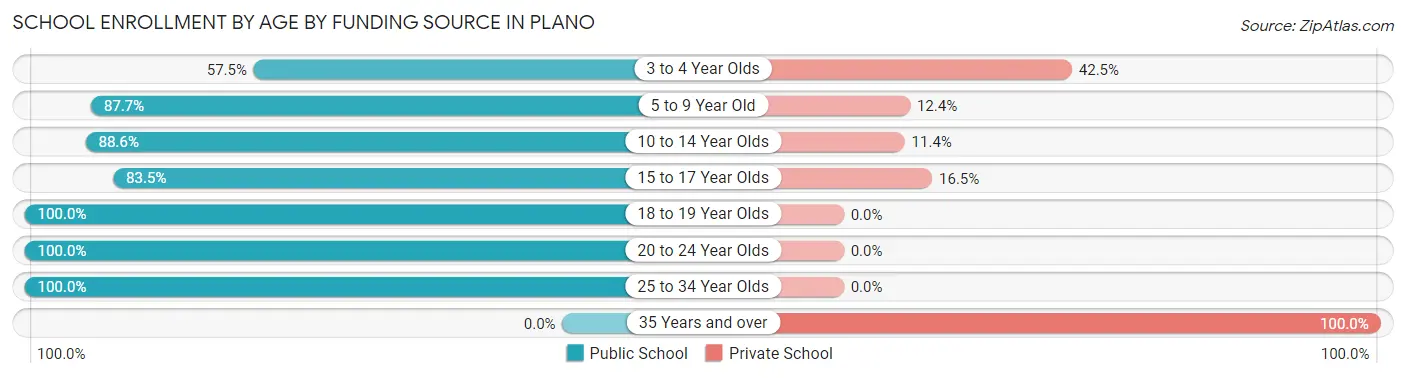
School Enrollment by Age by Funding Source in Plano
Out of a total of 531 students who are enrolled in schools in Plano, 80 (15.1%) attend a private institution, while the remaining 451 (84.9%) are enrolled in public schools. The age group of 35 years and over has the highest likelihood of being enrolled in private schools, with 14 (100.0% in the age bracket) enrolled. Conversely, the age group of 18 to 19 year olds has the lowest likelihood of being enrolled in a private school, with 38 (100.0% in the age bracket) attending a public institution.
| Age Bracket | Public School | Private School |
| 3 to 4 Year Olds | 23 (57.5%) | 17 (42.5%) |
| 5 to 9 Year Old | 142 (87.6%) | 20 (12.3%) |
| 10 to 14 Year Olds | 117 (88.6%) | 15 (11.4%) |
| 15 to 17 Year Olds | 71 (83.5%) | 14 (16.5%) |
| 18 to 19 Year Olds | 38 (100.0%) | 0 (0.0%) |
| 20 to 24 Year Olds | 39 (100.0%) | 0 (0.0%) |
| 25 to 34 Year Olds | 21 (100.0%) | 0 (0.0%) |
| 35 Years and over | 0 (0.0%) | 14 (100.0%) |
| Total | 451 (84.9%) | 80 (15.1%) |
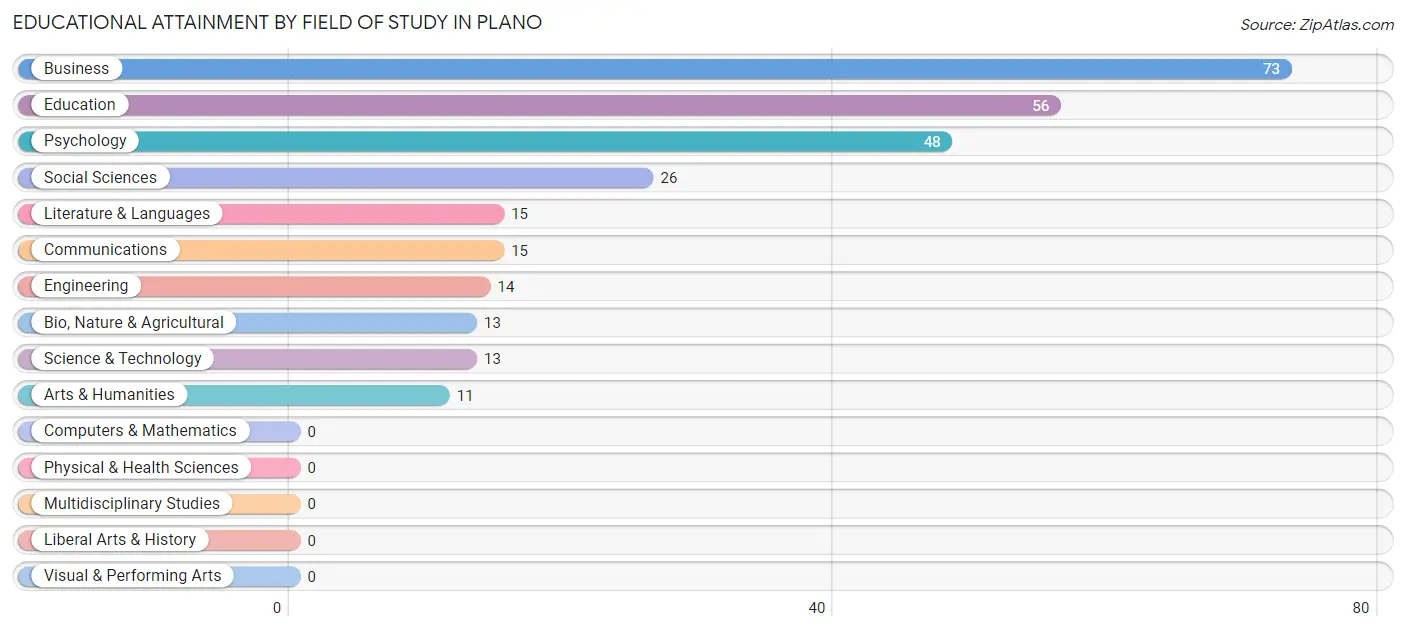
Educational Attainment by Field of Study in Plano
Business (73 | 25.7%), education (56 | 19.7%), psychology (48 | 16.9%), social sciences (26 | 9.1%), and literature & languages (15 | 5.3%) are the most common fields of study among 284 individuals in Plano who have obtained a bachelor's degree or higher.
| Field of Study | # Graduates | % Graduates |
| Computers & Mathematics | 0 | 0.0% |
| Bio, Nature & Agricultural | 13 | 4.6% |
| Physical & Health Sciences | 0 | 0.0% |
| Psychology | 48 | 16.9% |
| Social Sciences | 26 | 9.1% |
| Engineering | 14 | 4.9% |
| Multidisciplinary Studies | 0 | 0.0% |
| Science & Technology | 13 | 4.6% |
| Business | 73 | 25.7% |
| Education | 56 | 19.7% |
| Literature & Languages | 15 | 5.3% |
| Liberal Arts & History | 0 | 0.0% |
| Visual & Performing Arts | 0 | 0.0% |
| Communications | 15 | 5.3% |
| Arts & Humanities | 11 | 3.9% |
| Total | 284 | 100.0% |
Transportation & Commute in Plano
Vehicle Availability by Sex in Plano
The most prevalent vehicle ownership categories in Plano are males with 2 vehicles (218, accounting for 60.4%) and females with 2 vehicles (137, making up 66.5%).
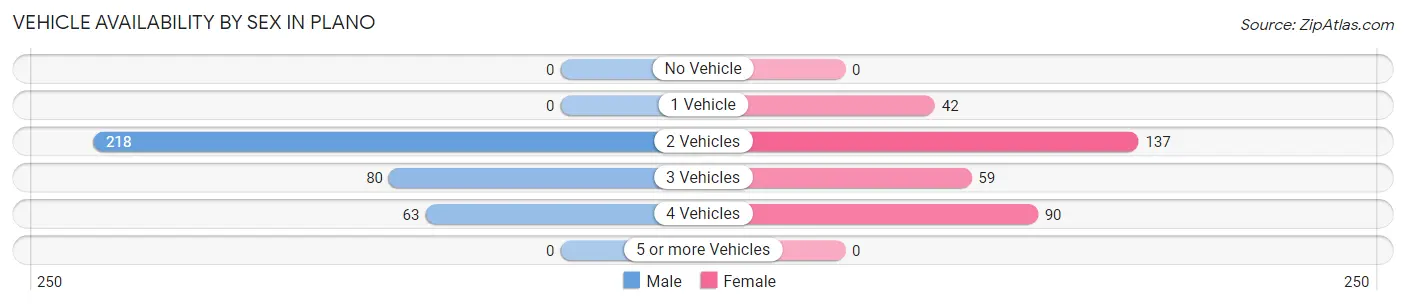
| Vehicles Available | Male | Female |
| No Vehicle | 0 (0.0%) | 0 (0.0%) |
| 1 Vehicle | 0 (0.0%) | 42 (12.8%) |
| 2 Vehicles | 218 (60.4%) | 137 (41.8%) |
| 3 Vehicles | 80 (22.2%) | 59 (18.0%) |
| 4 Vehicles | 63 (17.4%) | 90 (27.4%) |
| 5 or more Vehicles | 0 (0.0%) | 0 (0.0%) |
| Total | 361 (100.0%) | 328 (100.0%) |
Commute Time in Plano
The most frequently occuring commute durations in Plano are 15 to 19 minutes (295 commuters, 43.6%), 20 to 24 minutes (212 commuters, 31.4%), and 45 to 59 minutes (106 commuters, 15.7%).
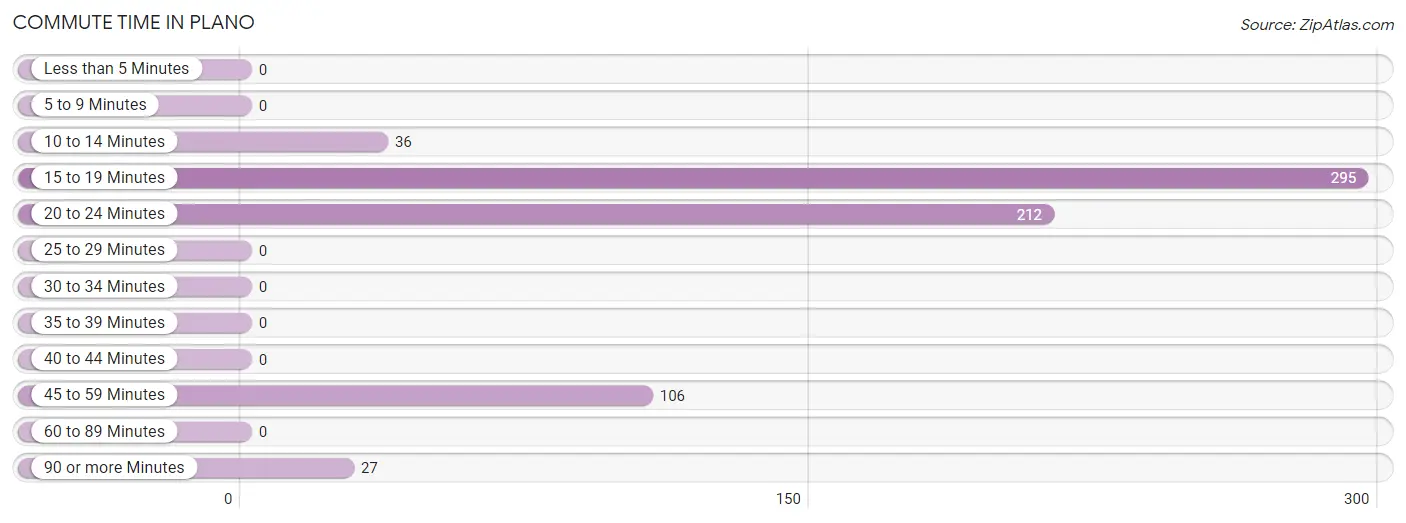
| Commute Time | # Commuters | % Commuters |
| Less than 5 Minutes | 0 | 0.0% |
| 5 to 9 Minutes | 0 | 0.0% |
| 10 to 14 Minutes | 36 | 5.3% |
| 15 to 19 Minutes | 295 | 43.6% |
| 20 to 24 Minutes | 212 | 31.4% |
| 25 to 29 Minutes | 0 | 0.0% |
| 30 to 34 Minutes | 0 | 0.0% |
| 35 to 39 Minutes | 0 | 0.0% |
| 40 to 44 Minutes | 0 | 0.0% |
| 45 to 59 Minutes | 106 | 15.7% |
| 60 to 89 Minutes | 0 | 0.0% |
| 90 or more Minutes | 27 | 4.0% |
Commute Time by Sex in Plano
The most common commute times in Plano are 15 to 19 minutes (133 commuters, 38.2%) for males and 15 to 19 minutes (162 commuters, 49.4%) for females.
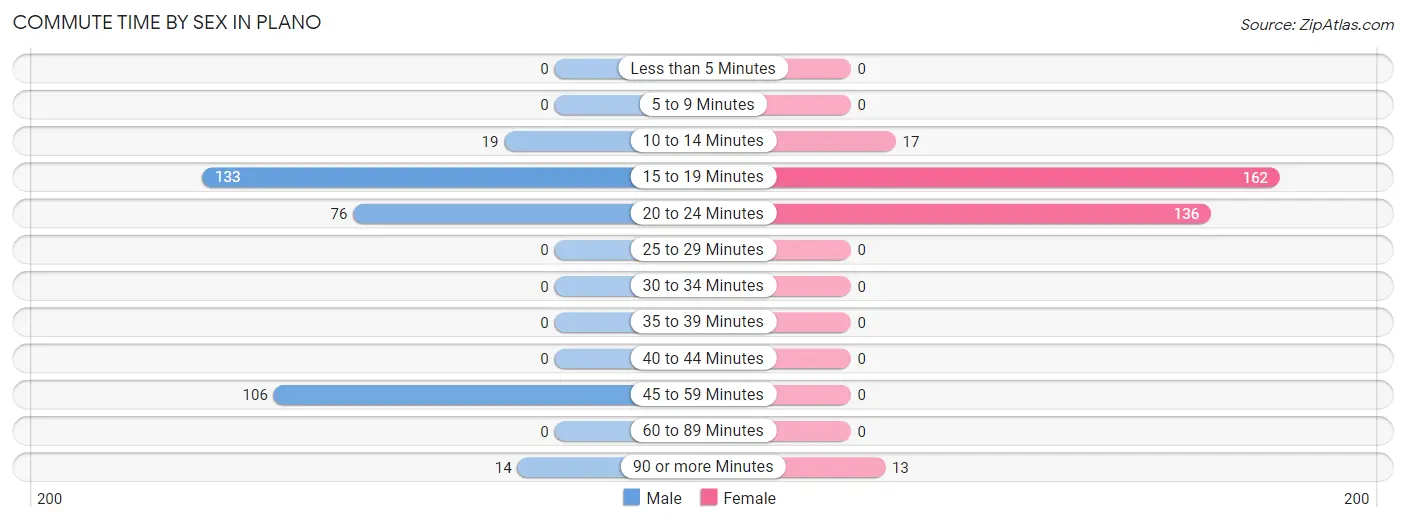
| Commute Time | Male | Female |
| Less than 5 Minutes | 0 (0.0%) | 0 (0.0%) |
| 5 to 9 Minutes | 0 (0.0%) | 0 (0.0%) |
| 10 to 14 Minutes | 19 (5.5%) | 17 (5.2%) |
| 15 to 19 Minutes | 133 (38.2%) | 162 (49.4%) |
| 20 to 24 Minutes | 76 (21.8%) | 136 (41.5%) |
| 25 to 29 Minutes | 0 (0.0%) | 0 (0.0%) |
| 30 to 34 Minutes | 0 (0.0%) | 0 (0.0%) |
| 35 to 39 Minutes | 0 (0.0%) | 0 (0.0%) |
| 40 to 44 Minutes | 0 (0.0%) | 0 (0.0%) |
| 45 to 59 Minutes | 106 (30.5%) | 0 (0.0%) |
| 60 to 89 Minutes | 0 (0.0%) | 0 (0.0%) |
| 90 or more Minutes | 14 (4.0%) | 13 (4.0%) |
Time of Departure to Work by Sex in Plano
The most frequent times of departure to work in Plano are 5:30 AM to 5:59 AM (71, 20.4%) for males and 6:30 AM to 6:59 AM (118, 36.0%) for females.
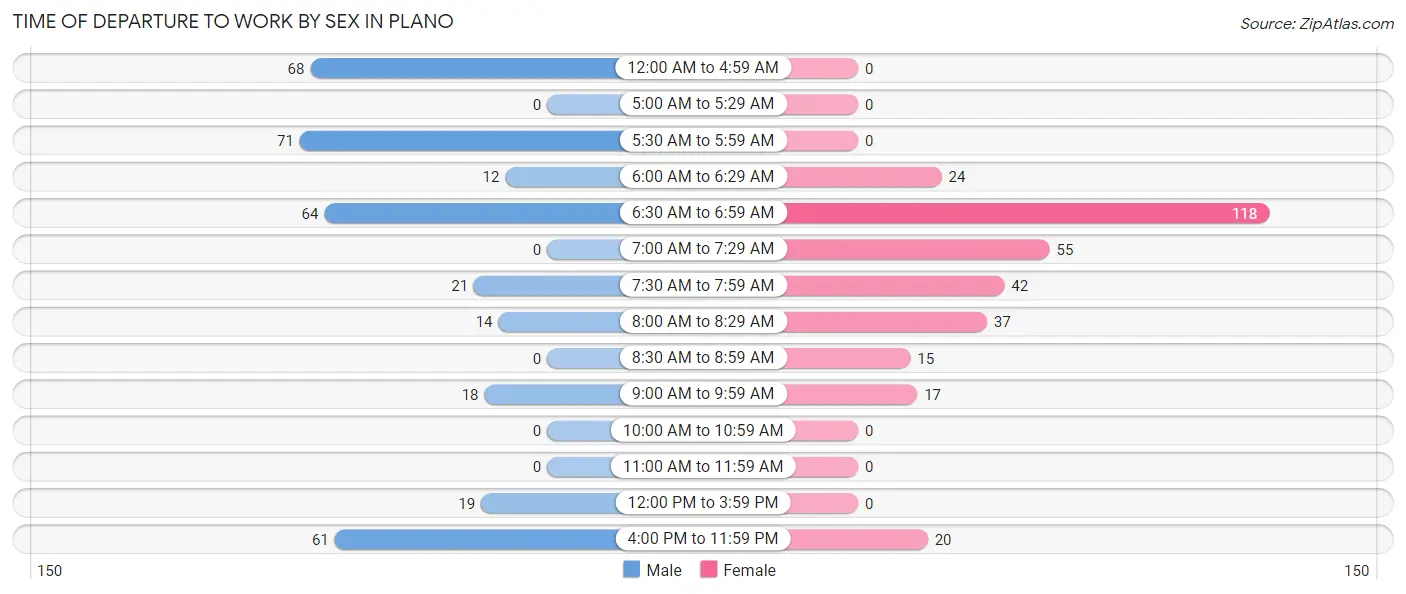
| Time of Departure | Male | Female |
| 12:00 AM to 4:59 AM | 68 (19.5%) | 0 (0.0%) |
| 5:00 AM to 5:29 AM | 0 (0.0%) | 0 (0.0%) |
| 5:30 AM to 5:59 AM | 71 (20.4%) | 0 (0.0%) |
| 6:00 AM to 6:29 AM | 12 (3.5%) | 24 (7.3%) |
| 6:30 AM to 6:59 AM | 64 (18.4%) | 118 (36.0%) |
| 7:00 AM to 7:29 AM | 0 (0.0%) | 55 (16.8%) |
| 7:30 AM to 7:59 AM | 21 (6.0%) | 42 (12.8%) |
| 8:00 AM to 8:29 AM | 14 (4.0%) | 37 (11.3%) |
| 8:30 AM to 8:59 AM | 0 (0.0%) | 15 (4.6%) |
| 9:00 AM to 9:59 AM | 18 (5.2%) | 17 (5.2%) |
| 10:00 AM to 10:59 AM | 0 (0.0%) | 0 (0.0%) |
| 11:00 AM to 11:59 AM | 0 (0.0%) | 0 (0.0%) |
| 12:00 PM to 3:59 PM | 19 (5.5%) | 0 (0.0%) |
| 4:00 PM to 11:59 PM | 61 (17.5%) | 20 (6.1%) |
| Total | 348 (100.0%) | 328 (100.0%) |
Housing Occupancy in Plano
Occupancy by Ownership in Plano
Of the total 393 dwellings in Plano, owner-occupied units account for 393 (100.0%), while renter-occupied units make up 0 (0.0%).
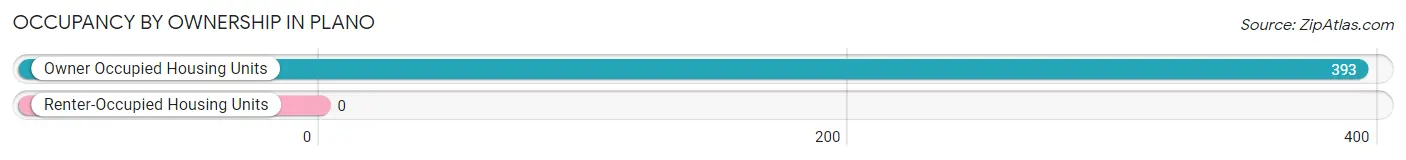
| Occupancy | # Housing Units | % Housing Units |
| Owner Occupied Housing Units | 393 | 100.0% |
| Renter-Occupied Housing Units | 0 | 0.0% |
| Total Occupied Housing Units | 393 | 100.0% |
Occupancy by Household Size in Plano
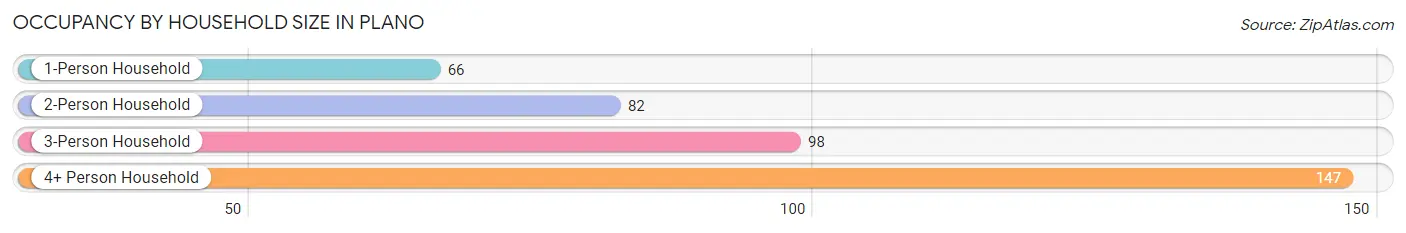
| Household Size | # Housing Units | % Housing Units |
| 1-Person Household | 66 | 16.8% |
| 2-Person Household | 82 | 20.9% |
| 3-Person Household | 98 | 24.9% |
| 4+ Person Household | 147 | 37.4% |
| Total Housing Units | 393 | 100.0% |
Occupancy by Ownership by Household Size in Plano
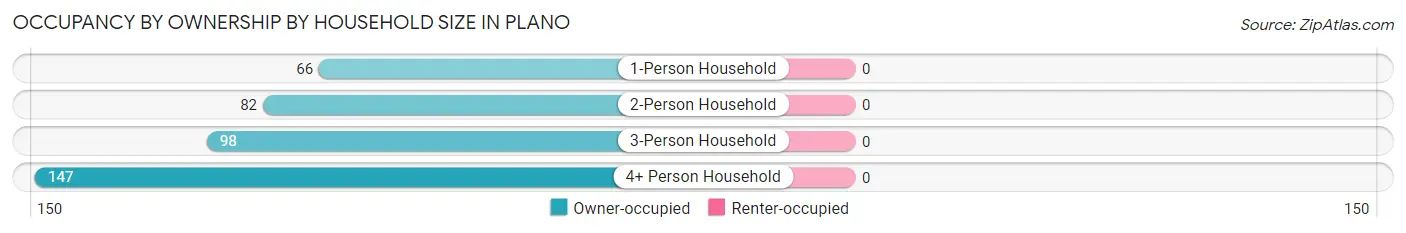
| Household Size | Owner-occupied | Renter-occupied |
| 1-Person Household | 66 (100.0%) | 0 (0.0%) |
| 2-Person Household | 82 (100.0%) | 0 (0.0%) |
| 3-Person Household | 98 (100.0%) | 0 (0.0%) |
| 4+ Person Household | 147 (100.0%) | 0 (0.0%) |
| Total Housing Units | 393 (100.0%) | 0 (0.0%) |
Occupancy by Educational Attainment in Plano
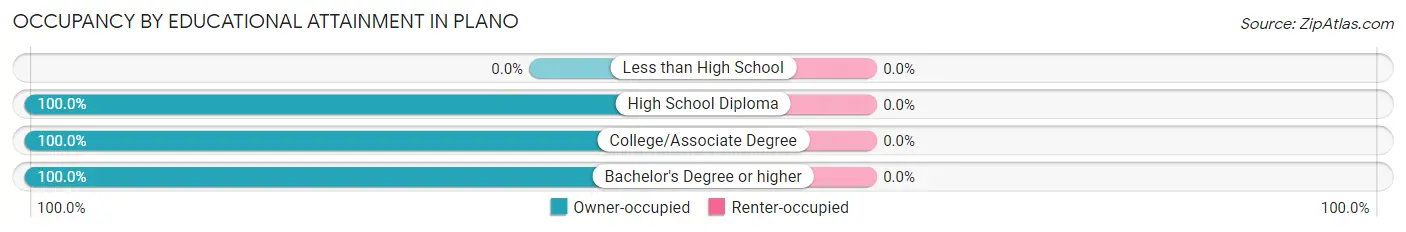
| Household Size | Owner-occupied | Renter-occupied |
| Less than High School | 0 (0.0%) | 0 (0.0%) |
| High School Diploma | 103 (100.0%) | 0 (0.0%) |
| College/Associate Degree | 173 (100.0%) | 0 (0.0%) |
| Bachelor's Degree or higher | 117 (100.0%) | 0 (0.0%) |
Occupancy by Age of Householder in Plano
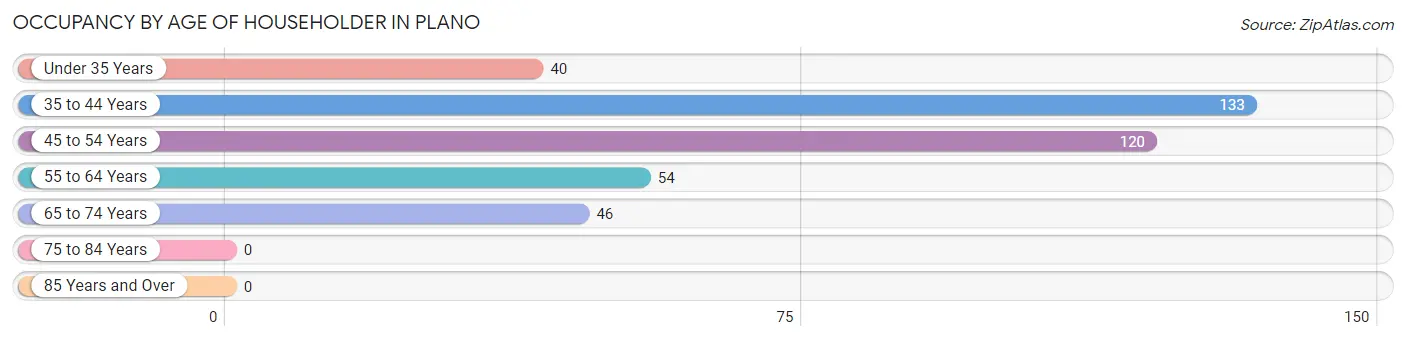
| Age Bracket | # Households | % Households |
| Under 35 Years | 40 | 10.2% |
| 35 to 44 Years | 133 | 33.8% |
| 45 to 54 Years | 120 | 30.5% |
| 55 to 64 Years | 54 | 13.7% |
| 65 to 74 Years | 46 | 11.7% |
| 75 to 84 Years | 0 | 0.0% |
| 85 Years and Over | 0 | 0.0% |
| Total | 393 | 100.0% |
Housing Finances in Plano
Median Income by Occupancy in Plano
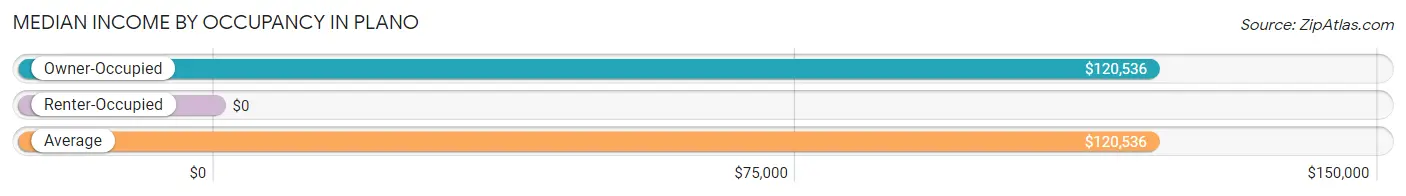
| Occupancy Type | # Households | Median Income |
| Owner-Occupied | 393 (100.0%) | $120,536 |
| Renter-Occupied | 0 (0.0%) | $0 |
| Average | 393 (100.0%) | $120,536 |
Occupancy by Householder Income Bracket in Plano
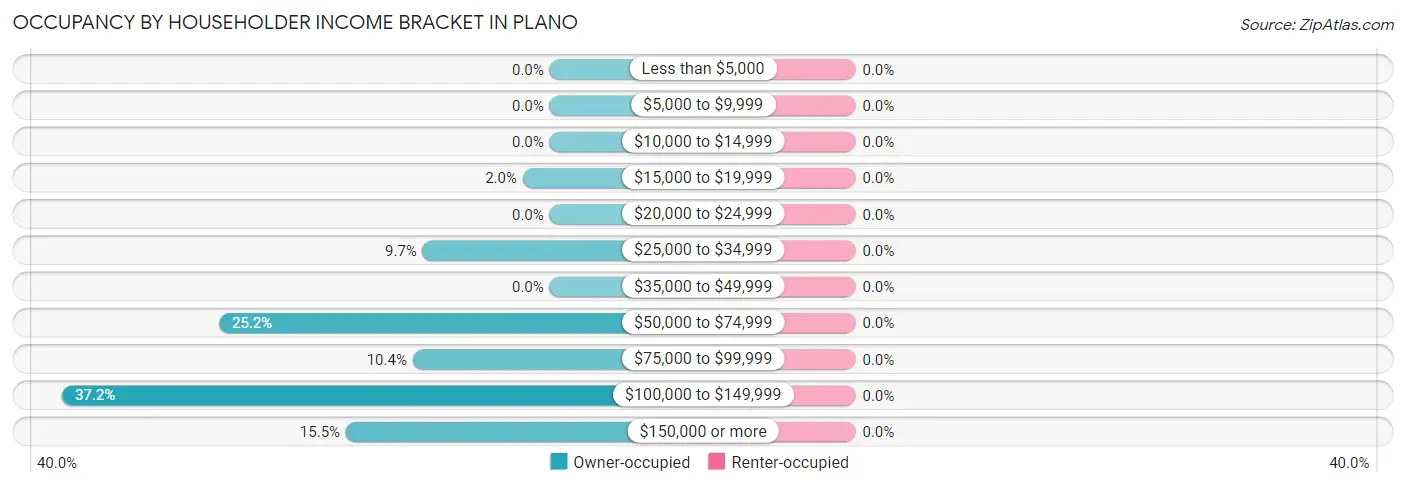
| Income Bracket | Owner-occupied | Renter-occupied |
| Less than $5,000 | 0 (0.0%) | 0 (0.0%) |
| $5,000 to $9,999 | 0 (0.0%) | 0 (0.0%) |
| $10,000 to $14,999 | 0 (0.0%) | 0 (0.0%) |
| $15,000 to $19,999 | 8 (2.0%) | 0 (0.0%) |
| $20,000 to $24,999 | 0 (0.0%) | 0 (0.0%) |
| $25,000 to $34,999 | 38 (9.7%) | 0 (0.0%) |
| $35,000 to $49,999 | 0 (0.0%) | 0 (0.0%) |
| $50,000 to $74,999 | 99 (25.2%) | 0 (0.0%) |
| $75,000 to $99,999 | 41 (10.4%) | 0 (0.0%) |
| $100,000 to $149,999 | 146 (37.1%) | 0 (0.0%) |
| $150,000 or more | 61 (15.5%) | 0 (0.0%) |
| Total | 393 (100.0%) | 0 (0.0%) |
Monthly Housing Cost Tiers in Plano
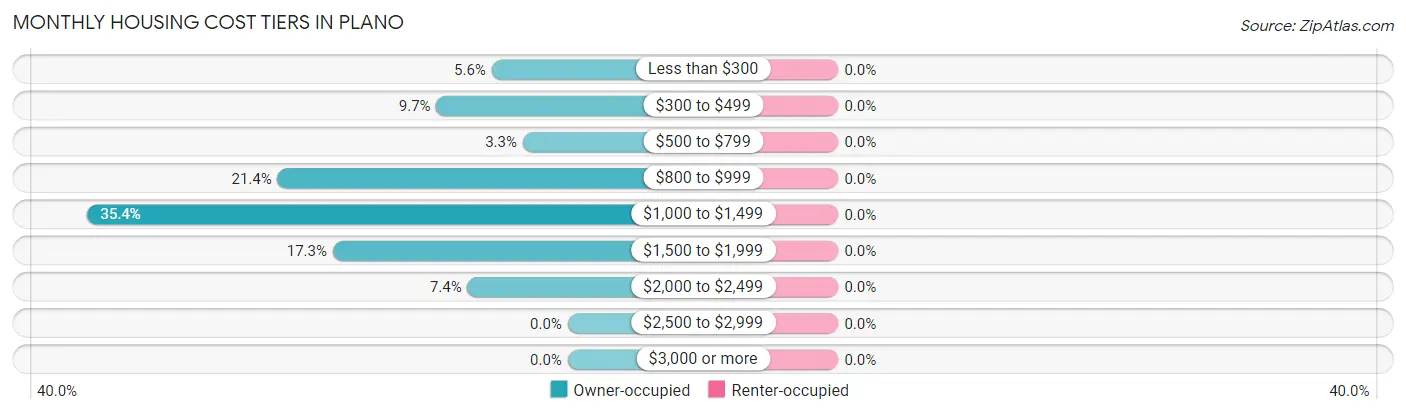
| Monthly Cost | Owner-occupied | Renter-occupied |
| Less than $300 | 22 (5.6%) | 0 (0.0%) |
| $300 to $499 | 38 (9.7%) | 0 (0.0%) |
| $500 to $799 | 13 (3.3%) | 0 (0.0%) |
| $800 to $999 | 84 (21.4%) | 0 (0.0%) |
| $1,000 to $1,499 | 139 (35.4%) | 0 (0.0%) |
| $1,500 to $1,999 | 68 (17.3%) | 0 (0.0%) |
| $2,000 to $2,499 | 29 (7.4%) | 0 (0.0%) |
| $2,500 to $2,999 | 0 (0.0%) | 0 (0.0%) |
| $3,000 or more | 0 (0.0%) | 0 (0.0%) |
| Total | 393 (100.0%) | 0 (0.0%) |
Physical Housing Characteristics in Plano
Housing Structures in Plano
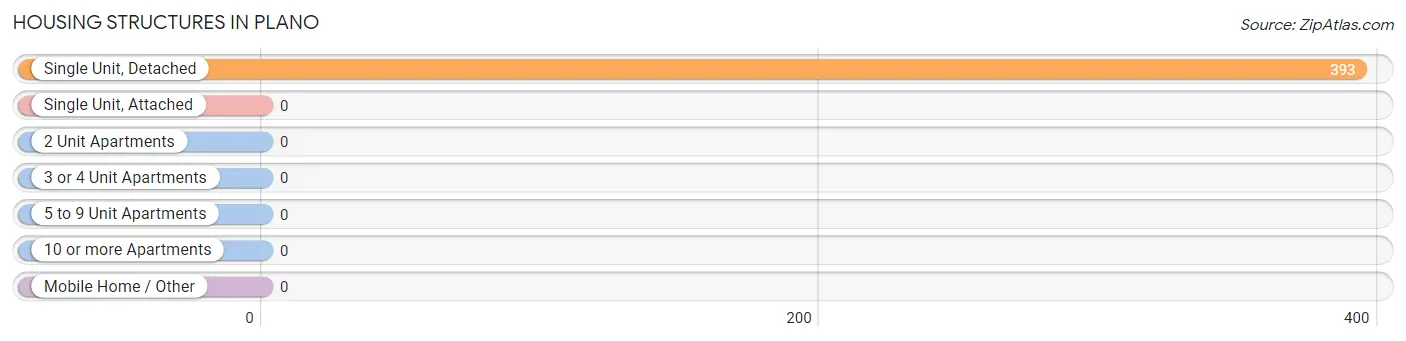
| Structure Type | # Housing Units | % Housing Units |
| Single Unit, Detached | 393 | 100.0% |
| Single Unit, Attached | 0 | 0.0% |
| 2 Unit Apartments | 0 | 0.0% |
| 3 or 4 Unit Apartments | 0 | 0.0% |
| 5 to 9 Unit Apartments | 0 | 0.0% |
| 10 or more Apartments | 0 | 0.0% |
| Mobile Home / Other | 0 | 0.0% |
| Total | 393 | 100.0% |
Housing Structures by Occupancy in Plano
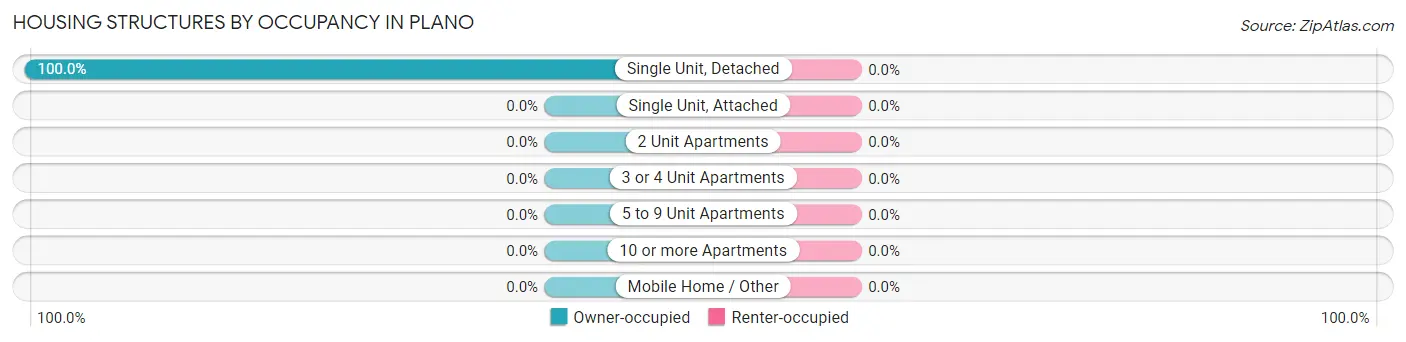
| Structure Type | Owner-occupied | Renter-occupied |
| Single Unit, Detached | 393 (100.0%) | 0 (0.0%) |
| Single Unit, Attached | 0 (0.0%) | 0 (0.0%) |
| 2 Unit Apartments | 0 (0.0%) | 0 (0.0%) |
| 3 or 4 Unit Apartments | 0 (0.0%) | 0 (0.0%) |
| 5 to 9 Unit Apartments | 0 (0.0%) | 0 (0.0%) |
| 10 or more Apartments | 0 (0.0%) | 0 (0.0%) |
| Mobile Home / Other | 0 (0.0%) | 0 (0.0%) |
| Total | 393 (100.0%) | 0 (0.0%) |
Housing Structures by Number of Rooms in Plano
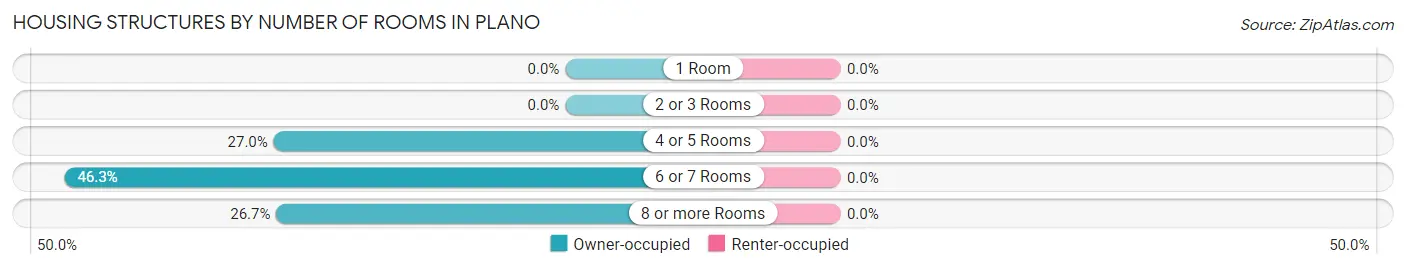
| Number of Rooms | Owner-occupied | Renter-occupied |
| 1 Room | 0 (0.0%) | 0 (0.0%) |
| 2 or 3 Rooms | 0 (0.0%) | 0 (0.0%) |
| 4 or 5 Rooms | 106 (27.0%) | 0 (0.0%) |
| 6 or 7 Rooms | 182 (46.3%) | 0 (0.0%) |
| 8 or more Rooms | 105 (26.7%) | 0 (0.0%) |
| Total | 393 (100.0%) | 0 (0.0%) |
Housing Structure by Heating Type in Plano
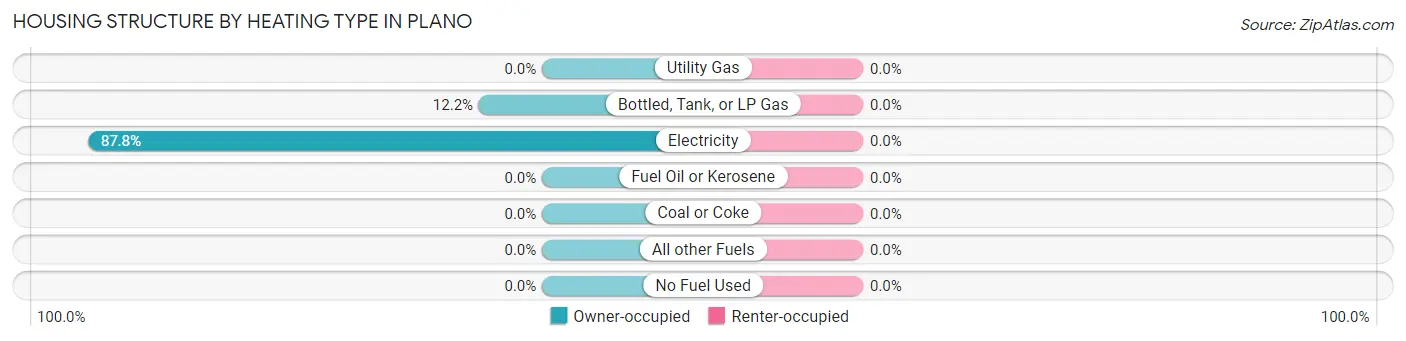
| Heating Type | Owner-occupied | Renter-occupied |
| Utility Gas | 0 (0.0%) | 0 (0.0%) |
| Bottled, Tank, or LP Gas | 48 (12.2%) | 0 (0.0%) |
| Electricity | 345 (87.8%) | 0 (0.0%) |
| Fuel Oil or Kerosene | 0 (0.0%) | 0 (0.0%) |
| Coal or Coke | 0 (0.0%) | 0 (0.0%) |
| All other Fuels | 0 (0.0%) | 0 (0.0%) |
| No Fuel Used | 0 (0.0%) | 0 (0.0%) |
| Total | 393 (100.0%) | 0 (0.0%) |
Household Vehicle Usage in Plano
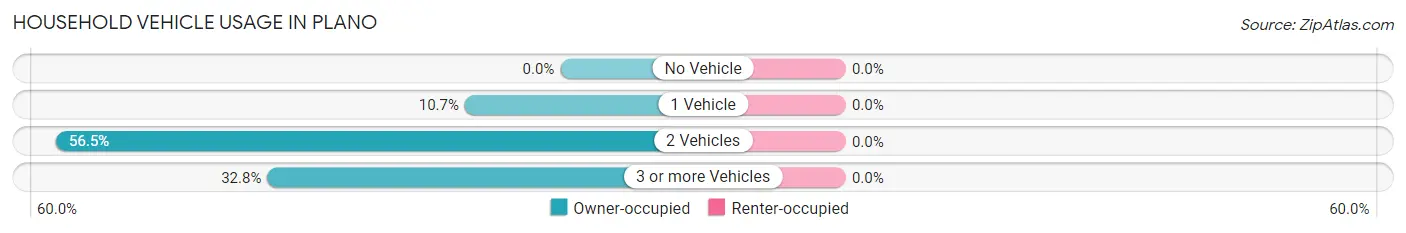
| Vehicles per Household | Owner-occupied | Renter-occupied |
| No Vehicle | 0 (0.0%) | 0 (0.0%) |
| 1 Vehicle | 42 (10.7%) | 0 (0.0%) |
| 2 Vehicles | 222 (56.5%) | 0 (0.0%) |
| 3 or more Vehicles | 129 (32.8%) | 0 (0.0%) |
| Total | 393 (100.0%) | 0 (0.0%) |
Real Estate & Mortgages in Plano
Real Estate and Mortgage Overview in Plano
| Characteristic | Without Mortgage | With Mortgage |
| Housing Units | 60 | 333 |
| Median Property Value | $134,500 | $260,300 |
| Median Household Income | $31,548 | $61 |
| Monthly Housing Costs | $361 | $0 |
| Real Estate Taxes | $1,105 | $0 |
Property Value by Mortgage Status in Plano
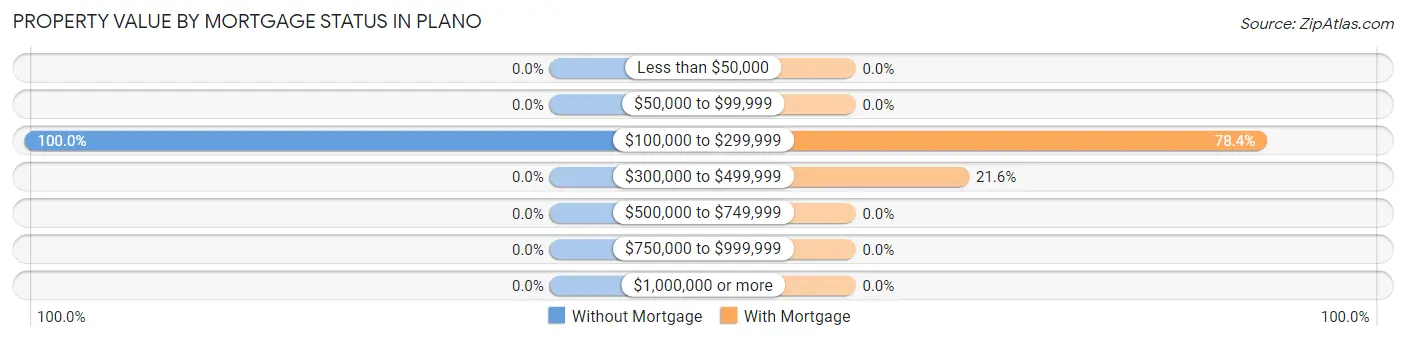
| Property Value | Without Mortgage | With Mortgage |
| Less than $50,000 | 0 (0.0%) | 0 (0.0%) |
| $50,000 to $99,999 | 0 (0.0%) | 0 (0.0%) |
| $100,000 to $299,999 | 60 (100.0%) | 261 (78.4%) |
| $300,000 to $499,999 | 0 (0.0%) | 72 (21.6%) |
| $500,000 to $749,999 | 0 (0.0%) | 0 (0.0%) |
| $750,000 to $999,999 | 0 (0.0%) | 0 (0.0%) |
| $1,000,000 or more | 0 (0.0%) | 0 (0.0%) |
| Total | 60 (100.0%) | 333 (100.0%) |
Household Income by Mortgage Status in Plano
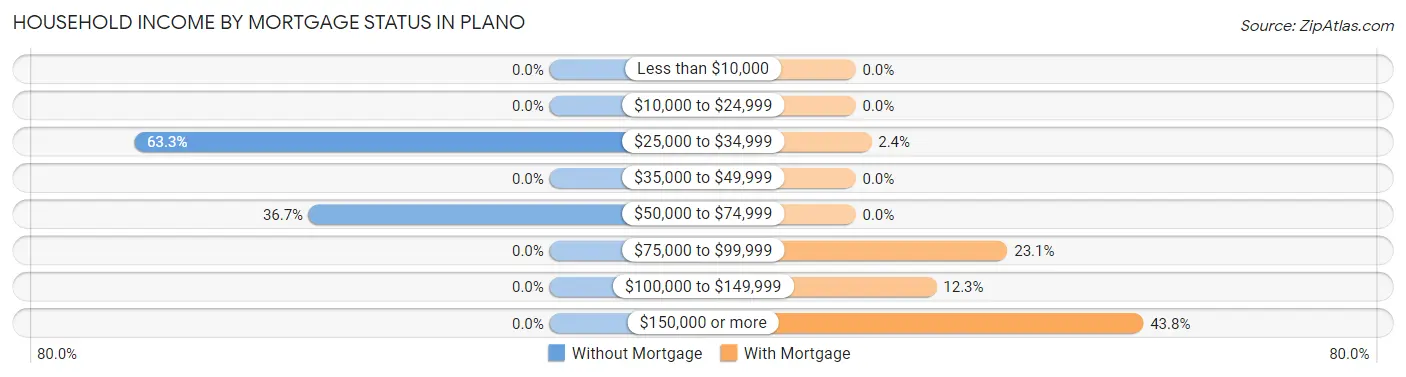
| Household Income | Without Mortgage | With Mortgage |
| Less than $10,000 | 0 (0.0%) | 0 (0.0%) |
| $10,000 to $24,999 | 0 (0.0%) | 0 (0.0%) |
| $25,000 to $34,999 | 38 (63.3%) | 8 (2.4%) |
| $35,000 to $49,999 | 0 (0.0%) | 0 (0.0%) |
| $50,000 to $74,999 | 22 (36.7%) | 0 (0.0%) |
| $75,000 to $99,999 | 0 (0.0%) | 77 (23.1%) |
| $100,000 to $149,999 | 0 (0.0%) | 41 (12.3%) |
| $150,000 or more | 0 (0.0%) | 146 (43.8%) |
| Total | 60 (100.0%) | 333 (100.0%) |
Property Value to Household Income Ratio in Plano
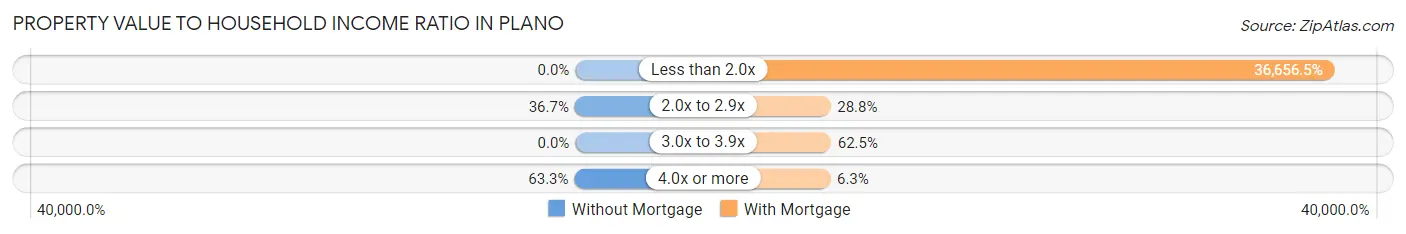
| Value-to-Income Ratio | Without Mortgage | With Mortgage |
| Less than 2.0x | 0 (0.0%) | 122,066 (36,656.5%) |
| 2.0x to 2.9x | 22 (36.7%) | 96 (28.8%) |
| 3.0x to 3.9x | 0 (0.0%) | 208 (62.5%) |
| 4.0x or more | 38 (63.3%) | 21 (6.3%) |
| Total | 60 (100.0%) | 333 (100.0%) |
Real Estate Taxes by Mortgage Status in Plano
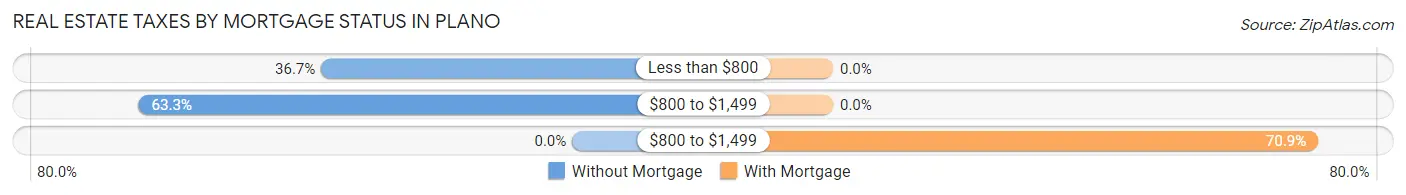
| Property Taxes | Without Mortgage | With Mortgage |
| Less than $800 | 22 (36.7%) | 0 (0.0%) |
| $800 to $1,499 | 38 (63.3%) | 0 (0.0%) |
| $800 to $1,499 | 0 (0.0%) | 236 (70.9%) |
| Total | 60 (100.0%) | 333 (100.0%) |
Health & Disability in Plano
Health Insurance Coverage by Age in Plano
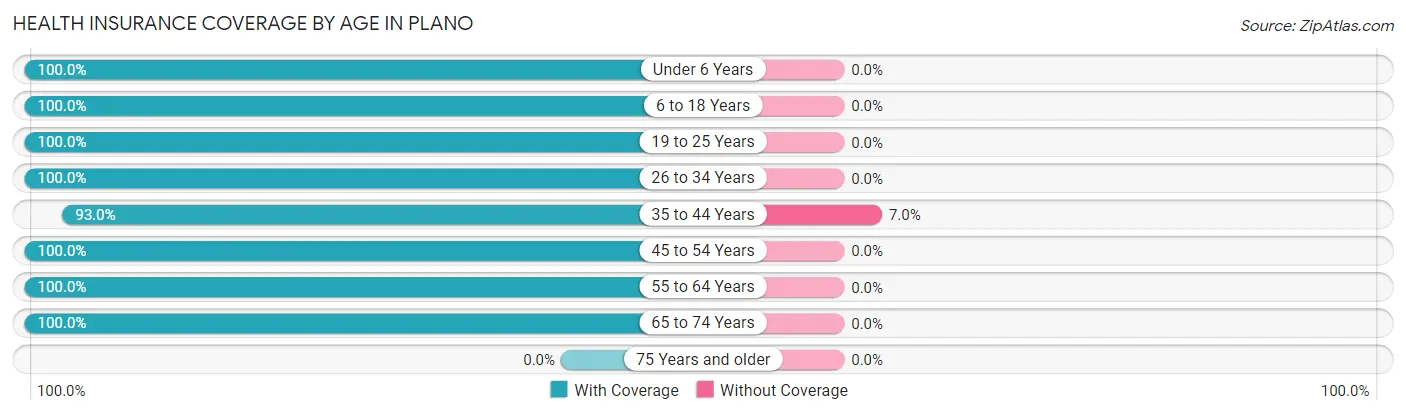
| Age Bracket | With Coverage | Without Coverage |
| Under 6 Years | 126 (100.0%) | 0 (0.0%) |
| 6 to 18 Years | 359 (100.0%) | 0 (0.0%) |
| 19 to 25 Years | 77 (100.0%) | 0 (0.0%) |
| 26 to 34 Years | 108 (100.0%) | 0 (0.0%) |
| 35 to 44 Years | 238 (93.0%) | 18 (7.0%) |
| 45 to 54 Years | 242 (100.0%) | 0 (0.0%) |
| 55 to 64 Years | 81 (100.0%) | 0 (0.0%) |
| 65 to 74 Years | 65 (100.0%) | 0 (0.0%) |
| 75 Years and older | 0 (0.0%) | 0 (0.0%) |
| Total | 1,296 (98.6%) | 18 (1.4%) |
Health Insurance Coverage by Citizenship Status in Plano
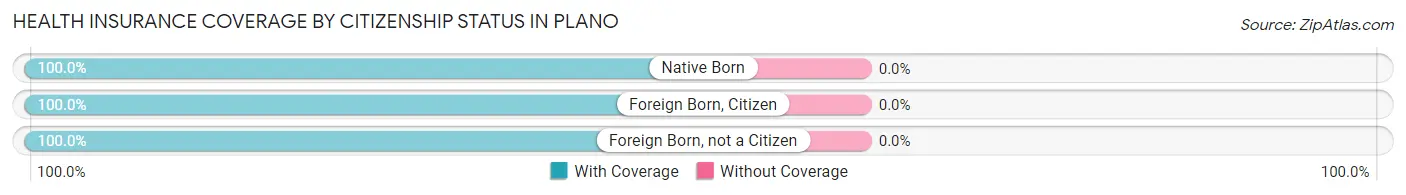
| Citizenship Status | With Coverage | Without Coverage |
| Native Born | 126 (100.0%) | 0 (0.0%) |
| Foreign Born, Citizen | 359 (100.0%) | 0 (0.0%) |
| Foreign Born, not a Citizen | 77 (100.0%) | 0 (0.0%) |
Health Insurance Coverage by Household Income in Plano
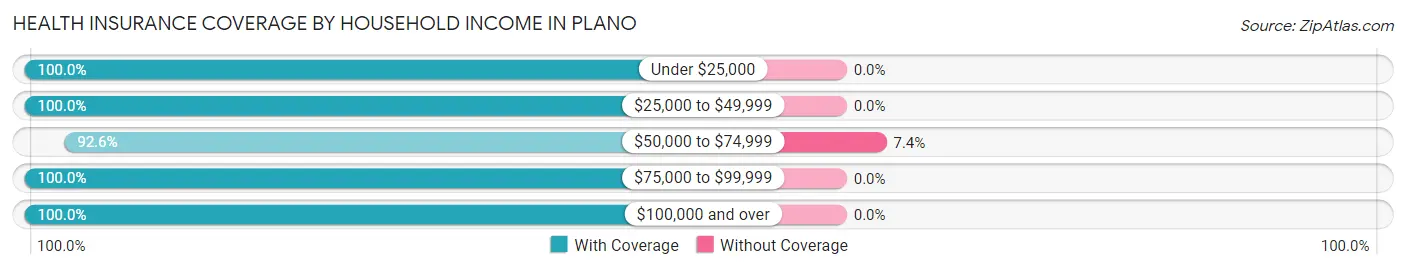
| Household Income | With Coverage | Without Coverage |
| Under $25,000 | 38 (100.0%) | 0 (0.0%) |
| $25,000 to $49,999 | 94 (100.0%) | 0 (0.0%) |
| $50,000 to $74,999 | 224 (92.6%) | 18 (7.4%) |
| $75,000 to $99,999 | 141 (100.0%) | 0 (0.0%) |
| $100,000 and over | 799 (100.0%) | 0 (0.0%) |
Public vs Private Health Insurance Coverage by Age in Plano
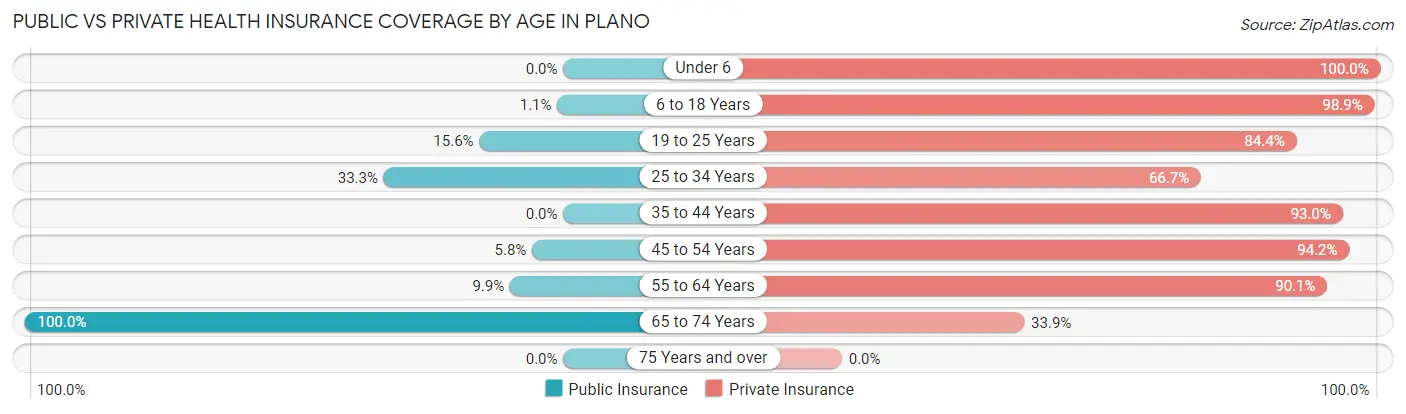
| Age Bracket | Public Insurance | Private Insurance |
| Under 6 | 0 (0.0%) | 126 (100.0%) |
| 6 to 18 Years | 4 (1.1%) | 355 (98.9%) |
| 19 to 25 Years | 12 (15.6%) | 65 (84.4%) |
| 25 to 34 Years | 36 (33.3%) | 72 (66.7%) |
| 35 to 44 Years | 0 (0.0%) | 238 (93.0%) |
| 45 to 54 Years | 14 (5.8%) | 228 (94.2%) |
| 55 to 64 Years | 8 (9.9%) | 73 (90.1%) |
| 65 to 74 Years | 65 (100.0%) | 22 (33.9%) |
| 75 Years and over | 0 (0.0%) | 0 (0.0%) |
| Total | 139 (10.6%) | 1,179 (89.7%) |
Disability Status by Sex by Age in Plano
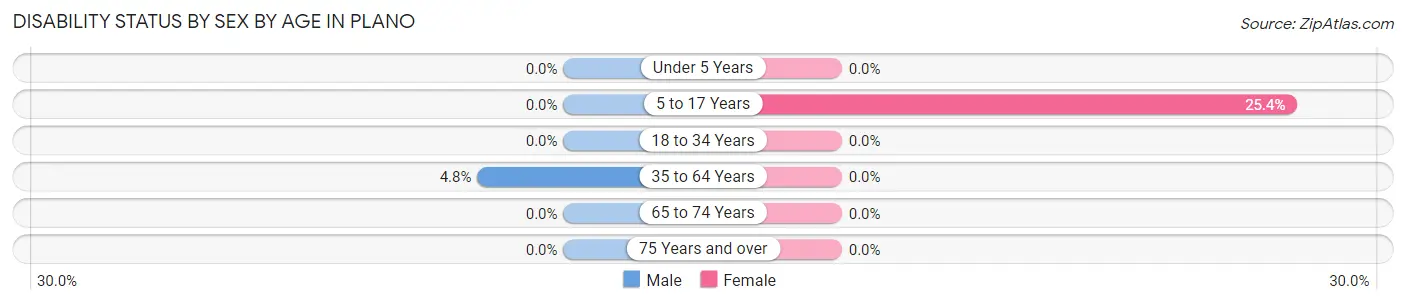
| Age Bracket | Male | Female |
| Under 5 Years | 0 (0.0%) | 0 (0.0%) |
| 5 to 17 Years | 0 (0.0%) | 53 (25.4%) |
| 18 to 34 Years | 0 (0.0%) | 0 (0.0%) |
| 35 to 64 Years | 14 (4.8%) | 0 (0.0%) |
| 65 to 74 Years | 0 (0.0%) | 0 (0.0%) |
| 75 Years and over | 0 (0.0%) | 0 (0.0%) |
Disability Class by Sex by Age in Plano
Disability Class: Hearing Difficulty
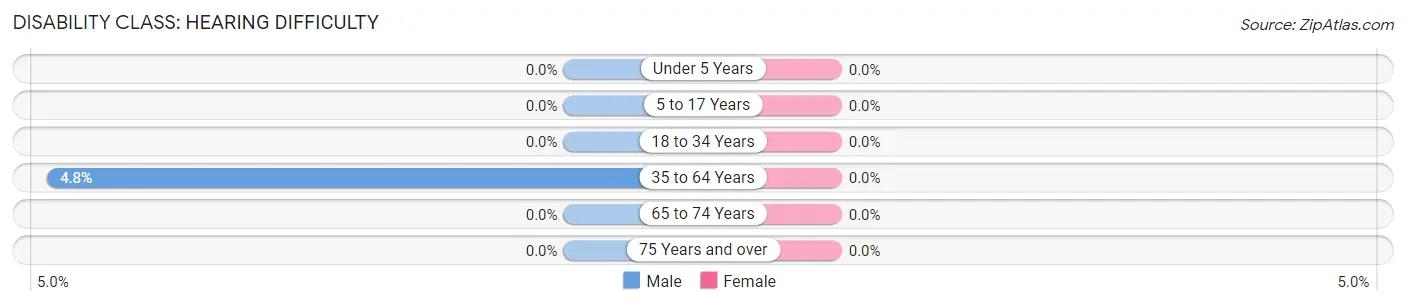
| Age Bracket | Male | Female |
| Under 5 Years | 0 (0.0%) | 0 (0.0%) |
| 5 to 17 Years | 0 (0.0%) | 0 (0.0%) |
| 18 to 34 Years | 0 (0.0%) | 0 (0.0%) |
| 35 to 64 Years | 14 (4.8%) | 0 (0.0%) |
| 65 to 74 Years | 0 (0.0%) | 0 (0.0%) |
| 75 Years and over | 0 (0.0%) | 0 (0.0%) |
Disability Class: Vision Difficulty
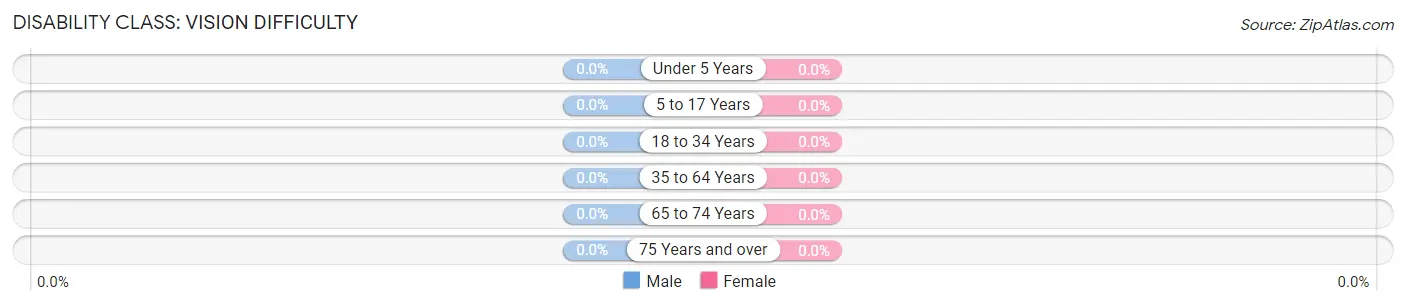
| Age Bracket | Male | Female |
| Under 5 Years | 0 (0.0%) | 0 (0.0%) |
| 5 to 17 Years | 0 (0.0%) | 0 (0.0%) |
| 18 to 34 Years | 0 (0.0%) | 0 (0.0%) |
| 35 to 64 Years | 0 (0.0%) | 0 (0.0%) |
| 65 to 74 Years | 0 (0.0%) | 0 (0.0%) |
| 75 Years and over | 0 (0.0%) | 0 (0.0%) |
Disability Class: Cognitive Difficulty
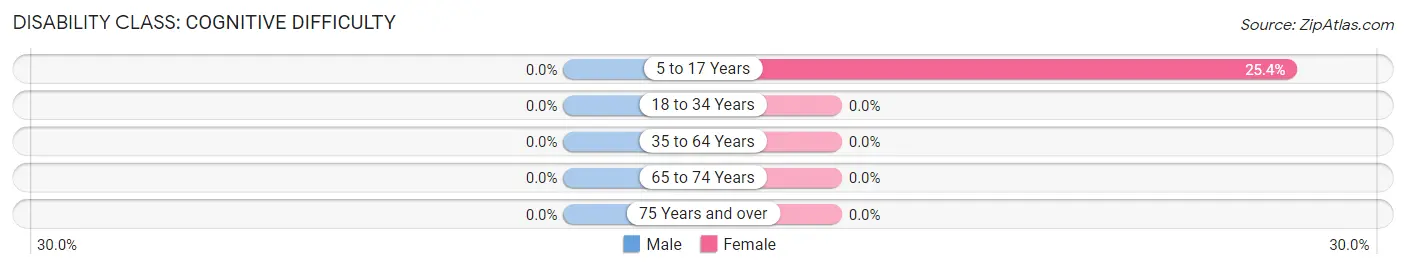
| Age Bracket | Male | Female |
| 5 to 17 Years | 0 (0.0%) | 53 (25.4%) |
| 18 to 34 Years | 0 (0.0%) | 0 (0.0%) |
| 35 to 64 Years | 0 (0.0%) | 0 (0.0%) |
| 65 to 74 Years | 0 (0.0%) | 0 (0.0%) |
| 75 Years and over | 0 (0.0%) | 0 (0.0%) |
Disability Class: Ambulatory Difficulty
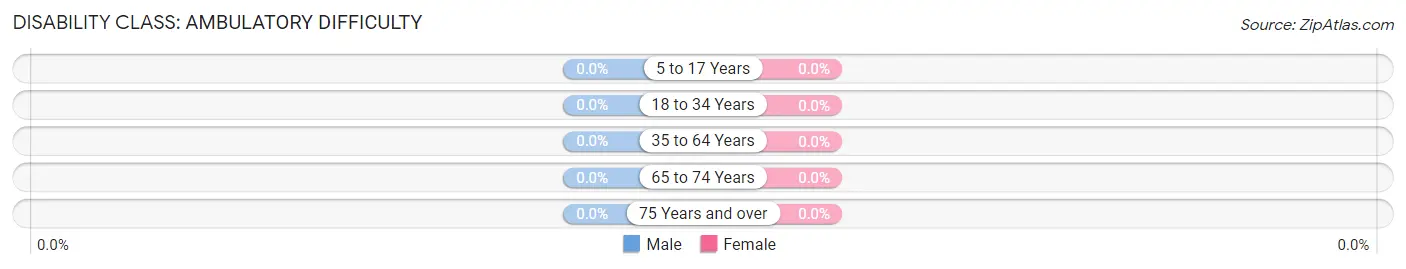
| Age Bracket | Male | Female |
| 5 to 17 Years | 0 (0.0%) | 0 (0.0%) |
| 18 to 34 Years | 0 (0.0%) | 0 (0.0%) |
| 35 to 64 Years | 0 (0.0%) | 0 (0.0%) |
| 65 to 74 Years | 0 (0.0%) | 0 (0.0%) |
| 75 Years and over | 0 (0.0%) | 0 (0.0%) |
Disability Class: Self-Care Difficulty
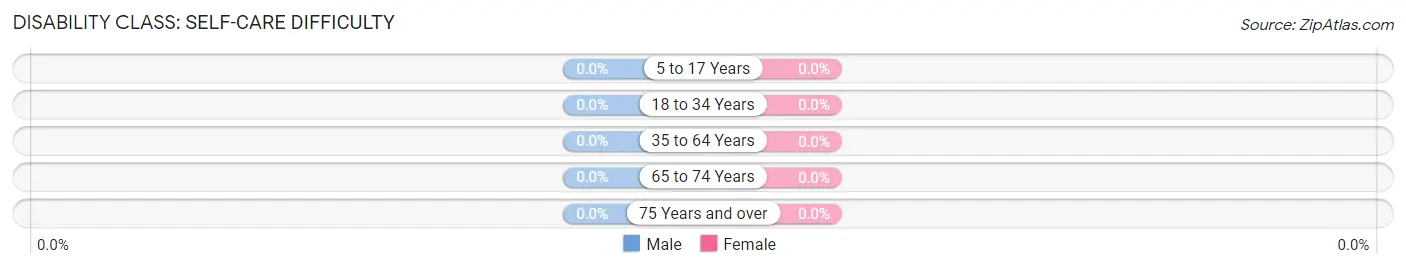
| Age Bracket | Male | Female |
| 5 to 17 Years | 0 (0.0%) | 0 (0.0%) |
| 18 to 34 Years | 0 (0.0%) | 0 (0.0%) |
| 35 to 64 Years | 0 (0.0%) | 0 (0.0%) |
| 65 to 74 Years | 0 (0.0%) | 0 (0.0%) |
| 75 Years and over | 0 (0.0%) | 0 (0.0%) |
Technology Access in Plano
Computing Device Access in Plano
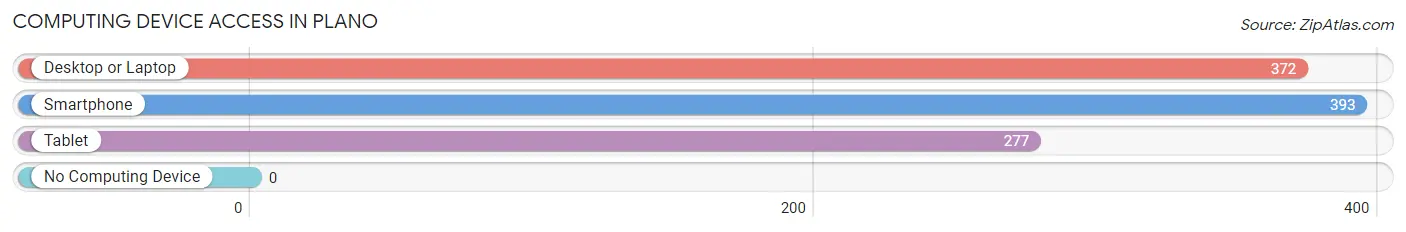
| Device Type | # Households | % Households |
| Desktop or Laptop | 372 | 94.7% |
| Smartphone | 393 | 100.0% |
| Tablet | 277 | 70.5% |
| No Computing Device | 0 | 0.0% |
| Total | 393 | 100.0% |
Internet Access in Plano
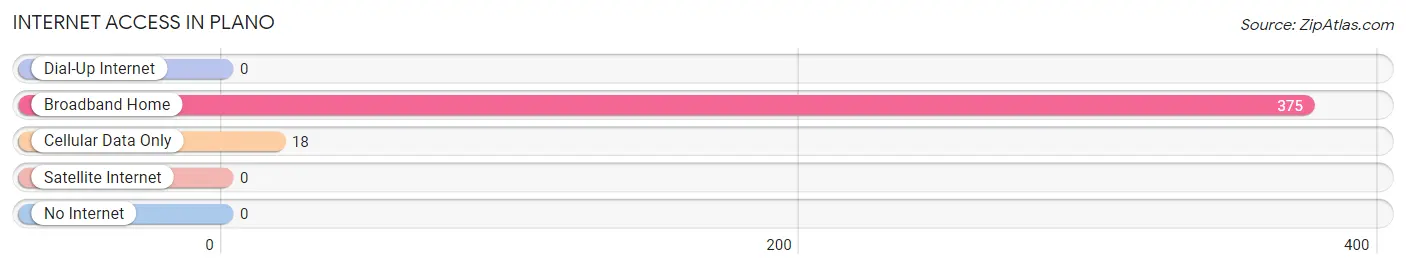
| Internet Type | # Households | % Households |
| Dial-Up Internet | 0 | 0.0% |
| Broadband Home | 375 | 95.4% |
| Cellular Data Only | 18 | 4.6% |
| Satellite Internet | 0 | 0.0% |
| No Internet | 0 | 0.0% |
| Total | 393 | 100.0% |
Plano Summary
Plano, Kentucky is a small unincorporated community located in the southeastern corner of the state, in the foothills of the Appalachian Mountains. It is situated in the county of Clay, and is part of the larger Harlan County. The population of Plano was estimated to be around 200 people in 2020.
History
Plano was first settled in the late 1700s by a group of settlers from North Carolina. The town was originally known as “Plain”, but the name was changed to Plano in 1820. The town was officially incorporated in 1845.
The town was originally a farming community, but in the late 1800s, the coal industry began to take off in the area. The coal industry brought a great deal of prosperity to the town, and it quickly became a major coal mining center. The town was home to several coal mines, and the coal industry provided jobs for many of the town’s residents.
The town was also home to a number of other businesses, including a general store, a blacksmith shop, a sawmill, and a gristmill. The town also had a post office, a school, and a church.
Geography
Plano is located in the southeastern corner of Kentucky, in the foothills of the Appalachian Mountains. The town is situated in the county of Clay, and is part of the larger Harlan County. The town is located at an elevation of 1,400 feet above sea level.
The town is surrounded by rolling hills and mountains, and is located near the Cumberland Gap National Historical Park. The town is also located near the Big South Fork National River and Recreation Area, which is a popular destination for outdoor recreation.
Economy
The economy of Plano is largely based on the coal industry. The town is home to several coal mines, and the coal industry provides jobs for many of the town’s residents. The town is also home to a number of other businesses, including a general store, a blacksmith shop, a sawmill, and a gristmill.
The town is also home to a number of tourist attractions, including the Cumberland Gap National Historical Park, the Big South Fork National River and Recreation Area, and the Kentucky Coal Museum. These attractions bring in a great deal of tourism to the town, and help to support the local economy.
Demographics
The population of Plano was estimated to be around 200 people in 2020. The town is predominantly white, with a small minority population. The median household income in the town is around $30,000, and the median home value is around $90,000. The town has a high rate of poverty, with around 25% of the population living below the poverty line.
Common Questions
What is Per Capita Income in Plano?
Per Capita income in Plano is $31,703.
What is the Median Family Income in Plano?
Median Family Income in Plano is $121,531.
What is the Median Household income in Plano?
Median Household Income in Plano is $120,536.
What is Income or Wage Gap in Plano?
Income or Wage Gap in Plano is 44.3%.
Women in Plano earn 55.7 cents for every dollar earned by a man.
What is Inequality or Gini Index in Plano?
Inequality or Gini Index in Plano is 0.29.
What is the Total Population of Plano?
Total Population of Plano is 1,314.
What is the Total Male Population of Plano?
Total Male Population of Plano is 676.
What is the Total Female Population of Plano?
Total Female Population of Plano is 638.
What is the Ratio of Males per 100 Females in Plano?
There are 105.96 Males per 100 Females in Plano.
What is the Ratio of Females per 100 Males in Plano?
There are 94.38 Females per 100 Males in Plano.
What is the Median Population Age in Plano?
Median Population Age in Plano is 30.7 Years.
What is the Average Family Size in Plano
Average Family Size in Plano is 3.9 People.
What is the Average Household Size in Plano
Average Household Size in Plano is 3.3 People.
How Large is the Labor Force in Plano?
There are 725 People in the Labor Forcein in Plano.
What is the Percentage of People in the Labor Force in Plano?
83.0% of People are in the Labor Force in Plano.
What is the Unemployment Rate in Plano?
Unemployment Rate in Plano is 5.0%.