Massac, KY Map & Demographics
Massac Map
Massac Overview
$38,355
PER CAPITA INCOME
$73,815
AVG FAMILY INCOME
$65,966
AVG HOUSEHOLD INCOME
48.0%
WAGE / INCOME GAP [ % ]
52.0¢/ $1
WAGE / INCOME GAP [ $ ]
0.53
INEQUALITY / GINI INDEX
4,722
TOTAL POPULATION
2,424
MALE POPULATION
2,298
FEMALE POPULATION
105.48
MALES / 100 FEMALES
94.80
FEMALES / 100 MALES
30.5
MEDIAN AGE
3.2
AVG FAMILY SIZE
2.5
AVG HOUSEHOLD SIZE
2,068
LABOR FORCE [ PEOPLE ]
57.9%
PERCENT IN LABOR FORCE
Income in Massac
Income Overview in Massac
Per Capita Income in Massac is $38,355, while median incomes of families and households are $73,815 and $65,966 respectively.
| Characteristic | Number | Measure |
| Per Capita Income | 4,722 | $38,355 |
| Median Family Income | 1,157 | $73,815 |
| Mean Family Income | 1,157 | $122,528 |
| Median Household Income | 1,859 | $65,966 |
| Mean Household Income | 1,859 | $94,885 |
| Income Deficit | 1,157 | $0 |
| Wage / Income Gap (%) | 4,722 | 48.03% |
| Wage / Income Gap ($) | 4,722 | 51.97¢ per $1 |
| Gini / Inequality Index | 4,722 | 0.53 |
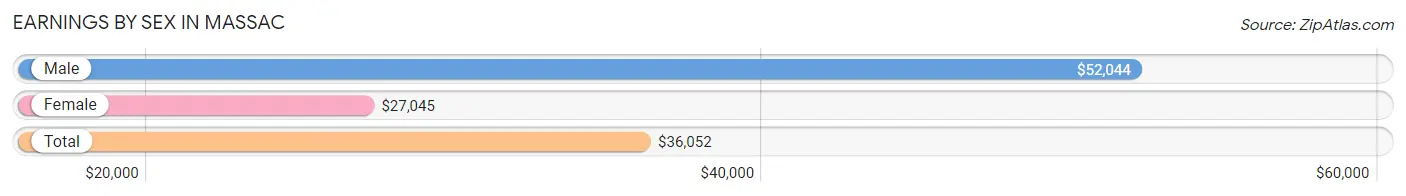
Earnings by Sex in Massac
Average Earnings in Massac are $36,052, $52,044 for men and $27,045 for women, a difference of 48.0%.
| Sex | Number | Average Earnings |
| Male | 1,202 (54.7%) | $52,044 |
| Female | 997 (45.3%) | $27,045 |
| Total | 2,199 (100.0%) | $36,052 |
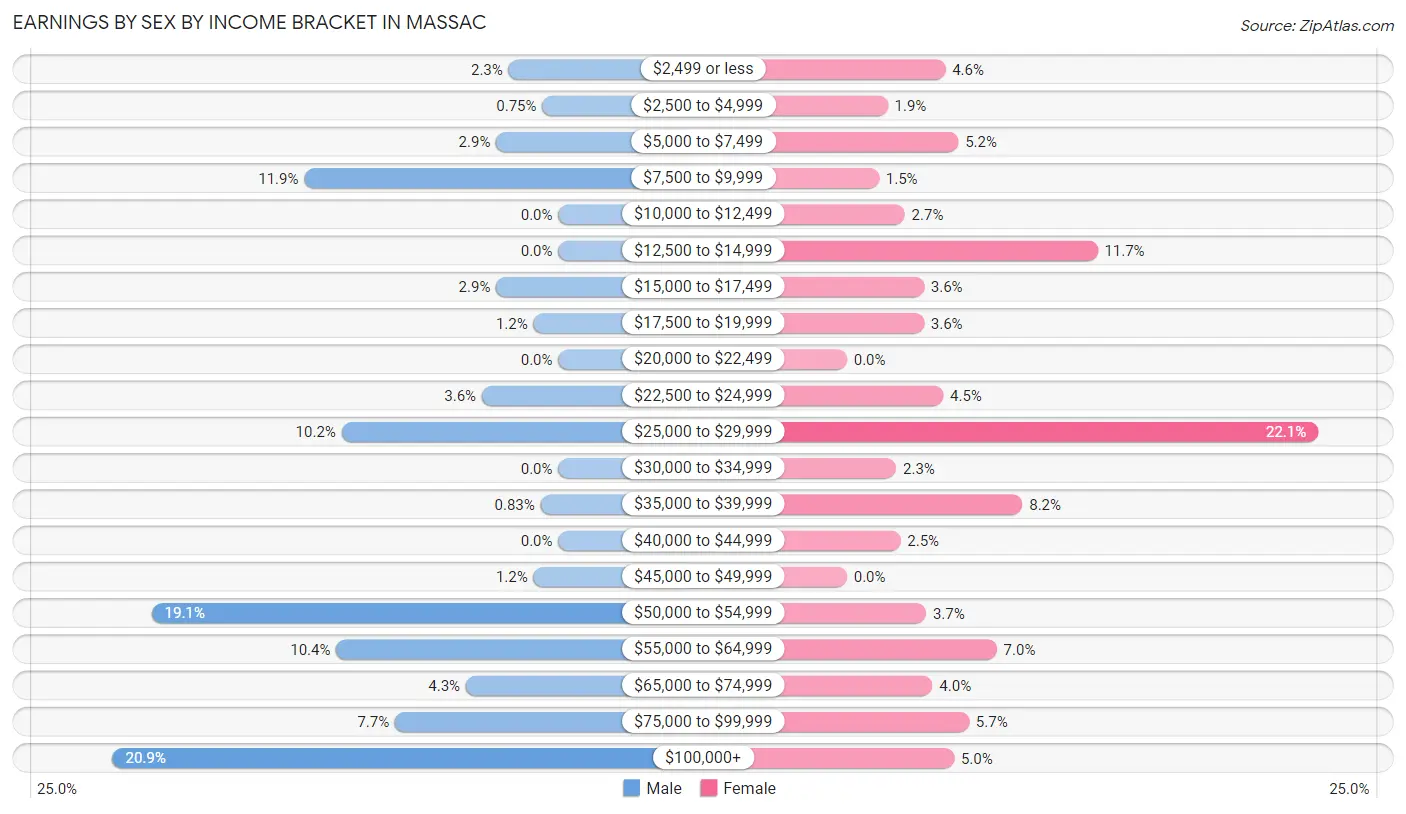
Earnings by Sex by Income Bracket in Massac
The most common earnings brackets in Massac are $100,000+ for men (251 | 20.9%) and $25,000 to $29,999 for women (220 | 22.1%).
| Income | Male | Female |
| $2,499 or less | 28 (2.3%) | 46 (4.6%) |
| $2,500 to $4,999 | 9 (0.7%) | 19 (1.9%) |
| $5,000 to $7,499 | 35 (2.9%) | 52 (5.2%) |
| $7,500 to $9,999 | 143 (11.9%) | 15 (1.5%) |
| $10,000 to $12,499 | 0 (0.0%) | 27 (2.7%) |
| $12,500 to $14,999 | 0 (0.0%) | 117 (11.7%) |
| $15,000 to $17,499 | 35 (2.9%) | 36 (3.6%) |
| $17,500 to $19,999 | 14 (1.2%) | 36 (3.6%) |
| $20,000 to $22,499 | 0 (0.0%) | 0 (0.0%) |
| $22,500 to $24,999 | 43 (3.6%) | 45 (4.5%) |
| $25,000 to $29,999 | 122 (10.2%) | 220 (22.1%) |
| $30,000 to $34,999 | 0 (0.0%) | 23 (2.3%) |
| $35,000 to $39,999 | 10 (0.8%) | 82 (8.2%) |
| $40,000 to $44,999 | 0 (0.0%) | 25 (2.5%) |
| $45,000 to $49,999 | 14 (1.2%) | 0 (0.0%) |
| $50,000 to $54,999 | 229 (19.1%) | 37 (3.7%) |
| $55,000 to $64,999 | 125 (10.4%) | 70 (7.0%) |
| $65,000 to $74,999 | 52 (4.3%) | 40 (4.0%) |
| $75,000 to $99,999 | 92 (7.6%) | 57 (5.7%) |
| $100,000+ | 251 (20.9%) | 50 (5.0%) |
| Total | 1,202 (100.0%) | 997 (100.0%) |
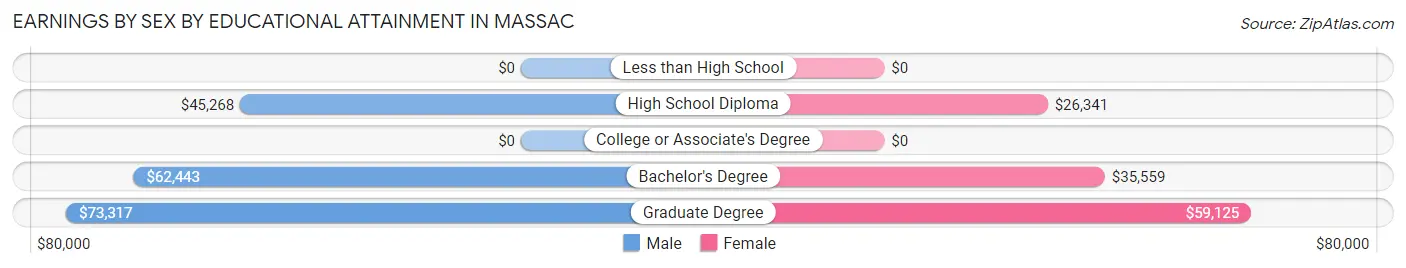
Earnings by Sex by Educational Attainment in Massac
Average earnings in Massac are $54,661 for men and $35,091 for women, a difference of 35.8%. Men with an educational attainment of graduate degree enjoy the highest average annual earnings of $73,317, while those with high school diploma education earn the least with $45,268. Women with an educational attainment of graduate degree earn the most with the average annual earnings of $59,125, while those with high school diploma education have the smallest earnings of $26,341.
| Educational Attainment | Male Income | Female Income |
| Less than High School | - | - |
| High School Diploma | $45,268 | $26,341 |
| College or Associate's Degree | - | - |
| Bachelor's Degree | $62,443 | $35,559 |
| Graduate Degree | $73,317 | $59,125 |
| Total | $54,661 | $35,091 |
Family Income in Massac
Family Income Brackets in Massac
According to the Massac family income data, there are 318 families falling into the $50,000 to $74,999 income range, which is the most common income bracket and makes up 27.5% of all families. Conversely, the $10,000 to $14,999 income bracket is the least frequent group with only 14 families (1.2%) belonging to this category.
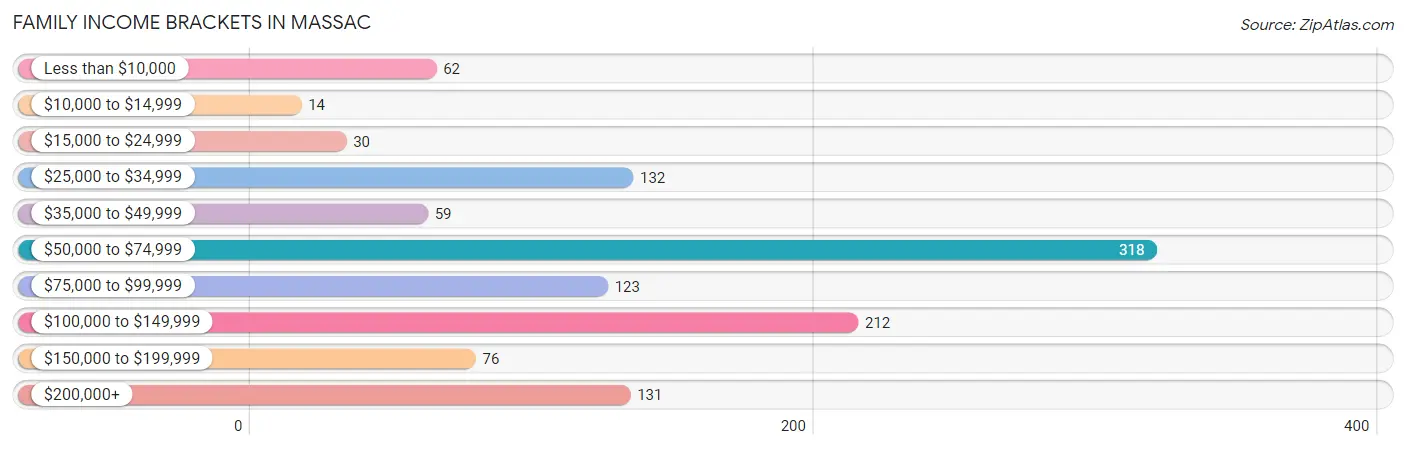
| Income Bracket | # Families | % Families |
| Less than $10,000 | 62 | 5.4% |
| $10,000 to $14,999 | 14 | 1.2% |
| $15,000 to $24,999 | 30 | 2.6% |
| $25,000 to $34,999 | 132 | 11.4% |
| $35,000 to $49,999 | 59 | 5.1% |
| $50,000 to $74,999 | 318 | 27.5% |
| $75,000 to $99,999 | 123 | 10.6% |
| $100,000 to $149,999 | 212 | 18.3% |
| $150,000 to $199,999 | 76 | 6.6% |
| $200,000+ | 131 | 11.3% |
Family Income by Famaliy Size in Massac
3-person families (262 | 22.6%) account for the highest median family income in Massac with $133,250 per family, while 3-person families (262 | 22.6%) have the highest median income of $44,417 per family member.
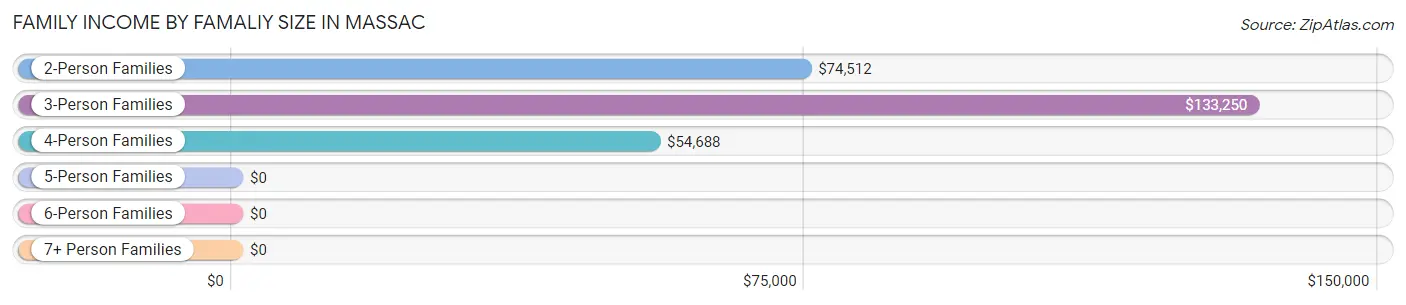
| Income Bracket | # Families | Median Income |
| 2-Person Families | 546 (47.2%) | $74,512 |
| 3-Person Families | 262 (22.6%) | $133,250 |
| 4-Person Families | 221 (19.1%) | $54,688 |
| 5-Person Families | 109 (9.4%) | $0 |
| 6-Person Families | 19 (1.6%) | $0 |
| 7+ Person Families | 0 (0.0%) | $0 |
| Total | 1,157 (100.0%) | $73,815 |
Family Income by Number of Earners in Massac
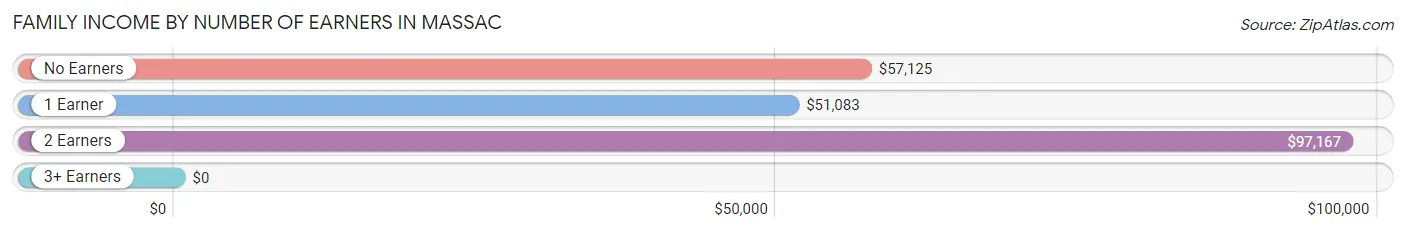
| Number of Earners | # Families | Median Income |
| No Earners | 241 (20.8%) | $57,125 |
| 1 Earner | 353 (30.5%) | $51,083 |
| 2 Earners | 530 (45.8%) | $97,167 |
| 3+ Earners | 33 (2.9%) | $0 |
| Total | 1,157 (100.0%) | $73,815 |
Household Income in Massac
Household Income Brackets in Massac
With 429 households falling in the category, the $50,000 to $74,999 income range is the most frequent in Massac, accounting for 23.1% of all households. In contrast, only 33 households (1.8%) fall into the $10,000 to $14,999 income bracket, making it the least populous group.
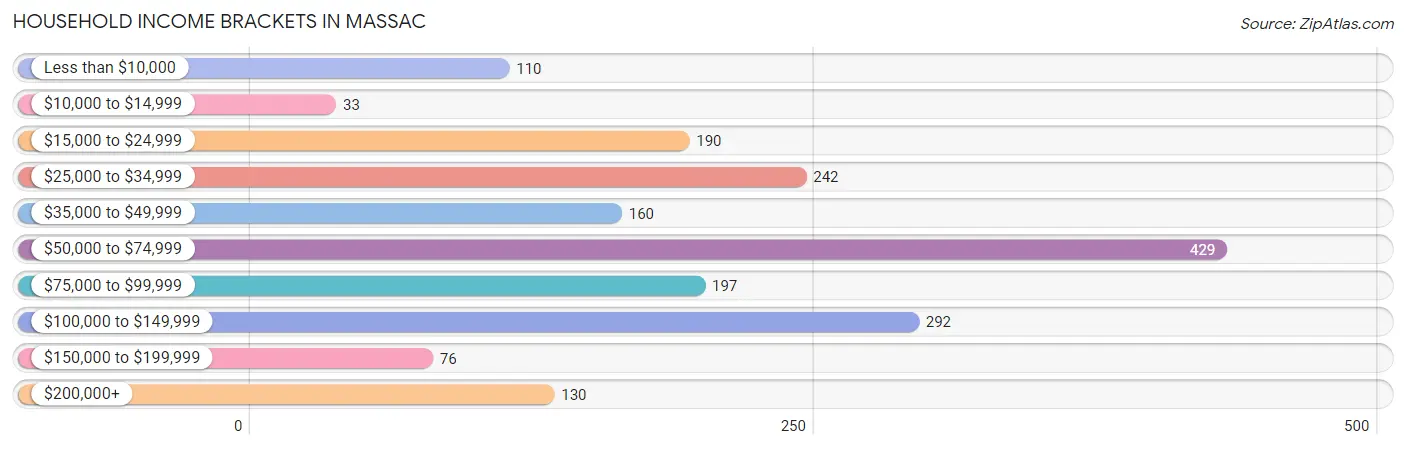
| Income Bracket | # Households | % Households |
| Less than $10,000 | 110 | 5.9% |
| $10,000 to $14,999 | 33 | 1.8% |
| $15,000 to $24,999 | 190 | 10.2% |
| $25,000 to $34,999 | 242 | 13.0% |
| $35,000 to $49,999 | 160 | 8.6% |
| $50,000 to $74,999 | 429 | 23.1% |
| $75,000 to $99,999 | 197 | 10.6% |
| $100,000 to $149,999 | 292 | 15.7% |
| $150,000 to $199,999 | 76 | 4.1% |
| $200,000+ | 130 | 7.0% |
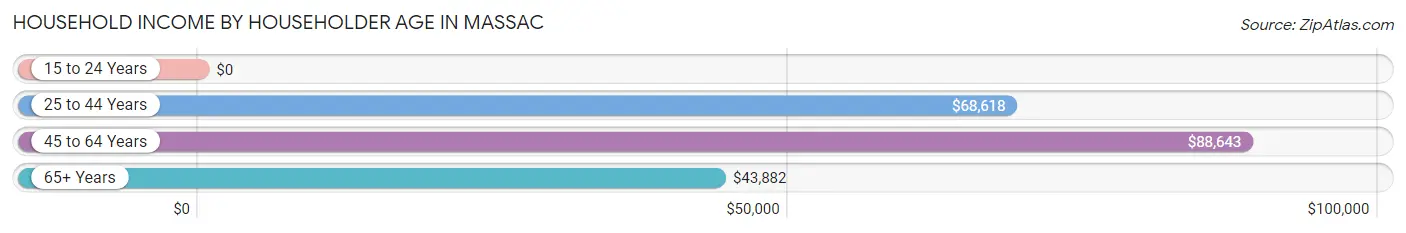
Household Income by Householder Age in Massac
The median household income in Massac is $65,966, with the highest median household income of $88,643 found in the 45 to 64 years age bracket for the primary householder. A total of 442 households (23.8%) fall into this category. Meanwhile, the 15 to 24 years age bracket for the primary householder has the lowest median household income of $0, with 120 households (6.5%) in this group.
| Income Bracket | # Households | Median Income |
| 15 to 24 Years | 120 (6.5%) | $0 |
| 25 to 44 Years | 745 (40.1%) | $68,618 |
| 45 to 64 Years | 442 (23.8%) | $88,643 |
| 65+ Years | 552 (29.7%) | $43,882 |
| Total | 1,859 (100.0%) | $65,966 |
Poverty in Massac
Income Below Poverty by Sex and Age in Massac
With 7.9% poverty level for males and 15.2% for females among the residents of Massac, 5 year old males and 18 to 24 year old females are the most vulnerable to poverty, with 31 males (100.0%) and 104 females (32.5%) in their respective age groups living below the poverty level.
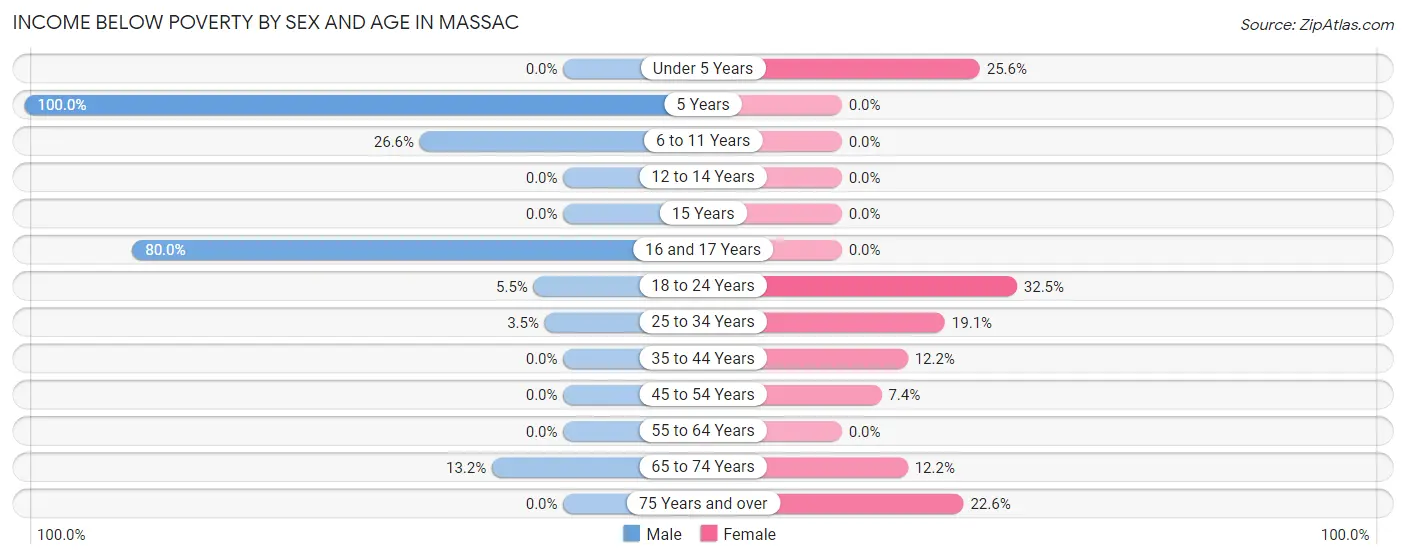
| Age Bracket | Male | Female |
| Under 5 Years | 0 (0.0%) | 52 (25.6%) |
| 5 Years | 31 (100.0%) | 0 (0.0%) |
| 6 to 11 Years | 53 (26.6%) | 0 (0.0%) |
| 12 to 14 Years | 0 (0.0%) | 0 (0.0%) |
| 15 Years | 0 (0.0%) | 0 (0.0%) |
| 16 and 17 Years | 56 (80.0%) | 0 (0.0%) |
| 18 to 24 Years | 17 (5.5%) | 104 (32.5%) |
| 25 to 34 Years | 16 (3.5%) | 62 (19.1%) |
| 35 to 44 Years | 0 (0.0%) | 23 (12.2%) |
| 45 to 54 Years | 0 (0.0%) | 14 (7.4%) |
| 55 to 64 Years | 0 (0.0%) | 0 (0.0%) |
| 65 to 74 Years | 18 (13.2%) | 41 (12.2%) |
| 75 Years and over | 0 (0.0%) | 54 (22.6%) |
| Total | 191 (7.9%) | 350 (15.2%) |
Income Above Poverty by Sex and Age in Massac
According to the poverty statistics in Massac, males aged under 5 years and females aged 6 to 11 years are the age groups that are most secure financially, with 100.0% of males and 100.0% of females in these age groups living above the poverty line.
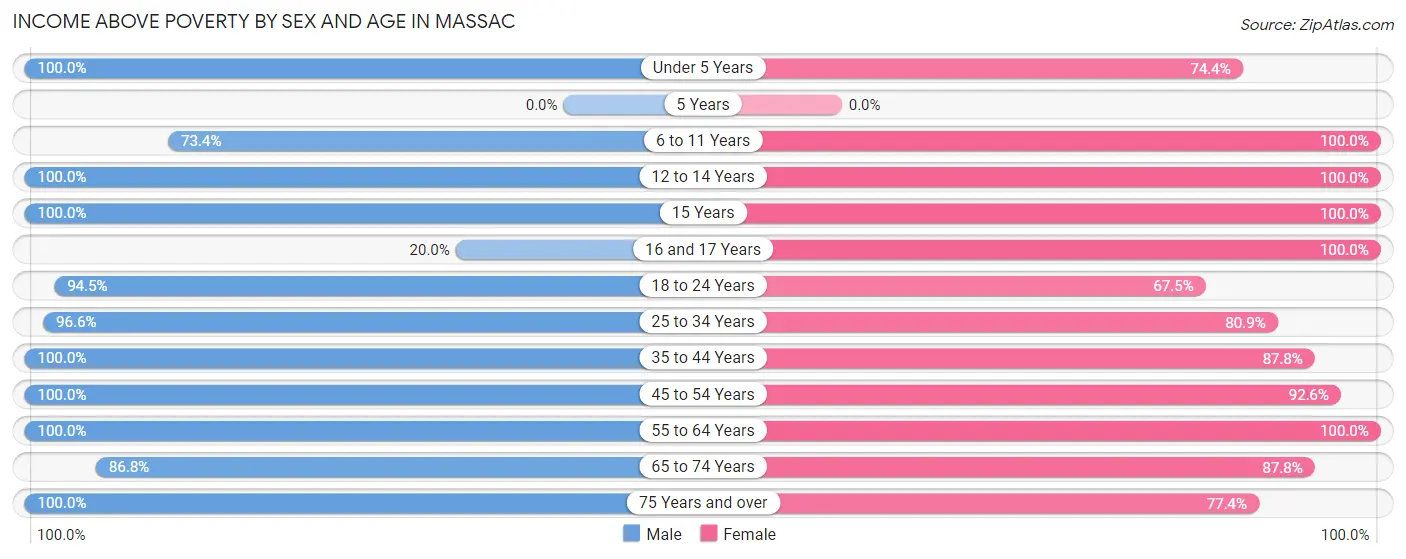
| Age Bracket | Male | Female |
| Under 5 Years | 295 (100.0%) | 151 (74.4%) |
| 5 Years | 0 (0.0%) | 0 (0.0%) |
| 6 to 11 Years | 146 (73.4%) | 199 (100.0%) |
| 12 to 14 Years | 96 (100.0%) | 58 (100.0%) |
| 15 Years | 57 (100.0%) | 12 (100.0%) |
| 16 and 17 Years | 14 (20.0%) | 63 (100.0%) |
| 18 to 24 Years | 292 (94.5%) | 216 (67.5%) |
| 25 to 34 Years | 448 (96.6%) | 262 (80.9%) |
| 35 to 44 Years | 279 (100.0%) | 165 (87.8%) |
| 45 to 54 Years | 152 (100.0%) | 176 (92.6%) |
| 55 to 64 Years | 216 (100.0%) | 167 (100.0%) |
| 65 to 74 Years | 118 (86.8%) | 294 (87.8%) |
| 75 Years and over | 120 (100.0%) | 185 (77.4%) |
| Total | 2,233 (92.1%) | 1,948 (84.8%) |
Income Below Poverty Among Married-Couple Families in Massac
The poverty statistics for married-couple families in Massac show that 4.0% or 35 of the total 874 families live below the poverty line. Families with 1 or 2 children have the highest poverty rate of 5.5%, comprising of 17 families. On the other hand, families with 3 or 4 children have the lowest poverty rate of 0.0%, which includes 0 families.
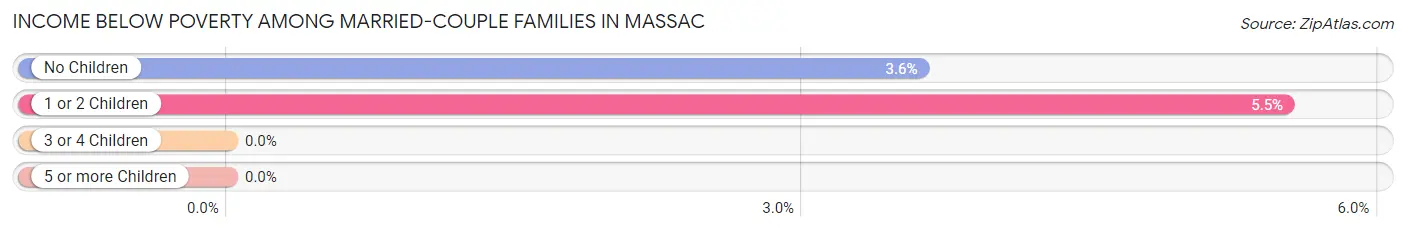
| Children | Above Poverty | Below Poverty |
| No Children | 480 (96.4%) | 18 (3.6%) |
| 1 or 2 Children | 291 (94.5%) | 17 (5.5%) |
| 3 or 4 Children | 68 (100.0%) | 0 (0.0%) |
| 5 or more Children | 0 (0.0%) | 0 (0.0%) |
| Total | 839 (96.0%) | 35 (4.0%) |
Income Below Poverty Among Single-Parent Households in Massac
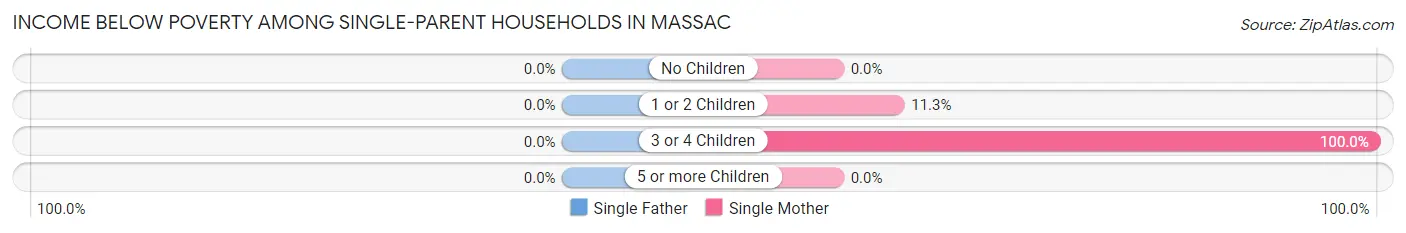
| Children | Single Father | Single Mother |
| No Children | 0 (0.0%) | 0 (0.0%) |
| 1 or 2 Children | 0 (0.0%) | 14 (11.3%) |
| 3 or 4 Children | 0 (0.0%) | 45 (100.0%) |
| 5 or more Children | 0 (0.0%) | 0 (0.0%) |
| Total | 0 (0.0%) | 59 (23.1%) |
Income Below Poverty Among Married-Couple vs Single-Parent Households in Massac
The poverty data for Massac shows that 35 of the married-couple family households (4.0%) and 59 of the single-parent households (20.8%) are living below the poverty level. Within the married-couple family households, those with 1 or 2 children have the highest poverty rate, with 17 households (5.5%) falling below the poverty line. Among the single-parent households, those with 3 or 4 children have the highest poverty rate, with 45 household (73.8%) living below poverty.
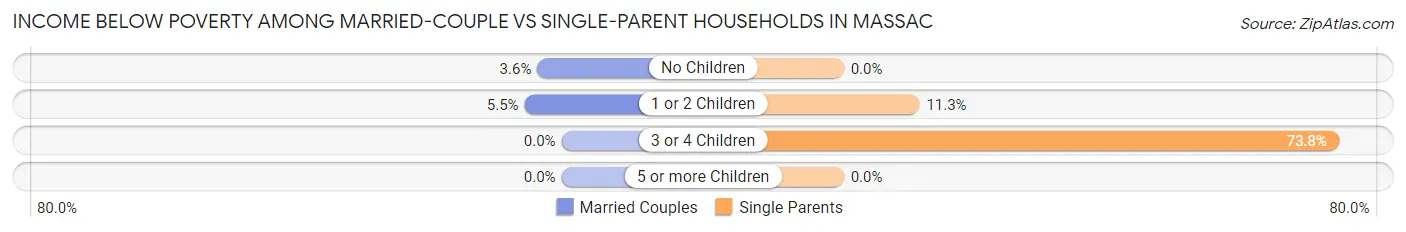
| Children | Married-Couple Families | Single-Parent Households |
| No Children | 18 (3.6%) | 0 (0.0%) |
| 1 or 2 Children | 17 (5.5%) | 14 (11.3%) |
| 3 or 4 Children | 0 (0.0%) | 45 (73.8%) |
| 5 or more Children | 0 (0.0%) | 0 (0.0%) |
| Total | 35 (4.0%) | 59 (20.8%) |
Race in Massac
The most populous races in Massac are White / Caucasian (3,856 | 81.7%), Two or more Races (523 | 11.1%), and Black / African American (343 | 7.3%).
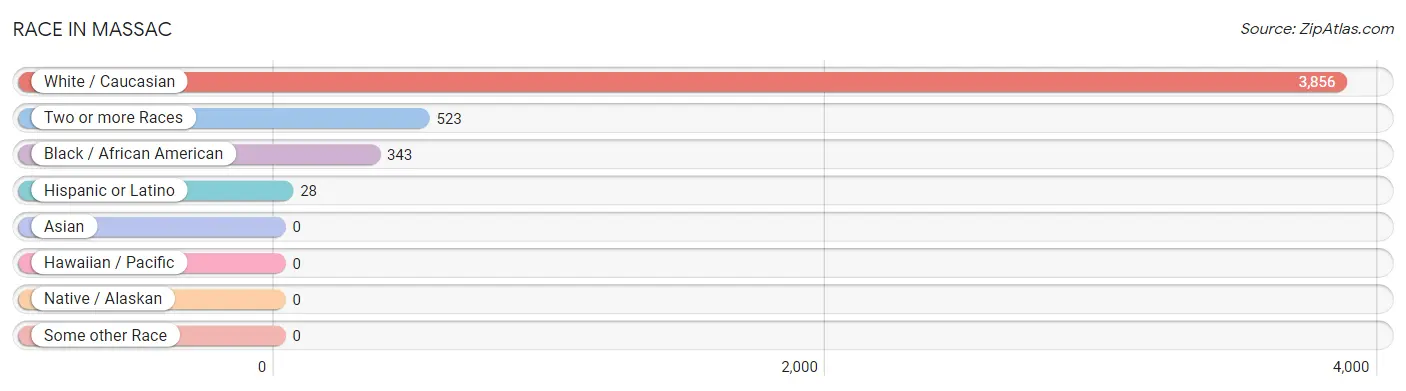
| Race | # Population | % Population |
| Asian | 0 | 0.0% |
| Black / African American | 343 | 7.3% |
| Hawaiian / Pacific | 0 | 0.0% |
| Hispanic or Latino | 28 | 0.6% |
| Native / Alaskan | 0 | 0.0% |
| White / Caucasian | 3,856 | 81.7% |
| Two or more Races | 523 | 11.1% |
| Some other Race | 0 | 0.0% |
| Total | 4,722 | 100.0% |
Ancestry in Massac
The most populous ancestries reported in Massac are English (1,161 | 24.6%), American (810 | 17.2%), Irish (644 | 13.6%), German (386 | 8.2%), and African (268 | 5.7%), together accounting for 69.2% of all Massac residents.
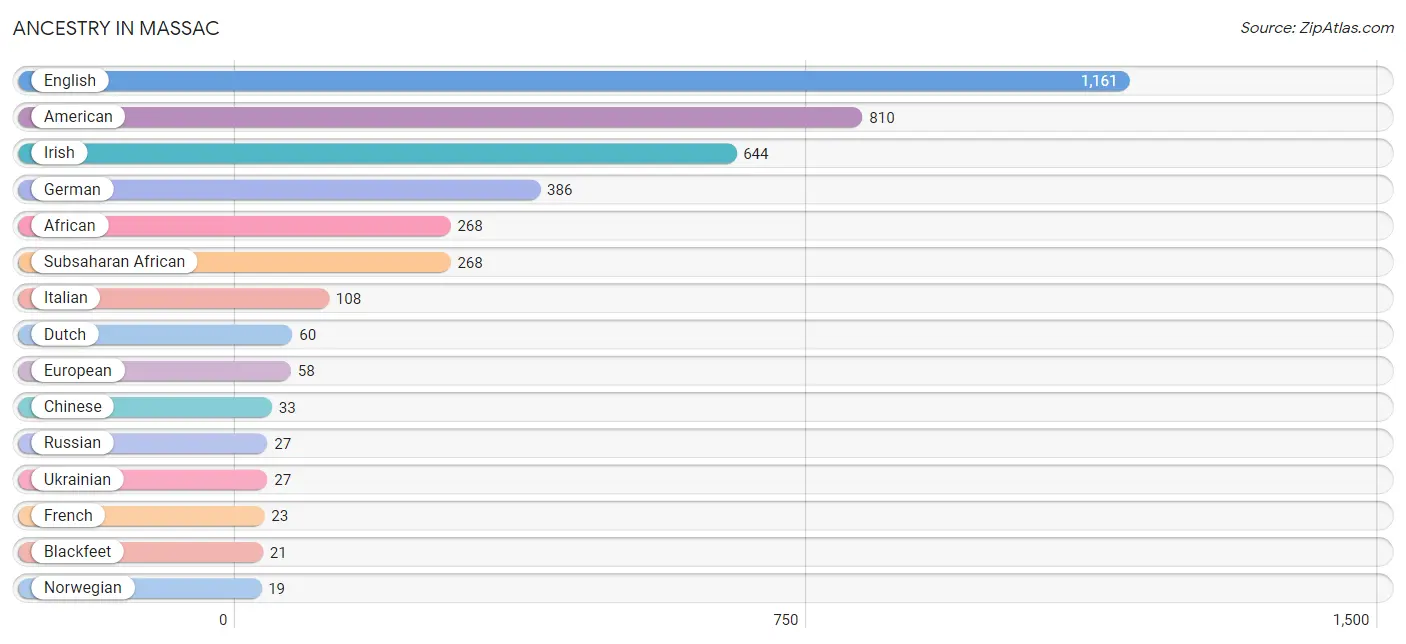
| Ancestry | # Population | % Population |
| African | 268 | 5.7% |
| Alsatian | 17 | 0.4% |
| American | 810 | 17.2% |
| Blackfeet | 21 | 0.4% |
| Cherokee | 7 | 0.2% |
| Chinese | 33 | 0.7% |
| Dutch | 60 | 1.3% |
| English | 1,161 | 24.6% |
| European | 58 | 1.2% |
| French | 23 | 0.5% |
| German | 386 | 8.2% |
| Greek | 11 | 0.2% |
| Irish | 644 | 13.6% |
| Italian | 108 | 2.3% |
| Korean | 13 | 0.3% |
| Norwegian | 19 | 0.4% |
| Portuguese | 17 | 0.4% |
| Puerto Rican | 17 | 0.4% |
| Russian | 27 | 0.6% |
| Scotch-Irish | 10 | 0.2% |
| Spaniard | 11 | 0.2% |
| Subsaharan African | 268 | 5.7% |
| Ukrainian | 27 | 0.6% |
| Welsh | 16 | 0.3% | View All 24 Rows |
Immigrants in Massac
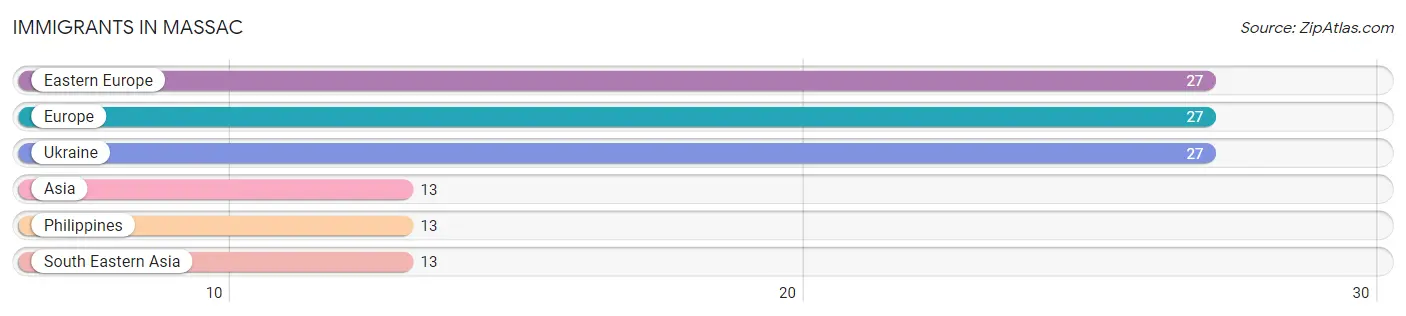
The most numerous immigrant groups reported in Massac came from Eastern Europe (27 | 0.6%), Europe (27 | 0.6%), Ukraine (27 | 0.6%), Asia (13 | 0.3%), and Philippines (13 | 0.3%), together accounting for 2.3% of all Massac residents.
| Immigration Origin | # Population | % Population |
| Asia | 13 | 0.3% |
| Eastern Europe | 27 | 0.6% |
| Europe | 27 | 0.6% |
| Philippines | 13 | 0.3% |
| South Eastern Asia | 13 | 0.3% |
| Ukraine | 27 | 0.6% | View All 6 Rows |
Sex and Age in Massac
Sex and Age in Massac
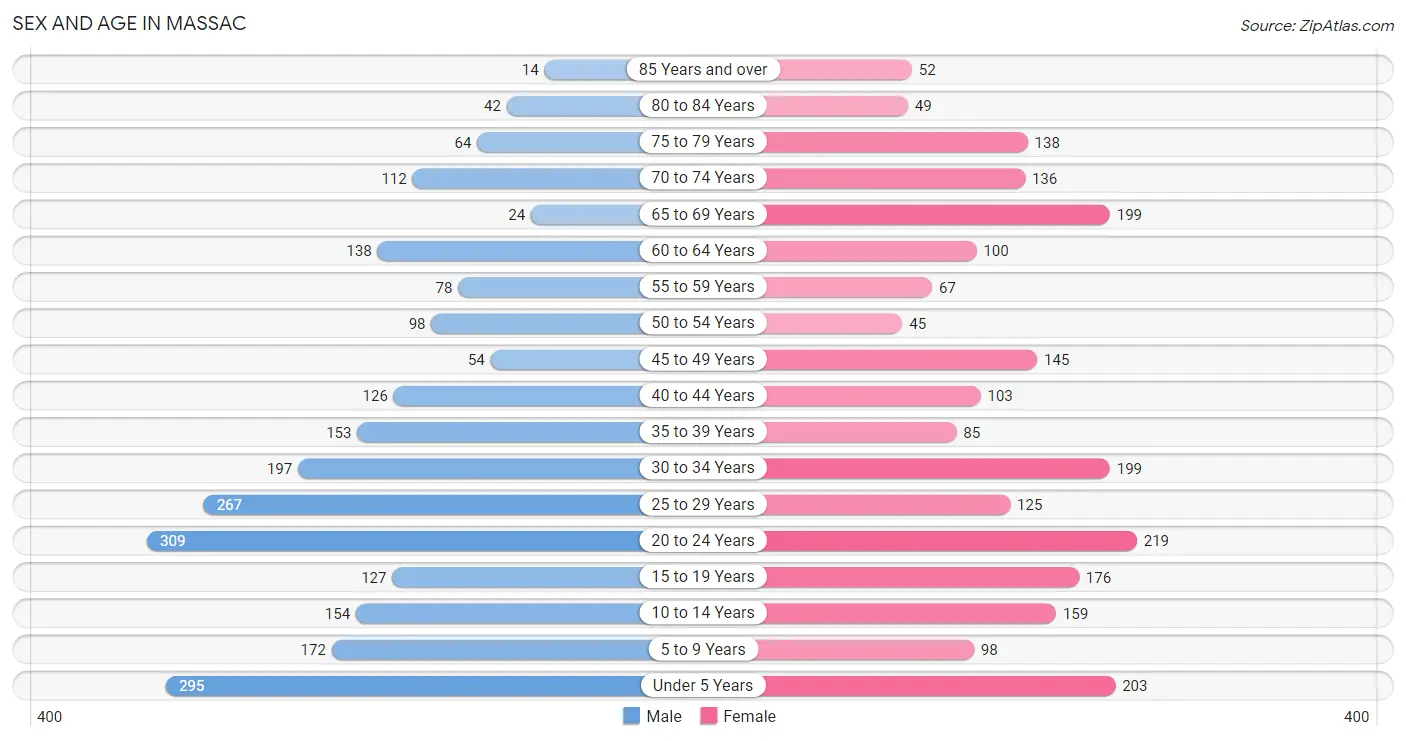
The most populous age groups in Massac are 20 to 24 Years (309 | 12.8%) for men and 20 to 24 Years (219 | 9.5%) for women.
| Age Bracket | Male | Female |
| Under 5 Years | 295 (12.2%) | 203 (8.8%) |
| 5 to 9 Years | 172 (7.1%) | 98 (4.3%) |
| 10 to 14 Years | 154 (6.4%) | 159 (6.9%) |
| 15 to 19 Years | 127 (5.2%) | 176 (7.7%) |
| 20 to 24 Years | 309 (12.8%) | 219 (9.5%) |
| 25 to 29 Years | 267 (11.0%) | 125 (5.4%) |
| 30 to 34 Years | 197 (8.1%) | 199 (8.7%) |
| 35 to 39 Years | 153 (6.3%) | 85 (3.7%) |
| 40 to 44 Years | 126 (5.2%) | 103 (4.5%) |
| 45 to 49 Years | 54 (2.2%) | 145 (6.3%) |
| 50 to 54 Years | 98 (4.0%) | 45 (2.0%) |
| 55 to 59 Years | 78 (3.2%) | 67 (2.9%) |
| 60 to 64 Years | 138 (5.7%) | 100 (4.3%) |
| 65 to 69 Years | 24 (1.0%) | 199 (8.7%) |
| 70 to 74 Years | 112 (4.6%) | 136 (5.9%) |
| 75 to 79 Years | 64 (2.6%) | 138 (6.0%) |
| 80 to 84 Years | 42 (1.7%) | 49 (2.1%) |
| 85 Years and over | 14 (0.6%) | 52 (2.3%) |
| Total | 2,424 (100.0%) | 2,298 (100.0%) |
Families and Households in Massac
Median Family Size in Massac
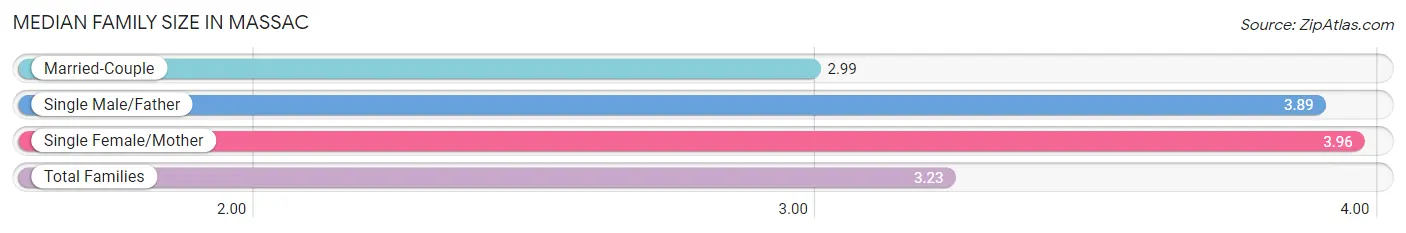
The median family size in Massac is 3.23 persons per family, with single female/mother families (255 | 22.0%) accounting for the largest median family size of 3.96 persons per family. On the other hand, married-couple families (874 | 75.5%) represent the smallest median family size with 2.99 persons per family.
| Family Type | # Families | Family Size |
| Married-Couple | 874 (75.5%) | 2.99 |
| Single Male/Father | 28 (2.4%) | 3.89 |
| Single Female/Mother | 255 (22.0%) | 3.96 |
| Total Families | 1,157 (100.0%) | 3.23 |
Median Household Size in Massac
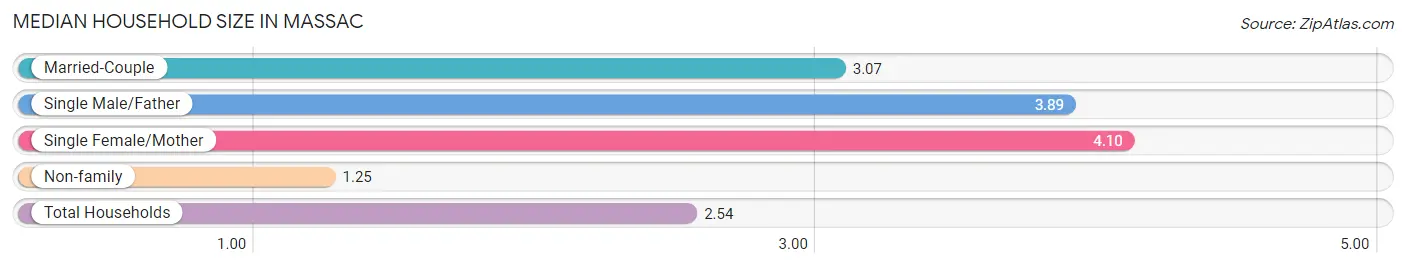
The median household size in Massac is 2.54 persons per household, with single female/mother households (255 | 13.7%) accounting for the largest median household size of 4.1 persons per household. non-family households (702 | 37.8%) represent the smallest median household size with 1.25 persons per household.
| Household Type | # Households | Household Size |
| Married-Couple | 874 (47.0%) | 3.07 |
| Single Male/Father | 28 (1.5%) | 3.89 |
| Single Female/Mother | 255 (13.7%) | 4.10 |
| Non-family | 702 (37.8%) | 1.25 |
| Total Households | 1,859 (100.0%) | 2.54 |
Household Size by Marriage Status in Massac
Out of a total of 1,859 households in Massac, 1,157 (62.2%) are family households, while 702 (37.8%) are nonfamily households. The most numerous type of family households are 2-person households, comprising 546, and the most common type of nonfamily households are 1-person households, comprising 572.
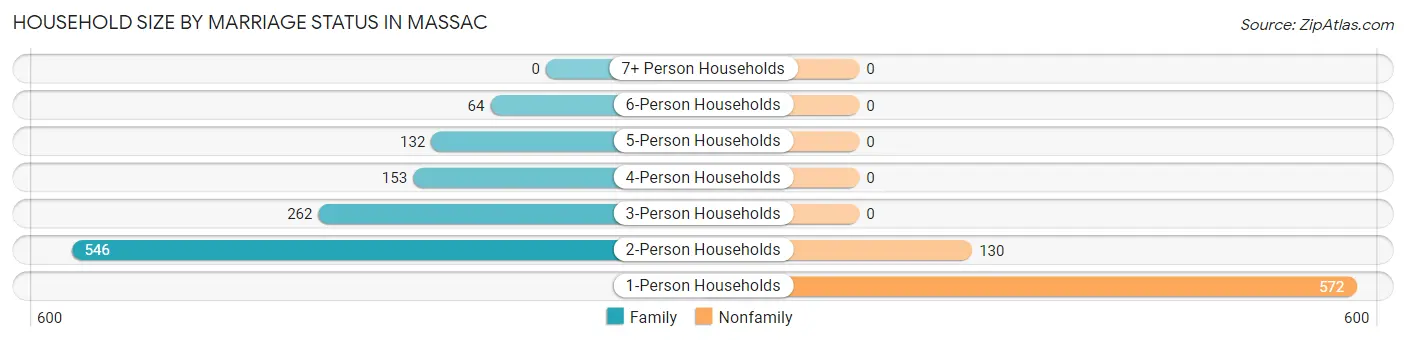
| Household Size | Family Households | Nonfamily Households |
| 1-Person Households | - | 572 (30.8%) |
| 2-Person Households | 546 (29.4%) | 130 (7.0%) |
| 3-Person Households | 262 (14.1%) | 0 (0.0%) |
| 4-Person Households | 153 (8.2%) | 0 (0.0%) |
| 5-Person Households | 132 (7.1%) | 0 (0.0%) |
| 6-Person Households | 64 (3.4%) | 0 (0.0%) |
| 7+ Person Households | 0 (0.0%) | 0 (0.0%) |
| Total | 1,157 (62.2%) | 702 (37.8%) |
Female Fertility in Massac
Fertility by Age in Massac
Average fertility rate in Massac is 110.0 births per 1,000 women. Women in the age bracket of 20 to 34 years have the highest fertility rate with 217.0 births per 1,000 women. Women in the age bracket of 20 to 34 years acount for 100.0% of all women with births.
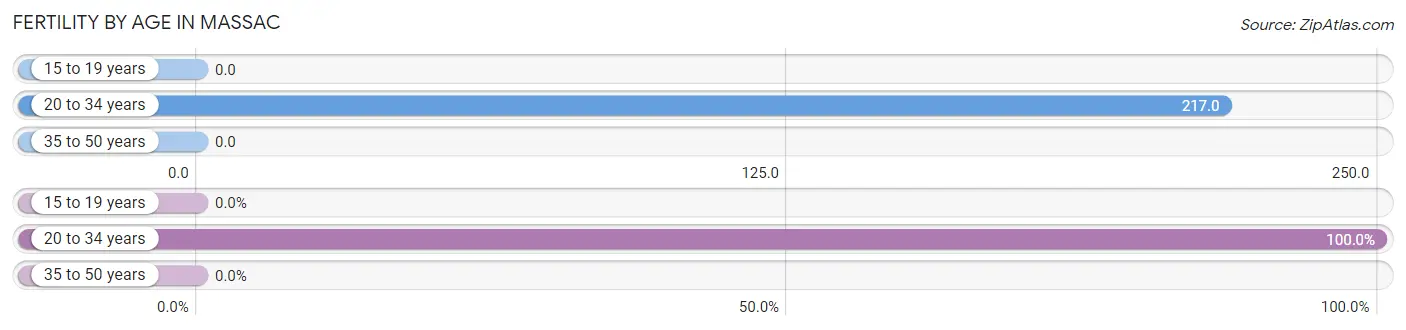
| Age Bracket | Women with Births | Births / 1,000 Women |
| 15 to 19 years | 0 (0.0%) | 0.0 |
| 20 to 34 years | 118 (100.0%) | 217.0 |
| 35 to 50 years | 0 (0.0%) | 0.0 |
| Total | 118 (100.0%) | 110.0 |
Fertility by Age by Marriage Status in Massac
66.1% of women with births (118) in Massac are married. The highest percentage of unmarried women with births falls into 20 to 34 years age bracket with 33.9% of them unmarried at the time of birth, while the lowest percentage of unmarried women with births belong to 20 to 34 years age bracket with 33.9% of them unmarried.
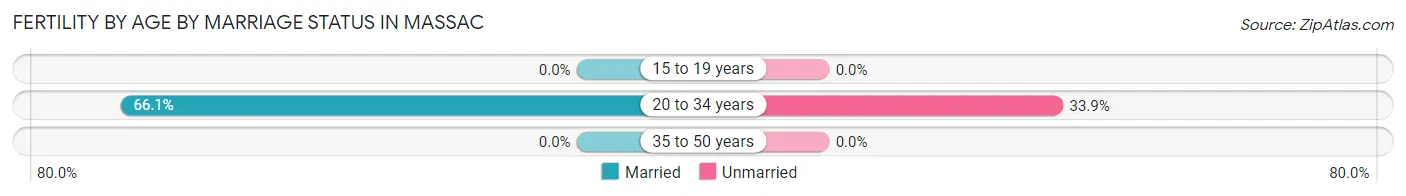
| Age Bracket | Married | Unmarried |
| 15 to 19 years | 0 (0.0%) | 0 (0.0%) |
| 20 to 34 years | 78 (66.1%) | 40 (33.9%) |
| 35 to 50 years | 0 (0.0%) | 0 (0.0%) |
| Total | 78 (66.1%) | 40 (33.9%) |
Fertility by Education in Massac
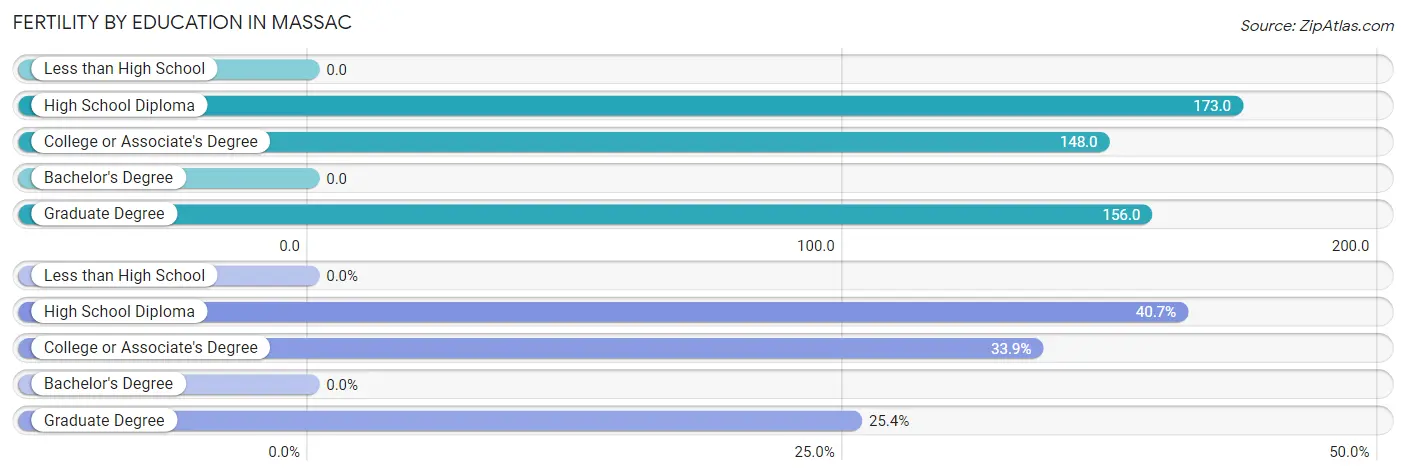
| Educational Attainment | Women with Births | Births / 1,000 Women |
| Less than High School | 0 (0.0%) | 0.0 |
| High School Diploma | 48 (40.7%) | 173.0 |
| College or Associate's Degree | 40 (33.9%) | 148.0 |
| Bachelor's Degree | 0 (0.0%) | 0.0 |
| Graduate Degree | 30 (25.4%) | 156.0 |
| Total | 118 (100.0%) | 110.0 |
Fertility by Education by Marriage Status in Massac
33.9% of women with births in Massac are unmarried. Women with the educational attainment of high school diploma are most likely to be married with 100.0% of them married at childbirth, while women with the educational attainment of college or associate's degree are least likely to be married with 100.0% of them unmarried at childbirth.
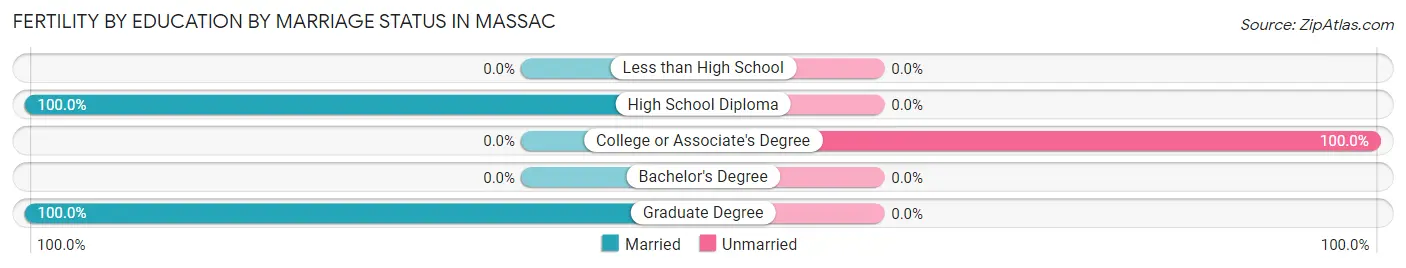
| Educational Attainment | Married | Unmarried |
| Less than High School | 0 (0.0%) | 0 (0.0%) |
| High School Diploma | 48 (100.0%) | 0 (0.0%) |
| College or Associate's Degree | 0 (0.0%) | 40 (100.0%) |
| Bachelor's Degree | 0 (0.0%) | 0 (0.0%) |
| Graduate Degree | 30 (100.0%) | 0 (0.0%) |
| Total | 78 (66.1%) | 40 (33.9%) |
Employment Characteristics in Massac
Employment by Class of Employer in Massac
Among the 2,040 employed individuals in Massac, private company employees (1,490 | 73.0%), local government employees (185 | 9.1%), and not-for-profit organizations (149 | 7.3%) make up the most common classes of employment.
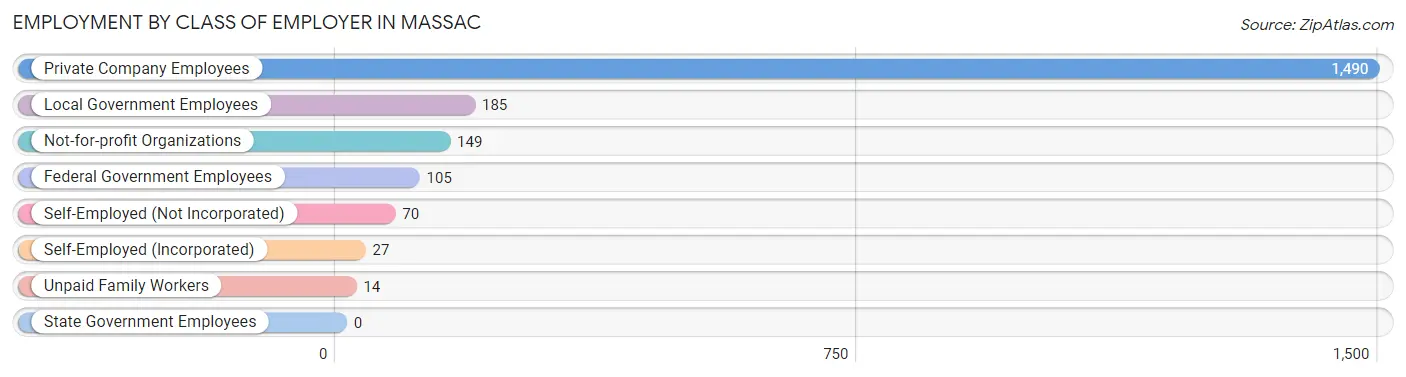
| Employer Class | # Employees | % Employees |
| Private Company Employees | 1,490 | 73.0% |
| Self-Employed (Incorporated) | 27 | 1.3% |
| Self-Employed (Not Incorporated) | 70 | 3.4% |
| Not-for-profit Organizations | 149 | 7.3% |
| Local Government Employees | 185 | 9.1% |
| State Government Employees | 0 | 0.0% |
| Federal Government Employees | 105 | 5.1% |
| Unpaid Family Workers | 14 | 0.7% |
| Total | 2,040 | 100.0% |
Employment Status by Age in Massac
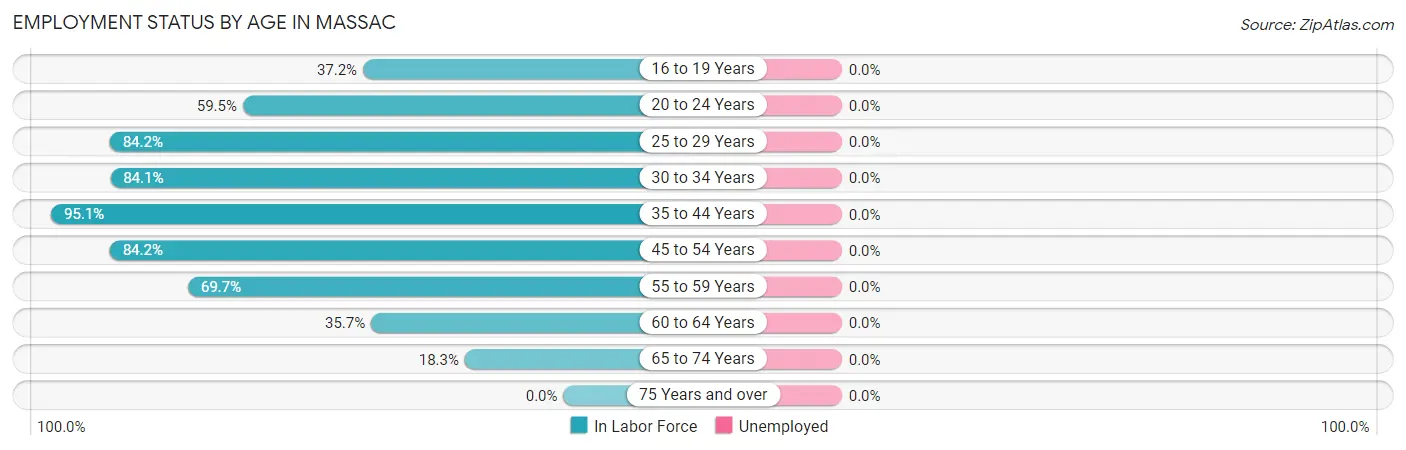
| Age Bracket | In Labor Force | Unemployed |
| 16 to 19 Years | 87 (37.2%) | 0 (0.0%) |
| 20 to 24 Years | 314 (59.5%) | 0 (0.0%) |
| 25 to 29 Years | 330 (84.2%) | 0 (0.0%) |
| 30 to 34 Years | 333 (84.1%) | 0 (0.0%) |
| 35 to 44 Years | 444 (95.1%) | 0 (0.0%) |
| 45 to 54 Years | 288 (84.2%) | 0 (0.0%) |
| 55 to 59 Years | 101 (69.7%) | 0 (0.0%) |
| 60 to 64 Years | 85 (35.7%) | 0 (0.0%) |
| 65 to 74 Years | 86 (18.3%) | 0 (0.0%) |
| 75 Years and over | 0 (0.0%) | 0 (0.0%) |
| Total | 2,068 (57.9%) | 0 (0.0%) |
Employment Status by Educational Attainment in Massac
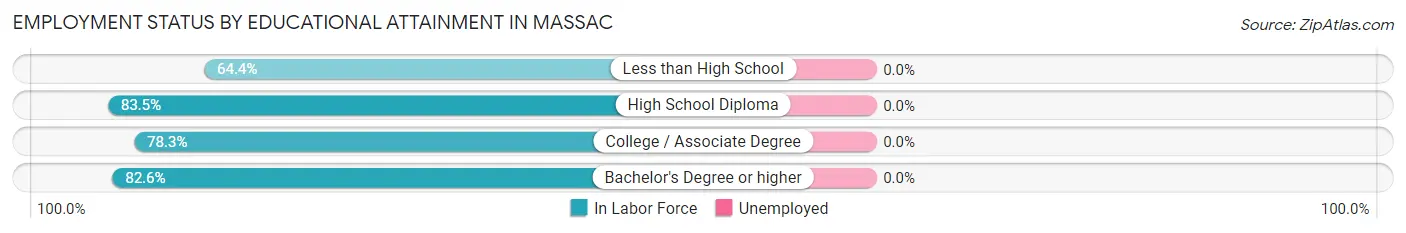
| Educational Attainment | In Labor Force | Unemployed |
| Less than High School | 130 (64.4%) | 0 (0.0%) |
| High School Diploma | 365 (83.5%) | 0 (0.0%) |
| College / Associate Degree | 393 (78.3%) | 0 (0.0%) |
| Bachelor's Degree or higher | 693 (82.6%) | 0 (0.0%) |
| Total | 1,580 (79.8%) | 0 (0.0%) |
Employment Occupations by Sex in Massac
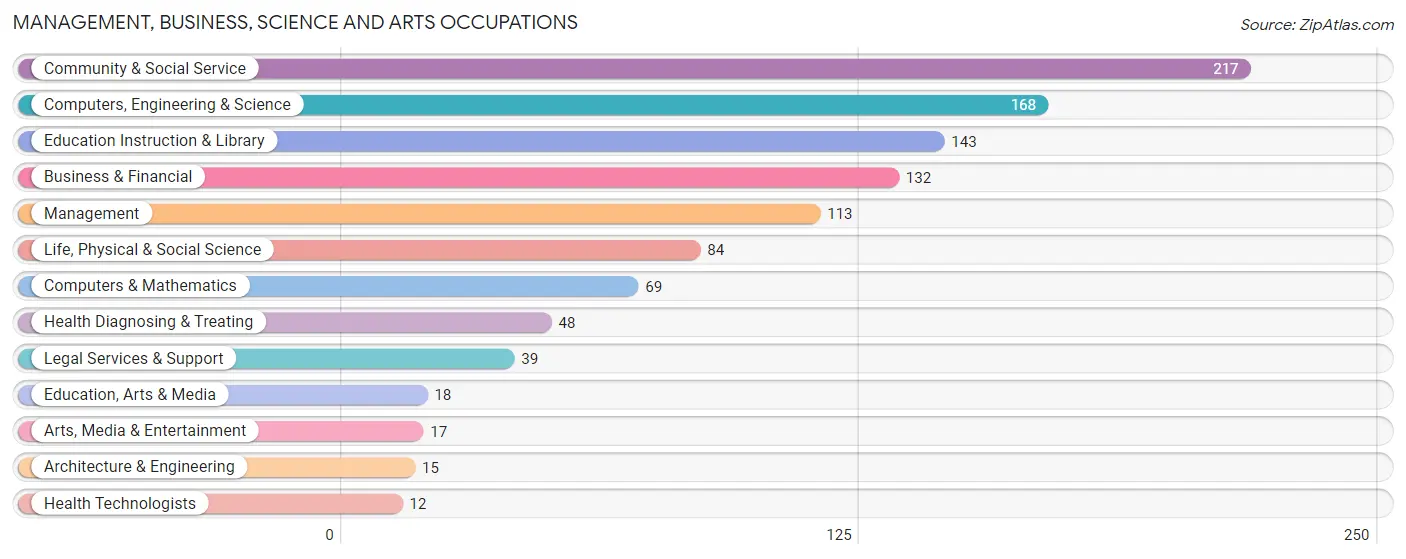
Management, Business, Science and Arts Occupations
The most common Management, Business, Science and Arts occupations in Massac are Community & Social Service (217 | 10.5%), Computers, Engineering & Science (168 | 8.2%), Education Instruction & Library (143 | 7.0%), Business & Financial (132 | 6.4%), and Management (113 | 5.5%).
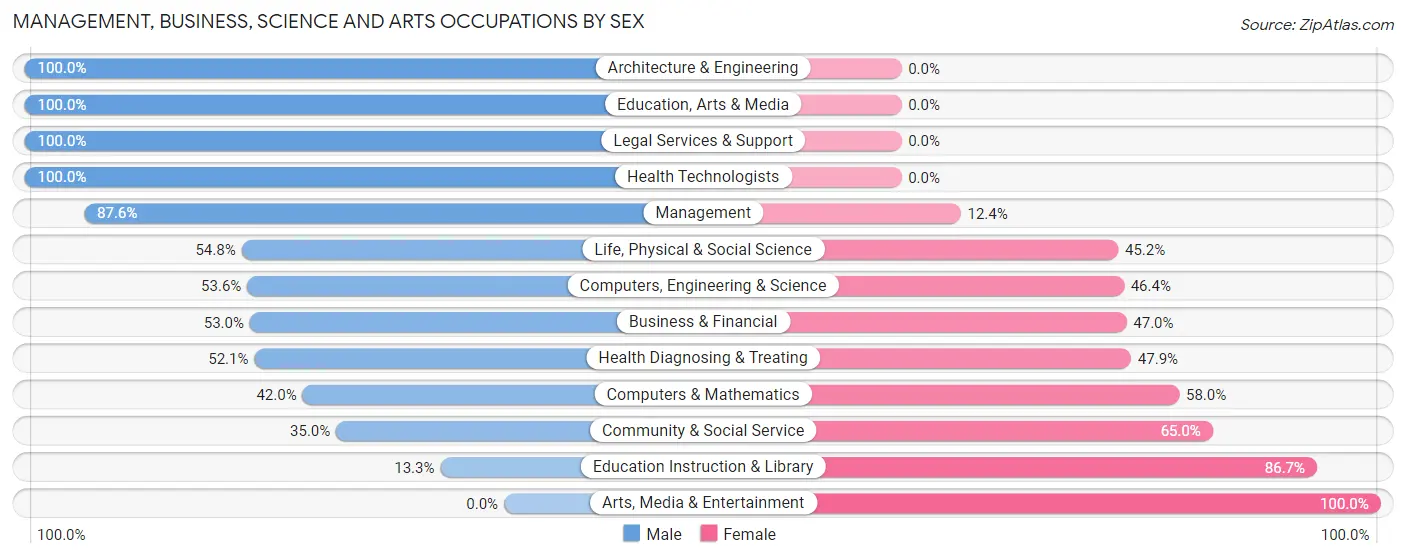
Management, Business, Science and Arts Occupations by Sex
Within the Management, Business, Science and Arts occupations in Massac, the most male-oriented occupations are Architecture & Engineering (100.0%), Education, Arts & Media (100.0%), and Legal Services & Support (100.0%), while the most female-oriented occupations are Arts, Media & Entertainment (100.0%), Education Instruction & Library (86.7%), and Community & Social Service (65.0%).
| Occupation | Male | Female |
| Management | 99 (87.6%) | 14 (12.4%) |
| Business & Financial | 70 (53.0%) | 62 (47.0%) |
| Computers, Engineering & Science | 90 (53.6%) | 78 (46.4%) |
| Computers & Mathematics | 29 (42.0%) | 40 (58.0%) |
| Architecture & Engineering | 15 (100.0%) | 0 (0.0%) |
| Life, Physical & Social Science | 46 (54.8%) | 38 (45.2%) |
| Community & Social Service | 76 (35.0%) | 141 (65.0%) |
| Education, Arts & Media | 18 (100.0%) | 0 (0.0%) |
| Legal Services & Support | 39 (100.0%) | 0 (0.0%) |
| Education Instruction & Library | 19 (13.3%) | 124 (86.7%) |
| Arts, Media & Entertainment | 0 (0.0%) | 17 (100.0%) |
| Health Diagnosing & Treating | 25 (52.1%) | 23 (47.9%) |
| Health Technologists | 12 (100.0%) | 0 (0.0%) |
| Total (Category) | 360 (53.1%) | 318 (46.9%) |
| Total (Overall) | 1,155 (56.1%) | 904 (43.9%) |
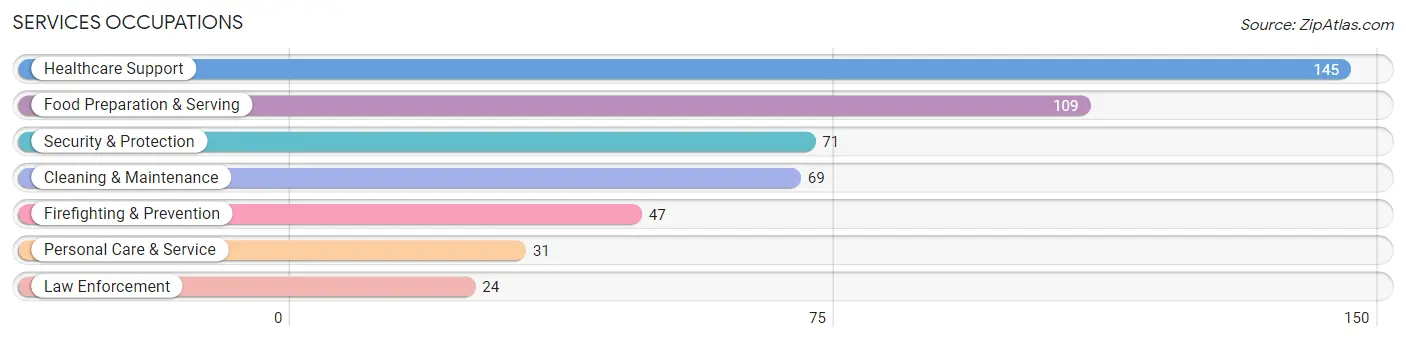
Services Occupations
The most common Services occupations in Massac are Healthcare Support (145 | 7.0%), Food Preparation & Serving (109 | 5.3%), Security & Protection (71 | 3.5%), Cleaning & Maintenance (69 | 3.4%), and Firefighting & Prevention (47 | 2.3%).
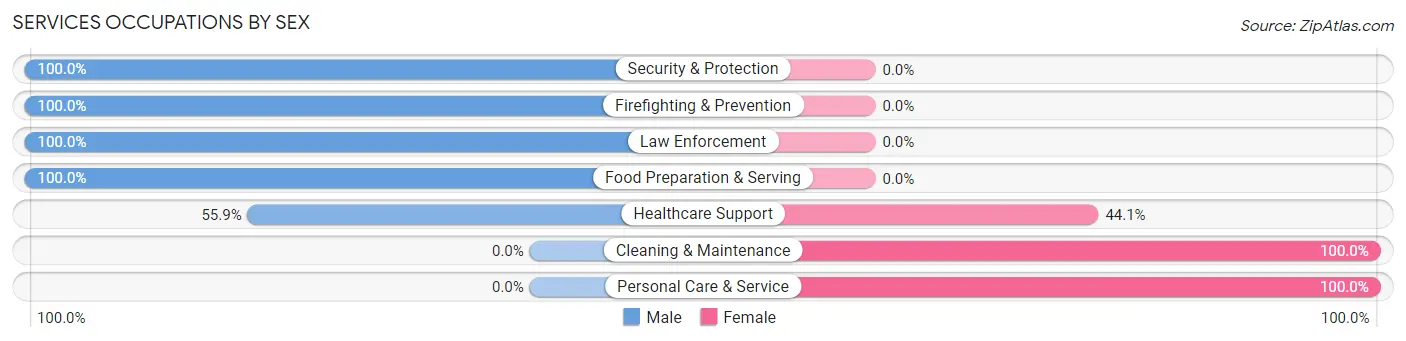
Services Occupations by Sex
Within the Services occupations in Massac, the most male-oriented occupations are Security & Protection (100.0%), Firefighting & Prevention (100.0%), and Law Enforcement (100.0%), while the most female-oriented occupations are Cleaning & Maintenance (100.0%), Personal Care & Service (100.0%), and Healthcare Support (44.1%).
| Occupation | Male | Female |
| Healthcare Support | 81 (55.9%) | 64 (44.1%) |
| Security & Protection | 71 (100.0%) | 0 (0.0%) |
| Firefighting & Prevention | 47 (100.0%) | 0 (0.0%) |
| Law Enforcement | 24 (100.0%) | 0 (0.0%) |
| Food Preparation & Serving | 109 (100.0%) | 0 (0.0%) |
| Cleaning & Maintenance | 0 (0.0%) | 69 (100.0%) |
| Personal Care & Service | 0 (0.0%) | 31 (100.0%) |
| Total (Category) | 261 (61.4%) | 164 (38.6%) |
| Total (Overall) | 1,155 (56.1%) | 904 (43.9%) |
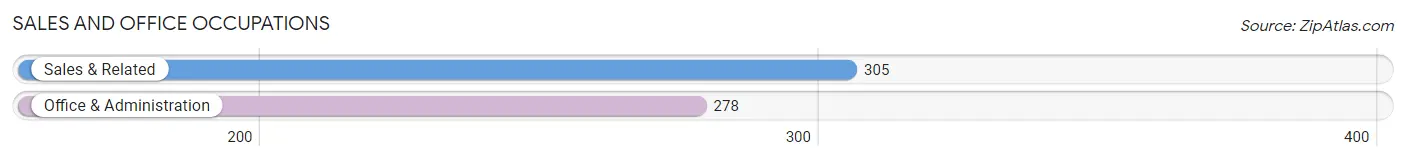
Sales and Office Occupations
The most common Sales and Office occupations in Massac are Sales & Related (305 | 14.8%), and Office & Administration (278 | 13.5%).
Sales and Office Occupations by Sex
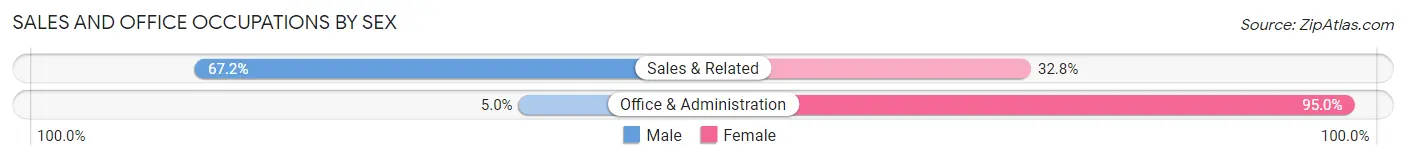
| Occupation | Male | Female |
| Sales & Related | 205 (67.2%) | 100 (32.8%) |
| Office & Administration | 14 (5.0%) | 264 (95.0%) |
| Total (Category) | 219 (37.6%) | 364 (62.4%) |
| Total (Overall) | 1,155 (56.1%) | 904 (43.9%) |
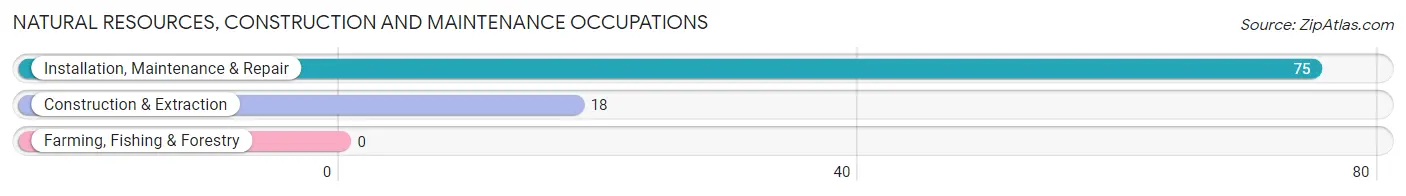
Natural Resources, Construction and Maintenance Occupations
The most common Natural Resources, Construction and Maintenance occupations in Massac are Installation, Maintenance & Repair (75 | 3.6%), and Construction & Extraction (18 | 0.9%).
Natural Resources, Construction and Maintenance Occupations by Sex
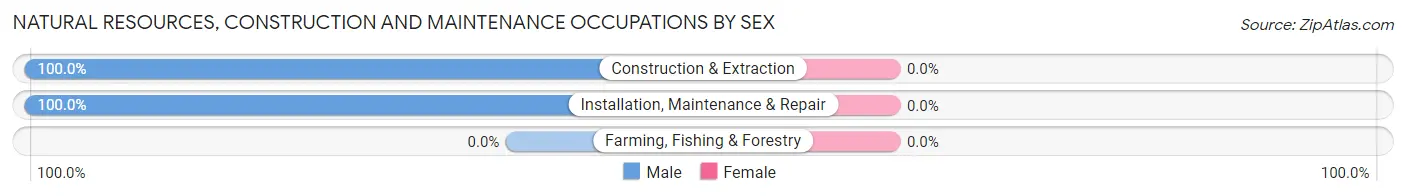
| Occupation | Male | Female |
| Farming, Fishing & Forestry | 0 (0.0%) | 0 (0.0%) |
| Construction & Extraction | 18 (100.0%) | 0 (0.0%) |
| Installation, Maintenance & Repair | 75 (100.0%) | 0 (0.0%) |
| Total (Category) | 93 (100.0%) | 0 (0.0%) |
| Total (Overall) | 1,155 (56.1%) | 904 (43.9%) |
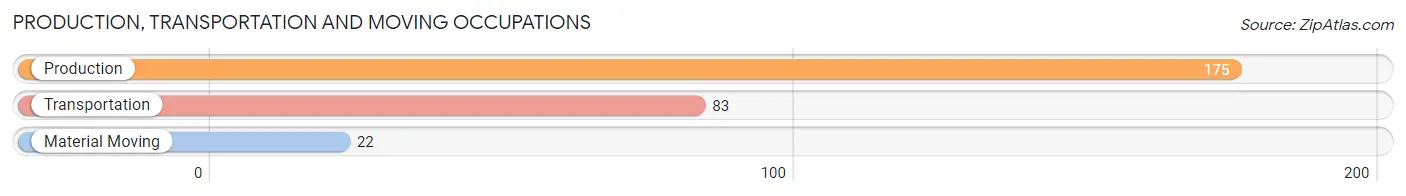
Production, Transportation and Moving Occupations
The most common Production, Transportation and Moving occupations in Massac are Production (175 | 8.5%), Transportation (83 | 4.0%), and Material Moving (22 | 1.1%).
Production, Transportation and Moving Occupations by Sex
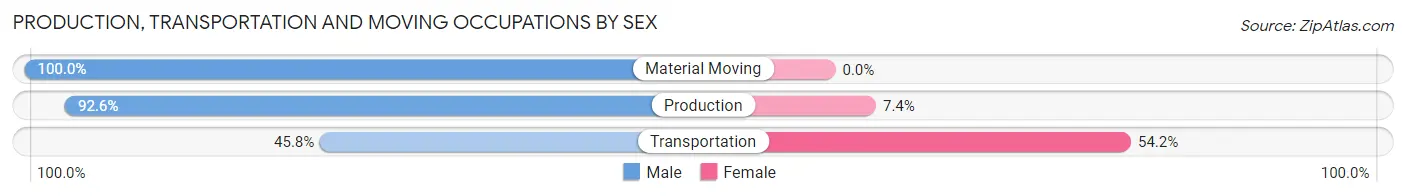
| Occupation | Male | Female |
| Production | 162 (92.6%) | 13 (7.4%) |
| Transportation | 38 (45.8%) | 45 (54.2%) |
| Material Moving | 22 (100.0%) | 0 (0.0%) |
| Total (Category) | 222 (79.3%) | 58 (20.7%) |
| Total (Overall) | 1,155 (56.1%) | 904 (43.9%) |
Employment Industries by Sex in Massac
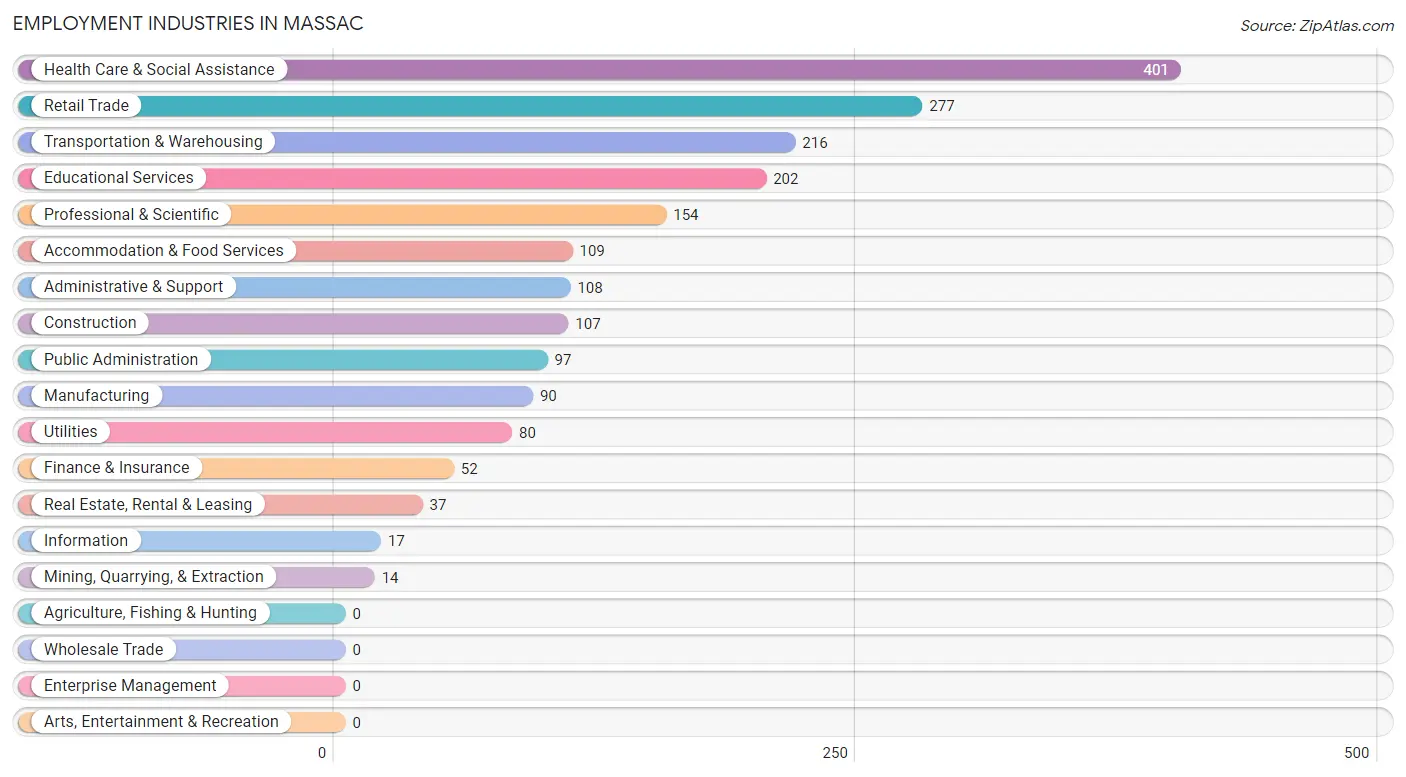
Employment Industries in Massac
The major employment industries in Massac include Health Care & Social Assistance (401 | 19.5%), Retail Trade (277 | 13.5%), Transportation & Warehousing (216 | 10.5%), Educational Services (202 | 9.8%), and Professional & Scientific (154 | 7.5%).
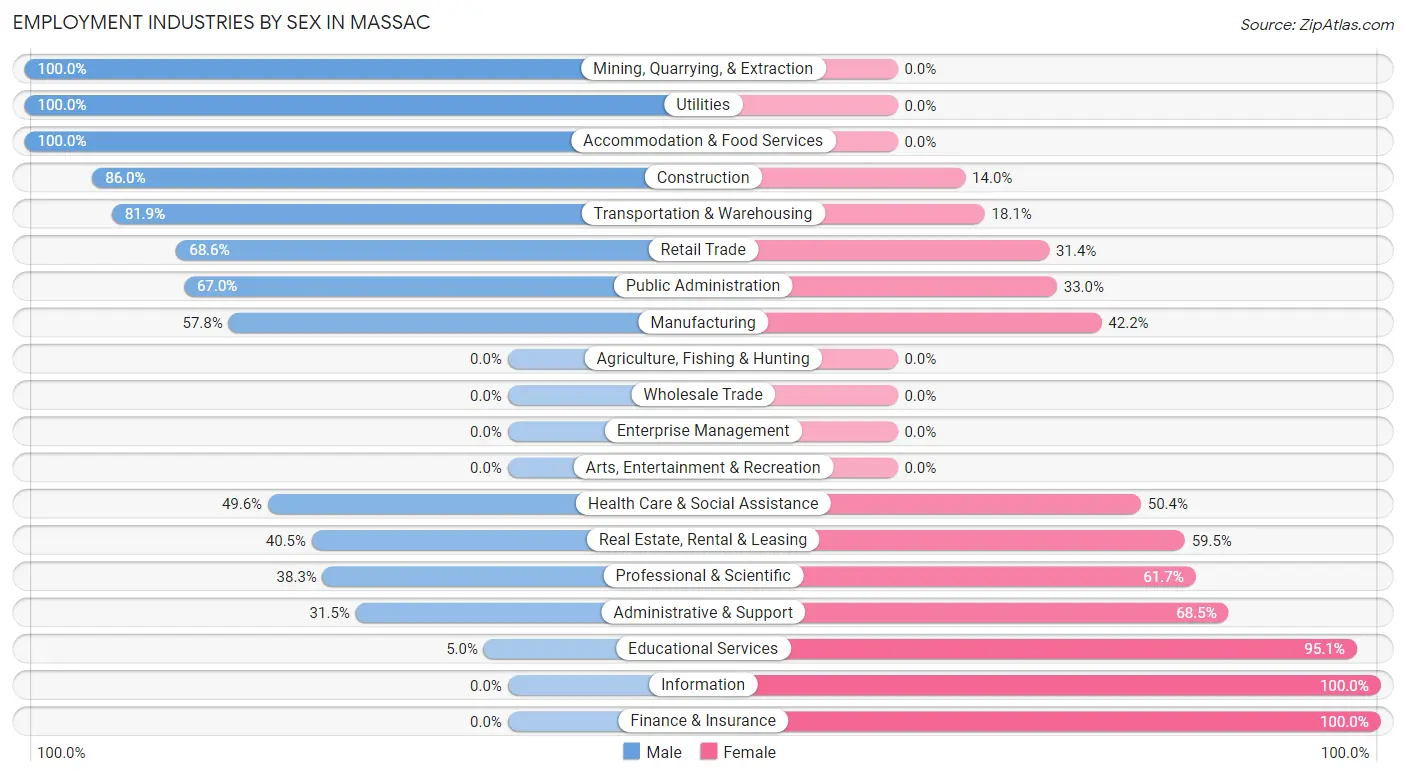
Employment Industries by Sex in Massac
The Massac industries that see more men than women are Mining, Quarrying, & Extraction (100.0%), Utilities (100.0%), and Accommodation & Food Services (100.0%), whereas the industries that tend to have a higher number of women are Information (100.0%), Finance & Insurance (100.0%), and Educational Services (95.1%).
| Industry | Male | Female |
| Agriculture, Fishing & Hunting | 0 (0.0%) | 0 (0.0%) |
| Mining, Quarrying, & Extraction | 14 (100.0%) | 0 (0.0%) |
| Construction | 92 (86.0%) | 15 (14.0%) |
| Manufacturing | 52 (57.8%) | 38 (42.2%) |
| Wholesale Trade | 0 (0.0%) | 0 (0.0%) |
| Retail Trade | 190 (68.6%) | 87 (31.4%) |
| Transportation & Warehousing | 177 (81.9%) | 39 (18.1%) |
| Utilities | 80 (100.0%) | 0 (0.0%) |
| Information | 0 (0.0%) | 17 (100.0%) |
| Finance & Insurance | 0 (0.0%) | 52 (100.0%) |
| Real Estate, Rental & Leasing | 15 (40.5%) | 22 (59.5%) |
| Professional & Scientific | 59 (38.3%) | 95 (61.7%) |
| Enterprise Management | 0 (0.0%) | 0 (0.0%) |
| Administrative & Support | 34 (31.5%) | 74 (68.5%) |
| Educational Services | 10 (5.0%) | 192 (95.1%) |
| Health Care & Social Assistance | 199 (49.6%) | 202 (50.4%) |
| Arts, Entertainment & Recreation | 0 (0.0%) | 0 (0.0%) |
| Accommodation & Food Services | 109 (100.0%) | 0 (0.0%) |
| Public Administration | 65 (67.0%) | 32 (33.0%) |
| Total | 1,155 (56.1%) | 904 (43.9%) |
Education in Massac
School Enrollment in Massac
The most common levels of schooling among the 955 students in Massac are middle school (297 | 31.1%), high school (233 | 24.4%), and elementary school (216 | 22.6%).
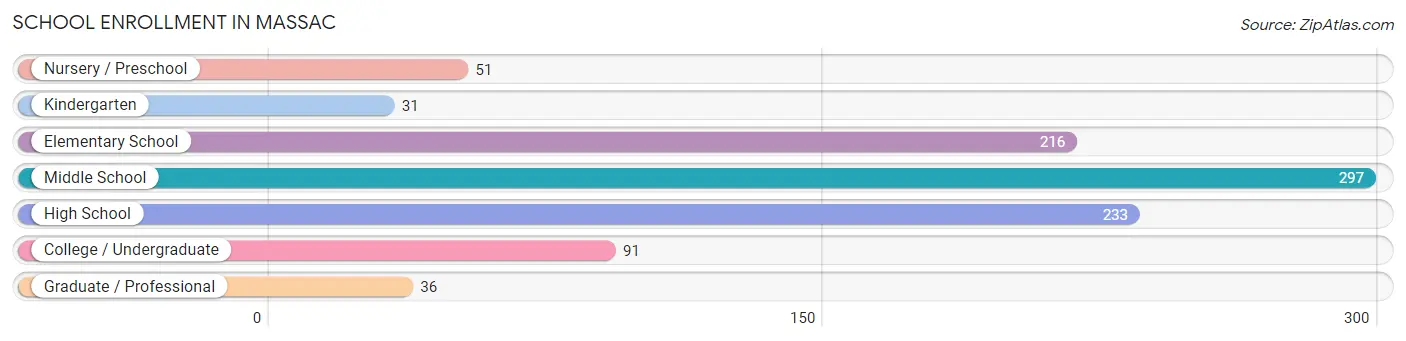
| School Level | # Students | % Students |
| Nursery / Preschool | 51 | 5.3% |
| Kindergarten | 31 | 3.3% |
| Elementary School | 216 | 22.6% |
| Middle School | 297 | 31.1% |
| High School | 233 | 24.4% |
| College / Undergraduate | 91 | 9.5% |
| Graduate / Professional | 36 | 3.8% |
| Total | 955 | 100.0% |
School Enrollment by Age by Funding Source in Massac
Out of a total of 955 students who are enrolled in schools in Massac, 63 (6.6%) attend a private institution, while the remaining 892 (93.4%) are enrolled in public schools. The age group of 10 to 14 year olds has the highest likelihood of being enrolled in private schools, with 49 (15.7% in the age bracket) enrolled. Conversely, the age group of 3 to 4 year olds has the lowest likelihood of being enrolled in a private school, with 51 (100.0% in the age bracket) attending a public institution.
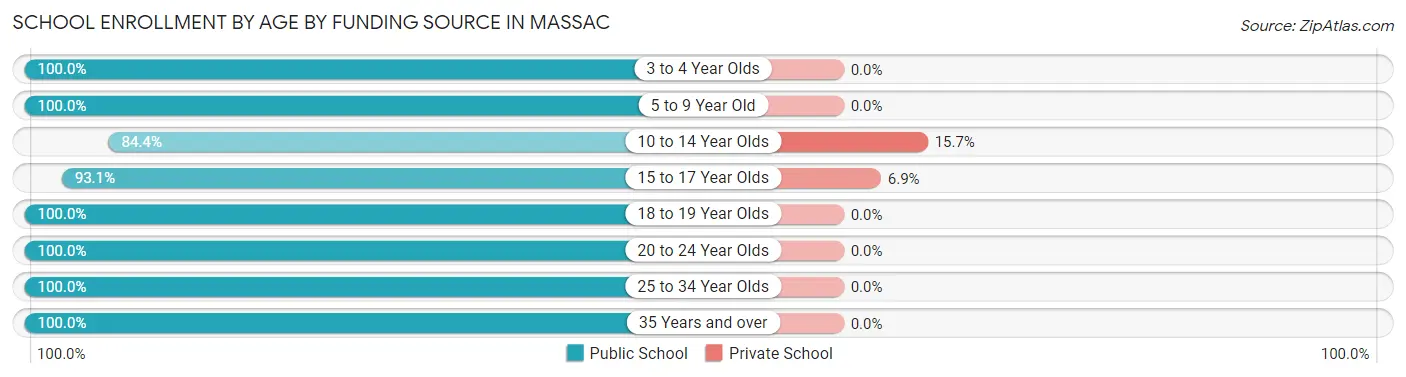
| Age Bracket | Public School | Private School |
| 3 to 4 Year Olds | 51 (100.0%) | 0 (0.0%) |
| 5 to 9 Year Old | 247 (100.0%) | 0 (0.0%) |
| 10 to 14 Year Olds | 264 (84.4%) | 49 (15.7%) |
| 15 to 17 Year Olds | 188 (93.1%) | 14 (6.9%) |
| 18 to 19 Year Olds | 28 (100.0%) | 0 (0.0%) |
| 20 to 24 Year Olds | 65 (100.0%) | 0 (0.0%) |
| 25 to 34 Year Olds | 36 (100.0%) | 0 (0.0%) |
| 35 Years and over | 13 (100.0%) | 0 (0.0%) |
| Total | 892 (93.4%) | 63 (6.6%) |
Educational Attainment by Field of Study in Massac
Business (292 | 25.6%), education (248 | 21.7%), science & technology (177 | 15.5%), communications (104 | 9.1%), and liberal arts & history (55 | 4.8%) are the most common fields of study among 1,143 individuals in Massac who have obtained a bachelor's degree or higher.
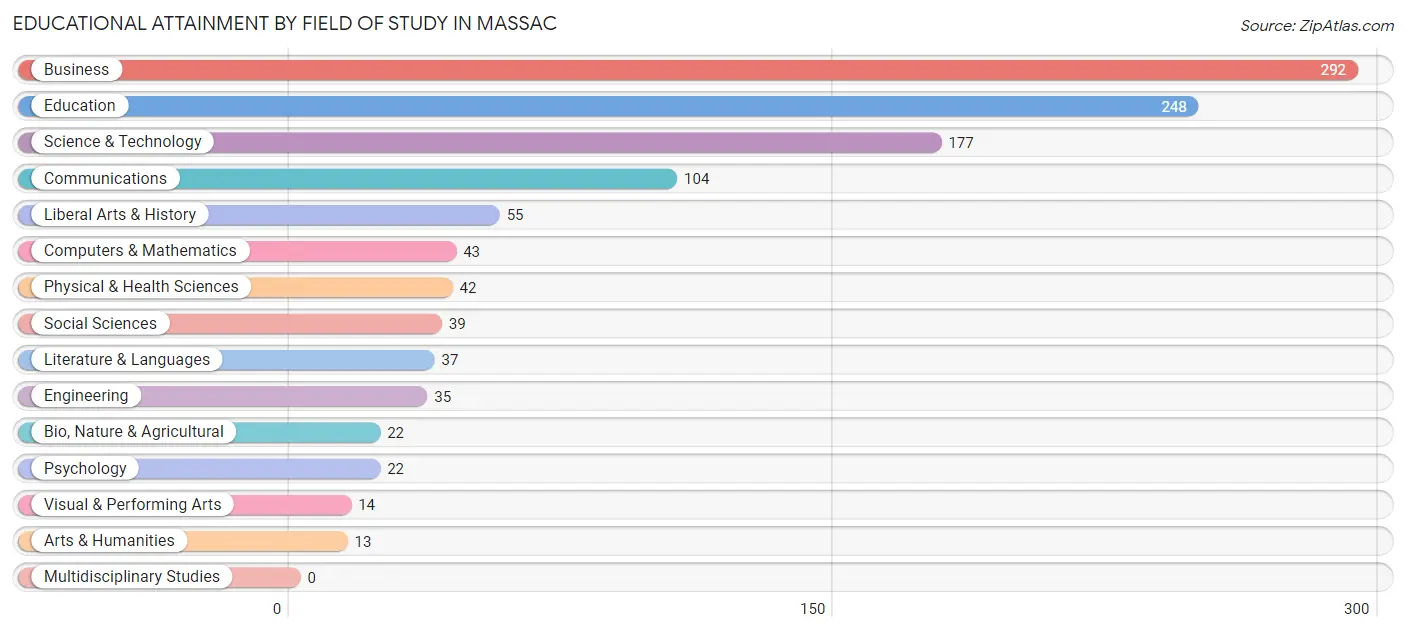
| Field of Study | # Graduates | % Graduates |
| Computers & Mathematics | 43 | 3.8% |
| Bio, Nature & Agricultural | 22 | 1.9% |
| Physical & Health Sciences | 42 | 3.7% |
| Psychology | 22 | 1.9% |
| Social Sciences | 39 | 3.4% |
| Engineering | 35 | 3.1% |
| Multidisciplinary Studies | 0 | 0.0% |
| Science & Technology | 177 | 15.5% |
| Business | 292 | 25.6% |
| Education | 248 | 21.7% |
| Literature & Languages | 37 | 3.2% |
| Liberal Arts & History | 55 | 4.8% |
| Visual & Performing Arts | 14 | 1.2% |
| Communications | 104 | 9.1% |
| Arts & Humanities | 13 | 1.1% |
| Total | 1,143 | 100.0% |
Transportation & Commute in Massac
Vehicle Availability by Sex in Massac
The most prevalent vehicle ownership categories in Massac are males with 2 vehicles (600, accounting for 51.5%) and females with 2 vehicles (446, making up 68.5%).
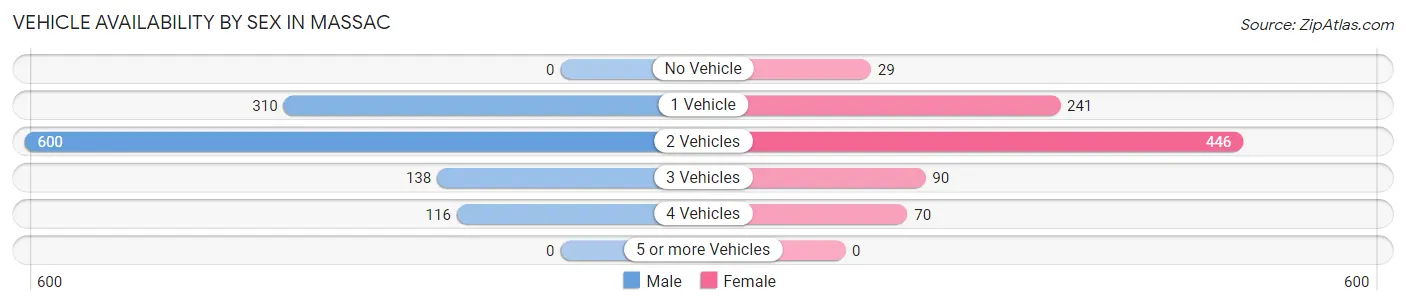
| Vehicles Available | Male | Female |
| No Vehicle | 0 (0.0%) | 29 (3.3%) |
| 1 Vehicle | 310 (26.6%) | 241 (27.5%) |
| 2 Vehicles | 600 (51.5%) | 446 (50.9%) |
| 3 Vehicles | 138 (11.9%) | 90 (10.3%) |
| 4 Vehicles | 116 (10.0%) | 70 (8.0%) |
| 5 or more Vehicles | 0 (0.0%) | 0 (0.0%) |
| Total | 1,164 (100.0%) | 876 (100.0%) |
Commute Time in Massac
The most frequently occuring commute durations in Massac are 10 to 14 minutes (807 commuters, 41.2%), 15 to 19 minutes (374 commuters, 19.1%), and 20 to 24 minutes (210 commuters, 10.7%).

| Commute Time | # Commuters | % Commuters |
| Less than 5 Minutes | 14 | 0.7% |
| 5 to 9 Minutes | 180 | 9.2% |
| 10 to 14 Minutes | 807 | 41.2% |
| 15 to 19 Minutes | 374 | 19.1% |
| 20 to 24 Minutes | 210 | 10.7% |
| 25 to 29 Minutes | 127 | 6.5% |
| 30 to 34 Minutes | 169 | 8.6% |
| 35 to 39 Minutes | 13 | 0.7% |
| 40 to 44 Minutes | 0 | 0.0% |
| 45 to 59 Minutes | 25 | 1.3% |
| 60 to 89 Minutes | 38 | 1.9% |
| 90 or more Minutes | 0 | 0.0% |
Commute Time by Sex in Massac
The most common commute times in Massac are 10 to 14 minutes (359 commuters, 32.3%) for males and 10 to 14 minutes (448 commuters, 53.1%) for females.
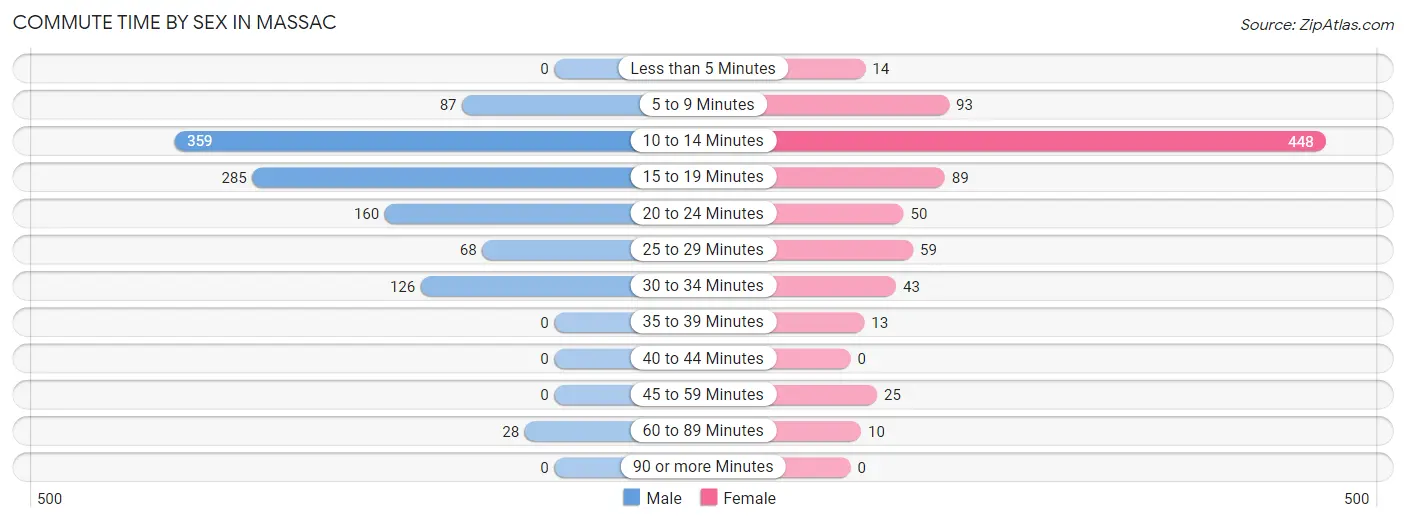
| Commute Time | Male | Female |
| Less than 5 Minutes | 0 (0.0%) | 14 (1.7%) |
| 5 to 9 Minutes | 87 (7.8%) | 93 (11.0%) |
| 10 to 14 Minutes | 359 (32.3%) | 448 (53.1%) |
| 15 to 19 Minutes | 285 (25.6%) | 89 (10.5%) |
| 20 to 24 Minutes | 160 (14.4%) | 50 (5.9%) |
| 25 to 29 Minutes | 68 (6.1%) | 59 (7.0%) |
| 30 to 34 Minutes | 126 (11.3%) | 43 (5.1%) |
| 35 to 39 Minutes | 0 (0.0%) | 13 (1.5%) |
| 40 to 44 Minutes | 0 (0.0%) | 0 (0.0%) |
| 45 to 59 Minutes | 0 (0.0%) | 25 (3.0%) |
| 60 to 89 Minutes | 28 (2.5%) | 10 (1.2%) |
| 90 or more Minutes | 0 (0.0%) | 0 (0.0%) |
Time of Departure to Work by Sex in Massac
The most frequent times of departure to work in Massac are 8:00 AM to 8:29 AM (189, 17.0%) for males and 6:30 AM to 6:59 AM (157, 18.6%) for females.
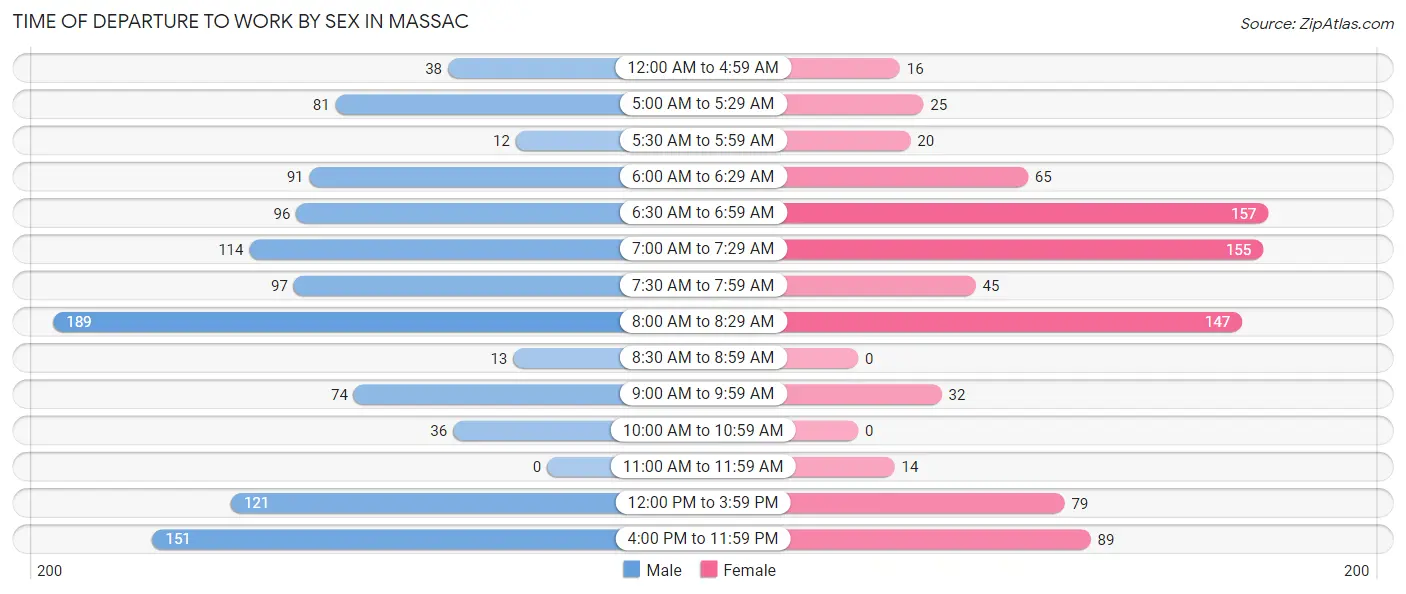
| Time of Departure | Male | Female |
| 12:00 AM to 4:59 AM | 38 (3.4%) | 16 (1.9%) |
| 5:00 AM to 5:29 AM | 81 (7.3%) | 25 (3.0%) |
| 5:30 AM to 5:59 AM | 12 (1.1%) | 20 (2.4%) |
| 6:00 AM to 6:29 AM | 91 (8.2%) | 65 (7.7%) |
| 6:30 AM to 6:59 AM | 96 (8.6%) | 157 (18.6%) |
| 7:00 AM to 7:29 AM | 114 (10.2%) | 155 (18.4%) |
| 7:30 AM to 7:59 AM | 97 (8.7%) | 45 (5.3%) |
| 8:00 AM to 8:29 AM | 189 (17.0%) | 147 (17.4%) |
| 8:30 AM to 8:59 AM | 13 (1.2%) | 0 (0.0%) |
| 9:00 AM to 9:59 AM | 74 (6.7%) | 32 (3.8%) |
| 10:00 AM to 10:59 AM | 36 (3.2%) | 0 (0.0%) |
| 11:00 AM to 11:59 AM | 0 (0.0%) | 14 (1.7%) |
| 12:00 PM to 3:59 PM | 121 (10.9%) | 79 (9.4%) |
| 4:00 PM to 11:59 PM | 151 (13.6%) | 89 (10.5%) |
| Total | 1,113 (100.0%) | 844 (100.0%) |
Housing Occupancy in Massac
Occupancy by Ownership in Massac
Of the total 1,859 dwellings in Massac, owner-occupied units account for 1,171 (63.0%), while renter-occupied units make up 688 (37.0%).
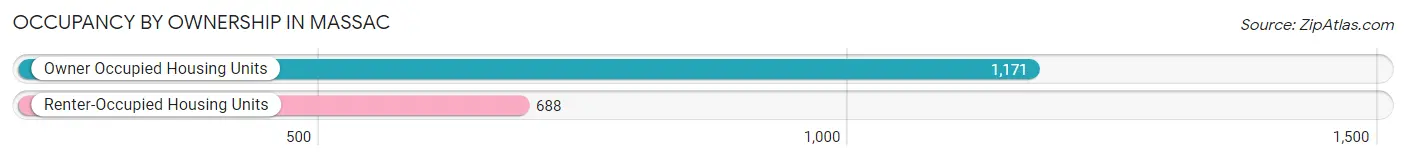
| Occupancy | # Housing Units | % Housing Units |
| Owner Occupied Housing Units | 1,171 | 63.0% |
| Renter-Occupied Housing Units | 688 | 37.0% |
| Total Occupied Housing Units | 1,859 | 100.0% |
Occupancy by Household Size in Massac
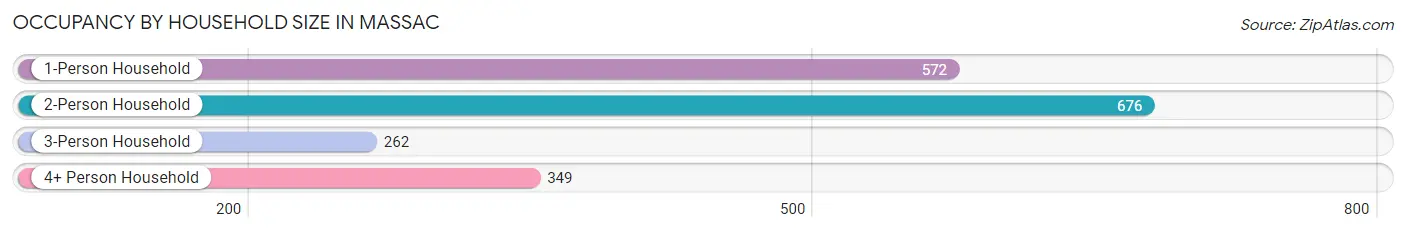
| Household Size | # Housing Units | % Housing Units |
| 1-Person Household | 572 | 30.8% |
| 2-Person Household | 676 | 36.4% |
| 3-Person Household | 262 | 14.1% |
| 4+ Person Household | 349 | 18.8% |
| Total Housing Units | 1,859 | 100.0% |
Occupancy by Ownership by Household Size in Massac
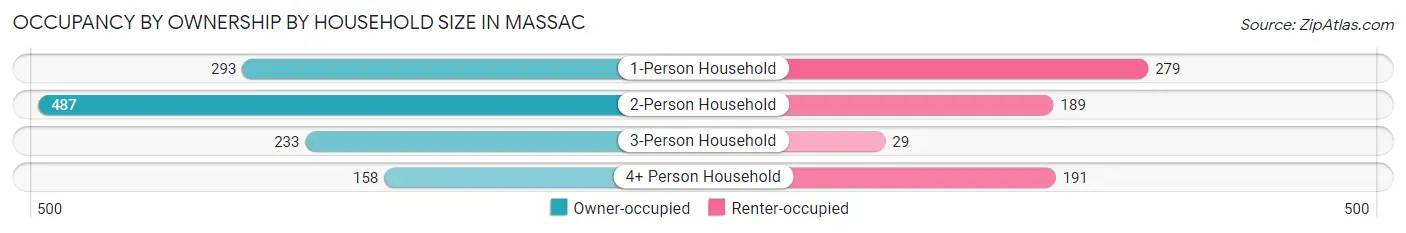
| Household Size | Owner-occupied | Renter-occupied |
| 1-Person Household | 293 (51.2%) | 279 (48.8%) |
| 2-Person Household | 487 (72.0%) | 189 (28.0%) |
| 3-Person Household | 233 (88.9%) | 29 (11.1%) |
| 4+ Person Household | 158 (45.3%) | 191 (54.7%) |
| Total Housing Units | 1,171 (63.0%) | 688 (37.0%) |
Occupancy by Educational Attainment in Massac
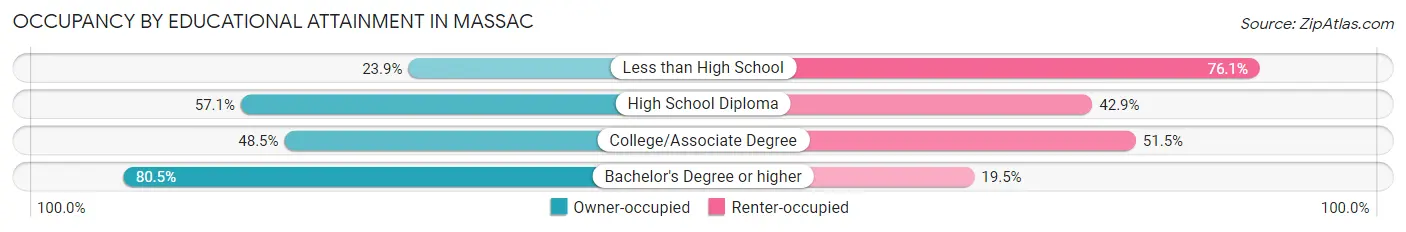
| Household Size | Owner-occupied | Renter-occupied |
| Less than High School | 17 (23.9%) | 54 (76.1%) |
| High School Diploma | 256 (57.1%) | 192 (42.9%) |
| College/Associate Degree | 274 (48.5%) | 291 (51.5%) |
| Bachelor's Degree or higher | 624 (80.5%) | 151 (19.5%) |
Occupancy by Age of Householder in Massac
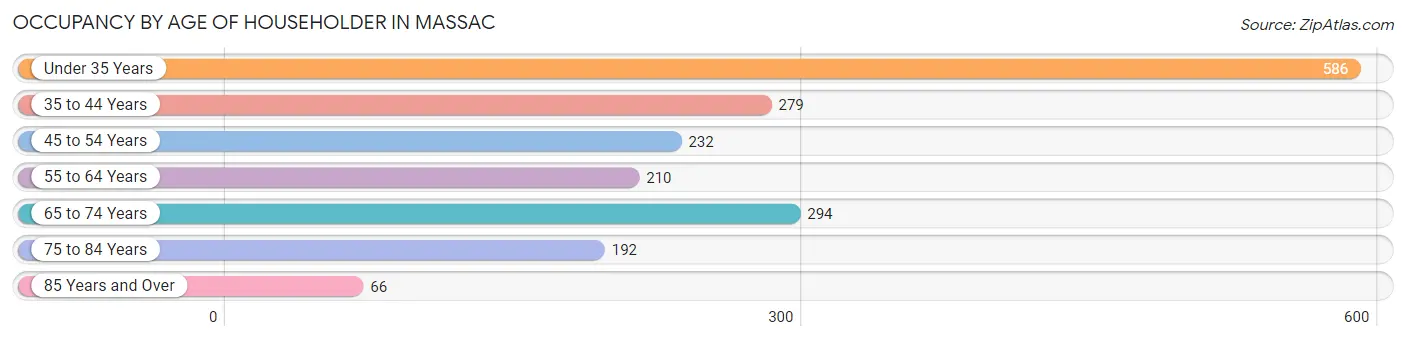
| Age Bracket | # Households | % Households |
| Under 35 Years | 586 | 31.5% |
| 35 to 44 Years | 279 | 15.0% |
| 45 to 54 Years | 232 | 12.5% |
| 55 to 64 Years | 210 | 11.3% |
| 65 to 74 Years | 294 | 15.8% |
| 75 to 84 Years | 192 | 10.3% |
| 85 Years and Over | 66 | 3.5% |
| Total | 1,859 | 100.0% |
Housing Finances in Massac
Median Income by Occupancy in Massac
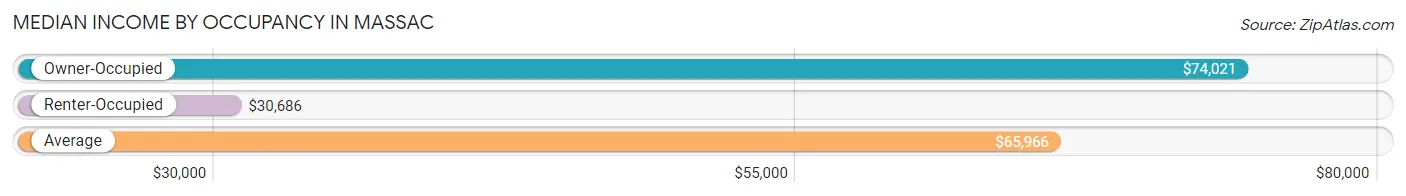
| Occupancy Type | # Households | Median Income |
| Owner-Occupied | 1,171 (63.0%) | $74,021 |
| Renter-Occupied | 688 (37.0%) | $30,686 |
| Average | 1,859 (100.0%) | $65,966 |
Occupancy by Householder Income Bracket in Massac
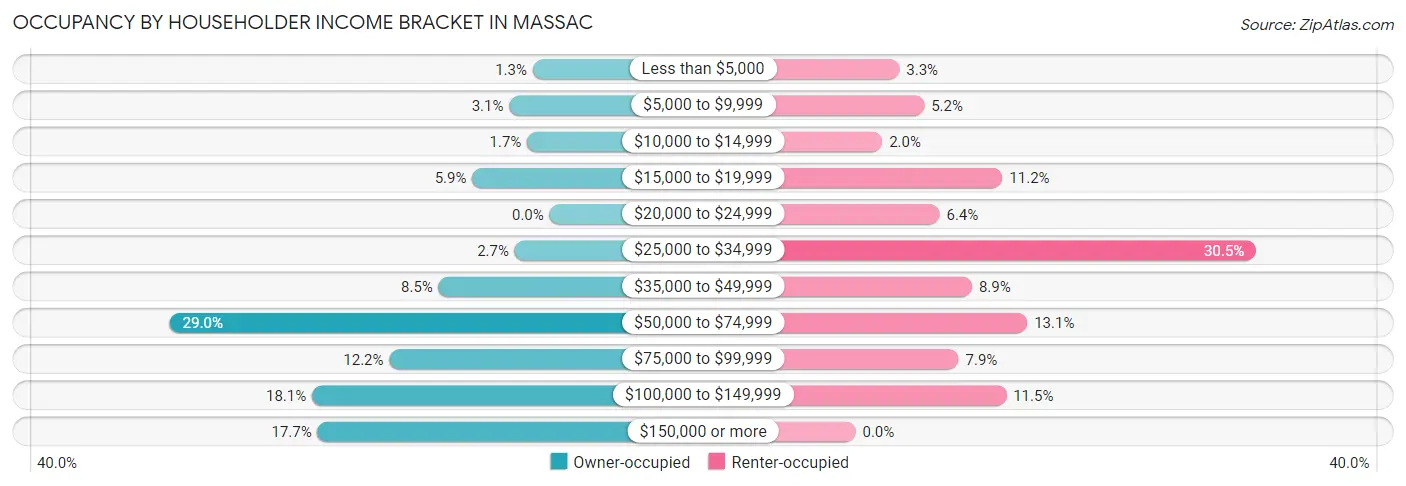
| Income Bracket | Owner-occupied | Renter-occupied |
| Less than $5,000 | 15 (1.3%) | 23 (3.3%) |
| $5,000 to $9,999 | 36 (3.1%) | 36 (5.2%) |
| $10,000 to $14,999 | 20 (1.7%) | 14 (2.0%) |
| $15,000 to $19,999 | 69 (5.9%) | 77 (11.2%) |
| $20,000 to $24,999 | 0 (0.0%) | 44 (6.4%) |
| $25,000 to $34,999 | 31 (2.6%) | 210 (30.5%) |
| $35,000 to $49,999 | 99 (8.5%) | 61 (8.9%) |
| $50,000 to $74,999 | 339 (28.9%) | 90 (13.1%) |
| $75,000 to $99,999 | 143 (12.2%) | 54 (7.9%) |
| $100,000 to $149,999 | 212 (18.1%) | 79 (11.5%) |
| $150,000 or more | 207 (17.7%) | 0 (0.0%) |
| Total | 1,171 (100.0%) | 688 (100.0%) |
Monthly Housing Cost Tiers in Massac
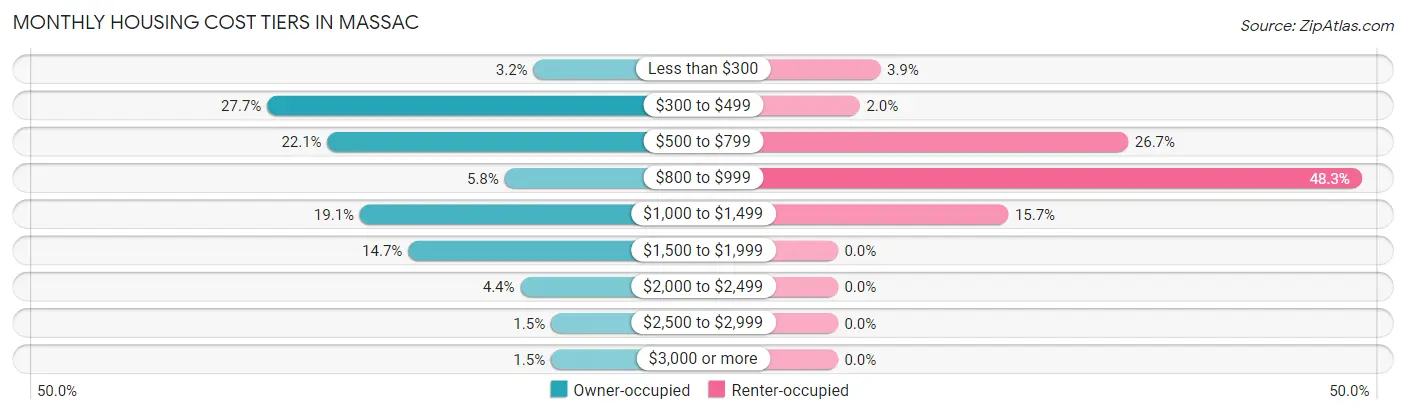
| Monthly Cost | Owner-occupied | Renter-occupied |
| Less than $300 | 37 (3.2%) | 27 (3.9%) |
| $300 to $499 | 324 (27.7%) | 14 (2.0%) |
| $500 to $799 | 259 (22.1%) | 184 (26.7%) |
| $800 to $999 | 68 (5.8%) | 332 (48.3%) |
| $1,000 to $1,499 | 224 (19.1%) | 108 (15.7%) |
| $1,500 to $1,999 | 172 (14.7%) | 0 (0.0%) |
| $2,000 to $2,499 | 51 (4.4%) | 0 (0.0%) |
| $2,500 to $2,999 | 18 (1.5%) | 0 (0.0%) |
| $3,000 or more | 18 (1.5%) | 0 (0.0%) |
| Total | 1,171 (100.0%) | 688 (100.0%) |
Physical Housing Characteristics in Massac
Housing Structures in Massac
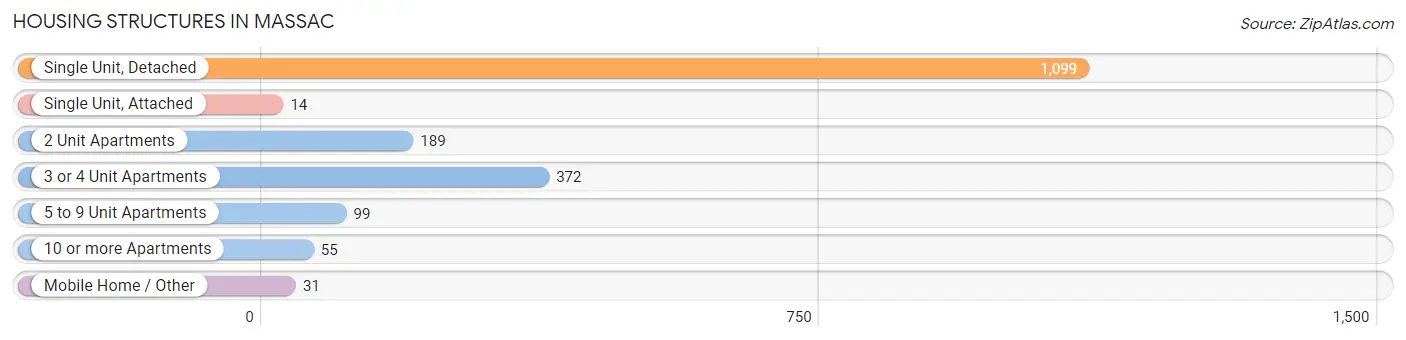
| Structure Type | # Housing Units | % Housing Units |
| Single Unit, Detached | 1,099 | 59.1% |
| Single Unit, Attached | 14 | 0.7% |
| 2 Unit Apartments | 189 | 10.2% |
| 3 or 4 Unit Apartments | 372 | 20.0% |
| 5 to 9 Unit Apartments | 99 | 5.3% |
| 10 or more Apartments | 55 | 3.0% |
| Mobile Home / Other | 31 | 1.7% |
| Total | 1,859 | 100.0% |
Housing Structures by Occupancy in Massac
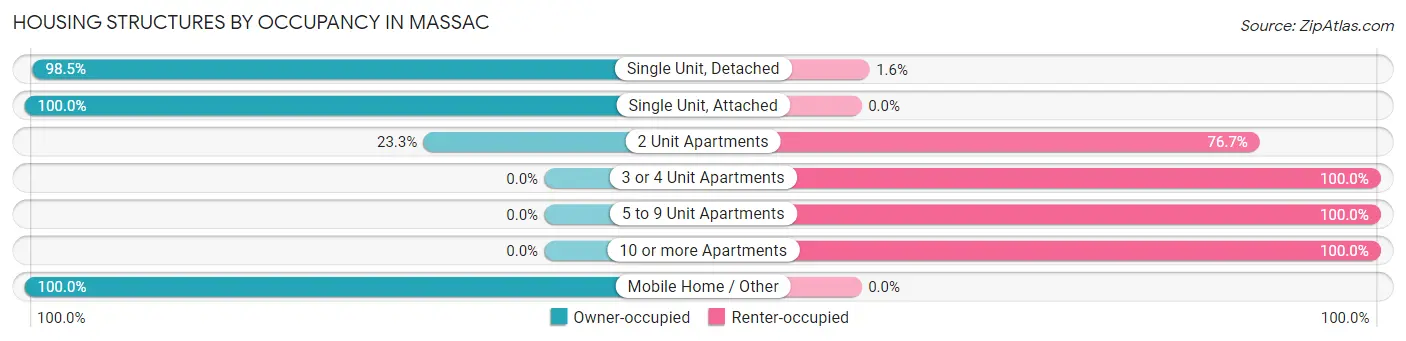
| Structure Type | Owner-occupied | Renter-occupied |
| Single Unit, Detached | 1,082 (98.5%) | 17 (1.5%) |
| Single Unit, Attached | 14 (100.0%) | 0 (0.0%) |
| 2 Unit Apartments | 44 (23.3%) | 145 (76.7%) |
| 3 or 4 Unit Apartments | 0 (0.0%) | 372 (100.0%) |
| 5 to 9 Unit Apartments | 0 (0.0%) | 99 (100.0%) |
| 10 or more Apartments | 0 (0.0%) | 55 (100.0%) |
| Mobile Home / Other | 31 (100.0%) | 0 (0.0%) |
| Total | 1,171 (63.0%) | 688 (37.0%) |
Housing Structures by Number of Rooms in Massac
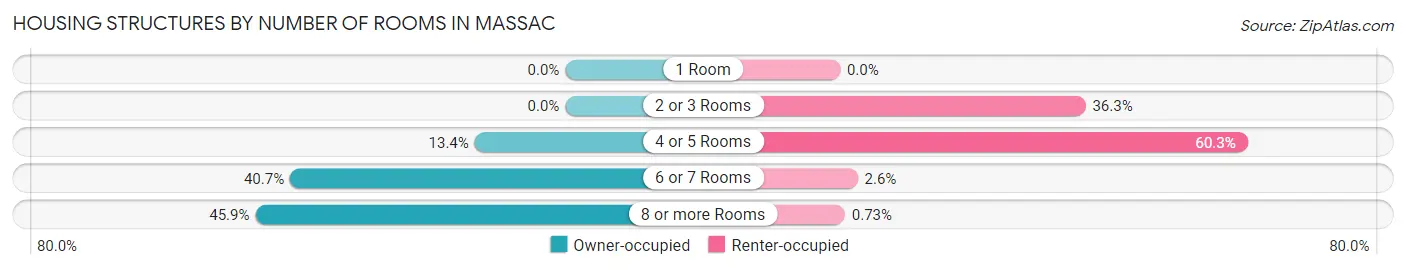
| Number of Rooms | Owner-occupied | Renter-occupied |
| 1 Room | 0 (0.0%) | 0 (0.0%) |
| 2 or 3 Rooms | 0 (0.0%) | 250 (36.3%) |
| 4 or 5 Rooms | 157 (13.4%) | 415 (60.3%) |
| 6 or 7 Rooms | 477 (40.7%) | 18 (2.6%) |
| 8 or more Rooms | 537 (45.9%) | 5 (0.7%) |
| Total | 1,171 (100.0%) | 688 (100.0%) |
Housing Structure by Heating Type in Massac
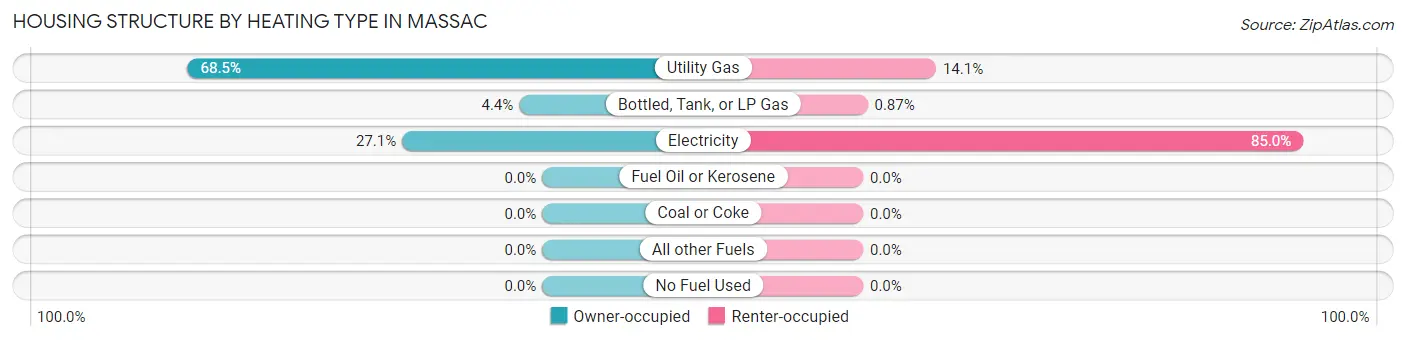
| Heating Type | Owner-occupied | Renter-occupied |
| Utility Gas | 802 (68.5%) | 97 (14.1%) |
| Bottled, Tank, or LP Gas | 52 (4.4%) | 6 (0.9%) |
| Electricity | 317 (27.1%) | 585 (85.0%) |
| Fuel Oil or Kerosene | 0 (0.0%) | 0 (0.0%) |
| Coal or Coke | 0 (0.0%) | 0 (0.0%) |
| All other Fuels | 0 (0.0%) | 0 (0.0%) |
| No Fuel Used | 0 (0.0%) | 0 (0.0%) |
| Total | 1,171 (100.0%) | 688 (100.0%) |
Household Vehicle Usage in Massac
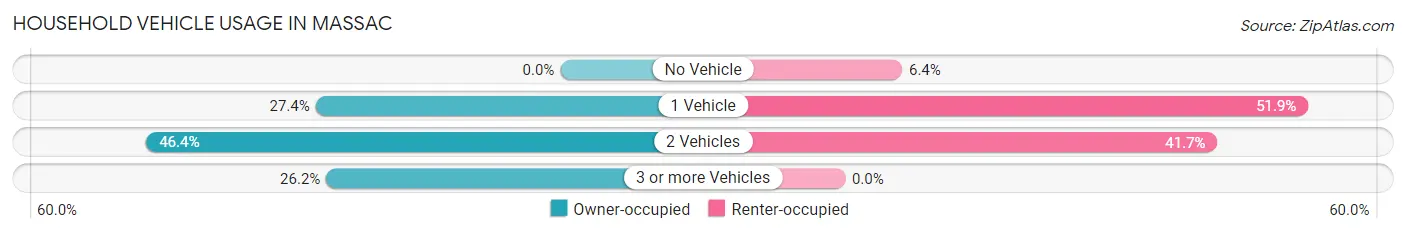
| Vehicles per Household | Owner-occupied | Renter-occupied |
| No Vehicle | 0 (0.0%) | 44 (6.4%) |
| 1 Vehicle | 321 (27.4%) | 357 (51.9%) |
| 2 Vehicles | 543 (46.4%) | 287 (41.7%) |
| 3 or more Vehicles | 307 (26.2%) | 0 (0.0%) |
| Total | 1,171 (100.0%) | 688 (100.0%) |
Real Estate & Mortgages in Massac
Real Estate and Mortgage Overview in Massac
| Characteristic | Without Mortgage | With Mortgage |
| Housing Units | 650 | 521 |
| Median Property Value | $198,100 | $204,300 |
| Median Household Income | $72,708 | $113 |
| Monthly Housing Costs | $486 | $0 |
| Real Estate Taxes | $1,327 | $0 |
Property Value by Mortgage Status in Massac
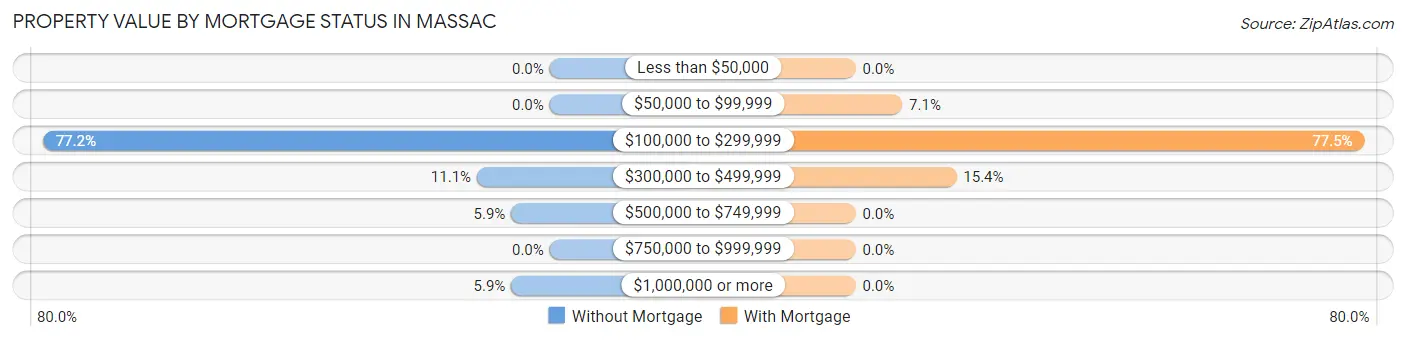
| Property Value | Without Mortgage | With Mortgage |
| Less than $50,000 | 0 (0.0%) | 0 (0.0%) |
| $50,000 to $99,999 | 0 (0.0%) | 37 (7.1%) |
| $100,000 to $299,999 | 502 (77.2%) | 404 (77.5%) |
| $300,000 to $499,999 | 72 (11.1%) | 80 (15.4%) |
| $500,000 to $749,999 | 38 (5.9%) | 0 (0.0%) |
| $750,000 to $999,999 | 0 (0.0%) | 0 (0.0%) |
| $1,000,000 or more | 38 (5.9%) | 0 (0.0%) |
| Total | 650 (100.0%) | 521 (100.0%) |
Household Income by Mortgage Status in Massac
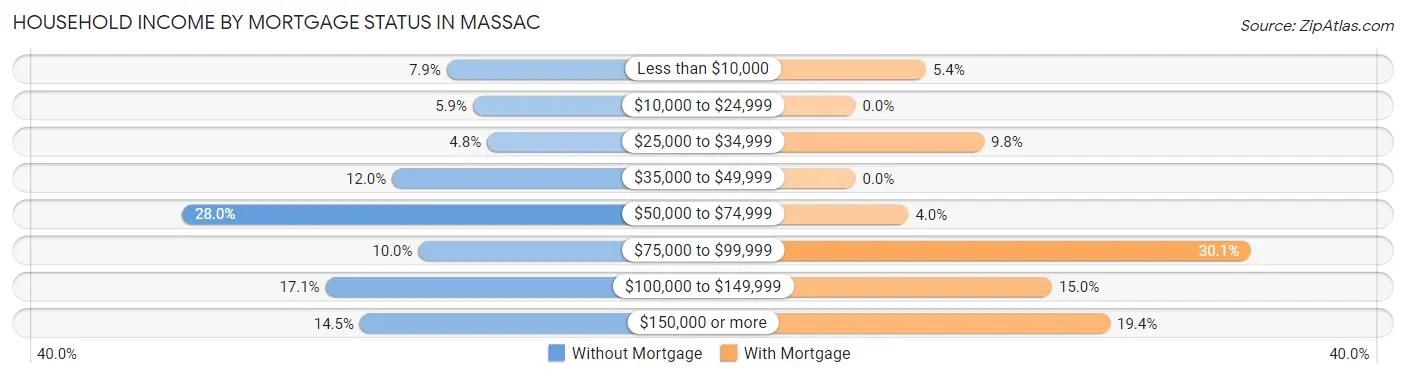
| Household Income | Without Mortgage | With Mortgage |
| Less than $10,000 | 51 (7.9%) | 28 (5.4%) |
| $10,000 to $24,999 | 38 (5.9%) | 0 (0.0%) |
| $25,000 to $34,999 | 31 (4.8%) | 51 (9.8%) |
| $35,000 to $49,999 | 78 (12.0%) | 0 (0.0%) |
| $50,000 to $74,999 | 182 (28.0%) | 21 (4.0%) |
| $75,000 to $99,999 | 65 (10.0%) | 157 (30.1%) |
| $100,000 to $149,999 | 111 (17.1%) | 78 (15.0%) |
| $150,000 or more | 94 (14.5%) | 101 (19.4%) |
| Total | 650 (100.0%) | 521 (100.0%) |
Property Value to Household Income Ratio in Massac
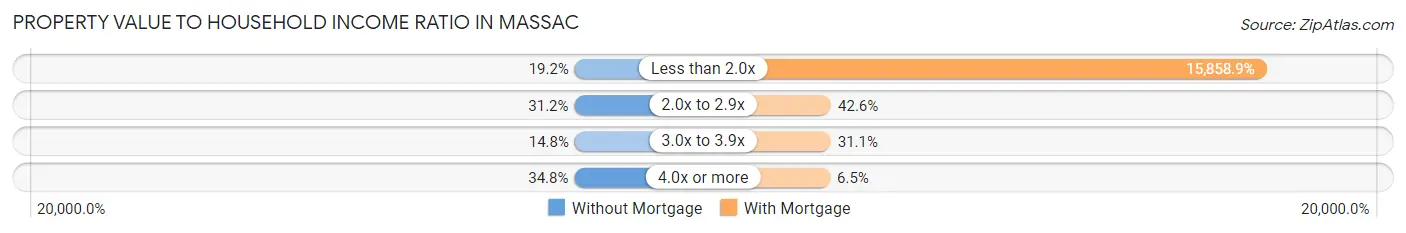
| Value-to-Income Ratio | Without Mortgage | With Mortgage |
| Less than 2.0x | 125 (19.2%) | 82,625 (15,858.9%) |
| 2.0x to 2.9x | 203 (31.2%) | 222 (42.6%) |
| 3.0x to 3.9x | 96 (14.8%) | 162 (31.1%) |
| 4.0x or more | 226 (34.8%) | 34 (6.5%) |
| Total | 650 (100.0%) | 521 (100.0%) |
Real Estate Taxes by Mortgage Status in Massac
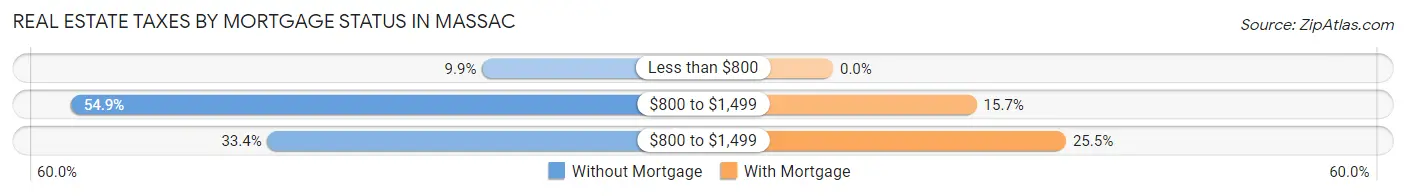
| Property Taxes | Without Mortgage | With Mortgage |
| Less than $800 | 64 (9.9%) | 0 (0.0%) |
| $800 to $1,499 | 357 (54.9%) | 82 (15.7%) |
| $800 to $1,499 | 217 (33.4%) | 133 (25.5%) |
| Total | 650 (100.0%) | 521 (100.0%) |
Health & Disability in Massac
Health Insurance Coverage by Age in Massac
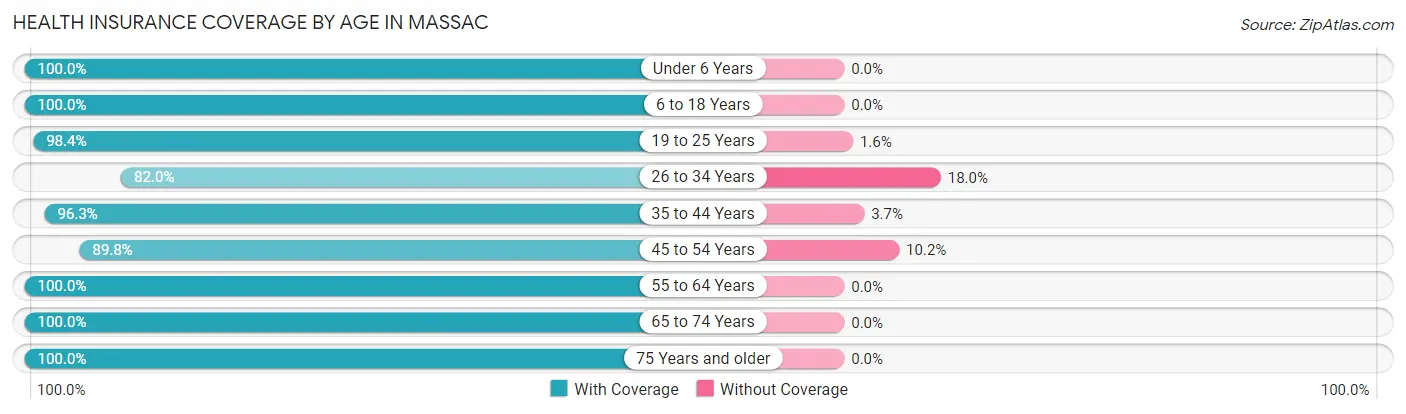
| Age Bracket | With Coverage | Without Coverage |
| Under 6 Years | 529 (100.0%) | 0 (0.0%) |
| 6 to 18 Years | 769 (100.0%) | 0 (0.0%) |
| 19 to 25 Years | 789 (98.4%) | 13 (1.6%) |
| 26 to 34 Years | 492 (82.0%) | 108 (18.0%) |
| 35 to 44 Years | 441 (96.3%) | 17 (3.7%) |
| 45 to 54 Years | 307 (89.8%) | 35 (10.2%) |
| 55 to 64 Years | 383 (100.0%) | 0 (0.0%) |
| 65 to 74 Years | 471 (100.0%) | 0 (0.0%) |
| 75 Years and older | 359 (100.0%) | 0 (0.0%) |
| Total | 4,540 (96.3%) | 173 (3.7%) |
Health Insurance Coverage by Citizenship Status in Massac
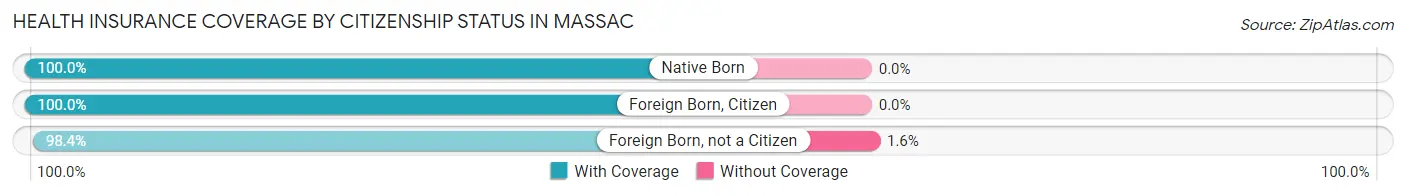
| Citizenship Status | With Coverage | Without Coverage |
| Native Born | 529 (100.0%) | 0 (0.0%) |
| Foreign Born, Citizen | 769 (100.0%) | 0 (0.0%) |
| Foreign Born, not a Citizen | 789 (98.4%) | 13 (1.6%) |
Health Insurance Coverage by Household Income in Massac
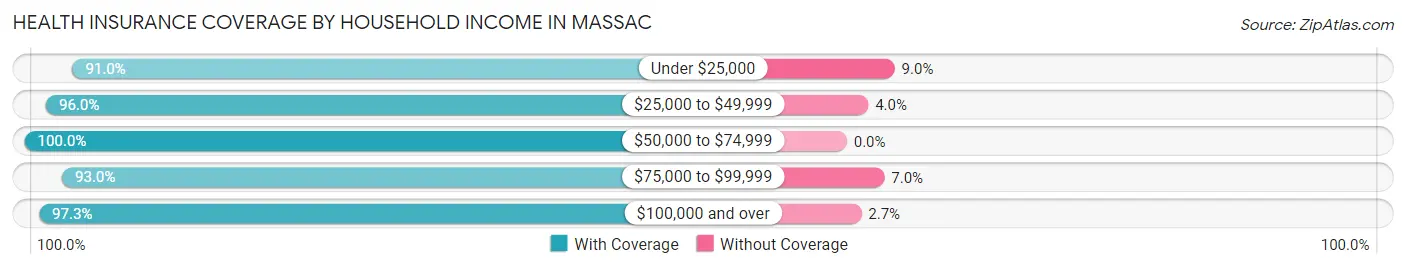
| Household Income | With Coverage | Without Coverage |
| Under $25,000 | 568 (91.0%) | 56 (9.0%) |
| $25,000 to $49,999 | 979 (96.0%) | 41 (4.0%) |
| $50,000 to $74,999 | 1,067 (100.0%) | 0 (0.0%) |
| $75,000 to $99,999 | 463 (93.0%) | 35 (7.0%) |
| $100,000 and over | 1,463 (97.3%) | 41 (2.7%) |
Public vs Private Health Insurance Coverage by Age in Massac
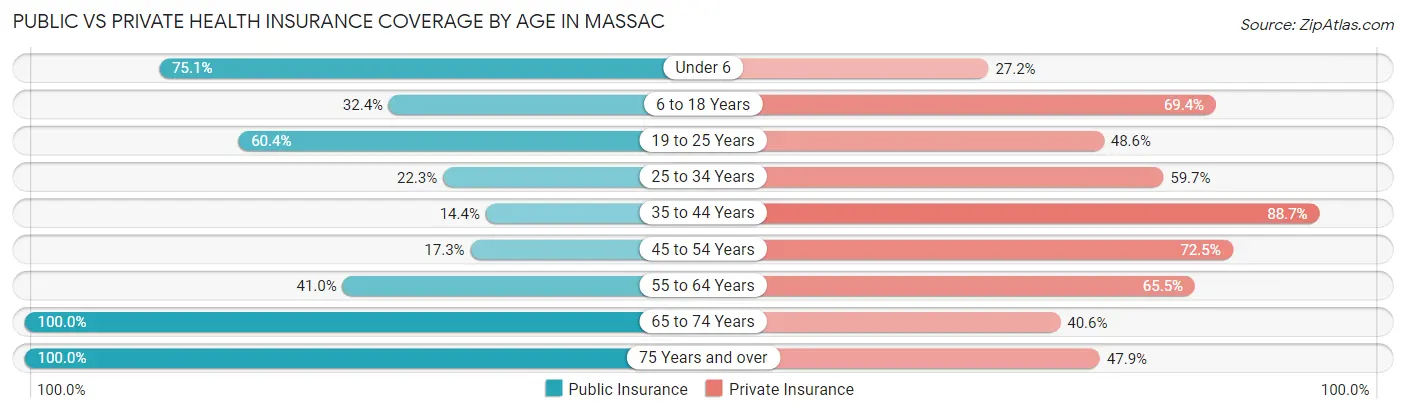
| Age Bracket | Public Insurance | Private Insurance |
| Under 6 | 397 (75.0%) | 144 (27.2%) |
| 6 to 18 Years | 249 (32.4%) | 534 (69.4%) |
| 19 to 25 Years | 484 (60.4%) | 390 (48.6%) |
| 25 to 34 Years | 134 (22.3%) | 358 (59.7%) |
| 35 to 44 Years | 66 (14.4%) | 406 (88.6%) |
| 45 to 54 Years | 59 (17.2%) | 248 (72.5%) |
| 55 to 64 Years | 157 (41.0%) | 251 (65.5%) |
| 65 to 74 Years | 471 (100.0%) | 191 (40.6%) |
| 75 Years and over | 359 (100.0%) | 172 (47.9%) |
| Total | 2,376 (50.4%) | 2,694 (57.2%) |
Disability Status by Sex by Age in Massac
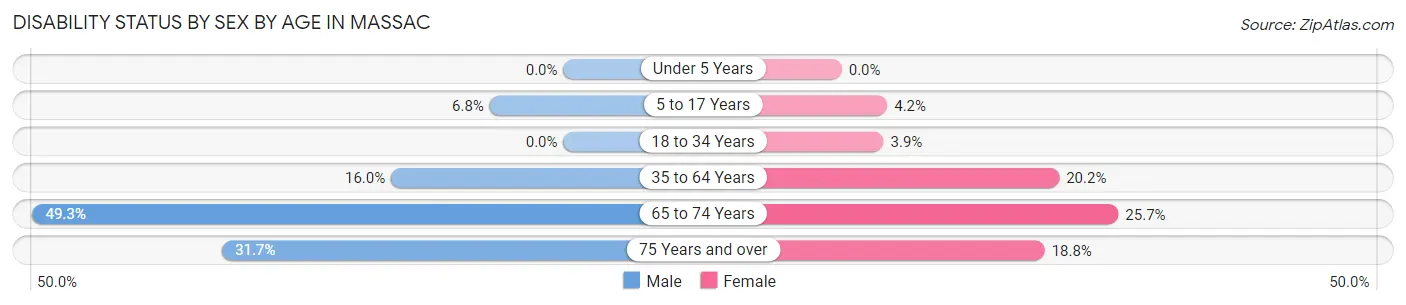
| Age Bracket | Male | Female |
| Under 5 Years | 0 (0.0%) | 0 (0.0%) |
| 5 to 17 Years | 31 (6.8%) | 14 (4.2%) |
| 18 to 34 Years | 0 (0.0%) | 25 (3.9%) |
| 35 to 64 Years | 102 (16.0%) | 110 (20.2%) |
| 65 to 74 Years | 67 (49.3%) | 86 (25.7%) |
| 75 Years and over | 38 (31.7%) | 45 (18.8%) |
Disability Class by Sex by Age in Massac
Disability Class: Hearing Difficulty
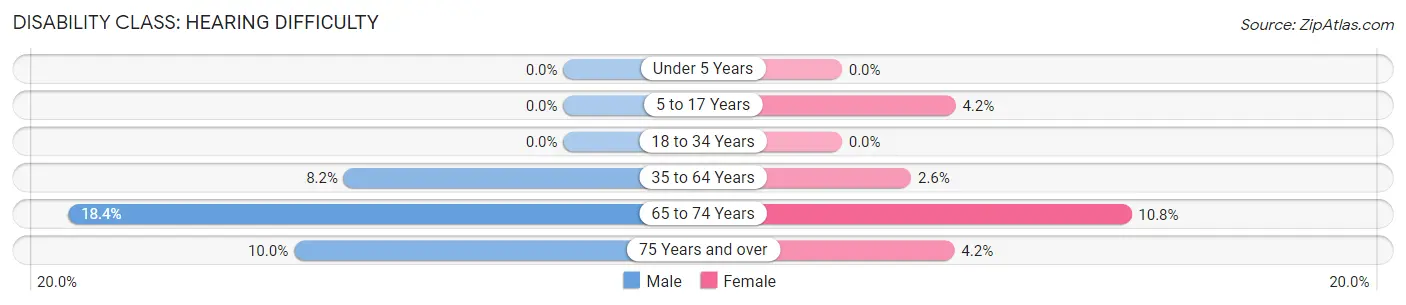
| Age Bracket | Male | Female |
| Under 5 Years | 0 (0.0%) | 0 (0.0%) |
| 5 to 17 Years | 0 (0.0%) | 14 (4.2%) |
| 18 to 34 Years | 0 (0.0%) | 0 (0.0%) |
| 35 to 64 Years | 52 (8.2%) | 14 (2.6%) |
| 65 to 74 Years | 25 (18.4%) | 36 (10.7%) |
| 75 Years and over | 12 (10.0%) | 10 (4.2%) |
Disability Class: Vision Difficulty
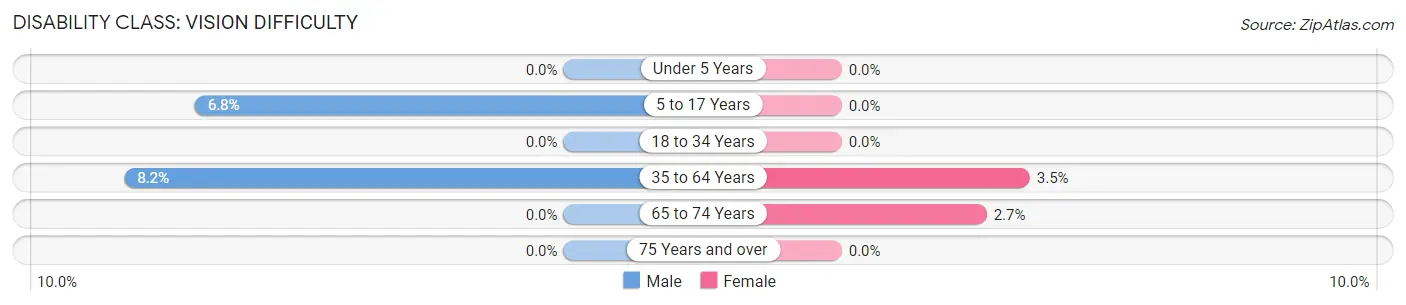
| Age Bracket | Male | Female |
| Under 5 Years | 0 (0.0%) | 0 (0.0%) |
| 5 to 17 Years | 31 (6.8%) | 0 (0.0%) |
| 18 to 34 Years | 0 (0.0%) | 0 (0.0%) |
| 35 to 64 Years | 52 (8.2%) | 19 (3.5%) |
| 65 to 74 Years | 0 (0.0%) | 9 (2.7%) |
| 75 Years and over | 0 (0.0%) | 0 (0.0%) |
Disability Class: Cognitive Difficulty
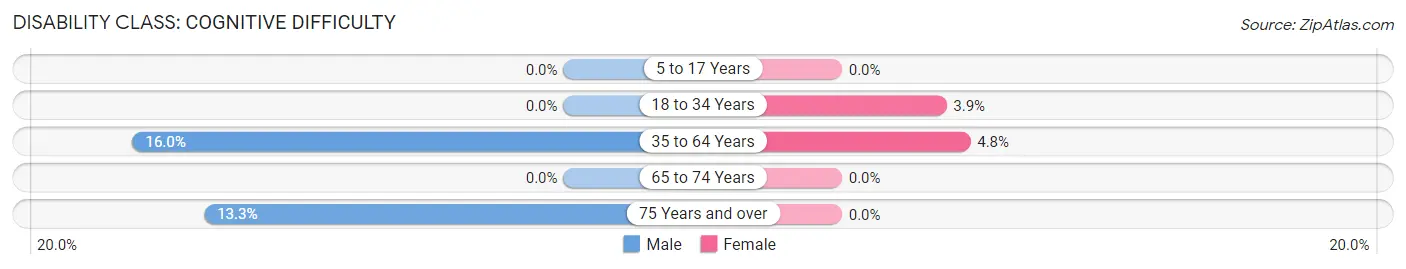
| Age Bracket | Male | Female |
| 5 to 17 Years | 0 (0.0%) | 0 (0.0%) |
| 18 to 34 Years | 0 (0.0%) | 25 (3.9%) |
| 35 to 64 Years | 102 (16.0%) | 26 (4.8%) |
| 65 to 74 Years | 0 (0.0%) | 0 (0.0%) |
| 75 Years and over | 16 (13.3%) | 0 (0.0%) |
Disability Class: Ambulatory Difficulty
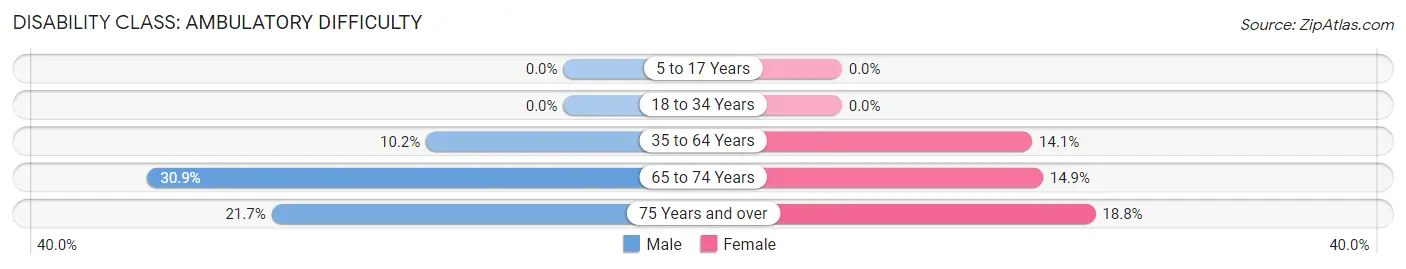
| Age Bracket | Male | Female |
| 5 to 17 Years | 0 (0.0%) | 0 (0.0%) |
| 18 to 34 Years | 0 (0.0%) | 0 (0.0%) |
| 35 to 64 Years | 65 (10.2%) | 77 (14.1%) |
| 65 to 74 Years | 42 (30.9%) | 50 (14.9%) |
| 75 Years and over | 26 (21.7%) | 45 (18.8%) |
Disability Class: Self-Care Difficulty
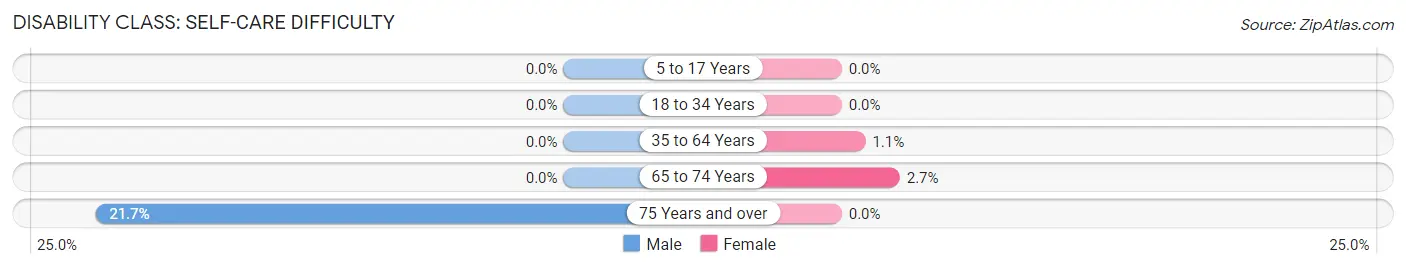
| Age Bracket | Male | Female |
| 5 to 17 Years | 0 (0.0%) | 0 (0.0%) |
| 18 to 34 Years | 0 (0.0%) | 0 (0.0%) |
| 35 to 64 Years | 0 (0.0%) | 6 (1.1%) |
| 65 to 74 Years | 0 (0.0%) | 9 (2.7%) |
| 75 Years and over | 26 (21.7%) | 0 (0.0%) |
Technology Access in Massac
Computing Device Access in Massac
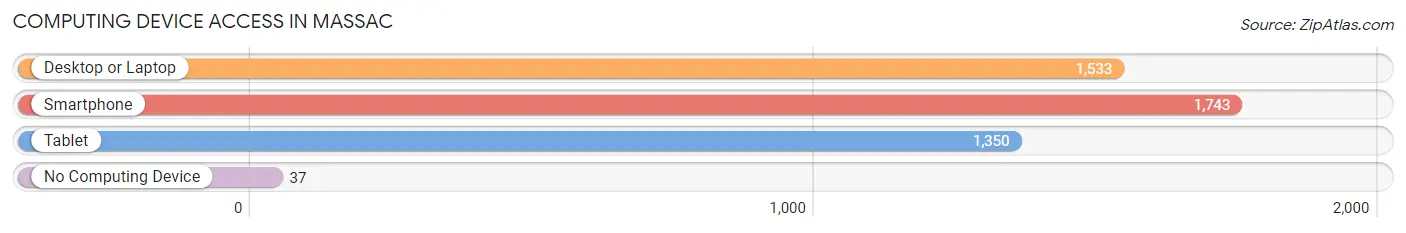
| Device Type | # Households | % Households |
| Desktop or Laptop | 1,533 | 82.5% |
| Smartphone | 1,743 | 93.8% |
| Tablet | 1,350 | 72.6% |
| No Computing Device | 37 | 2.0% |
| Total | 1,859 | 100.0% |
Internet Access in Massac
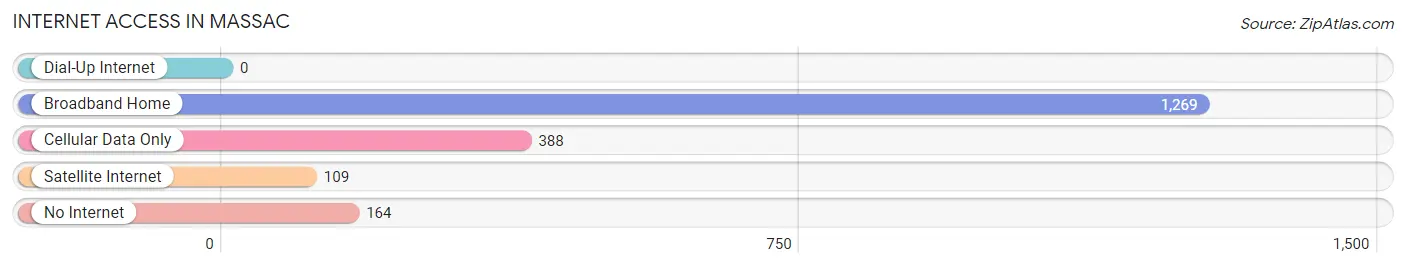
| Internet Type | # Households | % Households |
| Dial-Up Internet | 0 | 0.0% |
| Broadband Home | 1,269 | 68.3% |
| Cellular Data Only | 388 | 20.9% |
| Satellite Internet | 109 | 5.9% |
| No Internet | 164 | 8.8% |
| Total | 1,859 | 100.0% |
Massac Summary
Massac is a small unincorporated community located in the western part of McCracken County, Kentucky. It is situated along the banks of the Ohio River, just south of the city of Paducah. The community is named after the Massac County, Illinois, which is located directly across the river.
History
The area that is now Massac was first settled in the early 1800s by a group of French-Canadian immigrants. The settlement was originally known as “La Petite France”, and was located on the banks of the Ohio River. The settlement was later renamed “Massac”, after the county in Illinois.
In the late 1800s, the area was home to a number of small businesses, including a sawmill, a grist mill, and a general store. The area was also home to a number of churches, including the First Baptist Church of Massac, which was founded in 1883.
In the early 1900s, the area began to experience a period of growth and development. The Louisville and Nashville Railroad built a line through the area, and a number of new businesses and industries began to open up. The area also saw the construction of a number of new homes and buildings.
Geography
Massac is located in the western part of McCracken County, Kentucky. It is situated along the banks of the Ohio River, just south of the city of Paducah. The community is located at an elevation of approximately 400 feet above sea level.
The area is characterized by rolling hills and flat plains. The climate is generally mild, with temperatures ranging from the low 30s in the winter to the mid-80s in the summer. The area receives an average of 45 inches of precipitation per year.
Economy
The economy of Massac is largely based on agriculture and manufacturing. The area is home to a number of small farms, which produce a variety of crops, including corn, soybeans, and wheat. The area is also home to a number of small manufacturing businesses, which produce a variety of products, including furniture, clothing, and automotive parts.
The area is also home to a number of small businesses, including restaurants, retail stores, and service providers. The area is also home to a number of tourist attractions, including the Paducah Riverfront, the Paducah Riverwalk, and the Paducah-McCracken County Museum.
Demographics
As of the 2010 census, the population of Massac was 1,845. The racial makeup of the area was 97.3% White, 0.9% African American, 0.2% Native American, 0.2% Asian, 0.1% Pacific Islander, and 1.3% from other races. The median household income in the area was $37,917, and the median family income was $45,938.
The area is served by the McCracken County Public Schools system. The area is also home to a number of private schools, including the Massac Christian Academy and the Paducah Christian Academy. The area is also home to a number of higher education institutions, including the University of Kentucky, Murray State University, and West Kentucky Community and Technical College.
Common Questions
What is Per Capita Income in Massac?
Per Capita income in Massac is $38,355.
What is the Median Family Income in Massac?
Median Family Income in Massac is $73,815.
What is the Median Household income in Massac?
Median Household Income in Massac is $65,966.
What is Income or Wage Gap in Massac?
Income or Wage Gap in Massac is 48.0%.
Women in Massac earn 52.0 cents for every dollar earned by a man.
What is Inequality or Gini Index in Massac?
Inequality or Gini Index in Massac is 0.53.
What is the Total Population of Massac?
Total Population of Massac is 4,722.
What is the Total Male Population of Massac?
Total Male Population of Massac is 2,424.
What is the Total Female Population of Massac?
Total Female Population of Massac is 2,298.
What is the Ratio of Males per 100 Females in Massac?
There are 105.48 Males per 100 Females in Massac.
What is the Ratio of Females per 100 Males in Massac?
There are 94.80 Females per 100 Males in Massac.
What is the Median Population Age in Massac?
Median Population Age in Massac is 30.5 Years.
What is the Average Family Size in Massac
Average Family Size in Massac is 3.2 People.
What is the Average Household Size in Massac
Average Household Size in Massac is 2.5 People.
How Large is the Labor Force in Massac?
There are 2,068 People in the Labor Forcein in Massac.
What is the Percentage of People in the Labor Force in Massac?
57.9% of People are in the Labor Force in Massac.