Winchester, KY Map & Demographics
Winchester Map
Winchester Overview
$31,185
PER CAPITA INCOME
$67,500
AVG FAMILY INCOME
$50,982
AVG HOUSEHOLD INCOME
34.6%
WAGE / INCOME GAP [ % ]
65.4¢/ $1
WAGE / INCOME GAP [ $ ]
0.48
INEQUALITY / GINI INDEX
19,080
TOTAL POPULATION
8,902
MALE POPULATION
10,178
FEMALE POPULATION
87.46
MALES / 100 FEMALES
114.33
FEMALES / 100 MALES
37.6
MEDIAN AGE
3.0
AVG FAMILY SIZE
2.3
AVG HOUSEHOLD SIZE
9,120
LABOR FORCE [ PEOPLE ]
59.1%
PERCENT IN LABOR FORCE
5.6%
UNEMPLOYMENT RATE
Winchester Zip Codes
Winchester Area Codes
Income in Winchester
Income Overview in Winchester
Per Capita Income in Winchester is $31,185, while median incomes of families and households are $67,500 and $50,982 respectively.
| Characteristic | Number | Measure |
| Per Capita Income | 19,080 | $31,185 |
| Median Family Income | 4,628 | $67,500 |
| Mean Family Income | 4,628 | $84,860 |
| Median Household Income | 8,036 | $50,982 |
| Mean Household Income | 8,036 | $70,878 |
| Income Deficit | 4,628 | $0 |
| Wage / Income Gap (%) | 19,080 | 34.62% |
| Wage / Income Gap ($) | 19,080 | 65.38¢ per $1 |
| Gini / Inequality Index | 19,080 | 0.48 |
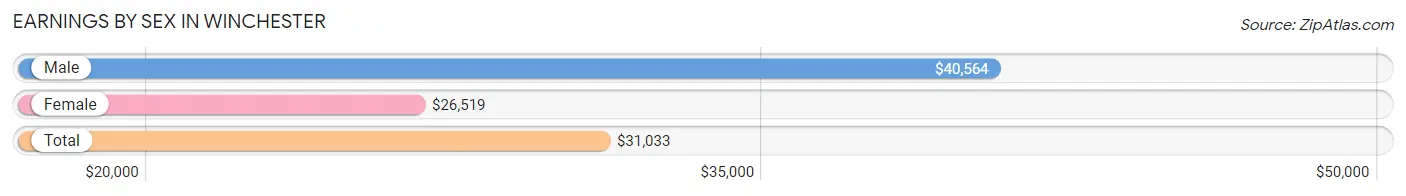
Earnings by Sex in Winchester
Average Earnings in Winchester are $31,033, $40,564 for men and $26,519 for women, a difference of 34.6%.
| Sex | Number | Average Earnings |
| Male | 4,903 (50.7%) | $40,564 |
| Female | 4,765 (49.3%) | $26,519 |
| Total | 9,668 (100.0%) | $31,033 |
Earnings by Sex by Income Bracket in Winchester
The most common earnings brackets in Winchester are $55,000 to $64,999 for men (537 | 11.0%) and $25,000 to $29,999 for women (641 | 13.5%).
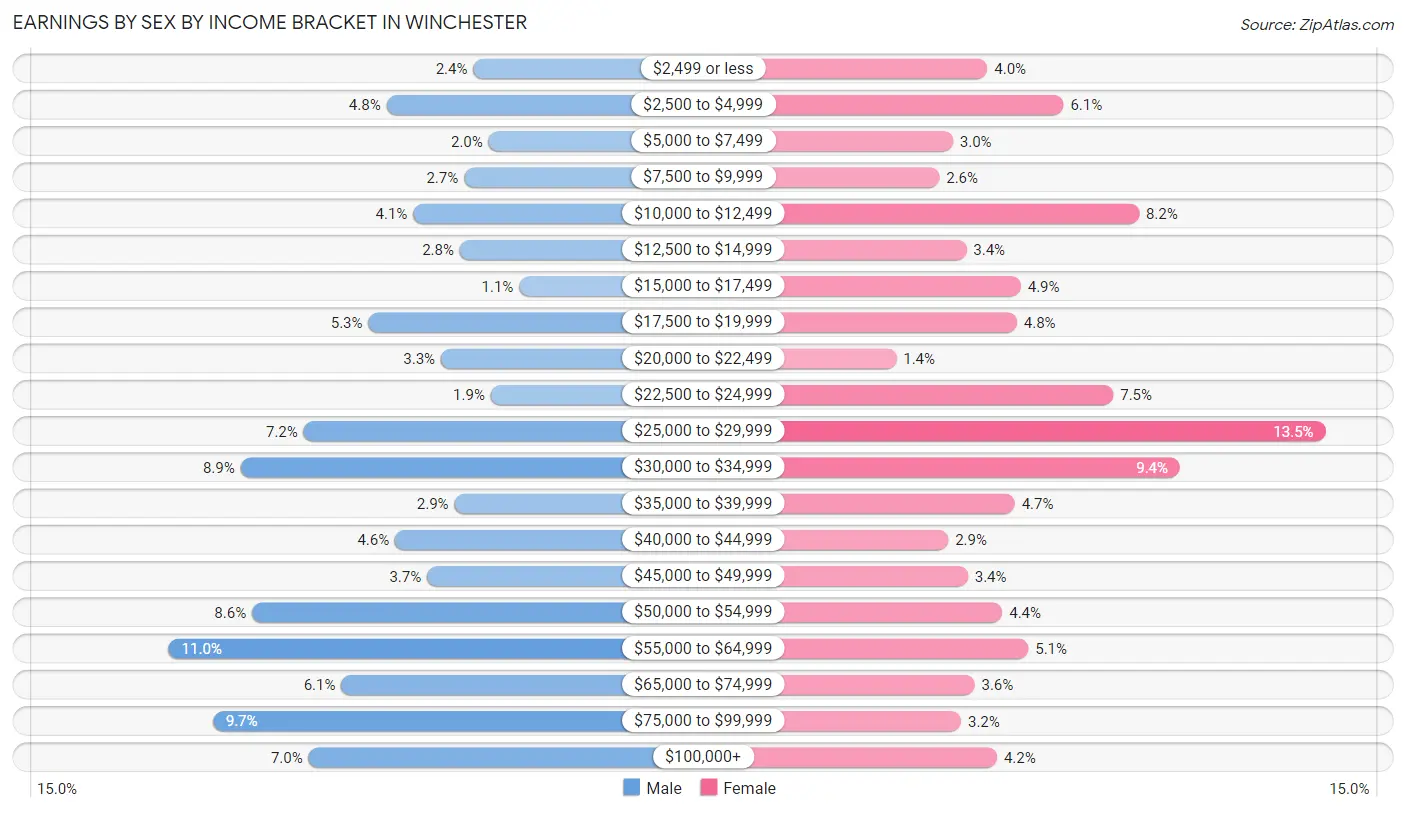
| Income | Male | Female |
| $2,499 or less | 117 (2.4%) | 188 (4.0%) |
| $2,500 to $4,999 | 237 (4.8%) | 290 (6.1%) |
| $5,000 to $7,499 | 96 (2.0%) | 142 (3.0%) |
| $7,500 to $9,999 | 130 (2.6%) | 124 (2.6%) |
| $10,000 to $12,499 | 200 (4.1%) | 391 (8.2%) |
| $12,500 to $14,999 | 136 (2.8%) | 160 (3.4%) |
| $15,000 to $17,499 | 54 (1.1%) | 233 (4.9%) |
| $17,500 to $19,999 | 262 (5.3%) | 228 (4.8%) |
| $20,000 to $22,499 | 162 (3.3%) | 66 (1.4%) |
| $22,500 to $24,999 | 93 (1.9%) | 357 (7.5%) |
| $25,000 to $29,999 | 351 (7.2%) | 641 (13.5%) |
| $30,000 to $34,999 | 438 (8.9%) | 446 (9.4%) |
| $35,000 to $39,999 | 143 (2.9%) | 225 (4.7%) |
| $40,000 to $44,999 | 225 (4.6%) | 136 (2.9%) |
| $45,000 to $49,999 | 181 (3.7%) | 162 (3.4%) |
| $50,000 to $54,999 | 422 (8.6%) | 208 (4.4%) |
| $55,000 to $64,999 | 537 (11.0%) | 243 (5.1%) |
| $65,000 to $74,999 | 299 (6.1%) | 171 (3.6%) |
| $75,000 to $99,999 | 476 (9.7%) | 153 (3.2%) |
| $100,000+ | 344 (7.0%) | 201 (4.2%) |
| Total | 4,903 (100.0%) | 4,765 (100.0%) |
Earnings by Sex by Educational Attainment in Winchester
Average earnings in Winchester are $50,214 for men and $27,786 for women, a difference of 44.7%. Men with an educational attainment of graduate degree enjoy the highest average annual earnings of $80,114, while those with less than high school education earn the least with $19,667. Women with an educational attainment of graduate degree earn the most with the average annual earnings of $56,823, while those with high school diploma education have the smallest earnings of $24,859.
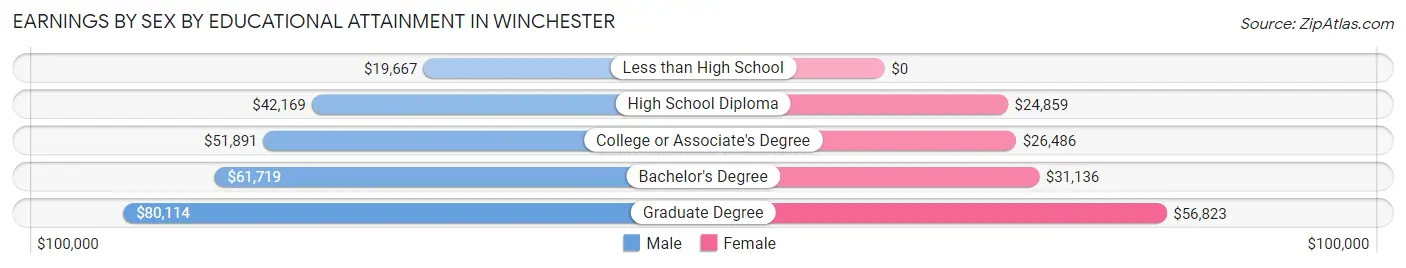
| Educational Attainment | Male Income | Female Income |
| Less than High School | $19,667 | $0 |
| High School Diploma | $42,169 | $24,859 |
| College or Associate's Degree | $51,891 | $26,486 |
| Bachelor's Degree | $61,719 | $31,136 |
| Graduate Degree | $80,114 | $56,823 |
| Total | $50,214 | $27,786 |
Family Income in Winchester
Family Income Brackets in Winchester
According to the Winchester family income data, there are 963 families falling into the $100,000 to $149,999 income range, which is the most common income bracket and makes up 20.8% of all families. Conversely, the $10,000 to $14,999 income bracket is the least frequent group with only 116 families (2.5%) belonging to this category.
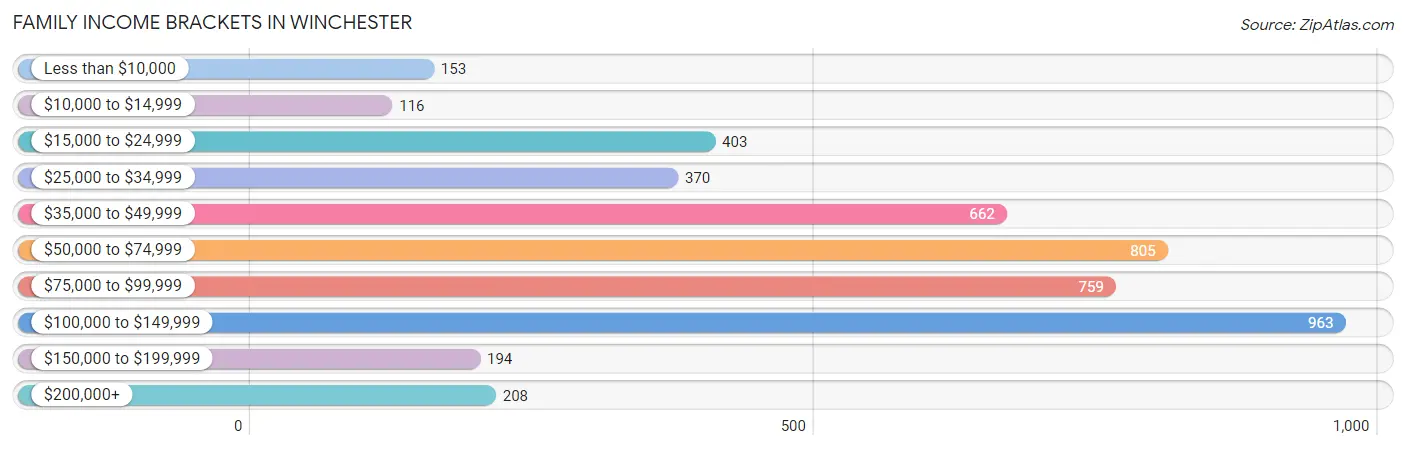
| Income Bracket | # Families | % Families |
| Less than $10,000 | 153 | 3.3% |
| $10,000 to $14,999 | 116 | 2.5% |
| $15,000 to $24,999 | 403 | 8.7% |
| $25,000 to $34,999 | 370 | 8.0% |
| $35,000 to $49,999 | 662 | 14.3% |
| $50,000 to $74,999 | 805 | 17.4% |
| $75,000 to $99,999 | 759 | 16.4% |
| $100,000 to $149,999 | 963 | 20.8% |
| $150,000 to $199,999 | 194 | 4.2% |
| $200,000+ | 208 | 4.5% |
Family Income by Famaliy Size in Winchester
5-person families (219 | 4.7%) account for the highest median family income in Winchester with $101,250 per family, while 2-person families (2,197 | 47.5%) have the highest median income of $31,612 per family member.
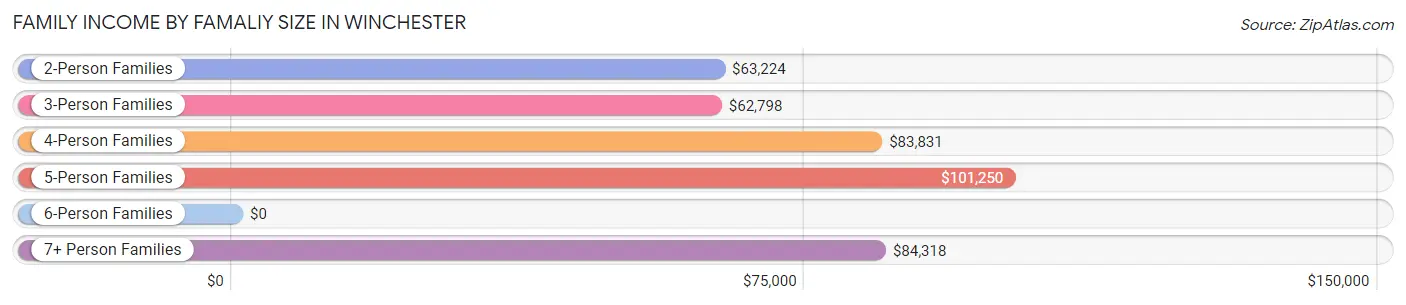
| Income Bracket | # Families | Median Income |
| 2-Person Families | 2,197 (47.5%) | $63,224 |
| 3-Person Families | 1,274 (27.5%) | $62,798 |
| 4-Person Families | 812 (17.5%) | $83,831 |
| 5-Person Families | 219 (4.7%) | $101,250 |
| 6-Person Families | 62 (1.3%) | $0 |
| 7+ Person Families | 64 (1.4%) | $84,318 |
| Total | 4,628 (100.0%) | $67,500 |
Family Income by Number of Earners in Winchester
The median family income in Winchester is $67,500, with families comprising 3+ earners (262) having the highest median family income of $136,765, while families with 1 earner (1,606) have the lowest median family income of $37,794, accounting for 5.7% and 34.7% of families, respectively.
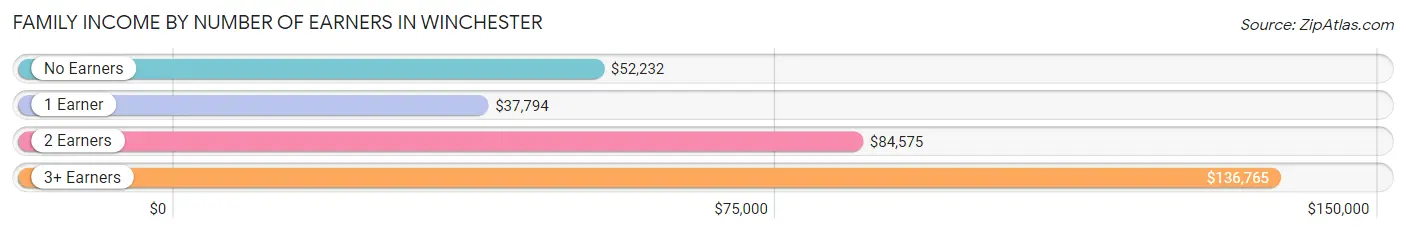
| Number of Earners | # Families | Median Income |
| No Earners | 823 (17.8%) | $52,232 |
| 1 Earner | 1,606 (34.7%) | $37,794 |
| 2 Earners | 1,937 (41.8%) | $84,575 |
| 3+ Earners | 262 (5.7%) | $136,765 |
| Total | 4,628 (100.0%) | $67,500 |
Household Income in Winchester
Household Income Brackets in Winchester
With 1,487 households falling in the category, the $50,000 to $74,999 income range is the most frequent in Winchester, accounting for 18.5% of all households. In contrast, only 257 households (3.2%) fall into the $200,000+ income bracket, making it the least populous group.
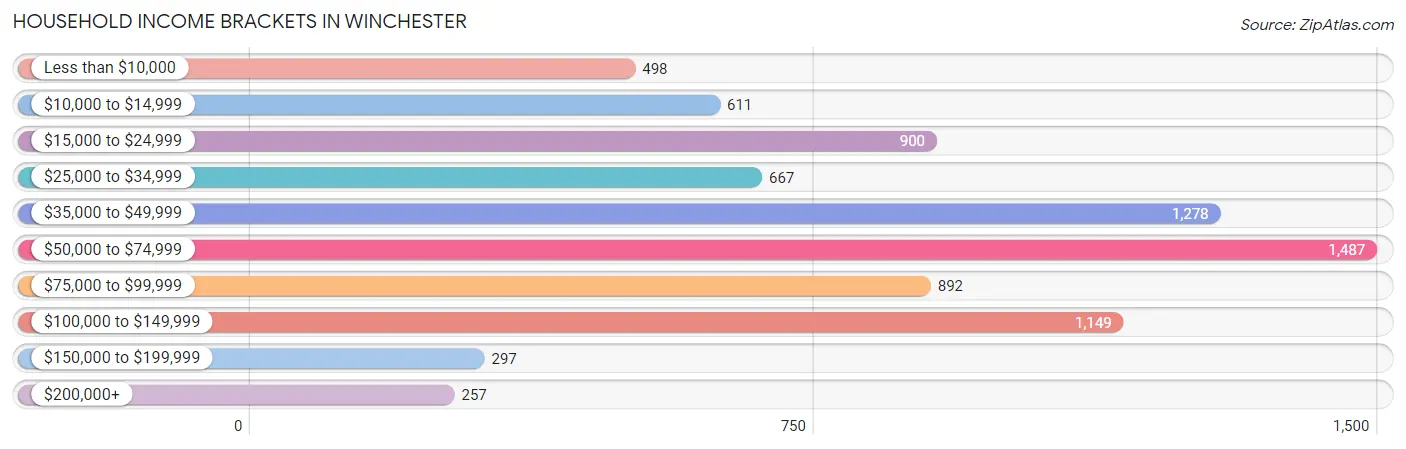
| Income Bracket | # Households | % Households |
| Less than $10,000 | 498 | 6.2% |
| $10,000 to $14,999 | 611 | 7.6% |
| $15,000 to $24,999 | 900 | 11.2% |
| $25,000 to $34,999 | 667 | 8.3% |
| $35,000 to $49,999 | 1,278 | 15.9% |
| $50,000 to $74,999 | 1,487 | 18.5% |
| $75,000 to $99,999 | 892 | 11.1% |
| $100,000 to $149,999 | 1,149 | 14.3% |
| $150,000 to $199,999 | 297 | 3.7% |
| $200,000+ | 257 | 3.2% |
Household Income by Householder Age in Winchester
The median household income in Winchester is $50,982, with the highest median household income of $58,188 found in the 25 to 44 years age bracket for the primary householder. A total of 2,430 households (30.2%) fall into this category. Meanwhile, the 15 to 24 years age bracket for the primary householder has the lowest median household income of $39,196, with 585 households (7.3%) in this group.
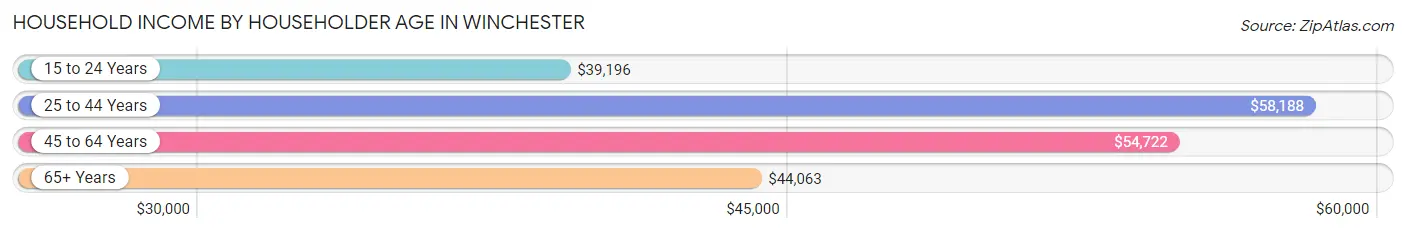
| Income Bracket | # Households | Median Income |
| 15 to 24 Years | 585 (7.3%) | $39,196 |
| 25 to 44 Years | 2,430 (30.2%) | $58,188 |
| 45 to 64 Years | 2,806 (34.9%) | $54,722 |
| 65+ Years | 2,215 (27.6%) | $44,063 |
| Total | 8,036 (100.0%) | $50,982 |
Poverty in Winchester
Income Below Poverty by Sex and Age in Winchester
With 17.2% poverty level for males and 21.4% for females among the residents of Winchester, 6 to 11 year old males and 6 to 11 year old females are the most vulnerable to poverty, with 182 males (38.7%) and 230 females (32.6%) in their respective age groups living below the poverty level.
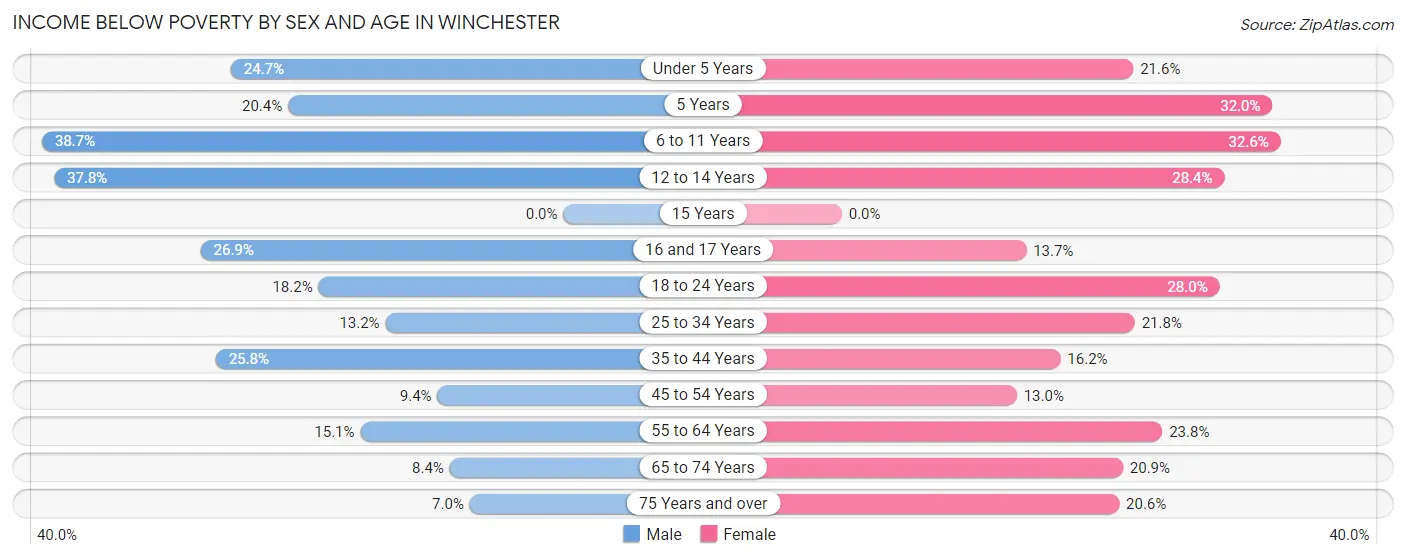
| Age Bracket | Male | Female |
| Under 5 Years | 158 (24.7%) | 87 (21.6%) |
| 5 Years | 28 (20.4%) | 62 (32.0%) |
| 6 to 11 Years | 182 (38.7%) | 230 (32.6%) |
| 12 to 14 Years | 104 (37.8%) | 138 (28.4%) |
| 15 Years | 0 (0.0%) | 0 (0.0%) |
| 16 and 17 Years | 87 (26.9%) | 33 (13.7%) |
| 18 to 24 Years | 194 (18.2%) | 210 (28.0%) |
| 25 to 34 Years | 191 (13.2%) | 331 (21.7%) |
| 35 to 44 Years | 184 (25.8%) | 188 (16.2%) |
| 45 to 54 Years | 132 (9.3%) | 156 (13.0%) |
| 55 to 64 Years | 131 (15.1%) | 295 (23.8%) |
| 65 to 74 Years | 59 (8.4%) | 225 (20.9%) |
| 75 Years and over | 36 (7.0%) | 195 (20.6%) |
| Total | 1,486 (17.2%) | 2,150 (21.4%) |
Income Above Poverty by Sex and Age in Winchester
According to the poverty statistics in Winchester, males aged 15 years and females aged 15 years are the age groups that are most secure financially, with 100.0% of males and 100.0% of females in these age groups living above the poverty line.
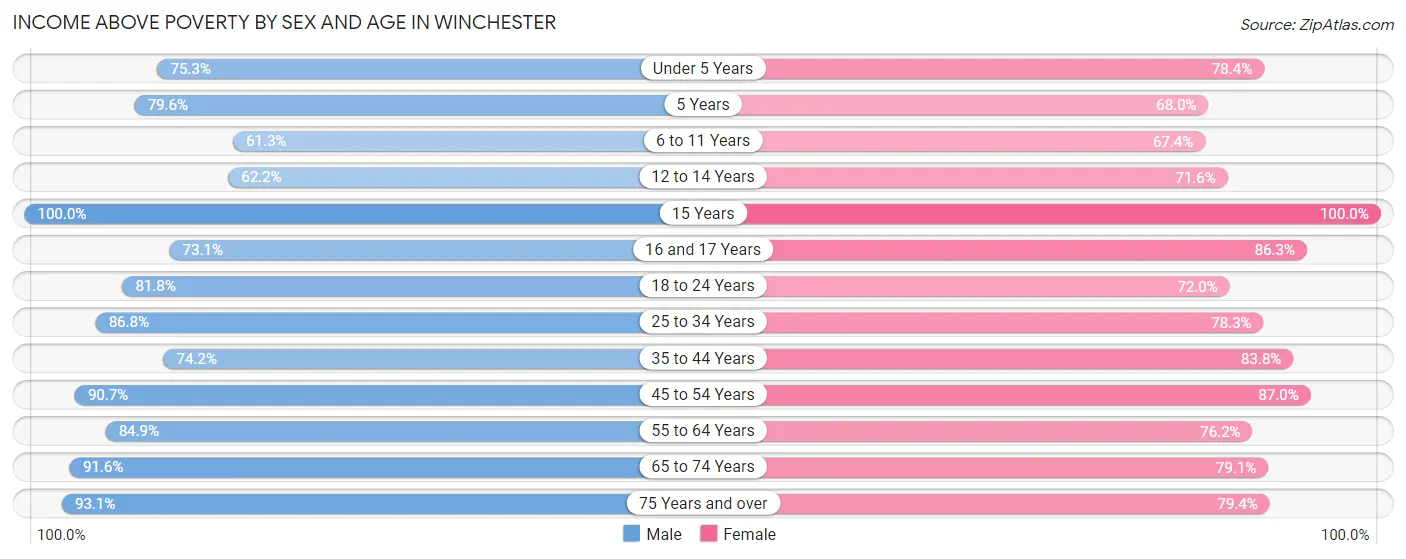
| Age Bracket | Male | Female |
| Under 5 Years | 482 (75.3%) | 315 (78.4%) |
| 5 Years | 109 (79.6%) | 132 (68.0%) |
| 6 to 11 Years | 288 (61.3%) | 476 (67.4%) |
| 12 to 14 Years | 171 (62.2%) | 348 (71.6%) |
| 15 Years | 47 (100.0%) | 132 (100.0%) |
| 16 and 17 Years | 236 (73.1%) | 208 (86.3%) |
| 18 to 24 Years | 873 (81.8%) | 539 (72.0%) |
| 25 to 34 Years | 1,255 (86.8%) | 1,191 (78.2%) |
| 35 to 44 Years | 529 (74.2%) | 970 (83.8%) |
| 45 to 54 Years | 1,280 (90.6%) | 1,045 (87.0%) |
| 55 to 64 Years | 738 (84.9%) | 945 (76.2%) |
| 65 to 74 Years | 640 (91.6%) | 853 (79.1%) |
| 75 Years and over | 482 (93.0%) | 752 (79.4%) |
| Total | 7,130 (82.8%) | 7,906 (78.6%) |
Income Below Poverty Among Married-Couple Families in Winchester
The poverty statistics for married-couple families in Winchester show that 5.5% or 167 of the total 3,049 families live below the poverty line. Families with 3 or 4 children have the highest poverty rate of 9.0%, comprising of 17 families. On the other hand, families with no children have the lowest poverty rate of 5.1%, which includes 93 families.
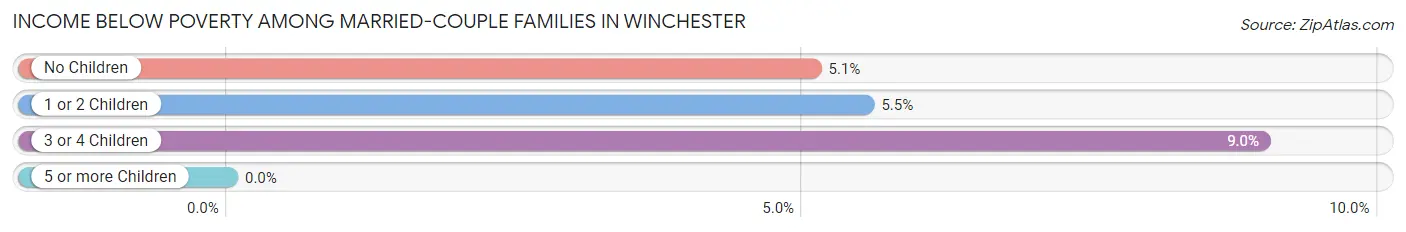
| Children | Above Poverty | Below Poverty |
| No Children | 1,739 (94.9%) | 93 (5.1%) |
| 1 or 2 Children | 971 (94.5%) | 57 (5.5%) |
| 3 or 4 Children | 172 (91.0%) | 17 (9.0%) |
| 5 or more Children | 0 (0.0%) | 0 (0.0%) |
| Total | 2,882 (94.5%) | 167 (5.5%) |
Income Below Poverty Among Single-Parent Households in Winchester
According to the poverty data in Winchester, 26.7% or 147 single-father households and 32.4% or 333 single-mother households are living below the poverty line. Among single-father households, those with 1 or 2 children have the highest poverty rate, with 135 households (33.1%) experiencing poverty. Likewise, among single-mother households, those with 3 or 4 children have the highest poverty rate, with 124 households (100.0%) falling below the poverty line.
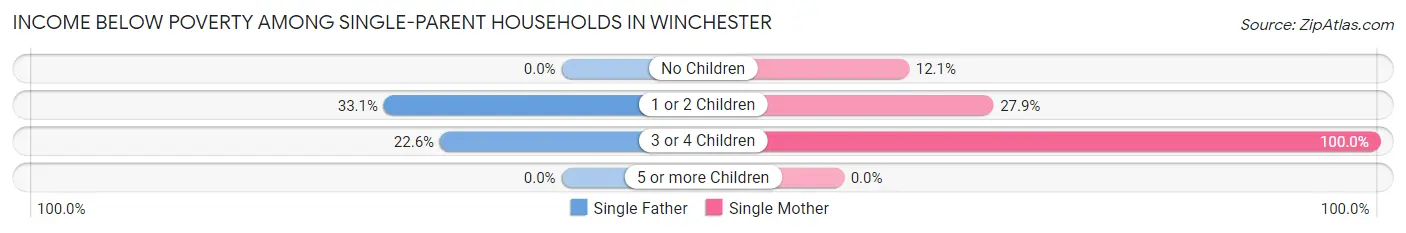
| Children | Single Father | Single Mother |
| No Children | 0 (0.0%) | 33 (12.1%) |
| 1 or 2 Children | 135 (33.1%) | 176 (27.9%) |
| 3 or 4 Children | 12 (22.6%) | 124 (100.0%) |
| 5 or more Children | 0 (0.0%) | 0 (0.0%) |
| Total | 147 (26.7%) | 333 (32.4%) |
Income Below Poverty Among Married-Couple vs Single-Parent Households in Winchester
The poverty data for Winchester shows that 167 of the married-couple family households (5.5%) and 480 of the single-parent households (30.4%) are living below the poverty level. Within the married-couple family households, those with 3 or 4 children have the highest poverty rate, with 17 households (9.0%) falling below the poverty line. Among the single-parent households, those with 3 or 4 children have the highest poverty rate, with 136 household (76.8%) living below poverty.
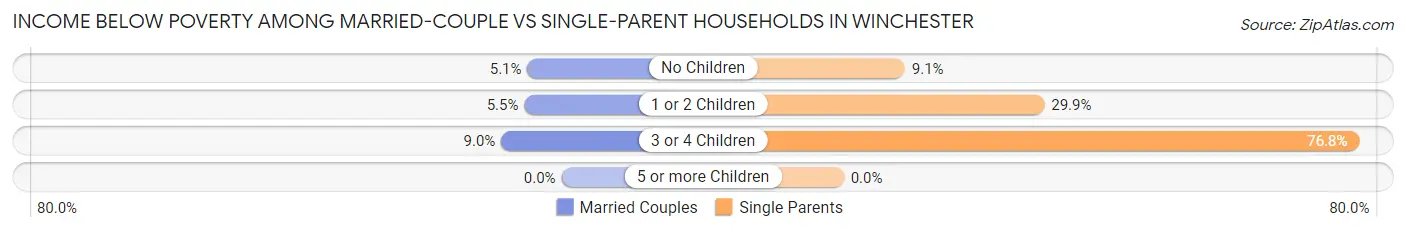
| Children | Married-Couple Families | Single-Parent Households |
| No Children | 93 (5.1%) | 33 (9.1%) |
| 1 or 2 Children | 57 (5.5%) | 311 (29.9%) |
| 3 or 4 Children | 17 (9.0%) | 136 (76.8%) |
| 5 or more Children | 0 (0.0%) | 0 (0.0%) |
| Total | 167 (5.5%) | 480 (30.4%) |
Race in Winchester
The most populous races in Winchester are White / Caucasian (16,644 | 87.2%), Black / African American (1,243 | 6.5%), and Hispanic or Latino (873 | 4.6%).
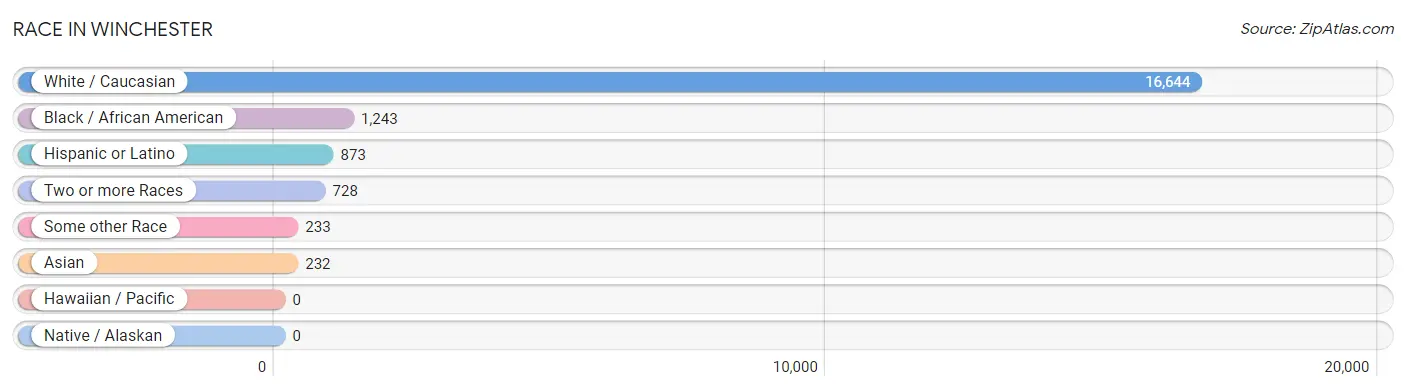
| Race | # Population | % Population |
| Asian | 232 | 1.2% |
| Black / African American | 1,243 | 6.5% |
| Hawaiian / Pacific | 0 | 0.0% |
| Hispanic or Latino | 873 | 4.6% |
| Native / Alaskan | 0 | 0.0% |
| White / Caucasian | 16,644 | 87.2% |
| Two or more Races | 728 | 3.8% |
| Some other Race | 233 | 1.2% |
| Total | 19,080 | 100.0% |
Ancestry in Winchester
The most populous ancestries reported in Winchester are Irish (2,542 | 13.3%), English (2,346 | 12.3%), German (2,134 | 11.2%), American (1,598 | 8.4%), and European (408 | 2.1%), together accounting for 47.3% of all Winchester residents.
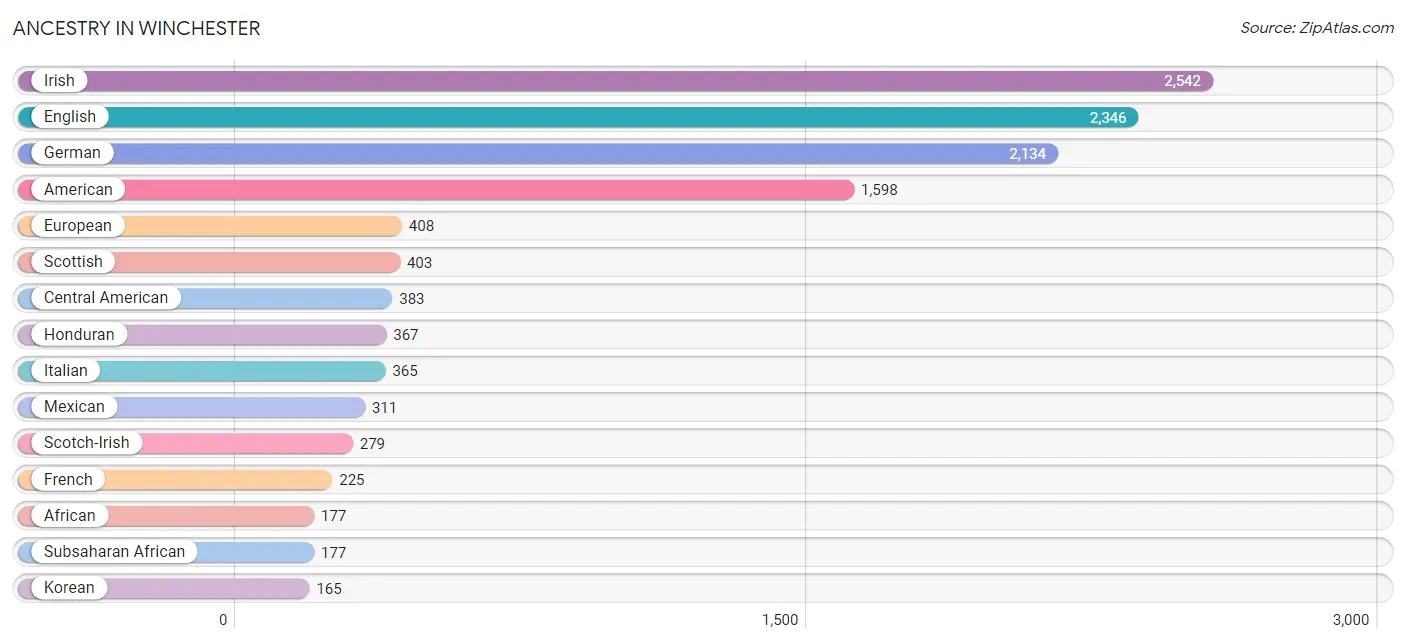
| Ancestry | # Population | % Population |
| African | 177 | 0.9% |
| American | 1,598 | 8.4% |
| Apache | 9 | 0.1% |
| Austrian | 11 | 0.1% |
| Bhutanese | 33 | 0.2% |
| Blackfeet | 38 | 0.2% |
| Brazilian | 42 | 0.2% |
| British | 68 | 0.4% |
| Central American | 383 | 2.0% |
| Cherokee | 112 | 0.6% |
| Chickasaw | 53 | 0.3% |
| Czech | 71 | 0.4% |
| Danish | 17 | 0.1% |
| Delaware | 4 | 0.0% |
| Dominican | 31 | 0.2% |
| Dutch | 57 | 0.3% |
| English | 2,346 | 12.3% |
| European | 408 | 2.1% |
| Finnish | 37 | 0.2% |
| French | 225 | 1.2% |
| French Canadian | 44 | 0.2% |
| German | 2,134 | 11.2% |
| Greek | 17 | 0.1% |
| Guatemalan | 16 | 0.1% |
| Honduran | 367 | 1.9% |
| Indian (Asian) | 33 | 0.2% |
| Iranian | 21 | 0.1% |
| Irish | 2,542 | 13.3% |
| Italian | 365 | 1.9% |
| Korean | 165 | 0.9% |
| Mexican | 311 | 1.6% |
| Native Hawaiian | 33 | 0.2% |
| Northern European | 31 | 0.2% |
| Norwegian | 40 | 0.2% |
| Polish | 40 | 0.2% |
| Portuguese | 17 | 0.1% |
| Puerto Rican | 107 | 0.6% |
| Scandinavian | 33 | 0.2% |
| Scotch-Irish | 279 | 1.5% |
| Scottish | 403 | 2.1% |
| Spanish | 41 | 0.2% |
| Subsaharan African | 177 | 0.9% |
| Swedish | 115 | 0.6% |
| Thai | 67 | 0.4% |
| U.S. Virgin Islander | 11 | 0.1% |
| Welsh | 128 | 0.7% | View All 46 Rows |
Immigrants in Winchester
The most numerous immigrant groups reported in Winchester came from Latin America (289 | 1.5%), Central America (270 | 1.4%), Honduras (251 | 1.3%), Asia (199 | 1.0%), and Philippines (165 | 0.9%), together accounting for 6.1% of all Winchester residents.
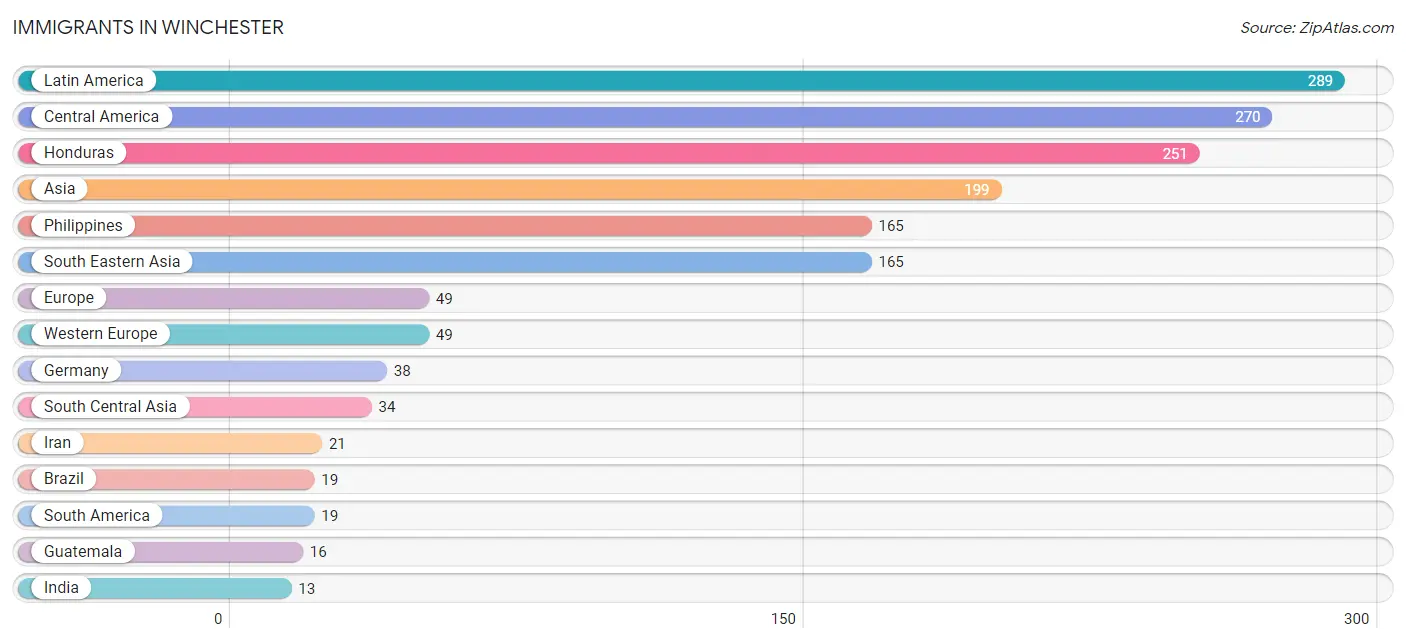
| Immigration Origin | # Population | % Population |
| Asia | 199 | 1.0% |
| Brazil | 19 | 0.1% |
| Central America | 270 | 1.4% |
| Europe | 49 | 0.3% |
| Germany | 38 | 0.2% |
| Guatemala | 16 | 0.1% |
| Honduras | 251 | 1.3% |
| India | 13 | 0.1% |
| Iran | 21 | 0.1% |
| Latin America | 289 | 1.5% |
| Mexico | 3 | 0.0% |
| Netherlands | 11 | 0.1% |
| Philippines | 165 | 0.9% |
| South America | 19 | 0.1% |
| South Central Asia | 34 | 0.2% |
| South Eastern Asia | 165 | 0.9% |
| Western Europe | 49 | 0.3% | View All 17 Rows |
Sex and Age in Winchester
Sex and Age in Winchester
The most populous age groups in Winchester are 20 to 24 Years (889 | 10.0%) for men and 25 to 29 Years (880 | 8.6%) for women.
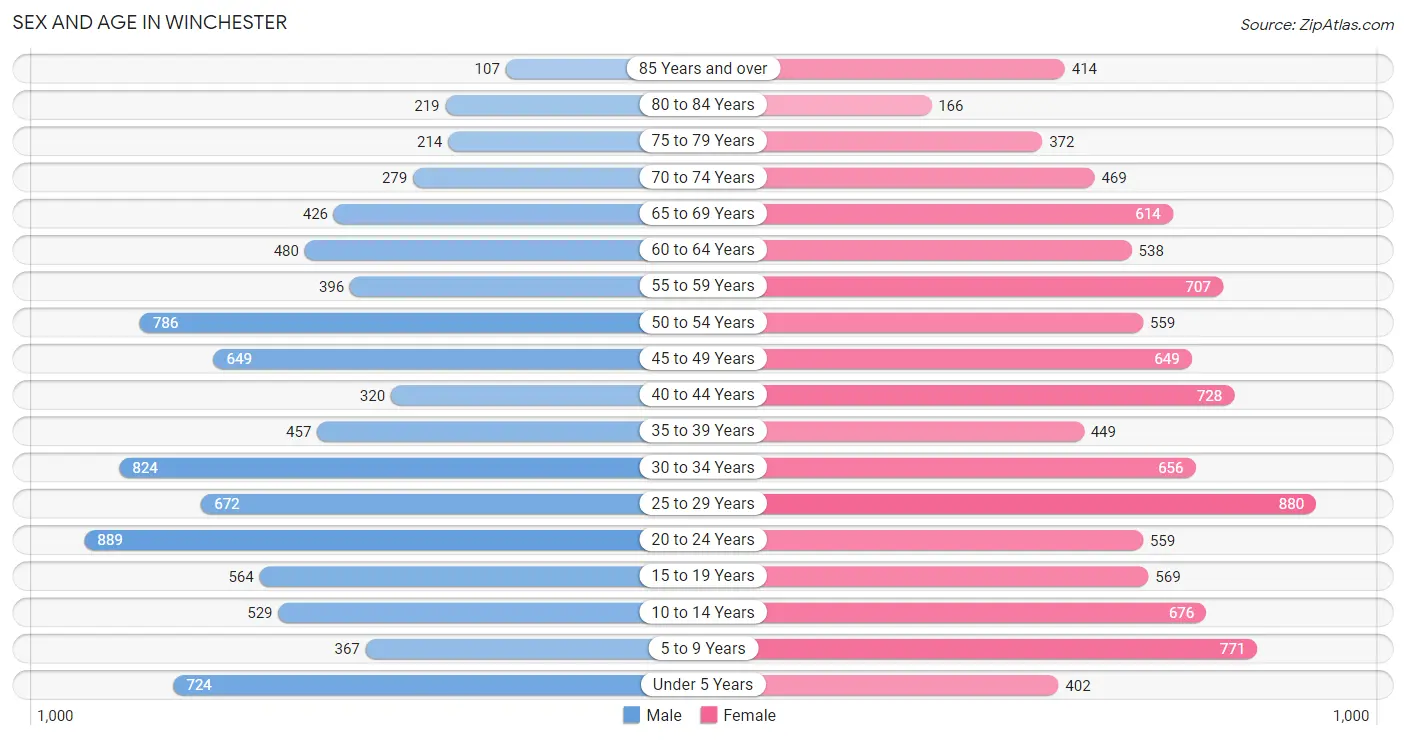
| Age Bracket | Male | Female |
| Under 5 Years | 724 (8.1%) | 402 (4.0%) |
| 5 to 9 Years | 367 (4.1%) | 771 (7.6%) |
| 10 to 14 Years | 529 (5.9%) | 676 (6.6%) |
| 15 to 19 Years | 564 (6.3%) | 569 (5.6%) |
| 20 to 24 Years | 889 (10.0%) | 559 (5.5%) |
| 25 to 29 Years | 672 (7.5%) | 880 (8.6%) |
| 30 to 34 Years | 824 (9.3%) | 656 (6.5%) |
| 35 to 39 Years | 457 (5.1%) | 449 (4.4%) |
| 40 to 44 Years | 320 (3.6%) | 728 (7.1%) |
| 45 to 49 Years | 649 (7.3%) | 649 (6.4%) |
| 50 to 54 Years | 786 (8.8%) | 559 (5.5%) |
| 55 to 59 Years | 396 (4.4%) | 707 (7.0%) |
| 60 to 64 Years | 480 (5.4%) | 538 (5.3%) |
| 65 to 69 Years | 426 (4.8%) | 614 (6.0%) |
| 70 to 74 Years | 279 (3.1%) | 469 (4.6%) |
| 75 to 79 Years | 214 (2.4%) | 372 (3.6%) |
| 80 to 84 Years | 219 (2.5%) | 166 (1.6%) |
| 85 Years and over | 107 (1.2%) | 414 (4.1%) |
| Total | 8,902 (100.0%) | 10,178 (100.0%) |
Families and Households in Winchester
Median Family Size in Winchester
The median family size in Winchester is 3.02 persons per family, with single female/mother families (1,028 | 22.2%) accounting for the largest median family size of 3.2 persons per family. On the other hand, single male/father families (551 | 11.9%) represent the smallest median family size with 2.42 persons per family.
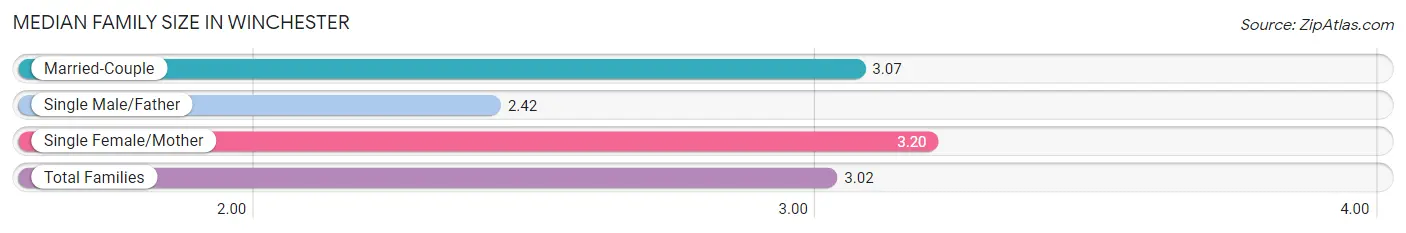
| Family Type | # Families | Family Size |
| Married-Couple | 3,049 (65.9%) | 3.07 |
| Single Male/Father | 551 (11.9%) | 2.42 |
| Single Female/Mother | 1,028 (22.2%) | 3.20 |
| Total Families | 4,628 (100.0%) | 3.02 |
Median Household Size in Winchester
The median household size in Winchester is 2.33 persons per household, with single female/mother households (1,028 | 12.8%) accounting for the largest median household size of 3.38 persons per household. non-family households (3,408 | 42.4%) represent the smallest median household size with 1.20 persons per household.
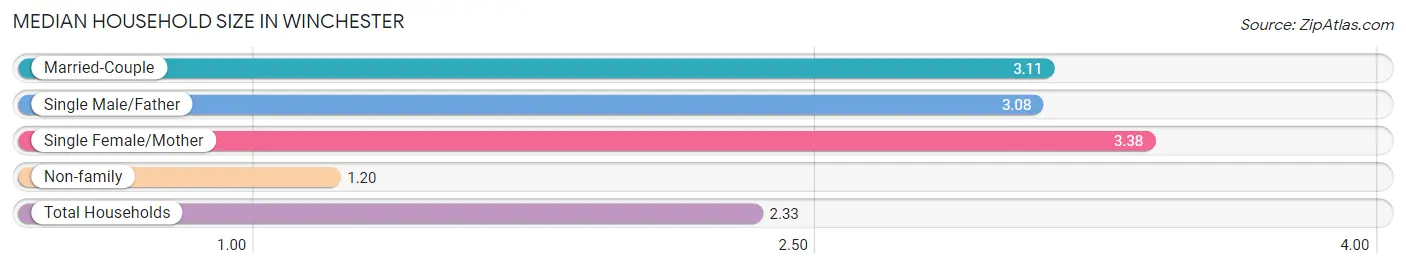
| Household Type | # Households | Household Size |
| Married-Couple | 3,049 (37.9%) | 3.11 |
| Single Male/Father | 551 (6.9%) | 3.08 |
| Single Female/Mother | 1,028 (12.8%) | 3.38 |
| Non-family | 3,408 (42.4%) | 1.20 |
| Total Households | 8,036 (100.0%) | 2.33 |
Household Size by Marriage Status in Winchester
Out of a total of 8,036 households in Winchester, 4,628 (57.6%) are family households, while 3,408 (42.4%) are nonfamily households. The most numerous type of family households are 2-person households, comprising 1,727, and the most common type of nonfamily households are 1-person households, comprising 2,931.
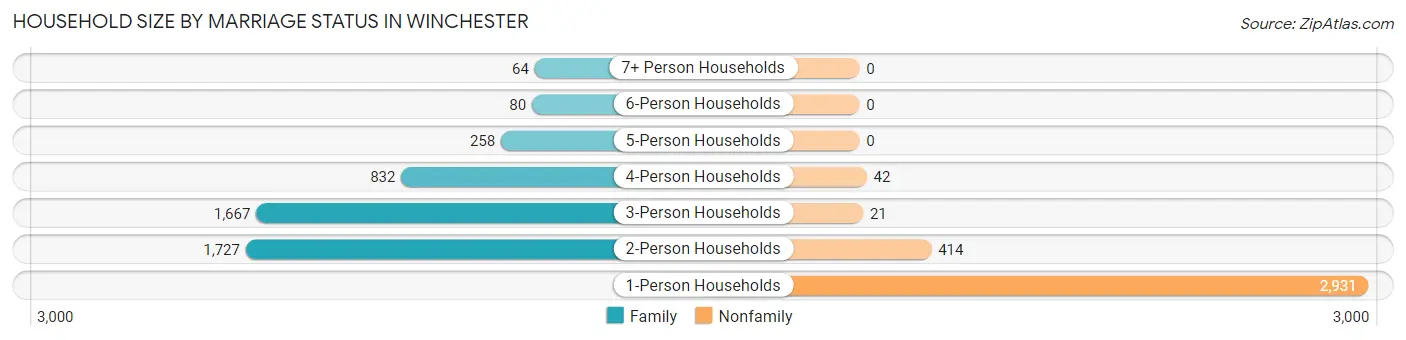
| Household Size | Family Households | Nonfamily Households |
| 1-Person Households | - | 2,931 (36.5%) |
| 2-Person Households | 1,727 (21.5%) | 414 (5.1%) |
| 3-Person Households | 1,667 (20.7%) | 21 (0.3%) |
| 4-Person Households | 832 (10.3%) | 42 (0.5%) |
| 5-Person Households | 258 (3.2%) | 0 (0.0%) |
| 6-Person Households | 80 (1.0%) | 0 (0.0%) |
| 7+ Person Households | 64 (0.8%) | 0 (0.0%) |
| Total | 4,628 (57.6%) | 3,408 (42.4%) |
Female Fertility in Winchester
Fertility by Age in Winchester
Average fertility rate in Winchester is 43.0 births per 1,000 women. Women in the age bracket of 20 to 34 years have the highest fertility rate with 88.0 births per 1,000 women. Women in the age bracket of 20 to 34 years acount for 93.0% of all women with births.
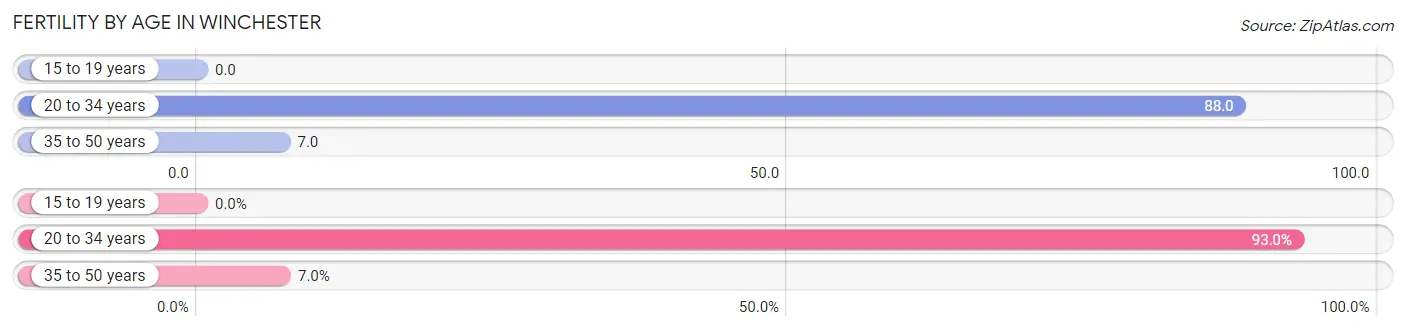
| Age Bracket | Women with Births | Births / 1,000 Women |
| 15 to 19 years | 0 (0.0%) | 0.0 |
| 20 to 34 years | 185 (93.0%) | 88.0 |
| 35 to 50 years | 14 (7.0%) | 7.0 |
| Total | 199 (100.0%) | 43.0 |
Fertility by Age by Marriage Status in Winchester
72.9% of women with births (199) in Winchester are married. The highest percentage of unmarried women with births falls into 35 to 50 years age bracket with 100.0% of them unmarried at the time of birth, while the lowest percentage of unmarried women with births belong to 20 to 34 years age bracket with 21.6% of them unmarried.
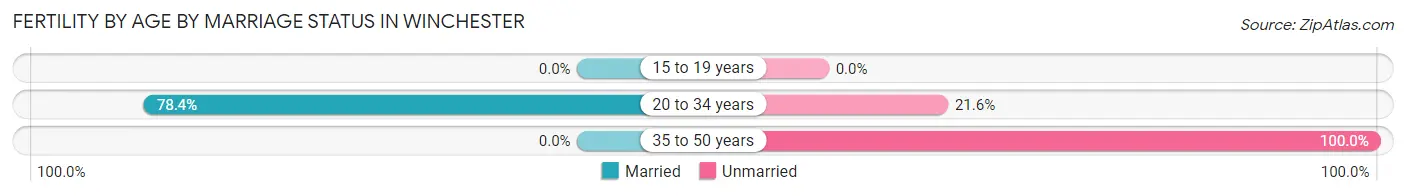
| Age Bracket | Married | Unmarried |
| 15 to 19 years | 0 (0.0%) | 0 (0.0%) |
| 20 to 34 years | 145 (78.4%) | 40 (21.6%) |
| 35 to 50 years | 0 (0.0%) | 14 (100.0%) |
| Total | 145 (72.9%) | 54 (27.1%) |
Fertility by Education in Winchester
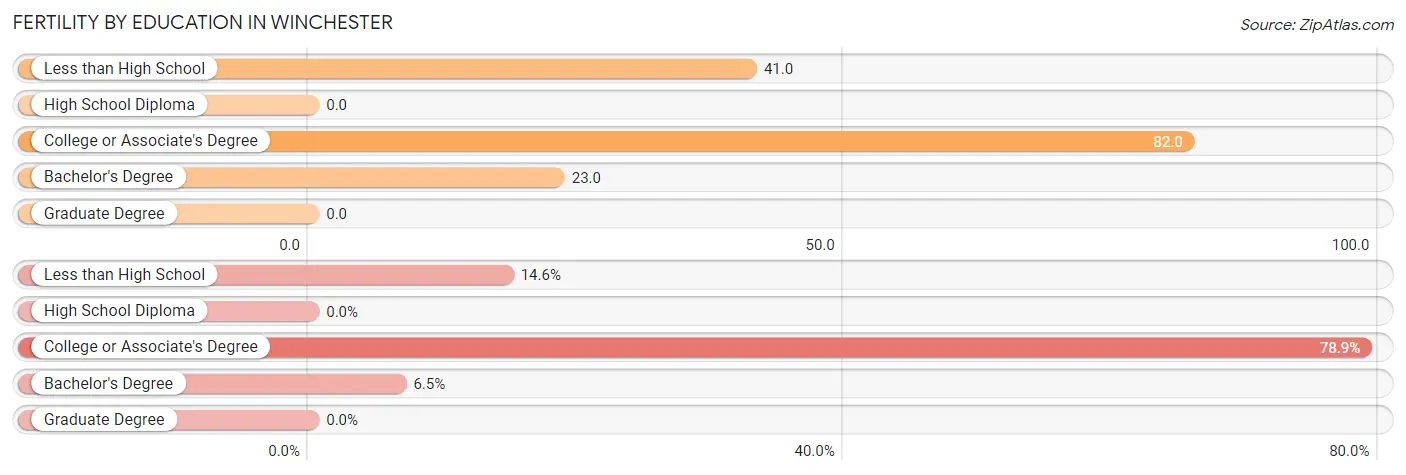
| Educational Attainment | Women with Births | Births / 1,000 Women |
| Less than High School | 29 (14.6%) | 41.0 |
| High School Diploma | 0 (0.0%) | 0.0 |
| College or Associate's Degree | 157 (78.9%) | 82.0 |
| Bachelor's Degree | 13 (6.5%) | 23.0 |
| Graduate Degree | 0 (0.0%) | 0.0 |
| Total | 199 (100.0%) | 43.0 |
Fertility by Education by Marriage Status in Winchester
27.1% of women with births in Winchester are unmarried. Women with the educational attainment of bachelor's degree are most likely to be married with 100.0% of them married at childbirth, while women with the educational attainment of less than high school are least likely to be married with 58.6% of them unmarried at childbirth.

| Educational Attainment | Married | Unmarried |
| Less than High School | 12 (41.4%) | 17 (58.6%) |
| High School Diploma | 0 (0.0%) | 0 (0.0%) |
| College or Associate's Degree | 120 (76.4%) | 37 (23.6%) |
| Bachelor's Degree | 13 (100.0%) | 0 (0.0%) |
| Graduate Degree | 0 (0.0%) | 0 (0.0%) |
| Total | 145 (72.9%) | 54 (27.1%) |
Employment Characteristics in Winchester
Employment by Class of Employer in Winchester
Among the 8,524 employed individuals in Winchester, private company employees (6,623 | 77.7%), not-for-profit organizations (459 | 5.4%), and local government employees (434 | 5.1%) make up the most common classes of employment.
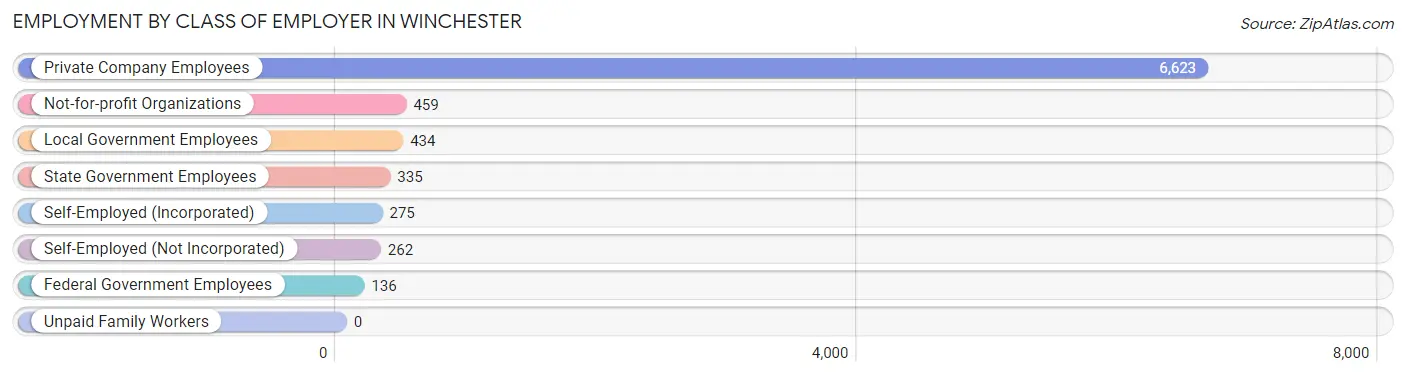
| Employer Class | # Employees | % Employees |
| Private Company Employees | 6,623 | 77.7% |
| Self-Employed (Incorporated) | 275 | 3.2% |
| Self-Employed (Not Incorporated) | 262 | 3.1% |
| Not-for-profit Organizations | 459 | 5.4% |
| Local Government Employees | 434 | 5.1% |
| State Government Employees | 335 | 3.9% |
| Federal Government Employees | 136 | 1.6% |
| Unpaid Family Workers | 0 | 0.0% |
| Total | 8,524 | 100.0% |
Employment Status by Age in Winchester
According to the labor force statistics for Winchester, out of the total population over 16 years of age (15,432), 59.1% or 9,120 individuals are in the labor force, with 5.6% or 511 of them unemployed. The age group with the highest labor force participation rate is 25 to 29 years, with 87.4% or 1,356 individuals in the labor force. Within the labor force, the 16 to 19 years age range has the highest percentage of unemployed individuals, with 17.0% or 53 of them being unemployed.
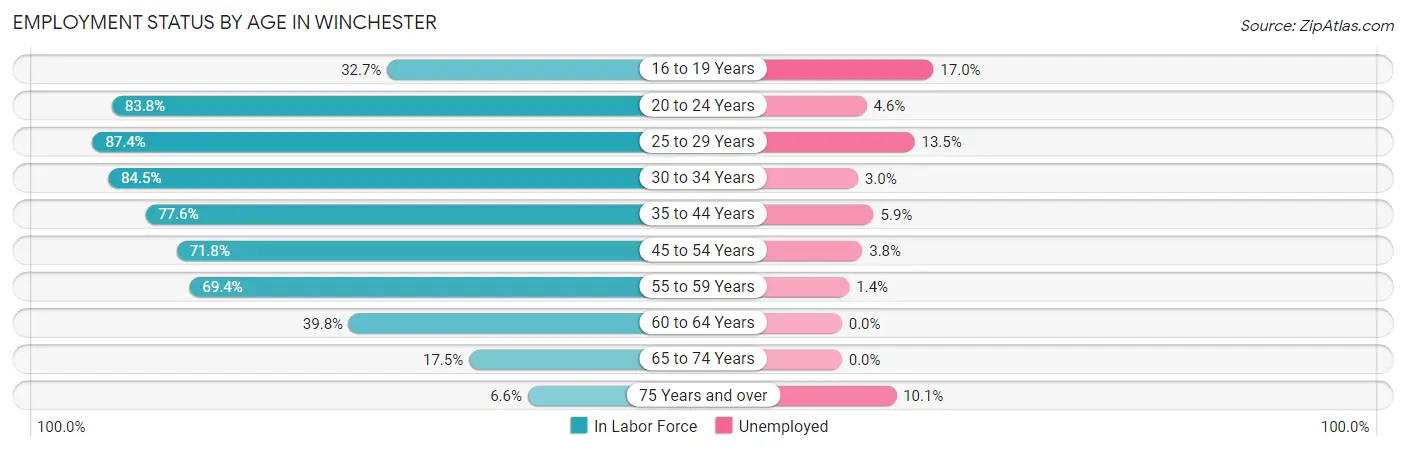
| Age Bracket | In Labor Force | Unemployed |
| 16 to 19 Years | 312 (32.7%) | 53 (17.0%) |
| 20 to 24 Years | 1,213 (83.8%) | 56 (4.6%) |
| 25 to 29 Years | 1,356 (87.4%) | 183 (13.5%) |
| 30 to 34 Years | 1,251 (84.5%) | 38 (3.0%) |
| 35 to 44 Years | 1,516 (77.6%) | 89 (5.9%) |
| 45 to 54 Years | 1,898 (71.8%) | 72 (3.8%) |
| 55 to 59 Years | 765 (69.4%) | 11 (1.4%) |
| 60 to 64 Years | 405 (39.8%) | 0 (0.0%) |
| 65 to 74 Years | 313 (17.5%) | 0 (0.0%) |
| 75 Years and over | 98 (6.6%) | 10 (10.1%) |
| Total | 9,120 (59.1%) | 511 (5.6%) |
Employment Status by Educational Attainment in Winchester
According to labor force statistics for Winchester, 73.7% of individuals (7,186) out of the total population between 25 and 64 years of age (9,750) are in the labor force, with 5.5% or 395 of them being unemployed. The group with the highest labor force participation rate are those with the educational attainment of college / associate degree, with 83.5% or 2,880 individuals in the labor force. Within the labor force, individuals with high school diploma education have the highest percentage of unemployment, with 6.0% or 144 of them being unemployed.
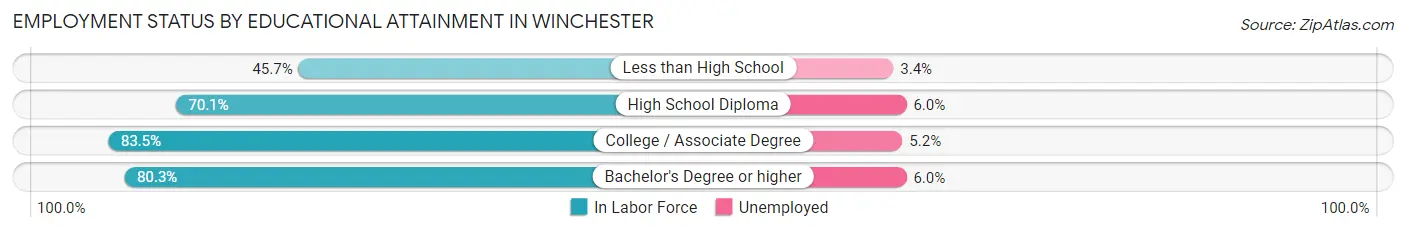
| Educational Attainment | In Labor Force | Unemployed |
| Less than High School | 531 (45.7%) | 40 (3.4%) |
| High School Diploma | 2,397 (70.1%) | 205 (6.0%) |
| College / Associate Degree | 2,880 (83.5%) | 179 (5.2%) |
| Bachelor's Degree or higher | 1,381 (80.3%) | 103 (6.0%) |
| Total | 7,186 (73.7%) | 536 (5.5%) |
Employment Occupations by Sex in Winchester
Management, Business, Science and Arts Occupations
The most common Management, Business, Science and Arts occupations in Winchester are Management (790 | 9.2%), Community & Social Service (589 | 6.8%), Health Diagnosing & Treating (576 | 6.7%), Education Instruction & Library (440 | 5.1%), and Business & Financial (364 | 4.2%).
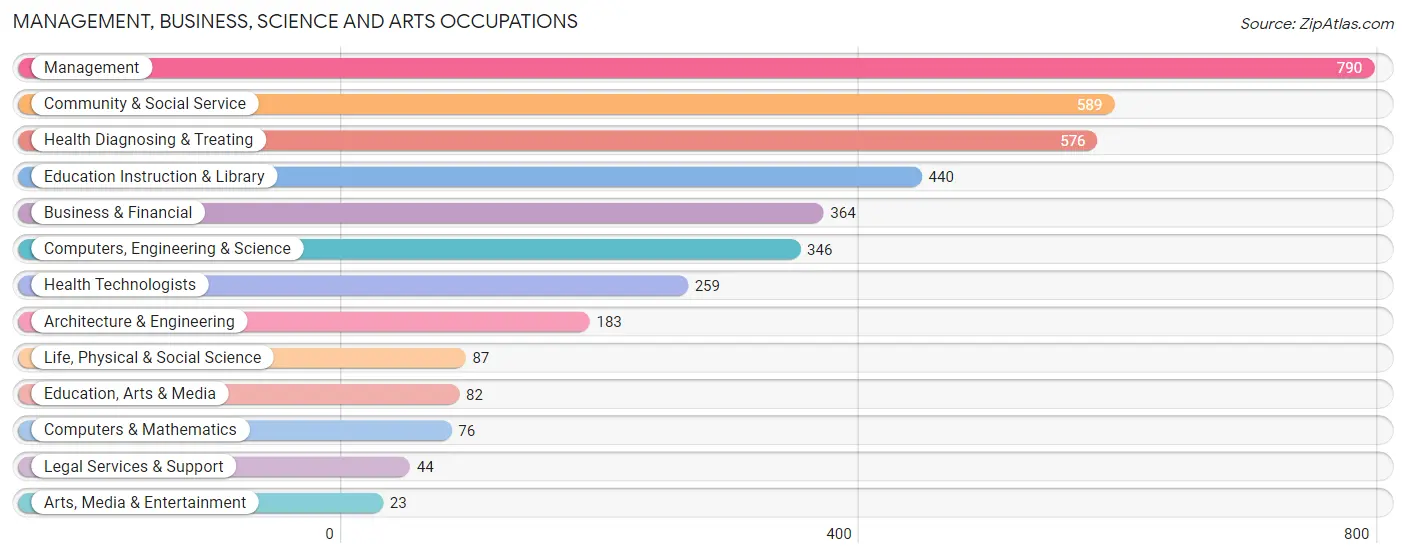
Management, Business, Science and Arts Occupations by Sex
Within the Management, Business, Science and Arts occupations in Winchester, the most male-oriented occupations are Arts, Media & Entertainment (100.0%), Life, Physical & Social Science (85.1%), and Computers & Mathematics (84.2%), while the most female-oriented occupations are Education Instruction & Library (94.3%), Health Technologists (91.9%), and Education, Arts & Media (90.2%).
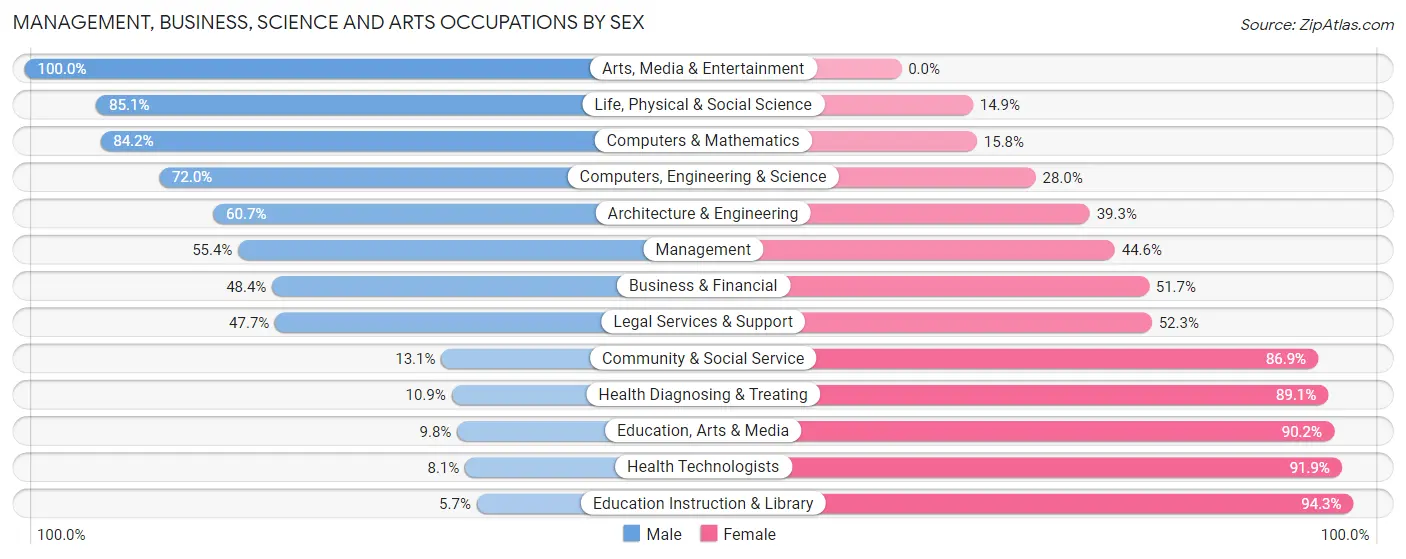
| Occupation | Male | Female |
| Management | 438 (55.4%) | 352 (44.6%) |
| Business & Financial | 176 (48.3%) | 188 (51.6%) |
| Computers, Engineering & Science | 249 (72.0%) | 97 (28.0%) |
| Computers & Mathematics | 64 (84.2%) | 12 (15.8%) |
| Architecture & Engineering | 111 (60.7%) | 72 (39.3%) |
| Life, Physical & Social Science | 74 (85.1%) | 13 (14.9%) |
| Community & Social Service | 77 (13.1%) | 512 (86.9%) |
| Education, Arts & Media | 8 (9.8%) | 74 (90.2%) |
| Legal Services & Support | 21 (47.7%) | 23 (52.3%) |
| Education Instruction & Library | 25 (5.7%) | 415 (94.3%) |
| Arts, Media & Entertainment | 23 (100.0%) | 0 (0.0%) |
| Health Diagnosing & Treating | 63 (10.9%) | 513 (89.1%) |
| Health Technologists | 21 (8.1%) | 238 (91.9%) |
| Total (Category) | 1,003 (37.6%) | 1,662 (62.4%) |
| Total (Overall) | 4,566 (53.0%) | 4,050 (47.0%) |
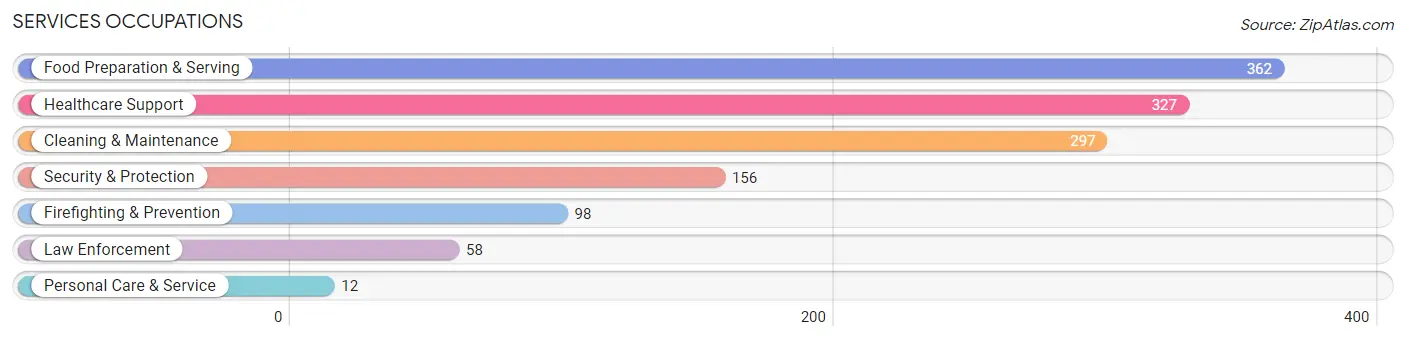
Services Occupations
The most common Services occupations in Winchester are Food Preparation & Serving (362 | 4.2%), Healthcare Support (327 | 3.8%), Cleaning & Maintenance (297 | 3.5%), Security & Protection (156 | 1.8%), and Firefighting & Prevention (98 | 1.1%).
Services Occupations by Sex
Within the Services occupations in Winchester, the most male-oriented occupations are Firefighting & Prevention (100.0%), Security & Protection (92.3%), and Law Enforcement (79.3%), while the most female-oriented occupations are Healthcare Support (100.0%), Personal Care & Service (100.0%), and Food Preparation & Serving (70.2%).
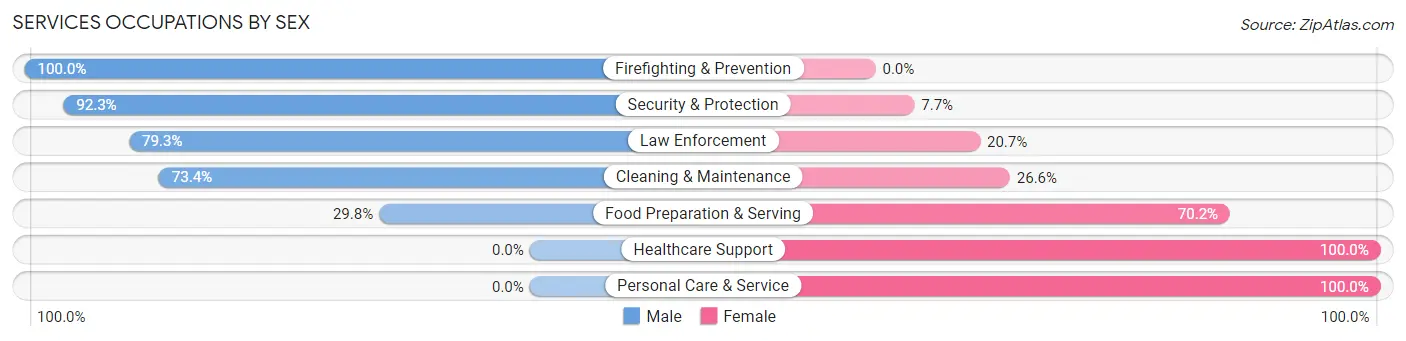
| Occupation | Male | Female |
| Healthcare Support | 0 (0.0%) | 327 (100.0%) |
| Security & Protection | 144 (92.3%) | 12 (7.7%) |
| Firefighting & Prevention | 98 (100.0%) | 0 (0.0%) |
| Law Enforcement | 46 (79.3%) | 12 (20.7%) |
| Food Preparation & Serving | 108 (29.8%) | 254 (70.2%) |
| Cleaning & Maintenance | 218 (73.4%) | 79 (26.6%) |
| Personal Care & Service | 0 (0.0%) | 12 (100.0%) |
| Total (Category) | 470 (40.7%) | 684 (59.3%) |
| Total (Overall) | 4,566 (53.0%) | 4,050 (47.0%) |
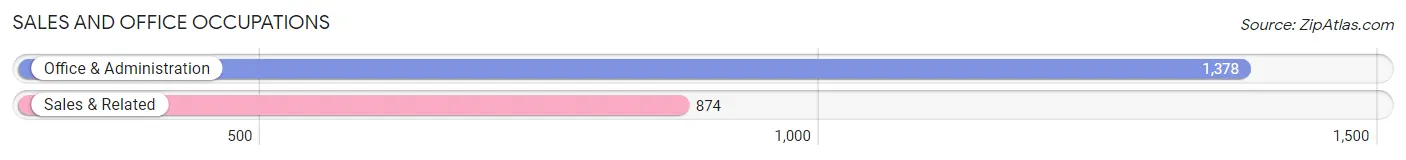
Sales and Office Occupations
The most common Sales and Office occupations in Winchester are Office & Administration (1,378 | 16.0%), and Sales & Related (874 | 10.1%).
Sales and Office Occupations by Sex
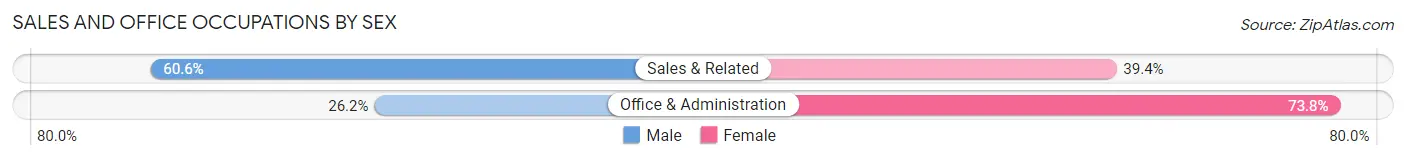
| Occupation | Male | Female |
| Sales & Related | 530 (60.6%) | 344 (39.4%) |
| Office & Administration | 361 (26.2%) | 1,017 (73.8%) |
| Total (Category) | 891 (39.6%) | 1,361 (60.4%) |
| Total (Overall) | 4,566 (53.0%) | 4,050 (47.0%) |
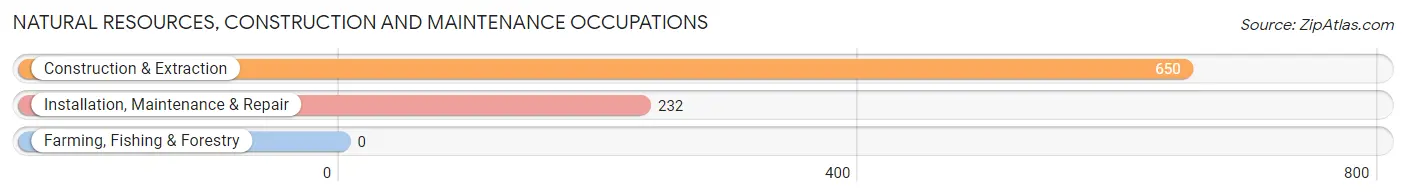
Natural Resources, Construction and Maintenance Occupations
The most common Natural Resources, Construction and Maintenance occupations in Winchester are Construction & Extraction (650 | 7.5%), and Installation, Maintenance & Repair (232 | 2.7%).
Natural Resources, Construction and Maintenance Occupations by Sex
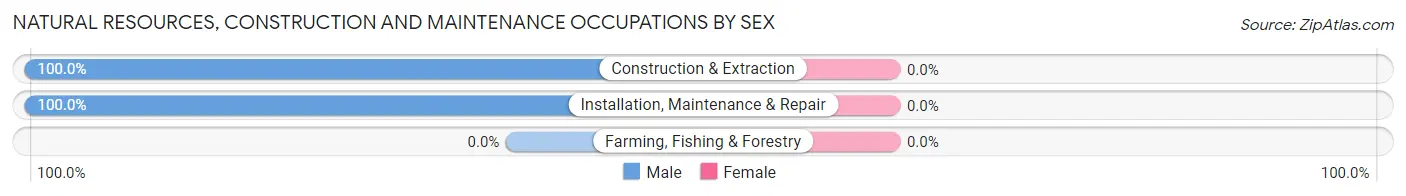
| Occupation | Male | Female |
| Farming, Fishing & Forestry | 0 (0.0%) | 0 (0.0%) |
| Construction & Extraction | 650 (100.0%) | 0 (0.0%) |
| Installation, Maintenance & Repair | 232 (100.0%) | 0 (0.0%) |
| Total (Category) | 882 (100.0%) | 0 (0.0%) |
| Total (Overall) | 4,566 (53.0%) | 4,050 (47.0%) |
Production, Transportation and Moving Occupations
The most common Production, Transportation and Moving occupations in Winchester are Production (877 | 10.2%), Material Moving (486 | 5.6%), and Transportation (300 | 3.5%).
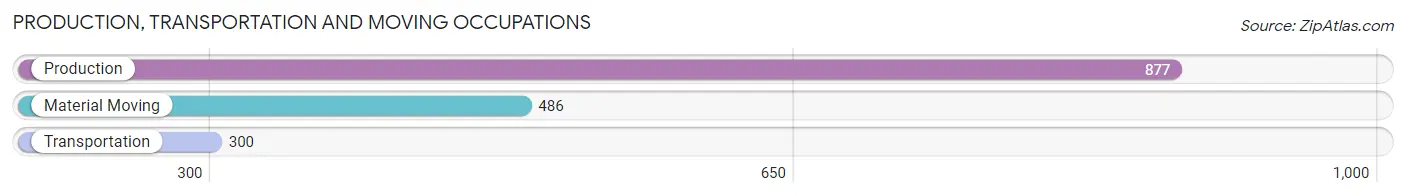
Production, Transportation and Moving Occupations by Sex
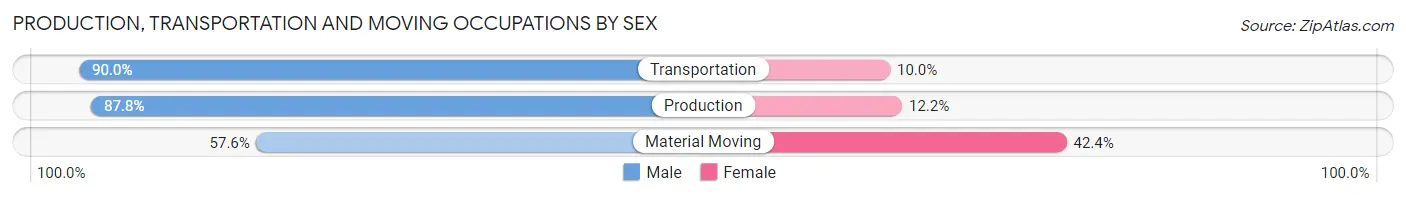
| Occupation | Male | Female |
| Production | 770 (87.8%) | 107 (12.2%) |
| Transportation | 270 (90.0%) | 30 (10.0%) |
| Material Moving | 280 (57.6%) | 206 (42.4%) |
| Total (Category) | 1,320 (79.4%) | 343 (20.6%) |
| Total (Overall) | 4,566 (53.0%) | 4,050 (47.0%) |
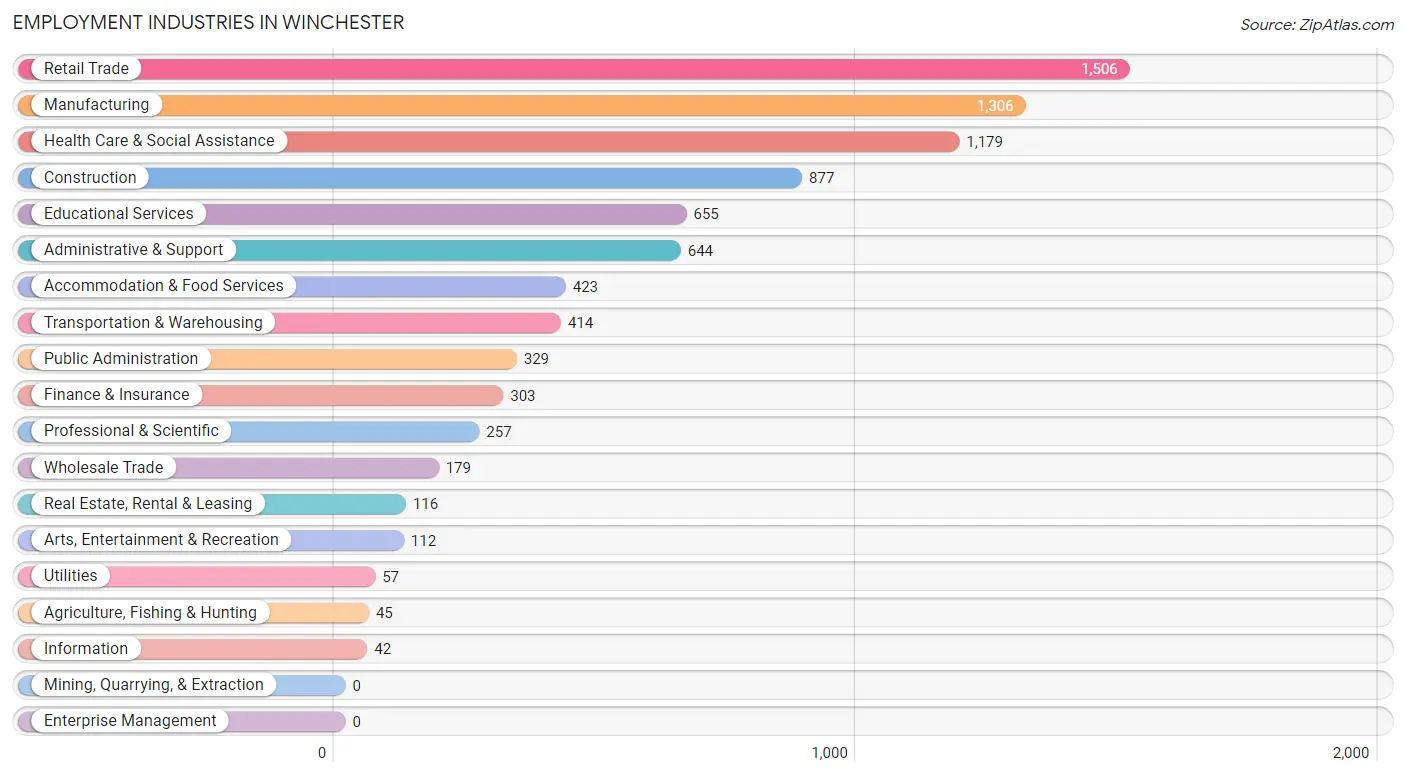
Employment Industries by Sex in Winchester
Employment Industries in Winchester
The major employment industries in Winchester include Retail Trade (1,506 | 17.5%), Manufacturing (1,306 | 15.2%), Health Care & Social Assistance (1,179 | 13.7%), Construction (877 | 10.2%), and Educational Services (655 | 7.6%).
Employment Industries by Sex in Winchester
The Winchester industries that see more men than women are Utilities (100.0%), Construction (98.0%), and Arts, Entertainment & Recreation (92.9%), whereas the industries that tend to have a higher number of women are Health Care & Social Assistance (92.6%), Educational Services (80.5%), and Finance & Insurance (69.0%).
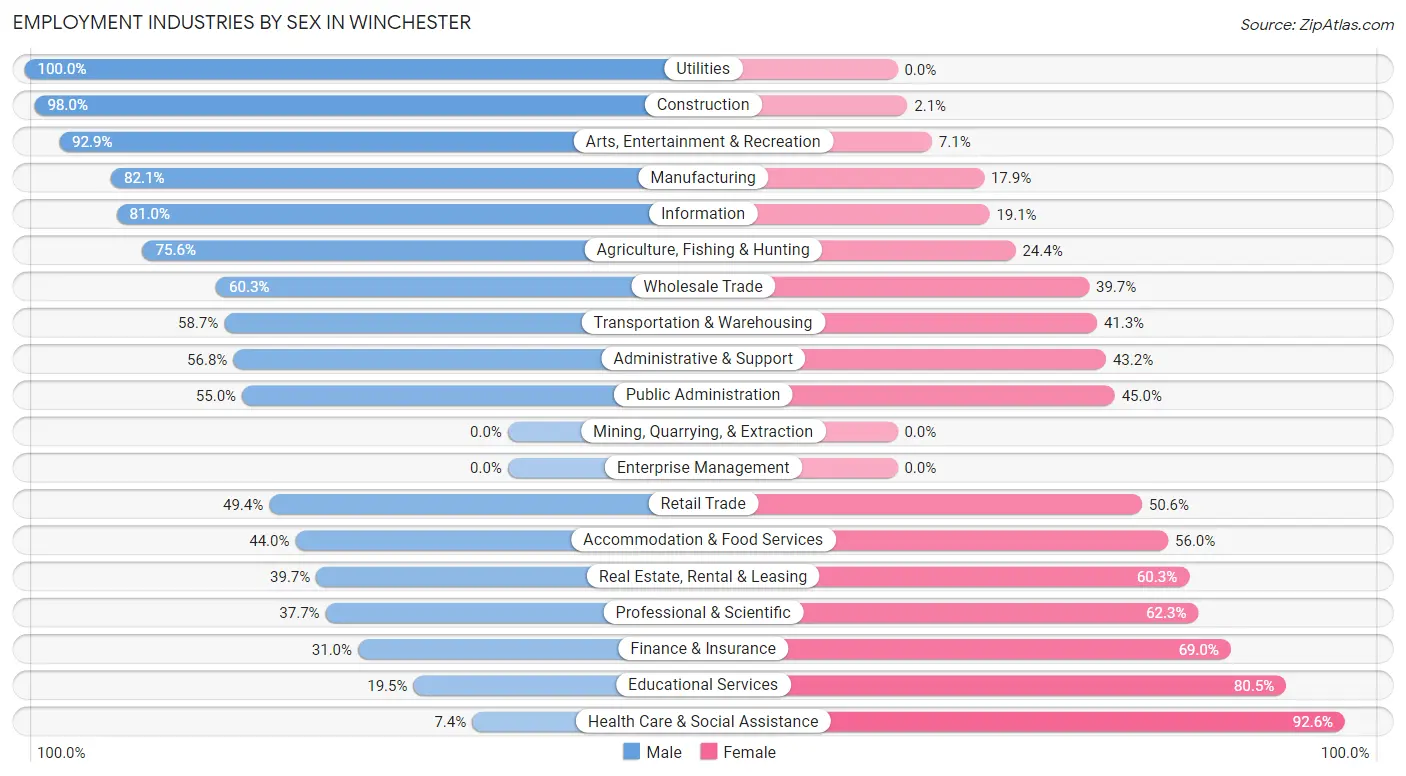
| Industry | Male | Female |
| Agriculture, Fishing & Hunting | 34 (75.6%) | 11 (24.4%) |
| Mining, Quarrying, & Extraction | 0 (0.0%) | 0 (0.0%) |
| Construction | 859 (98.0%) | 18 (2.1%) |
| Manufacturing | 1,072 (82.1%) | 234 (17.9%) |
| Wholesale Trade | 108 (60.3%) | 71 (39.7%) |
| Retail Trade | 744 (49.4%) | 762 (50.6%) |
| Transportation & Warehousing | 243 (58.7%) | 171 (41.3%) |
| Utilities | 57 (100.0%) | 0 (0.0%) |
| Information | 34 (80.9%) | 8 (19.1%) |
| Finance & Insurance | 94 (31.0%) | 209 (69.0%) |
| Real Estate, Rental & Leasing | 46 (39.7%) | 70 (60.3%) |
| Professional & Scientific | 97 (37.7%) | 160 (62.3%) |
| Enterprise Management | 0 (0.0%) | 0 (0.0%) |
| Administrative & Support | 366 (56.8%) | 278 (43.2%) |
| Educational Services | 128 (19.5%) | 527 (80.5%) |
| Health Care & Social Assistance | 87 (7.4%) | 1,092 (92.6%) |
| Arts, Entertainment & Recreation | 104 (92.9%) | 8 (7.1%) |
| Accommodation & Food Services | 186 (44.0%) | 237 (56.0%) |
| Public Administration | 181 (55.0%) | 148 (45.0%) |
| Total | 4,566 (53.0%) | 4,050 (47.0%) |
Education in Winchester
School Enrollment in Winchester
The most common levels of schooling among the 3,987 students in Winchester are middle school (884 | 22.2%), high school (831 | 20.8%), and college / undergraduate (792 | 19.9%).
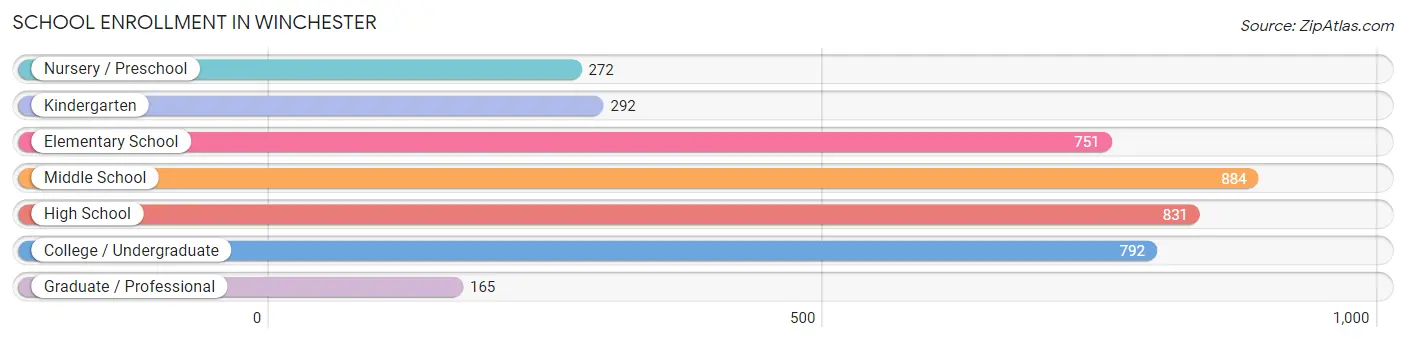
| School Level | # Students | % Students |
| Nursery / Preschool | 272 | 6.8% |
| Kindergarten | 292 | 7.3% |
| Elementary School | 751 | 18.8% |
| Middle School | 884 | 22.2% |
| High School | 831 | 20.8% |
| College / Undergraduate | 792 | 19.9% |
| Graduate / Professional | 165 | 4.1% |
| Total | 3,987 | 100.0% |
School Enrollment by Age by Funding Source in Winchester
Out of a total of 3,987 students who are enrolled in schools in Winchester, 335 (8.4%) attend a private institution, while the remaining 3,652 (91.6%) are enrolled in public schools. The age group of 5 to 9 year old has the highest likelihood of being enrolled in private schools, with 179 (17.4% in the age bracket) enrolled. Conversely, the age group of 18 to 19 year olds has the lowest likelihood of being enrolled in a private school, with 148 (100.0% in the age bracket) attending a public institution.
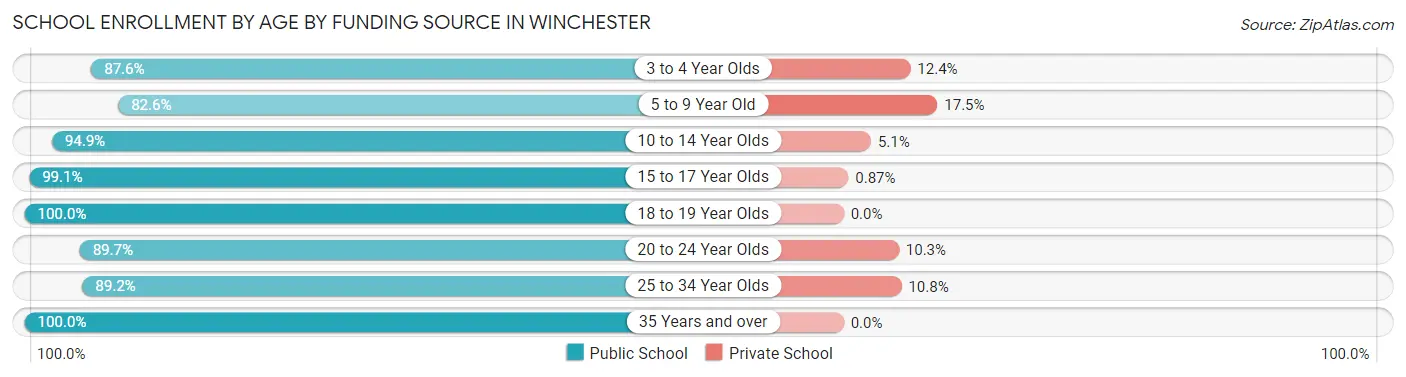
| Age Bracket | Public School | Private School |
| 3 to 4 Year Olds | 148 (87.6%) | 21 (12.4%) |
| 5 to 9 Year Old | 847 (82.6%) | 179 (17.4%) |
| 10 to 14 Year Olds | 1,101 (94.9%) | 59 (5.1%) |
| 15 to 17 Year Olds | 680 (99.1%) | 6 (0.9%) |
| 18 to 19 Year Olds | 148 (100.0%) | 0 (0.0%) |
| 20 to 24 Year Olds | 253 (89.7%) | 29 (10.3%) |
| 25 to 34 Year Olds | 348 (89.2%) | 42 (10.8%) |
| 35 Years and over | 126 (100.0%) | 0 (0.0%) |
| Total | 3,652 (91.6%) | 335 (8.4%) |
Educational Attainment by Field of Study in Winchester
Science & technology (422 | 17.6%), education (384 | 16.1%), business (297 | 12.4%), arts & humanities (241 | 10.1%), and bio, nature & agricultural (226 | 9.5%) are the most common fields of study among 2,392 individuals in Winchester who have obtained a bachelor's degree or higher.
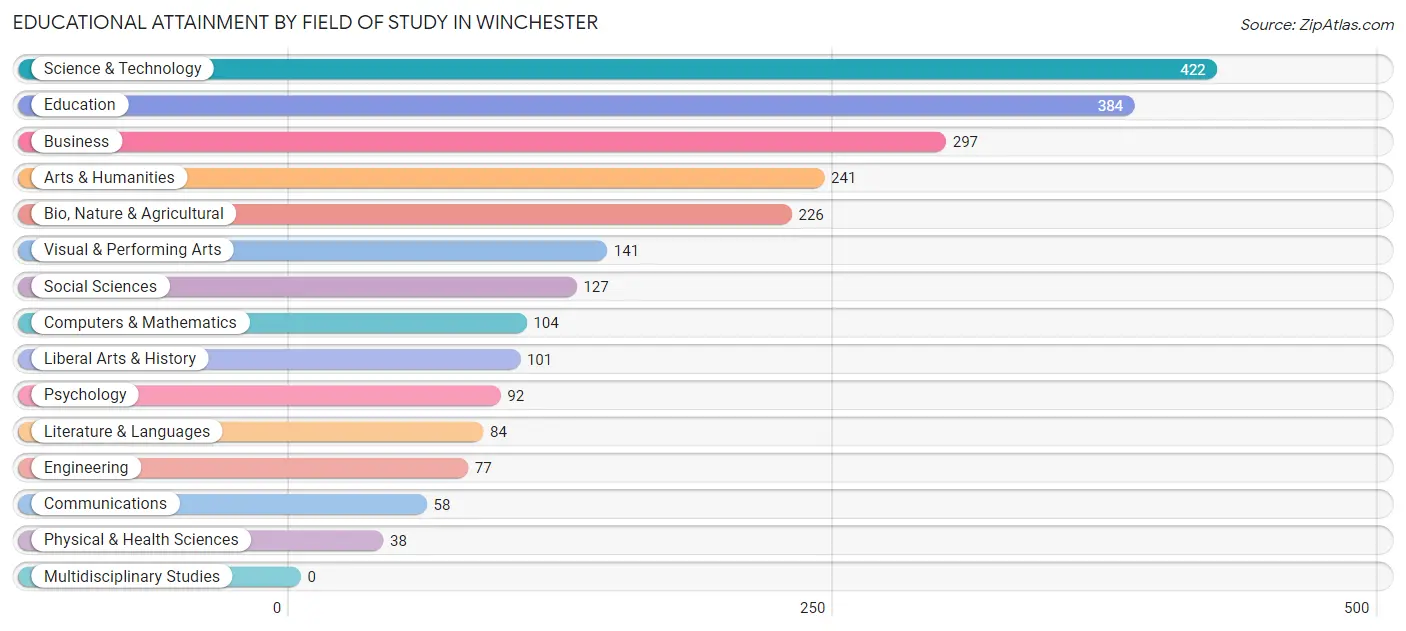
| Field of Study | # Graduates | % Graduates |
| Computers & Mathematics | 104 | 4.3% |
| Bio, Nature & Agricultural | 226 | 9.5% |
| Physical & Health Sciences | 38 | 1.6% |
| Psychology | 92 | 3.8% |
| Social Sciences | 127 | 5.3% |
| Engineering | 77 | 3.2% |
| Multidisciplinary Studies | 0 | 0.0% |
| Science & Technology | 422 | 17.6% |
| Business | 297 | 12.4% |
| Education | 384 | 16.1% |
| Literature & Languages | 84 | 3.5% |
| Liberal Arts & History | 101 | 4.2% |
| Visual & Performing Arts | 141 | 5.9% |
| Communications | 58 | 2.4% |
| Arts & Humanities | 241 | 10.1% |
| Total | 2,392 | 100.0% |
Transportation & Commute in Winchester
Vehicle Availability by Sex in Winchester
The most prevalent vehicle ownership categories in Winchester are males with 2 vehicles (1,857, accounting for 41.0%) and females with 2 vehicles (1,492, making up 46.7%).
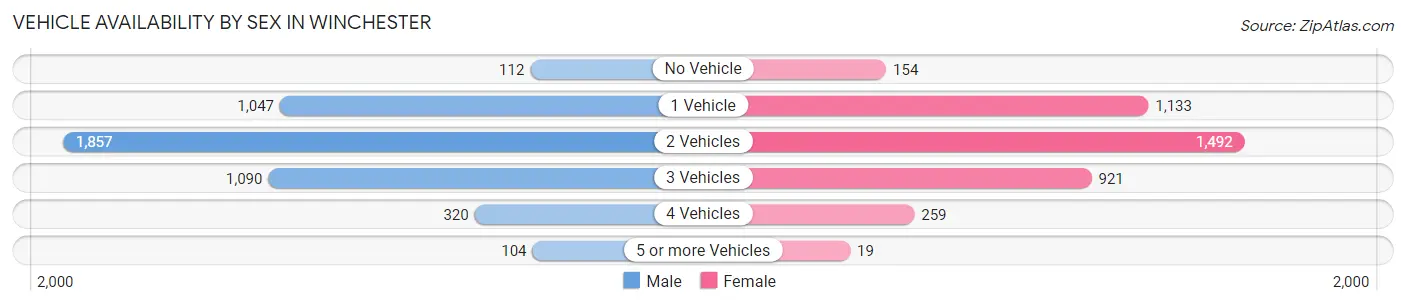
| Vehicles Available | Male | Female |
| No Vehicle | 112 (2.5%) | 154 (3.9%) |
| 1 Vehicle | 1,047 (23.1%) | 1,133 (28.5%) |
| 2 Vehicles | 1,857 (41.0%) | 1,492 (37.5%) |
| 3 Vehicles | 1,090 (24.1%) | 921 (23.2%) |
| 4 Vehicles | 320 (7.1%) | 259 (6.5%) |
| 5 or more Vehicles | 104 (2.3%) | 19 (0.5%) |
| Total | 4,530 (100.0%) | 3,978 (100.0%) |
Commute Time in Winchester
The most frequently occuring commute durations in Winchester are 5 to 9 minutes (1,599 commuters, 20.0%), 30 to 34 minutes (1,112 commuters, 13.9%), and 10 to 14 minutes (1,072 commuters, 13.4%).
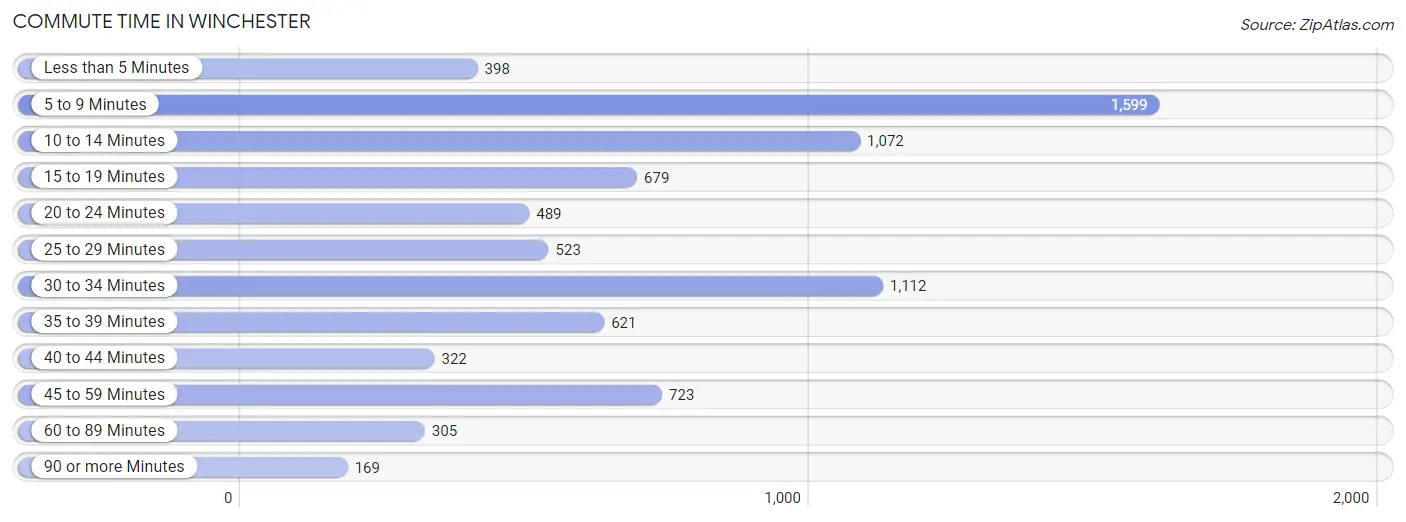
| Commute Time | # Commuters | % Commuters |
| Less than 5 Minutes | 398 | 5.0% |
| 5 to 9 Minutes | 1,599 | 20.0% |
| 10 to 14 Minutes | 1,072 | 13.4% |
| 15 to 19 Minutes | 679 | 8.5% |
| 20 to 24 Minutes | 489 | 6.1% |
| 25 to 29 Minutes | 523 | 6.5% |
| 30 to 34 Minutes | 1,112 | 13.9% |
| 35 to 39 Minutes | 621 | 7.7% |
| 40 to 44 Minutes | 322 | 4.0% |
| 45 to 59 Minutes | 723 | 9.0% |
| 60 to 89 Minutes | 305 | 3.8% |
| 90 or more Minutes | 169 | 2.1% |
Commute Time by Sex in Winchester
The most common commute times in Winchester are 30 to 34 minutes (789 commuters, 18.4%) for males and 5 to 9 minutes (1,078 commuters, 28.9%) for females.
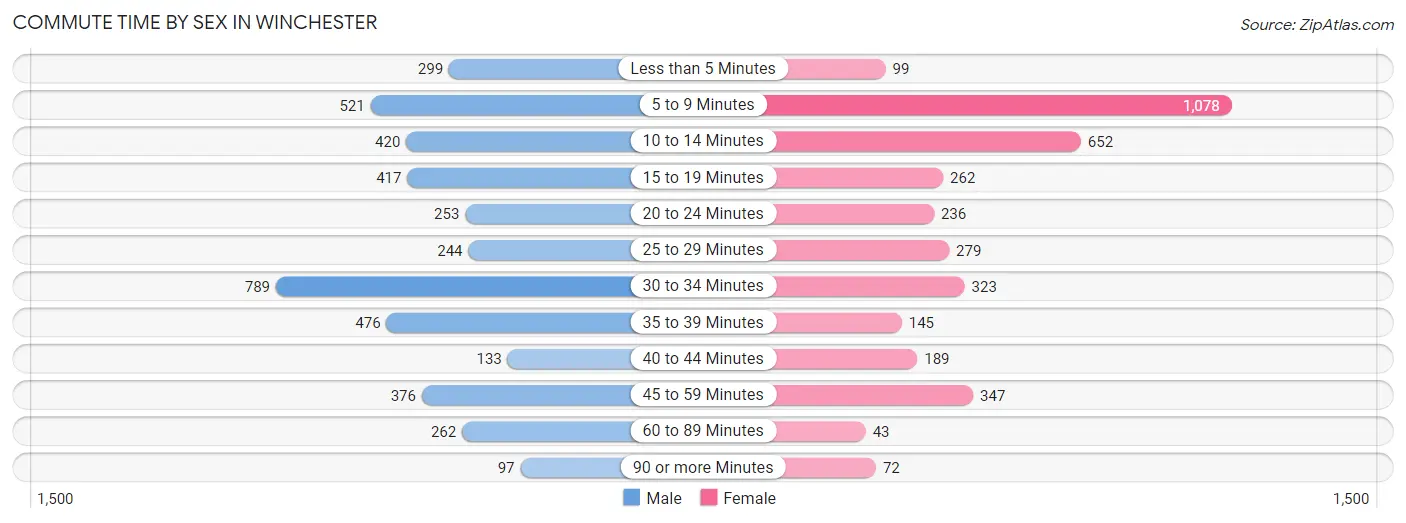
| Commute Time | Male | Female |
| Less than 5 Minutes | 299 (7.0%) | 99 (2.7%) |
| 5 to 9 Minutes | 521 (12.1%) | 1,078 (28.9%) |
| 10 to 14 Minutes | 420 (9.8%) | 652 (17.5%) |
| 15 to 19 Minutes | 417 (9.7%) | 262 (7.0%) |
| 20 to 24 Minutes | 253 (5.9%) | 236 (6.3%) |
| 25 to 29 Minutes | 244 (5.7%) | 279 (7.5%) |
| 30 to 34 Minutes | 789 (18.4%) | 323 (8.7%) |
| 35 to 39 Minutes | 476 (11.1%) | 145 (3.9%) |
| 40 to 44 Minutes | 133 (3.1%) | 189 (5.1%) |
| 45 to 59 Minutes | 376 (8.8%) | 347 (9.3%) |
| 60 to 89 Minutes | 262 (6.1%) | 43 (1.1%) |
| 90 or more Minutes | 97 (2.3%) | 72 (1.9%) |
Time of Departure to Work by Sex in Winchester
The most frequent times of departure to work in Winchester are 4:00 PM to 11:59 PM (681, 15.9%) for males and 7:30 AM to 7:59 AM (611, 16.4%) for females.
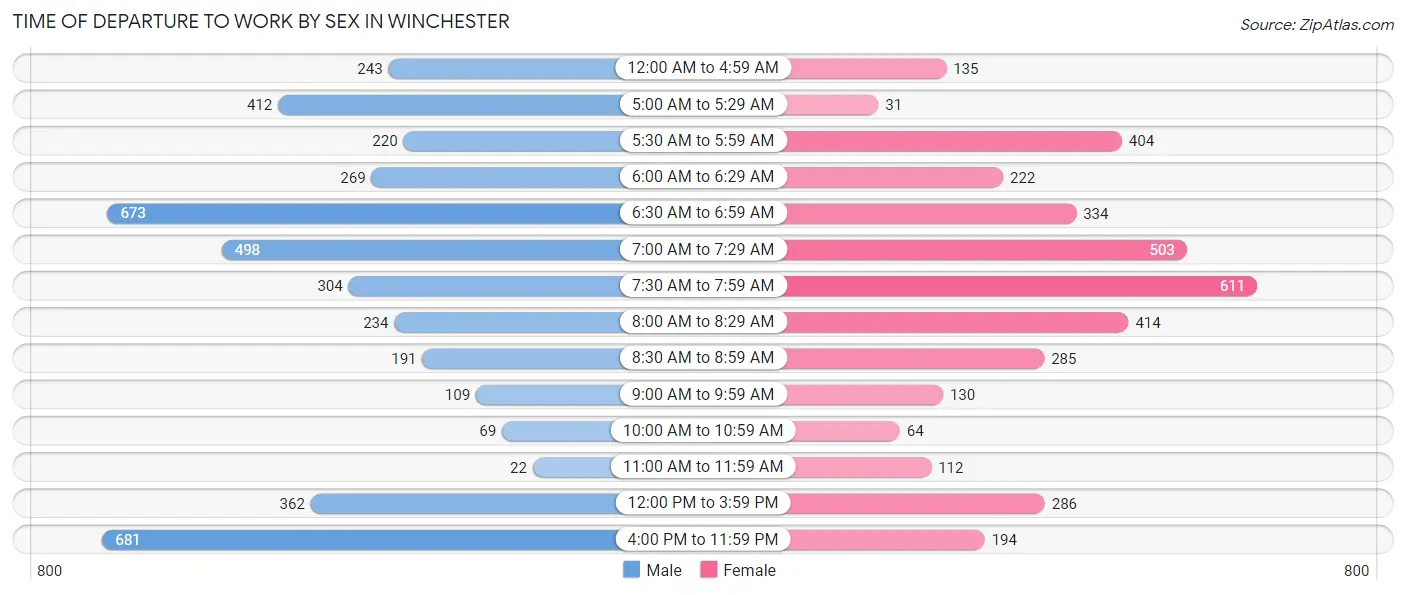
| Time of Departure | Male | Female |
| 12:00 AM to 4:59 AM | 243 (5.7%) | 135 (3.6%) |
| 5:00 AM to 5:29 AM | 412 (9.6%) | 31 (0.8%) |
| 5:30 AM to 5:59 AM | 220 (5.1%) | 404 (10.8%) |
| 6:00 AM to 6:29 AM | 269 (6.3%) | 222 (6.0%) |
| 6:30 AM to 6:59 AM | 673 (15.7%) | 334 (9.0%) |
| 7:00 AM to 7:29 AM | 498 (11.6%) | 503 (13.5%) |
| 7:30 AM to 7:59 AM | 304 (7.1%) | 611 (16.4%) |
| 8:00 AM to 8:29 AM | 234 (5.5%) | 414 (11.1%) |
| 8:30 AM to 8:59 AM | 191 (4.5%) | 285 (7.6%) |
| 9:00 AM to 9:59 AM | 109 (2.5%) | 130 (3.5%) |
| 10:00 AM to 10:59 AM | 69 (1.6%) | 64 (1.7%) |
| 11:00 AM to 11:59 AM | 22 (0.5%) | 112 (3.0%) |
| 12:00 PM to 3:59 PM | 362 (8.4%) | 286 (7.7%) |
| 4:00 PM to 11:59 PM | 681 (15.9%) | 194 (5.2%) |
| Total | 4,287 (100.0%) | 3,725 (100.0%) |
Housing Occupancy in Winchester
Occupancy by Ownership in Winchester
Of the total 8,036 dwellings in Winchester, owner-occupied units account for 4,809 (59.8%), while renter-occupied units make up 3,227 (40.2%).
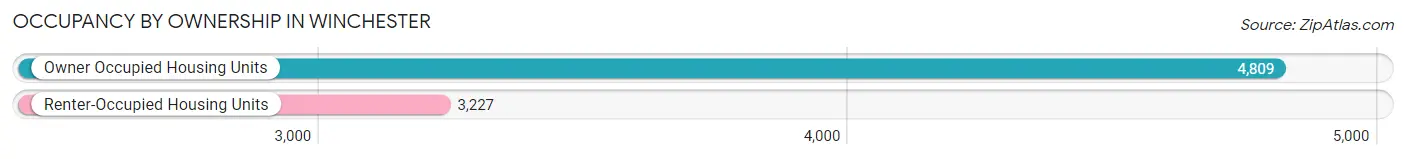
| Occupancy | # Housing Units | % Housing Units |
| Owner Occupied Housing Units | 4,809 | 59.8% |
| Renter-Occupied Housing Units | 3,227 | 40.2% |
| Total Occupied Housing Units | 8,036 | 100.0% |
Occupancy by Household Size in Winchester
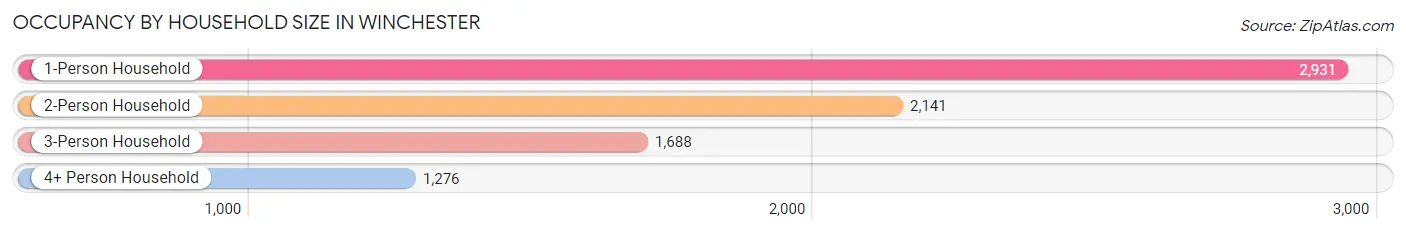
| Household Size | # Housing Units | % Housing Units |
| 1-Person Household | 2,931 | 36.5% |
| 2-Person Household | 2,141 | 26.6% |
| 3-Person Household | 1,688 | 21.0% |
| 4+ Person Household | 1,276 | 15.9% |
| Total Housing Units | 8,036 | 100.0% |
Occupancy by Ownership by Household Size in Winchester
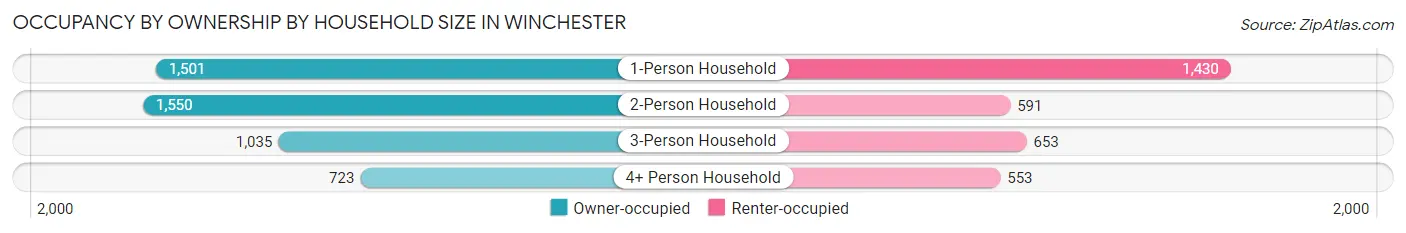
| Household Size | Owner-occupied | Renter-occupied |
| 1-Person Household | 1,501 (51.2%) | 1,430 (48.8%) |
| 2-Person Household | 1,550 (72.4%) | 591 (27.6%) |
| 3-Person Household | 1,035 (61.3%) | 653 (38.7%) |
| 4+ Person Household | 723 (56.7%) | 553 (43.3%) |
| Total Housing Units | 4,809 (59.8%) | 3,227 (40.2%) |
Occupancy by Educational Attainment in Winchester
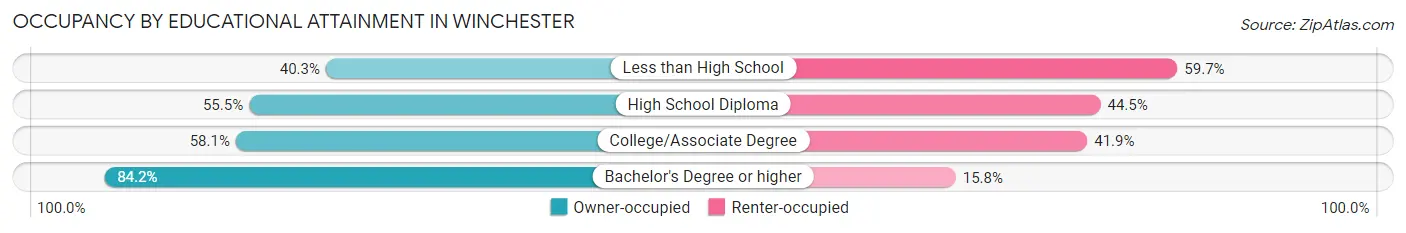
| Household Size | Owner-occupied | Renter-occupied |
| Less than High School | 398 (40.3%) | 590 (59.7%) |
| High School Diploma | 1,515 (55.5%) | 1,214 (44.5%) |
| College/Associate Degree | 1,653 (58.1%) | 1,190 (41.9%) |
| Bachelor's Degree or higher | 1,243 (84.2%) | 233 (15.8%) |
Occupancy by Age of Householder in Winchester
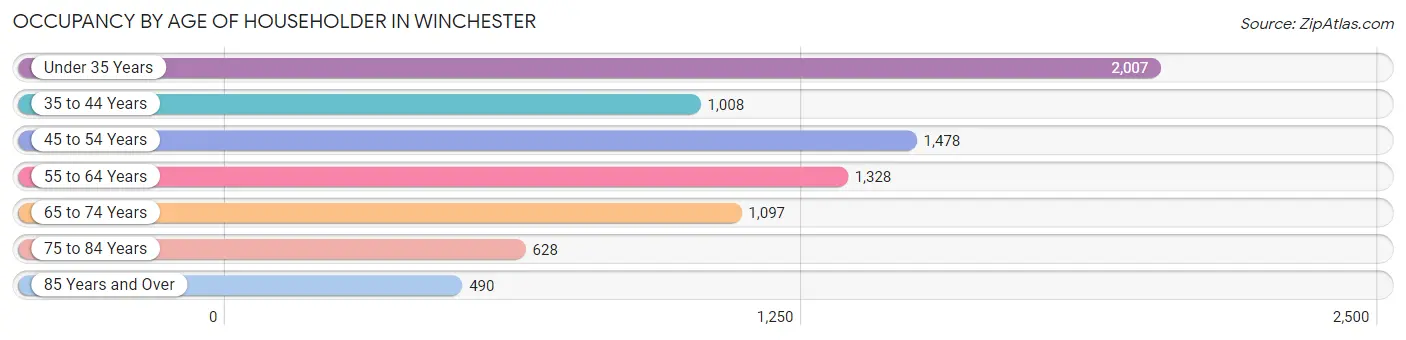
| Age Bracket | # Households | % Households |
| Under 35 Years | 2,007 | 25.0% |
| 35 to 44 Years | 1,008 | 12.5% |
| 45 to 54 Years | 1,478 | 18.4% |
| 55 to 64 Years | 1,328 | 16.5% |
| 65 to 74 Years | 1,097 | 13.7% |
| 75 to 84 Years | 628 | 7.8% |
| 85 Years and Over | 490 | 6.1% |
| Total | 8,036 | 100.0% |
Housing Finances in Winchester
Median Income by Occupancy in Winchester
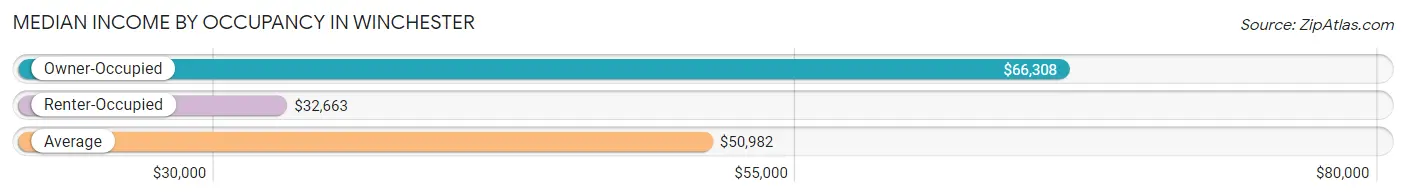
| Occupancy Type | # Households | Median Income |
| Owner-Occupied | 4,809 (59.8%) | $66,308 |
| Renter-Occupied | 3,227 (40.2%) | $32,663 |
| Average | 8,036 (100.0%) | $50,982 |
Occupancy by Householder Income Bracket in Winchester
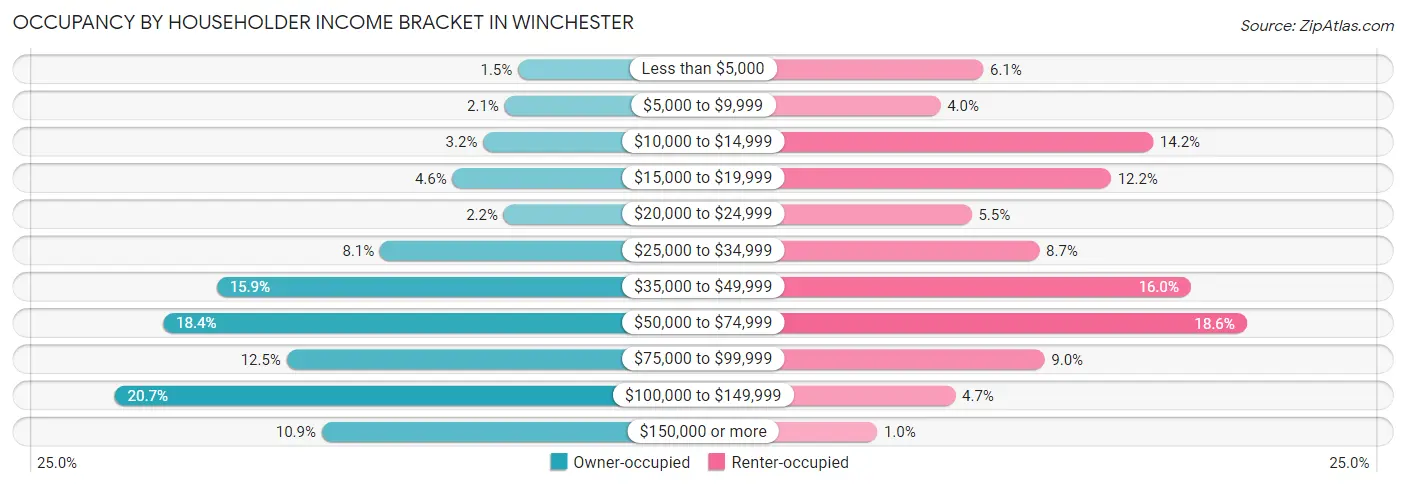
| Income Bracket | Owner-occupied | Renter-occupied |
| Less than $5,000 | 72 (1.5%) | 196 (6.1%) |
| $5,000 to $9,999 | 103 (2.1%) | 130 (4.0%) |
| $10,000 to $14,999 | 152 (3.2%) | 457 (14.2%) |
| $15,000 to $19,999 | 222 (4.6%) | 392 (12.1%) |
| $20,000 to $24,999 | 105 (2.2%) | 178 (5.5%) |
| $25,000 to $34,999 | 388 (8.1%) | 282 (8.7%) |
| $35,000 to $49,999 | 762 (15.9%) | 515 (16.0%) |
| $50,000 to $74,999 | 885 (18.4%) | 601 (18.6%) |
| $75,000 to $99,999 | 602 (12.5%) | 290 (9.0%) |
| $100,000 to $149,999 | 996 (20.7%) | 153 (4.7%) |
| $150,000 or more | 522 (10.8%) | 33 (1.0%) |
| Total | 4,809 (100.0%) | 3,227 (100.0%) |
Monthly Housing Cost Tiers in Winchester
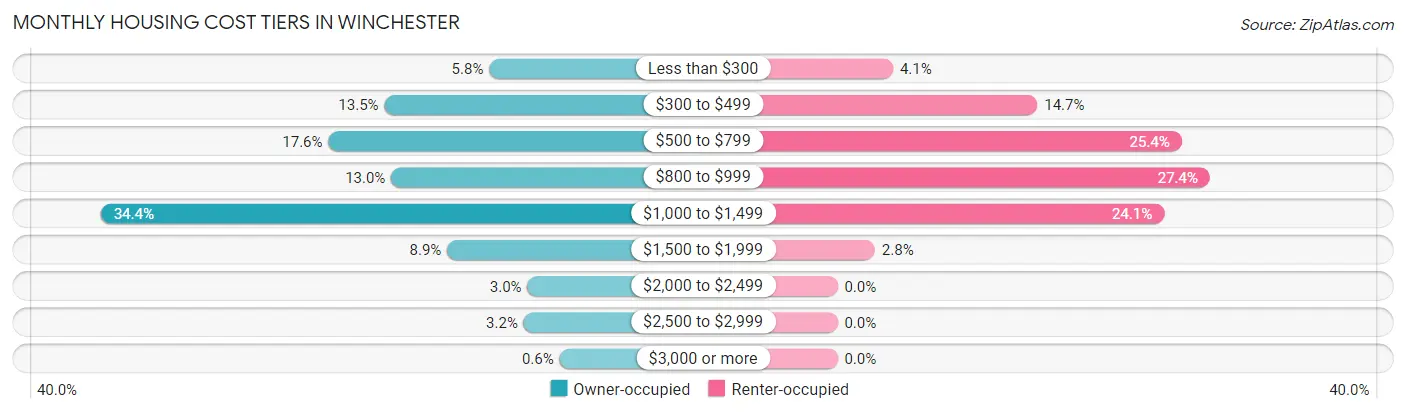
| Monthly Cost | Owner-occupied | Renter-occupied |
| Less than $300 | 278 (5.8%) | 132 (4.1%) |
| $300 to $499 | 649 (13.5%) | 475 (14.7%) |
| $500 to $799 | 848 (17.6%) | 818 (25.4%) |
| $800 to $999 | 625 (13.0%) | 885 (27.4%) |
| $1,000 to $1,499 | 1,654 (34.4%) | 776 (24.0%) |
| $1,500 to $1,999 | 427 (8.9%) | 89 (2.8%) |
| $2,000 to $2,499 | 143 (3.0%) | 0 (0.0%) |
| $2,500 to $2,999 | 156 (3.2%) | 0 (0.0%) |
| $3,000 or more | 29 (0.6%) | 0 (0.0%) |
| Total | 4,809 (100.0%) | 3,227 (100.0%) |
Physical Housing Characteristics in Winchester
Housing Structures in Winchester
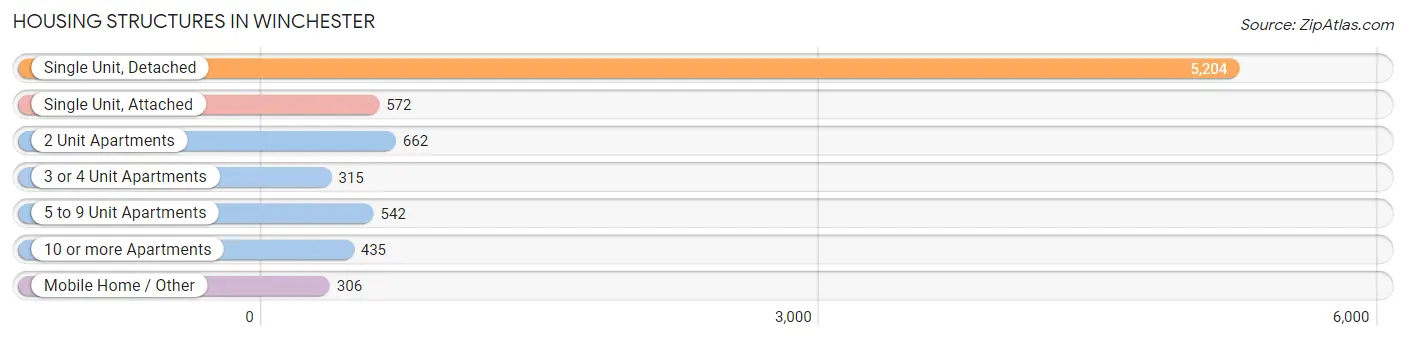
| Structure Type | # Housing Units | % Housing Units |
| Single Unit, Detached | 5,204 | 64.8% |
| Single Unit, Attached | 572 | 7.1% |
| 2 Unit Apartments | 662 | 8.2% |
| 3 or 4 Unit Apartments | 315 | 3.9% |
| 5 to 9 Unit Apartments | 542 | 6.7% |
| 10 or more Apartments | 435 | 5.4% |
| Mobile Home / Other | 306 | 3.8% |
| Total | 8,036 | 100.0% |
Housing Structures by Occupancy in Winchester
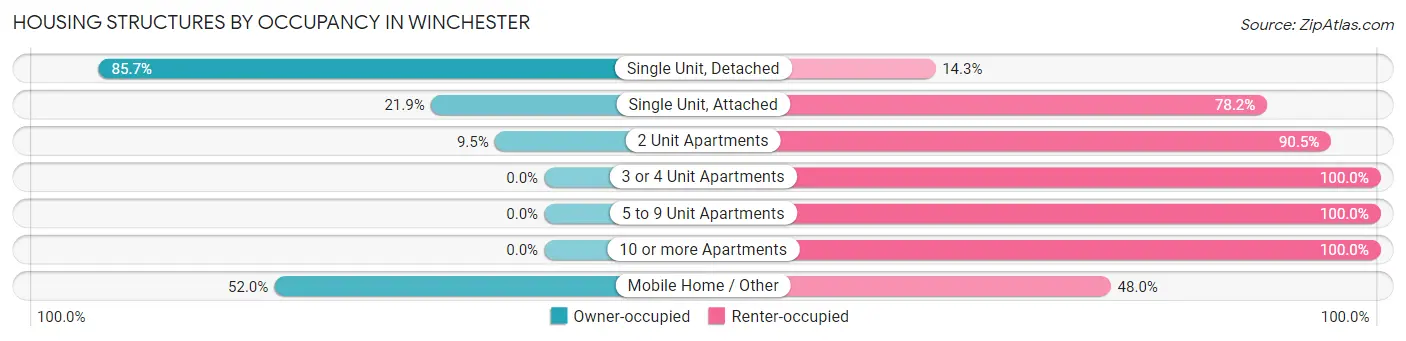
| Structure Type | Owner-occupied | Renter-occupied |
| Single Unit, Detached | 4,462 (85.7%) | 742 (14.3%) |
| Single Unit, Attached | 125 (21.8%) | 447 (78.1%) |
| 2 Unit Apartments | 63 (9.5%) | 599 (90.5%) |
| 3 or 4 Unit Apartments | 0 (0.0%) | 315 (100.0%) |
| 5 to 9 Unit Apartments | 0 (0.0%) | 542 (100.0%) |
| 10 or more Apartments | 0 (0.0%) | 435 (100.0%) |
| Mobile Home / Other | 159 (52.0%) | 147 (48.0%) |
| Total | 4,809 (59.8%) | 3,227 (40.2%) |
Housing Structures by Number of Rooms in Winchester
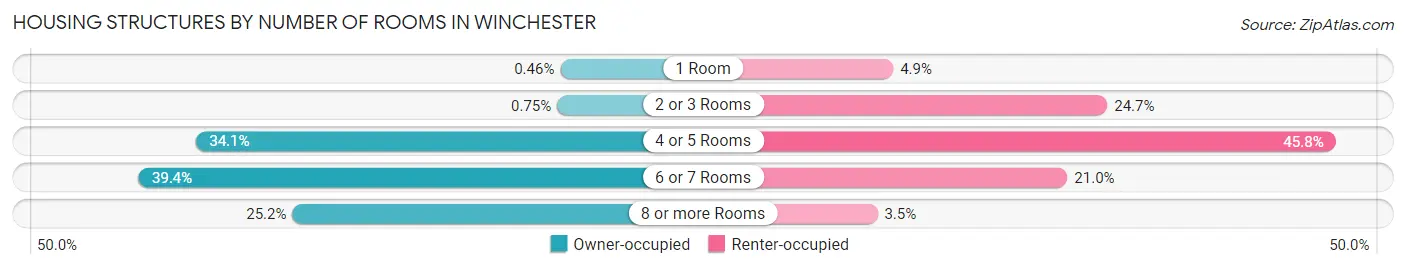
| Number of Rooms | Owner-occupied | Renter-occupied |
| 1 Room | 22 (0.5%) | 159 (4.9%) |
| 2 or 3 Rooms | 36 (0.7%) | 798 (24.7%) |
| 4 or 5 Rooms | 1,641 (34.1%) | 1,479 (45.8%) |
| 6 or 7 Rooms | 1,896 (39.4%) | 679 (21.0%) |
| 8 or more Rooms | 1,214 (25.2%) | 112 (3.5%) |
| Total | 4,809 (100.0%) | 3,227 (100.0%) |
Housing Structure by Heating Type in Winchester
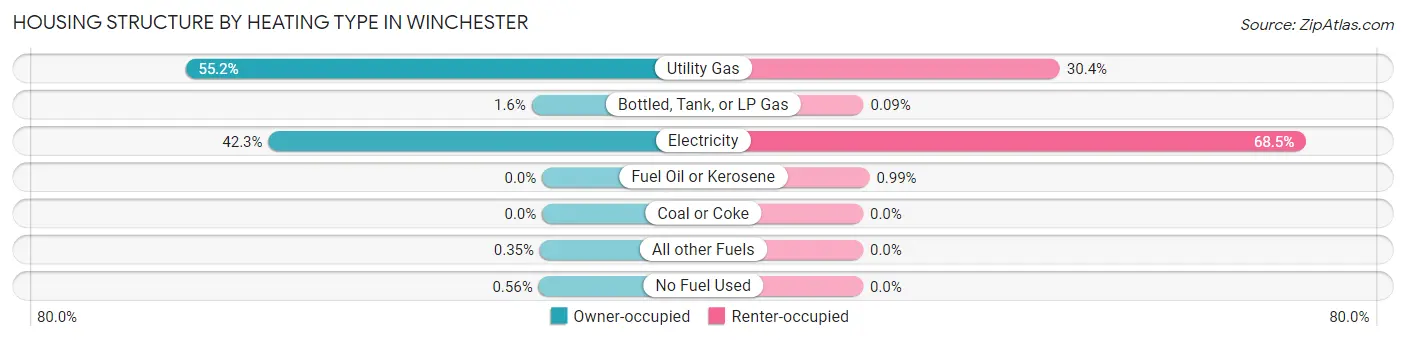
| Heating Type | Owner-occupied | Renter-occupied |
| Utility Gas | 2,652 (55.1%) | 982 (30.4%) |
| Bottled, Tank, or LP Gas | 78 (1.6%) | 3 (0.1%) |
| Electricity | 2,035 (42.3%) | 2,210 (68.5%) |
| Fuel Oil or Kerosene | 0 (0.0%) | 32 (1.0%) |
| Coal or Coke | 0 (0.0%) | 0 (0.0%) |
| All other Fuels | 17 (0.4%) | 0 (0.0%) |
| No Fuel Used | 27 (0.6%) | 0 (0.0%) |
| Total | 4,809 (100.0%) | 3,227 (100.0%) |
Household Vehicle Usage in Winchester
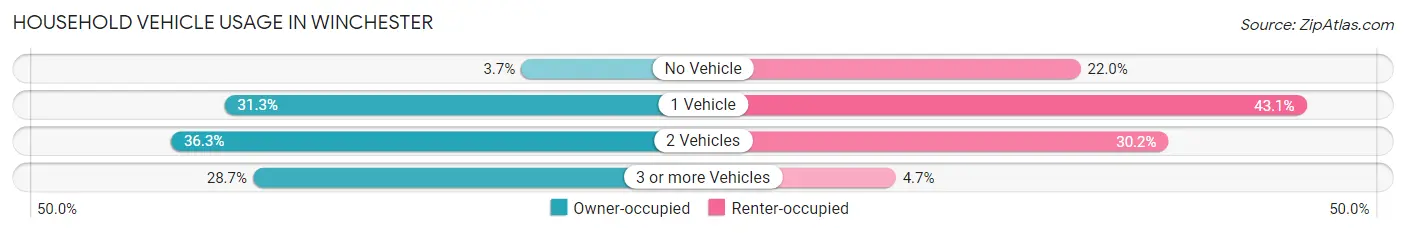
| Vehicles per Household | Owner-occupied | Renter-occupied |
| No Vehicle | 176 (3.7%) | 710 (22.0%) |
| 1 Vehicle | 1,506 (31.3%) | 1,390 (43.1%) |
| 2 Vehicles | 1,747 (36.3%) | 974 (30.2%) |
| 3 or more Vehicles | 1,380 (28.7%) | 153 (4.7%) |
| Total | 4,809 (100.0%) | 3,227 (100.0%) |
Real Estate & Mortgages in Winchester
Real Estate and Mortgage Overview in Winchester
| Characteristic | Without Mortgage | With Mortgage |
| Housing Units | 1,622 | 3,187 |
| Median Property Value | $169,800 | $153,600 |
| Median Household Income | $48,667 | $359 |
| Monthly Housing Costs | $476 | $29 |
| Real Estate Taxes | $1,229 | $69 |
Property Value by Mortgage Status in Winchester
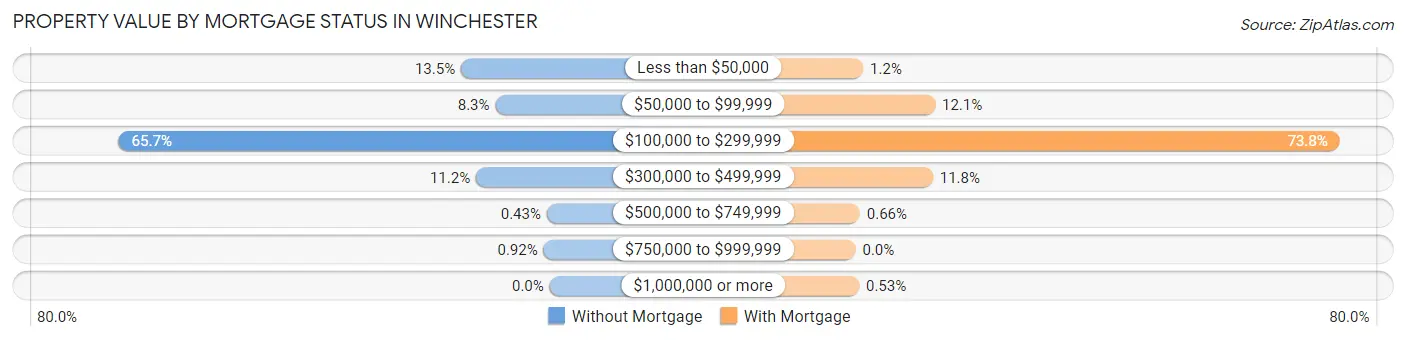
| Property Value | Without Mortgage | With Mortgage |
| Less than $50,000 | 219 (13.5%) | 37 (1.2%) |
| $50,000 to $99,999 | 134 (8.3%) | 386 (12.1%) |
| $100,000 to $299,999 | 1,065 (65.7%) | 2,351 (73.8%) |
| $300,000 to $499,999 | 182 (11.2%) | 375 (11.8%) |
| $500,000 to $749,999 | 7 (0.4%) | 21 (0.7%) |
| $750,000 to $999,999 | 15 (0.9%) | 0 (0.0%) |
| $1,000,000 or more | 0 (0.0%) | 17 (0.5%) |
| Total | 1,622 (100.0%) | 3,187 (100.0%) |
Household Income by Mortgage Status in Winchester
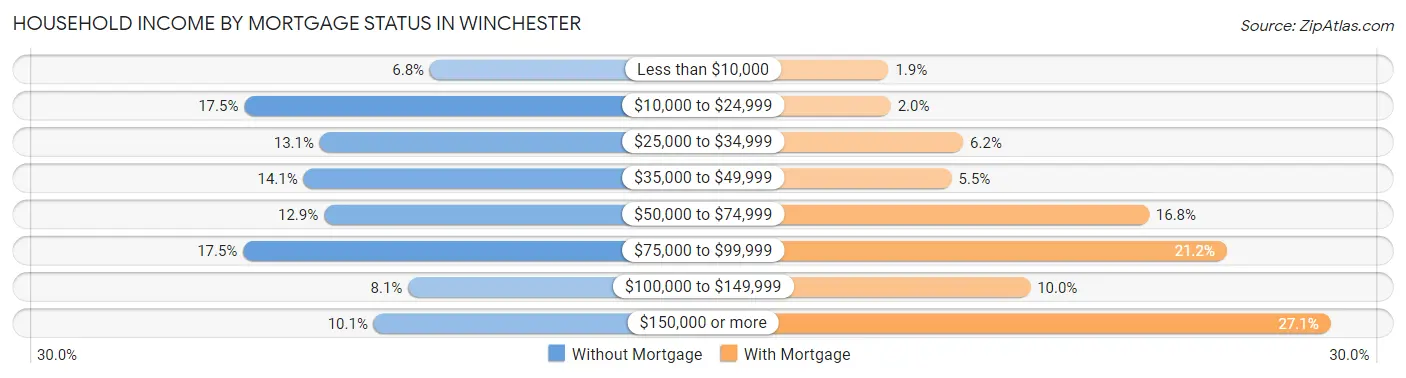
| Household Income | Without Mortgage | With Mortgage |
| Less than $10,000 | 111 (6.8%) | 60 (1.9%) |
| $10,000 to $24,999 | 283 (17.4%) | 64 (2.0%) |
| $25,000 to $34,999 | 213 (13.1%) | 196 (6.1%) |
| $35,000 to $49,999 | 228 (14.1%) | 175 (5.5%) |
| $50,000 to $74,999 | 209 (12.9%) | 534 (16.8%) |
| $75,000 to $99,999 | 284 (17.5%) | 676 (21.2%) |
| $100,000 to $149,999 | 131 (8.1%) | 318 (10.0%) |
| $150,000 or more | 163 (10.1%) | 865 (27.1%) |
| Total | 1,622 (100.0%) | 3,187 (100.0%) |
Property Value to Household Income Ratio in Winchester
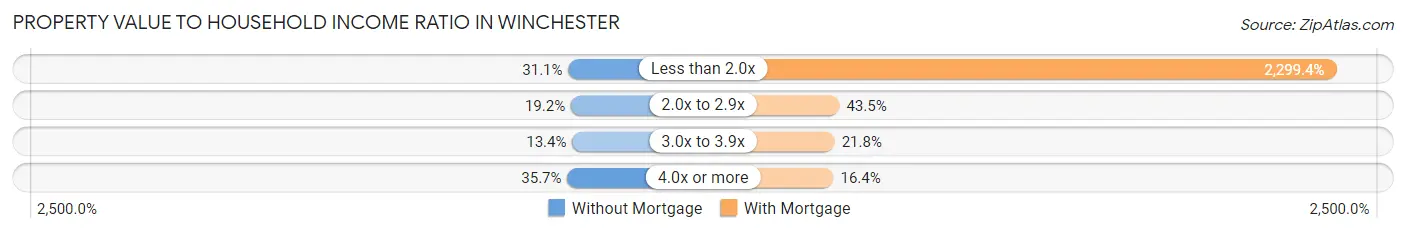
| Value-to-Income Ratio | Without Mortgage | With Mortgage |
| Less than 2.0x | 505 (31.1%) | 73,283 (2,299.4%) |
| 2.0x to 2.9x | 311 (19.2%) | 1,385 (43.5%) |
| 3.0x to 3.9x | 218 (13.4%) | 694 (21.8%) |
| 4.0x or more | 579 (35.7%) | 521 (16.4%) |
| Total | 1,622 (100.0%) | 3,187 (100.0%) |
Real Estate Taxes by Mortgage Status in Winchester
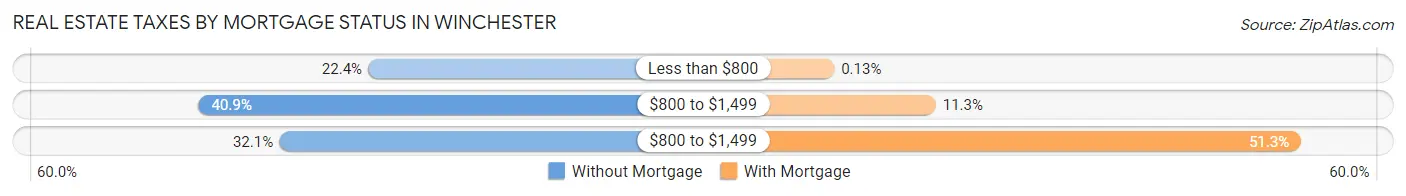
| Property Taxes | Without Mortgage | With Mortgage |
| Less than $800 | 363 (22.4%) | 4 (0.1%) |
| $800 to $1,499 | 664 (40.9%) | 359 (11.3%) |
| $800 to $1,499 | 521 (32.1%) | 1,635 (51.3%) |
| Total | 1,622 (100.0%) | 3,187 (100.0%) |
Health & Disability in Winchester
Health Insurance Coverage by Age in Winchester
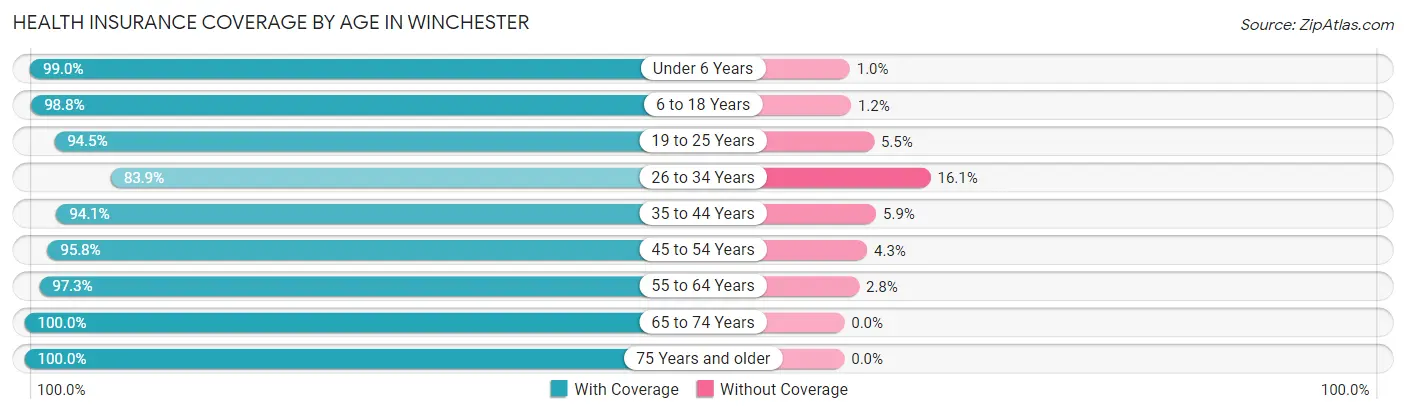
| Age Bracket | With Coverage | Without Coverage |
| Under 6 Years | 1,456 (99.0%) | 15 (1.0%) |
| 6 to 18 Years | 2,951 (98.8%) | 37 (1.2%) |
| 19 to 25 Years | 1,878 (94.5%) | 110 (5.5%) |
| 26 to 34 Years | 2,139 (83.9%) | 410 (16.1%) |
| 35 to 44 Years | 1,760 (94.1%) | 111 (5.9%) |
| 45 to 54 Years | 2,502 (95.8%) | 111 (4.3%) |
| 55 to 64 Years | 2,051 (97.3%) | 58 (2.8%) |
| 65 to 74 Years | 1,777 (100.0%) | 0 (0.0%) |
| 75 Years and older | 1,465 (100.0%) | 0 (0.0%) |
| Total | 17,979 (95.5%) | 852 (4.5%) |
Health Insurance Coverage by Citizenship Status in Winchester
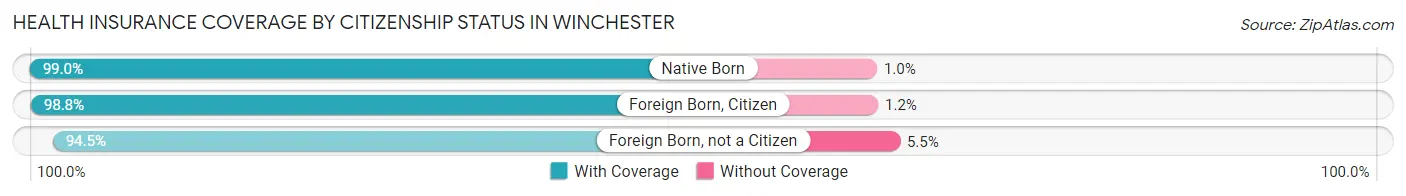
| Citizenship Status | With Coverage | Without Coverage |
| Native Born | 1,456 (99.0%) | 15 (1.0%) |
| Foreign Born, Citizen | 2,951 (98.8%) | 37 (1.2%) |
| Foreign Born, not a Citizen | 1,878 (94.5%) | 110 (5.5%) |
Health Insurance Coverage by Household Income in Winchester
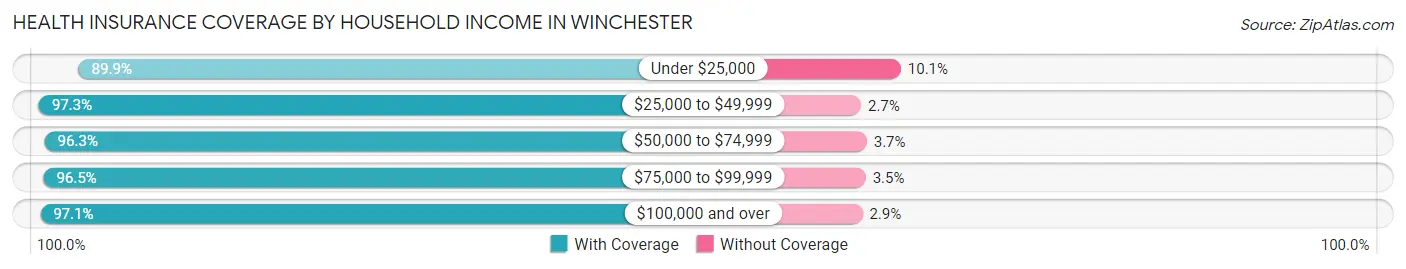
| Household Income | With Coverage | Without Coverage |
| Under $25,000 | 3,194 (89.9%) | 360 (10.1%) |
| $25,000 to $49,999 | 3,935 (97.3%) | 108 (2.7%) |
| $50,000 to $74,999 | 3,266 (96.3%) | 127 (3.7%) |
| $75,000 to $99,999 | 2,640 (96.5%) | 97 (3.5%) |
| $100,000 and over | 4,869 (97.1%) | 147 (2.9%) |
Public vs Private Health Insurance Coverage by Age in Winchester
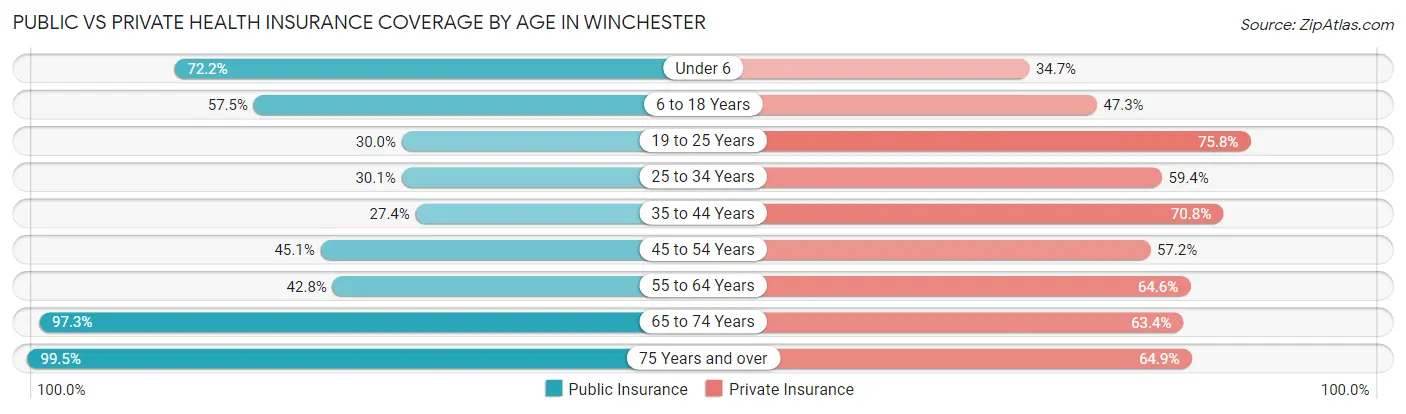
| Age Bracket | Public Insurance | Private Insurance |
| Under 6 | 1,062 (72.2%) | 511 (34.7%) |
| 6 to 18 Years | 1,717 (57.5%) | 1,412 (47.3%) |
| 19 to 25 Years | 596 (30.0%) | 1,507 (75.8%) |
| 25 to 34 Years | 766 (30.0%) | 1,513 (59.4%) |
| 35 to 44 Years | 513 (27.4%) | 1,324 (70.8%) |
| 45 to 54 Years | 1,178 (45.1%) | 1,495 (57.2%) |
| 55 to 64 Years | 903 (42.8%) | 1,363 (64.6%) |
| 65 to 74 Years | 1,729 (97.3%) | 1,126 (63.4%) |
| 75 Years and over | 1,457 (99.5%) | 950 (64.8%) |
| Total | 9,921 (52.7%) | 11,201 (59.5%) |
Disability Status by Sex by Age in Winchester
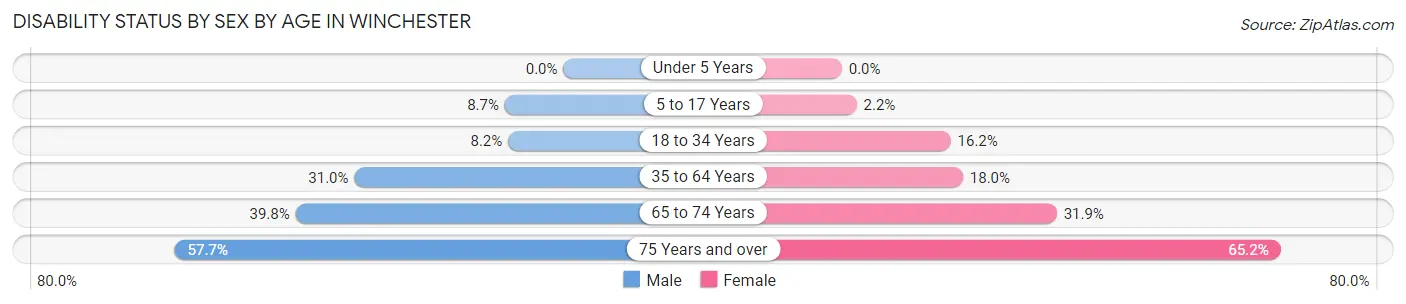
| Age Bracket | Male | Female |
| Under 5 Years | 0 (0.0%) | 0 (0.0%) |
| 5 to 17 Years | 110 (8.7%) | 40 (2.2%) |
| 18 to 34 Years | 206 (8.2%) | 367 (16.2%) |
| 35 to 64 Years | 929 (31.0%) | 647 (18.0%) |
| 65 to 74 Years | 278 (39.8%) | 344 (31.9%) |
| 75 Years and over | 299 (57.7%) | 617 (65.1%) |
Disability Class by Sex by Age in Winchester
Disability Class: Hearing Difficulty
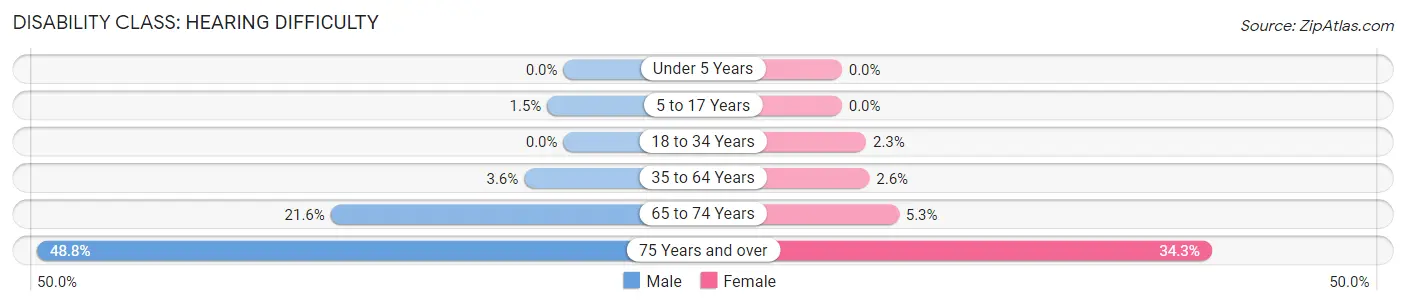
| Age Bracket | Male | Female |
| Under 5 Years | 0 (0.0%) | 0 (0.0%) |
| 5 to 17 Years | 19 (1.5%) | 0 (0.0%) |
| 18 to 34 Years | 0 (0.0%) | 51 (2.2%) |
| 35 to 64 Years | 109 (3.6%) | 92 (2.6%) |
| 65 to 74 Years | 151 (21.6%) | 57 (5.3%) |
| 75 Years and over | 253 (48.8%) | 325 (34.3%) |
Disability Class: Vision Difficulty
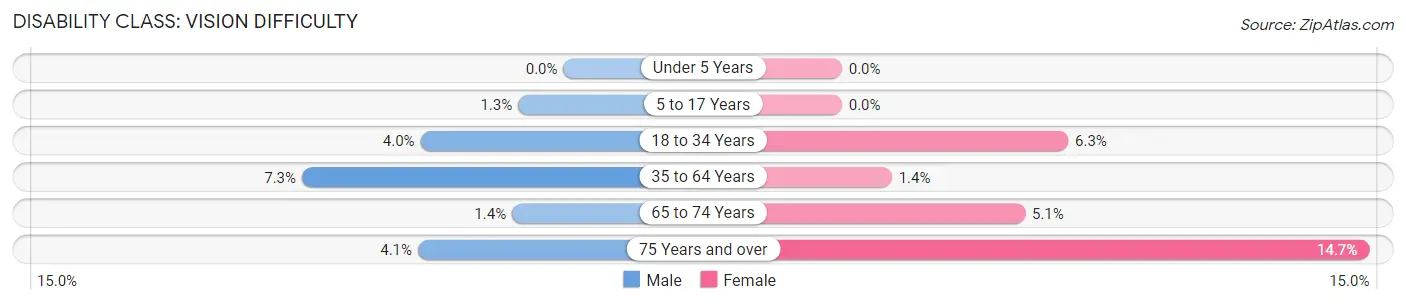
| Age Bracket | Male | Female |
| Under 5 Years | 0 (0.0%) | 0 (0.0%) |
| 5 to 17 Years | 16 (1.3%) | 0 (0.0%) |
| 18 to 34 Years | 100 (4.0%) | 143 (6.3%) |
| 35 to 64 Years | 218 (7.3%) | 50 (1.4%) |
| 65 to 74 Years | 10 (1.4%) | 55 (5.1%) |
| 75 Years and over | 21 (4.1%) | 139 (14.7%) |
Disability Class: Cognitive Difficulty
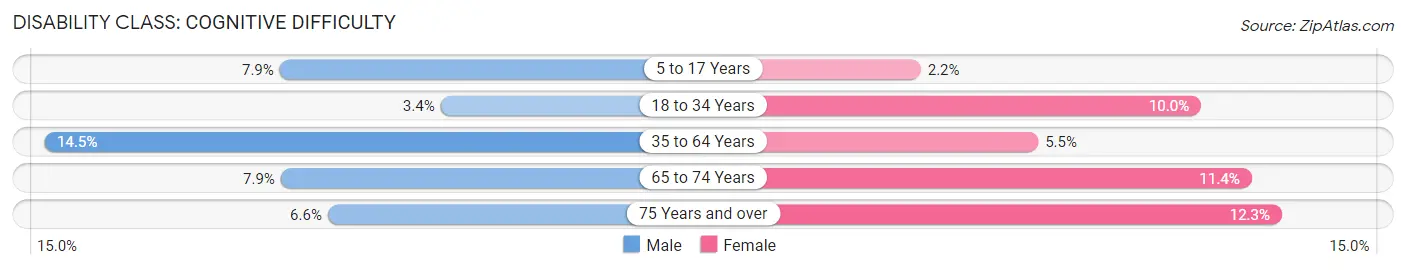
| Age Bracket | Male | Female |
| 5 to 17 Years | 100 (7.9%) | 40 (2.2%) |
| 18 to 34 Years | 86 (3.4%) | 227 (10.0%) |
| 35 to 64 Years | 433 (14.5%) | 197 (5.5%) |
| 65 to 74 Years | 55 (7.9%) | 123 (11.4%) |
| 75 Years and over | 34 (6.6%) | 116 (12.2%) |
Disability Class: Ambulatory Difficulty
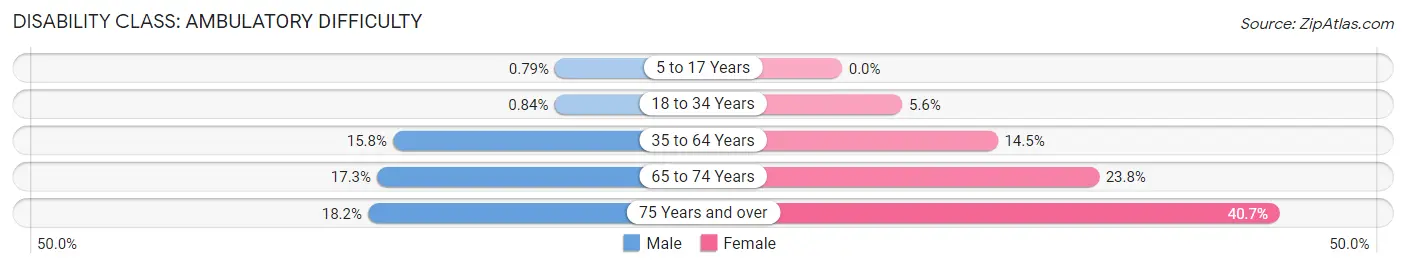
| Age Bracket | Male | Female |
| 5 to 17 Years | 10 (0.8%) | 0 (0.0%) |
| 18 to 34 Years | 21 (0.8%) | 127 (5.6%) |
| 35 to 64 Years | 474 (15.8%) | 520 (14.4%) |
| 65 to 74 Years | 121 (17.3%) | 257 (23.8%) |
| 75 Years and over | 94 (18.1%) | 385 (40.6%) |
Disability Class: Self-Care Difficulty
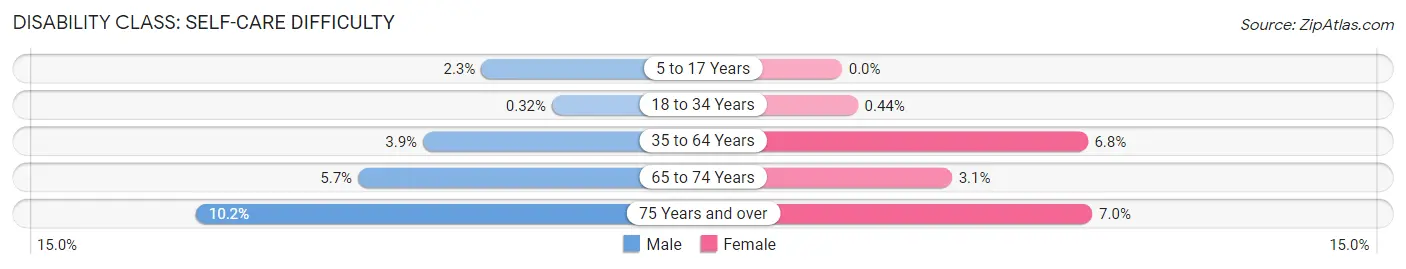
| Age Bracket | Male | Female |
| 5 to 17 Years | 29 (2.3%) | 0 (0.0%) |
| 18 to 34 Years | 8 (0.3%) | 10 (0.4%) |
| 35 to 64 Years | 117 (3.9%) | 246 (6.8%) |
| 65 to 74 Years | 40 (5.7%) | 33 (3.1%) |
| 75 Years and over | 53 (10.2%) | 66 (7.0%) |
Technology Access in Winchester
Computing Device Access in Winchester
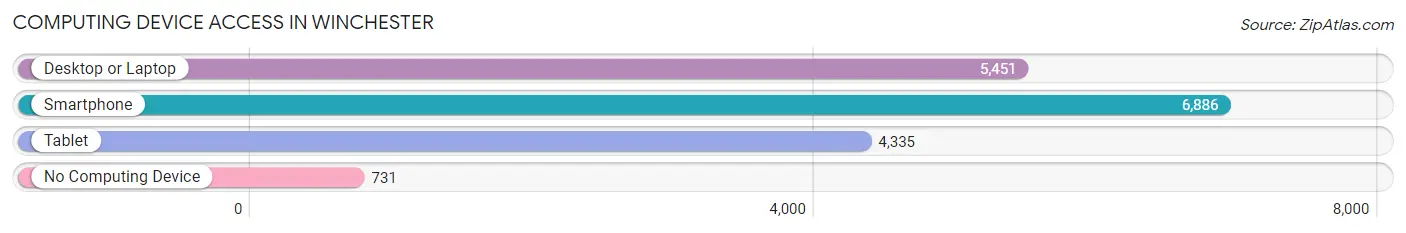
| Device Type | # Households | % Households |
| Desktop or Laptop | 5,451 | 67.8% |
| Smartphone | 6,886 | 85.7% |
| Tablet | 4,335 | 53.9% |
| No Computing Device | 731 | 9.1% |
| Total | 8,036 | 100.0% |
Internet Access in Winchester
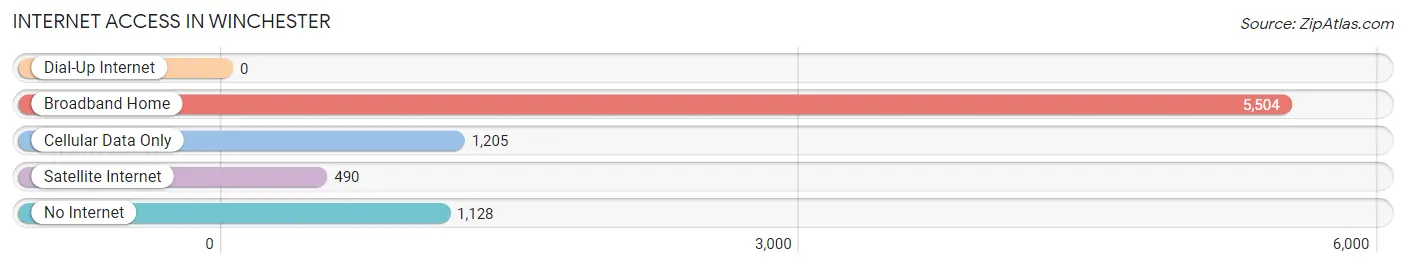
| Internet Type | # Households | % Households |
| Dial-Up Internet | 0 | 0.0% |
| Broadband Home | 5,504 | 68.5% |
| Cellular Data Only | 1,205 | 15.0% |
| Satellite Internet | 490 | 6.1% |
| No Internet | 1,128 | 14.0% |
| Total | 8,036 | 100.0% |
Winchester Summary
Winchester, Kentucky is a city located in Clark County, Kentucky, United States. It is the county seat of Clark County and is located in the Bluegrass region of the state. The population was 18,368 at the 2010 census. Winchester is part of the Lexington-Fayette Metropolitan Statistical Area.
History
Winchester was founded in 1793 by Colonel James Winchester, a Revolutionary War veteran and surveyor. The city was named after Winchester, Virginia, where Colonel Winchester had previously lived. The city was incorporated in 1818 and became the county seat of Clark County in 1825.
Winchester was an important stop on the Lexington and Eastern Railroad, which connected Lexington to the coal fields of eastern Kentucky. The railroad was completed in 1875 and helped to spur the growth of the city.
Geography
Winchester is located in central Kentucky at the junction of Interstate 64 and US Route 60. It is situated in the Bluegrass region of the state, approximately 25 miles east of Lexington. The city has a total area of 8.3 square miles, all of which is land.
Climate
Winchester has a humid subtropical climate, with hot, humid summers and mild winters. The average annual temperature is 57°F, with an average high of 79°F in July and an average low of 34°F in January. The average annual precipitation is 45 inches.
Demographics
As of the 2010 census, there were 18,368 people, 7,541 households, and 4,845 families residing in the city. The population density was 2,213.3 people per square mile. The racial makeup of the city was 90.2% White, 6.2% African American, 0.3% Native American, 0.7% Asian, 0.1% Pacific Islander, 1.2% from other races, and 1.3% from two or more races. Hispanic or Latino of any race were 2.7% of the population.
Economy
Winchester is home to several major employers, including Clark Regional Medical Center, Clark County Public Schools, and the Winchester-Clark County Industrial Park. The city is also home to several small businesses, including restaurants, retail stores, and professional services.
The city is served by the Winchester-Clark County Industrial Park, which is home to several major employers, including Amazon, Walmart, and the Winchester-Clark County Airport. The airport is a major hub for air cargo and passenger traffic in the region.
The city is also home to several educational institutions, including the University of Kentucky, Eastern Kentucky University, and Bluegrass Community and Technical College.
Conclusion
Winchester, Kentucky is a city located in Clark County, Kentucky, United States. It is the county seat of Clark County and is located in the Bluegrass region of the state. The city was founded in 1793 by Colonel James Winchester and was incorporated in 1818. Winchester is home to several major employers, including Clark Regional Medical Center, Clark County Public Schools, and the Winchester-Clark County Industrial Park. The city is also home to several educational institutions, including the University of Kentucky, Eastern Kentucky University, and Bluegrass Community and Technical College. Winchester has a humid subtropical climate, with hot, humid summers and mild winters. The population was 18,368 at the 2010 census.
Common Questions
What is Per Capita Income in Winchester?
Per Capita income in Winchester is $31,185.
What is the Median Family Income in Winchester?
Median Family Income in Winchester is $67,500.
What is the Median Household income in Winchester?
Median Household Income in Winchester is $50,982.
What is Income or Wage Gap in Winchester?
Income or Wage Gap in Winchester is 34.6%.
Women in Winchester earn 65.4 cents for every dollar earned by a man.
What is Inequality or Gini Index in Winchester?
Inequality or Gini Index in Winchester is 0.48.
What is the Total Population of Winchester?
Total Population of Winchester is 19,080.
What is the Total Male Population of Winchester?
Total Male Population of Winchester is 8,902.
What is the Total Female Population of Winchester?
Total Female Population of Winchester is 10,178.
What is the Ratio of Males per 100 Females in Winchester?
There are 87.46 Males per 100 Females in Winchester.
What is the Ratio of Females per 100 Males in Winchester?
There are 114.33 Females per 100 Males in Winchester.
What is the Median Population Age in Winchester?
Median Population Age in Winchester is 37.6 Years.
What is the Average Family Size in Winchester
Average Family Size in Winchester is 3.0 People.
What is the Average Household Size in Winchester
Average Household Size in Winchester is 2.3 People.
How Large is the Labor Force in Winchester?
There are 9,120 People in the Labor Forcein in Winchester.
What is the Percentage of People in the Labor Force in Winchester?
59.1% of People are in the Labor Force in Winchester.
What is the Unemployment Rate in Winchester?
Unemployment Rate in Winchester is 5.6%.