Russellville, KY Map & Demographics
Russellville Map
Russellville Overview
$22,996
PER CAPITA INCOME
$57,363
AVG FAMILY INCOME
$45,484
AVG HOUSEHOLD INCOME
32.9%
WAGE / INCOME GAP [ % ]
67.1¢/ $1
WAGE / INCOME GAP [ $ ]
0.43
INEQUALITY / GINI INDEX
7,186
TOTAL POPULATION
3,104
MALE POPULATION
4,082
FEMALE POPULATION
76.04
MALES / 100 FEMALES
131.51
FEMALES / 100 MALES
35.9
MEDIAN AGE
2.9
AVG FAMILY SIZE
2.3
AVG HOUSEHOLD SIZE
3,052
LABOR FORCE [ PEOPLE ]
56.4%
PERCENT IN LABOR FORCE
9.2%
UNEMPLOYMENT RATE
Russellville Zip Codes
Russellville Area Codes
Income in Russellville
Income Overview in Russellville
Per Capita Income in Russellville is $22,996, while median incomes of families and households are $57,363 and $45,484 respectively.
| Characteristic | Number | Measure |
| Per Capita Income | 7,186 | $22,996 |
| Median Family Income | 1,945 | $57,363 |
| Mean Family Income | 1,945 | $62,790 |
| Median Household Income | 3,003 | $45,484 |
| Mean Household Income | 3,003 | $55,751 |
| Income Deficit | 1,945 | $0 |
| Wage / Income Gap (%) | 7,186 | 32.93% |
| Wage / Income Gap ($) | 7,186 | 67.07¢ per $1 |
| Gini / Inequality Index | 7,186 | 0.43 |
Earnings by Sex in Russellville
Average Earnings in Russellville are $31,141, $37,886 for men and $25,412 for women, a difference of 32.9%.
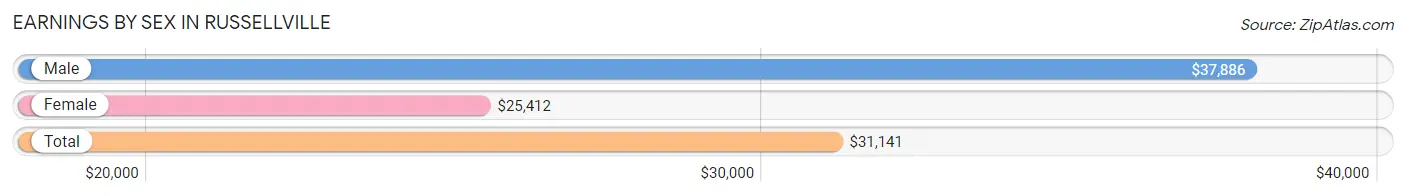
| Sex | Number | Average Earnings |
| Male | 1,593 (50.7%) | $37,886 |
| Female | 1,550 (49.3%) | $25,412 |
| Total | 3,143 (100.0%) | $31,141 |
Earnings by Sex by Income Bracket in Russellville
The most common earnings brackets in Russellville are $30,000 to $34,999 for men (237 | 14.9%) and $30,000 to $34,999 for women (184 | 11.9%).
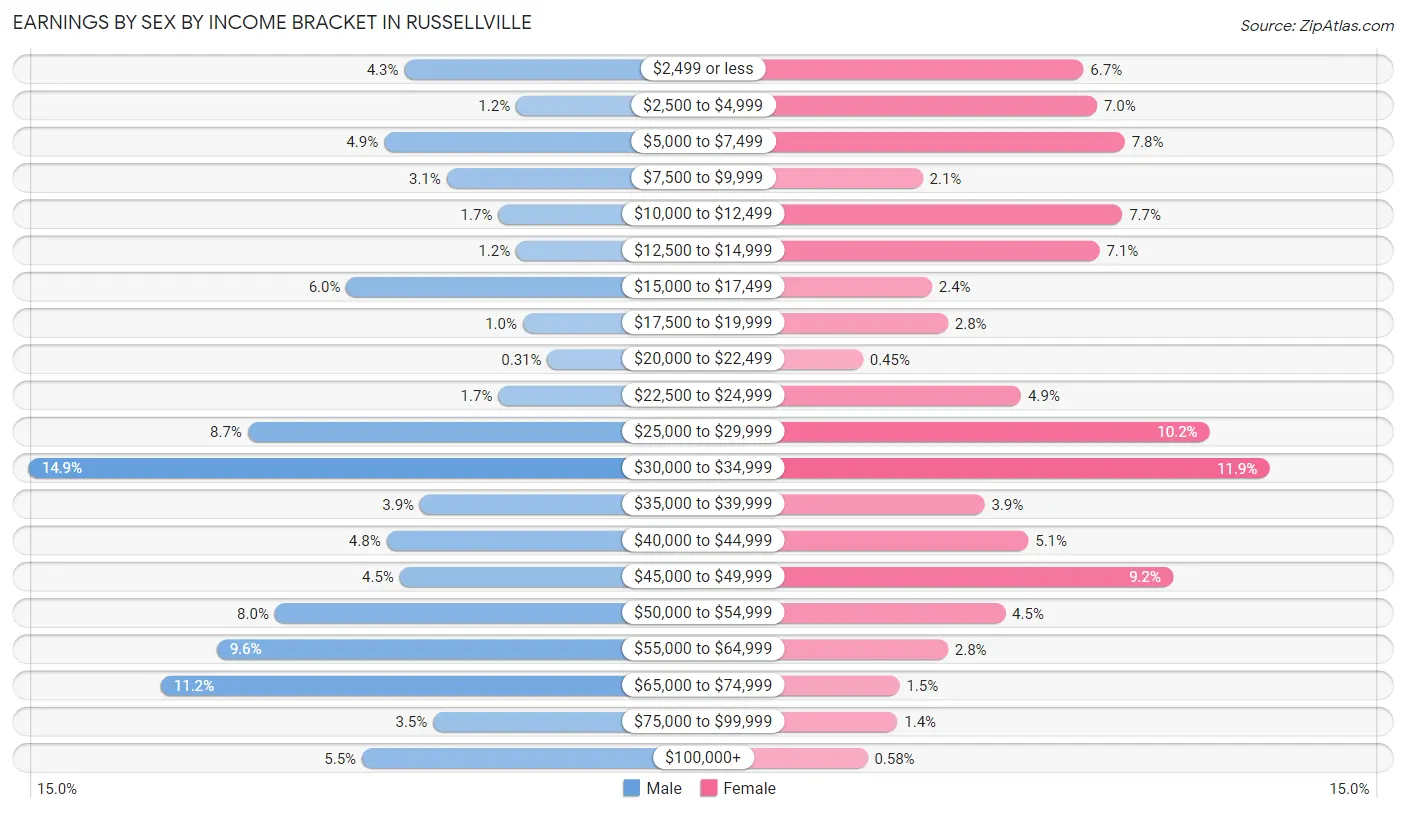
| Income | Male | Female |
| $2,499 or less | 69 (4.3%) | 103 (6.7%) |
| $2,500 to $4,999 | 19 (1.2%) | 109 (7.0%) |
| $5,000 to $7,499 | 78 (4.9%) | 121 (7.8%) |
| $7,500 to $9,999 | 50 (3.1%) | 33 (2.1%) |
| $10,000 to $12,499 | 27 (1.7%) | 120 (7.7%) |
| $12,500 to $14,999 | 19 (1.2%) | 110 (7.1%) |
| $15,000 to $17,499 | 95 (6.0%) | 37 (2.4%) |
| $17,500 to $19,999 | 16 (1.0%) | 44 (2.8%) |
| $20,000 to $22,499 | 5 (0.3%) | 7 (0.4%) |
| $22,500 to $24,999 | 27 (1.7%) | 76 (4.9%) |
| $25,000 to $29,999 | 139 (8.7%) | 158 (10.2%) |
| $30,000 to $34,999 | 237 (14.9%) | 184 (11.9%) |
| $35,000 to $39,999 | 62 (3.9%) | 60 (3.9%) |
| $40,000 to $44,999 | 77 (4.8%) | 79 (5.1%) |
| $45,000 to $49,999 | 71 (4.5%) | 142 (9.2%) |
| $50,000 to $54,999 | 127 (8.0%) | 69 (4.4%) |
| $55,000 to $64,999 | 153 (9.6%) | 44 (2.8%) |
| $65,000 to $74,999 | 178 (11.2%) | 23 (1.5%) |
| $75,000 to $99,999 | 56 (3.5%) | 22 (1.4%) |
| $100,000+ | 88 (5.5%) | 9 (0.6%) |
| Total | 1,593 (100.0%) | 1,550 (100.0%) |
Earnings by Sex by Educational Attainment in Russellville
Average earnings in Russellville are $44,505 for men and $25,934 for women, a difference of 41.7%. Men with an educational attainment of graduate degree enjoy the highest average annual earnings of $72,583, while those with high school diploma education earn the least with $31,420. Women with an educational attainment of bachelor's degree earn the most with the average annual earnings of $39,554, while those with less than high school education have the smallest earnings of $3,750.
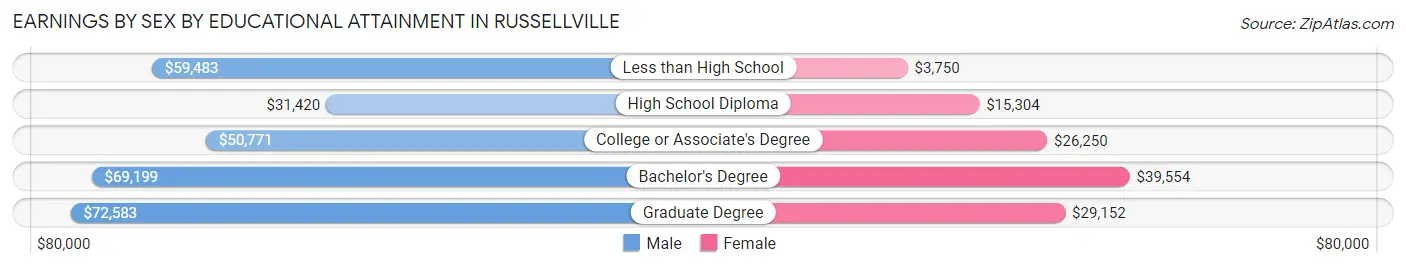
| Educational Attainment | Male Income | Female Income |
| Less than High School | $59,483 | $3,750 |
| High School Diploma | $31,420 | $15,304 |
| College or Associate's Degree | $50,771 | $26,250 |
| Bachelor's Degree | $69,199 | $39,554 |
| Graduate Degree | $72,583 | $29,152 |
| Total | $44,505 | $25,934 |
Family Income in Russellville
Family Income Brackets in Russellville
According to the Russellville family income data, there are 438 families falling into the $75,000 to $99,999 income range, which is the most common income bracket and makes up 22.5% of all families. Conversely, the $200,000+ income bracket is the least frequent group with only 12 families (0.6%) belonging to this category.
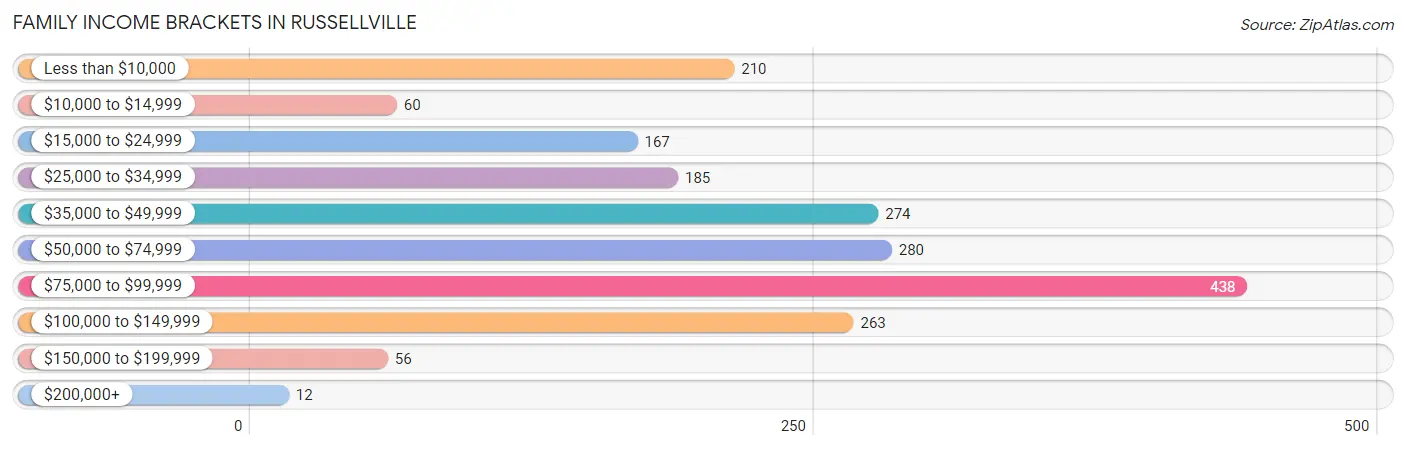
| Income Bracket | # Families | % Families |
| Less than $10,000 | 210 | 10.8% |
| $10,000 to $14,999 | 60 | 3.1% |
| $15,000 to $24,999 | 167 | 8.6% |
| $25,000 to $34,999 | 185 | 9.5% |
| $35,000 to $49,999 | 274 | 14.1% |
| $50,000 to $74,999 | 280 | 14.4% |
| $75,000 to $99,999 | 438 | 22.5% |
| $100,000 to $149,999 | 263 | 13.5% |
| $150,000 to $199,999 | 56 | 2.9% |
| $200,000+ | 12 | 0.6% |
Family Income by Famaliy Size in Russellville
4-person families (539 | 27.7%) account for the highest median family income in Russellville with $95,285 per family, while 2-person families (985 | 50.6%) have the highest median income of $26,384 per family member.
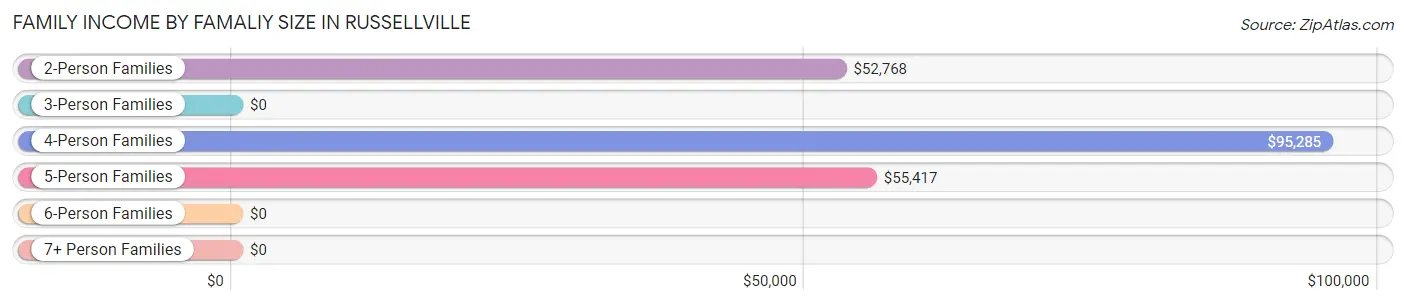
| Income Bracket | # Families | Median Income |
| 2-Person Families | 985 (50.6%) | $52,768 |
| 3-Person Families | 293 (15.1%) | $0 |
| 4-Person Families | 539 (27.7%) | $95,285 |
| 5-Person Families | 84 (4.3%) | $55,417 |
| 6-Person Families | 30 (1.5%) | $0 |
| 7+ Person Families | 14 (0.7%) | $0 |
| Total | 1,945 (100.0%) | $57,363 |
Family Income by Number of Earners in Russellville
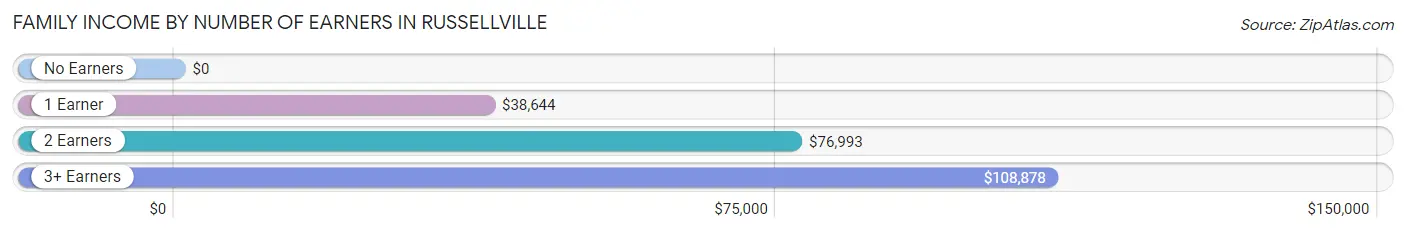
| Number of Earners | # Families | Median Income |
| No Earners | 463 (23.8%) | $0 |
| 1 Earner | 527 (27.1%) | $38,644 |
| 2 Earners | 854 (43.9%) | $76,993 |
| 3+ Earners | 101 (5.2%) | $108,878 |
| Total | 1,945 (100.0%) | $57,363 |
Household Income in Russellville
Household Income Brackets in Russellville
With 489 households falling in the category, the $50,000 to $74,999 income range is the most frequent in Russellville, accounting for 16.3% of all households. In contrast, only 45 households (1.5%) fall into the $200,000+ income bracket, making it the least populous group.
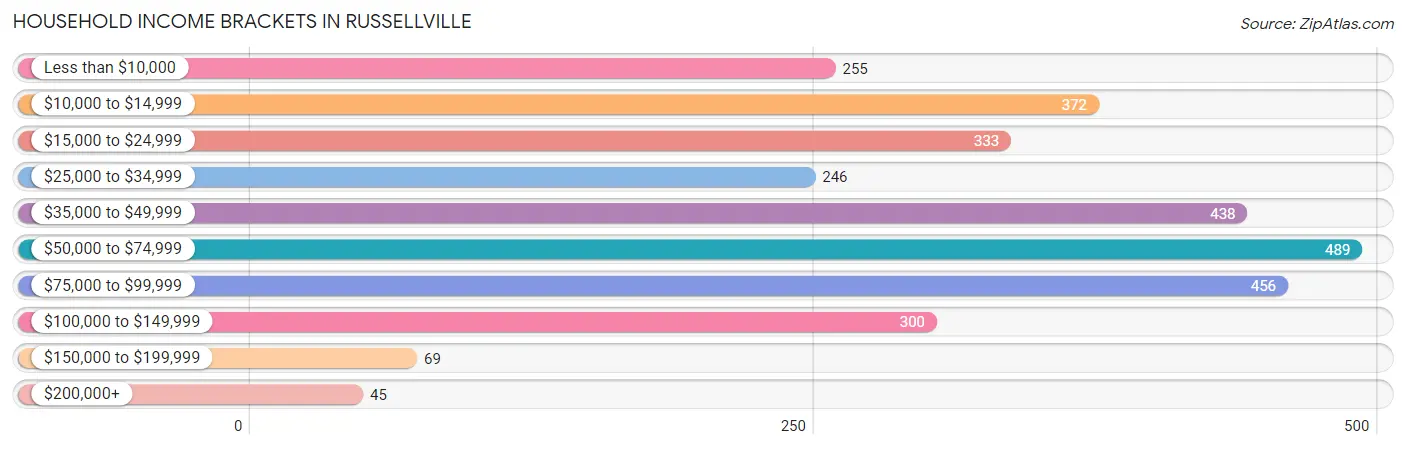
| Income Bracket | # Households | % Households |
| Less than $10,000 | 255 | 8.5% |
| $10,000 to $14,999 | 372 | 12.4% |
| $15,000 to $24,999 | 333 | 11.1% |
| $25,000 to $34,999 | 246 | 8.2% |
| $35,000 to $49,999 | 438 | 14.6% |
| $50,000 to $74,999 | 489 | 16.3% |
| $75,000 to $99,999 | 456 | 15.2% |
| $100,000 to $149,999 | 300 | 10.0% |
| $150,000 to $199,999 | 69 | 2.3% |
| $200,000+ | 45 | 1.5% |
Household Income by Householder Age in Russellville
The median household income in Russellville is $45,484, with the highest median household income of $49,105 found in the 25 to 44 years age bracket for the primary householder. A total of 1,015 households (33.8%) fall into this category. Meanwhile, the 15 to 24 years age bracket for the primary householder has the lowest median household income of $0, with 98 households (3.3%) in this group.
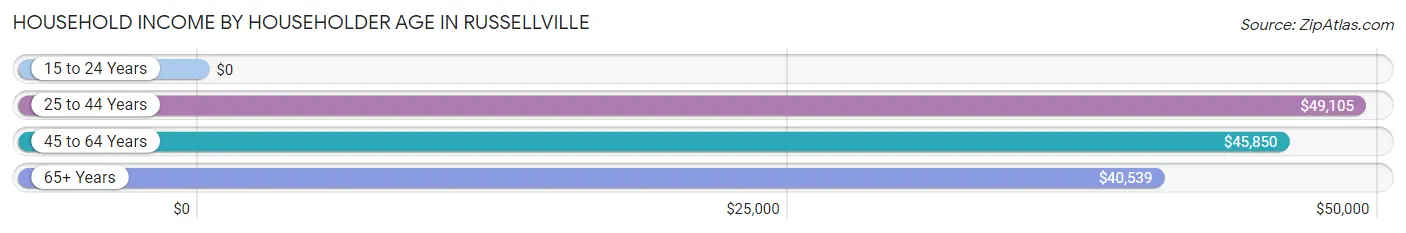
| Income Bracket | # Households | Median Income |
| 15 to 24 Years | 98 (3.3%) | $0 |
| 25 to 44 Years | 1,015 (33.8%) | $49,105 |
| 45 to 64 Years | 876 (29.2%) | $45,850 |
| 65+ Years | 1,014 (33.8%) | $40,539 |
| Total | 3,003 (100.0%) | $45,484 |
Poverty in Russellville
Income Below Poverty by Sex and Age in Russellville
With 14.3% poverty level for males and 23.1% for females among the residents of Russellville, 12 to 14 year old males and 55 to 64 year old females are the most vulnerable to poverty, with 112 males (80.0%) and 171 females (37.2%) in their respective age groups living below the poverty level.
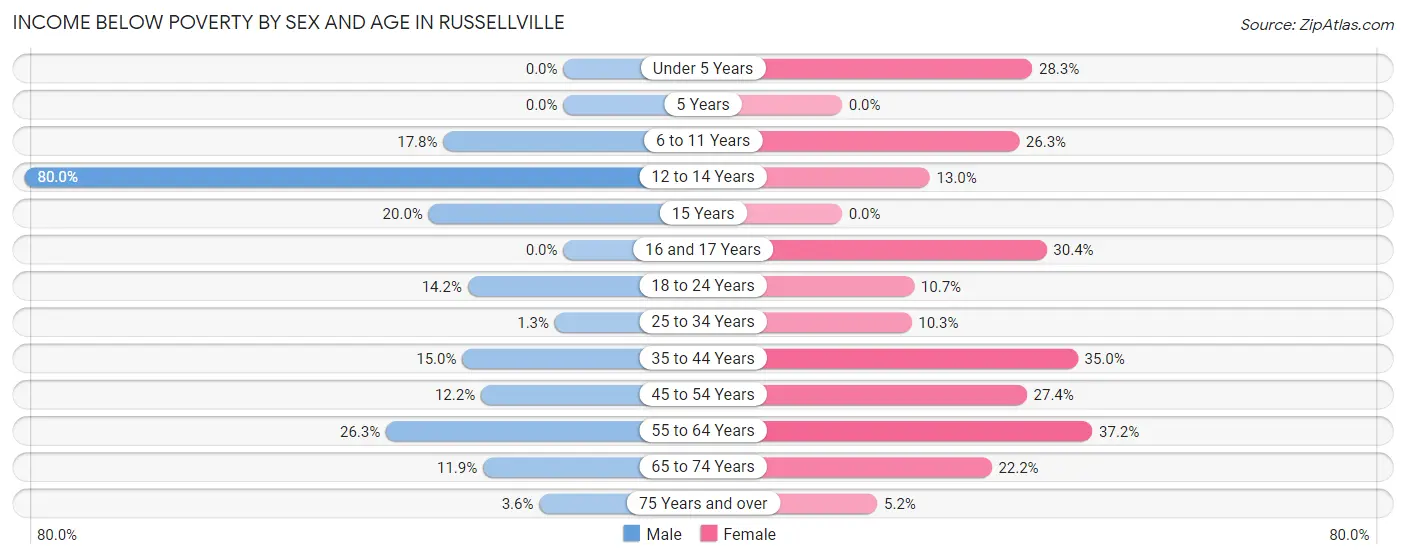
| Age Bracket | Male | Female |
| Under 5 Years | 0 (0.0%) | 63 (28.2%) |
| 5 Years | 0 (0.0%) | 0 (0.0%) |
| 6 to 11 Years | 56 (17.8%) | 157 (26.3%) |
| 12 to 14 Years | 112 (80.0%) | 24 (13.0%) |
| 15 Years | 8 (20.0%) | 0 (0.0%) |
| 16 and 17 Years | 0 (0.0%) | 24 (30.4%) |
| 18 to 24 Years | 23 (14.2%) | 21 (10.7%) |
| 25 to 34 Years | 5 (1.3%) | 55 (10.3%) |
| 35 to 44 Years | 56 (15.0%) | 167 (35.0%) |
| 45 to 54 Years | 40 (12.2%) | 90 (27.4%) |
| 55 to 64 Years | 79 (26.3%) | 171 (37.2%) |
| 65 to 74 Years | 31 (11.9%) | 132 (22.2%) |
| 75 Years and over | 11 (3.6%) | 13 (5.2%) |
| Total | 421 (14.3%) | 917 (23.1%) |
Income Above Poverty by Sex and Age in Russellville
According to the poverty statistics in Russellville, males aged under 5 years and females aged 15 years are the age groups that are most secure financially, with 100.0% of males and 100.0% of females in these age groups living above the poverty line.
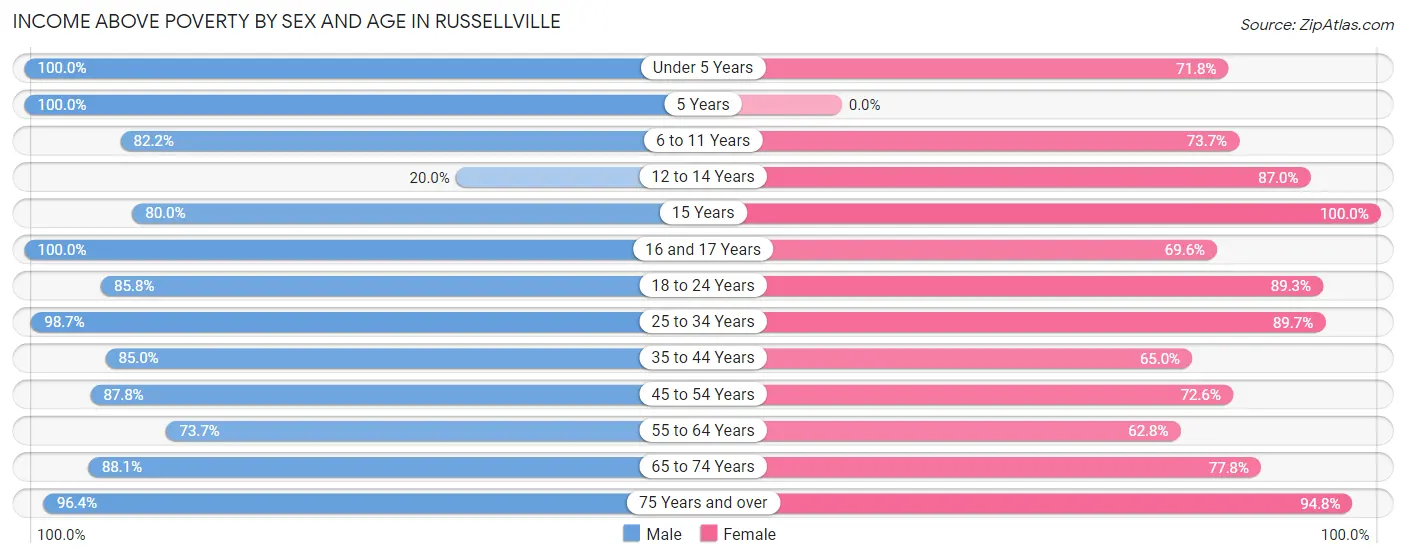
| Age Bracket | Male | Female |
| Under 5 Years | 206 (100.0%) | 160 (71.8%) |
| 5 Years | 18 (100.0%) | 0 (0.0%) |
| 6 to 11 Years | 258 (82.2%) | 440 (73.7%) |
| 12 to 14 Years | 28 (20.0%) | 160 (87.0%) |
| 15 Years | 32 (80.0%) | 53 (100.0%) |
| 16 and 17 Years | 101 (100.0%) | 55 (69.6%) |
| 18 to 24 Years | 139 (85.8%) | 175 (89.3%) |
| 25 to 34 Years | 392 (98.7%) | 478 (89.7%) |
| 35 to 44 Years | 317 (85.0%) | 310 (65.0%) |
| 45 to 54 Years | 287 (87.8%) | 238 (72.6%) |
| 55 to 64 Years | 221 (73.7%) | 289 (62.8%) |
| 65 to 74 Years | 229 (88.1%) | 462 (77.8%) |
| 75 Years and over | 297 (96.4%) | 235 (94.8%) |
| Total | 2,525 (85.7%) | 3,055 (76.9%) |
Income Below Poverty Among Married-Couple Families in Russellville
The poverty statistics for married-couple families in Russellville show that 4.2% or 57 of the total 1,347 families live below the poverty line. Families with no children have the highest poverty rate of 5.9%, comprising of 39 families. On the other hand, families with 3 or 4 children have the lowest poverty rate of 0.0%, which includes 0 families.
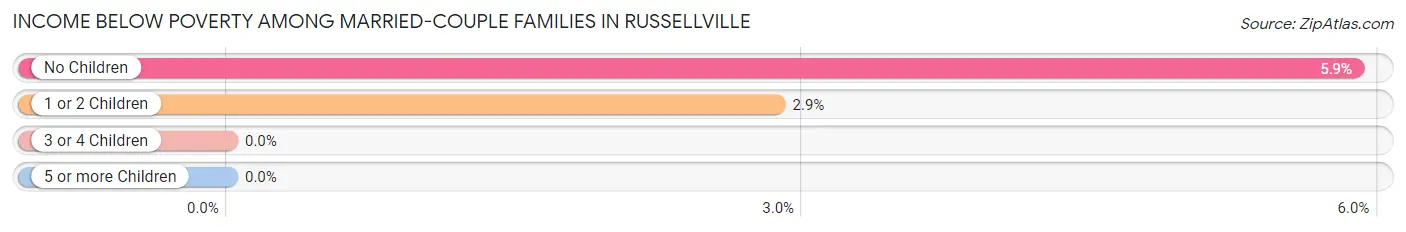
| Children | Above Poverty | Below Poverty |
| No Children | 624 (94.1%) | 39 (5.9%) |
| 1 or 2 Children | 612 (97.1%) | 18 (2.9%) |
| 3 or 4 Children | 54 (100.0%) | 0 (0.0%) |
| 5 or more Children | 0 (0.0%) | 0 (0.0%) |
| Total | 1,290 (95.8%) | 57 (4.2%) |
Income Below Poverty Among Single-Parent Households in Russellville
According to the poverty data in Russellville, 16.7% or 21 single-father households and 43.6% or 206 single-mother households are living below the poverty line. Among single-father households, those with no children have the highest poverty rate, with 13 households (25.0%) experiencing poverty. Likewise, among single-mother households, those with 3 or 4 children have the highest poverty rate, with 48 households (90.6%) falling below the poverty line.
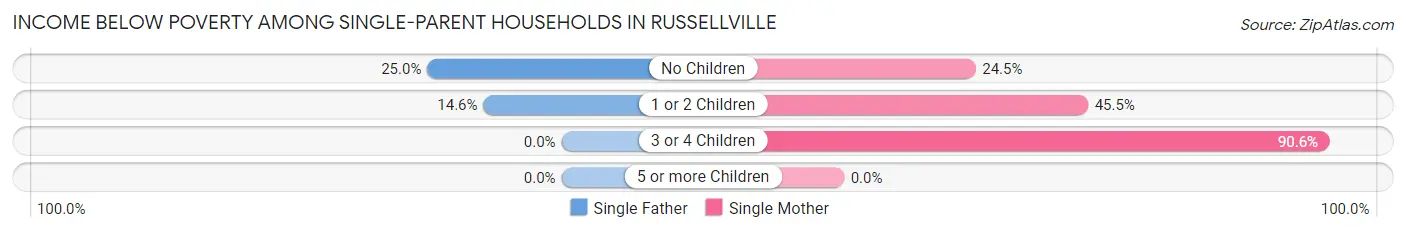
| Children | Single Father | Single Mother |
| No Children | 13 (25.0%) | 38 (24.5%) |
| 1 or 2 Children | 8 (14.5%) | 120 (45.5%) |
| 3 or 4 Children | 0 (0.0%) | 48 (90.6%) |
| 5 or more Children | 0 (0.0%) | 0 (0.0%) |
| Total | 21 (16.7%) | 206 (43.6%) |
Income Below Poverty Among Married-Couple vs Single-Parent Households in Russellville
The poverty data for Russellville shows that 57 of the married-couple family households (4.2%) and 227 of the single-parent households (38.0%) are living below the poverty level. Within the married-couple family households, those with no children have the highest poverty rate, with 39 households (5.9%) falling below the poverty line. Among the single-parent households, those with 3 or 4 children have the highest poverty rate, with 48 household (66.7%) living below poverty.
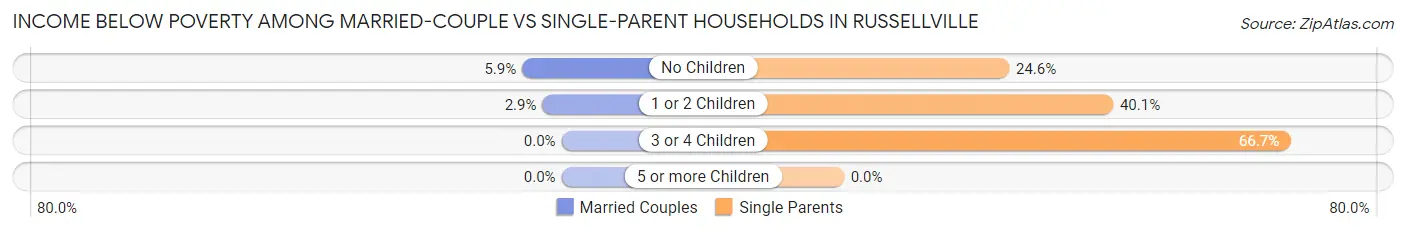
| Children | Married-Couple Families | Single-Parent Households |
| No Children | 39 (5.9%) | 51 (24.6%) |
| 1 or 2 Children | 18 (2.9%) | 128 (40.1%) |
| 3 or 4 Children | 0 (0.0%) | 48 (66.7%) |
| 5 or more Children | 0 (0.0%) | 0 (0.0%) |
| Total | 57 (4.2%) | 227 (38.0%) |
Race in Russellville
The most populous races in Russellville are White / Caucasian (5,808 | 80.8%), Black / African American (1,004 | 14.0%), and Hispanic or Latino (299 | 4.2%).
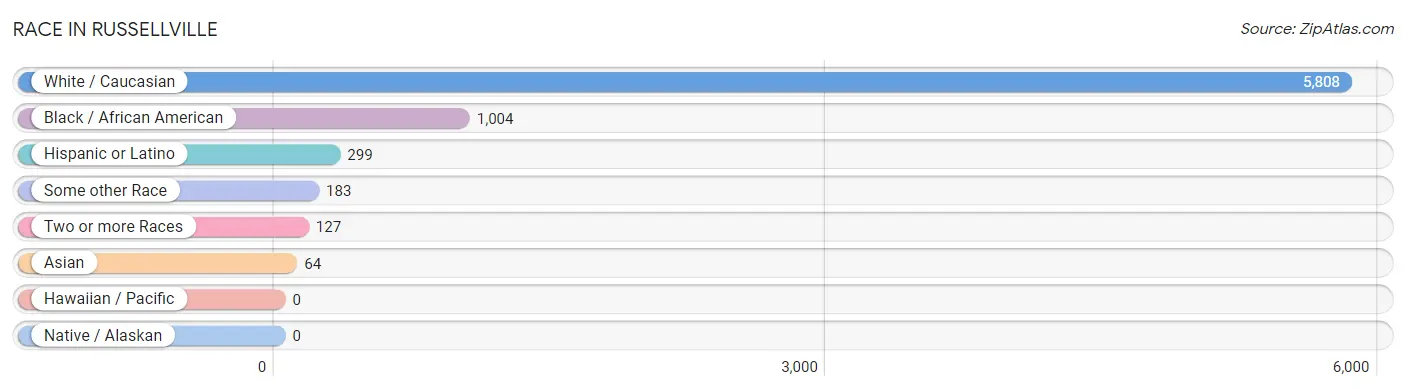
| Race | # Population | % Population |
| Asian | 64 | 0.9% |
| Black / African American | 1,004 | 14.0% |
| Hawaiian / Pacific | 0 | 0.0% |
| Hispanic or Latino | 299 | 4.2% |
| Native / Alaskan | 0 | 0.0% |
| White / Caucasian | 5,808 | 80.8% |
| Two or more Races | 127 | 1.8% |
| Some other Race | 183 | 2.5% |
| Total | 7,186 | 100.0% |
Ancestry in Russellville
The most populous ancestries reported in Russellville are American (676 | 9.4%), English (628 | 8.7%), Irish (510 | 7.1%), German (340 | 4.7%), and Mexican (204 | 2.8%), together accounting for 32.8% of all Russellville residents.
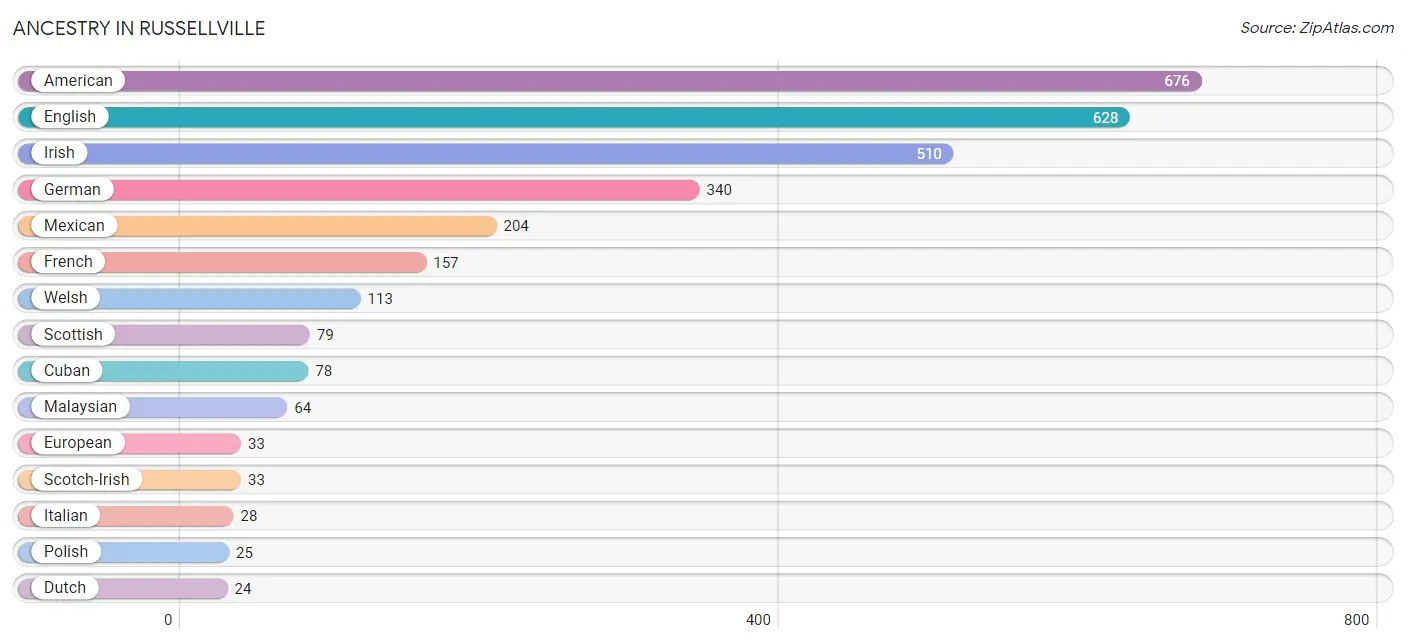
| Ancestry | # Population | % Population |
| African | 15 | 0.2% |
| American | 676 | 9.4% |
| Belgian | 2 | 0.0% |
| Blackfeet | 3 | 0.0% |
| British | 15 | 0.2% |
| Cherokee | 6 | 0.1% |
| Cuban | 78 | 1.1% |
| Czech | 13 | 0.2% |
| Dutch | 24 | 0.3% |
| English | 628 | 8.7% |
| European | 33 | 0.5% |
| French | 157 | 2.2% |
| German | 340 | 4.7% |
| Greek | 11 | 0.2% |
| Irish | 510 | 7.1% |
| Italian | 28 | 0.4% |
| Malaysian | 64 | 0.9% |
| Mexican | 204 | 2.8% |
| Polish | 25 | 0.4% |
| Puerto Rican | 17 | 0.2% |
| Scotch-Irish | 33 | 0.5% |
| Scottish | 79 | 1.1% |
| Subsaharan African | 15 | 0.2% |
| Swedish | 6 | 0.1% |
| Welsh | 113 | 1.6% | View All 25 Rows |
Immigrants in Russellville
The most numerous immigrant groups reported in Russellville came from Asia (40 | 0.6%), Laos (40 | 0.6%), South Eastern Asia (40 | 0.6%), Central America (2 | 0.0%), and Latin America (2 | 0.0%), together accounting for 1.7% of all Russellville residents.
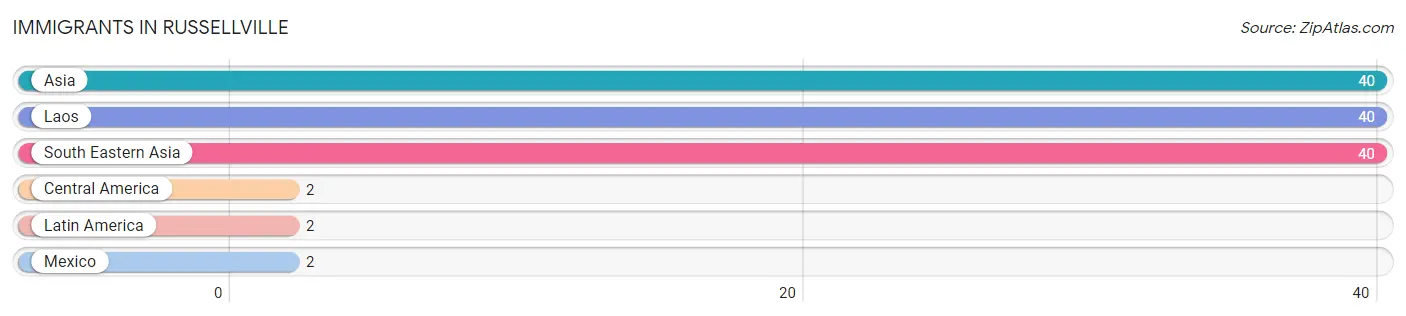
| Immigration Origin | # Population | % Population |
| Asia | 40 | 0.6% |
| Central America | 2 | 0.0% |
| Laos | 40 | 0.6% |
| Latin America | 2 | 0.0% |
| Mexico | 2 | 0.0% |
| South Eastern Asia | 40 | 0.6% | View All 6 Rows |
Sex and Age in Russellville
Sex and Age in Russellville
The most populous age groups in Russellville are 25 to 29 Years (316 | 10.2%) for men and 5 to 9 Years (522 | 12.8%) for women.
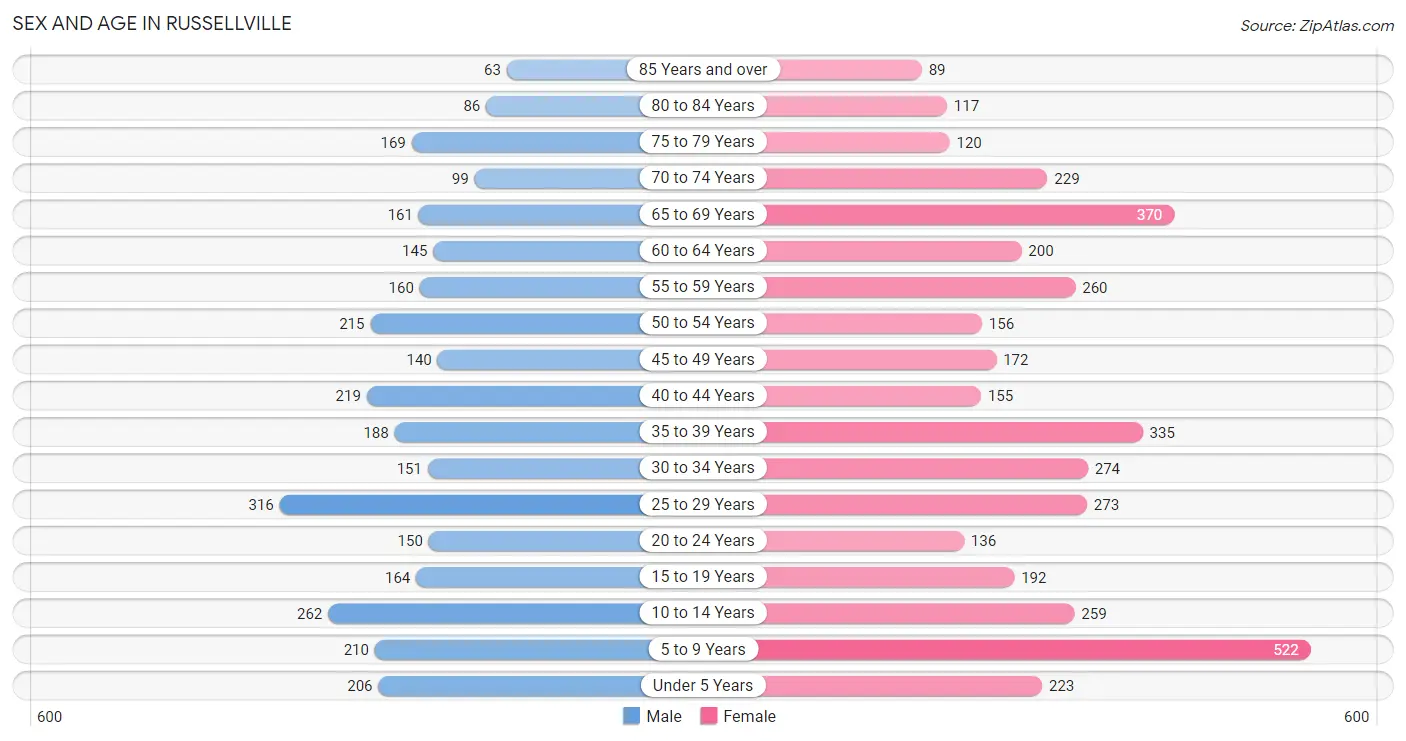
| Age Bracket | Male | Female |
| Under 5 Years | 206 (6.6%) | 223 (5.5%) |
| 5 to 9 Years | 210 (6.8%) | 522 (12.8%) |
| 10 to 14 Years | 262 (8.4%) | 259 (6.3%) |
| 15 to 19 Years | 164 (5.3%) | 192 (4.7%) |
| 20 to 24 Years | 150 (4.8%) | 136 (3.3%) |
| 25 to 29 Years | 316 (10.2%) | 273 (6.7%) |
| 30 to 34 Years | 151 (4.9%) | 274 (6.7%) |
| 35 to 39 Years | 188 (6.1%) | 335 (8.2%) |
| 40 to 44 Years | 219 (7.1%) | 155 (3.8%) |
| 45 to 49 Years | 140 (4.5%) | 172 (4.2%) |
| 50 to 54 Years | 215 (6.9%) | 156 (3.8%) |
| 55 to 59 Years | 160 (5.1%) | 260 (6.4%) |
| 60 to 64 Years | 145 (4.7%) | 200 (4.9%) |
| 65 to 69 Years | 161 (5.2%) | 370 (9.1%) |
| 70 to 74 Years | 99 (3.2%) | 229 (5.6%) |
| 75 to 79 Years | 169 (5.4%) | 120 (2.9%) |
| 80 to 84 Years | 86 (2.8%) | 117 (2.9%) |
| 85 Years and over | 63 (2.0%) | 89 (2.2%) |
| Total | 3,104 (100.0%) | 4,082 (100.0%) |
Families and Households in Russellville
Median Family Size in Russellville
The median family size in Russellville is 2.91 persons per family, with single female/mother families (472 | 24.3%) accounting for the largest median family size of 3.05 persons per family. On the other hand, single male/father families (126 | 6.5%) represent the smallest median family size with 2.55 persons per family.
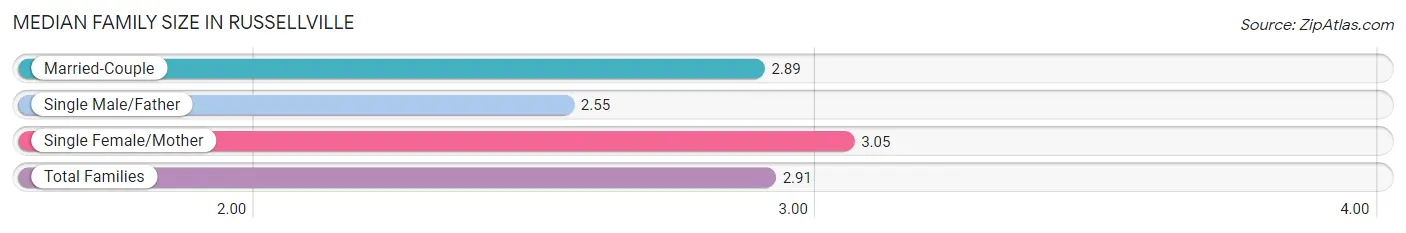
| Family Type | # Families | Family Size |
| Married-Couple | 1,347 (69.3%) | 2.89 |
| Single Male/Father | 126 (6.5%) | 2.55 |
| Single Female/Mother | 472 (24.3%) | 3.05 |
| Total Families | 1,945 (100.0%) | 2.91 |
Median Household Size in Russellville
The median household size in Russellville is 2.29 persons per household, with single female/mother households (472 | 15.7%) accounting for the largest median household size of 3.05 persons per household. non-family households (1,058 | 35.2%) represent the smallest median household size with 1.12 persons per household.
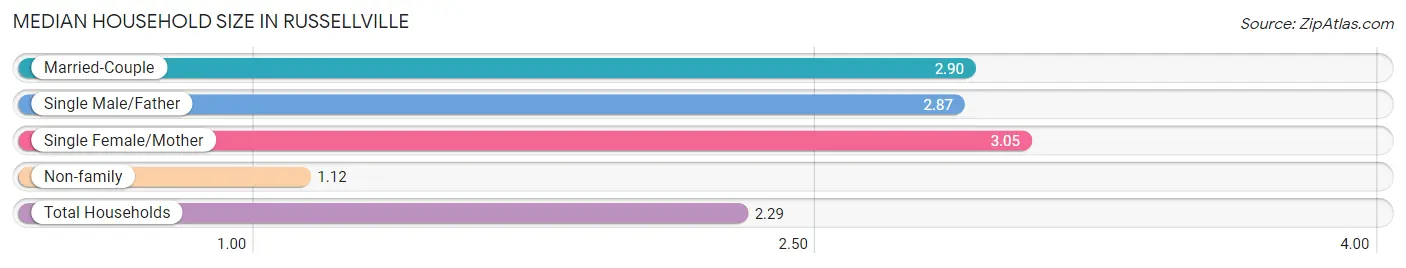
| Household Type | # Households | Household Size |
| Married-Couple | 1,347 (44.9%) | 2.90 |
| Single Male/Father | 126 (4.2%) | 2.87 |
| Single Female/Mother | 472 (15.7%) | 3.05 |
| Non-family | 1,058 (35.2%) | 1.12 |
| Total Households | 3,003 (100.0%) | 2.29 |
Household Size by Marriage Status in Russellville
Out of a total of 3,003 households in Russellville, 1,945 (64.8%) are family households, while 1,058 (35.2%) are nonfamily households. The most numerous type of family households are 2-person households, comprising 933, and the most common type of nonfamily households are 1-person households, comprising 977.
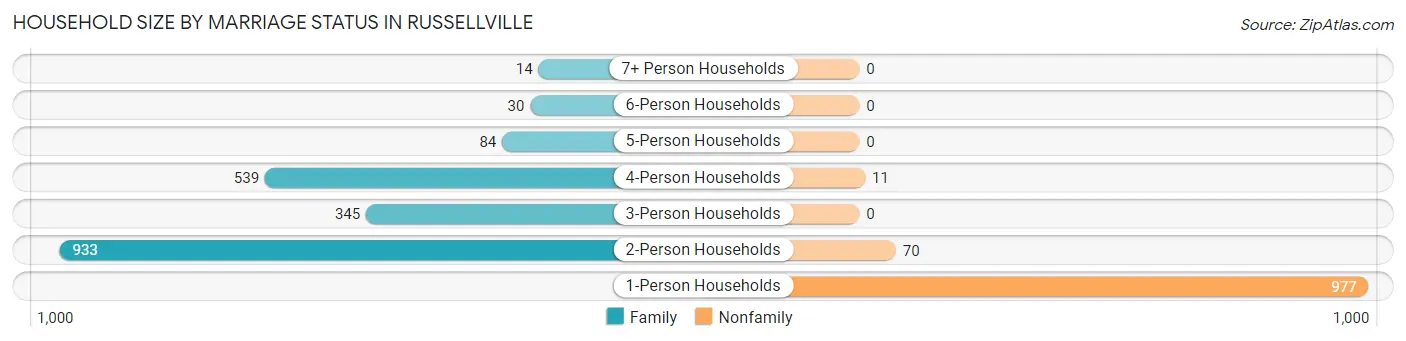
| Household Size | Family Households | Nonfamily Households |
| 1-Person Households | - | 977 (32.5%) |
| 2-Person Households | 933 (31.1%) | 70 (2.3%) |
| 3-Person Households | 345 (11.5%) | 0 (0.0%) |
| 4-Person Households | 539 (17.9%) | 11 (0.4%) |
| 5-Person Households | 84 (2.8%) | 0 (0.0%) |
| 6-Person Households | 30 (1.0%) | 0 (0.0%) |
| 7+ Person Households | 14 (0.5%) | 0 (0.0%) |
| Total | 1,945 (64.8%) | 1,058 (35.2%) |
Female Fertility in Russellville
Fertility by Age in Russellville
Average fertility rate in Russellville is 14.0 births per 1,000 women. Women in the age bracket of 20 to 34 years have the highest fertility rate with 18.0 births per 1,000 women. Women in the age bracket of 20 to 34 years acount for 52.2% of all women with births.
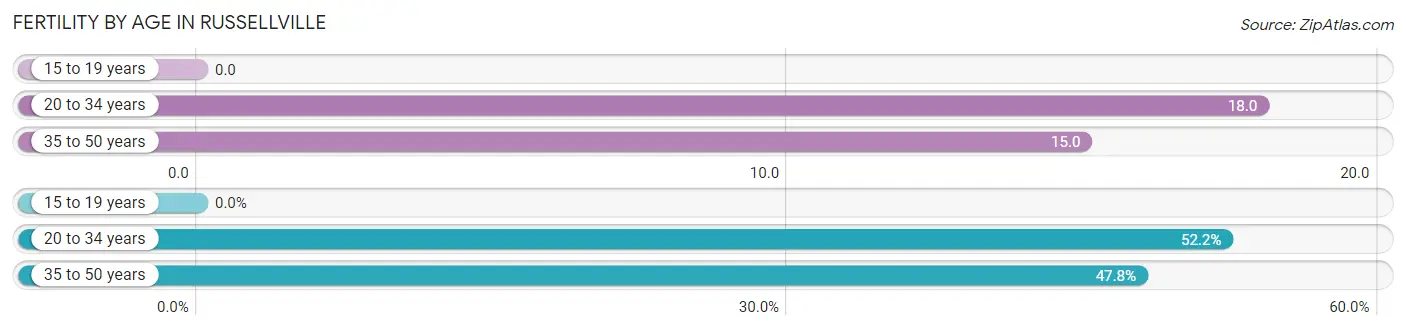
| Age Bracket | Women with Births | Births / 1,000 Women |
| 15 to 19 years | 0 (0.0%) | 0.0 |
| 20 to 34 years | 12 (52.2%) | 18.0 |
| 35 to 50 years | 11 (47.8%) | 15.0 |
| Total | 23 (100.0%) | 14.0 |
Fertility by Age by Marriage Status in Russellville
39.1% of women with births (23) in Russellville are married. The highest percentage of unmarried women with births falls into 35 to 50 years age bracket with 100.0% of them unmarried at the time of birth, while the lowest percentage of unmarried women with births belong to 20 to 34 years age bracket with 25.0% of them unmarried.
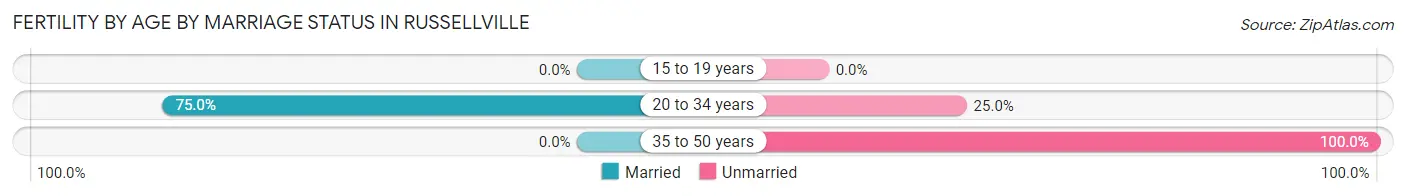
| Age Bracket | Married | Unmarried |
| 15 to 19 years | 0 (0.0%) | 0 (0.0%) |
| 20 to 34 years | 9 (75.0%) | 3 (25.0%) |
| 35 to 50 years | 0 (0.0%) | 11 (100.0%) |
| Total | 9 (39.1%) | 14 (60.9%) |
Fertility by Education in Russellville
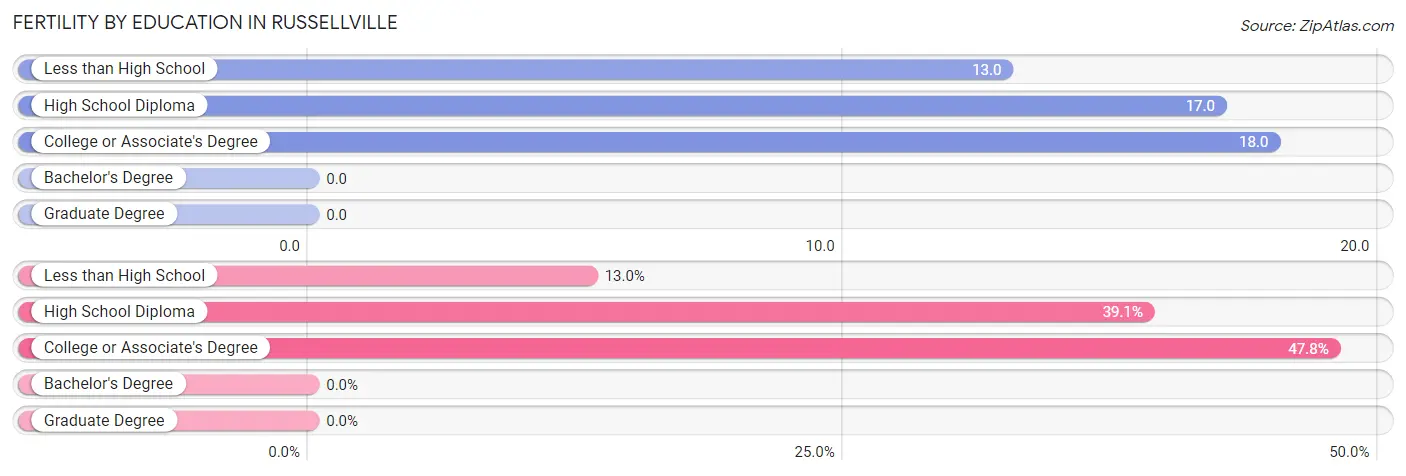
| Educational Attainment | Women with Births | Births / 1,000 Women |
| Less than High School | 3 (13.0%) | 13.0 |
| High School Diploma | 9 (39.1%) | 17.0 |
| College or Associate's Degree | 11 (47.8%) | 18.0 |
| Bachelor's Degree | 0 (0.0%) | 0.0 |
| Graduate Degree | 0 (0.0%) | 0.0 |
| Total | 23 (100.0%) | 14.0 |
Fertility by Education by Marriage Status in Russellville
60.9% of women with births in Russellville are unmarried. Women with the educational attainment of high school diploma are most likely to be married with 100.0% of them married at childbirth, while women with the educational attainment of less than high school are least likely to be married with 100.0% of them unmarried at childbirth.
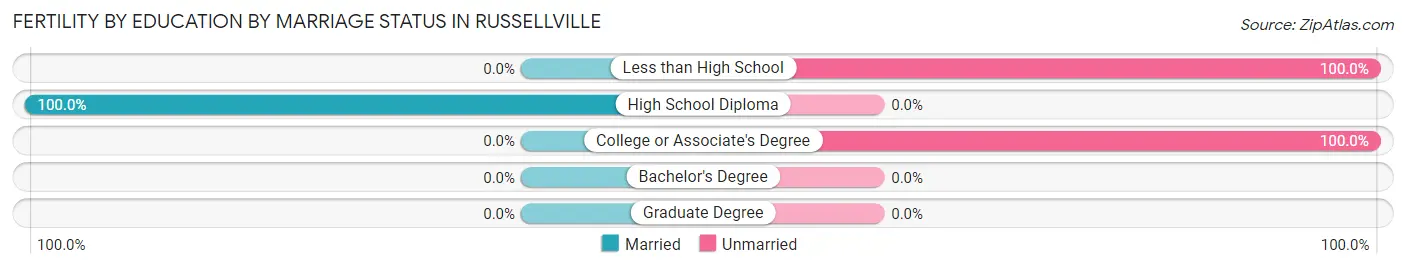
| Educational Attainment | Married | Unmarried |
| Less than High School | 0 (0.0%) | 3 (100.0%) |
| High School Diploma | 9 (100.0%) | 0 (0.0%) |
| College or Associate's Degree | 0 (0.0%) | 11 (100.0%) |
| Bachelor's Degree | 0 (0.0%) | 0 (0.0%) |
| Graduate Degree | 0 (0.0%) | 0 (0.0%) |
| Total | 9 (39.1%) | 14 (60.9%) |
Employment Characteristics in Russellville
Employment by Class of Employer in Russellville
Among the 2,616 employed individuals in Russellville, private company employees (1,925 | 73.6%), not-for-profit organizations (197 | 7.5%), and local government employees (129 | 4.9%) make up the most common classes of employment.
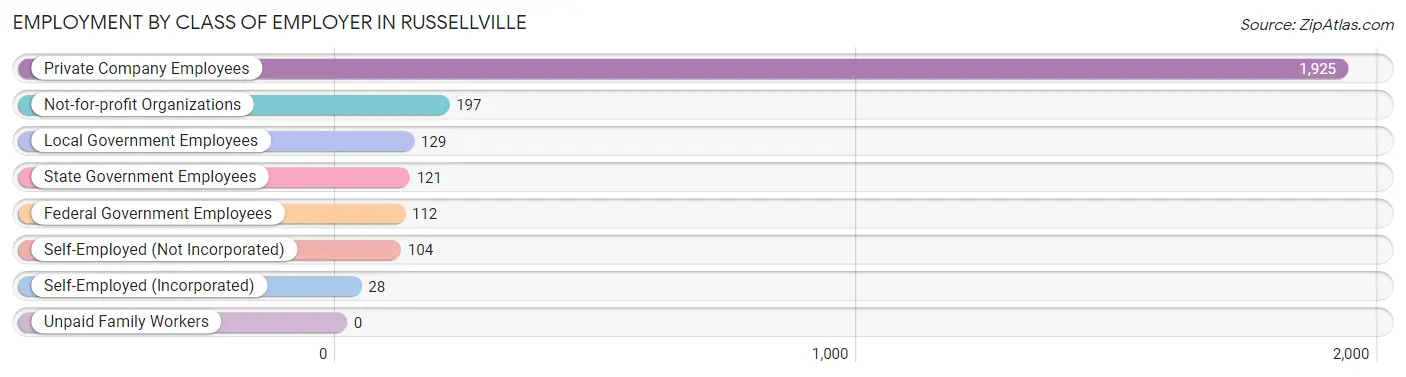
| Employer Class | # Employees | % Employees |
| Private Company Employees | 1,925 | 73.6% |
| Self-Employed (Incorporated) | 28 | 1.1% |
| Self-Employed (Not Incorporated) | 104 | 4.0% |
| Not-for-profit Organizations | 197 | 7.5% |
| Local Government Employees | 129 | 4.9% |
| State Government Employees | 121 | 4.6% |
| Federal Government Employees | 112 | 4.3% |
| Unpaid Family Workers | 0 | 0.0% |
| Total | 2,616 | 100.0% |
Employment Status by Age in Russellville
According to the labor force statistics for Russellville, out of the total population over 16 years of age (5,411), 56.4% or 3,052 individuals are in the labor force, with 9.2% or 281 of them unemployed. The age group with the highest labor force participation rate is 30 to 34 years, with 85.9% or 365 individuals in the labor force. Within the labor force, the 35 to 44 years age range has the highest percentage of unemployed individuals, with 26.6% or 179 of them being unemployed.
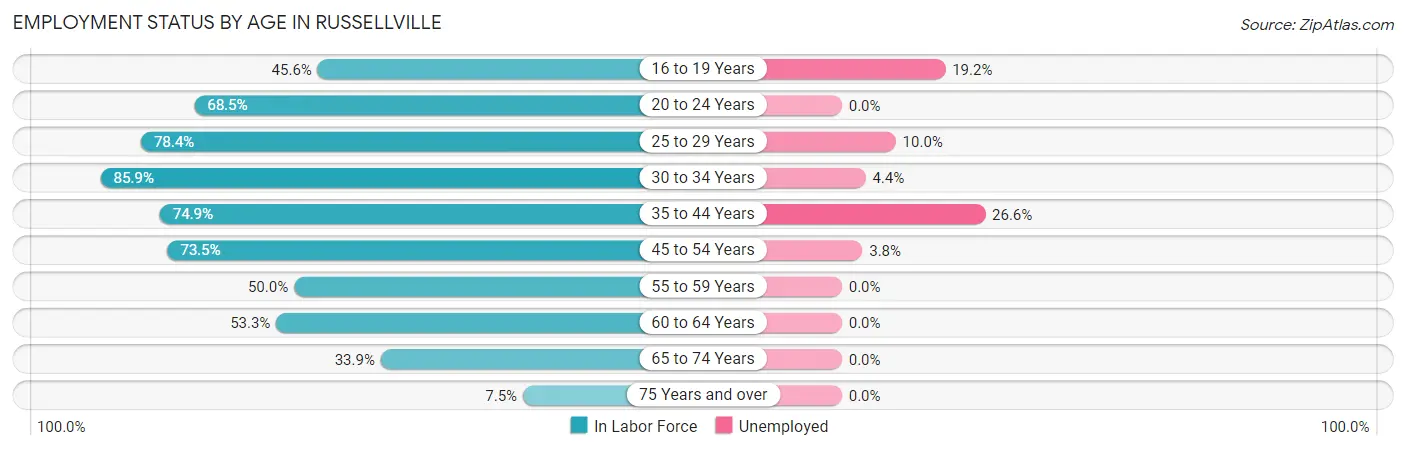
| Age Bracket | In Labor Force | Unemployed |
| 16 to 19 Years | 120 (45.6%) | 23 (19.2%) |
| 20 to 24 Years | 196 (68.5%) | 0 (0.0%) |
| 25 to 29 Years | 462 (78.4%) | 46 (10.0%) |
| 30 to 34 Years | 365 (85.9%) | 16 (4.4%) |
| 35 to 44 Years | 672 (74.9%) | 179 (26.6%) |
| 45 to 54 Years | 502 (73.5%) | 19 (3.8%) |
| 55 to 59 Years | 210 (50.0%) | 0 (0.0%) |
| 60 to 64 Years | 184 (53.3%) | 0 (0.0%) |
| 65 to 74 Years | 291 (33.9%) | 0 (0.0%) |
| 75 Years and over | 48 (7.5%) | 0 (0.0%) |
| Total | 3,052 (56.4%) | 281 (9.2%) |
Employment Status by Educational Attainment in Russellville
According to labor force statistics for Russellville, 71.3% of individuals (2,395) out of the total population between 25 and 64 years of age (3,359) are in the labor force, with 10.8% or 259 of them being unemployed. The group with the highest labor force participation rate are those with the educational attainment of bachelor's degree or higher, with 95.4% or 460 individuals in the labor force. Within the labor force, individuals with high school diploma education have the highest percentage of unemployment, with 21.5% or 181 of them being unemployed.
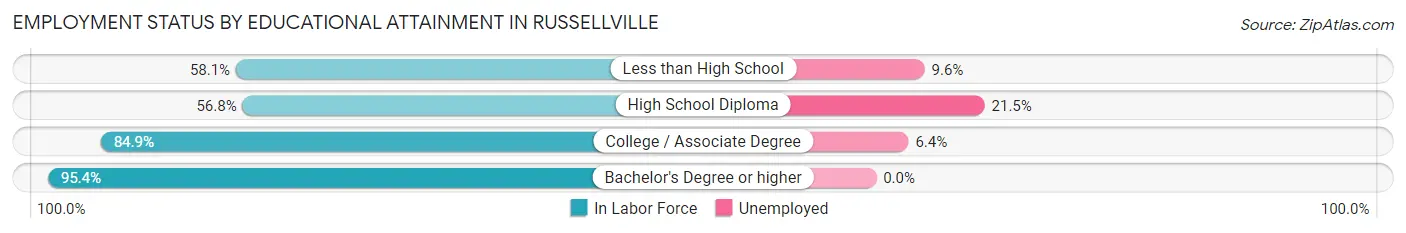
| Educational Attainment | In Labor Force | Unemployed |
| Less than High School | 198 (58.1%) | 33 (9.6%) |
| High School Diploma | 842 (56.8%) | 319 (21.5%) |
| College / Associate Degree | 895 (84.9%) | 67 (6.4%) |
| Bachelor's Degree or higher | 460 (95.4%) | 0 (0.0%) |
| Total | 2,395 (71.3%) | 363 (10.8%) |
Employment Occupations by Sex in Russellville
Management, Business, Science and Arts Occupations
The most common Management, Business, Science and Arts occupations in Russellville are Community & Social Service (222 | 8.1%), Health Diagnosing & Treating (181 | 6.6%), Health Technologists (168 | 6.1%), Education, Arts & Media (135 | 4.9%), and Computers, Engineering & Science (87 | 3.2%).
Management, Business, Science and Arts Occupations by Sex
Within the Management, Business, Science and Arts occupations in Russellville, the most male-oriented occupations are Life, Physical & Social Science (100.0%), Management (85.9%), and Architecture & Engineering (74.2%), while the most female-oriented occupations are Computers & Mathematics (100.0%), Health Diagnosing & Treating (96.1%), and Health Technologists (95.8%).
| Occupation | Male | Female |
| Management | 55 (85.9%) | 9 (14.1%) |
| Business & Financial | 15 (37.5%) | 25 (62.5%) |
| Computers, Engineering & Science | 56 (64.4%) | 31 (35.6%) |
| Computers & Mathematics | 0 (0.0%) | 23 (100.0%) |
| Architecture & Engineering | 23 (74.2%) | 8 (25.8%) |
| Life, Physical & Social Science | 33 (100.0%) | 0 (0.0%) |
| Community & Social Service | 105 (47.3%) | 117 (52.7%) |
| Education, Arts & Media | 93 (68.9%) | 42 (31.1%) |
| Legal Services & Support | 0 (0.0%) | 0 (0.0%) |
| Education Instruction & Library | 12 (13.8%) | 75 (86.2%) |
| Arts, Media & Entertainment | 0 (0.0%) | 0 (0.0%) |
| Health Diagnosing & Treating | 7 (3.9%) | 174 (96.1%) |
| Health Technologists | 7 (4.2%) | 161 (95.8%) |
| Total (Category) | 238 (40.1%) | 356 (59.9%) |
| Total (Overall) | 1,342 (48.6%) | 1,417 (51.4%) |
Services Occupations
The most common Services occupations in Russellville are Food Preparation & Serving (171 | 6.2%), Security & Protection (109 | 4.0%), Firefighting & Prevention (91 | 3.3%), Cleaning & Maintenance (78 | 2.8%), and Healthcare Support (72 | 2.6%).
Services Occupations by Sex
Within the Services occupations in Russellville, the most male-oriented occupations are Law Enforcement (100.0%), Security & Protection (91.7%), and Firefighting & Prevention (90.1%), while the most female-oriented occupations are Healthcare Support (100.0%), Personal Care & Service (100.0%), and Food Preparation & Serving (53.2%).
| Occupation | Male | Female |
| Healthcare Support | 0 (0.0%) | 72 (100.0%) |
| Security & Protection | 100 (91.7%) | 9 (8.3%) |
| Firefighting & Prevention | 82 (90.1%) | 9 (9.9%) |
| Law Enforcement | 18 (100.0%) | 0 (0.0%) |
| Food Preparation & Serving | 80 (46.8%) | 91 (53.2%) |
| Cleaning & Maintenance | 63 (80.8%) | 15 (19.2%) |
| Personal Care & Service | 0 (0.0%) | 24 (100.0%) |
| Total (Category) | 243 (53.5%) | 211 (46.5%) |
| Total (Overall) | 1,342 (48.6%) | 1,417 (51.4%) |
Sales and Office Occupations
The most common Sales and Office occupations in Russellville are Sales & Related (379 | 13.7%), and Office & Administration (271 | 9.8%).

Sales and Office Occupations by Sex

| Occupation | Male | Female |
| Sales & Related | 95 (25.1%) | 284 (74.9%) |
| Office & Administration | 0 (0.0%) | 271 (100.0%) |
| Total (Category) | 95 (14.6%) | 555 (85.4%) |
| Total (Overall) | 1,342 (48.6%) | 1,417 (51.4%) |
Natural Resources, Construction and Maintenance Occupations
The most common Natural Resources, Construction and Maintenance occupations in Russellville are Construction & Extraction (231 | 8.4%), and Installation, Maintenance & Repair (67 | 2.4%).
Natural Resources, Construction and Maintenance Occupations by Sex
| Occupation | Male | Female |
| Farming, Fishing & Forestry | 0 (0.0%) | 0 (0.0%) |
| Construction & Extraction | 231 (100.0%) | 0 (0.0%) |
| Installation, Maintenance & Repair | 67 (100.0%) | 0 (0.0%) |
| Total (Category) | 298 (100.0%) | 0 (0.0%) |
| Total (Overall) | 1,342 (48.6%) | 1,417 (51.4%) |
Production, Transportation and Moving Occupations
The most common Production, Transportation and Moving occupations in Russellville are Production (402 | 14.6%), Material Moving (256 | 9.3%), and Transportation (105 | 3.8%).
Production, Transportation and Moving Occupations by Sex
| Occupation | Male | Female |
| Production | 308 (76.6%) | 94 (23.4%) |
| Transportation | 105 (100.0%) | 0 (0.0%) |
| Material Moving | 55 (21.5%) | 201 (78.5%) |
| Total (Category) | 468 (61.3%) | 295 (38.7%) |
| Total (Overall) | 1,342 (48.6%) | 1,417 (51.4%) |
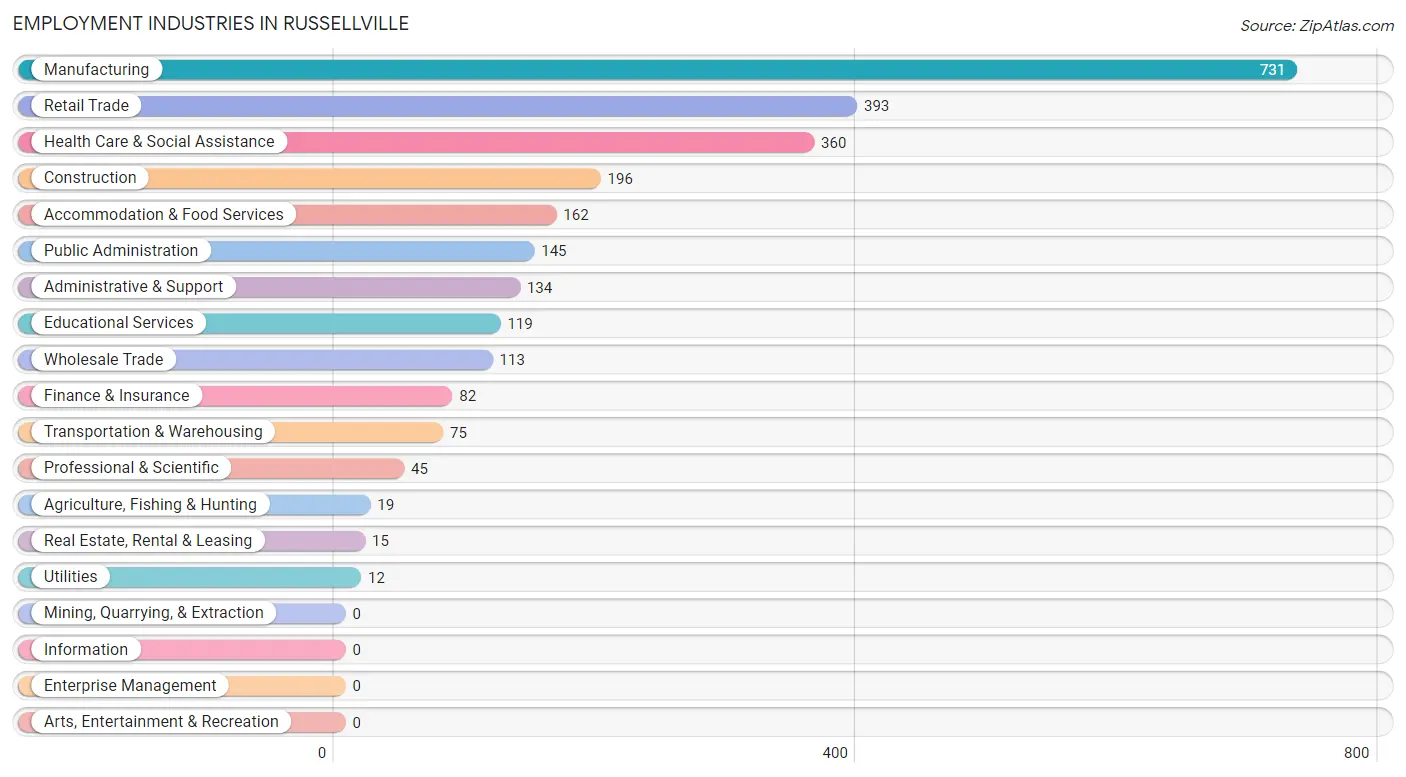
Employment Industries by Sex in Russellville
Employment Industries in Russellville
The major employment industries in Russellville include Manufacturing (731 | 26.5%), Retail Trade (393 | 14.2%), Health Care & Social Assistance (360 | 13.1%), Construction (196 | 7.1%), and Accommodation & Food Services (162 | 5.9%).
Employment Industries by Sex in Russellville
The Russellville industries that see more men than women are Construction (100.0%), Real Estate, Rental & Leasing (100.0%), and Agriculture, Fishing & Hunting (84.2%), whereas the industries that tend to have a higher number of women are Utilities (100.0%), Wholesale Trade (89.4%), and Health Care & Social Assistance (86.9%).
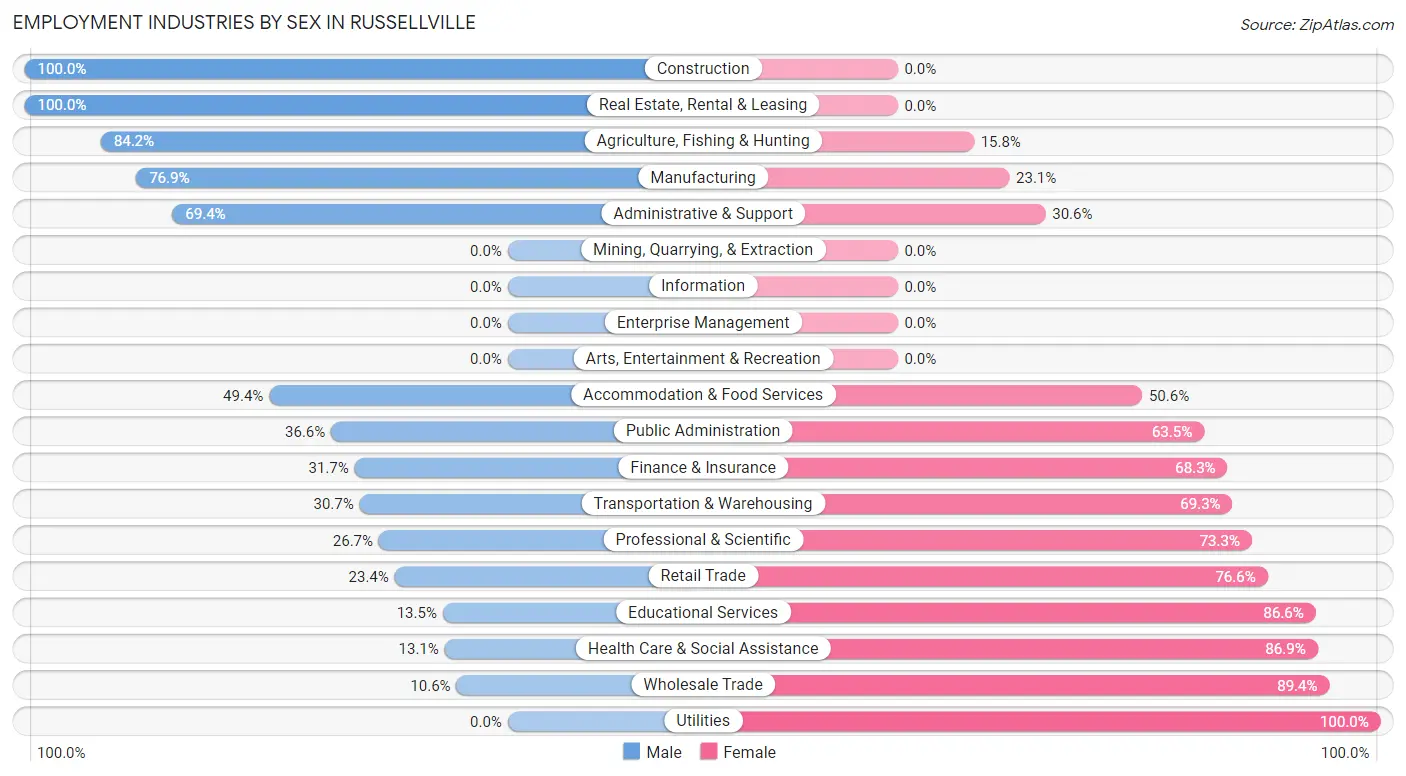
| Industry | Male | Female |
| Agriculture, Fishing & Hunting | 16 (84.2%) | 3 (15.8%) |
| Mining, Quarrying, & Extraction | 0 (0.0%) | 0 (0.0%) |
| Construction | 196 (100.0%) | 0 (0.0%) |
| Manufacturing | 562 (76.9%) | 169 (23.1%) |
| Wholesale Trade | 12 (10.6%) | 101 (89.4%) |
| Retail Trade | 92 (23.4%) | 301 (76.6%) |
| Transportation & Warehousing | 23 (30.7%) | 52 (69.3%) |
| Utilities | 0 (0.0%) | 12 (100.0%) |
| Information | 0 (0.0%) | 0 (0.0%) |
| Finance & Insurance | 26 (31.7%) | 56 (68.3%) |
| Real Estate, Rental & Leasing | 15 (100.0%) | 0 (0.0%) |
| Professional & Scientific | 12 (26.7%) | 33 (73.3%) |
| Enterprise Management | 0 (0.0%) | 0 (0.0%) |
| Administrative & Support | 93 (69.4%) | 41 (30.6%) |
| Educational Services | 16 (13.5%) | 103 (86.6%) |
| Health Care & Social Assistance | 47 (13.1%) | 313 (86.9%) |
| Arts, Entertainment & Recreation | 0 (0.0%) | 0 (0.0%) |
| Accommodation & Food Services | 80 (49.4%) | 82 (50.6%) |
| Public Administration | 53 (36.5%) | 92 (63.4%) |
| Total | 1,342 (48.6%) | 1,417 (51.4%) |
Education in Russellville
School Enrollment in Russellville
The most common levels of schooling among the 1,793 students in Russellville are elementary school (659 | 36.7%), high school (419 | 23.4%), and middle school (397 | 22.1%).
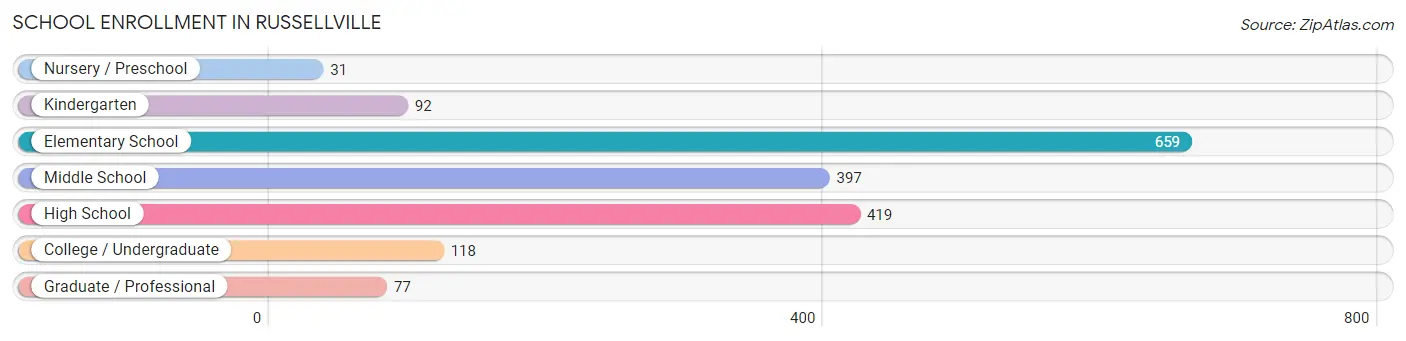
| School Level | # Students | % Students |
| Nursery / Preschool | 31 | 1.7% |
| Kindergarten | 92 | 5.1% |
| Elementary School | 659 | 36.7% |
| Middle School | 397 | 22.1% |
| High School | 419 | 23.4% |
| College / Undergraduate | 118 | 6.6% |
| Graduate / Professional | 77 | 4.3% |
| Total | 1,793 | 100.0% |
School Enrollment by Age by Funding Source in Russellville
Out of a total of 1,793 students who are enrolled in schools in Russellville, 172 (9.6%) attend a private institution, while the remaining 1,621 (90.4%) are enrolled in public schools. The age group of 25 to 34 year olds has the highest likelihood of being enrolled in private schools, with 62 (68.1% in the age bracket) enrolled. Conversely, the age group of 18 to 19 year olds has the lowest likelihood of being enrolled in a private school, with 51 (100.0% in the age bracket) attending a public institution.
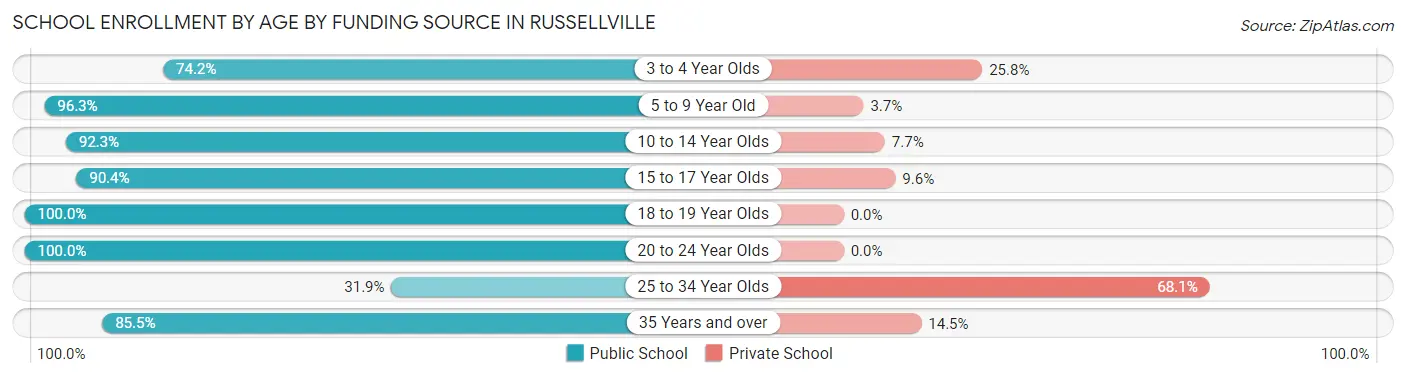
| Age Bracket | Public School | Private School |
| 3 to 4 Year Olds | 23 (74.2%) | 8 (25.8%) |
| 5 to 9 Year Old | 705 (96.3%) | 27 (3.7%) |
| 10 to 14 Year Olds | 481 (92.3%) | 40 (7.7%) |
| 15 to 17 Year Olds | 225 (90.4%) | 24 (9.6%) |
| 18 to 19 Year Olds | 51 (100.0%) | 0 (0.0%) |
| 20 to 24 Year Olds | 42 (100.0%) | 0 (0.0%) |
| 25 to 34 Year Olds | 29 (31.9%) | 62 (68.1%) |
| 35 Years and over | 65 (85.5%) | 11 (14.5%) |
| Total | 1,621 (90.4%) | 172 (9.6%) |
Educational Attainment by Field of Study in Russellville
Education (220 | 33.1%), business (153 | 23.0%), science & technology (76 | 11.4%), arts & humanities (66 | 9.9%), and liberal arts & history (47 | 7.1%) are the most common fields of study among 665 individuals in Russellville who have obtained a bachelor's degree or higher.
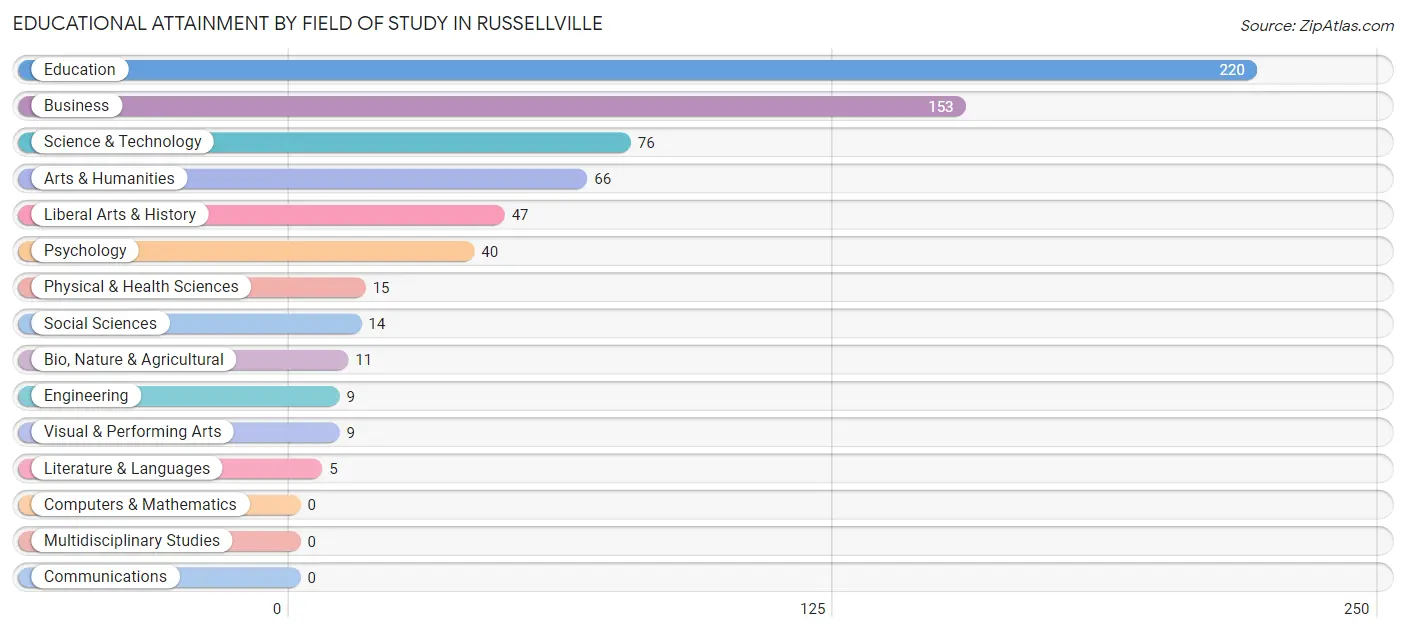
| Field of Study | # Graduates | % Graduates |
| Computers & Mathematics | 0 | 0.0% |
| Bio, Nature & Agricultural | 11 | 1.7% |
| Physical & Health Sciences | 15 | 2.3% |
| Psychology | 40 | 6.0% |
| Social Sciences | 14 | 2.1% |
| Engineering | 9 | 1.3% |
| Multidisciplinary Studies | 0 | 0.0% |
| Science & Technology | 76 | 11.4% |
| Business | 153 | 23.0% |
| Education | 220 | 33.1% |
| Literature & Languages | 5 | 0.7% |
| Liberal Arts & History | 47 | 7.1% |
| Visual & Performing Arts | 9 | 1.3% |
| Communications | 0 | 0.0% |
| Arts & Humanities | 66 | 9.9% |
| Total | 665 | 100.0% |
Transportation & Commute in Russellville
Vehicle Availability by Sex in Russellville
The most prevalent vehicle ownership categories in Russellville are males with 2 vehicles (488, accounting for 37.9%) and females with 2 vehicles (472, making up 36.8%).
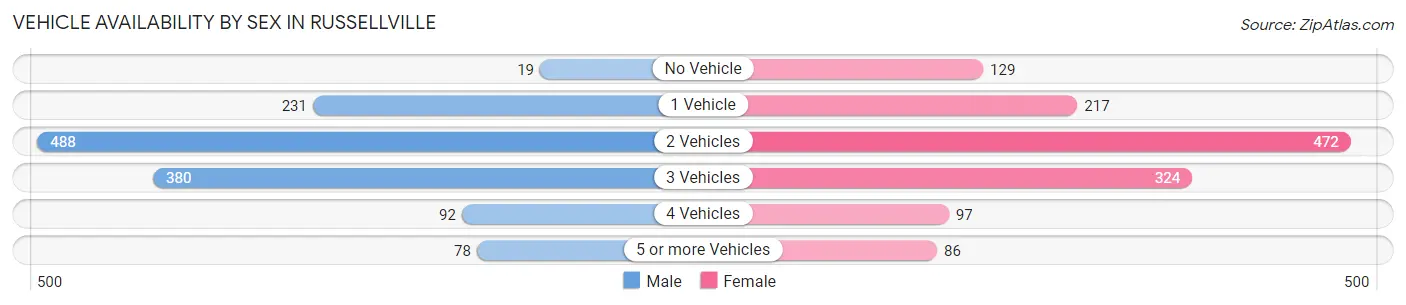
| Vehicles Available | Male | Female |
| No Vehicle | 19 (1.5%) | 129 (9.7%) |
| 1 Vehicle | 231 (17.9%) | 217 (16.4%) |
| 2 Vehicles | 488 (37.9%) | 472 (35.6%) |
| 3 Vehicles | 380 (29.5%) | 324 (24.4%) |
| 4 Vehicles | 92 (7.1%) | 97 (7.3%) |
| 5 or more Vehicles | 78 (6.1%) | 86 (6.5%) |
| Total | 1,288 (100.0%) | 1,325 (100.0%) |
Commute Time in Russellville
The most frequently occuring commute durations in Russellville are 5 to 9 minutes (842 commuters, 33.0%), 10 to 14 minutes (334 commuters, 13.1%), and 30 to 34 minutes (322 commuters, 12.6%).
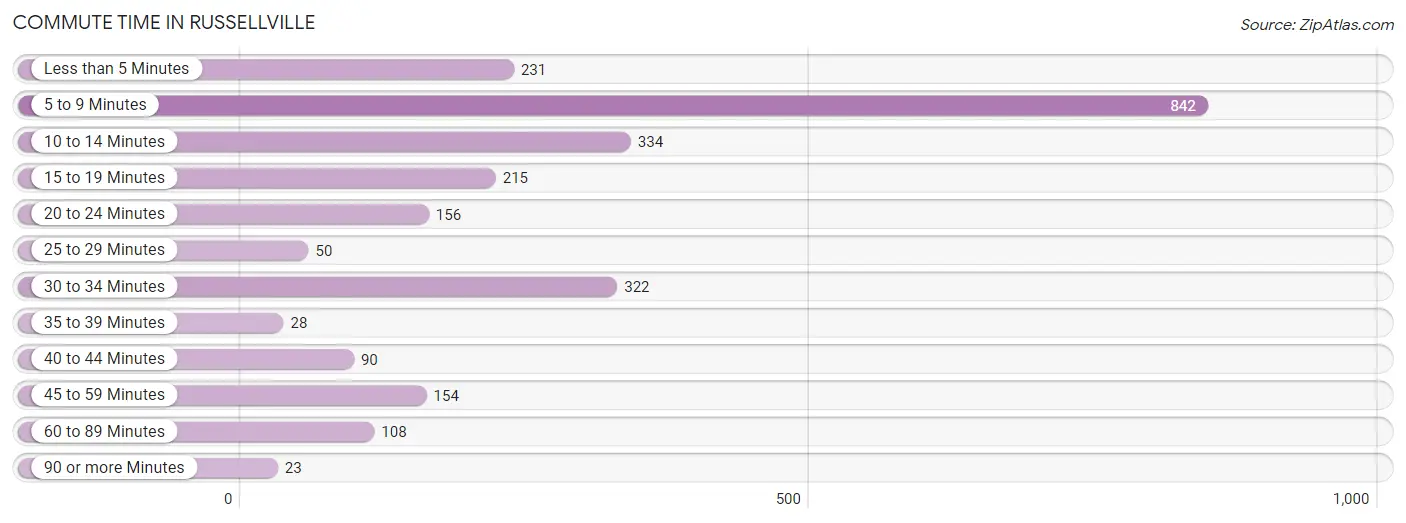
| Commute Time | # Commuters | % Commuters |
| Less than 5 Minutes | 231 | 9.0% |
| 5 to 9 Minutes | 842 | 33.0% |
| 10 to 14 Minutes | 334 | 13.1% |
| 15 to 19 Minutes | 215 | 8.4% |
| 20 to 24 Minutes | 156 | 6.1% |
| 25 to 29 Minutes | 50 | 2.0% |
| 30 to 34 Minutes | 322 | 12.6% |
| 35 to 39 Minutes | 28 | 1.1% |
| 40 to 44 Minutes | 90 | 3.5% |
| 45 to 59 Minutes | 154 | 6.0% |
| 60 to 89 Minutes | 108 | 4.2% |
| 90 or more Minutes | 23 | 0.9% |
Commute Time by Sex in Russellville
The most common commute times in Russellville are 5 to 9 minutes (406 commuters, 32.5%) for males and 5 to 9 minutes (436 commuters, 33.4%) for females.
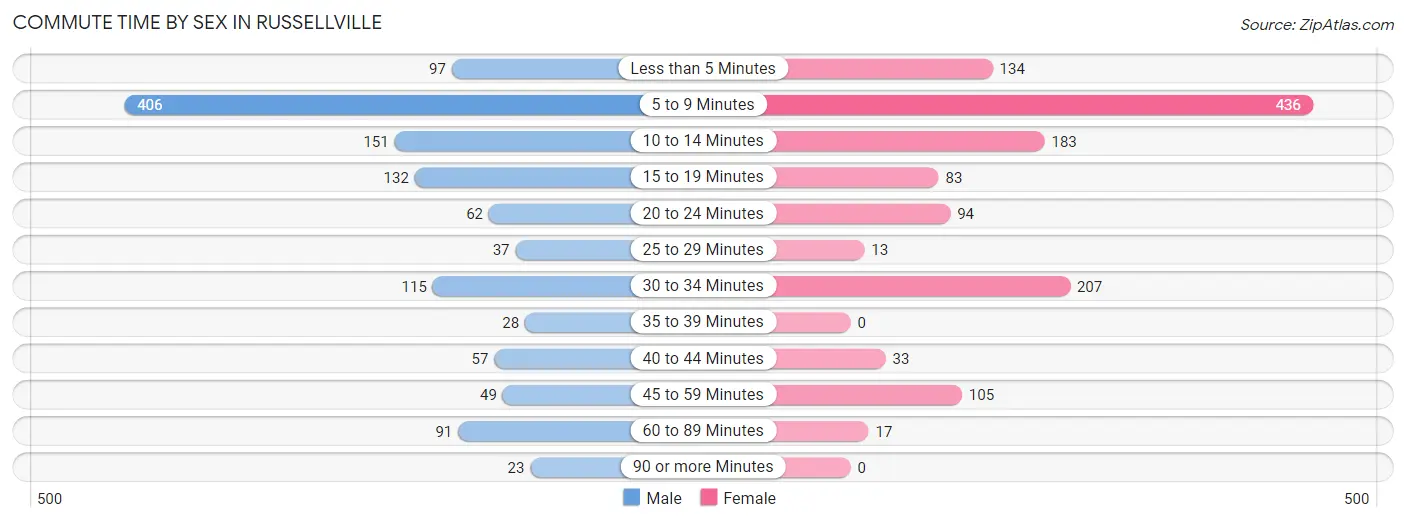
| Commute Time | Male | Female |
| Less than 5 Minutes | 97 (7.8%) | 134 (10.3%) |
| 5 to 9 Minutes | 406 (32.5%) | 436 (33.4%) |
| 10 to 14 Minutes | 151 (12.1%) | 183 (14.0%) |
| 15 to 19 Minutes | 132 (10.6%) | 83 (6.4%) |
| 20 to 24 Minutes | 62 (5.0%) | 94 (7.2%) |
| 25 to 29 Minutes | 37 (3.0%) | 13 (1.0%) |
| 30 to 34 Minutes | 115 (9.2%) | 207 (15.9%) |
| 35 to 39 Minutes | 28 (2.2%) | 0 (0.0%) |
| 40 to 44 Minutes | 57 (4.6%) | 33 (2.5%) |
| 45 to 59 Minutes | 49 (3.9%) | 105 (8.1%) |
| 60 to 89 Minutes | 91 (7.3%) | 17 (1.3%) |
| 90 or more Minutes | 23 (1.8%) | 0 (0.0%) |
Time of Departure to Work by Sex in Russellville
The most frequent times of departure to work in Russellville are 12:00 PM to 3:59 PM (211, 16.9%) for males and 6:30 AM to 6:59 AM (228, 17.5%) for females.
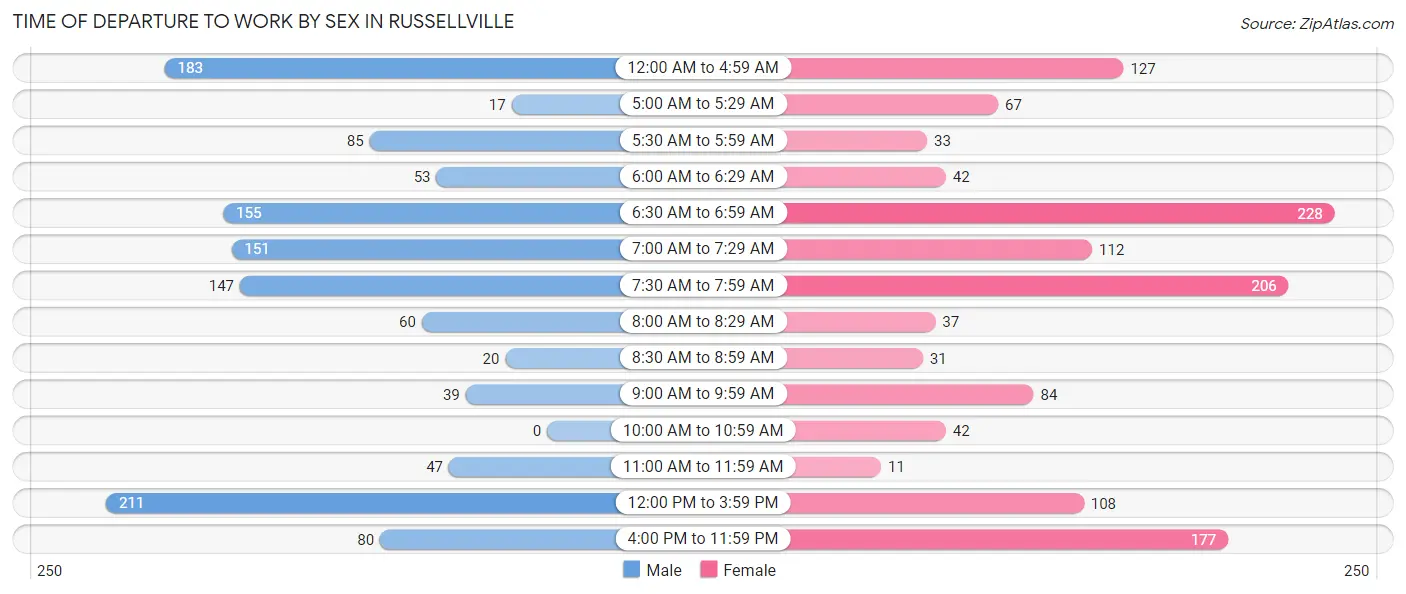
| Time of Departure | Male | Female |
| 12:00 AM to 4:59 AM | 183 (14.7%) | 127 (9.7%) |
| 5:00 AM to 5:29 AM | 17 (1.4%) | 67 (5.1%) |
| 5:30 AM to 5:59 AM | 85 (6.8%) | 33 (2.5%) |
| 6:00 AM to 6:29 AM | 53 (4.3%) | 42 (3.2%) |
| 6:30 AM to 6:59 AM | 155 (12.4%) | 228 (17.5%) |
| 7:00 AM to 7:29 AM | 151 (12.1%) | 112 (8.6%) |
| 7:30 AM to 7:59 AM | 147 (11.8%) | 206 (15.8%) |
| 8:00 AM to 8:29 AM | 60 (4.8%) | 37 (2.8%) |
| 8:30 AM to 8:59 AM | 20 (1.6%) | 31 (2.4%) |
| 9:00 AM to 9:59 AM | 39 (3.1%) | 84 (6.4%) |
| 10:00 AM to 10:59 AM | 0 (0.0%) | 42 (3.2%) |
| 11:00 AM to 11:59 AM | 47 (3.8%) | 11 (0.8%) |
| 12:00 PM to 3:59 PM | 211 (16.9%) | 108 (8.3%) |
| 4:00 PM to 11:59 PM | 80 (6.4%) | 177 (13.6%) |
| Total | 1,248 (100.0%) | 1,305 (100.0%) |
Housing Occupancy in Russellville
Occupancy by Ownership in Russellville
Of the total 3,003 dwellings in Russellville, owner-occupied units account for 1,480 (49.3%), while renter-occupied units make up 1,523 (50.7%).
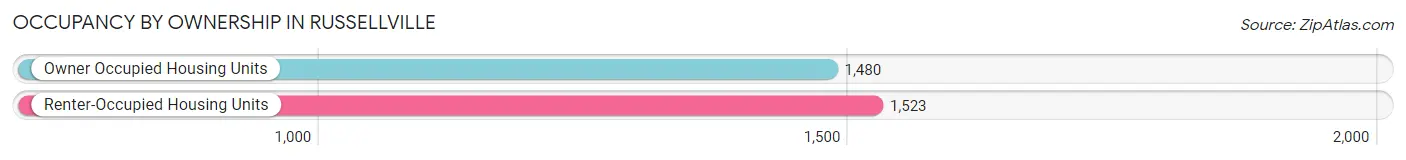
| Occupancy | # Housing Units | % Housing Units |
| Owner Occupied Housing Units | 1,480 | 49.3% |
| Renter-Occupied Housing Units | 1,523 | 50.7% |
| Total Occupied Housing Units | 3,003 | 100.0% |
Occupancy by Household Size in Russellville
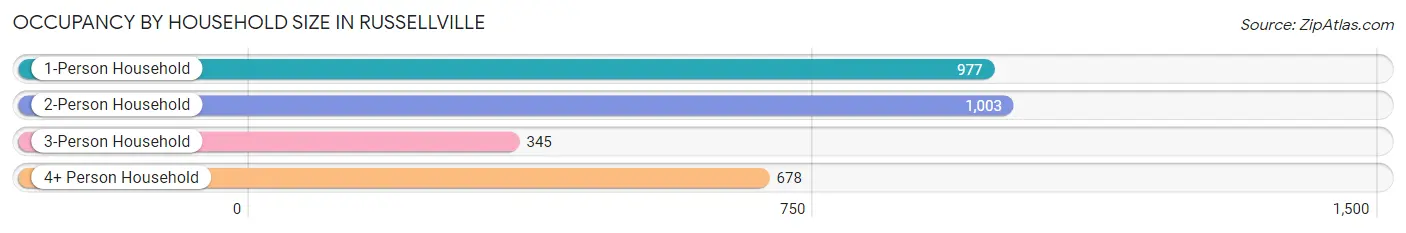
| Household Size | # Housing Units | % Housing Units |
| 1-Person Household | 977 | 32.5% |
| 2-Person Household | 1,003 | 33.4% |
| 3-Person Household | 345 | 11.5% |
| 4+ Person Household | 678 | 22.6% |
| Total Housing Units | 3,003 | 100.0% |
Occupancy by Ownership by Household Size in Russellville
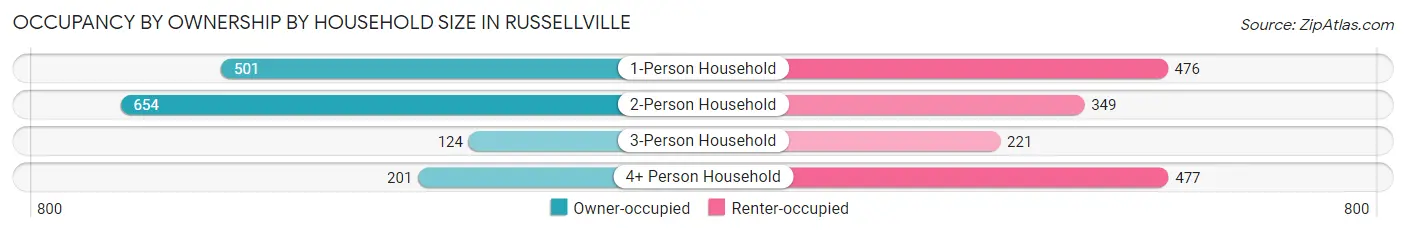
| Household Size | Owner-occupied | Renter-occupied |
| 1-Person Household | 501 (51.3%) | 476 (48.7%) |
| 2-Person Household | 654 (65.2%) | 349 (34.8%) |
| 3-Person Household | 124 (35.9%) | 221 (64.1%) |
| 4+ Person Household | 201 (29.6%) | 477 (70.4%) |
| Total Housing Units | 1,480 (49.3%) | 1,523 (50.7%) |
Occupancy by Educational Attainment in Russellville
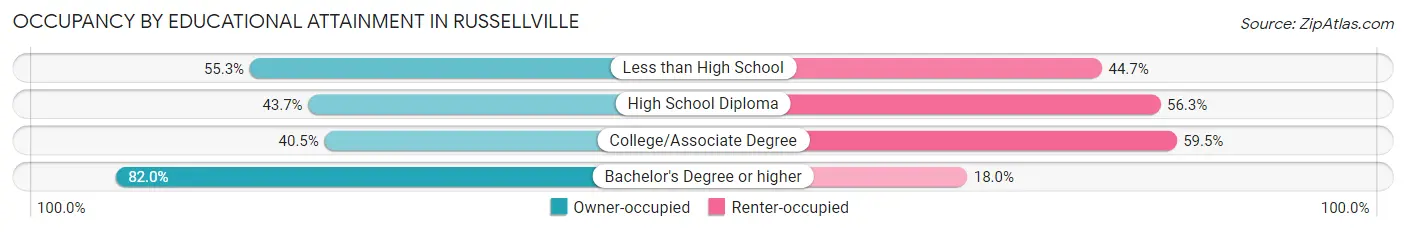
| Household Size | Owner-occupied | Renter-occupied |
| Less than High School | 104 (55.3%) | 84 (44.7%) |
| High School Diploma | 595 (43.7%) | 766 (56.3%) |
| College/Associate Degree | 402 (40.5%) | 590 (59.5%) |
| Bachelor's Degree or higher | 379 (82.0%) | 83 (18.0%) |
Occupancy by Age of Householder in Russellville
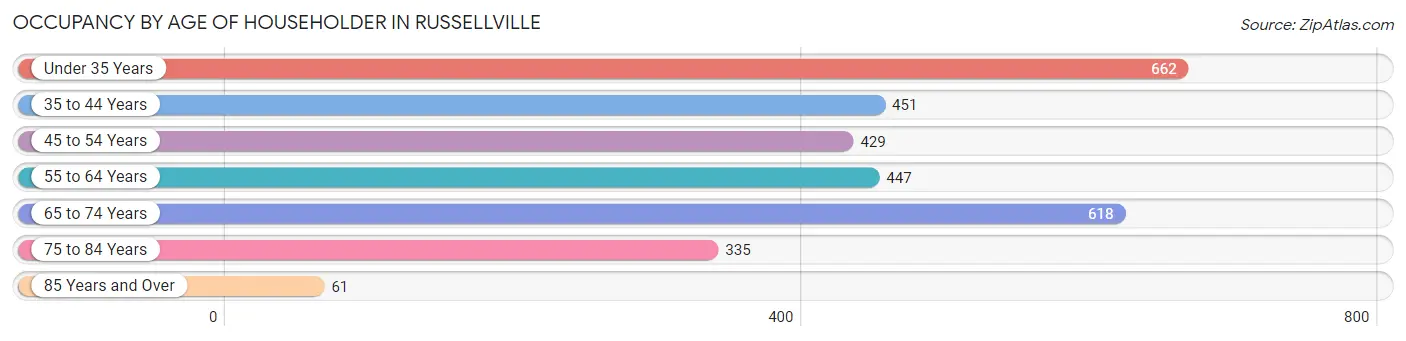
| Age Bracket | # Households | % Households |
| Under 35 Years | 662 | 22.0% |
| 35 to 44 Years | 451 | 15.0% |
| 45 to 54 Years | 429 | 14.3% |
| 55 to 64 Years | 447 | 14.9% |
| 65 to 74 Years | 618 | 20.6% |
| 75 to 84 Years | 335 | 11.2% |
| 85 Years and Over | 61 | 2.0% |
| Total | 3,003 | 100.0% |
Housing Finances in Russellville
Median Income by Occupancy in Russellville
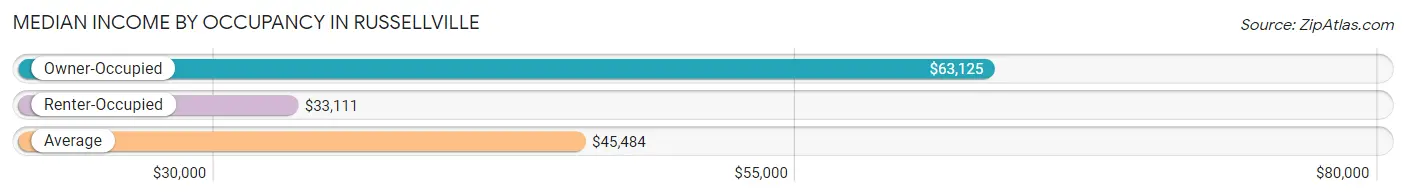
| Occupancy Type | # Households | Median Income |
| Owner-Occupied | 1,480 (49.3%) | $63,125 |
| Renter-Occupied | 1,523 (50.7%) | $33,111 |
| Average | 3,003 (100.0%) | $45,484 |
Occupancy by Householder Income Bracket in Russellville
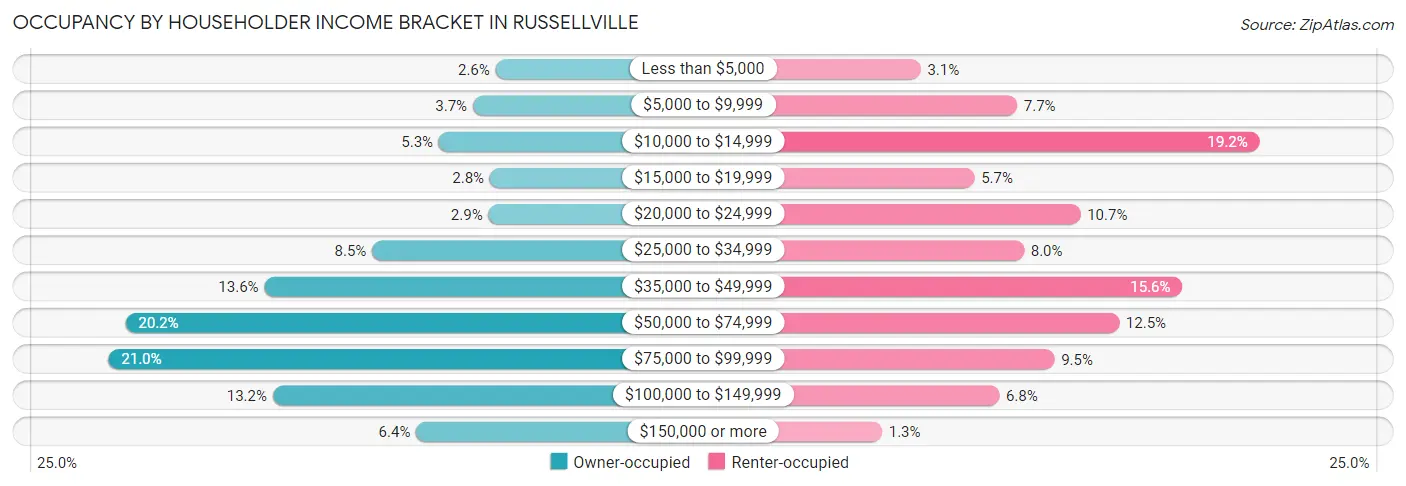
| Income Bracket | Owner-occupied | Renter-occupied |
| Less than $5,000 | 38 (2.6%) | 47 (3.1%) |
| $5,000 to $9,999 | 54 (3.6%) | 117 (7.7%) |
| $10,000 to $14,999 | 78 (5.3%) | 293 (19.2%) |
| $15,000 to $19,999 | 42 (2.8%) | 86 (5.7%) |
| $20,000 to $24,999 | 43 (2.9%) | 163 (10.7%) |
| $25,000 to $34,999 | 125 (8.5%) | 122 (8.0%) |
| $35,000 to $49,999 | 201 (13.6%) | 237 (15.6%) |
| $50,000 to $74,999 | 299 (20.2%) | 191 (12.5%) |
| $75,000 to $99,999 | 311 (21.0%) | 144 (9.5%) |
| $100,000 to $149,999 | 195 (13.2%) | 104 (6.8%) |
| $150,000 or more | 94 (6.4%) | 19 (1.3%) |
| Total | 1,480 (100.0%) | 1,523 (100.0%) |
Monthly Housing Cost Tiers in Russellville
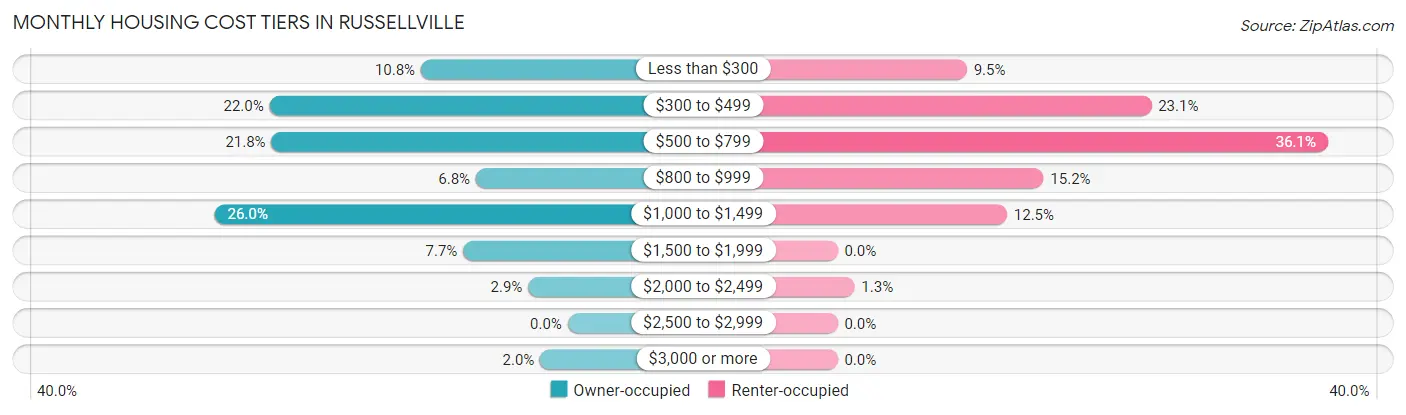
| Monthly Cost | Owner-occupied | Renter-occupied |
| Less than $300 | 160 (10.8%) | 145 (9.5%) |
| $300 to $499 | 325 (22.0%) | 352 (23.1%) |
| $500 to $799 | 323 (21.8%) | 550 (36.1%) |
| $800 to $999 | 100 (6.8%) | 231 (15.2%) |
| $1,000 to $1,499 | 385 (26.0%) | 190 (12.5%) |
| $1,500 to $1,999 | 114 (7.7%) | 0 (0.0%) |
| $2,000 to $2,499 | 43 (2.9%) | 19 (1.3%) |
| $2,500 to $2,999 | 0 (0.0%) | 0 (0.0%) |
| $3,000 or more | 30 (2.0%) | 0 (0.0%) |
| Total | 1,480 (100.0%) | 1,523 (100.0%) |
Physical Housing Characteristics in Russellville
Housing Structures in Russellville
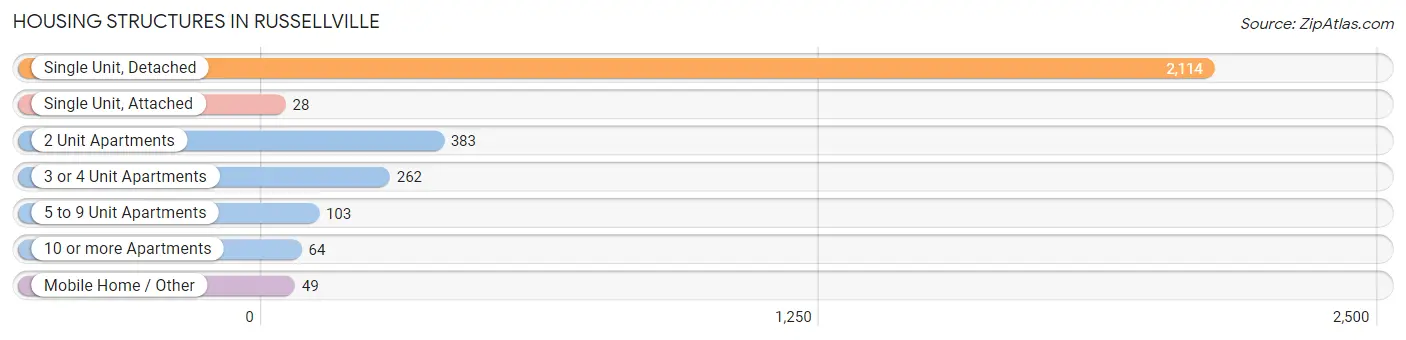
| Structure Type | # Housing Units | % Housing Units |
| Single Unit, Detached | 2,114 | 70.4% |
| Single Unit, Attached | 28 | 0.9% |
| 2 Unit Apartments | 383 | 12.8% |
| 3 or 4 Unit Apartments | 262 | 8.7% |
| 5 to 9 Unit Apartments | 103 | 3.4% |
| 10 or more Apartments | 64 | 2.1% |
| Mobile Home / Other | 49 | 1.6% |
| Total | 3,003 | 100.0% |
Housing Structures by Occupancy in Russellville
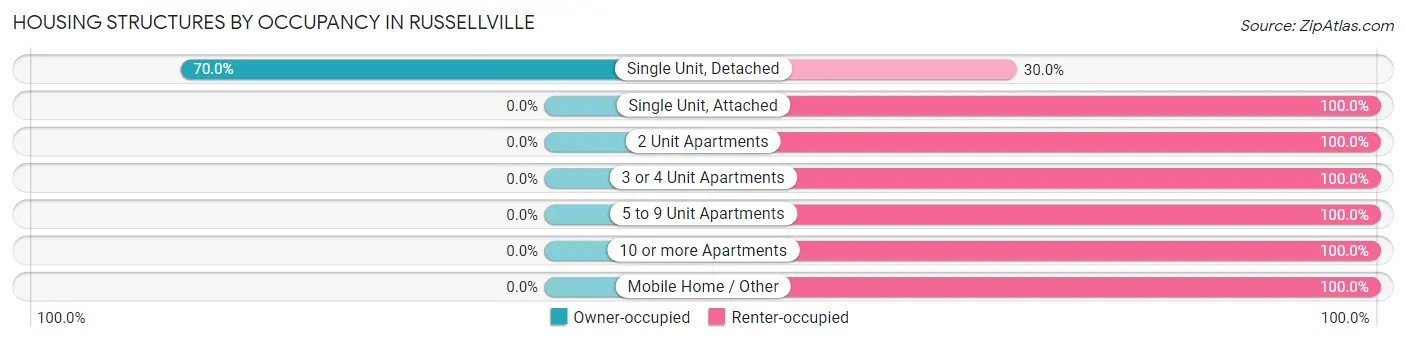
| Structure Type | Owner-occupied | Renter-occupied |
| Single Unit, Detached | 1,480 (70.0%) | 634 (30.0%) |
| Single Unit, Attached | 0 (0.0%) | 28 (100.0%) |
| 2 Unit Apartments | 0 (0.0%) | 383 (100.0%) |
| 3 or 4 Unit Apartments | 0 (0.0%) | 262 (100.0%) |
| 5 to 9 Unit Apartments | 0 (0.0%) | 103 (100.0%) |
| 10 or more Apartments | 0 (0.0%) | 64 (100.0%) |
| Mobile Home / Other | 0 (0.0%) | 49 (100.0%) |
| Total | 1,480 (49.3%) | 1,523 (50.7%) |
Housing Structures by Number of Rooms in Russellville
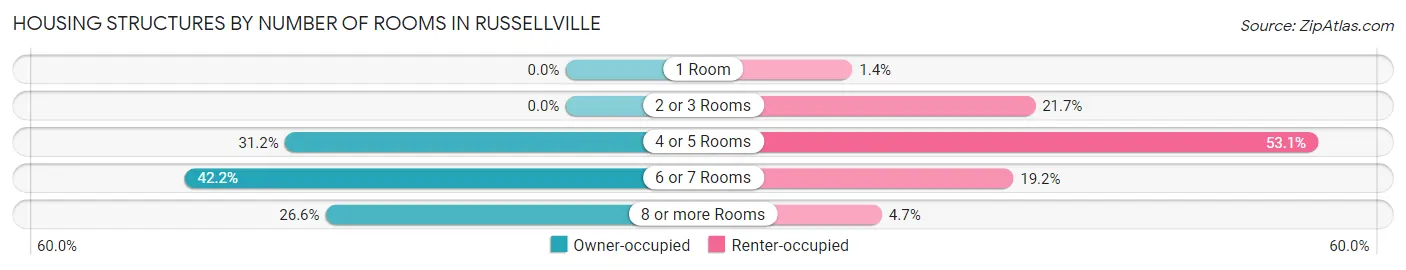
| Number of Rooms | Owner-occupied | Renter-occupied |
| 1 Room | 0 (0.0%) | 21 (1.4%) |
| 2 or 3 Rooms | 0 (0.0%) | 330 (21.7%) |
| 4 or 5 Rooms | 461 (31.1%) | 808 (53.0%) |
| 6 or 7 Rooms | 625 (42.2%) | 293 (19.2%) |
| 8 or more Rooms | 394 (26.6%) | 71 (4.7%) |
| Total | 1,480 (100.0%) | 1,523 (100.0%) |
Housing Structure by Heating Type in Russellville
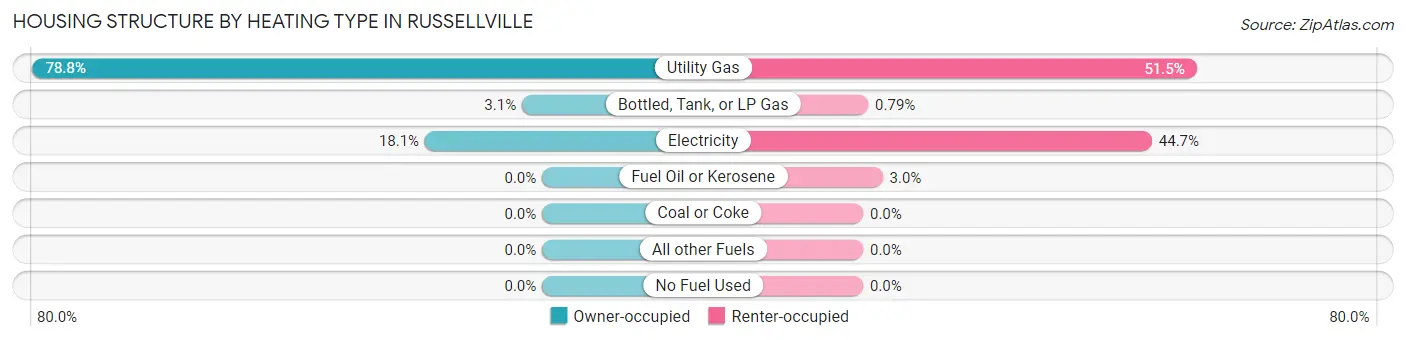
| Heating Type | Owner-occupied | Renter-occupied |
| Utility Gas | 1,166 (78.8%) | 785 (51.5%) |
| Bottled, Tank, or LP Gas | 46 (3.1%) | 12 (0.8%) |
| Electricity | 268 (18.1%) | 680 (44.7%) |
| Fuel Oil or Kerosene | 0 (0.0%) | 46 (3.0%) |
| Coal or Coke | 0 (0.0%) | 0 (0.0%) |
| All other Fuels | 0 (0.0%) | 0 (0.0%) |
| No Fuel Used | 0 (0.0%) | 0 (0.0%) |
| Total | 1,480 (100.0%) | 1,523 (100.0%) |
Household Vehicle Usage in Russellville
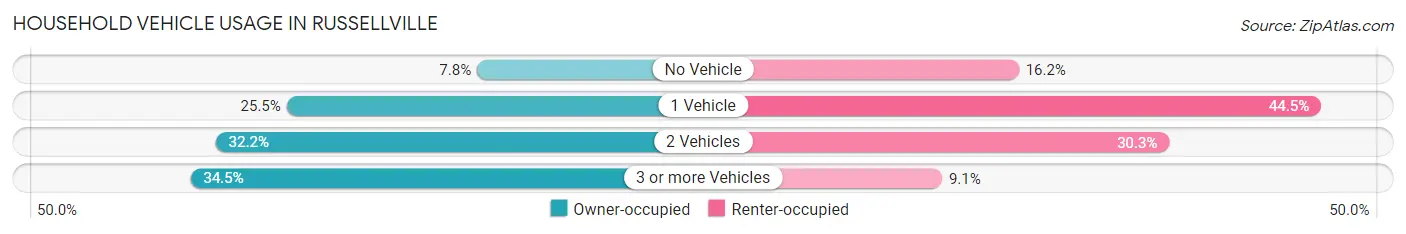
| Vehicles per Household | Owner-occupied | Renter-occupied |
| No Vehicle | 115 (7.8%) | 247 (16.2%) |
| 1 Vehicle | 378 (25.5%) | 677 (44.5%) |
| 2 Vehicles | 476 (32.2%) | 461 (30.3%) |
| 3 or more Vehicles | 511 (34.5%) | 138 (9.1%) |
| Total | 1,480 (100.0%) | 1,523 (100.0%) |
Real Estate & Mortgages in Russellville
Real Estate and Mortgage Overview in Russellville
| Characteristic | Without Mortgage | With Mortgage |
| Housing Units | 682 | 798 |
| Median Property Value | $103,300 | $138,400 |
| Median Household Income | $57,105 | $73 |
| Monthly Housing Costs | $444 | $13 |
| Real Estate Taxes | $811 | $37 |
Property Value by Mortgage Status in Russellville
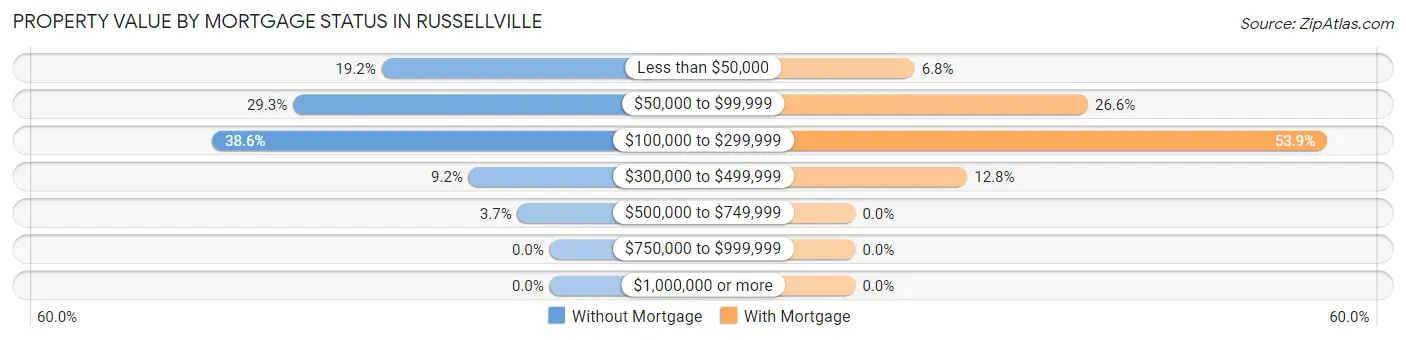
| Property Value | Without Mortgage | With Mortgage |
| Less than $50,000 | 131 (19.2%) | 54 (6.8%) |
| $50,000 to $99,999 | 200 (29.3%) | 212 (26.6%) |
| $100,000 to $299,999 | 263 (38.6%) | 430 (53.9%) |
| $300,000 to $499,999 | 63 (9.2%) | 102 (12.8%) |
| $500,000 to $749,999 | 25 (3.7%) | 0 (0.0%) |
| $750,000 to $999,999 | 0 (0.0%) | 0 (0.0%) |
| $1,000,000 or more | 0 (0.0%) | 0 (0.0%) |
| Total | 682 (100.0%) | 798 (100.0%) |
Household Income by Mortgage Status in Russellville
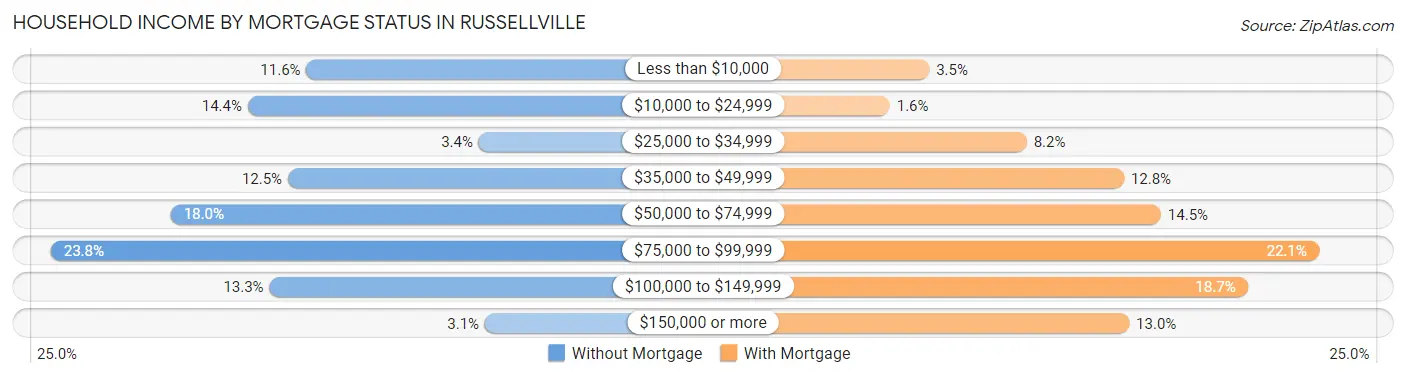
| Household Income | Without Mortgage | With Mortgage |
| Less than $10,000 | 79 (11.6%) | 28 (3.5%) |
| $10,000 to $24,999 | 98 (14.4%) | 13 (1.6%) |
| $25,000 to $34,999 | 23 (3.4%) | 65 (8.2%) |
| $35,000 to $49,999 | 85 (12.5%) | 102 (12.8%) |
| $50,000 to $74,999 | 123 (18.0%) | 116 (14.5%) |
| $75,000 to $99,999 | 162 (23.7%) | 176 (22.1%) |
| $100,000 to $149,999 | 91 (13.3%) | 149 (18.7%) |
| $150,000 or more | 21 (3.1%) | 104 (13.0%) |
| Total | 682 (100.0%) | 798 (100.0%) |
Property Value to Household Income Ratio in Russellville
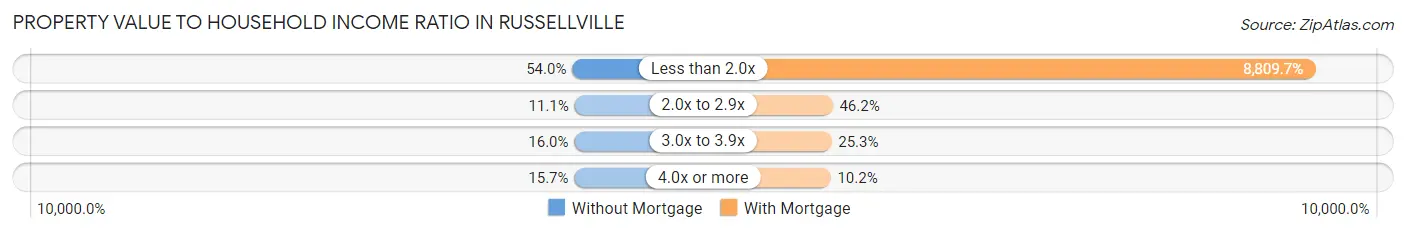
| Value-to-Income Ratio | Without Mortgage | With Mortgage |
| Less than 2.0x | 368 (54.0%) | 70,301 (8,809.7%) |
| 2.0x to 2.9x | 76 (11.1%) | 369 (46.2%) |
| 3.0x to 3.9x | 109 (16.0%) | 202 (25.3%) |
| 4.0x or more | 107 (15.7%) | 81 (10.2%) |
| Total | 682 (100.0%) | 798 (100.0%) |
Real Estate Taxes by Mortgage Status in Russellville
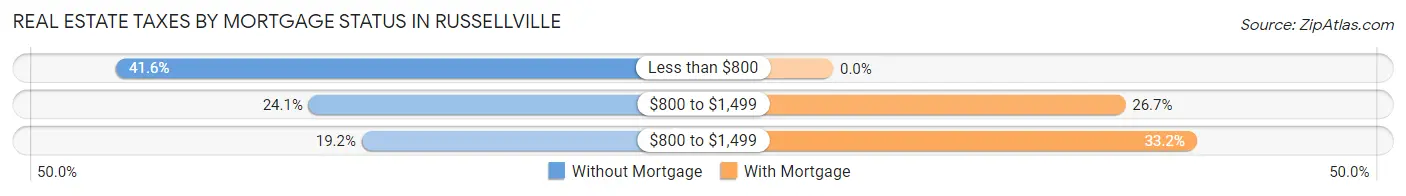
| Property Taxes | Without Mortgage | With Mortgage |
| Less than $800 | 284 (41.6%) | 0 (0.0%) |
| $800 to $1,499 | 164 (24.0%) | 213 (26.7%) |
| $800 to $1,499 | 131 (19.2%) | 265 (33.2%) |
| Total | 682 (100.0%) | 798 (100.0%) |
Health & Disability in Russellville
Health Insurance Coverage by Age in Russellville
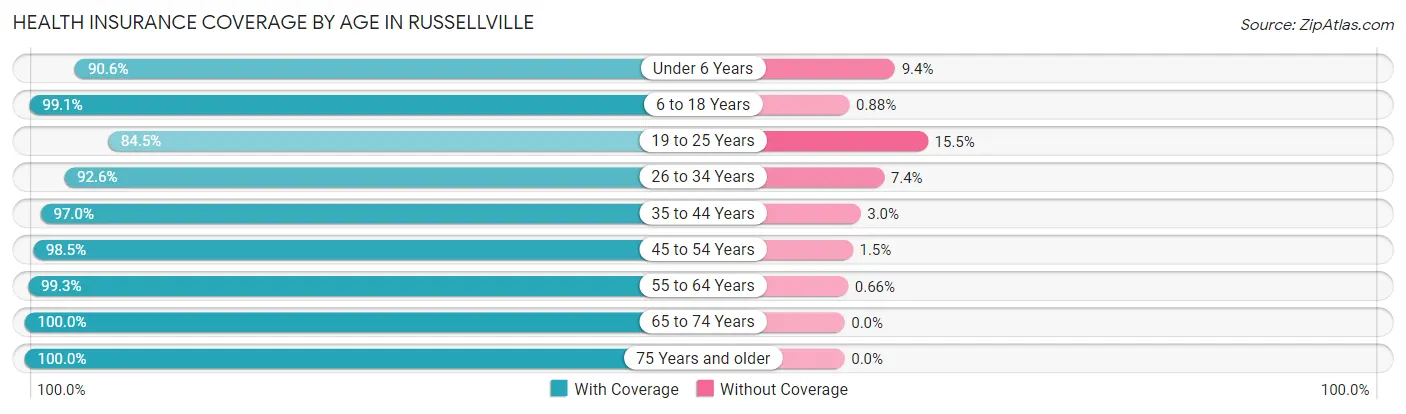
| Age Bracket | With Coverage | Without Coverage |
| Under 6 Years | 405 (90.6%) | 42 (9.4%) |
| 6 to 18 Years | 1,569 (99.1%) | 14 (0.9%) |
| 19 to 25 Years | 326 (84.5%) | 60 (15.5%) |
| 26 to 34 Years | 766 (92.6%) | 61 (7.4%) |
| 35 to 44 Years | 814 (97.0%) | 25 (3.0%) |
| 45 to 54 Years | 645 (98.5%) | 10 (1.5%) |
| 55 to 64 Years | 755 (99.3%) | 5 (0.7%) |
| 65 to 74 Years | 854 (100.0%) | 0 (0.0%) |
| 75 Years and older | 556 (100.0%) | 0 (0.0%) |
| Total | 6,690 (96.9%) | 217 (3.1%) |
Health Insurance Coverage by Citizenship Status in Russellville
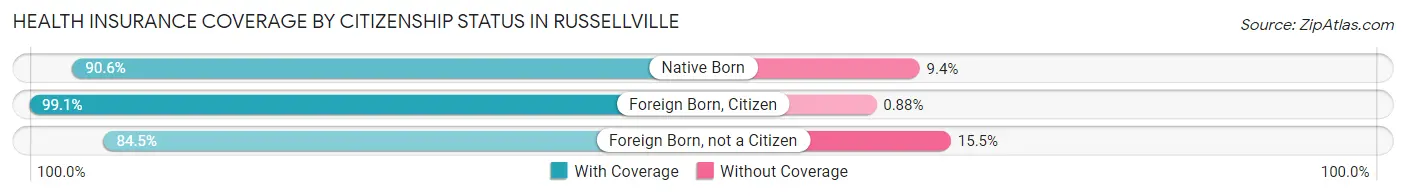
| Citizenship Status | With Coverage | Without Coverage |
| Native Born | 405 (90.6%) | 42 (9.4%) |
| Foreign Born, Citizen | 1,569 (99.1%) | 14 (0.9%) |
| Foreign Born, not a Citizen | 326 (84.5%) | 60 (15.5%) |
Health Insurance Coverage by Household Income in Russellville
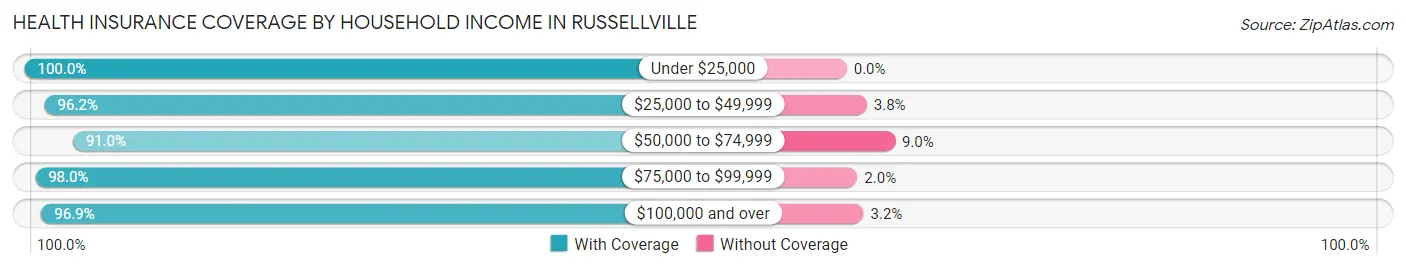
| Household Income | With Coverage | Without Coverage |
| Under $25,000 | 1,865 (100.0%) | 0 (0.0%) |
| $25,000 to $49,999 | 1,407 (96.2%) | 55 (3.8%) |
| $50,000 to $74,999 | 937 (91.0%) | 93 (9.0%) |
| $75,000 to $99,999 | 1,283 (98.0%) | 26 (2.0%) |
| $100,000 and over | 1,170 (96.9%) | 38 (3.2%) |
Public vs Private Health Insurance Coverage by Age in Russellville
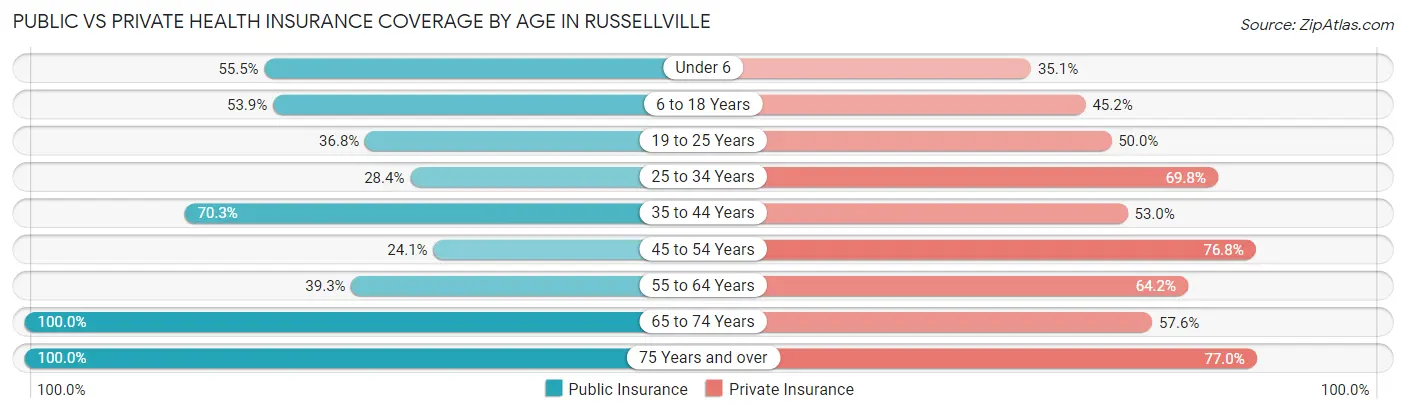
| Age Bracket | Public Insurance | Private Insurance |
| Under 6 | 248 (55.5%) | 157 (35.1%) |
| 6 to 18 Years | 853 (53.9%) | 716 (45.2%) |
| 19 to 25 Years | 142 (36.8%) | 193 (50.0%) |
| 25 to 34 Years | 235 (28.4%) | 577 (69.8%) |
| 35 to 44 Years | 590 (70.3%) | 445 (53.0%) |
| 45 to 54 Years | 158 (24.1%) | 503 (76.8%) |
| 55 to 64 Years | 299 (39.3%) | 488 (64.2%) |
| 65 to 74 Years | 854 (100.0%) | 492 (57.6%) |
| 75 Years and over | 556 (100.0%) | 428 (77.0%) |
| Total | 3,935 (57.0%) | 3,999 (57.9%) |
Disability Status by Sex by Age in Russellville
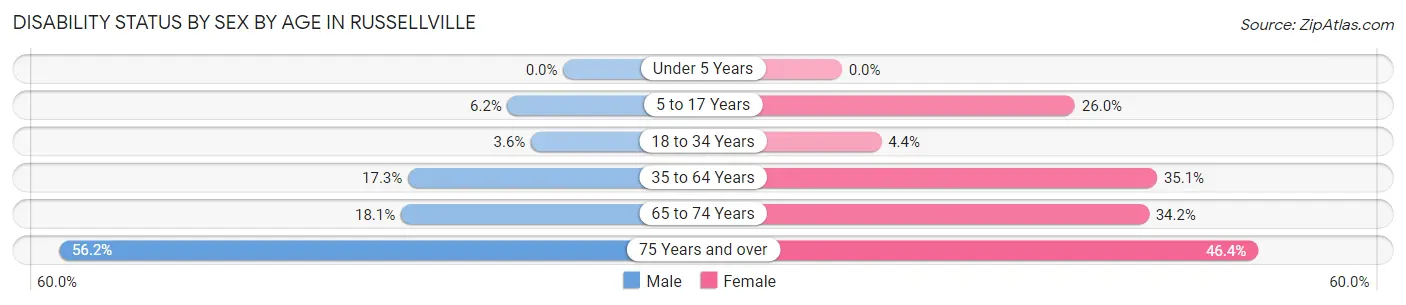
| Age Bracket | Male | Female |
| Under 5 Years | 0 (0.0%) | 0 (0.0%) |
| 5 to 17 Years | 38 (6.2%) | 237 (26.0%) |
| 18 to 34 Years | 20 (3.6%) | 32 (4.4%) |
| 35 to 64 Years | 171 (17.3%) | 444 (35.1%) |
| 65 to 74 Years | 47 (18.1%) | 203 (34.2%) |
| 75 Years and over | 173 (56.2%) | 115 (46.4%) |
Disability Class by Sex by Age in Russellville
Disability Class: Hearing Difficulty
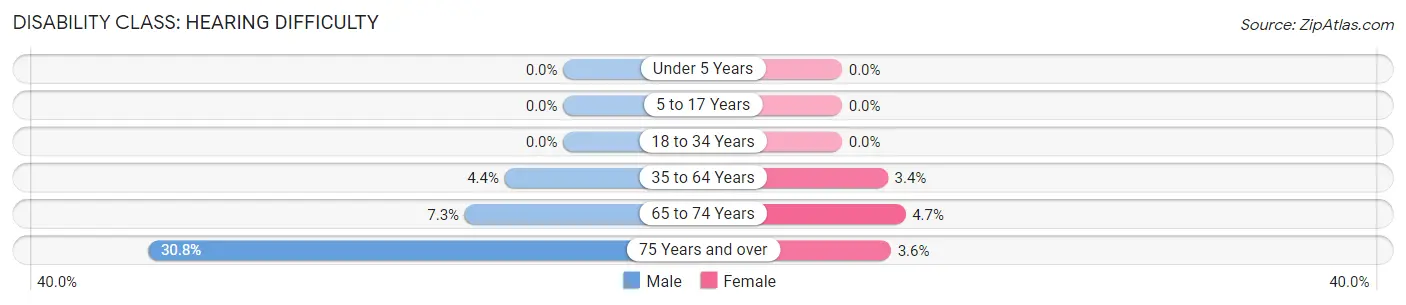
| Age Bracket | Male | Female |
| Under 5 Years | 0 (0.0%) | 0 (0.0%) |
| 5 to 17 Years | 0 (0.0%) | 0 (0.0%) |
| 18 to 34 Years | 0 (0.0%) | 0 (0.0%) |
| 35 to 64 Years | 43 (4.3%) | 43 (3.4%) |
| 65 to 74 Years | 19 (7.3%) | 28 (4.7%) |
| 75 Years and over | 95 (30.8%) | 9 (3.6%) |
Disability Class: Vision Difficulty
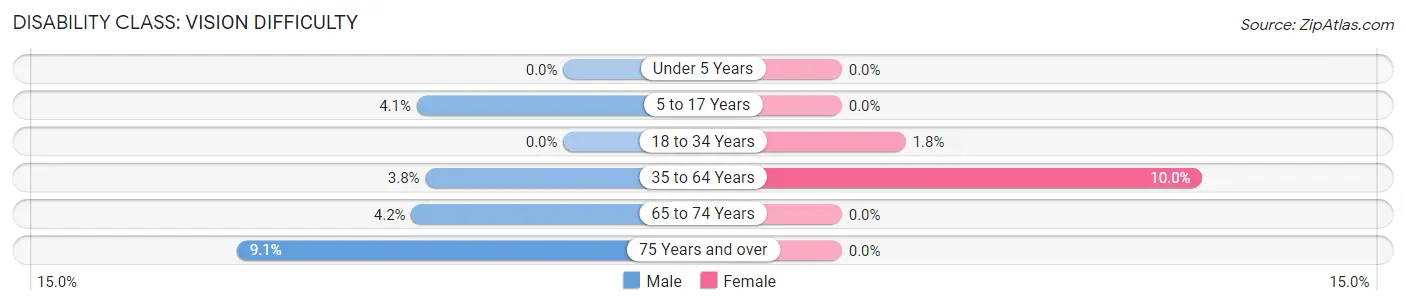
| Age Bracket | Male | Female |
| Under 5 Years | 0 (0.0%) | 0 (0.0%) |
| 5 to 17 Years | 25 (4.1%) | 0 (0.0%) |
| 18 to 34 Years | 0 (0.0%) | 13 (1.8%) |
| 35 to 64 Years | 38 (3.8%) | 127 (10.0%) |
| 65 to 74 Years | 11 (4.2%) | 0 (0.0%) |
| 75 Years and over | 28 (9.1%) | 0 (0.0%) |
Disability Class: Cognitive Difficulty
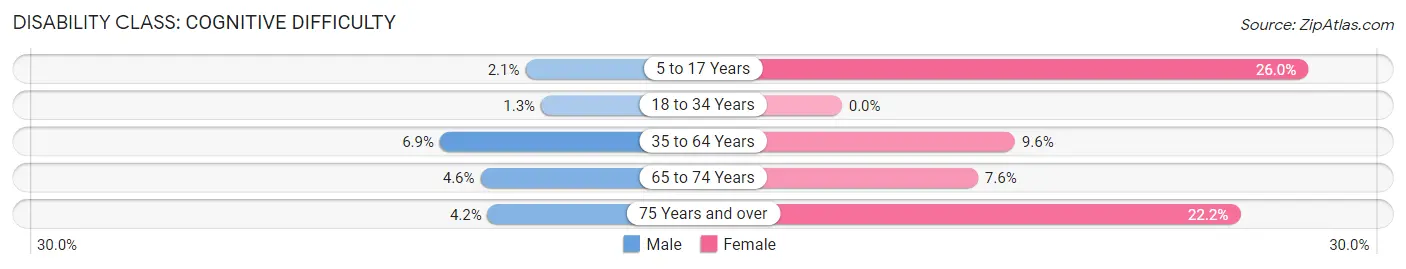
| Age Bracket | Male | Female |
| 5 to 17 Years | 13 (2.1%) | 237 (26.0%) |
| 18 to 34 Years | 7 (1.3%) | 0 (0.0%) |
| 35 to 64 Years | 68 (6.9%) | 122 (9.6%) |
| 65 to 74 Years | 12 (4.6%) | 45 (7.6%) |
| 75 Years and over | 13 (4.2%) | 55 (22.2%) |
Disability Class: Ambulatory Difficulty
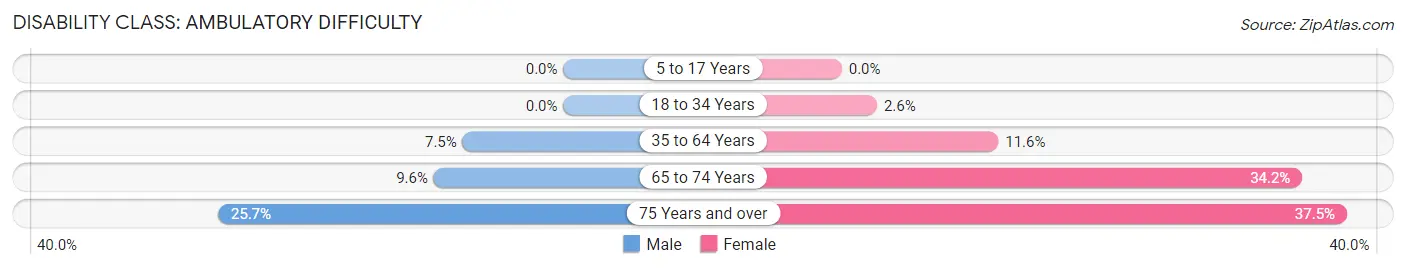
| Age Bracket | Male | Female |
| 5 to 17 Years | 0 (0.0%) | 0 (0.0%) |
| 18 to 34 Years | 0 (0.0%) | 19 (2.6%) |
| 35 to 64 Years | 74 (7.5%) | 147 (11.6%) |
| 65 to 74 Years | 25 (9.6%) | 203 (34.2%) |
| 75 Years and over | 79 (25.7%) | 93 (37.5%) |
Disability Class: Self-Care Difficulty
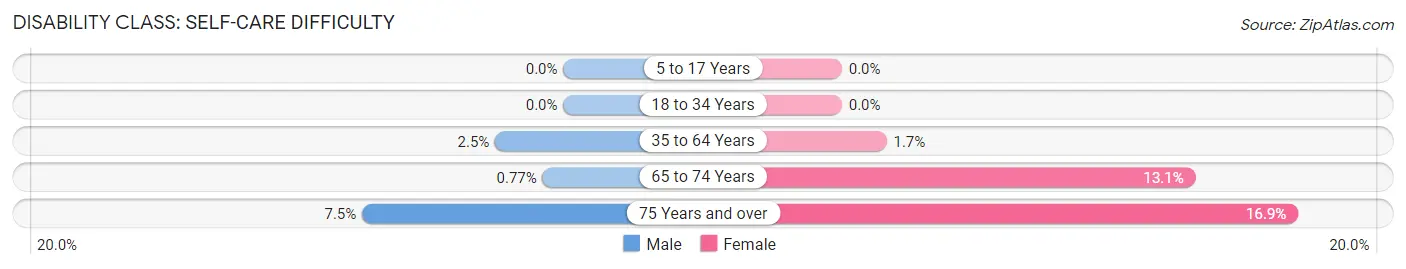
| Age Bracket | Male | Female |
| 5 to 17 Years | 0 (0.0%) | 0 (0.0%) |
| 18 to 34 Years | 0 (0.0%) | 0 (0.0%) |
| 35 to 64 Years | 25 (2.5%) | 21 (1.7%) |
| 65 to 74 Years | 2 (0.8%) | 78 (13.1%) |
| 75 Years and over | 23 (7.5%) | 42 (16.9%) |
Technology Access in Russellville
Computing Device Access in Russellville
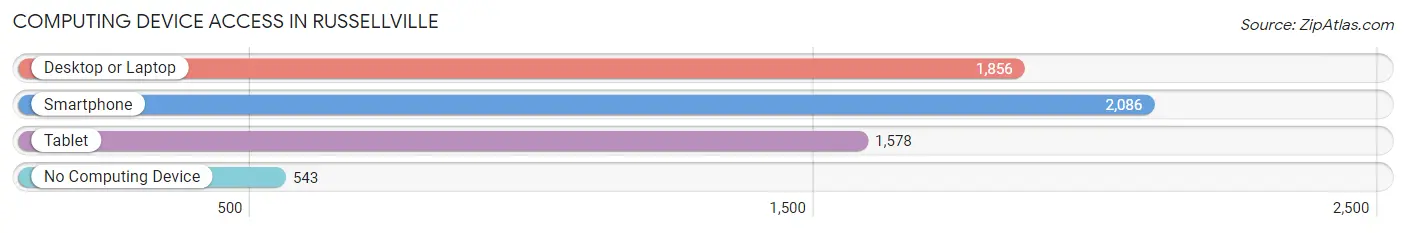
| Device Type | # Households | % Households |
| Desktop or Laptop | 1,856 | 61.8% |
| Smartphone | 2,086 | 69.5% |
| Tablet | 1,578 | 52.5% |
| No Computing Device | 543 | 18.1% |
| Total | 3,003 | 100.0% |
Internet Access in Russellville
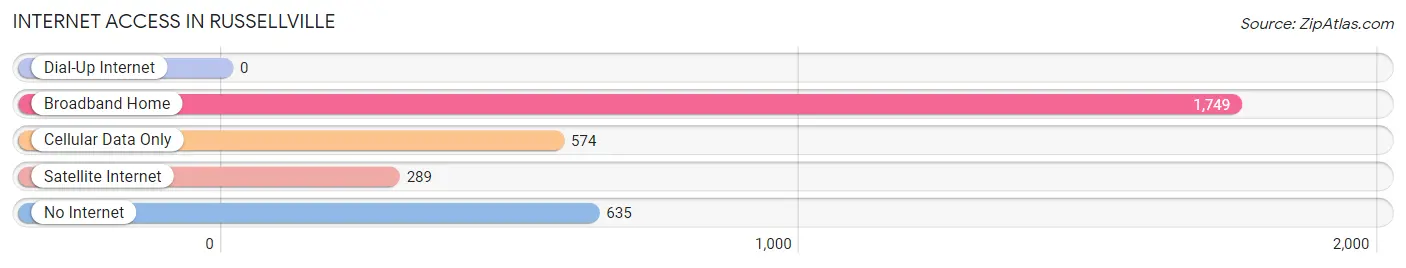
| Internet Type | # Households | % Households |
| Dial-Up Internet | 0 | 0.0% |
| Broadband Home | 1,749 | 58.2% |
| Cellular Data Only | 574 | 19.1% |
| Satellite Internet | 289 | 9.6% |
| No Internet | 635 | 21.1% |
| Total | 3,003 | 100.0% |
Russellville Summary
Introduction
Russellville is a city located in Logan County, Kentucky, United States. It is the county seat of Logan County and is located along the banks of the Green River. The city has a population of 7,719 as of the 2010 census. It is part of the Bowling Green metropolitan area.
History
The area that is now Russellville was first settled in the early 1800s by a group of settlers from Virginia. The town was originally known as Logan Court House, and was later renamed Russellville in honor of William Russell, a prominent local politician. The town was officially incorporated in 1820.
In the late 1800s, Russellville was a major center for the tobacco industry. The town was home to several tobacco warehouses and factories, and was a major hub for the sale and distribution of tobacco products.
In the early 1900s, the town began to experience a period of growth and development. The town was home to several businesses, including a bank, a hotel, a newspaper, and a movie theater. The town also had a public library and a hospital.
Geography
Russellville is located in Logan County, Kentucky, United States. It is situated along the banks of the Green River, and is located about 30 miles north of Bowling Green. The city has a total area of 4.2 square miles, all of which is land.
The city has a humid subtropical climate, with hot, humid summers and mild winters. The average annual temperature is around 61 degrees Fahrenheit, and the average annual precipitation is around 45 inches.
Economy
The economy of Russellville is largely based on agriculture and manufacturing. The city is home to several large agricultural operations, including a large poultry farm and a large dairy farm. The city is also home to several manufacturing companies, including a furniture factory and a plastics factory.
The city is also home to several retail stores, restaurants, and other businesses. The city is home to a large shopping mall, as well as several smaller shopping centers.
Demographics
As of the 2010 census, the population of Russellville was 7,719. The racial makeup of the city was 87.3% White, 8.7% African American, 0.3% Native American, 0.7% Asian, 0.1% Pacific Islander, and 2.9% from other races. Hispanic or Latino of any race were 3.2% of the population.
The median household income in Russellville was $37,945, and the median family income was $45,938. The per capita income for the city was $19,945. About 16.3% of the population was below the poverty line.
Conclusion
Russellville is a city located in Logan County, Kentucky, United States. It is the county seat of Logan County and is located along the banks of the Green River. The city has a population of 7,719 as of the 2010 census. The economy of Russellville is largely based on agriculture and manufacturing, and the city is home to several retail stores, restaurants, and other businesses. The racial makeup of the city was 87.3% White, 8.7% African American, 0.3% Native American, 0.7% Asian, 0.1% Pacific Islander, and 2.9% from other races. The median household income in Russellville was $37,945, and the median family income was $45,938.
Common Questions
What is Per Capita Income in Russellville?
Per Capita income in Russellville is $22,996.
What is the Median Family Income in Russellville?
Median Family Income in Russellville is $57,363.
What is the Median Household income in Russellville?
Median Household Income in Russellville is $45,484.
What is Income or Wage Gap in Russellville?
Income or Wage Gap in Russellville is 32.9%.
Women in Russellville earn 67.1 cents for every dollar earned by a man.
What is Inequality or Gini Index in Russellville?
Inequality or Gini Index in Russellville is 0.43.
What is the Total Population of Russellville?
Total Population of Russellville is 7,186.
What is the Total Male Population of Russellville?
Total Male Population of Russellville is 3,104.
What is the Total Female Population of Russellville?
Total Female Population of Russellville is 4,082.
What is the Ratio of Males per 100 Females in Russellville?
There are 76.04 Males per 100 Females in Russellville.
What is the Ratio of Females per 100 Males in Russellville?
There are 131.51 Females per 100 Males in Russellville.
What is the Median Population Age in Russellville?
Median Population Age in Russellville is 35.9 Years.
What is the Average Family Size in Russellville
Average Family Size in Russellville is 2.9 People.
What is the Average Household Size in Russellville
Average Household Size in Russellville is 2.3 People.
How Large is the Labor Force in Russellville?
There are 3,052 People in the Labor Forcein in Russellville.
What is the Percentage of People in the Labor Force in Russellville?
56.4% of People are in the Labor Force in Russellville.
What is the Unemployment Rate in Russellville?
Unemployment Rate in Russellville is 9.2%.