Beechwood Village, KY Map & Demographics
Beechwood Village Map
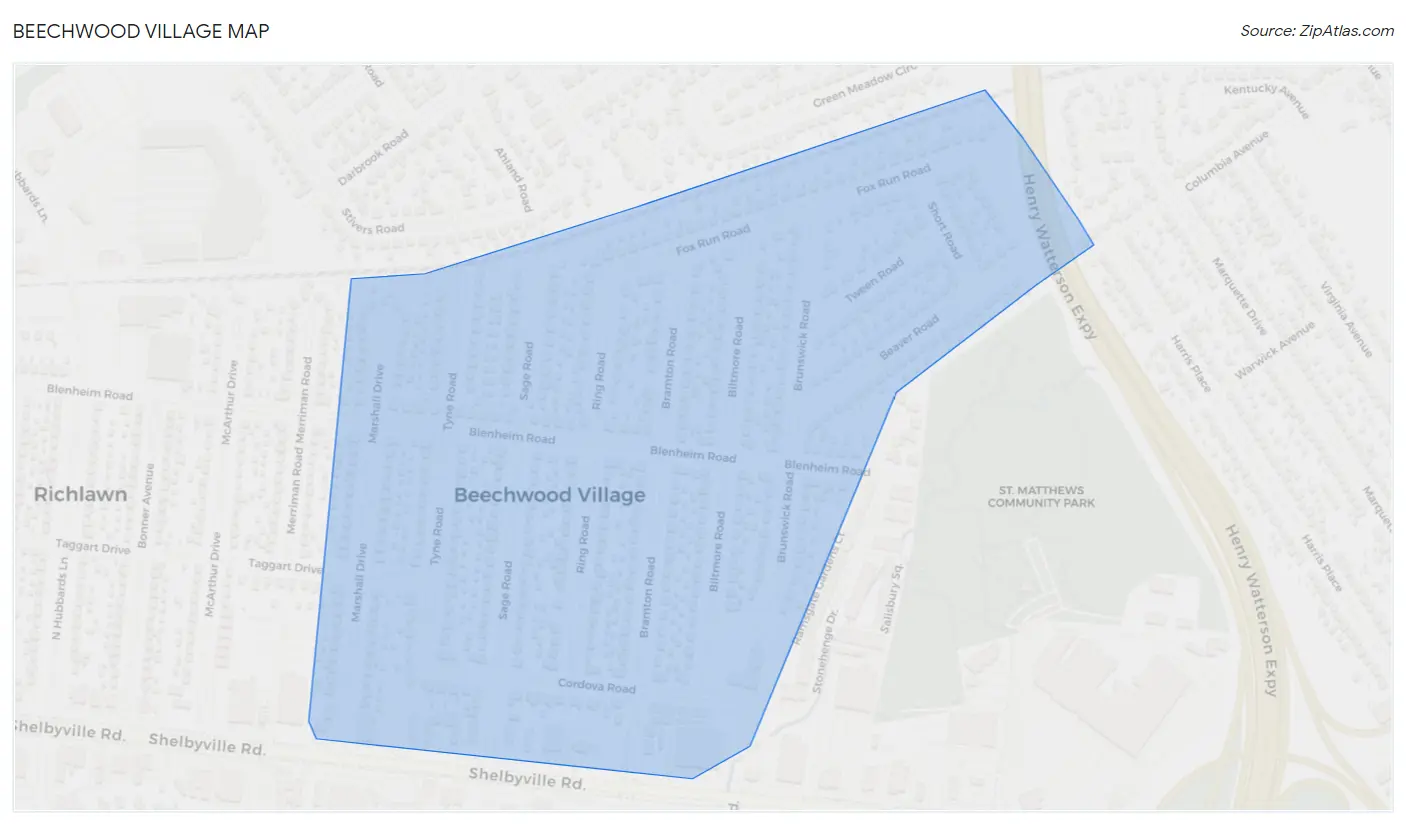
Beechwood Village Overview
$69,927
PER CAPITA INCOME
$146,184
AVG FAMILY INCOME
$114,375
AVG HOUSEHOLD INCOME
17.2%
WAGE / INCOME GAP [ % ]
82.8¢/ $1
WAGE / INCOME GAP [ $ ]
0.51
INEQUALITY / GINI INDEX
1,302
TOTAL POPULATION
542
MALE POPULATION
760
FEMALE POPULATION
71.32
MALES / 100 FEMALES
140.22
FEMALES / 100 MALES
38.4
MEDIAN AGE
2.9
AVG FAMILY SIZE
2.3
AVG HOUSEHOLD SIZE
700
LABOR FORCE [ PEOPLE ]
70.9%
PERCENT IN LABOR FORCE
2.7%
UNEMPLOYMENT RATE
Income in Beechwood Village
Income Overview in Beechwood Village
Per Capita Income in Beechwood Village is $69,927, while median incomes of families and households are $146,184 and $114,375 respectively.
| Characteristic | Number | Measure |
| Per Capita Income | 1,302 | $69,927 |
| Median Family Income | 356 | $146,184 |
| Mean Family Income | 356 | $211,900 |
| Median Household Income | 566 | $114,375 |
| Mean Household Income | 566 | $162,371 |
| Income Deficit | 356 | $0 |
| Wage / Income Gap (%) | 1,302 | 17.19% |
| Wage / Income Gap ($) | 1,302 | 82.81¢ per $1 |
| Gini / Inequality Index | 1,302 | 0.51 |
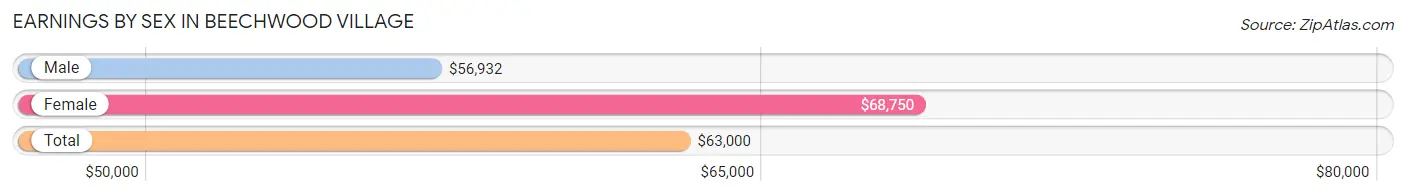
Earnings by Sex in Beechwood Village
Average Earnings in Beechwood Village are $63,000, $56,932 for men and $68,750 for women, a difference of 17.2%.
| Sex | Number | Average Earnings |
| Male | 363 (48.4%) | $56,932 |
| Female | 387 (51.6%) | $68,750 |
| Total | 750 (100.0%) | $63,000 |
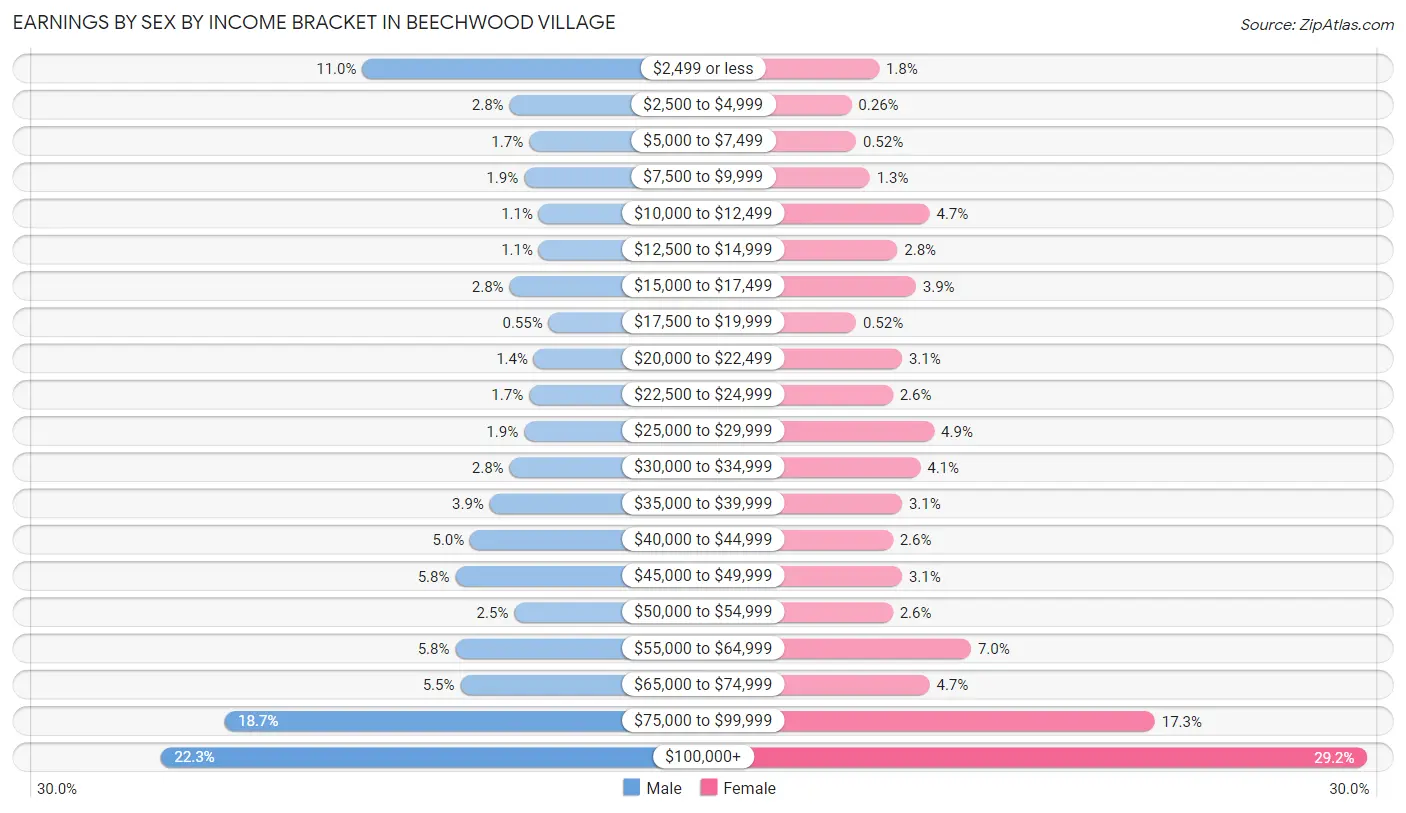
Earnings by Sex by Income Bracket in Beechwood Village
The most common earnings brackets in Beechwood Village are $100,000+ for men (81 | 22.3%) and $100,000+ for women (113 | 29.2%).
| Income | Male | Female |
| $2,499 or less | 40 (11.0%) | 7 (1.8%) |
| $2,500 to $4,999 | 10 (2.8%) | 1 (0.3%) |
| $5,000 to $7,499 | 6 (1.7%) | 2 (0.5%) |
| $7,500 to $9,999 | 7 (1.9%) | 5 (1.3%) |
| $10,000 to $12,499 | 4 (1.1%) | 18 (4.6%) |
| $12,500 to $14,999 | 4 (1.1%) | 11 (2.8%) |
| $15,000 to $17,499 | 10 (2.8%) | 15 (3.9%) |
| $17,500 to $19,999 | 2 (0.5%) | 2 (0.5%) |
| $20,000 to $22,499 | 5 (1.4%) | 12 (3.1%) |
| $22,500 to $24,999 | 6 (1.7%) | 10 (2.6%) |
| $25,000 to $29,999 | 7 (1.9%) | 19 (4.9%) |
| $30,000 to $34,999 | 10 (2.8%) | 16 (4.1%) |
| $35,000 to $39,999 | 14 (3.9%) | 12 (3.1%) |
| $40,000 to $44,999 | 18 (5.0%) | 10 (2.6%) |
| $45,000 to $49,999 | 21 (5.8%) | 12 (3.1%) |
| $50,000 to $54,999 | 9 (2.5%) | 10 (2.6%) |
| $55,000 to $64,999 | 21 (5.8%) | 27 (7.0%) |
| $65,000 to $74,999 | 20 (5.5%) | 18 (4.6%) |
| $75,000 to $99,999 | 68 (18.7%) | 67 (17.3%) |
| $100,000+ | 81 (22.3%) | 113 (29.2%) |
| Total | 363 (100.0%) | 387 (100.0%) |
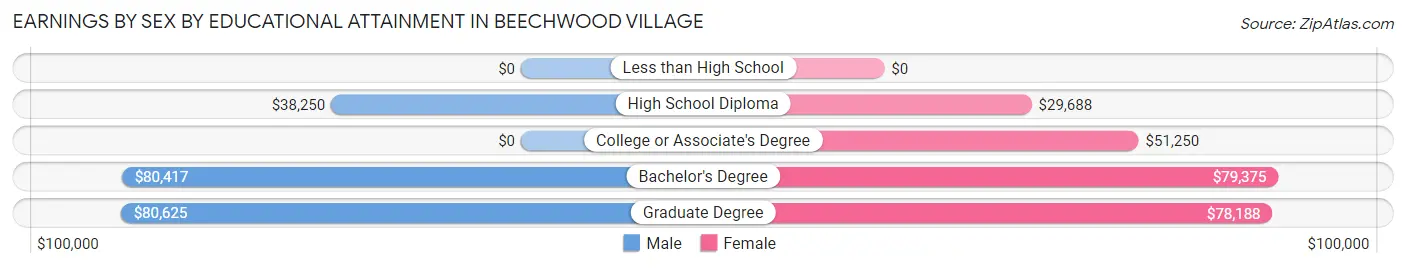
Earnings by Sex by Educational Attainment in Beechwood Village
Average earnings in Beechwood Village are $58,750 for men and $74,861 for women, a difference of 21.5%. Men with an educational attainment of graduate degree enjoy the highest average annual earnings of $80,625, while those with high school diploma education earn the least with $38,250. Women with an educational attainment of bachelor's degree earn the most with the average annual earnings of $79,375, while those with high school diploma education have the smallest earnings of $29,688.
| Educational Attainment | Male Income | Female Income |
| Less than High School | - | - |
| High School Diploma | $38,250 | $29,688 |
| College or Associate's Degree | - | - |
| Bachelor's Degree | $80,417 | $79,375 |
| Graduate Degree | $80,625 | $78,188 |
| Total | $58,750 | $74,861 |
Family Income in Beechwood Village
Family Income Brackets in Beechwood Village
According to the Beechwood Village family income data, there are 117 families falling into the $200,000+ income range, which is the most common income bracket and makes up 32.9% of all families.
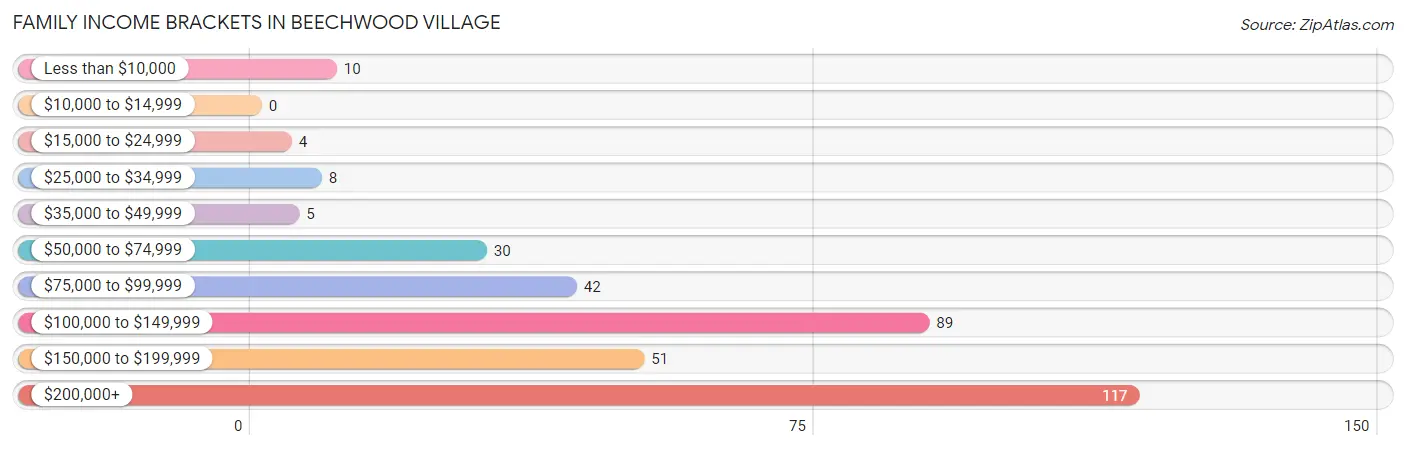
| Income Bracket | # Families | % Families |
| Less than $10,000 | 10 | 2.8% |
| $10,000 to $14,999 | 0 | 0.0% |
| $15,000 to $24,999 | 4 | 1.1% |
| $25,000 to $34,999 | 8 | 2.2% |
| $35,000 to $49,999 | 5 | 1.4% |
| $50,000 to $74,999 | 30 | 8.4% |
| $75,000 to $99,999 | 42 | 11.8% |
| $100,000 to $149,999 | 89 | 25.0% |
| $150,000 to $199,999 | 51 | 14.3% |
| $200,000+ | 117 | 32.9% |
Family Income by Famaliy Size in Beechwood Village
5-person families (19 | 5.3%) account for the highest median family income in Beechwood Village with $250,001 per family, while 2-person families (216 | 60.7%) have the highest median income of $67,188 per family member.
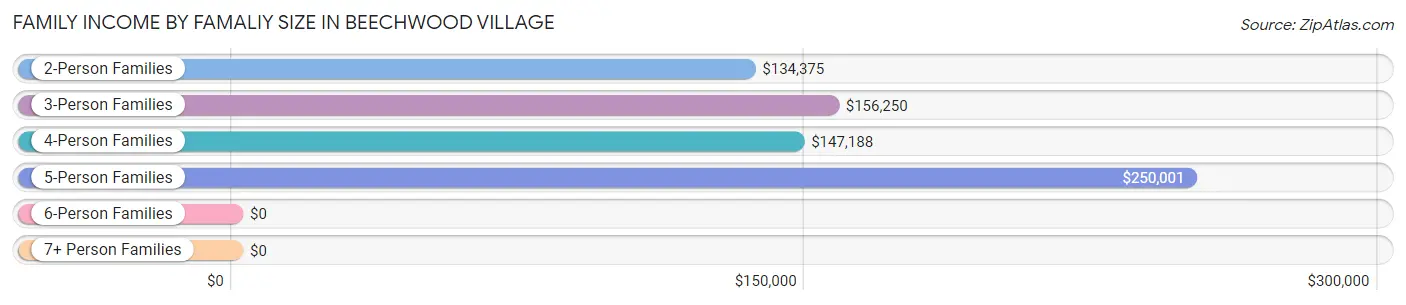
| Income Bracket | # Families | Median Income |
| 2-Person Families | 216 (60.7%) | $134,375 |
| 3-Person Families | 68 (19.1%) | $156,250 |
| 4-Person Families | 51 (14.3%) | $147,188 |
| 5-Person Families | 19 (5.3%) | $250,001 |
| 6-Person Families | 2 (0.6%) | $0 |
| 7+ Person Families | 0 (0.0%) | $0 |
| Total | 356 (100.0%) | $146,184 |
Family Income by Number of Earners in Beechwood Village
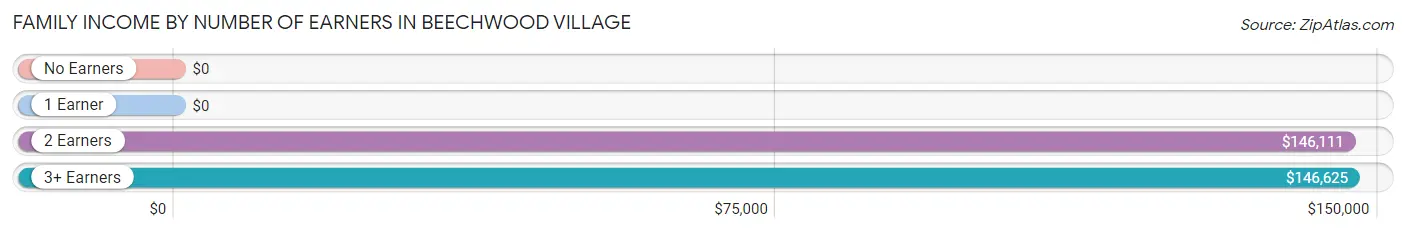
| Number of Earners | # Families | Median Income |
| No Earners | 49 (13.8%) | $0 |
| 1 Earner | 76 (21.3%) | $0 |
| 2 Earners | 196 (55.1%) | $146,111 |
| 3+ Earners | 35 (9.8%) | $146,625 |
| Total | 356 (100.0%) | $146,184 |
Household Income in Beechwood Village
Household Income Brackets in Beechwood Village
With 132 households falling in the category, the $200,000+ income range is the most frequent in Beechwood Village, accounting for 23.3% of all households. In contrast, only 19 households (3.4%) fall into the $10,000 to $14,999 income bracket, making it the least populous group.
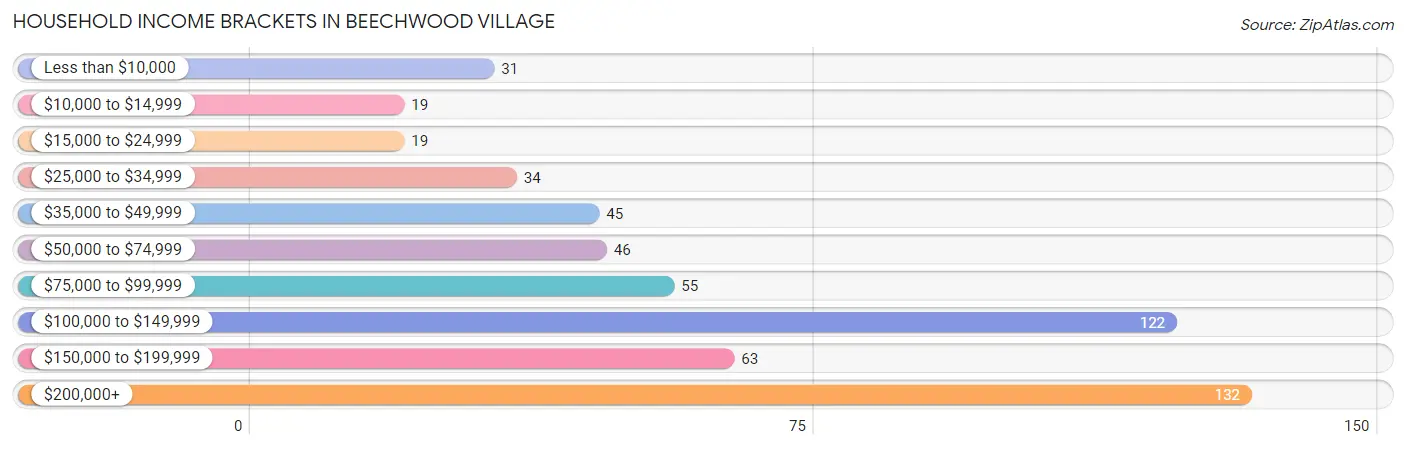
| Income Bracket | # Households | % Households |
| Less than $10,000 | 31 | 5.5% |
| $10,000 to $14,999 | 19 | 3.4% |
| $15,000 to $24,999 | 19 | 3.4% |
| $25,000 to $34,999 | 34 | 6.0% |
| $35,000 to $49,999 | 45 | 8.0% |
| $50,000 to $74,999 | 46 | 8.1% |
| $75,000 to $99,999 | 55 | 9.7% |
| $100,000 to $149,999 | 122 | 21.6% |
| $150,000 to $199,999 | 63 | 11.1% |
| $200,000+ | 132 | 23.3% |
Household Income by Householder Age in Beechwood Village
The median household income in Beechwood Village is $114,375, with the highest median household income of $129,000 found in the 25 to 44 years age bracket for the primary householder. A total of 212 households (37.5%) fall into this category. Meanwhile, the 15 to 24 years age bracket for the primary householder has the lowest median household income of $0, with 8 households (1.4%) in this group.
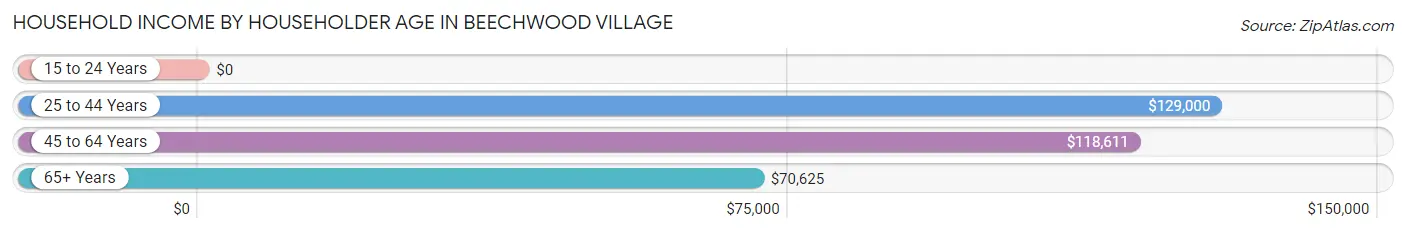
| Income Bracket | # Households | Median Income |
| 15 to 24 Years | 8 (1.4%) | $0 |
| 25 to 44 Years | 212 (37.5%) | $129,000 |
| 45 to 64 Years | 204 (36.0%) | $118,611 |
| 65+ Years | 142 (25.1%) | $70,625 |
| Total | 566 (100.0%) | $114,375 |
Poverty in Beechwood Village
Income Below Poverty by Sex and Age in Beechwood Village
With 6.3% poverty level for males and 7.0% for females among the residents of Beechwood Village, 5 year old males and 6 to 11 year old females are the most vulnerable to poverty, with 6 males (100.0%) and 9 females (32.1%) in their respective age groups living below the poverty level.
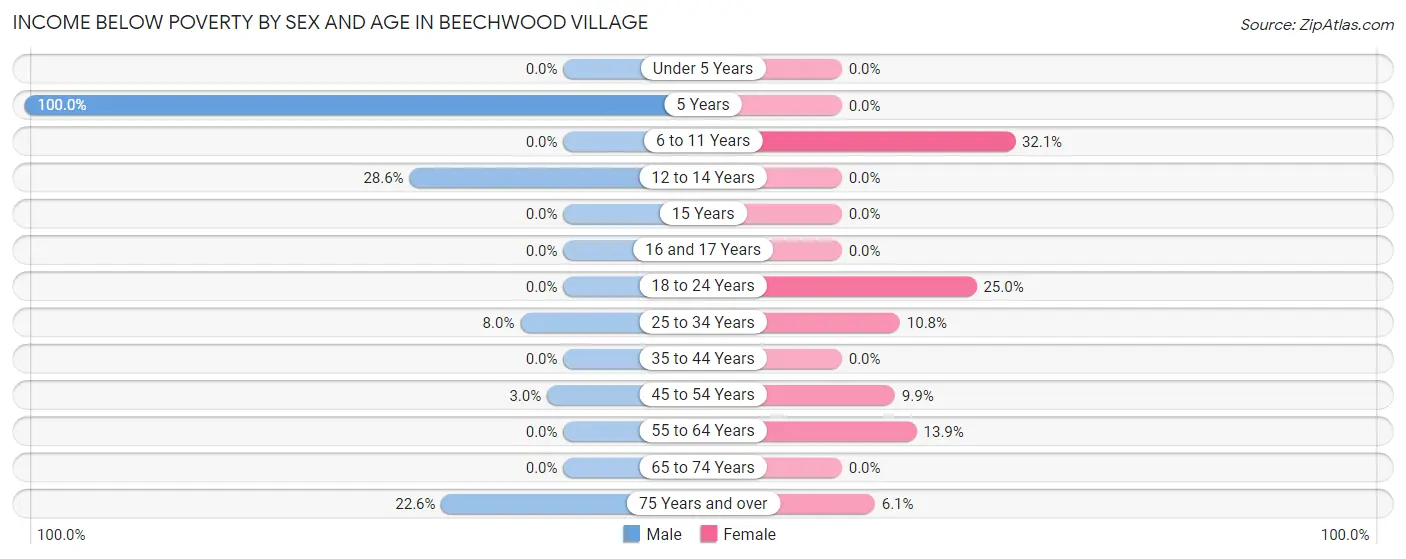
| Age Bracket | Male | Female |
| Under 5 Years | 0 (0.0%) | 0 (0.0%) |
| 5 Years | 6 (100.0%) | 0 (0.0%) |
| 6 to 11 Years | 0 (0.0%) | 9 (32.1%) |
| 12 to 14 Years | 4 (28.6%) | 0 (0.0%) |
| 15 Years | 0 (0.0%) | 0 (0.0%) |
| 16 and 17 Years | 0 (0.0%) | 0 (0.0%) |
| 18 to 24 Years | 0 (0.0%) | 8 (25.0%) |
| 25 to 34 Years | 10 (8.0%) | 11 (10.8%) |
| 35 to 44 Years | 0 (0.0%) | 0 (0.0%) |
| 45 to 54 Years | 2 (3.0%) | 7 (9.9%) |
| 55 to 64 Years | 0 (0.0%) | 15 (13.9%) |
| 65 to 74 Years | 0 (0.0%) | 0 (0.0%) |
| 75 Years and over | 12 (22.6%) | 3 (6.1%) |
| Total | 34 (6.3%) | 53 (7.0%) |
Income Above Poverty by Sex and Age in Beechwood Village
According to the poverty statistics in Beechwood Village, males aged under 5 years and females aged under 5 years are the age groups that are most secure financially, with 100.0% of males and 100.0% of females in these age groups living above the poverty line.
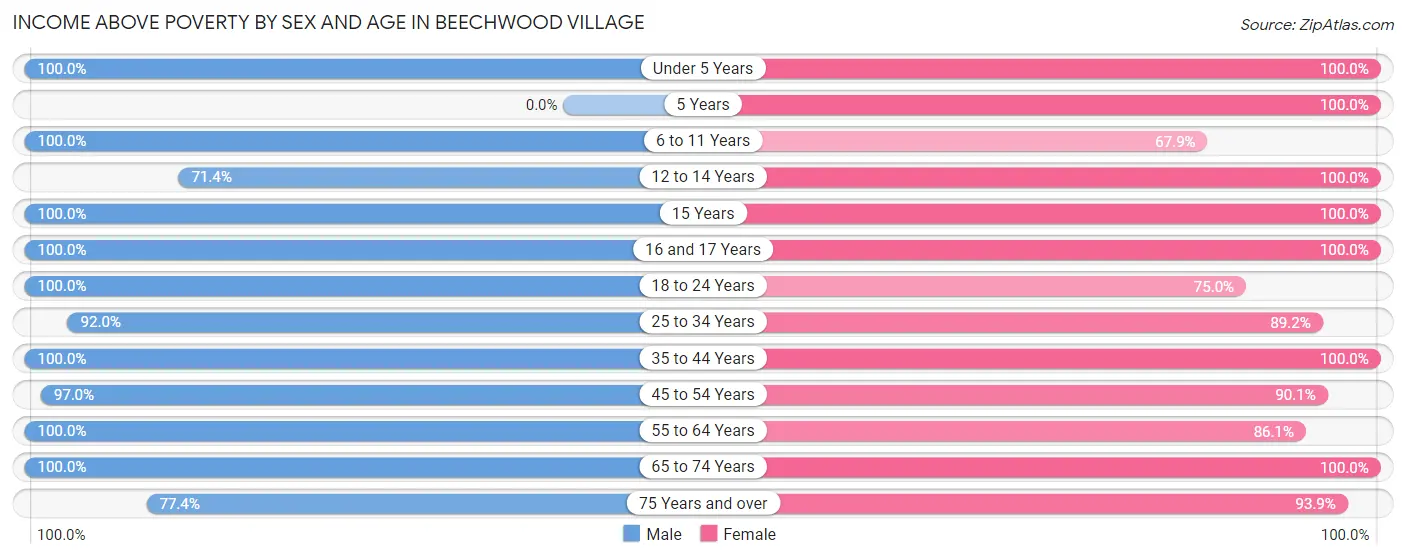
| Age Bracket | Male | Female |
| Under 5 Years | 25 (100.0%) | 41 (100.0%) |
| 5 Years | 0 (0.0%) | 3 (100.0%) |
| 6 to 11 Years | 29 (100.0%) | 19 (67.9%) |
| 12 to 14 Years | 10 (71.4%) | 19 (100.0%) |
| 15 Years | 3 (100.0%) | 145 (100.0%) |
| 16 and 17 Years | 6 (100.0%) | 5 (100.0%) |
| 18 to 24 Years | 10 (100.0%) | 24 (75.0%) |
| 25 to 34 Years | 115 (92.0%) | 91 (89.2%) |
| 35 to 44 Years | 60 (100.0%) | 97 (100.0%) |
| 45 to 54 Years | 64 (97.0%) | 64 (90.1%) |
| 55 to 64 Years | 95 (100.0%) | 93 (86.1%) |
| 65 to 74 Years | 50 (100.0%) | 58 (100.0%) |
| 75 Years and over | 41 (77.4%) | 46 (93.9%) |
| Total | 508 (93.7%) | 705 (93.0%) |
Income Below Poverty Among Married-Couple Families in Beechwood Village
The poverty statistics for married-couple families in Beechwood Village show that 1.0% or 3 of the total 298 families live below the poverty line. Families with no children have the highest poverty rate of 1.5%, comprising of 3 families. On the other hand, families with 1 or 2 children have the lowest poverty rate of 0.0%, which includes 0 families.
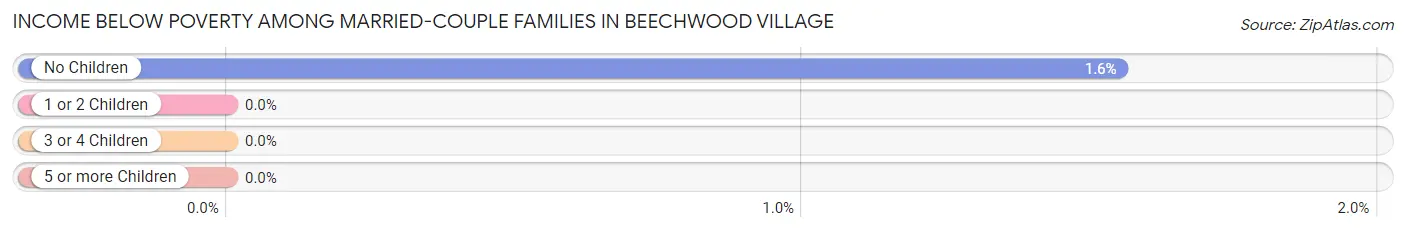
| Children | Above Poverty | Below Poverty |
| No Children | 190 (98.5%) | 3 (1.5%) |
| 1 or 2 Children | 92 (100.0%) | 0 (0.0%) |
| 3 or 4 Children | 13 (100.0%) | 0 (0.0%) |
| 5 or more Children | 0 (0.0%) | 0 (0.0%) |
| Total | 295 (99.0%) | 3 (1.0%) |
Income Below Poverty Among Single-Parent Households in Beechwood Village
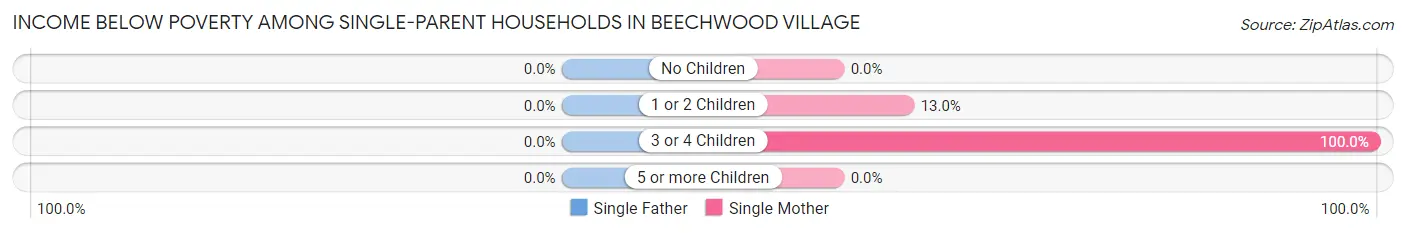
| Children | Single Father | Single Mother |
| No Children | 0 (0.0%) | 0 (0.0%) |
| 1 or 2 Children | 0 (0.0%) | 6 (13.0%) |
| 3 or 4 Children | 0 (0.0%) | 4 (100.0%) |
| 5 or more Children | 0 (0.0%) | 0 (0.0%) |
| Total | 0 (0.0%) | 10 (18.9%) |
Income Below Poverty Among Married-Couple vs Single-Parent Households in Beechwood Village
The poverty data for Beechwood Village shows that 3 of the married-couple family households (1.0%) and 10 of the single-parent households (17.2%) are living below the poverty level. Within the married-couple family households, those with no children have the highest poverty rate, with 3 households (1.5%) falling below the poverty line. Among the single-parent households, those with 3 or 4 children have the highest poverty rate, with 4 household (100.0%) living below poverty.
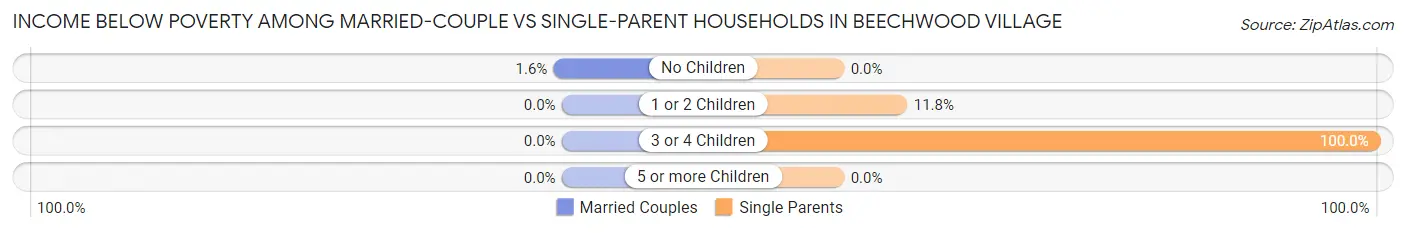
| Children | Married-Couple Families | Single-Parent Households |
| No Children | 3 (1.5%) | 0 (0.0%) |
| 1 or 2 Children | 0 (0.0%) | 6 (11.8%) |
| 3 or 4 Children | 0 (0.0%) | 4 (100.0%) |
| 5 or more Children | 0 (0.0%) | 0 (0.0%) |
| Total | 3 (1.0%) | 10 (17.2%) |
Race in Beechwood Village
The most populous races in Beechwood Village are White / Caucasian (1,037 | 79.6%), Asian (155 | 11.9%), and Two or more Races (78 | 6.0%).
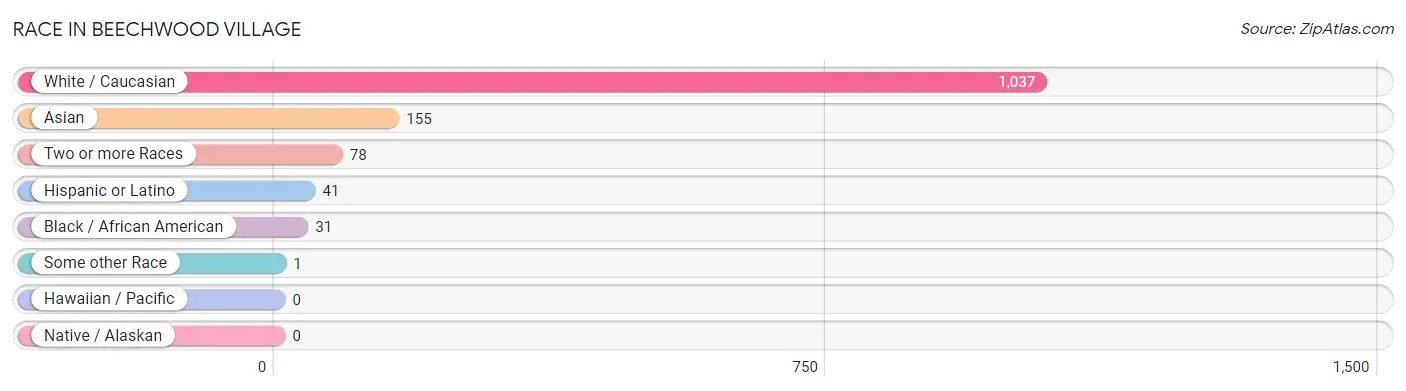
| Race | # Population | % Population |
| Asian | 155 | 11.9% |
| Black / African American | 31 | 2.4% |
| Hawaiian / Pacific | 0 | 0.0% |
| Hispanic or Latino | 41 | 3.2% |
| Native / Alaskan | 0 | 0.0% |
| White / Caucasian | 1,037 | 79.6% |
| Two or more Races | 78 | 6.0% |
| Some other Race | 1 | 0.1% |
| Total | 1,302 | 100.0% |
Ancestry in Beechwood Village
The most populous ancestries reported in Beechwood Village are German (329 | 25.3%), Irish (250 | 19.2%), English (205 | 15.8%), Indian (Asian) (132 | 10.1%), and Italian (46 | 3.5%), together accounting for 73.9% of all Beechwood Village residents.
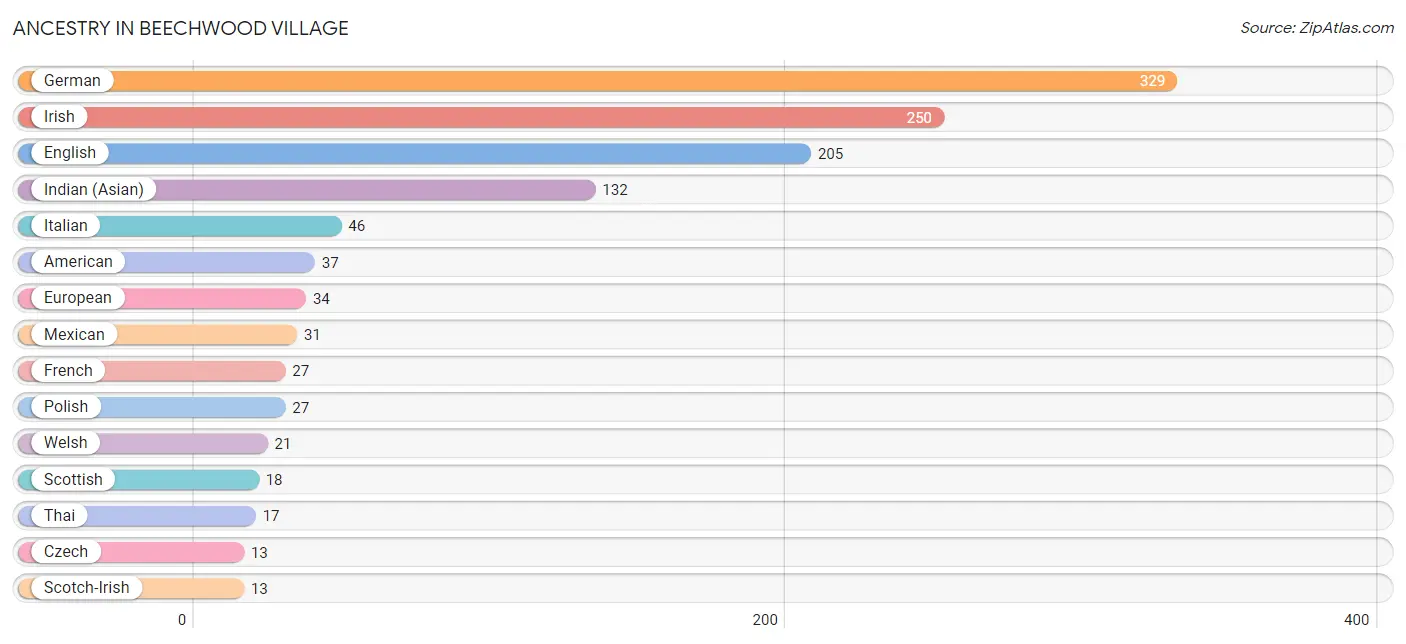
| Ancestry | # Population | % Population |
| American | 37 | 2.8% |
| Arab | 11 | 0.8% |
| British | 4 | 0.3% |
| Central American | 1 | 0.1% |
| Cherokee | 8 | 0.6% |
| Czech | 13 | 1.0% |
| Dutch | 6 | 0.5% |
| Eastern European | 3 | 0.2% |
| English | 205 | 15.8% |
| European | 34 | 2.6% |
| French | 27 | 2.1% |
| German | 329 | 25.3% |
| Guatemalan | 1 | 0.1% |
| Hungarian | 6 | 0.5% |
| Indian (Asian) | 132 | 10.1% |
| Iranian | 2 | 0.2% |
| Irish | 250 | 19.2% |
| Italian | 46 | 3.5% |
| Lebanese | 2 | 0.2% |
| Mexican | 31 | 2.4% |
| Northern European | 5 | 0.4% |
| Polish | 27 | 2.1% |
| Scandinavian | 7 | 0.5% |
| Scotch-Irish | 13 | 1.0% |
| Scottish | 18 | 1.4% |
| Slavic | 4 | 0.3% |
| Spaniard | 9 | 0.7% |
| Sri Lankan | 7 | 0.5% |
| Swedish | 8 | 0.6% |
| Swiss | 13 | 1.0% |
| Thai | 17 | 1.3% |
| Turkish | 3 | 0.2% |
| Ukrainian | 3 | 0.2% |
| Welsh | 21 | 1.6% | View All 34 Rows |
Immigrants in Beechwood Village
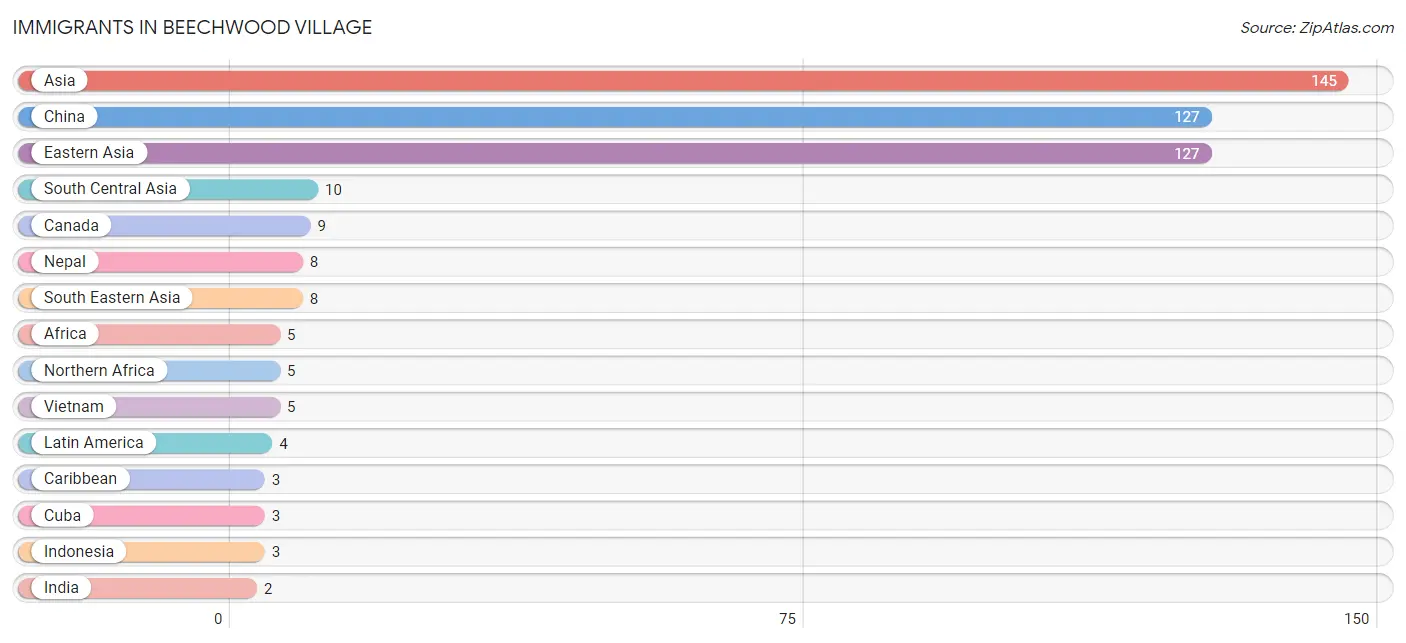
The most numerous immigrant groups reported in Beechwood Village came from Asia (145 | 11.1%), China (127 | 9.8%), Eastern Asia (127 | 9.8%), South Central Asia (10 | 0.8%), and Canada (9 | 0.7%), together accounting for 32.1% of all Beechwood Village residents.
| Immigration Origin | # Population | % Population |
| Africa | 5 | 0.4% |
| Asia | 145 | 11.1% |
| Canada | 9 | 0.7% |
| Caribbean | 3 | 0.2% |
| Central America | 1 | 0.1% |
| China | 127 | 9.8% |
| Cuba | 3 | 0.2% |
| Eastern Asia | 127 | 9.8% |
| Europe | 1 | 0.1% |
| Guatemala | 1 | 0.1% |
| India | 2 | 0.2% |
| Indonesia | 3 | 0.2% |
| Latin America | 4 | 0.3% |
| Nepal | 8 | 0.6% |
| Netherlands | 1 | 0.1% |
| Northern Africa | 5 | 0.4% |
| South Central Asia | 10 | 0.8% |
| South Eastern Asia | 8 | 0.6% |
| Vietnam | 5 | 0.4% |
| Western Europe | 1 | 0.1% | View All 20 Rows |
Sex and Age in Beechwood Village
Sex and Age in Beechwood Village
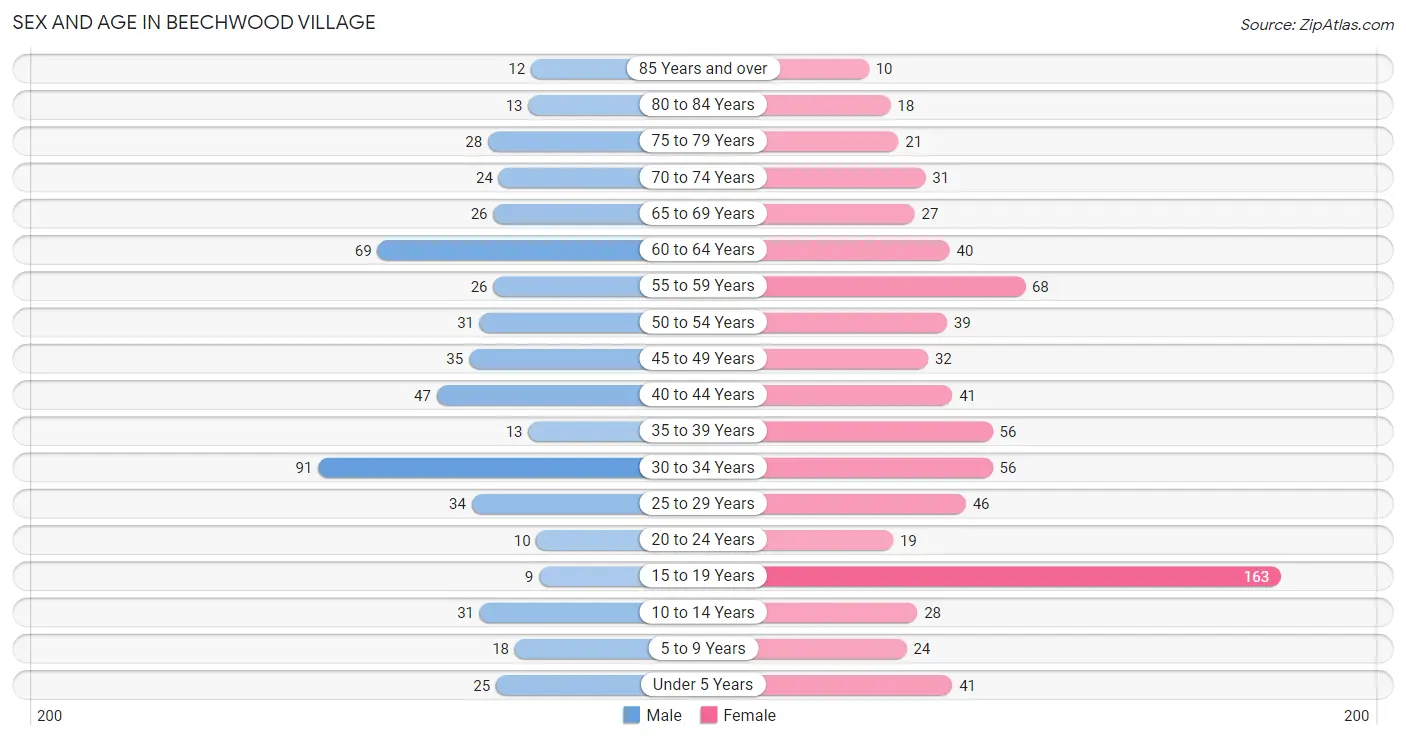
The most populous age groups in Beechwood Village are 30 to 34 Years (91 | 16.8%) for men and 15 to 19 Years (163 | 21.4%) for women.
| Age Bracket | Male | Female |
| Under 5 Years | 25 (4.6%) | 41 (5.4%) |
| 5 to 9 Years | 18 (3.3%) | 24 (3.2%) |
| 10 to 14 Years | 31 (5.7%) | 28 (3.7%) |
| 15 to 19 Years | 9 (1.7%) | 163 (21.4%) |
| 20 to 24 Years | 10 (1.8%) | 19 (2.5%) |
| 25 to 29 Years | 34 (6.3%) | 46 (6.0%) |
| 30 to 34 Years | 91 (16.8%) | 56 (7.4%) |
| 35 to 39 Years | 13 (2.4%) | 56 (7.4%) |
| 40 to 44 Years | 47 (8.7%) | 41 (5.4%) |
| 45 to 49 Years | 35 (6.5%) | 32 (4.2%) |
| 50 to 54 Years | 31 (5.7%) | 39 (5.1%) |
| 55 to 59 Years | 26 (4.8%) | 68 (8.9%) |
| 60 to 64 Years | 69 (12.7%) | 40 (5.3%) |
| 65 to 69 Years | 26 (4.8%) | 27 (3.5%) |
| 70 to 74 Years | 24 (4.4%) | 31 (4.1%) |
| 75 to 79 Years | 28 (5.2%) | 21 (2.8%) |
| 80 to 84 Years | 13 (2.4%) | 18 (2.4%) |
| 85 Years and over | 12 (2.2%) | 10 (1.3%) |
| Total | 542 (100.0%) | 760 (100.0%) |
Families and Households in Beechwood Village
Median Family Size in Beechwood Village
The median family size in Beechwood Village is 2.92 persons per family, with single female/mother families (53 | 14.9%) accounting for the largest median family size of 4.06 persons per family. On the other hand, married-couple families (298 | 83.7%) represent the smallest median family size with 2.72 persons per family.

| Family Type | # Families | Family Size |
| Married-Couple | 298 (83.7%) | 2.72 |
| Single Male/Father | 5 (1.4%) | 2.80 |
| Single Female/Mother | 53 (14.9%) | 4.06 |
| Total Families | 356 (100.0%) | 2.92 |
Median Household Size in Beechwood Village
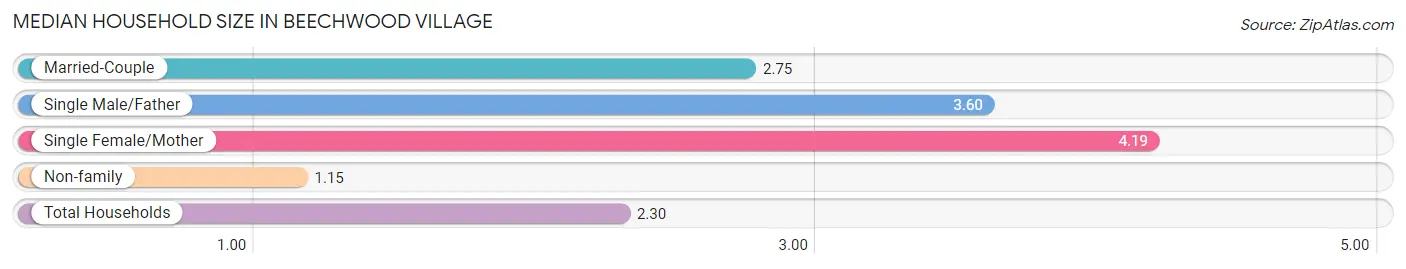
The median household size in Beechwood Village is 2.30 persons per household, with single female/mother households (53 | 9.4%) accounting for the largest median household size of 4.19 persons per household. non-family households (210 | 37.1%) represent the smallest median household size with 1.15 persons per household.
| Household Type | # Households | Household Size |
| Married-Couple | 298 (52.6%) | 2.75 |
| Single Male/Father | 5 (0.9%) | 3.60 |
| Single Female/Mother | 53 (9.4%) | 4.19 |
| Non-family | 210 (37.1%) | 1.15 |
| Total Households | 566 (100.0%) | 2.30 |
Household Size by Marriage Status in Beechwood Village
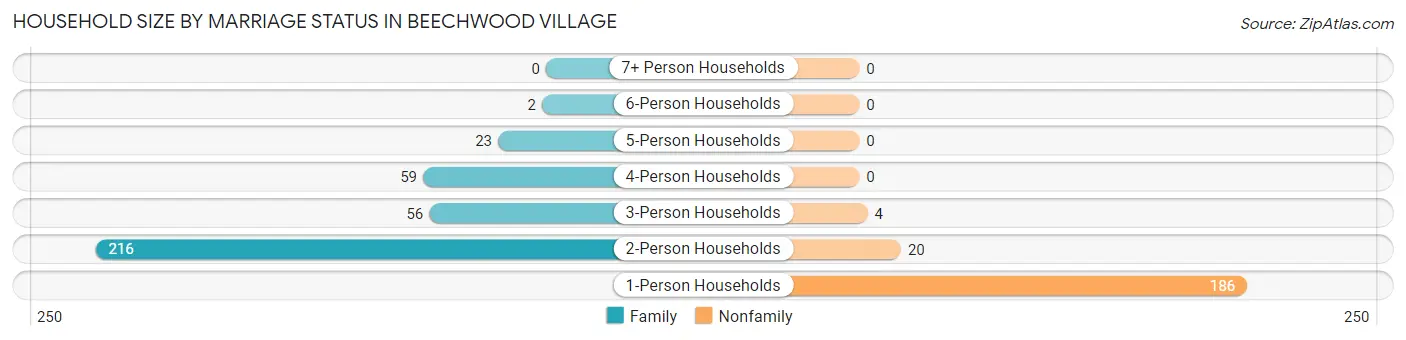
Out of a total of 566 households in Beechwood Village, 356 (62.9%) are family households, while 210 (37.1%) are nonfamily households. The most numerous type of family households are 2-person households, comprising 216, and the most common type of nonfamily households are 1-person households, comprising 186.
| Household Size | Family Households | Nonfamily Households |
| 1-Person Households | - | 186 (32.9%) |
| 2-Person Households | 216 (38.2%) | 20 (3.5%) |
| 3-Person Households | 56 (9.9%) | 4 (0.7%) |
| 4-Person Households | 59 (10.4%) | 0 (0.0%) |
| 5-Person Households | 23 (4.1%) | 0 (0.0%) |
| 6-Person Households | 2 (0.4%) | 0 (0.0%) |
| 7+ Person Households | 0 (0.0%) | 0 (0.0%) |
| Total | 356 (62.9%) | 210 (37.1%) |
Female Fertility in Beechwood Village
Fertility by Age in Beechwood Village
Average fertility rate in Beechwood Village is 31.0 births per 1,000 women. Women in the age bracket of 20 to 34 years have the highest fertility rate with 50.0 births per 1,000 women. Women in the age bracket of 35 to 50 years acount for 53.8% of all women with births.
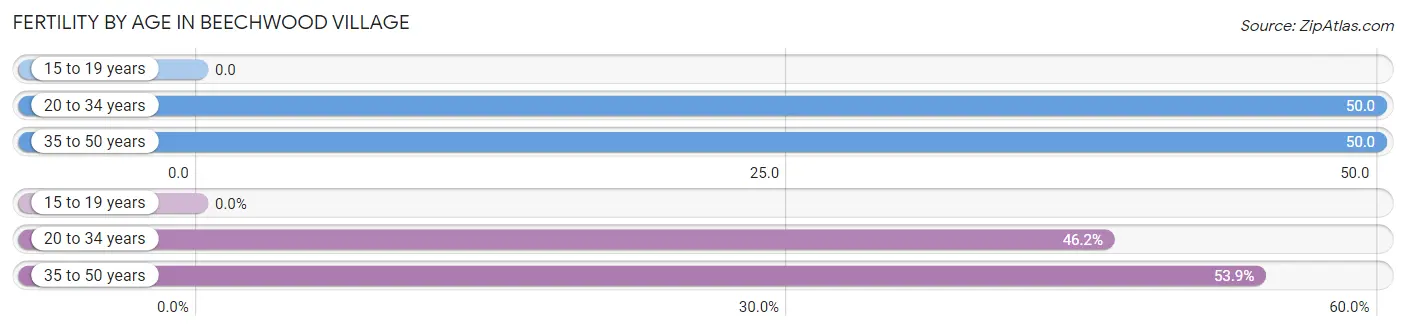
| Age Bracket | Women with Births | Births / 1,000 Women |
| 15 to 19 years | 0 (0.0%) | 0.0 |
| 20 to 34 years | 6 (46.2%) | 50.0 |
| 35 to 50 years | 7 (53.8%) | 50.0 |
| Total | 13 (100.0%) | 31.0 |
Fertility by Age by Marriage Status in Beechwood Village
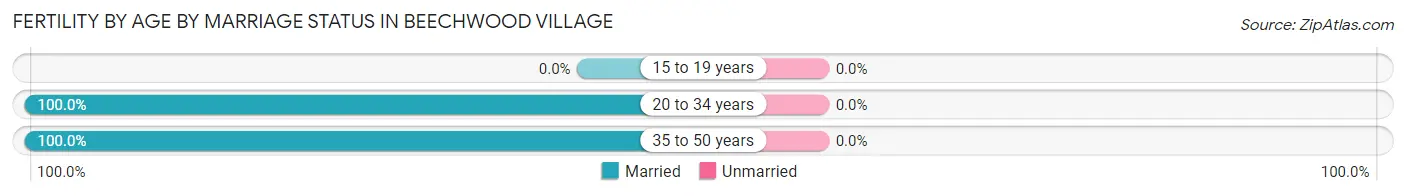
| Age Bracket | Married | Unmarried |
| 15 to 19 years | 0 (0.0%) | 0 (0.0%) |
| 20 to 34 years | 6 (100.0%) | 0 (0.0%) |
| 35 to 50 years | 7 (100.0%) | 0 (0.0%) |
| Total | 13 (100.0%) | 0 (0.0%) |
Fertility by Education in Beechwood Village
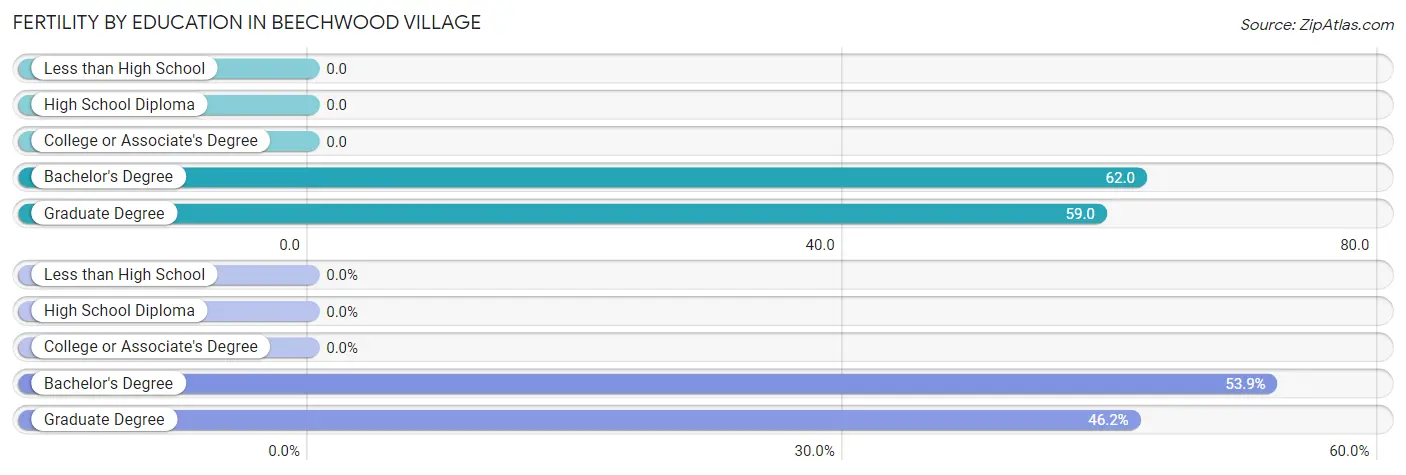
| Educational Attainment | Women with Births | Births / 1,000 Women |
| Less than High School | 0 (0.0%) | 0.0 |
| High School Diploma | 0 (0.0%) | 0.0 |
| College or Associate's Degree | 0 (0.0%) | 0.0 |
| Bachelor's Degree | 7 (53.8%) | 62.0 |
| Graduate Degree | 6 (46.2%) | 59.0 |
| Total | 13 (100.0%) | 31.0 |
Fertility by Education by Marriage Status in Beechwood Village
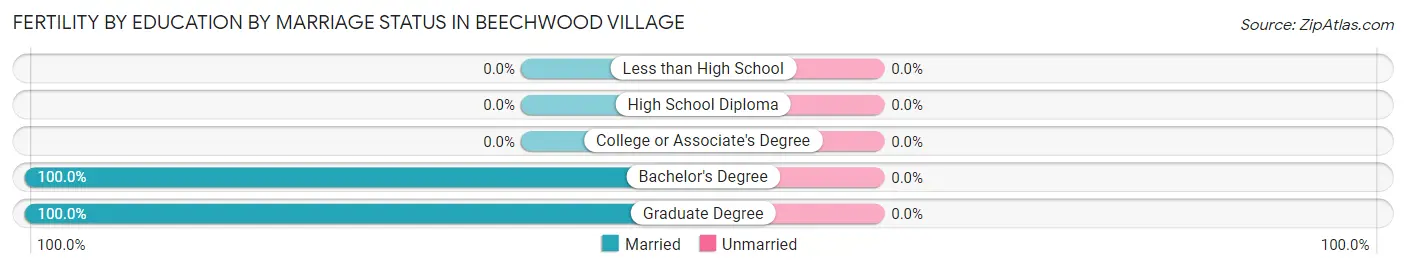
| Educational Attainment | Married | Unmarried |
| Less than High School | 0 (0.0%) | 0 (0.0%) |
| High School Diploma | 0 (0.0%) | 0 (0.0%) |
| College or Associate's Degree | 0 (0.0%) | 0 (0.0%) |
| Bachelor's Degree | 7 (100.0%) | 0 (0.0%) |
| Graduate Degree | 6 (100.0%) | 0 (0.0%) |
| Total | 13 (100.0%) | 0 (0.0%) |
Employment Characteristics in Beechwood Village
Employment by Class of Employer in Beechwood Village
Among the 672 employed individuals in Beechwood Village, private company employees (420 | 62.5%), not-for-profit organizations (101 | 15.0%), and state government employees (48 | 7.1%) make up the most common classes of employment.
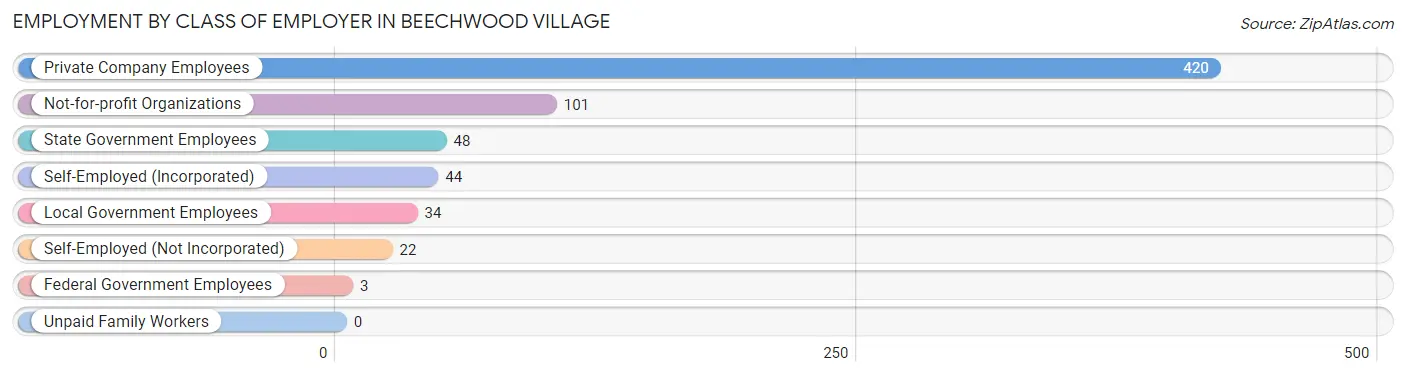
| Employer Class | # Employees | % Employees |
| Private Company Employees | 420 | 62.5% |
| Self-Employed (Incorporated) | 44 | 6.6% |
| Self-Employed (Not Incorporated) | 22 | 3.3% |
| Not-for-profit Organizations | 101 | 15.0% |
| Local Government Employees | 34 | 5.1% |
| State Government Employees | 48 | 7.1% |
| Federal Government Employees | 3 | 0.4% |
| Unpaid Family Workers | 0 | 0.0% |
| Total | 672 | 100.0% |
Employment Status by Age in Beechwood Village
According to the labor force statistics for Beechwood Village, out of the total population over 16 years of age (987), 70.9% or 700 individuals are in the labor force, with 2.7% or 19 of them unemployed. The age group with the highest labor force participation rate is 35 to 44 years, with 98.1% or 154 individuals in the labor force. Within the labor force, the 20 to 24 years age range has the highest percentage of unemployed individuals, with 28.6% or 6 of them being unemployed.
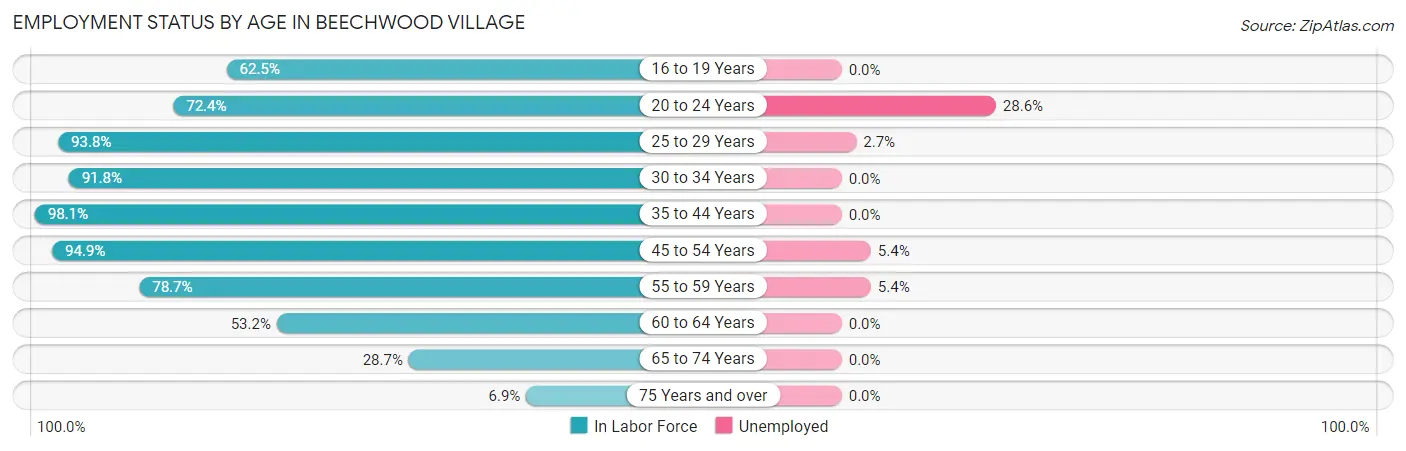
| Age Bracket | In Labor Force | Unemployed |
| 16 to 19 Years | 15 (62.5%) | 0 (0.0%) |
| 20 to 24 Years | 21 (72.4%) | 6 (28.6%) |
| 25 to 29 Years | 75 (93.8%) | 2 (2.7%) |
| 30 to 34 Years | 135 (91.8%) | 0 (0.0%) |
| 35 to 44 Years | 154 (98.1%) | 0 (0.0%) |
| 45 to 54 Years | 130 (94.9%) | 7 (5.4%) |
| 55 to 59 Years | 74 (78.7%) | 4 (5.4%) |
| 60 to 64 Years | 58 (53.2%) | 0 (0.0%) |
| 65 to 74 Years | 31 (28.7%) | 0 (0.0%) |
| 75 Years and over | 7 (6.9%) | 0 (0.0%) |
| Total | 700 (70.9%) | 19 (2.7%) |
Employment Status by Educational Attainment in Beechwood Village
According to labor force statistics for Beechwood Village, 86.5% of individuals (626) out of the total population between 25 and 64 years of age (724) are in the labor force, with 2.1% or 13 of them being unemployed. The group with the highest labor force participation rate are those with the educational attainment of less than high school, with 100.0% or 5 individuals in the labor force. Within the labor force, individuals with high school diploma education have the highest percentage of unemployment, with 14.6% or 7 of them being unemployed.
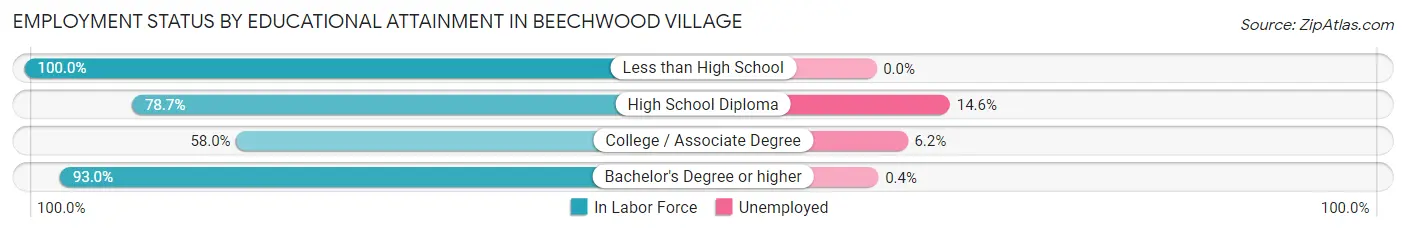
| Educational Attainment | In Labor Force | Unemployed |
| Less than High School | 5 (100.0%) | 0 (0.0%) |
| High School Diploma | 48 (78.7%) | 9 (14.6%) |
| College / Associate Degree | 65 (58.0%) | 7 (6.2%) |
| Bachelor's Degree or higher | 508 (93.0%) | 2 (0.4%) |
| Total | 626 (86.5%) | 15 (2.1%) |
Employment Occupations by Sex in Beechwood Village
Management, Business, Science and Arts Occupations
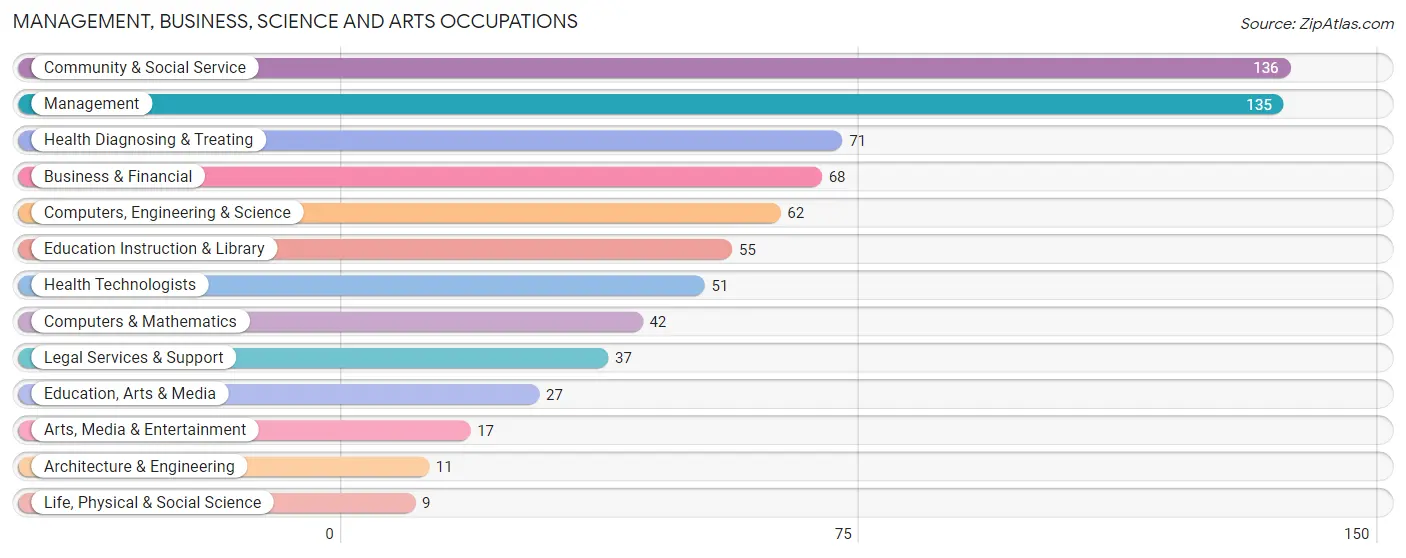
The most common Management, Business, Science and Arts occupations in Beechwood Village are Community & Social Service (136 | 20.0%), Management (135 | 19.8%), Health Diagnosing & Treating (71 | 10.4%), Business & Financial (68 | 10.0%), and Computers, Engineering & Science (62 | 9.1%).
Management, Business, Science and Arts Occupations by Sex
Within the Management, Business, Science and Arts occupations in Beechwood Village, the most male-oriented occupations are Architecture & Engineering (100.0%), Computers, Engineering & Science (77.4%), and Computers & Mathematics (76.2%), while the most female-oriented occupations are Arts, Media & Entertainment (76.5%), Health Diagnosing & Treating (71.8%), and Education Instruction & Library (67.3%).
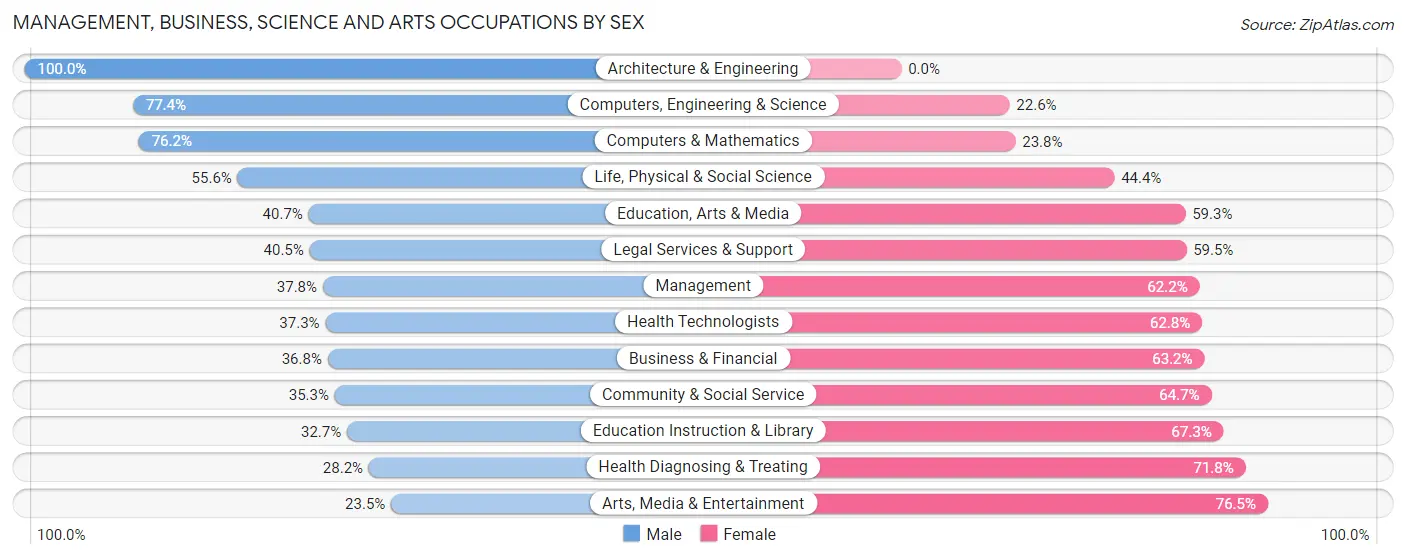
| Occupation | Male | Female |
| Management | 51 (37.8%) | 84 (62.2%) |
| Business & Financial | 25 (36.8%) | 43 (63.2%) |
| Computers, Engineering & Science | 48 (77.4%) | 14 (22.6%) |
| Computers & Mathematics | 32 (76.2%) | 10 (23.8%) |
| Architecture & Engineering | 11 (100.0%) | 0 (0.0%) |
| Life, Physical & Social Science | 5 (55.6%) | 4 (44.4%) |
| Community & Social Service | 48 (35.3%) | 88 (64.7%) |
| Education, Arts & Media | 11 (40.7%) | 16 (59.3%) |
| Legal Services & Support | 15 (40.5%) | 22 (59.5%) |
| Education Instruction & Library | 18 (32.7%) | 37 (67.3%) |
| Arts, Media & Entertainment | 4 (23.5%) | 13 (76.5%) |
| Health Diagnosing & Treating | 20 (28.2%) | 51 (71.8%) |
| Health Technologists | 19 (37.2%) | 32 (62.7%) |
| Total (Category) | 192 (40.7%) | 280 (59.3%) |
| Total (Overall) | 317 (46.6%) | 364 (53.4%) |
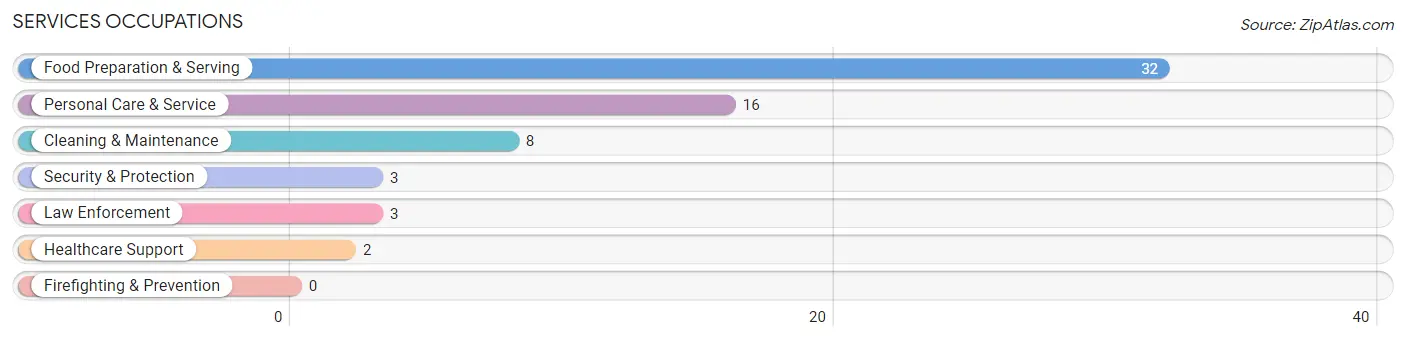
Services Occupations
The most common Services occupations in Beechwood Village are Food Preparation & Serving (32 | 4.7%), Personal Care & Service (16 | 2.4%), Cleaning & Maintenance (8 | 1.2%), Security & Protection (3 | 0.4%), and Law Enforcement (3 | 0.4%).
Services Occupations by Sex
Within the Services occupations in Beechwood Village, the most male-oriented occupations are Security & Protection (100.0%), Law Enforcement (100.0%), and Cleaning & Maintenance (100.0%), while the most female-oriented occupations are Healthcare Support (100.0%), Personal Care & Service (31.2%), and Food Preparation & Serving (9.4%).
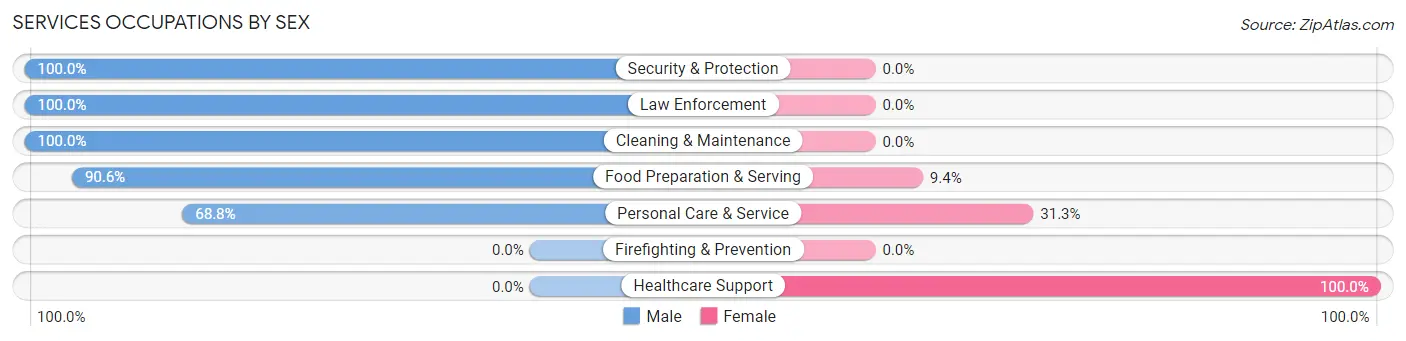
| Occupation | Male | Female |
| Healthcare Support | 0 (0.0%) | 2 (100.0%) |
| Security & Protection | 3 (100.0%) | 0 (0.0%) |
| Firefighting & Prevention | 0 (0.0%) | 0 (0.0%) |
| Law Enforcement | 3 (100.0%) | 0 (0.0%) |
| Food Preparation & Serving | 29 (90.6%) | 3 (9.4%) |
| Cleaning & Maintenance | 8 (100.0%) | 0 (0.0%) |
| Personal Care & Service | 11 (68.8%) | 5 (31.2%) |
| Total (Category) | 51 (83.6%) | 10 (16.4%) |
| Total (Overall) | 317 (46.6%) | 364 (53.4%) |
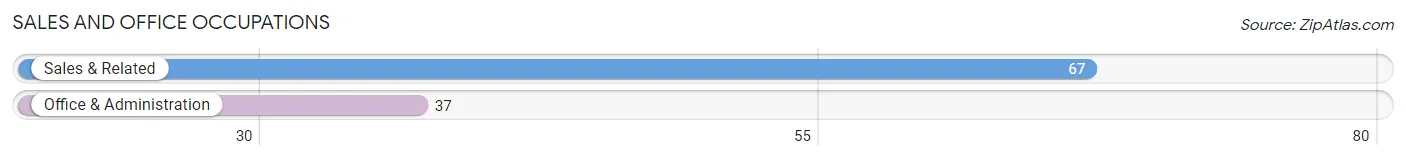
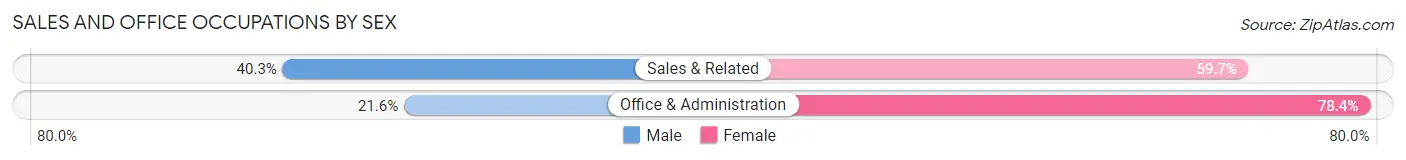
Sales and Office Occupations
The most common Sales and Office occupations in Beechwood Village are Sales & Related (67 | 9.8%), and Office & Administration (37 | 5.4%).
Sales and Office Occupations by Sex
| Occupation | Male | Female |
| Sales & Related | 27 (40.3%) | 40 (59.7%) |
| Office & Administration | 8 (21.6%) | 29 (78.4%) |
| Total (Category) | 35 (33.7%) | 69 (66.3%) |
| Total (Overall) | 317 (46.6%) | 364 (53.4%) |
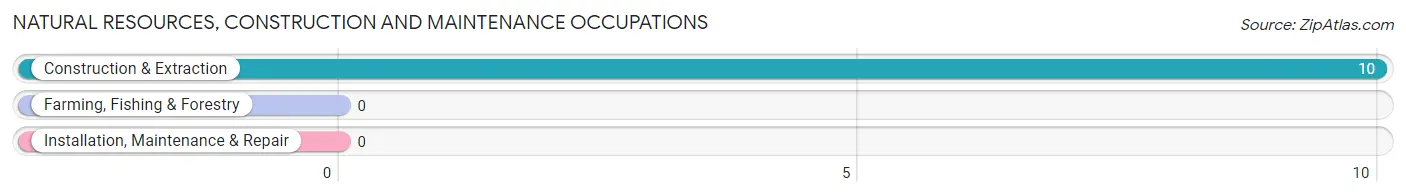
Natural Resources, Construction and Maintenance Occupations
The most common Natural Resources, Construction and Maintenance occupations in Beechwood Village are , and Construction & Extraction (10 | 1.5%).
Natural Resources, Construction and Maintenance Occupations by Sex
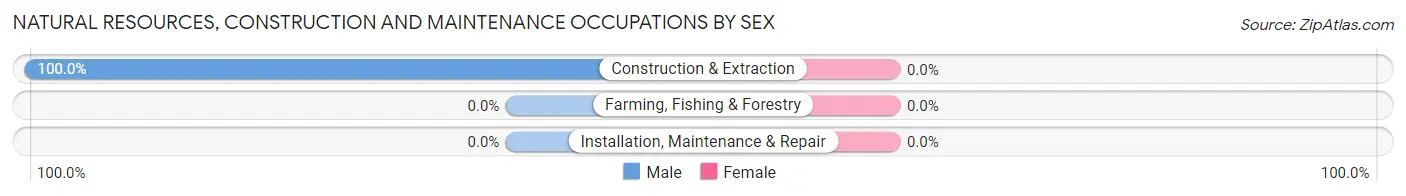
| Occupation | Male | Female |
| Farming, Fishing & Forestry | 0 (0.0%) | 0 (0.0%) |
| Construction & Extraction | 10 (100.0%) | 0 (0.0%) |
| Installation, Maintenance & Repair | 0 (0.0%) | 0 (0.0%) |
| Total (Category) | 10 (100.0%) | 0 (0.0%) |
| Total (Overall) | 317 (46.6%) | 364 (53.4%) |
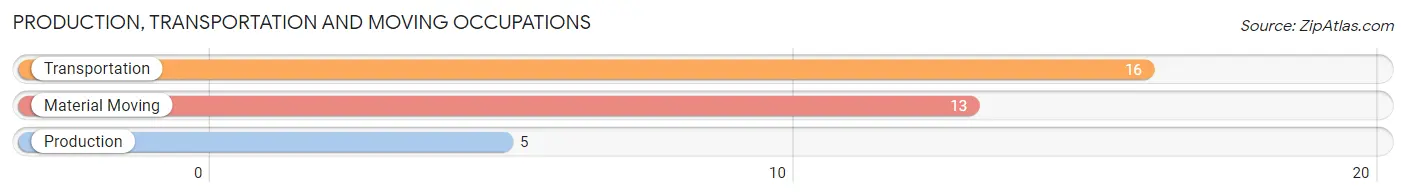
Production, Transportation and Moving Occupations
The most common Production, Transportation and Moving occupations in Beechwood Village are Transportation (16 | 2.4%), Material Moving (13 | 1.9%), and Production (5 | 0.7%).
Production, Transportation and Moving Occupations by Sex
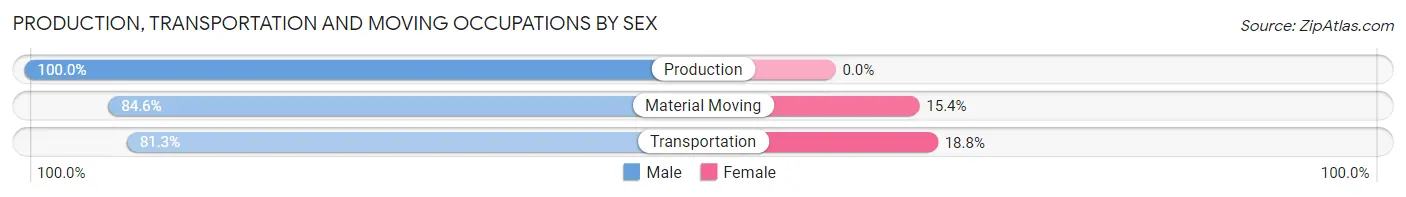
| Occupation | Male | Female |
| Production | 5 (100.0%) | 0 (0.0%) |
| Transportation | 13 (81.2%) | 3 (18.8%) |
| Material Moving | 11 (84.6%) | 2 (15.4%) |
| Total (Category) | 29 (85.3%) | 5 (14.7%) |
| Total (Overall) | 317 (46.6%) | 364 (53.4%) |
Employment Industries by Sex in Beechwood Village
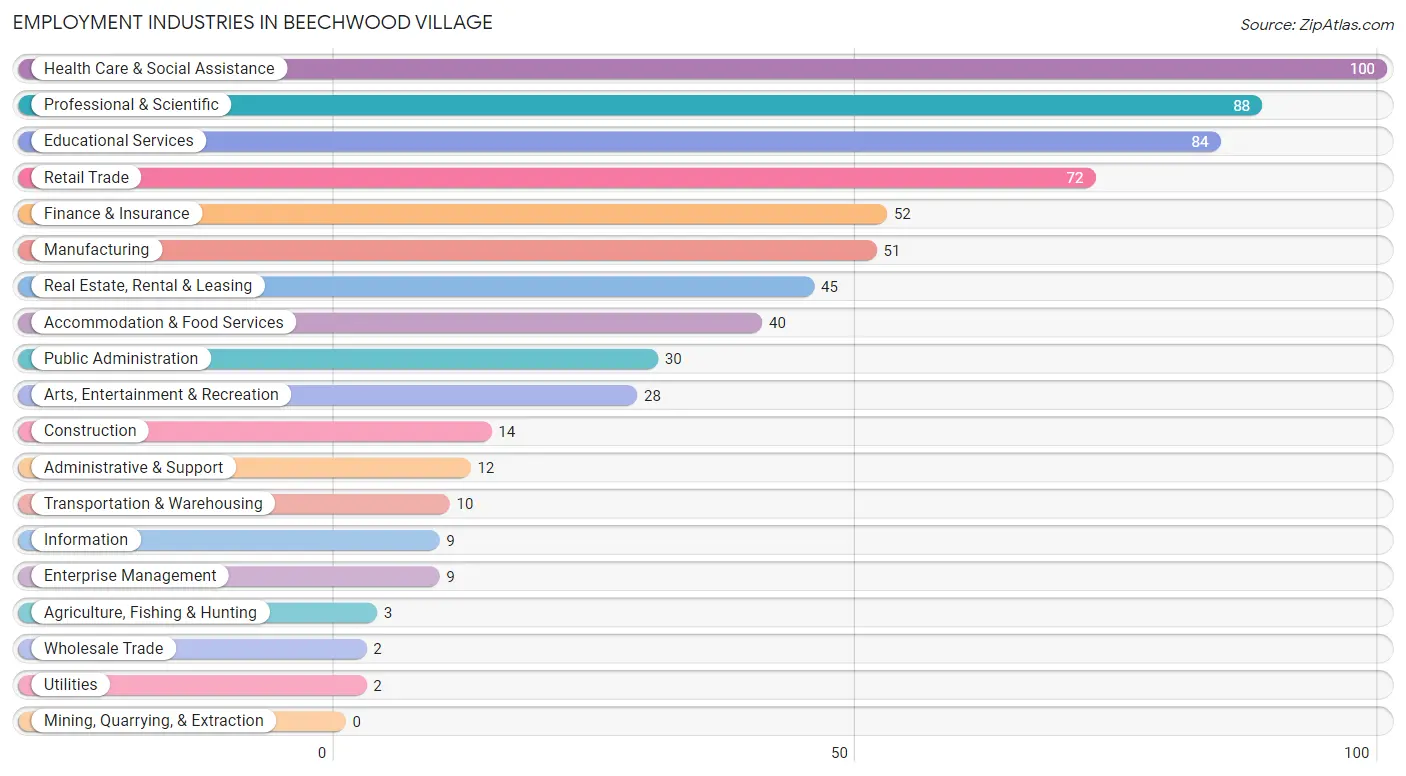
Employment Industries in Beechwood Village
The major employment industries in Beechwood Village include Health Care & Social Assistance (100 | 14.7%), Professional & Scientific (88 | 12.9%), Educational Services (84 | 12.3%), Retail Trade (72 | 10.6%), and Finance & Insurance (52 | 7.6%).
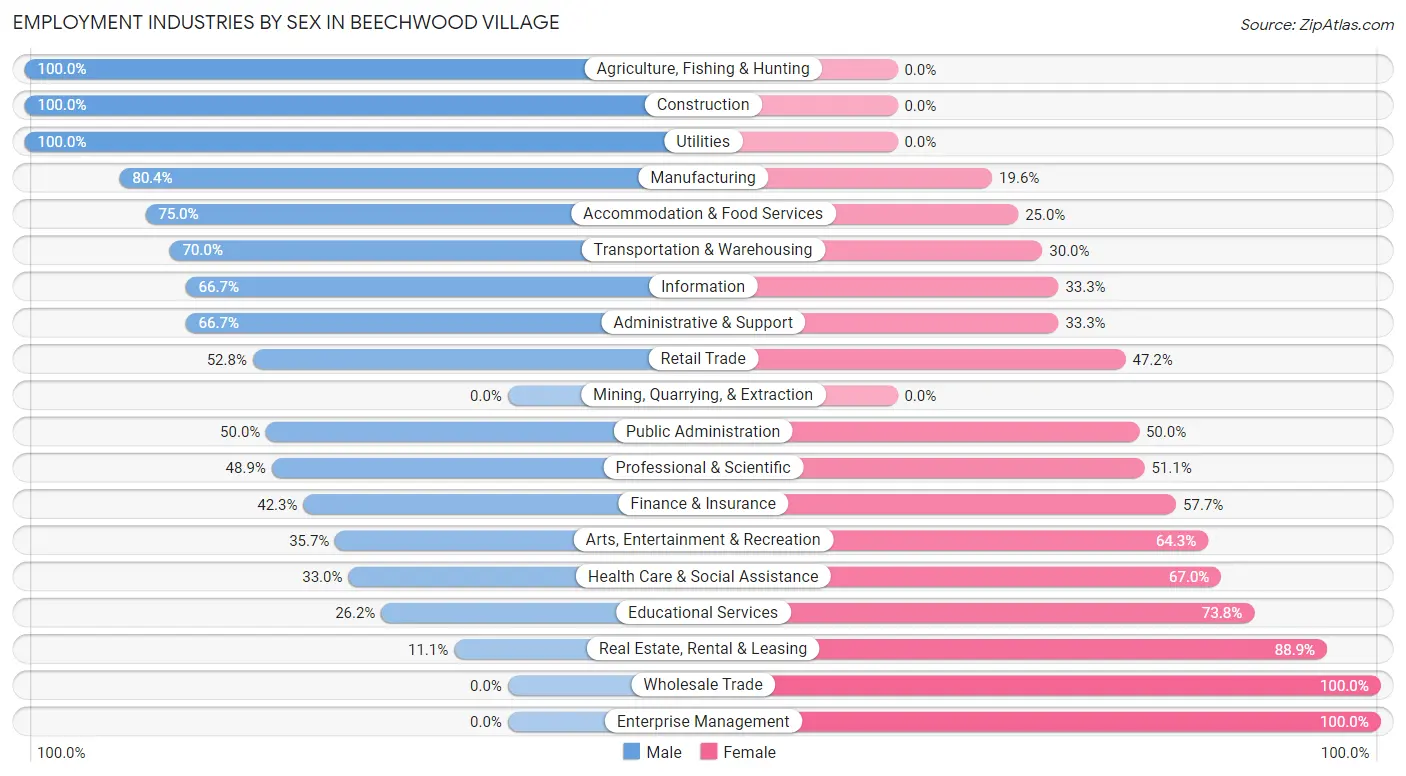
Employment Industries by Sex in Beechwood Village
The Beechwood Village industries that see more men than women are Agriculture, Fishing & Hunting (100.0%), Construction (100.0%), and Utilities (100.0%), whereas the industries that tend to have a higher number of women are Wholesale Trade (100.0%), Enterprise Management (100.0%), and Real Estate, Rental & Leasing (88.9%).
| Industry | Male | Female |
| Agriculture, Fishing & Hunting | 3 (100.0%) | 0 (0.0%) |
| Mining, Quarrying, & Extraction | 0 (0.0%) | 0 (0.0%) |
| Construction | 14 (100.0%) | 0 (0.0%) |
| Manufacturing | 41 (80.4%) | 10 (19.6%) |
| Wholesale Trade | 0 (0.0%) | 2 (100.0%) |
| Retail Trade | 38 (52.8%) | 34 (47.2%) |
| Transportation & Warehousing | 7 (70.0%) | 3 (30.0%) |
| Utilities | 2 (100.0%) | 0 (0.0%) |
| Information | 6 (66.7%) | 3 (33.3%) |
| Finance & Insurance | 22 (42.3%) | 30 (57.7%) |
| Real Estate, Rental & Leasing | 5 (11.1%) | 40 (88.9%) |
| Professional & Scientific | 43 (48.9%) | 45 (51.1%) |
| Enterprise Management | 0 (0.0%) | 9 (100.0%) |
| Administrative & Support | 8 (66.7%) | 4 (33.3%) |
| Educational Services | 22 (26.2%) | 62 (73.8%) |
| Health Care & Social Assistance | 33 (33.0%) | 67 (67.0%) |
| Arts, Entertainment & Recreation | 10 (35.7%) | 18 (64.3%) |
| Accommodation & Food Services | 30 (75.0%) | 10 (25.0%) |
| Public Administration | 15 (50.0%) | 15 (50.0%) |
| Total | 317 (46.6%) | 364 (53.4%) |
Education in Beechwood Village
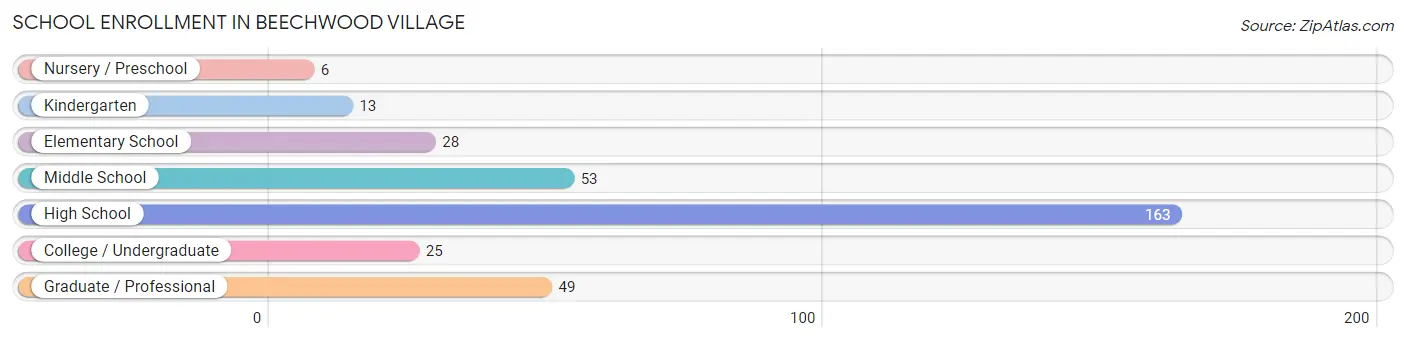
School Enrollment in Beechwood Village
The most common levels of schooling among the 337 students in Beechwood Village are high school (163 | 48.4%), middle school (53 | 15.7%), and graduate / professional (49 | 14.5%).
| School Level | # Students | % Students |
| Nursery / Preschool | 6 | 1.8% |
| Kindergarten | 13 | 3.9% |
| Elementary School | 28 | 8.3% |
| Middle School | 53 | 15.7% |
| High School | 163 | 48.4% |
| College / Undergraduate | 25 | 7.4% |
| Graduate / Professional | 49 | 14.5% |
| Total | 337 | 100.0% |
School Enrollment by Age by Funding Source in Beechwood Village
Out of a total of 337 students who are enrolled in schools in Beechwood Village, 233 (69.1%) attend a private institution, while the remaining 104 (30.9%) are enrolled in public schools. The age group of 3 to 4 year olds has the highest likelihood of being enrolled in private schools, with 7 (100.0% in the age bracket) enrolled. Conversely, the age group of 5 to 9 year old has the lowest likelihood of being enrolled in a private school, with 35 (94.6% in the age bracket) attending a public institution.
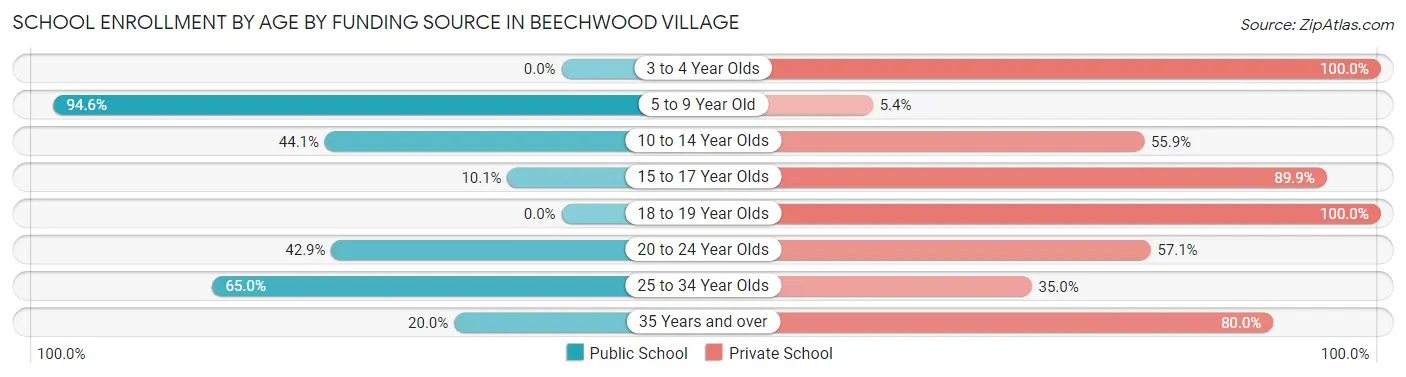
| Age Bracket | Public School | Private School |
| 3 to 4 Year Olds | 0 (0.0%) | 7 (100.0%) |
| 5 to 9 Year Old | 35 (94.6%) | 2 (5.4%) |
| 10 to 14 Year Olds | 26 (44.1%) | 33 (55.9%) |
| 15 to 17 Year Olds | 16 (10.1%) | 143 (89.9%) |
| 18 to 19 Year Olds | 0 (0.0%) | 1 (100.0%) |
| 20 to 24 Year Olds | 6 (42.9%) | 8 (57.1%) |
| 25 to 34 Year Olds | 13 (65.0%) | 7 (35.0%) |
| 35 Years and over | 8 (20.0%) | 32 (80.0%) |
| Total | 104 (30.9%) | 233 (69.1%) |
Educational Attainment by Field of Study in Beechwood Village
Business (157 | 22.1%), social sciences (90 | 12.6%), education (64 | 9.0%), bio, nature & agricultural (63 | 8.8%), and literature & languages (62 | 8.7%) are the most common fields of study among 712 individuals in Beechwood Village who have obtained a bachelor's degree or higher.
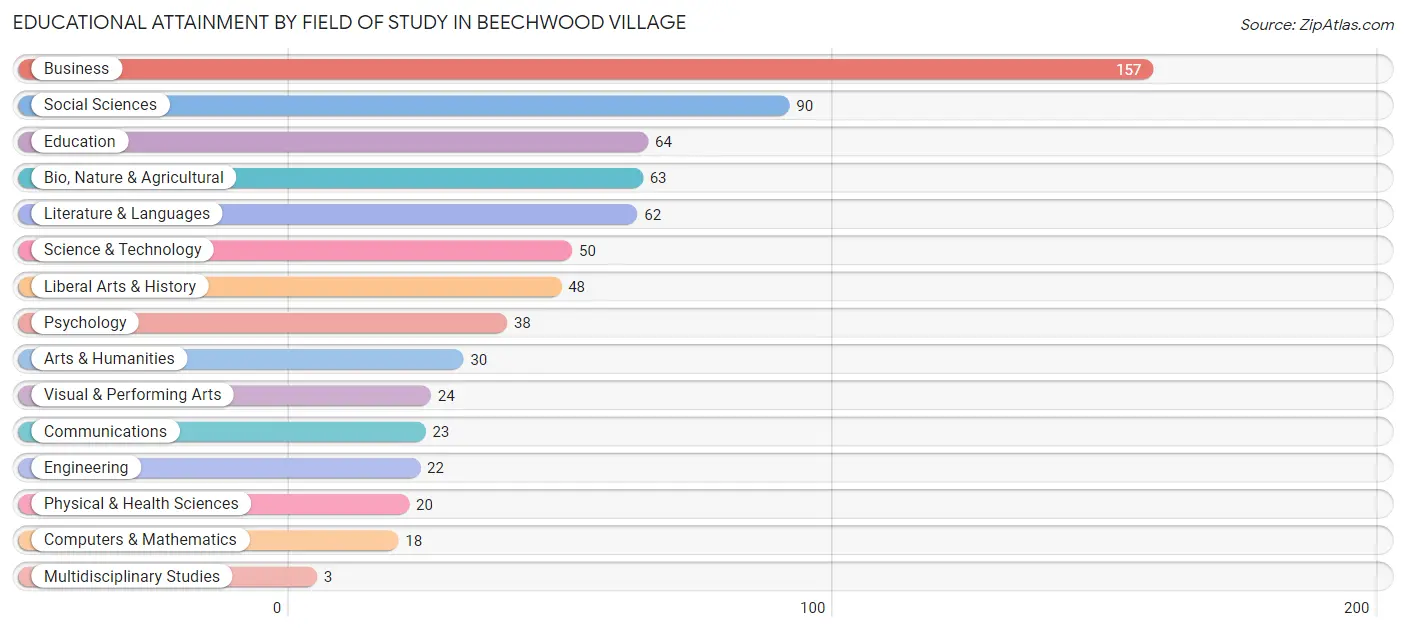
| Field of Study | # Graduates | % Graduates |
| Computers & Mathematics | 18 | 2.5% |
| Bio, Nature & Agricultural | 63 | 8.8% |
| Physical & Health Sciences | 20 | 2.8% |
| Psychology | 38 | 5.3% |
| Social Sciences | 90 | 12.6% |
| Engineering | 22 | 3.1% |
| Multidisciplinary Studies | 3 | 0.4% |
| Science & Technology | 50 | 7.0% |
| Business | 157 | 22.1% |
| Education | 64 | 9.0% |
| Literature & Languages | 62 | 8.7% |
| Liberal Arts & History | 48 | 6.7% |
| Visual & Performing Arts | 24 | 3.4% |
| Communications | 23 | 3.2% |
| Arts & Humanities | 30 | 4.2% |
| Total | 712 | 100.0% |
Transportation & Commute in Beechwood Village
Vehicle Availability by Sex in Beechwood Village
The most prevalent vehicle ownership categories in Beechwood Village are males with 2 vehicles (230, accounting for 73.0%) and females with 2 vehicles (209, making up 64.4%).
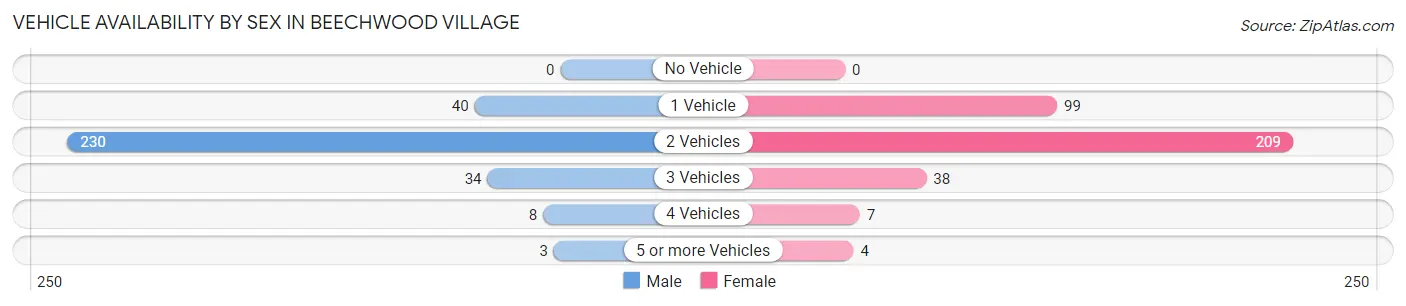
| Vehicles Available | Male | Female |
| No Vehicle | 0 (0.0%) | 0 (0.0%) |
| 1 Vehicle | 40 (12.7%) | 99 (27.7%) |
| 2 Vehicles | 230 (73.0%) | 209 (58.5%) |
| 3 Vehicles | 34 (10.8%) | 38 (10.6%) |
| 4 Vehicles | 8 (2.5%) | 7 (2.0%) |
| 5 or more Vehicles | 3 (0.9%) | 4 (1.1%) |
| Total | 315 (100.0%) | 357 (100.0%) |
Commute Time in Beechwood Village
The most frequently occuring commute durations in Beechwood Village are 20 to 24 minutes (121 commuters, 23.7%), 15 to 19 minutes (104 commuters, 20.3%), and 5 to 9 minutes (58 commuters, 11.4%).
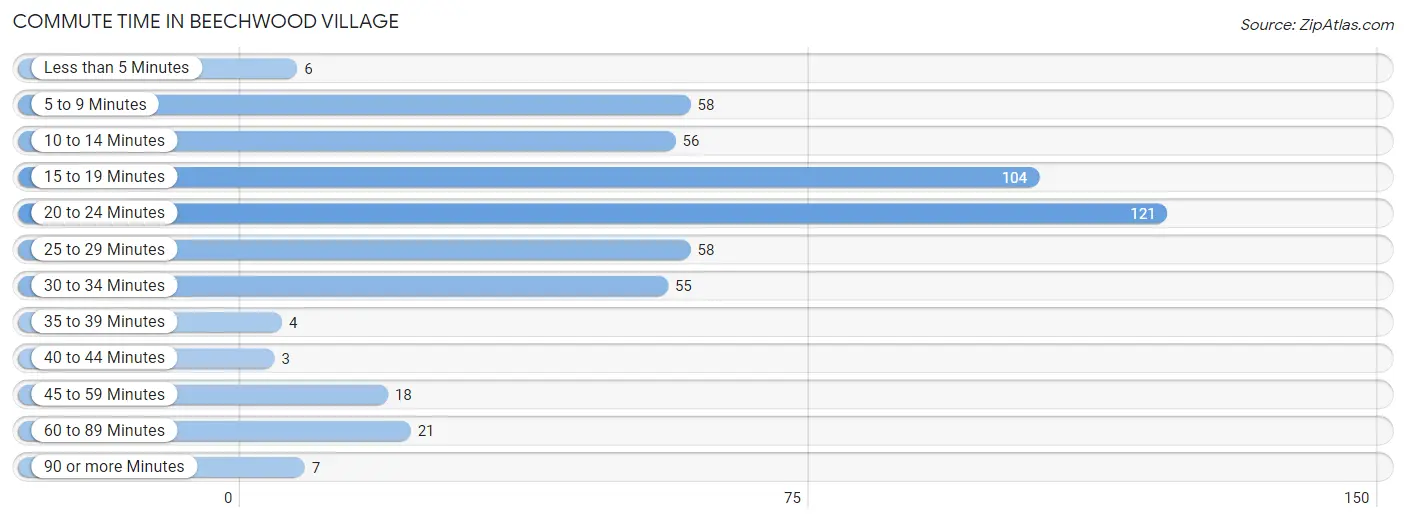
| Commute Time | # Commuters | % Commuters |
| Less than 5 Minutes | 6 | 1.2% |
| 5 to 9 Minutes | 58 | 11.4% |
| 10 to 14 Minutes | 56 | 11.0% |
| 15 to 19 Minutes | 104 | 20.3% |
| 20 to 24 Minutes | 121 | 23.7% |
| 25 to 29 Minutes | 58 | 11.4% |
| 30 to 34 Minutes | 55 | 10.8% |
| 35 to 39 Minutes | 4 | 0.8% |
| 40 to 44 Minutes | 3 | 0.6% |
| 45 to 59 Minutes | 18 | 3.5% |
| 60 to 89 Minutes | 21 | 4.1% |
| 90 or more Minutes | 7 | 1.4% |
Commute Time by Sex in Beechwood Village
The most common commute times in Beechwood Village are 15 to 19 minutes (57 commuters, 22.4%) for males and 20 to 24 minutes (77 commuters, 30.0%) for females.
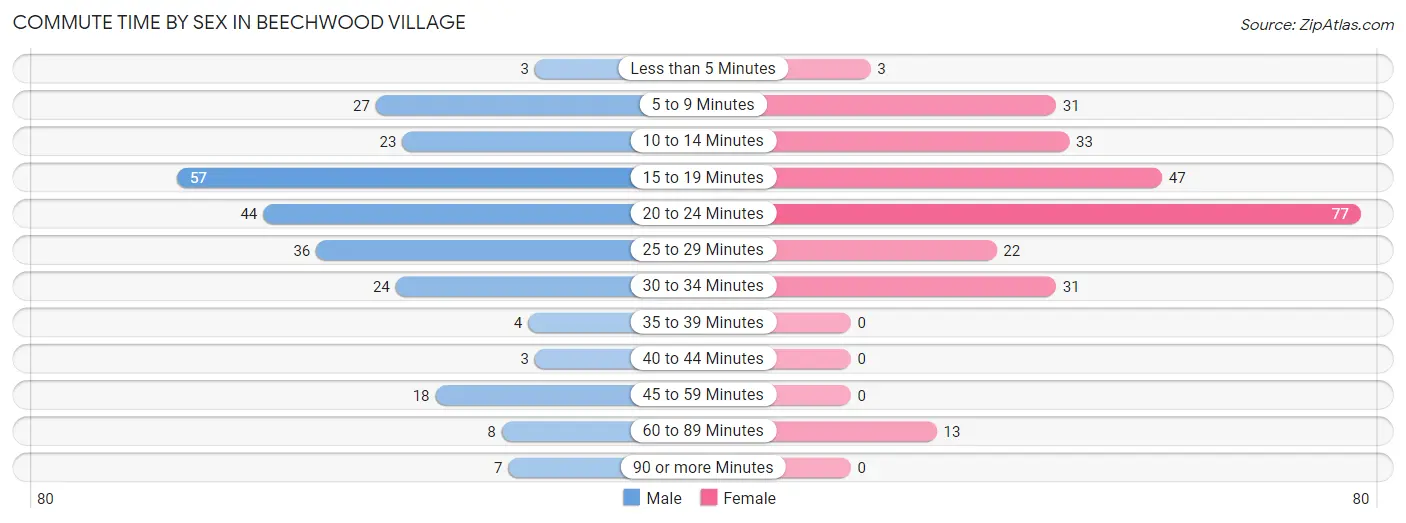
| Commute Time | Male | Female |
| Less than 5 Minutes | 3 (1.2%) | 3 (1.2%) |
| 5 to 9 Minutes | 27 (10.6%) | 31 (12.1%) |
| 10 to 14 Minutes | 23 (9.1%) | 33 (12.8%) |
| 15 to 19 Minutes | 57 (22.4%) | 47 (18.3%) |
| 20 to 24 Minutes | 44 (17.3%) | 77 (30.0%) |
| 25 to 29 Minutes | 36 (14.2%) | 22 (8.6%) |
| 30 to 34 Minutes | 24 (9.5%) | 31 (12.1%) |
| 35 to 39 Minutes | 4 (1.6%) | 0 (0.0%) |
| 40 to 44 Minutes | 3 (1.2%) | 0 (0.0%) |
| 45 to 59 Minutes | 18 (7.1%) | 0 (0.0%) |
| 60 to 89 Minutes | 8 (3.2%) | 13 (5.1%) |
| 90 or more Minutes | 7 (2.8%) | 0 (0.0%) |
Time of Departure to Work by Sex in Beechwood Village
The most frequent times of departure to work in Beechwood Village are 7:00 AM to 7:29 AM (49, 19.3%) for males and 7:30 AM to 7:59 AM (56, 21.8%) for females.
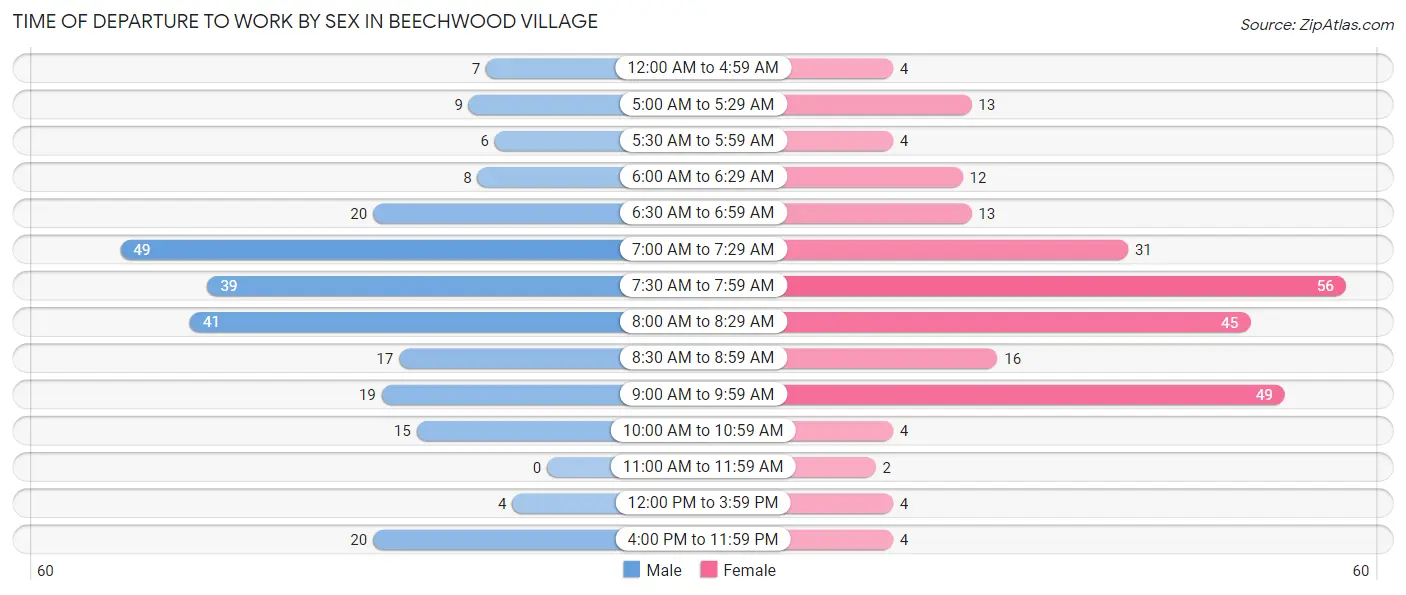
| Time of Departure | Male | Female |
| 12:00 AM to 4:59 AM | 7 (2.8%) | 4 (1.6%) |
| 5:00 AM to 5:29 AM | 9 (3.5%) | 13 (5.1%) |
| 5:30 AM to 5:59 AM | 6 (2.4%) | 4 (1.6%) |
| 6:00 AM to 6:29 AM | 8 (3.2%) | 12 (4.7%) |
| 6:30 AM to 6:59 AM | 20 (7.9%) | 13 (5.1%) |
| 7:00 AM to 7:29 AM | 49 (19.3%) | 31 (12.1%) |
| 7:30 AM to 7:59 AM | 39 (15.3%) | 56 (21.8%) |
| 8:00 AM to 8:29 AM | 41 (16.1%) | 45 (17.5%) |
| 8:30 AM to 8:59 AM | 17 (6.7%) | 16 (6.2%) |
| 9:00 AM to 9:59 AM | 19 (7.5%) | 49 (19.1%) |
| 10:00 AM to 10:59 AM | 15 (5.9%) | 4 (1.6%) |
| 11:00 AM to 11:59 AM | 0 (0.0%) | 2 (0.8%) |
| 12:00 PM to 3:59 PM | 4 (1.6%) | 4 (1.6%) |
| 4:00 PM to 11:59 PM | 20 (7.9%) | 4 (1.6%) |
| Total | 254 (100.0%) | 257 (100.0%) |
Housing Occupancy in Beechwood Village
Occupancy by Ownership in Beechwood Village
Of the total 566 dwellings in Beechwood Village, owner-occupied units account for 480 (84.8%), while renter-occupied units make up 86 (15.2%).
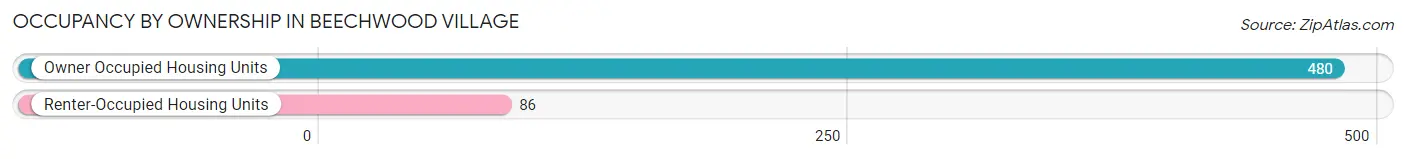
| Occupancy | # Housing Units | % Housing Units |
| Owner Occupied Housing Units | 480 | 84.8% |
| Renter-Occupied Housing Units | 86 | 15.2% |
| Total Occupied Housing Units | 566 | 100.0% |
Occupancy by Household Size in Beechwood Village
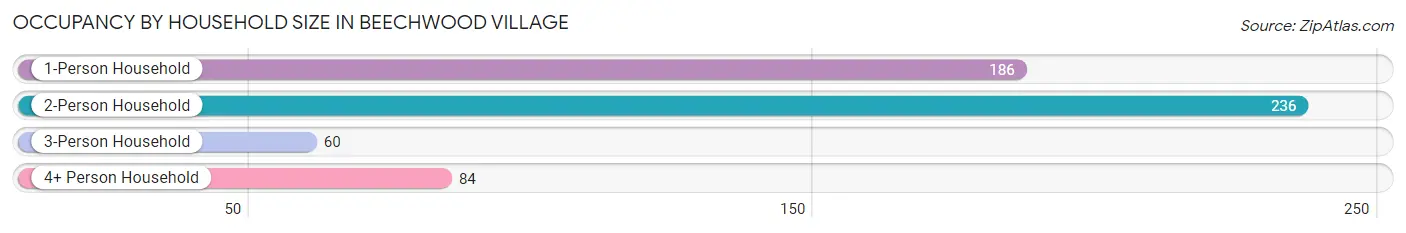
| Household Size | # Housing Units | % Housing Units |
| 1-Person Household | 186 | 32.9% |
| 2-Person Household | 236 | 41.7% |
| 3-Person Household | 60 | 10.6% |
| 4+ Person Household | 84 | 14.8% |
| Total Housing Units | 566 | 100.0% |
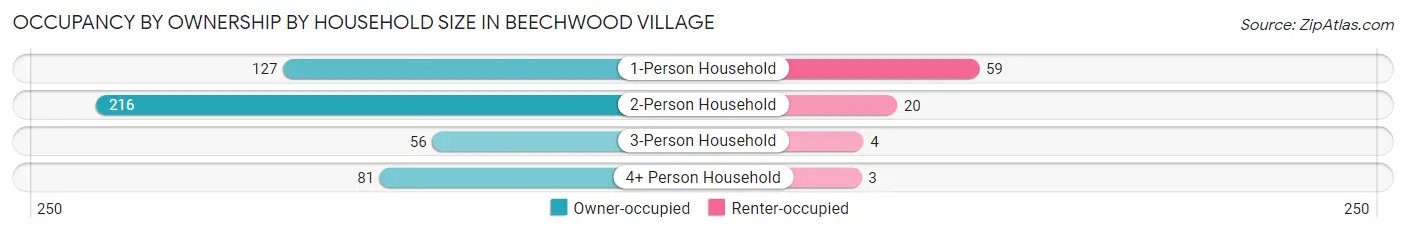
Occupancy by Ownership by Household Size in Beechwood Village
| Household Size | Owner-occupied | Renter-occupied |
| 1-Person Household | 127 (68.3%) | 59 (31.7%) |
| 2-Person Household | 216 (91.5%) | 20 (8.5%) |
| 3-Person Household | 56 (93.3%) | 4 (6.7%) |
| 4+ Person Household | 81 (96.4%) | 3 (3.6%) |
| Total Housing Units | 480 (84.8%) | 86 (15.2%) |
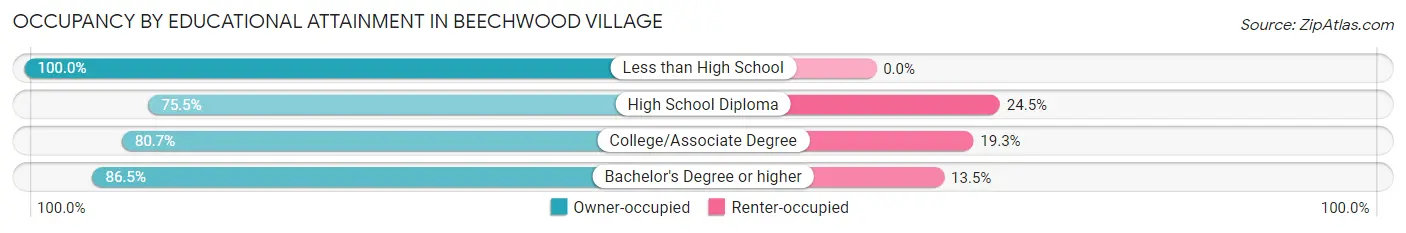
Occupancy by Educational Attainment in Beechwood Village
| Household Size | Owner-occupied | Renter-occupied |
| Less than High School | 7 (100.0%) | 0 (0.0%) |
| High School Diploma | 40 (75.5%) | 13 (24.5%) |
| College/Associate Degree | 67 (80.7%) | 16 (19.3%) |
| Bachelor's Degree or higher | 366 (86.5%) | 57 (13.5%) |
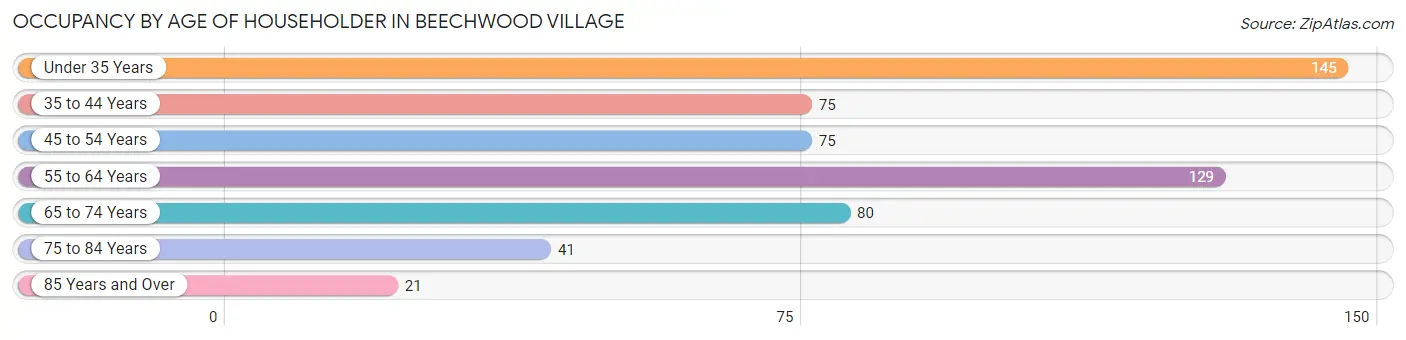
Occupancy by Age of Householder in Beechwood Village
| Age Bracket | # Households | % Households |
| Under 35 Years | 145 | 25.6% |
| 35 to 44 Years | 75 | 13.3% |
| 45 to 54 Years | 75 | 13.3% |
| 55 to 64 Years | 129 | 22.8% |
| 65 to 74 Years | 80 | 14.1% |
| 75 to 84 Years | 41 | 7.2% |
| 85 Years and Over | 21 | 3.7% |
| Total | 566 | 100.0% |
Housing Finances in Beechwood Village
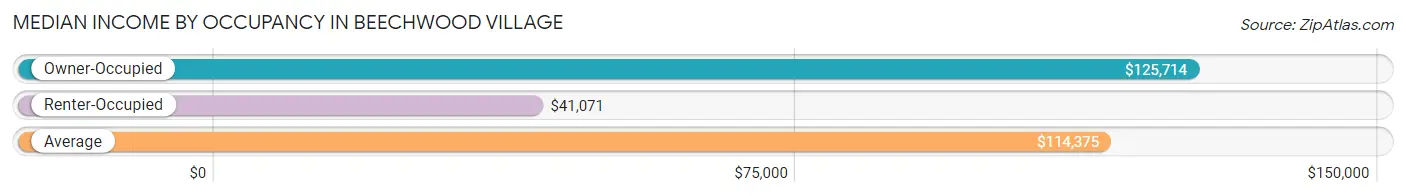
Median Income by Occupancy in Beechwood Village
| Occupancy Type | # Households | Median Income |
| Owner-Occupied | 480 (84.8%) | $125,714 |
| Renter-Occupied | 86 (15.2%) | $41,071 |
| Average | 566 (100.0%) | $114,375 |
Occupancy by Householder Income Bracket in Beechwood Village
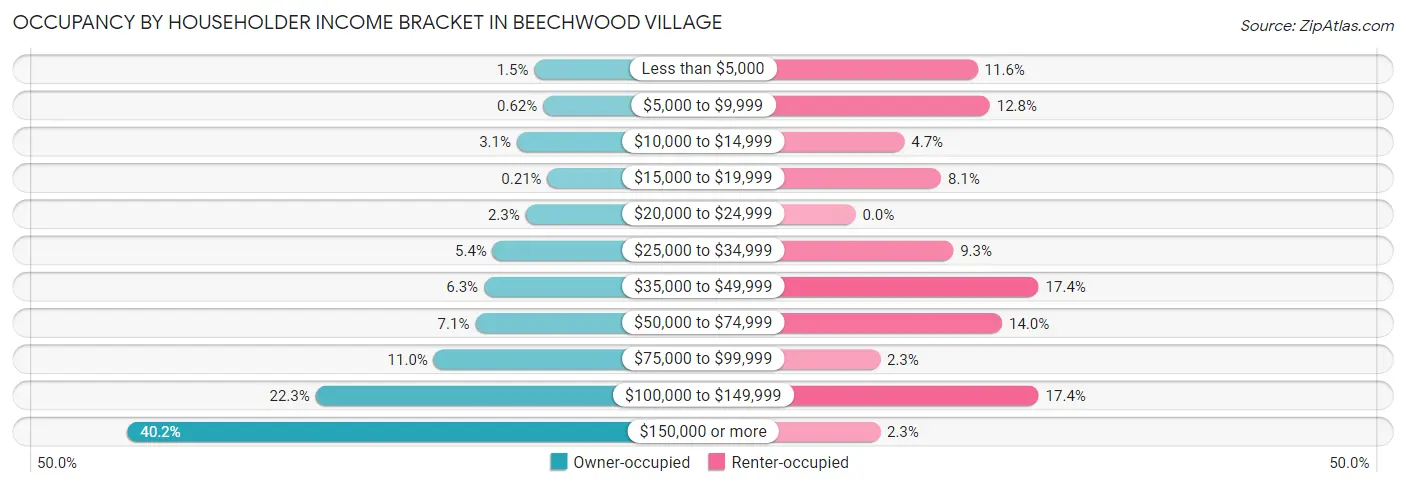
| Income Bracket | Owner-occupied | Renter-occupied |
| Less than $5,000 | 7 (1.5%) | 10 (11.6%) |
| $5,000 to $9,999 | 3 (0.6%) | 11 (12.8%) |
| $10,000 to $14,999 | 15 (3.1%) | 4 (4.6%) |
| $15,000 to $19,999 | 1 (0.2%) | 7 (8.1%) |
| $20,000 to $24,999 | 11 (2.3%) | 0 (0.0%) |
| $25,000 to $34,999 | 26 (5.4%) | 8 (9.3%) |
| $35,000 to $49,999 | 30 (6.2%) | 15 (17.4%) |
| $50,000 to $74,999 | 34 (7.1%) | 12 (14.0%) |
| $75,000 to $99,999 | 53 (11.0%) | 2 (2.3%) |
| $100,000 to $149,999 | 107 (22.3%) | 15 (17.4%) |
| $150,000 or more | 193 (40.2%) | 2 (2.3%) |
| Total | 480 (100.0%) | 86 (100.0%) |
Monthly Housing Cost Tiers in Beechwood Village
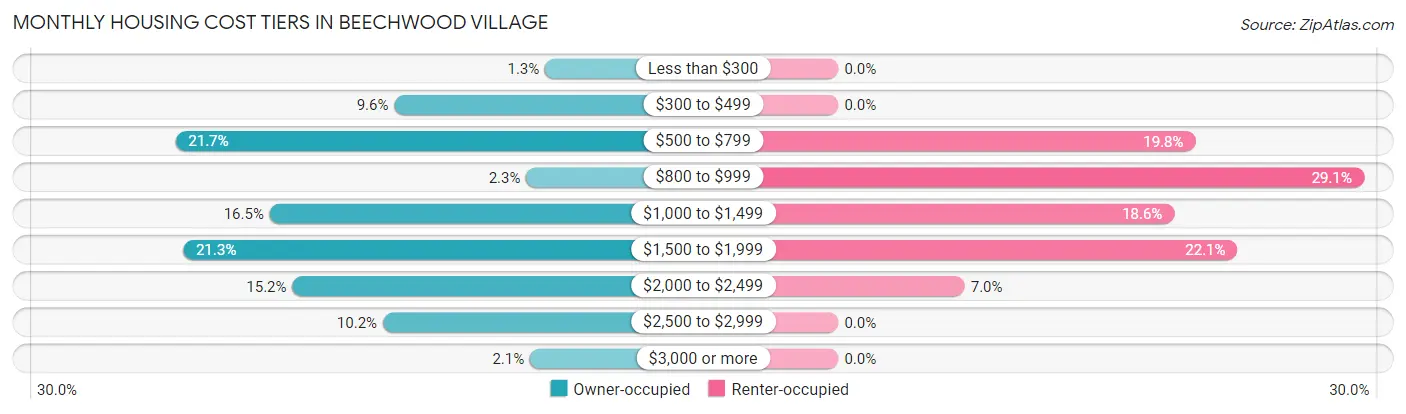
| Monthly Cost | Owner-occupied | Renter-occupied |
| Less than $300 | 6 (1.3%) | 0 (0.0%) |
| $300 to $499 | 46 (9.6%) | 0 (0.0%) |
| $500 to $799 | 104 (21.7%) | 17 (19.8%) |
| $800 to $999 | 11 (2.3%) | 25 (29.1%) |
| $1,000 to $1,499 | 79 (16.5%) | 16 (18.6%) |
| $1,500 to $1,999 | 102 (21.2%) | 19 (22.1%) |
| $2,000 to $2,499 | 73 (15.2%) | 6 (7.0%) |
| $2,500 to $2,999 | 49 (10.2%) | 0 (0.0%) |
| $3,000 or more | 10 (2.1%) | 0 (0.0%) |
| Total | 480 (100.0%) | 86 (100.0%) |
Physical Housing Characteristics in Beechwood Village
Housing Structures in Beechwood Village
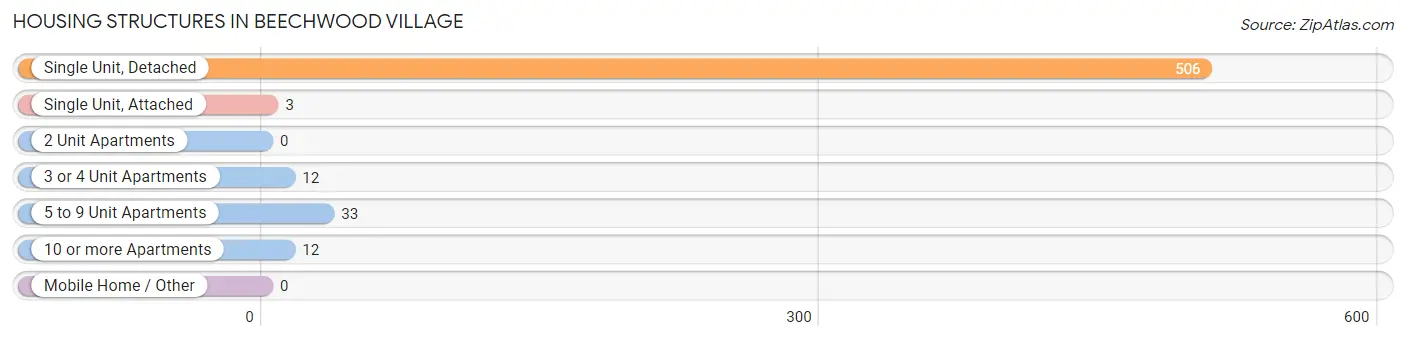
| Structure Type | # Housing Units | % Housing Units |
| Single Unit, Detached | 506 | 89.4% |
| Single Unit, Attached | 3 | 0.5% |
| 2 Unit Apartments | 0 | 0.0% |
| 3 or 4 Unit Apartments | 12 | 2.1% |
| 5 to 9 Unit Apartments | 33 | 5.8% |
| 10 or more Apartments | 12 | 2.1% |
| Mobile Home / Other | 0 | 0.0% |
| Total | 566 | 100.0% |
Housing Structures by Occupancy in Beechwood Village
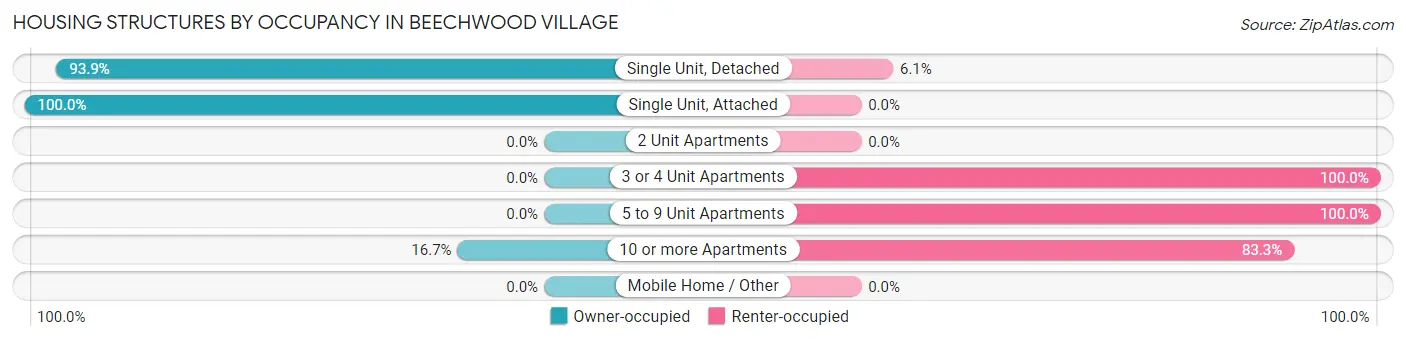
| Structure Type | Owner-occupied | Renter-occupied |
| Single Unit, Detached | 475 (93.9%) | 31 (6.1%) |
| Single Unit, Attached | 3 (100.0%) | 0 (0.0%) |
| 2 Unit Apartments | 0 (0.0%) | 0 (0.0%) |
| 3 or 4 Unit Apartments | 0 (0.0%) | 12 (100.0%) |
| 5 to 9 Unit Apartments | 0 (0.0%) | 33 (100.0%) |
| 10 or more Apartments | 2 (16.7%) | 10 (83.3%) |
| Mobile Home / Other | 0 (0.0%) | 0 (0.0%) |
| Total | 480 (84.8%) | 86 (15.2%) |
Housing Structures by Number of Rooms in Beechwood Village
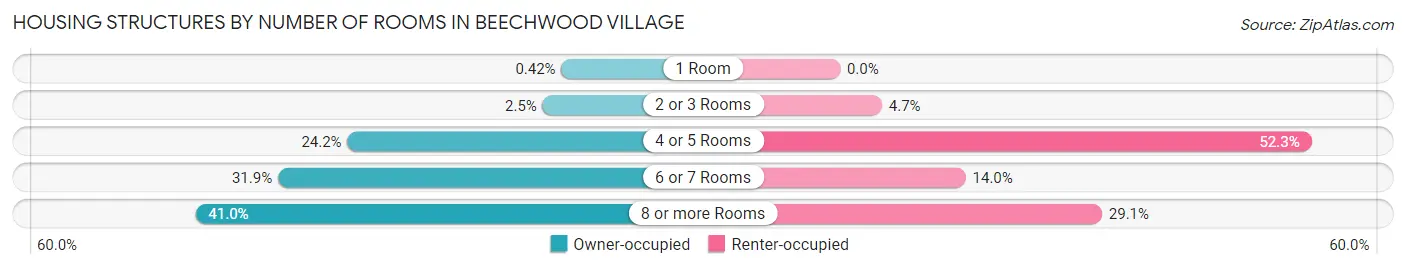
| Number of Rooms | Owner-occupied | Renter-occupied |
| 1 Room | 2 (0.4%) | 0 (0.0%) |
| 2 or 3 Rooms | 12 (2.5%) | 4 (4.6%) |
| 4 or 5 Rooms | 116 (24.2%) | 45 (52.3%) |
| 6 or 7 Rooms | 153 (31.9%) | 12 (14.0%) |
| 8 or more Rooms | 197 (41.0%) | 25 (29.1%) |
| Total | 480 (100.0%) | 86 (100.0%) |
Housing Structure by Heating Type in Beechwood Village
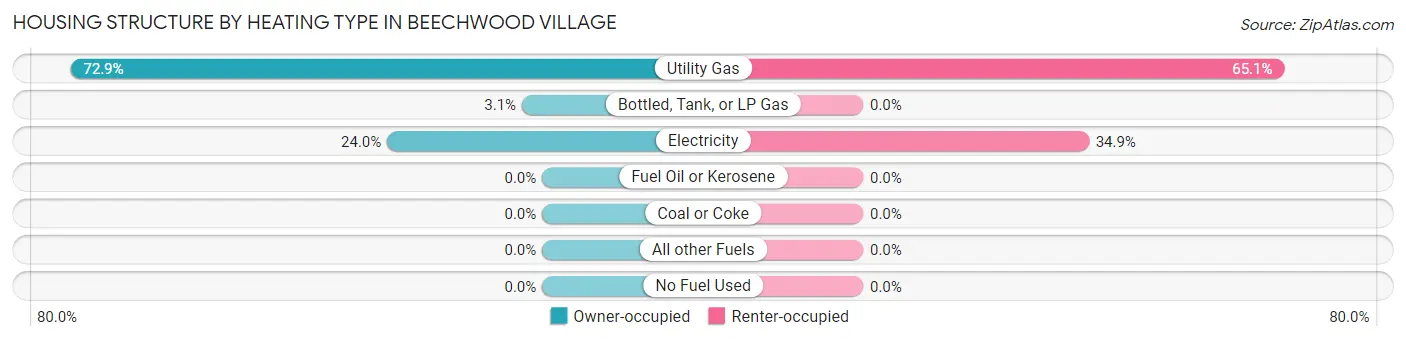
| Heating Type | Owner-occupied | Renter-occupied |
| Utility Gas | 350 (72.9%) | 56 (65.1%) |
| Bottled, Tank, or LP Gas | 15 (3.1%) | 0 (0.0%) |
| Electricity | 115 (24.0%) | 30 (34.9%) |
| Fuel Oil or Kerosene | 0 (0.0%) | 0 (0.0%) |
| Coal or Coke | 0 (0.0%) | 0 (0.0%) |
| All other Fuels | 0 (0.0%) | 0 (0.0%) |
| No Fuel Used | 0 (0.0%) | 0 (0.0%) |
| Total | 480 (100.0%) | 86 (100.0%) |
Household Vehicle Usage in Beechwood Village
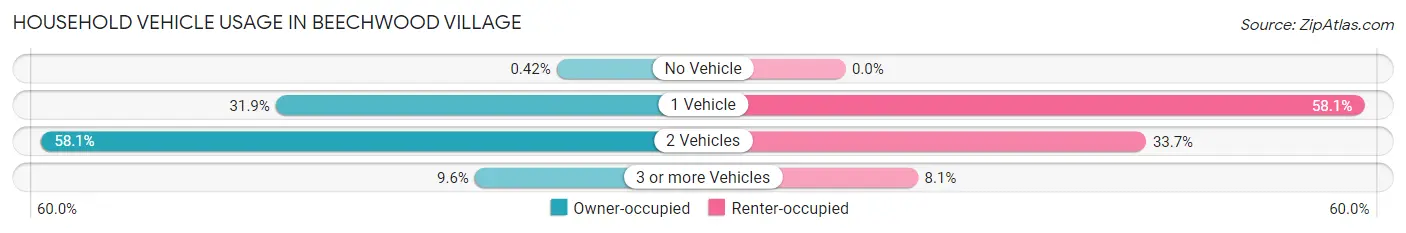
| Vehicles per Household | Owner-occupied | Renter-occupied |
| No Vehicle | 2 (0.4%) | 0 (0.0%) |
| 1 Vehicle | 153 (31.9%) | 50 (58.1%) |
| 2 Vehicles | 279 (58.1%) | 29 (33.7%) |
| 3 or more Vehicles | 46 (9.6%) | 7 (8.1%) |
| Total | 480 (100.0%) | 86 (100.0%) |
Real Estate & Mortgages in Beechwood Village
Real Estate and Mortgage Overview in Beechwood Village
| Characteristic | Without Mortgage | With Mortgage |
| Housing Units | 165 | 315 |
| Median Property Value | $326,500 | $323,300 |
| Median Household Income | $116,875 | $134 |
| Monthly Housing Costs | $632 | $10 |
| Real Estate Taxes | $2,583 | $2 |
Property Value by Mortgage Status in Beechwood Village
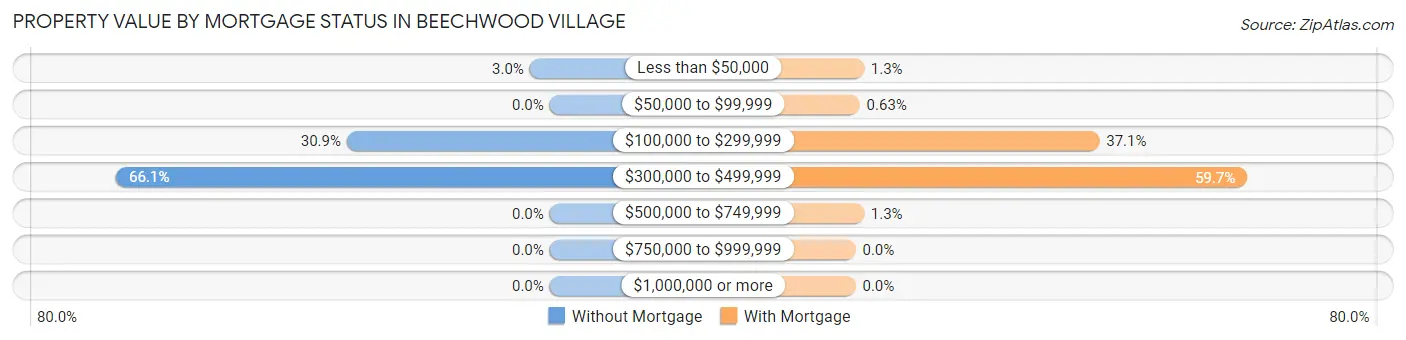
| Property Value | Without Mortgage | With Mortgage |
| Less than $50,000 | 5 (3.0%) | 4 (1.3%) |
| $50,000 to $99,999 | 0 (0.0%) | 2 (0.6%) |
| $100,000 to $299,999 | 51 (30.9%) | 117 (37.1%) |
| $300,000 to $499,999 | 109 (66.1%) | 188 (59.7%) |
| $500,000 to $749,999 | 0 (0.0%) | 4 (1.3%) |
| $750,000 to $999,999 | 0 (0.0%) | 0 (0.0%) |
| $1,000,000 or more | 0 (0.0%) | 0 (0.0%) |
| Total | 165 (100.0%) | 315 (100.0%) |
Household Income by Mortgage Status in Beechwood Village
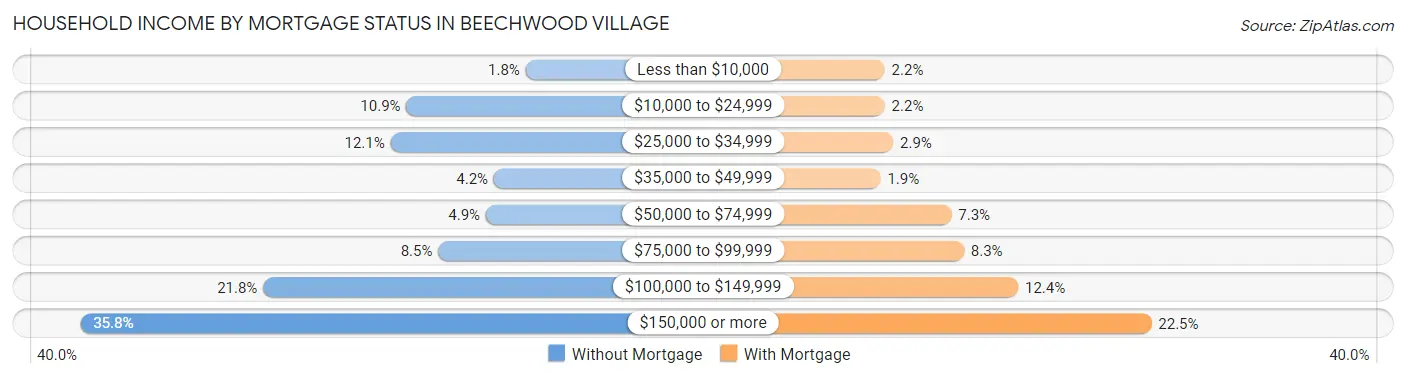
| Household Income | Without Mortgage | With Mortgage |
| Less than $10,000 | 3 (1.8%) | 7 (2.2%) |
| $10,000 to $24,999 | 18 (10.9%) | 7 (2.2%) |
| $25,000 to $34,999 | 20 (12.1%) | 9 (2.9%) |
| $35,000 to $49,999 | 7 (4.2%) | 6 (1.9%) |
| $50,000 to $74,999 | 8 (4.9%) | 23 (7.3%) |
| $75,000 to $99,999 | 14 (8.5%) | 26 (8.3%) |
| $100,000 to $149,999 | 36 (21.8%) | 39 (12.4%) |
| $150,000 or more | 59 (35.8%) | 71 (22.5%) |
| Total | 165 (100.0%) | 315 (100.0%) |
Property Value to Household Income Ratio in Beechwood Village
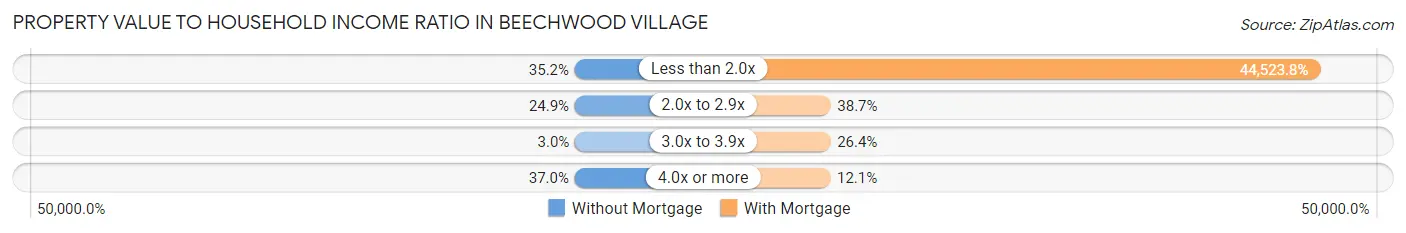
| Value-to-Income Ratio | Without Mortgage | With Mortgage |
| Less than 2.0x | 58 (35.1%) | 140,250 (44,523.8%) |
| 2.0x to 2.9x | 41 (24.8%) | 122 (38.7%) |
| 3.0x to 3.9x | 5 (3.0%) | 83 (26.4%) |
| 4.0x or more | 61 (37.0%) | 38 (12.1%) |
| Total | 165 (100.0%) | 315 (100.0%) |
Real Estate Taxes by Mortgage Status in Beechwood Village
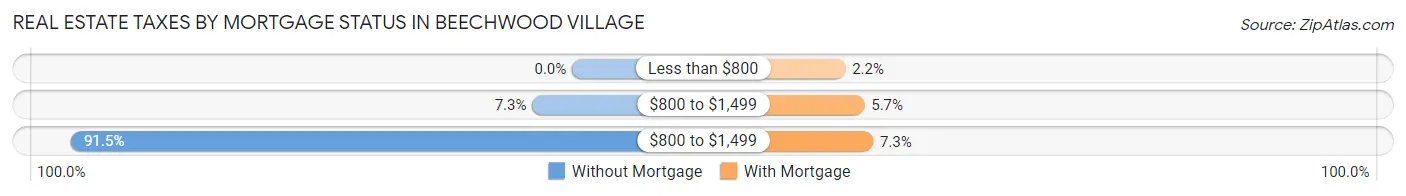
| Property Taxes | Without Mortgage | With Mortgage |
| Less than $800 | 0 (0.0%) | 7 (2.2%) |
| $800 to $1,499 | 12 (7.3%) | 18 (5.7%) |
| $800 to $1,499 | 151 (91.5%) | 23 (7.3%) |
| Total | 165 (100.0%) | 315 (100.0%) |
Health & Disability in Beechwood Village
Health Insurance Coverage by Age in Beechwood Village
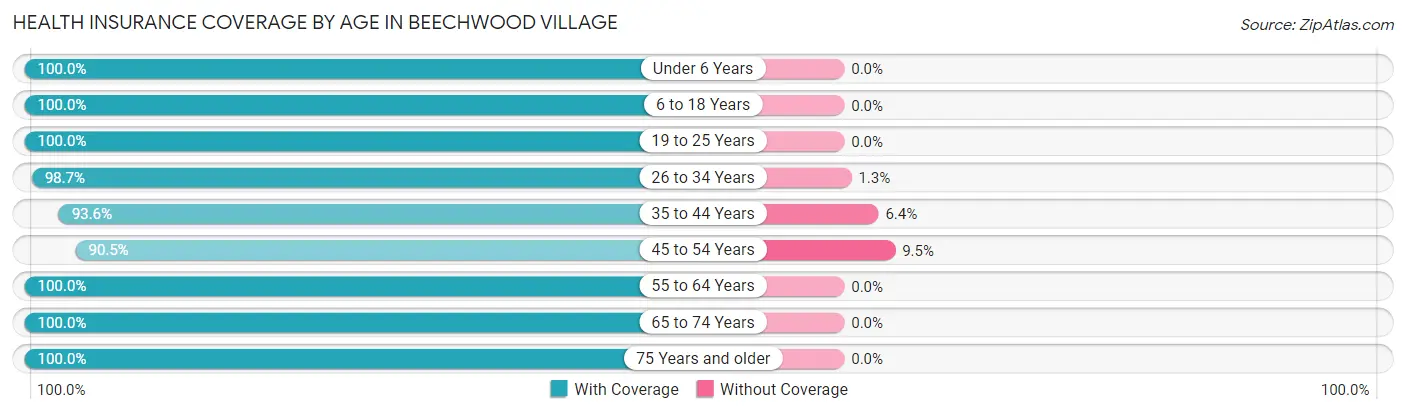
| Age Bracket | With Coverage | Without Coverage |
| Under 6 Years | 75 (100.0%) | 0 (0.0%) |
| 6 to 18 Years | 264 (100.0%) | 0 (0.0%) |
| 19 to 25 Years | 31 (100.0%) | 0 (0.0%) |
| 26 to 34 Years | 222 (98.7%) | 3 (1.3%) |
| 35 to 44 Years | 147 (93.6%) | 10 (6.4%) |
| 45 to 54 Years | 124 (90.5%) | 13 (9.5%) |
| 55 to 64 Years | 203 (100.0%) | 0 (0.0%) |
| 65 to 74 Years | 108 (100.0%) | 0 (0.0%) |
| 75 Years and older | 102 (100.0%) | 0 (0.0%) |
| Total | 1,276 (98.0%) | 26 (2.0%) |
Health Insurance Coverage by Citizenship Status in Beechwood Village
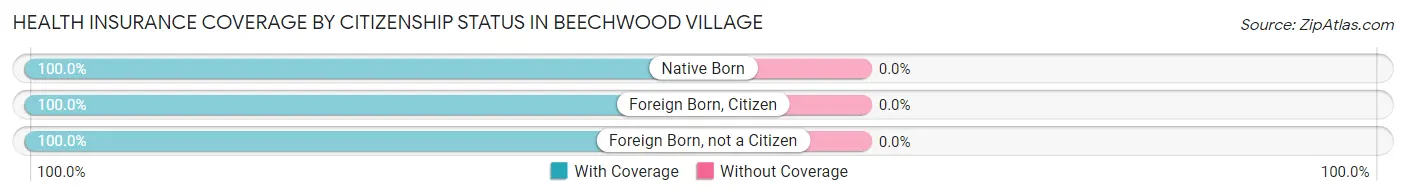
| Citizenship Status | With Coverage | Without Coverage |
| Native Born | 75 (100.0%) | 0 (0.0%) |
| Foreign Born, Citizen | 264 (100.0%) | 0 (0.0%) |
| Foreign Born, not a Citizen | 31 (100.0%) | 0 (0.0%) |
Health Insurance Coverage by Household Income in Beechwood Village
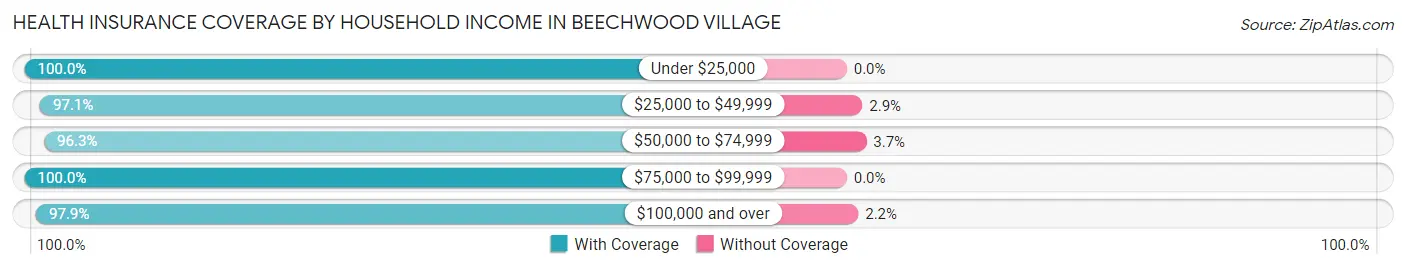
| Household Income | With Coverage | Without Coverage |
| Under $25,000 | 84 (100.0%) | 0 (0.0%) |
| $25,000 to $49,999 | 100 (97.1%) | 3 (2.9%) |
| $50,000 to $74,999 | 105 (96.3%) | 4 (3.7%) |
| $75,000 to $99,999 | 121 (100.0%) | 0 (0.0%) |
| $100,000 and over | 866 (97.9%) | 19 (2.1%) |
Public vs Private Health Insurance Coverage by Age in Beechwood Village
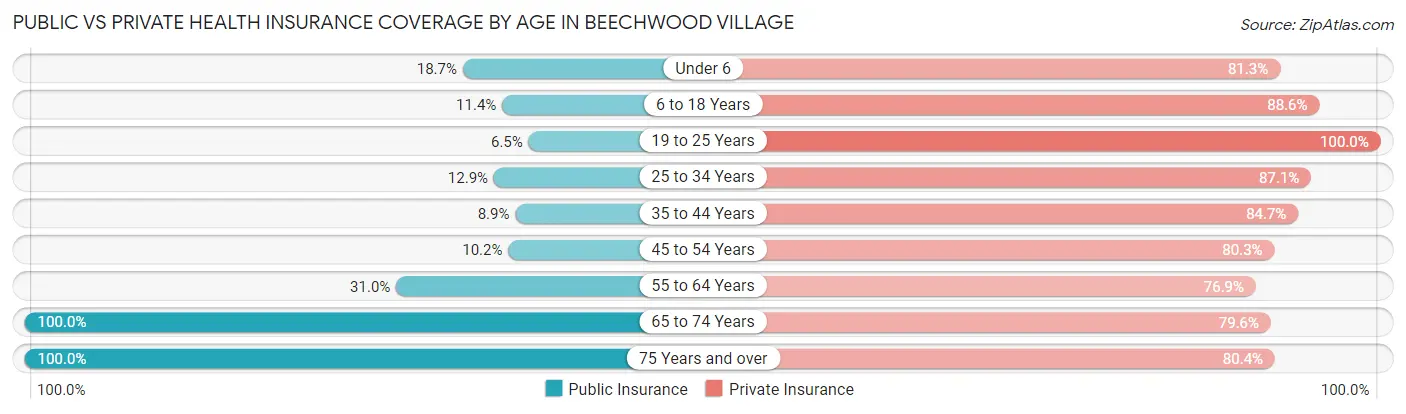
| Age Bracket | Public Insurance | Private Insurance |
| Under 6 | 14 (18.7%) | 61 (81.3%) |
| 6 to 18 Years | 30 (11.4%) | 234 (88.6%) |
| 19 to 25 Years | 2 (6.5%) | 31 (100.0%) |
| 25 to 34 Years | 29 (12.9%) | 196 (87.1%) |
| 35 to 44 Years | 14 (8.9%) | 133 (84.7%) |
| 45 to 54 Years | 14 (10.2%) | 110 (80.3%) |
| 55 to 64 Years | 63 (31.0%) | 156 (76.8%) |
| 65 to 74 Years | 108 (100.0%) | 86 (79.6%) |
| 75 Years and over | 102 (100.0%) | 82 (80.4%) |
| Total | 376 (28.9%) | 1,089 (83.6%) |
Disability Status by Sex by Age in Beechwood Village
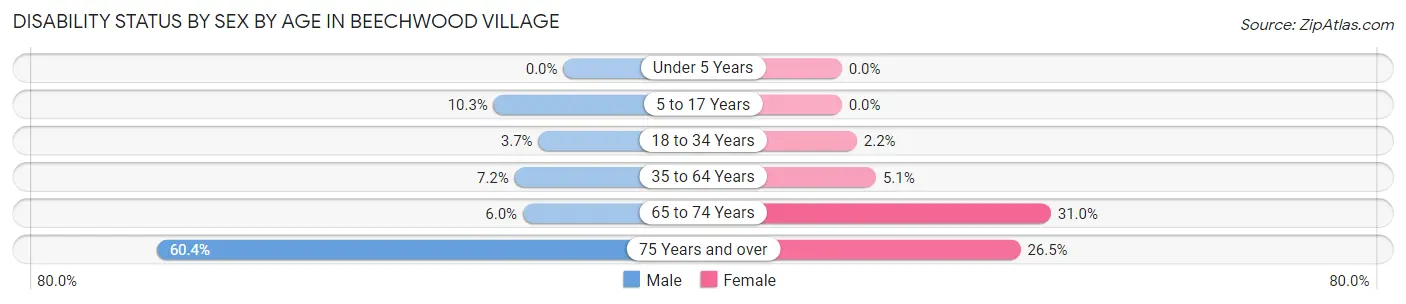
| Age Bracket | Male | Female |
| Under 5 Years | 0 (0.0%) | 0 (0.0%) |
| 5 to 17 Years | 6 (10.3%) | 0 (0.0%) |
| 18 to 34 Years | 5 (3.7%) | 3 (2.2%) |
| 35 to 64 Years | 16 (7.2%) | 14 (5.1%) |
| 65 to 74 Years | 3 (6.0%) | 18 (31.0%) |
| 75 Years and over | 32 (60.4%) | 13 (26.5%) |
Disability Class by Sex by Age in Beechwood Village
Disability Class: Hearing Difficulty
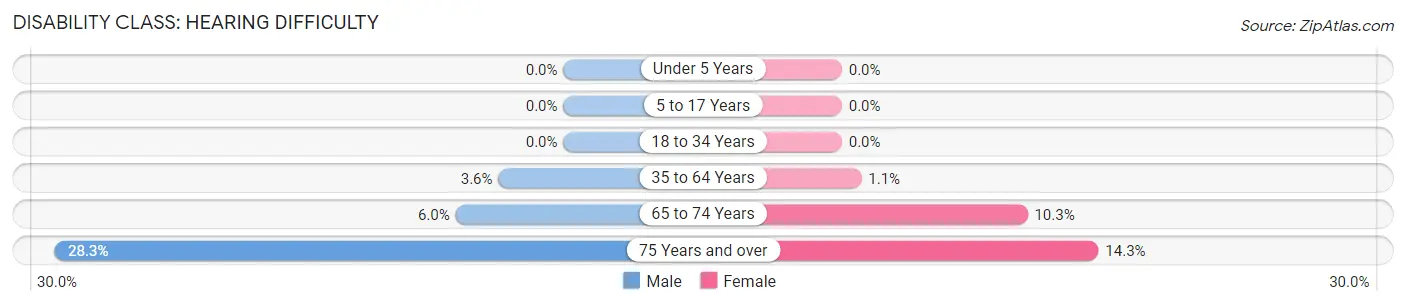
| Age Bracket | Male | Female |
| Under 5 Years | 0 (0.0%) | 0 (0.0%) |
| 5 to 17 Years | 0 (0.0%) | 0 (0.0%) |
| 18 to 34 Years | 0 (0.0%) | 0 (0.0%) |
| 35 to 64 Years | 8 (3.6%) | 3 (1.1%) |
| 65 to 74 Years | 3 (6.0%) | 6 (10.3%) |
| 75 Years and over | 15 (28.3%) | 7 (14.3%) |
Disability Class: Vision Difficulty
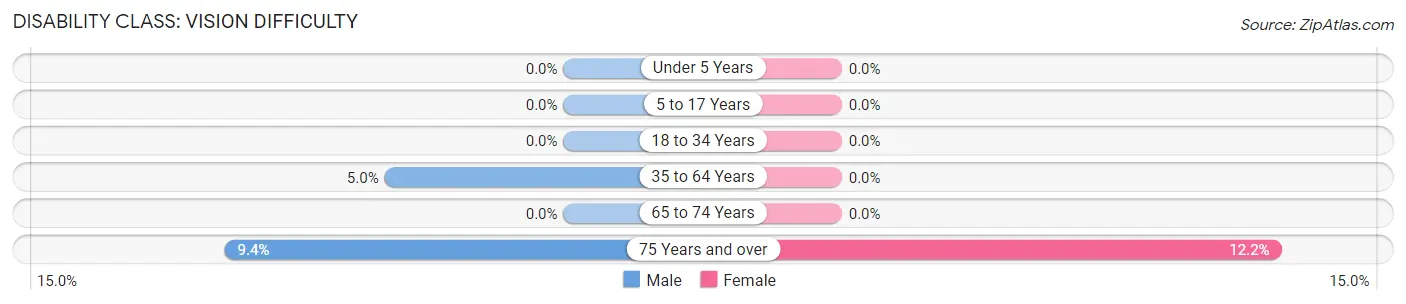
| Age Bracket | Male | Female |
| Under 5 Years | 0 (0.0%) | 0 (0.0%) |
| 5 to 17 Years | 0 (0.0%) | 0 (0.0%) |
| 18 to 34 Years | 0 (0.0%) | 0 (0.0%) |
| 35 to 64 Years | 11 (5.0%) | 0 (0.0%) |
| 65 to 74 Years | 0 (0.0%) | 0 (0.0%) |
| 75 Years and over | 5 (9.4%) | 6 (12.2%) |
Disability Class: Cognitive Difficulty
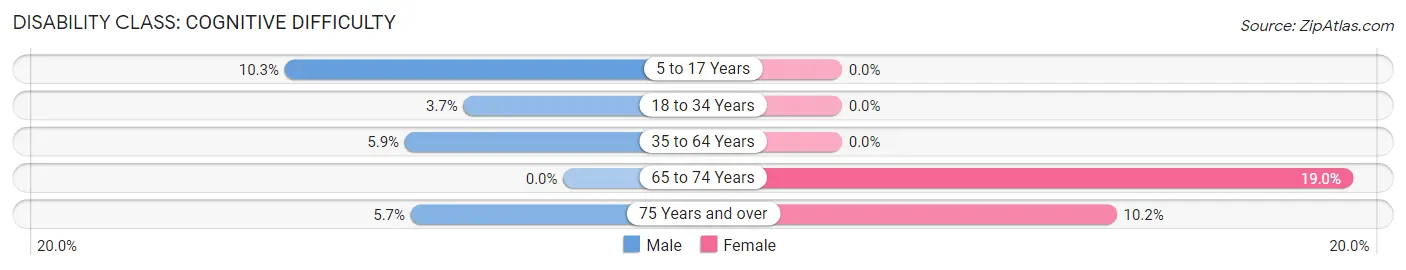
| Age Bracket | Male | Female |
| 5 to 17 Years | 6 (10.3%) | 0 (0.0%) |
| 18 to 34 Years | 5 (3.7%) | 0 (0.0%) |
| 35 to 64 Years | 13 (5.9%) | 0 (0.0%) |
| 65 to 74 Years | 0 (0.0%) | 11 (19.0%) |
| 75 Years and over | 3 (5.7%) | 5 (10.2%) |
Disability Class: Ambulatory Difficulty
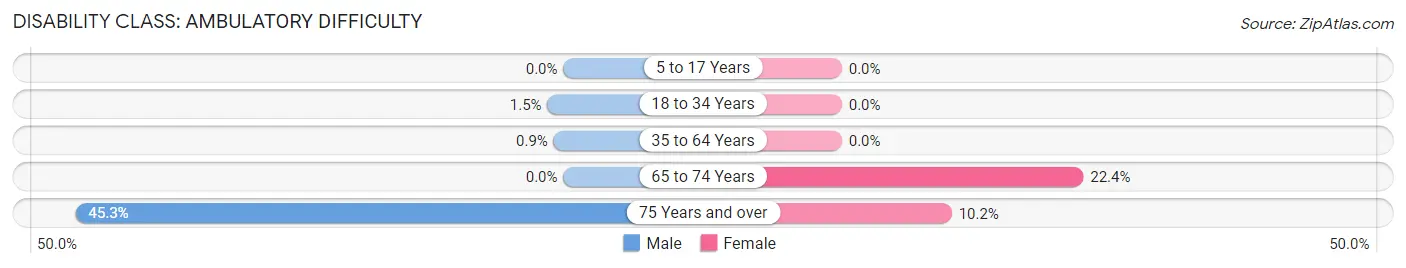
| Age Bracket | Male | Female |
| 5 to 17 Years | 0 (0.0%) | 0 (0.0%) |
| 18 to 34 Years | 2 (1.5%) | 0 (0.0%) |
| 35 to 64 Years | 2 (0.9%) | 0 (0.0%) |
| 65 to 74 Years | 0 (0.0%) | 13 (22.4%) |
| 75 Years and over | 24 (45.3%) | 5 (10.2%) |
Disability Class: Self-Care Difficulty
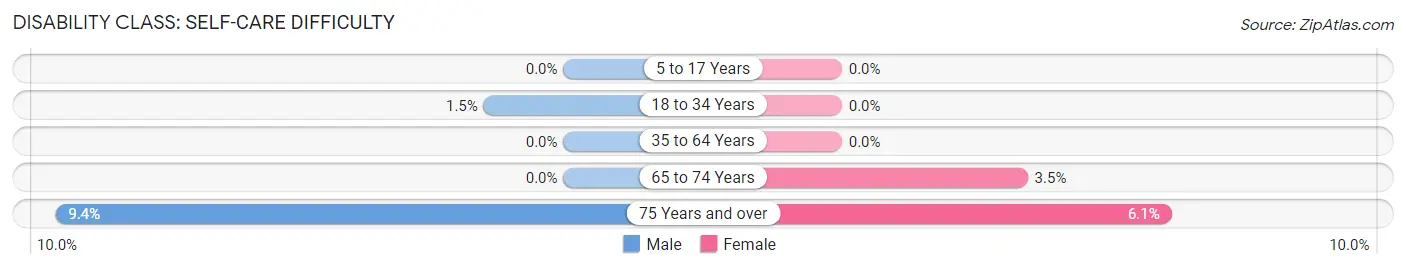
| Age Bracket | Male | Female |
| 5 to 17 Years | 0 (0.0%) | 0 (0.0%) |
| 18 to 34 Years | 2 (1.5%) | 0 (0.0%) |
| 35 to 64 Years | 0 (0.0%) | 0 (0.0%) |
| 65 to 74 Years | 0 (0.0%) | 2 (3.5%) |
| 75 Years and over | 5 (9.4%) | 3 (6.1%) |
Technology Access in Beechwood Village
Computing Device Access in Beechwood Village
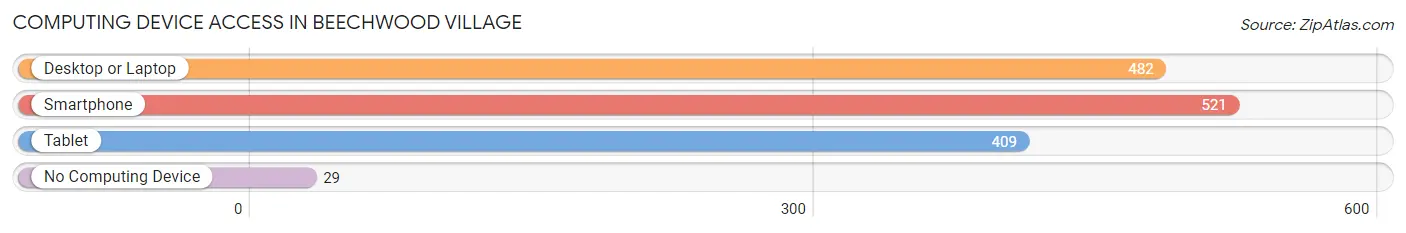
| Device Type | # Households | % Households |
| Desktop or Laptop | 482 | 85.2% |
| Smartphone | 521 | 92.0% |
| Tablet | 409 | 72.3% |
| No Computing Device | 29 | 5.1% |
| Total | 566 | 100.0% |
Internet Access in Beechwood Village
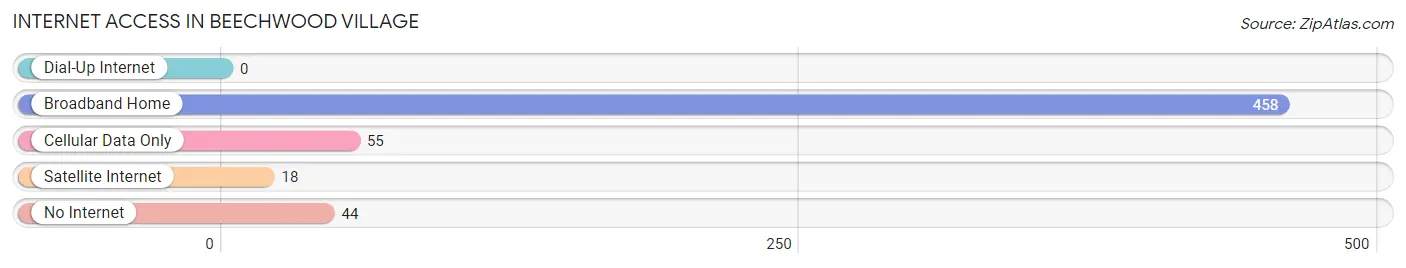
| Internet Type | # Households | % Households |
| Dial-Up Internet | 0 | 0.0% |
| Broadband Home | 458 | 80.9% |
| Cellular Data Only | 55 | 9.7% |
| Satellite Internet | 18 | 3.2% |
| No Internet | 44 | 7.8% |
| Total | 566 | 100.0% |
Beechwood Village Summary
Beechwood Village is a small city located in the state of Kentucky, United States. It is situated in the northern part of the state, in the county of Jefferson. The city has a population of approximately 1,500 people, and is part of the Louisville metropolitan area.
History
Beechwood Village was founded in 1883 by a group of German immigrants who had settled in the area. The city was originally known as Beechwood, and was named after the abundance of beech trees in the area. The city was incorporated in 1887, and the name was changed to Beechwood Village in 1895.
The city was originally a farming community, and the main crops grown were corn, wheat, and tobacco. The city also had a number of small businesses, including a general store, a blacksmith, and a sawmill.
In the early 1900s, the city began to grow and develop. The Louisville and Nashville Railroad built a line through the city, and this helped to spur economic growth. The city also began to attract new businesses, including a bank, a hotel, and a movie theater.
Geography
Beechwood Village is located in the northern part of the state of Kentucky, in the county of Jefferson. The city is situated on the banks of the Ohio River, and is bordered by the cities of Louisville and New Albany. The city has a total area of 1.2 square miles, all of which is land.
The city has a humid subtropical climate, with hot, humid summers and mild winters. The average temperature in the summer is around 80 degrees Fahrenheit, and the average temperature in the winter is around 40 degrees Fahrenheit.
Economy
The economy of Beechwood Village is largely based on the service industry. The city is home to a number of restaurants, bars, and other businesses that cater to the needs of the local population. The city also has a number of retail stores, including a grocery store, a hardware store, and a drug store.
The city is also home to a number of manufacturing companies, including a furniture factory and a printing company. The city also has a number of small businesses, including a bakery, a florist, and a pet store.
Demographics
As of the 2010 census, the population of Beechwood Village was 1,500 people. The racial makeup of the city was 95.3% White, 1.7% African American, 0.7% Asian, 0.3% Native American, and 2.0% from other races. The median household income was $45,000, and the median family income was $50,000.
The city has a large number of elderly residents, with nearly 20% of the population over the age of 65. The city also has a large number of children, with nearly 30% of the population under the age of 18. The city has a low unemployment rate, with only 4.3% of the population unemployed.
Conclusion
Beechwood Village is a small city located in the northern part of the state of Kentucky. The city has a population of approximately 1,500 people, and is part of the Louisville metropolitan area. The city was founded in 1883 by a group of German immigrants, and has since grown and developed into a thriving community. The economy of the city is largely based on the service industry, and the city has a number of small businesses and manufacturing companies. The city also has a large number of elderly and young residents, and a low unemployment rate.
Common Questions
What is Per Capita Income in Beechwood Village?
Per Capita income in Beechwood Village is $69,927.
What is the Median Family Income in Beechwood Village?
Median Family Income in Beechwood Village is $146,184.
What is the Median Household income in Beechwood Village?
Median Household Income in Beechwood Village is $114,375.
What is Income or Wage Gap in Beechwood Village?
Income or Wage Gap in Beechwood Village is 17.2%.
Women in Beechwood Village earn 82.8 cents for every dollar earned by a man.
What is Inequality or Gini Index in Beechwood Village?
Inequality or Gini Index in Beechwood Village is 0.51.
What is the Total Population of Beechwood Village?
Total Population of Beechwood Village is 1,302.
What is the Total Male Population of Beechwood Village?
Total Male Population of Beechwood Village is 542.
What is the Total Female Population of Beechwood Village?
Total Female Population of Beechwood Village is 760.
What is the Ratio of Males per 100 Females in Beechwood Village?
There are 71.32 Males per 100 Females in Beechwood Village.
What is the Ratio of Females per 100 Males in Beechwood Village?
There are 140.22 Females per 100 Males in Beechwood Village.
What is the Median Population Age in Beechwood Village?
Median Population Age in Beechwood Village is 38.4 Years.
What is the Average Family Size in Beechwood Village
Average Family Size in Beechwood Village is 2.9 People.
What is the Average Household Size in Beechwood Village
Average Household Size in Beechwood Village is 2.3 People.
How Large is the Labor Force in Beechwood Village?
There are 700 People in the Labor Forcein in Beechwood Village.
What is the Percentage of People in the Labor Force in Beechwood Village?
70.9% of People are in the Labor Force in Beechwood Village.
What is the Unemployment Rate in Beechwood Village?
Unemployment Rate in Beechwood Village is 2.7%.