Fairfield, KY Map & Demographics
Fairfield Map
Fairfield Overview
$28,090
PER CAPITA INCOME
$85,951
AVG FAMILY INCOME
$85,546
AVG HOUSEHOLD INCOME
0.21
INEQUALITY / GINI INDEX
196
TOTAL POPULATION
78
MALE POPULATION
118
FEMALE POPULATION
66.10
MALES / 100 FEMALES
151.28
FEMALES / 100 MALES
59.7
MEDIAN AGE
1.7
AVG FAMILY SIZE
1.6
AVG HOUSEHOLD SIZE
66
LABOR FORCE [ PEOPLE ]
34.9%
PERCENT IN LABOR FORCE
Fairfield Zip Codes
Fairfield Area Codes
Income in Fairfield
Income Overview in Fairfield
Per Capita Income in Fairfield is $28,090, while median incomes of families and households are $85,951 and $85,546 respectively.
| Characteristic | Number | Measure |
| Per Capita Income | 196 | $28,090 |
| Median Family Income | 98 | $85,951 |
| Mean Family Income | 98 | $82,890 |
| Median Household Income | 121 | $85,546 |
| Mean Household Income | 121 | $75,431 |
| Income Deficit | 98 | $0 |
| Wage / Income Gap (%) | 196 | 0.00% |
| Wage / Income Gap ($) | 196 | 100.00¢ per $1 |
| Gini / Inequality Index | 196 | 0.21 |
Earnings by Sex in Fairfield
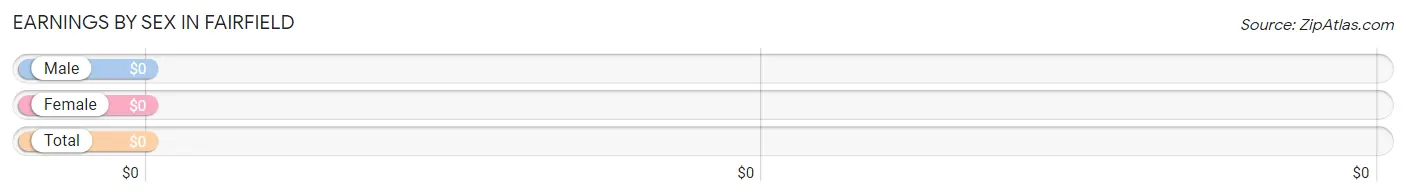
| Sex | Number | Average Earnings |
| Male | 52 (63.4%) | $0 |
| Female | 30 (36.6%) | $0 |
| Total | 82 (100.0%) | $0 |
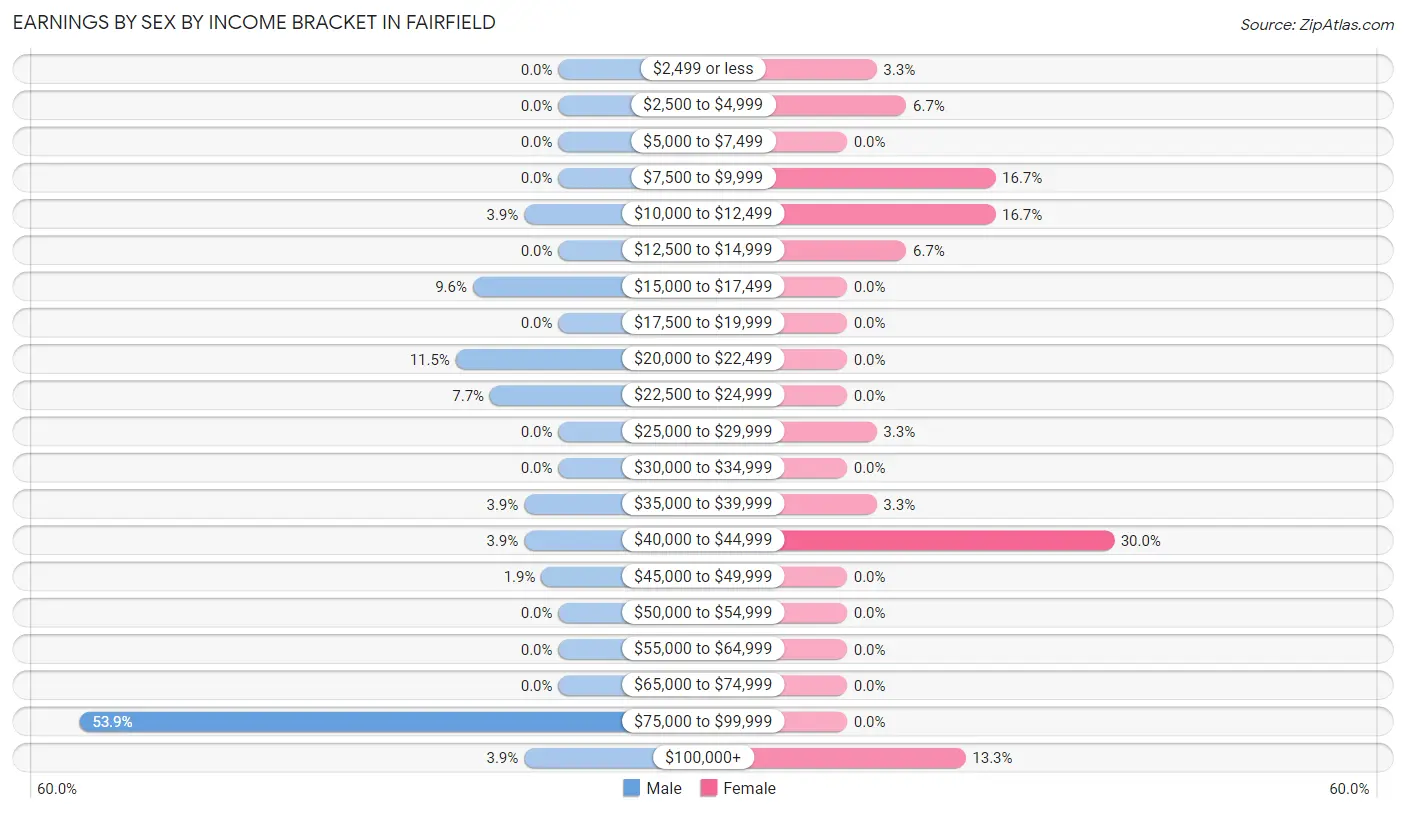
Earnings by Sex by Income Bracket in Fairfield
The most common earnings brackets in Fairfield are $75,000 to $99,999 for men (28 | 53.8%) and $40,000 to $44,999 for women (9 | 30.0%).
| Income | Male | Female |
| $2,499 or less | 0 (0.0%) | 1 (3.3%) |
| $2,500 to $4,999 | 0 (0.0%) | 2 (6.7%) |
| $5,000 to $7,499 | 0 (0.0%) | 0 (0.0%) |
| $7,500 to $9,999 | 0 (0.0%) | 5 (16.7%) |
| $10,000 to $12,499 | 2 (3.8%) | 5 (16.7%) |
| $12,500 to $14,999 | 0 (0.0%) | 2 (6.7%) |
| $15,000 to $17,499 | 5 (9.6%) | 0 (0.0%) |
| $17,500 to $19,999 | 0 (0.0%) | 0 (0.0%) |
| $20,000 to $22,499 | 6 (11.5%) | 0 (0.0%) |
| $22,500 to $24,999 | 4 (7.7%) | 0 (0.0%) |
| $25,000 to $29,999 | 0 (0.0%) | 1 (3.3%) |
| $30,000 to $34,999 | 0 (0.0%) | 0 (0.0%) |
| $35,000 to $39,999 | 2 (3.8%) | 1 (3.3%) |
| $40,000 to $44,999 | 2 (3.8%) | 9 (30.0%) |
| $45,000 to $49,999 | 1 (1.9%) | 0 (0.0%) |
| $50,000 to $54,999 | 0 (0.0%) | 0 (0.0%) |
| $55,000 to $64,999 | 0 (0.0%) | 0 (0.0%) |
| $65,000 to $74,999 | 0 (0.0%) | 0 (0.0%) |
| $75,000 to $99,999 | 28 (53.8%) | 0 (0.0%) |
| $100,000+ | 2 (3.8%) | 4 (13.3%) |
| Total | 52 (100.0%) | 30 (100.0%) |
Earnings by Sex by Educational Attainment in Fairfield
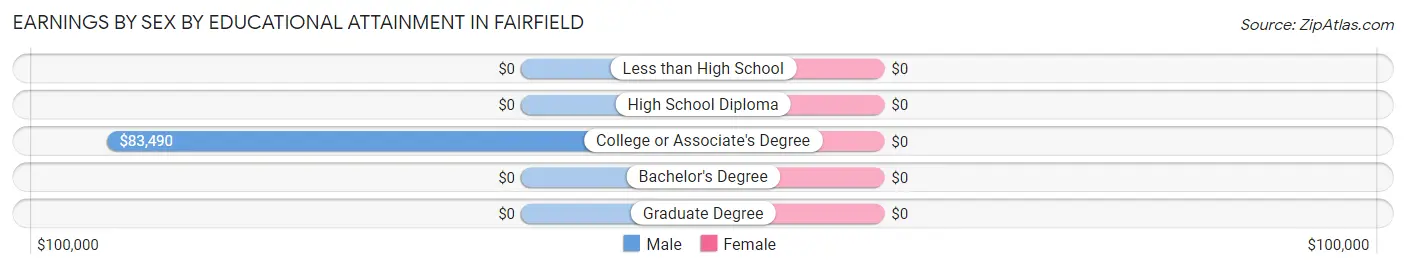
| Educational Attainment | Male Income | Female Income |
| Less than High School | - | - |
| High School Diploma | - | - |
| College or Associate's Degree | $83,490 | $0 |
| Bachelor's Degree | - | - |
| Graduate Degree | - | - |
| Total | $83,125 | $0 |
Family Income in Fairfield
Family Income Brackets in Fairfield
According to the Fairfield family income data, there are 72 families falling into the $75,000 to $99,999 income range, which is the most common income bracket and makes up 73.5% of all families.
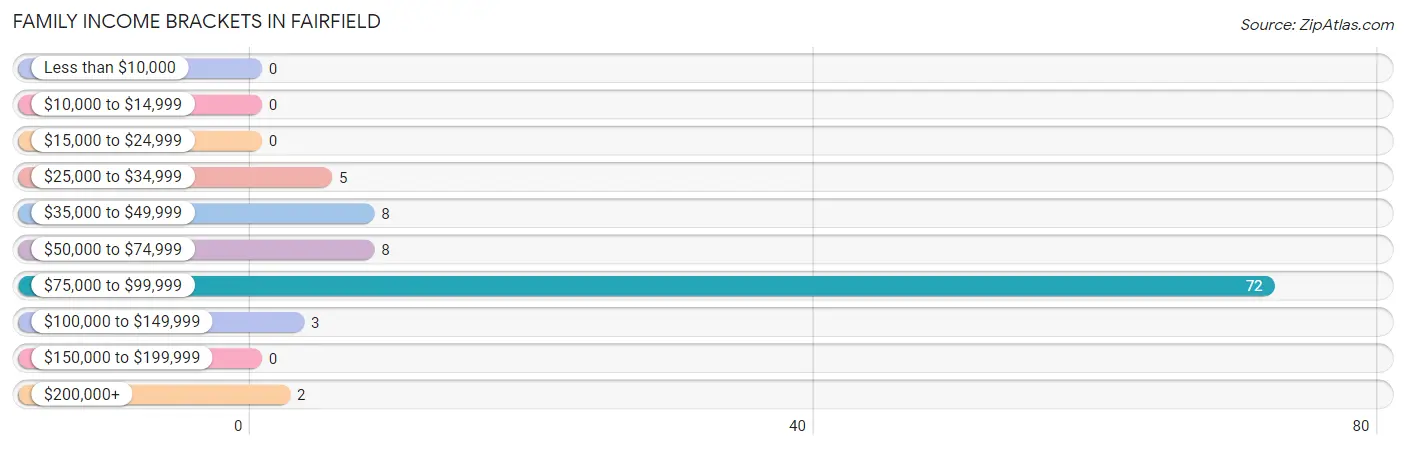
| Income Bracket | # Families | % Families |
| Less than $10,000 | 0 | 0.0% |
| $10,000 to $14,999 | 0 | 0.0% |
| $15,000 to $24,999 | 0 | 0.0% |
| $25,000 to $34,999 | 5 | 5.1% |
| $35,000 to $49,999 | 8 | 8.2% |
| $50,000 to $74,999 | 8 | 8.2% |
| $75,000 to $99,999 | 72 | 73.5% |
| $100,000 to $149,999 | 3 | 3.1% |
| $150,000 to $199,999 | 0 | 0.0% |
| $200,000+ | 2 | 2.0% |
Family Income by Famaliy Size in Fairfield
2-person families (93 | 94.9%) account for the highest median family income in Fairfield with $85,933 per family, while 2-person families (93 | 94.9%) have the highest median income of $42,966 per family member.
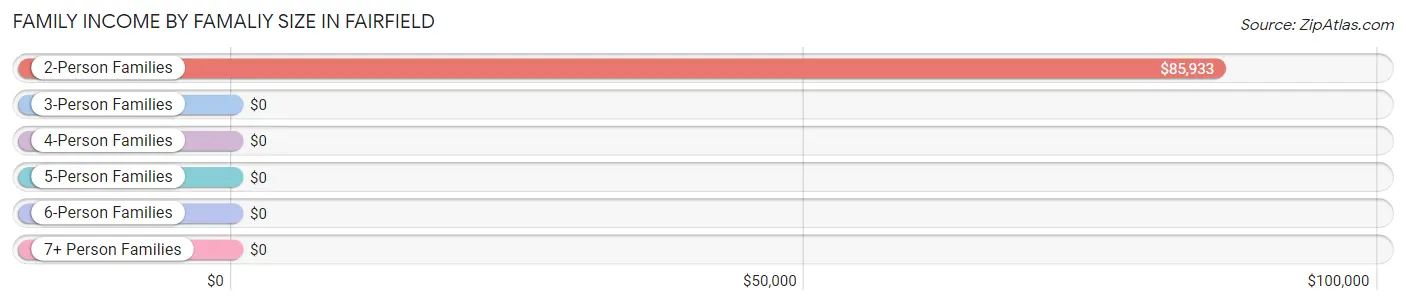
| Income Bracket | # Families | Median Income |
| 2-Person Families | 93 (94.9%) | $85,933 |
| 3-Person Families | 0 (0.0%) | $0 |
| 4-Person Families | 1 (1.0%) | $0 |
| 5-Person Families | 4 (4.1%) | $0 |
| 6-Person Families | 0 (0.0%) | $0 |
| 7+ Person Families | 0 (0.0%) | $0 |
| Total | 98 (100.0%) | $85,951 |
Family Income by Number of Earners in Fairfield
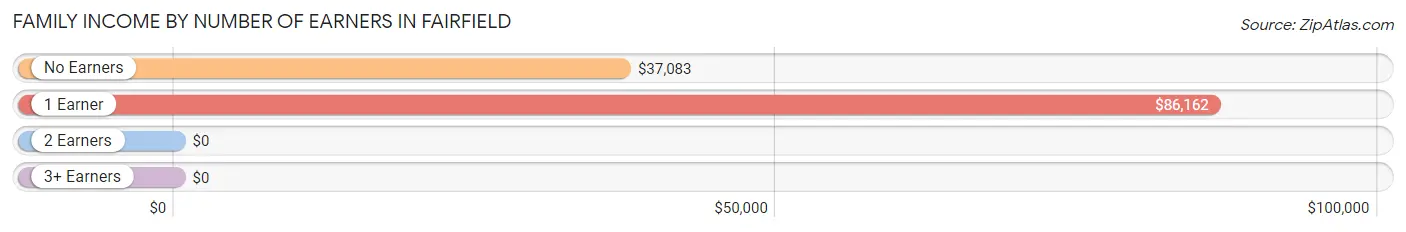
| Number of Earners | # Families | Median Income |
| No Earners | 15 (15.3%) | $37,083 |
| 1 Earner | 76 (77.5%) | $86,162 |
| 2 Earners | 4 (4.1%) | $0 |
| 3+ Earners | 3 (3.1%) | $0 |
| Total | 98 (100.0%) | $85,951 |
Household Income in Fairfield
Household Income Brackets in Fairfield
With 73 households falling in the category, the $75,000 to $99,999 income range is the most frequent in Fairfield, accounting for 60.3% of all households.
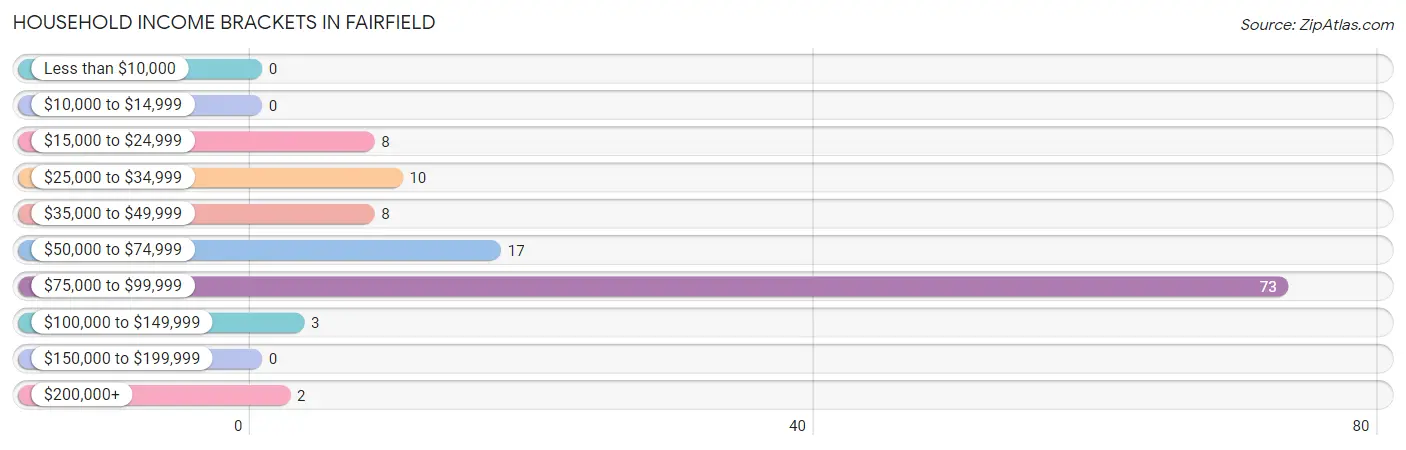
| Income Bracket | # Households | % Households |
| Less than $10,000 | 0 | 0.0% |
| $10,000 to $14,999 | 0 | 0.0% |
| $15,000 to $24,999 | 8 | 6.6% |
| $25,000 to $34,999 | 10 | 8.3% |
| $35,000 to $49,999 | 8 | 6.6% |
| $50,000 to $74,999 | 17 | 14.0% |
| $75,000 to $99,999 | 73 | 60.3% |
| $100,000 to $149,999 | 3 | 2.5% |
| $150,000 to $199,999 | 0 | 0.0% |
| $200,000+ | 2 | 1.7% |
Household Income by Householder Age in Fairfield
The median household income in Fairfield is $85,546, with the highest median household income of $86,232 found in the 45 to 64 years age bracket for the primary householder. A total of 74 households (61.2%) fall into this category.
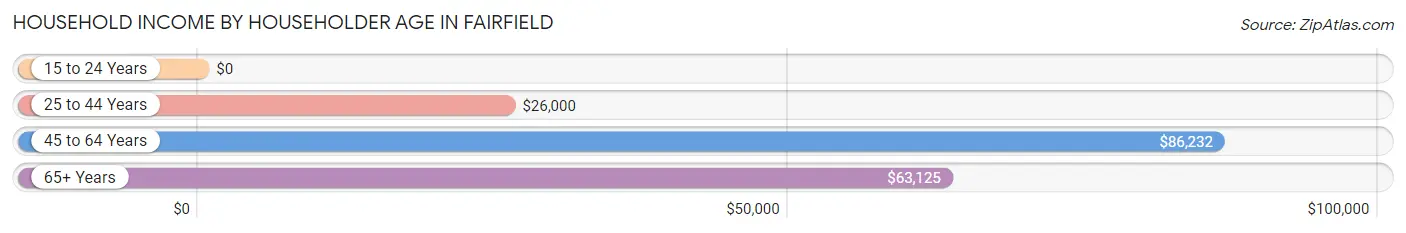
| Income Bracket | # Households | Median Income |
| 15 to 24 Years | 0 (0.0%) | $0 |
| 25 to 44 Years | 16 (13.2%) | $26,000 |
| 45 to 64 Years | 74 (61.2%) | $86,232 |
| 65+ Years | 31 (25.6%) | $63,125 |
| Total | 121 (100.0%) | $85,546 |
Poverty in Fairfield
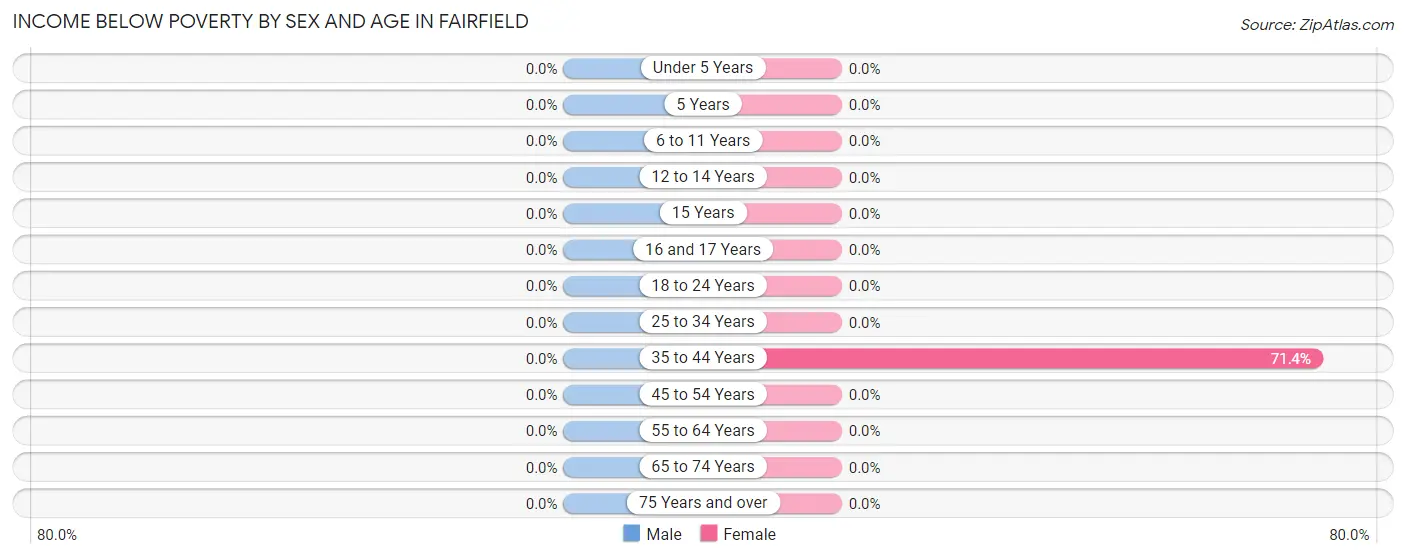
Income Below Poverty by Sex and Age in Fairfield
| Age Bracket | Male | Female |
| Under 5 Years | 0 (0.0%) | 0 (0.0%) |
| 5 Years | 0 (0.0%) | 0 (0.0%) |
| 6 to 11 Years | 0 (0.0%) | 0 (0.0%) |
| 12 to 14 Years | 0 (0.0%) | 0 (0.0%) |
| 15 Years | 0 (0.0%) | 0 (0.0%) |
| 16 and 17 Years | 0 (0.0%) | 0 (0.0%) |
| 18 to 24 Years | 0 (0.0%) | 0 (0.0%) |
| 25 to 34 Years | 0 (0.0%) | 0 (0.0%) |
| 35 to 44 Years | 0 (0.0%) | 5 (71.4%) |
| 45 to 54 Years | 0 (0.0%) | 0 (0.0%) |
| 55 to 64 Years | 0 (0.0%) | 0 (0.0%) |
| 65 to 74 Years | 0 (0.0%) | 0 (0.0%) |
| 75 Years and over | 0 (0.0%) | 0 (0.0%) |
| Total | 0 (0.0%) | 5 (4.2%) |
Income Above Poverty by Sex and Age in Fairfield
According to the poverty statistics in Fairfield, males aged under 5 years and females aged under 5 years are the age groups that are most secure financially, with 100.0% of males and 100.0% of females in these age groups living above the poverty line.
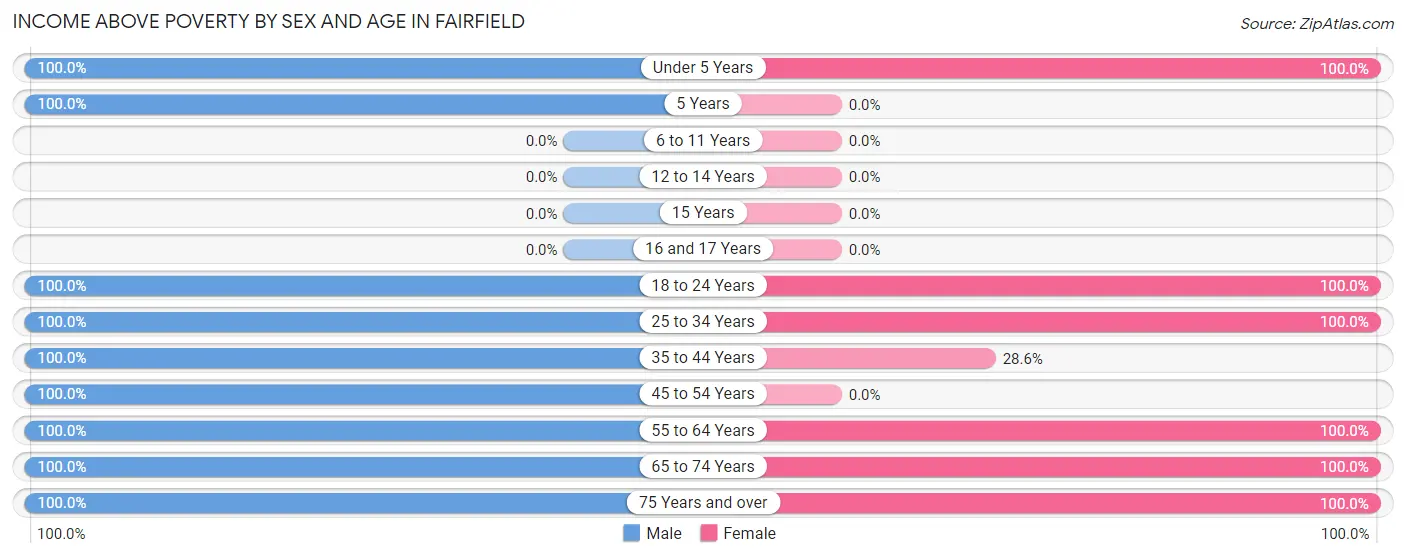
| Age Bracket | Male | Female |
| Under 5 Years | 3 (100.0%) | 2 (100.0%) |
| 5 Years | 2 (100.0%) | 0 (0.0%) |
| 6 to 11 Years | 0 (0.0%) | 0 (0.0%) |
| 12 to 14 Years | 0 (0.0%) | 0 (0.0%) |
| 15 Years | 0 (0.0%) | 0 (0.0%) |
| 16 and 17 Years | 0 (0.0%) | 0 (0.0%) |
| 18 to 24 Years | 4 (100.0%) | 5 (100.0%) |
| 25 to 34 Years | 9 (100.0%) | 3 (100.0%) |
| 35 to 44 Years | 2 (100.0%) | 2 (28.6%) |
| 45 to 54 Years | 2 (100.0%) | 0 (0.0%) |
| 55 to 64 Years | 33 (100.0%) | 72 (100.0%) |
| 65 to 74 Years | 13 (100.0%) | 28 (100.0%) |
| 75 Years and over | 10 (100.0%) | 1 (100.0%) |
| Total | 78 (100.0%) | 113 (95.8%) |
Income Below Poverty Among Married-Couple Families in Fairfield
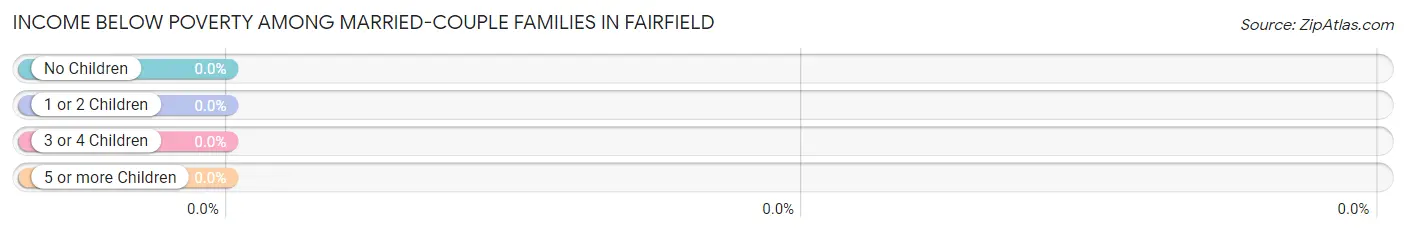
| Children | Above Poverty | Below Poverty |
| No Children | 92 (100.0%) | 0 (0.0%) |
| 1 or 2 Children | 2 (100.0%) | 0 (0.0%) |
| 3 or 4 Children | 2 (100.0%) | 0 (0.0%) |
| 5 or more Children | 0 (0.0%) | 0 (0.0%) |
| Total | 96 (100.0%) | 0 (0.0%) |
Income Below Poverty Among Single-Parent Households in Fairfield
| Children | Single Father | Single Mother |
| No Children | 0 (0.0%) | 0 (0.0%) |
| 1 or 2 Children | 0 (0.0%) | 0 (0.0%) |
| 3 or 4 Children | 0 (0.0%) | 0 (0.0%) |
| 5 or more Children | 0 (0.0%) | 0 (0.0%) |
| Total | 0 (0.0%) | 0 (0.0%) |
Income Below Poverty Among Married-Couple vs Single-Parent Households in Fairfield
| Children | Married-Couple Families | Single-Parent Households |
| No Children | 0 (0.0%) | 0 (0.0%) |
| 1 or 2 Children | 0 (0.0%) | 0 (0.0%) |
| 3 or 4 Children | 0 (0.0%) | 0 (0.0%) |
| 5 or more Children | 0 (0.0%) | 0 (0.0%) |
| Total | 0 (0.0%) | 0 (0.0%) |
Race in Fairfield
The most populous races in Fairfield are White / Caucasian (192 | 98.0%), and Two or more Races (4 | 2.0%).
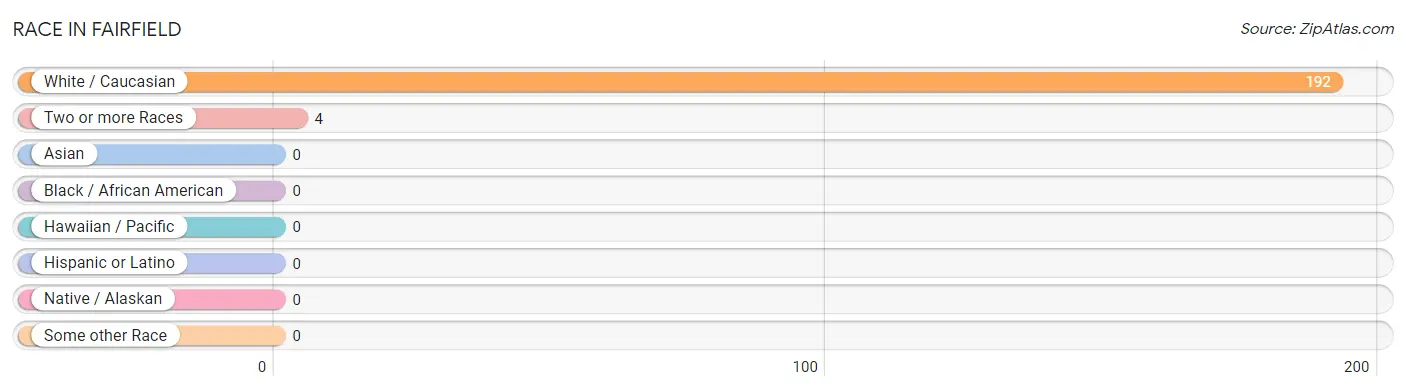
| Race | # Population | % Population |
| Asian | 0 | 0.0% |
| Black / African American | 0 | 0.0% |
| Hawaiian / Pacific | 0 | 0.0% |
| Hispanic or Latino | 0 | 0.0% |
| Native / Alaskan | 0 | 0.0% |
| White / Caucasian | 192 | 98.0% |
| Two or more Races | 4 | 2.0% |
| Some other Race | 0 | 0.0% |
| Total | 196 | 100.0% |
Ancestry in Fairfield
The most populous ancestries reported in Fairfield are German (20 | 10.2%), Irish (17 | 8.7%), American (13 | 6.6%), French (10 | 5.1%), and European (9 | 4.6%), together accounting for 35.2% of all Fairfield residents.
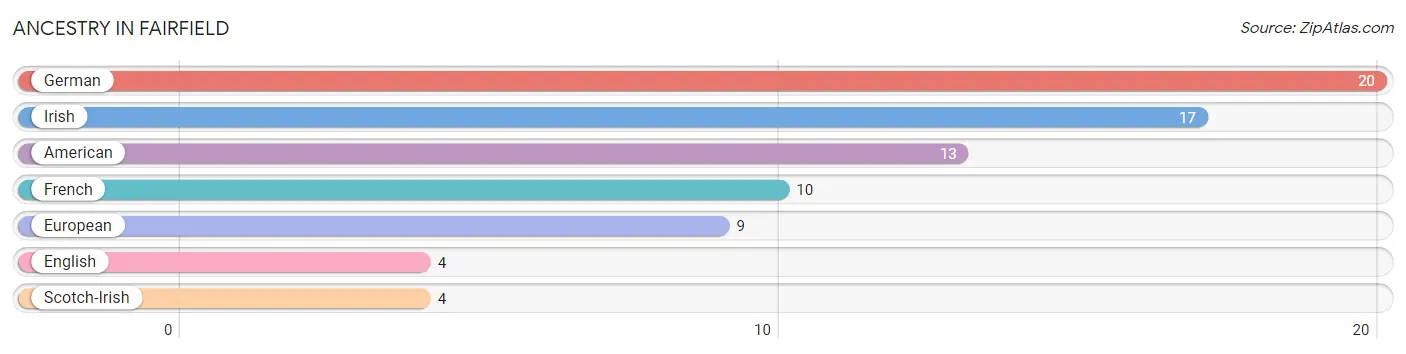
| Ancestry | # Population | % Population |
| American | 13 | 6.6% |
| English | 4 | 2.0% |
| European | 9 | 4.6% |
| French | 10 | 5.1% |
| German | 20 | 10.2% |
| Irish | 17 | 8.7% |
| Scotch-Irish | 4 | 2.0% | View All 7 Rows |
Immigrants in Fairfield

| Immigration Origin | # Population | % Population | View All 0 Rows |
Sex and Age in Fairfield
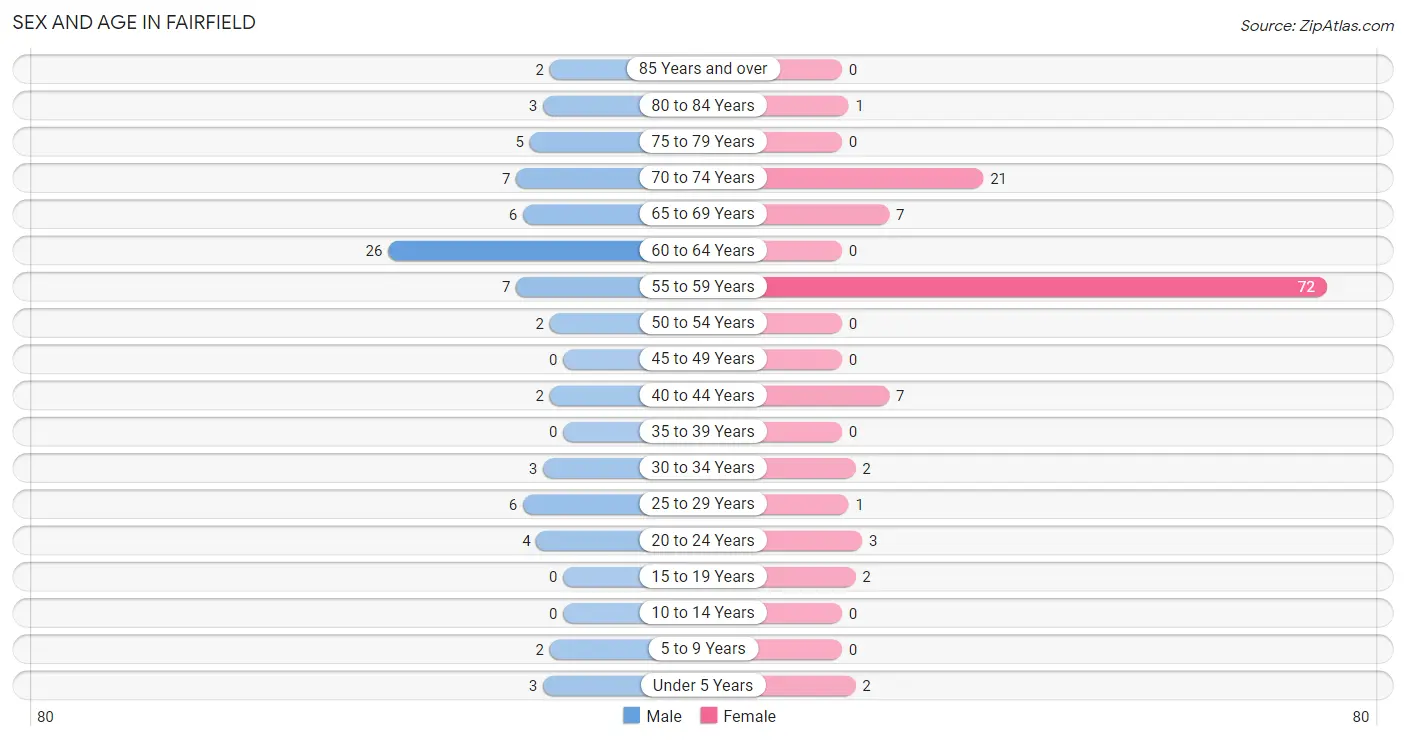
Sex and Age in Fairfield
The most populous age groups in Fairfield are 60 to 64 Years (26 | 33.3%) for men and 55 to 59 Years (72 | 61.0%) for women.
| Age Bracket | Male | Female |
| Under 5 Years | 3 (3.8%) | 2 (1.7%) |
| 5 to 9 Years | 2 (2.6%) | 0 (0.0%) |
| 10 to 14 Years | 0 (0.0%) | 0 (0.0%) |
| 15 to 19 Years | 0 (0.0%) | 2 (1.7%) |
| 20 to 24 Years | 4 (5.1%) | 3 (2.5%) |
| 25 to 29 Years | 6 (7.7%) | 1 (0.9%) |
| 30 to 34 Years | 3 (3.8%) | 2 (1.7%) |
| 35 to 39 Years | 0 (0.0%) | 0 (0.0%) |
| 40 to 44 Years | 2 (2.6%) | 7 (5.9%) |
| 45 to 49 Years | 0 (0.0%) | 0 (0.0%) |
| 50 to 54 Years | 2 (2.6%) | 0 (0.0%) |
| 55 to 59 Years | 7 (9.0%) | 72 (61.0%) |
| 60 to 64 Years | 26 (33.3%) | 0 (0.0%) |
| 65 to 69 Years | 6 (7.7%) | 7 (5.9%) |
| 70 to 74 Years | 7 (9.0%) | 21 (17.8%) |
| 75 to 79 Years | 5 (6.4%) | 0 (0.0%) |
| 80 to 84 Years | 3 (3.8%) | 1 (0.9%) |
| 85 Years and over | 2 (2.6%) | 0 (0.0%) |
| Total | 78 (100.0%) | 118 (100.0%) |
Families and Households in Fairfield
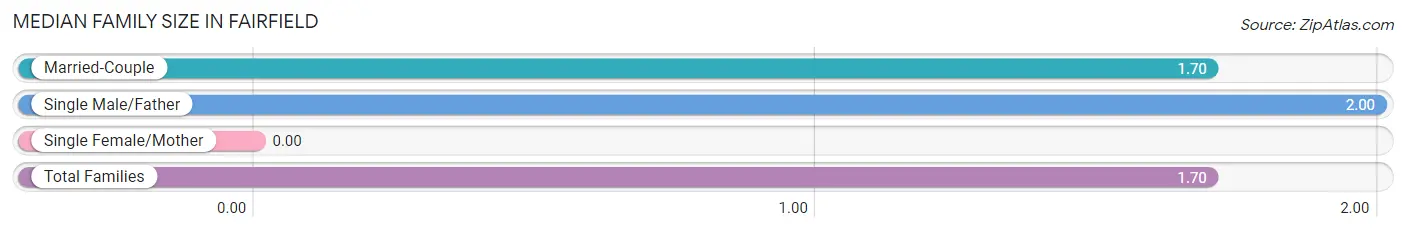
Median Family Size in Fairfield
| Family Type | # Families | Family Size |
| Married-Couple | 96 (98.0%) | 1.70 |
| Single Male/Father | 2 (2.0%) | 2.00 |
| Single Female/Mother | 0 (0.0%) | - |
| Total Families | 98 (100.0%) | 1.70 |
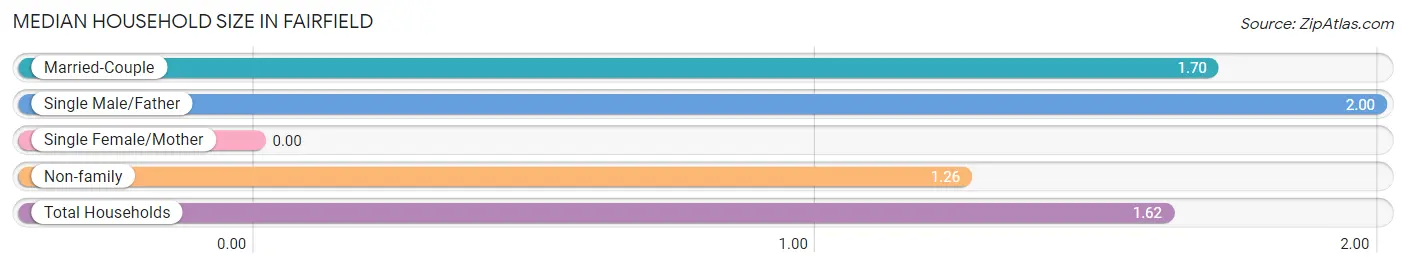
Median Household Size in Fairfield
| Household Type | # Households | Household Size |
| Married-Couple | 96 (79.3%) | 1.70 |
| Single Male/Father | 2 (1.7%) | 2.00 |
| Single Female/Mother | 0 (0.0%) | - |
| Non-family | 23 (19.0%) | 1.26 |
| Total Households | 121 (100.0%) | 1.62 |
Household Size by Marriage Status in Fairfield
Out of a total of 121 households in Fairfield, 98 (81.0%) are family households, while 23 (19.0%) are nonfamily households. The most numerous type of family households are 2-person households, comprising 93, and the most common type of nonfamily households are 1-person households, comprising 17.
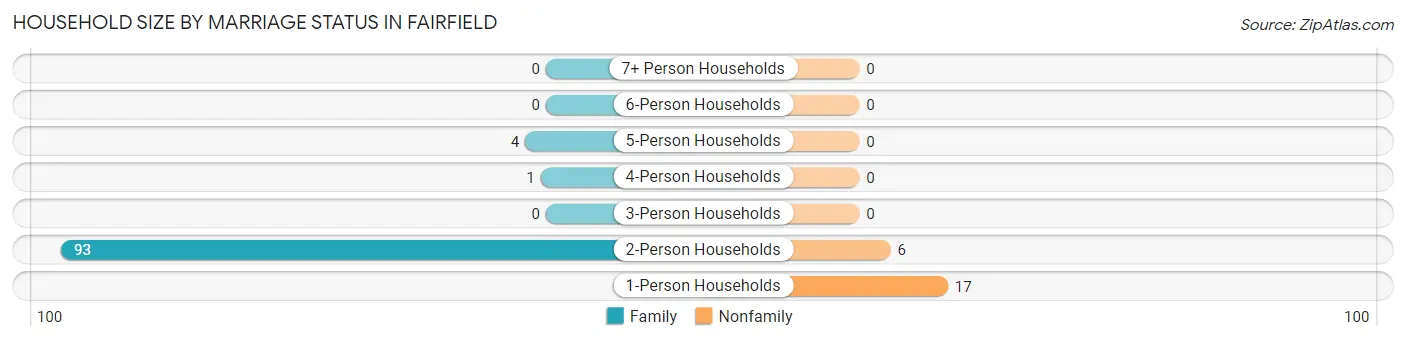
| Household Size | Family Households | Nonfamily Households |
| 1-Person Households | - | 17 (14.1%) |
| 2-Person Households | 93 (76.9%) | 6 (5.0%) |
| 3-Person Households | 0 (0.0%) | 0 (0.0%) |
| 4-Person Households | 1 (0.8%) | 0 (0.0%) |
| 5-Person Households | 4 (3.3%) | 0 (0.0%) |
| 6-Person Households | 0 (0.0%) | 0 (0.0%) |
| 7+ Person Households | 0 (0.0%) | 0 (0.0%) |
| Total | 98 (81.0%) | 23 (19.0%) |
Female Fertility in Fairfield
Fertility by Age in Fairfield
Average fertility rate in Fairfield is 133.0 births per 1,000 women. Women in the age bracket of 20 to 34 years have the highest fertility rate with 333.0 births per 1,000 women. Women in the age bracket of 20 to 34 years acount for 100.0% of all women with births.
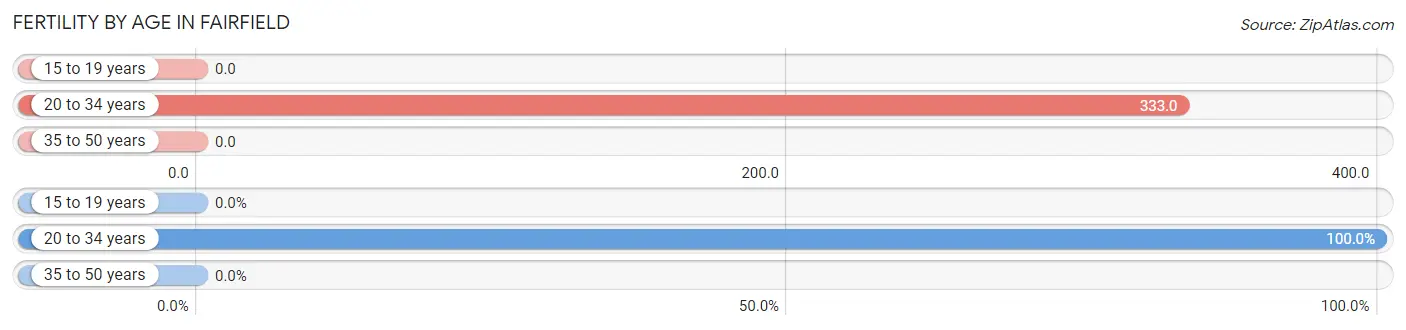
| Age Bracket | Women with Births | Births / 1,000 Women |
| 15 to 19 years | 0 (0.0%) | 0.0 |
| 20 to 34 years | 2 (100.0%) | 333.0 |
| 35 to 50 years | 0 (0.0%) | 0.0 |
| Total | 2 (100.0%) | 133.0 |
Fertility by Age by Marriage Status in Fairfield
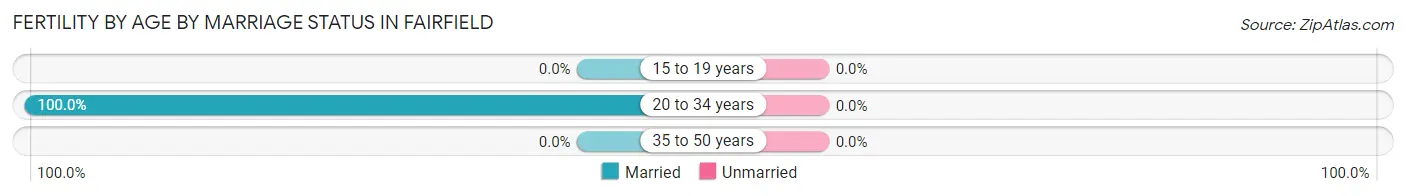
| Age Bracket | Married | Unmarried |
| 15 to 19 years | 0 (0.0%) | 0 (0.0%) |
| 20 to 34 years | 2 (100.0%) | 0 (0.0%) |
| 35 to 50 years | 0 (0.0%) | 0 (0.0%) |
| Total | 2 (100.0%) | 0 (0.0%) |
Fertility by Education in Fairfield
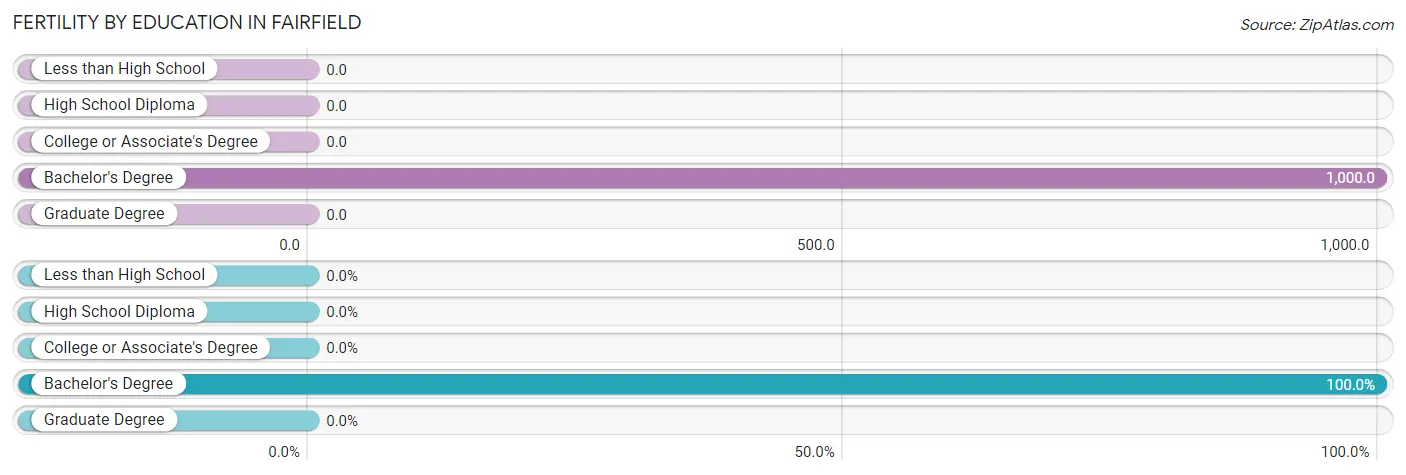
| Educational Attainment | Women with Births | Births / 1,000 Women |
| Less than High School | 0 (0.0%) | 0.0 |
| High School Diploma | 0 (0.0%) | 0.0 |
| College or Associate's Degree | 0 (0.0%) | 0.0 |
| Bachelor's Degree | 2 (100.0%) | 1,000.0 |
| Graduate Degree | 0 (0.0%) | 0.0 |
| Total | 2 (100.0%) | 133.0 |
Fertility by Education by Marriage Status in Fairfield
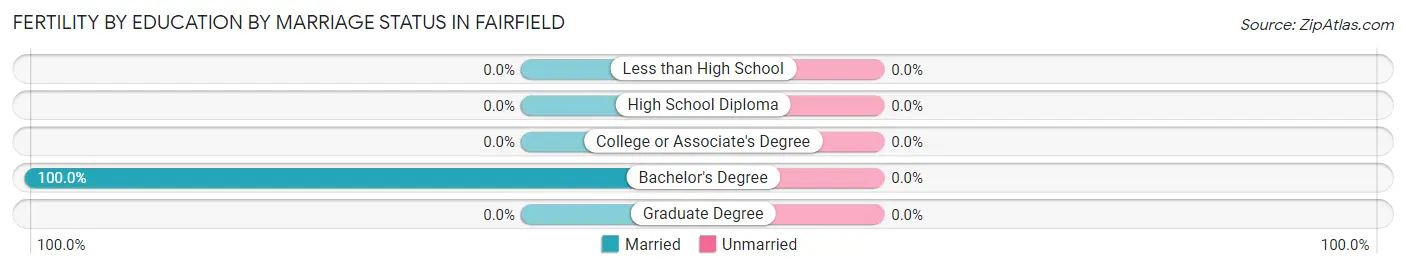
| Educational Attainment | Married | Unmarried |
| Less than High School | 0 (0.0%) | 0 (0.0%) |
| High School Diploma | 0 (0.0%) | 0 (0.0%) |
| College or Associate's Degree | 0 (0.0%) | 0 (0.0%) |
| Bachelor's Degree | 2 (100.0%) | 0 (0.0%) |
| Graduate Degree | 0 (0.0%) | 0 (0.0%) |
| Total | 2 (100.0%) | 0 (0.0%) |
Employment Characteristics in Fairfield
Employment by Class of Employer in Fairfield
Among the 66 employed individuals in Fairfield, private company employees (59 | 89.4%), self-employed (incorporated) (4 | 6.1%), and not-for-profit organizations (2 | 3.0%) make up the most common classes of employment.
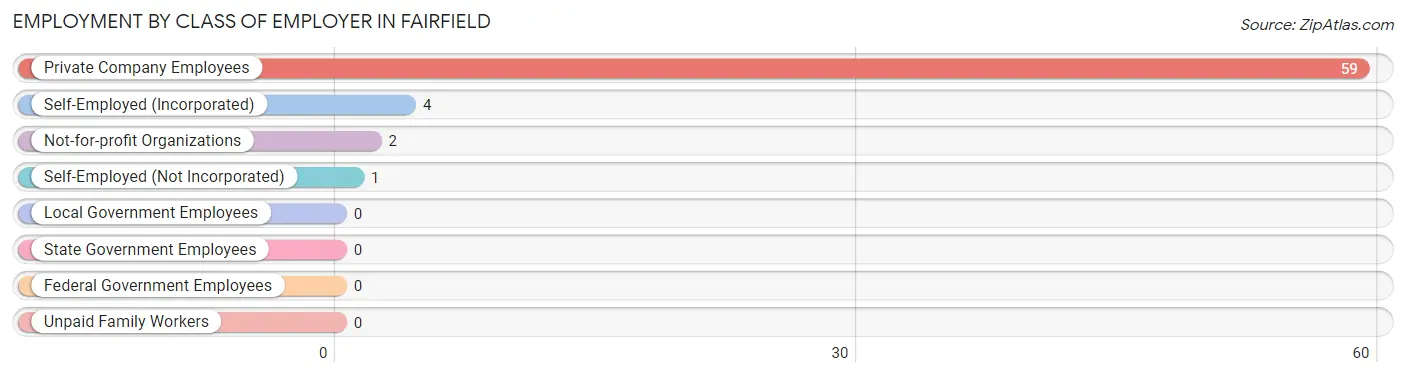
| Employer Class | # Employees | % Employees |
| Private Company Employees | 59 | 89.4% |
| Self-Employed (Incorporated) | 4 | 6.1% |
| Self-Employed (Not Incorporated) | 1 | 1.5% |
| Not-for-profit Organizations | 2 | 3.0% |
| Local Government Employees | 0 | 0.0% |
| State Government Employees | 0 | 0.0% |
| Federal Government Employees | 0 | 0.0% |
| Unpaid Family Workers | 0 | 0.0% |
| Total | 66 | 100.0% |
Employment Status by Age in Fairfield
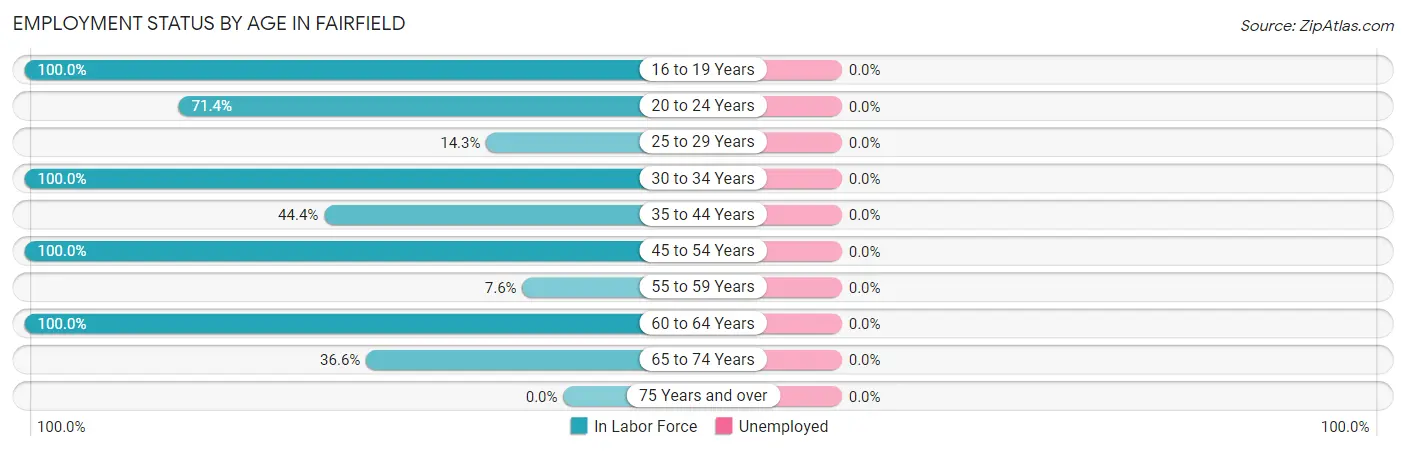
| Age Bracket | In Labor Force | Unemployed |
| 16 to 19 Years | 2 (100.0%) | 0 (0.0%) |
| 20 to 24 Years | 5 (71.4%) | 0 (0.0%) |
| 25 to 29 Years | 1 (14.3%) | 0 (0.0%) |
| 30 to 34 Years | 5 (100.0%) | 0 (0.0%) |
| 35 to 44 Years | 4 (44.4%) | 0 (0.0%) |
| 45 to 54 Years | 2 (100.0%) | 0 (0.0%) |
| 55 to 59 Years | 6 (7.6%) | 0 (0.0%) |
| 60 to 64 Years | 26 (100.0%) | 0 (0.0%) |
| 65 to 74 Years | 15 (36.6%) | 0 (0.0%) |
| 75 Years and over | 0 (0.0%) | 0 (0.0%) |
| Total | 66 (34.9%) | 0 (0.0%) |
Employment Status by Educational Attainment in Fairfield
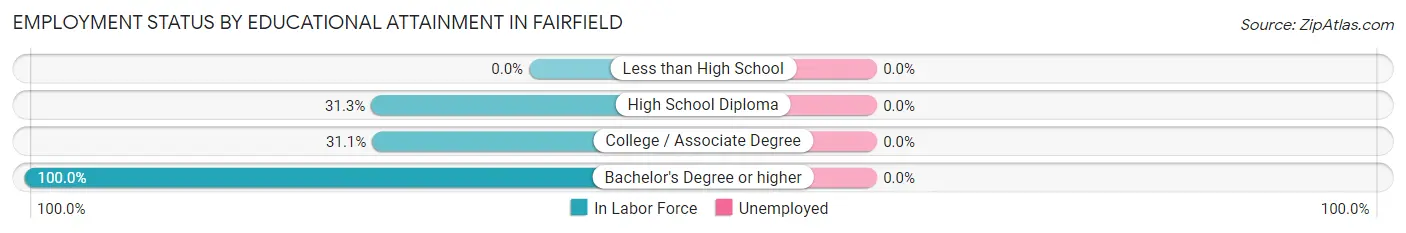
| Educational Attainment | In Labor Force | Unemployed |
| Less than High School | 0 (0.0%) | 0 (0.0%) |
| High School Diploma | 5 (31.3%) | 0 (0.0%) |
| College / Associate Degree | 33 (31.1%) | 0 (0.0%) |
| Bachelor's Degree or higher | 6 (100.0%) | 0 (0.0%) |
| Total | 44 (34.4%) | 0 (0.0%) |
Employment Occupations by Sex in Fairfield
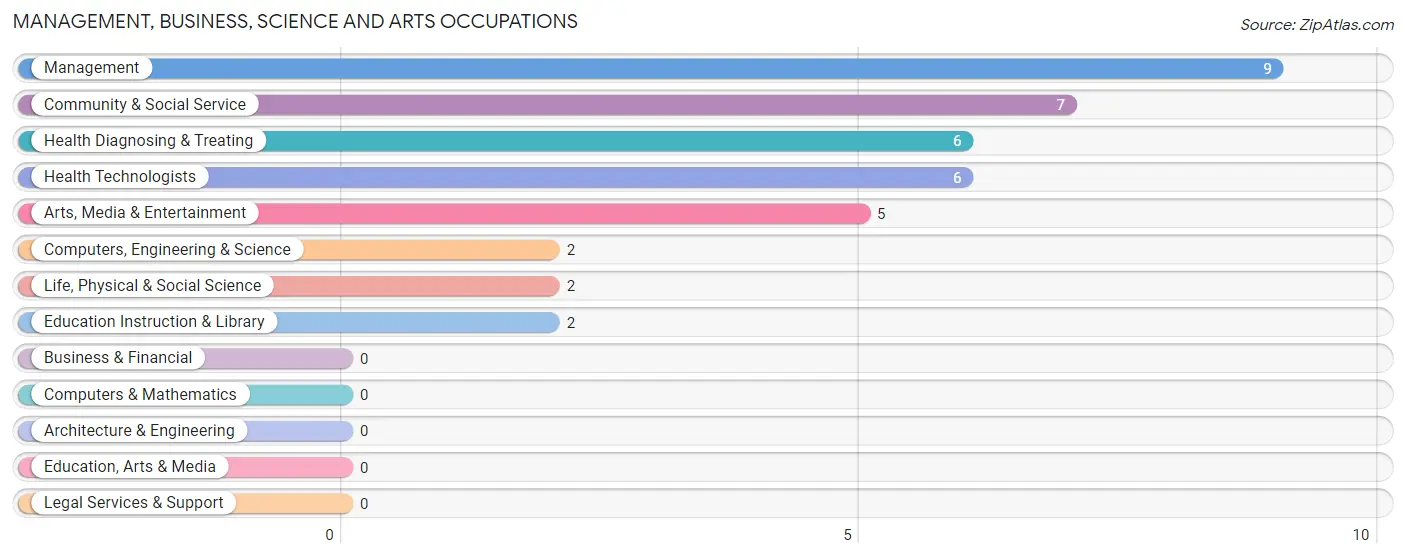
Management, Business, Science and Arts Occupations
The most common Management, Business, Science and Arts occupations in Fairfield are Management (9 | 13.6%), Community & Social Service (7 | 10.6%), Health Diagnosing & Treating (6 | 9.1%), Health Technologists (6 | 9.1%), and Arts, Media & Entertainment (5 | 7.6%).
Management, Business, Science and Arts Occupations by Sex
Within the Management, Business, Science and Arts occupations in Fairfield, the most male-oriented occupations are Computers, Engineering & Science (100.0%), Life, Physical & Social Science (100.0%), and Education Instruction & Library (100.0%), while the most female-oriented occupations are Management (100.0%), Arts, Media & Entertainment (100.0%), and Health Diagnosing & Treating (100.0%).
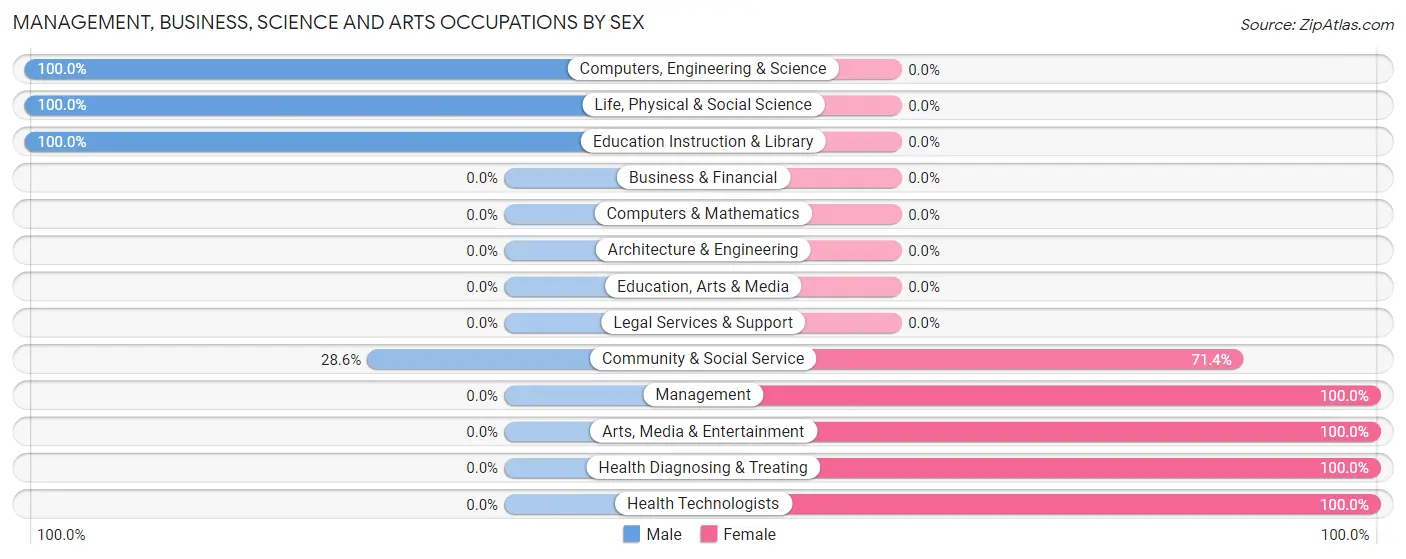
| Occupation | Male | Female |
| Management | 0 (0.0%) | 9 (100.0%) |
| Business & Financial | 0 (0.0%) | 0 (0.0%) |
| Computers, Engineering & Science | 2 (100.0%) | 0 (0.0%) |
| Computers & Mathematics | 0 (0.0%) | 0 (0.0%) |
| Architecture & Engineering | 0 (0.0%) | 0 (0.0%) |
| Life, Physical & Social Science | 2 (100.0%) | 0 (0.0%) |
| Community & Social Service | 2 (28.6%) | 5 (71.4%) |
| Education, Arts & Media | 0 (0.0%) | 0 (0.0%) |
| Legal Services & Support | 0 (0.0%) | 0 (0.0%) |
| Education Instruction & Library | 2 (100.0%) | 0 (0.0%) |
| Arts, Media & Entertainment | 0 (0.0%) | 5 (100.0%) |
| Health Diagnosing & Treating | 0 (0.0%) | 6 (100.0%) |
| Health Technologists | 0 (0.0%) | 6 (100.0%) |
| Total (Category) | 4 (16.7%) | 20 (83.3%) |
| Total (Overall) | 42 (63.6%) | 24 (36.4%) |
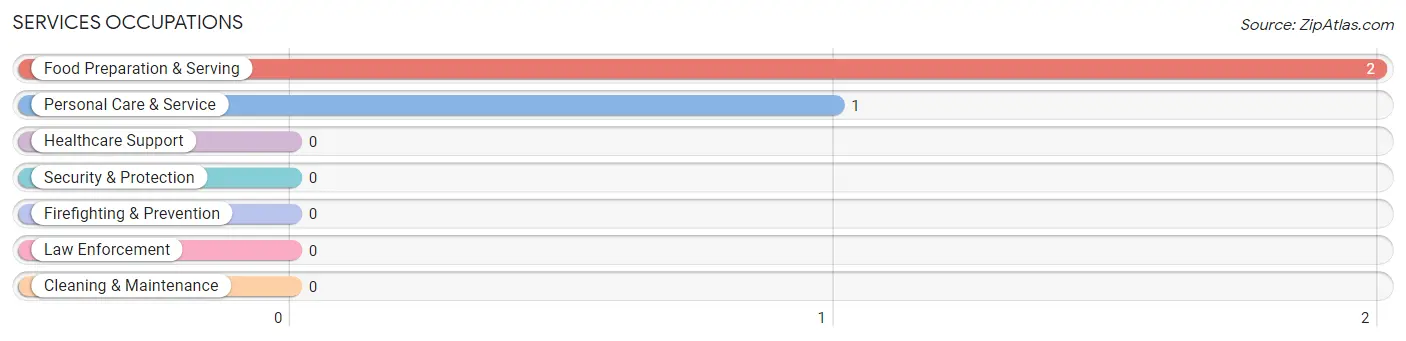
Services Occupations
The most common Services occupations in Fairfield are Food Preparation & Serving (2 | 3.0%), and Personal Care & Service (1 | 1.5%).
Services Occupations by Sex
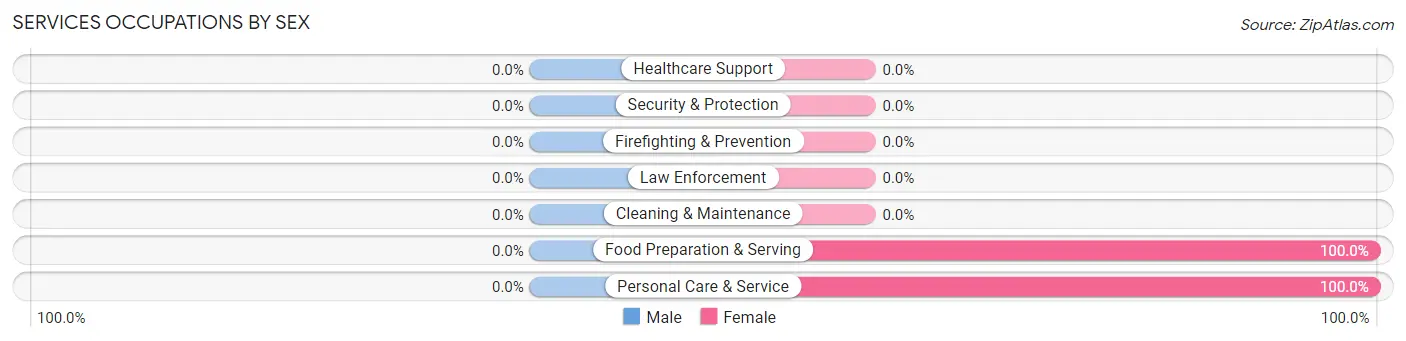
| Occupation | Male | Female |
| Healthcare Support | 0 (0.0%) | 0 (0.0%) |
| Security & Protection | 0 (0.0%) | 0 (0.0%) |
| Firefighting & Prevention | 0 (0.0%) | 0 (0.0%) |
| Law Enforcement | 0 (0.0%) | 0 (0.0%) |
| Food Preparation & Serving | 0 (0.0%) | 2 (100.0%) |
| Cleaning & Maintenance | 0 (0.0%) | 0 (0.0%) |
| Personal Care & Service | 0 (0.0%) | 1 (100.0%) |
| Total (Category) | 0 (0.0%) | 3 (100.0%) |
| Total (Overall) | 42 (63.6%) | 24 (36.4%) |
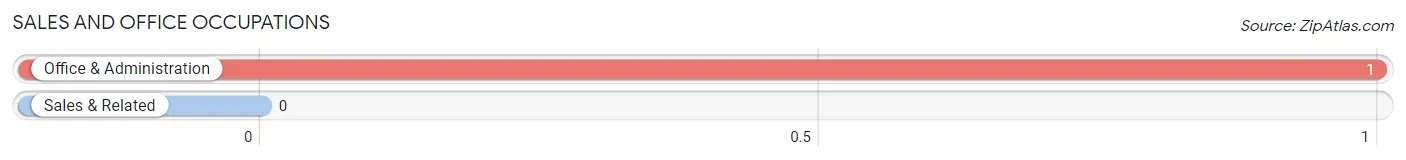
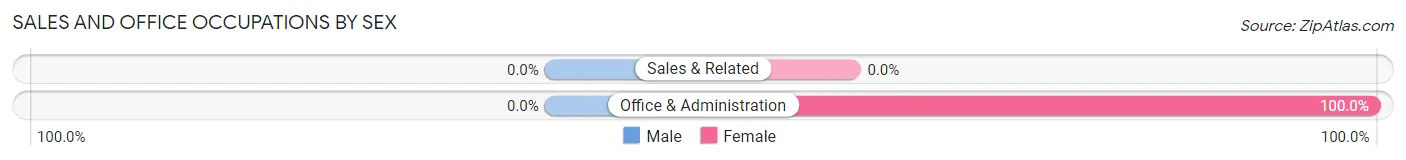
Sales and Office Occupations
The most common Sales and Office occupations in Fairfield are , and Office & Administration (1 | 1.5%).
Sales and Office Occupations by Sex
| Occupation | Male | Female |
| Sales & Related | 0 (0.0%) | 0 (0.0%) |
| Office & Administration | 0 (0.0%) | 1 (100.0%) |
| Total (Category) | 0 (0.0%) | 1 (100.0%) |
| Total (Overall) | 42 (63.6%) | 24 (36.4%) |
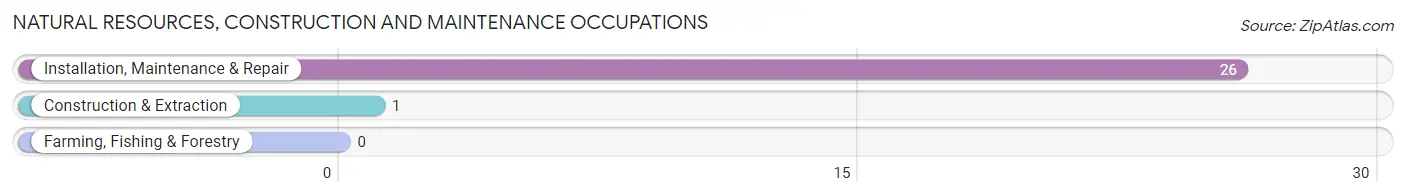
Natural Resources, Construction and Maintenance Occupations
The most common Natural Resources, Construction and Maintenance occupations in Fairfield are Installation, Maintenance & Repair (26 | 39.4%), and Construction & Extraction (1 | 1.5%).
Natural Resources, Construction and Maintenance Occupations by Sex
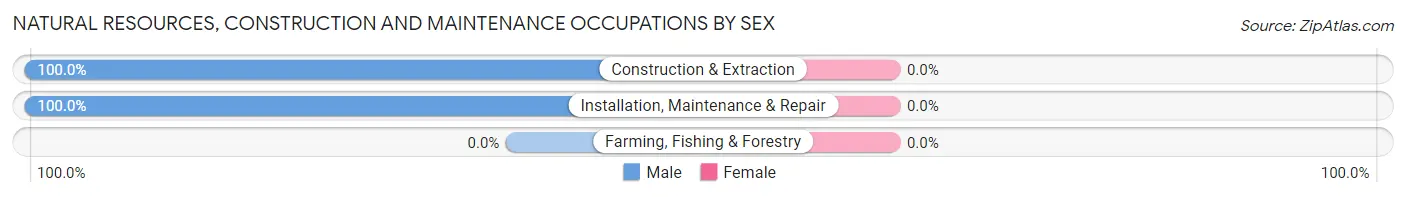
| Occupation | Male | Female |
| Farming, Fishing & Forestry | 0 (0.0%) | 0 (0.0%) |
| Construction & Extraction | 1 (100.0%) | 0 (0.0%) |
| Installation, Maintenance & Repair | 26 (100.0%) | 0 (0.0%) |
| Total (Category) | 27 (100.0%) | 0 (0.0%) |
| Total (Overall) | 42 (63.6%) | 24 (36.4%) |
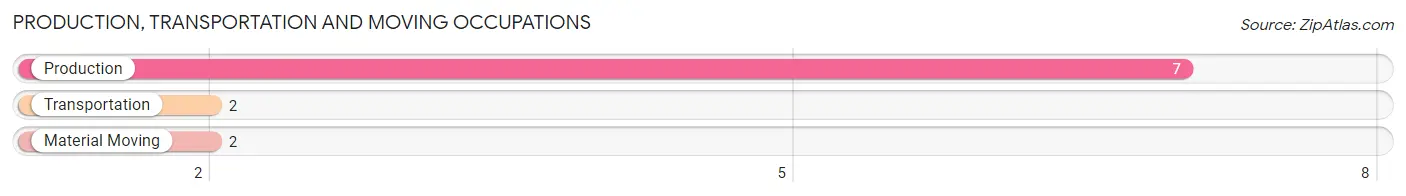
Production, Transportation and Moving Occupations
The most common Production, Transportation and Moving occupations in Fairfield are Production (7 | 10.6%), Transportation (2 | 3.0%), and Material Moving (2 | 3.0%).
Production, Transportation and Moving Occupations by Sex
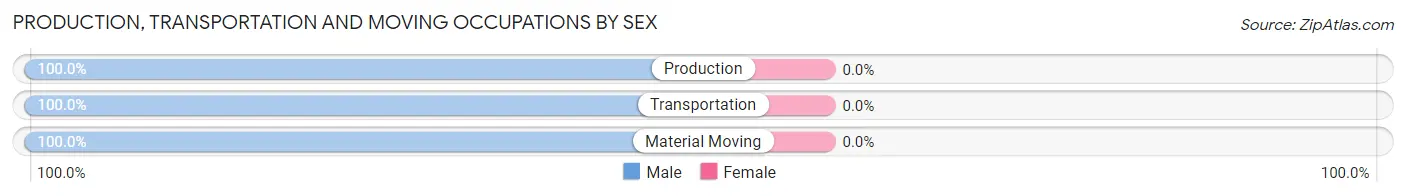
| Occupation | Male | Female |
| Production | 7 (100.0%) | 0 (0.0%) |
| Transportation | 2 (100.0%) | 0 (0.0%) |
| Material Moving | 2 (100.0%) | 0 (0.0%) |
| Total (Category) | 11 (100.0%) | 0 (0.0%) |
| Total (Overall) | 42 (63.6%) | 24 (36.4%) |
Employment Industries by Sex in Fairfield
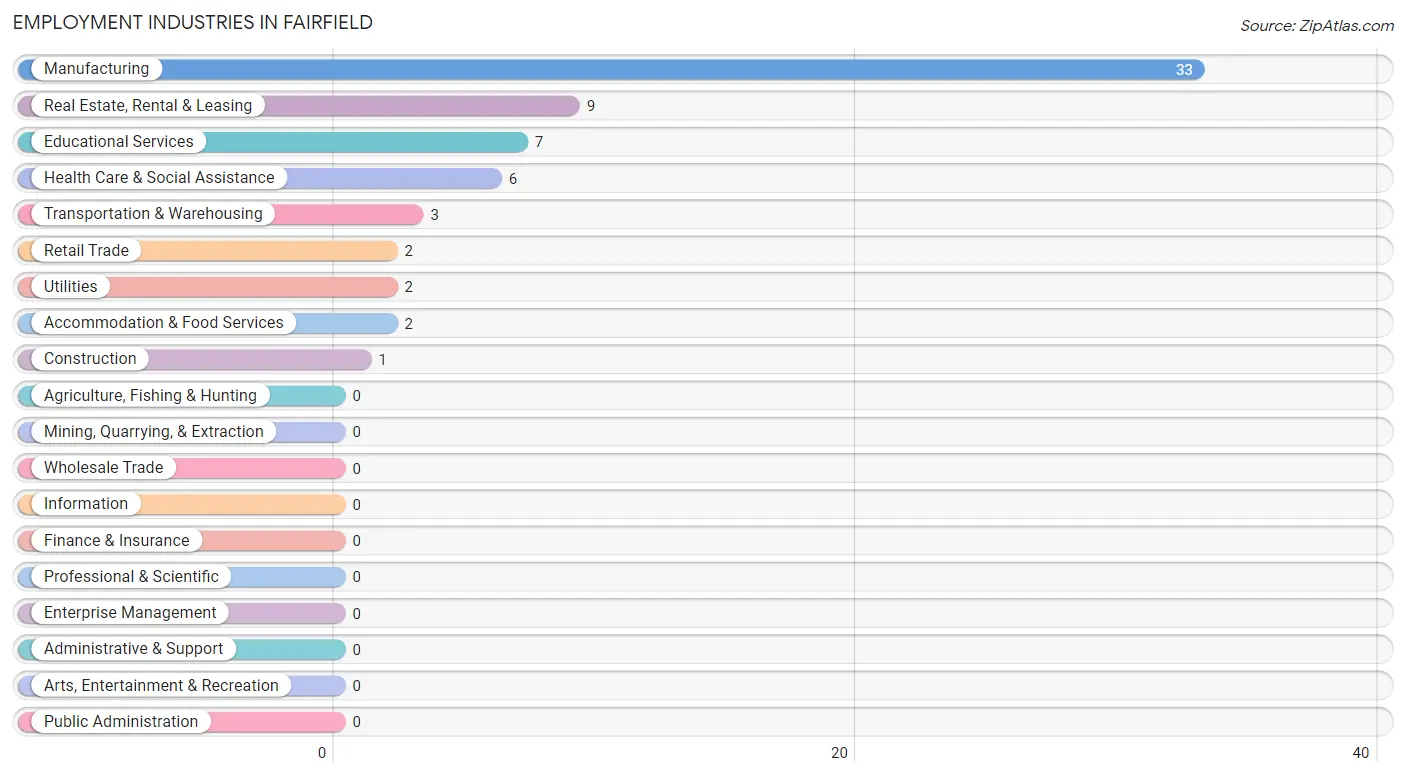
Employment Industries in Fairfield
The major employment industries in Fairfield include Manufacturing (33 | 50.0%), Real Estate, Rental & Leasing (9 | 13.6%), Educational Services (7 | 10.6%), Health Care & Social Assistance (6 | 9.1%), and Transportation & Warehousing (3 | 4.5%).
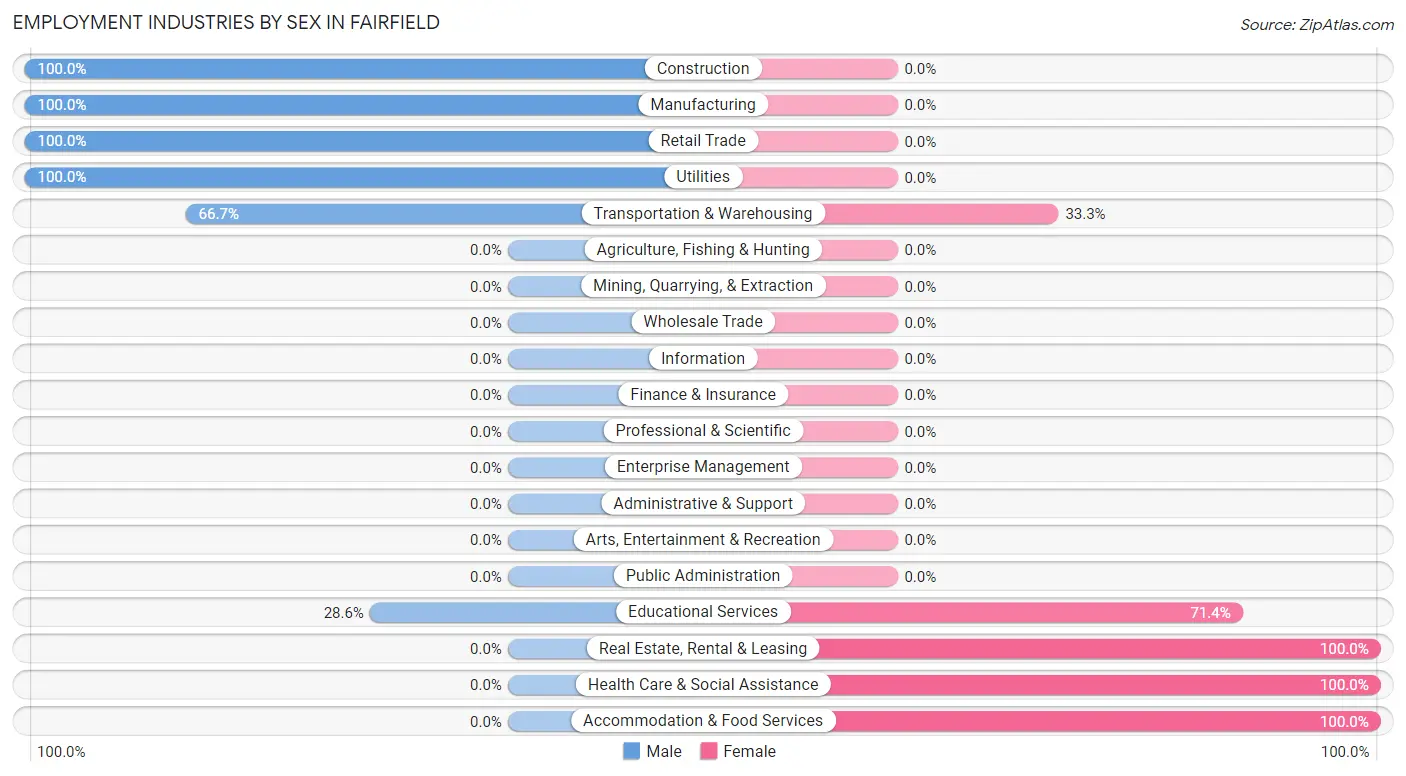
Employment Industries by Sex in Fairfield
The Fairfield industries that see more men than women are Construction (100.0%), Manufacturing (100.0%), and Retail Trade (100.0%), whereas the industries that tend to have a higher number of women are Real Estate, Rental & Leasing (100.0%), Health Care & Social Assistance (100.0%), and Accommodation & Food Services (100.0%).
| Industry | Male | Female |
| Agriculture, Fishing & Hunting | 0 (0.0%) | 0 (0.0%) |
| Mining, Quarrying, & Extraction | 0 (0.0%) | 0 (0.0%) |
| Construction | 1 (100.0%) | 0 (0.0%) |
| Manufacturing | 33 (100.0%) | 0 (0.0%) |
| Wholesale Trade | 0 (0.0%) | 0 (0.0%) |
| Retail Trade | 2 (100.0%) | 0 (0.0%) |
| Transportation & Warehousing | 2 (66.7%) | 1 (33.3%) |
| Utilities | 2 (100.0%) | 0 (0.0%) |
| Information | 0 (0.0%) | 0 (0.0%) |
| Finance & Insurance | 0 (0.0%) | 0 (0.0%) |
| Real Estate, Rental & Leasing | 0 (0.0%) | 9 (100.0%) |
| Professional & Scientific | 0 (0.0%) | 0 (0.0%) |
| Enterprise Management | 0 (0.0%) | 0 (0.0%) |
| Administrative & Support | 0 (0.0%) | 0 (0.0%) |
| Educational Services | 2 (28.6%) | 5 (71.4%) |
| Health Care & Social Assistance | 0 (0.0%) | 6 (100.0%) |
| Arts, Entertainment & Recreation | 0 (0.0%) | 0 (0.0%) |
| Accommodation & Food Services | 0 (0.0%) | 2 (100.0%) |
| Public Administration | 0 (0.0%) | 0 (0.0%) |
| Total | 42 (63.6%) | 24 (36.4%) |
Education in Fairfield
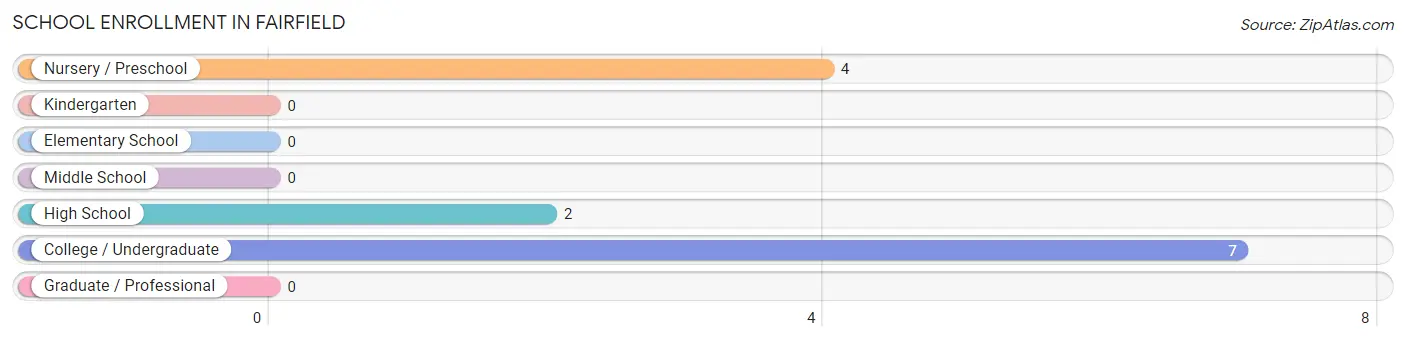
School Enrollment in Fairfield
The most common levels of schooling among the 13 students in Fairfield are college / undergraduate (7 | 53.8%), nursery / preschool (4 | 30.8%), and high school (2 | 15.4%).
| School Level | # Students | % Students |
| Nursery / Preschool | 4 | 30.8% |
| Kindergarten | 0 | 0.0% |
| Elementary School | 0 | 0.0% |
| Middle School | 0 | 0.0% |
| High School | 2 | 15.4% |
| College / Undergraduate | 7 | 53.8% |
| Graduate / Professional | 0 | 0.0% |
| Total | 13 | 100.0% |
School Enrollment by Age by Funding Source in Fairfield
Out of a total of 13 students who are enrolled in schools in Fairfield, 6 (46.2%) attend a private institution, while the remaining 7 (53.8%) are enrolled in public schools. The age group of 3 to 4 year olds has the highest likelihood of being enrolled in private schools, with 2 (100.0% in the age bracket) enrolled. Conversely, the age group of 20 to 24 year olds has the lowest likelihood of being enrolled in a private school, with 7 (100.0% in the age bracket) attending a public institution.
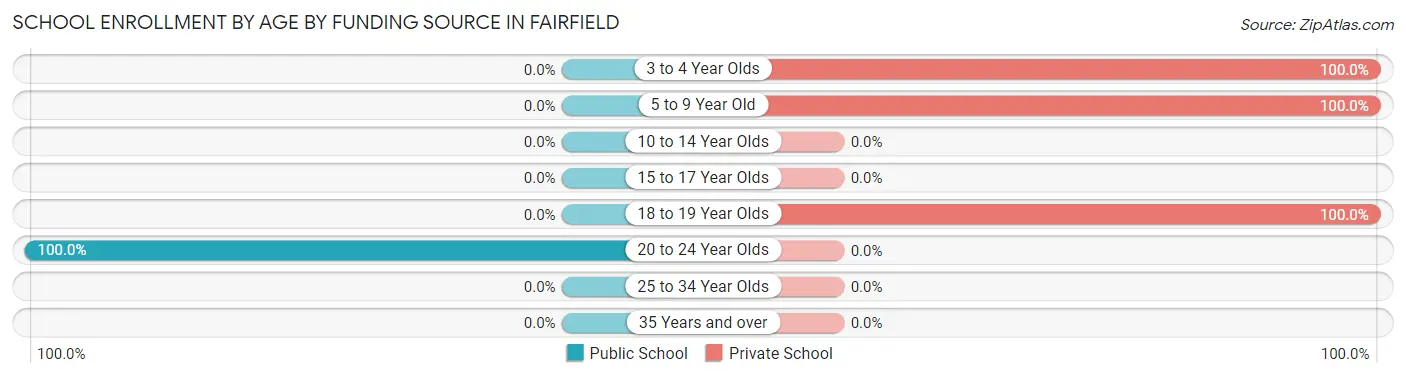
| Age Bracket | Public School | Private School |
| 3 to 4 Year Olds | 0 (0.0%) | 2 (100.0%) |
| 5 to 9 Year Old | 0 (0.0%) | 2 (100.0%) |
| 10 to 14 Year Olds | 0 (0.0%) | 0 (0.0%) |
| 15 to 17 Year Olds | 0 (0.0%) | 0 (0.0%) |
| 18 to 19 Year Olds | 0 (0.0%) | 2 (100.0%) |
| 20 to 24 Year Olds | 7 (100.0%) | 0 (0.0%) |
| 25 to 34 Year Olds | 0 (0.0%) | 0 (0.0%) |
| 35 Years and over | 0 (0.0%) | 0 (0.0%) |
| Total | 7 (53.8%) | 6 (46.2%) |
Educational Attainment by Field of Study in Fairfield
Physical & health sciences (6 | 42.9%), science & technology (3 | 21.4%), computers & mathematics (2 | 14.3%), social sciences (2 | 14.3%), and liberal arts & history (1 | 7.1%) are the most common fields of study among 14 individuals in Fairfield who have obtained a bachelor's degree or higher.
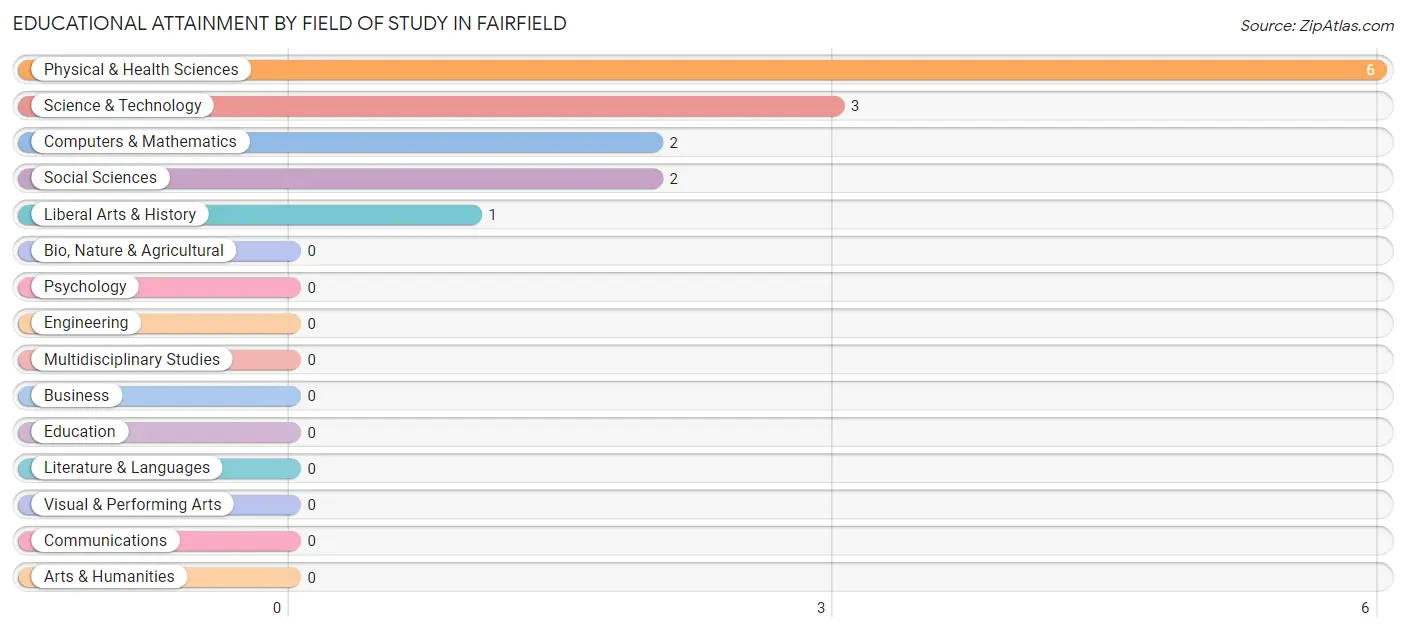
| Field of Study | # Graduates | % Graduates |
| Computers & Mathematics | 2 | 14.3% |
| Bio, Nature & Agricultural | 0 | 0.0% |
| Physical & Health Sciences | 6 | 42.9% |
| Psychology | 0 | 0.0% |
| Social Sciences | 2 | 14.3% |
| Engineering | 0 | 0.0% |
| Multidisciplinary Studies | 0 | 0.0% |
| Science & Technology | 3 | 21.4% |
| Business | 0 | 0.0% |
| Education | 0 | 0.0% |
| Literature & Languages | 0 | 0.0% |
| Liberal Arts & History | 1 | 7.1% |
| Visual & Performing Arts | 0 | 0.0% |
| Communications | 0 | 0.0% |
| Arts & Humanities | 0 | 0.0% |
| Total | 14 | 100.0% |
Transportation & Commute in Fairfield
Vehicle Availability by Sex in Fairfield
The most prevalent vehicle ownership categories in Fairfield are males with 2 vehicles (29, accounting for 69.1%) and females with 2 vehicles (3, making up 120.8%).
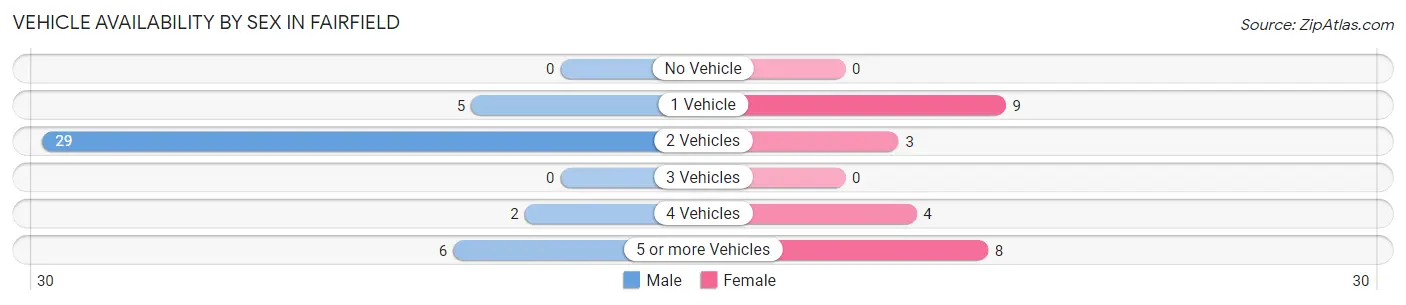
| Vehicles Available | Male | Female |
| No Vehicle | 0 (0.0%) | 0 (0.0%) |
| 1 Vehicle | 5 (11.9%) | 9 (37.5%) |
| 2 Vehicles | 29 (69.1%) | 3 (12.5%) |
| 3 Vehicles | 0 (0.0%) | 0 (0.0%) |
| 4 Vehicles | 2 (4.8%) | 4 (16.7%) |
| 5 or more Vehicles | 6 (14.3%) | 8 (33.3%) |
| Total | 42 (100.0%) | 24 (100.0%) |
Commute Time in Fairfield
The most frequently occuring commute durations in Fairfield are 45 to 59 minutes (33 commuters, 50.8%), 15 to 19 minutes (9 commuters, 13.9%), and 20 to 24 minutes (7 commuters, 10.8%).
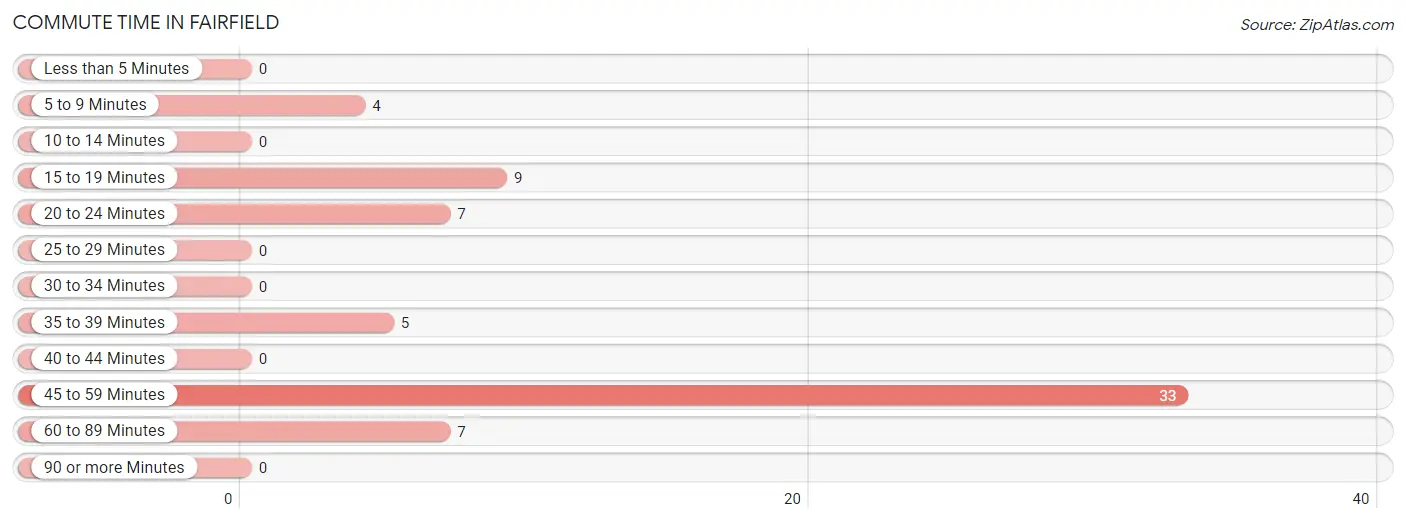
| Commute Time | # Commuters | % Commuters |
| Less than 5 Minutes | 0 | 0.0% |
| 5 to 9 Minutes | 4 | 6.1% |
| 10 to 14 Minutes | 0 | 0.0% |
| 15 to 19 Minutes | 9 | 13.9% |
| 20 to 24 Minutes | 7 | 10.8% |
| 25 to 29 Minutes | 0 | 0.0% |
| 30 to 34 Minutes | 0 | 0.0% |
| 35 to 39 Minutes | 5 | 7.7% |
| 40 to 44 Minutes | 0 | 0.0% |
| 45 to 59 Minutes | 33 | 50.8% |
| 60 to 89 Minutes | 7 | 10.8% |
| 90 or more Minutes | 0 | 0.0% |
Commute Time by Sex in Fairfield
The most common commute times in Fairfield are 45 to 59 minutes (28 commuters, 66.7%) for males and 15 to 19 minutes (9 commuters, 39.1%) for females.
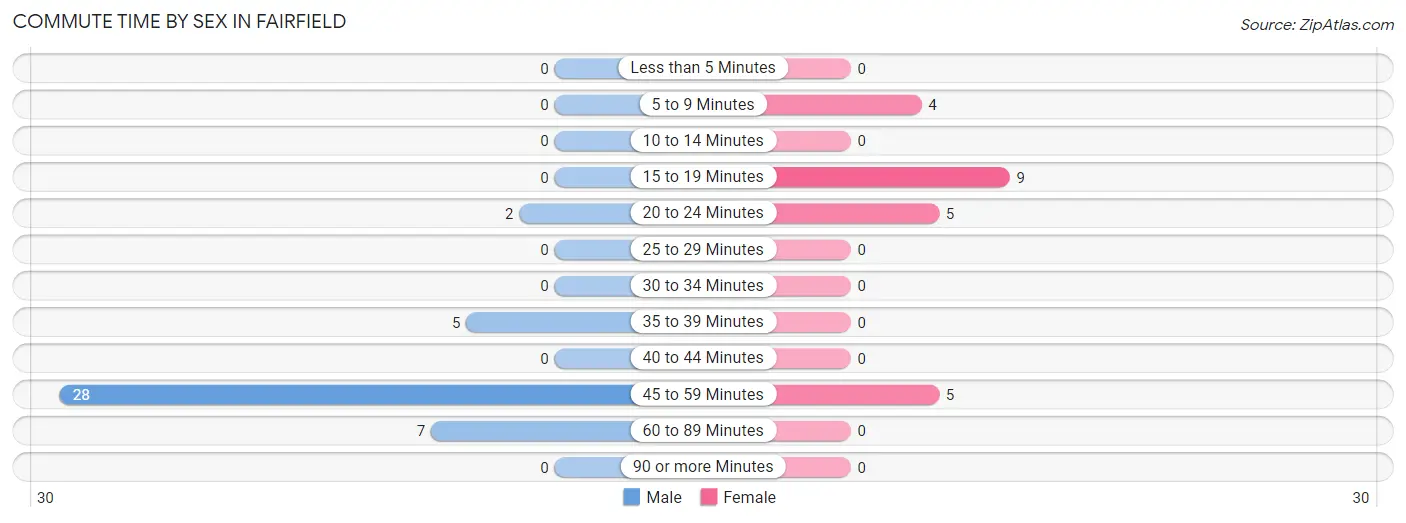
| Commute Time | Male | Female |
| Less than 5 Minutes | 0 (0.0%) | 0 (0.0%) |
| 5 to 9 Minutes | 0 (0.0%) | 4 (17.4%) |
| 10 to 14 Minutes | 0 (0.0%) | 0 (0.0%) |
| 15 to 19 Minutes | 0 (0.0%) | 9 (39.1%) |
| 20 to 24 Minutes | 2 (4.8%) | 5 (21.7%) |
| 25 to 29 Minutes | 0 (0.0%) | 0 (0.0%) |
| 30 to 34 Minutes | 0 (0.0%) | 0 (0.0%) |
| 35 to 39 Minutes | 5 (11.9%) | 0 (0.0%) |
| 40 to 44 Minutes | 0 (0.0%) | 0 (0.0%) |
| 45 to 59 Minutes | 28 (66.7%) | 5 (21.7%) |
| 60 to 89 Minutes | 7 (16.7%) | 0 (0.0%) |
| 90 or more Minutes | 0 (0.0%) | 0 (0.0%) |
Time of Departure to Work by Sex in Fairfield
The most frequent times of departure to work in Fairfield are 8:30 AM to 8:59 AM (26, 61.9%) for males and 6:30 AM to 6:59 AM (11, 47.8%) for females.
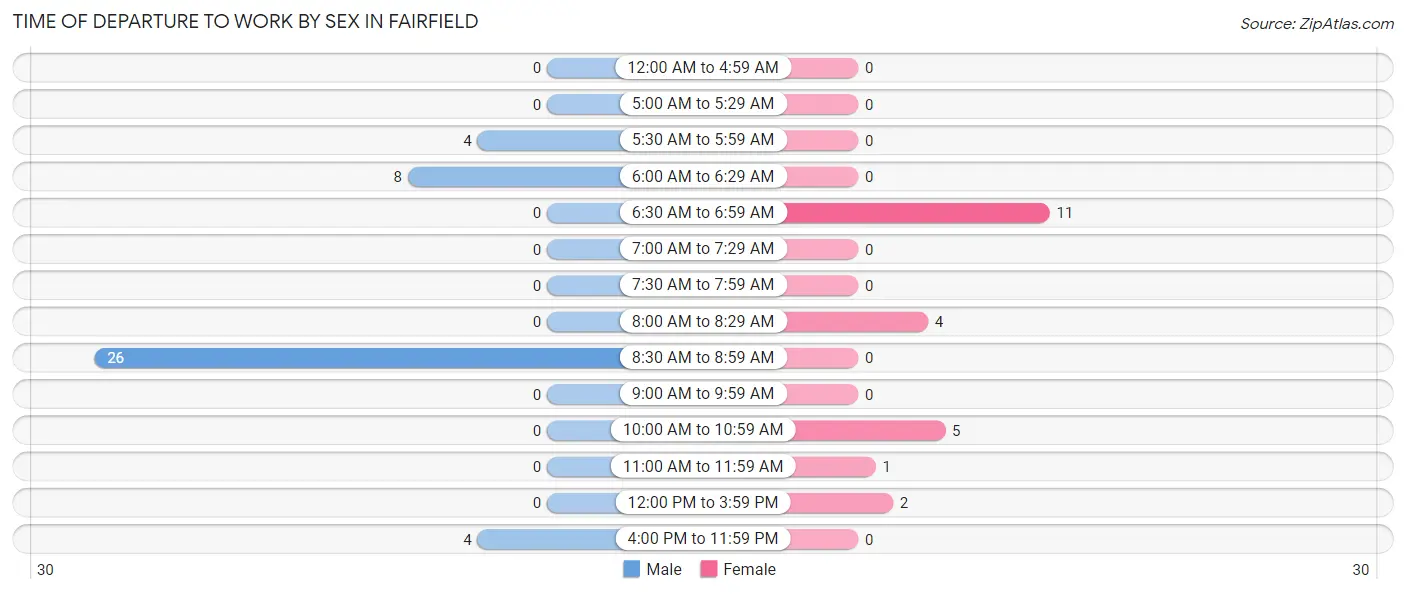
| Time of Departure | Male | Female |
| 12:00 AM to 4:59 AM | 0 (0.0%) | 0 (0.0%) |
| 5:00 AM to 5:29 AM | 0 (0.0%) | 0 (0.0%) |
| 5:30 AM to 5:59 AM | 4 (9.5%) | 0 (0.0%) |
| 6:00 AM to 6:29 AM | 8 (19.1%) | 0 (0.0%) |
| 6:30 AM to 6:59 AM | 0 (0.0%) | 11 (47.8%) |
| 7:00 AM to 7:29 AM | 0 (0.0%) | 0 (0.0%) |
| 7:30 AM to 7:59 AM | 0 (0.0%) | 0 (0.0%) |
| 8:00 AM to 8:29 AM | 0 (0.0%) | 4 (17.4%) |
| 8:30 AM to 8:59 AM | 26 (61.9%) | 0 (0.0%) |
| 9:00 AM to 9:59 AM | 0 (0.0%) | 0 (0.0%) |
| 10:00 AM to 10:59 AM | 0 (0.0%) | 5 (21.7%) |
| 11:00 AM to 11:59 AM | 0 (0.0%) | 1 (4.3%) |
| 12:00 PM to 3:59 PM | 0 (0.0%) | 2 (8.7%) |
| 4:00 PM to 11:59 PM | 4 (9.5%) | 0 (0.0%) |
| Total | 42 (100.0%) | 23 (100.0%) |
Housing Occupancy in Fairfield
Occupancy by Ownership in Fairfield
Of the total 121 dwellings in Fairfield, owner-occupied units account for 109 (90.1%), while renter-occupied units make up 12 (9.9%).
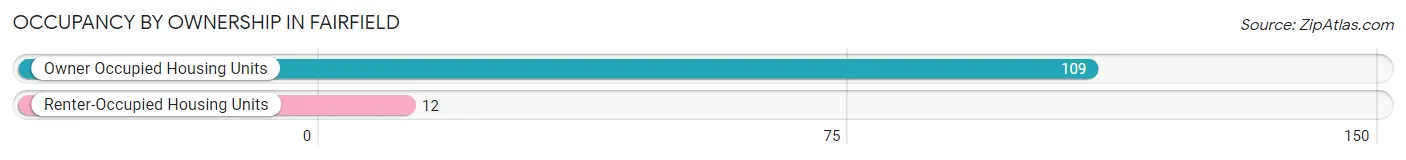
| Occupancy | # Housing Units | % Housing Units |
| Owner Occupied Housing Units | 109 | 90.1% |
| Renter-Occupied Housing Units | 12 | 9.9% |
| Total Occupied Housing Units | 121 | 100.0% |
Occupancy by Household Size in Fairfield
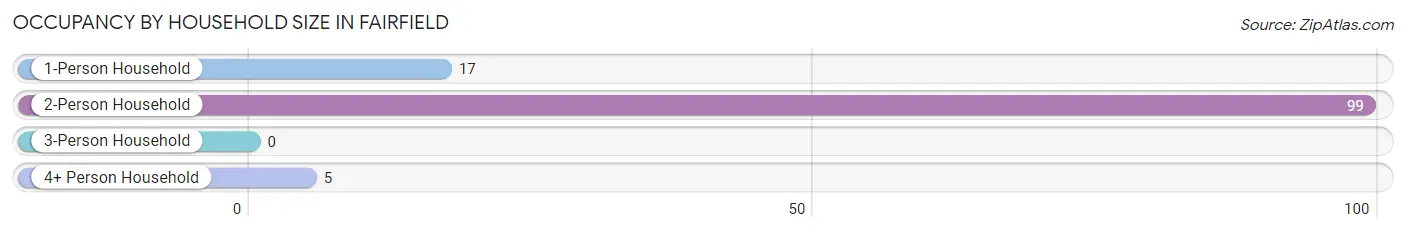
| Household Size | # Housing Units | % Housing Units |
| 1-Person Household | 17 | 14.1% |
| 2-Person Household | 99 | 81.8% |
| 3-Person Household | 0 | 0.0% |
| 4+ Person Household | 5 | 4.1% |
| Total Housing Units | 121 | 100.0% |
Occupancy by Ownership by Household Size in Fairfield
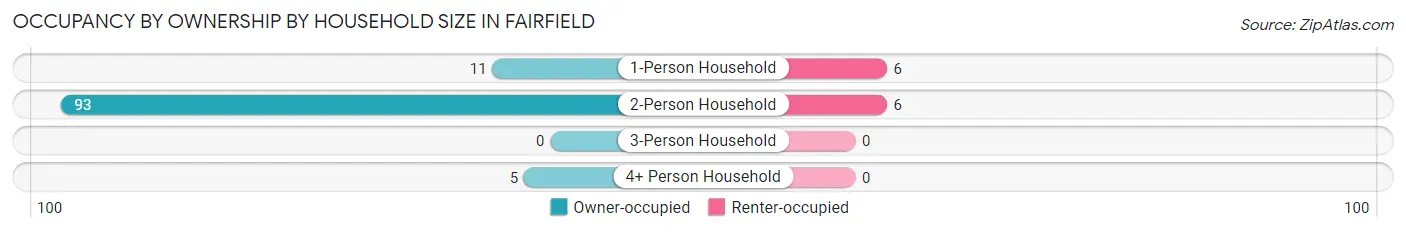
| Household Size | Owner-occupied | Renter-occupied |
| 1-Person Household | 11 (64.7%) | 6 (35.3%) |
| 2-Person Household | 93 (93.9%) | 6 (6.1%) |
| 3-Person Household | 0 (0.0%) | 0 (0.0%) |
| 4+ Person Household | 5 (100.0%) | 0 (0.0%) |
| Total Housing Units | 109 (90.1%) | 12 (9.9%) |
Occupancy by Educational Attainment in Fairfield
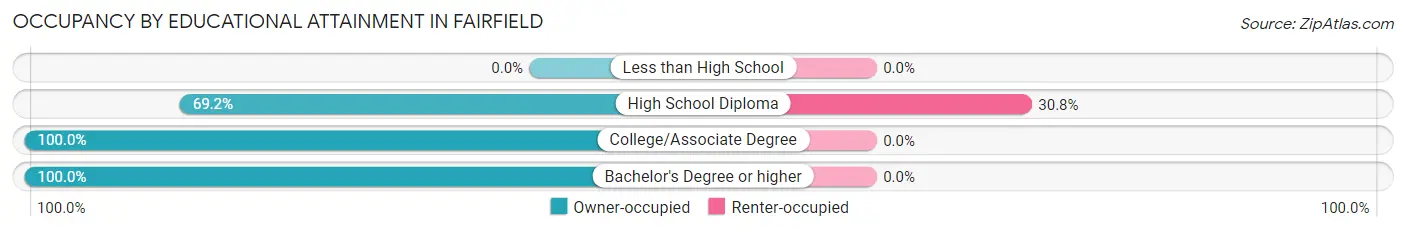
| Household Size | Owner-occupied | Renter-occupied |
| Less than High School | 0 (0.0%) | 0 (0.0%) |
| High School Diploma | 27 (69.2%) | 12 (30.8%) |
| College/Associate Degree | 77 (100.0%) | 0 (0.0%) |
| Bachelor's Degree or higher | 5 (100.0%) | 0 (0.0%) |
Occupancy by Age of Householder in Fairfield
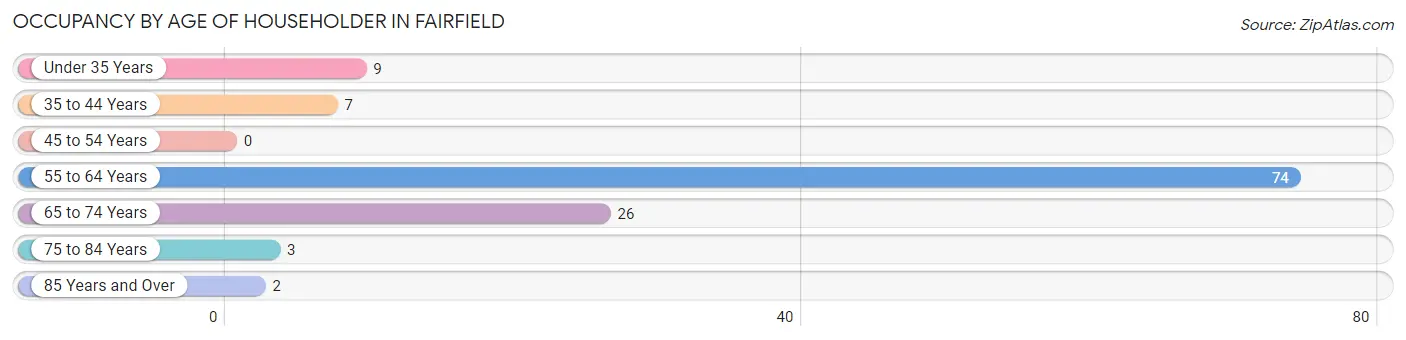
| Age Bracket | # Households | % Households |
| Under 35 Years | 9 | 7.4% |
| 35 to 44 Years | 7 | 5.8% |
| 45 to 54 Years | 0 | 0.0% |
| 55 to 64 Years | 74 | 61.2% |
| 65 to 74 Years | 26 | 21.5% |
| 75 to 84 Years | 3 | 2.5% |
| 85 Years and Over | 2 | 1.7% |
| Total | 121 | 100.0% |
Housing Finances in Fairfield
Median Income by Occupancy in Fairfield
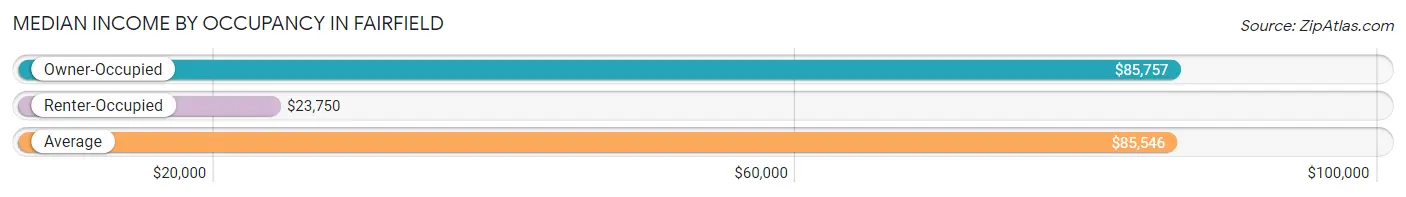
| Occupancy Type | # Households | Median Income |
| Owner-Occupied | 109 (90.1%) | $85,757 |
| Renter-Occupied | 12 (9.9%) | $23,750 |
| Average | 121 (100.0%) | $85,546 |
Occupancy by Householder Income Bracket in Fairfield
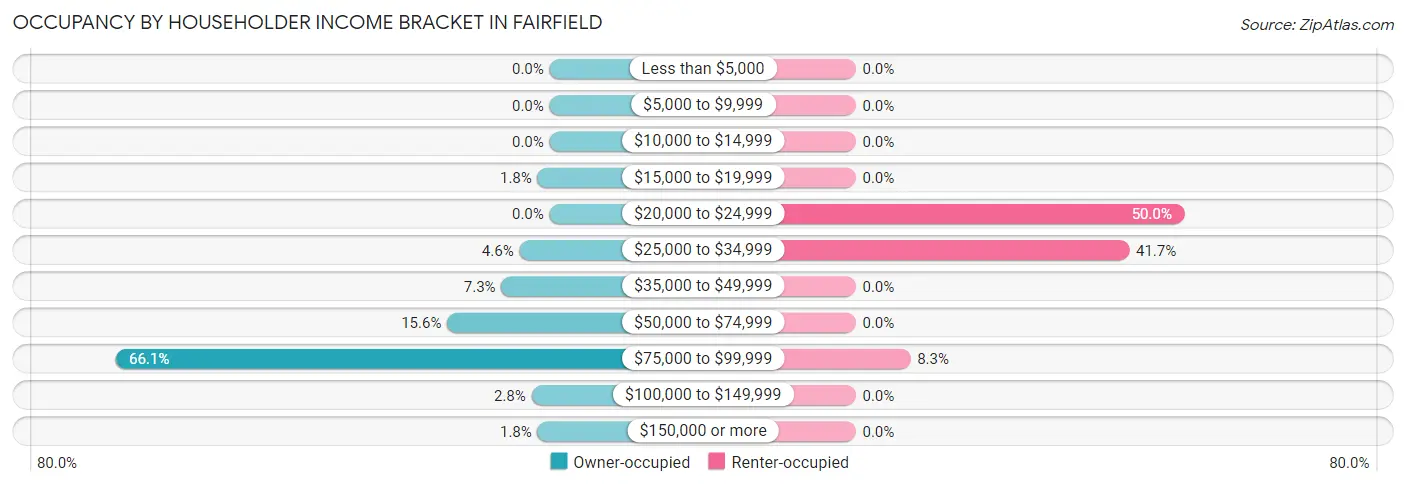
| Income Bracket | Owner-occupied | Renter-occupied |
| Less than $5,000 | 0 (0.0%) | 0 (0.0%) |
| $5,000 to $9,999 | 0 (0.0%) | 0 (0.0%) |
| $10,000 to $14,999 | 0 (0.0%) | 0 (0.0%) |
| $15,000 to $19,999 | 2 (1.8%) | 0 (0.0%) |
| $20,000 to $24,999 | 0 (0.0%) | 6 (50.0%) |
| $25,000 to $34,999 | 5 (4.6%) | 5 (41.7%) |
| $35,000 to $49,999 | 8 (7.3%) | 0 (0.0%) |
| $50,000 to $74,999 | 17 (15.6%) | 0 (0.0%) |
| $75,000 to $99,999 | 72 (66.1%) | 1 (8.3%) |
| $100,000 to $149,999 | 3 (2.8%) | 0 (0.0%) |
| $150,000 or more | 2 (1.8%) | 0 (0.0%) |
| Total | 109 (100.0%) | 12 (100.0%) |
Monthly Housing Cost Tiers in Fairfield
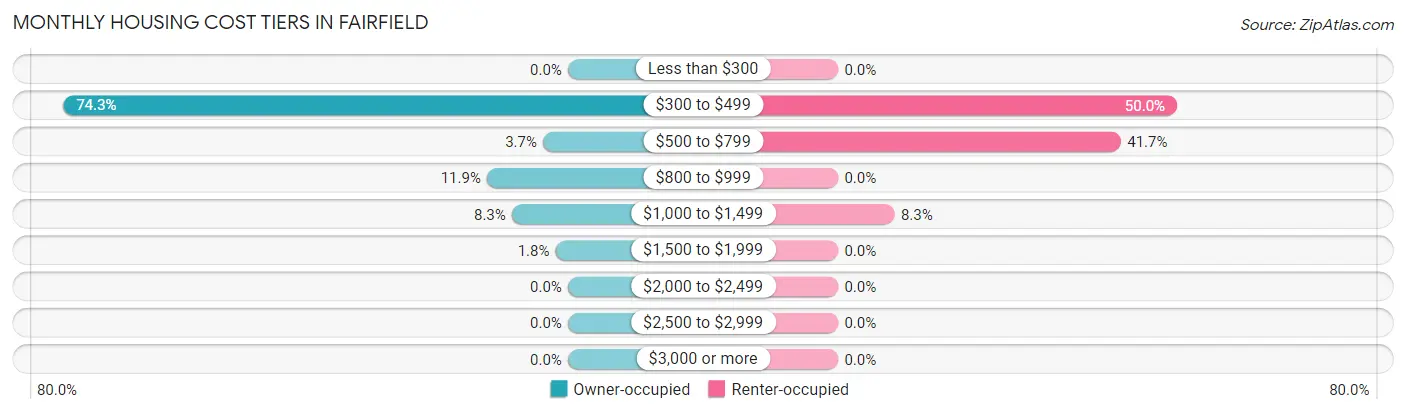
| Monthly Cost | Owner-occupied | Renter-occupied |
| Less than $300 | 0 (0.0%) | 0 (0.0%) |
| $300 to $499 | 81 (74.3%) | 6 (50.0%) |
| $500 to $799 | 4 (3.7%) | 5 (41.7%) |
| $800 to $999 | 13 (11.9%) | 0 (0.0%) |
| $1,000 to $1,499 | 9 (8.3%) | 1 (8.3%) |
| $1,500 to $1,999 | 2 (1.8%) | 0 (0.0%) |
| $2,000 to $2,499 | 0 (0.0%) | 0 (0.0%) |
| $2,500 to $2,999 | 0 (0.0%) | 0 (0.0%) |
| $3,000 or more | 0 (0.0%) | 0 (0.0%) |
| Total | 109 (100.0%) | 12 (100.0%) |
Physical Housing Characteristics in Fairfield
Housing Structures in Fairfield
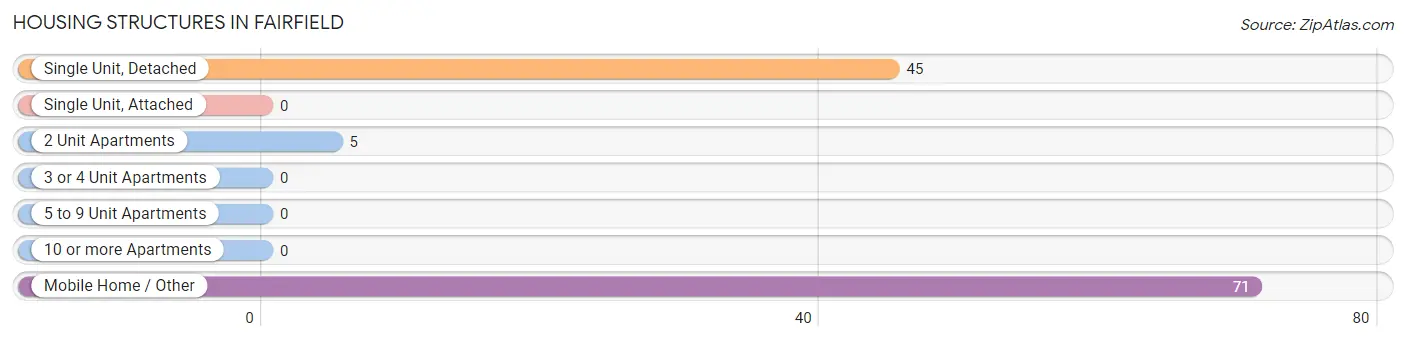
| Structure Type | # Housing Units | % Housing Units |
| Single Unit, Detached | 45 | 37.2% |
| Single Unit, Attached | 0 | 0.0% |
| 2 Unit Apartments | 5 | 4.1% |
| 3 or 4 Unit Apartments | 0 | 0.0% |
| 5 to 9 Unit Apartments | 0 | 0.0% |
| 10 or more Apartments | 0 | 0.0% |
| Mobile Home / Other | 71 | 58.7% |
| Total | 121 | 100.0% |
Housing Structures by Occupancy in Fairfield
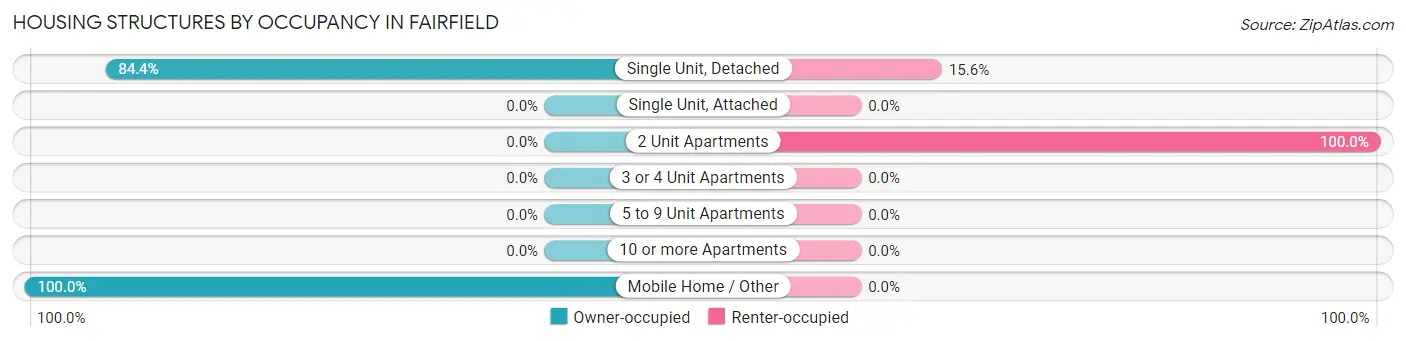
| Structure Type | Owner-occupied | Renter-occupied |
| Single Unit, Detached | 38 (84.4%) | 7 (15.6%) |
| Single Unit, Attached | 0 (0.0%) | 0 (0.0%) |
| 2 Unit Apartments | 0 (0.0%) | 5 (100.0%) |
| 3 or 4 Unit Apartments | 0 (0.0%) | 0 (0.0%) |
| 5 to 9 Unit Apartments | 0 (0.0%) | 0 (0.0%) |
| 10 or more Apartments | 0 (0.0%) | 0 (0.0%) |
| Mobile Home / Other | 71 (100.0%) | 0 (0.0%) |
| Total | 109 (90.1%) | 12 (9.9%) |
Housing Structures by Number of Rooms in Fairfield
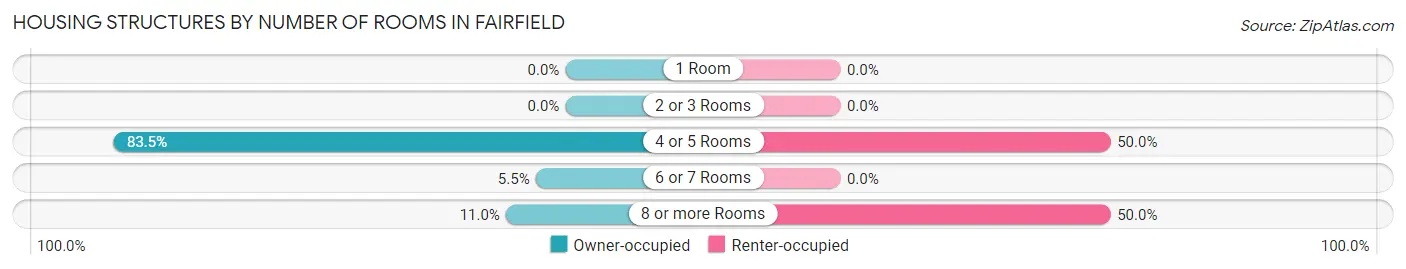
| Number of Rooms | Owner-occupied | Renter-occupied |
| 1 Room | 0 (0.0%) | 0 (0.0%) |
| 2 or 3 Rooms | 0 (0.0%) | 0 (0.0%) |
| 4 or 5 Rooms | 91 (83.5%) | 6 (50.0%) |
| 6 or 7 Rooms | 6 (5.5%) | 0 (0.0%) |
| 8 or more Rooms | 12 (11.0%) | 6 (50.0%) |
| Total | 109 (100.0%) | 12 (100.0%) |
Housing Structure by Heating Type in Fairfield
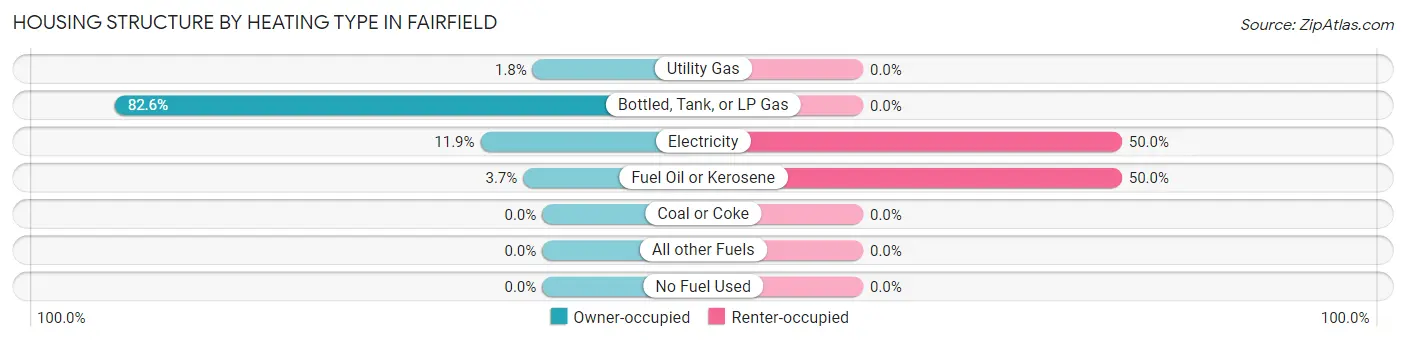
| Heating Type | Owner-occupied | Renter-occupied |
| Utility Gas | 2 (1.8%) | 0 (0.0%) |
| Bottled, Tank, or LP Gas | 90 (82.6%) | 0 (0.0%) |
| Electricity | 13 (11.9%) | 6 (50.0%) |
| Fuel Oil or Kerosene | 4 (3.7%) | 6 (50.0%) |
| Coal or Coke | 0 (0.0%) | 0 (0.0%) |
| All other Fuels | 0 (0.0%) | 0 (0.0%) |
| No Fuel Used | 0 (0.0%) | 0 (0.0%) |
| Total | 109 (100.0%) | 12 (100.0%) |
Household Vehicle Usage in Fairfield
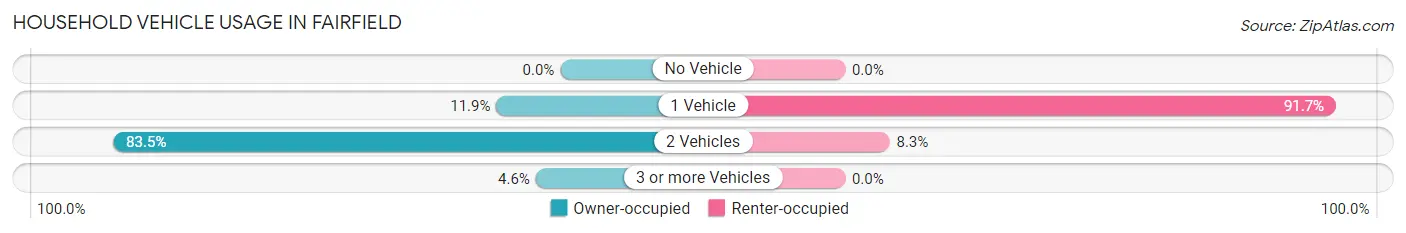
| Vehicles per Household | Owner-occupied | Renter-occupied |
| No Vehicle | 0 (0.0%) | 0 (0.0%) |
| 1 Vehicle | 13 (11.9%) | 11 (91.7%) |
| 2 Vehicles | 91 (83.5%) | 1 (8.3%) |
| 3 or more Vehicles | 5 (4.6%) | 0 (0.0%) |
| Total | 109 (100.0%) | 12 (100.0%) |
Real Estate & Mortgages in Fairfield
Real Estate and Mortgage Overview in Fairfield
| Characteristic | Without Mortgage | With Mortgage |
| Housing Units | 100 | 9 |
| Median Property Value | - | - |
| Median Household Income | $85,845 | $0 |
| Monthly Housing Costs | $333 | $0 |
| Real Estate Taxes | $370 | $0 |
Property Value by Mortgage Status in Fairfield
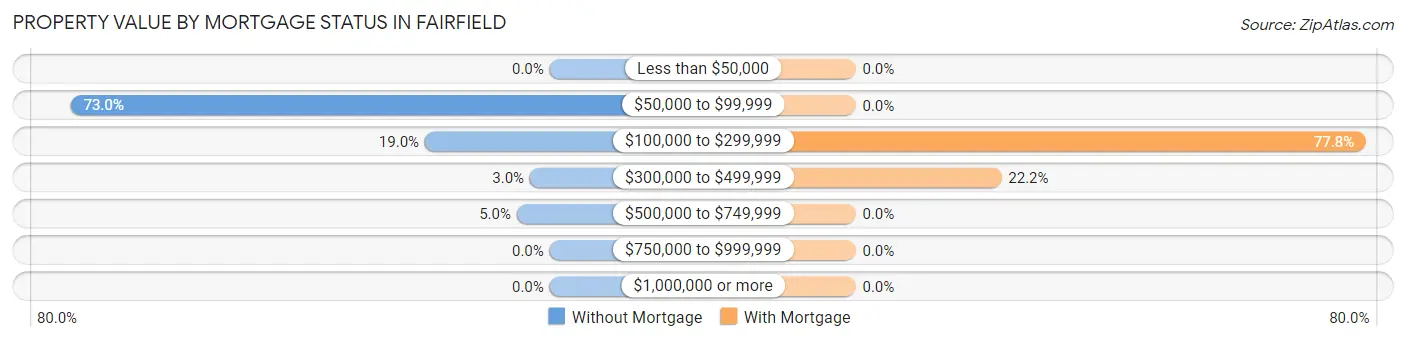
| Property Value | Without Mortgage | With Mortgage |
| Less than $50,000 | 0 (0.0%) | 0 (0.0%) |
| $50,000 to $99,999 | 73 (73.0%) | 0 (0.0%) |
| $100,000 to $299,999 | 19 (19.0%) | 7 (77.8%) |
| $300,000 to $499,999 | 3 (3.0%) | 2 (22.2%) |
| $500,000 to $749,999 | 5 (5.0%) | 0 (0.0%) |
| $750,000 to $999,999 | 0 (0.0%) | 0 (0.0%) |
| $1,000,000 or more | 0 (0.0%) | 0 (0.0%) |
| Total | 100 (100.0%) | 9 (100.0%) |
Household Income by Mortgage Status in Fairfield
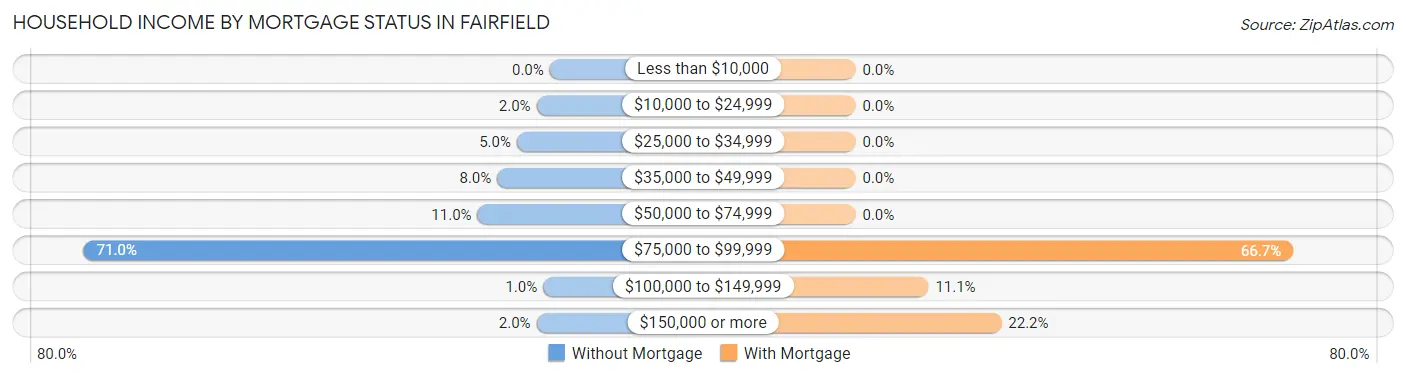
| Household Income | Without Mortgage | With Mortgage |
| Less than $10,000 | 0 (0.0%) | 0 (0.0%) |
| $10,000 to $24,999 | 2 (2.0%) | 0 (0.0%) |
| $25,000 to $34,999 | 5 (5.0%) | 0 (0.0%) |
| $35,000 to $49,999 | 8 (8.0%) | 0 (0.0%) |
| $50,000 to $74,999 | 11 (11.0%) | 0 (0.0%) |
| $75,000 to $99,999 | 71 (71.0%) | 6 (66.7%) |
| $100,000 to $149,999 | 1 (1.0%) | 1 (11.1%) |
| $150,000 or more | 2 (2.0%) | 2 (22.2%) |
| Total | 100 (100.0%) | 9 (100.0%) |
Property Value to Household Income Ratio in Fairfield
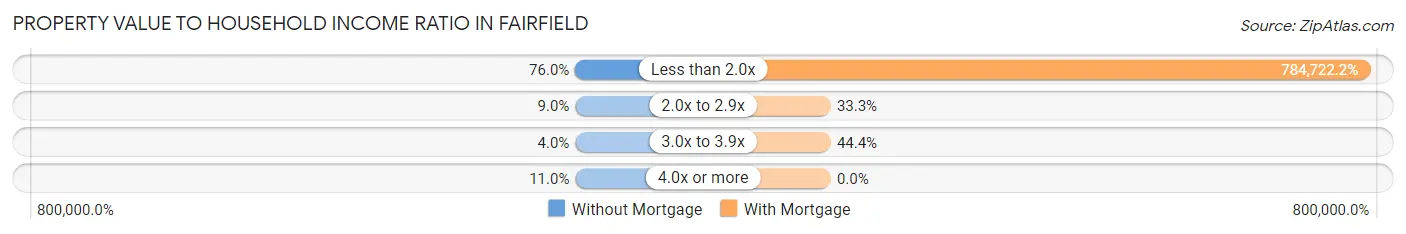
| Value-to-Income Ratio | Without Mortgage | With Mortgage |
| Less than 2.0x | 76 (76.0%) | 70,625 (784,722.2%) |
| 2.0x to 2.9x | 9 (9.0%) | 3 (33.3%) |
| 3.0x to 3.9x | 4 (4.0%) | 4 (44.4%) |
| 4.0x or more | 11 (11.0%) | 0 (0.0%) |
| Total | 100 (100.0%) | 9 (100.0%) |
Real Estate Taxes by Mortgage Status in Fairfield
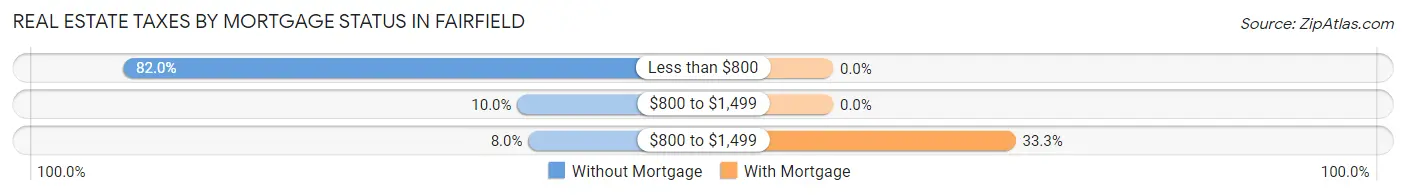
| Property Taxes | Without Mortgage | With Mortgage |
| Less than $800 | 82 (82.0%) | 0 (0.0%) |
| $800 to $1,499 | 10 (10.0%) | 0 (0.0%) |
| $800 to $1,499 | 8 (8.0%) | 3 (33.3%) |
| Total | 100 (100.0%) | 9 (100.0%) |
Health & Disability in Fairfield
Health Insurance Coverage by Age in Fairfield
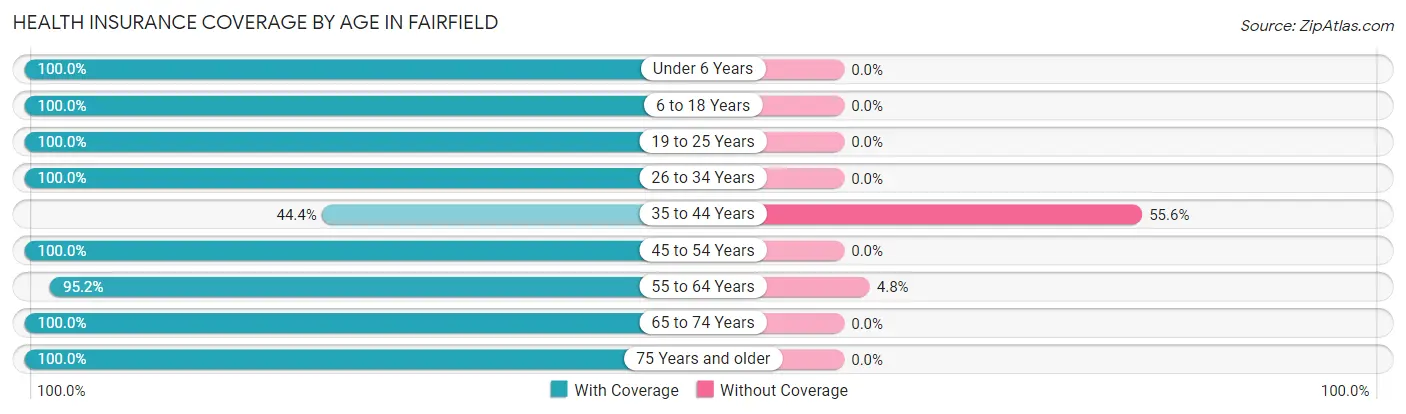
| Age Bracket | With Coverage | Without Coverage |
| Under 6 Years | 7 (100.0%) | 0 (0.0%) |
| 6 to 18 Years | 2 (100.0%) | 0 (0.0%) |
| 19 to 25 Years | 7 (100.0%) | 0 (0.0%) |
| 26 to 34 Years | 12 (100.0%) | 0 (0.0%) |
| 35 to 44 Years | 4 (44.4%) | 5 (55.6%) |
| 45 to 54 Years | 2 (100.0%) | 0 (0.0%) |
| 55 to 64 Years | 100 (95.2%) | 5 (4.8%) |
| 65 to 74 Years | 41 (100.0%) | 0 (0.0%) |
| 75 Years and older | 11 (100.0%) | 0 (0.0%) |
| Total | 186 (94.9%) | 10 (5.1%) |
Health Insurance Coverage by Citizenship Status in Fairfield
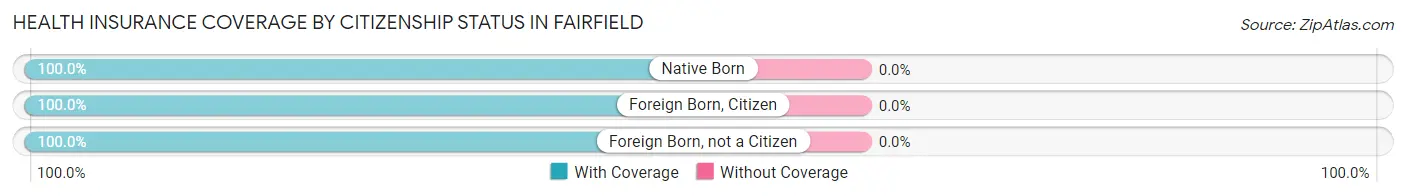
| Citizenship Status | With Coverage | Without Coverage |
| Native Born | 7 (100.0%) | 0 (0.0%) |
| Foreign Born, Citizen | 2 (100.0%) | 0 (0.0%) |
| Foreign Born, not a Citizen | 7 (100.0%) | 0 (0.0%) |
Health Insurance Coverage by Household Income in Fairfield
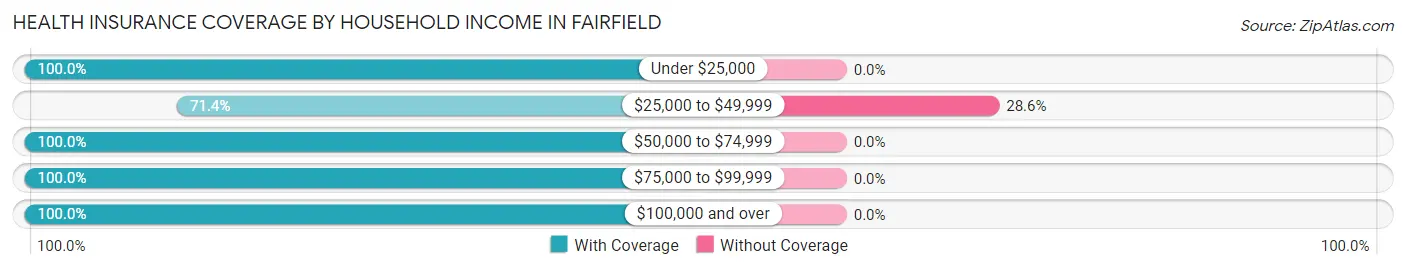
| Household Income | With Coverage | Without Coverage |
| Under $25,000 | 8 (100.0%) | 0 (0.0%) |
| $25,000 to $49,999 | 25 (71.4%) | 10 (28.6%) |
| $50,000 to $74,999 | 30 (100.0%) | 0 (0.0%) |
| $75,000 to $99,999 | 99 (100.0%) | 0 (0.0%) |
| $100,000 and over | 24 (100.0%) | 0 (0.0%) |
Public vs Private Health Insurance Coverage by Age in Fairfield
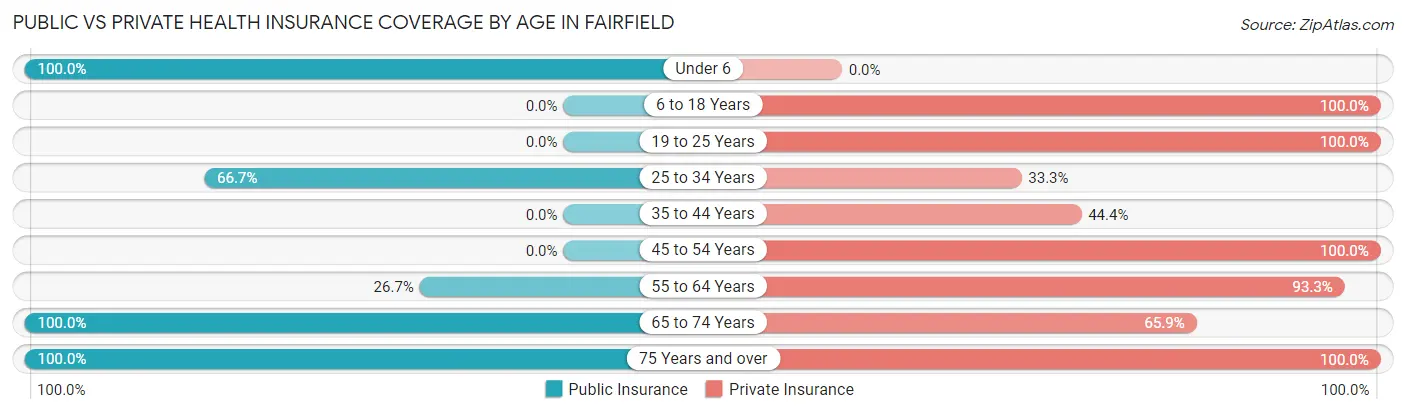
| Age Bracket | Public Insurance | Private Insurance |
| Under 6 | 7 (100.0%) | 0 (0.0%) |
| 6 to 18 Years | 0 (0.0%) | 2 (100.0%) |
| 19 to 25 Years | 0 (0.0%) | 7 (100.0%) |
| 25 to 34 Years | 8 (66.7%) | 4 (33.3%) |
| 35 to 44 Years | 0 (0.0%) | 4 (44.4%) |
| 45 to 54 Years | 0 (0.0%) | 2 (100.0%) |
| 55 to 64 Years | 28 (26.7%) | 98 (93.3%) |
| 65 to 74 Years | 41 (100.0%) | 27 (65.8%) |
| 75 Years and over | 11 (100.0%) | 11 (100.0%) |
| Total | 95 (48.5%) | 155 (79.1%) |
Disability Status by Sex by Age in Fairfield
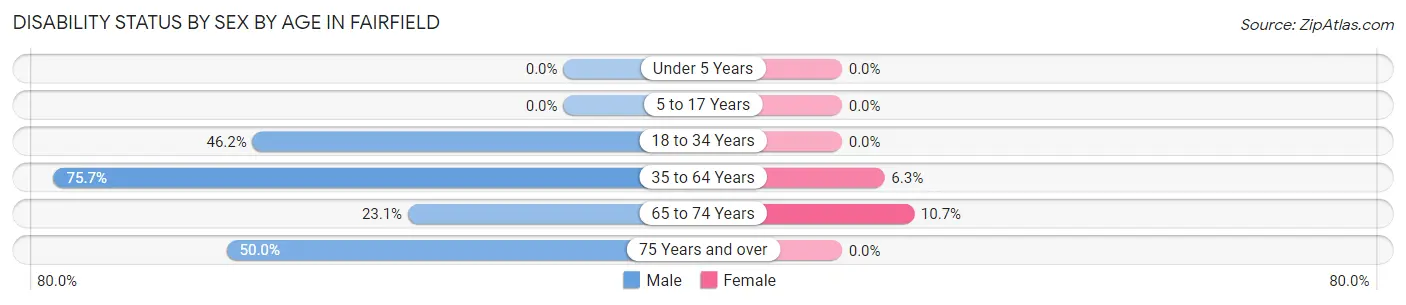
| Age Bracket | Male | Female |
| Under 5 Years | 0 (0.0%) | 0 (0.0%) |
| 5 to 17 Years | 0 (0.0%) | 0 (0.0%) |
| 18 to 34 Years | 6 (46.2%) | 0 (0.0%) |
| 35 to 64 Years | 28 (75.7%) | 5 (6.3%) |
| 65 to 74 Years | 3 (23.1%) | 3 (10.7%) |
| 75 Years and over | 5 (50.0%) | 0 (0.0%) |
Disability Class by Sex by Age in Fairfield
Disability Class: Hearing Difficulty
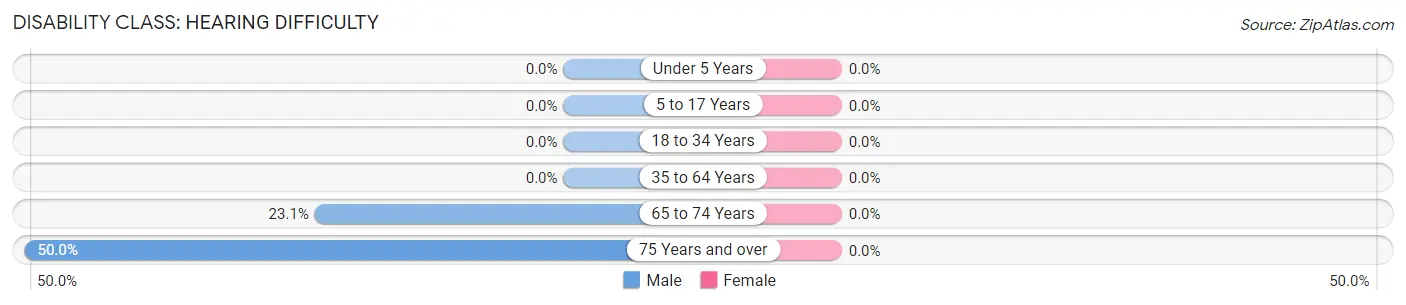
| Age Bracket | Male | Female |
| Under 5 Years | 0 (0.0%) | 0 (0.0%) |
| 5 to 17 Years | 0 (0.0%) | 0 (0.0%) |
| 18 to 34 Years | 0 (0.0%) | 0 (0.0%) |
| 35 to 64 Years | 0 (0.0%) | 0 (0.0%) |
| 65 to 74 Years | 3 (23.1%) | 0 (0.0%) |
| 75 Years and over | 5 (50.0%) | 0 (0.0%) |
Disability Class: Vision Difficulty
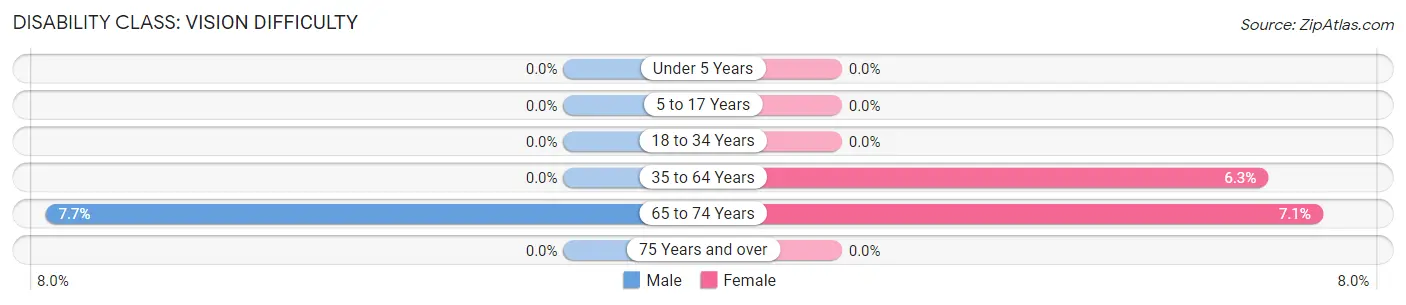
| Age Bracket | Male | Female |
| Under 5 Years | 0 (0.0%) | 0 (0.0%) |
| 5 to 17 Years | 0 (0.0%) | 0 (0.0%) |
| 18 to 34 Years | 0 (0.0%) | 0 (0.0%) |
| 35 to 64 Years | 0 (0.0%) | 5 (6.3%) |
| 65 to 74 Years | 1 (7.7%) | 2 (7.1%) |
| 75 Years and over | 0 (0.0%) | 0 (0.0%) |
Disability Class: Cognitive Difficulty
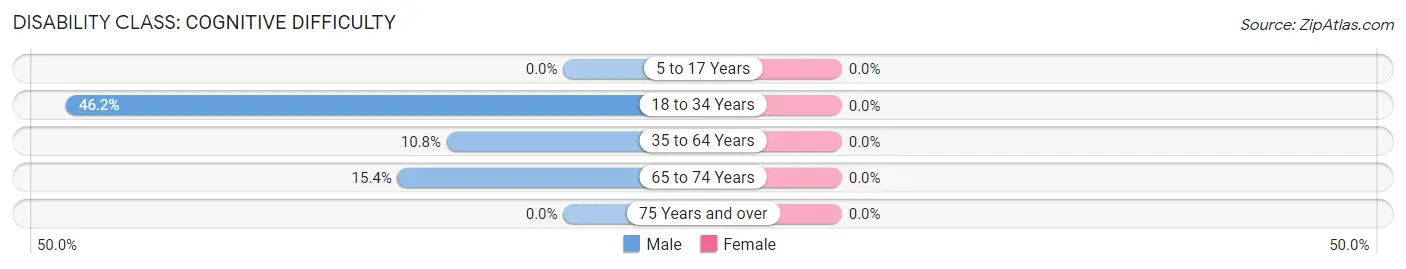
| Age Bracket | Male | Female |
| 5 to 17 Years | 0 (0.0%) | 0 (0.0%) |
| 18 to 34 Years | 6 (46.2%) | 0 (0.0%) |
| 35 to 64 Years | 4 (10.8%) | 0 (0.0%) |
| 65 to 74 Years | 2 (15.4%) | 0 (0.0%) |
| 75 Years and over | 0 (0.0%) | 0 (0.0%) |
Disability Class: Ambulatory Difficulty
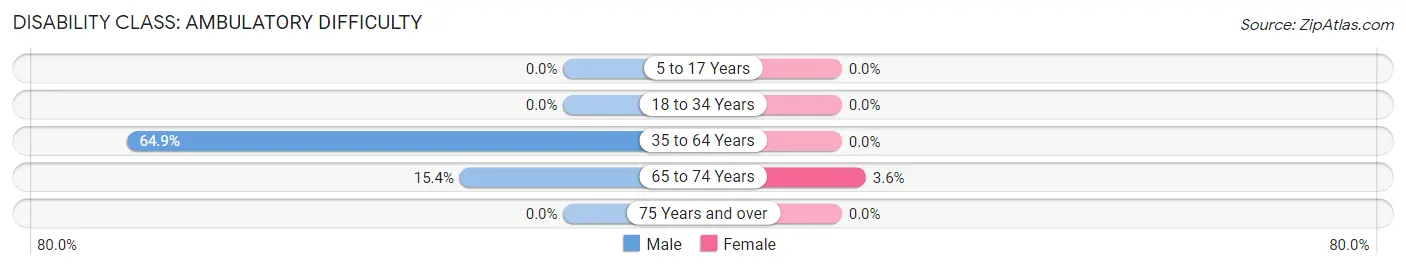
| Age Bracket | Male | Female |
| 5 to 17 Years | 0 (0.0%) | 0 (0.0%) |
| 18 to 34 Years | 0 (0.0%) | 0 (0.0%) |
| 35 to 64 Years | 24 (64.9%) | 0 (0.0%) |
| 65 to 74 Years | 2 (15.4%) | 1 (3.6%) |
| 75 Years and over | 0 (0.0%) | 0 (0.0%) |
Disability Class: Self-Care Difficulty
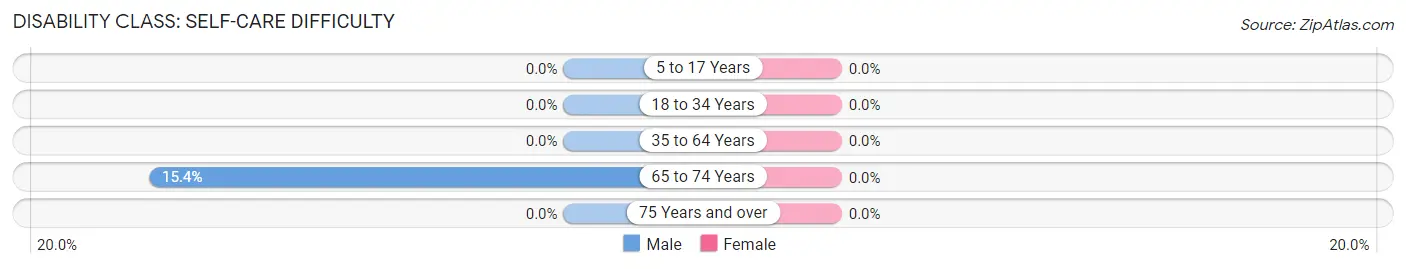
| Age Bracket | Male | Female |
| 5 to 17 Years | 0 (0.0%) | 0 (0.0%) |
| 18 to 34 Years | 0 (0.0%) | 0 (0.0%) |
| 35 to 64 Years | 0 (0.0%) | 0 (0.0%) |
| 65 to 74 Years | 2 (15.4%) | 0 (0.0%) |
| 75 Years and over | 0 (0.0%) | 0 (0.0%) |
Technology Access in Fairfield
Computing Device Access in Fairfield
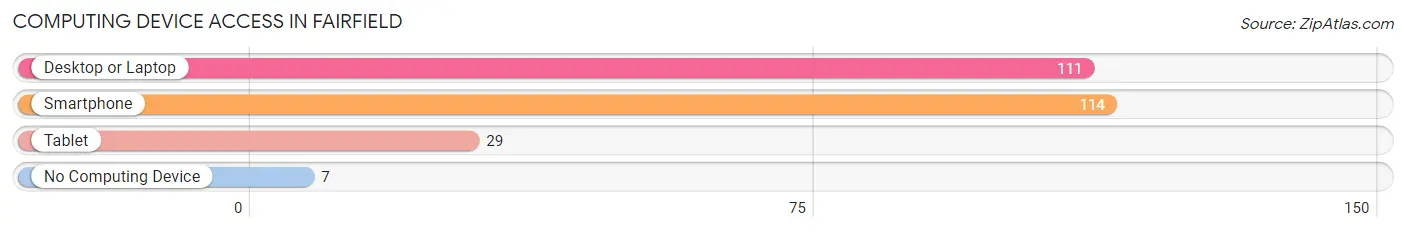
| Device Type | # Households | % Households |
| Desktop or Laptop | 111 | 91.7% |
| Smartphone | 114 | 94.2% |
| Tablet | 29 | 24.0% |
| No Computing Device | 7 | 5.8% |
| Total | 121 | 100.0% |
Internet Access in Fairfield
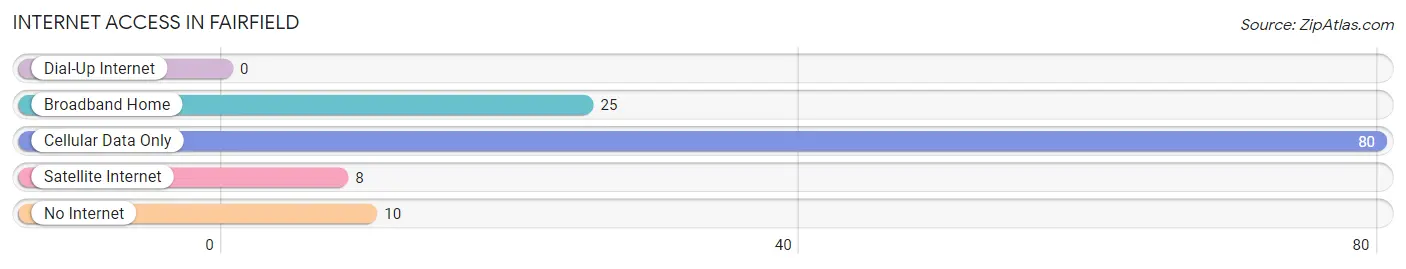
| Internet Type | # Households | % Households |
| Dial-Up Internet | 0 | 0.0% |
| Broadband Home | 25 | 20.7% |
| Cellular Data Only | 80 | 66.1% |
| Satellite Internet | 8 | 6.6% |
| No Internet | 10 | 8.3% |
| Total | 121 | 100.0% |
Fairfield Summary
Fairfield is a city located in the northern part of Kentucky, in the United States. It is part of the Cincinnati metropolitan area and is located in the county of Boone. The city has a population of approximately 8,000 people and is located about 20 miles south of Cincinnati.
History
Fairfield was founded in 1815 by a group of settlers from Pennsylvania. The city was named after the Fairfield Plantation, which was owned by one of the settlers. The city was incorporated in 1867 and has since grown to become a thriving community.
The city was originally a farming community, but in the late 19th century, it began to develop into an industrial center. The city was home to several factories, including a paper mill, a flour mill, and a tobacco factory. The city also had a large number of stores and businesses, including a bank, a post office, and a hotel.
In the early 20th century, the city began to experience a decline in its industrial base. This was due to the Great Depression and the decline of the tobacco industry. However, the city was able to rebound in the 1950s and 1960s, thanks to the growth of the Cincinnati metropolitan area.
Geography
Fairfield is located in the northern part of Kentucky, in the United States. It is part of the Cincinnati metropolitan area and is located in the county of Boone. The city is situated on the banks of the Ohio River and is bordered by the cities of Florence, Hebron, and Union.
The city has a total area of 4.3 square miles, of which 4.2 square miles is land and 0.1 square miles is water. The city has a humid subtropical climate, with hot, humid summers and cold, wet winters.
Economy
Fairfield’s economy is largely based on the service industry. The city is home to several large employers, including the University of Cincinnati Medical Center, the Cincinnati Children’s Hospital, and the Cincinnati Zoo. The city also has a number of retail stores, restaurants, and other businesses.
The city is also home to several manufacturing companies, including a paper mill, a flour mill, and a tobacco factory. The city also has a large number of stores and businesses, including a bank, a post office, and a hotel.
Demographics
As of the 2010 census, the population of Fairfield was 8,000 people. The city has a population density of 1,845 people per square mile. The median household income in the city is $50,000, and the median age is 37.
The city is predominantly white, with a population that is 88.3% white, 5.3% African American, 2.2% Asian, and 1.2% Hispanic or Latino. The city also has a large number of foreign-born residents, with a population that is 8.3% foreign-born.
Conclusion
Fairfield is a city located in the northern part of Kentucky, in the United States. It is part of the Cincinnati metropolitan area and is located in the county of Boone. The city has a population of approximately 8,000 people and is located about 20 miles south of Cincinnati. The city has a long history, dating back to 1815, and has a diverse economy based on the service industry, manufacturing, and retail. The city is predominantly white, with a population that is 88.3% white, 5.3% African American, 2.2% Asian, and 1.2% Hispanic or Latino. The city also has a large number of foreign-born residents, with a population that is 8.3% foreign-born.
Common Questions
What is Per Capita Income in Fairfield?
Per Capita income in Fairfield is $28,090.
What is the Median Family Income in Fairfield?
Median Family Income in Fairfield is $85,951.
What is the Median Household income in Fairfield?
Median Household Income in Fairfield is $85,546.
What is Inequality or Gini Index in Fairfield?
Inequality or Gini Index in Fairfield is 0.21.
What is the Total Population of Fairfield?
Total Population of Fairfield is 196.
What is the Total Male Population of Fairfield?
Total Male Population of Fairfield is 78.
What is the Total Female Population of Fairfield?
Total Female Population of Fairfield is 118.
What is the Ratio of Males per 100 Females in Fairfield?
There are 66.10 Males per 100 Females in Fairfield.
What is the Ratio of Females per 100 Males in Fairfield?
There are 151.28 Females per 100 Males in Fairfield.
What is the Median Population Age in Fairfield?
Median Population Age in Fairfield is 59.7 Years.
What is the Average Family Size in Fairfield
Average Family Size in Fairfield is 1.7 People.
What is the Average Household Size in Fairfield
Average Household Size in Fairfield is 1.6 People.
How Large is the Labor Force in Fairfield?
There are 66 People in the Labor Forcein in Fairfield.
What is the Percentage of People in the Labor Force in Fairfield?
34.9% of People are in the Labor Force in Fairfield.