Independence, KY Map & Demographics
Independence Map
Independence Overview
$37,415
PER CAPITA INCOME
$99,779
AVG FAMILY INCOME
$92,355
AVG HOUSEHOLD INCOME
31.4%
WAGE / INCOME GAP [ % ]
68.6¢/ $1
WAGE / INCOME GAP [ $ ]
$13,249
FAMILY INCOME DEFICIT
0.35
INEQUALITY / GINI INDEX
28,722
TOTAL POPULATION
14,246
MALE POPULATION
14,476
FEMALE POPULATION
98.41
MALES / 100 FEMALES
101.61
FEMALES / 100 MALES
34.7
MEDIAN AGE
3.3
AVG FAMILY SIZE
2.9
AVG HOUSEHOLD SIZE
16,207
LABOR FORCE [ PEOPLE ]
74.8%
PERCENT IN LABOR FORCE
3.6%
UNEMPLOYMENT RATE
Independence Zip Codes
Independence Area Codes
Income in Independence
Income Overview in Independence
Per Capita Income in Independence is $37,415, while median incomes of families and households are $99,779 and $92,355 respectively.
| Characteristic | Number | Measure |
| Per Capita Income | 28,722 | $37,415 |
| Median Family Income | 7,423 | $99,779 |
| Mean Family Income | 7,423 | $112,524 |
| Median Household Income | 9,968 | $92,355 |
| Mean Household Income | 9,968 | $105,066 |
| Income Deficit | 7,423 | $13,249 |
| Wage / Income Gap (%) | 28,722 | 31.38% |
| Wage / Income Gap ($) | 28,722 | 68.62¢ per $1 |
| Gini / Inequality Index | 28,722 | 0.35 |
Earnings by Sex in Independence
Average Earnings in Independence are $48,215, $56,138 for men and $38,521 for women, a difference of 31.4%.
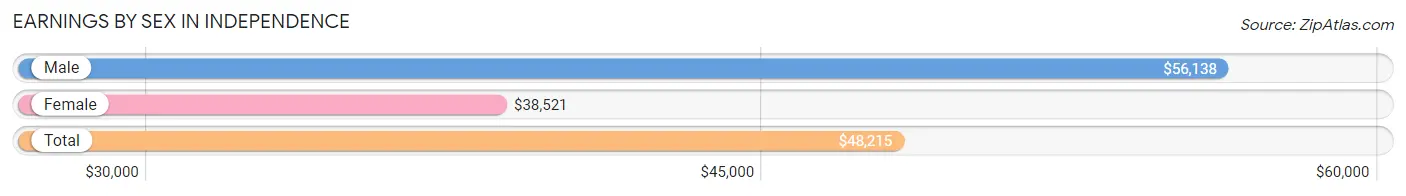
| Sex | Number | Average Earnings |
| Male | 8,512 (52.0%) | $56,138 |
| Female | 7,851 (48.0%) | $38,521 |
| Total | 16,363 (100.0%) | $48,215 |
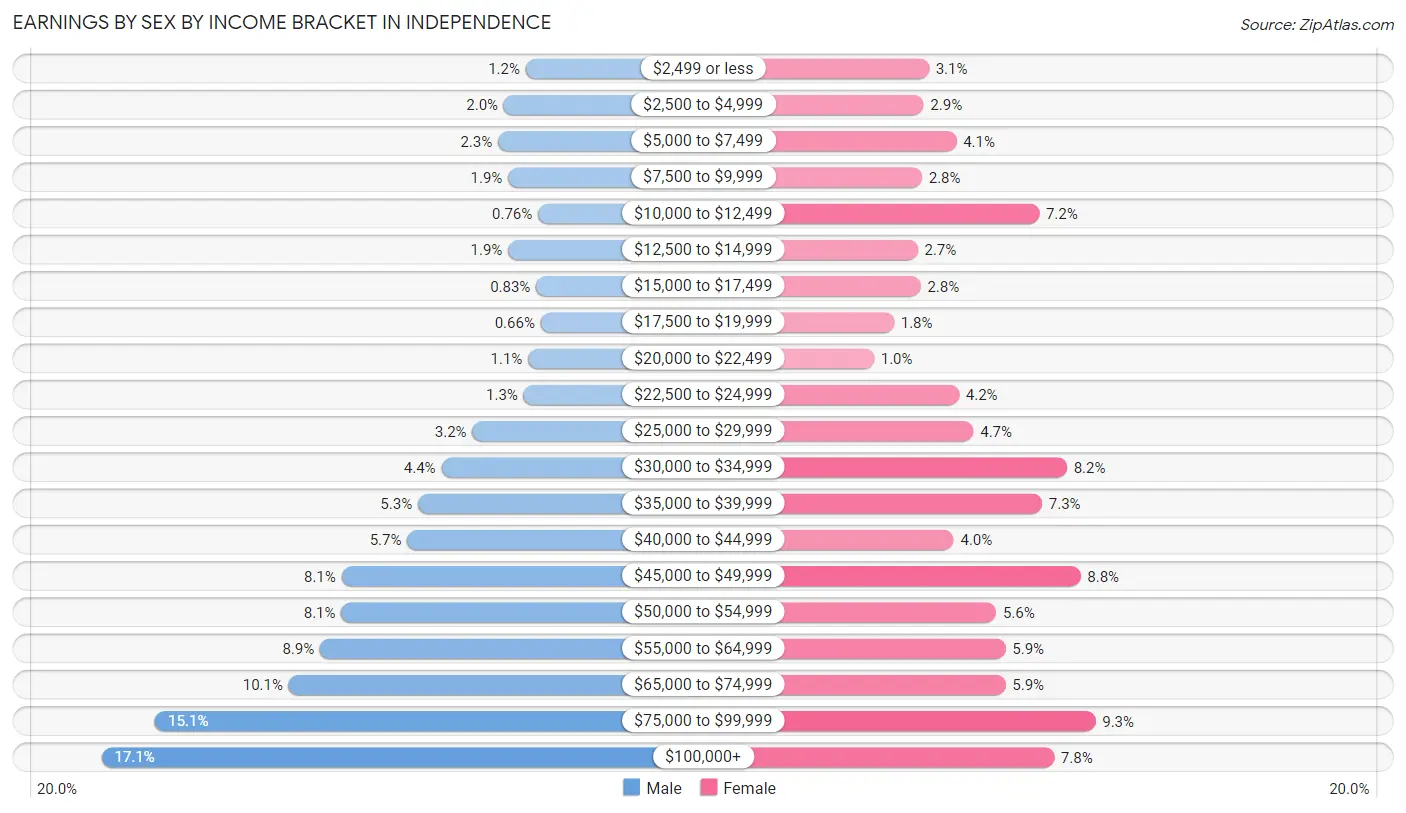
Earnings by Sex by Income Bracket in Independence
The most common earnings brackets in Independence are $100,000+ for men (1,457 | 17.1%) and $75,000 to $99,999 for women (731 | 9.3%).
| Income | Male | Female |
| $2,499 or less | 104 (1.2%) | 241 (3.1%) |
| $2,500 to $4,999 | 174 (2.0%) | 225 (2.9%) |
| $5,000 to $7,499 | 192 (2.3%) | 322 (4.1%) |
| $7,500 to $9,999 | 160 (1.9%) | 221 (2.8%) |
| $10,000 to $12,499 | 65 (0.8%) | 565 (7.2%) |
| $12,500 to $14,999 | 160 (1.9%) | 208 (2.6%) |
| $15,000 to $17,499 | 71 (0.8%) | 217 (2.8%) |
| $17,500 to $19,999 | 56 (0.7%) | 138 (1.8%) |
| $20,000 to $22,499 | 96 (1.1%) | 79 (1.0%) |
| $22,500 to $24,999 | 111 (1.3%) | 330 (4.2%) |
| $25,000 to $29,999 | 274 (3.2%) | 372 (4.7%) |
| $30,000 to $34,999 | 373 (4.4%) | 647 (8.2%) |
| $35,000 to $39,999 | 448 (5.3%) | 574 (7.3%) |
| $40,000 to $44,999 | 482 (5.7%) | 314 (4.0%) |
| $45,000 to $49,999 | 691 (8.1%) | 687 (8.7%) |
| $50,000 to $54,999 | 692 (8.1%) | 439 (5.6%) |
| $55,000 to $64,999 | 760 (8.9%) | 466 (5.9%) |
| $65,000 to $74,999 | 860 (10.1%) | 466 (5.9%) |
| $75,000 to $99,999 | 1,286 (15.1%) | 731 (9.3%) |
| $100,000+ | 1,457 (17.1%) | 609 (7.8%) |
| Total | 8,512 (100.0%) | 7,851 (100.0%) |
Earnings by Sex by Educational Attainment in Independence
Average earnings in Independence are $63,304 for men and $45,716 for women, a difference of 27.8%. Men with an educational attainment of graduate degree enjoy the highest average annual earnings of $110,978, while those with less than high school education earn the least with $35,357. Women with an educational attainment of graduate degree earn the most with the average annual earnings of $59,347, while those with less than high school education have the smallest earnings of $27,969.
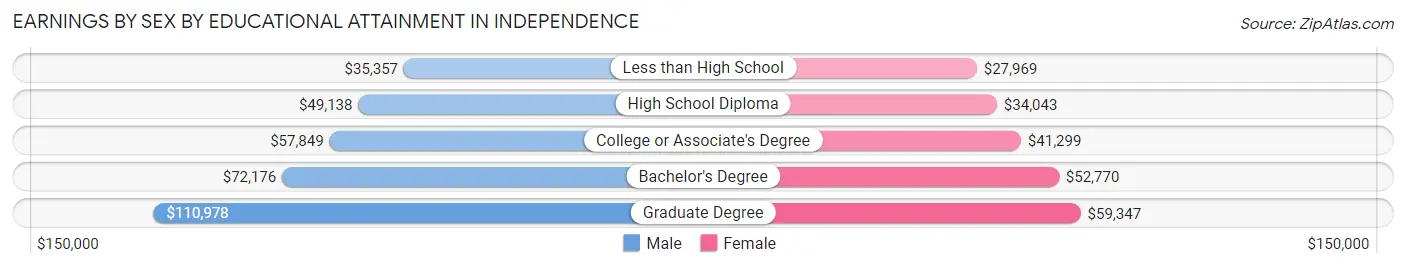
| Educational Attainment | Male Income | Female Income |
| Less than High School | $35,357 | $27,969 |
| High School Diploma | $49,138 | $34,043 |
| College or Associate's Degree | $57,849 | $41,299 |
| Bachelor's Degree | $72,176 | $52,770 |
| Graduate Degree | $110,978 | $59,347 |
| Total | $63,304 | $45,716 |
Family Income in Independence
Family Income Brackets in Independence
According to the Independence family income data, there are 1,982 families falling into the $100,000 to $149,999 income range, which is the most common income bracket and makes up 26.7% of all families. Conversely, the $10,000 to $14,999 income bracket is the least frequent group with only 89 families (1.2%) belonging to this category.
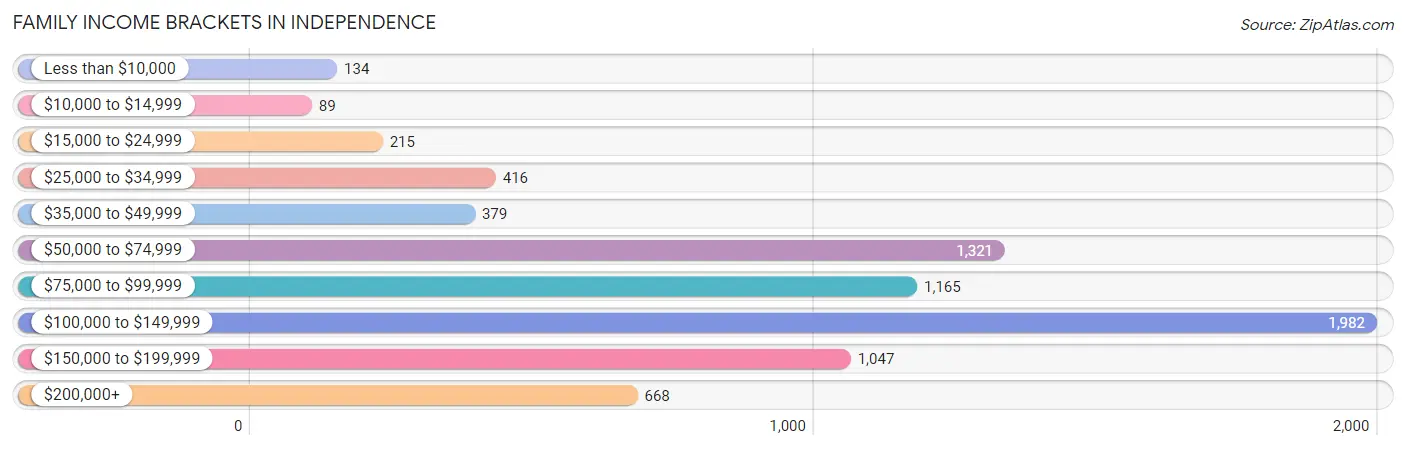
| Income Bracket | # Families | % Families |
| Less than $10,000 | 134 | 1.8% |
| $10,000 to $14,999 | 89 | 1.2% |
| $15,000 to $24,999 | 215 | 2.9% |
| $25,000 to $34,999 | 416 | 5.6% |
| $35,000 to $49,999 | 379 | 5.1% |
| $50,000 to $74,999 | 1,321 | 17.8% |
| $75,000 to $99,999 | 1,165 | 15.7% |
| $100,000 to $149,999 | 1,982 | 26.7% |
| $150,000 to $199,999 | 1,047 | 14.1% |
| $200,000+ | 668 | 9.0% |
Family Income by Famaliy Size in Independence
4-person families (1,724 | 23.2%) account for the highest median family income in Independence with $120,469 per family, while 2-person families (2,876 | 38.7%) have the highest median income of $38,494 per family member.
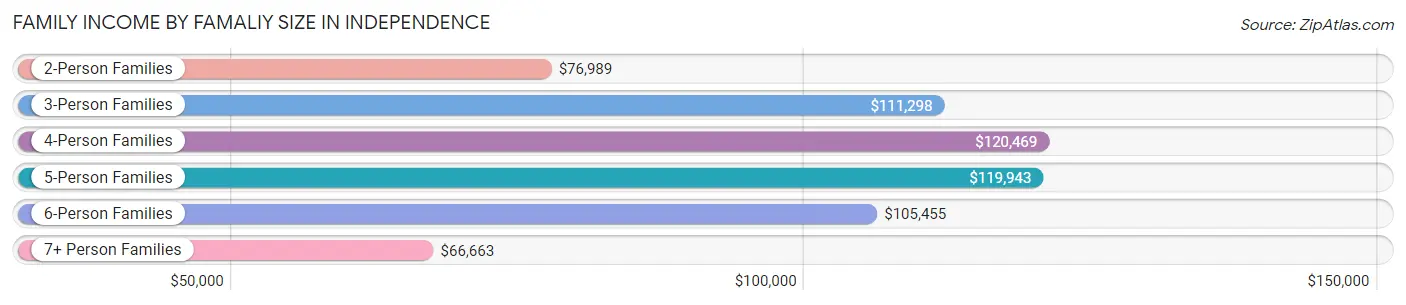
| Income Bracket | # Families | Median Income |
| 2-Person Families | 2,876 (38.7%) | $76,989 |
| 3-Person Families | 1,742 (23.5%) | $111,298 |
| 4-Person Families | 1,724 (23.2%) | $120,469 |
| 5-Person Families | 764 (10.3%) | $119,943 |
| 6-Person Families | 108 (1.5%) | $105,455 |
| 7+ Person Families | 209 (2.8%) | $66,663 |
| Total | 7,423 (100.0%) | $99,779 |
Family Income by Number of Earners in Independence
The median family income in Independence is $99,779, with families comprising 3+ earners (990) having the highest median family income of $155,875, while families with no earners (870) have the lowest median family income of $53,237, accounting for 13.3% and 11.7% of families, respectively.
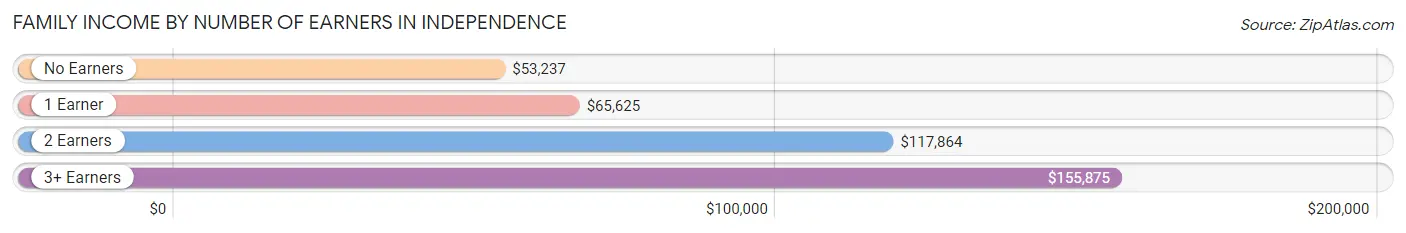
| Number of Earners | # Families | Median Income |
| No Earners | 870 (11.7%) | $53,237 |
| 1 Earner | 1,823 (24.6%) | $65,625 |
| 2 Earners | 3,740 (50.4%) | $117,864 |
| 3+ Earners | 990 (13.3%) | $155,875 |
| Total | 7,423 (100.0%) | $99,779 |
Household Income in Independence
Household Income Brackets in Independence
With 2,512 households falling in the category, the $100,000 to $149,999 income range is the most frequent in Independence, accounting for 25.2% of all households. In contrast, only 189 households (1.9%) fall into the less than $10,000 income bracket, making it the least populous group.
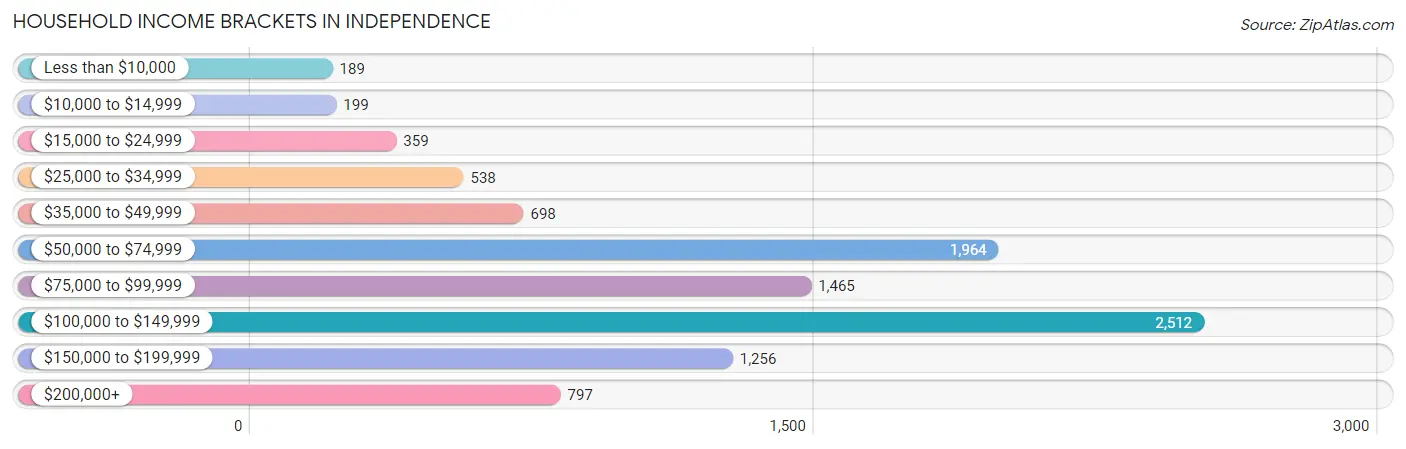
| Income Bracket | # Households | % Households |
| Less than $10,000 | 189 | 1.9% |
| $10,000 to $14,999 | 199 | 2.0% |
| $15,000 to $24,999 | 359 | 3.6% |
| $25,000 to $34,999 | 538 | 5.4% |
| $35,000 to $49,999 | 698 | 7.0% |
| $50,000 to $74,999 | 1,964 | 19.7% |
| $75,000 to $99,999 | 1,465 | 14.7% |
| $100,000 to $149,999 | 2,512 | 25.2% |
| $150,000 to $199,999 | 1,256 | 12.6% |
| $200,000+ | 797 | 8.0% |
Household Income by Householder Age in Independence
The median household income in Independence is $92,355, with the highest median household income of $106,157 found in the 45 to 64 years age bracket for the primary householder. A total of 3,907 households (39.2%) fall into this category. Meanwhile, the 65+ years age bracket for the primary householder has the lowest median household income of $57,631, with 1,679 households (16.8%) in this group.
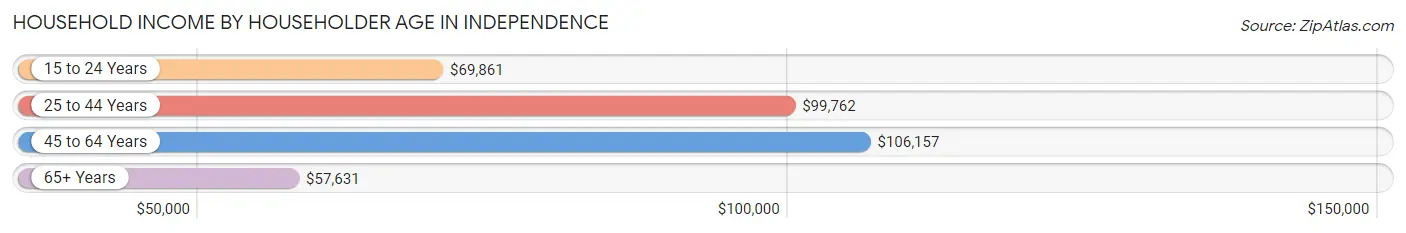
| Income Bracket | # Households | Median Income |
| 15 to 24 Years | 223 (2.2%) | $69,861 |
| 25 to 44 Years | 4,159 (41.7%) | $99,762 |
| 45 to 64 Years | 3,907 (39.2%) | $106,157 |
| 65+ Years | 1,679 (16.8%) | $57,631 |
| Total | 9,968 (100.0%) | $92,355 |
Poverty in Independence
Income Below Poverty by Sex and Age in Independence
With 6.5% poverty level for males and 9.2% for females among the residents of Independence, 5 year old males and 15 year old females are the most vulnerable to poverty, with 45 males (34.9%) and 47 females (23.4%) in their respective age groups living below the poverty level.
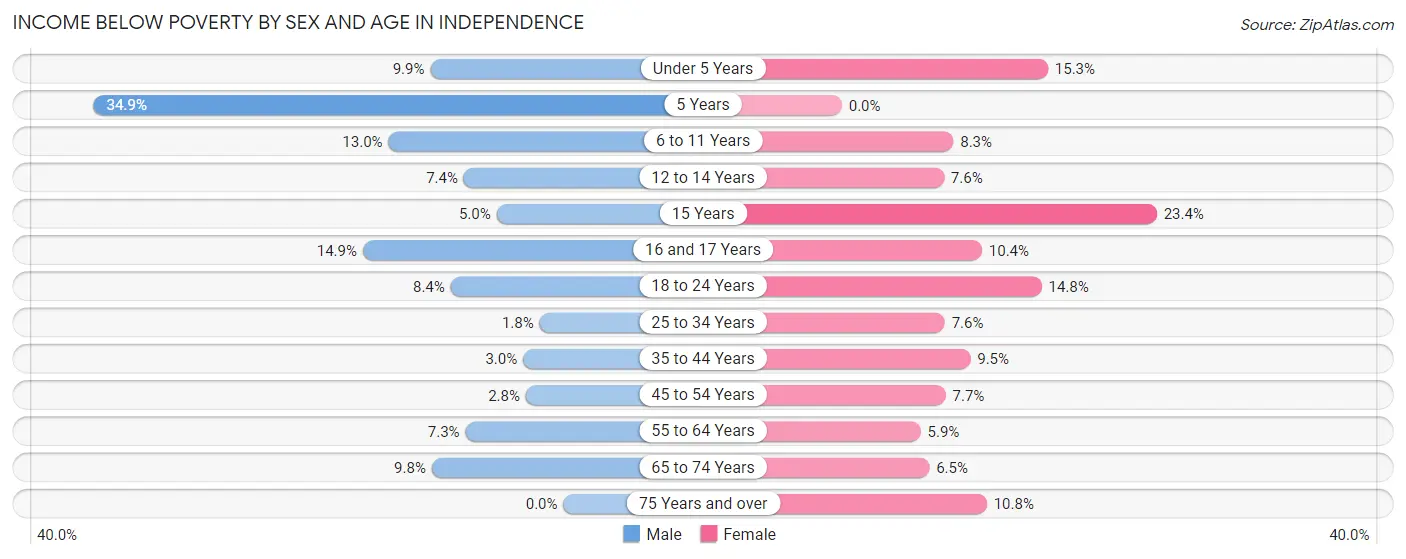
| Age Bracket | Male | Female |
| Under 5 Years | 91 (9.9%) | 176 (15.3%) |
| 5 Years | 45 (34.9%) | 0 (0.0%) |
| 6 to 11 Years | 217 (13.0%) | 87 (8.3%) |
| 12 to 14 Years | 45 (7.4%) | 48 (7.6%) |
| 15 Years | 18 (5.0%) | 47 (23.4%) |
| 16 and 17 Years | 42 (14.9%) | 54 (10.4%) |
| 18 to 24 Years | 107 (8.4%) | 183 (14.8%) |
| 25 to 34 Years | 34 (1.8%) | 169 (7.6%) |
| 35 to 44 Years | 63 (3.0%) | 204 (9.5%) |
| 45 to 54 Years | 59 (2.8%) | 149 (7.7%) |
| 55 to 64 Years | 113 (7.3%) | 88 (5.9%) |
| 65 to 74 Years | 81 (9.8%) | 73 (6.5%) |
| 75 Years and over | 0 (0.0%) | 54 (10.8%) |
| Total | 915 (6.5%) | 1,332 (9.2%) |
Income Above Poverty by Sex and Age in Independence
According to the poverty statistics in Independence, males aged 75 years and over and females aged 5 years are the age groups that are most secure financially, with 100.0% of males and 100.0% of females in these age groups living above the poverty line.
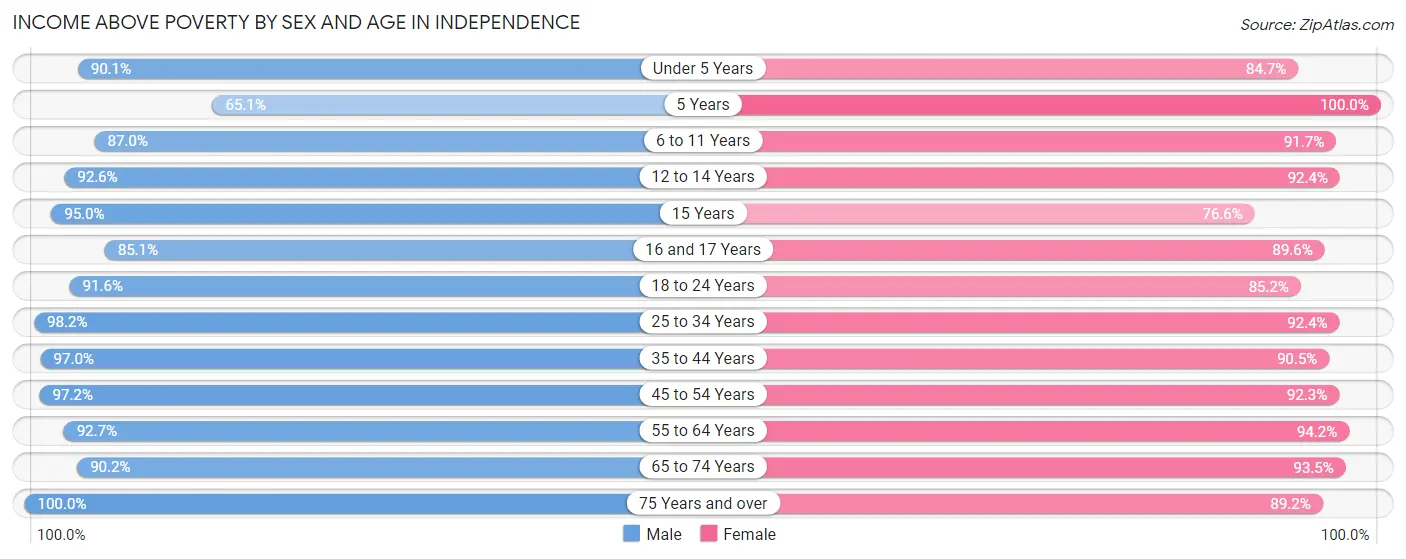
| Age Bracket | Male | Female |
| Under 5 Years | 830 (90.1%) | 974 (84.7%) |
| 5 Years | 84 (65.1%) | 200 (100.0%) |
| 6 to 11 Years | 1,454 (87.0%) | 964 (91.7%) |
| 12 to 14 Years | 564 (92.6%) | 585 (92.4%) |
| 15 Years | 345 (95.0%) | 154 (76.6%) |
| 16 and 17 Years | 240 (85.1%) | 465 (89.6%) |
| 18 to 24 Years | 1,172 (91.6%) | 1,051 (85.2%) |
| 25 to 34 Years | 1,882 (98.2%) | 2,042 (92.4%) |
| 35 to 44 Years | 2,045 (97.0%) | 1,934 (90.5%) |
| 45 to 54 Years | 2,054 (97.2%) | 1,783 (92.3%) |
| 55 to 64 Years | 1,441 (92.7%) | 1,417 (94.2%) |
| 65 to 74 Years | 748 (90.2%) | 1,051 (93.5%) |
| 75 Years and over | 421 (100.0%) | 448 (89.2%) |
| Total | 13,280 (93.5%) | 13,068 (90.7%) |
Income Below Poverty Among Married-Couple Families in Independence
The poverty statistics for married-couple families in Independence show that 0.9% or 54 of the total 5,761 families live below the poverty line. Families with 3 or 4 children have the highest poverty rate of 5.4%, comprising of 30 families. On the other hand, families with 5 or more children have the lowest poverty rate of 0.0%, which includes 0 families.
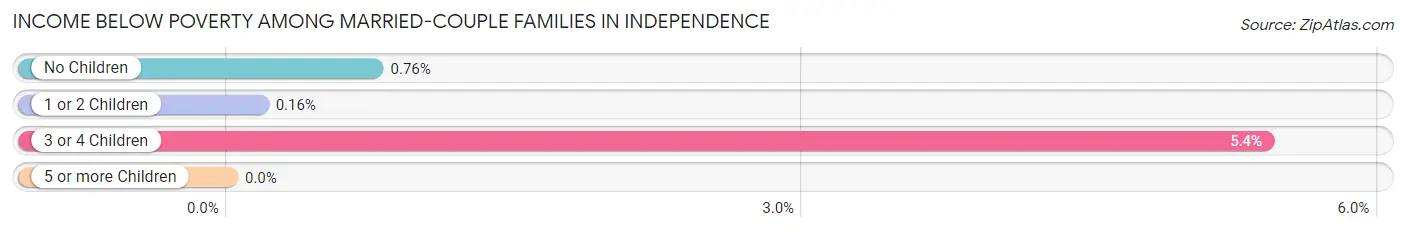
| Children | Above Poverty | Below Poverty |
| No Children | 2,611 (99.2%) | 20 (0.8%) |
| 1 or 2 Children | 2,431 (99.8%) | 4 (0.2%) |
| 3 or 4 Children | 525 (94.6%) | 30 (5.4%) |
| 5 or more Children | 140 (100.0%) | 0 (0.0%) |
| Total | 5,707 (99.1%) | 54 (0.9%) |
Income Below Poverty Among Single-Parent Households in Independence
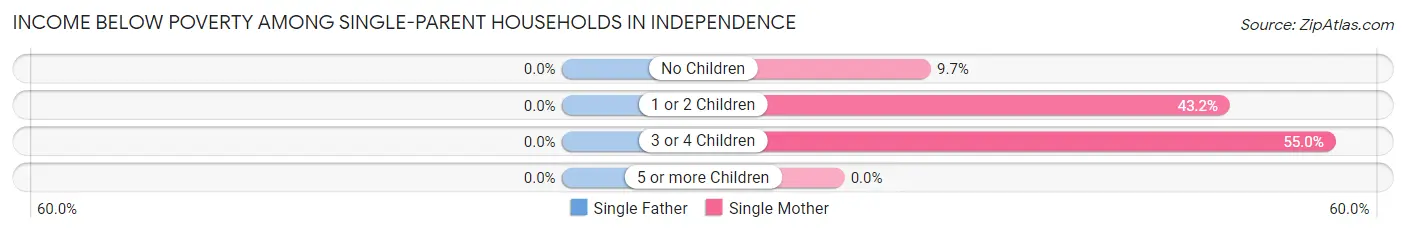
| Children | Single Father | Single Mother |
| No Children | 0 (0.0%) | 56 (9.7%) |
| 1 or 2 Children | 0 (0.0%) | 107 (43.1%) |
| 3 or 4 Children | 0 (0.0%) | 133 (55.0%) |
| 5 or more Children | 0 (0.0%) | 0 (0.0%) |
| Total | 0 (0.0%) | 296 (27.7%) |
Income Below Poverty Among Married-Couple vs Single-Parent Households in Independence
The poverty data for Independence shows that 54 of the married-couple family households (0.9%) and 296 of the single-parent households (17.8%) are living below the poverty level. Within the married-couple family households, those with 3 or 4 children have the highest poverty rate, with 30 households (5.4%) falling below the poverty line. Among the single-parent households, those with 3 or 4 children have the highest poverty rate, with 133 household (41.7%) living below poverty.
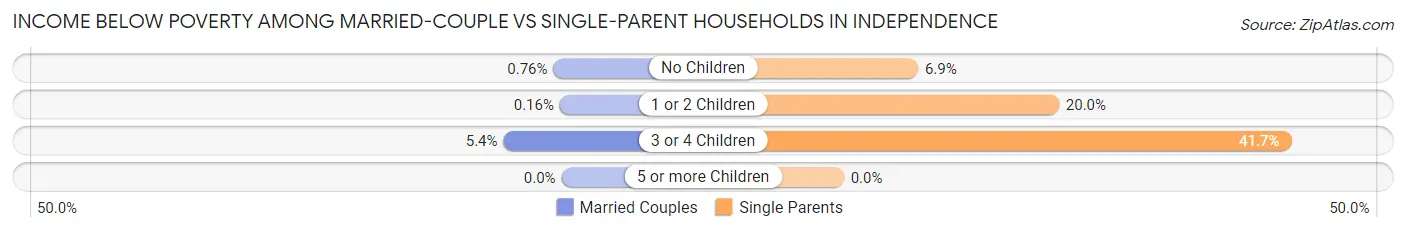
| Children | Married-Couple Families | Single-Parent Households |
| No Children | 20 (0.8%) | 56 (6.9%) |
| 1 or 2 Children | 4 (0.2%) | 107 (20.0%) |
| 3 or 4 Children | 30 (5.4%) | 133 (41.7%) |
| 5 or more Children | 0 (0.0%) | 0 (0.0%) |
| Total | 54 (0.9%) | 296 (17.8%) |
Race in Independence
The most populous races in Independence are White / Caucasian (27,100 | 94.4%), Two or more Races (795 | 2.8%), and Asian (399 | 1.4%).
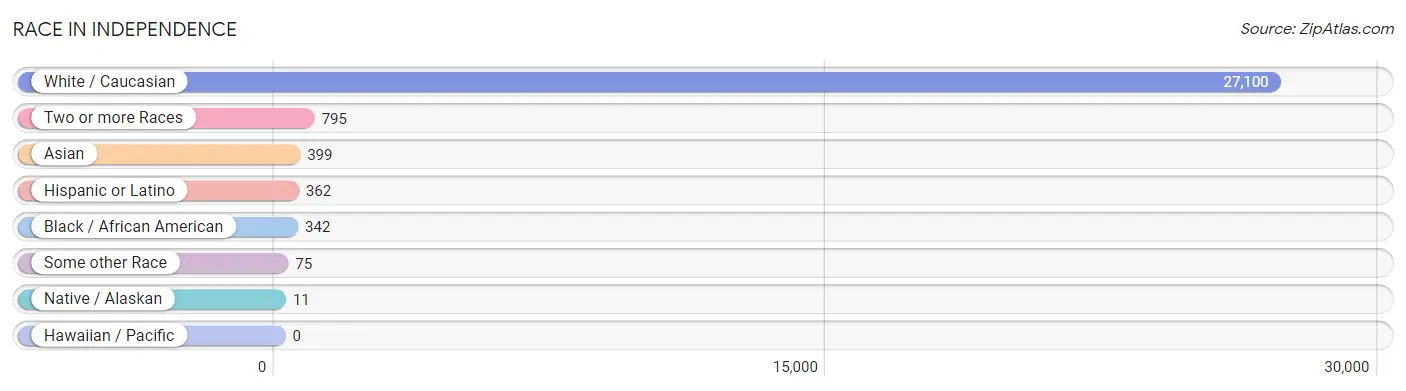
| Race | # Population | % Population |
| Asian | 399 | 1.4% |
| Black / African American | 342 | 1.2% |
| Hawaiian / Pacific | 0 | 0.0% |
| Hispanic or Latino | 362 | 1.3% |
| Native / Alaskan | 11 | 0.0% |
| White / Caucasian | 27,100 | 94.4% |
| Two or more Races | 795 | 2.8% |
| Some other Race | 75 | 0.3% |
| Total | 28,722 | 100.0% |
Ancestry in Independence
The most populous ancestries reported in Independence are German (9,516 | 33.1%), Irish (5,224 | 18.2%), English (4,504 | 15.7%), American (2,225 | 7.7%), and European (1,040 | 3.6%), together accounting for 78.4% of all Independence residents.
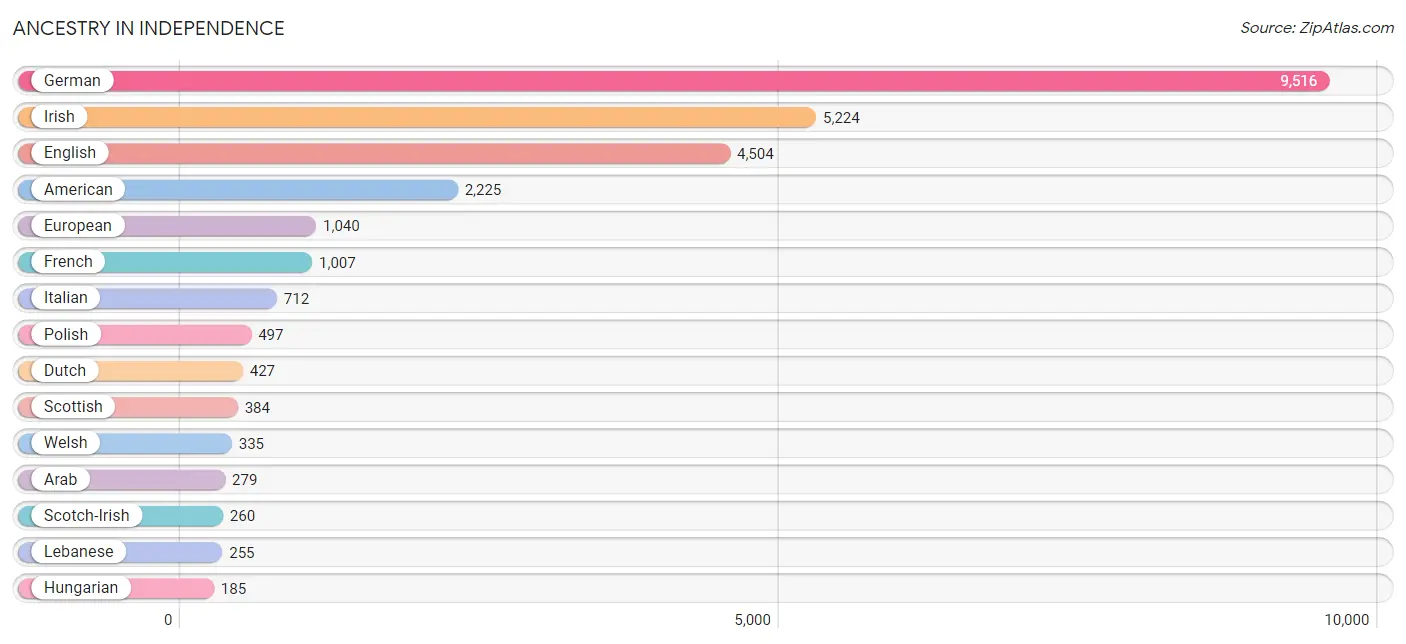
| Ancestry | # Population | % Population |
| American | 2,225 | 7.7% |
| Arab | 279 | 1.0% |
| Austrian | 27 | 0.1% |
| Bhutanese | 128 | 0.4% |
| British | 99 | 0.3% |
| Burmese | 28 | 0.1% |
| Celtic | 14 | 0.1% |
| Cherokee | 72 | 0.3% |
| Choctaw | 9 | 0.0% |
| Colombian | 20 | 0.1% |
| Croatian | 13 | 0.1% |
| Crow | 5 | 0.0% |
| Cuban | 128 | 0.4% |
| Czech | 121 | 0.4% |
| Danish | 14 | 0.1% |
| Dutch | 427 | 1.5% |
| Eastern European | 51 | 0.2% |
| English | 4,504 | 15.7% |
| European | 1,040 | 3.6% |
| French | 1,007 | 3.5% |
| German | 9,516 | 33.1% |
| Greek | 86 | 0.3% |
| Haitian | 20 | 0.1% |
| Hungarian | 185 | 0.6% |
| Indian (Asian) | 134 | 0.5% |
| Irish | 5,224 | 18.2% |
| Italian | 712 | 2.5% |
| Korean | 94 | 0.3% |
| Lebanese | 255 | 0.9% |
| Lithuanian | 36 | 0.1% |
| Mexican | 53 | 0.2% |
| Mexican American Indian | 25 | 0.1% |
| Norwegian | 151 | 0.5% |
| Peruvian | 13 | 0.1% |
| Polish | 497 | 1.7% |
| Portuguese | 14 | 0.1% |
| Puerto Rican | 113 | 0.4% |
| Russian | 103 | 0.4% |
| Scandinavian | 53 | 0.2% |
| Scotch-Irish | 260 | 0.9% |
| Scottish | 384 | 1.3% |
| Serbian | 27 | 0.1% |
| Slavic | 18 | 0.1% |
| South American | 33 | 0.1% |
| Spaniard | 35 | 0.1% |
| Sri Lankan | 35 | 0.1% |
| Swedish | 46 | 0.2% |
| Swiss | 15 | 0.1% |
| Thai | 100 | 0.4% |
| Turkish | 22 | 0.1% |
| Welsh | 335 | 1.2% | View All 51 Rows |
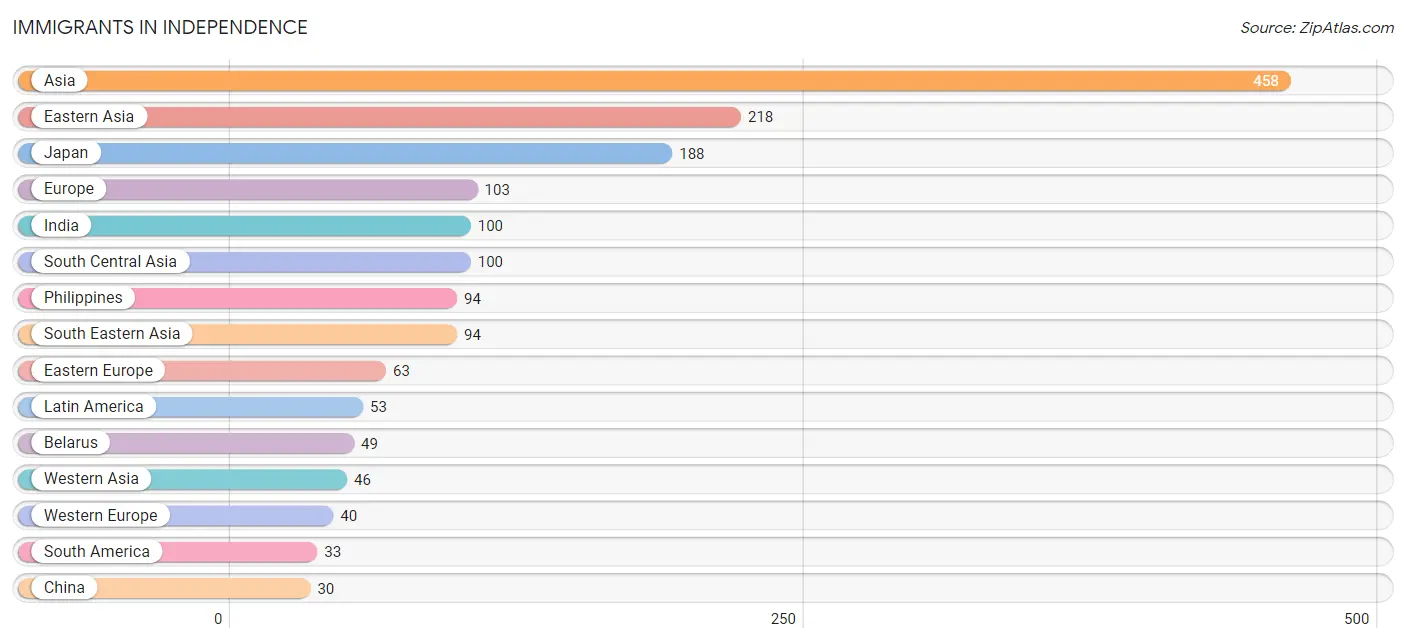
Immigrants in Independence
The most numerous immigrant groups reported in Independence came from Asia (458 | 1.6%), Eastern Asia (218 | 0.8%), Japan (188 | 0.6%), Europe (103 | 0.4%), and India (100 | 0.4%), together accounting for 3.7% of all Independence residents.
| Immigration Origin | # Population | % Population |
| Africa | 16 | 0.1% |
| Asia | 458 | 1.6% |
| Belarus | 49 | 0.2% |
| Caribbean | 20 | 0.1% |
| China | 30 | 0.1% |
| Colombia | 20 | 0.1% |
| Eastern Asia | 218 | 0.8% |
| Eastern Europe | 63 | 0.2% |
| Europe | 103 | 0.4% |
| France | 16 | 0.1% |
| Germany | 24 | 0.1% |
| Haiti | 20 | 0.1% |
| India | 100 | 0.4% |
| Japan | 188 | 0.6% |
| Latin America | 53 | 0.2% |
| Peru | 13 | 0.1% |
| Philippines | 94 | 0.3% |
| Poland | 14 | 0.1% |
| Saudi Arabia | 24 | 0.1% |
| Senegal | 16 | 0.1% |
| South America | 33 | 0.1% |
| South Central Asia | 100 | 0.4% |
| South Eastern Asia | 94 | 0.3% |
| Turkey | 22 | 0.1% |
| Western Africa | 16 | 0.1% |
| Western Asia | 46 | 0.2% |
| Western Europe | 40 | 0.1% | View All 27 Rows |
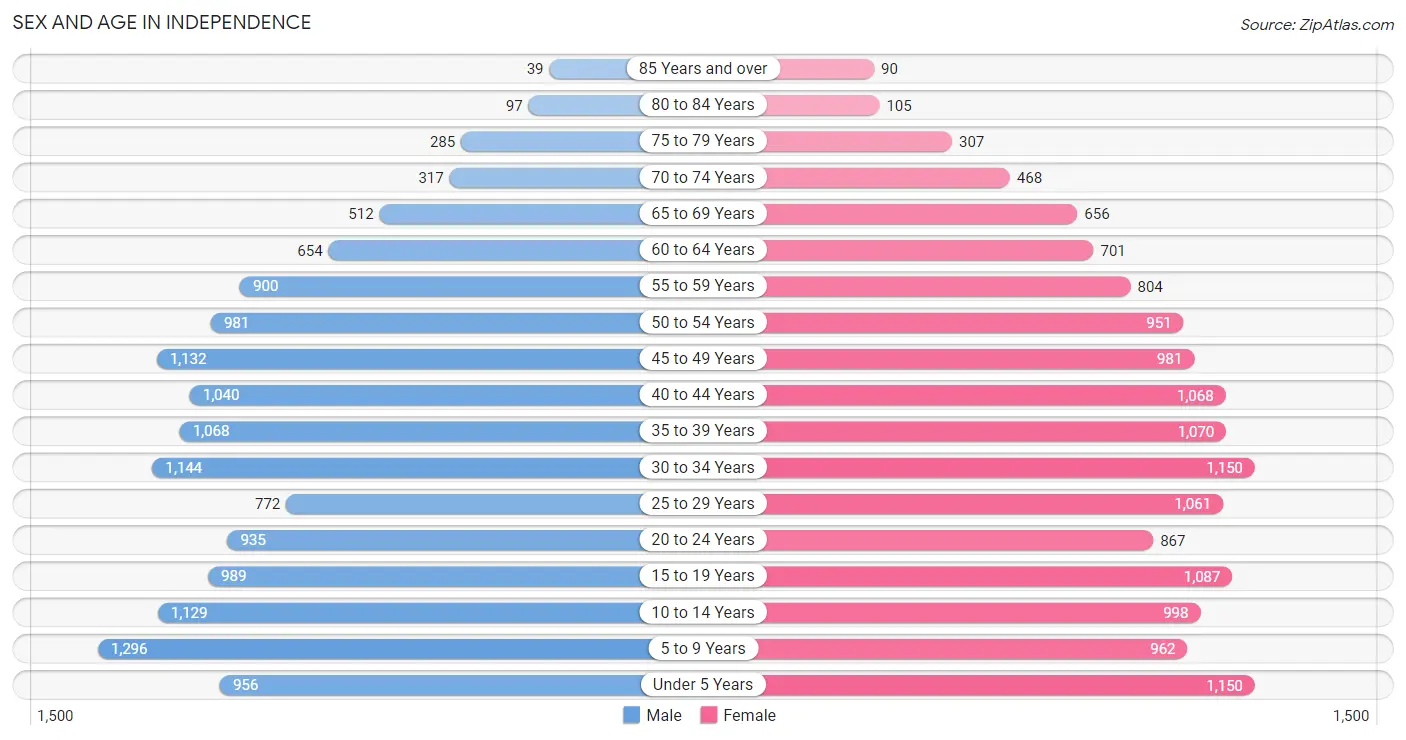
Sex and Age in Independence
Sex and Age in Independence
The most populous age groups in Independence are 5 to 9 Years (1,296 | 9.1%) for men and Under 5 Years (1,150 | 7.9%) for women.
| Age Bracket | Male | Female |
| Under 5 Years | 956 (6.7%) | 1,150 (7.9%) |
| 5 to 9 Years | 1,296 (9.1%) | 962 (6.7%) |
| 10 to 14 Years | 1,129 (7.9%) | 998 (6.9%) |
| 15 to 19 Years | 989 (6.9%) | 1,087 (7.5%) |
| 20 to 24 Years | 935 (6.6%) | 867 (6.0%) |
| 25 to 29 Years | 772 (5.4%) | 1,061 (7.3%) |
| 30 to 34 Years | 1,144 (8.0%) | 1,150 (7.9%) |
| 35 to 39 Years | 1,068 (7.5%) | 1,070 (7.4%) |
| 40 to 44 Years | 1,040 (7.3%) | 1,068 (7.4%) |
| 45 to 49 Years | 1,132 (8.0%) | 981 (6.8%) |
| 50 to 54 Years | 981 (6.9%) | 951 (6.6%) |
| 55 to 59 Years | 900 (6.3%) | 804 (5.6%) |
| 60 to 64 Years | 654 (4.6%) | 701 (4.8%) |
| 65 to 69 Years | 512 (3.6%) | 656 (4.5%) |
| 70 to 74 Years | 317 (2.2%) | 468 (3.2%) |
| 75 to 79 Years | 285 (2.0%) | 307 (2.1%) |
| 80 to 84 Years | 97 (0.7%) | 105 (0.7%) |
| 85 Years and over | 39 (0.3%) | 90 (0.6%) |
| Total | 14,246 (100.0%) | 14,476 (100.0%) |
Families and Households in Independence
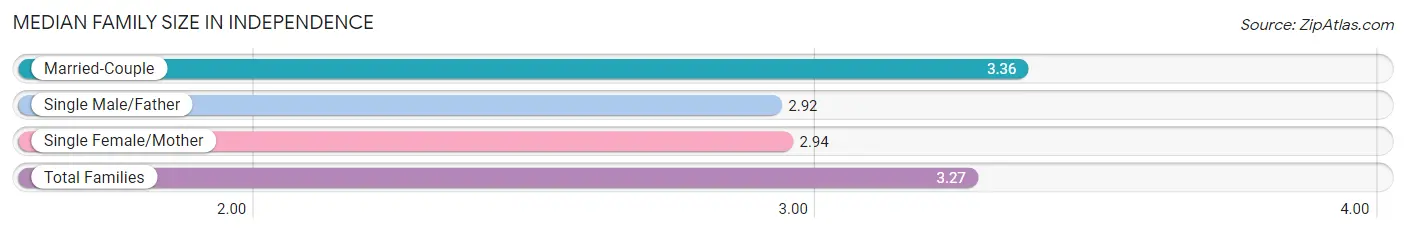
Median Family Size in Independence
The median family size in Independence is 3.27 persons per family, with married-couple families (5,761 | 77.6%) accounting for the largest median family size of 3.36 persons per family. On the other hand, single male/father families (592 | 8.0%) represent the smallest median family size with 2.92 persons per family.
| Family Type | # Families | Family Size |
| Married-Couple | 5,761 (77.6%) | 3.36 |
| Single Male/Father | 592 (8.0%) | 2.92 |
| Single Female/Mother | 1,070 (14.4%) | 2.94 |
| Total Families | 7,423 (100.0%) | 3.27 |
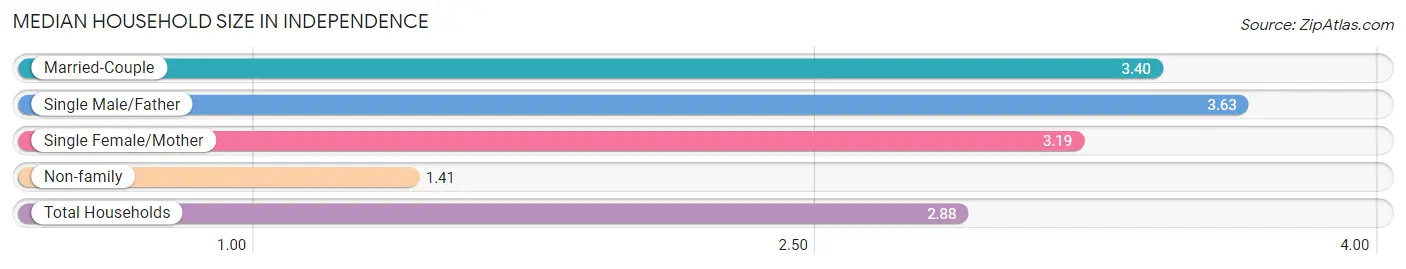
Median Household Size in Independence
The median household size in Independence is 2.88 persons per household, with single male/father households (592 | 5.9%) accounting for the largest median household size of 3.63 persons per household. non-family households (2,545 | 25.5%) represent the smallest median household size with 1.41 persons per household.
| Household Type | # Households | Household Size |
| Married-Couple | 5,761 (57.8%) | 3.40 |
| Single Male/Father | 592 (5.9%) | 3.63 |
| Single Female/Mother | 1,070 (10.7%) | 3.19 |
| Non-family | 2,545 (25.5%) | 1.41 |
| Total Households | 9,968 (100.0%) | 2.88 |
Household Size by Marriage Status in Independence
Out of a total of 9,968 households in Independence, 7,423 (74.5%) are family households, while 2,545 (25.5%) are nonfamily households. The most numerous type of family households are 2-person households, comprising 2,610, and the most common type of nonfamily households are 1-person households, comprising 1,694.
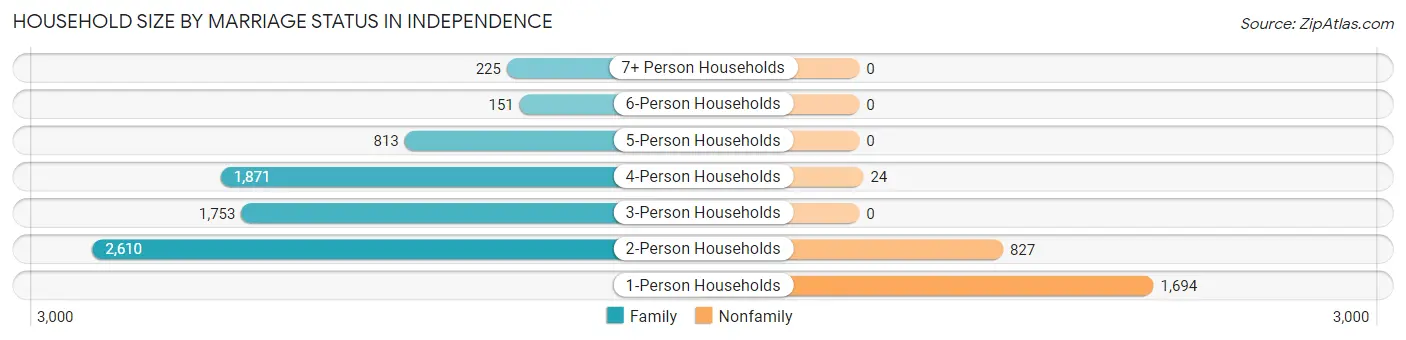
| Household Size | Family Households | Nonfamily Households |
| 1-Person Households | - | 1,694 (17.0%) |
| 2-Person Households | 2,610 (26.2%) | 827 (8.3%) |
| 3-Person Households | 1,753 (17.6%) | 0 (0.0%) |
| 4-Person Households | 1,871 (18.8%) | 24 (0.2%) |
| 5-Person Households | 813 (8.2%) | 0 (0.0%) |
| 6-Person Households | 151 (1.5%) | 0 (0.0%) |
| 7+ Person Households | 225 (2.3%) | 0 (0.0%) |
| Total | 7,423 (74.5%) | 2,545 (25.5%) |
Female Fertility in Independence
Fertility by Age in Independence
Average fertility rate in Independence is 54.0 births per 1,000 women. Women in the age bracket of 20 to 34 years have the highest fertility rate with 123.0 births per 1,000 women. Women in the age bracket of 20 to 34 years acount for 92.7% of all women with births.
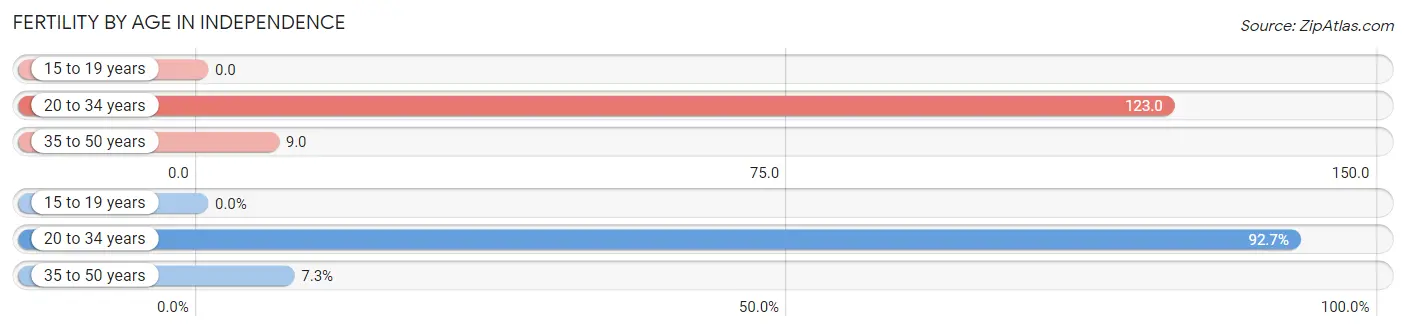
| Age Bracket | Women with Births | Births / 1,000 Women |
| 15 to 19 years | 0 (0.0%) | 0.0 |
| 20 to 34 years | 380 (92.7%) | 123.0 |
| 35 to 50 years | 30 (7.3%) | 9.0 |
| Total | 410 (100.0%) | 54.0 |
Fertility by Age by Marriage Status in Independence
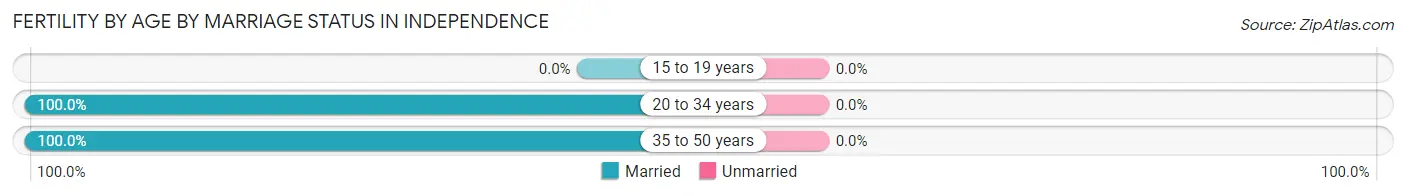
| Age Bracket | Married | Unmarried |
| 15 to 19 years | 0 (0.0%) | 0 (0.0%) |
| 20 to 34 years | 380 (100.0%) | 0 (0.0%) |
| 35 to 50 years | 30 (100.0%) | 0 (0.0%) |
| Total | 410 (100.0%) | 0 (0.0%) |
Fertility by Education in Independence
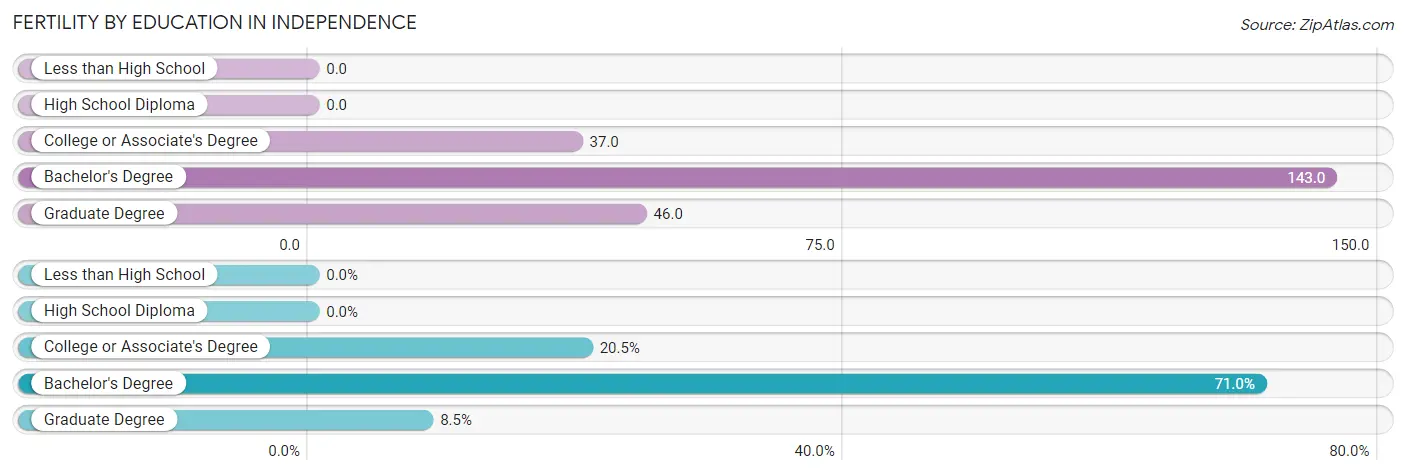
| Educational Attainment | Women with Births | Births / 1,000 Women |
| Less than High School | 0 (0.0%) | 0.0 |
| High School Diploma | 0 (0.0%) | 0.0 |
| College or Associate's Degree | 84 (20.5%) | 37.0 |
| Bachelor's Degree | 291 (71.0%) | 143.0 |
| Graduate Degree | 35 (8.5%) | 46.0 |
| Total | 410 (100.0%) | 54.0 |
Fertility by Education by Marriage Status in Independence
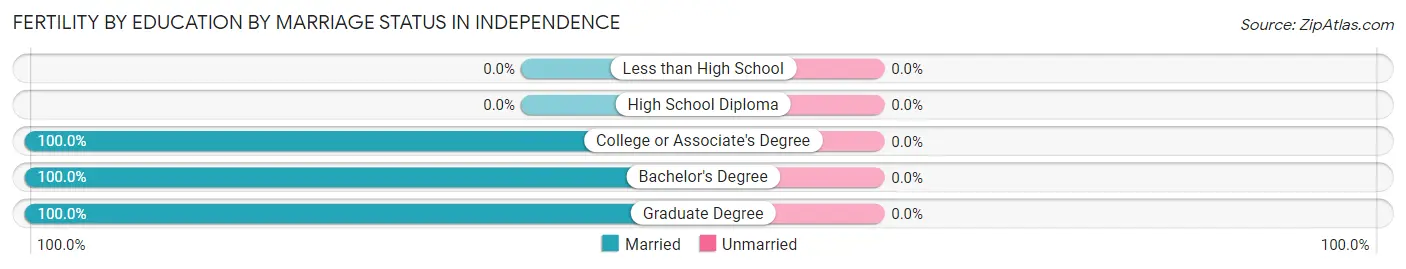
| Educational Attainment | Married | Unmarried |
| Less than High School | 0 (0.0%) | 0 (0.0%) |
| High School Diploma | 0 (0.0%) | 0 (0.0%) |
| College or Associate's Degree | 84 (100.0%) | 0 (0.0%) |
| Bachelor's Degree | 291 (100.0%) | 0 (0.0%) |
| Graduate Degree | 35 (100.0%) | 0 (0.0%) |
| Total | 410 (100.0%) | 0 (0.0%) |
Employment Characteristics in Independence
Employment by Class of Employer in Independence
Among the 15,366 employed individuals in Independence, private company employees (11,562 | 75.2%), not-for-profit organizations (1,531 | 10.0%), and local government employees (1,006 | 6.6%) make up the most common classes of employment.
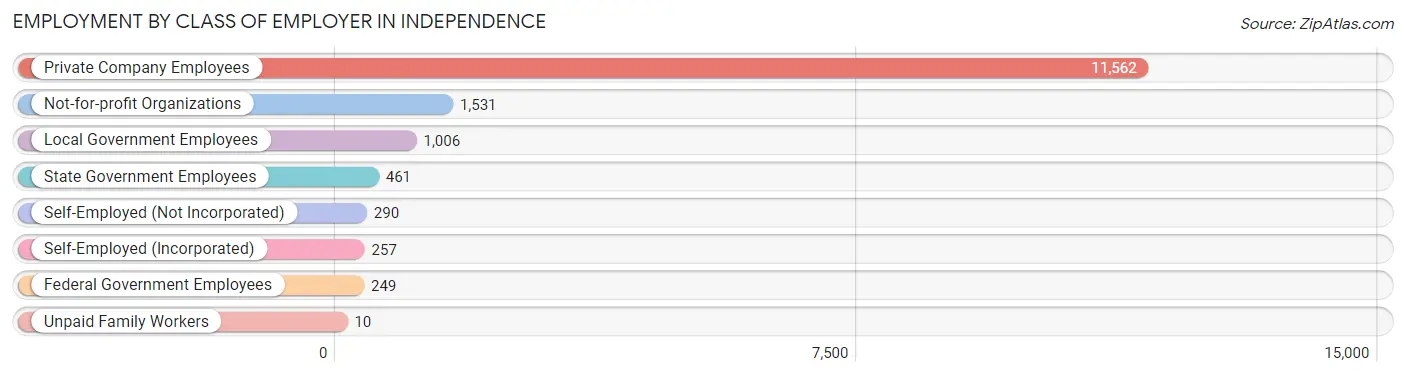
| Employer Class | # Employees | % Employees |
| Private Company Employees | 11,562 | 75.2% |
| Self-Employed (Incorporated) | 257 | 1.7% |
| Self-Employed (Not Incorporated) | 290 | 1.9% |
| Not-for-profit Organizations | 1,531 | 10.0% |
| Local Government Employees | 1,006 | 6.6% |
| State Government Employees | 461 | 3.0% |
| Federal Government Employees | 249 | 1.6% |
| Unpaid Family Workers | 10 | 0.1% |
| Total | 15,366 | 100.0% |
Employment Status by Age in Independence
According to the labor force statistics for Independence, out of the total population over 16 years of age (21,667), 74.8% or 16,207 individuals are in the labor force, with 3.6% or 583 of them unemployed. The age group with the highest labor force participation rate is 25 to 29 years, with 95.4% or 1,749 individuals in the labor force. Within the labor force, the 25 to 29 years age range has the highest percentage of unemployed individuals, with 9.9% or 173 of them being unemployed.
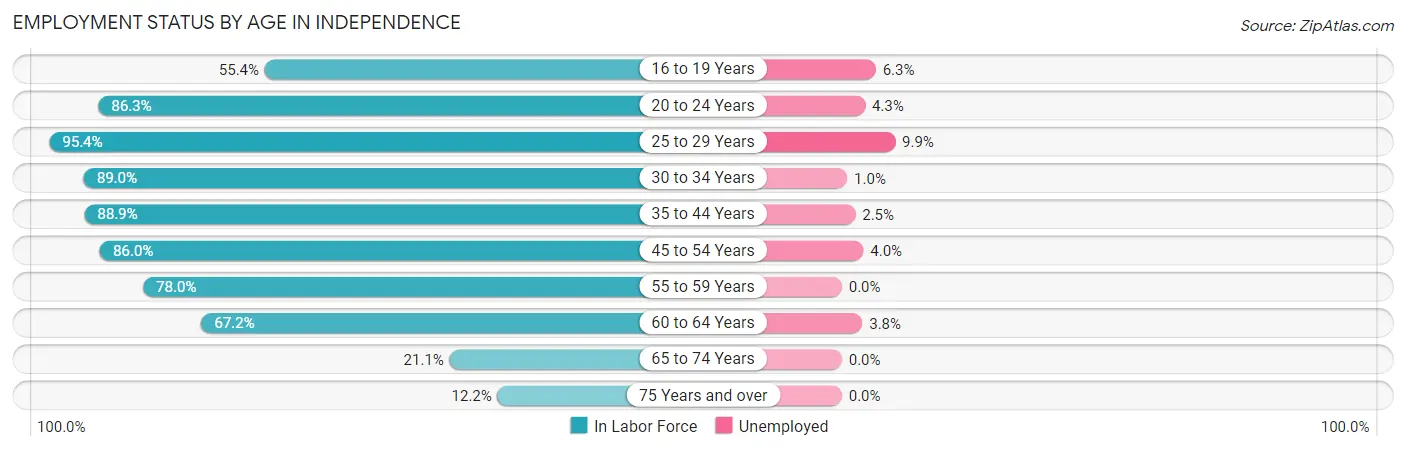
| Age Bracket | In Labor Force | Unemployed |
| 16 to 19 Years | 838 (55.4%) | 53 (6.3%) |
| 20 to 24 Years | 1,555 (86.3%) | 67 (4.3%) |
| 25 to 29 Years | 1,749 (95.4%) | 173 (9.9%) |
| 30 to 34 Years | 2,042 (89.0%) | 20 (1.0%) |
| 35 to 44 Years | 3,775 (88.9%) | 94 (2.5%) |
| 45 to 54 Years | 3,479 (86.0%) | 139 (4.0%) |
| 55 to 59 Years | 1,329 (78.0%) | 0 (0.0%) |
| 60 to 64 Years | 911 (67.2%) | 35 (3.8%) |
| 65 to 74 Years | 412 (21.1%) | 0 (0.0%) |
| 75 Years and over | 113 (12.2%) | 0 (0.0%) |
| Total | 16,207 (74.8%) | 583 (3.6%) |
Employment Status by Educational Attainment in Independence
According to labor force statistics for Independence, 85.8% of individuals (13,279) out of the total population between 25 and 64 years of age (15,477) are in the labor force, with 3.5% or 465 of them being unemployed. The group with the highest labor force participation rate are those with the educational attainment of bachelor's degree or higher, with 92.6% or 5,458 individuals in the labor force. Within the labor force, individuals with college / associate degree education have the highest percentage of unemployment, with 7.3% or 329 of them being unemployed.
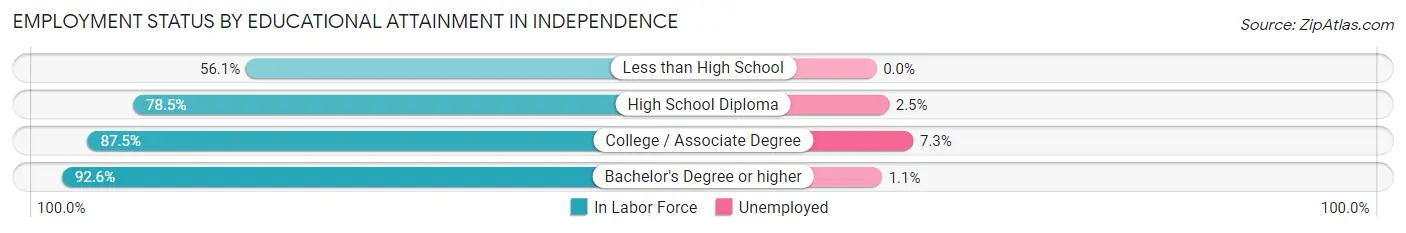
| Educational Attainment | In Labor Force | Unemployed |
| Less than High School | 390 (56.1%) | 0 (0.0%) |
| High School Diploma | 2,932 (78.5%) | 93 (2.5%) |
| College / Associate Degree | 4,509 (87.5%) | 376 (7.3%) |
| Bachelor's Degree or higher | 5,458 (92.6%) | 65 (1.1%) |
| Total | 13,279 (85.8%) | 542 (3.5%) |
Employment Occupations by Sex in Independence
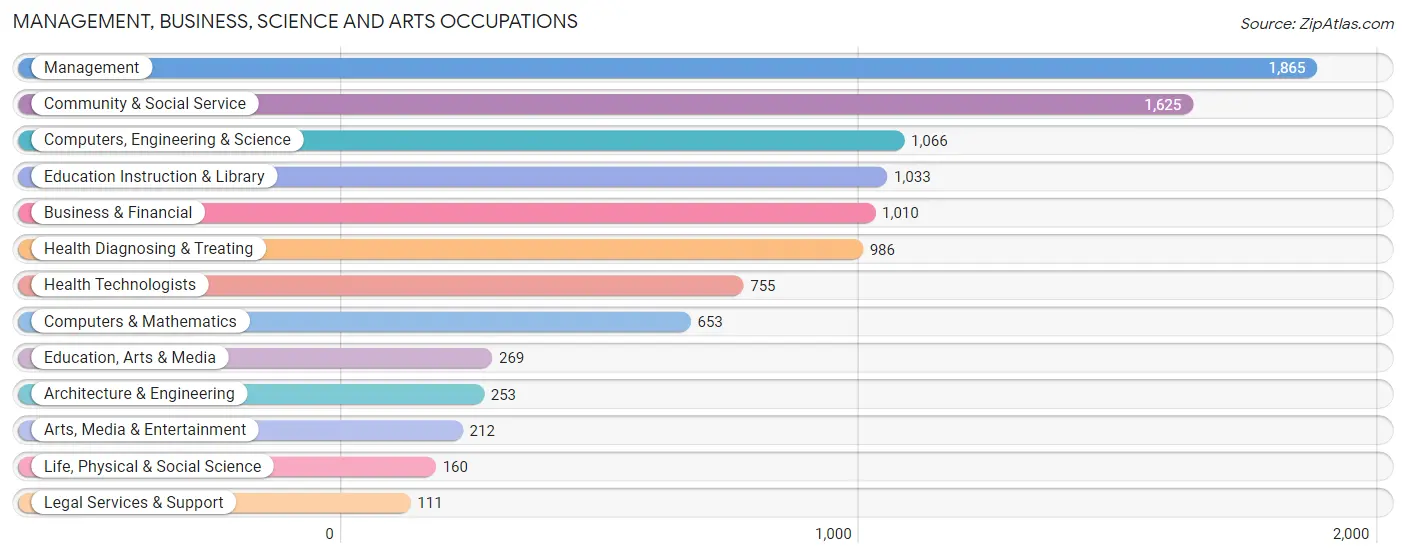
Management, Business, Science and Arts Occupations
The most common Management, Business, Science and Arts occupations in Independence are Management (1,865 | 11.9%), Community & Social Service (1,625 | 10.4%), Computers, Engineering & Science (1,066 | 6.8%), Education Instruction & Library (1,033 | 6.6%), and Business & Financial (1,010 | 6.5%).
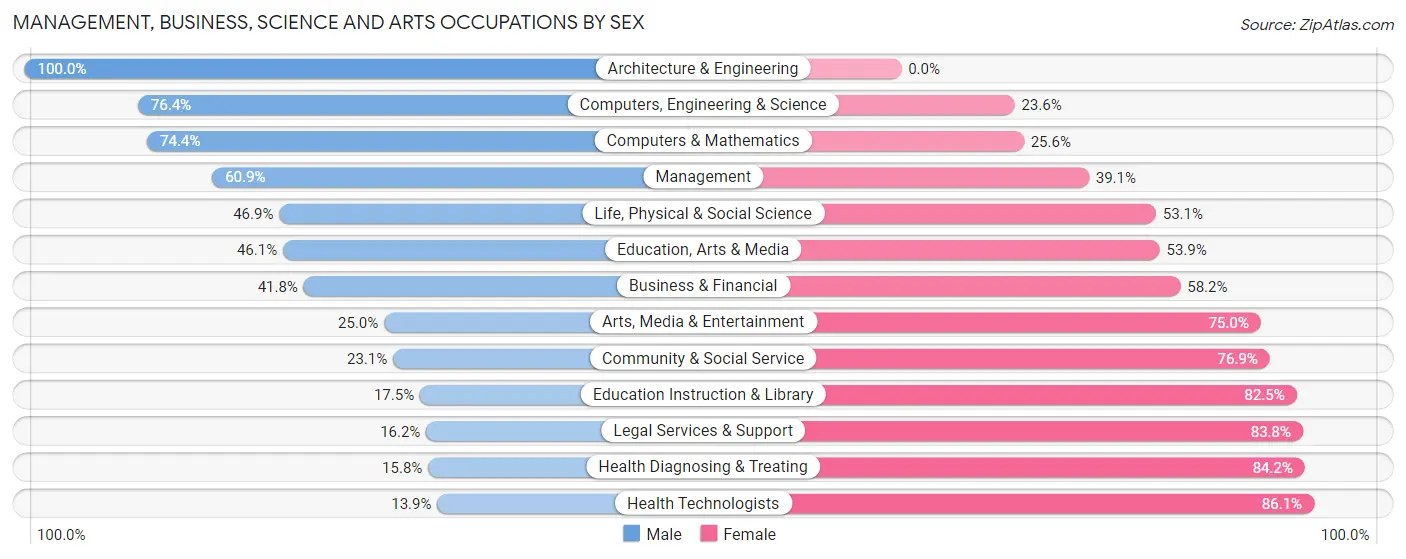
Management, Business, Science and Arts Occupations by Sex
Within the Management, Business, Science and Arts occupations in Independence, the most male-oriented occupations are Architecture & Engineering (100.0%), Computers, Engineering & Science (76.4%), and Computers & Mathematics (74.4%), while the most female-oriented occupations are Health Technologists (86.1%), Health Diagnosing & Treating (84.2%), and Legal Services & Support (83.8%).
| Occupation | Male | Female |
| Management | 1,135 (60.9%) | 730 (39.1%) |
| Business & Financial | 422 (41.8%) | 588 (58.2%) |
| Computers, Engineering & Science | 814 (76.4%) | 252 (23.6%) |
| Computers & Mathematics | 486 (74.4%) | 167 (25.6%) |
| Architecture & Engineering | 253 (100.0%) | 0 (0.0%) |
| Life, Physical & Social Science | 75 (46.9%) | 85 (53.1%) |
| Community & Social Service | 376 (23.1%) | 1,249 (76.9%) |
| Education, Arts & Media | 124 (46.1%) | 145 (53.9%) |
| Legal Services & Support | 18 (16.2%) | 93 (83.8%) |
| Education Instruction & Library | 181 (17.5%) | 852 (82.5%) |
| Arts, Media & Entertainment | 53 (25.0%) | 159 (75.0%) |
| Health Diagnosing & Treating | 156 (15.8%) | 830 (84.2%) |
| Health Technologists | 105 (13.9%) | 650 (86.1%) |
| Total (Category) | 2,903 (44.3%) | 3,649 (55.7%) |
| Total (Overall) | 8,135 (52.1%) | 7,478 (47.9%) |
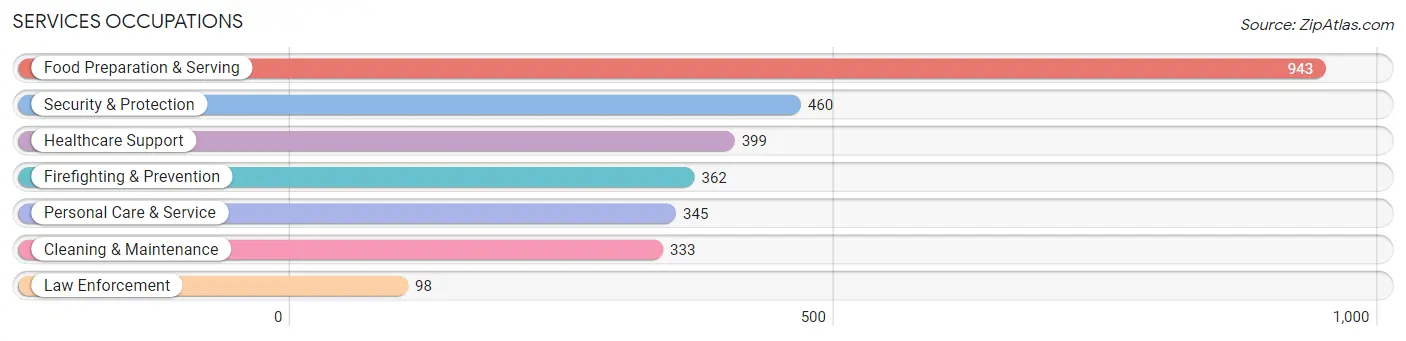
Services Occupations
The most common Services occupations in Independence are Food Preparation & Serving (943 | 6.0%), Security & Protection (460 | 2.9%), Healthcare Support (399 | 2.6%), Firefighting & Prevention (362 | 2.3%), and Personal Care & Service (345 | 2.2%).
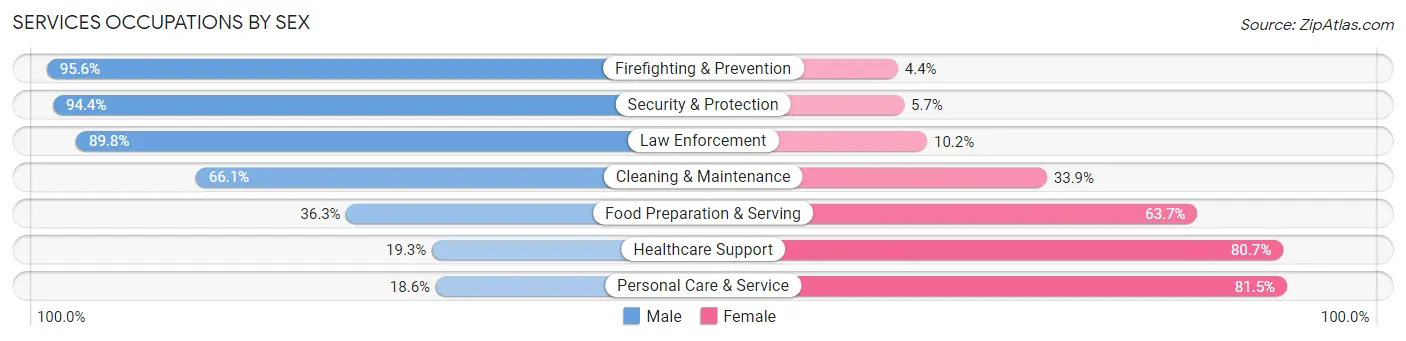
Services Occupations by Sex
Within the Services occupations in Independence, the most male-oriented occupations are Firefighting & Prevention (95.6%), Security & Protection (94.4%), and Law Enforcement (89.8%), while the most female-oriented occupations are Personal Care & Service (81.5%), Healthcare Support (80.7%), and Food Preparation & Serving (63.7%).
| Occupation | Male | Female |
| Healthcare Support | 77 (19.3%) | 322 (80.7%) |
| Security & Protection | 434 (94.4%) | 26 (5.7%) |
| Firefighting & Prevention | 346 (95.6%) | 16 (4.4%) |
| Law Enforcement | 88 (89.8%) | 10 (10.2%) |
| Food Preparation & Serving | 342 (36.3%) | 601 (63.7%) |
| Cleaning & Maintenance | 220 (66.1%) | 113 (33.9%) |
| Personal Care & Service | 64 (18.5%) | 281 (81.5%) |
| Total (Category) | 1,137 (45.9%) | 1,343 (54.1%) |
| Total (Overall) | 8,135 (52.1%) | 7,478 (47.9%) |
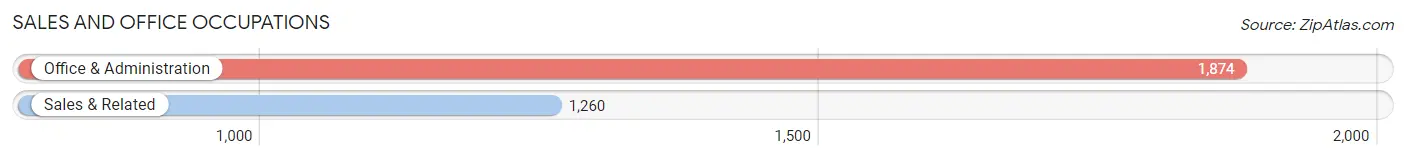
Sales and Office Occupations
The most common Sales and Office occupations in Independence are Office & Administration (1,874 | 12.0%), and Sales & Related (1,260 | 8.1%).
Sales and Office Occupations by Sex
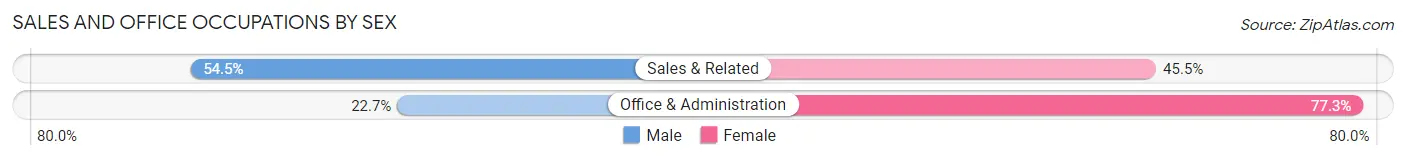
| Occupation | Male | Female |
| Sales & Related | 687 (54.5%) | 573 (45.5%) |
| Office & Administration | 425 (22.7%) | 1,449 (77.3%) |
| Total (Category) | 1,112 (35.5%) | 2,022 (64.5%) |
| Total (Overall) | 8,135 (52.1%) | 7,478 (47.9%) |
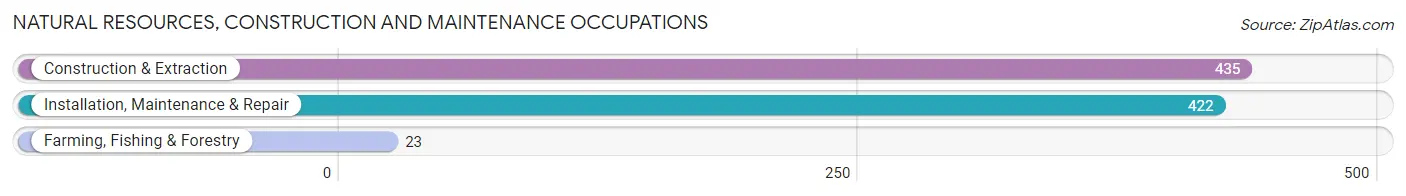
Natural Resources, Construction and Maintenance Occupations
The most common Natural Resources, Construction and Maintenance occupations in Independence are Construction & Extraction (435 | 2.8%), Installation, Maintenance & Repair (422 | 2.7%), and Farming, Fishing & Forestry (23 | 0.2%).
Natural Resources, Construction and Maintenance Occupations by Sex
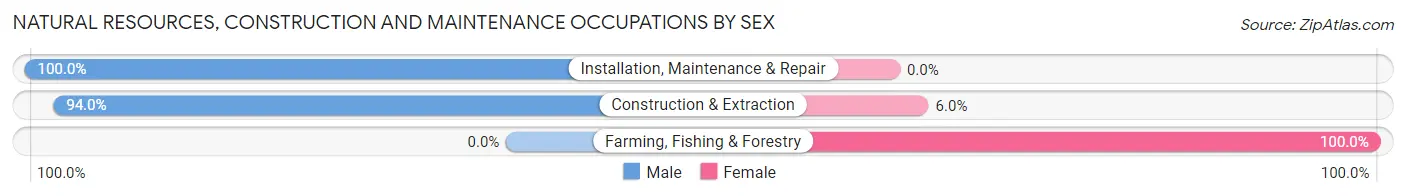
| Occupation | Male | Female |
| Farming, Fishing & Forestry | 0 (0.0%) | 23 (100.0%) |
| Construction & Extraction | 409 (94.0%) | 26 (6.0%) |
| Installation, Maintenance & Repair | 422 (100.0%) | 0 (0.0%) |
| Total (Category) | 831 (94.4%) | 49 (5.6%) |
| Total (Overall) | 8,135 (52.1%) | 7,478 (47.9%) |
Production, Transportation and Moving Occupations
The most common Production, Transportation and Moving occupations in Independence are Production (1,023 | 6.6%), Material Moving (844 | 5.4%), and Transportation (700 | 4.5%).

Production, Transportation and Moving Occupations by Sex
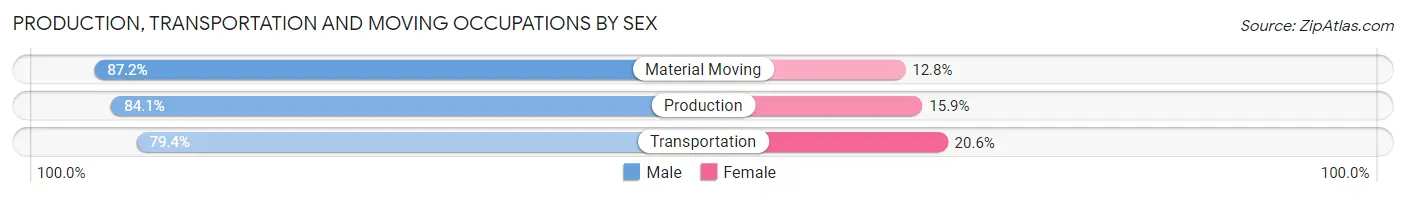
| Occupation | Male | Female |
| Production | 860 (84.1%) | 163 (15.9%) |
| Transportation | 556 (79.4%) | 144 (20.6%) |
| Material Moving | 736 (87.2%) | 108 (12.8%) |
| Total (Category) | 2,152 (83.8%) | 415 (16.2%) |
| Total (Overall) | 8,135 (52.1%) | 7,478 (47.9%) |
Employment Industries by Sex in Independence
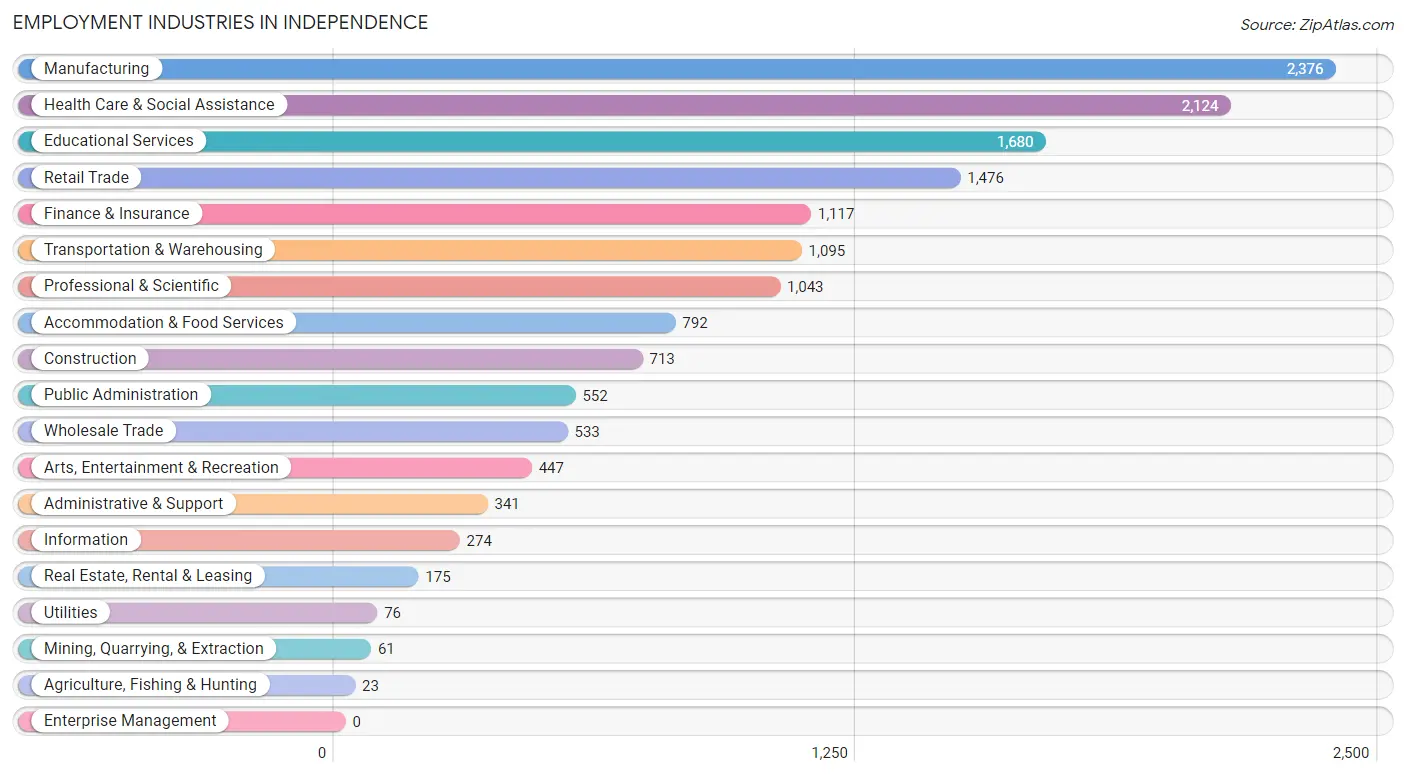
Employment Industries in Independence
The major employment industries in Independence include Manufacturing (2,376 | 15.2%), Health Care & Social Assistance (2,124 | 13.6%), Educational Services (1,680 | 10.8%), Retail Trade (1,476 | 9.5%), and Finance & Insurance (1,117 | 7.1%).
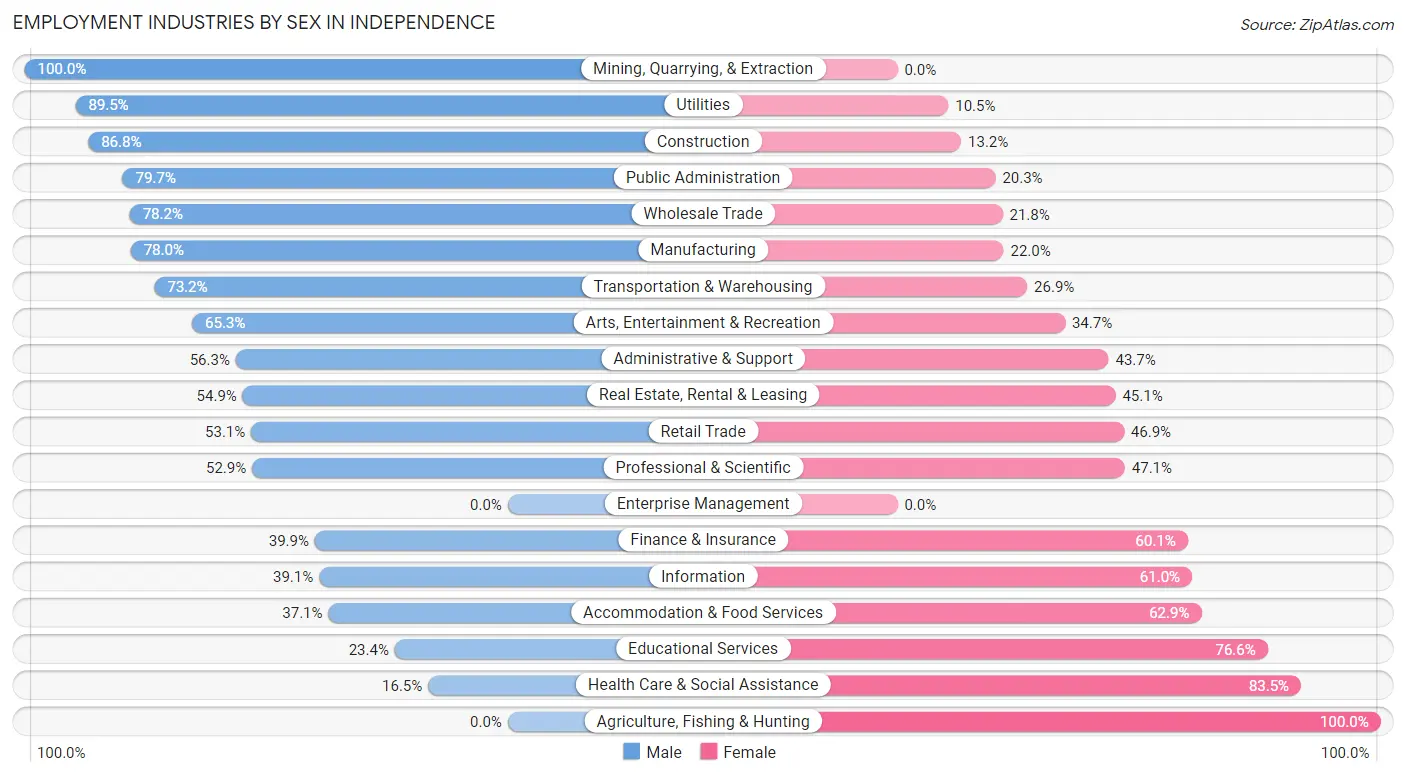
Employment Industries by Sex in Independence
The Independence industries that see more men than women are Mining, Quarrying, & Extraction (100.0%), Utilities (89.5%), and Construction (86.8%), whereas the industries that tend to have a higher number of women are Agriculture, Fishing & Hunting (100.0%), Health Care & Social Assistance (83.5%), and Educational Services (76.6%).
| Industry | Male | Female |
| Agriculture, Fishing & Hunting | 0 (0.0%) | 23 (100.0%) |
| Mining, Quarrying, & Extraction | 61 (100.0%) | 0 (0.0%) |
| Construction | 619 (86.8%) | 94 (13.2%) |
| Manufacturing | 1,854 (78.0%) | 522 (22.0%) |
| Wholesale Trade | 417 (78.2%) | 116 (21.8%) |
| Retail Trade | 784 (53.1%) | 692 (46.9%) |
| Transportation & Warehousing | 801 (73.2%) | 294 (26.9%) |
| Utilities | 68 (89.5%) | 8 (10.5%) |
| Information | 107 (39.1%) | 167 (61.0%) |
| Finance & Insurance | 446 (39.9%) | 671 (60.1%) |
| Real Estate, Rental & Leasing | 96 (54.9%) | 79 (45.1%) |
| Professional & Scientific | 552 (52.9%) | 491 (47.1%) |
| Enterprise Management | 0 (0.0%) | 0 (0.0%) |
| Administrative & Support | 192 (56.3%) | 149 (43.7%) |
| Educational Services | 393 (23.4%) | 1,287 (76.6%) |
| Health Care & Social Assistance | 350 (16.5%) | 1,774 (83.5%) |
| Arts, Entertainment & Recreation | 292 (65.3%) | 155 (34.7%) |
| Accommodation & Food Services | 294 (37.1%) | 498 (62.9%) |
| Public Administration | 440 (79.7%) | 112 (20.3%) |
| Total | 8,135 (52.1%) | 7,478 (47.9%) |
Education in Independence
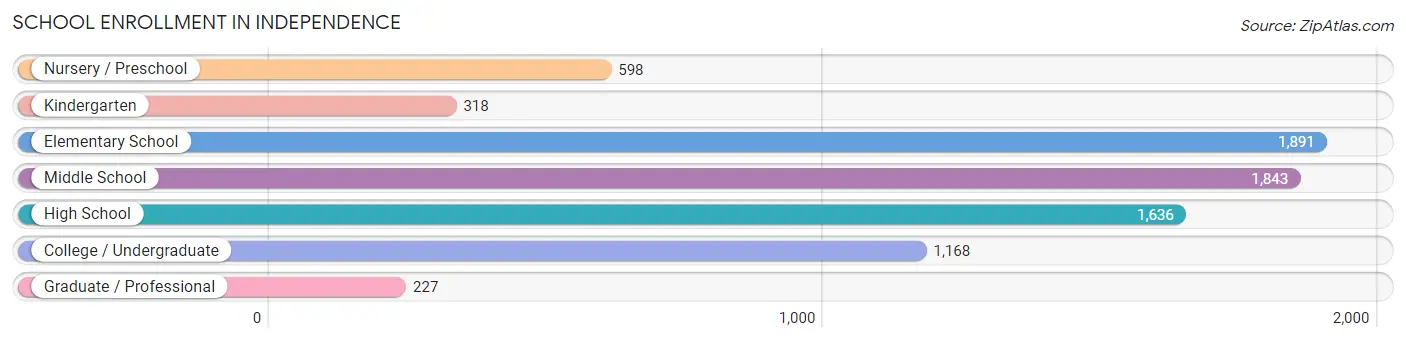
School Enrollment in Independence
The most common levels of schooling among the 7,681 students in Independence are elementary school (1,891 | 24.6%), middle school (1,843 | 24.0%), and high school (1,636 | 21.3%).
| School Level | # Students | % Students |
| Nursery / Preschool | 598 | 7.8% |
| Kindergarten | 318 | 4.1% |
| Elementary School | 1,891 | 24.6% |
| Middle School | 1,843 | 24.0% |
| High School | 1,636 | 21.3% |
| College / Undergraduate | 1,168 | 15.2% |
| Graduate / Professional | 227 | 3.0% |
| Total | 7,681 | 100.0% |
School Enrollment by Age by Funding Source in Independence
Out of a total of 7,681 students who are enrolled in schools in Independence, 1,797 (23.4%) attend a private institution, while the remaining 5,884 (76.6%) are enrolled in public schools. The age group of 3 to 4 year olds has the highest likelihood of being enrolled in private schools, with 282 (57.2% in the age bracket) enrolled. Conversely, the age group of 10 to 14 year olds has the lowest likelihood of being enrolled in a private school, with 1,736 (82.2% in the age bracket) attending a public institution.
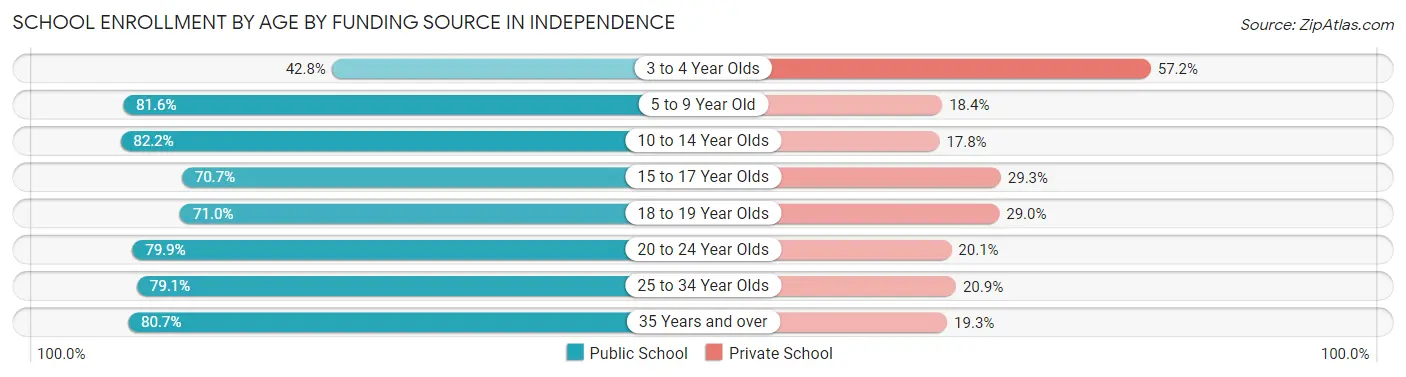
| Age Bracket | Public School | Private School |
| 3 to 4 Year Olds | 211 (42.8%) | 282 (57.2%) |
| 5 to 9 Year Old | 1,756 (81.6%) | 395 (18.4%) |
| 10 to 14 Year Olds | 1,736 (82.2%) | 377 (17.8%) |
| 15 to 17 Year Olds | 954 (70.7%) | 395 (29.3%) |
| 18 to 19 Year Olds | 272 (71.0%) | 111 (29.0%) |
| 20 to 24 Year Olds | 462 (79.9%) | 116 (20.1%) |
| 25 to 34 Year Olds | 223 (79.1%) | 59 (20.9%) |
| 35 Years and over | 268 (80.7%) | 64 (19.3%) |
| Total | 5,884 (76.6%) | 1,797 (23.4%) |
Educational Attainment by Field of Study in Independence
Business (1,445 | 20.5%), science & technology (1,045 | 14.8%), education (898 | 12.7%), communications (657 | 9.3%), and engineering (570 | 8.1%) are the most common fields of study among 7,046 individuals in Independence who have obtained a bachelor's degree or higher.
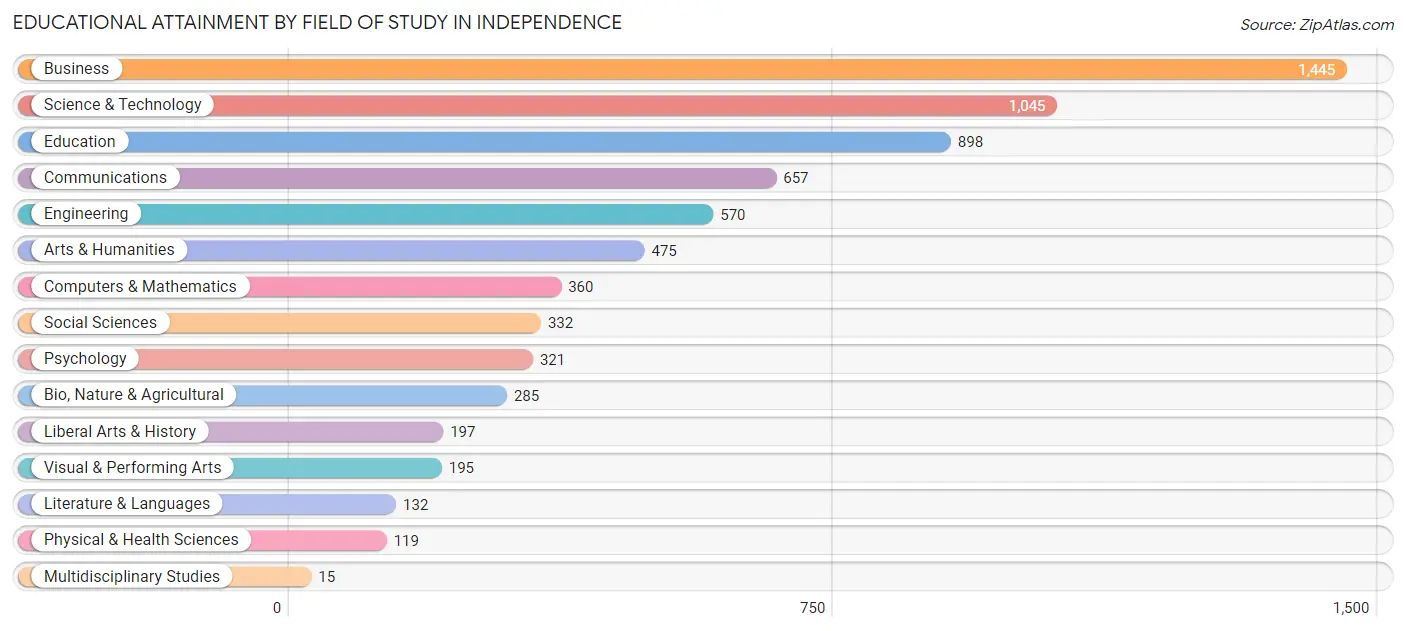
| Field of Study | # Graduates | % Graduates |
| Computers & Mathematics | 360 | 5.1% |
| Bio, Nature & Agricultural | 285 | 4.0% |
| Physical & Health Sciences | 119 | 1.7% |
| Psychology | 321 | 4.6% |
| Social Sciences | 332 | 4.7% |
| Engineering | 570 | 8.1% |
| Multidisciplinary Studies | 15 | 0.2% |
| Science & Technology | 1,045 | 14.8% |
| Business | 1,445 | 20.5% |
| Education | 898 | 12.7% |
| Literature & Languages | 132 | 1.9% |
| Liberal Arts & History | 197 | 2.8% |
| Visual & Performing Arts | 195 | 2.8% |
| Communications | 657 | 9.3% |
| Arts & Humanities | 475 | 6.7% |
| Total | 7,046 | 100.0% |
Transportation & Commute in Independence
Vehicle Availability by Sex in Independence
The most prevalent vehicle ownership categories in Independence are males with 2 vehicles (4,045, accounting for 50.2%) and females with 2 vehicles (3,473, making up 55.3%).
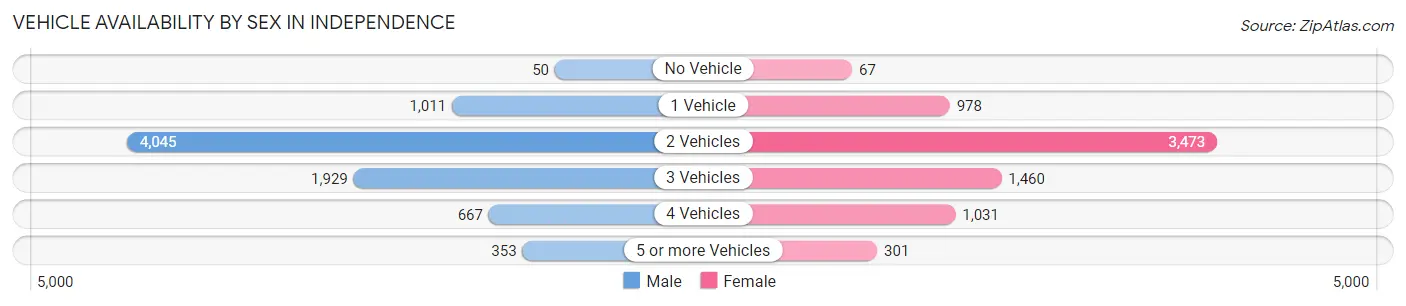
| Vehicles Available | Male | Female |
| No Vehicle | 50 (0.6%) | 67 (0.9%) |
| 1 Vehicle | 1,011 (12.6%) | 978 (13.4%) |
| 2 Vehicles | 4,045 (50.2%) | 3,473 (47.5%) |
| 3 Vehicles | 1,929 (23.9%) | 1,460 (20.0%) |
| 4 Vehicles | 667 (8.3%) | 1,031 (14.1%) |
| 5 or more Vehicles | 353 (4.4%) | 301 (4.1%) |
| Total | 8,055 (100.0%) | 7,310 (100.0%) |
Commute Time in Independence
The most frequently occuring commute durations in Independence are 20 to 24 minutes (2,681 commuters, 19.2%), 15 to 19 minutes (2,626 commuters, 18.8%), and 30 to 34 minutes (2,296 commuters, 16.5%).
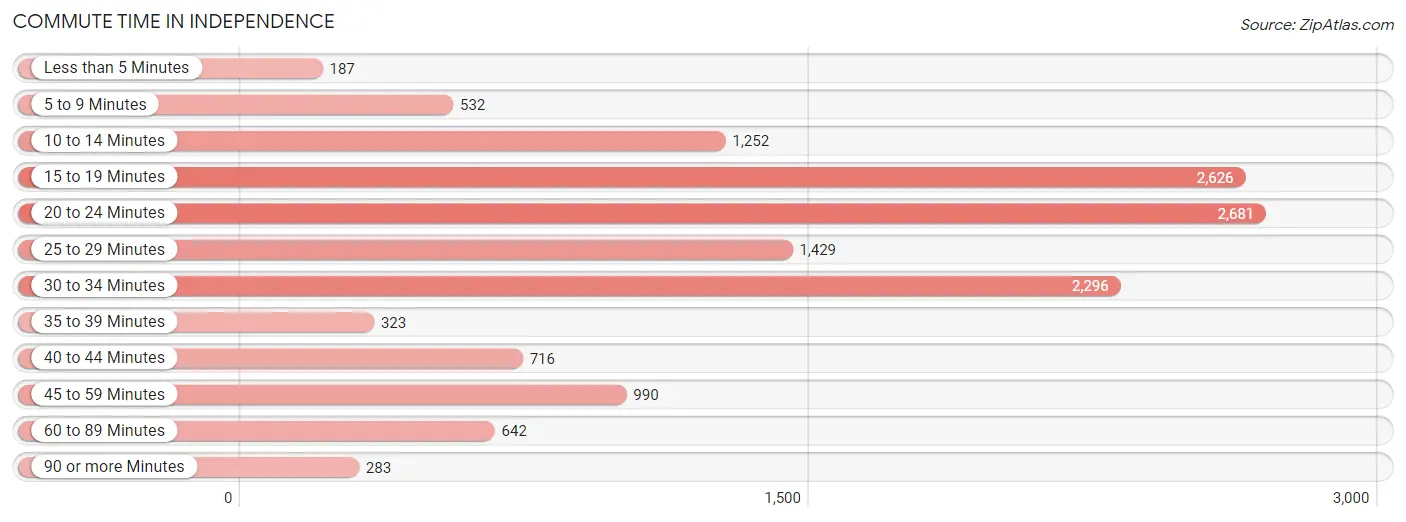
| Commute Time | # Commuters | % Commuters |
| Less than 5 Minutes | 187 | 1.3% |
| 5 to 9 Minutes | 532 | 3.8% |
| 10 to 14 Minutes | 1,252 | 9.0% |
| 15 to 19 Minutes | 2,626 | 18.8% |
| 20 to 24 Minutes | 2,681 | 19.2% |
| 25 to 29 Minutes | 1,429 | 10.2% |
| 30 to 34 Minutes | 2,296 | 16.5% |
| 35 to 39 Minutes | 323 | 2.3% |
| 40 to 44 Minutes | 716 | 5.1% |
| 45 to 59 Minutes | 990 | 7.1% |
| 60 to 89 Minutes | 642 | 4.6% |
| 90 or more Minutes | 283 | 2.0% |
Commute Time by Sex in Independence
The most common commute times in Independence are 30 to 34 minutes (1,395 commuters, 18.6%) for males and 20 to 24 minutes (1,348 commuters, 20.8%) for females.
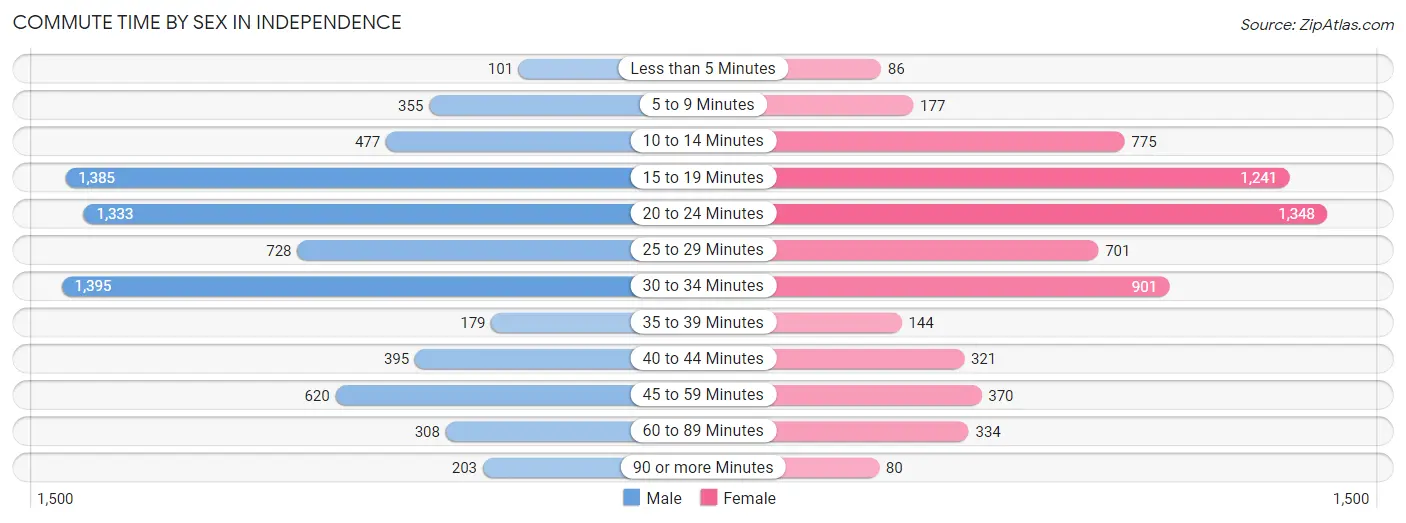
| Commute Time | Male | Female |
| Less than 5 Minutes | 101 (1.3%) | 86 (1.3%) |
| 5 to 9 Minutes | 355 (4.8%) | 177 (2.7%) |
| 10 to 14 Minutes | 477 (6.4%) | 775 (12.0%) |
| 15 to 19 Minutes | 1,385 (18.5%) | 1,241 (19.2%) |
| 20 to 24 Minutes | 1,333 (17.8%) | 1,348 (20.8%) |
| 25 to 29 Minutes | 728 (9.7%) | 701 (10.8%) |
| 30 to 34 Minutes | 1,395 (18.6%) | 901 (13.9%) |
| 35 to 39 Minutes | 179 (2.4%) | 144 (2.2%) |
| 40 to 44 Minutes | 395 (5.3%) | 321 (5.0%) |
| 45 to 59 Minutes | 620 (8.3%) | 370 (5.7%) |
| 60 to 89 Minutes | 308 (4.1%) | 334 (5.2%) |
| 90 or more Minutes | 203 (2.7%) | 80 (1.2%) |
Time of Departure to Work by Sex in Independence
The most frequent times of departure to work in Independence are 4:00 PM to 11:59 PM (916, 12.2%) for males and 7:00 AM to 7:29 AM (1,426, 22.0%) for females.
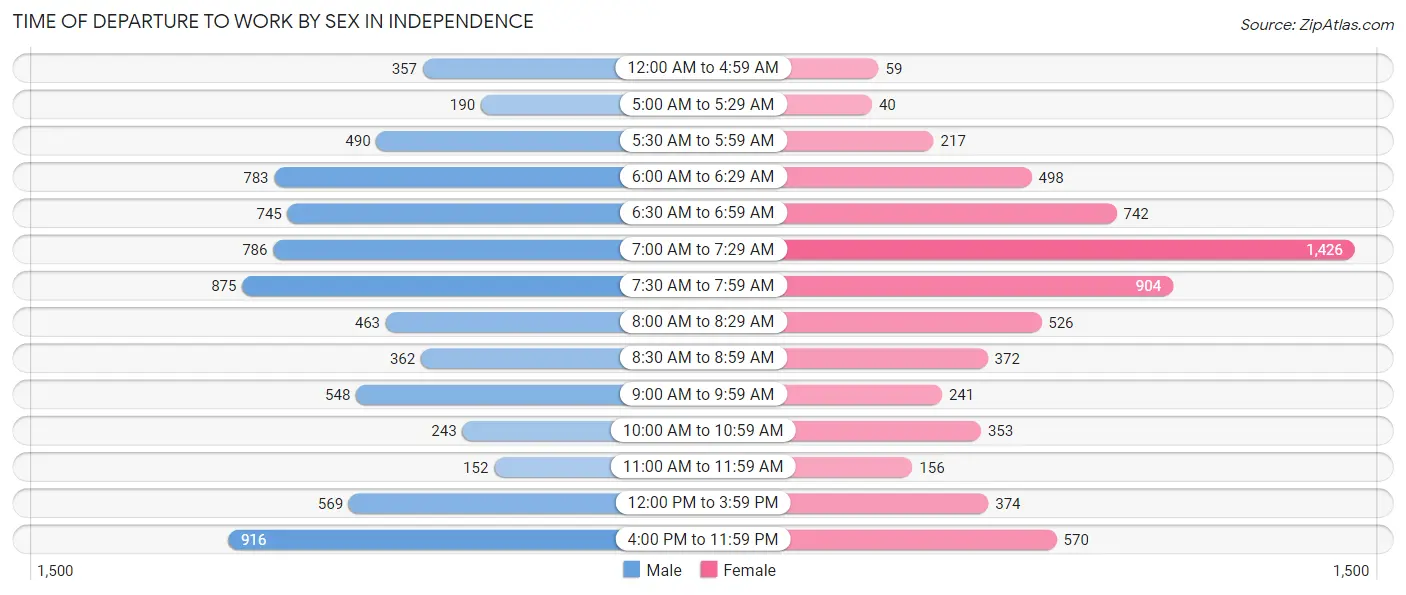
| Time of Departure | Male | Female |
| 12:00 AM to 4:59 AM | 357 (4.8%) | 59 (0.9%) |
| 5:00 AM to 5:29 AM | 190 (2.5%) | 40 (0.6%) |
| 5:30 AM to 5:59 AM | 490 (6.6%) | 217 (3.4%) |
| 6:00 AM to 6:29 AM | 783 (10.5%) | 498 (7.7%) |
| 6:30 AM to 6:59 AM | 745 (10.0%) | 742 (11.5%) |
| 7:00 AM to 7:29 AM | 786 (10.5%) | 1,426 (22.0%) |
| 7:30 AM to 7:59 AM | 875 (11.7%) | 904 (14.0%) |
| 8:00 AM to 8:29 AM | 463 (6.2%) | 526 (8.1%) |
| 8:30 AM to 8:59 AM | 362 (4.8%) | 372 (5.7%) |
| 9:00 AM to 9:59 AM | 548 (7.3%) | 241 (3.7%) |
| 10:00 AM to 10:59 AM | 243 (3.3%) | 353 (5.4%) |
| 11:00 AM to 11:59 AM | 152 (2.0%) | 156 (2.4%) |
| 12:00 PM to 3:59 PM | 569 (7.6%) | 374 (5.8%) |
| 4:00 PM to 11:59 PM | 916 (12.2%) | 570 (8.8%) |
| Total | 7,479 (100.0%) | 6,478 (100.0%) |
Housing Occupancy in Independence
Occupancy by Ownership in Independence
Of the total 9,968 dwellings in Independence, owner-occupied units account for 8,071 (81.0%), while renter-occupied units make up 1,897 (19.0%).
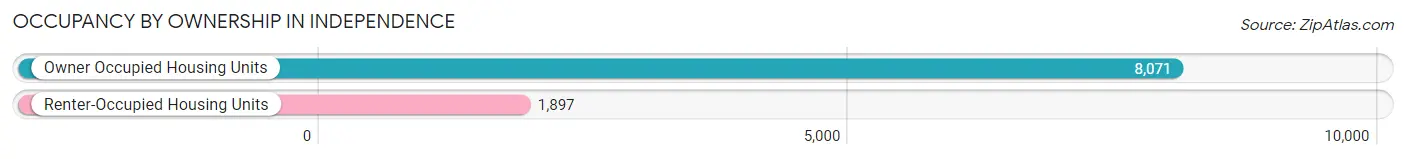
| Occupancy | # Housing Units | % Housing Units |
| Owner Occupied Housing Units | 8,071 | 81.0% |
| Renter-Occupied Housing Units | 1,897 | 19.0% |
| Total Occupied Housing Units | 9,968 | 100.0% |
Occupancy by Household Size in Independence
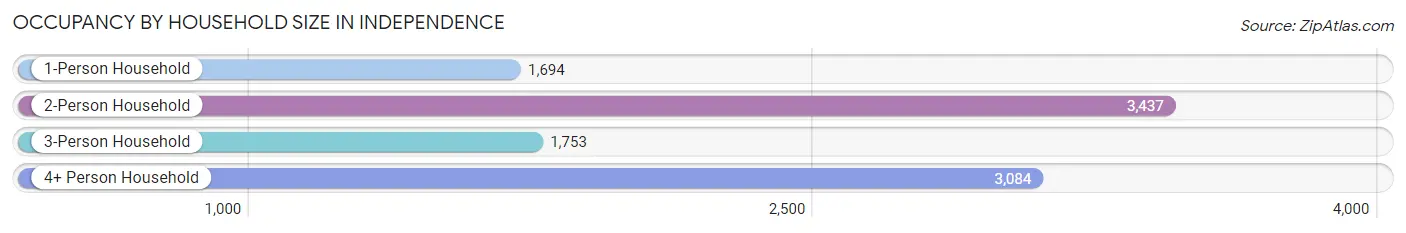
| Household Size | # Housing Units | % Housing Units |
| 1-Person Household | 1,694 | 17.0% |
| 2-Person Household | 3,437 | 34.5% |
| 3-Person Household | 1,753 | 17.6% |
| 4+ Person Household | 3,084 | 30.9% |
| Total Housing Units | 9,968 | 100.0% |
Occupancy by Ownership by Household Size in Independence
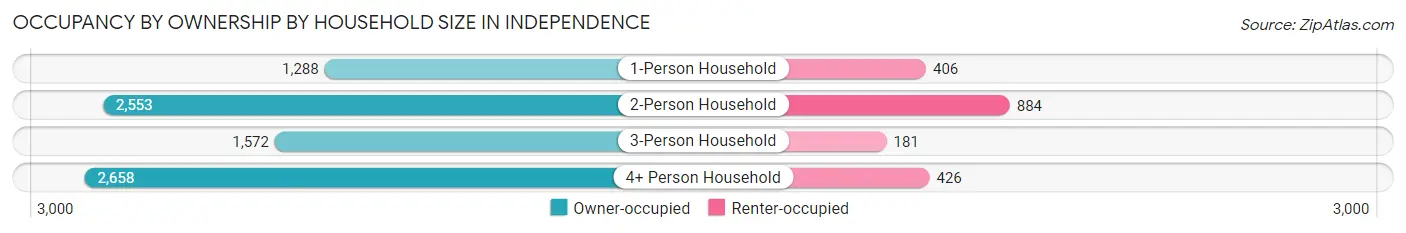
| Household Size | Owner-occupied | Renter-occupied |
| 1-Person Household | 1,288 (76.0%) | 406 (24.0%) |
| 2-Person Household | 2,553 (74.3%) | 884 (25.7%) |
| 3-Person Household | 1,572 (89.7%) | 181 (10.3%) |
| 4+ Person Household | 2,658 (86.2%) | 426 (13.8%) |
| Total Housing Units | 8,071 (81.0%) | 1,897 (19.0%) |
Occupancy by Educational Attainment in Independence
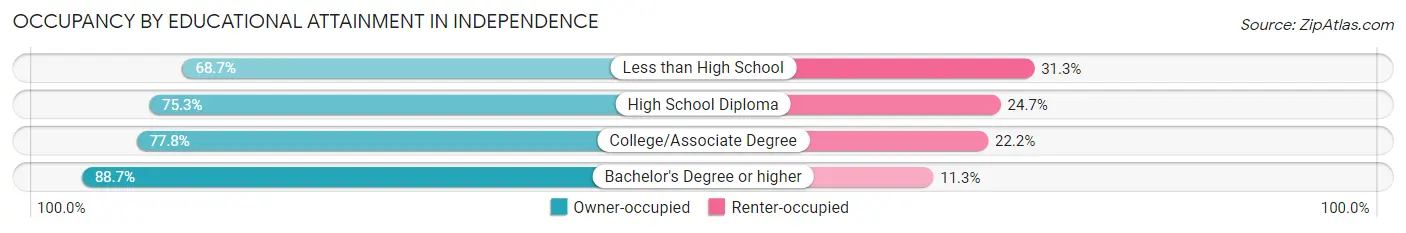
| Household Size | Owner-occupied | Renter-occupied |
| Less than High School | 285 (68.7%) | 130 (31.3%) |
| High School Diploma | 1,569 (75.3%) | 514 (24.7%) |
| College/Associate Degree | 2,916 (77.8%) | 831 (22.2%) |
| Bachelor's Degree or higher | 3,301 (88.7%) | 422 (11.3%) |
Occupancy by Age of Householder in Independence
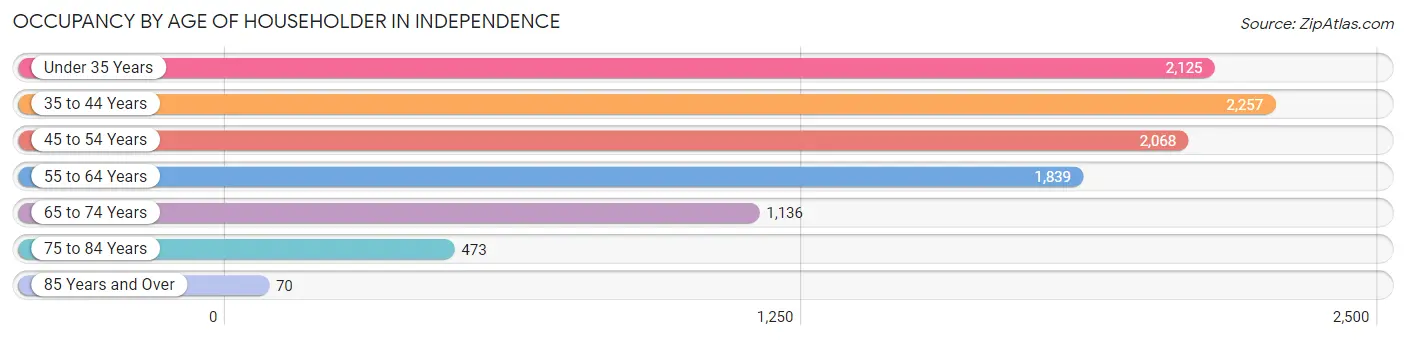
| Age Bracket | # Households | % Households |
| Under 35 Years | 2,125 | 21.3% |
| 35 to 44 Years | 2,257 | 22.6% |
| 45 to 54 Years | 2,068 | 20.7% |
| 55 to 64 Years | 1,839 | 18.4% |
| 65 to 74 Years | 1,136 | 11.4% |
| 75 to 84 Years | 473 | 4.8% |
| 85 Years and Over | 70 | 0.7% |
| Total | 9,968 | 100.0% |
Housing Finances in Independence
Median Income by Occupancy in Independence
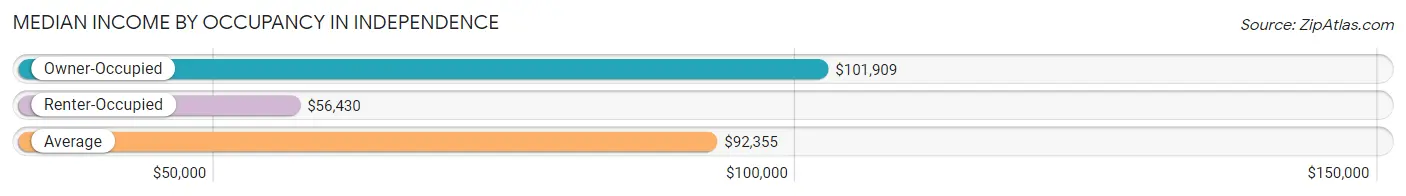
| Occupancy Type | # Households | Median Income |
| Owner-Occupied | 8,071 (81.0%) | $101,909 |
| Renter-Occupied | 1,897 (19.0%) | $56,430 |
| Average | 9,968 (100.0%) | $92,355 |
Occupancy by Householder Income Bracket in Independence
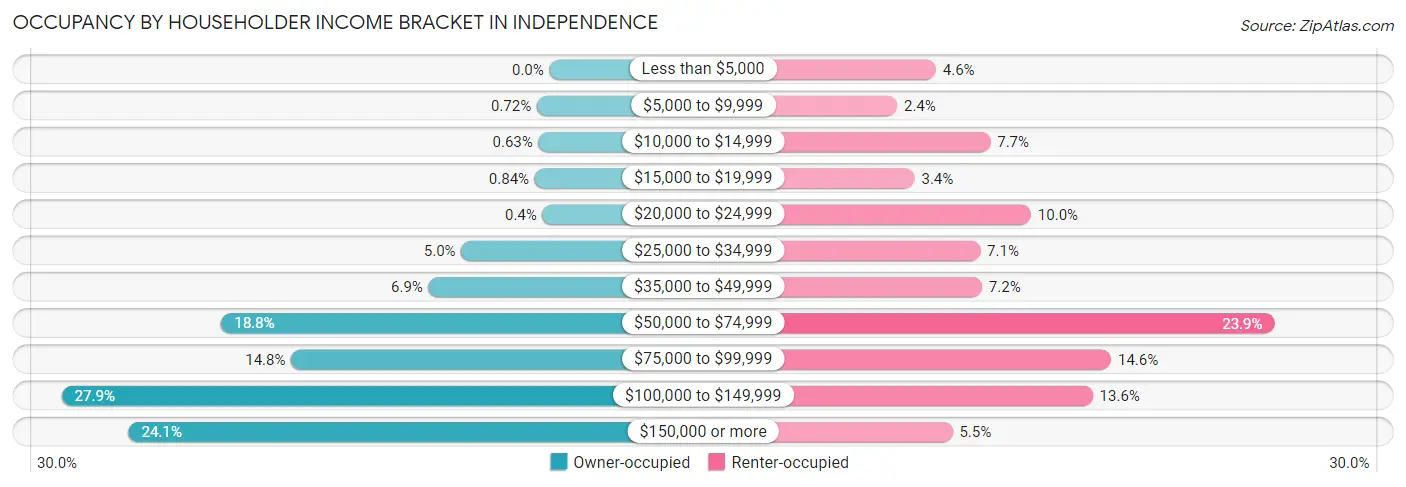
| Income Bracket | Owner-occupied | Renter-occupied |
| Less than $5,000 | 0 (0.0%) | 87 (4.6%) |
| $5,000 to $9,999 | 58 (0.7%) | 45 (2.4%) |
| $10,000 to $14,999 | 51 (0.6%) | 146 (7.7%) |
| $15,000 to $19,999 | 68 (0.8%) | 64 (3.4%) |
| $20,000 to $24,999 | 32 (0.4%) | 190 (10.0%) |
| $25,000 to $34,999 | 407 (5.0%) | 135 (7.1%) |
| $35,000 to $49,999 | 558 (6.9%) | 137 (7.2%) |
| $50,000 to $74,999 | 1,514 (18.8%) | 454 (23.9%) |
| $75,000 to $99,999 | 1,191 (14.8%) | 277 (14.6%) |
| $100,000 to $149,999 | 2,250 (27.9%) | 257 (13.6%) |
| $150,000 or more | 1,942 (24.1%) | 105 (5.5%) |
| Total | 8,071 (100.0%) | 1,897 (100.0%) |
Monthly Housing Cost Tiers in Independence
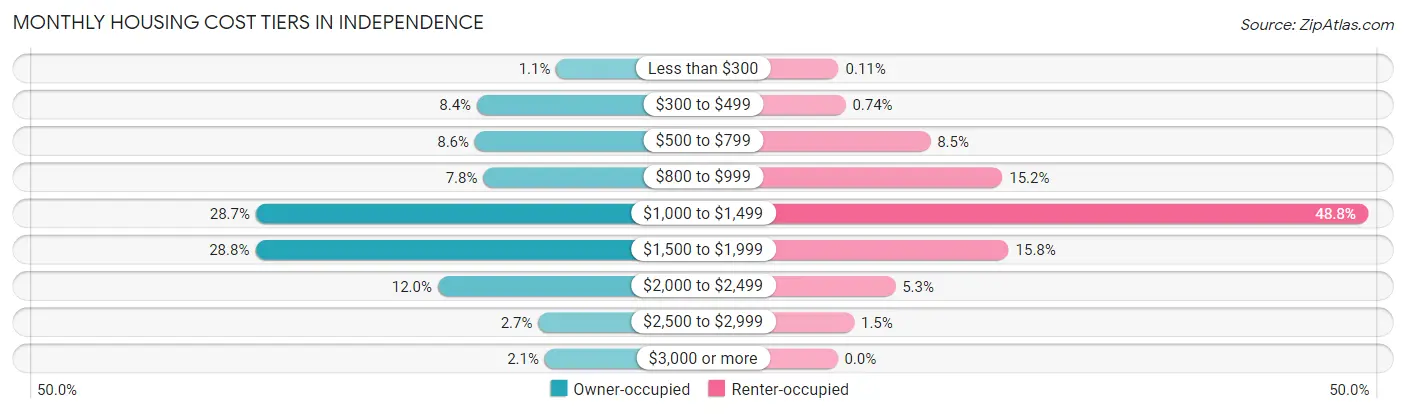
| Monthly Cost | Owner-occupied | Renter-occupied |
| Less than $300 | 85 (1.1%) | 2 (0.1%) |
| $300 to $499 | 675 (8.4%) | 14 (0.7%) |
| $500 to $799 | 690 (8.6%) | 162 (8.5%) |
| $800 to $999 | 627 (7.8%) | 288 (15.2%) |
| $1,000 to $1,499 | 2,318 (28.7%) | 926 (48.8%) |
| $1,500 to $1,999 | 2,322 (28.8%) | 299 (15.8%) |
| $2,000 to $2,499 | 965 (12.0%) | 101 (5.3%) |
| $2,500 to $2,999 | 219 (2.7%) | 29 (1.5%) |
| $3,000 or more | 170 (2.1%) | 0 (0.0%) |
| Total | 8,071 (100.0%) | 1,897 (100.0%) |
Physical Housing Characteristics in Independence
Housing Structures in Independence
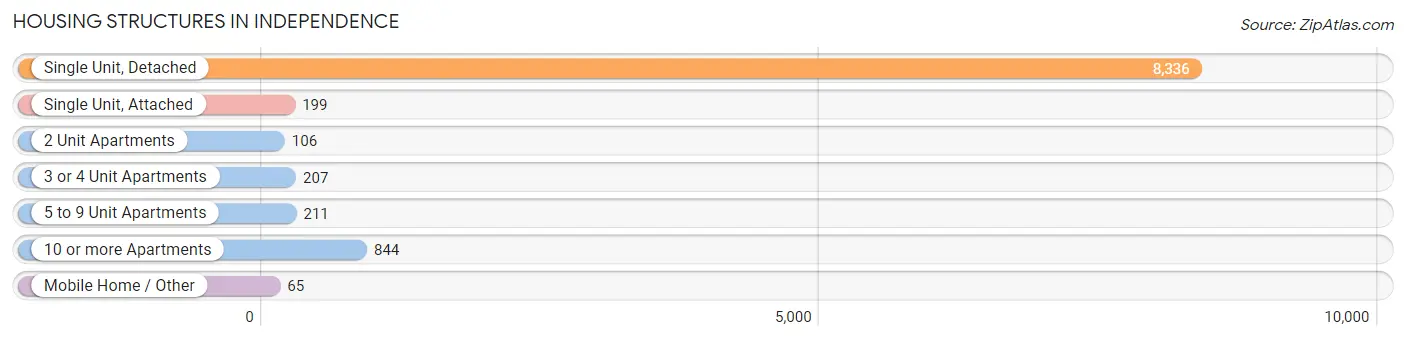
| Structure Type | # Housing Units | % Housing Units |
| Single Unit, Detached | 8,336 | 83.6% |
| Single Unit, Attached | 199 | 2.0% |
| 2 Unit Apartments | 106 | 1.1% |
| 3 or 4 Unit Apartments | 207 | 2.1% |
| 5 to 9 Unit Apartments | 211 | 2.1% |
| 10 or more Apartments | 844 | 8.5% |
| Mobile Home / Other | 65 | 0.6% |
| Total | 9,968 | 100.0% |
Housing Structures by Occupancy in Independence
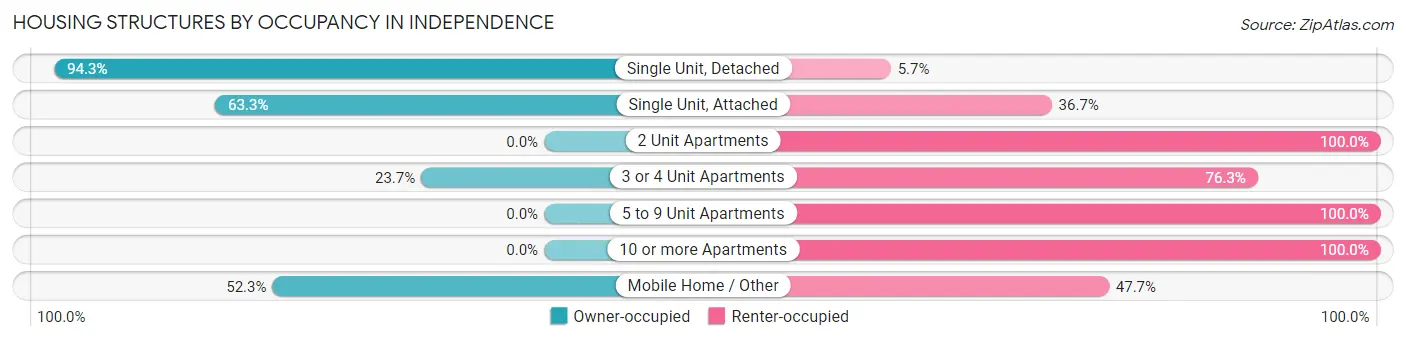
| Structure Type | Owner-occupied | Renter-occupied |
| Single Unit, Detached | 7,862 (94.3%) | 474 (5.7%) |
| Single Unit, Attached | 126 (63.3%) | 73 (36.7%) |
| 2 Unit Apartments | 0 (0.0%) | 106 (100.0%) |
| 3 or 4 Unit Apartments | 49 (23.7%) | 158 (76.3%) |
| 5 to 9 Unit Apartments | 0 (0.0%) | 211 (100.0%) |
| 10 or more Apartments | 0 (0.0%) | 844 (100.0%) |
| Mobile Home / Other | 34 (52.3%) | 31 (47.7%) |
| Total | 8,071 (81.0%) | 1,897 (19.0%) |
Housing Structures by Number of Rooms in Independence
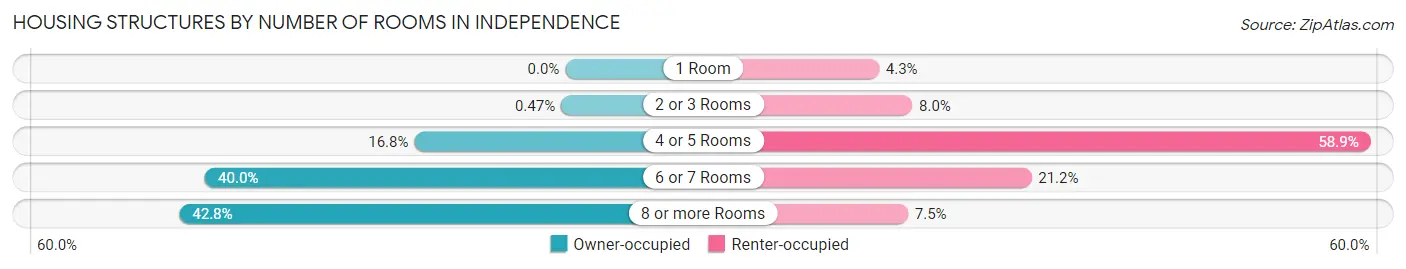
| Number of Rooms | Owner-occupied | Renter-occupied |
| 1 Room | 0 (0.0%) | 82 (4.3%) |
| 2 or 3 Rooms | 38 (0.5%) | 152 (8.0%) |
| 4 or 5 Rooms | 1,352 (16.8%) | 1,117 (58.9%) |
| 6 or 7 Rooms | 3,225 (40.0%) | 403 (21.2%) |
| 8 or more Rooms | 3,456 (42.8%) | 143 (7.5%) |
| Total | 8,071 (100.0%) | 1,897 (100.0%) |
Housing Structure by Heating Type in Independence
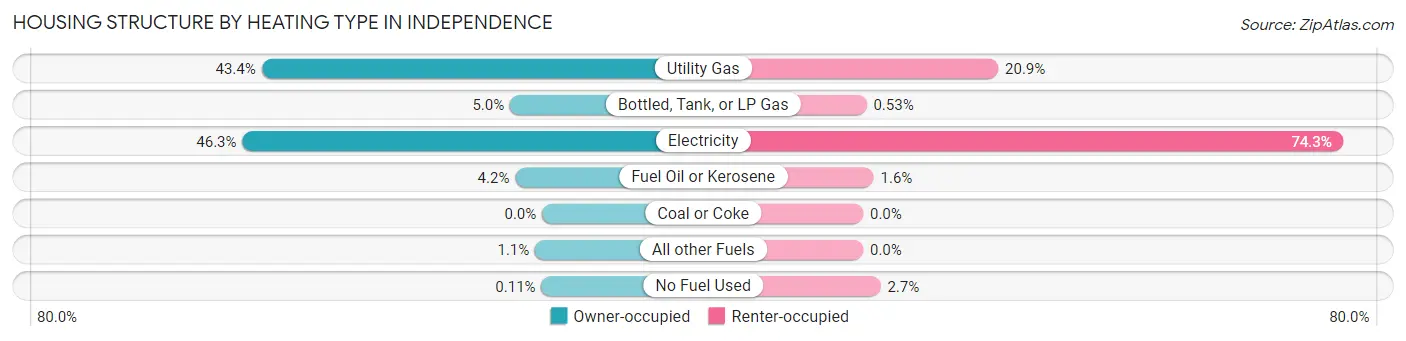
| Heating Type | Owner-occupied | Renter-occupied |
| Utility Gas | 3,500 (43.4%) | 396 (20.9%) |
| Bottled, Tank, or LP Gas | 400 (5.0%) | 10 (0.5%) |
| Electricity | 3,740 (46.3%) | 1,409 (74.3%) |
| Fuel Oil or Kerosene | 335 (4.2%) | 31 (1.6%) |
| Coal or Coke | 0 (0.0%) | 0 (0.0%) |
| All other Fuels | 87 (1.1%) | 0 (0.0%) |
| No Fuel Used | 9 (0.1%) | 51 (2.7%) |
| Total | 8,071 (100.0%) | 1,897 (100.0%) |
Household Vehicle Usage in Independence
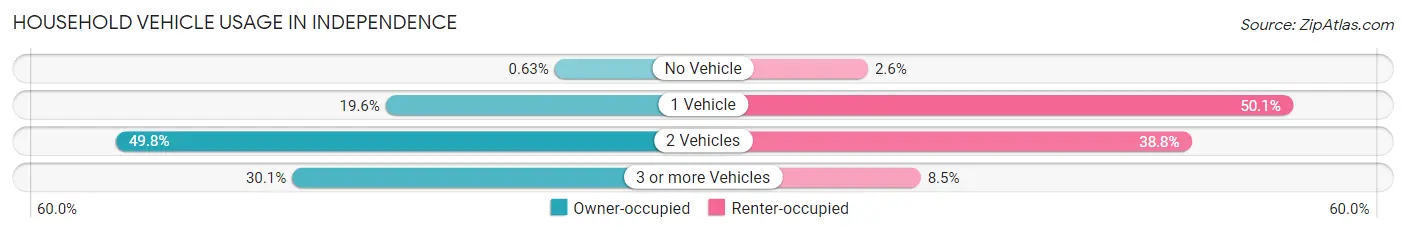
| Vehicles per Household | Owner-occupied | Renter-occupied |
| No Vehicle | 51 (0.6%) | 49 (2.6%) |
| 1 Vehicle | 1,579 (19.6%) | 951 (50.1%) |
| 2 Vehicles | 4,016 (49.8%) | 736 (38.8%) |
| 3 or more Vehicles | 2,425 (30.0%) | 161 (8.5%) |
| Total | 8,071 (100.0%) | 1,897 (100.0%) |
Real Estate & Mortgages in Independence
Real Estate and Mortgage Overview in Independence
| Characteristic | Without Mortgage | With Mortgage |
| Housing Units | 1,503 | 6,568 |
| Median Property Value | $231,100 | $224,400 |
| Median Household Income | $92,242 | $1,570 |
| Monthly Housing Costs | $516 | $143 |
| Real Estate Taxes | $2,199 | $175 |
Property Value by Mortgage Status in Independence
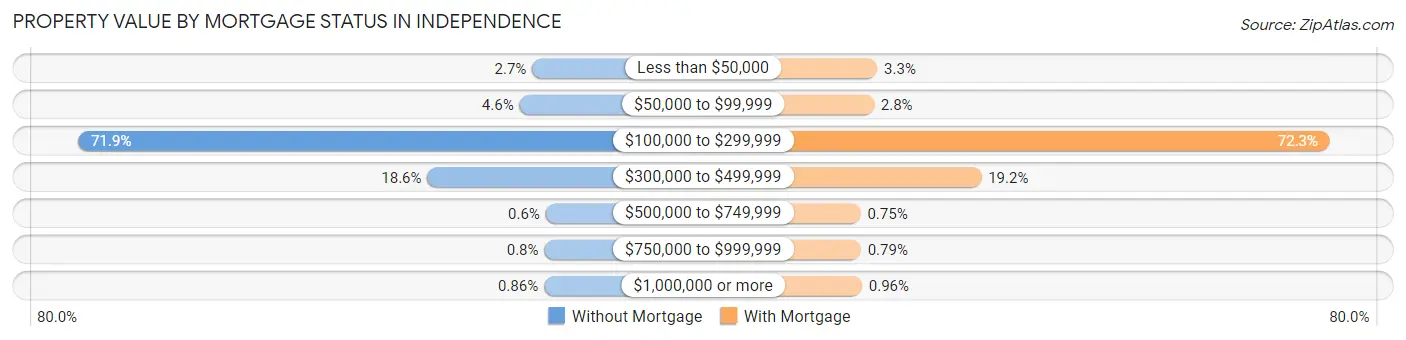
| Property Value | Without Mortgage | With Mortgage |
| Less than $50,000 | 40 (2.7%) | 216 (3.3%) |
| $50,000 to $99,999 | 69 (4.6%) | 183 (2.8%) |
| $100,000 to $299,999 | 1,080 (71.9%) | 4,747 (72.3%) |
| $300,000 to $499,999 | 280 (18.6%) | 1,258 (19.2%) |
| $500,000 to $749,999 | 9 (0.6%) | 49 (0.7%) |
| $750,000 to $999,999 | 12 (0.8%) | 52 (0.8%) |
| $1,000,000 or more | 13 (0.9%) | 63 (1.0%) |
| Total | 1,503 (100.0%) | 6,568 (100.0%) |
Household Income by Mortgage Status in Independence
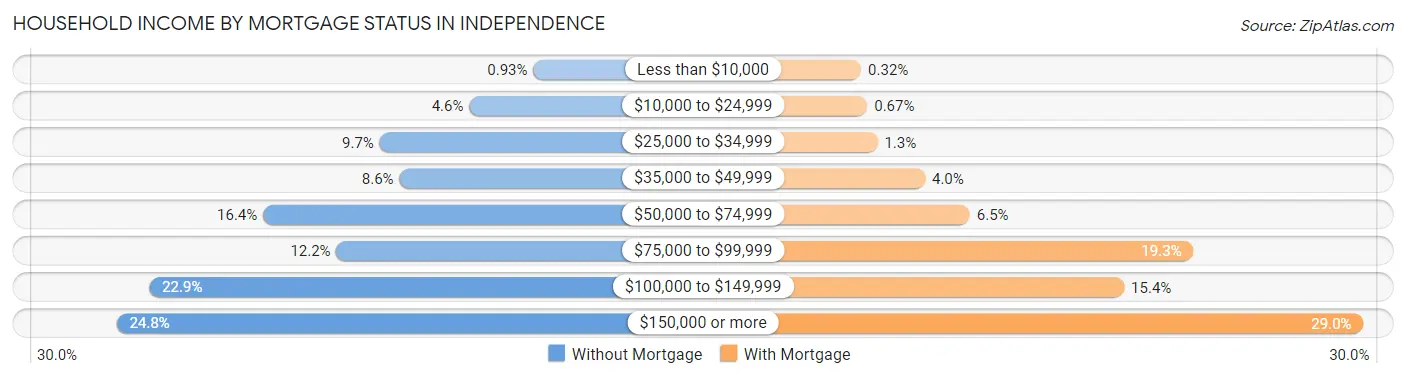
| Household Income | Without Mortgage | With Mortgage |
| Less than $10,000 | 14 (0.9%) | 21 (0.3%) |
| $10,000 to $24,999 | 69 (4.6%) | 44 (0.7%) |
| $25,000 to $34,999 | 146 (9.7%) | 82 (1.3%) |
| $35,000 to $49,999 | 129 (8.6%) | 261 (4.0%) |
| $50,000 to $74,999 | 246 (16.4%) | 429 (6.5%) |
| $75,000 to $99,999 | 183 (12.2%) | 1,268 (19.3%) |
| $100,000 to $149,999 | 344 (22.9%) | 1,008 (15.3%) |
| $150,000 or more | 372 (24.7%) | 1,906 (29.0%) |
| Total | 1,503 (100.0%) | 6,568 (100.0%) |
Property Value to Household Income Ratio in Independence
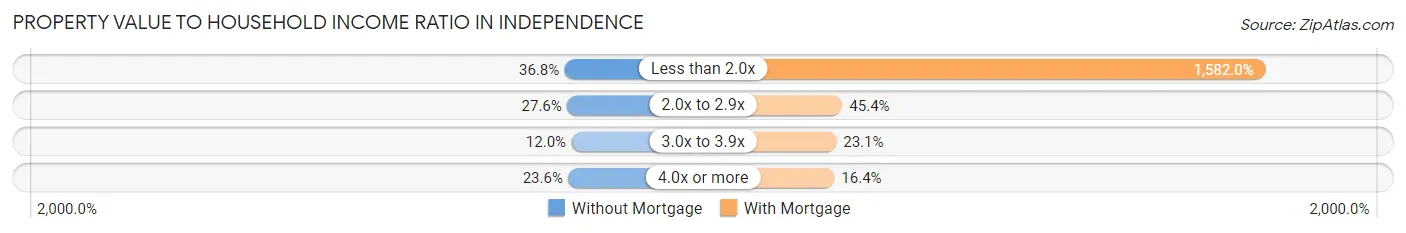
| Value-to-Income Ratio | Without Mortgage | With Mortgage |
| Less than 2.0x | 553 (36.8%) | 103,908 (1,582.0%) |
| 2.0x to 2.9x | 415 (27.6%) | 2,982 (45.4%) |
| 3.0x to 3.9x | 181 (12.0%) | 1,520 (23.1%) |
| 4.0x or more | 354 (23.5%) | 1,074 (16.4%) |
| Total | 1,503 (100.0%) | 6,568 (100.0%) |
Real Estate Taxes by Mortgage Status in Independence
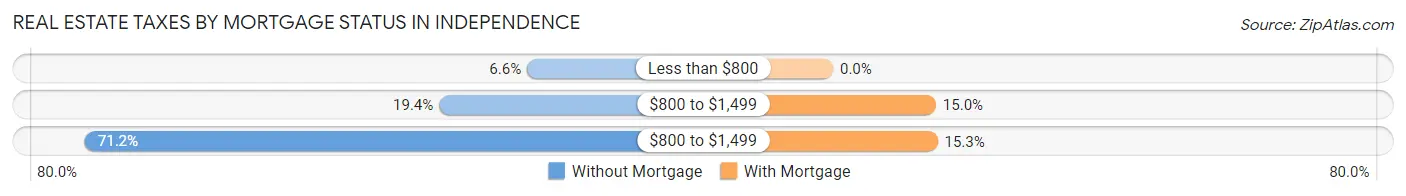
| Property Taxes | Without Mortgage | With Mortgage |
| Less than $800 | 99 (6.6%) | 0 (0.0%) |
| $800 to $1,499 | 292 (19.4%) | 987 (15.0%) |
| $800 to $1,499 | 1,070 (71.2%) | 1,003 (15.3%) |
| Total | 1,503 (100.0%) | 6,568 (100.0%) |
Health & Disability in Independence
Health Insurance Coverage by Age in Independence
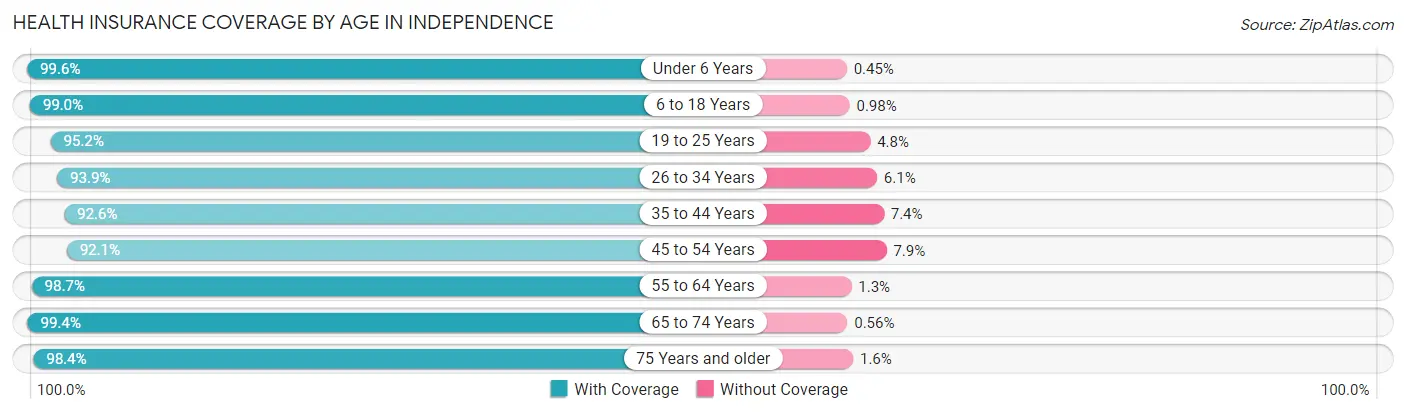
| Age Bracket | With Coverage | Without Coverage |
| Under 6 Years | 2,424 (99.6%) | 11 (0.4%) |
| 6 to 18 Years | 5,770 (99.0%) | 57 (1.0%) |
| 19 to 25 Years | 2,284 (95.2%) | 116 (4.8%) |
| 26 to 34 Years | 3,601 (93.9%) | 233 (6.1%) |
| 35 to 44 Years | 3,925 (92.6%) | 312 (7.4%) |
| 45 to 54 Years | 3,727 (92.1%) | 318 (7.9%) |
| 55 to 64 Years | 3,019 (98.7%) | 40 (1.3%) |
| 65 to 74 Years | 1,942 (99.4%) | 11 (0.6%) |
| 75 Years and older | 908 (98.4%) | 15 (1.6%) |
| Total | 27,600 (96.1%) | 1,113 (3.9%) |
Health Insurance Coverage by Citizenship Status in Independence
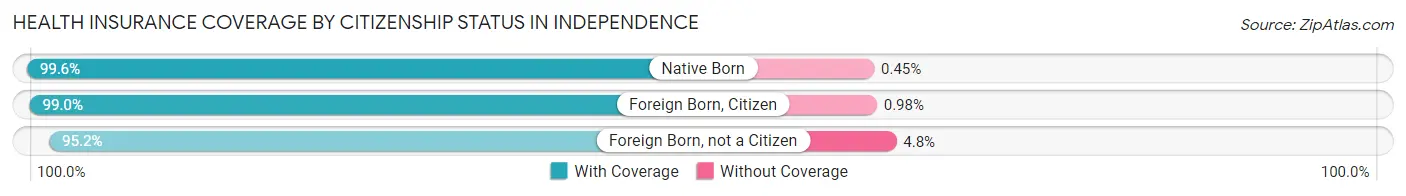
| Citizenship Status | With Coverage | Without Coverage |
| Native Born | 2,424 (99.6%) | 11 (0.4%) |
| Foreign Born, Citizen | 5,770 (99.0%) | 57 (1.0%) |
| Foreign Born, not a Citizen | 2,284 (95.2%) | 116 (4.8%) |
Health Insurance Coverage by Household Income in Independence
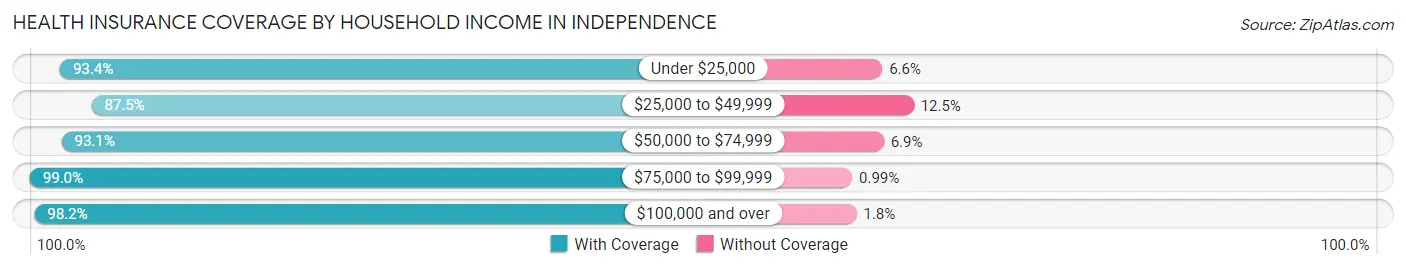
| Household Income | With Coverage | Without Coverage |
| Under $25,000 | 1,785 (93.4%) | 127 (6.6%) |
| $25,000 to $49,999 | 2,151 (87.5%) | 308 (12.5%) |
| $50,000 to $74,999 | 4,886 (93.1%) | 363 (6.9%) |
| $75,000 to $99,999 | 3,884 (99.0%) | 39 (1.0%) |
| $100,000 and over | 14,889 (98.2%) | 276 (1.8%) |
Public vs Private Health Insurance Coverage by Age in Independence
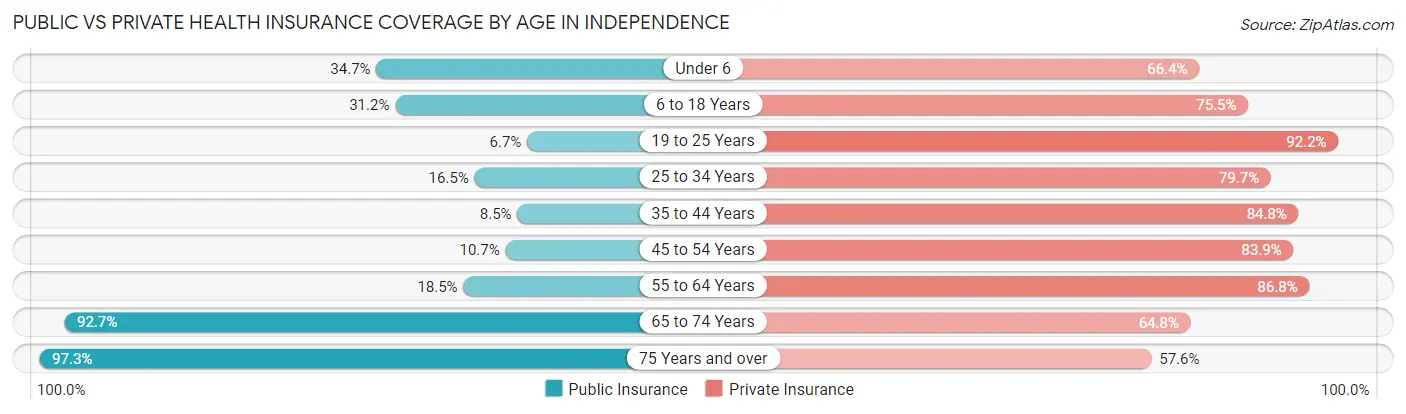
| Age Bracket | Public Insurance | Private Insurance |
| Under 6 | 845 (34.7%) | 1,616 (66.4%) |
| 6 to 18 Years | 1,818 (31.2%) | 4,397 (75.5%) |
| 19 to 25 Years | 161 (6.7%) | 2,212 (92.2%) |
| 25 to 34 Years | 631 (16.5%) | 3,054 (79.7%) |
| 35 to 44 Years | 361 (8.5%) | 3,593 (84.8%) |
| 45 to 54 Years | 434 (10.7%) | 3,392 (83.9%) |
| 55 to 64 Years | 567 (18.5%) | 2,656 (86.8%) |
| 65 to 74 Years | 1,810 (92.7%) | 1,265 (64.8%) |
| 75 Years and over | 898 (97.3%) | 532 (57.6%) |
| Total | 7,525 (26.2%) | 22,717 (79.1%) |
Disability Status by Sex by Age in Independence
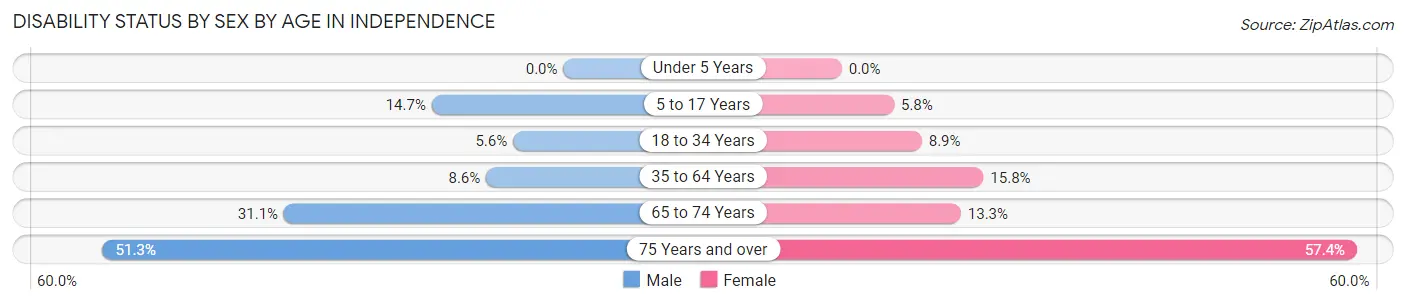
| Age Bracket | Male | Female |
| Under 5 Years | 0 (0.0%) | 0 (0.0%) |
| 5 to 17 Years | 450 (14.7%) | 156 (5.8%) |
| 18 to 34 Years | 179 (5.6%) | 307 (8.9%) |
| 35 to 64 Years | 496 (8.6%) | 879 (15.8%) |
| 65 to 74 Years | 258 (31.1%) | 149 (13.3%) |
| 75 Years and over | 216 (51.3%) | 288 (57.4%) |
Disability Class by Sex by Age in Independence
Disability Class: Hearing Difficulty
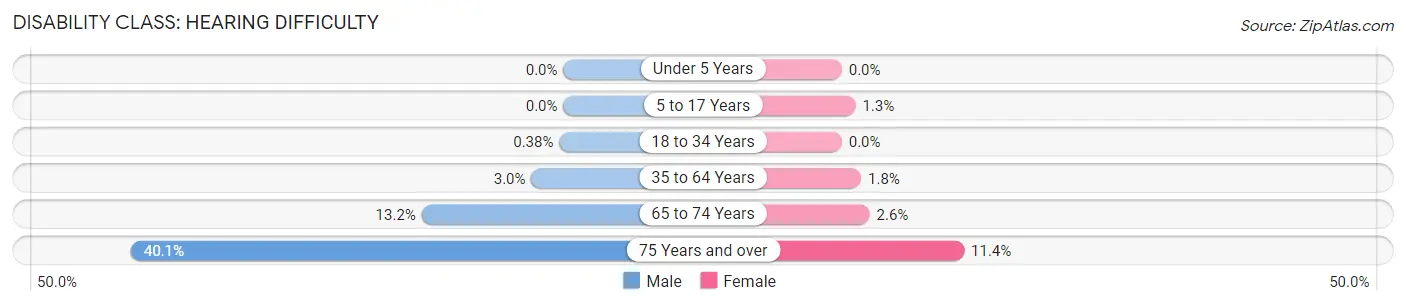
| Age Bracket | Male | Female |
| Under 5 Years | 0 (0.0%) | 0 (0.0%) |
| 5 to 17 Years | 0 (0.0%) | 34 (1.3%) |
| 18 to 34 Years | 12 (0.4%) | 0 (0.0%) |
| 35 to 64 Years | 171 (3.0%) | 100 (1.8%) |
| 65 to 74 Years | 109 (13.2%) | 29 (2.6%) |
| 75 Years and over | 169 (40.1%) | 57 (11.4%) |
Disability Class: Vision Difficulty
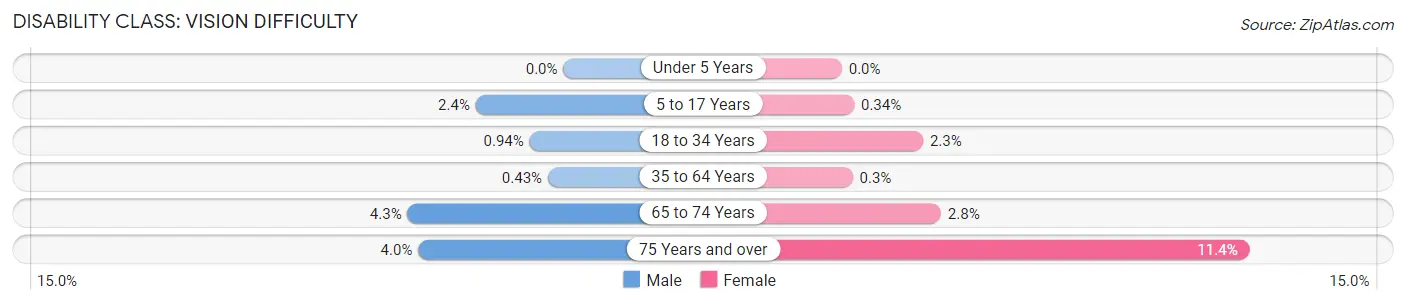
| Age Bracket | Male | Female |
| Under 5 Years | 0 (0.0%) | 0 (0.0%) |
| 5 to 17 Years | 75 (2.4%) | 9 (0.3%) |
| 18 to 34 Years | 30 (0.9%) | 78 (2.3%) |
| 35 to 64 Years | 25 (0.4%) | 17 (0.3%) |
| 65 to 74 Years | 36 (4.3%) | 31 (2.8%) |
| 75 Years and over | 17 (4.0%) | 57 (11.4%) |
Disability Class: Cognitive Difficulty
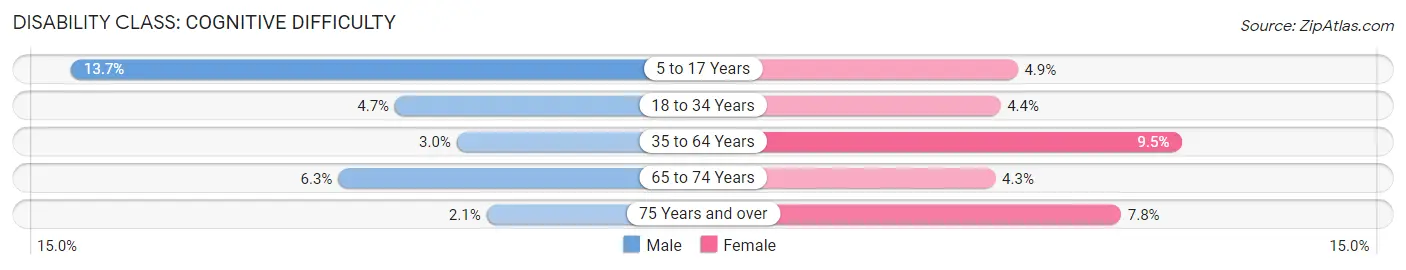
| Age Bracket | Male | Female |
| 5 to 17 Years | 421 (13.7%) | 131 (4.9%) |
| 18 to 34 Years | 150 (4.7%) | 152 (4.4%) |
| 35 to 64 Years | 171 (3.0%) | 527 (9.5%) |
| 65 to 74 Years | 52 (6.3%) | 48 (4.3%) |
| 75 Years and over | 9 (2.1%) | 39 (7.8%) |
Disability Class: Ambulatory Difficulty
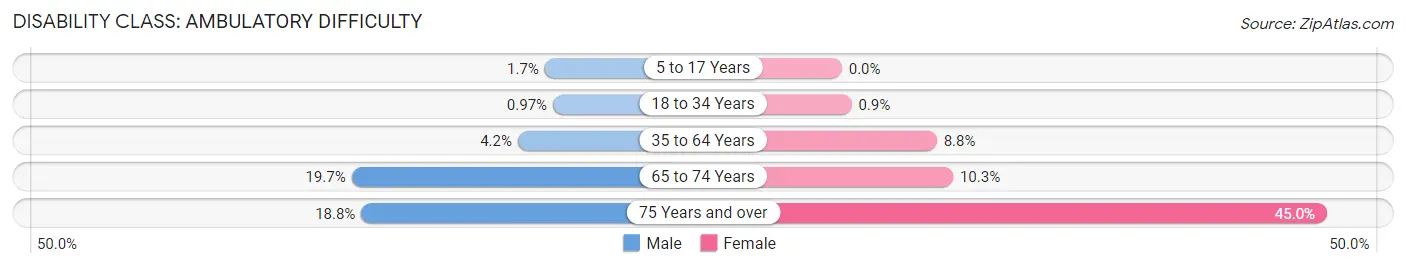
| Age Bracket | Male | Female |
| 5 to 17 Years | 53 (1.7%) | 0 (0.0%) |
| 18 to 34 Years | 31 (1.0%) | 31 (0.9%) |
| 35 to 64 Years | 244 (4.2%) | 491 (8.8%) |
| 65 to 74 Years | 163 (19.7%) | 116 (10.3%) |
| 75 Years and over | 79 (18.8%) | 226 (45.0%) |
Disability Class: Self-Care Difficulty
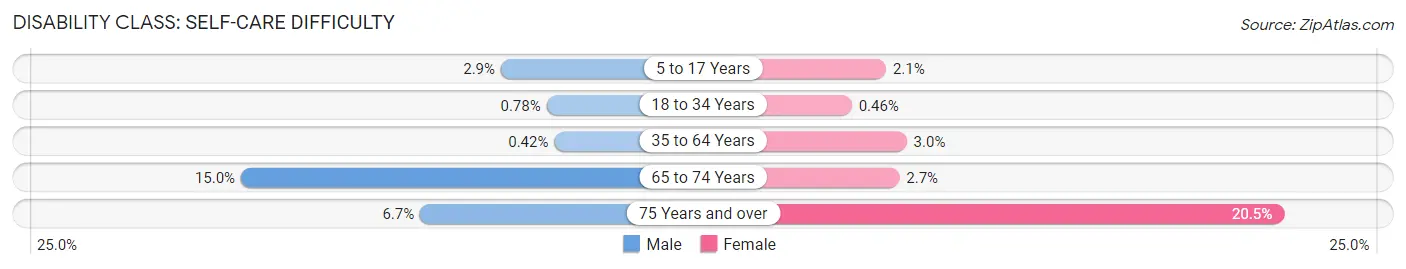
| Age Bracket | Male | Female |
| 5 to 17 Years | 89 (2.9%) | 55 (2.1%) |
| 18 to 34 Years | 25 (0.8%) | 16 (0.5%) |
| 35 to 64 Years | 24 (0.4%) | 168 (3.0%) |
| 65 to 74 Years | 124 (15.0%) | 30 (2.7%) |
| 75 Years and over | 28 (6.7%) | 103 (20.5%) |
Technology Access in Independence
Computing Device Access in Independence
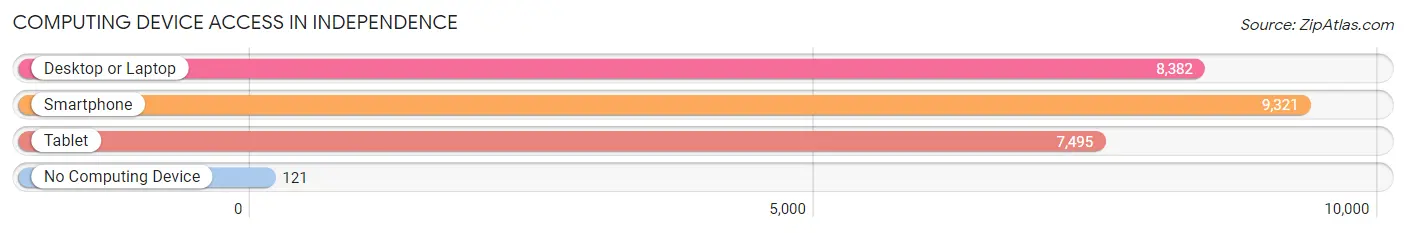
| Device Type | # Households | % Households |
| Desktop or Laptop | 8,382 | 84.1% |
| Smartphone | 9,321 | 93.5% |
| Tablet | 7,495 | 75.2% |
| No Computing Device | 121 | 1.2% |
| Total | 9,968 | 100.0% |
Internet Access in Independence
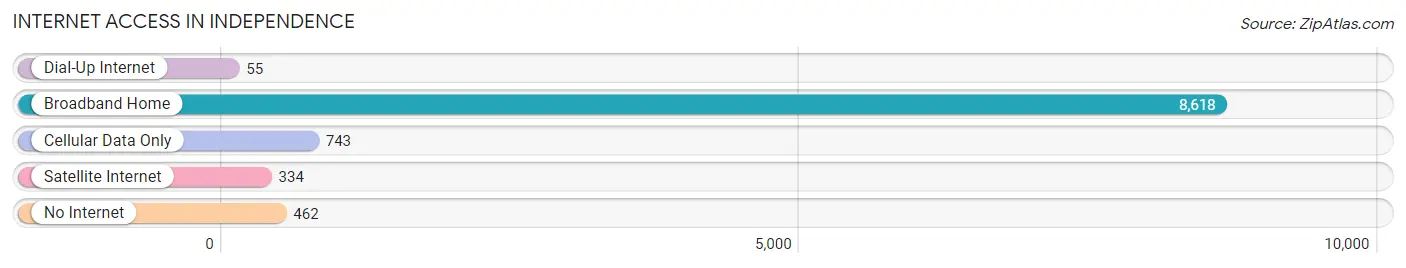
| Internet Type | # Households | % Households |
| Dial-Up Internet | 55 | 0.5% |
| Broadband Home | 8,618 | 86.5% |
| Cellular Data Only | 743 | 7.4% |
| Satellite Internet | 334 | 3.4% |
| No Internet | 462 | 4.6% |
| Total | 9,968 | 100.0% |
Independence Summary
Independence is a city located in Kenton County, Kentucky, United States. It is a suburb of Cincinnati, Ohio, and is part of the Cincinnati metropolitan area. The population was 24,757 at the 2010 census.
History
Independence was founded in 1820 by a group of settlers from the nearby town of Covington, Kentucky. The settlers chose the name Independence because they wanted to be independent from Covington. The town was incorporated in 1842 and was the first city in Kenton County.
In the late 19th century, Independence was a popular destination for wealthy Cincinnatians who wanted to escape the city and enjoy the rural atmosphere. The city was home to several large estates, including the historic William Henry Harrison estate, which is now a museum.
In the early 20th century, Independence experienced a period of growth and development. The city was home to several factories, including the Independence Iron and Steel Company, which was the largest employer in the city. The city also had a thriving business district, which included several banks, stores, and restaurants.
Geography
Independence is located in northern Kenton County, at the intersection of Interstate 75 and U.S. Route 25. The city is bordered to the north by the city of Taylor Mill, to the east by the city of Covington, to the south by the city of Fort Mitchell, and to the west by the city of Erlanger.
The city has a total area of 8.2 square miles, of which 8.1 square miles is land and 0.1 square miles is water. The city is located in the rolling hills of northern Kentucky and is part of the Cincinnati metropolitan area.
Economy
Independence is a bedroom community for Cincinnati, Ohio, and is home to several large employers. The largest employer in the city is the Independence Iron and Steel Company, which employs over 1,000 people. Other major employers include the Kenton County School District, the Kenton County Public Library, and the Kenton County Sheriff's Office.
The city also has a thriving retail sector, with several large shopping centers and retail stores. The city is home to several restaurants, bars, and entertainment venues.
Demographics
As of the 2010 census, the population of Independence was 24,757. The racial makeup of the city was 90.2% White, 4.3% African American, 0.3% Native American, 1.7% Asian, 0.1% Pacific Islander, 1.2% from other races, and 2.4% from two or more races. Hispanic or Latino of any race were 3.7% of the population.
The median income for a household in the city was $50,945, and the median income for a family was $60,945. The per capita income for the city was $25,945. About 5.2% of families and 6.7% of the population were below the poverty line, including 8.2% of those under age 18 and 5.2% of those age 65 or over.
Common Questions
What is Per Capita Income in Independence?
Per Capita income in Independence is $37,415.
What is the Median Family Income in Independence?
Median Family Income in Independence is $99,779.
What is the Median Household income in Independence?
Median Household Income in Independence is $92,355.
What is Income or Wage Gap in Independence?
Income or Wage Gap in Independence is 31.4%.
Women in Independence earn 68.6 cents for every dollar earned by a man.
What is Family Income Deficit in Independence?
Family Income Deficit in Independence is $13,249.
Families that are below poverty line in Independence earn $13,249 less on average than the poverty threshold level.
What is Inequality or Gini Index in Independence?
Inequality or Gini Index in Independence is 0.35.
What is the Total Population of Independence?
Total Population of Independence is 28,722.
What is the Total Male Population of Independence?
Total Male Population of Independence is 14,246.
What is the Total Female Population of Independence?
Total Female Population of Independence is 14,476.
What is the Ratio of Males per 100 Females in Independence?
There are 98.41 Males per 100 Females in Independence.
What is the Ratio of Females per 100 Males in Independence?
There are 101.61 Females per 100 Males in Independence.
What is the Median Population Age in Independence?
Median Population Age in Independence is 34.7 Years.
What is the Average Family Size in Independence
Average Family Size in Independence is 3.3 People.
What is the Average Household Size in Independence
Average Household Size in Independence is 2.9 People.
How Large is the Labor Force in Independence?
There are 16,207 People in the Labor Forcein in Independence.
What is the Percentage of People in the Labor Force in Independence?
74.8% of People are in the Labor Force in Independence.
What is the Unemployment Rate in Independence?
Unemployment Rate in Independence is 3.6%.