Langdon Place, KY Map & Demographics
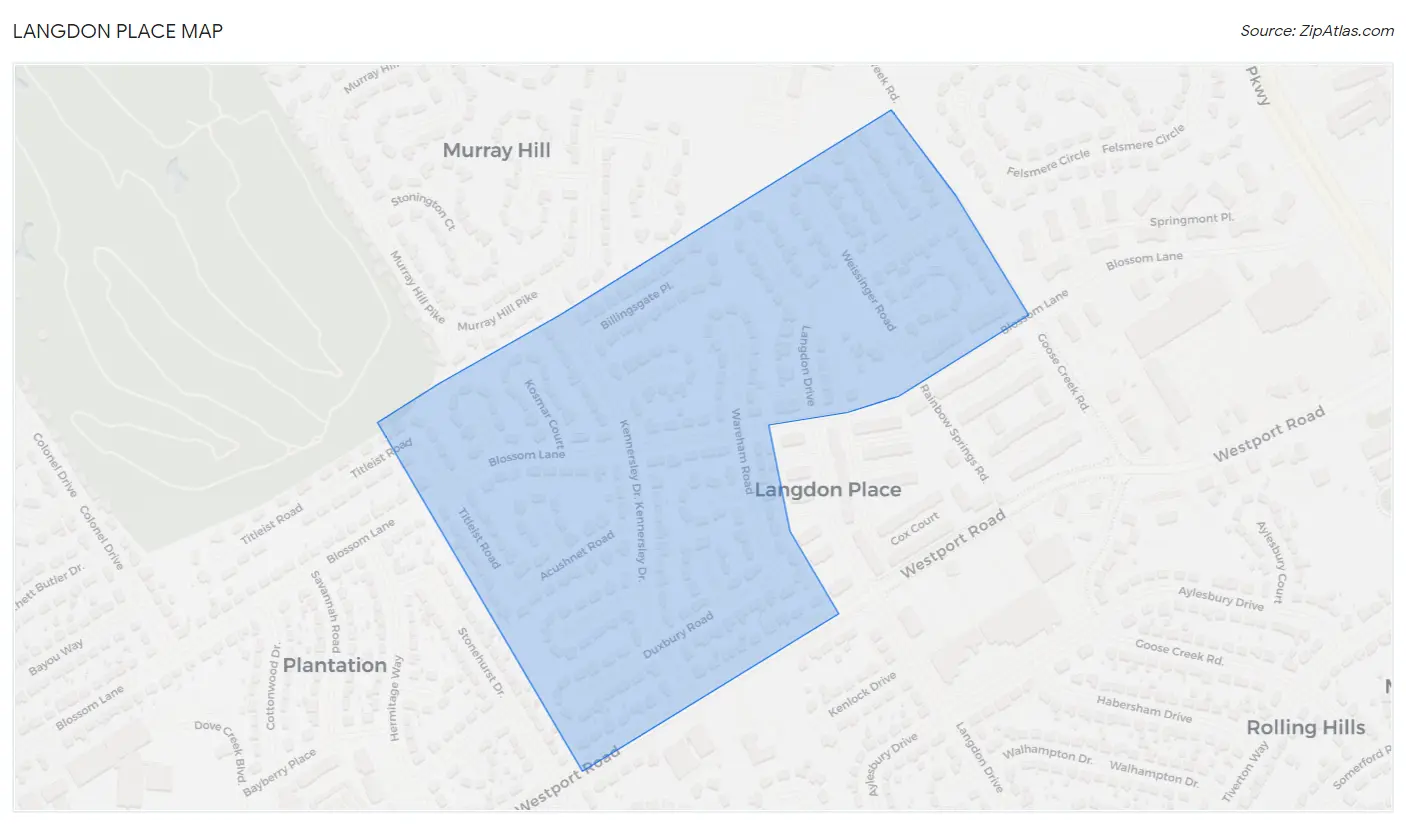
Langdon Place Map
Langdon Place Overview
$44,391
PER CAPITA INCOME
$116,875
AVG FAMILY INCOME
$99,091
AVG HOUSEHOLD INCOME
29.7%
WAGE / INCOME GAP [ % ]
70.3¢/ $1
WAGE / INCOME GAP [ $ ]
0.37
INEQUALITY / GINI INDEX
933
TOTAL POPULATION
426
MALE POPULATION
507
FEMALE POPULATION
84.02
MALES / 100 FEMALES
119.01
FEMALES / 100 MALES
38.5
MEDIAN AGE
3.5
AVG FAMILY SIZE
2.9
AVG HOUSEHOLD SIZE
497
LABOR FORCE [ PEOPLE ]
74.4%
PERCENT IN LABOR FORCE
2.0%
UNEMPLOYMENT RATE
Langdon Place Area Codes
Income in Langdon Place
Income Overview in Langdon Place
Per Capita Income in Langdon Place is $44,391, while median incomes of families and households are $116,875 and $99,091 respectively.
| Characteristic | Number | Measure |
| Per Capita Income | 933 | $44,391 |
| Median Family Income | 227 | $116,875 |
| Mean Family Income | 227 | $135,913 |
| Median Household Income | 320 | $99,091 |
| Mean Household Income | 320 | $124,796 |
| Income Deficit | 227 | $0 |
| Wage / Income Gap (%) | 933 | 29.74% |
| Wage / Income Gap ($) | 933 | 70.26¢ per $1 |
| Gini / Inequality Index | 933 | 0.37 |
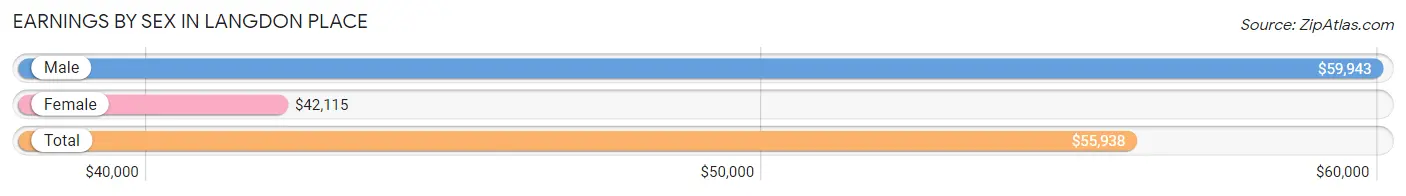
Earnings by Sex in Langdon Place
Average Earnings in Langdon Place are $55,938, $59,943 for men and $42,115 for women, a difference of 29.7%.
| Sex | Number | Average Earnings |
| Male | 265 (50.7%) | $59,943 |
| Female | 258 (49.3%) | $42,115 |
| Total | 523 (100.0%) | $55,938 |
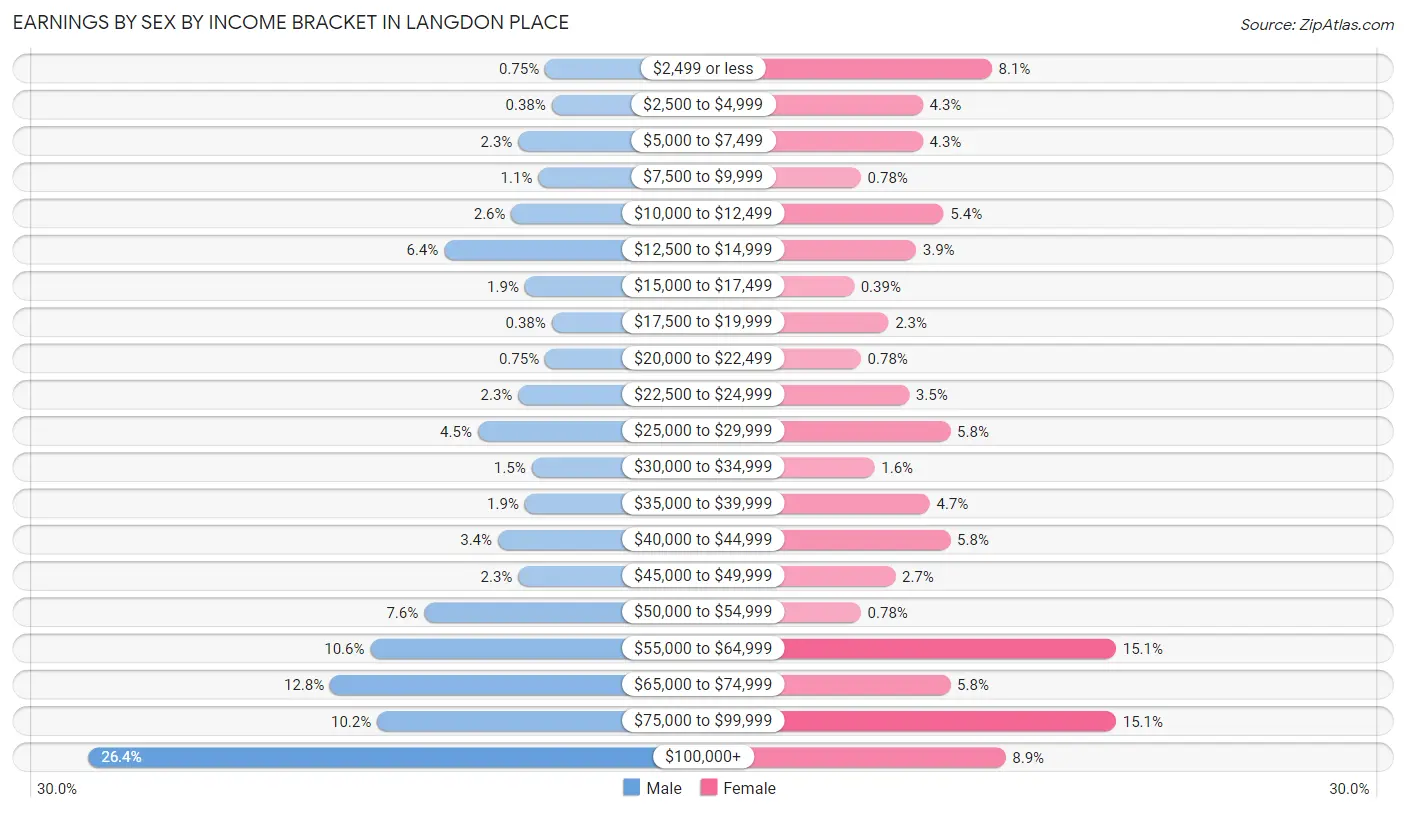
Earnings by Sex by Income Bracket in Langdon Place
The most common earnings brackets in Langdon Place are $100,000+ for men (70 | 26.4%) and $55,000 to $64,999 for women (39 | 15.1%).
| Income | Male | Female |
| $2,499 or less | 2 (0.7%) | 21 (8.1%) |
| $2,500 to $4,999 | 1 (0.4%) | 11 (4.3%) |
| $5,000 to $7,499 | 6 (2.3%) | 11 (4.3%) |
| $7,500 to $9,999 | 3 (1.1%) | 2 (0.8%) |
| $10,000 to $12,499 | 7 (2.6%) | 14 (5.4%) |
| $12,500 to $14,999 | 17 (6.4%) | 10 (3.9%) |
| $15,000 to $17,499 | 5 (1.9%) | 1 (0.4%) |
| $17,500 to $19,999 | 1 (0.4%) | 6 (2.3%) |
| $20,000 to $22,499 | 2 (0.7%) | 2 (0.8%) |
| $22,500 to $24,999 | 6 (2.3%) | 9 (3.5%) |
| $25,000 to $29,999 | 12 (4.5%) | 15 (5.8%) |
| $30,000 to $34,999 | 4 (1.5%) | 4 (1.5%) |
| $35,000 to $39,999 | 5 (1.9%) | 12 (4.6%) |
| $40,000 to $44,999 | 9 (3.4%) | 15 (5.8%) |
| $45,000 to $49,999 | 6 (2.3%) | 7 (2.7%) |
| $50,000 to $54,999 | 20 (7.5%) | 2 (0.8%) |
| $55,000 to $64,999 | 28 (10.6%) | 39 (15.1%) |
| $65,000 to $74,999 | 34 (12.8%) | 15 (5.8%) |
| $75,000 to $99,999 | 27 (10.2%) | 39 (15.1%) |
| $100,000+ | 70 (26.4%) | 23 (8.9%) |
| Total | 265 (100.0%) | 258 (100.0%) |
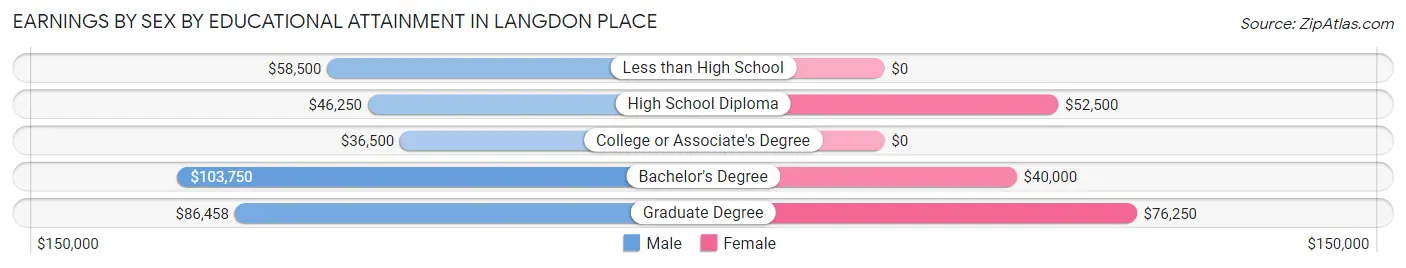
Earnings by Sex by Educational Attainment in Langdon Place
Average earnings in Langdon Place are $65,750 for men and $49,375 for women, a difference of 24.9%. Men with an educational attainment of bachelor's degree enjoy the highest average annual earnings of $103,750, while those with college or associate's degree education earn the least with $36,500. Women with an educational attainment of graduate degree earn the most with the average annual earnings of $76,250, while those with bachelor's degree education have the smallest earnings of $40,000.
| Educational Attainment | Male Income | Female Income |
| Less than High School | $58,500 | $0 |
| High School Diploma | $46,250 | $52,500 |
| College or Associate's Degree | $36,500 | $0 |
| Bachelor's Degree | $103,750 | $40,000 |
| Graduate Degree | $86,458 | $76,250 |
| Total | $65,750 | $49,375 |
Family Income in Langdon Place
Family Income Brackets in Langdon Place
According to the Langdon Place family income data, there are 52 families falling into the $50,000 to $74,999 income range, which is the most common income bracket and makes up 22.9% of all families.
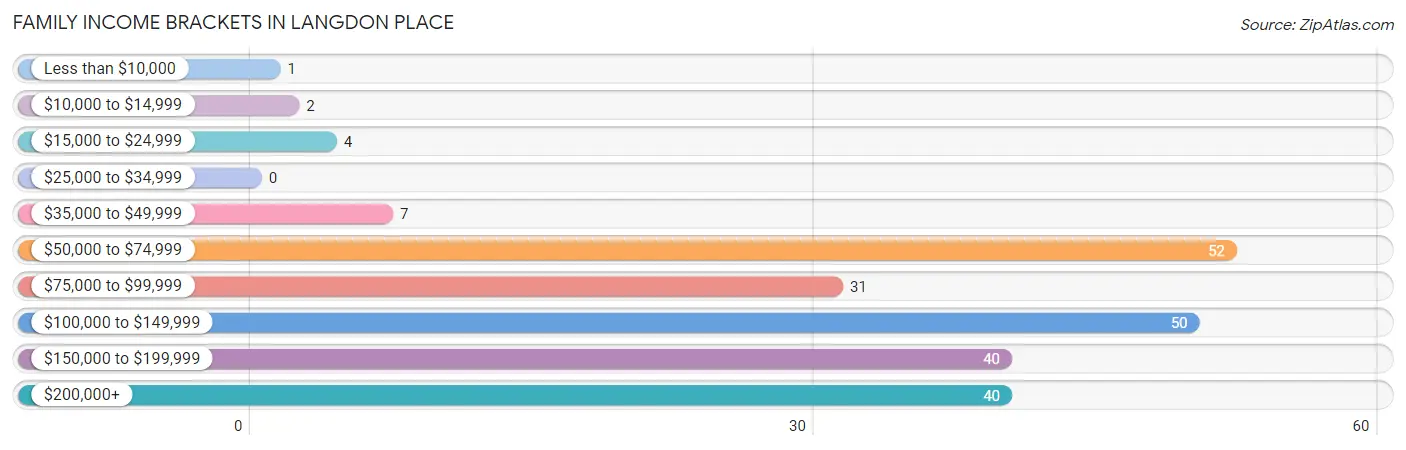
| Income Bracket | # Families | % Families |
| Less than $10,000 | 1 | 0.4% |
| $10,000 to $14,999 | 2 | 0.9% |
| $15,000 to $24,999 | 4 | 1.8% |
| $25,000 to $34,999 | 0 | 0.0% |
| $35,000 to $49,999 | 7 | 3.1% |
| $50,000 to $74,999 | 52 | 22.9% |
| $75,000 to $99,999 | 31 | 13.7% |
| $100,000 to $149,999 | 50 | 22.0% |
| $150,000 to $199,999 | 40 | 17.6% |
| $200,000+ | 40 | 17.6% |
Family Income by Famaliy Size in Langdon Place
4-person families (49 | 21.6%) account for the highest median family income in Langdon Place with $186,250 per family, while 3-person families (46 | 20.3%) have the highest median income of $53,333 per family member.
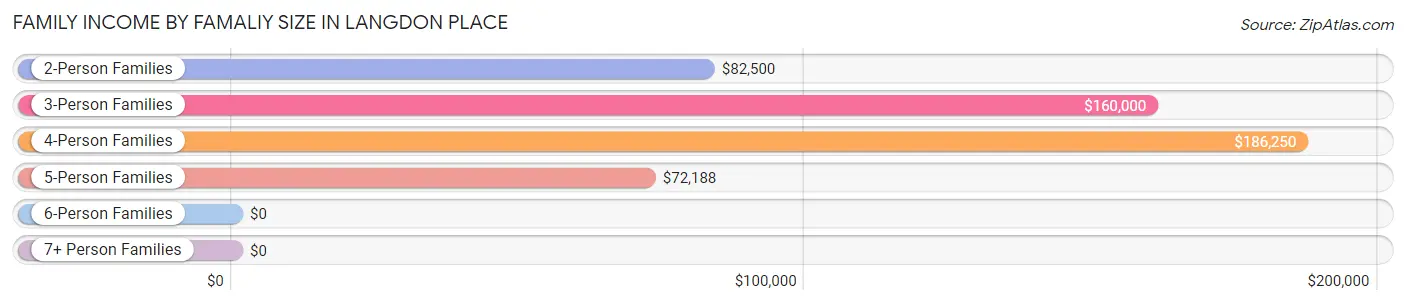
| Income Bracket | # Families | Median Income |
| 2-Person Families | 96 (42.3%) | $82,500 |
| 3-Person Families | 46 (20.3%) | $160,000 |
| 4-Person Families | 49 (21.6%) | $186,250 |
| 5-Person Families | 32 (14.1%) | $72,188 |
| 6-Person Families | 3 (1.3%) | $0 |
| 7+ Person Families | 1 (0.4%) | $0 |
| Total | 227 (100.0%) | $116,875 |
Family Income by Number of Earners in Langdon Place
The median family income in Langdon Place is $116,875, with families comprising 3+ earners (24) having the highest median family income of $196,944, while families with 1 earner (40) have the lowest median family income of $72,500, accounting for 10.6% and 17.6% of families, respectively.
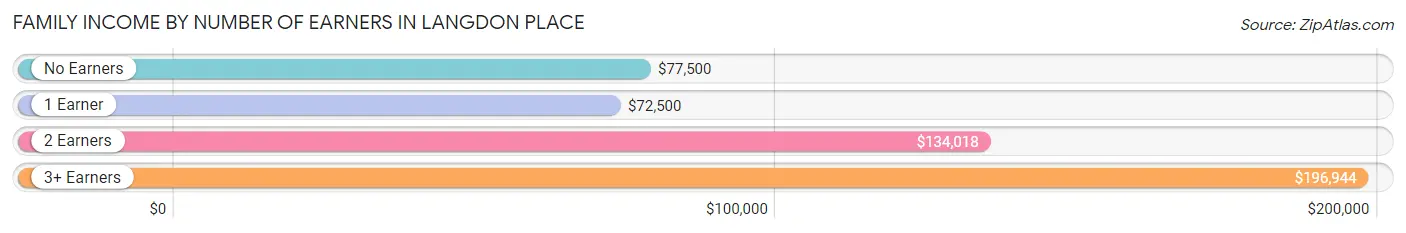
| Number of Earners | # Families | Median Income |
| No Earners | 14 (6.2%) | $77,500 |
| 1 Earner | 40 (17.6%) | $72,500 |
| 2 Earners | 149 (65.6%) | $134,018 |
| 3+ Earners | 24 (10.6%) | $196,944 |
| Total | 227 (100.0%) | $116,875 |
Household Income in Langdon Place
Household Income Brackets in Langdon Place
With 78 households falling in the category, the $50,000 to $74,999 income range is the most frequent in Langdon Place, accounting for 24.4% of all households. In contrast, only 2 households (0.6%) fall into the less than $10,000 income bracket, making it the least populous group.
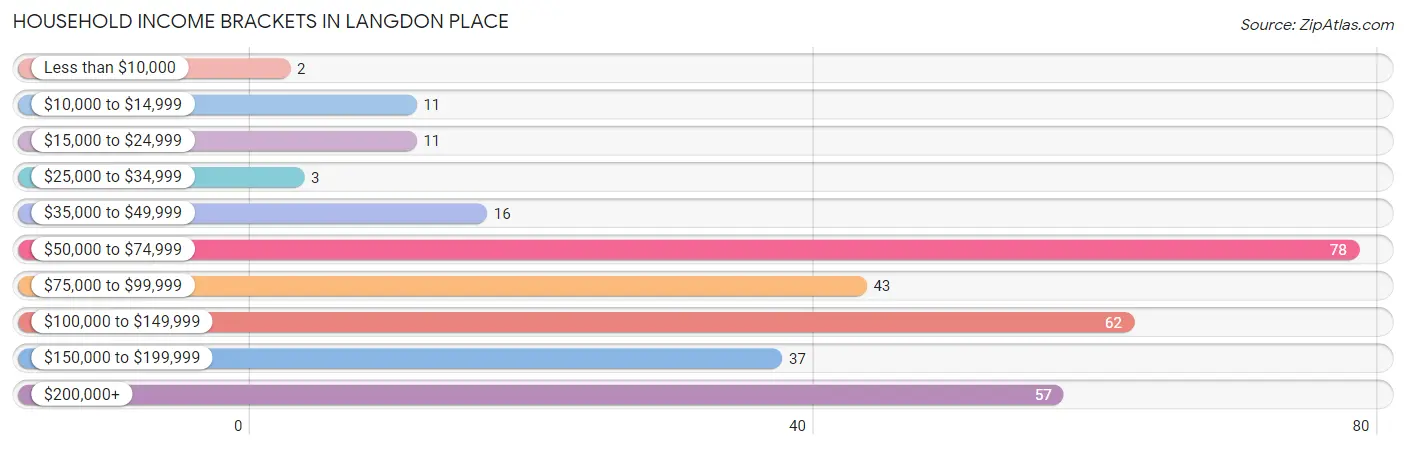
| Income Bracket | # Households | % Households |
| Less than $10,000 | 2 | 0.6% |
| $10,000 to $14,999 | 11 | 3.4% |
| $15,000 to $24,999 | 11 | 3.4% |
| $25,000 to $34,999 | 3 | 0.9% |
| $35,000 to $49,999 | 16 | 5.0% |
| $50,000 to $74,999 | 78 | 24.4% |
| $75,000 to $99,999 | 43 | 13.4% |
| $100,000 to $149,999 | 62 | 19.4% |
| $150,000 to $199,999 | 37 | 11.6% |
| $200,000+ | 57 | 17.8% |
Household Income by Householder Age in Langdon Place
The median household income in Langdon Place is $99,091, with the highest median household income of $116,875 found in the 45 to 64 years age bracket for the primary householder. A total of 113 households (35.3%) fall into this category.
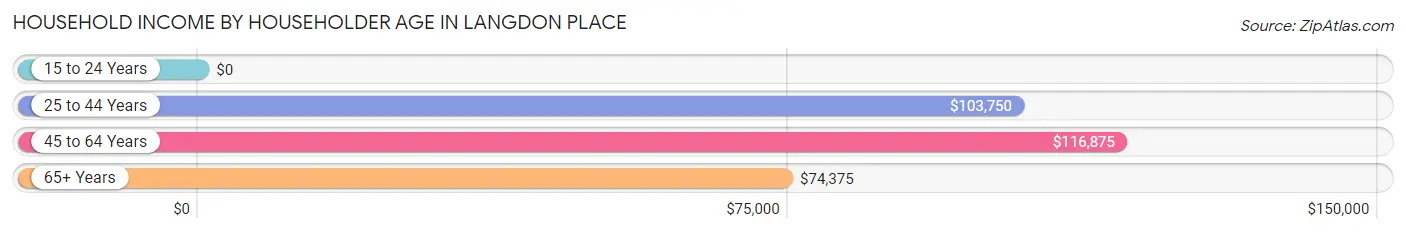
| Income Bracket | # Households | Median Income |
| 15 to 24 Years | 0 (0.0%) | $0 |
| 25 to 44 Years | 120 (37.5%) | $103,750 |
| 45 to 64 Years | 113 (35.3%) | $116,875 |
| 65+ Years | 87 (27.2%) | $74,375 |
| Total | 320 (100.0%) | $99,091 |
Poverty in Langdon Place
Income Below Poverty by Sex and Age in Langdon Place
With 1.6% poverty level for males and 3.0% for females among the residents of Langdon Place, 18 to 24 year old males and 55 to 64 year old females are the most vulnerable to poverty, with 1 males (16.7%) and 9 females (14.5%) in their respective age groups living below the poverty level.
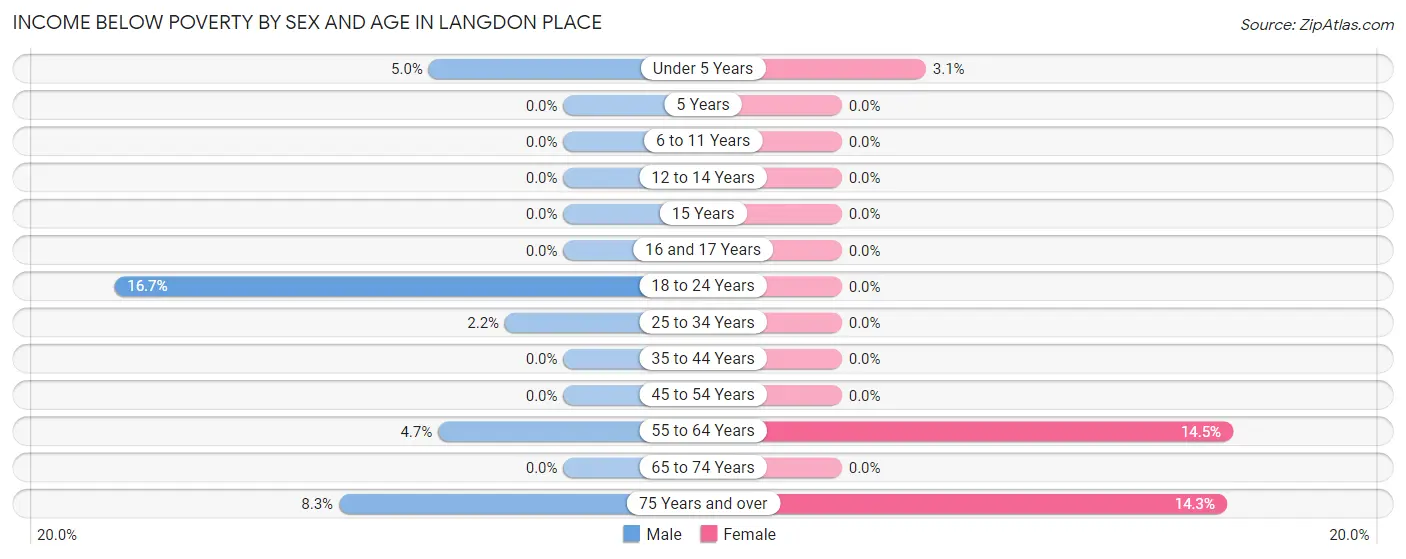
| Age Bracket | Male | Female |
| Under 5 Years | 1 (5.0%) | 1 (3.1%) |
| 5 Years | 0 (0.0%) | 0 (0.0%) |
| 6 to 11 Years | 0 (0.0%) | 0 (0.0%) |
| 12 to 14 Years | 0 (0.0%) | 0 (0.0%) |
| 15 Years | 0 (0.0%) | 0 (0.0%) |
| 16 and 17 Years | 0 (0.0%) | 0 (0.0%) |
| 18 to 24 Years | 1 (16.7%) | 0 (0.0%) |
| 25 to 34 Years | 1 (2.2%) | 0 (0.0%) |
| 35 to 44 Years | 0 (0.0%) | 0 (0.0%) |
| 45 to 54 Years | 0 (0.0%) | 0 (0.0%) |
| 55 to 64 Years | 2 (4.6%) | 9 (14.5%) |
| 65 to 74 Years | 0 (0.0%) | 0 (0.0%) |
| 75 Years and over | 2 (8.3%) | 5 (14.3%) |
| Total | 7 (1.6%) | 15 (3.0%) |
Income Above Poverty by Sex and Age in Langdon Place
According to the poverty statistics in Langdon Place, males aged 5 years and females aged 5 years are the age groups that are most secure financially, with 100.0% of males and 100.0% of females in these age groups living above the poverty line.
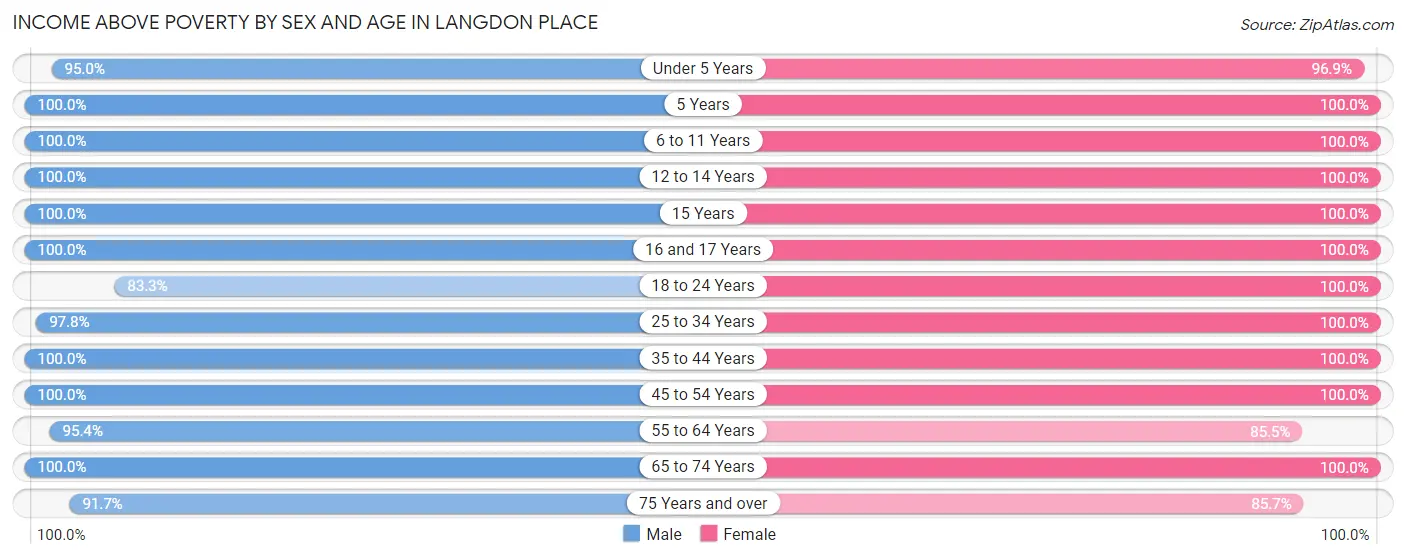
| Age Bracket | Male | Female |
| Under 5 Years | 19 (95.0%) | 31 (96.9%) |
| 5 Years | 34 (100.0%) | 10 (100.0%) |
| 6 to 11 Years | 20 (100.0%) | 44 (100.0%) |
| 12 to 14 Years | 35 (100.0%) | 28 (100.0%) |
| 15 Years | 1 (100.0%) | 41 (100.0%) |
| 16 and 17 Years | 11 (100.0%) | 16 (100.0%) |
| 18 to 24 Years | 5 (83.3%) | 13 (100.0%) |
| 25 to 34 Years | 45 (97.8%) | 55 (100.0%) |
| 35 to 44 Years | 107 (100.0%) | 78 (100.0%) |
| 45 to 54 Years | 33 (100.0%) | 25 (100.0%) |
| 55 to 64 Years | 41 (95.4%) | 53 (85.5%) |
| 65 to 74 Years | 46 (100.0%) | 68 (100.0%) |
| 75 Years and over | 22 (91.7%) | 30 (85.7%) |
| Total | 419 (98.4%) | 492 (97.0%) |
Income Below Poverty Among Married-Couple Families in Langdon Place
The poverty statistics for married-couple families in Langdon Place show that 1.0% or 2 of the total 200 families live below the poverty line. Families with no children have the highest poverty rate of 1.9%, comprising of 2 families. On the other hand, families with 1 or 2 children have the lowest poverty rate of 0.0%, which includes 0 families.
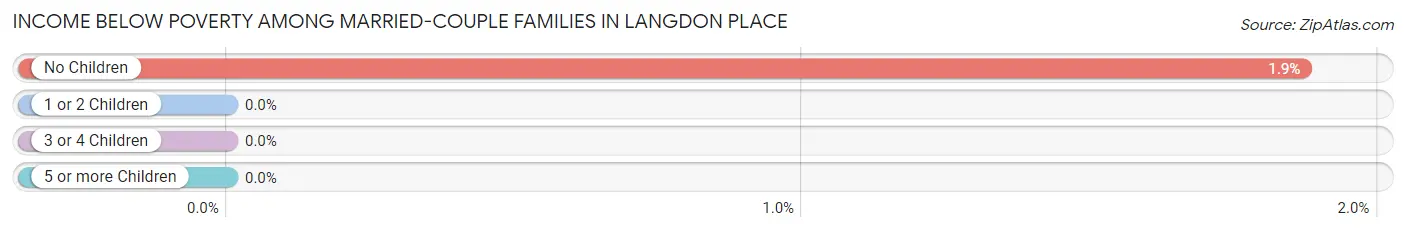
| Children | Above Poverty | Below Poverty |
| No Children | 105 (98.1%) | 2 (1.9%) |
| 1 or 2 Children | 57 (100.0%) | 0 (0.0%) |
| 3 or 4 Children | 36 (100.0%) | 0 (0.0%) |
| 5 or more Children | 0 (0.0%) | 0 (0.0%) |
| Total | 198 (99.0%) | 2 (1.0%) |
Income Below Poverty Among Single-Parent Households in Langdon Place
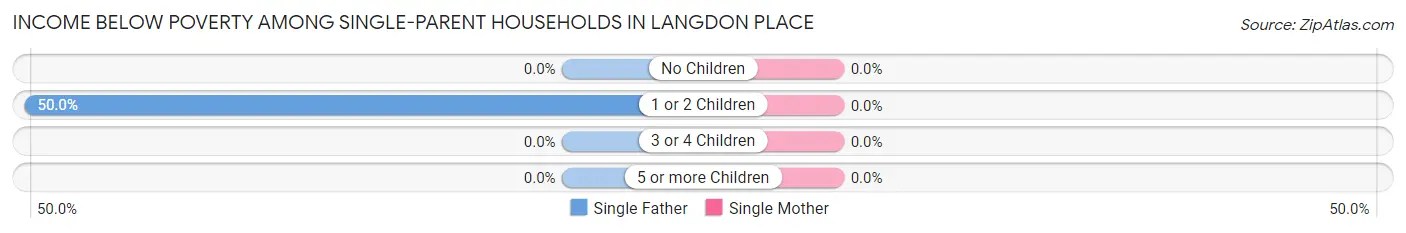
| Children | Single Father | Single Mother |
| No Children | 0 (0.0%) | 0 (0.0%) |
| 1 or 2 Children | 1 (50.0%) | 0 (0.0%) |
| 3 or 4 Children | 0 (0.0%) | 0 (0.0%) |
| 5 or more Children | 0 (0.0%) | 0 (0.0%) |
| Total | 1 (10.0%) | 0 (0.0%) |
Income Below Poverty Among Married-Couple vs Single-Parent Households in Langdon Place
The poverty data for Langdon Place shows that 2 of the married-couple family households (1.0%) and 1 of the single-parent households (3.7%) are living below the poverty level. Within the married-couple family households, those with no children have the highest poverty rate, with 2 households (1.9%) falling below the poverty line. Among the single-parent households, those with 1 or 2 children have the highest poverty rate, with 1 household (6.7%) living below poverty.
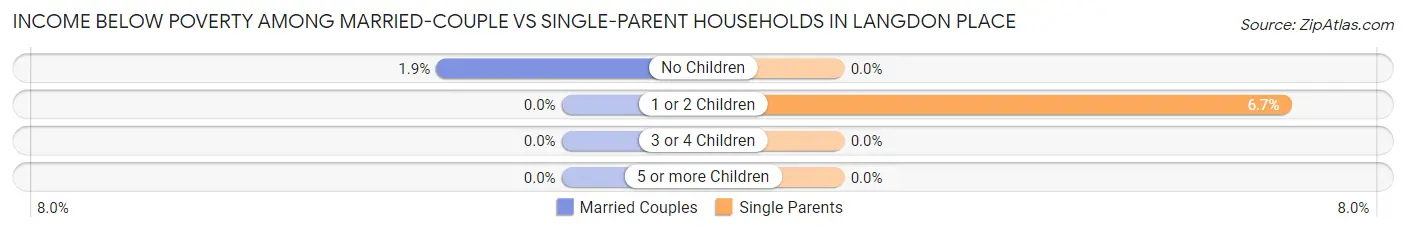
| Children | Married-Couple Families | Single-Parent Households |
| No Children | 2 (1.9%) | 0 (0.0%) |
| 1 or 2 Children | 0 (0.0%) | 1 (6.7%) |
| 3 or 4 Children | 0 (0.0%) | 0 (0.0%) |
| 5 or more Children | 0 (0.0%) | 0 (0.0%) |
| Total | 2 (1.0%) | 1 (3.7%) |
Race in Langdon Place
The most populous races in Langdon Place are White / Caucasian (696 | 74.6%), Asian (108 | 11.6%), and Black / African American (80 | 8.6%).
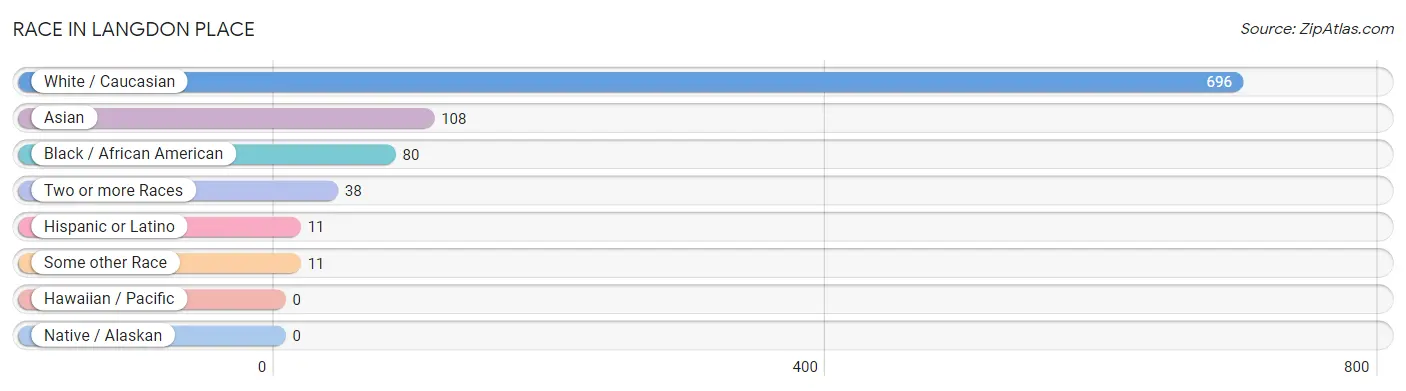
| Race | # Population | % Population |
| Asian | 108 | 11.6% |
| Black / African American | 80 | 8.6% |
| Hawaiian / Pacific | 0 | 0.0% |
| Hispanic or Latino | 11 | 1.2% |
| Native / Alaskan | 0 | 0.0% |
| White / Caucasian | 696 | 74.6% |
| Two or more Races | 38 | 4.1% |
| Some other Race | 11 | 1.2% |
| Total | 933 | 100.0% |
Ancestry in Langdon Place
The most populous ancestries reported in Langdon Place are Irish (206 | 22.1%), American (162 | 17.4%), German (147 | 15.8%), Indian (Asian) (98 | 10.5%), and English (88 | 9.4%), together accounting for 75.1% of all Langdon Place residents.
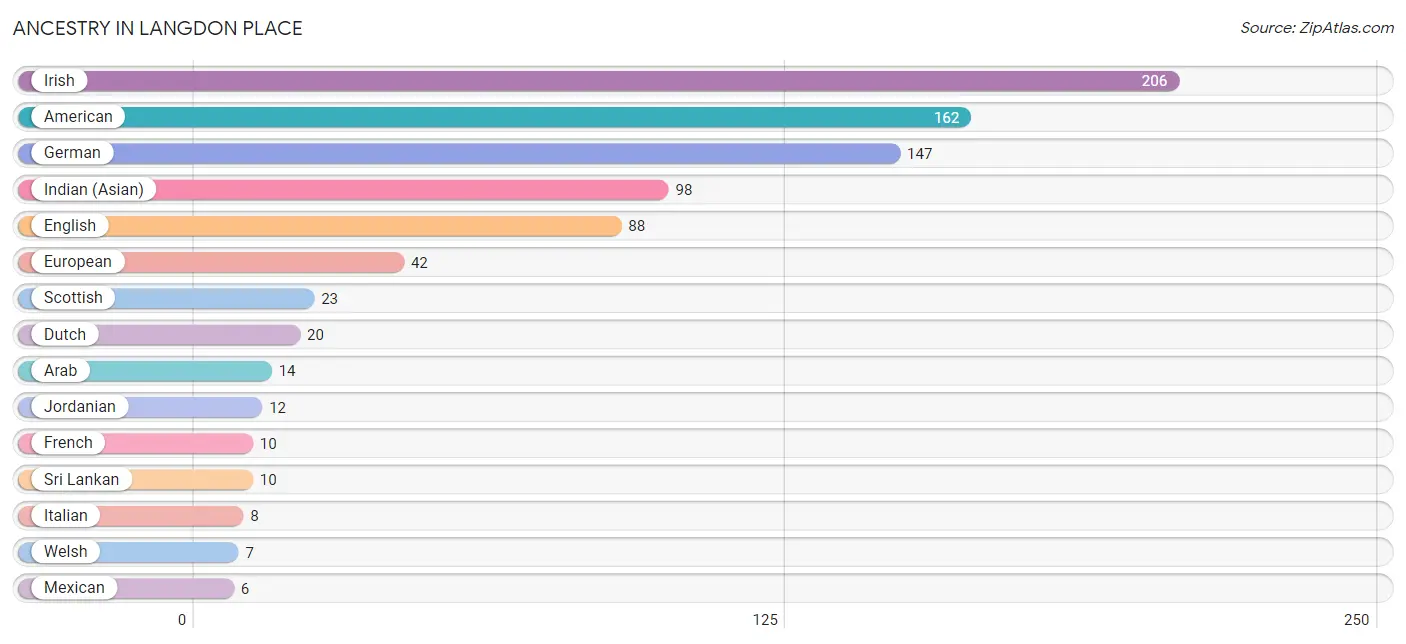
| Ancestry | # Population | % Population |
| American | 162 | 17.4% |
| Arab | 14 | 1.5% |
| Austrian | 1 | 0.1% |
| Bhutanese | 3 | 0.3% |
| Bolivian | 1 | 0.1% |
| British | 4 | 0.4% |
| Bulgarian | 3 | 0.3% |
| Cuban | 4 | 0.4% |
| Czech | 2 | 0.2% |
| Dutch | 20 | 2.1% |
| English | 88 | 9.4% |
| European | 42 | 4.5% |
| French | 10 | 1.1% |
| German | 147 | 15.8% |
| Hungarian | 5 | 0.5% |
| Indian (Asian) | 98 | 10.5% |
| Irish | 206 | 22.1% |
| Italian | 8 | 0.9% |
| Jordanian | 12 | 1.3% |
| Lebanese | 2 | 0.2% |
| Mexican | 6 | 0.6% |
| Norwegian | 2 | 0.2% |
| Polish | 3 | 0.3% |
| Romanian | 1 | 0.1% |
| Russian | 3 | 0.3% |
| Scotch-Irish | 5 | 0.5% |
| Scottish | 23 | 2.5% |
| South American | 1 | 0.1% |
| Sri Lankan | 10 | 1.1% |
| Swedish | 2 | 0.2% |
| Swiss | 5 | 0.5% |
| Thai | 6 | 0.6% |
| Ukrainian | 5 | 0.5% |
| Welsh | 7 | 0.7% | View All 34 Rows |
Immigrants in Langdon Place
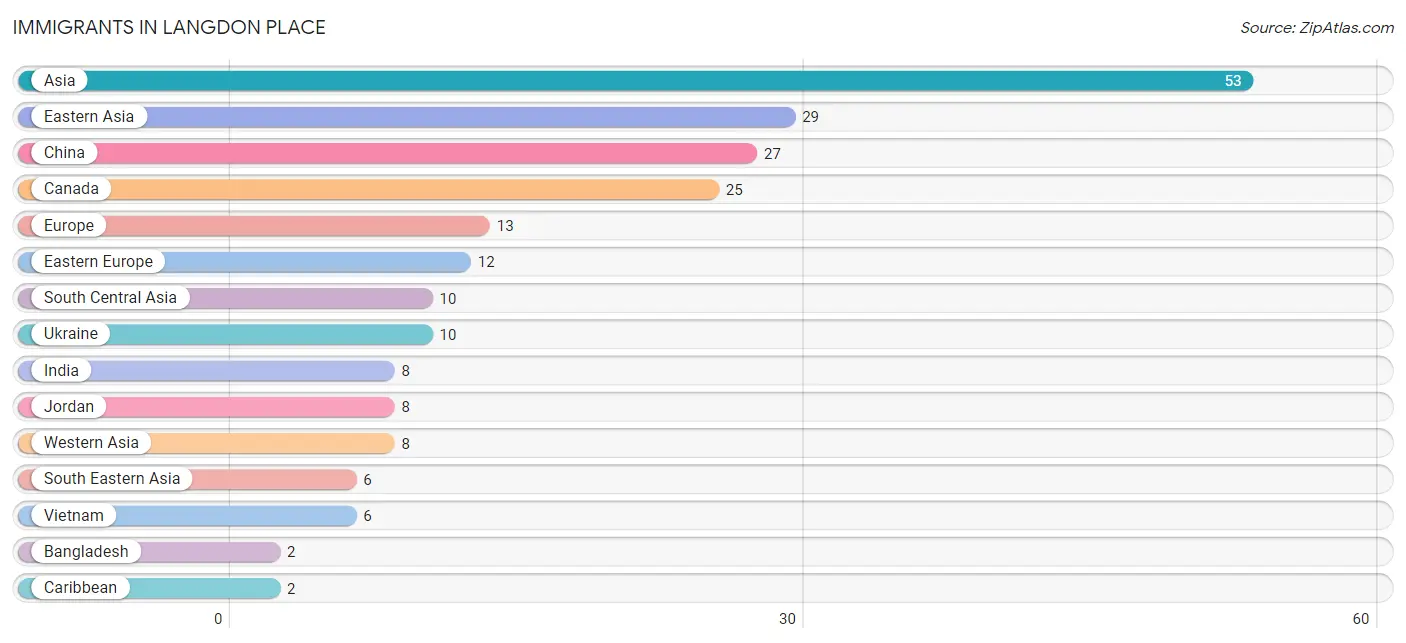
The most numerous immigrant groups reported in Langdon Place came from Asia (53 | 5.7%), Eastern Asia (29 | 3.1%), China (27 | 2.9%), Canada (25 | 2.7%), and Europe (13 | 1.4%), together accounting for 15.8% of all Langdon Place residents.
| Immigration Origin | # Population | % Population |
| Asia | 53 | 5.7% |
| Bangladesh | 2 | 0.2% |
| Bulgaria | 1 | 0.1% |
| Canada | 25 | 2.7% |
| Caribbean | 2 | 0.2% |
| China | 27 | 2.9% |
| Cuba | 2 | 0.2% |
| Eastern Asia | 29 | 3.1% |
| Eastern Europe | 12 | 1.3% |
| Europe | 13 | 1.4% |
| India | 8 | 0.9% |
| Japan | 2 | 0.2% |
| Jordan | 8 | 0.9% |
| Latin America | 2 | 0.2% |
| Northern Europe | 1 | 0.1% |
| Romania | 1 | 0.1% |
| Scotland | 1 | 0.1% |
| South Central Asia | 10 | 1.1% |
| South Eastern Asia | 6 | 0.6% |
| Ukraine | 10 | 1.1% |
| Vietnam | 6 | 0.6% |
| Western Asia | 8 | 0.9% | View All 22 Rows |
Sex and Age in Langdon Place
Sex and Age in Langdon Place
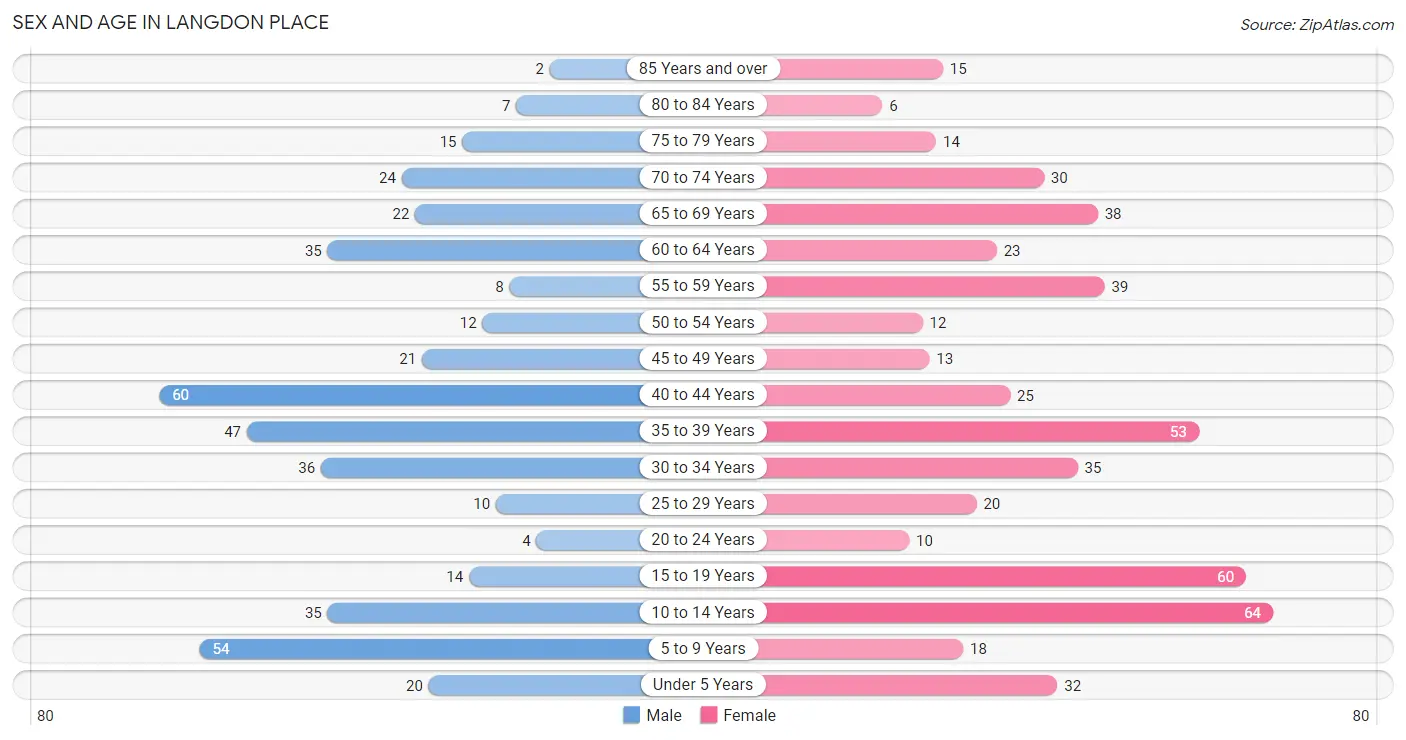
The most populous age groups in Langdon Place are 40 to 44 Years (60 | 14.1%) for men and 10 to 14 Years (64 | 12.6%) for women.
| Age Bracket | Male | Female |
| Under 5 Years | 20 (4.7%) | 32 (6.3%) |
| 5 to 9 Years | 54 (12.7%) | 18 (3.5%) |
| 10 to 14 Years | 35 (8.2%) | 64 (12.6%) |
| 15 to 19 Years | 14 (3.3%) | 60 (11.8%) |
| 20 to 24 Years | 4 (0.9%) | 10 (2.0%) |
| 25 to 29 Years | 10 (2.4%) | 20 (3.9%) |
| 30 to 34 Years | 36 (8.5%) | 35 (6.9%) |
| 35 to 39 Years | 47 (11.0%) | 53 (10.4%) |
| 40 to 44 Years | 60 (14.1%) | 25 (4.9%) |
| 45 to 49 Years | 21 (4.9%) | 13 (2.6%) |
| 50 to 54 Years | 12 (2.8%) | 12 (2.4%) |
| 55 to 59 Years | 8 (1.9%) | 39 (7.7%) |
| 60 to 64 Years | 35 (8.2%) | 23 (4.5%) |
| 65 to 69 Years | 22 (5.2%) | 38 (7.5%) |
| 70 to 74 Years | 24 (5.6%) | 30 (5.9%) |
| 75 to 79 Years | 15 (3.5%) | 14 (2.8%) |
| 80 to 84 Years | 7 (1.6%) | 6 (1.2%) |
| 85 Years and over | 2 (0.5%) | 15 (3.0%) |
| Total | 426 (100.0%) | 507 (100.0%) |
Families and Households in Langdon Place
Median Family Size in Langdon Place
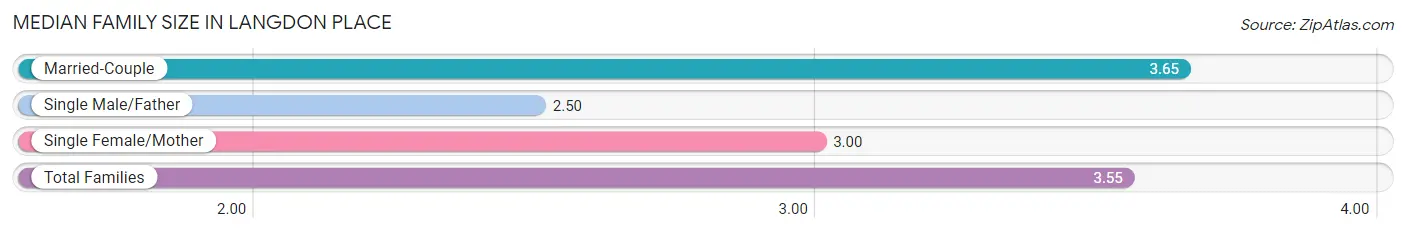
The median family size in Langdon Place is 3.55 persons per family, with married-couple families (200 | 88.1%) accounting for the largest median family size of 3.65 persons per family. On the other hand, single male/father families (10 | 4.4%) represent the smallest median family size with 2.50 persons per family.
| Family Type | # Families | Family Size |
| Married-Couple | 200 (88.1%) | 3.65 |
| Single Male/Father | 10 (4.4%) | 2.50 |
| Single Female/Mother | 17 (7.5%) | 3.00 |
| Total Families | 227 (100.0%) | 3.55 |
Median Household Size in Langdon Place
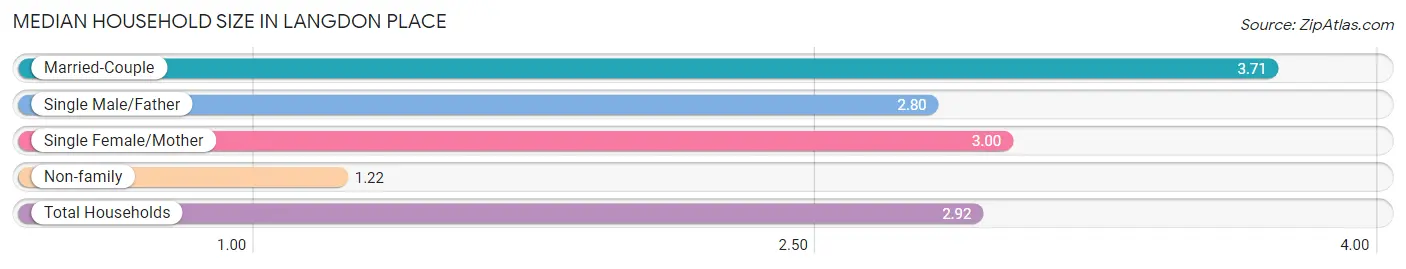
The median household size in Langdon Place is 2.92 persons per household, with married-couple households (200 | 62.5%) accounting for the largest median household size of 3.71 persons per household. non-family households (93 | 29.1%) represent the smallest median household size with 1.22 persons per household.
| Household Type | # Households | Household Size |
| Married-Couple | 200 (62.5%) | 3.71 |
| Single Male/Father | 10 (3.1%) | 2.80 |
| Single Female/Mother | 17 (5.3%) | 3.00 |
| Non-family | 93 (29.1%) | 1.22 |
| Total Households | 320 (100.0%) | 2.92 |
Household Size by Marriage Status in Langdon Place
Out of a total of 320 households in Langdon Place, 227 (70.9%) are family households, while 93 (29.1%) are nonfamily households. The most numerous type of family households are 2-person households, comprising 95, and the most common type of nonfamily households are 1-person households, comprising 74.
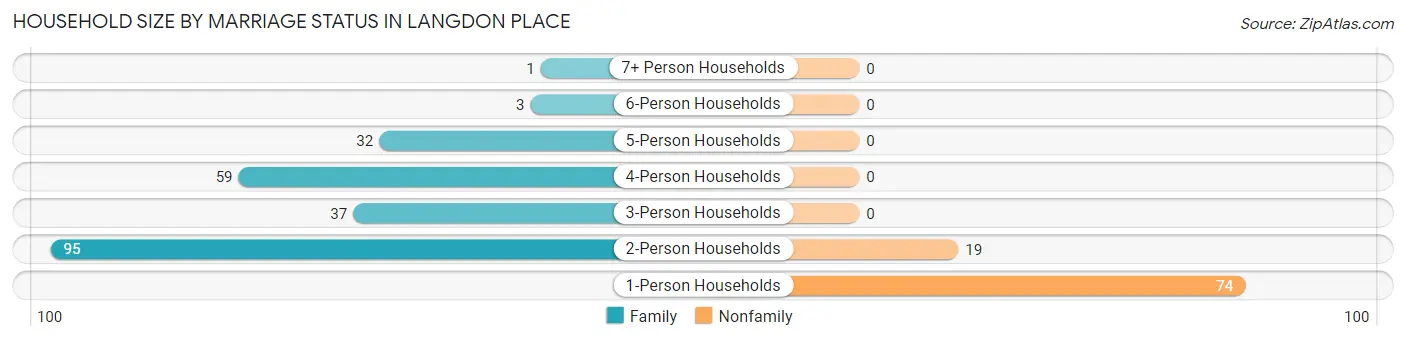
| Household Size | Family Households | Nonfamily Households |
| 1-Person Households | - | 74 (23.1%) |
| 2-Person Households | 95 (29.7%) | 19 (5.9%) |
| 3-Person Households | 37 (11.6%) | 0 (0.0%) |
| 4-Person Households | 59 (18.4%) | 0 (0.0%) |
| 5-Person Households | 32 (10.0%) | 0 (0.0%) |
| 6-Person Households | 3 (0.9%) | 0 (0.0%) |
| 7+ Person Households | 1 (0.3%) | 0 (0.0%) |
| Total | 227 (70.9%) | 93 (29.1%) |
Female Fertility in Langdon Place
Fertility by Age in Langdon Place
Average fertility rate in Langdon Place is 50.0 births per 1,000 women. Women in the age bracket of 20 to 34 years have the highest fertility rate with 92.0 births per 1,000 women. Women in the age bracket of 20 to 34 years acount for 54.5% of all women with births.
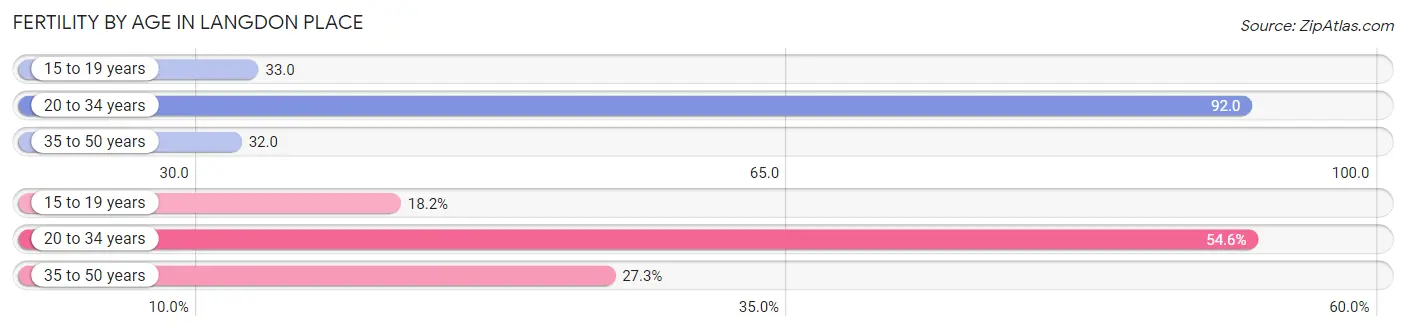
| Age Bracket | Women with Births | Births / 1,000 Women |
| 15 to 19 years | 2 (18.2%) | 33.0 |
| 20 to 34 years | 6 (54.5%) | 92.0 |
| 35 to 50 years | 3 (27.3%) | 32.0 |
| Total | 11 (100.0%) | 50.0 |
Fertility by Age by Marriage Status in Langdon Place
72.7% of women with births (11) in Langdon Place are married. The highest percentage of unmarried women with births falls into 15 to 19 years age bracket with 100.0% of them unmarried at the time of birth, while the lowest percentage of unmarried women with births belong to 35 to 50 years age bracket with 0.0% of them unmarried.
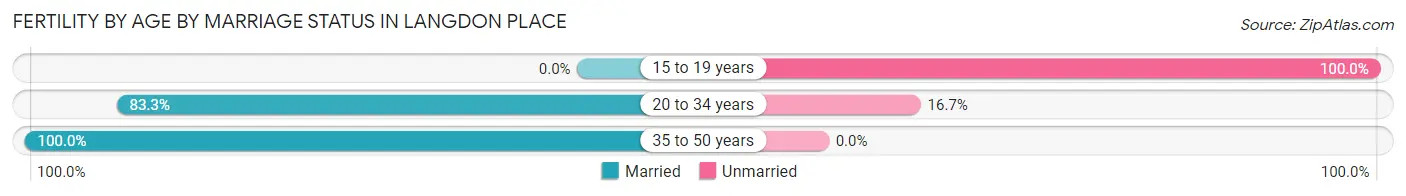
| Age Bracket | Married | Unmarried |
| 15 to 19 years | 0 (0.0%) | 2 (100.0%) |
| 20 to 34 years | 5 (83.3%) | 1 (16.7%) |
| 35 to 50 years | 3 (100.0%) | 0 (0.0%) |
| Total | 8 (72.7%) | 3 (27.3%) |
Fertility by Education in Langdon Place
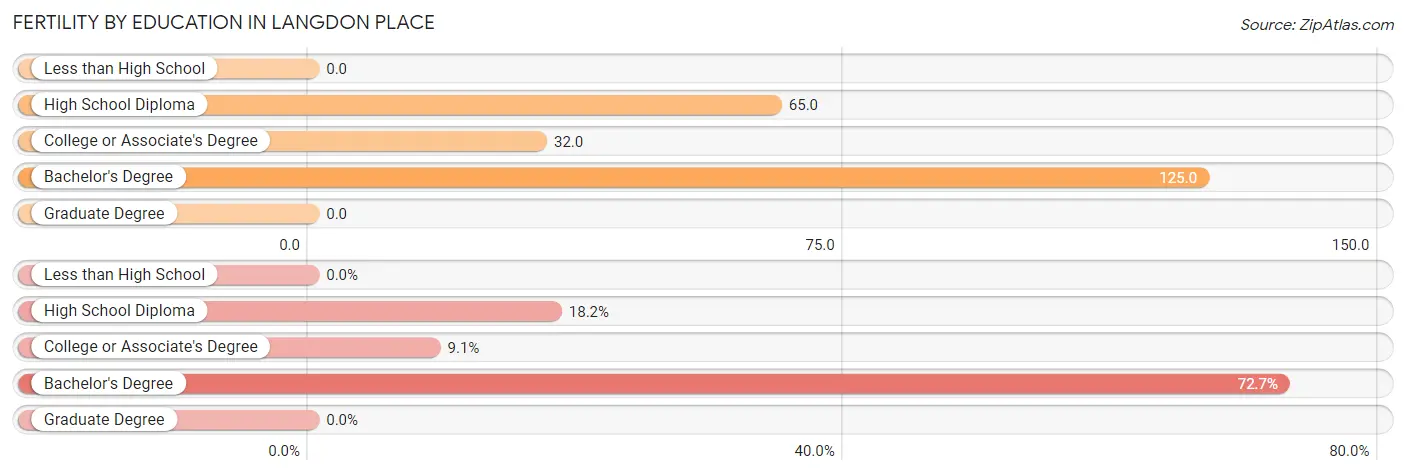
| Educational Attainment | Women with Births | Births / 1,000 Women |
| Less than High School | 0 (0.0%) | 0.0 |
| High School Diploma | 2 (18.2%) | 65.0 |
| College or Associate's Degree | 1 (9.1%) | 32.0 |
| Bachelor's Degree | 8 (72.7%) | 125.0 |
| Graduate Degree | 0 (0.0%) | 0.0 |
| Total | 11 (100.0%) | 50.0 |
Fertility by Education by Marriage Status in Langdon Place
27.3% of women with births in Langdon Place are unmarried. Women with the educational attainment of bachelor's degree are most likely to be married with 100.0% of them married at childbirth, while women with the educational attainment of high school diploma are least likely to be married with 100.0% of them unmarried at childbirth.
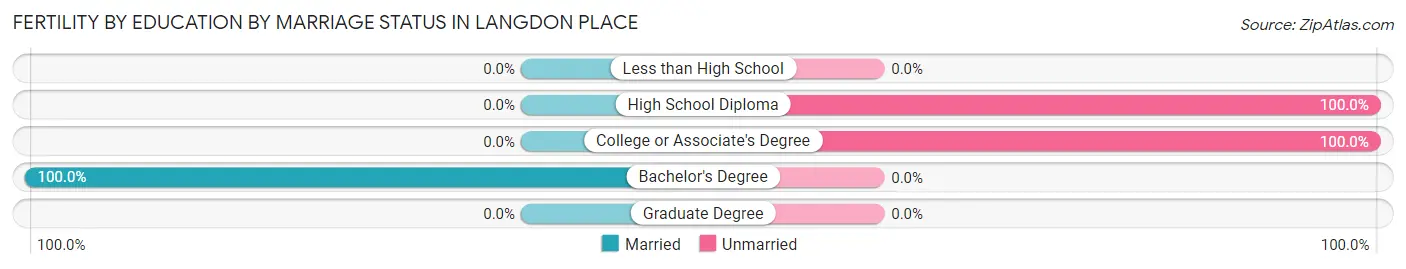
| Educational Attainment | Married | Unmarried |
| Less than High School | 0 (0.0%) | 0 (0.0%) |
| High School Diploma | 0 (0.0%) | 2 (100.0%) |
| College or Associate's Degree | 0 (0.0%) | 1 (100.0%) |
| Bachelor's Degree | 8 (100.0%) | 0 (0.0%) |
| Graduate Degree | 0 (0.0%) | 0 (0.0%) |
| Total | 8 (72.7%) | 3 (27.3%) |
Employment Characteristics in Langdon Place
Employment by Class of Employer in Langdon Place
Among the 485 employed individuals in Langdon Place, private company employees (321 | 66.2%), not-for-profit organizations (61 | 12.6%), and self-employed (incorporated) (32 | 6.6%) make up the most common classes of employment.
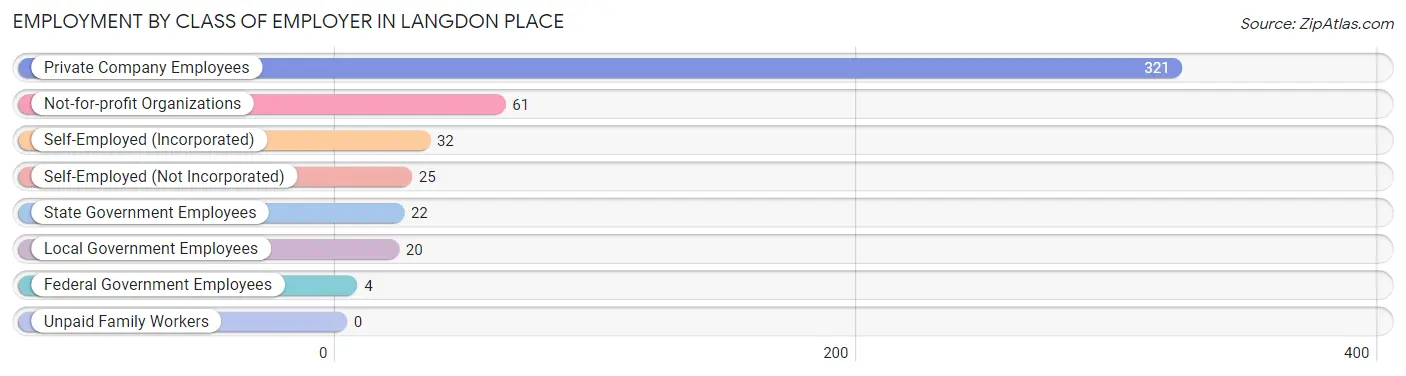
| Employer Class | # Employees | % Employees |
| Private Company Employees | 321 | 66.2% |
| Self-Employed (Incorporated) | 32 | 6.6% |
| Self-Employed (Not Incorporated) | 25 | 5.1% |
| Not-for-profit Organizations | 61 | 12.6% |
| Local Government Employees | 20 | 4.1% |
| State Government Employees | 22 | 4.5% |
| Federal Government Employees | 4 | 0.8% |
| Unpaid Family Workers | 0 | 0.0% |
| Total | 485 | 100.0% |
Employment Status by Age in Langdon Place
According to the labor force statistics for Langdon Place, out of the total population over 16 years of age (668), 74.4% or 497 individuals are in the labor force, with 2.0% or 10 of them unemployed. The age group with the highest labor force participation rate is 25 to 29 years, with 100.0% or 30 individuals in the labor force. Within the labor force, the 25 to 29 years age range has the highest percentage of unemployed individuals, with 16.7% or 5 of them being unemployed.
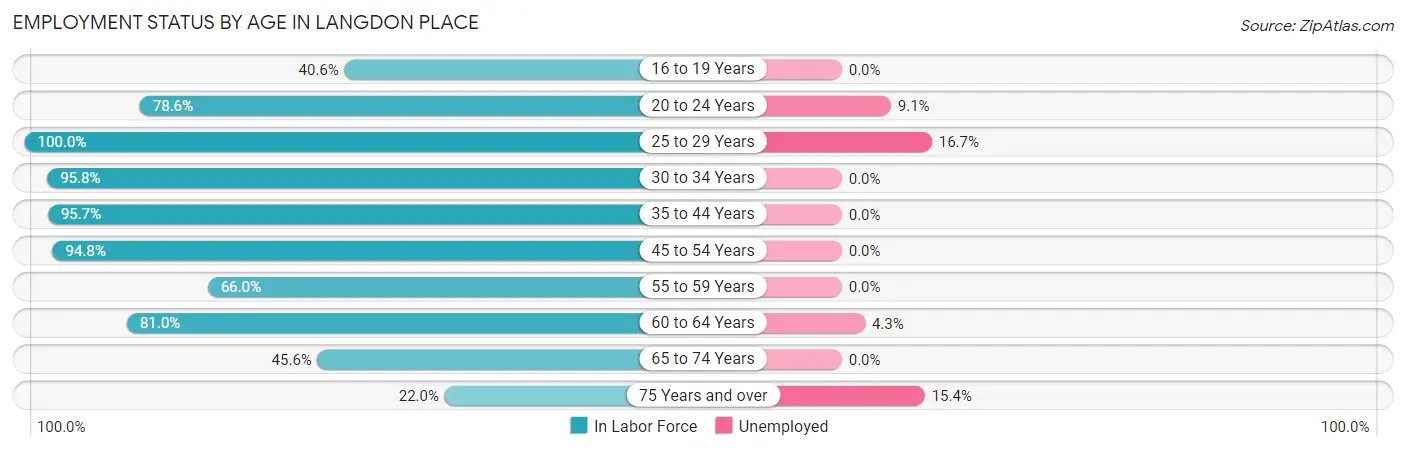
| Age Bracket | In Labor Force | Unemployed |
| 16 to 19 Years | 13 (40.6%) | 0 (0.0%) |
| 20 to 24 Years | 11 (78.6%) | 1 (9.1%) |
| 25 to 29 Years | 30 (100.0%) | 5 (16.7%) |
| 30 to 34 Years | 68 (95.8%) | 0 (0.0%) |
| 35 to 44 Years | 177 (95.7%) | 0 (0.0%) |
| 45 to 54 Years | 55 (94.8%) | 0 (0.0%) |
| 55 to 59 Years | 31 (66.0%) | 0 (0.0%) |
| 60 to 64 Years | 47 (81.0%) | 2 (4.3%) |
| 65 to 74 Years | 52 (45.6%) | 0 (0.0%) |
| 75 Years and over | 13 (22.0%) | 2 (15.4%) |
| Total | 497 (74.4%) | 10 (2.0%) |
Employment Status by Educational Attainment in Langdon Place
According to labor force statistics for Langdon Place, 90.9% of individuals (408) out of the total population between 25 and 64 years of age (449) are in the labor force, with 1.7% or 7 of them being unemployed. The group with the highest labor force participation rate are those with the educational attainment of bachelor's degree or higher, with 93.6% or 220 individuals in the labor force. Within the labor force, individuals with less than high school education have the highest percentage of unemployment, with 7.1% or 2 of them being unemployed.
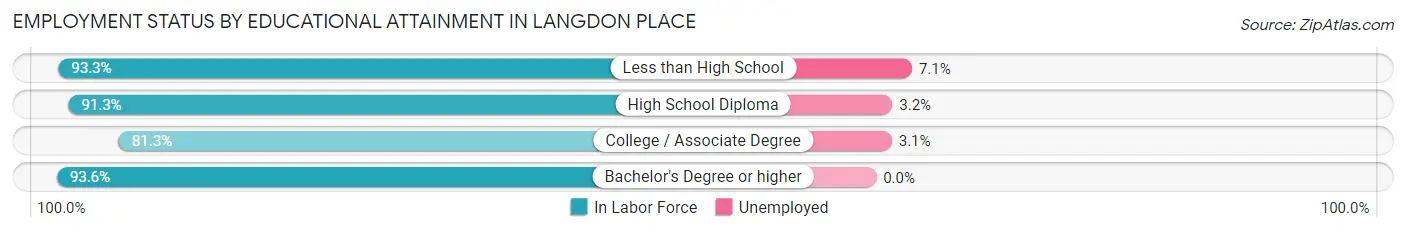
| Educational Attainment | In Labor Force | Unemployed |
| Less than High School | 28 (93.3%) | 2 (7.1%) |
| High School Diploma | 95 (91.3%) | 3 (3.2%) |
| College / Associate Degree | 65 (81.3%) | 2 (3.1%) |
| Bachelor's Degree or higher | 220 (93.6%) | 0 (0.0%) |
| Total | 408 (90.9%) | 8 (1.7%) |
Employment Occupations by Sex in Langdon Place
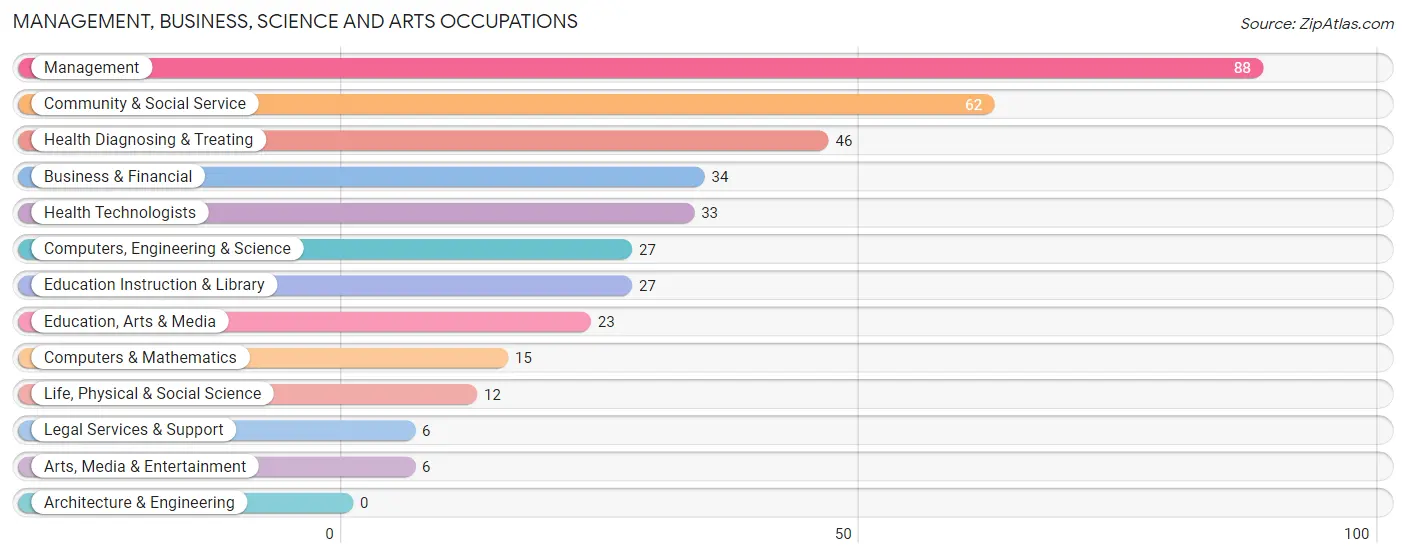
Management, Business, Science and Arts Occupations
The most common Management, Business, Science and Arts occupations in Langdon Place are Management (88 | 18.1%), Community & Social Service (62 | 12.7%), Health Diagnosing & Treating (46 | 9.5%), Business & Financial (34 | 7.0%), and Health Technologists (33 | 6.8%).
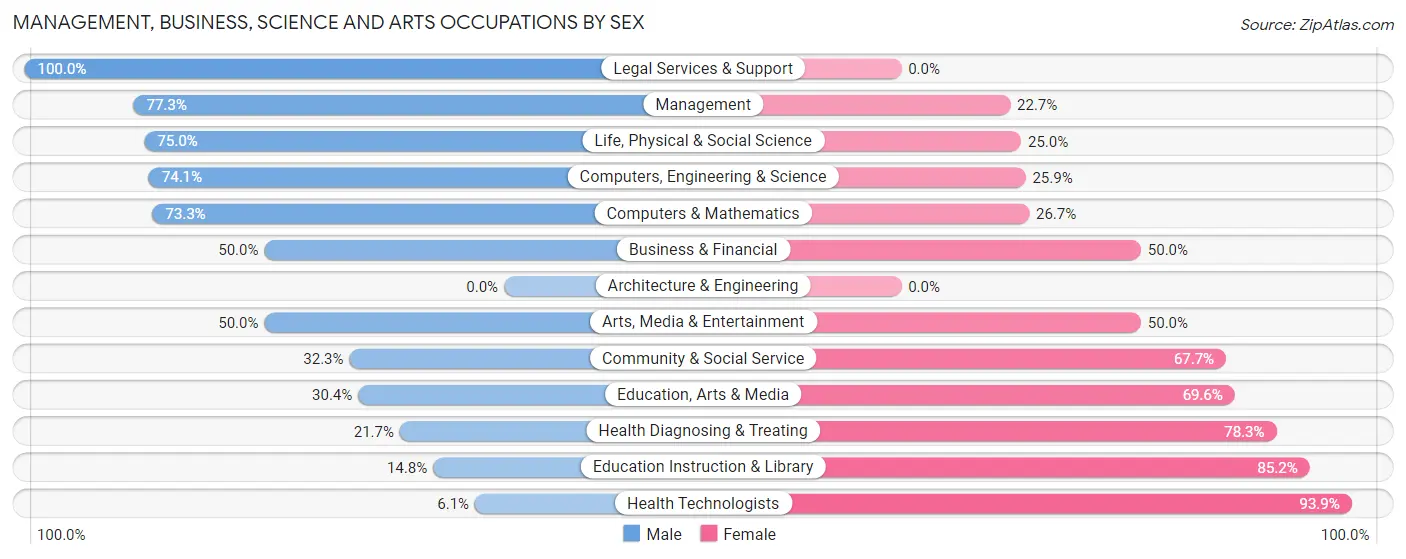
Management, Business, Science and Arts Occupations by Sex
Within the Management, Business, Science and Arts occupations in Langdon Place, the most male-oriented occupations are Legal Services & Support (100.0%), Management (77.3%), and Life, Physical & Social Science (75.0%), while the most female-oriented occupations are Health Technologists (93.9%), Education Instruction & Library (85.2%), and Health Diagnosing & Treating (78.3%).
| Occupation | Male | Female |
| Management | 68 (77.3%) | 20 (22.7%) |
| Business & Financial | 17 (50.0%) | 17 (50.0%) |
| Computers, Engineering & Science | 20 (74.1%) | 7 (25.9%) |
| Computers & Mathematics | 11 (73.3%) | 4 (26.7%) |
| Architecture & Engineering | 0 (0.0%) | 0 (0.0%) |
| Life, Physical & Social Science | 9 (75.0%) | 3 (25.0%) |
| Community & Social Service | 20 (32.3%) | 42 (67.7%) |
| Education, Arts & Media | 7 (30.4%) | 16 (69.6%) |
| Legal Services & Support | 6 (100.0%) | 0 (0.0%) |
| Education Instruction & Library | 4 (14.8%) | 23 (85.2%) |
| Arts, Media & Entertainment | 3 (50.0%) | 3 (50.0%) |
| Health Diagnosing & Treating | 10 (21.7%) | 36 (78.3%) |
| Health Technologists | 2 (6.1%) | 31 (93.9%) |
| Total (Category) | 135 (52.5%) | 122 (47.5%) |
| Total (Overall) | 256 (52.6%) | 231 (47.4%) |
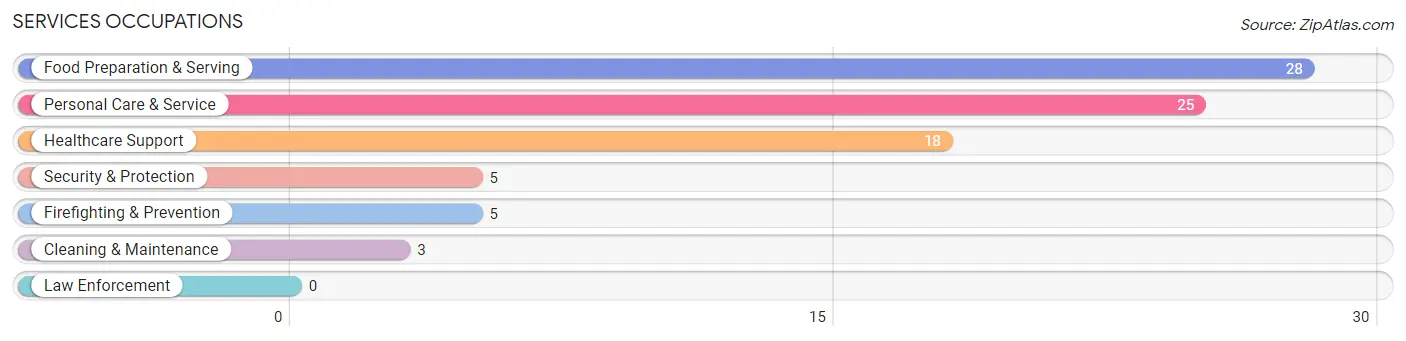
Services Occupations
The most common Services occupations in Langdon Place are Food Preparation & Serving (28 | 5.8%), Personal Care & Service (25 | 5.1%), Healthcare Support (18 | 3.7%), Security & Protection (5 | 1.0%), and Firefighting & Prevention (5 | 1.0%).
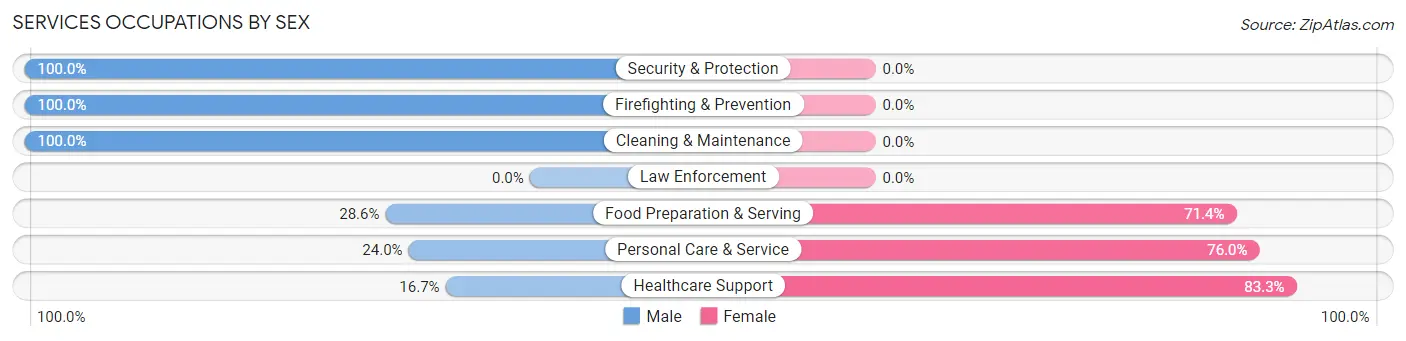
Services Occupations by Sex
Within the Services occupations in Langdon Place, the most male-oriented occupations are Security & Protection (100.0%), Firefighting & Prevention (100.0%), and Cleaning & Maintenance (100.0%), while the most female-oriented occupations are Healthcare Support (83.3%), Personal Care & Service (76.0%), and Food Preparation & Serving (71.4%).
| Occupation | Male | Female |
| Healthcare Support | 3 (16.7%) | 15 (83.3%) |
| Security & Protection | 5 (100.0%) | 0 (0.0%) |
| Firefighting & Prevention | 5 (100.0%) | 0 (0.0%) |
| Law Enforcement | 0 (0.0%) | 0 (0.0%) |
| Food Preparation & Serving | 8 (28.6%) | 20 (71.4%) |
| Cleaning & Maintenance | 3 (100.0%) | 0 (0.0%) |
| Personal Care & Service | 6 (24.0%) | 19 (76.0%) |
| Total (Category) | 25 (31.7%) | 54 (68.3%) |
| Total (Overall) | 256 (52.6%) | 231 (47.4%) |
Sales and Office Occupations
The most common Sales and Office occupations in Langdon Place are Office & Administration (62 | 12.7%), and Sales & Related (38 | 7.8%).
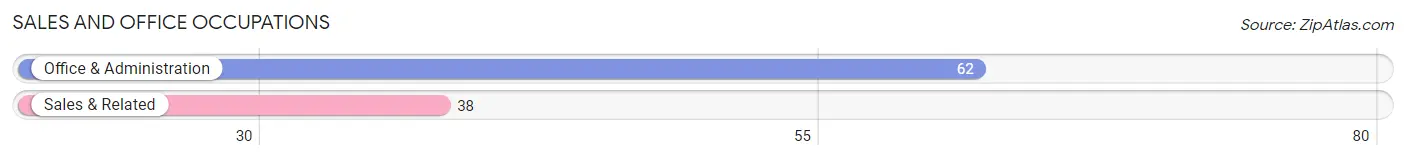
Sales and Office Occupations by Sex
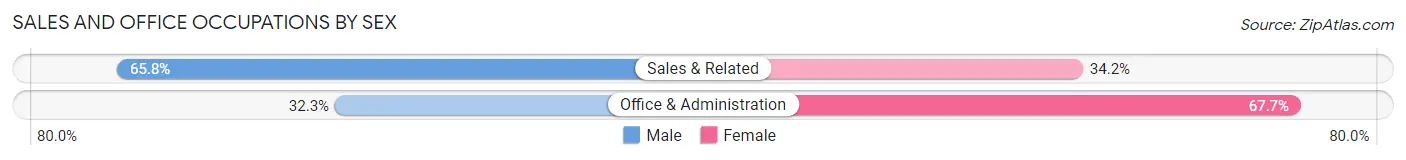
| Occupation | Male | Female |
| Sales & Related | 25 (65.8%) | 13 (34.2%) |
| Office & Administration | 20 (32.3%) | 42 (67.7%) |
| Total (Category) | 45 (45.0%) | 55 (55.0%) |
| Total (Overall) | 256 (52.6%) | 231 (47.4%) |
Natural Resources, Construction and Maintenance Occupations
The most common Natural Resources, Construction and Maintenance occupations in Langdon Place are Installation, Maintenance & Repair (9 | 1.8%), and Construction & Extraction (2 | 0.4%).
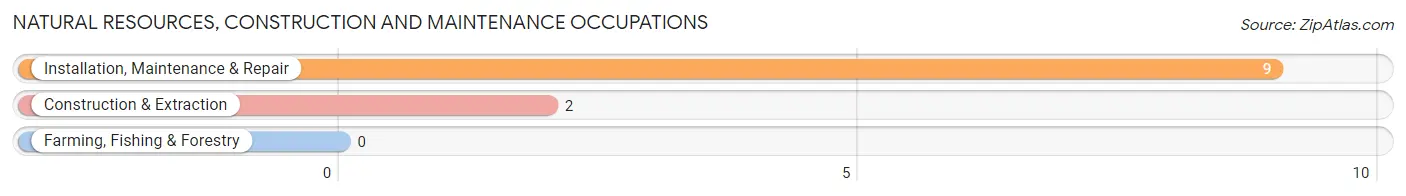
Natural Resources, Construction and Maintenance Occupations by Sex
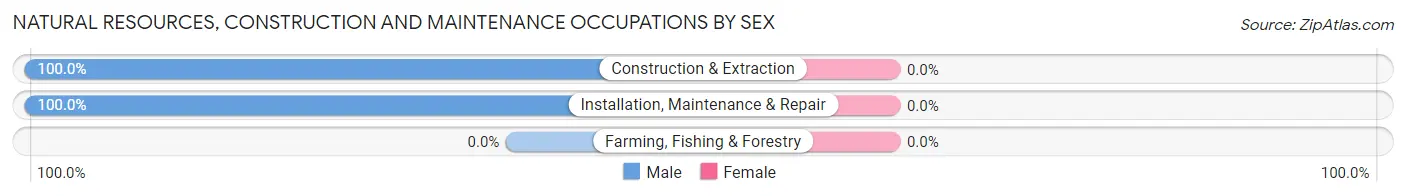
| Occupation | Male | Female |
| Farming, Fishing & Forestry | 0 (0.0%) | 0 (0.0%) |
| Construction & Extraction | 2 (100.0%) | 0 (0.0%) |
| Installation, Maintenance & Repair | 9 (100.0%) | 0 (0.0%) |
| Total (Category) | 11 (100.0%) | 0 (0.0%) |
| Total (Overall) | 256 (52.6%) | 231 (47.4%) |
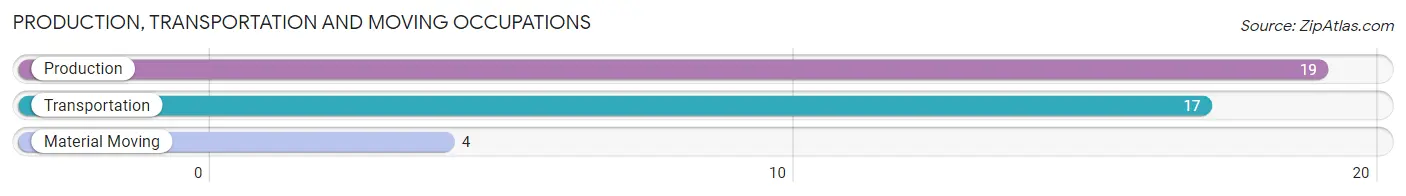
Production, Transportation and Moving Occupations
The most common Production, Transportation and Moving occupations in Langdon Place are Production (19 | 3.9%), Transportation (17 | 3.5%), and Material Moving (4 | 0.8%).
Production, Transportation and Moving Occupations by Sex
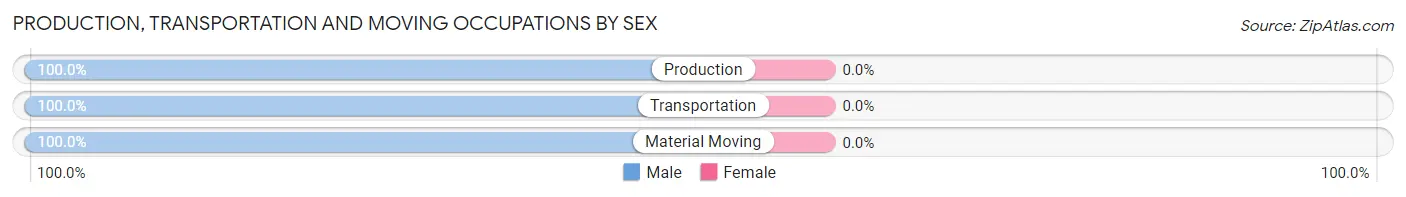
| Occupation | Male | Female |
| Production | 19 (100.0%) | 0 (0.0%) |
| Transportation | 17 (100.0%) | 0 (0.0%) |
| Material Moving | 4 (100.0%) | 0 (0.0%) |
| Total (Category) | 40 (100.0%) | 0 (0.0%) |
| Total (Overall) | 256 (52.6%) | 231 (47.4%) |
Employment Industries by Sex in Langdon Place
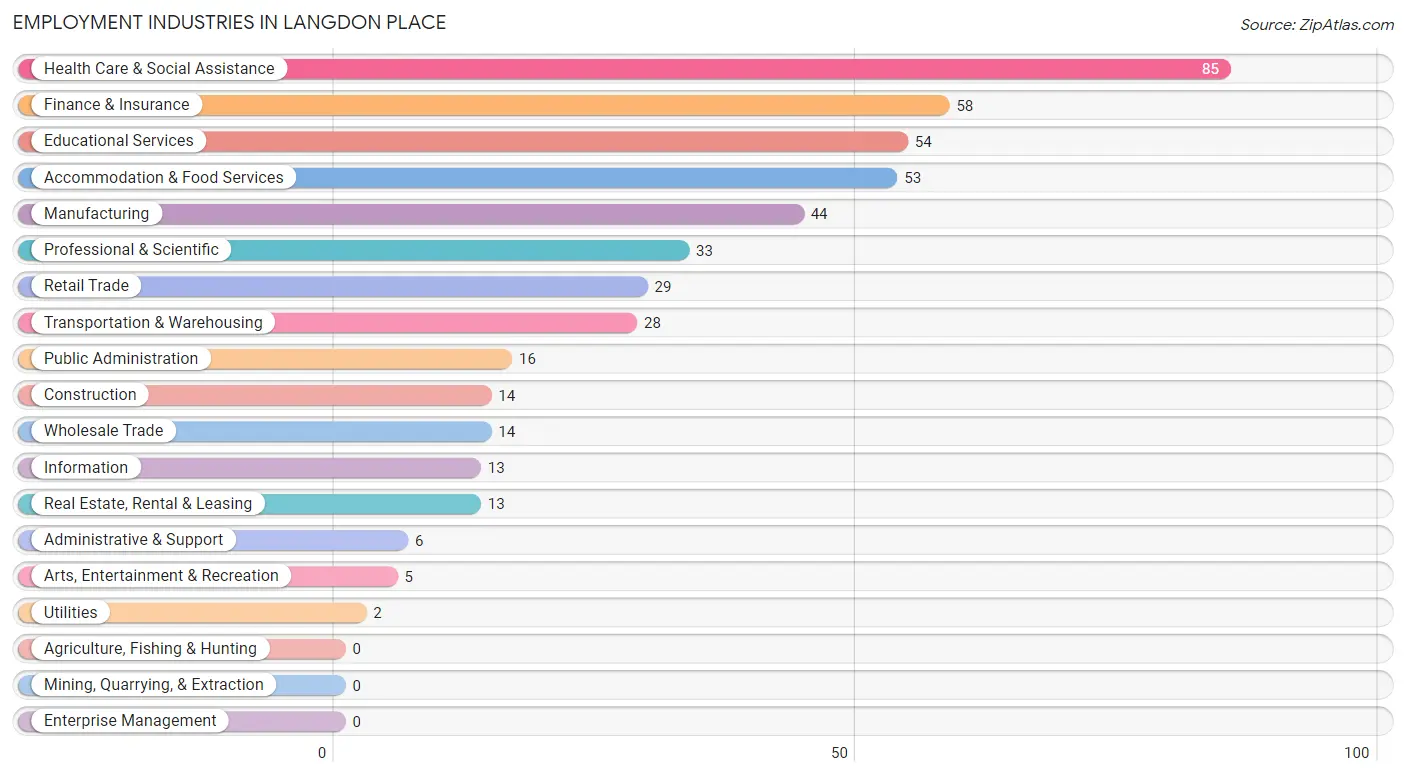
Employment Industries in Langdon Place
The major employment industries in Langdon Place include Health Care & Social Assistance (85 | 17.4%), Finance & Insurance (58 | 11.9%), Educational Services (54 | 11.1%), Accommodation & Food Services (53 | 10.9%), and Manufacturing (44 | 9.0%).
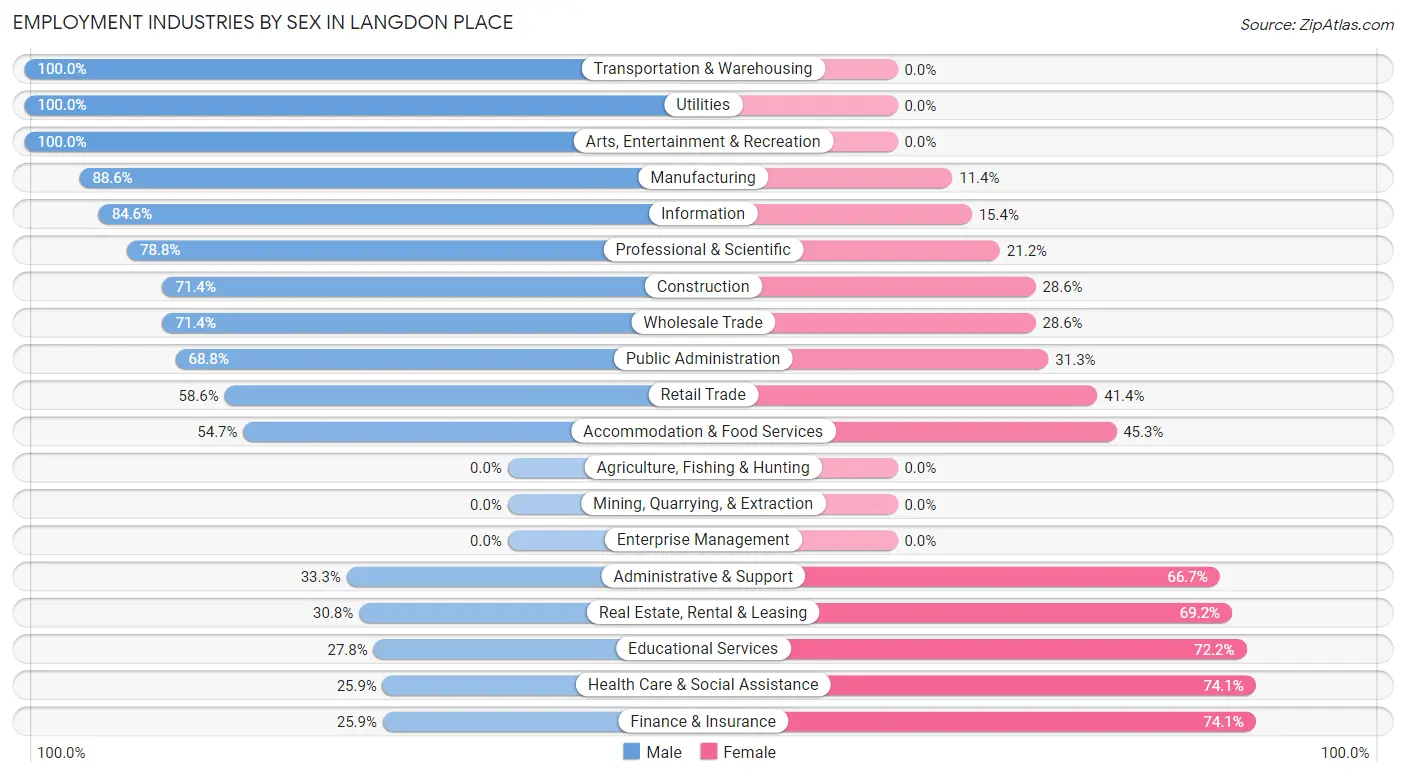
Employment Industries by Sex in Langdon Place
The Langdon Place industries that see more men than women are Transportation & Warehousing (100.0%), Utilities (100.0%), and Arts, Entertainment & Recreation (100.0%), whereas the industries that tend to have a higher number of women are Finance & Insurance (74.1%), Health Care & Social Assistance (74.1%), and Educational Services (72.2%).
| Industry | Male | Female |
| Agriculture, Fishing & Hunting | 0 (0.0%) | 0 (0.0%) |
| Mining, Quarrying, & Extraction | 0 (0.0%) | 0 (0.0%) |
| Construction | 10 (71.4%) | 4 (28.6%) |
| Manufacturing | 39 (88.6%) | 5 (11.4%) |
| Wholesale Trade | 10 (71.4%) | 4 (28.6%) |
| Retail Trade | 17 (58.6%) | 12 (41.4%) |
| Transportation & Warehousing | 28 (100.0%) | 0 (0.0%) |
| Utilities | 2 (100.0%) | 0 (0.0%) |
| Information | 11 (84.6%) | 2 (15.4%) |
| Finance & Insurance | 15 (25.9%) | 43 (74.1%) |
| Real Estate, Rental & Leasing | 4 (30.8%) | 9 (69.2%) |
| Professional & Scientific | 26 (78.8%) | 7 (21.2%) |
| Enterprise Management | 0 (0.0%) | 0 (0.0%) |
| Administrative & Support | 2 (33.3%) | 4 (66.7%) |
| Educational Services | 15 (27.8%) | 39 (72.2%) |
| Health Care & Social Assistance | 22 (25.9%) | 63 (74.1%) |
| Arts, Entertainment & Recreation | 5 (100.0%) | 0 (0.0%) |
| Accommodation & Food Services | 29 (54.7%) | 24 (45.3%) |
| Public Administration | 11 (68.8%) | 5 (31.2%) |
| Total | 256 (52.6%) | 231 (47.4%) |
Education in Langdon Place
School Enrollment in Langdon Place
The most common levels of schooling among the 261 students in Langdon Place are middle school (95 | 36.4%), high school (69 | 26.4%), and nursery / preschool (29 | 11.1%).
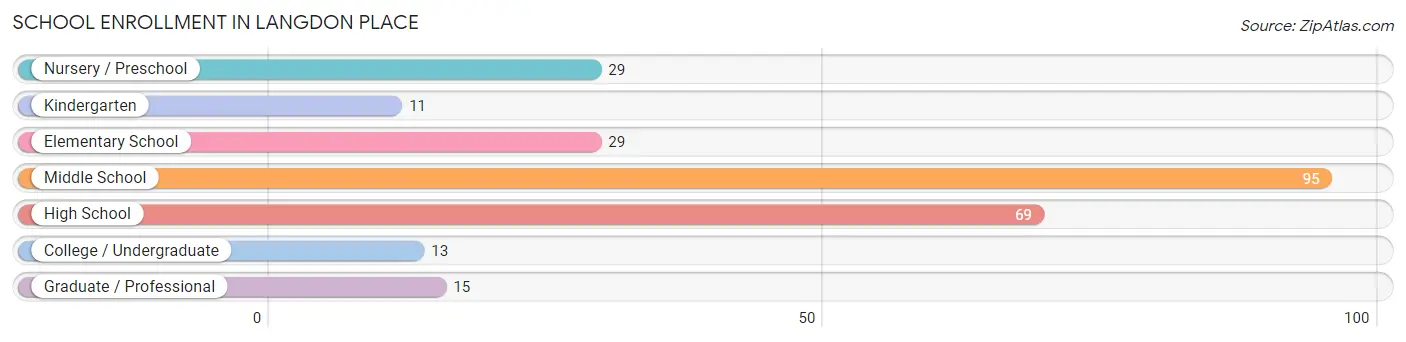
| School Level | # Students | % Students |
| Nursery / Preschool | 29 | 11.1% |
| Kindergarten | 11 | 4.2% |
| Elementary School | 29 | 11.1% |
| Middle School | 95 | 36.4% |
| High School | 69 | 26.4% |
| College / Undergraduate | 13 | 5.0% |
| Graduate / Professional | 15 | 5.8% |
| Total | 261 | 100.0% |
School Enrollment by Age by Funding Source in Langdon Place
Out of a total of 261 students who are enrolled in schools in Langdon Place, 56 (21.5%) attend a private institution, while the remaining 205 (78.5%) are enrolled in public schools. The age group of 3 to 4 year olds has the highest likelihood of being enrolled in private schools, with 7 (46.7% in the age bracket) enrolled. Conversely, the age group of 18 to 19 year olds has the lowest likelihood of being enrolled in a private school, with 1 (100.0% in the age bracket) attending a public institution.
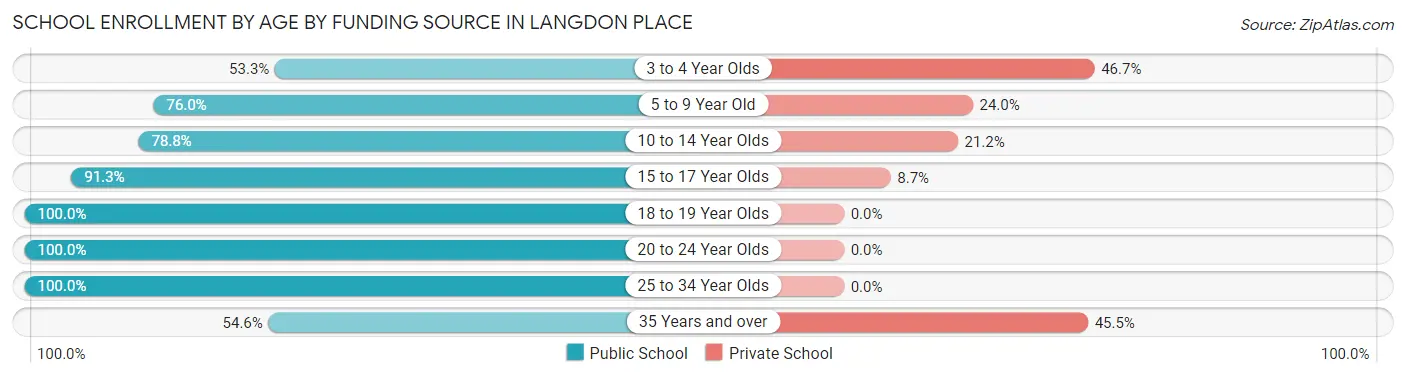
| Age Bracket | Public School | Private School |
| 3 to 4 Year Olds | 8 (53.3%) | 7 (46.7%) |
| 5 to 9 Year Old | 38 (76.0%) | 12 (24.0%) |
| 10 to 14 Year Olds | 78 (78.8%) | 21 (21.2%) |
| 15 to 17 Year Olds | 63 (91.3%) | 6 (8.7%) |
| 18 to 19 Year Olds | 1 (100.0%) | 0 (0.0%) |
| 20 to 24 Year Olds | 1 (100.0%) | 0 (0.0%) |
| 25 to 34 Year Olds | 4 (100.0%) | 0 (0.0%) |
| 35 Years and over | 12 (54.5%) | 10 (45.5%) |
| Total | 205 (78.5%) | 56 (21.5%) |
Educational Attainment by Field of Study in Langdon Place
Business (84 | 23.7%), liberal arts & history (39 | 11.0%), science & technology (36 | 10.1%), arts & humanities (29 | 8.2%), and social sciences (26 | 7.3%) are the most common fields of study among 355 individuals in Langdon Place who have obtained a bachelor's degree or higher.
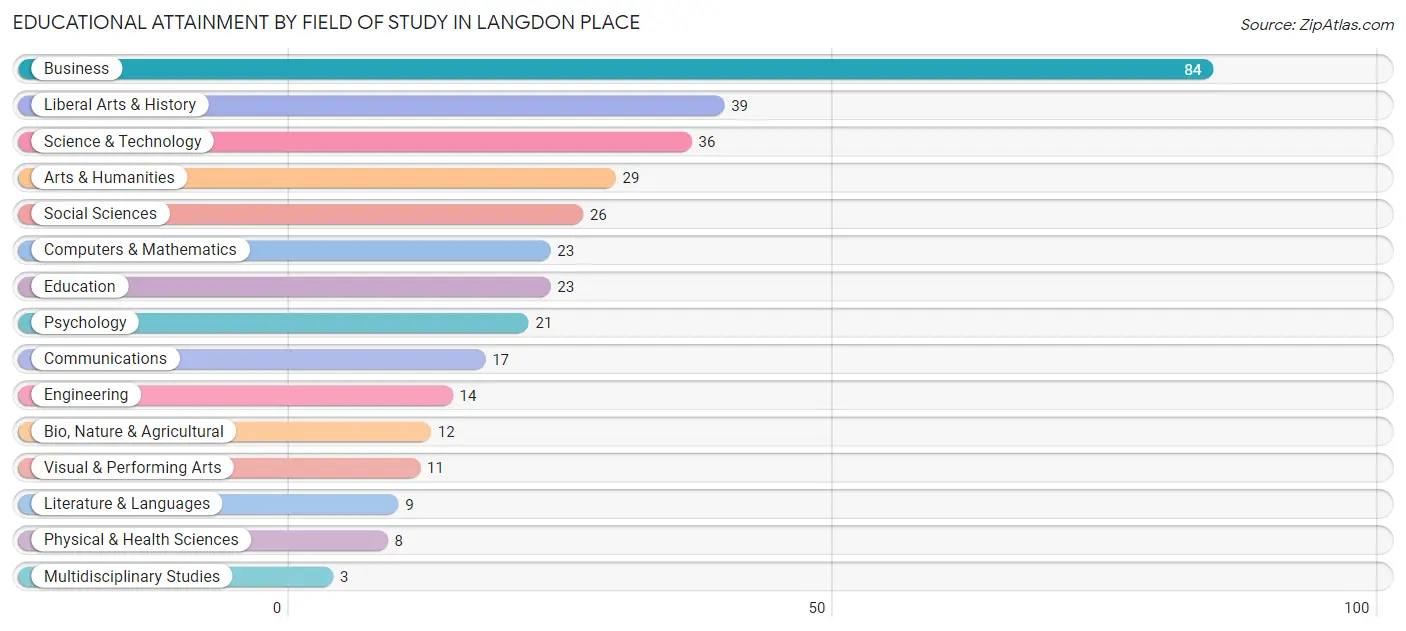
| Field of Study | # Graduates | % Graduates |
| Computers & Mathematics | 23 | 6.5% |
| Bio, Nature & Agricultural | 12 | 3.4% |
| Physical & Health Sciences | 8 | 2.2% |
| Psychology | 21 | 5.9% |
| Social Sciences | 26 | 7.3% |
| Engineering | 14 | 3.9% |
| Multidisciplinary Studies | 3 | 0.9% |
| Science & Technology | 36 | 10.1% |
| Business | 84 | 23.7% |
| Education | 23 | 6.5% |
| Literature & Languages | 9 | 2.5% |
| Liberal Arts & History | 39 | 11.0% |
| Visual & Performing Arts | 11 | 3.1% |
| Communications | 17 | 4.8% |
| Arts & Humanities | 29 | 8.2% |
| Total | 355 | 100.0% |
Transportation & Commute in Langdon Place
Vehicle Availability by Sex in Langdon Place
The most prevalent vehicle ownership categories in Langdon Place are males with 2 vehicles (167, accounting for 65.2%) and females with 2 vehicles (119, making up 72.9%).
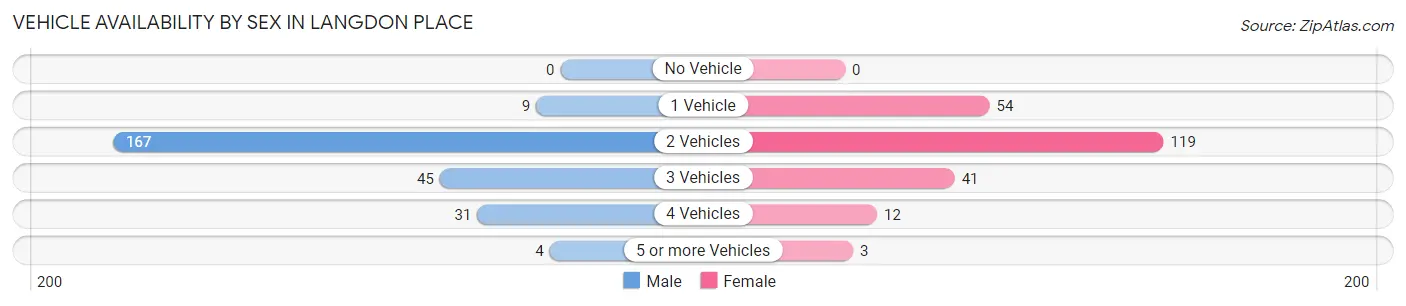
| Vehicles Available | Male | Female |
| No Vehicle | 0 (0.0%) | 0 (0.0%) |
| 1 Vehicle | 9 (3.5%) | 54 (23.6%) |
| 2 Vehicles | 167 (65.2%) | 119 (52.0%) |
| 3 Vehicles | 45 (17.6%) | 41 (17.9%) |
| 4 Vehicles | 31 (12.1%) | 12 (5.2%) |
| 5 or more Vehicles | 4 (1.6%) | 3 (1.3%) |
| Total | 256 (100.0%) | 229 (100.0%) |
Commute Time in Langdon Place
The most frequently occuring commute durations in Langdon Place are 15 to 19 minutes (102 commuters, 22.8%), 10 to 14 minutes (84 commuters, 18.8%), and 20 to 24 minutes (82 commuters, 18.3%).
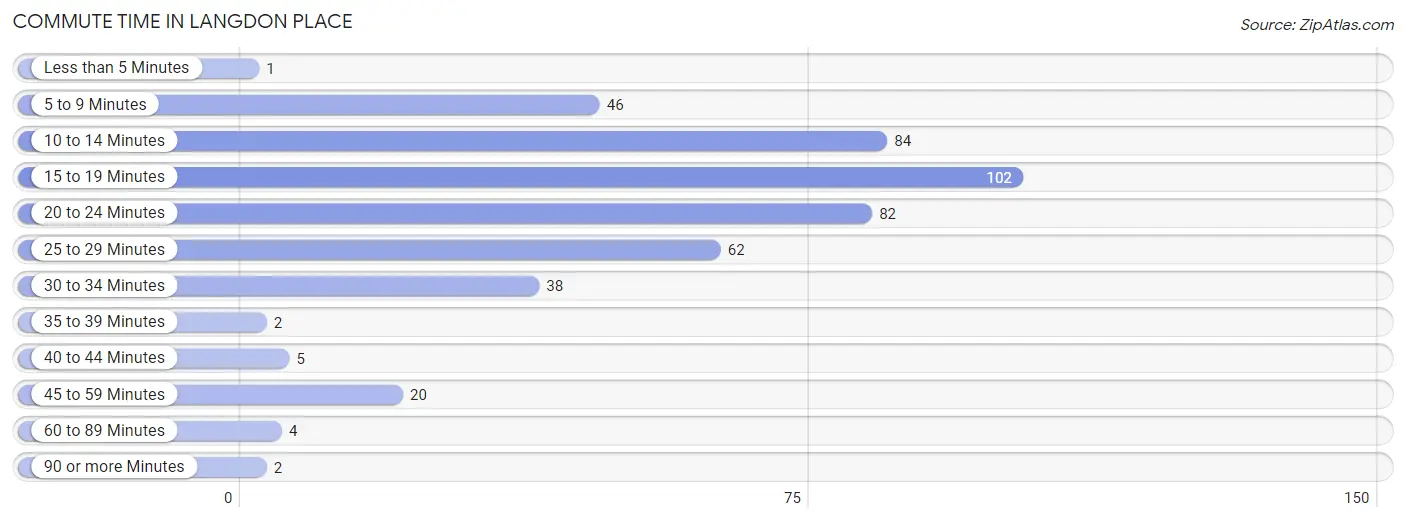
| Commute Time | # Commuters | % Commuters |
| Less than 5 Minutes | 1 | 0.2% |
| 5 to 9 Minutes | 46 | 10.3% |
| 10 to 14 Minutes | 84 | 18.8% |
| 15 to 19 Minutes | 102 | 22.8% |
| 20 to 24 Minutes | 82 | 18.3% |
| 25 to 29 Minutes | 62 | 13.8% |
| 30 to 34 Minutes | 38 | 8.5% |
| 35 to 39 Minutes | 2 | 0.4% |
| 40 to 44 Minutes | 5 | 1.1% |
| 45 to 59 Minutes | 20 | 4.5% |
| 60 to 89 Minutes | 4 | 0.9% |
| 90 or more Minutes | 2 | 0.4% |
Commute Time by Sex in Langdon Place
The most common commute times in Langdon Place are 15 to 19 minutes (56 commuters, 24.9%) for males and 10 to 14 minutes (51 commuters, 22.9%) for females.
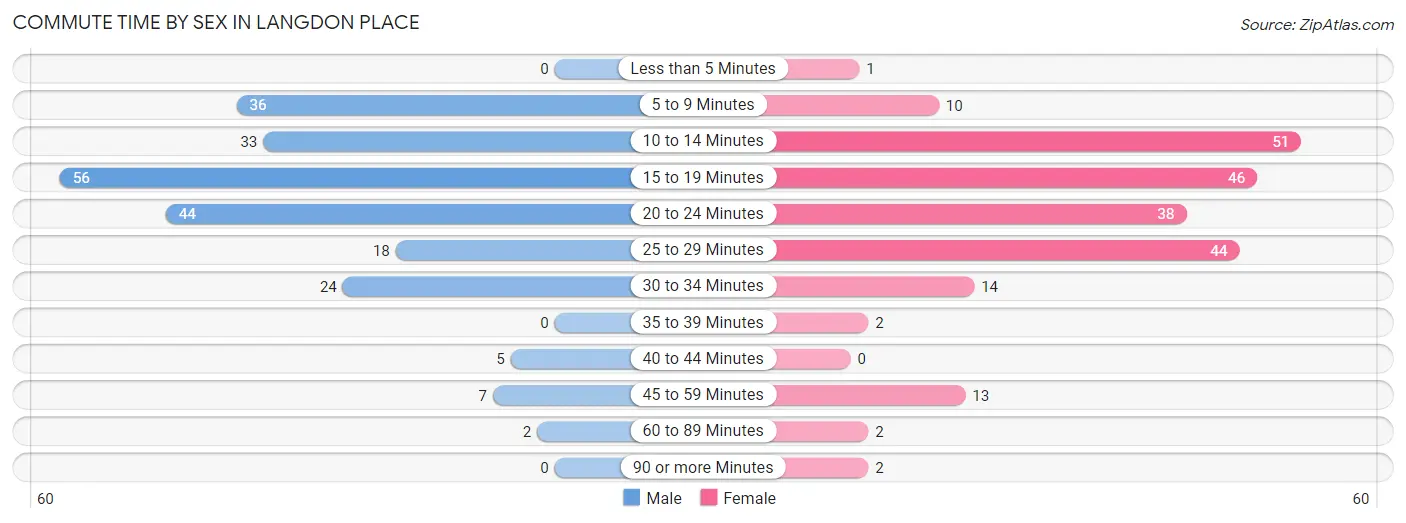
| Commute Time | Male | Female |
| Less than 5 Minutes | 0 (0.0%) | 1 (0.4%) |
| 5 to 9 Minutes | 36 (16.0%) | 10 (4.5%) |
| 10 to 14 Minutes | 33 (14.7%) | 51 (22.9%) |
| 15 to 19 Minutes | 56 (24.9%) | 46 (20.6%) |
| 20 to 24 Minutes | 44 (19.6%) | 38 (17.0%) |
| 25 to 29 Minutes | 18 (8.0%) | 44 (19.7%) |
| 30 to 34 Minutes | 24 (10.7%) | 14 (6.3%) |
| 35 to 39 Minutes | 0 (0.0%) | 2 (0.9%) |
| 40 to 44 Minutes | 5 (2.2%) | 0 (0.0%) |
| 45 to 59 Minutes | 7 (3.1%) | 13 (5.8%) |
| 60 to 89 Minutes | 2 (0.9%) | 2 (0.9%) |
| 90 or more Minutes | 0 (0.0%) | 2 (0.9%) |
Time of Departure to Work by Sex in Langdon Place
The most frequent times of departure to work in Langdon Place are 7:00 AM to 7:29 AM (32, 14.2%) for males and 7:00 AM to 7:29 AM (46, 20.6%) for females.
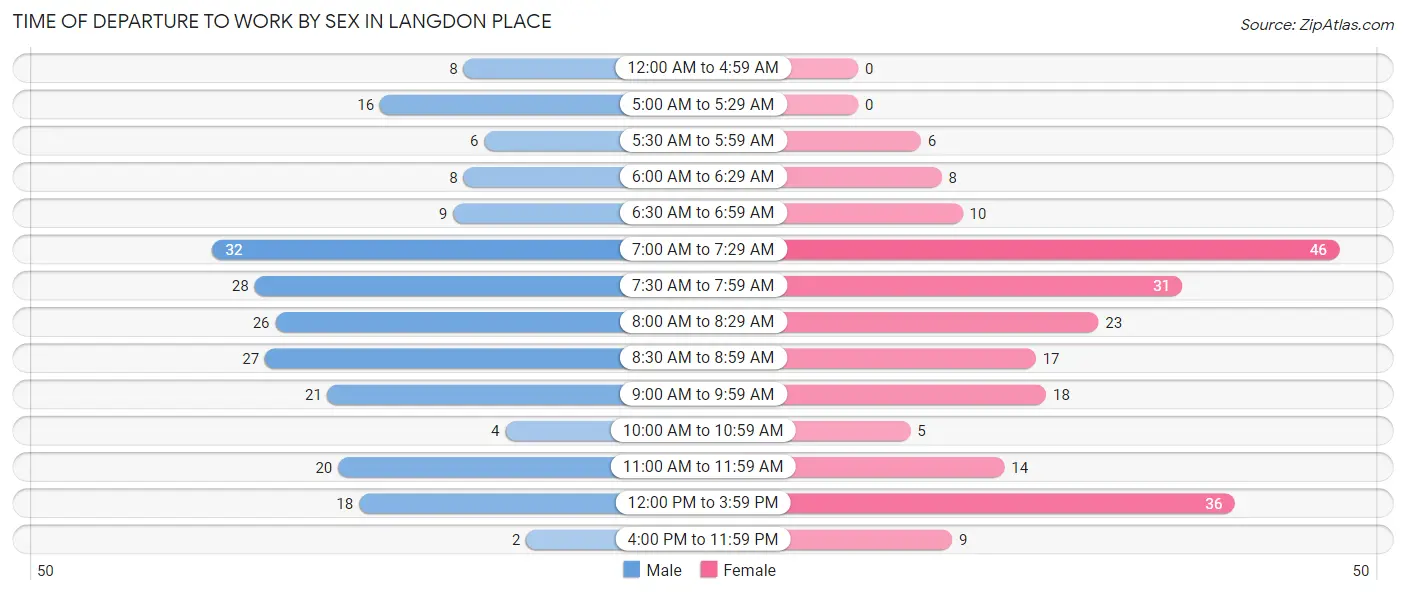
| Time of Departure | Male | Female |
| 12:00 AM to 4:59 AM | 8 (3.6%) | 0 (0.0%) |
| 5:00 AM to 5:29 AM | 16 (7.1%) | 0 (0.0%) |
| 5:30 AM to 5:59 AM | 6 (2.7%) | 6 (2.7%) |
| 6:00 AM to 6:29 AM | 8 (3.6%) | 8 (3.6%) |
| 6:30 AM to 6:59 AM | 9 (4.0%) | 10 (4.5%) |
| 7:00 AM to 7:29 AM | 32 (14.2%) | 46 (20.6%) |
| 7:30 AM to 7:59 AM | 28 (12.4%) | 31 (13.9%) |
| 8:00 AM to 8:29 AM | 26 (11.6%) | 23 (10.3%) |
| 8:30 AM to 8:59 AM | 27 (12.0%) | 17 (7.6%) |
| 9:00 AM to 9:59 AM | 21 (9.3%) | 18 (8.1%) |
| 10:00 AM to 10:59 AM | 4 (1.8%) | 5 (2.2%) |
| 11:00 AM to 11:59 AM | 20 (8.9%) | 14 (6.3%) |
| 12:00 PM to 3:59 PM | 18 (8.0%) | 36 (16.1%) |
| 4:00 PM to 11:59 PM | 2 (0.9%) | 9 (4.0%) |
| Total | 225 (100.0%) | 223 (100.0%) |
Housing Occupancy in Langdon Place
Occupancy by Ownership in Langdon Place
Of the total 320 dwellings in Langdon Place, owner-occupied units account for 278 (86.9%), while renter-occupied units make up 42 (13.1%).
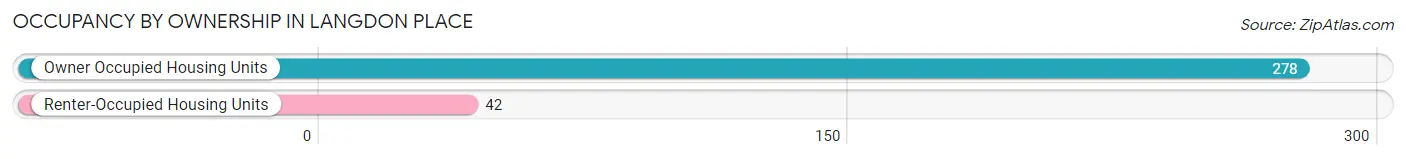
| Occupancy | # Housing Units | % Housing Units |
| Owner Occupied Housing Units | 278 | 86.9% |
| Renter-Occupied Housing Units | 42 | 13.1% |
| Total Occupied Housing Units | 320 | 100.0% |
Occupancy by Household Size in Langdon Place
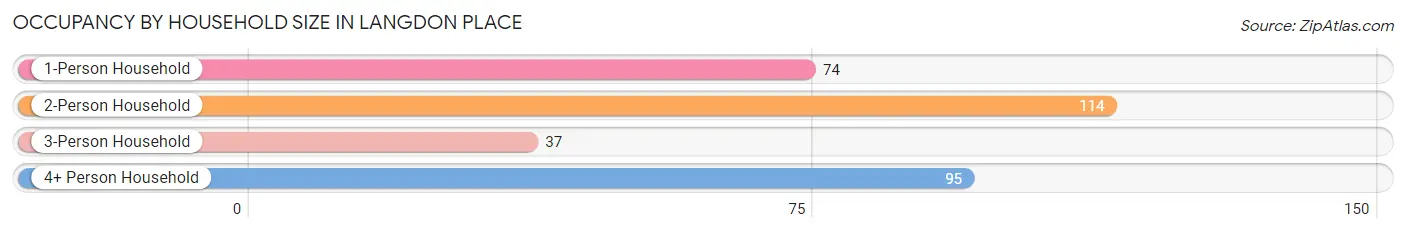
| Household Size | # Housing Units | % Housing Units |
| 1-Person Household | 74 | 23.1% |
| 2-Person Household | 114 | 35.6% |
| 3-Person Household | 37 | 11.6% |
| 4+ Person Household | 95 | 29.7% |
| Total Housing Units | 320 | 100.0% |
Occupancy by Ownership by Household Size in Langdon Place
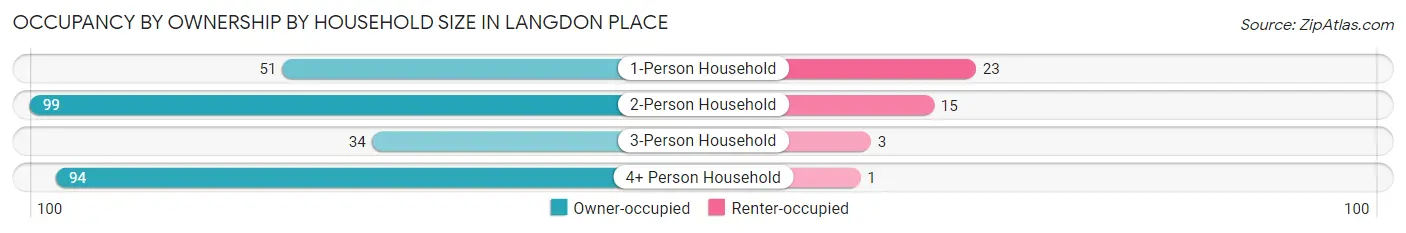
| Household Size | Owner-occupied | Renter-occupied |
| 1-Person Household | 51 (68.9%) | 23 (31.1%) |
| 2-Person Household | 99 (86.8%) | 15 (13.2%) |
| 3-Person Household | 34 (91.9%) | 3 (8.1%) |
| 4+ Person Household | 94 (99.0%) | 1 (1.1%) |
| Total Housing Units | 278 (86.9%) | 42 (13.1%) |
Occupancy by Educational Attainment in Langdon Place
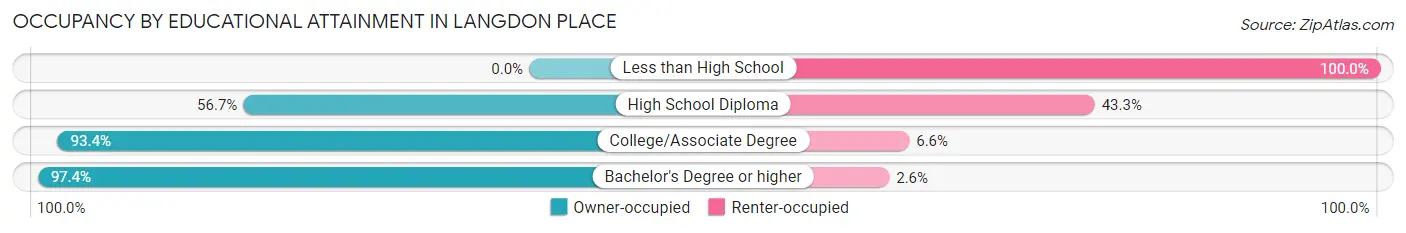
| Household Size | Owner-occupied | Renter-occupied |
| Less than High School | 0 (0.0%) | 7 (100.0%) |
| High School Diploma | 34 (56.7%) | 26 (43.3%) |
| College/Associate Degree | 57 (93.4%) | 4 (6.6%) |
| Bachelor's Degree or higher | 187 (97.4%) | 5 (2.6%) |
Occupancy by Age of Householder in Langdon Place
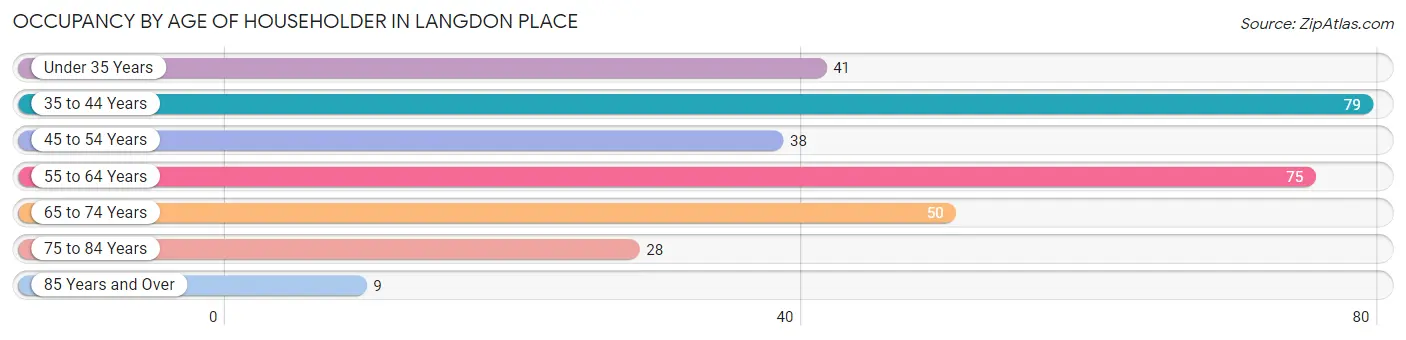
| Age Bracket | # Households | % Households |
| Under 35 Years | 41 | 12.8% |
| 35 to 44 Years | 79 | 24.7% |
| 45 to 54 Years | 38 | 11.9% |
| 55 to 64 Years | 75 | 23.4% |
| 65 to 74 Years | 50 | 15.6% |
| 75 to 84 Years | 28 | 8.7% |
| 85 Years and Over | 9 | 2.8% |
| Total | 320 | 100.0% |
Housing Finances in Langdon Place
Median Income by Occupancy in Langdon Place
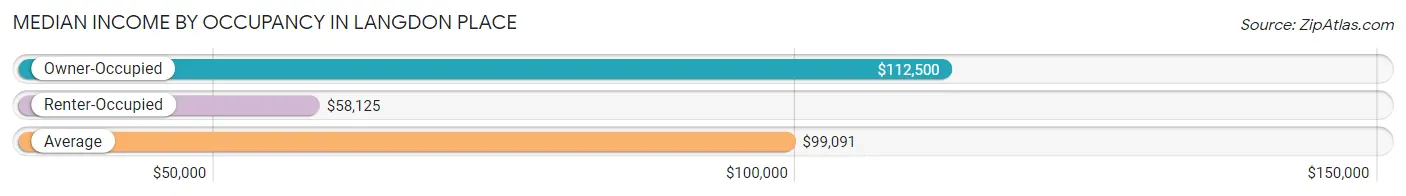
| Occupancy Type | # Households | Median Income |
| Owner-Occupied | 278 (86.9%) | $112,500 |
| Renter-Occupied | 42 (13.1%) | $58,125 |
| Average | 320 (100.0%) | $99,091 |
Occupancy by Householder Income Bracket in Langdon Place
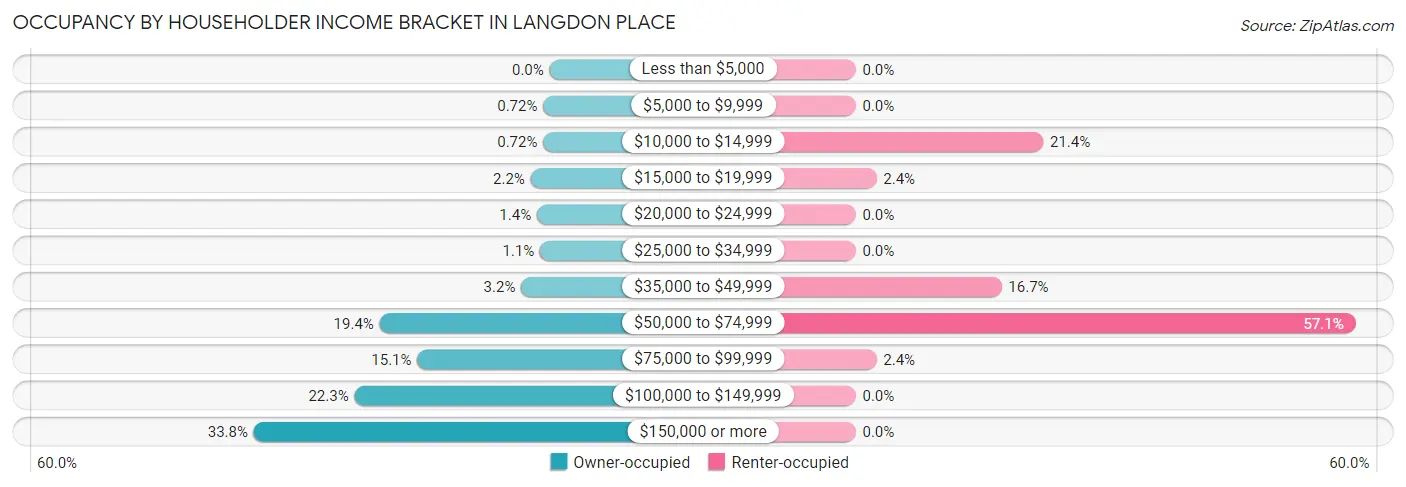
| Income Bracket | Owner-occupied | Renter-occupied |
| Less than $5,000 | 0 (0.0%) | 0 (0.0%) |
| $5,000 to $9,999 | 2 (0.7%) | 0 (0.0%) |
| $10,000 to $14,999 | 2 (0.7%) | 9 (21.4%) |
| $15,000 to $19,999 | 6 (2.2%) | 1 (2.4%) |
| $20,000 to $24,999 | 4 (1.4%) | 0 (0.0%) |
| $25,000 to $34,999 | 3 (1.1%) | 0 (0.0%) |
| $35,000 to $49,999 | 9 (3.2%) | 7 (16.7%) |
| $50,000 to $74,999 | 54 (19.4%) | 24 (57.1%) |
| $75,000 to $99,999 | 42 (15.1%) | 1 (2.4%) |
| $100,000 to $149,999 | 62 (22.3%) | 0 (0.0%) |
| $150,000 or more | 94 (33.8%) | 0 (0.0%) |
| Total | 278 (100.0%) | 42 (100.0%) |
Monthly Housing Cost Tiers in Langdon Place
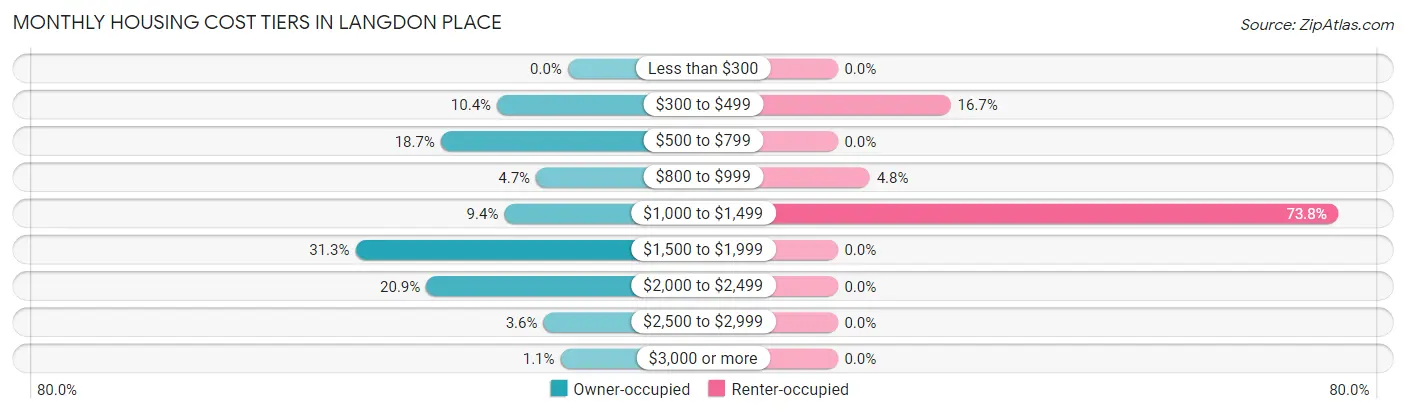
| Monthly Cost | Owner-occupied | Renter-occupied |
| Less than $300 | 0 (0.0%) | 0 (0.0%) |
| $300 to $499 | 29 (10.4%) | 7 (16.7%) |
| $500 to $799 | 52 (18.7%) | 0 (0.0%) |
| $800 to $999 | 13 (4.7%) | 2 (4.8%) |
| $1,000 to $1,499 | 26 (9.3%) | 31 (73.8%) |
| $1,500 to $1,999 | 87 (31.3%) | 0 (0.0%) |
| $2,000 to $2,499 | 58 (20.9%) | 0 (0.0%) |
| $2,500 to $2,999 | 10 (3.6%) | 0 (0.0%) |
| $3,000 or more | 3 (1.1%) | 0 (0.0%) |
| Total | 278 (100.0%) | 42 (100.0%) |
Physical Housing Characteristics in Langdon Place
Housing Structures in Langdon Place
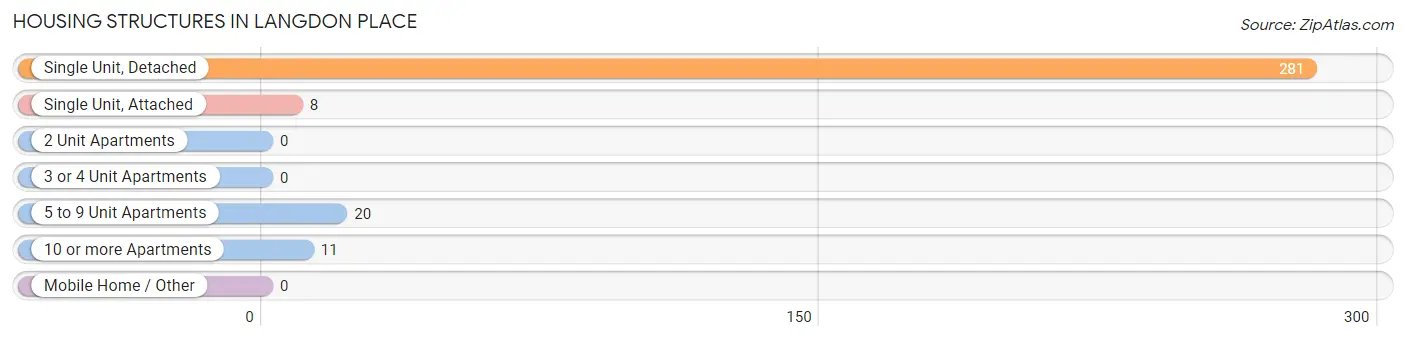
| Structure Type | # Housing Units | % Housing Units |
| Single Unit, Detached | 281 | 87.8% |
| Single Unit, Attached | 8 | 2.5% |
| 2 Unit Apartments | 0 | 0.0% |
| 3 or 4 Unit Apartments | 0 | 0.0% |
| 5 to 9 Unit Apartments | 20 | 6.2% |
| 10 or more Apartments | 11 | 3.4% |
| Mobile Home / Other | 0 | 0.0% |
| Total | 320 | 100.0% |
Housing Structures by Occupancy in Langdon Place
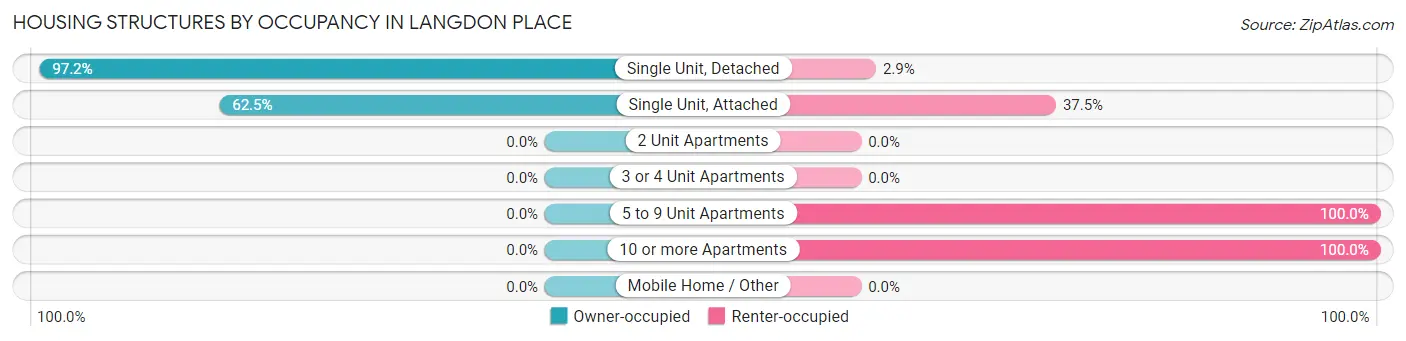
| Structure Type | Owner-occupied | Renter-occupied |
| Single Unit, Detached | 273 (97.2%) | 8 (2.9%) |
| Single Unit, Attached | 5 (62.5%) | 3 (37.5%) |
| 2 Unit Apartments | 0 (0.0%) | 0 (0.0%) |
| 3 or 4 Unit Apartments | 0 (0.0%) | 0 (0.0%) |
| 5 to 9 Unit Apartments | 0 (0.0%) | 20 (100.0%) |
| 10 or more Apartments | 0 (0.0%) | 11 (100.0%) |
| Mobile Home / Other | 0 (0.0%) | 0 (0.0%) |
| Total | 278 (86.9%) | 42 (13.1%) |
Housing Structures by Number of Rooms in Langdon Place
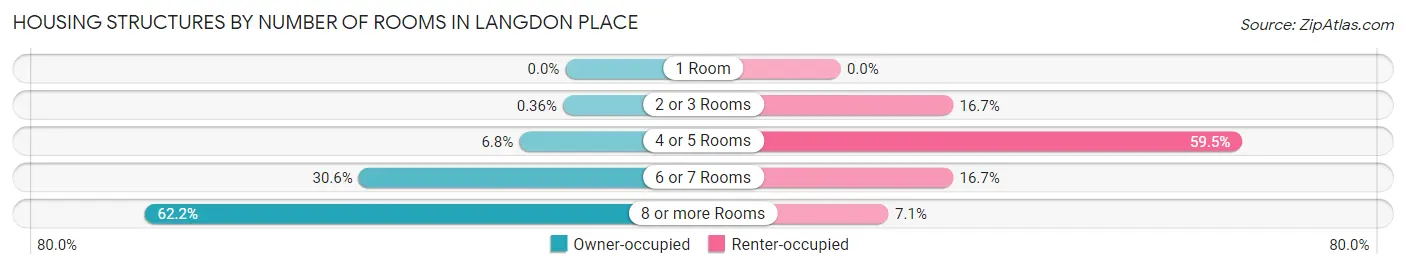
| Number of Rooms | Owner-occupied | Renter-occupied |
| 1 Room | 0 (0.0%) | 0 (0.0%) |
| 2 or 3 Rooms | 1 (0.4%) | 7 (16.7%) |
| 4 or 5 Rooms | 19 (6.8%) | 25 (59.5%) |
| 6 or 7 Rooms | 85 (30.6%) | 7 (16.7%) |
| 8 or more Rooms | 173 (62.2%) | 3 (7.1%) |
| Total | 278 (100.0%) | 42 (100.0%) |
Housing Structure by Heating Type in Langdon Place
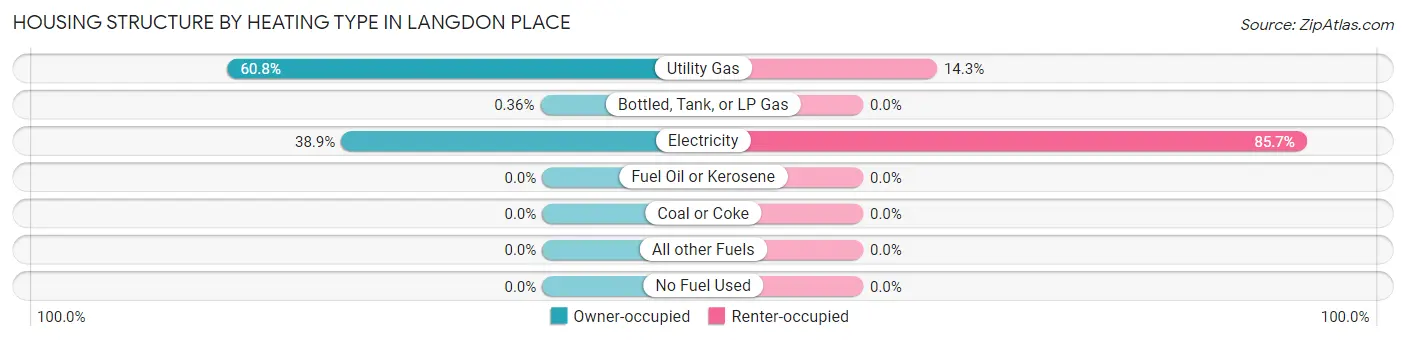
| Heating Type | Owner-occupied | Renter-occupied |
| Utility Gas | 169 (60.8%) | 6 (14.3%) |
| Bottled, Tank, or LP Gas | 1 (0.4%) | 0 (0.0%) |
| Electricity | 108 (38.9%) | 36 (85.7%) |
| Fuel Oil or Kerosene | 0 (0.0%) | 0 (0.0%) |
| Coal or Coke | 0 (0.0%) | 0 (0.0%) |
| All other Fuels | 0 (0.0%) | 0 (0.0%) |
| No Fuel Used | 0 (0.0%) | 0 (0.0%) |
| Total | 278 (100.0%) | 42 (100.0%) |
Household Vehicle Usage in Langdon Place
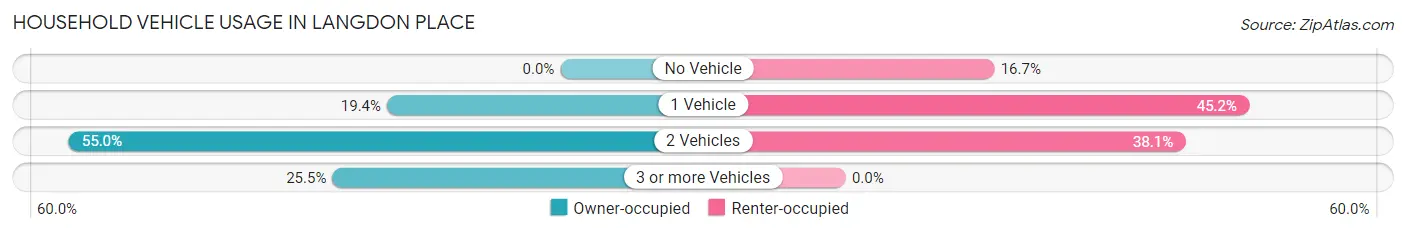
| Vehicles per Household | Owner-occupied | Renter-occupied |
| No Vehicle | 0 (0.0%) | 7 (16.7%) |
| 1 Vehicle | 54 (19.4%) | 19 (45.2%) |
| 2 Vehicles | 153 (55.0%) | 16 (38.1%) |
| 3 or more Vehicles | 71 (25.5%) | 0 (0.0%) |
| Total | 278 (100.0%) | 42 (100.0%) |
Real Estate & Mortgages in Langdon Place
Real Estate and Mortgage Overview in Langdon Place
| Characteristic | Without Mortgage | With Mortgage |
| Housing Units | 84 | 194 |
| Median Property Value | $269,000 | $295,600 |
| Median Household Income | $80,625 | $74 |
| Monthly Housing Costs | $559 | $3 |
| Real Estate Taxes | $2,333 | $0 |
Property Value by Mortgage Status in Langdon Place
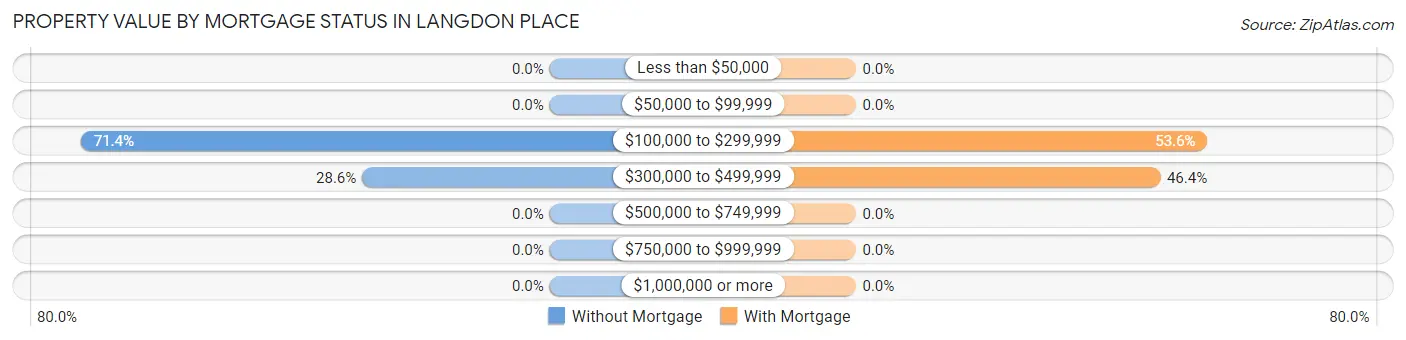
| Property Value | Without Mortgage | With Mortgage |
| Less than $50,000 | 0 (0.0%) | 0 (0.0%) |
| $50,000 to $99,999 | 0 (0.0%) | 0 (0.0%) |
| $100,000 to $299,999 | 60 (71.4%) | 104 (53.6%) |
| $300,000 to $499,999 | 24 (28.6%) | 90 (46.4%) |
| $500,000 to $749,999 | 0 (0.0%) | 0 (0.0%) |
| $750,000 to $999,999 | 0 (0.0%) | 0 (0.0%) |
| $1,000,000 or more | 0 (0.0%) | 0 (0.0%) |
| Total | 84 (100.0%) | 194 (100.0%) |
Household Income by Mortgage Status in Langdon Place
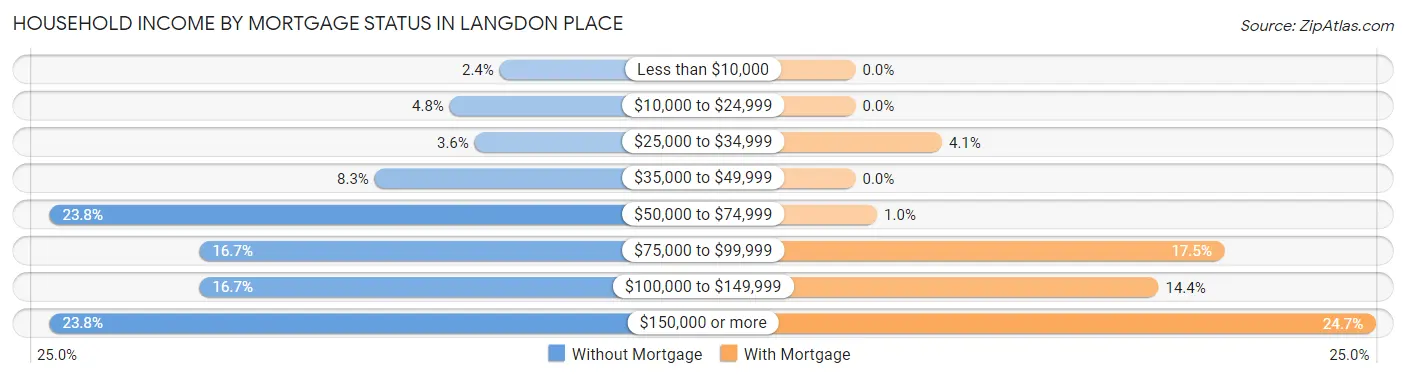
| Household Income | Without Mortgage | With Mortgage |
| Less than $10,000 | 2 (2.4%) | 0 (0.0%) |
| $10,000 to $24,999 | 4 (4.8%) | 0 (0.0%) |
| $25,000 to $34,999 | 3 (3.6%) | 8 (4.1%) |
| $35,000 to $49,999 | 7 (8.3%) | 0 (0.0%) |
| $50,000 to $74,999 | 20 (23.8%) | 2 (1.0%) |
| $75,000 to $99,999 | 14 (16.7%) | 34 (17.5%) |
| $100,000 to $149,999 | 14 (16.7%) | 28 (14.4%) |
| $150,000 or more | 20 (23.8%) | 48 (24.7%) |
| Total | 84 (100.0%) | 194 (100.0%) |
Property Value to Household Income Ratio in Langdon Place
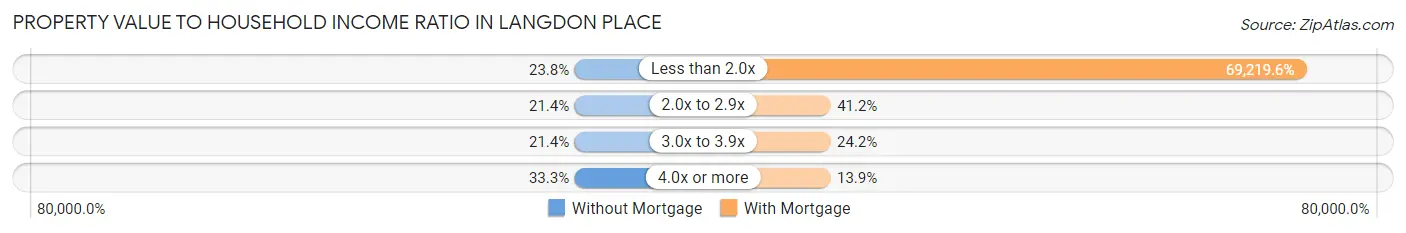
| Value-to-Income Ratio | Without Mortgage | With Mortgage |
| Less than 2.0x | 20 (23.8%) | 134,286 (69,219.6%) |
| 2.0x to 2.9x | 18 (21.4%) | 80 (41.2%) |
| 3.0x to 3.9x | 18 (21.4%) | 47 (24.2%) |
| 4.0x or more | 28 (33.3%) | 27 (13.9%) |
| Total | 84 (100.0%) | 194 (100.0%) |
Real Estate Taxes by Mortgage Status in Langdon Place
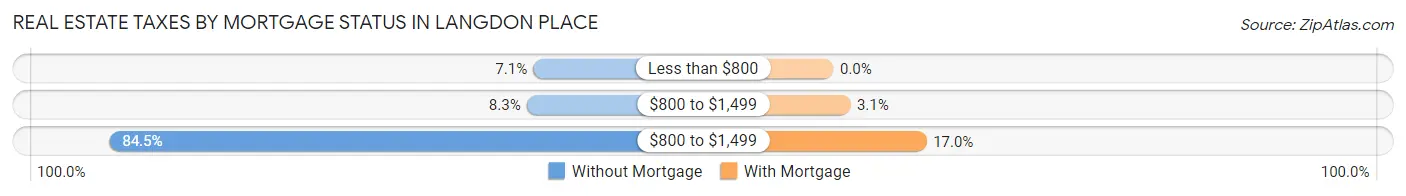
| Property Taxes | Without Mortgage | With Mortgage |
| Less than $800 | 6 (7.1%) | 0 (0.0%) |
| $800 to $1,499 | 7 (8.3%) | 6 (3.1%) |
| $800 to $1,499 | 71 (84.5%) | 33 (17.0%) |
| Total | 84 (100.0%) | 194 (100.0%) |
Health & Disability in Langdon Place
Health Insurance Coverage by Age in Langdon Place
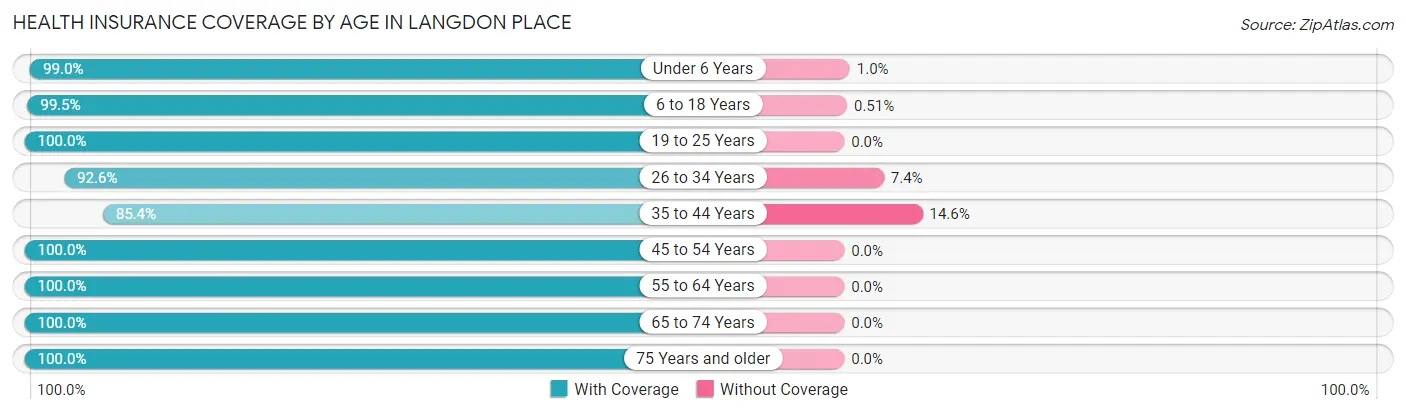
| Age Bracket | With Coverage | Without Coverage |
| Under 6 Years | 95 (99.0%) | 1 (1.0%) |
| 6 to 18 Years | 197 (99.5%) | 1 (0.5%) |
| 19 to 25 Years | 23 (100.0%) | 0 (0.0%) |
| 26 to 34 Years | 88 (92.6%) | 7 (7.4%) |
| 35 to 44 Years | 158 (85.4%) | 27 (14.6%) |
| 45 to 54 Years | 58 (100.0%) | 0 (0.0%) |
| 55 to 64 Years | 105 (100.0%) | 0 (0.0%) |
| 65 to 74 Years | 114 (100.0%) | 0 (0.0%) |
| 75 Years and older | 59 (100.0%) | 0 (0.0%) |
| Total | 897 (96.1%) | 36 (3.9%) |
Health Insurance Coverage by Citizenship Status in Langdon Place
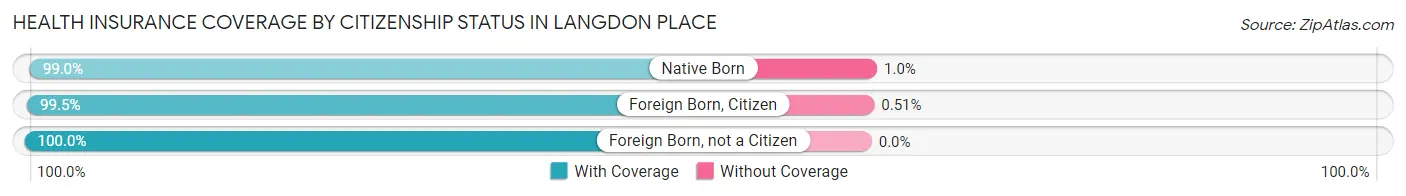
| Citizenship Status | With Coverage | Without Coverage |
| Native Born | 95 (99.0%) | 1 (1.0%) |
| Foreign Born, Citizen | 197 (99.5%) | 1 (0.5%) |
| Foreign Born, not a Citizen | 23 (100.0%) | 0 (0.0%) |
Health Insurance Coverage by Household Income in Langdon Place
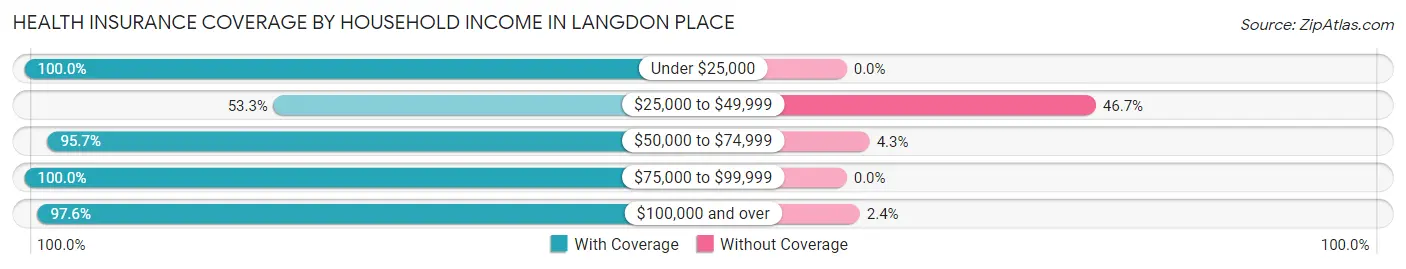
| Household Income | With Coverage | Without Coverage |
| Under $25,000 | 33 (100.0%) | 0 (0.0%) |
| $25,000 to $49,999 | 16 (53.3%) | 14 (46.7%) |
| $50,000 to $74,999 | 201 (95.7%) | 9 (4.3%) |
| $75,000 to $99,999 | 127 (100.0%) | 0 (0.0%) |
| $100,000 and over | 520 (97.6%) | 13 (2.4%) |
Public vs Private Health Insurance Coverage by Age in Langdon Place
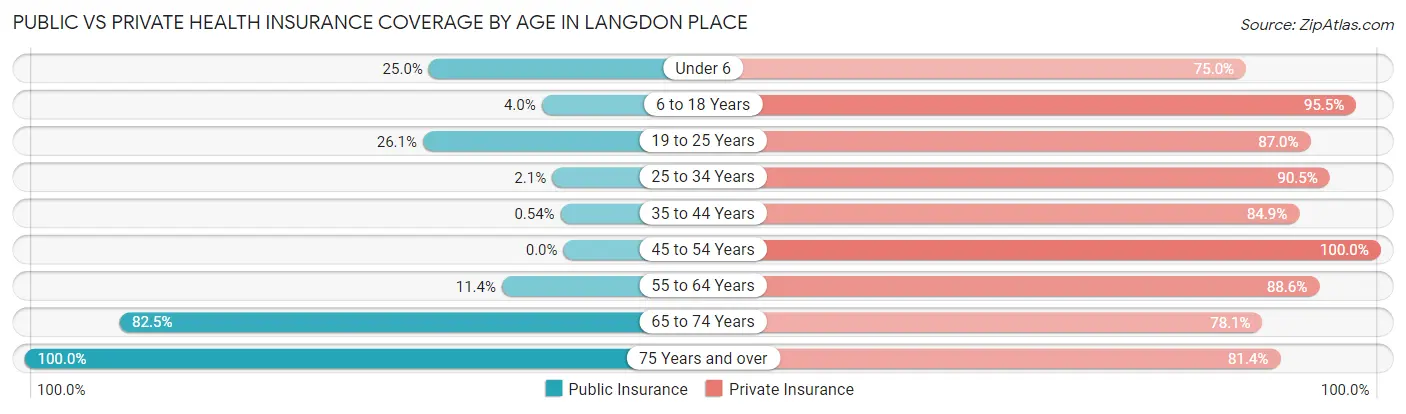
| Age Bracket | Public Insurance | Private Insurance |
| Under 6 | 24 (25.0%) | 72 (75.0%) |
| 6 to 18 Years | 8 (4.0%) | 189 (95.5%) |
| 19 to 25 Years | 6 (26.1%) | 20 (87.0%) |
| 25 to 34 Years | 2 (2.1%) | 86 (90.5%) |
| 35 to 44 Years | 1 (0.5%) | 157 (84.9%) |
| 45 to 54 Years | 0 (0.0%) | 58 (100.0%) |
| 55 to 64 Years | 12 (11.4%) | 93 (88.6%) |
| 65 to 74 Years | 94 (82.5%) | 89 (78.1%) |
| 75 Years and over | 59 (100.0%) | 48 (81.4%) |
| Total | 206 (22.1%) | 812 (87.0%) |
Disability Status by Sex by Age in Langdon Place
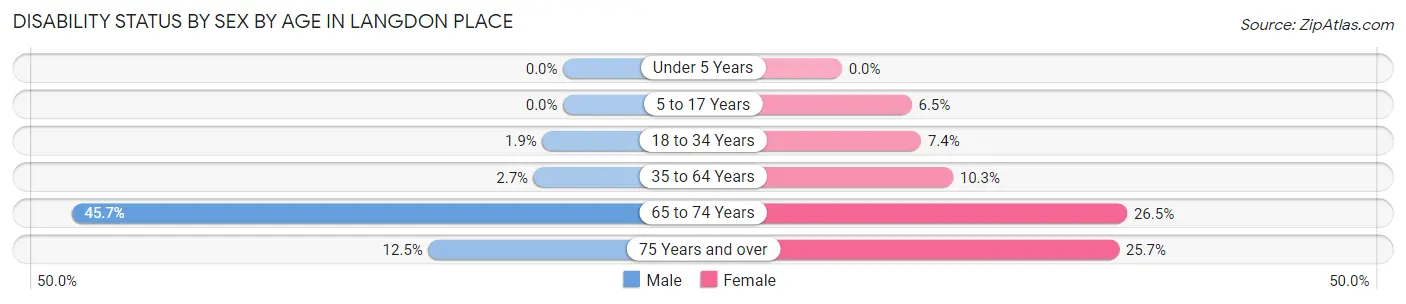
| Age Bracket | Male | Female |
| Under 5 Years | 0 (0.0%) | 0 (0.0%) |
| 5 to 17 Years | 0 (0.0%) | 9 (6.5%) |
| 18 to 34 Years | 1 (1.9%) | 5 (7.3%) |
| 35 to 64 Years | 5 (2.7%) | 17 (10.3%) |
| 65 to 74 Years | 21 (45.7%) | 18 (26.5%) |
| 75 Years and over | 3 (12.5%) | 9 (25.7%) |
Disability Class by Sex by Age in Langdon Place
Disability Class: Hearing Difficulty
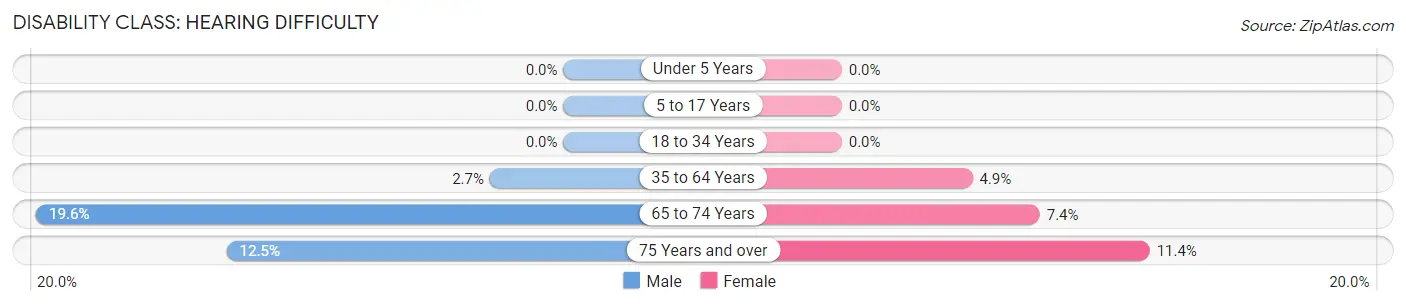
| Age Bracket | Male | Female |
| Under 5 Years | 0 (0.0%) | 0 (0.0%) |
| 5 to 17 Years | 0 (0.0%) | 0 (0.0%) |
| 18 to 34 Years | 0 (0.0%) | 0 (0.0%) |
| 35 to 64 Years | 5 (2.7%) | 8 (4.9%) |
| 65 to 74 Years | 9 (19.6%) | 5 (7.3%) |
| 75 Years and over | 3 (12.5%) | 4 (11.4%) |
Disability Class: Vision Difficulty
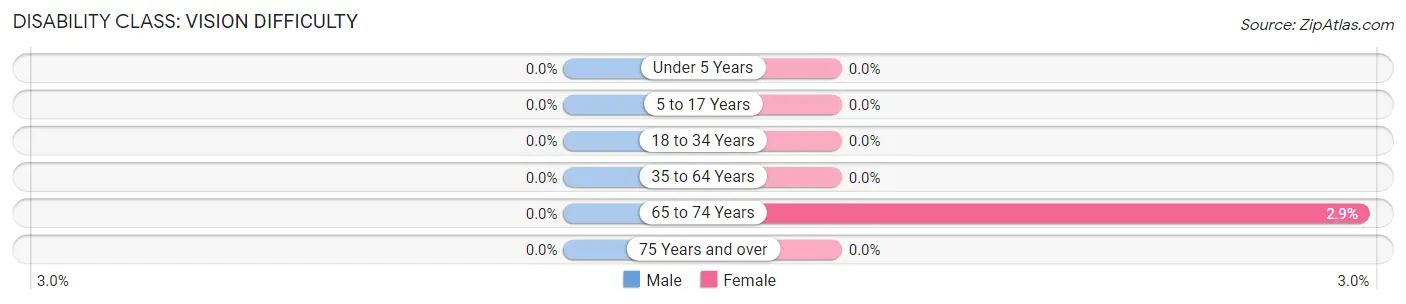
| Age Bracket | Male | Female |
| Under 5 Years | 0 (0.0%) | 0 (0.0%) |
| 5 to 17 Years | 0 (0.0%) | 0 (0.0%) |
| 18 to 34 Years | 0 (0.0%) | 0 (0.0%) |
| 35 to 64 Years | 0 (0.0%) | 0 (0.0%) |
| 65 to 74 Years | 0 (0.0%) | 2 (2.9%) |
| 75 Years and over | 0 (0.0%) | 0 (0.0%) |
Disability Class: Cognitive Difficulty
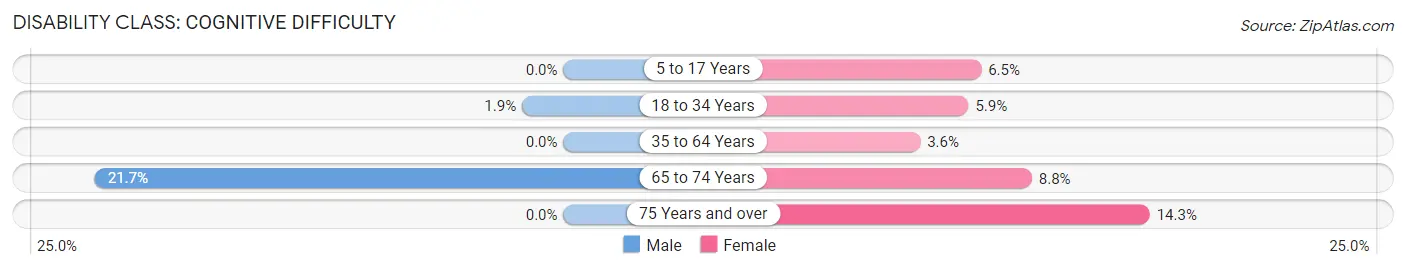
| Age Bracket | Male | Female |
| 5 to 17 Years | 0 (0.0%) | 9 (6.5%) |
| 18 to 34 Years | 1 (1.9%) | 4 (5.9%) |
| 35 to 64 Years | 0 (0.0%) | 6 (3.6%) |
| 65 to 74 Years | 10 (21.7%) | 6 (8.8%) |
| 75 Years and over | 0 (0.0%) | 5 (14.3%) |
Disability Class: Ambulatory Difficulty
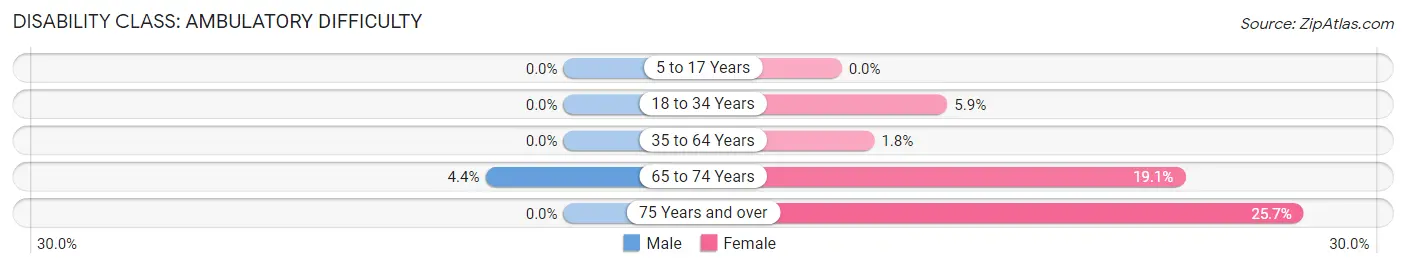
| Age Bracket | Male | Female |
| 5 to 17 Years | 0 (0.0%) | 0 (0.0%) |
| 18 to 34 Years | 0 (0.0%) | 4 (5.9%) |
| 35 to 64 Years | 0 (0.0%) | 3 (1.8%) |
| 65 to 74 Years | 2 (4.3%) | 13 (19.1%) |
| 75 Years and over | 0 (0.0%) | 9 (25.7%) |
Disability Class: Self-Care Difficulty
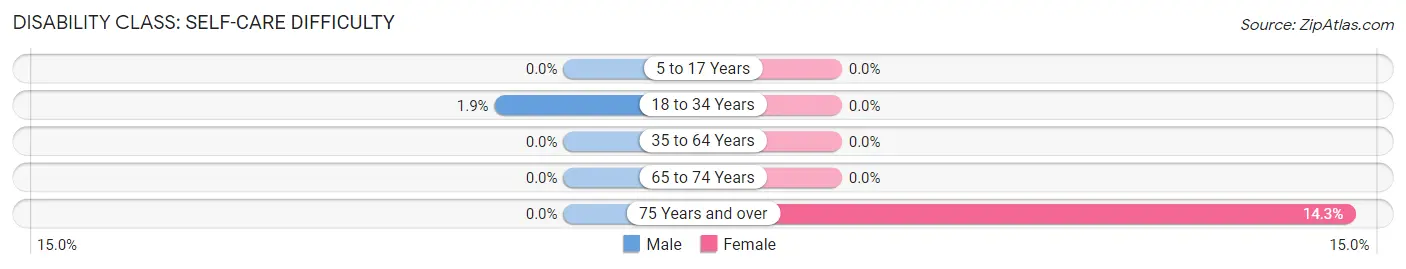
| Age Bracket | Male | Female |
| 5 to 17 Years | 0 (0.0%) | 0 (0.0%) |
| 18 to 34 Years | 1 (1.9%) | 0 (0.0%) |
| 35 to 64 Years | 0 (0.0%) | 0 (0.0%) |
| 65 to 74 Years | 0 (0.0%) | 0 (0.0%) |
| 75 Years and over | 0 (0.0%) | 5 (14.3%) |
Technology Access in Langdon Place
Computing Device Access in Langdon Place
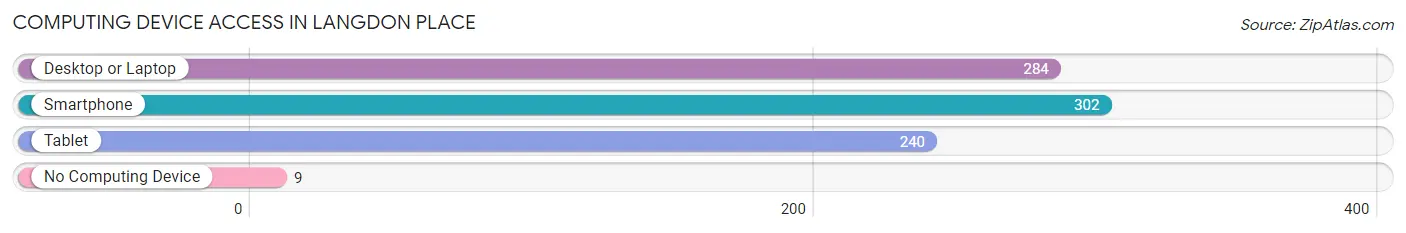
| Device Type | # Households | % Households |
| Desktop or Laptop | 284 | 88.7% |
| Smartphone | 302 | 94.4% |
| Tablet | 240 | 75.0% |
| No Computing Device | 9 | 2.8% |
| Total | 320 | 100.0% |
Internet Access in Langdon Place
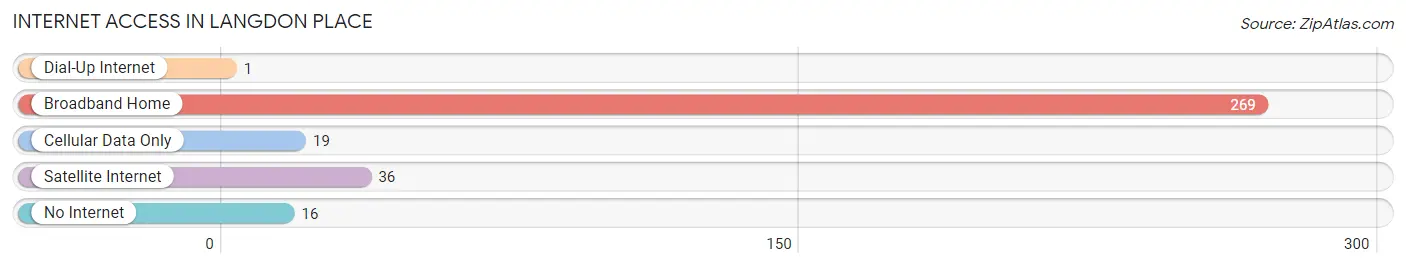
| Internet Type | # Households | % Households |
| Dial-Up Internet | 1 | 0.3% |
| Broadband Home | 269 | 84.1% |
| Cellular Data Only | 19 | 5.9% |
| Satellite Internet | 36 | 11.3% |
| No Internet | 16 | 5.0% |
| Total | 320 | 100.0% |
Langdon Place Summary
Langdon Place is a small unincorporated community located in Jefferson County, Kentucky. It is situated in the eastern part of the county, just south of the city of Louisville. The community is bordered by the cities of Jeffersontown and Middletown to the north, and the city of St. Matthews to the south. The population of Langdon Place was estimated to be 1,845 in 2019.
History
Langdon Place was originally part of a larger area known as Langdon Station, which was established in the late 1800s. The area was named after the Langdon family, who owned a large amount of land in the area. The Langdon family was one of the first settlers in the area, and their homestead was located near the intersection of what is now Taylorsville Road and Shelbyville Road.
The area was primarily agricultural until the 1950s, when the population began to grow rapidly due to the development of the nearby cities of Jeffersontown and Middletown. The area was annexed by the city of Jeffersontown in the late 1950s, and the name was changed to Langdon Place.
Geography
Langdon Place is located in the eastern part of Jefferson County, just south of the city of Louisville. The community is bordered by the cities of Jeffersontown and Middletown to the north, and the city of St. Matthews to the south. The area is primarily residential, with some commercial development along Taylorsville Road.
The terrain of Langdon Place is mostly flat, with some rolling hills in the northern part of the community. The area is located in the Bluegrass region of Kentucky, and is known for its lush green pastures and rolling hills.
Economy
The economy of Langdon Place is primarily based on the service industry. The area is home to a variety of restaurants, retail stores, and other businesses. The area is also home to several medical facilities, including a hospital and several medical offices.
The area is also home to several industrial parks, which provide employment opportunities for residents. The largest employer in the area is the Ford Motor Company, which has a large manufacturing plant located in the area.
Demographics
The population of Langdon Place was estimated to be 1,845 in 2019. The population is primarily white (90.2%), with a small percentage of African Americans (4.2%), Asians (2.2%), and other races (3.4%). The median household income in the area is $50,945, and the median home value is $179,400.
The area is served by the Jefferson County Public Schools system, and is home to several schools, including Langdon Place Elementary School, Langdon Place Middle School, and Langdon Place High School. The area is also home to several private schools, including St. Matthews Catholic School and St. Matthews Lutheran School.
Conclusion
Langdon Place is a small unincorporated community located in Jefferson County, Kentucky. The area is primarily residential, with some commercial development along Taylorsville Road. The economy of the area is primarily based on the service industry, and the population is primarily white. The area is served by the Jefferson County Public Schools system, and is home to several schools, including Langdon Place Elementary School, Langdon Place Middle School, and Langdon Place High School.
Common Questions
What is Per Capita Income in Langdon Place?
Per Capita income in Langdon Place is $44,391.
What is the Median Family Income in Langdon Place?
Median Family Income in Langdon Place is $116,875.
What is the Median Household income in Langdon Place?
Median Household Income in Langdon Place is $99,091.
What is Income or Wage Gap in Langdon Place?
Income or Wage Gap in Langdon Place is 29.7%.
Women in Langdon Place earn 70.3 cents for every dollar earned by a man.
What is Inequality or Gini Index in Langdon Place?
Inequality or Gini Index in Langdon Place is 0.37.
What is the Total Population of Langdon Place?
Total Population of Langdon Place is 933.
What is the Total Male Population of Langdon Place?
Total Male Population of Langdon Place is 426.
What is the Total Female Population of Langdon Place?
Total Female Population of Langdon Place is 507.
What is the Ratio of Males per 100 Females in Langdon Place?
There are 84.02 Males per 100 Females in Langdon Place.
What is the Ratio of Females per 100 Males in Langdon Place?
There are 119.01 Females per 100 Males in Langdon Place.
What is the Median Population Age in Langdon Place?
Median Population Age in Langdon Place is 38.5 Years.
What is the Average Family Size in Langdon Place
Average Family Size in Langdon Place is 3.5 People.
What is the Average Household Size in Langdon Place
Average Household Size in Langdon Place is 2.9 People.
How Large is the Labor Force in Langdon Place?
There are 497 People in the Labor Forcein in Langdon Place.
What is the Percentage of People in the Labor Force in Langdon Place?
74.4% of People are in the Labor Force in Langdon Place.
What is the Unemployment Rate in Langdon Place?
Unemployment Rate in Langdon Place is 2.0%.