Covington, KY Map & Demographics
Covington Map
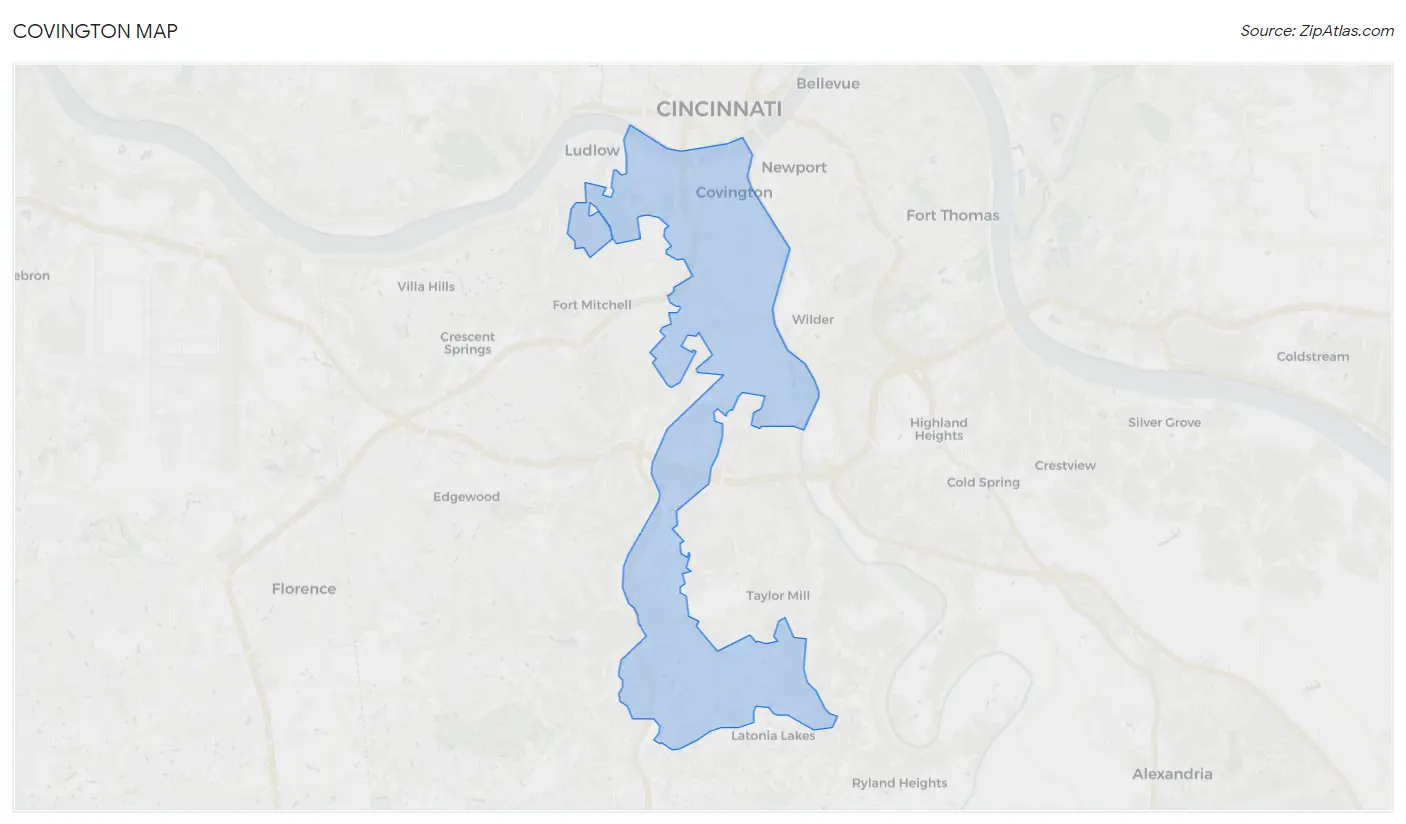
Covington Overview
$33,868
PER CAPITA INCOME
$74,007
AVG FAMILY INCOME
$53,770
AVG HOUSEHOLD INCOME
15.1%
WAGE / INCOME GAP [ % ]
84.9¢/ $1
WAGE / INCOME GAP [ $ ]
$11,248
FAMILY INCOME DEFICIT
0.49
INEQUALITY / GINI INDEX
40,923
TOTAL POPULATION
21,197
MALE POPULATION
19,726
FEMALE POPULATION
107.46
MALES / 100 FEMALES
93.06
FEMALES / 100 MALES
37.8
MEDIAN AGE
3.0
AVG FAMILY SIZE
2.2
AVG HOUSEHOLD SIZE
22,238
LABOR FORCE [ PEOPLE ]
66.8%
PERCENT IN LABOR FORCE
6.1%
UNEMPLOYMENT RATE
Covington Area Codes
Income in Covington
Income Overview in Covington
Per Capita Income in Covington is $33,868, while median incomes of families and households are $74,007 and $53,770 respectively.
| Characteristic | Number | Measure |
| Per Capita Income | 40,923 | $33,868 |
| Median Family Income | 9,168 | $74,007 |
| Mean Family Income | 9,168 | $95,100 |
| Median Household Income | 18,243 | $53,770 |
| Mean Household Income | 18,243 | $74,921 |
| Income Deficit | 9,168 | $11,248 |
| Wage / Income Gap (%) | 40,923 | 15.13% |
| Wage / Income Gap ($) | 40,923 | 84.87¢ per $1 |
| Gini / Inequality Index | 40,923 | 0.49 |
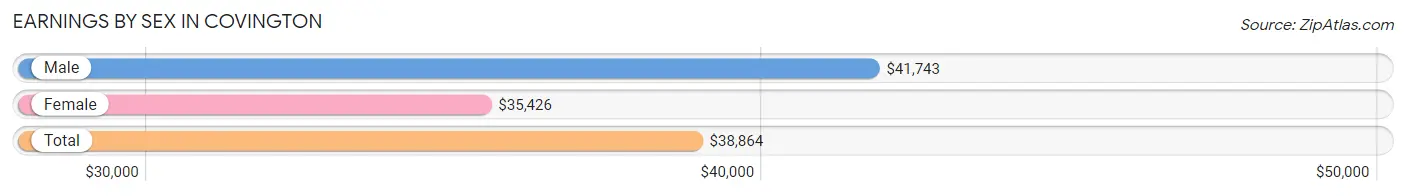
Earnings by Sex in Covington
Average Earnings in Covington are $38,864, $41,743 for men and $35,426 for women, a difference of 15.1%.
| Sex | Number | Average Earnings |
| Male | 12,424 (53.8%) | $41,743 |
| Female | 10,647 (46.2%) | $35,426 |
| Total | 23,071 (100.0%) | $38,864 |
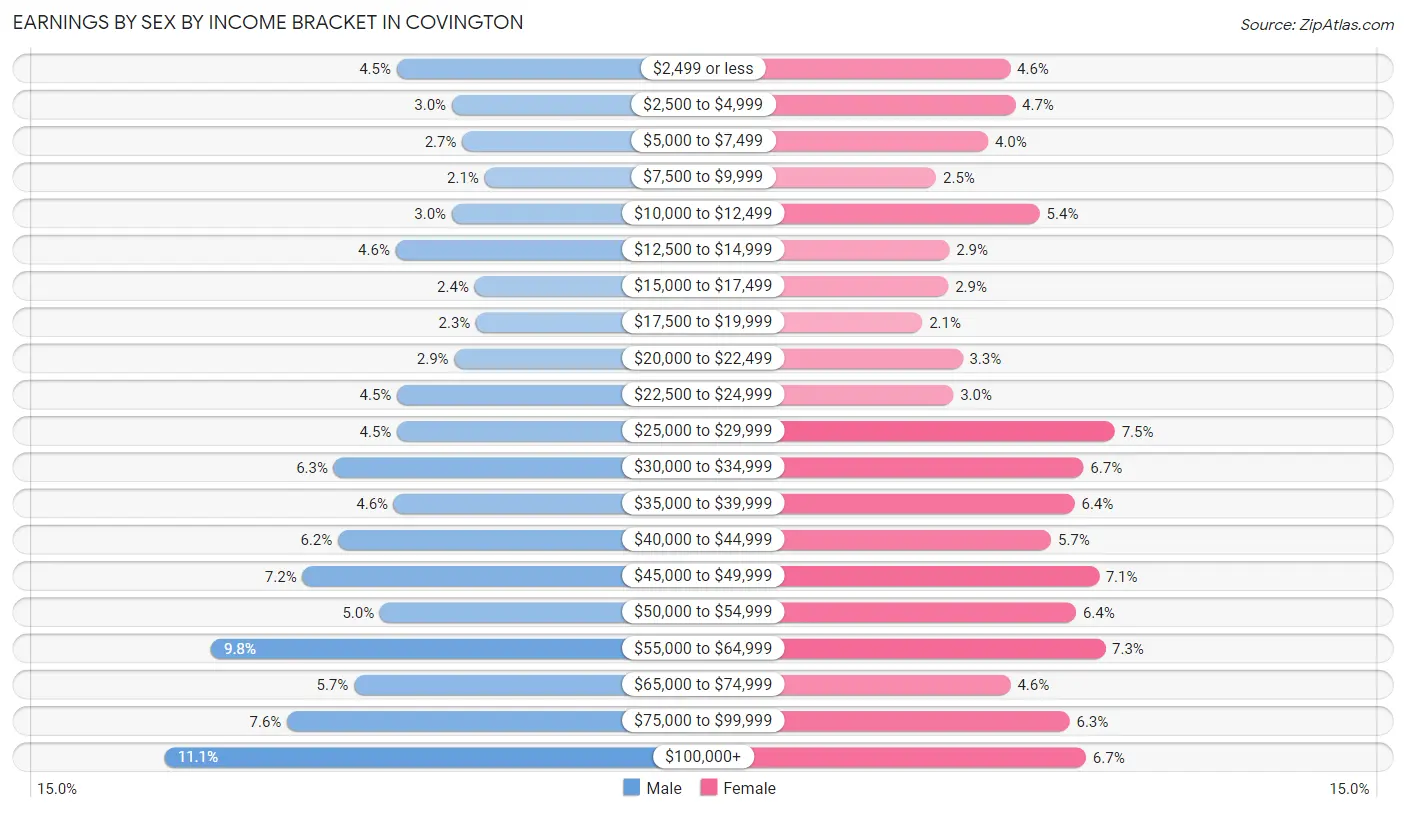
Earnings by Sex by Income Bracket in Covington
The most common earnings brackets in Covington are $100,000+ for men (1,374 | 11.1%) and $25,000 to $29,999 for women (802 | 7.5%).
| Income | Male | Female |
| $2,499 or less | 564 (4.5%) | 489 (4.6%) |
| $2,500 to $4,999 | 372 (3.0%) | 504 (4.7%) |
| $5,000 to $7,499 | 335 (2.7%) | 423 (4.0%) |
| $7,500 to $9,999 | 257 (2.1%) | 267 (2.5%) |
| $10,000 to $12,499 | 372 (3.0%) | 577 (5.4%) |
| $12,500 to $14,999 | 568 (4.6%) | 307 (2.9%) |
| $15,000 to $17,499 | 292 (2.4%) | 303 (2.9%) |
| $17,500 to $19,999 | 287 (2.3%) | 226 (2.1%) |
| $20,000 to $22,499 | 363 (2.9%) | 346 (3.3%) |
| $22,500 to $24,999 | 563 (4.5%) | 318 (3.0%) |
| $25,000 to $29,999 | 563 (4.5%) | 802 (7.5%) |
| $30,000 to $34,999 | 784 (6.3%) | 708 (6.7%) |
| $35,000 to $39,999 | 574 (4.6%) | 681 (6.4%) |
| $40,000 to $44,999 | 769 (6.2%) | 611 (5.7%) |
| $45,000 to $49,999 | 893 (7.2%) | 754 (7.1%) |
| $50,000 to $54,999 | 622 (5.0%) | 686 (6.4%) |
| $55,000 to $64,999 | 1,212 (9.8%) | 773 (7.3%) |
| $65,000 to $74,999 | 713 (5.7%) | 490 (4.6%) |
| $75,000 to $99,999 | 947 (7.6%) | 666 (6.3%) |
| $100,000+ | 1,374 (11.1%) | 716 (6.7%) |
| Total | 12,424 (100.0%) | 10,647 (100.0%) |
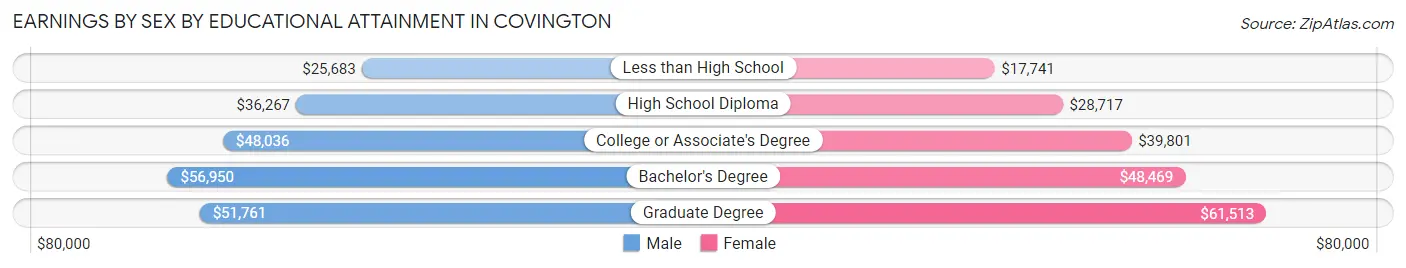
Earnings by Sex by Educational Attainment in Covington
Average earnings in Covington are $45,563 for men and $38,309 for women, a difference of 15.9%. Men with an educational attainment of bachelor's degree enjoy the highest average annual earnings of $56,950, while those with less than high school education earn the least with $25,683. Women with an educational attainment of graduate degree earn the most with the average annual earnings of $61,513, while those with less than high school education have the smallest earnings of $17,741.
| Educational Attainment | Male Income | Female Income |
| Less than High School | $25,683 | $17,741 |
| High School Diploma | $36,267 | $28,717 |
| College or Associate's Degree | $48,036 | $39,801 |
| Bachelor's Degree | $56,950 | $48,469 |
| Graduate Degree | $51,761 | $61,513 |
| Total | $45,563 | $38,309 |
Family Income in Covington
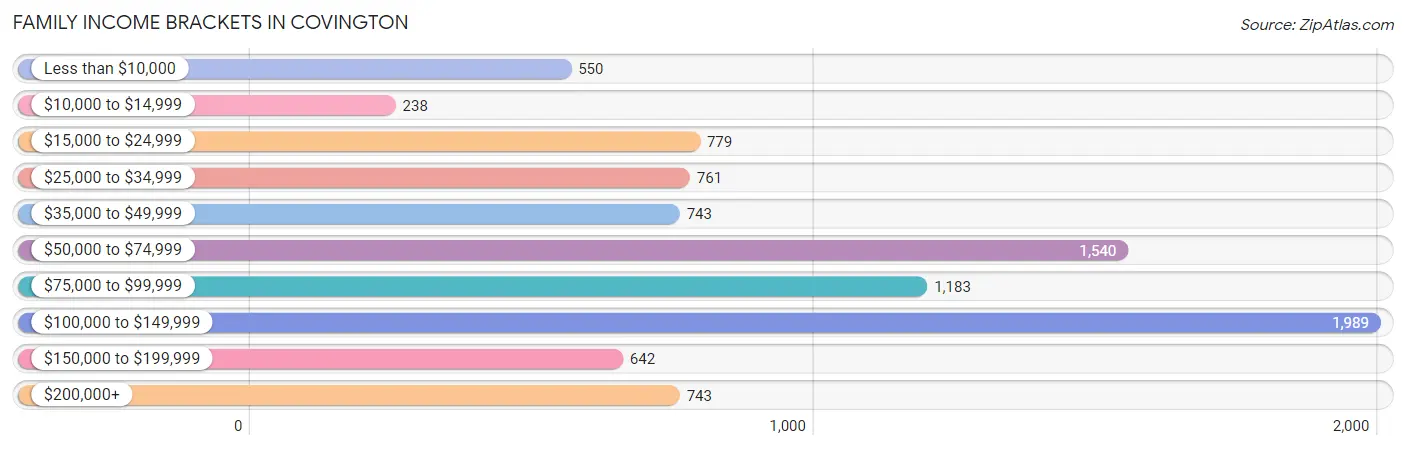
Family Income Brackets in Covington
According to the Covington family income data, there are 1,989 families falling into the $100,000 to $149,999 income range, which is the most common income bracket and makes up 21.7% of all families. Conversely, the $10,000 to $14,999 income bracket is the least frequent group with only 238 families (2.6%) belonging to this category.
| Income Bracket | # Families | % Families |
| Less than $10,000 | 550 | 6.0% |
| $10,000 to $14,999 | 238 | 2.6% |
| $15,000 to $24,999 | 779 | 8.5% |
| $25,000 to $34,999 | 761 | 8.3% |
| $35,000 to $49,999 | 743 | 8.1% |
| $50,000 to $74,999 | 1,540 | 16.8% |
| $75,000 to $99,999 | 1,183 | 12.9% |
| $100,000 to $149,999 | 1,989 | 21.7% |
| $150,000 to $199,999 | 642 | 7.0% |
| $200,000+ | 743 | 8.1% |
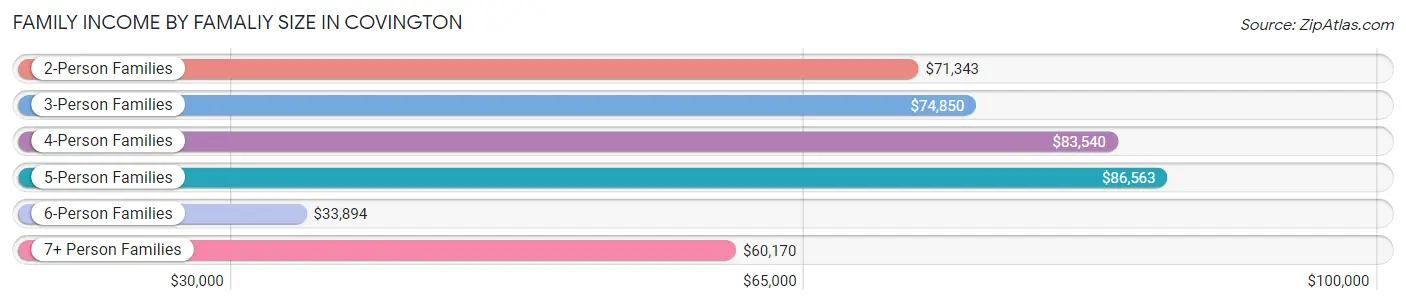
Family Income by Famaliy Size in Covington
5-person families (588 | 6.4%) account for the highest median family income in Covington with $86,563 per family, while 2-person families (4,623 | 50.4%) have the highest median income of $35,672 per family member.
| Income Bracket | # Families | Median Income |
| 2-Person Families | 4,623 (50.4%) | $71,343 |
| 3-Person Families | 2,107 (23.0%) | $74,850 |
| 4-Person Families | 1,534 (16.7%) | $83,540 |
| 5-Person Families | 588 (6.4%) | $86,563 |
| 6-Person Families | 193 (2.1%) | $33,894 |
| 7+ Person Families | 123 (1.3%) | $60,170 |
| Total | 9,168 (100.0%) | $74,007 |
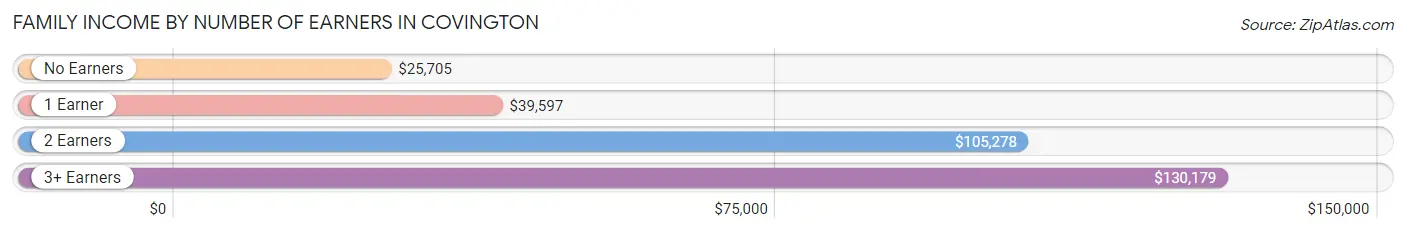
Family Income by Number of Earners in Covington
The median family income in Covington is $74,007, with families comprising 3+ earners (882) having the highest median family income of $130,179, while families with no earners (1,208) have the lowest median family income of $25,705, accounting for 9.6% and 13.2% of families, respectively.
| Number of Earners | # Families | Median Income |
| No Earners | 1,208 (13.2%) | $25,705 |
| 1 Earner | 3,108 (33.9%) | $39,597 |
| 2 Earners | 3,970 (43.3%) | $105,278 |
| 3+ Earners | 882 (9.6%) | $130,179 |
| Total | 9,168 (100.0%) | $74,007 |
Household Income in Covington
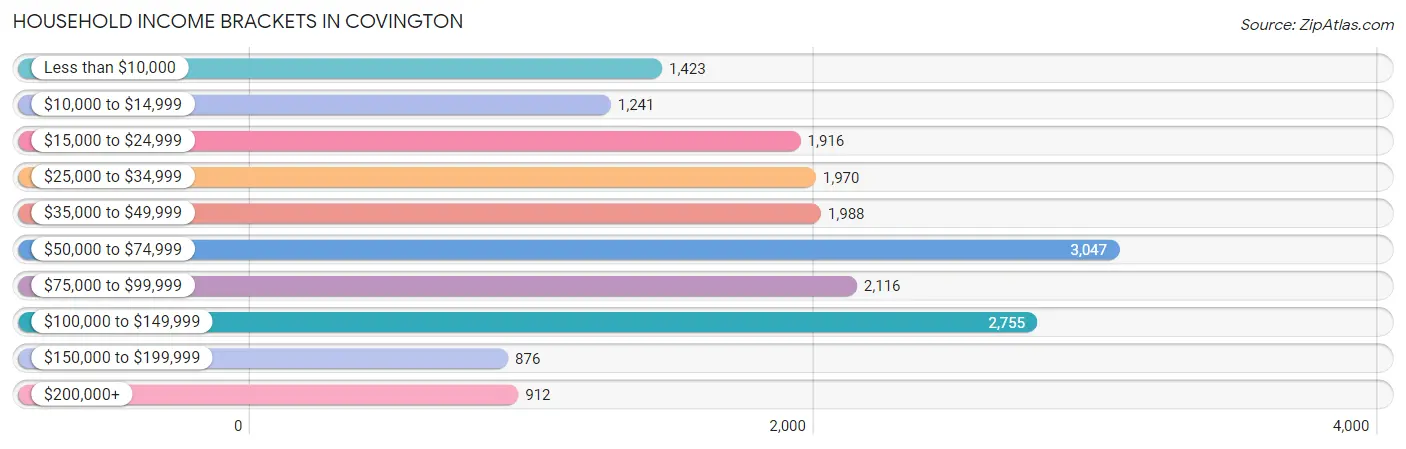
Household Income Brackets in Covington
With 3,047 households falling in the category, the $50,000 to $74,999 income range is the most frequent in Covington, accounting for 16.7% of all households. In contrast, only 876 households (4.8%) fall into the $150,000 to $199,999 income bracket, making it the least populous group.
| Income Bracket | # Households | % Households |
| Less than $10,000 | 1,423 | 7.8% |
| $10,000 to $14,999 | 1,241 | 6.8% |
| $15,000 to $24,999 | 1,916 | 10.5% |
| $25,000 to $34,999 | 1,970 | 10.8% |
| $35,000 to $49,999 | 1,988 | 10.9% |
| $50,000 to $74,999 | 3,047 | 16.7% |
| $75,000 to $99,999 | 2,116 | 11.6% |
| $100,000 to $149,999 | 2,755 | 15.1% |
| $150,000 to $199,999 | 876 | 4.8% |
| $200,000+ | 912 | 5.0% |
Household Income by Householder Age in Covington
The median household income in Covington is $53,770, with the highest median household income of $59,190 found in the 25 to 44 years age bracket for the primary householder. A total of 7,106 households (39.0%) fall into this category. Meanwhile, the 15 to 24 years age bracket for the primary householder has the lowest median household income of $31,958, with 747 households (4.1%) in this group.
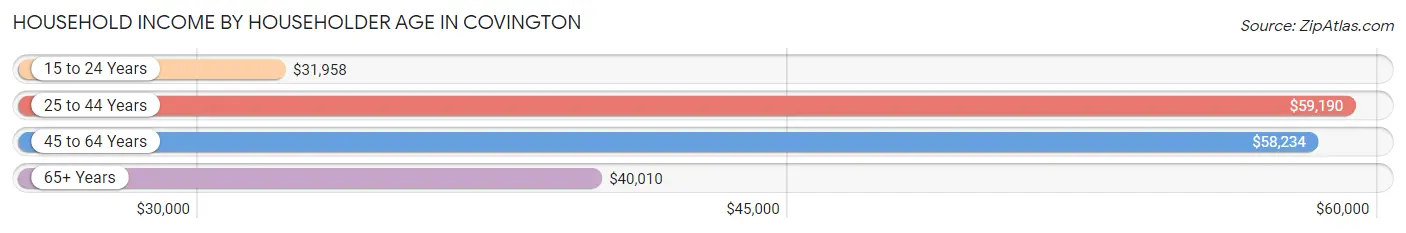
| Income Bracket | # Households | Median Income |
| 15 to 24 Years | 747 (4.1%) | $31,958 |
| 25 to 44 Years | 7,106 (39.0%) | $59,190 |
| 45 to 64 Years | 6,725 (36.9%) | $58,234 |
| 65+ Years | 3,665 (20.1%) | $40,010 |
| Total | 18,243 (100.0%) | $53,770 |
Poverty in Covington
Income Below Poverty by Sex and Age in Covington
With 22.6% poverty level for males and 24.0% for females among the residents of Covington, under 5 year old males and 15 year old females are the most vulnerable to poverty, with 676 males (50.7%) and 88 females (43.8%) in their respective age groups living below the poverty level.
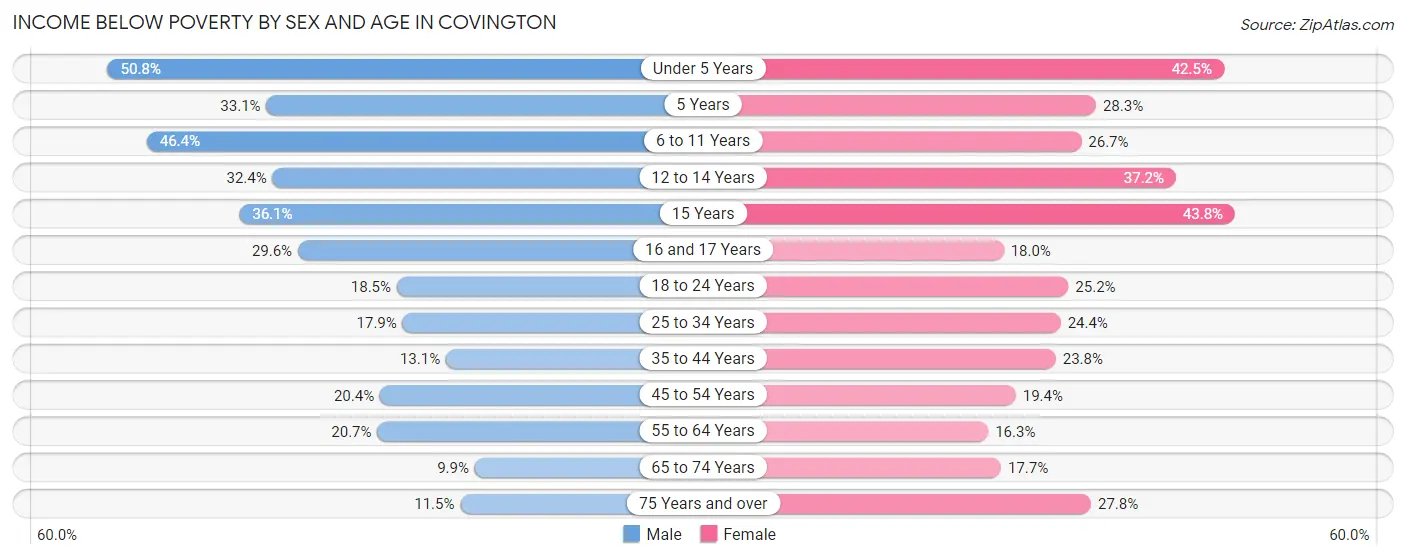
| Age Bracket | Male | Female |
| Under 5 Years | 676 (50.7%) | 555 (42.5%) |
| 5 Years | 84 (33.1%) | 47 (28.3%) |
| 6 to 11 Years | 823 (46.4%) | 350 (26.7%) |
| 12 to 14 Years | 183 (32.4%) | 154 (37.2%) |
| 15 Years | 61 (36.1%) | 88 (43.8%) |
| 16 and 17 Years | 128 (29.6%) | 55 (18.0%) |
| 18 to 24 Years | 281 (18.5%) | 340 (25.2%) |
| 25 to 34 Years | 729 (17.9%) | 783 (24.4%) |
| 35 to 44 Years | 350 (13.1%) | 692 (23.8%) |
| 45 to 54 Years | 464 (20.4%) | 453 (19.4%) |
| 55 to 64 Years | 638 (20.7%) | 470 (16.3%) |
| 65 to 74 Years | 193 (9.9%) | 276 (17.7%) |
| 75 Years and over | 65 (11.5%) | 395 (27.8%) |
| Total | 4,675 (22.6%) | 4,658 (24.0%) |
Income Above Poverty by Sex and Age in Covington
According to the poverty statistics in Covington, males aged 65 to 74 years and females aged 55 to 64 years are the age groups that are most secure financially, with 90.1% of males and 83.7% of females in these age groups living above the poverty line.
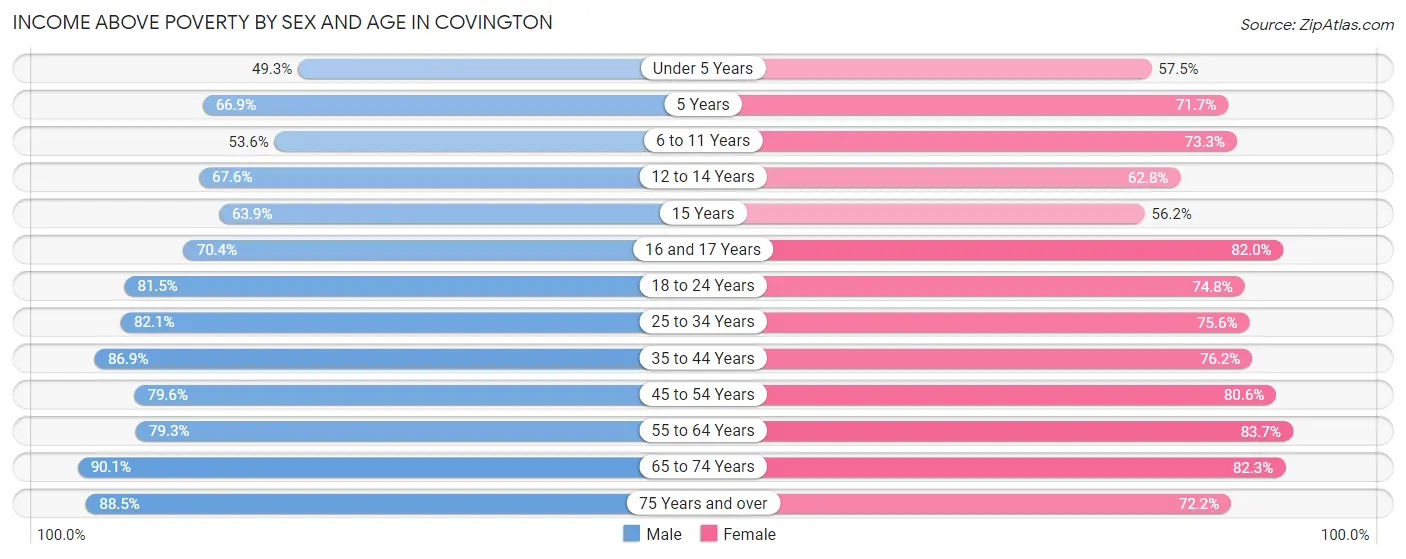
| Age Bracket | Male | Female |
| Under 5 Years | 656 (49.2%) | 750 (57.5%) |
| 5 Years | 170 (66.9%) | 119 (71.7%) |
| 6 to 11 Years | 951 (53.6%) | 962 (73.3%) |
| 12 to 14 Years | 382 (67.6%) | 260 (62.8%) |
| 15 Years | 108 (63.9%) | 113 (56.2%) |
| 16 and 17 Years | 305 (70.4%) | 250 (82.0%) |
| 18 to 24 Years | 1,235 (81.5%) | 1,007 (74.8%) |
| 25 to 34 Years | 3,344 (82.1%) | 2,429 (75.6%) |
| 35 to 44 Years | 2,327 (86.9%) | 2,212 (76.2%) |
| 45 to 54 Years | 1,808 (79.6%) | 1,885 (80.6%) |
| 55 to 64 Years | 2,443 (79.3%) | 2,411 (83.7%) |
| 65 to 74 Years | 1,764 (90.1%) | 1,280 (82.3%) |
| 75 Years and over | 501 (88.5%) | 1,028 (72.2%) |
| Total | 15,994 (77.4%) | 14,706 (75.9%) |
Income Below Poverty Among Married-Couple Families in Covington
The poverty statistics for married-couple families in Covington show that 7.5% or 418 of the total 5,558 families live below the poverty line. Families with 5 or more children have the highest poverty rate of 100.0%, comprising of 36 families. On the other hand, families with no children have the lowest poverty rate of 4.5%, which includes 161 families.
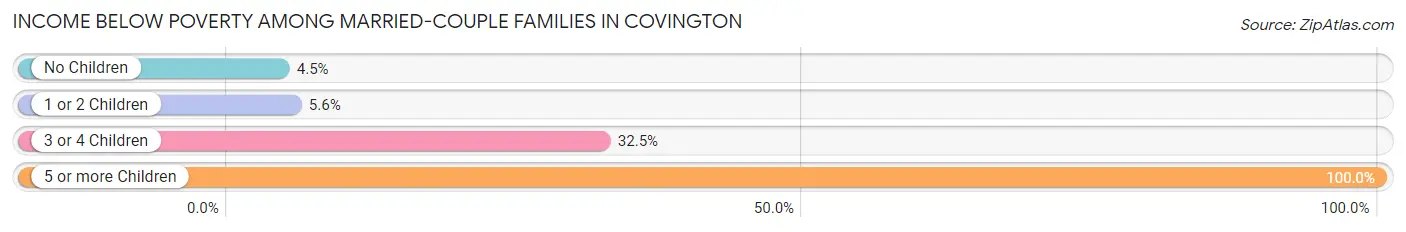
| Children | Above Poverty | Below Poverty |
| No Children | 3,412 (95.5%) | 161 (4.5%) |
| 1 or 2 Children | 1,445 (94.4%) | 85 (5.6%) |
| 3 or 4 Children | 283 (67.5%) | 136 (32.5%) |
| 5 or more Children | 0 (0.0%) | 36 (100.0%) |
| Total | 5,140 (92.5%) | 418 (7.5%) |
Income Below Poverty Among Single-Parent Households in Covington
According to the poverty data in Covington, 28.8% or 340 single-father households and 32.8% or 797 single-mother households are living below the poverty line. Among single-father households, those with 1 or 2 children have the highest poverty rate, with 273 households (46.4%) experiencing poverty. Likewise, among single-mother households, those with 5 or more children have the highest poverty rate, with 42 households (100.0%) falling below the poverty line.
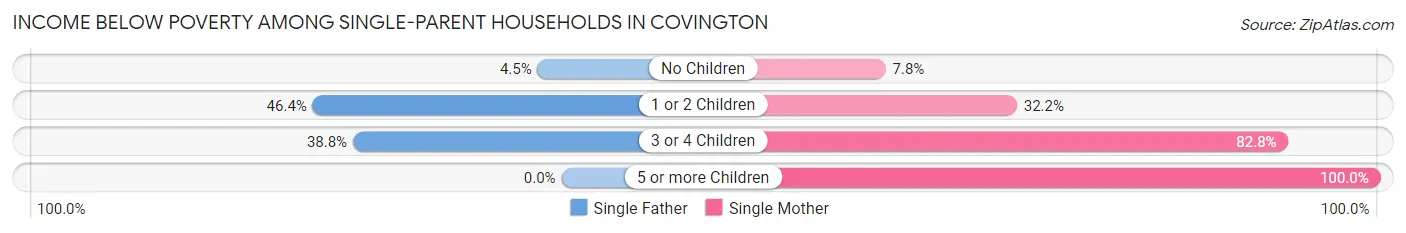
| Children | Single Father | Single Mother |
| No Children | 20 (4.4%) | 63 (7.8%) |
| 1 or 2 Children | 273 (46.4%) | 393 (32.2%) |
| 3 or 4 Children | 47 (38.8%) | 299 (82.8%) |
| 5 or more Children | 0 (0.0%) | 42 (100.0%) |
| Total | 340 (28.8%) | 797 (32.8%) |
Income Below Poverty Among Married-Couple vs Single-Parent Households in Covington
The poverty data for Covington shows that 418 of the married-couple family households (7.5%) and 1,137 of the single-parent households (31.5%) are living below the poverty level. Within the married-couple family households, those with 5 or more children have the highest poverty rate, with 36 households (100.0%) falling below the poverty line. Among the single-parent households, those with 3 or 4 children have the highest poverty rate, with 346 household (71.8%) living below poverty.
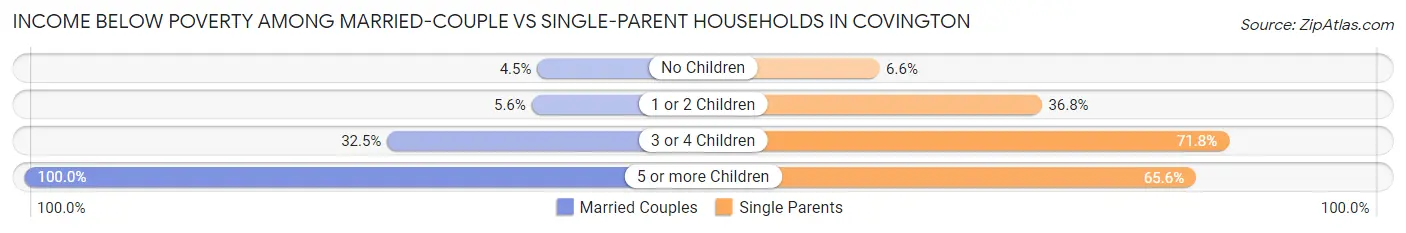
| Children | Married-Couple Families | Single-Parent Households |
| No Children | 161 (4.5%) | 83 (6.6%) |
| 1 or 2 Children | 85 (5.6%) | 666 (36.8%) |
| 3 or 4 Children | 136 (32.5%) | 346 (71.8%) |
| 5 or more Children | 36 (100.0%) | 42 (65.6%) |
| Total | 418 (7.5%) | 1,137 (31.5%) |
Race in Covington
The most populous races in Covington are White / Caucasian (32,047 | 78.3%), Black / African American (3,929 | 9.6%), and Hispanic or Latino (3,481 | 8.5%).
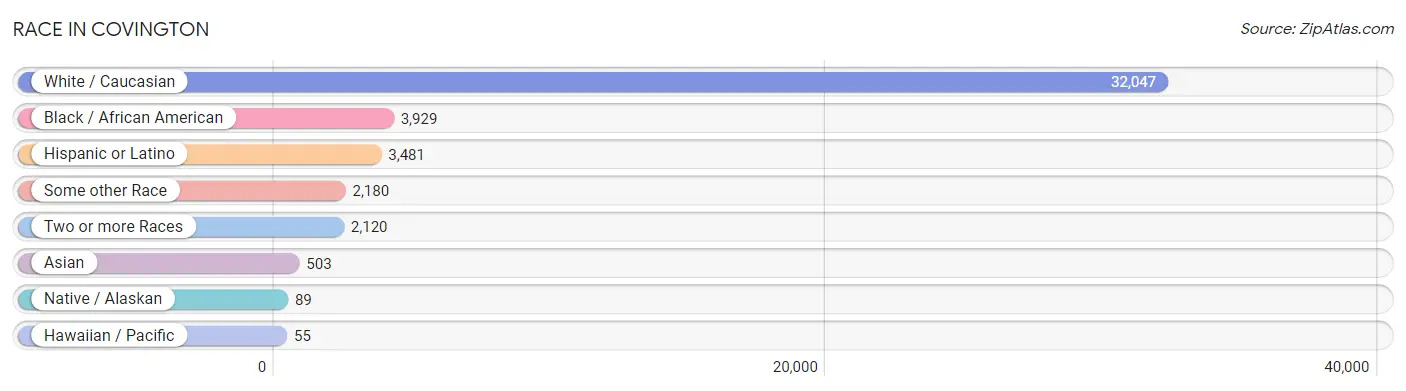
| Race | # Population | % Population |
| Asian | 503 | 1.2% |
| Black / African American | 3,929 | 9.6% |
| Hawaiian / Pacific | 55 | 0.1% |
| Hispanic or Latino | 3,481 | 8.5% |
| Native / Alaskan | 89 | 0.2% |
| White / Caucasian | 32,047 | 78.3% |
| Two or more Races | 2,120 | 5.2% |
| Some other Race | 2,180 | 5.3% |
| Total | 40,923 | 100.0% |
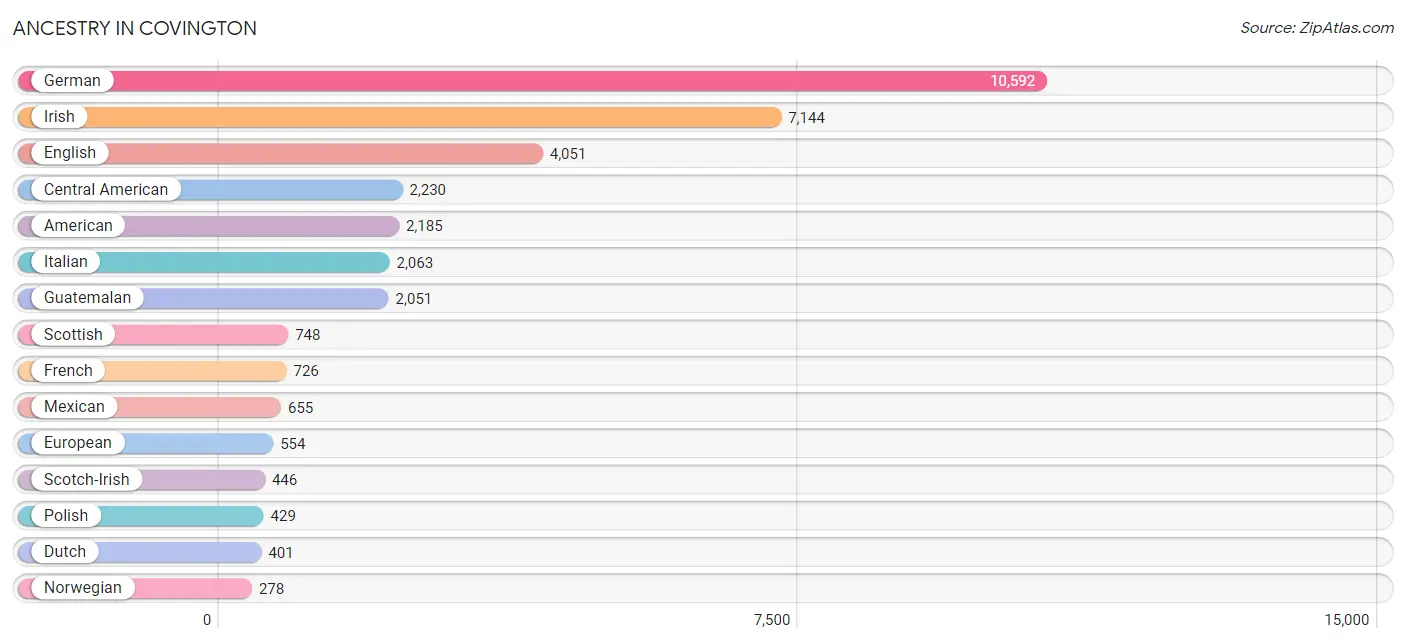
Ancestry in Covington
The most populous ancestries reported in Covington are German (10,592 | 25.9%), Irish (7,144 | 17.5%), English (4,051 | 9.9%), Central American (2,230 | 5.4%), and American (2,185 | 5.3%), together accounting for 64.0% of all Covington residents.
| Ancestry | # Population | % Population |
| African | 85 | 0.2% |
| American | 2,185 | 5.3% |
| Apache | 9 | 0.0% |
| Arab | 190 | 0.5% |
| Armenian | 8 | 0.0% |
| Assyrian / Chaldean / Syriac | 23 | 0.1% |
| Austrian | 12 | 0.0% |
| Belgian | 11 | 0.0% |
| Bhutanese | 45 | 0.1% |
| British | 181 | 0.4% |
| Bulgarian | 9 | 0.0% |
| Burmese | 103 | 0.3% |
| Canadian | 34 | 0.1% |
| Celtic | 24 | 0.1% |
| Central American | 2,230 | 5.4% |
| Central American Indian | 40 | 0.1% |
| Cherokee | 167 | 0.4% |
| Chilean | 16 | 0.0% |
| Choctaw | 17 | 0.0% |
| Colombian | 11 | 0.0% |
| Croatian | 34 | 0.1% |
| Cuban | 73 | 0.2% |
| Czech | 9 | 0.0% |
| Czechoslovakian | 23 | 0.1% |
| Danish | 137 | 0.3% |
| Dominican | 13 | 0.0% |
| Dutch | 401 | 1.0% |
| Eastern European | 51 | 0.1% |
| Egyptian | 3 | 0.0% |
| English | 4,051 | 9.9% |
| European | 554 | 1.3% |
| Finnish | 28 | 0.1% |
| French | 726 | 1.8% |
| French Canadian | 102 | 0.3% |
| German | 10,592 | 25.9% |
| Greek | 73 | 0.2% |
| Guamanian / Chamorro | 18 | 0.0% |
| Guatemalan | 2,051 | 5.0% |
| Honduran | 162 | 0.4% |
| Hungarian | 164 | 0.4% |
| Indian (Asian) | 146 | 0.4% |
| Iranian | 77 | 0.2% |
| Irish | 7,144 | 17.5% |
| Italian | 2,063 | 5.0% |
| Jamaican | 34 | 0.1% |
| Korean | 133 | 0.3% |
| Latvian | 28 | 0.1% |
| Lebanese | 33 | 0.1% |
| Lithuanian | 28 | 0.1% |
| Mexican | 655 | 1.6% |
| Moroccan | 114 | 0.3% |
| Native Hawaiian | 8 | 0.0% |
| Navajo | 1 | 0.0% |
| Northern European | 39 | 0.1% |
| Norwegian | 278 | 0.7% |
| Pakistani | 32 | 0.1% |
| Polish | 429 | 1.1% |
| Portuguese | 19 | 0.1% |
| Puerto Rican | 253 | 0.6% |
| Romanian | 19 | 0.1% |
| Russian | 39 | 0.1% |
| Salvadoran | 17 | 0.0% |
| Samoan | 37 | 0.1% |
| Scandinavian | 36 | 0.1% |
| Scotch-Irish | 446 | 1.1% |
| Scottish | 748 | 1.8% |
| Serbian | 13 | 0.0% |
| Slavic | 36 | 0.1% |
| Slovene | 9 | 0.0% |
| South African | 9 | 0.0% |
| South American | 27 | 0.1% |
| Spaniard | 158 | 0.4% |
| Spanish | 8 | 0.0% |
| Sri Lankan | 153 | 0.4% |
| Subsaharan African | 94 | 0.2% |
| Swedish | 55 | 0.1% |
| Swiss | 43 | 0.1% |
| Thai | 62 | 0.2% |
| Tongan | 18 | 0.0% |
| Ukrainian | 19 | 0.1% |
| Welsh | 234 | 0.6% | View All 81 Rows |
Immigrants in Covington
The most numerous immigrant groups reported in Covington came from Latin America (1,393 | 3.4%), Central America (1,318 | 3.2%), Guatemala (1,008 | 2.5%), Asia (351 | 0.9%), and Africa (233 | 0.6%), together accounting for 10.5% of all Covington residents.
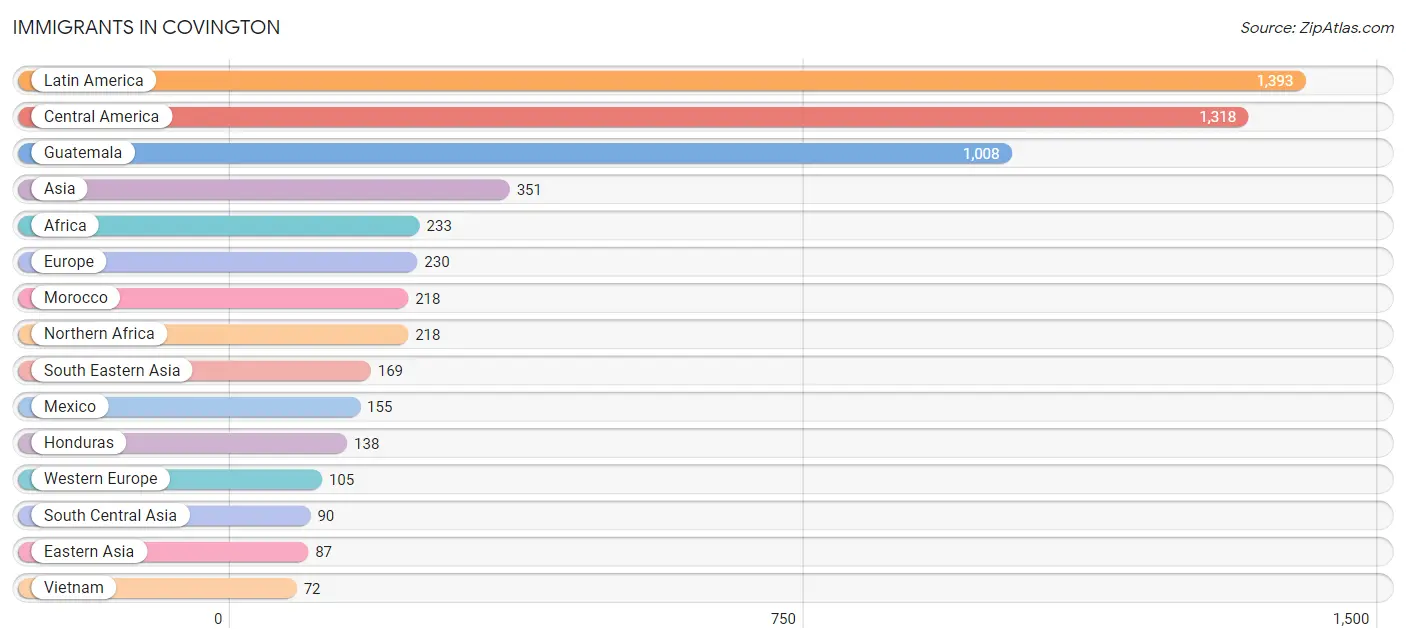
| Immigration Origin | # Population | % Population |
| Africa | 233 | 0.6% |
| Asia | 351 | 0.9% |
| Australia | 6 | 0.0% |
| Canada | 29 | 0.1% |
| Caribbean | 34 | 0.1% |
| Central America | 1,318 | 3.2% |
| Chile | 23 | 0.1% |
| China | 30 | 0.1% |
| Colombia | 11 | 0.0% |
| Eastern Asia | 87 | 0.2% |
| Eastern Europe | 68 | 0.2% |
| El Salvador | 17 | 0.0% |
| England | 13 | 0.0% |
| Europe | 230 | 0.6% |
| France | 38 | 0.1% |
| Germany | 67 | 0.2% |
| Guatemala | 1,008 | 2.5% |
| Honduras | 138 | 0.3% |
| Hungary | 53 | 0.1% |
| India | 67 | 0.2% |
| Iran | 23 | 0.1% |
| Ireland | 17 | 0.0% |
| Jamaica | 34 | 0.1% |
| Japan | 21 | 0.1% |
| Korea | 36 | 0.1% |
| Latin America | 1,393 | 3.4% |
| Latvia | 10 | 0.0% |
| Mexico | 155 | 0.4% |
| Morocco | 218 | 0.5% |
| Northern Africa | 218 | 0.5% |
| Northern Europe | 46 | 0.1% |
| Oceania | 6 | 0.0% |
| Philippines | 65 | 0.2% |
| Poland | 5 | 0.0% |
| South Africa | 15 | 0.0% |
| South America | 41 | 0.1% |
| South Central Asia | 90 | 0.2% |
| South Eastern Asia | 169 | 0.4% |
| Southern Europe | 11 | 0.0% |
| Spain | 11 | 0.0% |
| Syria | 5 | 0.0% |
| Thailand | 32 | 0.1% |
| Venezuela | 7 | 0.0% |
| Vietnam | 72 | 0.2% |
| Western Asia | 5 | 0.0% |
| Western Europe | 105 | 0.3% | View All 46 Rows |
Sex and Age in Covington
Sex and Age in Covington
The most populous age groups in Covington are 30 to 34 Years (2,102 | 9.9%) for men and 35 to 39 Years (1,846 | 9.4%) for women.
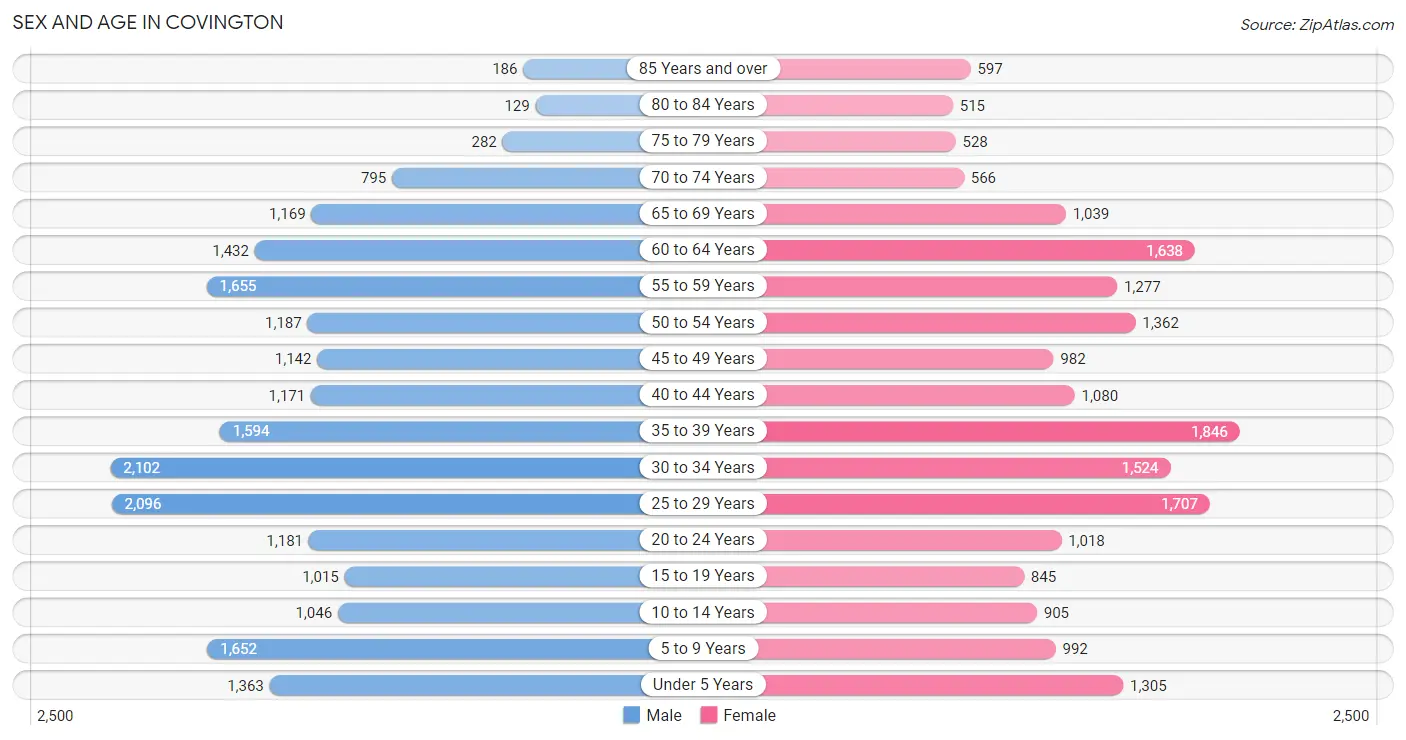
| Age Bracket | Male | Female |
| Under 5 Years | 1,363 (6.4%) | 1,305 (6.6%) |
| 5 to 9 Years | 1,652 (7.8%) | 992 (5.0%) |
| 10 to 14 Years | 1,046 (4.9%) | 905 (4.6%) |
| 15 to 19 Years | 1,015 (4.8%) | 845 (4.3%) |
| 20 to 24 Years | 1,181 (5.6%) | 1,018 (5.2%) |
| 25 to 29 Years | 2,096 (9.9%) | 1,707 (8.6%) |
| 30 to 34 Years | 2,102 (9.9%) | 1,524 (7.7%) |
| 35 to 39 Years | 1,594 (7.5%) | 1,846 (9.4%) |
| 40 to 44 Years | 1,171 (5.5%) | 1,080 (5.5%) |
| 45 to 49 Years | 1,142 (5.4%) | 982 (5.0%) |
| 50 to 54 Years | 1,187 (5.6%) | 1,362 (6.9%) |
| 55 to 59 Years | 1,655 (7.8%) | 1,277 (6.5%) |
| 60 to 64 Years | 1,432 (6.8%) | 1,638 (8.3%) |
| 65 to 69 Years | 1,169 (5.5%) | 1,039 (5.3%) |
| 70 to 74 Years | 795 (3.7%) | 566 (2.9%) |
| 75 to 79 Years | 282 (1.3%) | 528 (2.7%) |
| 80 to 84 Years | 129 (0.6%) | 515 (2.6%) |
| 85 Years and over | 186 (0.9%) | 597 (3.0%) |
| Total | 21,197 (100.0%) | 19,726 (100.0%) |
Families and Households in Covington
Median Family Size in Covington
The median family size in Covington is 2.97 persons per family, with married-couple families (5,558 | 60.6%) accounting for the largest median family size of 3.02 persons per family. On the other hand, single male/father families (1,181 | 12.9%) represent the smallest median family size with 2.69 persons per family.
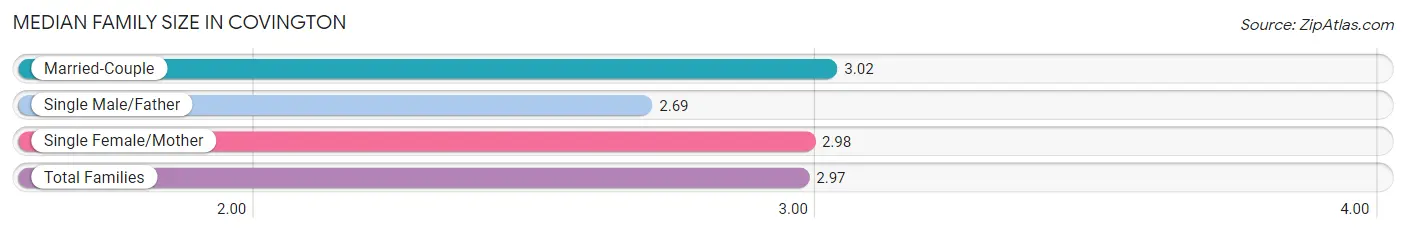
| Family Type | # Families | Family Size |
| Married-Couple | 5,558 (60.6%) | 3.02 |
| Single Male/Father | 1,181 (12.9%) | 2.69 |
| Single Female/Mother | 2,429 (26.5%) | 2.98 |
| Total Families | 9,168 (100.0%) | 2.97 |
Median Household Size in Covington
The median household size in Covington is 2.19 persons per household, with single male/father households (1,181 | 6.5%) accounting for the largest median household size of 3.19 persons per household. non-family households (9,075 | 49.7%) represent the smallest median household size with 1.29 persons per household.
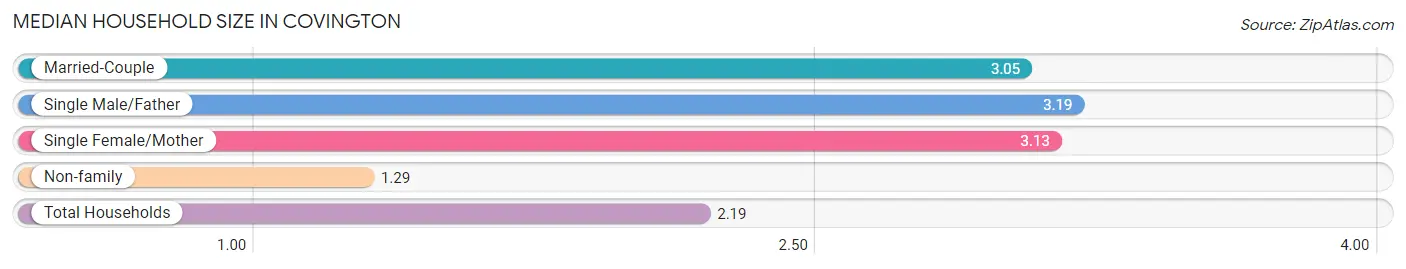
| Household Type | # Households | Household Size |
| Married-Couple | 5,558 (30.5%) | 3.05 |
| Single Male/Father | 1,181 (6.5%) | 3.19 |
| Single Female/Mother | 2,429 (13.3%) | 3.13 |
| Non-family | 9,075 (49.7%) | 1.29 |
| Total Households | 18,243 (100.0%) | 2.19 |
Household Size by Marriage Status in Covington
Out of a total of 18,243 households in Covington, 9,168 (50.2%) are family households, while 9,075 (49.7%) are nonfamily households. The most numerous type of family households are 2-person households, comprising 4,080, and the most common type of nonfamily households are 1-person households, comprising 7,074.
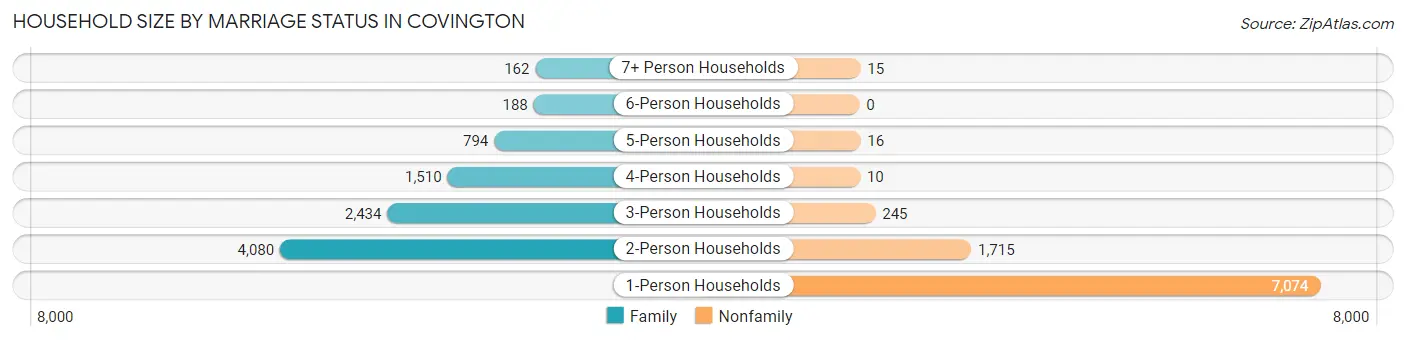
| Household Size | Family Households | Nonfamily Households |
| 1-Person Households | - | 7,074 (38.8%) |
| 2-Person Households | 4,080 (22.4%) | 1,715 (9.4%) |
| 3-Person Households | 2,434 (13.3%) | 245 (1.3%) |
| 4-Person Households | 1,510 (8.3%) | 10 (0.1%) |
| 5-Person Households | 794 (4.3%) | 16 (0.1%) |
| 6-Person Households | 188 (1.0%) | 0 (0.0%) |
| 7+ Person Households | 162 (0.9%) | 15 (0.1%) |
| Total | 9,168 (50.2%) | 9,075 (49.7%) |
Female Fertility in Covington
Fertility by Age in Covington
Average fertility rate in Covington is 49.0 births per 1,000 women. Women in the age bracket of 20 to 34 years have the highest fertility rate with 92.0 births per 1,000 women. Women in the age bracket of 20 to 34 years acount for 87.3% of all women with births.
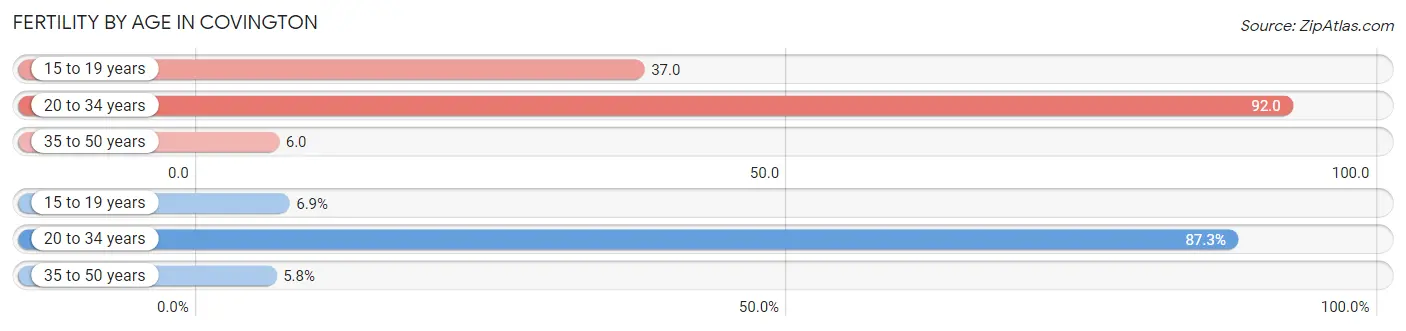
| Age Bracket | Women with Births | Births / 1,000 Women |
| 15 to 19 years | 31 (6.9%) | 37.0 |
| 20 to 34 years | 393 (87.3%) | 92.0 |
| 35 to 50 years | 26 (5.8%) | 6.0 |
| Total | 450 (100.0%) | 49.0 |
Fertility by Age by Marriage Status in Covington
45.1% of women with births (450) in Covington are married. The highest percentage of unmarried women with births falls into 15 to 19 years age bracket with 100.0% of them unmarried at the time of birth, while the lowest percentage of unmarried women with births belong to 20 to 34 years age bracket with 49.1% of them unmarried.
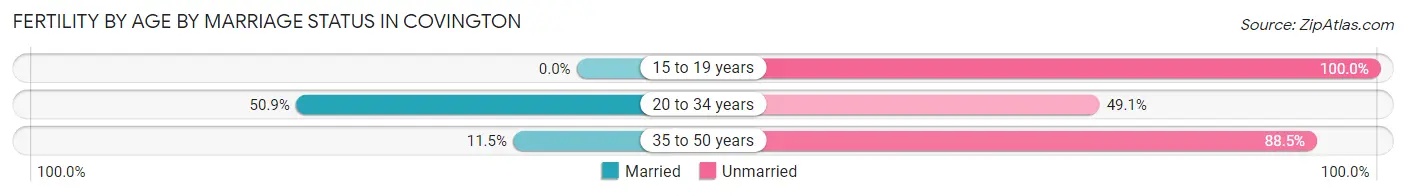
| Age Bracket | Married | Unmarried |
| 15 to 19 years | 0 (0.0%) | 31 (100.0%) |
| 20 to 34 years | 200 (50.9%) | 193 (49.1%) |
| 35 to 50 years | 3 (11.5%) | 23 (88.5%) |
| Total | 203 (45.1%) | 247 (54.9%) |
Fertility by Education in Covington
Average fertility rate in Covington is 49.0 births per 1,000 women. Women with the education attainment of less than high school have the highest fertility rate of 103.0 births per 1,000 women, while women with the education attainment of bachelor's degree have the lowest fertility at 24.0 births per 1,000 women. Women with the education attainment of less than high school represent 34.0% of all women with births.
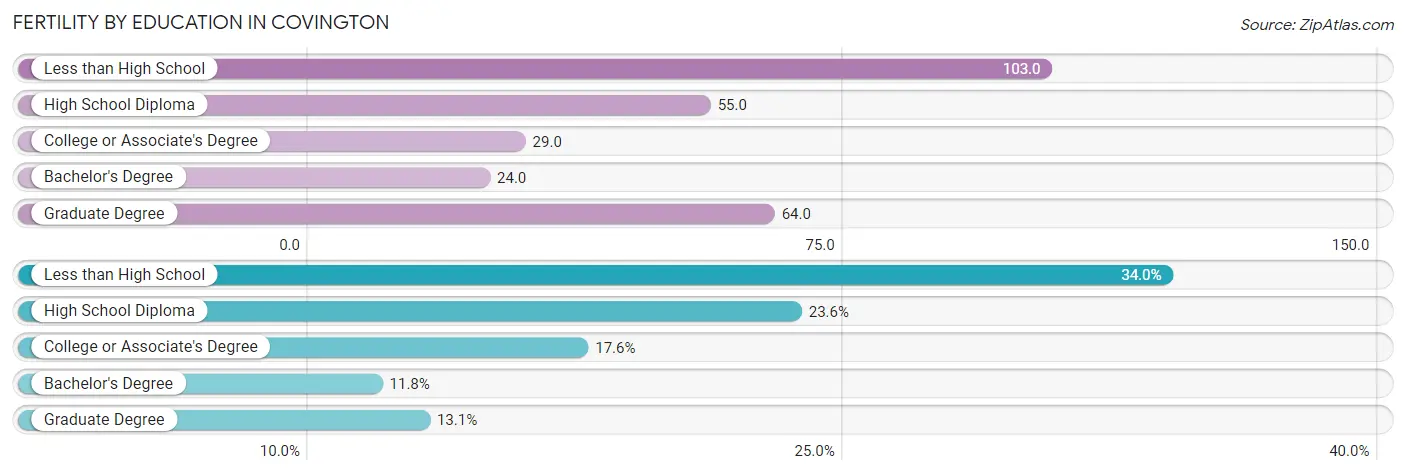
| Educational Attainment | Women with Births | Births / 1,000 Women |
| Less than High School | 153 (34.0%) | 103.0 |
| High School Diploma | 106 (23.6%) | 55.0 |
| College or Associate's Degree | 79 (17.6%) | 29.0 |
| Bachelor's Degree | 53 (11.8%) | 24.0 |
| Graduate Degree | 59 (13.1%) | 64.0 |
| Total | 450 (100.0%) | 49.0 |
Fertility by Education by Marriage Status in Covington
54.9% of women with births in Covington are unmarried. Women with the educational attainment of bachelor's degree are most likely to be married with 100.0% of them married at childbirth, while women with the educational attainment of high school diploma are least likely to be married with 83.0% of them unmarried at childbirth.
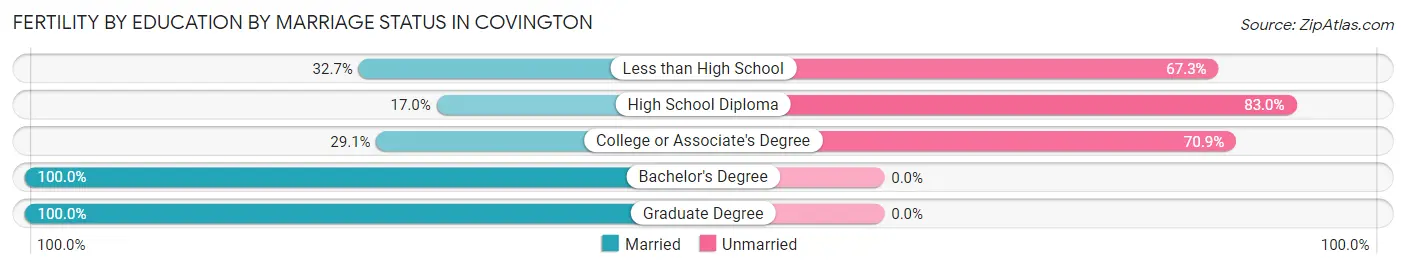
| Educational Attainment | Married | Unmarried |
| Less than High School | 50 (32.7%) | 103 (67.3%) |
| High School Diploma | 18 (17.0%) | 88 (83.0%) |
| College or Associate's Degree | 23 (29.1%) | 56 (70.9%) |
| Bachelor's Degree | 53 (100.0%) | 0 (0.0%) |
| Graduate Degree | 59 (100.0%) | 0 (0.0%) |
| Total | 203 (45.1%) | 247 (54.9%) |
Employment Characteristics in Covington
Employment by Class of Employer in Covington
Among the 20,475 employed individuals in Covington, private company employees (14,554 | 71.1%), not-for-profit organizations (2,371 | 11.6%), and self-employed (not incorporated) (1,127 | 5.5%) make up the most common classes of employment.
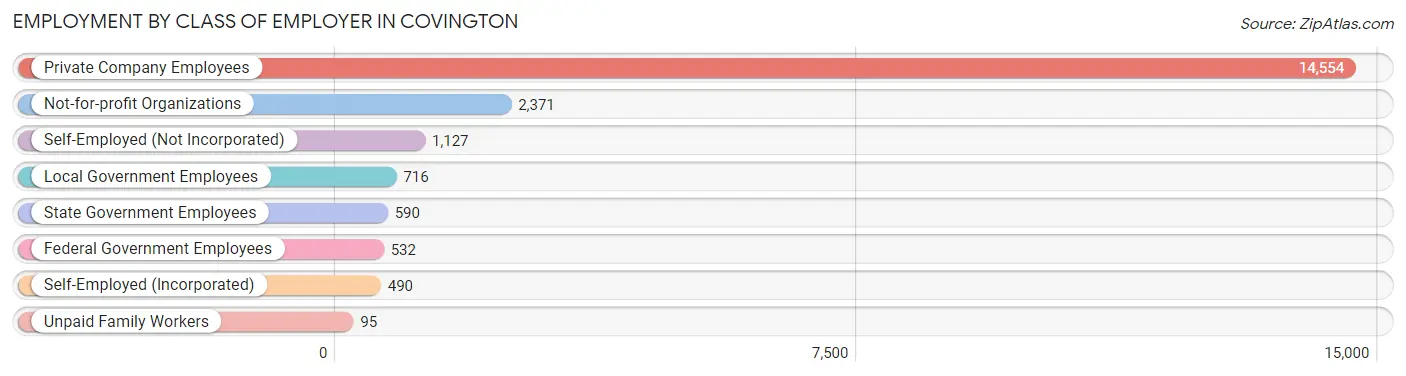
| Employer Class | # Employees | % Employees |
| Private Company Employees | 14,554 | 71.1% |
| Self-Employed (Incorporated) | 490 | 2.4% |
| Self-Employed (Not Incorporated) | 1,127 | 5.5% |
| Not-for-profit Organizations | 2,371 | 11.6% |
| Local Government Employees | 716 | 3.5% |
| State Government Employees | 590 | 2.9% |
| Federal Government Employees | 532 | 2.6% |
| Unpaid Family Workers | 95 | 0.5% |
| Total | 20,475 | 100.0% |
Employment Status by Age in Covington
According to the labor force statistics for Covington, out of the total population over 16 years of age (33,290), 66.8% or 22,238 individuals are in the labor force, with 6.1% or 1,357 of them unemployed. The age group with the highest labor force participation rate is 20 to 24 years, with 85.2% or 1,874 individuals in the labor force. Within the labor force, the 16 to 19 years age range has the highest percentage of unemployed individuals, with 20.3% or 150 of them being unemployed.
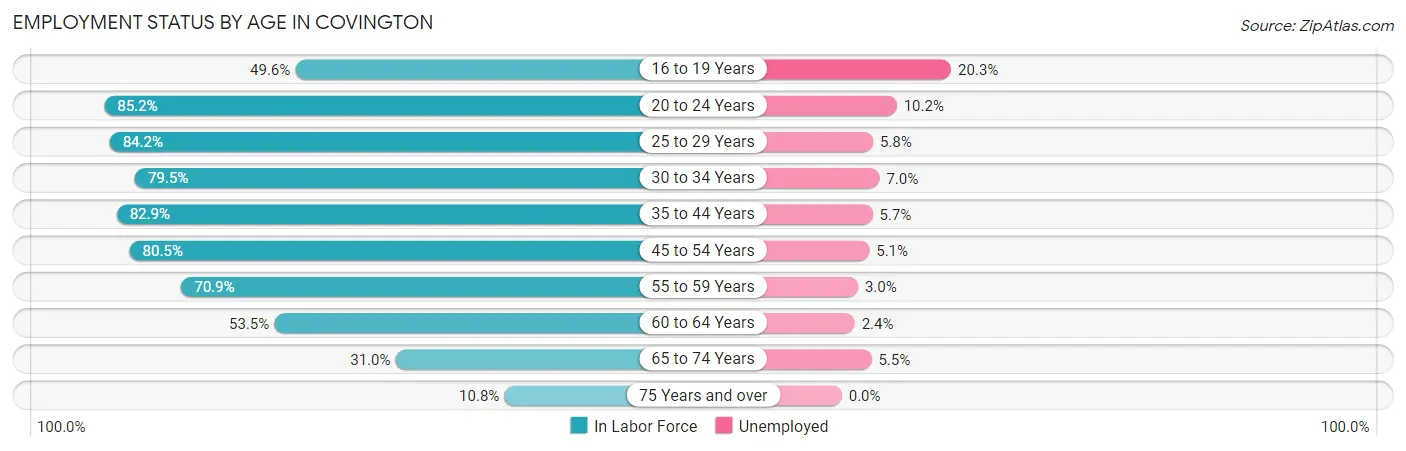
| Age Bracket | In Labor Force | Unemployed |
| 16 to 19 Years | 739 (49.6%) | 150 (20.3%) |
| 20 to 24 Years | 1,874 (85.2%) | 191 (10.2%) |
| 25 to 29 Years | 3,202 (84.2%) | 186 (5.8%) |
| 30 to 34 Years | 2,883 (79.5%) | 202 (7.0%) |
| 35 to 44 Years | 4,718 (82.9%) | 269 (5.7%) |
| 45 to 54 Years | 3,762 (80.5%) | 192 (5.1%) |
| 55 to 59 Years | 2,079 (70.9%) | 62 (3.0%) |
| 60 to 64 Years | 1,642 (53.5%) | 39 (2.4%) |
| 65 to 74 Years | 1,106 (31.0%) | 61 (5.5%) |
| 75 Years and over | 242 (10.8%) | 0 (0.0%) |
| Total | 22,238 (66.8%) | 1,357 (6.1%) |
Employment Status by Educational Attainment in Covington
According to labor force statistics for Covington, 76.8% of individuals (18,275) out of the total population between 25 and 64 years of age (23,795) are in the labor force, with 5.2% or 950 of them being unemployed. The group with the highest labor force participation rate are those with the educational attainment of bachelor's degree or higher, with 92.2% or 7,015 individuals in the labor force. Within the labor force, individuals with less than high school education have the highest percentage of unemployment, with 12.0% or 202 of them being unemployed.
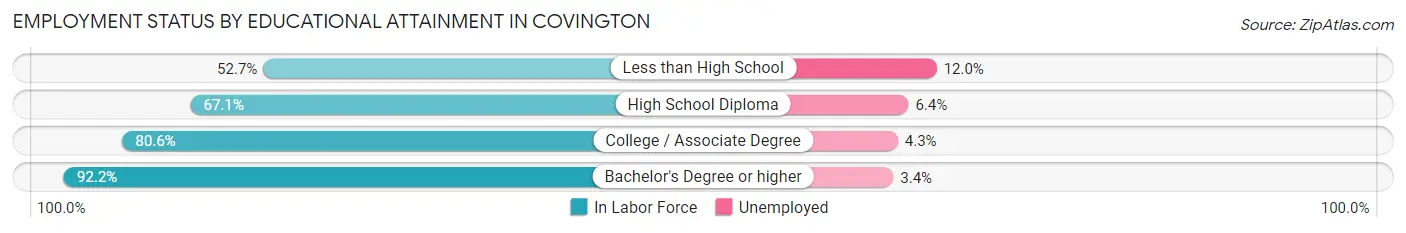
| Educational Attainment | In Labor Force | Unemployed |
| Less than High School | 1,683 (52.7%) | 383 (12.0%) |
| High School Diploma | 4,446 (67.1%) | 424 (6.4%) |
| College / Associate Degree | 5,133 (80.6%) | 274 (4.3%) |
| Bachelor's Degree or higher | 7,015 (92.2%) | 259 (3.4%) |
| Total | 18,275 (76.8%) | 1,237 (5.2%) |
Employment Occupations by Sex in Covington
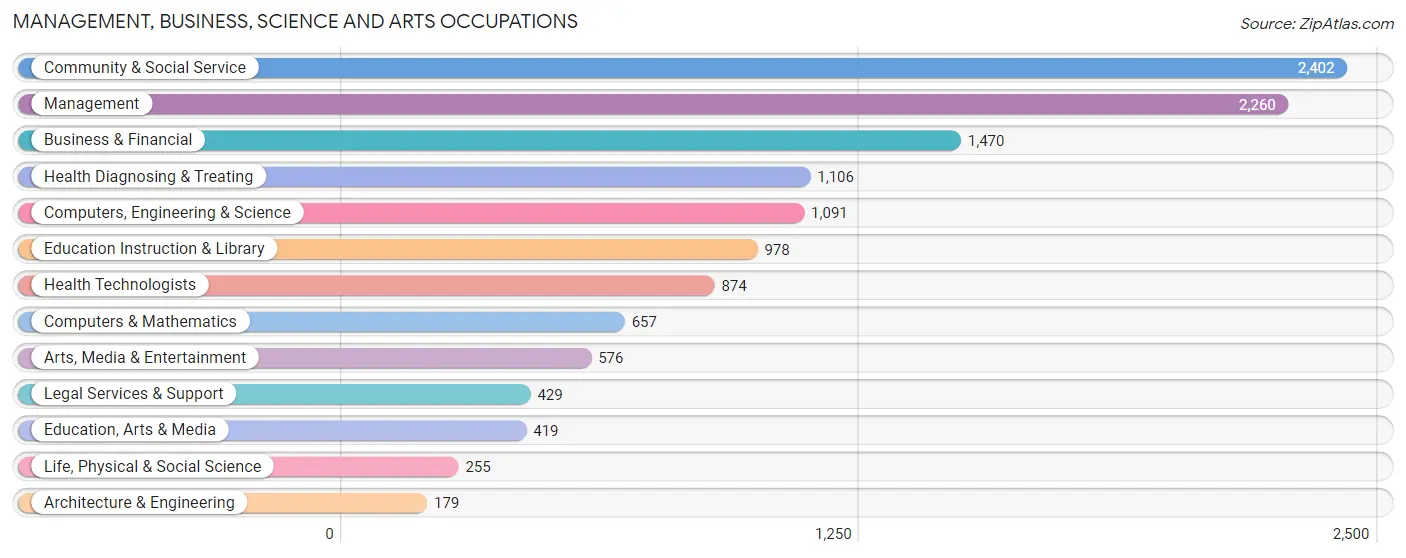
Management, Business, Science and Arts Occupations
The most common Management, Business, Science and Arts occupations in Covington are Community & Social Service (2,402 | 11.5%), Management (2,260 | 10.8%), Business & Financial (1,470 | 7.0%), Health Diagnosing & Treating (1,106 | 5.3%), and Computers, Engineering & Science (1,091 | 5.2%).
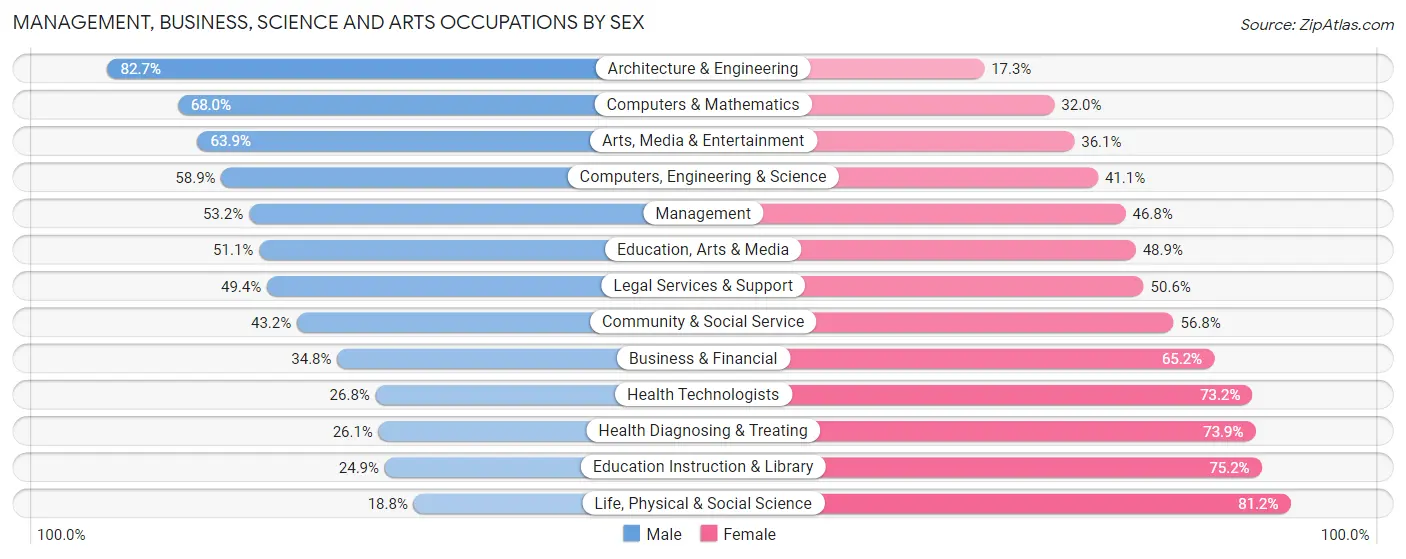
Management, Business, Science and Arts Occupations by Sex
Within the Management, Business, Science and Arts occupations in Covington, the most male-oriented occupations are Architecture & Engineering (82.7%), Computers & Mathematics (68.0%), and Arts, Media & Entertainment (63.9%), while the most female-oriented occupations are Life, Physical & Social Science (81.2%), Education Instruction & Library (75.1%), and Health Diagnosing & Treating (73.9%).
| Occupation | Male | Female |
| Management | 1,202 (53.2%) | 1,058 (46.8%) |
| Business & Financial | 511 (34.8%) | 959 (65.2%) |
| Computers, Engineering & Science | 643 (58.9%) | 448 (41.1%) |
| Computers & Mathematics | 447 (68.0%) | 210 (32.0%) |
| Architecture & Engineering | 148 (82.7%) | 31 (17.3%) |
| Life, Physical & Social Science | 48 (18.8%) | 207 (81.2%) |
| Community & Social Service | 1,037 (43.2%) | 1,365 (56.8%) |
| Education, Arts & Media | 214 (51.1%) | 205 (48.9%) |
| Legal Services & Support | 212 (49.4%) | 217 (50.6%) |
| Education Instruction & Library | 243 (24.8%) | 735 (75.1%) |
| Arts, Media & Entertainment | 368 (63.9%) | 208 (36.1%) |
| Health Diagnosing & Treating | 289 (26.1%) | 817 (73.9%) |
| Health Technologists | 234 (26.8%) | 640 (73.2%) |
| Total (Category) | 3,682 (44.2%) | 4,647 (55.8%) |
| Total (Overall) | 11,110 (53.2%) | 9,782 (46.8%) |
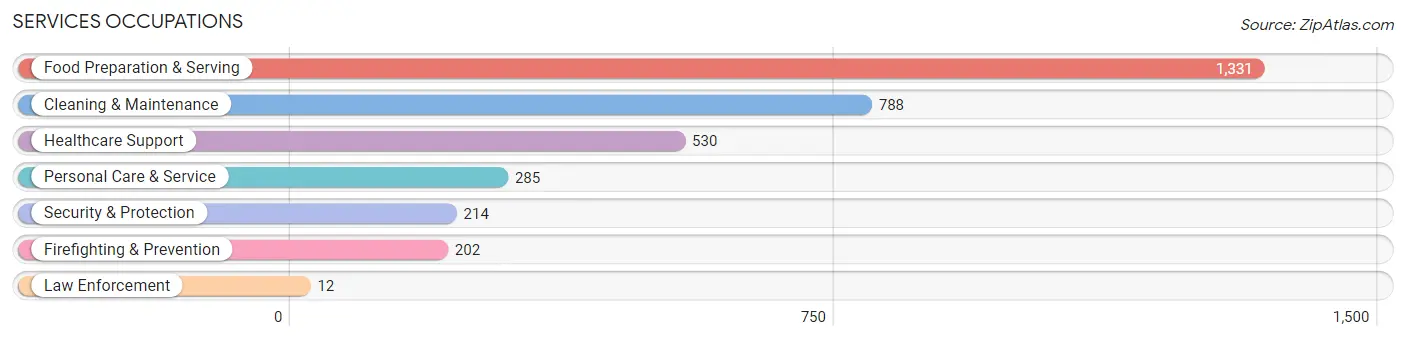
Services Occupations
The most common Services occupations in Covington are Food Preparation & Serving (1,331 | 6.4%), Cleaning & Maintenance (788 | 3.8%), Healthcare Support (530 | 2.5%), Personal Care & Service (285 | 1.4%), and Security & Protection (214 | 1.0%).
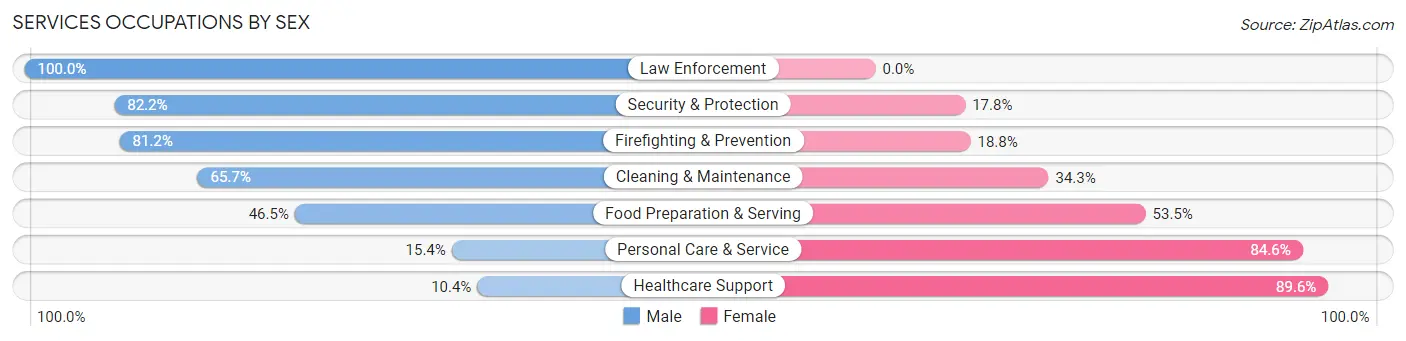
Services Occupations by Sex
Within the Services occupations in Covington, the most male-oriented occupations are Law Enforcement (100.0%), Security & Protection (82.2%), and Firefighting & Prevention (81.2%), while the most female-oriented occupations are Healthcare Support (89.6%), Personal Care & Service (84.6%), and Food Preparation & Serving (53.5%).
| Occupation | Male | Female |
| Healthcare Support | 55 (10.4%) | 475 (89.6%) |
| Security & Protection | 176 (82.2%) | 38 (17.8%) |
| Firefighting & Prevention | 164 (81.2%) | 38 (18.8%) |
| Law Enforcement | 12 (100.0%) | 0 (0.0%) |
| Food Preparation & Serving | 619 (46.5%) | 712 (53.5%) |
| Cleaning & Maintenance | 518 (65.7%) | 270 (34.3%) |
| Personal Care & Service | 44 (15.4%) | 241 (84.6%) |
| Total (Category) | 1,412 (44.9%) | 1,736 (55.1%) |
| Total (Overall) | 11,110 (53.2%) | 9,782 (46.8%) |
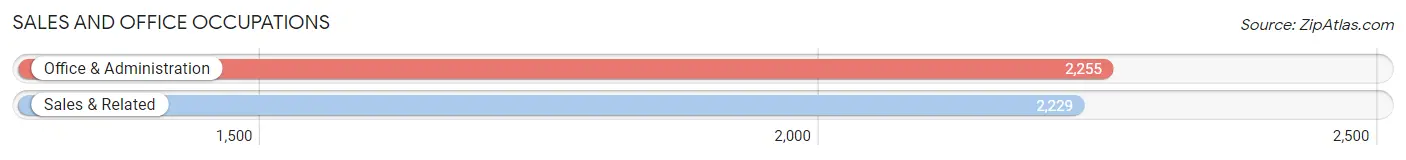
Sales and Office Occupations
The most common Sales and Office occupations in Covington are Office & Administration (2,255 | 10.8%), and Sales & Related (2,229 | 10.7%).
Sales and Office Occupations by Sex
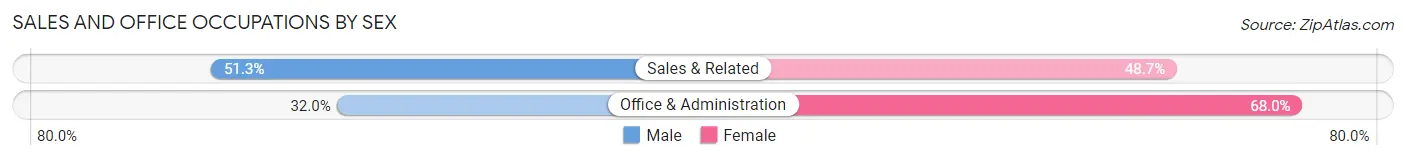
| Occupation | Male | Female |
| Sales & Related | 1,144 (51.3%) | 1,085 (48.7%) |
| Office & Administration | 722 (32.0%) | 1,533 (68.0%) |
| Total (Category) | 1,866 (41.6%) | 2,618 (58.4%) |
| Total (Overall) | 11,110 (53.2%) | 9,782 (46.8%) |
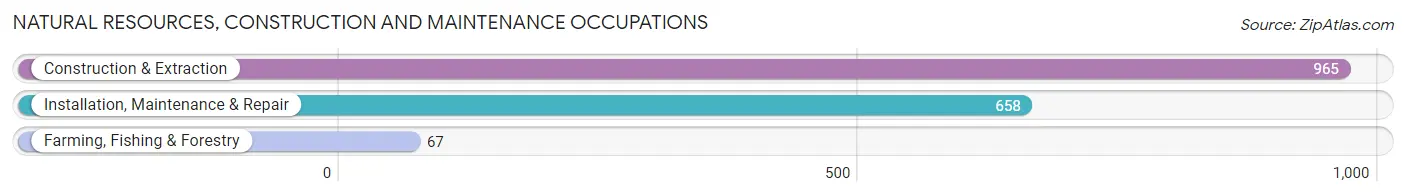
Natural Resources, Construction and Maintenance Occupations
The most common Natural Resources, Construction and Maintenance occupations in Covington are Construction & Extraction (965 | 4.6%), Installation, Maintenance & Repair (658 | 3.2%), and Farming, Fishing & Forestry (67 | 0.3%).
Natural Resources, Construction and Maintenance Occupations by Sex
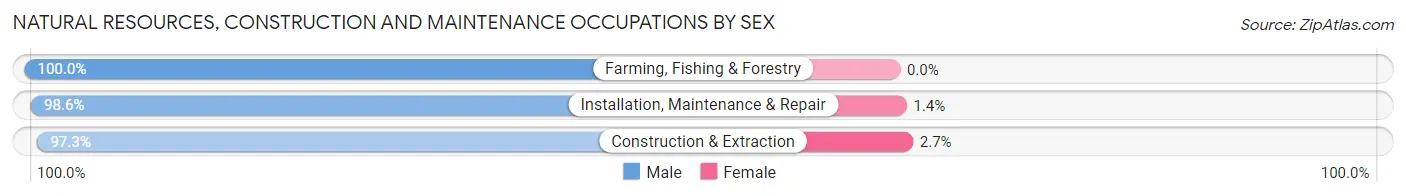
| Occupation | Male | Female |
| Farming, Fishing & Forestry | 67 (100.0%) | 0 (0.0%) |
| Construction & Extraction | 939 (97.3%) | 26 (2.7%) |
| Installation, Maintenance & Repair | 649 (98.6%) | 9 (1.4%) |
| Total (Category) | 1,655 (97.9%) | 35 (2.1%) |
| Total (Overall) | 11,110 (53.2%) | 9,782 (46.8%) |
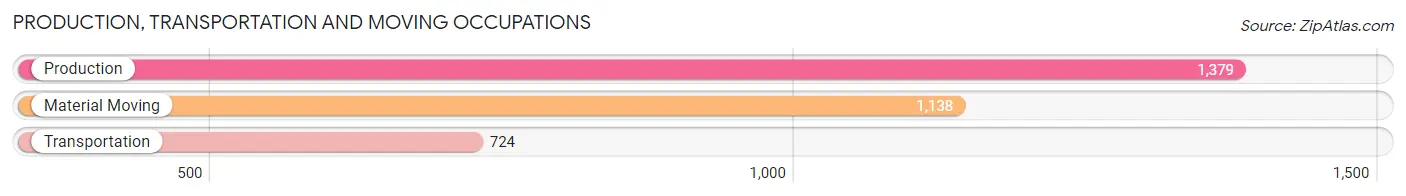
Production, Transportation and Moving Occupations
The most common Production, Transportation and Moving occupations in Covington are Production (1,379 | 6.6%), Material Moving (1,138 | 5.4%), and Transportation (724 | 3.5%).
Production, Transportation and Moving Occupations by Sex
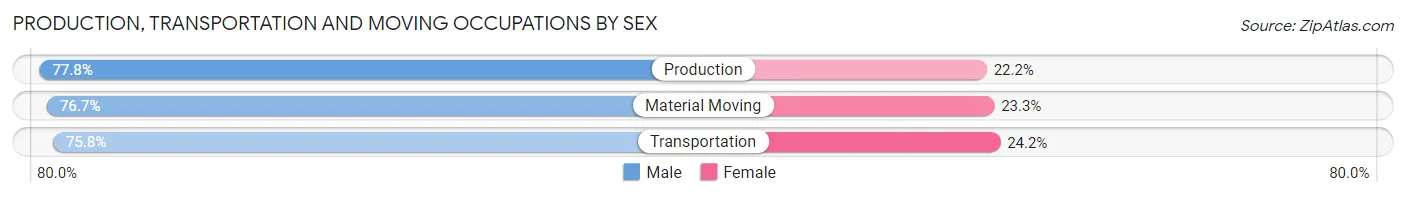
| Occupation | Male | Female |
| Production | 1,073 (77.8%) | 306 (22.2%) |
| Transportation | 549 (75.8%) | 175 (24.2%) |
| Material Moving | 873 (76.7%) | 265 (23.3%) |
| Total (Category) | 2,495 (77.0%) | 746 (23.0%) |
| Total (Overall) | 11,110 (53.2%) | 9,782 (46.8%) |
Employment Industries by Sex in Covington
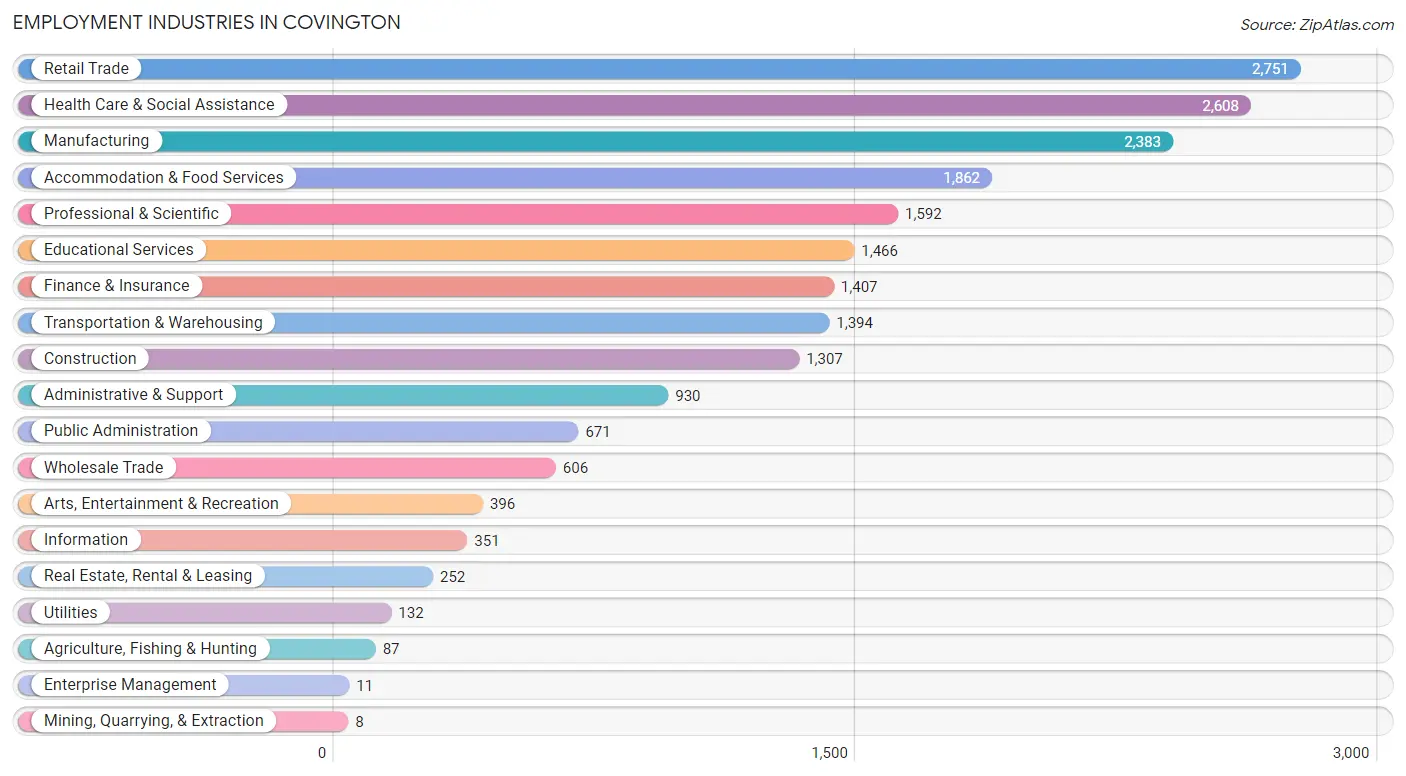
Employment Industries in Covington
The major employment industries in Covington include Retail Trade (2,751 | 13.2%), Health Care & Social Assistance (2,608 | 12.5%), Manufacturing (2,383 | 11.4%), Accommodation & Food Services (1,862 | 8.9%), and Professional & Scientific (1,592 | 7.6%).
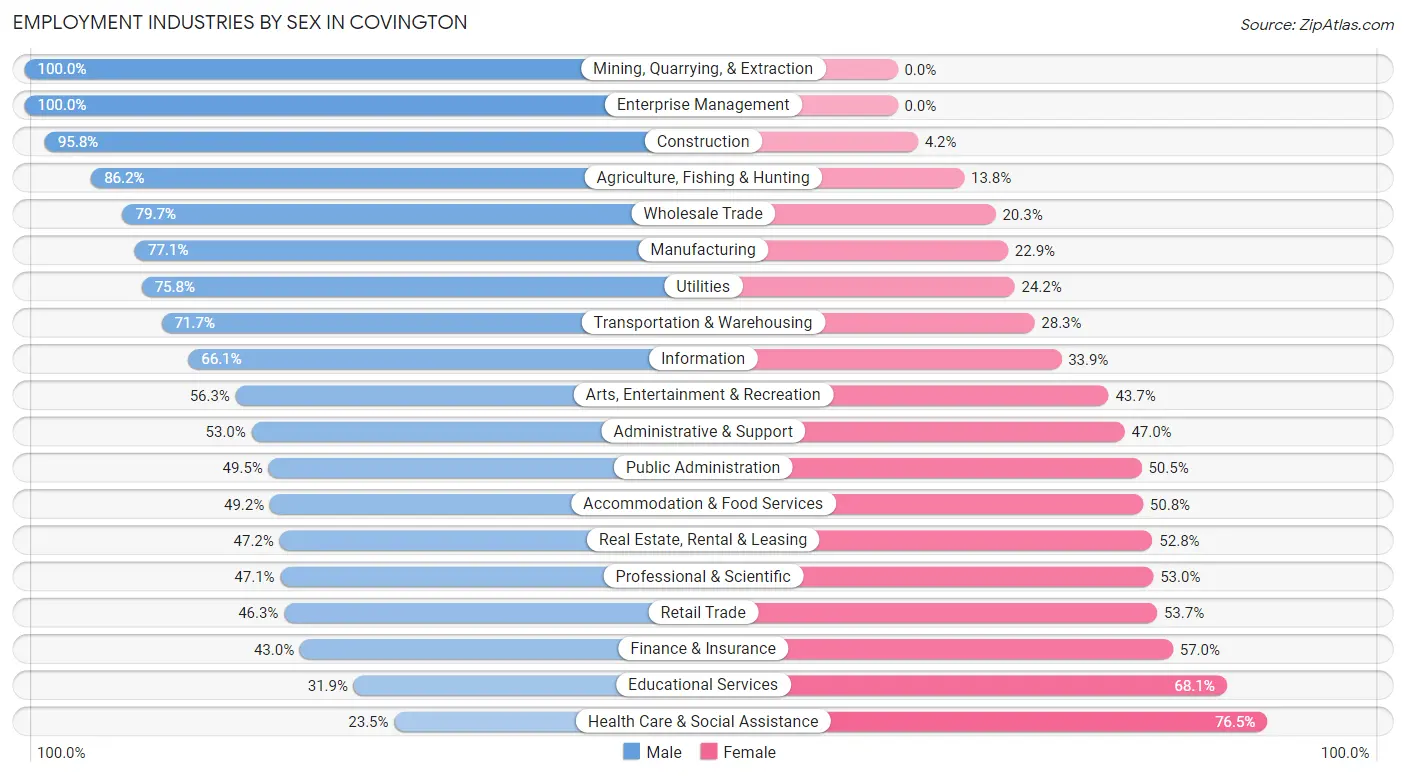
Employment Industries by Sex in Covington
The Covington industries that see more men than women are Mining, Quarrying, & Extraction (100.0%), Enterprise Management (100.0%), and Construction (95.8%), whereas the industries that tend to have a higher number of women are Health Care & Social Assistance (76.5%), Educational Services (68.1%), and Finance & Insurance (57.0%).
| Industry | Male | Female |
| Agriculture, Fishing & Hunting | 75 (86.2%) | 12 (13.8%) |
| Mining, Quarrying, & Extraction | 8 (100.0%) | 0 (0.0%) |
| Construction | 1,252 (95.8%) | 55 (4.2%) |
| Manufacturing | 1,838 (77.1%) | 545 (22.9%) |
| Wholesale Trade | 483 (79.7%) | 123 (20.3%) |
| Retail Trade | 1,273 (46.3%) | 1,478 (53.7%) |
| Transportation & Warehousing | 999 (71.7%) | 395 (28.3%) |
| Utilities | 100 (75.8%) | 32 (24.2%) |
| Information | 232 (66.1%) | 119 (33.9%) |
| Finance & Insurance | 605 (43.0%) | 802 (57.0%) |
| Real Estate, Rental & Leasing | 119 (47.2%) | 133 (52.8%) |
| Professional & Scientific | 749 (47.0%) | 843 (52.9%) |
| Enterprise Management | 11 (100.0%) | 0 (0.0%) |
| Administrative & Support | 493 (53.0%) | 437 (47.0%) |
| Educational Services | 467 (31.9%) | 999 (68.1%) |
| Health Care & Social Assistance | 612 (23.5%) | 1,996 (76.5%) |
| Arts, Entertainment & Recreation | 223 (56.3%) | 173 (43.7%) |
| Accommodation & Food Services | 916 (49.2%) | 946 (50.8%) |
| Public Administration | 332 (49.5%) | 339 (50.5%) |
| Total | 11,110 (53.2%) | 9,782 (46.8%) |
Education in Covington
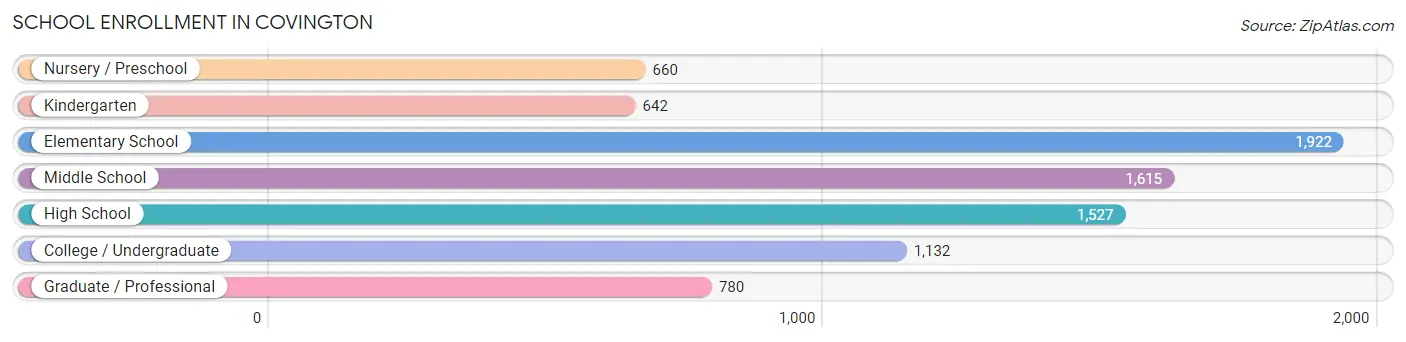
School Enrollment in Covington
The most common levels of schooling among the 8,278 students in Covington are elementary school (1,922 | 23.2%), middle school (1,615 | 19.5%), and high school (1,527 | 18.4%).
| School Level | # Students | % Students |
| Nursery / Preschool | 660 | 8.0% |
| Kindergarten | 642 | 7.8% |
| Elementary School | 1,922 | 23.2% |
| Middle School | 1,615 | 19.5% |
| High School | 1,527 | 18.4% |
| College / Undergraduate | 1,132 | 13.7% |
| Graduate / Professional | 780 | 9.4% |
| Total | 8,278 | 100.0% |
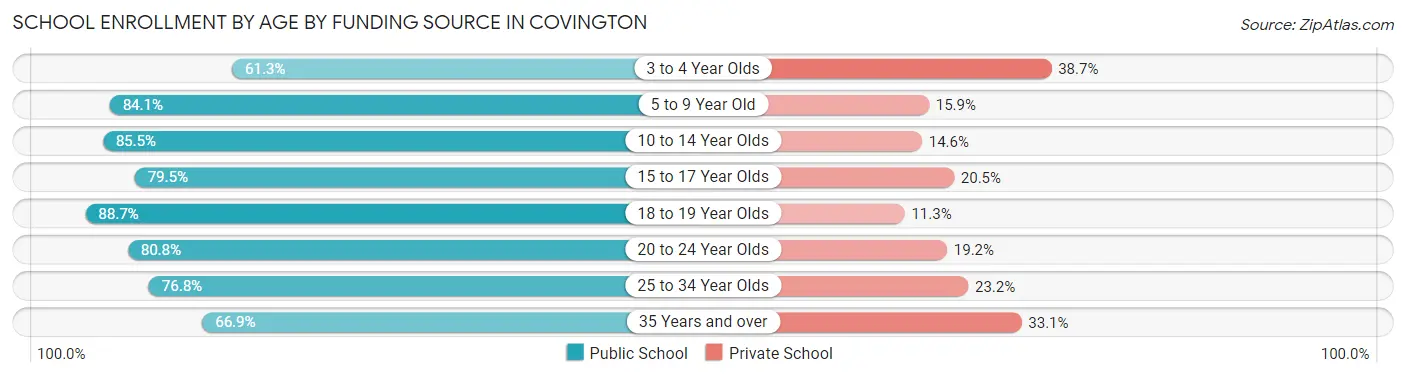
School Enrollment by Age by Funding Source in Covington
Out of a total of 8,278 students who are enrolled in schools in Covington, 1,598 (19.3%) attend a private institution, while the remaining 6,680 (80.7%) are enrolled in public schools. The age group of 3 to 4 year olds has the highest likelihood of being enrolled in private schools, with 184 (38.7% in the age bracket) enrolled. Conversely, the age group of 18 to 19 year olds has the lowest likelihood of being enrolled in a private school, with 274 (88.7% in the age bracket) attending a public institution.
| Age Bracket | Public School | Private School |
| 3 to 4 Year Olds | 292 (61.3%) | 184 (38.7%) |
| 5 to 9 Year Old | 2,128 (84.1%) | 401 (15.9%) |
| 10 to 14 Year Olds | 1,662 (85.5%) | 283 (14.5%) |
| 15 to 17 Year Olds | 879 (79.5%) | 227 (20.5%) |
| 18 to 19 Year Olds | 274 (88.7%) | 35 (11.3%) |
| 20 to 24 Year Olds | 458 (80.8%) | 109 (19.2%) |
| 25 to 34 Year Olds | 700 (76.8%) | 211 (23.2%) |
| 35 Years and over | 291 (66.9%) | 144 (33.1%) |
| Total | 6,680 (80.7%) | 1,598 (19.3%) |
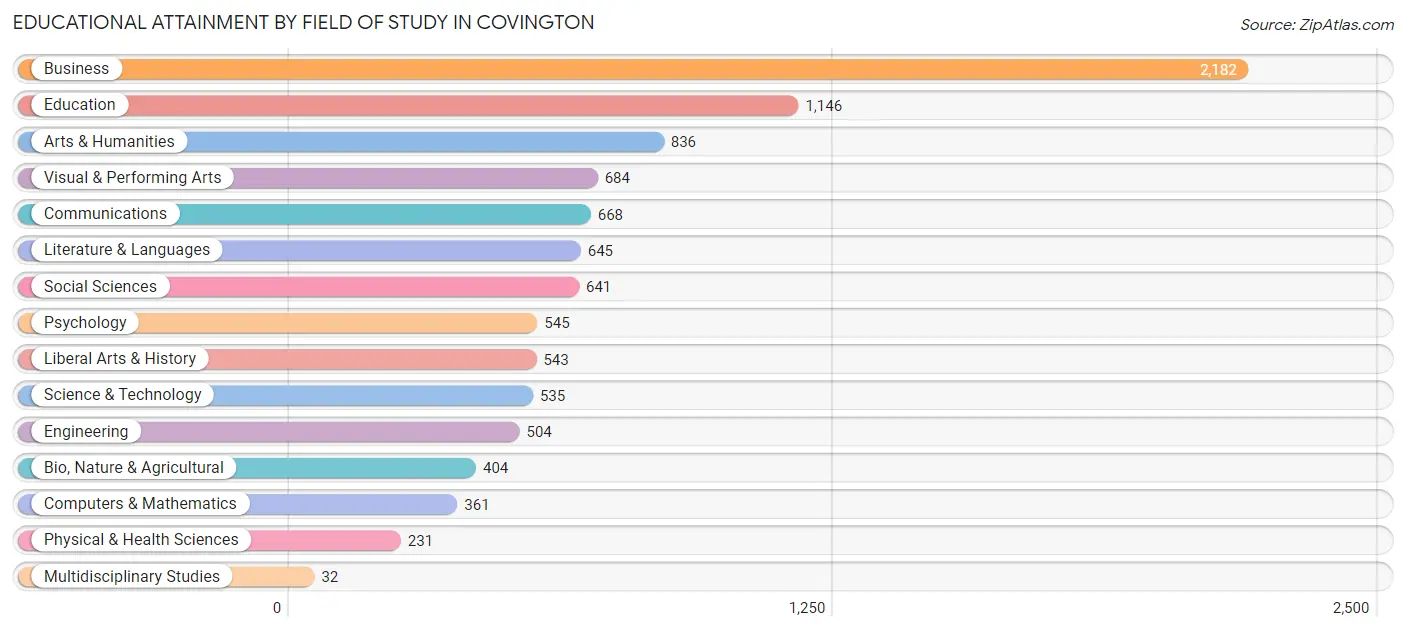
Educational Attainment by Field of Study in Covington
Business (2,182 | 21.9%), education (1,146 | 11.5%), arts & humanities (836 | 8.4%), visual & performing arts (684 | 6.9%), and communications (668 | 6.7%) are the most common fields of study among 9,957 individuals in Covington who have obtained a bachelor's degree or higher.
| Field of Study | # Graduates | % Graduates |
| Computers & Mathematics | 361 | 3.6% |
| Bio, Nature & Agricultural | 404 | 4.1% |
| Physical & Health Sciences | 231 | 2.3% |
| Psychology | 545 | 5.5% |
| Social Sciences | 641 | 6.4% |
| Engineering | 504 | 5.1% |
| Multidisciplinary Studies | 32 | 0.3% |
| Science & Technology | 535 | 5.4% |
| Business | 2,182 | 21.9% |
| Education | 1,146 | 11.5% |
| Literature & Languages | 645 | 6.5% |
| Liberal Arts & History | 543 | 5.4% |
| Visual & Performing Arts | 684 | 6.9% |
| Communications | 668 | 6.7% |
| Arts & Humanities | 836 | 8.4% |
| Total | 9,957 | 100.0% |
Transportation & Commute in Covington
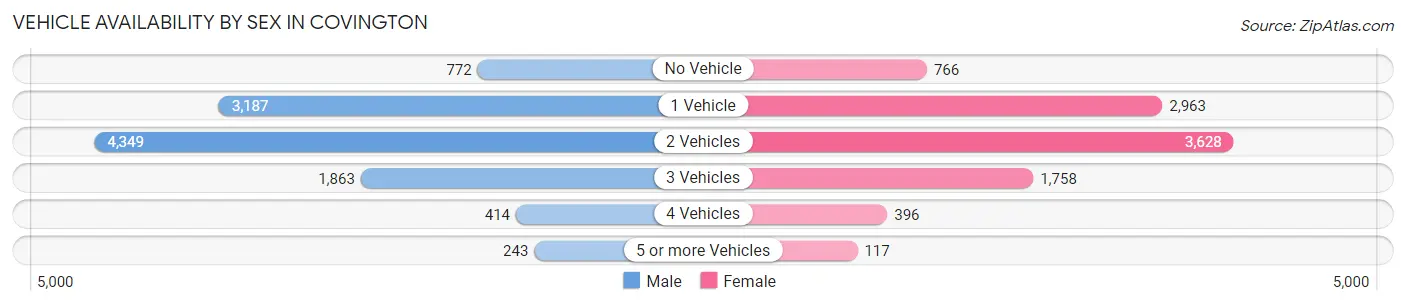
Vehicle Availability by Sex in Covington
The most prevalent vehicle ownership categories in Covington are males with 2 vehicles (4,349, accounting for 40.2%) and females with 2 vehicles (3,628, making up 45.2%).
| Vehicles Available | Male | Female |
| No Vehicle | 772 (7.1%) | 766 (8.0%) |
| 1 Vehicle | 3,187 (29.4%) | 2,963 (30.8%) |
| 2 Vehicles | 4,349 (40.2%) | 3,628 (37.7%) |
| 3 Vehicles | 1,863 (17.2%) | 1,758 (18.3%) |
| 4 Vehicles | 414 (3.8%) | 396 (4.1%) |
| 5 or more Vehicles | 243 (2.2%) | 117 (1.2%) |
| Total | 10,828 (100.0%) | 9,628 (100.0%) |
Commute Time in Covington
The most frequently occuring commute durations in Covington are 15 to 19 minutes (3,826 commuters, 21.1%), 20 to 24 minutes (3,483 commuters, 19.2%), and 10 to 14 minutes (2,767 commuters, 15.3%).
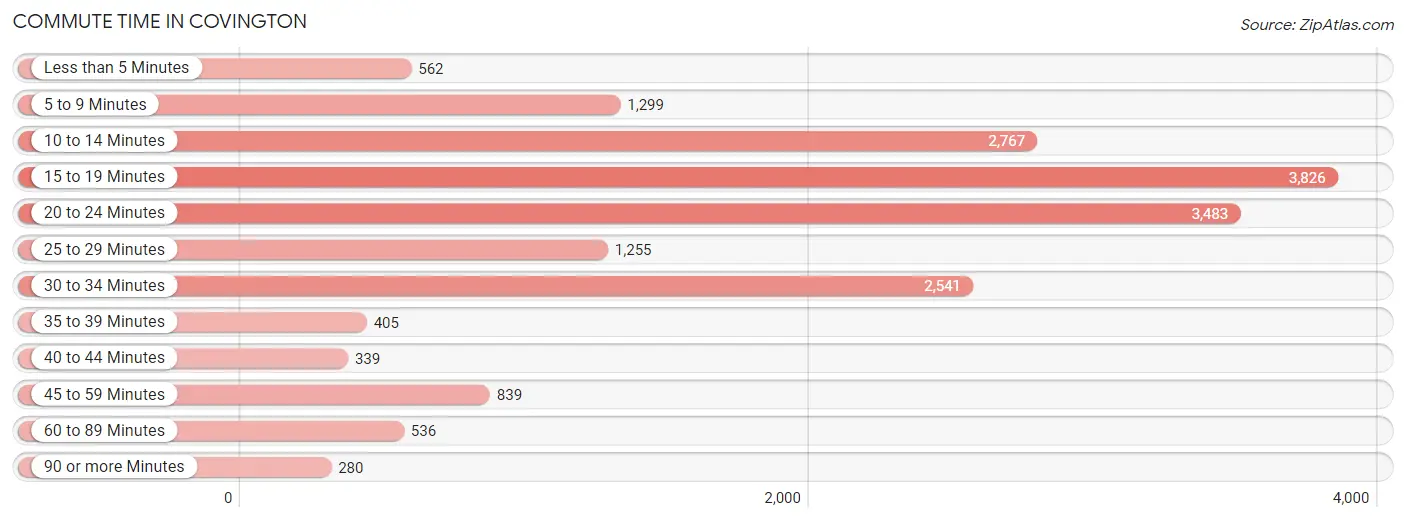
| Commute Time | # Commuters | % Commuters |
| Less than 5 Minutes | 562 | 3.1% |
| 5 to 9 Minutes | 1,299 | 7.2% |
| 10 to 14 Minutes | 2,767 | 15.3% |
| 15 to 19 Minutes | 3,826 | 21.1% |
| 20 to 24 Minutes | 3,483 | 19.2% |
| 25 to 29 Minutes | 1,255 | 6.9% |
| 30 to 34 Minutes | 2,541 | 14.0% |
| 35 to 39 Minutes | 405 | 2.2% |
| 40 to 44 Minutes | 339 | 1.9% |
| 45 to 59 Minutes | 839 | 4.6% |
| 60 to 89 Minutes | 536 | 3.0% |
| 90 or more Minutes | 280 | 1.5% |
Commute Time by Sex in Covington
The most common commute times in Covington are 20 to 24 minutes (2,214 commuters, 22.6%) for males and 15 to 19 minutes (1,693 commuters, 20.3%) for females.
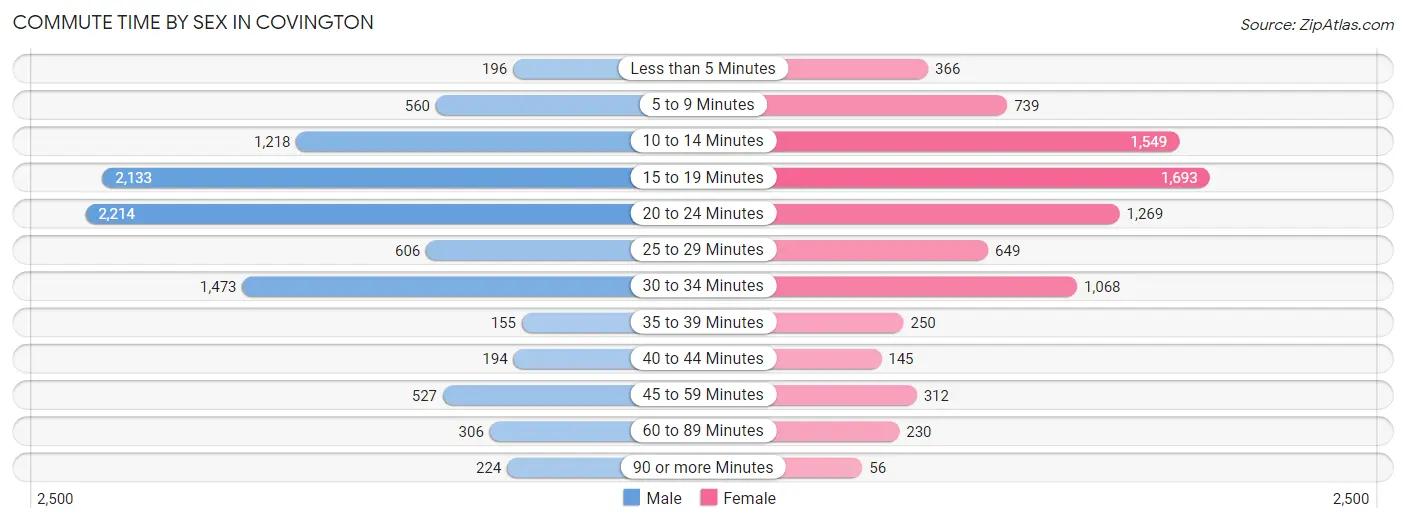
| Commute Time | Male | Female |
| Less than 5 Minutes | 196 (2.0%) | 366 (4.4%) |
| 5 to 9 Minutes | 560 (5.7%) | 739 (8.9%) |
| 10 to 14 Minutes | 1,218 (12.4%) | 1,549 (18.6%) |
| 15 to 19 Minutes | 2,133 (21.7%) | 1,693 (20.3%) |
| 20 to 24 Minutes | 2,214 (22.6%) | 1,269 (15.2%) |
| 25 to 29 Minutes | 606 (6.2%) | 649 (7.8%) |
| 30 to 34 Minutes | 1,473 (15.0%) | 1,068 (12.8%) |
| 35 to 39 Minutes | 155 (1.6%) | 250 (3.0%) |
| 40 to 44 Minutes | 194 (2.0%) | 145 (1.7%) |
| 45 to 59 Minutes | 527 (5.4%) | 312 (3.7%) |
| 60 to 89 Minutes | 306 (3.1%) | 230 (2.8%) |
| 90 or more Minutes | 224 (2.3%) | 56 (0.7%) |
Time of Departure to Work by Sex in Covington
The most frequent times of departure to work in Covington are 7:00 AM to 7:29 AM (1,142, 11.7%) for males and 7:00 AM to 7:29 AM (1,342, 16.1%) for females.
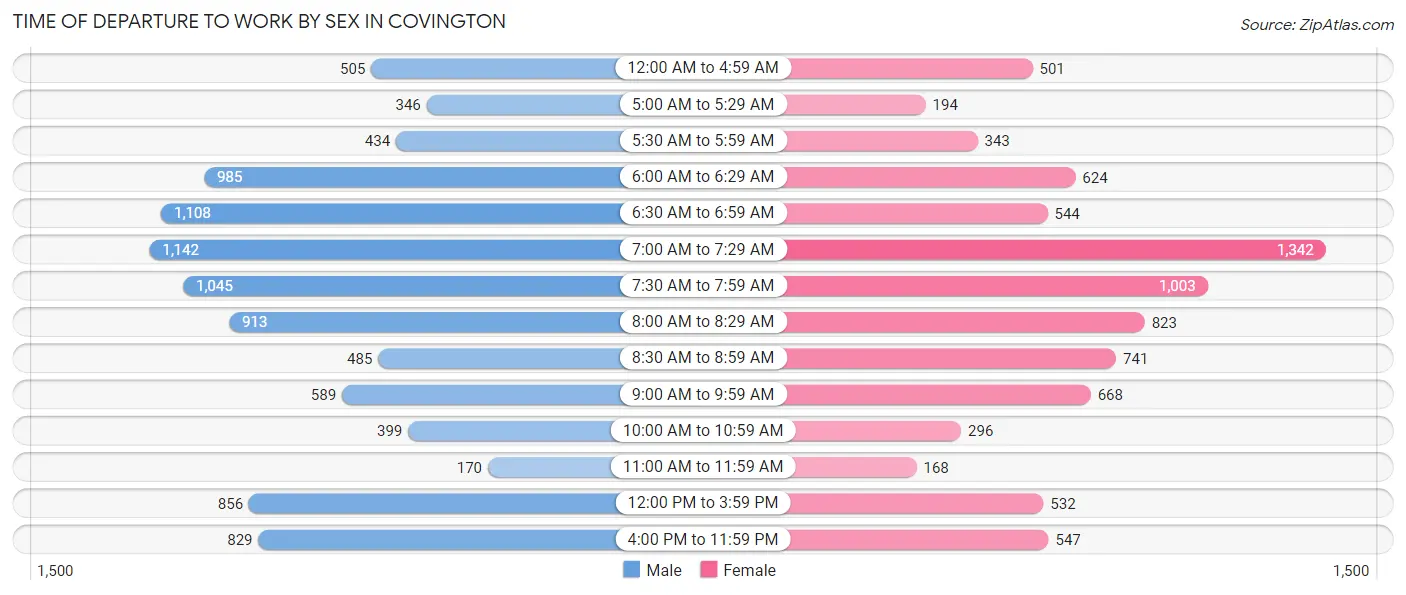
| Time of Departure | Male | Female |
| 12:00 AM to 4:59 AM | 505 (5.1%) | 501 (6.0%) |
| 5:00 AM to 5:29 AM | 346 (3.5%) | 194 (2.3%) |
| 5:30 AM to 5:59 AM | 434 (4.4%) | 343 (4.1%) |
| 6:00 AM to 6:29 AM | 985 (10.0%) | 624 (7.5%) |
| 6:30 AM to 6:59 AM | 1,108 (11.3%) | 544 (6.5%) |
| 7:00 AM to 7:29 AM | 1,142 (11.7%) | 1,342 (16.1%) |
| 7:30 AM to 7:59 AM | 1,045 (10.7%) | 1,003 (12.0%) |
| 8:00 AM to 8:29 AM | 913 (9.3%) | 823 (9.9%) |
| 8:30 AM to 8:59 AM | 485 (5.0%) | 741 (8.9%) |
| 9:00 AM to 9:59 AM | 589 (6.0%) | 668 (8.0%) |
| 10:00 AM to 10:59 AM | 399 (4.1%) | 296 (3.6%) |
| 11:00 AM to 11:59 AM | 170 (1.7%) | 168 (2.0%) |
| 12:00 PM to 3:59 PM | 856 (8.7%) | 532 (6.4%) |
| 4:00 PM to 11:59 PM | 829 (8.5%) | 547 (6.6%) |
| Total | 9,806 (100.0%) | 8,326 (100.0%) |
Housing Occupancy in Covington
Occupancy by Ownership in Covington
Of the total 18,243 dwellings in Covington, owner-occupied units account for 9,383 (51.4%), while renter-occupied units make up 8,860 (48.6%).
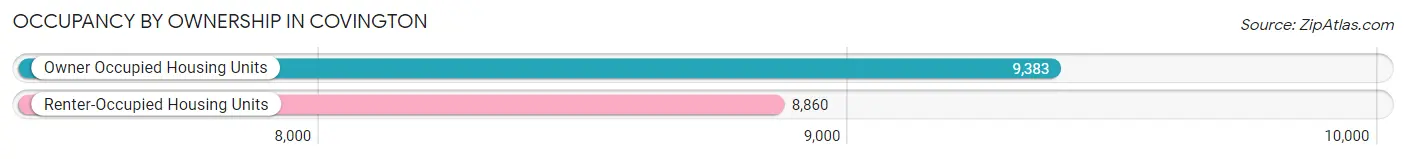
| Occupancy | # Housing Units | % Housing Units |
| Owner Occupied Housing Units | 9,383 | 51.4% |
| Renter-Occupied Housing Units | 8,860 | 48.6% |
| Total Occupied Housing Units | 18,243 | 100.0% |
Occupancy by Household Size in Covington
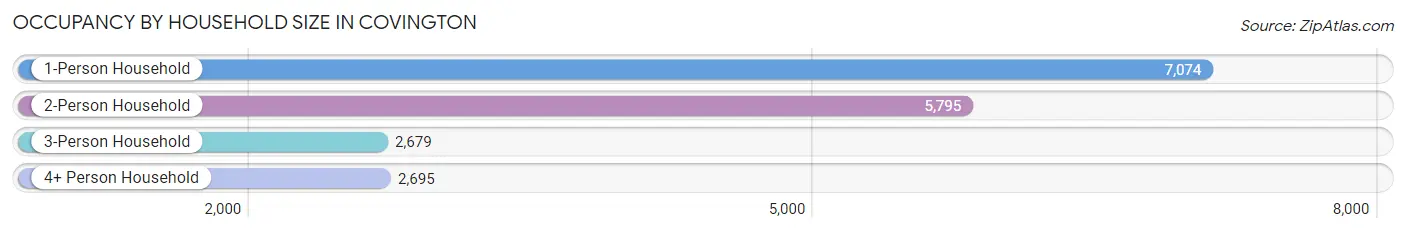
| Household Size | # Housing Units | % Housing Units |
| 1-Person Household | 7,074 | 38.8% |
| 2-Person Household | 5,795 | 31.8% |
| 3-Person Household | 2,679 | 14.7% |
| 4+ Person Household | 2,695 | 14.8% |
| Total Housing Units | 18,243 | 100.0% |
Occupancy by Ownership by Household Size in Covington
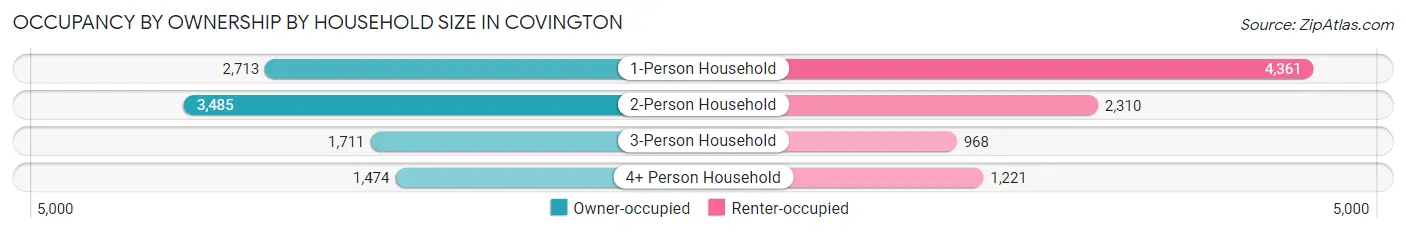
| Household Size | Owner-occupied | Renter-occupied |
| 1-Person Household | 2,713 (38.4%) | 4,361 (61.7%) |
| 2-Person Household | 3,485 (60.1%) | 2,310 (39.9%) |
| 3-Person Household | 1,711 (63.9%) | 968 (36.1%) |
| 4+ Person Household | 1,474 (54.7%) | 1,221 (45.3%) |
| Total Housing Units | 9,383 (51.4%) | 8,860 (48.6%) |
Occupancy by Educational Attainment in Covington
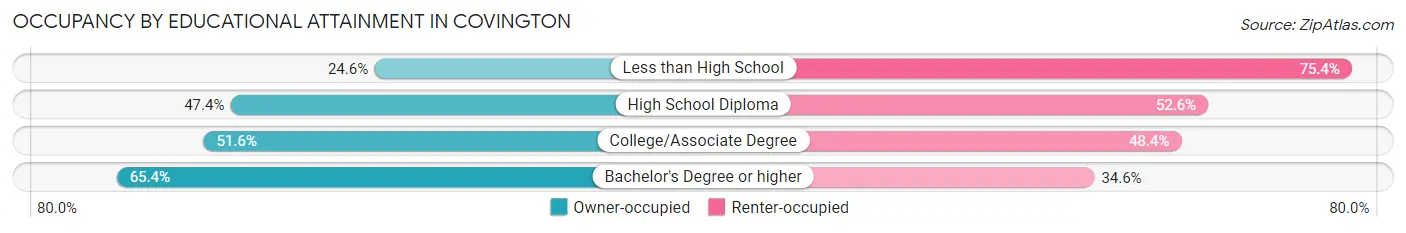
| Household Size | Owner-occupied | Renter-occupied |
| Less than High School | 594 (24.6%) | 1,823 (75.4%) |
| High School Diploma | 2,255 (47.4%) | 2,504 (52.6%) |
| College/Associate Degree | 2,632 (51.6%) | 2,467 (48.4%) |
| Bachelor's Degree or higher | 3,902 (65.4%) | 2,066 (34.6%) |
Occupancy by Age of Householder in Covington
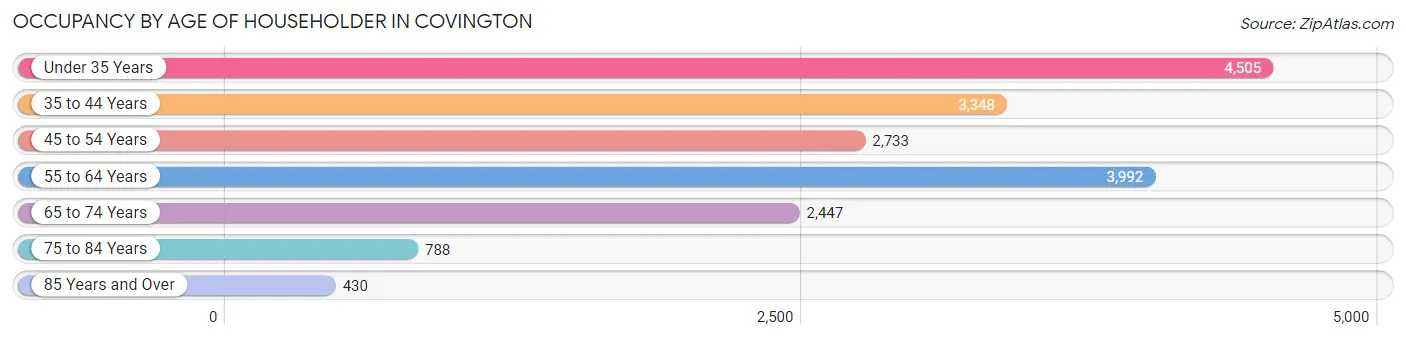
| Age Bracket | # Households | % Households |
| Under 35 Years | 4,505 | 24.7% |
| 35 to 44 Years | 3,348 | 18.3% |
| 45 to 54 Years | 2,733 | 15.0% |
| 55 to 64 Years | 3,992 | 21.9% |
| 65 to 74 Years | 2,447 | 13.4% |
| 75 to 84 Years | 788 | 4.3% |
| 85 Years and Over | 430 | 2.4% |
| Total | 18,243 | 100.0% |
Housing Finances in Covington
Median Income by Occupancy in Covington
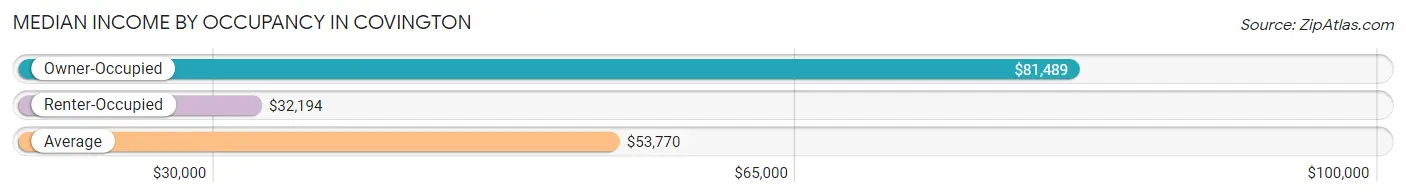
| Occupancy Type | # Households | Median Income |
| Owner-Occupied | 9,383 (51.4%) | $81,489 |
| Renter-Occupied | 8,860 (48.6%) | $32,194 |
| Average | 18,243 (100.0%) | $53,770 |
Occupancy by Householder Income Bracket in Covington
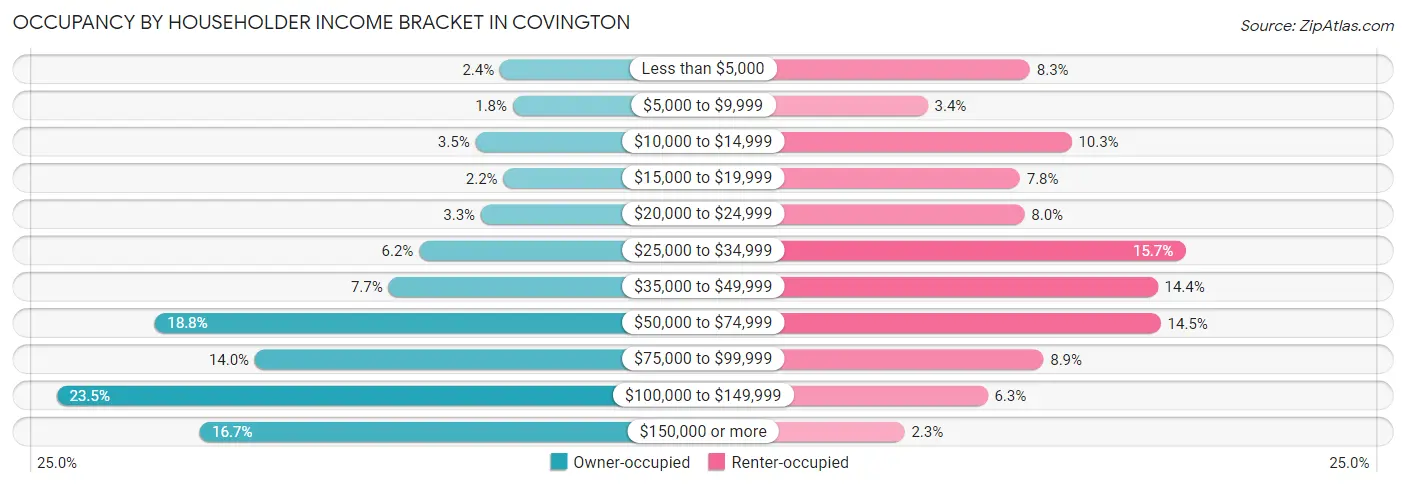
| Income Bracket | Owner-occupied | Renter-occupied |
| Less than $5,000 | 221 (2.4%) | 735 (8.3%) |
| $5,000 to $9,999 | 164 (1.8%) | 304 (3.4%) |
| $10,000 to $14,999 | 331 (3.5%) | 911 (10.3%) |
| $15,000 to $19,999 | 206 (2.2%) | 693 (7.8%) |
| $20,000 to $24,999 | 307 (3.3%) | 712 (8.0%) |
| $25,000 to $34,999 | 583 (6.2%) | 1,390 (15.7%) |
| $35,000 to $49,999 | 720 (7.7%) | 1,274 (14.4%) |
| $50,000 to $74,999 | 1,766 (18.8%) | 1,287 (14.5%) |
| $75,000 to $99,999 | 1,316 (14.0%) | 792 (8.9%) |
| $100,000 to $149,999 | 2,203 (23.5%) | 556 (6.3%) |
| $150,000 or more | 1,566 (16.7%) | 206 (2.3%) |
| Total | 9,383 (100.0%) | 8,860 (100.0%) |
Monthly Housing Cost Tiers in Covington
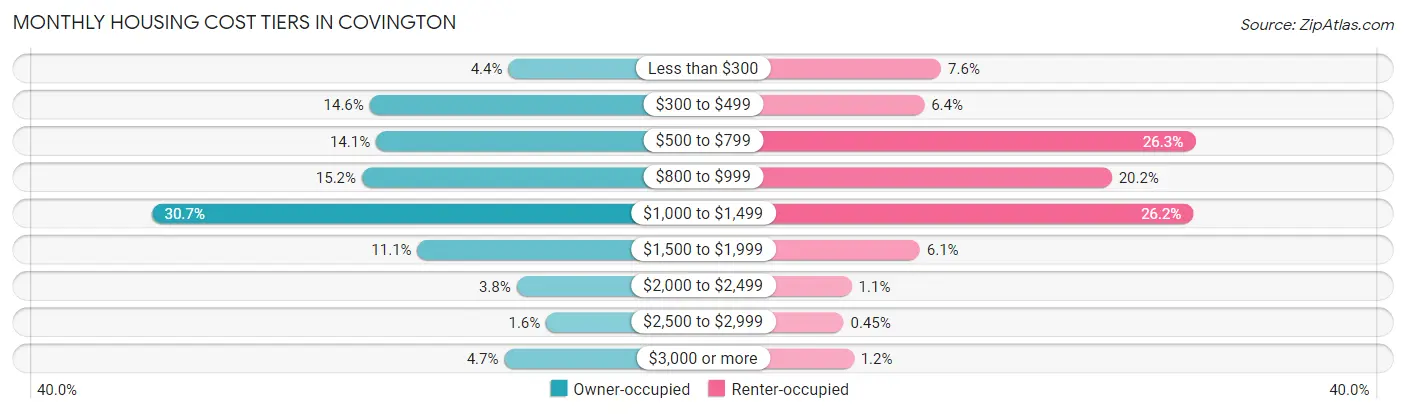
| Monthly Cost | Owner-occupied | Renter-occupied |
| Less than $300 | 411 (4.4%) | 677 (7.6%) |
| $300 to $499 | 1,369 (14.6%) | 566 (6.4%) |
| $500 to $799 | 1,325 (14.1%) | 2,333 (26.3%) |
| $800 to $999 | 1,422 (15.2%) | 1,790 (20.2%) |
| $1,000 to $1,499 | 2,876 (30.6%) | 2,321 (26.2%) |
| $1,500 to $1,999 | 1,039 (11.1%) | 538 (6.1%) |
| $2,000 to $2,499 | 354 (3.8%) | 93 (1.1%) |
| $2,500 to $2,999 | 149 (1.6%) | 40 (0.4%) |
| $3,000 or more | 438 (4.7%) | 106 (1.2%) |
| Total | 9,383 (100.0%) | 8,860 (100.0%) |
Physical Housing Characteristics in Covington
Housing Structures in Covington
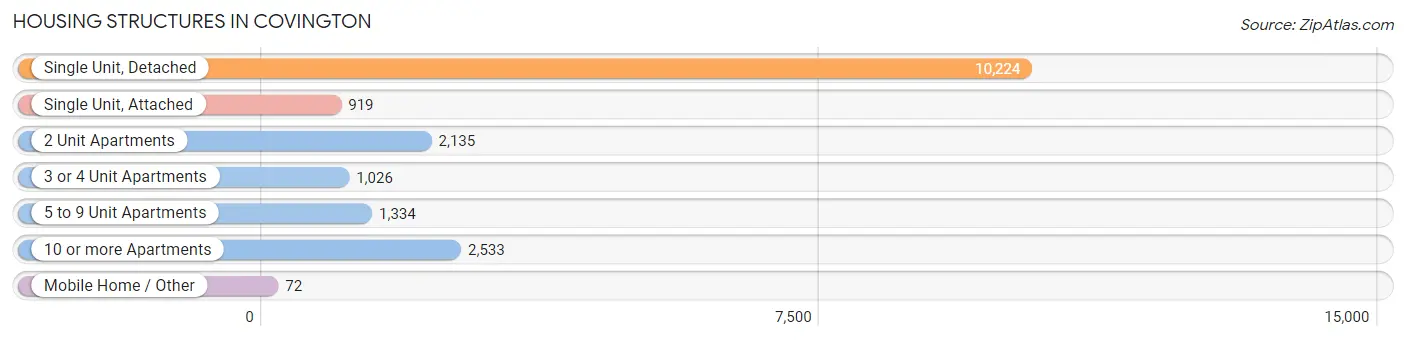
| Structure Type | # Housing Units | % Housing Units |
| Single Unit, Detached | 10,224 | 56.0% |
| Single Unit, Attached | 919 | 5.0% |
| 2 Unit Apartments | 2,135 | 11.7% |
| 3 or 4 Unit Apartments | 1,026 | 5.6% |
| 5 to 9 Unit Apartments | 1,334 | 7.3% |
| 10 or more Apartments | 2,533 | 13.9% |
| Mobile Home / Other | 72 | 0.4% |
| Total | 18,243 | 100.0% |
Housing Structures by Occupancy in Covington
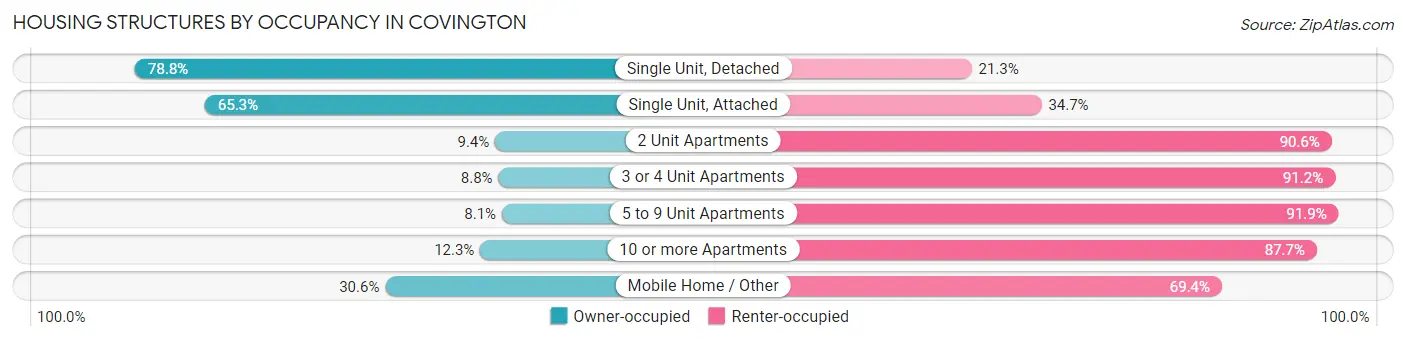
| Structure Type | Owner-occupied | Renter-occupied |
| Single Unit, Detached | 8,051 (78.7%) | 2,173 (21.2%) |
| Single Unit, Attached | 600 (65.3%) | 319 (34.7%) |
| 2 Unit Apartments | 201 (9.4%) | 1,934 (90.6%) |
| 3 or 4 Unit Apartments | 90 (8.8%) | 936 (91.2%) |
| 5 to 9 Unit Apartments | 108 (8.1%) | 1,226 (91.9%) |
| 10 or more Apartments | 311 (12.3%) | 2,222 (87.7%) |
| Mobile Home / Other | 22 (30.6%) | 50 (69.4%) |
| Total | 9,383 (51.4%) | 8,860 (48.6%) |
Housing Structures by Number of Rooms in Covington
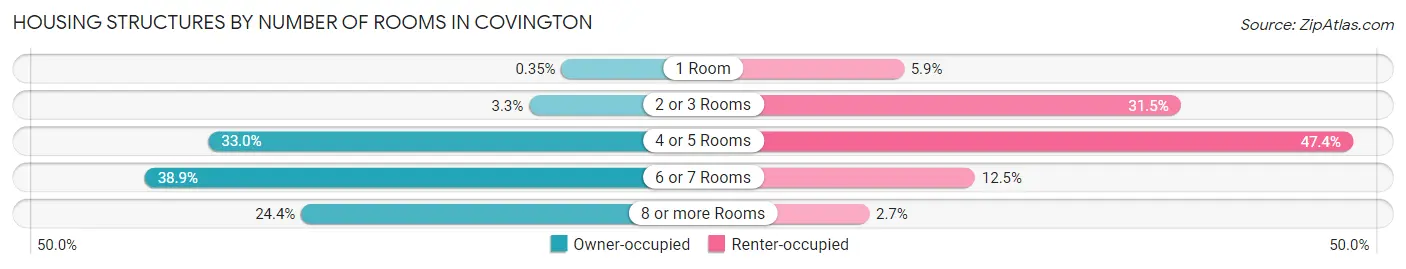
| Number of Rooms | Owner-occupied | Renter-occupied |
| 1 Room | 33 (0.4%) | 523 (5.9%) |
| 2 or 3 Rooms | 313 (3.3%) | 2,791 (31.5%) |
| 4 or 5 Rooms | 3,097 (33.0%) | 4,202 (47.4%) |
| 6 or 7 Rooms | 3,649 (38.9%) | 1,106 (12.5%) |
| 8 or more Rooms | 2,291 (24.4%) | 238 (2.7%) |
| Total | 9,383 (100.0%) | 8,860 (100.0%) |
Housing Structure by Heating Type in Covington
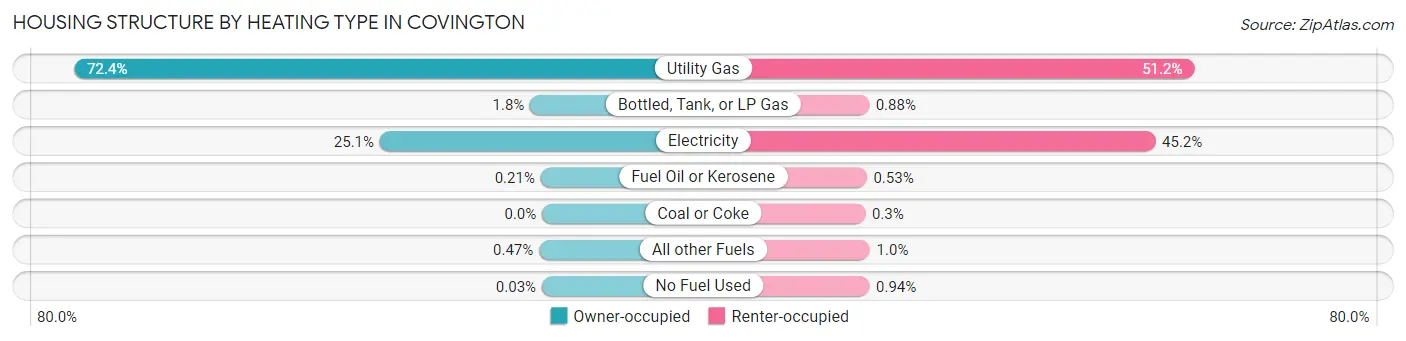
| Heating Type | Owner-occupied | Renter-occupied |
| Utility Gas | 6,790 (72.4%) | 4,535 (51.2%) |
| Bottled, Tank, or LP Gas | 173 (1.8%) | 78 (0.9%) |
| Electricity | 2,353 (25.1%) | 4,000 (45.2%) |
| Fuel Oil or Kerosene | 20 (0.2%) | 47 (0.5%) |
| Coal or Coke | 0 (0.0%) | 27 (0.3%) |
| All other Fuels | 44 (0.5%) | 90 (1.0%) |
| No Fuel Used | 3 (0.0%) | 83 (0.9%) |
| Total | 9,383 (100.0%) | 8,860 (100.0%) |
Household Vehicle Usage in Covington
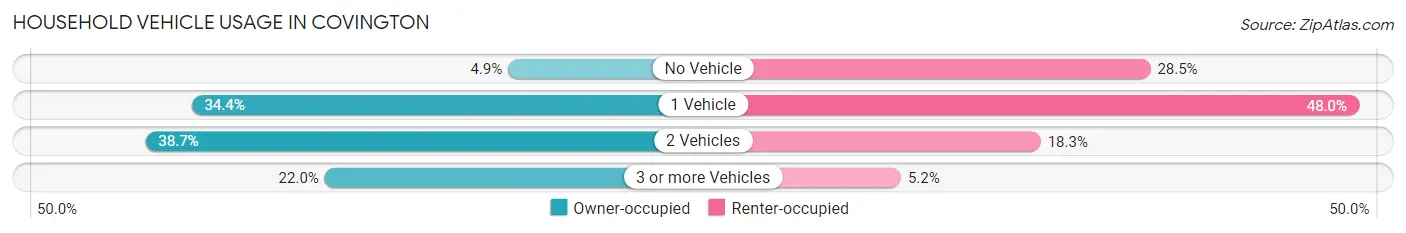
| Vehicles per Household | Owner-occupied | Renter-occupied |
| No Vehicle | 457 (4.9%) | 2,527 (28.5%) |
| 1 Vehicle | 3,230 (34.4%) | 4,250 (48.0%) |
| 2 Vehicles | 3,633 (38.7%) | 1,620 (18.3%) |
| 3 or more Vehicles | 2,063 (22.0%) | 463 (5.2%) |
| Total | 9,383 (100.0%) | 8,860 (100.0%) |
Real Estate & Mortgages in Covington
Real Estate and Mortgage Overview in Covington
| Characteristic | Without Mortgage | With Mortgage |
| Housing Units | 2,876 | 6,507 |
| Median Property Value | $134,400 | $161,300 |
| Median Household Income | $49,265 | $1,283 |
| Monthly Housing Costs | $468 | $438 |
| Real Estate Taxes | $1,476 | $206 |
Property Value by Mortgage Status in Covington
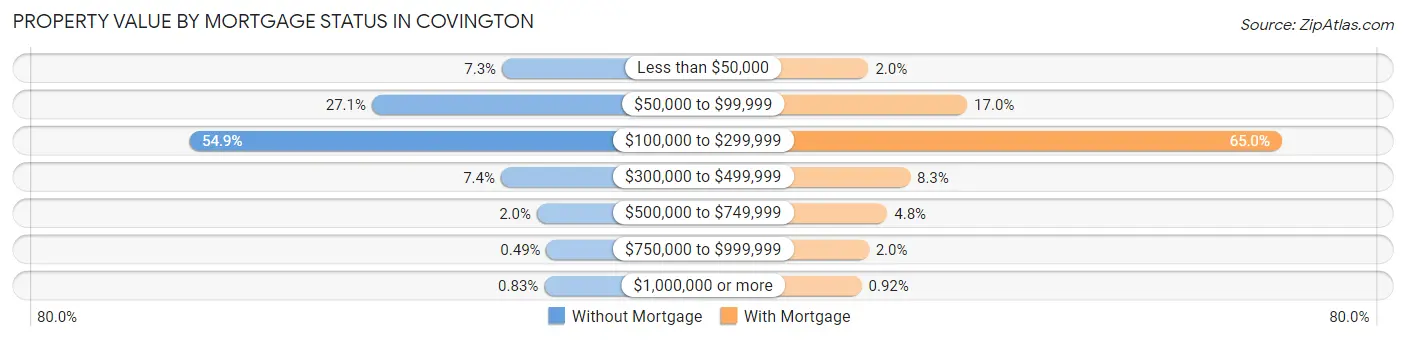
| Property Value | Without Mortgage | With Mortgage |
| Less than $50,000 | 209 (7.3%) | 128 (2.0%) |
| $50,000 to $99,999 | 779 (27.1%) | 1,107 (17.0%) |
| $100,000 to $299,999 | 1,580 (54.9%) | 4,227 (65.0%) |
| $300,000 to $499,999 | 214 (7.4%) | 540 (8.3%) |
| $500,000 to $749,999 | 56 (1.9%) | 315 (4.8%) |
| $750,000 to $999,999 | 14 (0.5%) | 130 (2.0%) |
| $1,000,000 or more | 24 (0.8%) | 60 (0.9%) |
| Total | 2,876 (100.0%) | 6,507 (100.0%) |
Household Income by Mortgage Status in Covington
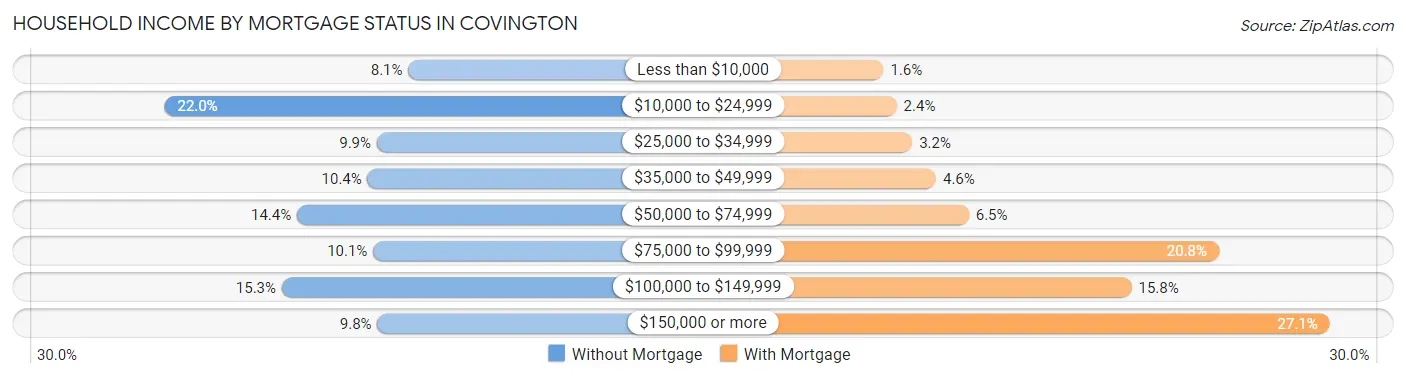
| Household Income | Without Mortgage | With Mortgage |
| Less than $10,000 | 232 (8.1%) | 104 (1.6%) |
| $10,000 to $24,999 | 633 (22.0%) | 153 (2.4%) |
| $25,000 to $34,999 | 284 (9.9%) | 211 (3.2%) |
| $35,000 to $49,999 | 299 (10.4%) | 299 (4.6%) |
| $50,000 to $74,999 | 415 (14.4%) | 421 (6.5%) |
| $75,000 to $99,999 | 290 (10.1%) | 1,351 (20.8%) |
| $100,000 to $149,999 | 440 (15.3%) | 1,026 (15.8%) |
| $150,000 or more | 283 (9.8%) | 1,763 (27.1%) |
| Total | 2,876 (100.0%) | 6,507 (100.0%) |
Property Value to Household Income Ratio in Covington
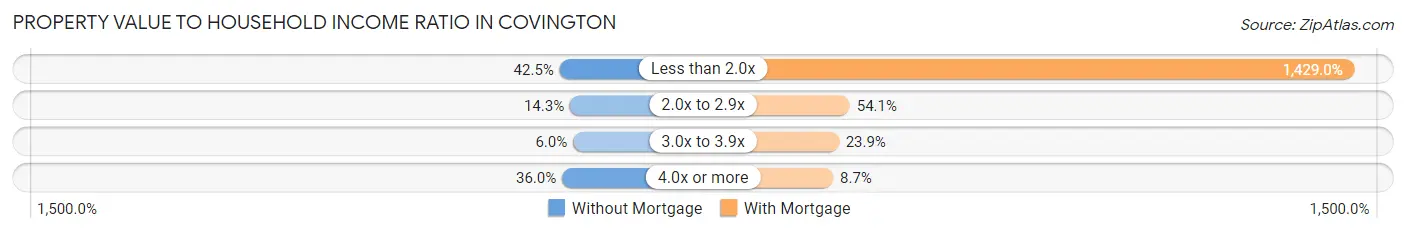
| Value-to-Income Ratio | Without Mortgage | With Mortgage |
| Less than 2.0x | 1,221 (42.4%) | 92,986 (1,429.0%) |
| 2.0x to 2.9x | 411 (14.3%) | 3,523 (54.1%) |
| 3.0x to 3.9x | 171 (5.9%) | 1,555 (23.9%) |
| 4.0x or more | 1,034 (35.9%) | 565 (8.7%) |
| Total | 2,876 (100.0%) | 6,507 (100.0%) |
Real Estate Taxes by Mortgage Status in Covington
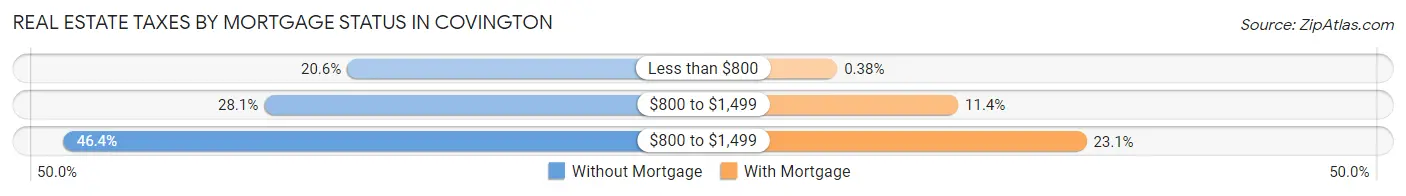
| Property Taxes | Without Mortgage | With Mortgage |
| Less than $800 | 591 (20.5%) | 25 (0.4%) |
| $800 to $1,499 | 809 (28.1%) | 743 (11.4%) |
| $800 to $1,499 | 1,335 (46.4%) | 1,506 (23.1%) |
| Total | 2,876 (100.0%) | 6,507 (100.0%) |
Health & Disability in Covington
Health Insurance Coverage by Age in Covington
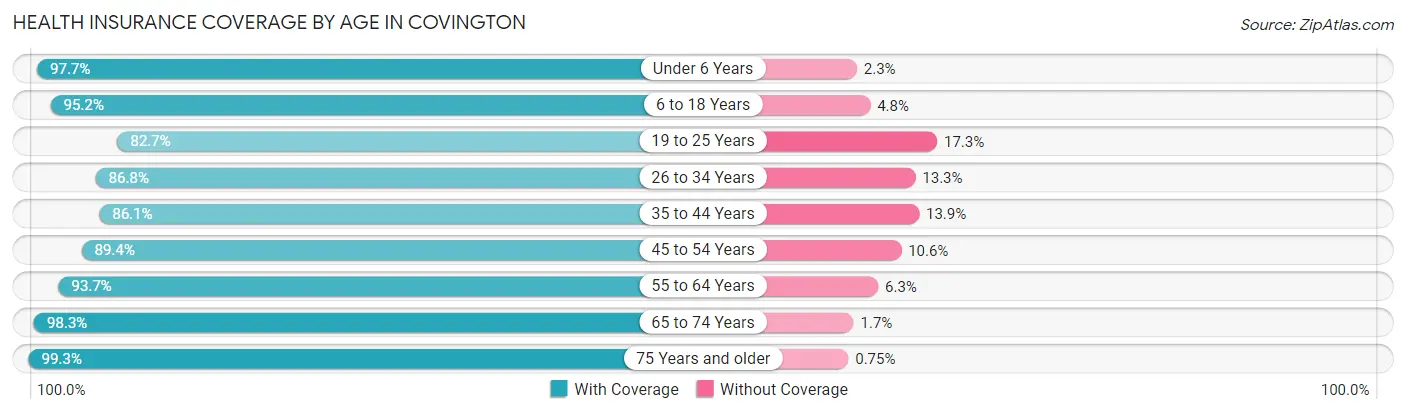
| Age Bracket | With Coverage | Without Coverage |
| Under 6 Years | 3,053 (97.7%) | 73 (2.3%) |
| 6 to 18 Years | 5,384 (95.2%) | 273 (4.8%) |
| 19 to 25 Years | 2,865 (82.7%) | 599 (17.3%) |
| 26 to 34 Years | 5,441 (86.8%) | 831 (13.3%) |
| 35 to 44 Years | 4,803 (86.1%) | 778 (13.9%) |
| 45 to 54 Years | 4,121 (89.4%) | 489 (10.6%) |
| 55 to 64 Years | 5,586 (93.7%) | 376 (6.3%) |
| 65 to 74 Years | 3,452 (98.3%) | 61 (1.7%) |
| 75 Years and older | 1,974 (99.3%) | 15 (0.7%) |
| Total | 36,679 (91.3%) | 3,495 (8.7%) |
Health Insurance Coverage by Citizenship Status in Covington
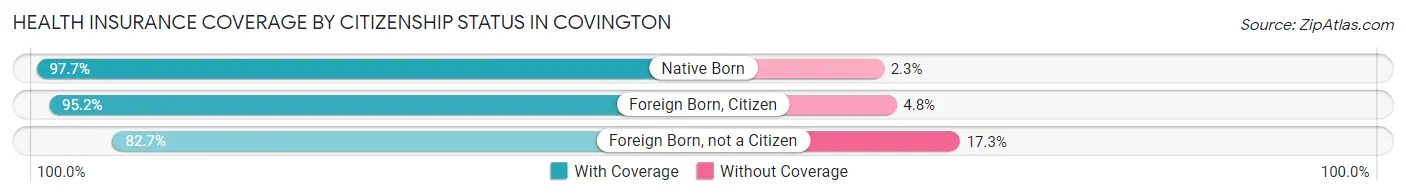
| Citizenship Status | With Coverage | Without Coverage |
| Native Born | 3,053 (97.7%) | 73 (2.3%) |
| Foreign Born, Citizen | 5,384 (95.2%) | 273 (4.8%) |
| Foreign Born, not a Citizen | 2,865 (82.7%) | 599 (17.3%) |
Health Insurance Coverage by Household Income in Covington
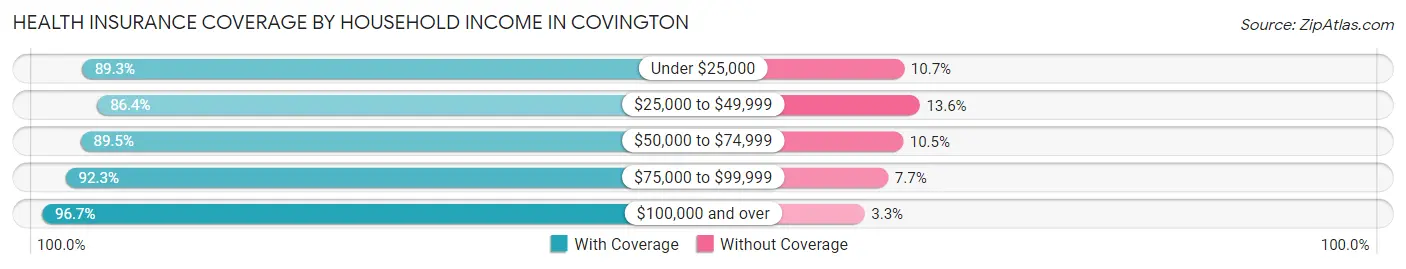
| Household Income | With Coverage | Without Coverage |
| Under $25,000 | 6,900 (89.3%) | 827 (10.7%) |
| $25,000 to $49,999 | 7,302 (86.4%) | 1,150 (13.6%) |
| $50,000 to $74,999 | 5,733 (89.5%) | 672 (10.5%) |
| $75,000 to $99,999 | 4,496 (92.3%) | 375 (7.7%) |
| $100,000 and over | 12,116 (96.7%) | 412 (3.3%) |
Public vs Private Health Insurance Coverage by Age in Covington
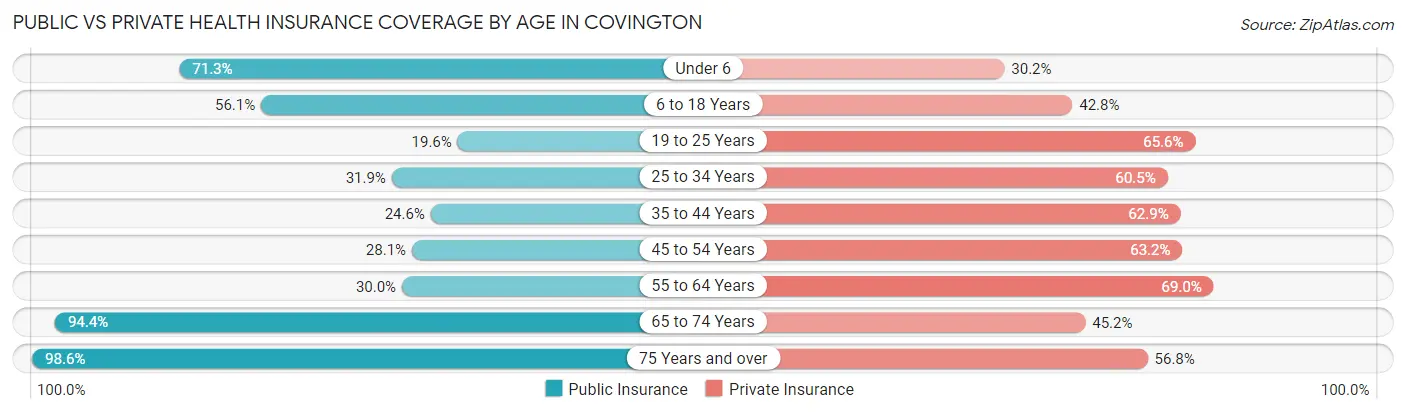
| Age Bracket | Public Insurance | Private Insurance |
| Under 6 | 2,228 (71.3%) | 943 (30.2%) |
| 6 to 18 Years | 3,174 (56.1%) | 2,420 (42.8%) |
| 19 to 25 Years | 680 (19.6%) | 2,273 (65.6%) |
| 25 to 34 Years | 1,998 (31.9%) | 3,792 (60.5%) |
| 35 to 44 Years | 1,374 (24.6%) | 3,508 (62.9%) |
| 45 to 54 Years | 1,296 (28.1%) | 2,913 (63.2%) |
| 55 to 64 Years | 1,786 (30.0%) | 4,115 (69.0%) |
| 65 to 74 Years | 3,315 (94.4%) | 1,588 (45.2%) |
| 75 Years and over | 1,961 (98.6%) | 1,129 (56.8%) |
| Total | 17,812 (44.3%) | 22,681 (56.5%) |
Disability Status by Sex by Age in Covington
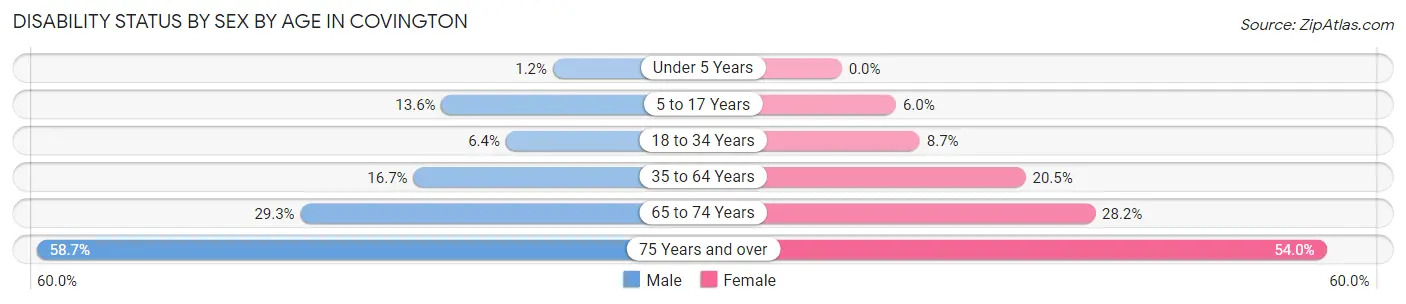
| Age Bracket | Male | Female |
| Under 5 Years | 16 (1.2%) | 0 (0.0%) |
| 5 to 17 Years | 448 (13.6%) | 145 (6.0%) |
| 18 to 34 Years | 358 (6.4%) | 396 (8.7%) |
| 35 to 64 Years | 1,341 (16.7%) | 1,662 (20.5%) |
| 65 to 74 Years | 573 (29.3%) | 439 (28.2%) |
| 75 Years and over | 332 (58.7%) | 768 (54.0%) |
Disability Class by Sex by Age in Covington
Disability Class: Hearing Difficulty
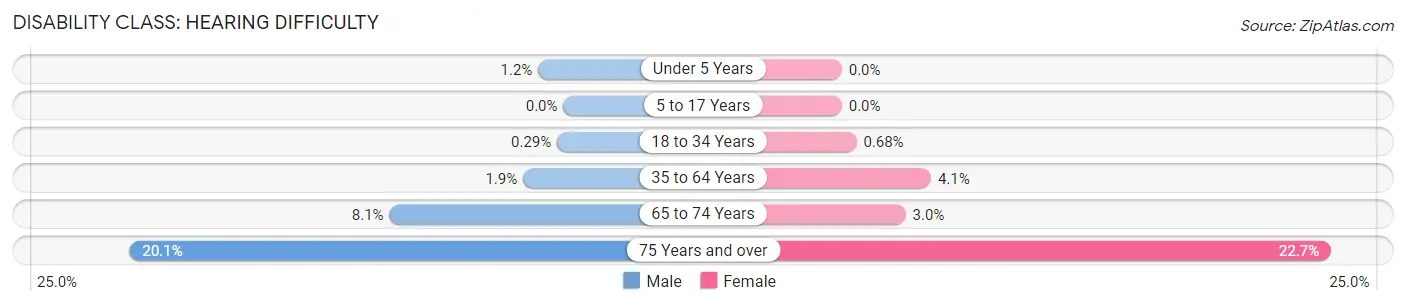
| Age Bracket | Male | Female |
| Under 5 Years | 16 (1.2%) | 0 (0.0%) |
| 5 to 17 Years | 0 (0.0%) | 0 (0.0%) |
| 18 to 34 Years | 16 (0.3%) | 31 (0.7%) |
| 35 to 64 Years | 150 (1.9%) | 336 (4.1%) |
| 65 to 74 Years | 158 (8.1%) | 46 (3.0%) |
| 75 Years and over | 114 (20.1%) | 323 (22.7%) |
Disability Class: Vision Difficulty
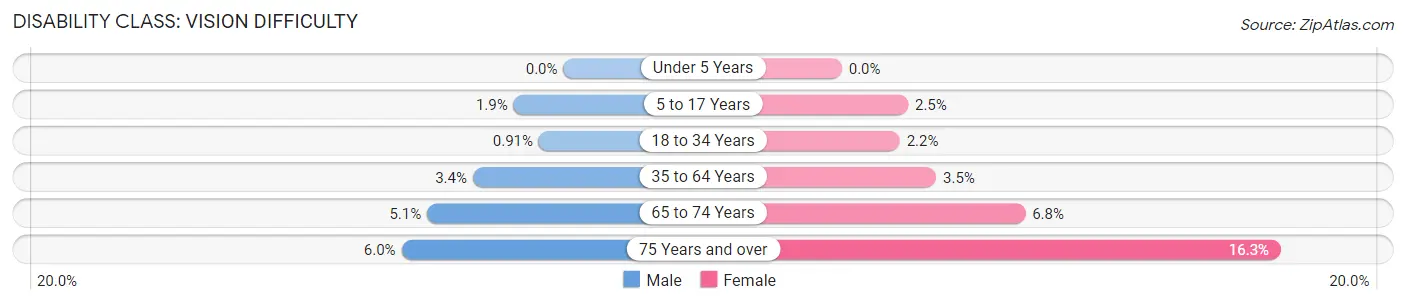
| Age Bracket | Male | Female |
| Under 5 Years | 0 (0.0%) | 0 (0.0%) |
| 5 to 17 Years | 61 (1.8%) | 59 (2.5%) |
| 18 to 34 Years | 51 (0.9%) | 98 (2.1%) |
| 35 to 64 Years | 270 (3.4%) | 284 (3.5%) |
| 65 to 74 Years | 99 (5.1%) | 106 (6.8%) |
| 75 Years and over | 34 (6.0%) | 232 (16.3%) |
Disability Class: Cognitive Difficulty
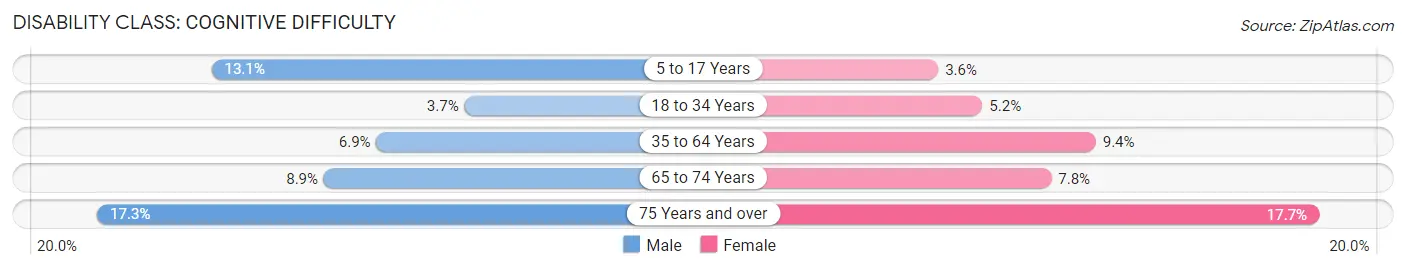
| Age Bracket | Male | Female |
| 5 to 17 Years | 431 (13.1%) | 86 (3.6%) |
| 18 to 34 Years | 205 (3.7%) | 238 (5.2%) |
| 35 to 64 Years | 557 (6.9%) | 766 (9.4%) |
| 65 to 74 Years | 174 (8.9%) | 121 (7.8%) |
| 75 Years and over | 98 (17.3%) | 252 (17.7%) |
Disability Class: Ambulatory Difficulty
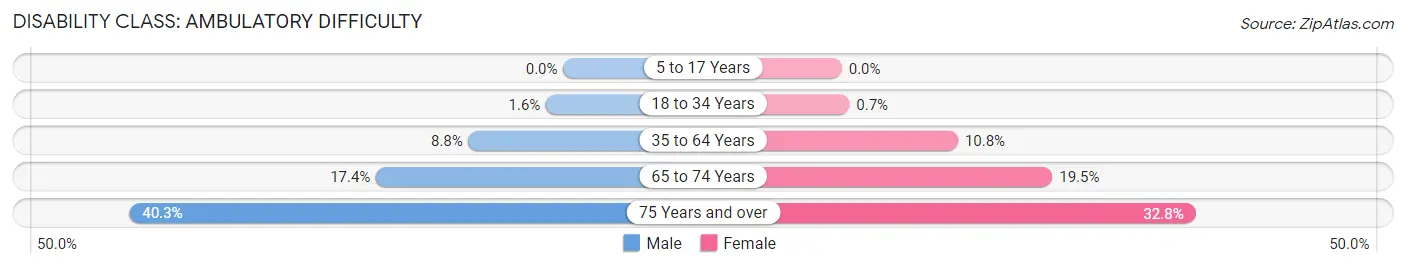
| Age Bracket | Male | Female |
| 5 to 17 Years | 0 (0.0%) | 0 (0.0%) |
| 18 to 34 Years | 89 (1.6%) | 32 (0.7%) |
| 35 to 64 Years | 706 (8.8%) | 876 (10.8%) |
| 65 to 74 Years | 340 (17.4%) | 304 (19.5%) |
| 75 Years and over | 228 (40.3%) | 467 (32.8%) |
Disability Class: Self-Care Difficulty
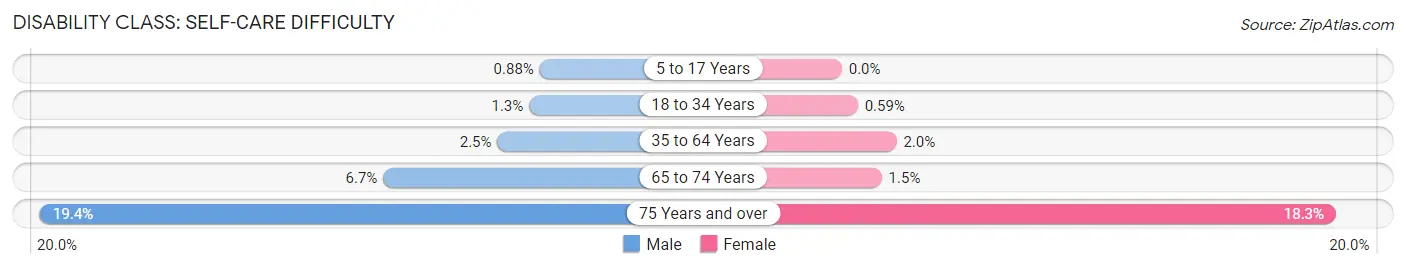
| Age Bracket | Male | Female |
| 5 to 17 Years | 29 (0.9%) | 0 (0.0%) |
| 18 to 34 Years | 71 (1.3%) | 27 (0.6%) |
| 35 to 64 Years | 197 (2.5%) | 165 (2.0%) |
| 65 to 74 Years | 131 (6.7%) | 23 (1.5%) |
| 75 Years and over | 110 (19.4%) | 261 (18.3%) |
Technology Access in Covington
Computing Device Access in Covington
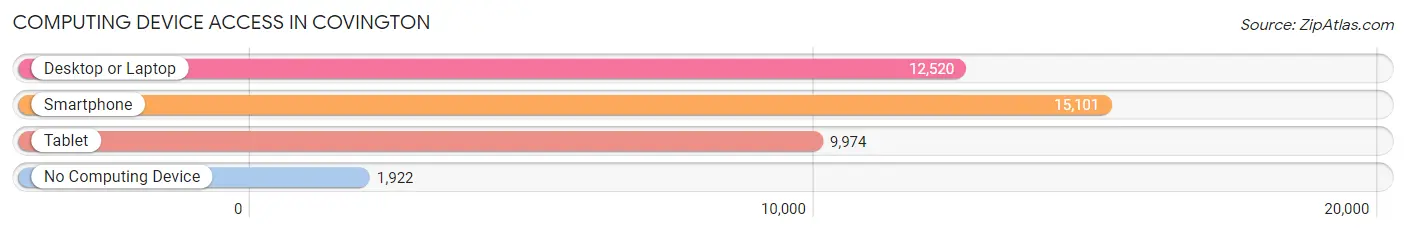
| Device Type | # Households | % Households |
| Desktop or Laptop | 12,520 | 68.6% |
| Smartphone | 15,101 | 82.8% |
| Tablet | 9,974 | 54.7% |
| No Computing Device | 1,922 | 10.5% |
| Total | 18,243 | 100.0% |
Internet Access in Covington
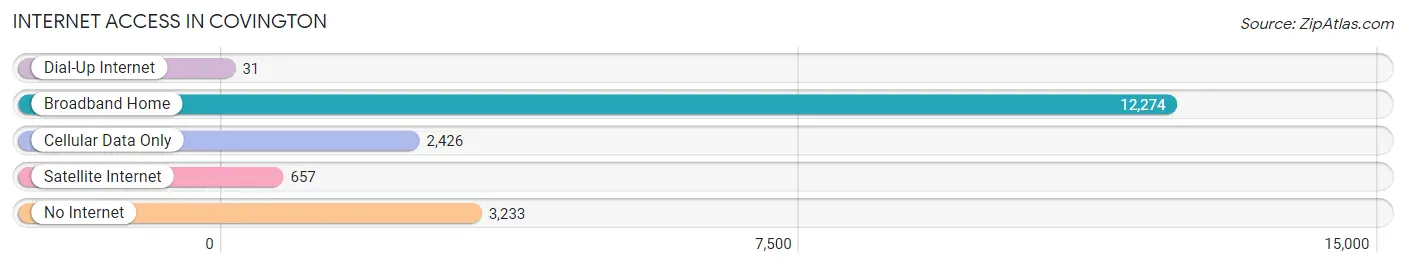
| Internet Type | # Households | % Households |
| Dial-Up Internet | 31 | 0.2% |
| Broadband Home | 12,274 | 67.3% |
| Cellular Data Only | 2,426 | 13.3% |
| Satellite Internet | 657 | 3.6% |
| No Internet | 3,233 | 17.7% |
| Total | 18,243 | 100.0% |
Covington Summary
Covington, Kentucky is a city located in the northern part of the state, just across the Ohio River from Cincinnati, Ohio. It is the county seat of Kenton County and is part of the Cincinnati metropolitan area. The city has a population of 40,640 as of the 2010 census, making it the fifth-largest city in the state.
History
Covington was founded in 1815 by William Covington, a Revolutionary War veteran. The city was named after him and was incorporated in 1816. In the early 19th century, Covington was a major port city, with steamboats traveling up and down the Ohio River. The city was also a major center for the production of iron and steel products.
In the late 19th century, Covington experienced a period of rapid growth and development. The city was home to several large factories, including the Covington Iron Works, which produced iron and steel products for the railroad industry. The city also became a major center for the production of tobacco products.
In the early 20th century, Covington was a major center for the production of automobiles. The city was home to several large automobile factories, including the Covington Automobile Company, which produced the Covington Model T.
Geography
Covington is located in northern Kentucky, just across the Ohio River from Cincinnati, Ohio. The city is situated on the banks of the Licking River, which flows into the Ohio River. The city has a total area of 8.3 square miles, of which 8.2 square miles is land and 0.1 square miles is water.
The city is located in the humid subtropical climate zone, with hot, humid summers and cold, wet winters. The average annual temperature is 57 degrees Fahrenheit, with an average high of 79 degrees in July and an average low of 35 degrees in January.
Economy
Covington’s economy is largely based on manufacturing and services. The city is home to several large factories, including the Covington Iron Works, which produces iron and steel products for the railroad industry. The city is also home to several large automobile factories, including the Covington Automobile Company, which produces the Covington Model T.
The city is also home to several large healthcare facilities, including St. Elizabeth Healthcare, which is the largest healthcare provider in the region. The city is also home to several large retail stores, including the Covington Mall, which is the largest shopping center in the region.
Demographics
As of the 2010 census, Covington had a population of 40,640. The racial makeup of the city was 79.2% White, 15.3% African American, 0.3% Native American, 1.2% Asian, 0.1% Pacific Islander, 1.3% from other races, and 2.7% from two or more races. Hispanic or Latino of any race were 4.2% of the population.
The median income for a household in the city was $37,837, and the median income for a family was $45,945. The per capita income for the city was $20,945. About 16.2% of the population was below the poverty line.
Covington is a diverse city with a rich history and a vibrant economy. The city is home to several large factories and healthcare facilities, as well as several large retail stores. The city has a population of 40,640 as of the 2010 census, making it the fifth-largest city in the state.
Common Questions
What is Per Capita Income in Covington?
Per Capita income in Covington is $33,868.
What is the Median Family Income in Covington?
Median Family Income in Covington is $74,007.
What is the Median Household income in Covington?
Median Household Income in Covington is $53,770.
What is Income or Wage Gap in Covington?
Income or Wage Gap in Covington is 15.1%.
Women in Covington earn 84.9 cents for every dollar earned by a man.
What is Family Income Deficit in Covington?
Family Income Deficit in Covington is $11,248.
Families that are below poverty line in Covington earn $11,248 less on average than the poverty threshold level.
What is Inequality or Gini Index in Covington?
Inequality or Gini Index in Covington is 0.49.
What is the Total Population of Covington?
Total Population of Covington is 40,923.
What is the Total Male Population of Covington?
Total Male Population of Covington is 21,197.
What is the Total Female Population of Covington?
Total Female Population of Covington is 19,726.
What is the Ratio of Males per 100 Females in Covington?
There are 107.46 Males per 100 Females in Covington.
What is the Ratio of Females per 100 Males in Covington?
There are 93.06 Females per 100 Males in Covington.
What is the Median Population Age in Covington?
Median Population Age in Covington is 37.8 Years.
What is the Average Family Size in Covington
Average Family Size in Covington is 3.0 People.
What is the Average Household Size in Covington
Average Household Size in Covington is 2.2 People.
How Large is the Labor Force in Covington?
There are 22,238 People in the Labor Forcein in Covington.
What is the Percentage of People in the Labor Force in Covington?
66.8% of People are in the Labor Force in Covington.
What is the Unemployment Rate in Covington?
Unemployment Rate in Covington is 6.1%.