Cecilia, KY Map & Demographics
Cecilia Map
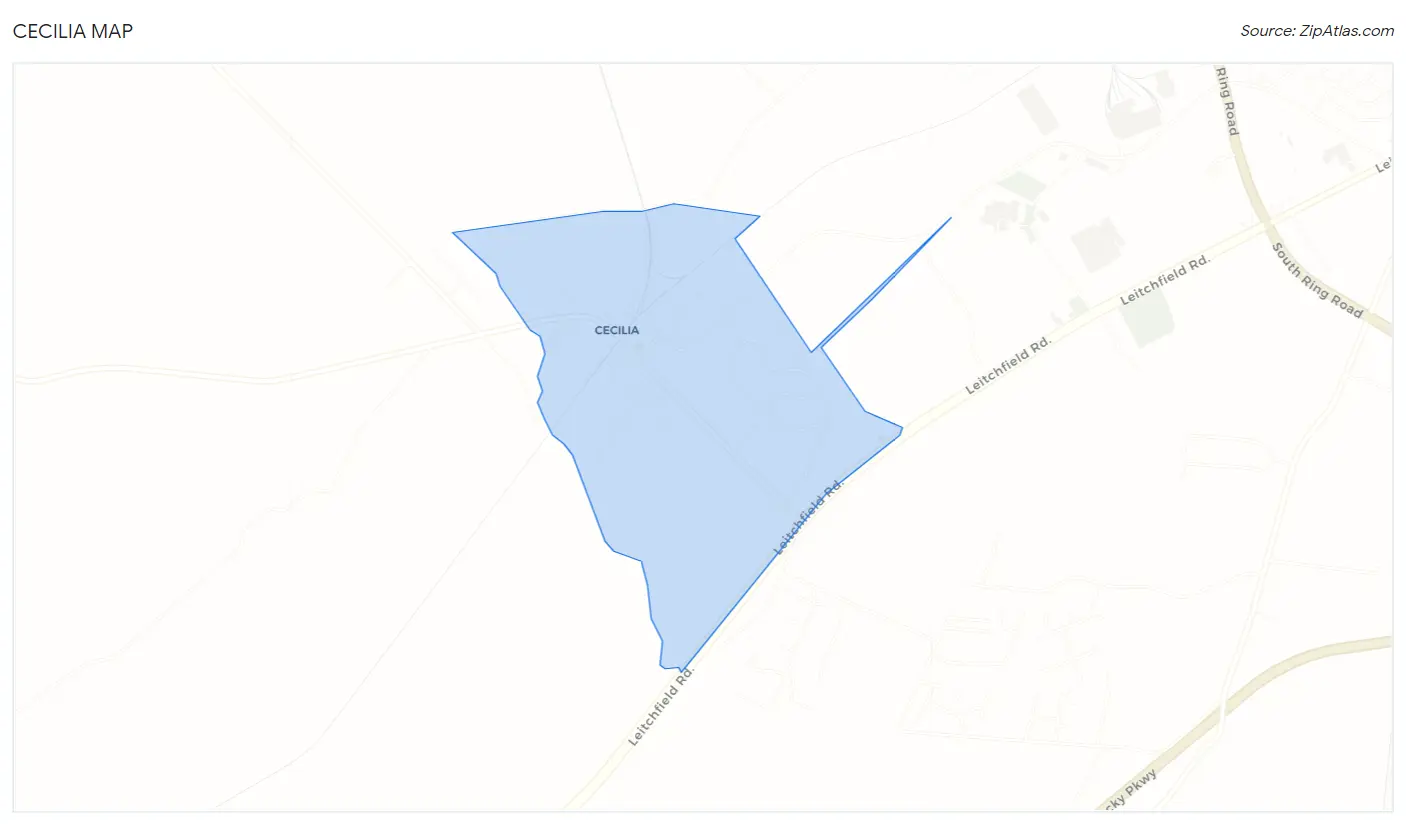
Cecilia Overview
$27,551
PER CAPITA INCOME
$78,375
AVG HOUSEHOLD INCOME
39.6%
WAGE / INCOME GAP [ % ]
60.4¢/ $1
WAGE / INCOME GAP [ $ ]
0.38
INEQUALITY / GINI INDEX
439
TOTAL POPULATION
178
MALE POPULATION
261
FEMALE POPULATION
68.20
MALES / 100 FEMALES
146.63
FEMALES / 100 MALES
49.9
MEDIAN AGE
2.5
AVG FAMILY SIZE
2.8
AVG HOUSEHOLD SIZE
213
LABOR FORCE [ PEOPLE ]
56.5%
PERCENT IN LABOR FORCE
28.6%
UNEMPLOYMENT RATE
Cecilia Zip Codes
Cecilia Area Codes
Income in Cecilia
Income Overview in Cecilia
| Characteristic | Number | Measure |
| Per Capita Income | 439 | $27,551 |
| Median Family Income | 158 | $0 |
| Mean Family Income | 158 | $76,368 |
| Median Household Income | 158 | $78,375 |
| Mean Household Income | 158 | $81,725 |
| Income Deficit | 158 | $0 |
| Wage / Income Gap (%) | 439 | 39.58% |
| Wage / Income Gap ($) | 439 | 60.42¢ per $1 |
| Gini / Inequality Index | 439 | 0.38 |
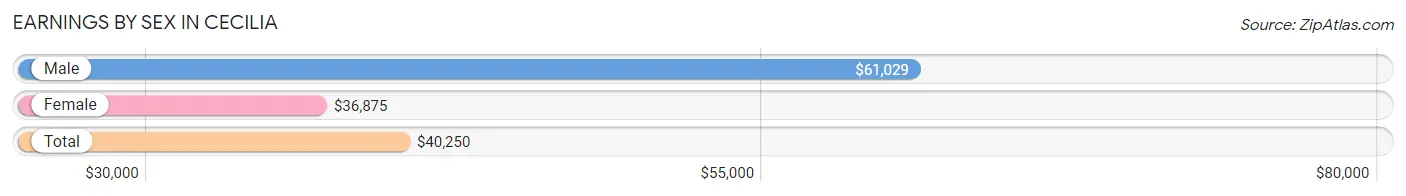
Earnings by Sex in Cecilia
Average Earnings in Cecilia are $40,250, $61,029 for men and $36,875 for women, a difference of 39.6%.
| Sex | Number | Average Earnings |
| Male | 92 (45.1%) | $61,029 |
| Female | 112 (54.9%) | $36,875 |
| Total | 204 (100.0%) | $40,250 |
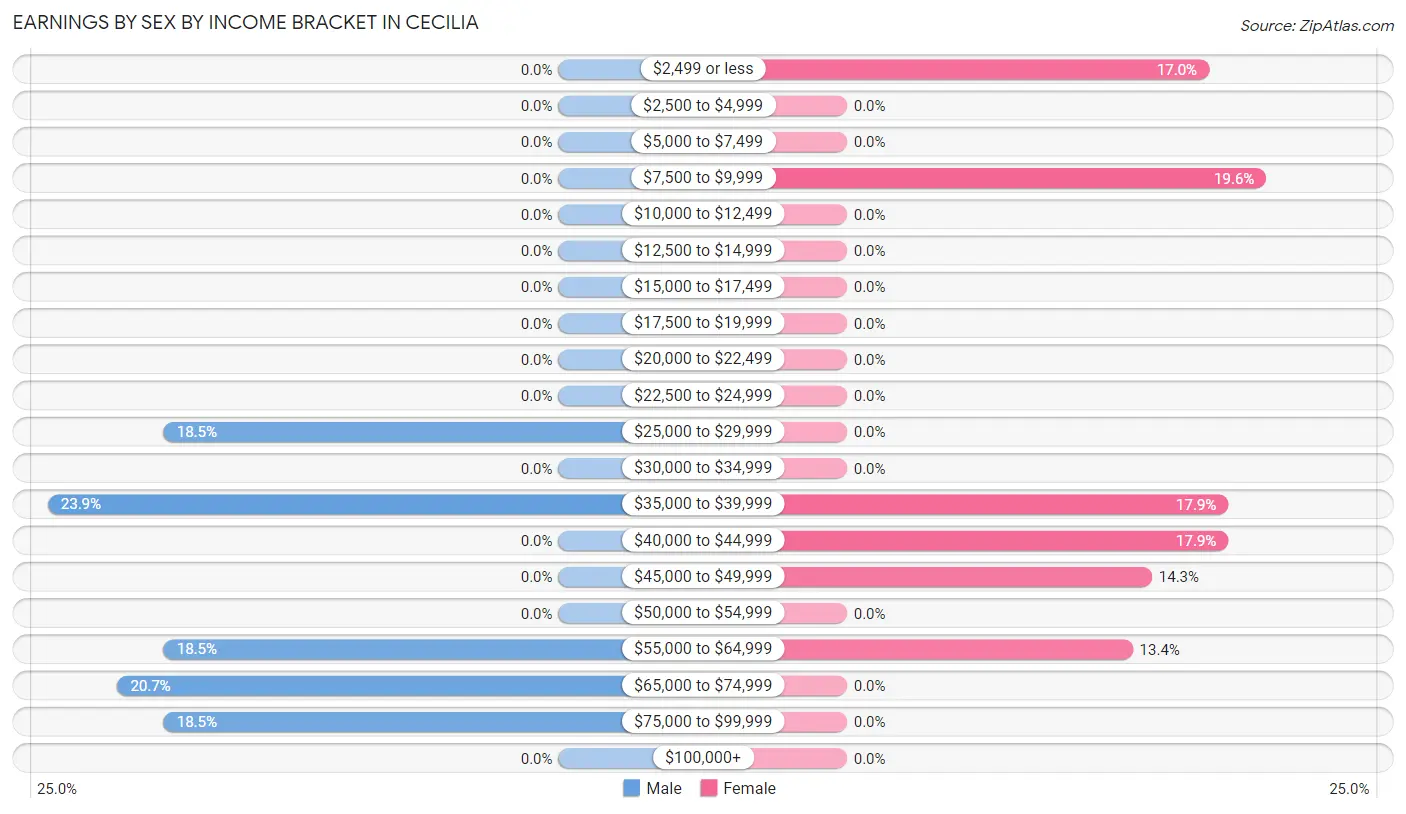
Earnings by Sex by Income Bracket in Cecilia
The most common earnings brackets in Cecilia are $35,000 to $39,999 for men (22 | 23.9%) and $7,500 to $9,999 for women (22 | 19.6%).
| Income | Male | Female |
| $2,499 or less | 0 (0.0%) | 19 (17.0%) |
| $2,500 to $4,999 | 0 (0.0%) | 0 (0.0%) |
| $5,000 to $7,499 | 0 (0.0%) | 0 (0.0%) |
| $7,500 to $9,999 | 0 (0.0%) | 22 (19.6%) |
| $10,000 to $12,499 | 0 (0.0%) | 0 (0.0%) |
| $12,500 to $14,999 | 0 (0.0%) | 0 (0.0%) |
| $15,000 to $17,499 | 0 (0.0%) | 0 (0.0%) |
| $17,500 to $19,999 | 0 (0.0%) | 0 (0.0%) |
| $20,000 to $22,499 | 0 (0.0%) | 0 (0.0%) |
| $22,500 to $24,999 | 0 (0.0%) | 0 (0.0%) |
| $25,000 to $29,999 | 17 (18.5%) | 0 (0.0%) |
| $30,000 to $34,999 | 0 (0.0%) | 0 (0.0%) |
| $35,000 to $39,999 | 22 (23.9%) | 20 (17.9%) |
| $40,000 to $44,999 | 0 (0.0%) | 20 (17.9%) |
| $45,000 to $49,999 | 0 (0.0%) | 16 (14.3%) |
| $50,000 to $54,999 | 0 (0.0%) | 0 (0.0%) |
| $55,000 to $64,999 | 17 (18.5%) | 15 (13.4%) |
| $65,000 to $74,999 | 19 (20.6%) | 0 (0.0%) |
| $75,000 to $99,999 | 17 (18.5%) | 0 (0.0%) |
| $100,000+ | 0 (0.0%) | 0 (0.0%) |
| Total | 92 (100.0%) | 112 (100.0%) |
Earnings by Sex by Educational Attainment in Cecilia
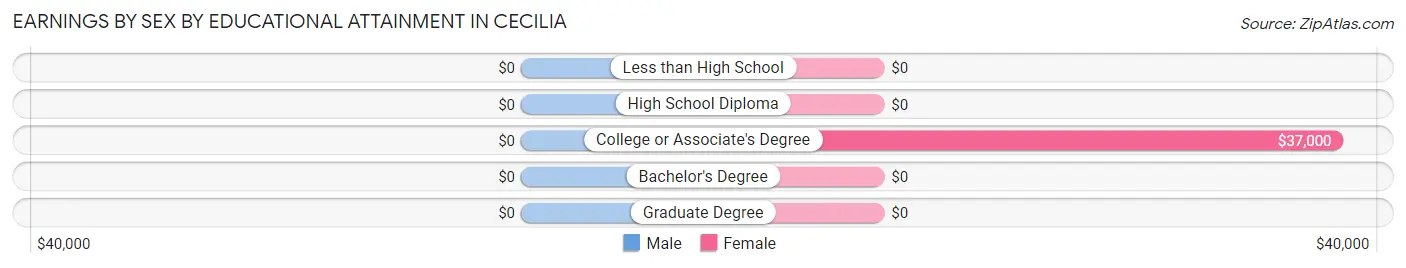
| Educational Attainment | Male Income | Female Income |
| Less than High School | - | - |
| High School Diploma | - | - |
| College or Associate's Degree | - | - |
| Bachelor's Degree | - | - |
| Graduate Degree | - | - |
| Total | $61,029 | $36,875 |
Family Income in Cecilia
Family Income Brackets in Cecilia
According to the Cecilia family income data, there are 41 families falling into the $15,000 to $24,999 income range, which is the most common income bracket and makes up 26.0% of all families.
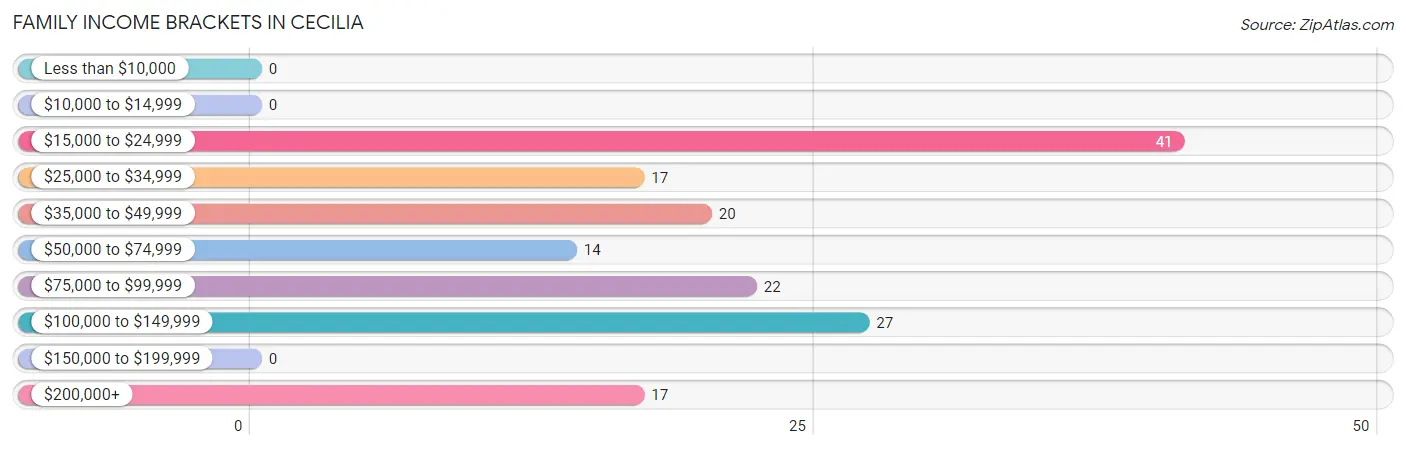
| Income Bracket | # Families | % Families |
| Less than $10,000 | 0 | 0.0% |
| $10,000 to $14,999 | 0 | 0.0% |
| $15,000 to $24,999 | 41 | 25.9% |
| $25,000 to $34,999 | 17 | 10.8% |
| $35,000 to $49,999 | 20 | 12.7% |
| $50,000 to $74,999 | 14 | 8.9% |
| $75,000 to $99,999 | 22 | 13.9% |
| $100,000 to $149,999 | 27 | 17.1% |
| $150,000 to $199,999 | 0 | 0.0% |
| $200,000+ | 17 | 10.8% |
Family Income by Famaliy Size in Cecilia
| Income Bracket | # Families | Median Income |
| 2-Person Families | 148 (93.7%) | $0 |
| 3-Person Families | 10 (6.3%) | $0 |
| 4-Person Families | 0 (0.0%) | $0 |
| 5-Person Families | 0 (0.0%) | $0 |
| 6-Person Families | 0 (0.0%) | $0 |
| 7+ Person Families | 0 (0.0%) | $0 |
| Total | 158 (100.0%) | $0 |
Family Income by Number of Earners in Cecilia
| Number of Earners | # Families | Median Income |
| No Earners | 41 (26.0%) | $0 |
| 1 Earner | 44 (27.9%) | $0 |
| 2 Earners | 73 (46.2%) | $0 |
| 3+ Earners | 0 (0.0%) | $0 |
| Total | 158 (100.0%) | $0 |
Household Income in Cecilia
Household Income Brackets in Cecilia
With 42 households falling in the category, the $75,000 to $99,999 income range is the most frequent in Cecilia, accounting for 26.6% of all households.
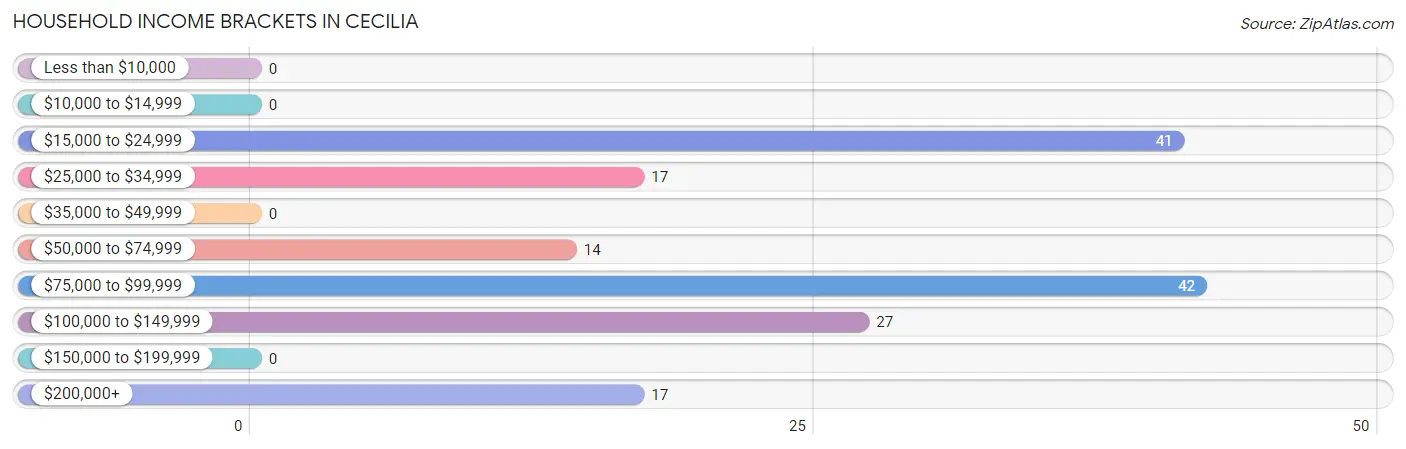
| Income Bracket | # Households | % Households |
| Less than $10,000 | 0 | 0.0% |
| $10,000 to $14,999 | 0 | 0.0% |
| $15,000 to $24,999 | 41 | 25.9% |
| $25,000 to $34,999 | 17 | 10.8% |
| $35,000 to $49,999 | 0 | 0.0% |
| $50,000 to $74,999 | 14 | 8.9% |
| $75,000 to $99,999 | 42 | 26.6% |
| $100,000 to $149,999 | 27 | 17.1% |
| $150,000 to $199,999 | 0 | 0.0% |
| $200,000+ | 17 | 10.8% |
Household Income by Householder Age in Cecilia
The median household income in Cecilia is $78,375, with the highest median household income of $133,088 found in the 45 to 64 years age bracket for the primary householder. A total of 80 households (50.6%) fall into this category.

| Income Bracket | # Households | Median Income |
| 15 to 24 Years | 0 (0.0%) | $0 |
| 25 to 44 Years | 37 (23.4%) | $0 |
| 45 to 64 Years | 80 (50.6%) | $133,088 |
| 65+ Years | 41 (26.0%) | $0 |
| Total | 158 (100.0%) | $78,375 |
Poverty in Cecilia
Income Below Poverty by Sex and Age in Cecilia
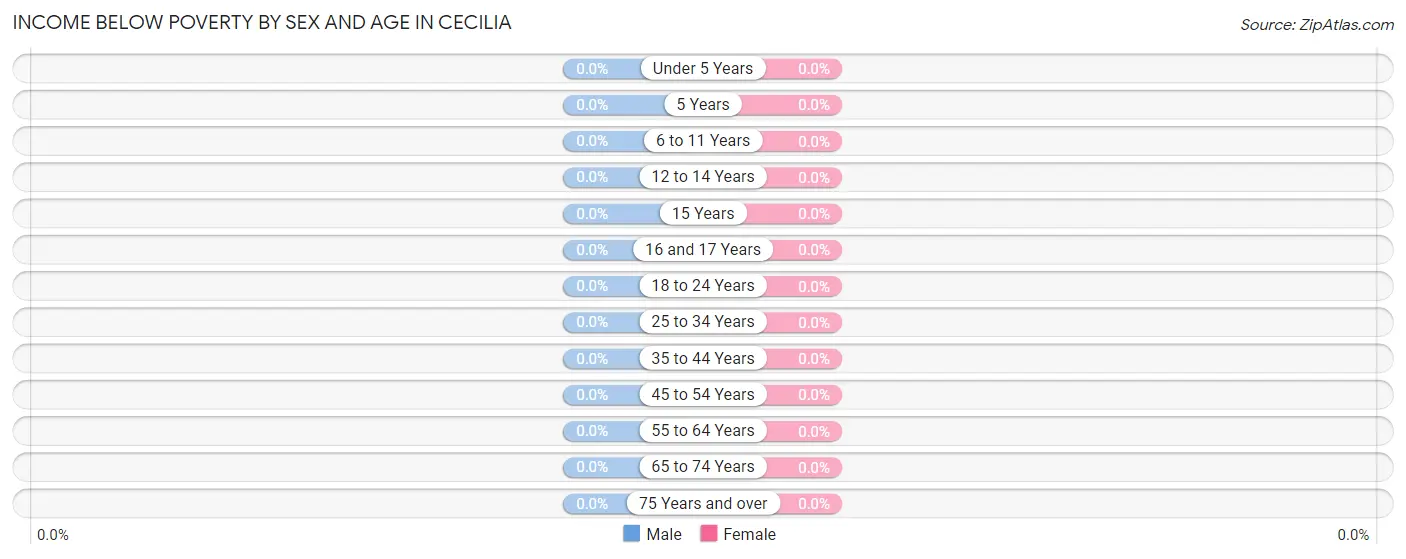
| Age Bracket | Male | Female |
| Under 5 Years | 0 (0.0%) | 0 (0.0%) |
| 5 Years | 0 (0.0%) | 0 (0.0%) |
| 6 to 11 Years | 0 (0.0%) | 0 (0.0%) |
| 12 to 14 Years | 0 (0.0%) | 0 (0.0%) |
| 15 Years | 0 (0.0%) | 0 (0.0%) |
| 16 and 17 Years | 0 (0.0%) | 0 (0.0%) |
| 18 to 24 Years | 0 (0.0%) | 0 (0.0%) |
| 25 to 34 Years | 0 (0.0%) | 0 (0.0%) |
| 35 to 44 Years | 0 (0.0%) | 0 (0.0%) |
| 45 to 54 Years | 0 (0.0%) | 0 (0.0%) |
| 55 to 64 Years | 0 (0.0%) | 0 (0.0%) |
| 65 to 74 Years | 0 (0.0%) | 0 (0.0%) |
| 75 Years and over | 0 (0.0%) | 0 (0.0%) |
| Total | 0 (0.0%) | 0 (0.0%) |
Income Above Poverty by Sex and Age in Cecilia
According to the poverty statistics in Cecilia, males aged 25 to 34 years and females aged under 5 years are the age groups that are most secure financially, with 100.0% of males and 100.0% of females in these age groups living above the poverty line.
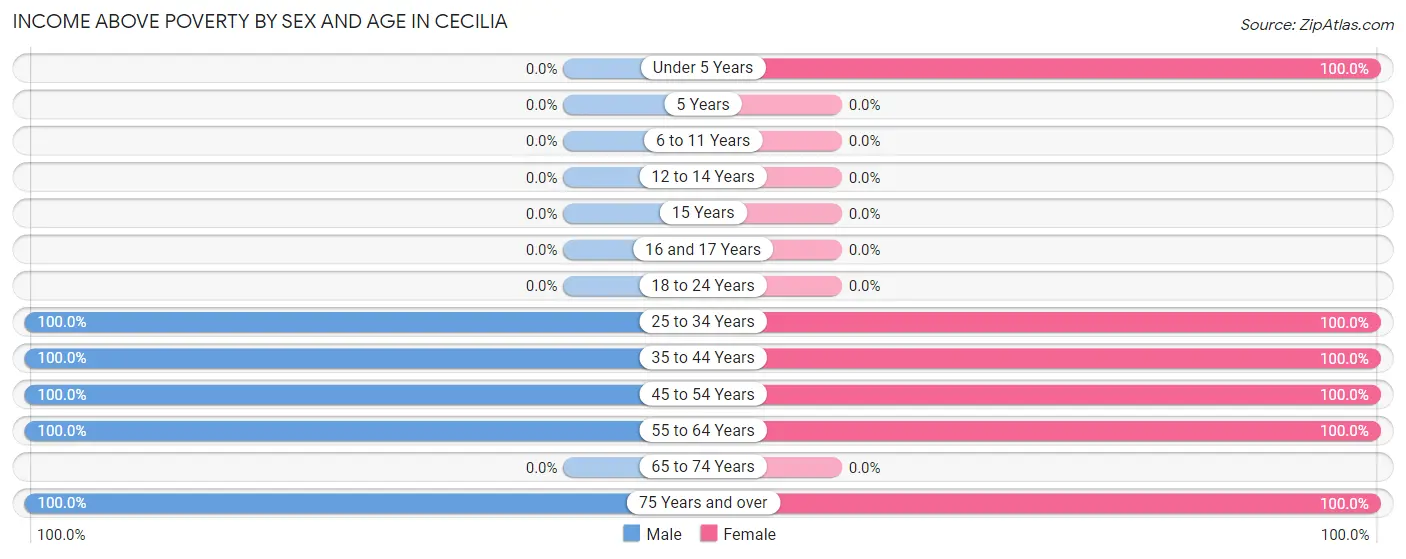
| Age Bracket | Male | Female |
| Under 5 Years | 0 (0.0%) | 46 (100.0%) |
| 5 Years | 0 (0.0%) | 0 (0.0%) |
| 6 to 11 Years | 0 (0.0%) | 0 (0.0%) |
| 12 to 14 Years | 0 (0.0%) | 0 (0.0%) |
| 15 Years | 0 (0.0%) | 0 (0.0%) |
| 16 and 17 Years | 0 (0.0%) | 0 (0.0%) |
| 18 to 24 Years | 0 (0.0%) | 0 (0.0%) |
| 25 to 34 Years | 67 (100.0%) | 20 (100.0%) |
| 35 to 44 Years | 17 (100.0%) | 19 (100.0%) |
| 45 to 54 Years | 26 (100.0%) | 70 (100.0%) |
| 55 to 64 Years | 27 (100.0%) | 67 (100.0%) |
| 65 to 74 Years | 0 (0.0%) | 0 (0.0%) |
| 75 Years and over | 41 (100.0%) | 23 (100.0%) |
| Total | 178 (100.0%) | 245 (100.0%) |
Income Below Poverty Among Married-Couple Families in Cecilia
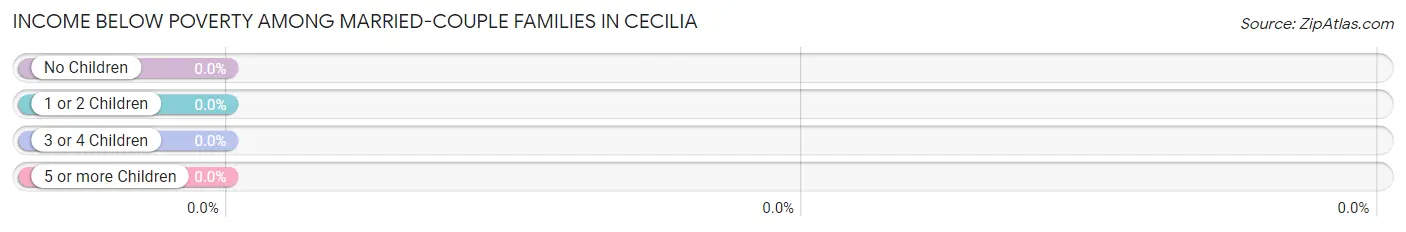
| Children | Above Poverty | Below Poverty |
| No Children | 124 (100.0%) | 0 (0.0%) |
| 1 or 2 Children | 0 (0.0%) | 0 (0.0%) |
| 3 or 4 Children | 0 (0.0%) | 0 (0.0%) |
| 5 or more Children | 0 (0.0%) | 0 (0.0%) |
| Total | 124 (100.0%) | 0 (0.0%) |
Income Below Poverty Among Single-Parent Households in Cecilia
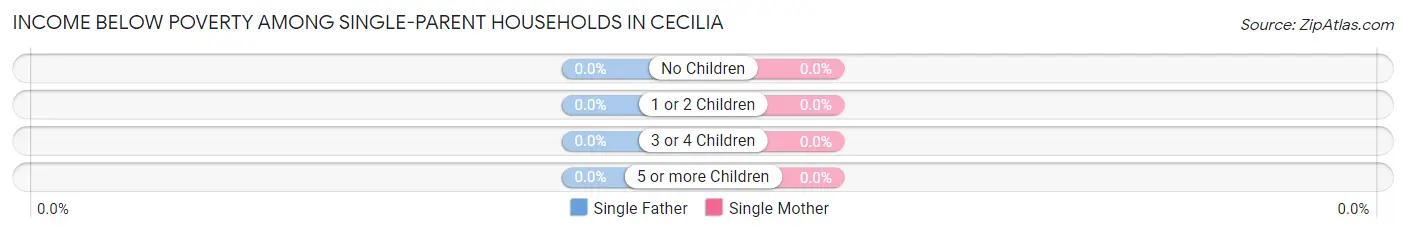
| Children | Single Father | Single Mother |
| No Children | 0 (0.0%) | 0 (0.0%) |
| 1 or 2 Children | 0 (0.0%) | 0 (0.0%) |
| 3 or 4 Children | 0 (0.0%) | 0 (0.0%) |
| 5 or more Children | 0 (0.0%) | 0 (0.0%) |
| Total | 0 (0.0%) | 0 (0.0%) |
Income Below Poverty Among Married-Couple vs Single-Parent Households in Cecilia
| Children | Married-Couple Families | Single-Parent Households |
| No Children | 0 (0.0%) | 0 (0.0%) |
| 1 or 2 Children | 0 (0.0%) | 0 (0.0%) |
| 3 or 4 Children | 0 (0.0%) | 0 (0.0%) |
| 5 or more Children | 0 (0.0%) | 0 (0.0%) |
| Total | 0 (0.0%) | 0 (0.0%) |
Race in Cecilia
The most populous races in Cecilia are White / Caucasian (201 | 45.8%), Two or more Races (145 | 33.0%), and Some other Race (55 | 12.5%).
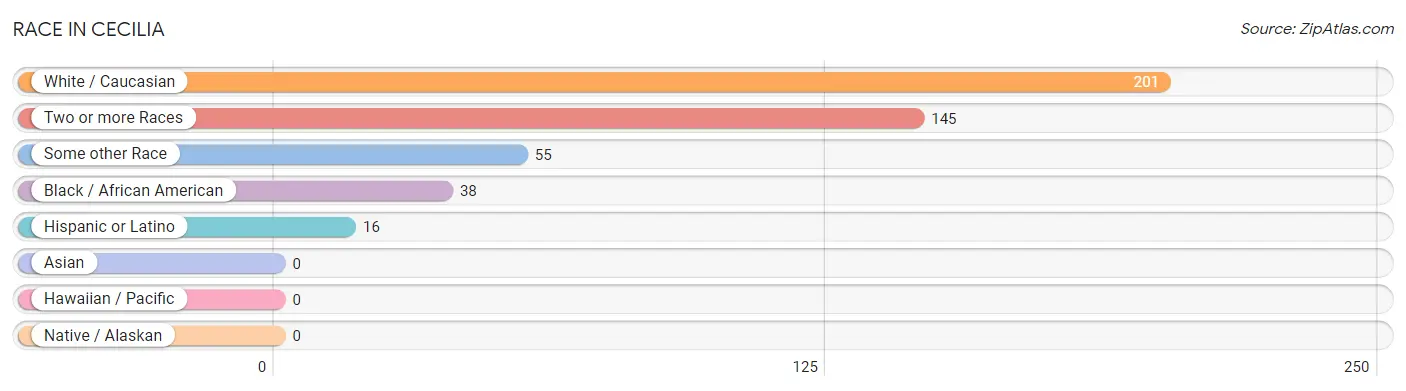
| Race | # Population | % Population |
| Asian | 0 | 0.0% |
| Black / African American | 38 | 8.7% |
| Hawaiian / Pacific | 0 | 0.0% |
| Hispanic or Latino | 16 | 3.6% |
| Native / Alaskan | 0 | 0.0% |
| White / Caucasian | 201 | 45.8% |
| Two or more Races | 145 | 33.0% |
| Some other Race | 55 | 12.5% |
| Total | 439 | 100.0% |
Ancestry in Cecilia
The most populous ancestries reported in Cecilia are American (92 | 21.0%), German (80 | 18.2%), Dutch West Indian (56 | 12.8%), Nigerian (42 | 9.6%), and Subsaharan African (42 | 9.6%), together accounting for 71.1% of all Cecilia residents.
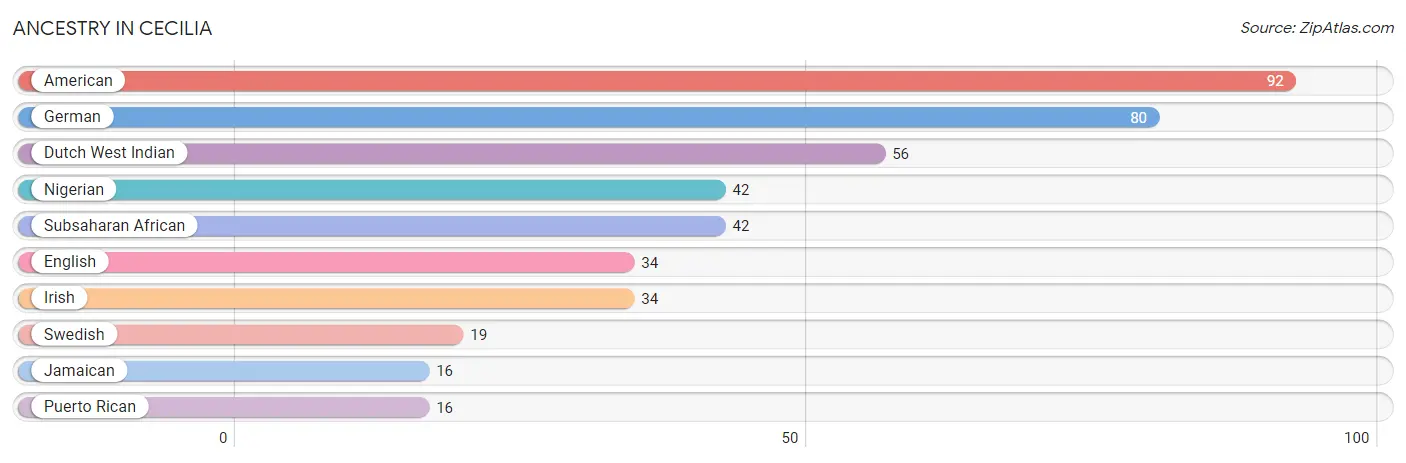
| Ancestry | # Population | % Population |
| American | 92 | 21.0% |
| Dutch West Indian | 56 | 12.8% |
| English | 34 | 7.7% |
| German | 80 | 18.2% |
| Irish | 34 | 7.7% |
| Jamaican | 16 | 3.6% |
| Nigerian | 42 | 9.6% |
| Puerto Rican | 16 | 3.6% |
| Subsaharan African | 42 | 9.6% |
| Swedish | 19 | 4.3% | View All 10 Rows |
Immigrants in Cecilia
The most numerous immigrant groups reported in Cecilia came from Europe (50 | 11.4%), Germany (50 | 11.4%), and Western Europe (50 | 11.4%), together accounting for 34.2% of all Cecilia residents.
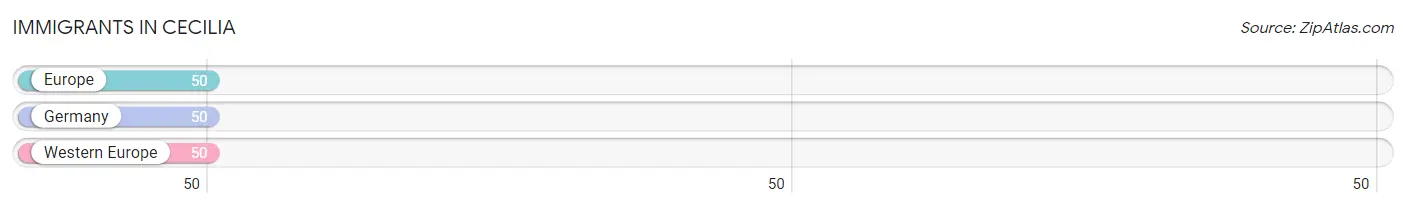
| Immigration Origin | # Population | % Population |
| Europe | 50 | 11.4% |
| Germany | 50 | 11.4% |
| Western Europe | 50 | 11.4% | View All 3 Rows |
Sex and Age in Cecilia
Sex and Age in Cecilia
The most populous age groups in Cecilia are 25 to 29 Years (45 | 25.3%) for men and Under 5 Years (62 | 23.7%) for women.
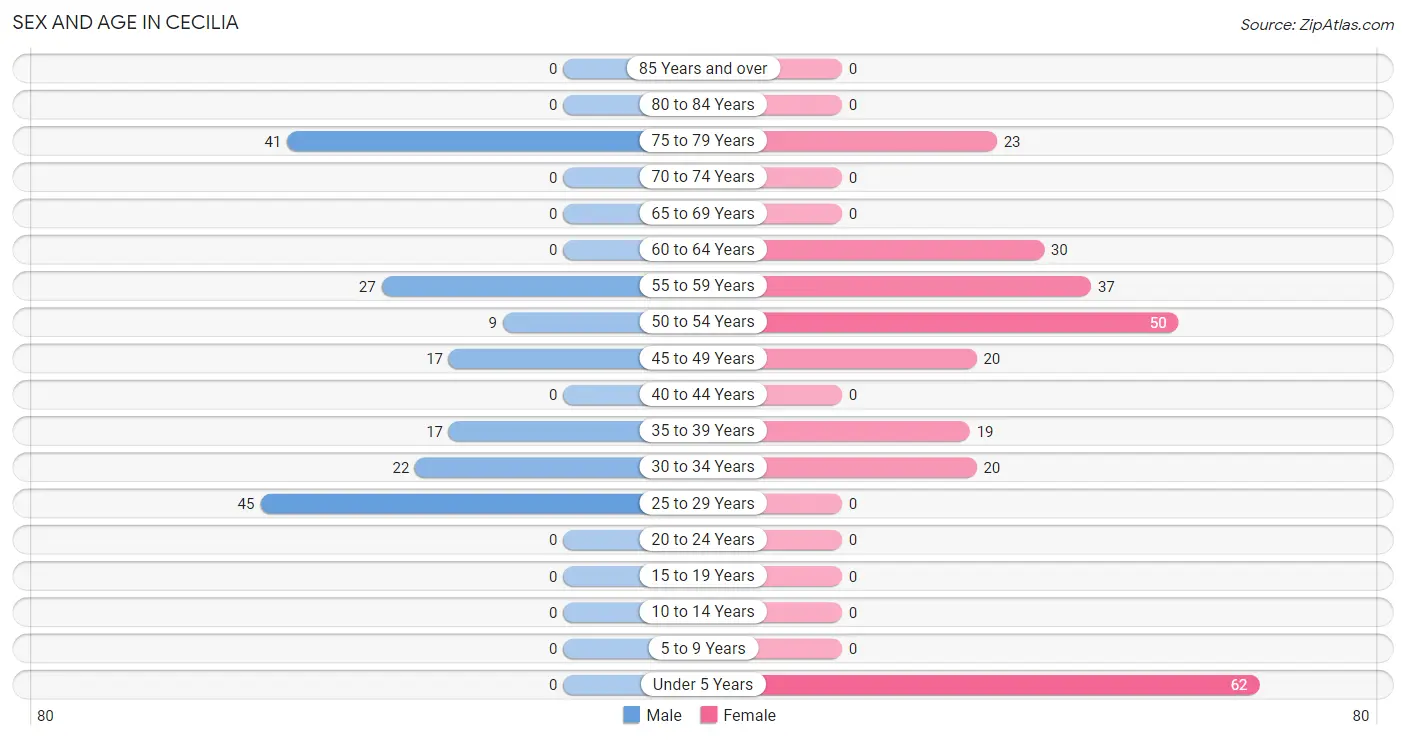
| Age Bracket | Male | Female |
| Under 5 Years | 0 (0.0%) | 62 (23.7%) |
| 5 to 9 Years | 0 (0.0%) | 0 (0.0%) |
| 10 to 14 Years | 0 (0.0%) | 0 (0.0%) |
| 15 to 19 Years | 0 (0.0%) | 0 (0.0%) |
| 20 to 24 Years | 0 (0.0%) | 0 (0.0%) |
| 25 to 29 Years | 45 (25.3%) | 0 (0.0%) |
| 30 to 34 Years | 22 (12.4%) | 20 (7.7%) |
| 35 to 39 Years | 17 (9.6%) | 19 (7.3%) |
| 40 to 44 Years | 0 (0.0%) | 0 (0.0%) |
| 45 to 49 Years | 17 (9.6%) | 20 (7.7%) |
| 50 to 54 Years | 9 (5.1%) | 50 (19.2%) |
| 55 to 59 Years | 27 (15.2%) | 37 (14.2%) |
| 60 to 64 Years | 0 (0.0%) | 30 (11.5%) |
| 65 to 69 Years | 0 (0.0%) | 0 (0.0%) |
| 70 to 74 Years | 0 (0.0%) | 0 (0.0%) |
| 75 to 79 Years | 41 (23.0%) | 23 (8.8%) |
| 80 to 84 Years | 0 (0.0%) | 0 (0.0%) |
| 85 Years and over | 0 (0.0%) | 0 (0.0%) |
| Total | 178 (100.0%) | 261 (100.0%) |
Families and Households in Cecilia
Median Family Size in Cecilia
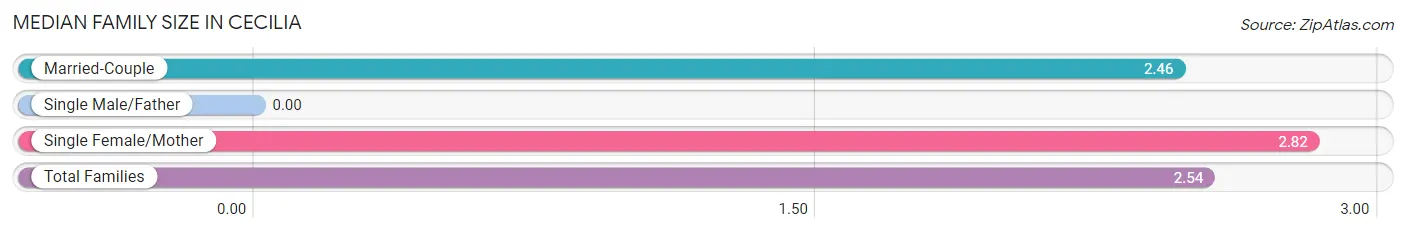
| Family Type | # Families | Family Size |
| Married-Couple | 124 (78.5%) | 2.46 |
| Single Male/Father | 0 (0.0%) | - |
| Single Female/Mother | 34 (21.5%) | 2.82 |
| Total Families | 158 (100.0%) | 2.54 |
Median Household Size in Cecilia
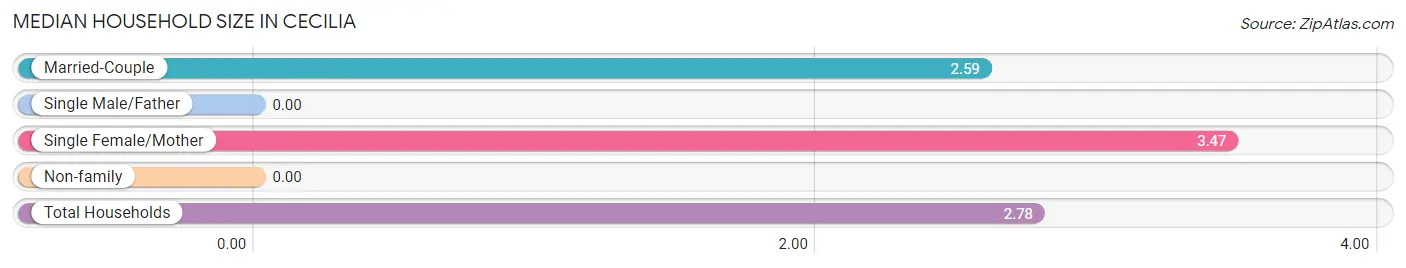
| Household Type | # Households | Household Size |
| Married-Couple | 124 (78.5%) | 2.59 |
| Single Male/Father | 0 (0.0%) | - |
| Single Female/Mother | 34 (21.5%) | 3.47 |
| Non-family | 0 (0.0%) | - |
| Total Households | 158 (100.0%) | 2.78 |
Household Size by Marriage Status in Cecilia
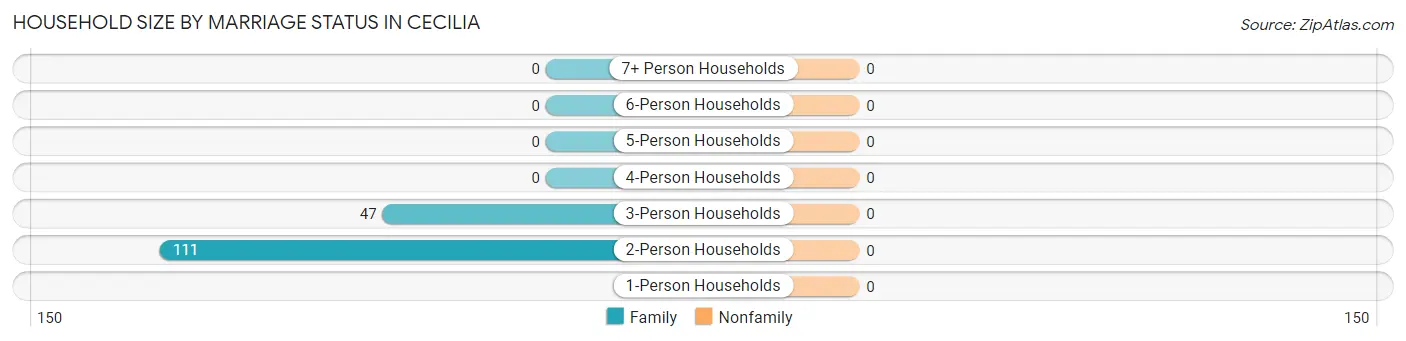
| Household Size | Family Households | Nonfamily Households |
| 1-Person Households | - | 0 (0.0%) |
| 2-Person Households | 111 (70.3%) | 0 (0.0%) |
| 3-Person Households | 47 (29.7%) | 0 (0.0%) |
| 4-Person Households | 0 (0.0%) | 0 (0.0%) |
| 5-Person Households | 0 (0.0%) | 0 (0.0%) |
| 6-Person Households | 0 (0.0%) | 0 (0.0%) |
| 7+ Person Households | 0 (0.0%) | 0 (0.0%) |
| Total | 158 (100.0%) | 0 (0.0%) |
Female Fertility in Cecilia
Fertility by Age in Cecilia
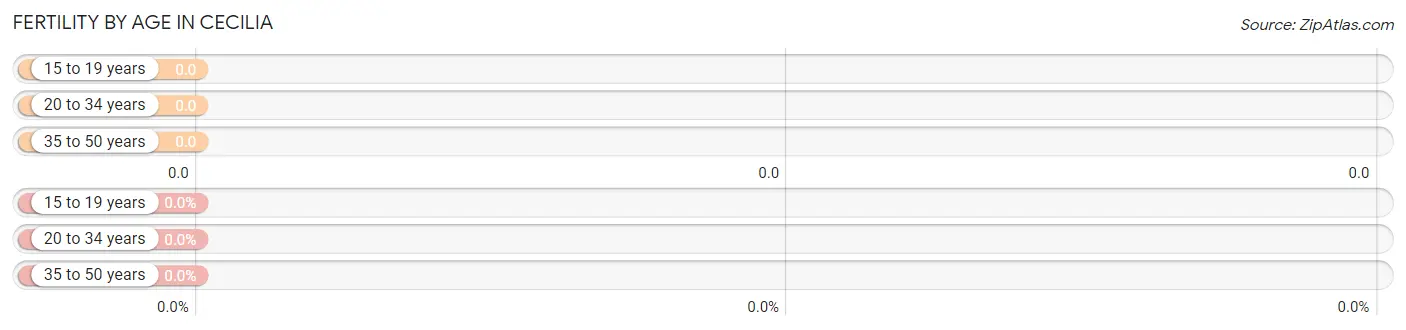
| Age Bracket | Women with Births | Births / 1,000 Women |
| 15 to 19 years | 0 (0.0%) | 0.0 |
| 20 to 34 years | 0 (0.0%) | 0.0 |
| 35 to 50 years | 0 (0.0%) | 0.0 |
| Total | 0 (0.0%) | 0.0 |
Fertility by Age by Marriage Status in Cecilia
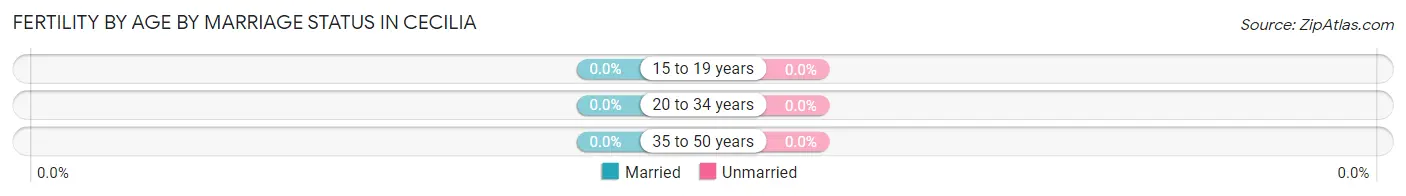
| Age Bracket | Married | Unmarried |
| 15 to 19 years | 0 (0.0%) | 0 (0.0%) |
| 20 to 34 years | 0 (0.0%) | 0 (0.0%) |
| 35 to 50 years | 0 (0.0%) | 0 (0.0%) |
| Total | 0 (0.0%) | 0 (0.0%) |
Fertility by Education in Cecilia
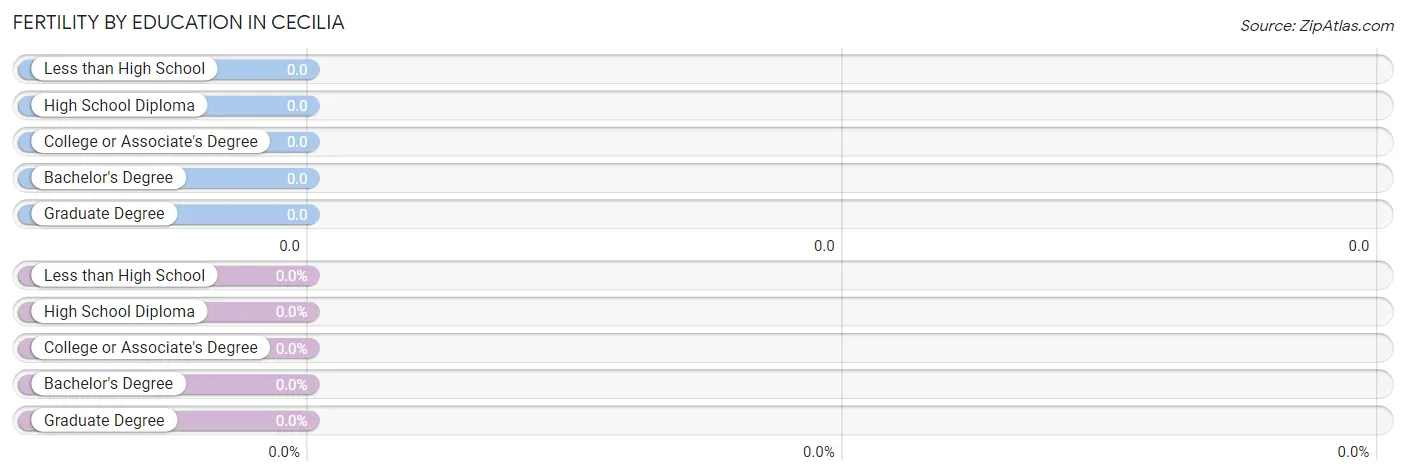
| Educational Attainment | Women with Births | Births / 1,000 Women |
| Less than High School | 0 (0.0%) | 0.0 |
| High School Diploma | 0 (0.0%) | 0.0 |
| College or Associate's Degree | 0 (0.0%) | 0.0 |
| Bachelor's Degree | 0 (0.0%) | 0.0 |
| Graduate Degree | 0 (0.0%) | 0.0 |
| Total | 0 (0.0%) | 0.0 |
Fertility by Education by Marriage Status in Cecilia
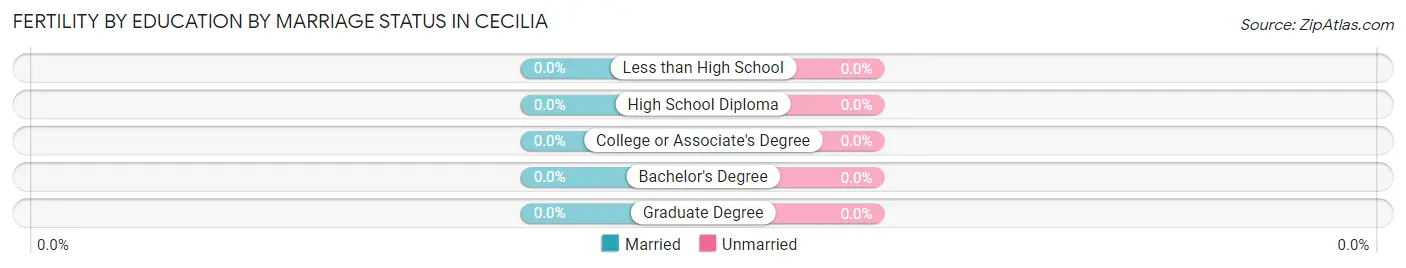
| Educational Attainment | Married | Unmarried |
| Less than High School | 0 (0.0%) | 0 (0.0%) |
| High School Diploma | 0 (0.0%) | 0 (0.0%) |
| College or Associate's Degree | 0 (0.0%) | 0 (0.0%) |
| Bachelor's Degree | 0 (0.0%) | 0 (0.0%) |
| Graduate Degree | 0 (0.0%) | 0 (0.0%) |
| Total | 0 (0.0%) | 0 (0.0%) |
Employment Characteristics in Cecilia
Employment by Class of Employer in Cecilia
Among the 142 employed individuals in Cecilia, private company employees (107 | 75.3%), state government employees (20 | 14.1%), and self-employed (incorporated) (15 | 10.6%) make up the most common classes of employment.
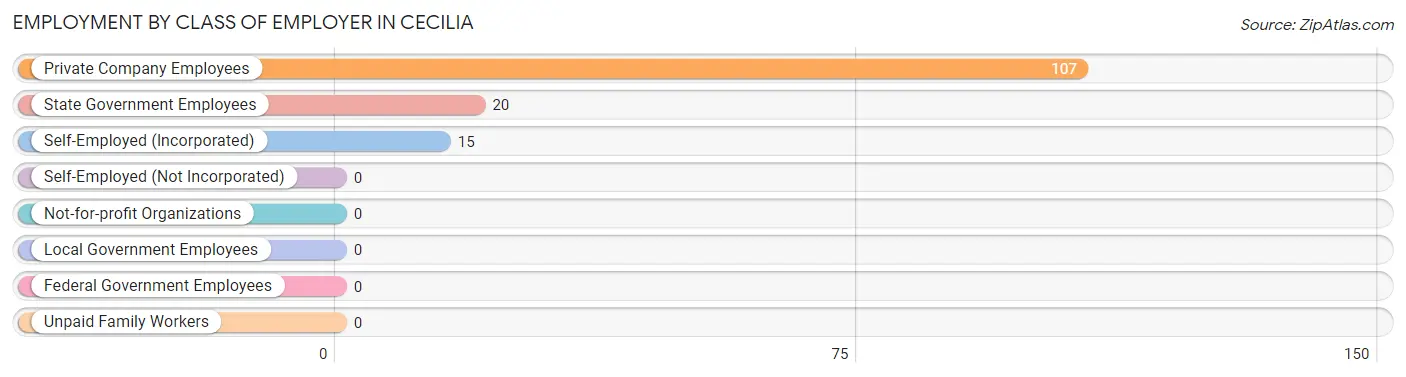
| Employer Class | # Employees | % Employees |
| Private Company Employees | 107 | 75.3% |
| Self-Employed (Incorporated) | 15 | 10.6% |
| Self-Employed (Not Incorporated) | 0 | 0.0% |
| Not-for-profit Organizations | 0 | 0.0% |
| Local Government Employees | 0 | 0.0% |
| State Government Employees | 20 | 14.1% |
| Federal Government Employees | 0 | 0.0% |
| Unpaid Family Workers | 0 | 0.0% |
| Total | 142 | 100.0% |
Employment Status by Age in Cecilia
According to the labor force statistics for Cecilia, out of the total population over 16 years of age (377), 56.5% or 213 individuals are in the labor force, with 28.6% or 61 of them unemployed. The age group with the highest labor force participation rate is 25 to 29 years, with 100.0% or 45 individuals in the labor force. Within the labor force, the 25 to 29 years age range has the highest percentage of unemployed individuals, with 100.0% or 45 of them being unemployed.
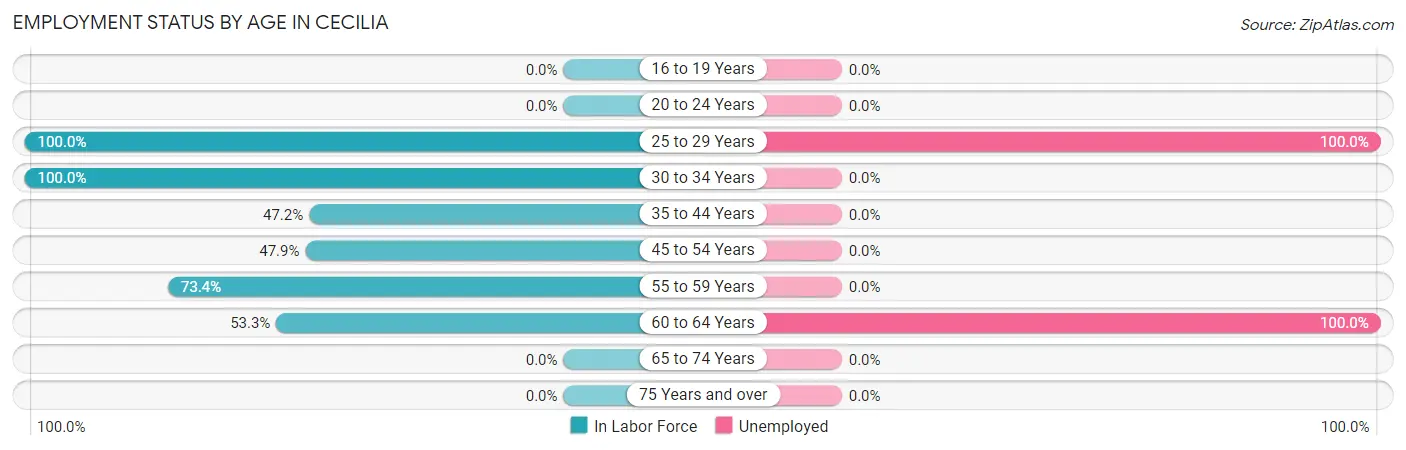
| Age Bracket | In Labor Force | Unemployed |
| 16 to 19 Years | 0 (0.0%) | 0 (0.0%) |
| 20 to 24 Years | 0 (0.0%) | 0 (0.0%) |
| 25 to 29 Years | 45 (100.0%) | 45 (100.0%) |
| 30 to 34 Years | 42 (100.0%) | 0 (0.0%) |
| 35 to 44 Years | 17 (47.2%) | 0 (0.0%) |
| 45 to 54 Years | 46 (47.9%) | 0 (0.0%) |
| 55 to 59 Years | 47 (73.4%) | 0 (0.0%) |
| 60 to 64 Years | 16 (53.3%) | 16 (100.0%) |
| 65 to 74 Years | 0 (0.0%) | 0 (0.0%) |
| 75 Years and over | 0 (0.0%) | 0 (0.0%) |
| Total | 213 (56.5%) | 61 (28.6%) |
Employment Status by Educational Attainment in Cecilia
According to labor force statistics for Cecilia, 68.1% of individuals (213) out of the total population between 25 and 64 years of age (313) are in the labor force, with 28.6% or 61 of them being unemployed. The group with the highest labor force participation rate are those with the educational attainment of high school diploma, with 100.0% or 31 individuals in the labor force. Within the labor force, individuals with bachelor's degree or higher education have the highest percentage of unemployment, with 34.4% or 45 of them being unemployed.
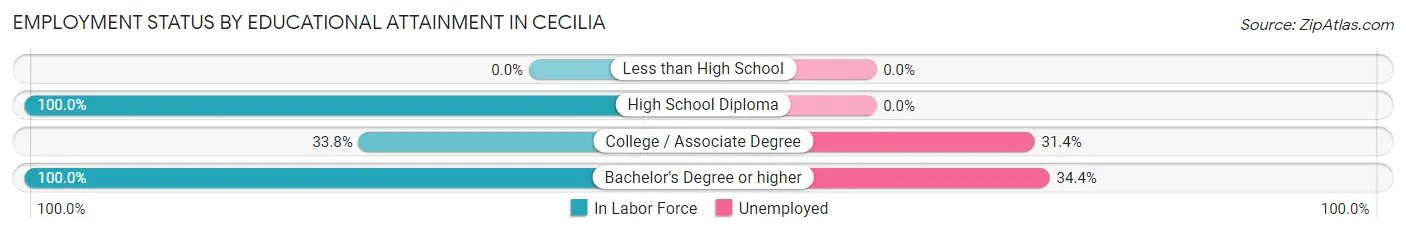
| Educational Attainment | In Labor Force | Unemployed |
| Less than High School | 0 (0.0%) | 0 (0.0%) |
| High School Diploma | 31 (100.0%) | 0 (0.0%) |
| College / Associate Degree | 51 (33.8%) | 47 (31.4%) |
| Bachelor's Degree or higher | 131 (100.0%) | 45 (34.4%) |
| Total | 213 (68.1%) | 90 (28.6%) |
Employment Occupations by Sex in Cecilia
Management, Business, Science and Arts Occupations
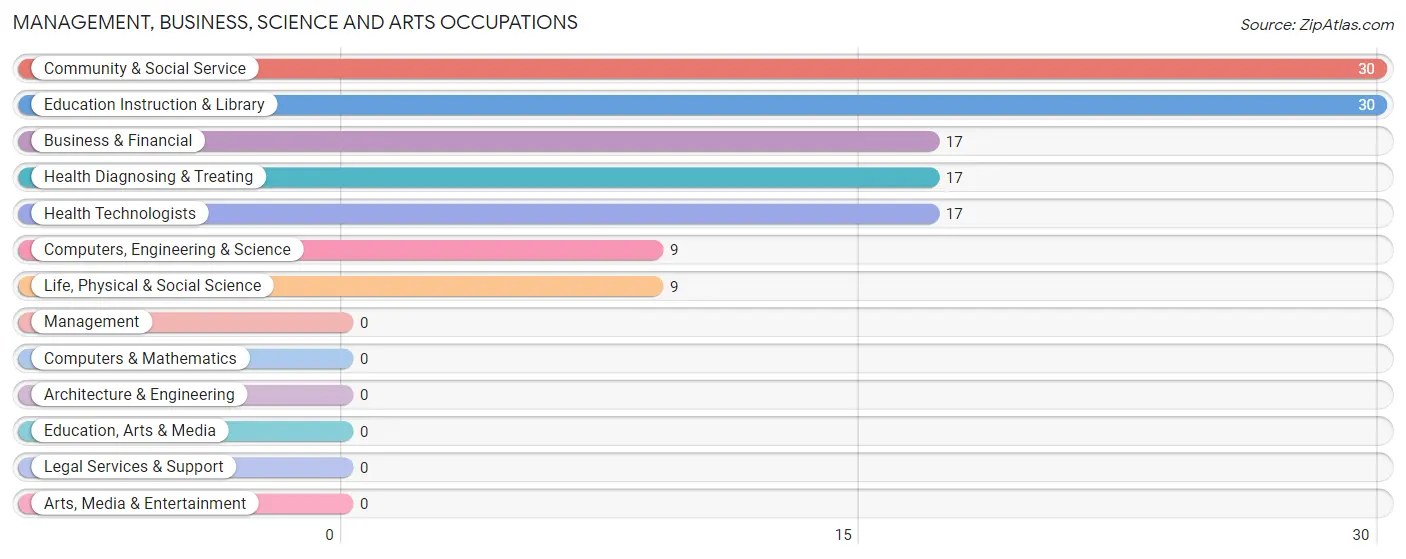
The most common Management, Business, Science and Arts occupations in Cecilia are Community & Social Service (30 | 19.7%), Education Instruction & Library (30 | 19.7%), Business & Financial (17 | 11.2%), Health Diagnosing & Treating (17 | 11.2%), and Health Technologists (17 | 11.2%).
Management, Business, Science and Arts Occupations by Sex
Within the Management, Business, Science and Arts occupations in Cecilia, the most male-oriented occupations are Business & Financial (100.0%), Computers, Engineering & Science (100.0%), and Life, Physical & Social Science (100.0%), while the most female-oriented occupations are Community & Social Service (66.7%), and Education Instruction & Library (66.7%).
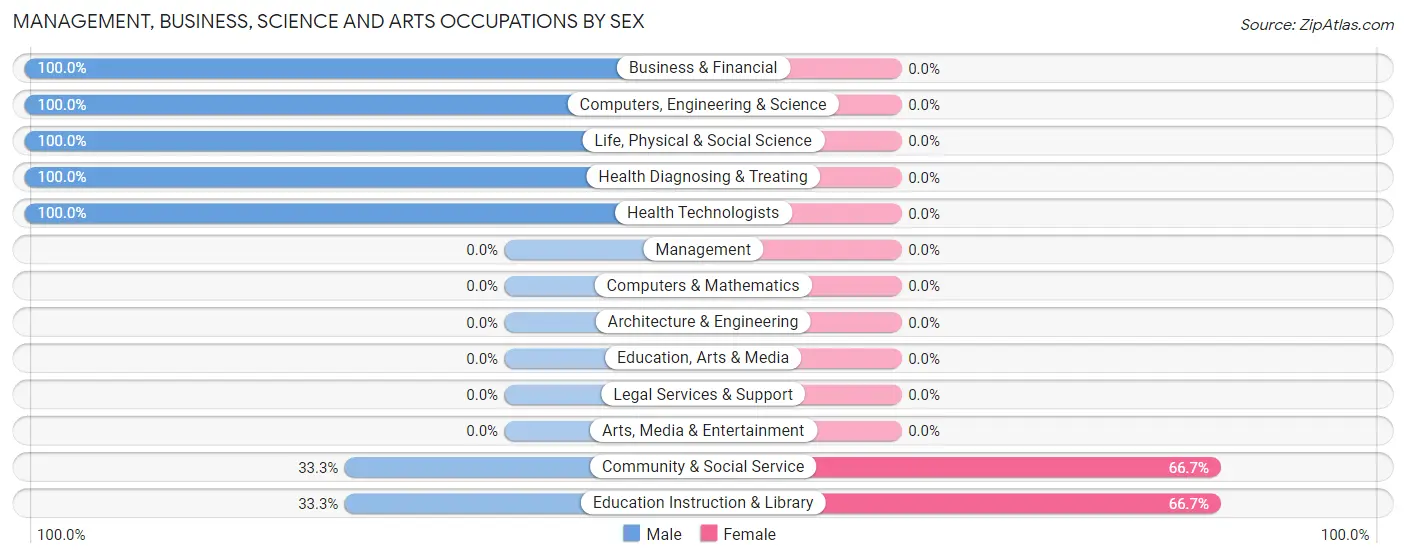
| Occupation | Male | Female |
| Management | 0 (0.0%) | 0 (0.0%) |
| Business & Financial | 17 (100.0%) | 0 (0.0%) |
| Computers, Engineering & Science | 9 (100.0%) | 0 (0.0%) |
| Computers & Mathematics | 0 (0.0%) | 0 (0.0%) |
| Architecture & Engineering | 0 (0.0%) | 0 (0.0%) |
| Life, Physical & Social Science | 9 (100.0%) | 0 (0.0%) |
| Community & Social Service | 10 (33.3%) | 20 (66.7%) |
| Education, Arts & Media | 0 (0.0%) | 0 (0.0%) |
| Legal Services & Support | 0 (0.0%) | 0 (0.0%) |
| Education Instruction & Library | 10 (33.3%) | 20 (66.7%) |
| Arts, Media & Entertainment | 0 (0.0%) | 0 (0.0%) |
| Health Diagnosing & Treating | 17 (100.0%) | 0 (0.0%) |
| Health Technologists | 17 (100.0%) | 0 (0.0%) |
| Total (Category) | 53 (72.6%) | 20 (27.4%) |
| Total (Overall) | 75 (49.3%) | 77 (50.7%) |
Services Occupations
Services Occupations by Sex
| Occupation | Male | Female |
| Healthcare Support | 0 (0.0%) | 0 (0.0%) |
| Security & Protection | 0 (0.0%) | 0 (0.0%) |
| Firefighting & Prevention | 0 (0.0%) | 0 (0.0%) |
| Law Enforcement | 0 (0.0%) | 0 (0.0%) |
| Food Preparation & Serving | 0 (0.0%) | 0 (0.0%) |
| Cleaning & Maintenance | 0 (0.0%) | 0 (0.0%) |
| Personal Care & Service | 0 (0.0%) | 0 (0.0%) |
| Total (Category) | 0 (0.0%) | 0 (0.0%) |
| Total (Overall) | 75 (49.3%) | 77 (50.7%) |
Sales and Office Occupations
The most common Sales and Office occupations in Cecilia are Office & Administration (20 | 13.2%), and Sales & Related (15 | 9.9%).
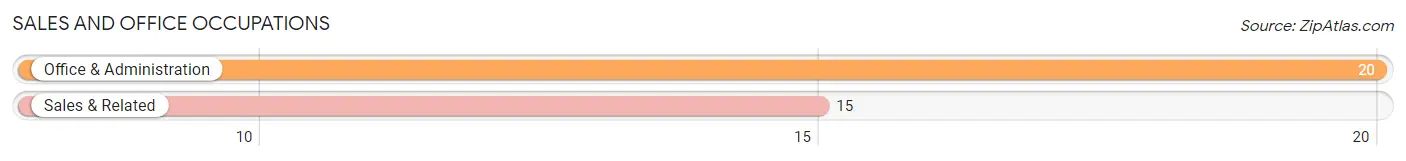
Sales and Office Occupations by Sex
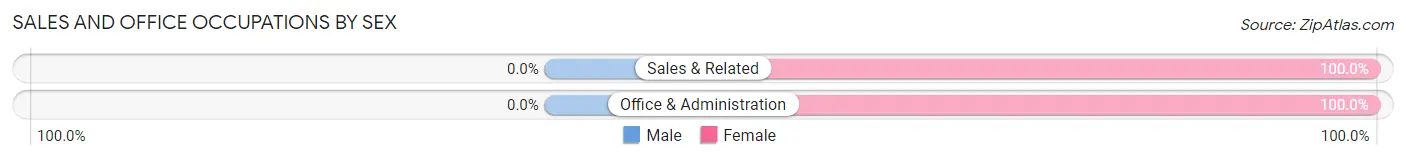
| Occupation | Male | Female |
| Sales & Related | 0 (0.0%) | 15 (100.0%) |
| Office & Administration | 0 (0.0%) | 20 (100.0%) |
| Total (Category) | 0 (0.0%) | 35 (100.0%) |
| Total (Overall) | 75 (49.3%) | 77 (50.7%) |
Natural Resources, Construction and Maintenance Occupations
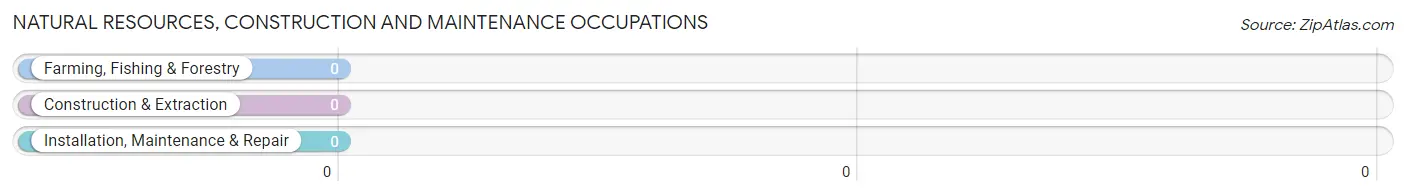
Natural Resources, Construction and Maintenance Occupations by Sex
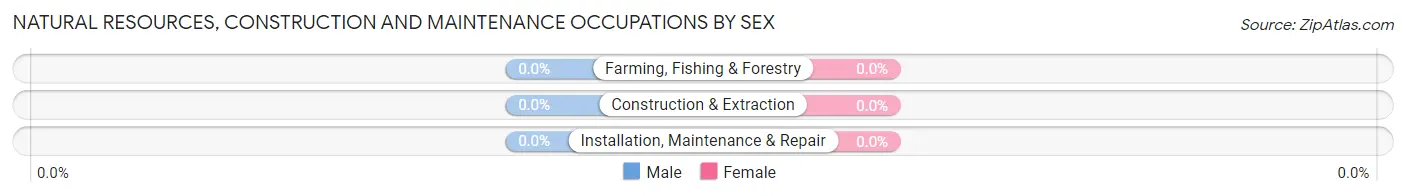
| Occupation | Male | Female |
| Farming, Fishing & Forestry | 0 (0.0%) | 0 (0.0%) |
| Construction & Extraction | 0 (0.0%) | 0 (0.0%) |
| Installation, Maintenance & Repair | 0 (0.0%) | 0 (0.0%) |
| Total (Category) | 0 (0.0%) | 0 (0.0%) |
| Total (Overall) | 75 (49.3%) | 77 (50.7%) |
Production, Transportation and Moving Occupations
The most common Production, Transportation and Moving occupations in Cecilia are Production (22 | 14.5%), and Transportation (22 | 14.5%).
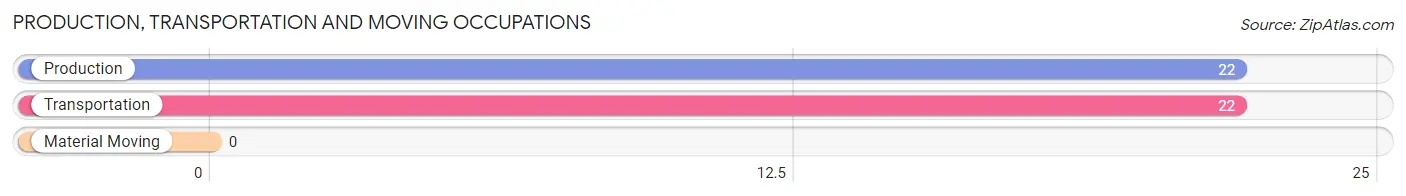
Production, Transportation and Moving Occupations by Sex
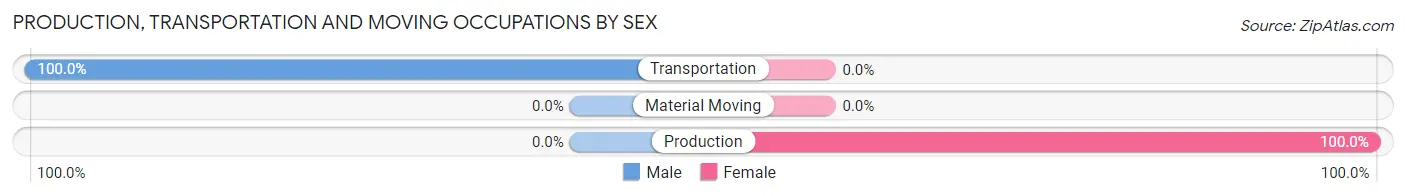
| Occupation | Male | Female |
| Production | 0 (0.0%) | 22 (100.0%) |
| Transportation | 22 (100.0%) | 0 (0.0%) |
| Material Moving | 0 (0.0%) | 0 (0.0%) |
| Total (Category) | 22 (50.0%) | 22 (50.0%) |
| Total (Overall) | 75 (49.3%) | 77 (50.7%) |
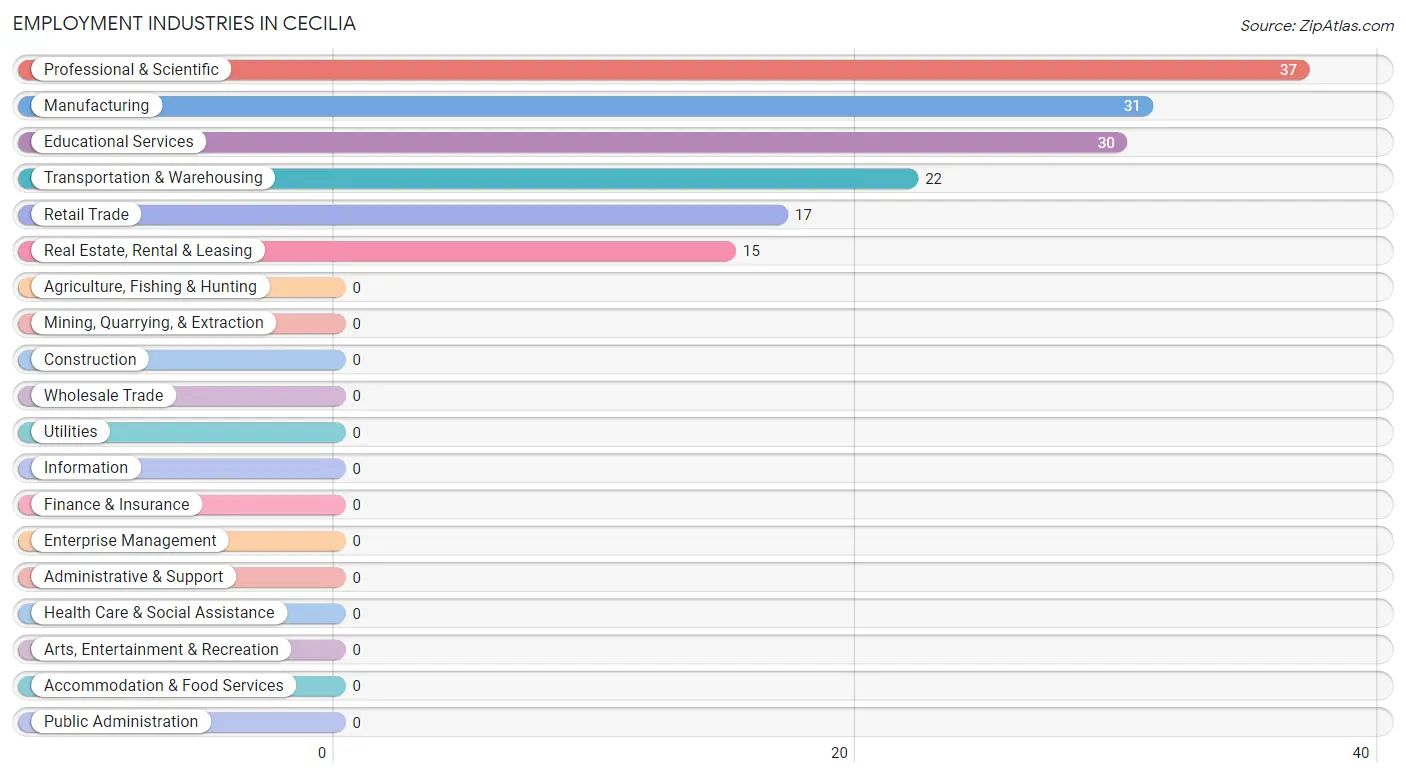
Employment Industries by Sex in Cecilia
Employment Industries in Cecilia
The major employment industries in Cecilia include Professional & Scientific (37 | 24.3%), Manufacturing (31 | 20.4%), Educational Services (30 | 19.7%), Transportation & Warehousing (22 | 14.5%), and Retail Trade (17 | 11.2%).
Employment Industries by Sex in Cecilia
The Cecilia industries that see more men than women are Retail Trade (100.0%), Transportation & Warehousing (100.0%), and Professional & Scientific (46.0%), whereas the industries that tend to have a higher number of women are Real Estate, Rental & Leasing (100.0%), Manufacturing (71.0%), and Educational Services (66.7%).
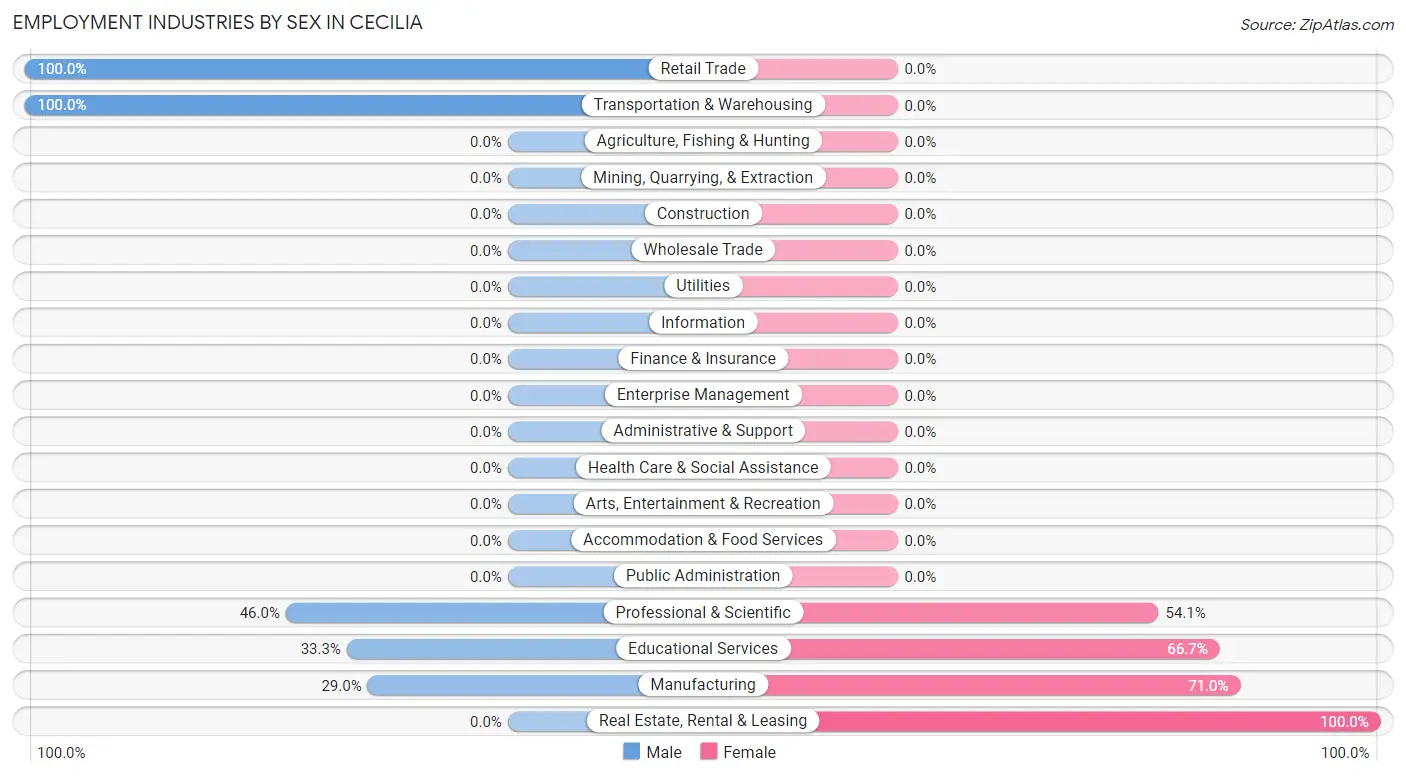
| Industry | Male | Female |
| Agriculture, Fishing & Hunting | 0 (0.0%) | 0 (0.0%) |
| Mining, Quarrying, & Extraction | 0 (0.0%) | 0 (0.0%) |
| Construction | 0 (0.0%) | 0 (0.0%) |
| Manufacturing | 9 (29.0%) | 22 (71.0%) |
| Wholesale Trade | 0 (0.0%) | 0 (0.0%) |
| Retail Trade | 17 (100.0%) | 0 (0.0%) |
| Transportation & Warehousing | 22 (100.0%) | 0 (0.0%) |
| Utilities | 0 (0.0%) | 0 (0.0%) |
| Information | 0 (0.0%) | 0 (0.0%) |
| Finance & Insurance | 0 (0.0%) | 0 (0.0%) |
| Real Estate, Rental & Leasing | 0 (0.0%) | 15 (100.0%) |
| Professional & Scientific | 17 (46.0%) | 20 (54.0%) |
| Enterprise Management | 0 (0.0%) | 0 (0.0%) |
| Administrative & Support | 0 (0.0%) | 0 (0.0%) |
| Educational Services | 10 (33.3%) | 20 (66.7%) |
| Health Care & Social Assistance | 0 (0.0%) | 0 (0.0%) |
| Arts, Entertainment & Recreation | 0 (0.0%) | 0 (0.0%) |
| Accommodation & Food Services | 0 (0.0%) | 0 (0.0%) |
| Public Administration | 0 (0.0%) | 0 (0.0%) |
| Total | 75 (49.3%) | 77 (50.7%) |
Education in Cecilia
School Enrollment in Cecilia
The most common levels of schooling among the 81 students in Cecilia are graduate / professional (62 | 76.5%), and college / undergraduate (19 | 23.5%).
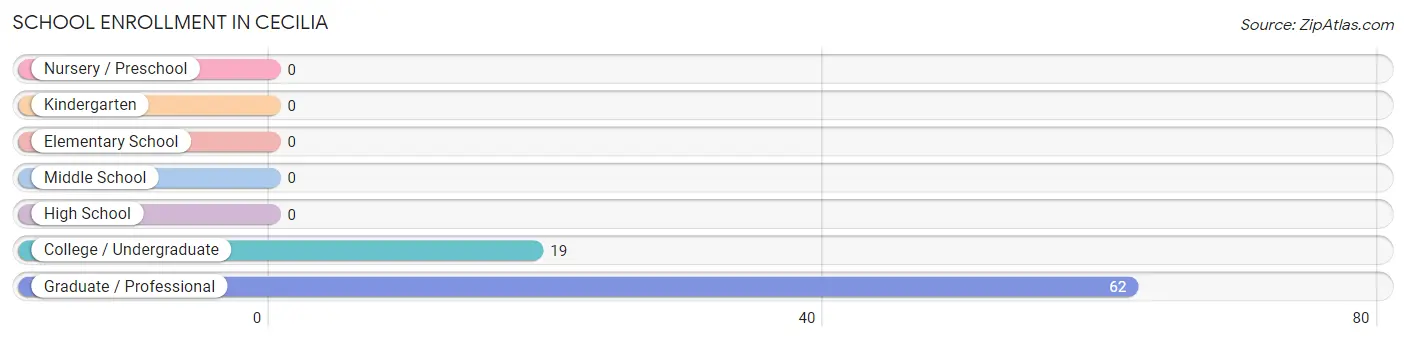
| School Level | # Students | % Students |
| Nursery / Preschool | 0 | 0.0% |
| Kindergarten | 0 | 0.0% |
| Elementary School | 0 | 0.0% |
| Middle School | 0 | 0.0% |
| High School | 0 | 0.0% |
| College / Undergraduate | 19 | 23.5% |
| Graduate / Professional | 62 | 76.5% |
| Total | 81 | 100.0% |
School Enrollment by Age by Funding Source in Cecilia
Out of a total of 81 students who are enrolled in schools in Cecilia, 36 (44.4%) attend a private institution, while the remaining 45 (55.6%) are enrolled in public schools. The age group of 35 years and over has the highest likelihood of being enrolled in private schools, with 36 (100.0% in the age bracket) enrolled. Conversely, the age group of 25 to 34 year olds has the lowest likelihood of being enrolled in a private school, with 45 (100.0% in the age bracket) attending a public institution.
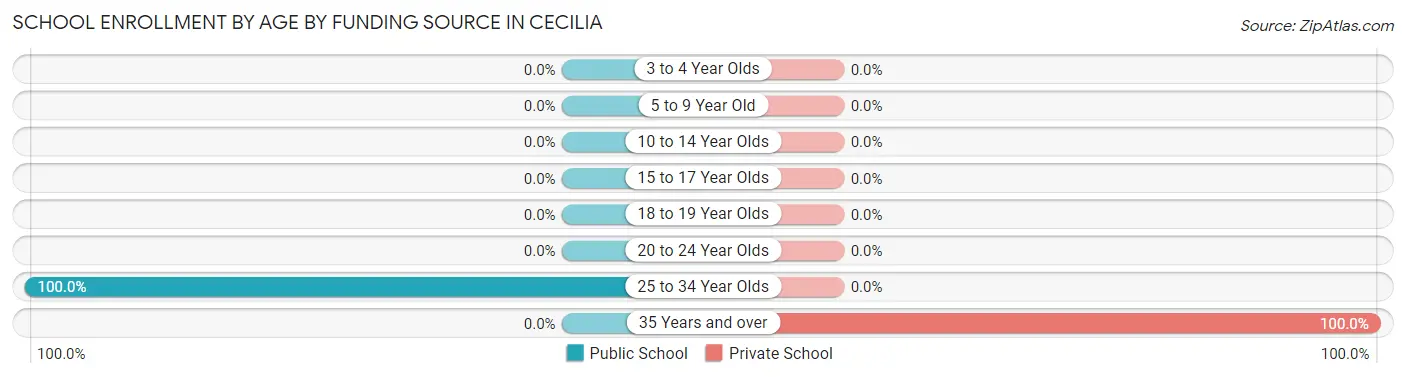
| Age Bracket | Public School | Private School |
| 3 to 4 Year Olds | 0 (0.0%) | 0 (0.0%) |
| 5 to 9 Year Old | 0 (0.0%) | 0 (0.0%) |
| 10 to 14 Year Olds | 0 (0.0%) | 0 (0.0%) |
| 15 to 17 Year Olds | 0 (0.0%) | 0 (0.0%) |
| 18 to 19 Year Olds | 0 (0.0%) | 0 (0.0%) |
| 20 to 24 Year Olds | 0 (0.0%) | 0 (0.0%) |
| 25 to 34 Year Olds | 45 (100.0%) | 0 (0.0%) |
| 35 Years and over | 0 (0.0%) | 36 (100.0%) |
| Total | 45 (55.6%) | 36 (44.4%) |
Educational Attainment by Field of Study in Cecilia
Computers & mathematics (45 | 29.4%), business (32 | 20.9%), social sciences (22 | 14.4%), education (20 | 13.1%), and bio, nature & agricultural (17 | 11.1%) are the most common fields of study among 153 individuals in Cecilia who have obtained a bachelor's degree or higher.
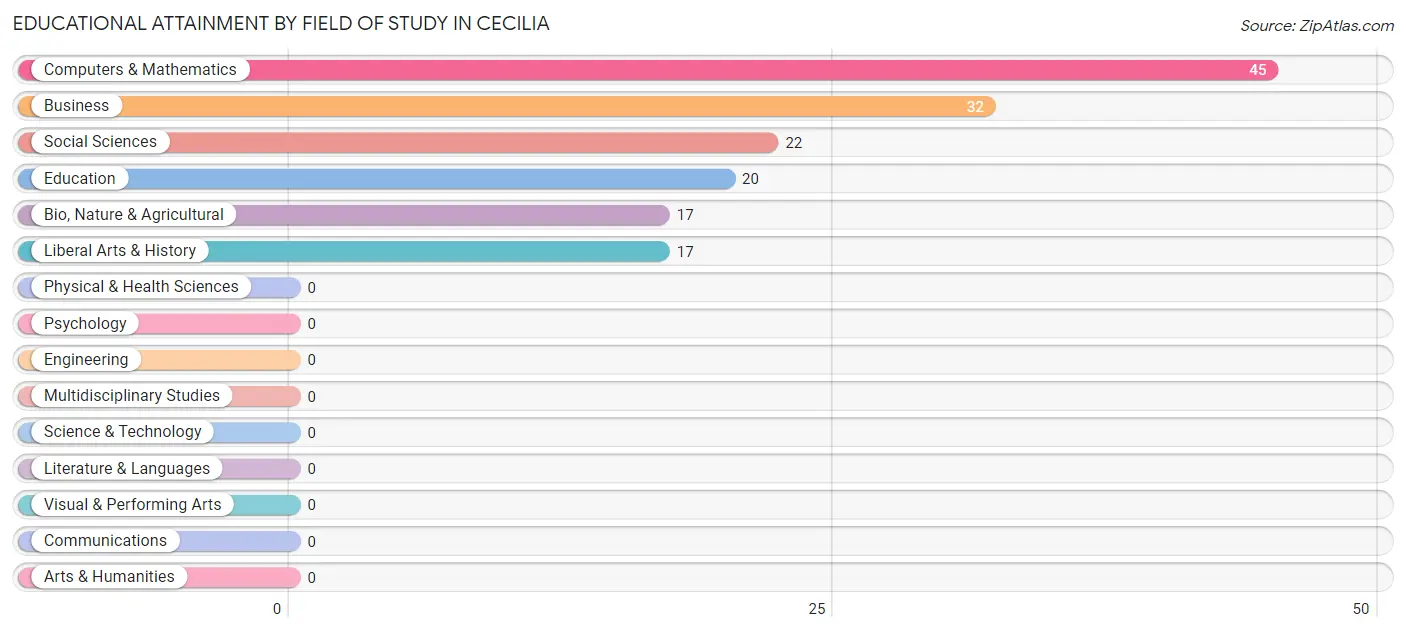
| Field of Study | # Graduates | % Graduates |
| Computers & Mathematics | 45 | 29.4% |
| Bio, Nature & Agricultural | 17 | 11.1% |
| Physical & Health Sciences | 0 | 0.0% |
| Psychology | 0 | 0.0% |
| Social Sciences | 22 | 14.4% |
| Engineering | 0 | 0.0% |
| Multidisciplinary Studies | 0 | 0.0% |
| Science & Technology | 0 | 0.0% |
| Business | 32 | 20.9% |
| Education | 20 | 13.1% |
| Literature & Languages | 0 | 0.0% |
| Liberal Arts & History | 17 | 11.1% |
| Visual & Performing Arts | 0 | 0.0% |
| Communications | 0 | 0.0% |
| Arts & Humanities | 0 | 0.0% |
| Total | 153 | 100.0% |
Transportation & Commute in Cecilia
Vehicle Availability by Sex in Cecilia
The most prevalent vehicle ownership categories in Cecilia are males with 2 vehicles (39, accounting for 60.0%) and females with 2 vehicles (35, making up 50.6%).
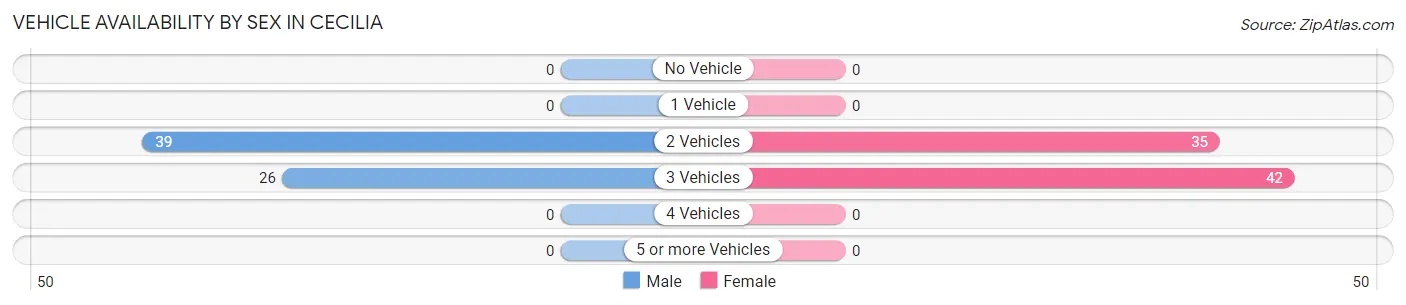
| Vehicles Available | Male | Female |
| No Vehicle | 0 (0.0%) | 0 (0.0%) |
| 1 Vehicle | 0 (0.0%) | 0 (0.0%) |
| 2 Vehicles | 39 (60.0%) | 35 (45.5%) |
| 3 Vehicles | 26 (40.0%) | 42 (54.5%) |
| 4 Vehicles | 0 (0.0%) | 0 (0.0%) |
| 5 or more Vehicles | 0 (0.0%) | 0 (0.0%) |
| Total | 65 (100.0%) | 77 (100.0%) |
Commute Time in Cecilia
The most frequently occuring commute durations in Cecilia are 10 to 14 minutes (76 commuters, 62.3%), 25 to 29 minutes (20 commuters, 16.4%), and 5 to 9 minutes (17 commuters, 13.9%).
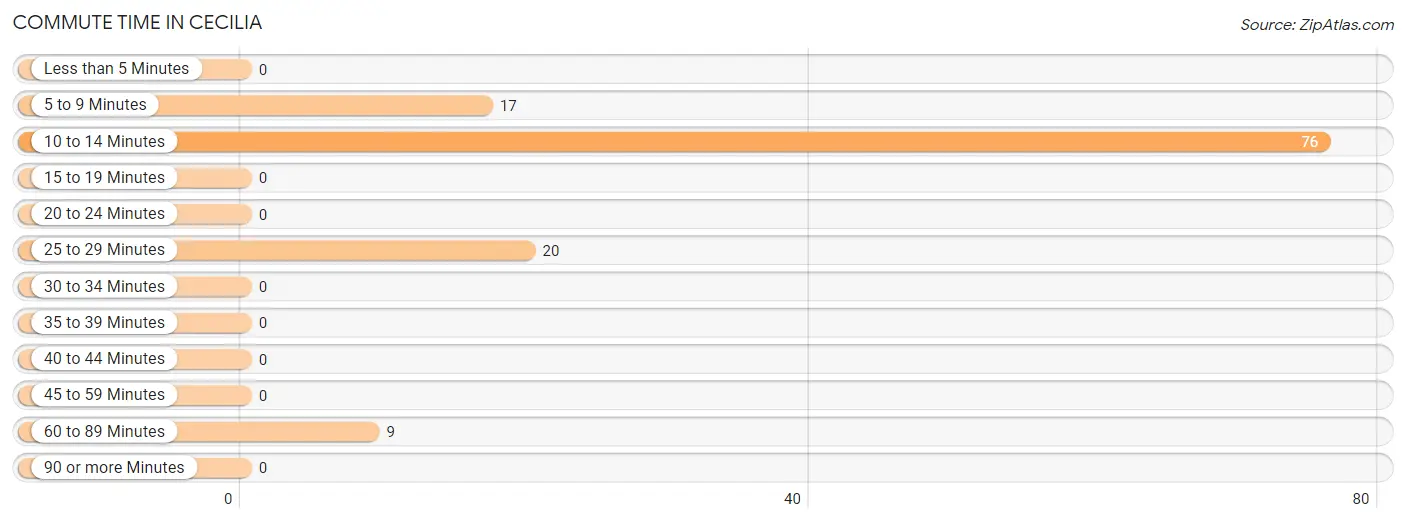
| Commute Time | # Commuters | % Commuters |
| Less than 5 Minutes | 0 | 0.0% |
| 5 to 9 Minutes | 17 | 13.9% |
| 10 to 14 Minutes | 76 | 62.3% |
| 15 to 19 Minutes | 0 | 0.0% |
| 20 to 24 Minutes | 0 | 0.0% |
| 25 to 29 Minutes | 20 | 16.4% |
| 30 to 34 Minutes | 0 | 0.0% |
| 35 to 39 Minutes | 0 | 0.0% |
| 40 to 44 Minutes | 0 | 0.0% |
| 45 to 59 Minutes | 0 | 0.0% |
| 60 to 89 Minutes | 9 | 7.4% |
| 90 or more Minutes | 0 | 0.0% |
Commute Time by Sex in Cecilia
The most common commute times in Cecilia are 10 to 14 minutes (39 commuters, 60.0%) for males and 10 to 14 minutes (37 commuters, 64.9%) for females.
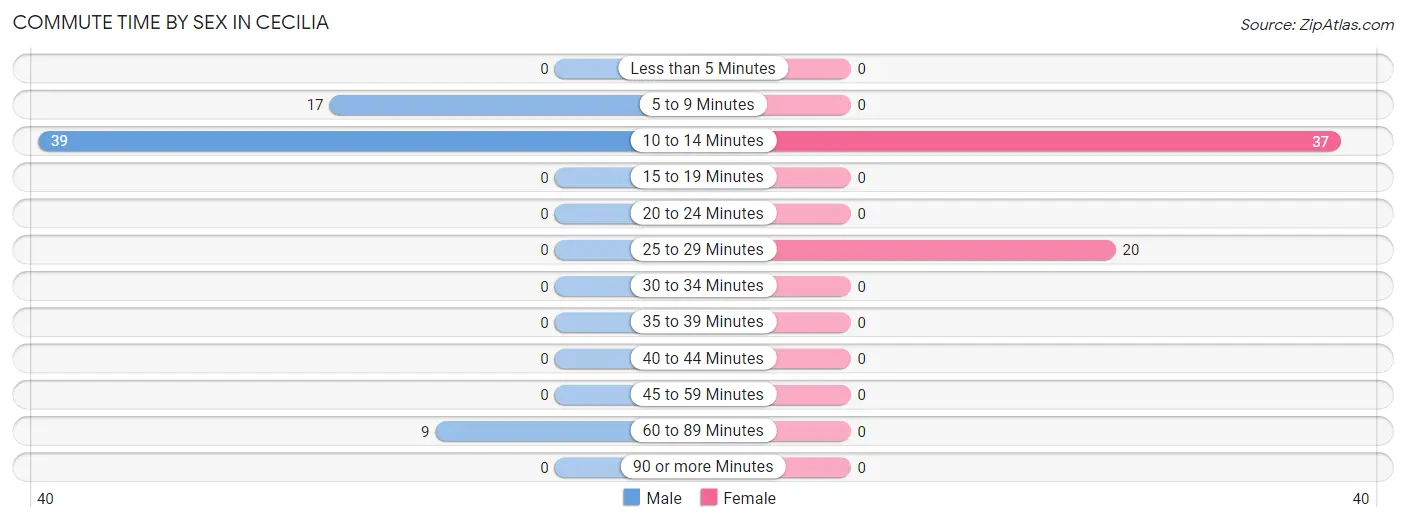
| Commute Time | Male | Female |
| Less than 5 Minutes | 0 (0.0%) | 0 (0.0%) |
| 5 to 9 Minutes | 17 (26.2%) | 0 (0.0%) |
| 10 to 14 Minutes | 39 (60.0%) | 37 (64.9%) |
| 15 to 19 Minutes | 0 (0.0%) | 0 (0.0%) |
| 20 to 24 Minutes | 0 (0.0%) | 0 (0.0%) |
| 25 to 29 Minutes | 0 (0.0%) | 20 (35.1%) |
| 30 to 34 Minutes | 0 (0.0%) | 0 (0.0%) |
| 35 to 39 Minutes | 0 (0.0%) | 0 (0.0%) |
| 40 to 44 Minutes | 0 (0.0%) | 0 (0.0%) |
| 45 to 59 Minutes | 0 (0.0%) | 0 (0.0%) |
| 60 to 89 Minutes | 9 (13.9%) | 0 (0.0%) |
| 90 or more Minutes | 0 (0.0%) | 0 (0.0%) |
Time of Departure to Work by Sex in Cecilia
The most frequent times of departure to work in Cecilia are 12:00 AM to 4:59 AM (22, 33.9%) for males and 12:00 PM to 3:59 PM (22, 38.6%) for females.
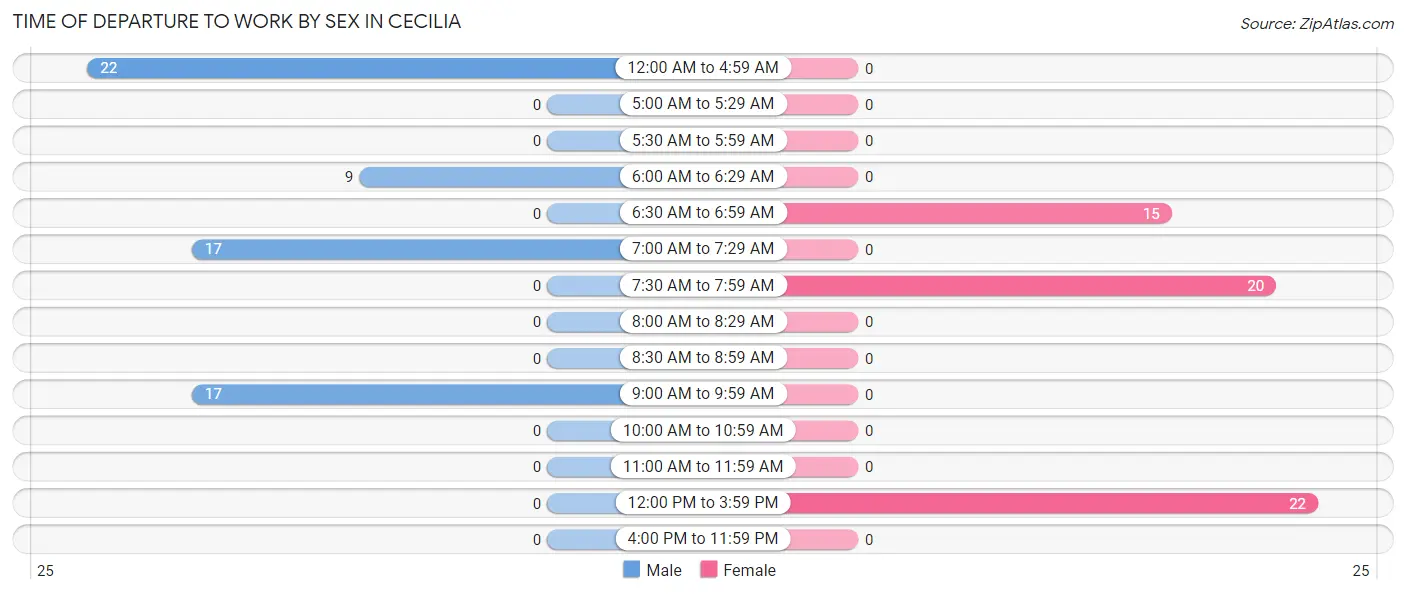
| Time of Departure | Male | Female |
| 12:00 AM to 4:59 AM | 22 (33.9%) | 0 (0.0%) |
| 5:00 AM to 5:29 AM | 0 (0.0%) | 0 (0.0%) |
| 5:30 AM to 5:59 AM | 0 (0.0%) | 0 (0.0%) |
| 6:00 AM to 6:29 AM | 9 (13.9%) | 0 (0.0%) |
| 6:30 AM to 6:59 AM | 0 (0.0%) | 15 (26.3%) |
| 7:00 AM to 7:29 AM | 17 (26.2%) | 0 (0.0%) |
| 7:30 AM to 7:59 AM | 0 (0.0%) | 20 (35.1%) |
| 8:00 AM to 8:29 AM | 0 (0.0%) | 0 (0.0%) |
| 8:30 AM to 8:59 AM | 0 (0.0%) | 0 (0.0%) |
| 9:00 AM to 9:59 AM | 17 (26.2%) | 0 (0.0%) |
| 10:00 AM to 10:59 AM | 0 (0.0%) | 0 (0.0%) |
| 11:00 AM to 11:59 AM | 0 (0.0%) | 0 (0.0%) |
| 12:00 PM to 3:59 PM | 0 (0.0%) | 22 (38.6%) |
| 4:00 PM to 11:59 PM | 0 (0.0%) | 0 (0.0%) |
| Total | 65 (100.0%) | 57 (100.0%) |
Housing Occupancy in Cecilia
Occupancy by Ownership in Cecilia
Of the total 158 dwellings in Cecilia, owner-occupied units account for 80 (50.6%), while renter-occupied units make up 78 (49.4%).
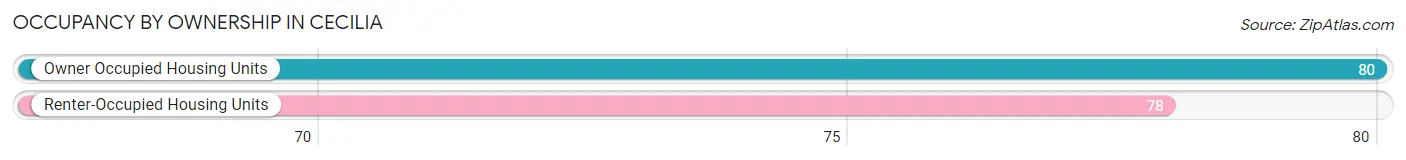
| Occupancy | # Housing Units | % Housing Units |
| Owner Occupied Housing Units | 80 | 50.6% |
| Renter-Occupied Housing Units | 78 | 49.4% |
| Total Occupied Housing Units | 158 | 100.0% |
Occupancy by Household Size in Cecilia
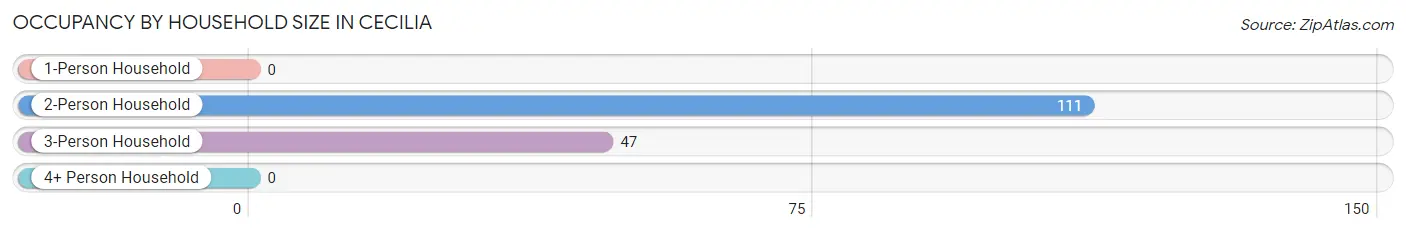
| Household Size | # Housing Units | % Housing Units |
| 1-Person Household | 0 | 0.0% |
| 2-Person Household | 111 | 70.3% |
| 3-Person Household | 47 | 29.7% |
| 4+ Person Household | 0 | 0.0% |
| Total Housing Units | 158 | 100.0% |
Occupancy by Ownership by Household Size in Cecilia
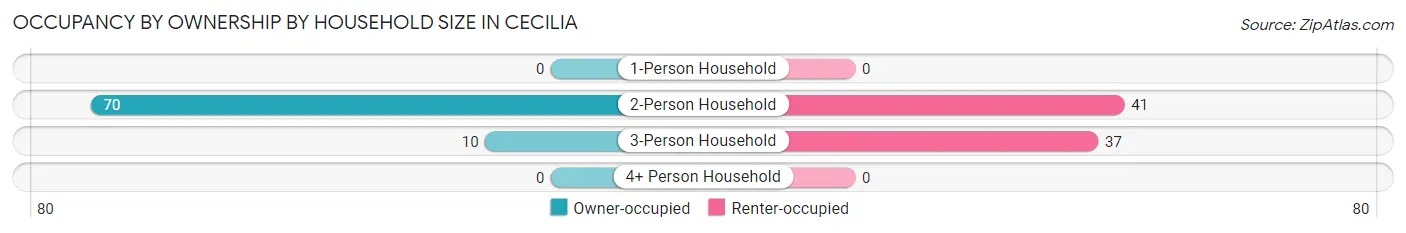
| Household Size | Owner-occupied | Renter-occupied |
| 1-Person Household | 0 (0.0%) | 0 (0.0%) |
| 2-Person Household | 70 (63.1%) | 41 (36.9%) |
| 3-Person Household | 10 (21.3%) | 37 (78.7%) |
| 4+ Person Household | 0 (0.0%) | 0 (0.0%) |
| Total Housing Units | 80 (50.6%) | 78 (49.4%) |
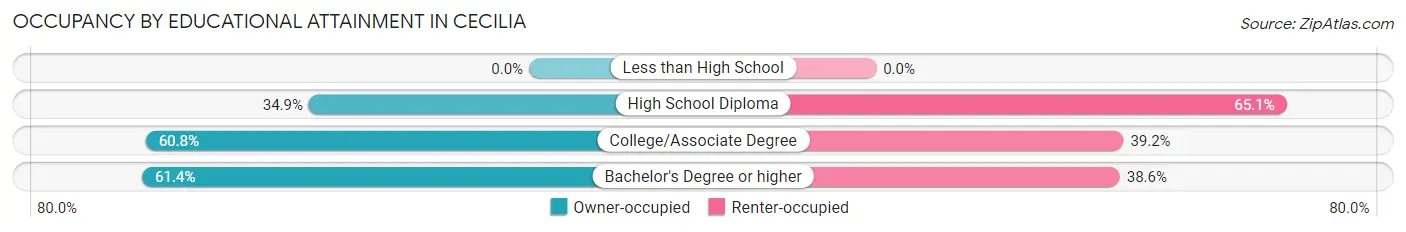
Occupancy by Educational Attainment in Cecilia
| Household Size | Owner-occupied | Renter-occupied |
| Less than High School | 0 (0.0%) | 0 (0.0%) |
| High School Diploma | 22 (34.9%) | 41 (65.1%) |
| College/Associate Degree | 31 (60.8%) | 20 (39.2%) |
| Bachelor's Degree or higher | 27 (61.4%) | 17 (38.6%) |
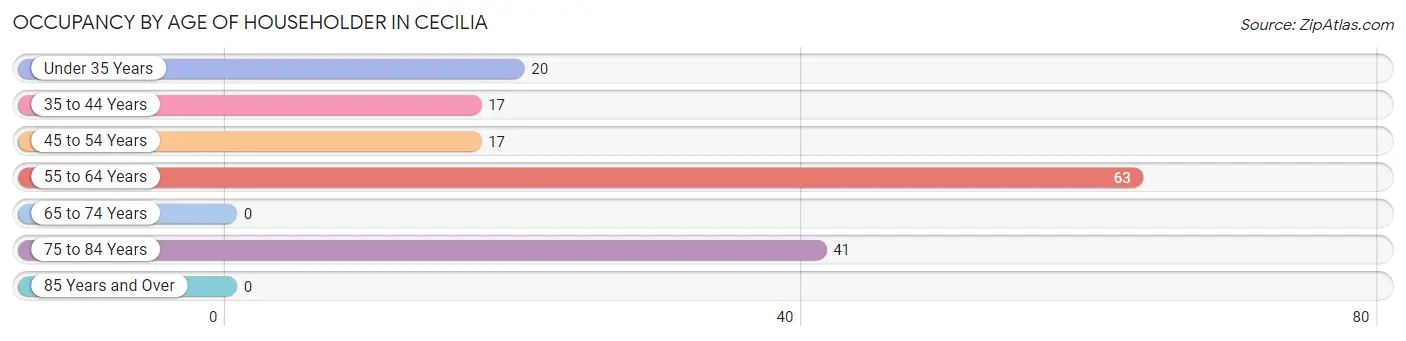
Occupancy by Age of Householder in Cecilia
| Age Bracket | # Households | % Households |
| Under 35 Years | 20 | 12.7% |
| 35 to 44 Years | 17 | 10.8% |
| 45 to 54 Years | 17 | 10.8% |
| 55 to 64 Years | 63 | 39.9% |
| 65 to 74 Years | 0 | 0.0% |
| 75 to 84 Years | 41 | 26.0% |
| 85 Years and Over | 0 | 0.0% |
| Total | 158 | 100.0% |
Housing Finances in Cecilia
Median Income by Occupancy in Cecilia
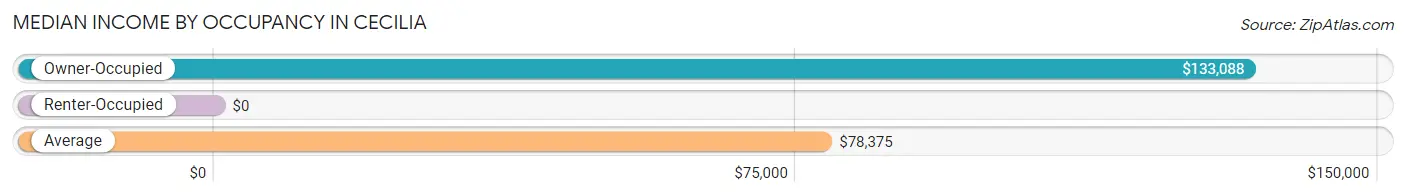
| Occupancy Type | # Households | Median Income |
| Owner-Occupied | 80 (50.6%) | $133,088 |
| Renter-Occupied | 78 (49.4%) | $0 |
| Average | 158 (100.0%) | $78,375 |
Occupancy by Householder Income Bracket in Cecilia
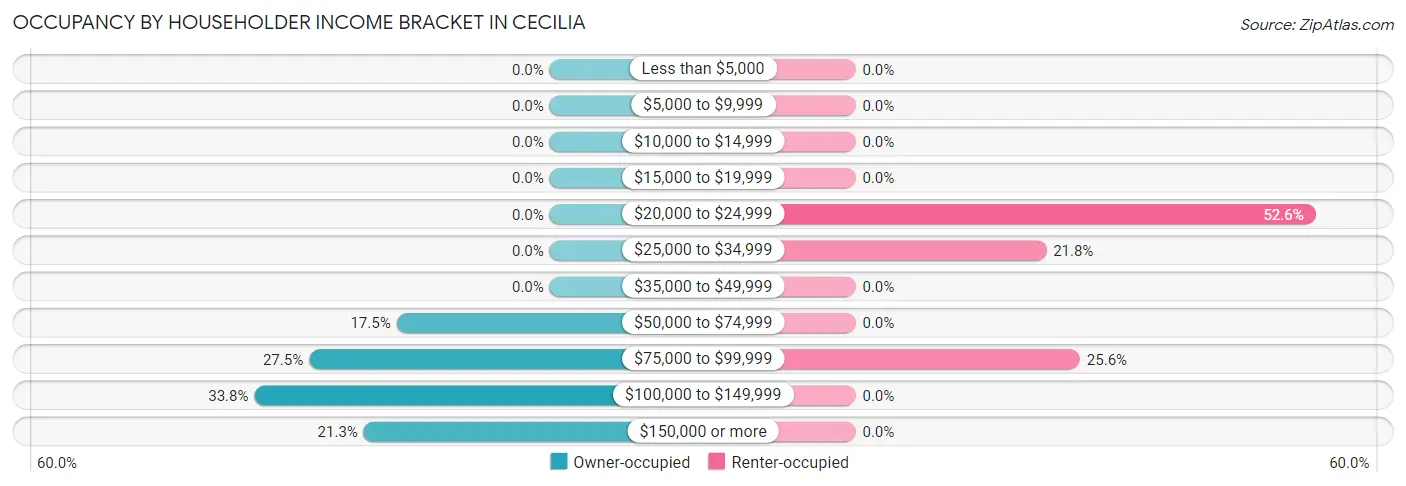
| Income Bracket | Owner-occupied | Renter-occupied |
| Less than $5,000 | 0 (0.0%) | 0 (0.0%) |
| $5,000 to $9,999 | 0 (0.0%) | 0 (0.0%) |
| $10,000 to $14,999 | 0 (0.0%) | 0 (0.0%) |
| $15,000 to $19,999 | 0 (0.0%) | 0 (0.0%) |
| $20,000 to $24,999 | 0 (0.0%) | 41 (52.6%) |
| $25,000 to $34,999 | 0 (0.0%) | 17 (21.8%) |
| $35,000 to $49,999 | 0 (0.0%) | 0 (0.0%) |
| $50,000 to $74,999 | 14 (17.5%) | 0 (0.0%) |
| $75,000 to $99,999 | 22 (27.5%) | 20 (25.6%) |
| $100,000 to $149,999 | 27 (33.8%) | 0 (0.0%) |
| $150,000 or more | 17 (21.2%) | 0 (0.0%) |
| Total | 80 (100.0%) | 78 (100.0%) |
Monthly Housing Cost Tiers in Cecilia
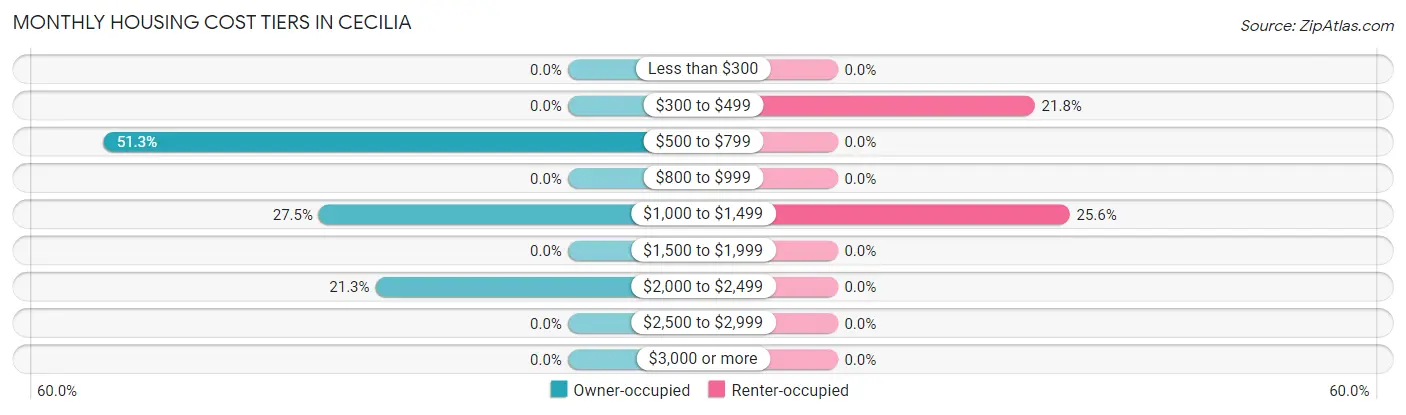
| Monthly Cost | Owner-occupied | Renter-occupied |
| Less than $300 | 0 (0.0%) | 0 (0.0%) |
| $300 to $499 | 0 (0.0%) | 17 (21.8%) |
| $500 to $799 | 41 (51.2%) | 0 (0.0%) |
| $800 to $999 | 0 (0.0%) | 0 (0.0%) |
| $1,000 to $1,499 | 22 (27.5%) | 20 (25.6%) |
| $1,500 to $1,999 | 0 (0.0%) | 0 (0.0%) |
| $2,000 to $2,499 | 17 (21.2%) | 0 (0.0%) |
| $2,500 to $2,999 | 0 (0.0%) | 0 (0.0%) |
| $3,000 or more | 0 (0.0%) | 0 (0.0%) |
| Total | 80 (100.0%) | 78 (100.0%) |
Physical Housing Characteristics in Cecilia
Housing Structures in Cecilia
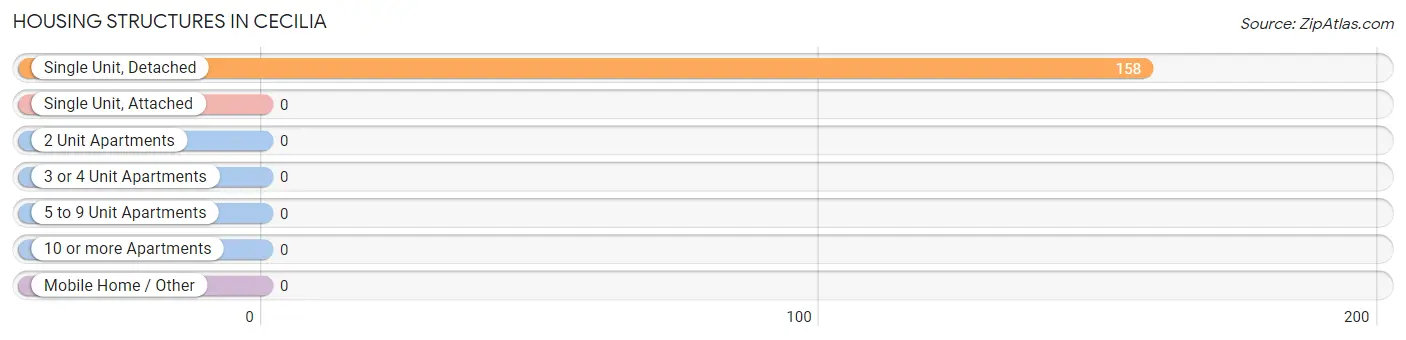
| Structure Type | # Housing Units | % Housing Units |
| Single Unit, Detached | 158 | 100.0% |
| Single Unit, Attached | 0 | 0.0% |
| 2 Unit Apartments | 0 | 0.0% |
| 3 or 4 Unit Apartments | 0 | 0.0% |
| 5 to 9 Unit Apartments | 0 | 0.0% |
| 10 or more Apartments | 0 | 0.0% |
| Mobile Home / Other | 0 | 0.0% |
| Total | 158 | 100.0% |
Housing Structures by Occupancy in Cecilia
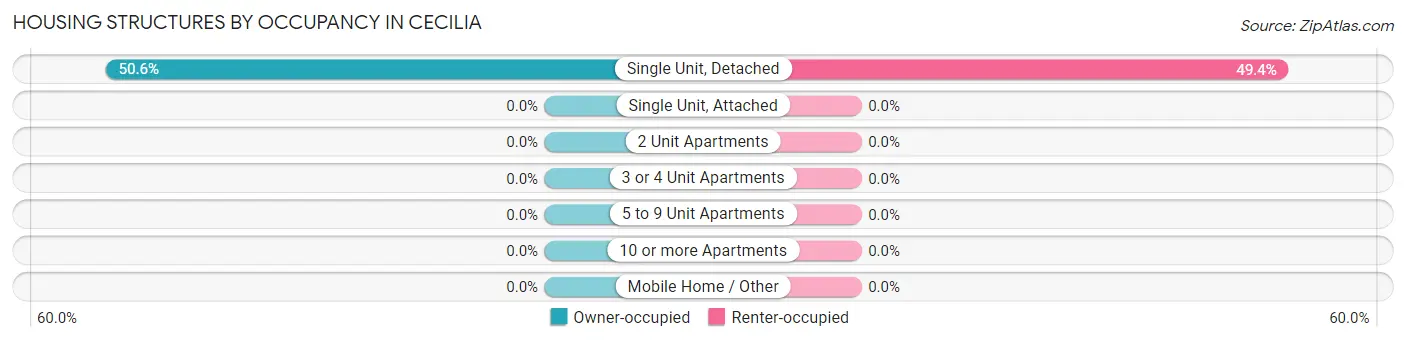
| Structure Type | Owner-occupied | Renter-occupied |
| Single Unit, Detached | 80 (50.6%) | 78 (49.4%) |
| Single Unit, Attached | 0 (0.0%) | 0 (0.0%) |
| 2 Unit Apartments | 0 (0.0%) | 0 (0.0%) |
| 3 or 4 Unit Apartments | 0 (0.0%) | 0 (0.0%) |
| 5 to 9 Unit Apartments | 0 (0.0%) | 0 (0.0%) |
| 10 or more Apartments | 0 (0.0%) | 0 (0.0%) |
| Mobile Home / Other | 0 (0.0%) | 0 (0.0%) |
| Total | 80 (50.6%) | 78 (49.4%) |
Housing Structures by Number of Rooms in Cecilia
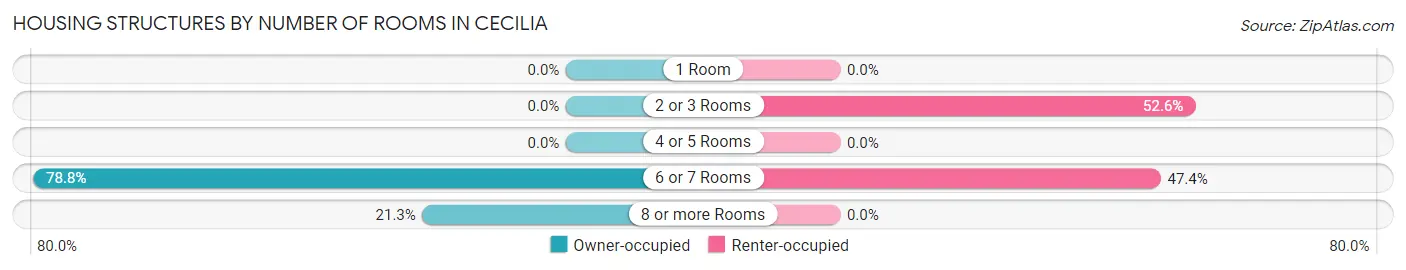
| Number of Rooms | Owner-occupied | Renter-occupied |
| 1 Room | 0 (0.0%) | 0 (0.0%) |
| 2 or 3 Rooms | 0 (0.0%) | 41 (52.6%) |
| 4 or 5 Rooms | 0 (0.0%) | 0 (0.0%) |
| 6 or 7 Rooms | 63 (78.7%) | 37 (47.4%) |
| 8 or more Rooms | 17 (21.2%) | 0 (0.0%) |
| Total | 80 (100.0%) | 78 (100.0%) |
Housing Structure by Heating Type in Cecilia
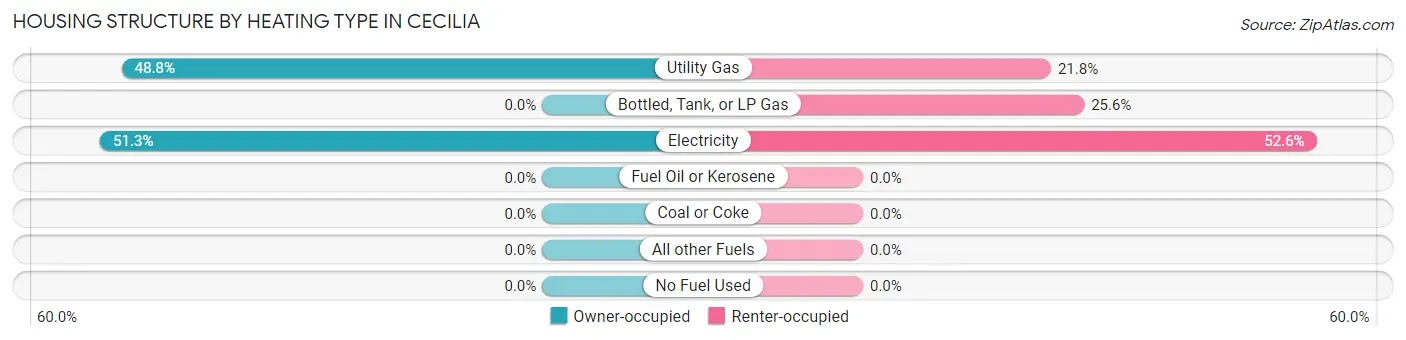
| Heating Type | Owner-occupied | Renter-occupied |
| Utility Gas | 39 (48.7%) | 17 (21.8%) |
| Bottled, Tank, or LP Gas | 0 (0.0%) | 20 (25.6%) |
| Electricity | 41 (51.2%) | 41 (52.6%) |
| Fuel Oil or Kerosene | 0 (0.0%) | 0 (0.0%) |
| Coal or Coke | 0 (0.0%) | 0 (0.0%) |
| All other Fuels | 0 (0.0%) | 0 (0.0%) |
| No Fuel Used | 0 (0.0%) | 0 (0.0%) |
| Total | 80 (100.0%) | 78 (100.0%) |
Household Vehicle Usage in Cecilia
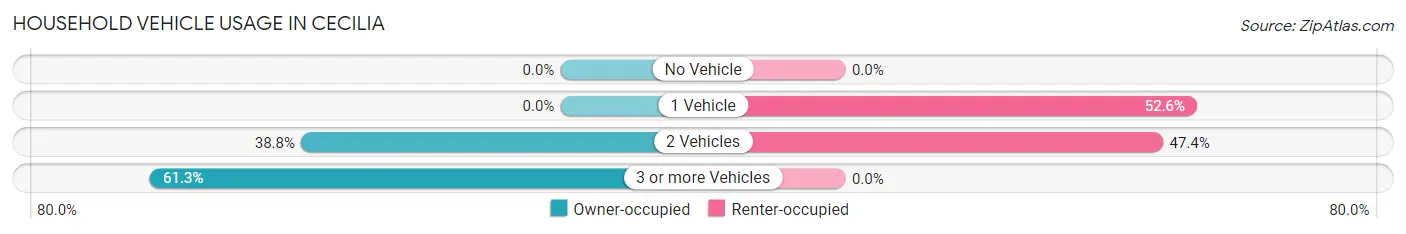
| Vehicles per Household | Owner-occupied | Renter-occupied |
| No Vehicle | 0 (0.0%) | 0 (0.0%) |
| 1 Vehicle | 0 (0.0%) | 41 (52.6%) |
| 2 Vehicles | 31 (38.8%) | 37 (47.4%) |
| 3 or more Vehicles | 49 (61.3%) | 0 (0.0%) |
| Total | 80 (100.0%) | 78 (100.0%) |
Real Estate & Mortgages in Cecilia
Real Estate and Mortgage Overview in Cecilia
| Characteristic | Without Mortgage | With Mortgage |
| Housing Units | 41 | 39 |
| Median Property Value | - | - |
| Median Household Income | $133,456 | $17 |
| Monthly Housing Costs | $585 | $0 |
| Real Estate Taxes | $1,825 | $0 |
Property Value by Mortgage Status in Cecilia
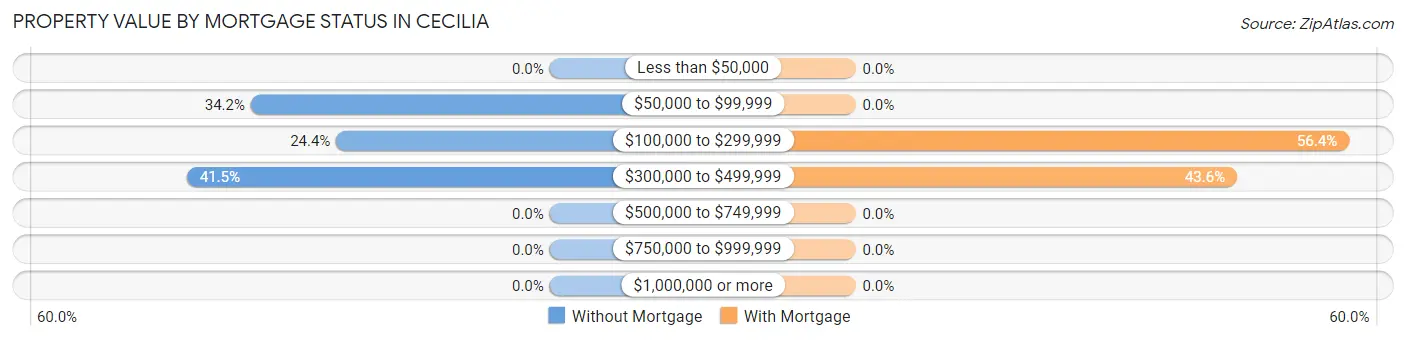
| Property Value | Without Mortgage | With Mortgage |
| Less than $50,000 | 0 (0.0%) | 0 (0.0%) |
| $50,000 to $99,999 | 14 (34.2%) | 0 (0.0%) |
| $100,000 to $299,999 | 10 (24.4%) | 22 (56.4%) |
| $300,000 to $499,999 | 17 (41.5%) | 17 (43.6%) |
| $500,000 to $749,999 | 0 (0.0%) | 0 (0.0%) |
| $750,000 to $999,999 | 0 (0.0%) | 0 (0.0%) |
| $1,000,000 or more | 0 (0.0%) | 0 (0.0%) |
| Total | 41 (100.0%) | 39 (100.0%) |
Household Income by Mortgage Status in Cecilia
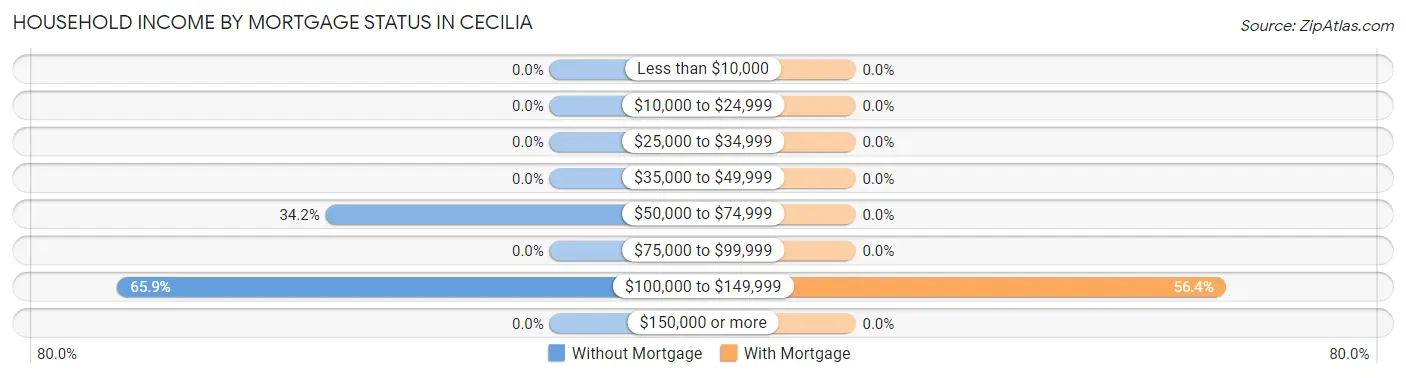
| Household Income | Without Mortgage | With Mortgage |
| Less than $10,000 | 0 (0.0%) | 0 (0.0%) |
| $10,000 to $24,999 | 0 (0.0%) | 0 (0.0%) |
| $25,000 to $34,999 | 0 (0.0%) | 0 (0.0%) |
| $35,000 to $49,999 | 0 (0.0%) | 0 (0.0%) |
| $50,000 to $74,999 | 14 (34.2%) | 0 (0.0%) |
| $75,000 to $99,999 | 0 (0.0%) | 0 (0.0%) |
| $100,000 to $149,999 | 27 (65.8%) | 22 (56.4%) |
| $150,000 or more | 0 (0.0%) | 0 (0.0%) |
| Total | 41 (100.0%) | 39 (100.0%) |
Property Value to Household Income Ratio in Cecilia
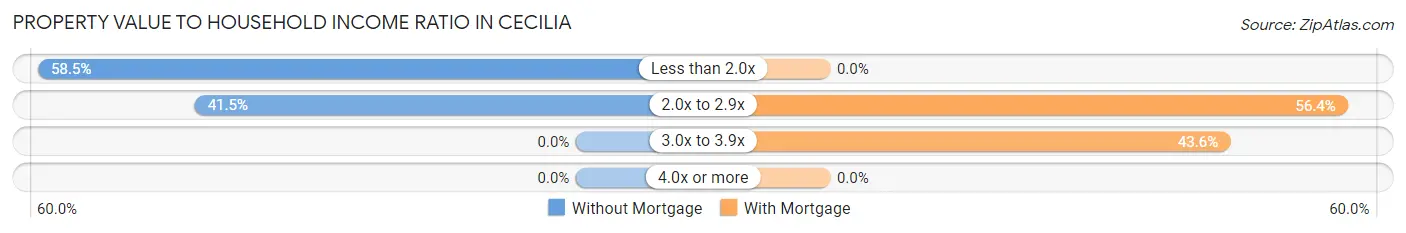
| Value-to-Income Ratio | Without Mortgage | With Mortgage |
| Less than 2.0x | 24 (58.5%) | 0 (0.0%) |
| 2.0x to 2.9x | 17 (41.5%) | 22 (56.4%) |
| 3.0x to 3.9x | 0 (0.0%) | 17 (43.6%) |
| 4.0x or more | 0 (0.0%) | 0 (0.0%) |
| Total | 41 (100.0%) | 39 (100.0%) |
Real Estate Taxes by Mortgage Status in Cecilia
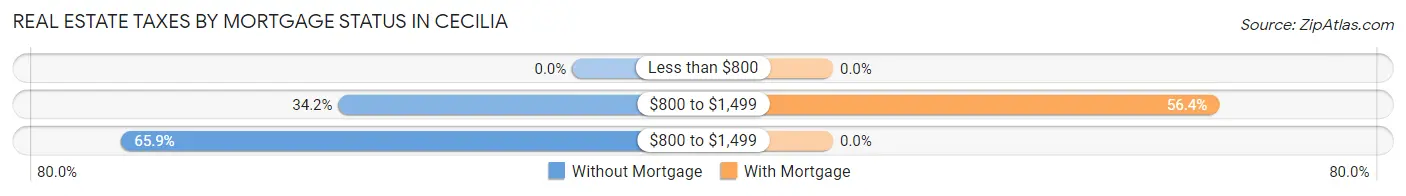
| Property Taxes | Without Mortgage | With Mortgage |
| Less than $800 | 0 (0.0%) | 0 (0.0%) |
| $800 to $1,499 | 14 (34.2%) | 22 (56.4%) |
| $800 to $1,499 | 27 (65.8%) | 0 (0.0%) |
| Total | 41 (100.0%) | 39 (100.0%) |
Health & Disability in Cecilia
Health Insurance Coverage by Age in Cecilia
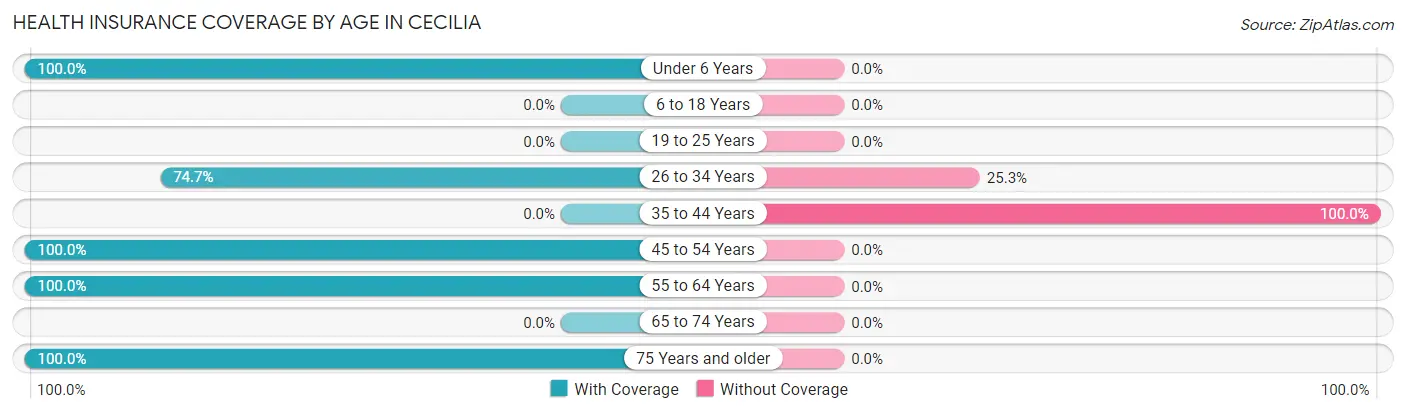
| Age Bracket | With Coverage | Without Coverage |
| Under 6 Years | 62 (100.0%) | 0 (0.0%) |
| 6 to 18 Years | 0 (0.0%) | 0 (0.0%) |
| 19 to 25 Years | 0 (0.0%) | 0 (0.0%) |
| 26 to 34 Years | 65 (74.7%) | 22 (25.3%) |
| 35 to 44 Years | 0 (0.0%) | 36 (100.0%) |
| 45 to 54 Years | 96 (100.0%) | 0 (0.0%) |
| 55 to 64 Years | 94 (100.0%) | 0 (0.0%) |
| 65 to 74 Years | 0 (0.0%) | 0 (0.0%) |
| 75 Years and older | 64 (100.0%) | 0 (0.0%) |
| Total | 381 (86.8%) | 58 (13.2%) |
Health Insurance Coverage by Citizenship Status in Cecilia
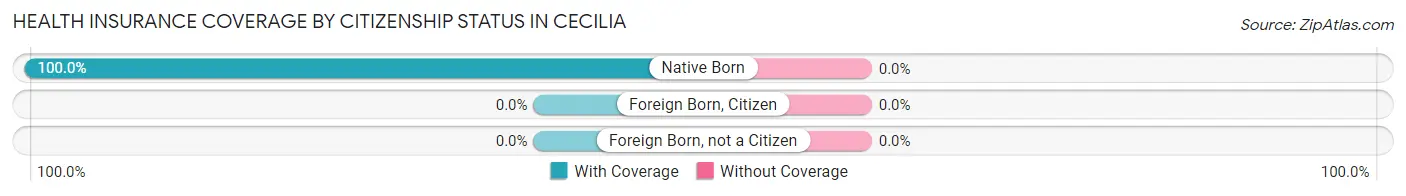
| Citizenship Status | With Coverage | Without Coverage |
| Native Born | 62 (100.0%) | 0 (0.0%) |
| Foreign Born, Citizen | 0 (0.0%) | 0 (0.0%) |
| Foreign Born, not a Citizen | 0 (0.0%) | 0 (0.0%) |
Health Insurance Coverage by Household Income in Cecilia
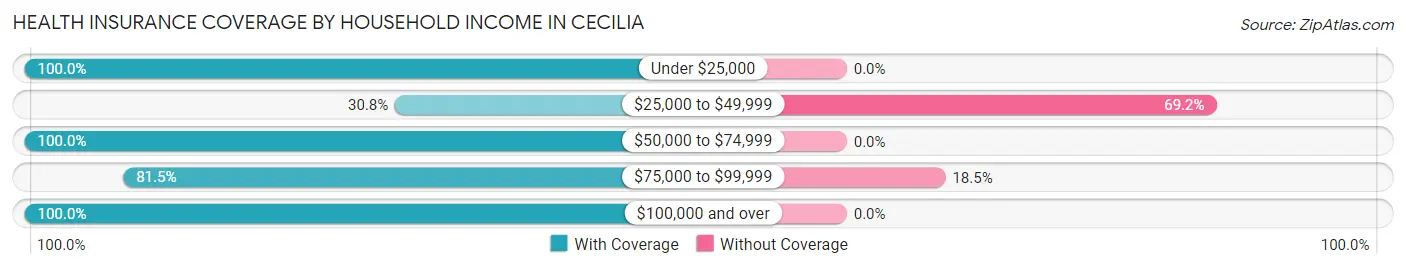
| Household Income | With Coverage | Without Coverage |
| Under $25,000 | 64 (100.0%) | 0 (0.0%) |
| $25,000 to $49,999 | 16 (30.8%) | 36 (69.2%) |
| $50,000 to $74,999 | 30 (100.0%) | 0 (0.0%) |
| $75,000 to $99,999 | 97 (81.5%) | 22 (18.5%) |
| $100,000 and over | 174 (100.0%) | 0 (0.0%) |
Public vs Private Health Insurance Coverage by Age in Cecilia
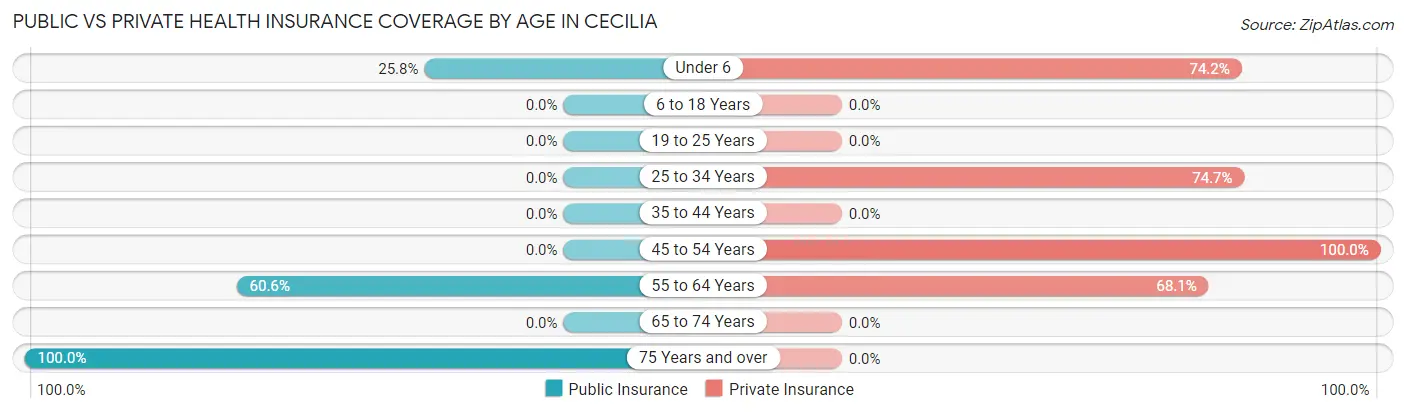
| Age Bracket | Public Insurance | Private Insurance |
| Under 6 | 16 (25.8%) | 46 (74.2%) |
| 6 to 18 Years | 0 (0.0%) | 0 (0.0%) |
| 19 to 25 Years | 0 (0.0%) | 0 (0.0%) |
| 25 to 34 Years | 0 (0.0%) | 65 (74.7%) |
| 35 to 44 Years | 0 (0.0%) | 0 (0.0%) |
| 45 to 54 Years | 0 (0.0%) | 96 (100.0%) |
| 55 to 64 Years | 57 (60.6%) | 64 (68.1%) |
| 65 to 74 Years | 0 (0.0%) | 0 (0.0%) |
| 75 Years and over | 64 (100.0%) | 0 (0.0%) |
| Total | 137 (31.2%) | 271 (61.7%) |
Disability Status by Sex by Age in Cecilia

| Age Bracket | Male | Female |
| Under 5 Years | 0 (0.0%) | 0 (0.0%) |
| 5 to 17 Years | 0 (0.0%) | 0 (0.0%) |
| 18 to 34 Years | 0 (0.0%) | 0 (0.0%) |
| 35 to 64 Years | 27 (38.6%) | 14 (9.0%) |
| 65 to 74 Years | 0 (0.0%) | 0 (0.0%) |
| 75 Years and over | 41 (100.0%) | 23 (100.0%) |
Disability Class by Sex by Age in Cecilia
Disability Class: Hearing Difficulty
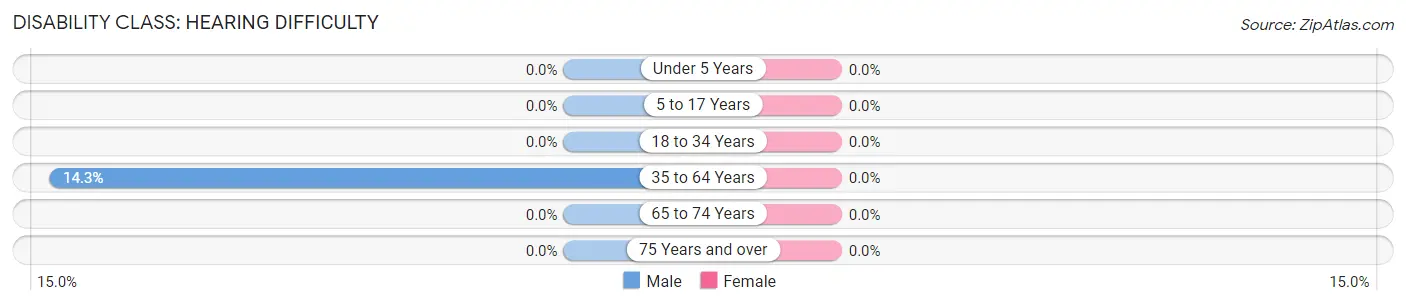
| Age Bracket | Male | Female |
| Under 5 Years | 0 (0.0%) | 0 (0.0%) |
| 5 to 17 Years | 0 (0.0%) | 0 (0.0%) |
| 18 to 34 Years | 0 (0.0%) | 0 (0.0%) |
| 35 to 64 Years | 10 (14.3%) | 0 (0.0%) |
| 65 to 74 Years | 0 (0.0%) | 0 (0.0%) |
| 75 Years and over | 0 (0.0%) | 0 (0.0%) |
Disability Class: Vision Difficulty
| Age Bracket | Male | Female |
| Under 5 Years | 0 (0.0%) | 0 (0.0%) |
| 5 to 17 Years | 0 (0.0%) | 0 (0.0%) |
| 18 to 34 Years | 0 (0.0%) | 0 (0.0%) |
| 35 to 64 Years | 0 (0.0%) | 0 (0.0%) |
| 65 to 74 Years | 0 (0.0%) | 0 (0.0%) |
| 75 Years and over | 0 (0.0%) | 0 (0.0%) |
Disability Class: Cognitive Difficulty
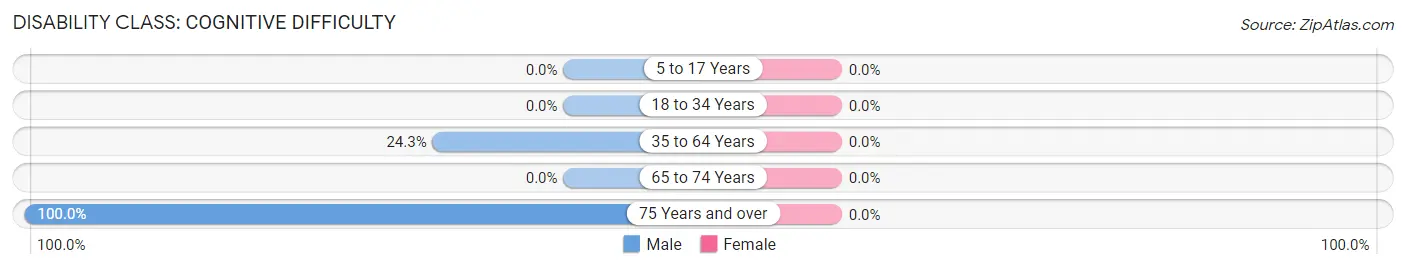
| Age Bracket | Male | Female |
| 5 to 17 Years | 0 (0.0%) | 0 (0.0%) |
| 18 to 34 Years | 0 (0.0%) | 0 (0.0%) |
| 35 to 64 Years | 17 (24.3%) | 0 (0.0%) |
| 65 to 74 Years | 0 (0.0%) | 0 (0.0%) |
| 75 Years and over | 41 (100.0%) | 0 (0.0%) |
Disability Class: Ambulatory Difficulty

| Age Bracket | Male | Female |
| 5 to 17 Years | 0 (0.0%) | 0 (0.0%) |
| 18 to 34 Years | 0 (0.0%) | 0 (0.0%) |
| 35 to 64 Years | 27 (38.6%) | 14 (9.0%) |
| 65 to 74 Years | 0 (0.0%) | 0 (0.0%) |
| 75 Years and over | 0 (0.0%) | 23 (100.0%) |
Disability Class: Self-Care Difficulty
| Age Bracket | Male | Female |
| 5 to 17 Years | 0 (0.0%) | 0 (0.0%) |
| 18 to 34 Years | 0 (0.0%) | 0 (0.0%) |
| 35 to 64 Years | 0 (0.0%) | 0 (0.0%) |
| 65 to 74 Years | 0 (0.0%) | 0 (0.0%) |
| 75 Years and over | 0 (0.0%) | 0 (0.0%) |
Technology Access in Cecilia
Computing Device Access in Cecilia
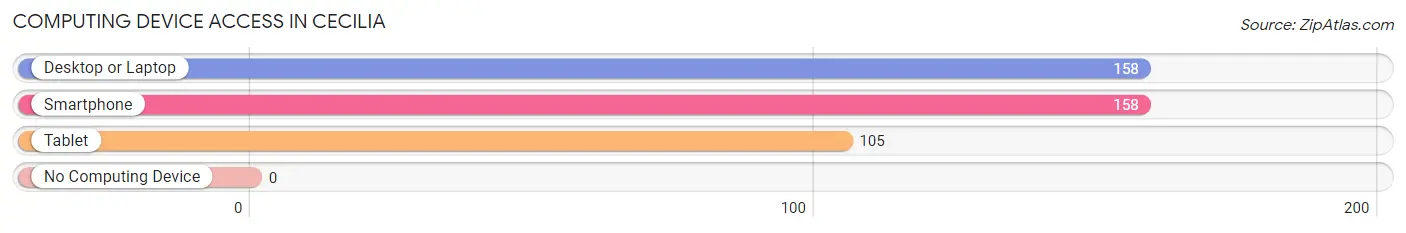
| Device Type | # Households | % Households |
| Desktop or Laptop | 158 | 100.0% |
| Smartphone | 158 | 100.0% |
| Tablet | 105 | 66.5% |
| No Computing Device | 0 | 0.0% |
| Total | 158 | 100.0% |
Internet Access in Cecilia
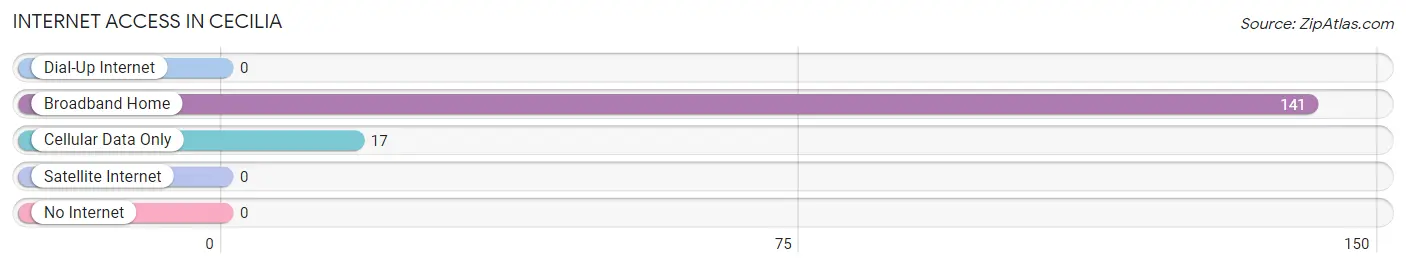
| Internet Type | # Households | % Households |
| Dial-Up Internet | 0 | 0.0% |
| Broadband Home | 141 | 89.2% |
| Cellular Data Only | 17 | 10.8% |
| Satellite Internet | 0 | 0.0% |
| No Internet | 0 | 0.0% |
| Total | 158 | 100.0% |
Cecilia Summary
Cecilia, Kentucky is a small unincorporated community located in Hardin County, Kentucky. It is situated along the banks of the Ohio River, approximately 10 miles south of Elizabethtown. The population of Cecilia was estimated to be 1,845 in 2019.
Geography
Cecilia is located in Hardin County, Kentucky, approximately 10 miles south of Elizabethtown. The community is situated along the banks of the Ohio River, and is bordered by the towns of Glendale, Upton, and Sonora. The terrain of the area is mostly flat, with some rolling hills. The climate is humid subtropical, with hot summers and mild winters.
Economy
The economy of Cecilia is largely based on agriculture and manufacturing. The town is home to several small businesses, including a grocery store, a hardware store, and a few restaurants. The town also has a few small industrial plants, which provide employment for many of the town's residents.
Demographics
As of 2019, the population of Cecilia was estimated to be 1,845. The racial makeup of the town was 97.3% White, 0.7% African American, 0.3% Native American, 0.2% Asian, 0.1% Pacific Islander, and 1.4% from other races. The median household income was $37,917, and the median family income was $45,917. The per capita income was $19,917.
History
Cecilia was founded in 1820 by a group of settlers from Virginia. The town was named after the wife of one of the settlers, who was named Cecilia. The town grew slowly over the years, and by the late 19th century, it had become a thriving agricultural community. The town was also home to several small businesses, including a grocery store, a hardware store, and a few restaurants.
In the early 20th century, the town began to decline as the economy shifted away from agriculture. The town's population began to decline, and by the 1950s, the town was nearly abandoned. In the late 20th century, the town began to experience a resurgence, as new businesses began to move into the area. Today, Cecilia is a small but vibrant community, with a population of around 1,845.
Common Questions
What is Per Capita Income in Cecilia?
Per Capita income in Cecilia is $27,551.
What is the Median Household income in Cecilia?
Median Household Income in Cecilia is $78,375.
What is Income or Wage Gap in Cecilia?
Income or Wage Gap in Cecilia is 39.6%.
Women in Cecilia earn 60.4 cents for every dollar earned by a man.
What is Inequality or Gini Index in Cecilia?
Inequality or Gini Index in Cecilia is 0.38.
What is the Total Population of Cecilia?
Total Population of Cecilia is 439.
What is the Total Male Population of Cecilia?
Total Male Population of Cecilia is 178.
What is the Total Female Population of Cecilia?
Total Female Population of Cecilia is 261.
What is the Ratio of Males per 100 Females in Cecilia?
There are 68.20 Males per 100 Females in Cecilia.
What is the Ratio of Females per 100 Males in Cecilia?
There are 146.63 Females per 100 Males in Cecilia.
What is the Median Population Age in Cecilia?
Median Population Age in Cecilia is 49.9 Years.
What is the Average Family Size in Cecilia
Average Family Size in Cecilia is 2.5 People.
What is the Average Household Size in Cecilia
Average Household Size in Cecilia is 2.8 People.
How Large is the Labor Force in Cecilia?
There are 213 People in the Labor Forcein in Cecilia.
What is the Percentage of People in the Labor Force in Cecilia?
56.5% of People are in the Labor Force in Cecilia.
What is the Unemployment Rate in Cecilia?
Unemployment Rate in Cecilia is 28.6%.