St Matthews, KY Map & Demographics
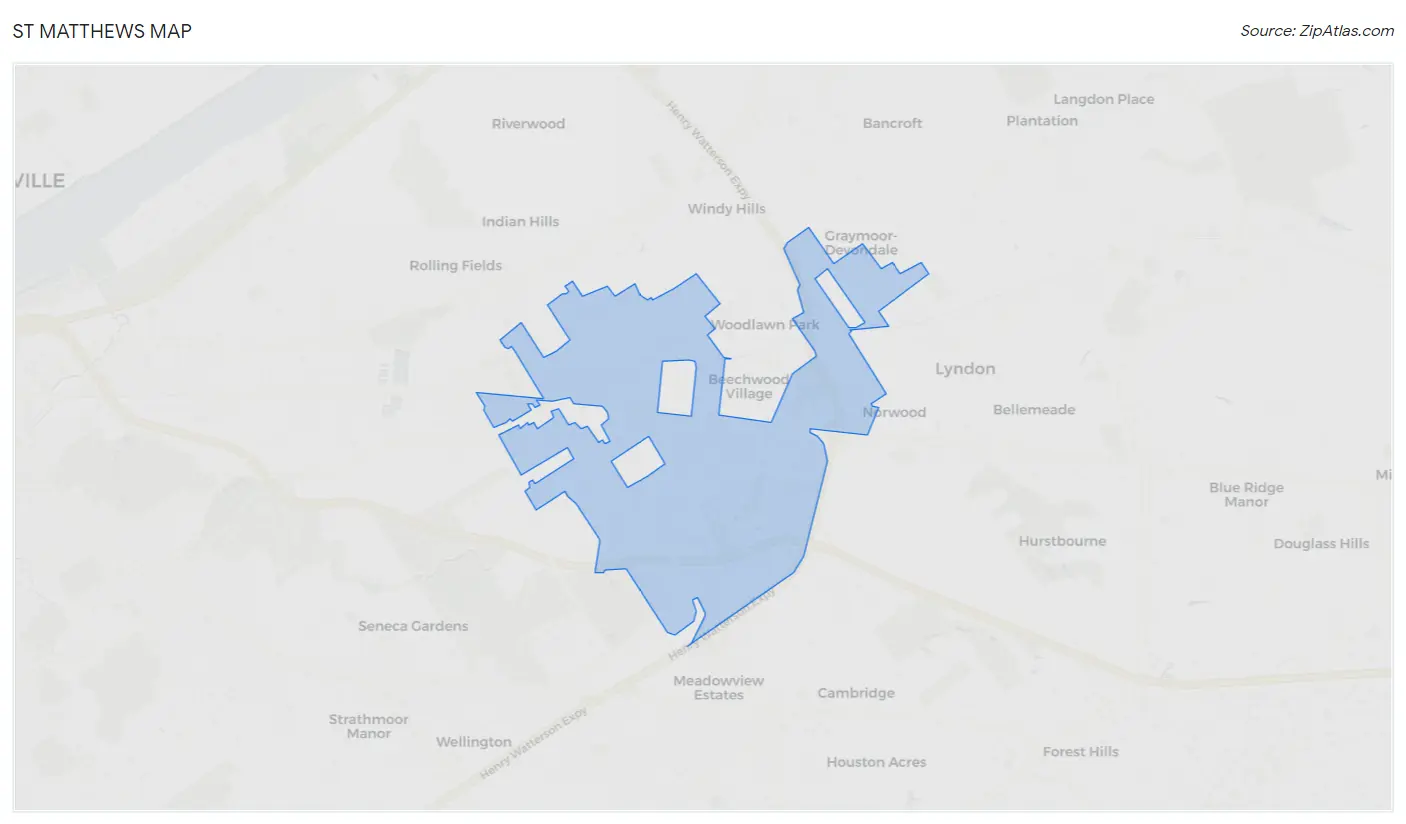
St Matthews Map
St Matthews Overview
$53,401
PER CAPITA INCOME
$118,250
AVG FAMILY INCOME
$78,928
AVG HOUSEHOLD INCOME
16.2%
WAGE / INCOME GAP [ % ]
83.8¢/ $1
WAGE / INCOME GAP [ $ ]
$12,408
FAMILY INCOME DEFICIT
0.44
INEQUALITY / GINI INDEX
17,511
TOTAL POPULATION
8,150
MALE POPULATION
9,361
FEMALE POPULATION
87.06
MALES / 100 FEMALES
114.86
FEMALES / 100 MALES
37.5
MEDIAN AGE
2.7
AVG FAMILY SIZE
2.0
AVG HOUSEHOLD SIZE
10,927
LABOR FORCE [ PEOPLE ]
72.2%
PERCENT IN LABOR FORCE
3.7%
UNEMPLOYMENT RATE
St Matthews Area Codes
Income in St Matthews
Income Overview in St Matthews
Per Capita Income in St Matthews is $53,401, while median incomes of families and households are $118,250 and $78,928 respectively.
| Characteristic | Number | Measure |
| Per Capita Income | 17,511 | $53,401 |
| Median Family Income | 4,173 | $118,250 |
| Mean Family Income | 4,173 | $139,843 |
| Median Household Income | 8,737 | $78,928 |
| Mean Household Income | 8,737 | $105,124 |
| Income Deficit | 4,173 | $12,408 |
| Wage / Income Gap (%) | 17,511 | 16.19% |
| Wage / Income Gap ($) | 17,511 | 83.81¢ per $1 |
| Gini / Inequality Index | 17,511 | 0.44 |
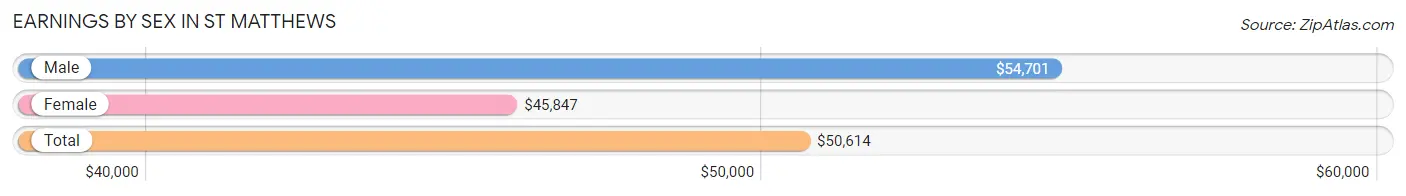
Earnings by Sex in St Matthews
Average Earnings in St Matthews are $50,614, $54,701 for men and $45,847 for women, a difference of 16.2%.
| Sex | Number | Average Earnings |
| Male | 5,688 (50.3%) | $54,701 |
| Female | 5,629 (49.7%) | $45,847 |
| Total | 11,317 (100.0%) | $50,614 |
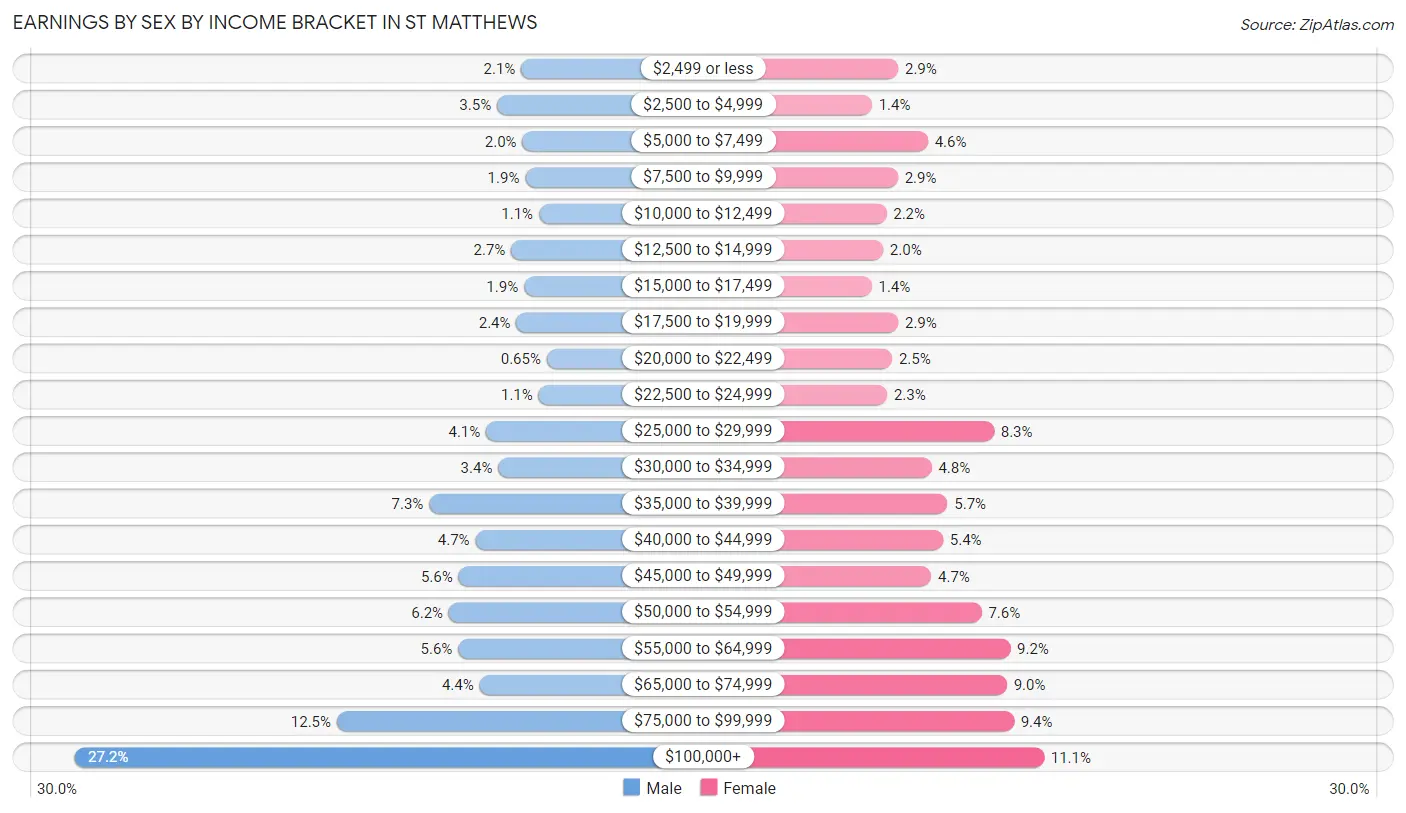
Earnings by Sex by Income Bracket in St Matthews
The most common earnings brackets in St Matthews are $100,000+ for men (1,545 | 27.2%) and $100,000+ for women (623 | 11.1%).
| Income | Male | Female |
| $2,499 or less | 119 (2.1%) | 162 (2.9%) |
| $2,500 to $4,999 | 196 (3.5%) | 79 (1.4%) |
| $5,000 to $7,499 | 115 (2.0%) | 256 (4.5%) |
| $7,500 to $9,999 | 106 (1.9%) | 161 (2.9%) |
| $10,000 to $12,499 | 62 (1.1%) | 125 (2.2%) |
| $12,500 to $14,999 | 151 (2.6%) | 114 (2.0%) |
| $15,000 to $17,499 | 110 (1.9%) | 78 (1.4%) |
| $17,500 to $19,999 | 134 (2.4%) | 162 (2.9%) |
| $20,000 to $22,499 | 37 (0.6%) | 143 (2.5%) |
| $22,500 to $24,999 | 63 (1.1%) | 127 (2.3%) |
| $25,000 to $29,999 | 231 (4.1%) | 465 (8.3%) |
| $30,000 to $34,999 | 192 (3.4%) | 268 (4.8%) |
| $35,000 to $39,999 | 413 (7.3%) | 318 (5.7%) |
| $40,000 to $44,999 | 265 (4.7%) | 304 (5.4%) |
| $45,000 to $49,999 | 319 (5.6%) | 267 (4.7%) |
| $50,000 to $54,999 | 350 (6.1%) | 426 (7.6%) |
| $55,000 to $64,999 | 320 (5.6%) | 517 (9.2%) |
| $65,000 to $74,999 | 252 (4.4%) | 506 (9.0%) |
| $75,000 to $99,999 | 708 (12.4%) | 528 (9.4%) |
| $100,000+ | 1,545 (27.2%) | 623 (11.1%) |
| Total | 5,688 (100.0%) | 5,629 (100.0%) |
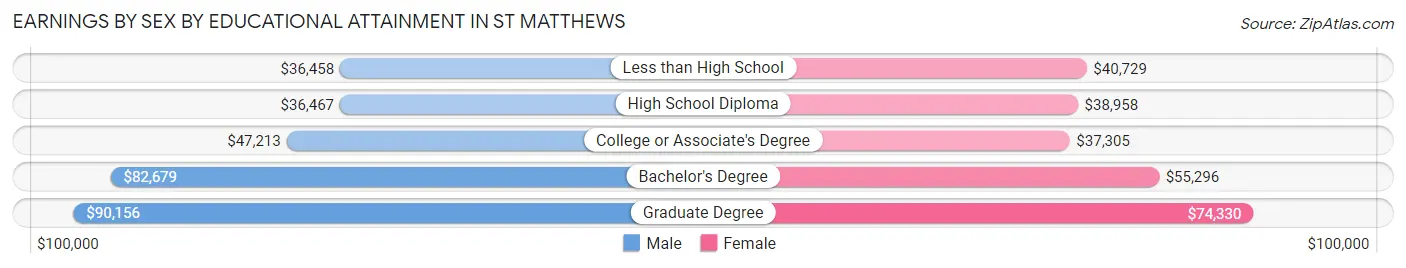
Earnings by Sex by Educational Attainment in St Matthews
Average earnings in St Matthews are $64,031 for men and $51,132 for women, a difference of 20.1%. Men with an educational attainment of graduate degree enjoy the highest average annual earnings of $90,156, while those with less than high school education earn the least with $36,458. Women with an educational attainment of graduate degree earn the most with the average annual earnings of $74,330, while those with college or associate's degree education have the smallest earnings of $37,305.
| Educational Attainment | Male Income | Female Income |
| Less than High School | $36,458 | $40,729 |
| High School Diploma | $36,467 | $38,958 |
| College or Associate's Degree | $47,213 | $37,305 |
| Bachelor's Degree | $82,679 | $55,296 |
| Graduate Degree | $90,156 | $74,330 |
| Total | $64,031 | $51,132 |
Family Income in St Matthews
Family Income Brackets in St Matthews
According to the St Matthews family income data, there are 1,006 families falling into the $100,000 to $149,999 income range, which is the most common income bracket and makes up 24.1% of all families. Conversely, the $15,000 to $24,999 income bracket is the least frequent group with only 58 families (1.4%) belonging to this category.
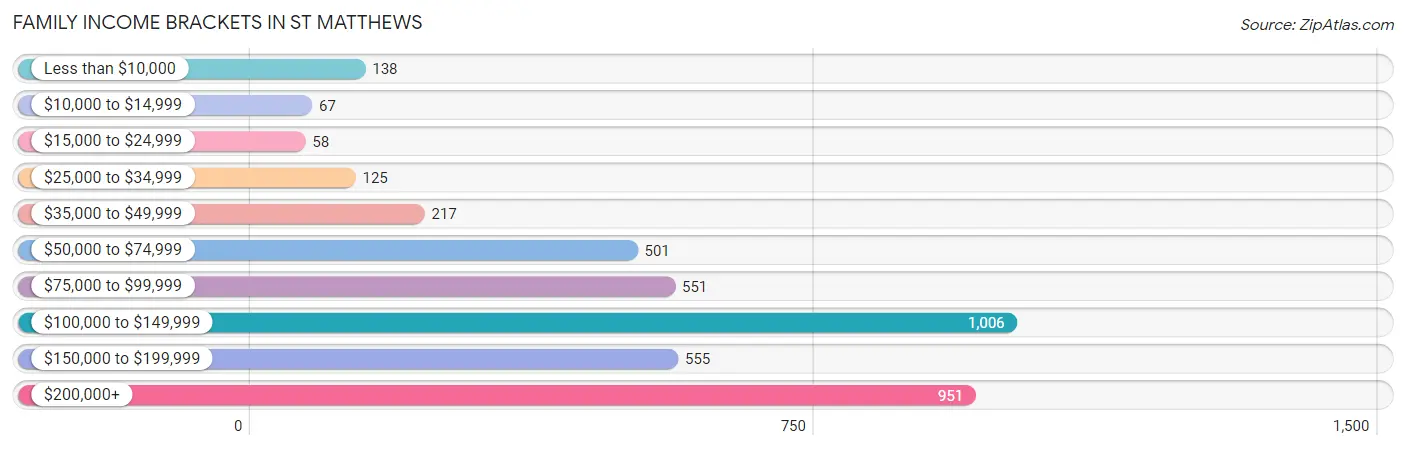
| Income Bracket | # Families | % Families |
| Less than $10,000 | 138 | 3.3% |
| $10,000 to $14,999 | 67 | 1.6% |
| $15,000 to $24,999 | 58 | 1.4% |
| $25,000 to $34,999 | 125 | 3.0% |
| $35,000 to $49,999 | 217 | 5.2% |
| $50,000 to $74,999 | 501 | 12.0% |
| $75,000 to $99,999 | 551 | 13.2% |
| $100,000 to $149,999 | 1,006 | 24.1% |
| $150,000 to $199,999 | 555 | 13.3% |
| $200,000+ | 951 | 22.8% |
Family Income by Famaliy Size in St Matthews
4-person families (675 | 16.2%) account for the highest median family income in St Matthews with $159,625 per family, while 2-person families (2,486 | 59.6%) have the highest median income of $52,364 per family member.
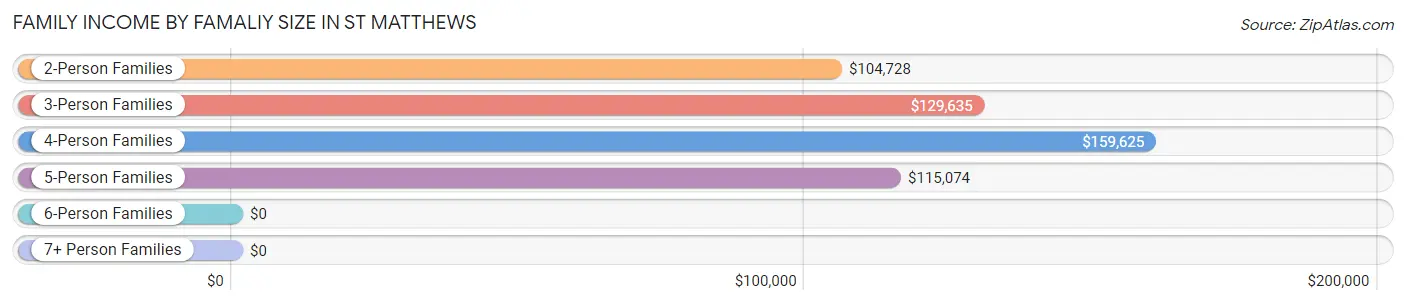
| Income Bracket | # Families | Median Income |
| 2-Person Families | 2,486 (59.6%) | $104,728 |
| 3-Person Families | 853 (20.4%) | $129,635 |
| 4-Person Families | 675 (16.2%) | $159,625 |
| 5-Person Families | 137 (3.3%) | $115,074 |
| 6-Person Families | 22 (0.5%) | $0 |
| 7+ Person Families | 0 (0.0%) | $0 |
| Total | 4,173 (100.0%) | $118,250 |
Family Income by Number of Earners in St Matthews
The median family income in St Matthews is $118,250, with families comprising 3+ earners (303) having the highest median family income of $172,670, while families with no earners (541) have the lowest median family income of $63,090, accounting for 7.3% and 13.0% of families, respectively.
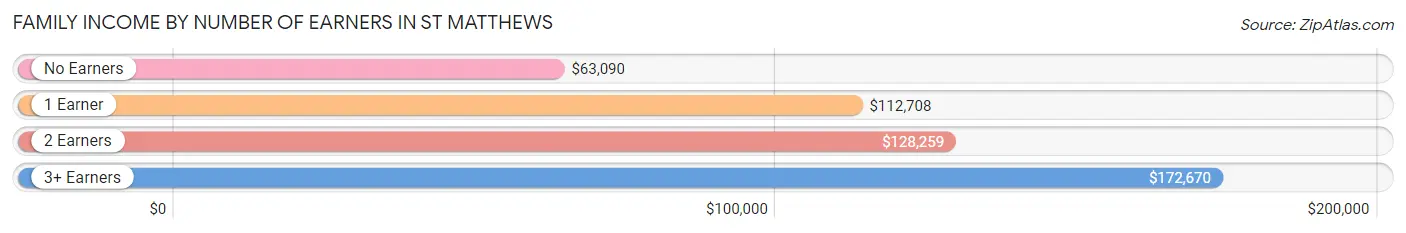
| Number of Earners | # Families | Median Income |
| No Earners | 541 (13.0%) | $63,090 |
| 1 Earner | 982 (23.5%) | $112,708 |
| 2 Earners | 2,347 (56.2%) | $128,259 |
| 3+ Earners | 303 (7.3%) | $172,670 |
| Total | 4,173 (100.0%) | $118,250 |
Household Income in St Matthews
Household Income Brackets in St Matthews
With 1,555 households falling in the category, the $100,000 to $149,999 income range is the most frequent in St Matthews, accounting for 17.8% of all households. In contrast, only 210 households (2.4%) fall into the $10,000 to $14,999 income bracket, making it the least populous group.
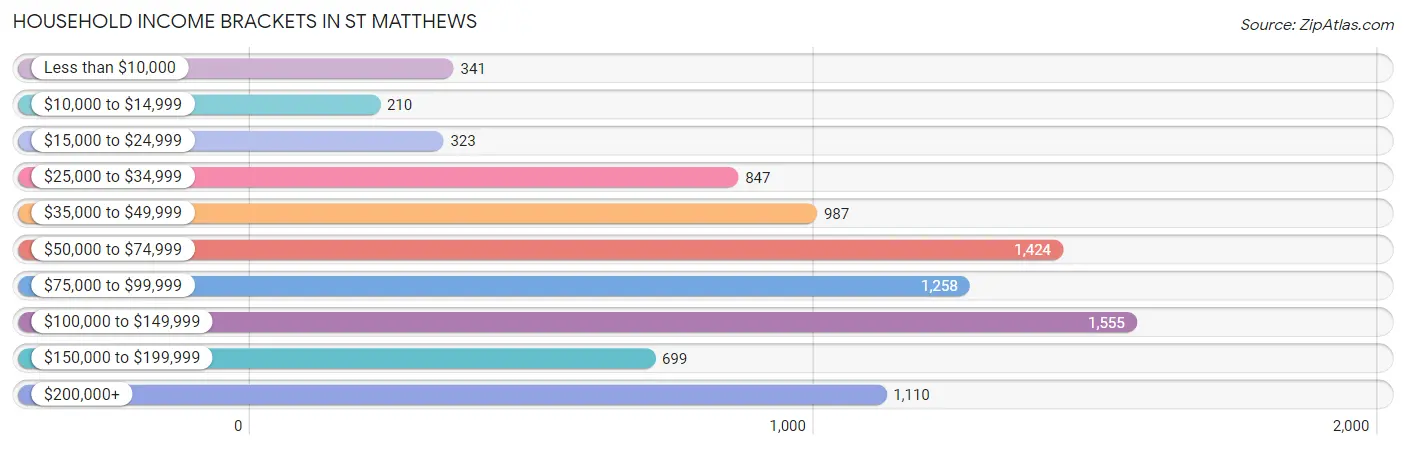
| Income Bracket | # Households | % Households |
| Less than $10,000 | 341 | 3.9% |
| $10,000 to $14,999 | 210 | 2.4% |
| $15,000 to $24,999 | 323 | 3.7% |
| $25,000 to $34,999 | 847 | 9.7% |
| $35,000 to $49,999 | 987 | 11.3% |
| $50,000 to $74,999 | 1,424 | 16.3% |
| $75,000 to $99,999 | 1,258 | 14.4% |
| $100,000 to $149,999 | 1,555 | 17.8% |
| $150,000 to $199,999 | 699 | 8.0% |
| $200,000+ | 1,110 | 12.7% |
Household Income by Householder Age in St Matthews
The median household income in St Matthews is $78,928, with the highest median household income of $91,404 found in the 25 to 44 years age bracket for the primary householder. A total of 3,574 households (40.9%) fall into this category. Meanwhile, the 15 to 24 years age bracket for the primary householder has the lowest median household income of $45,000, with 570 households (6.5%) in this group.
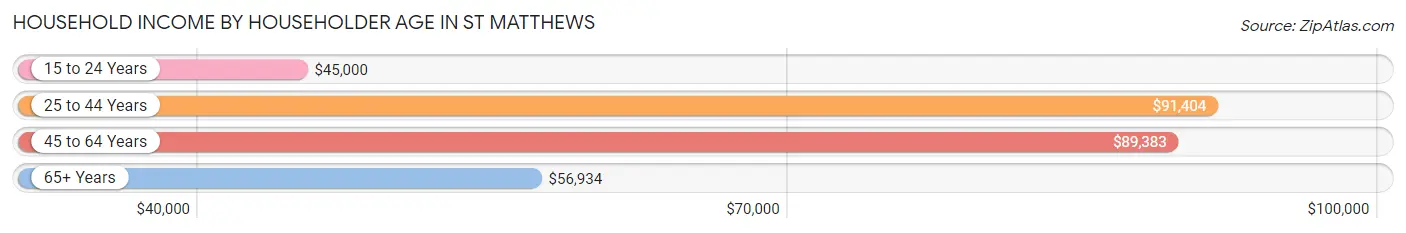
| Income Bracket | # Households | Median Income |
| 15 to 24 Years | 570 (6.5%) | $45,000 |
| 25 to 44 Years | 3,574 (40.9%) | $91,404 |
| 45 to 64 Years | 2,345 (26.8%) | $89,383 |
| 65+ Years | 2,248 (25.7%) | $56,934 |
| Total | 8,737 (100.0%) | $78,928 |
Poverty in St Matthews
Income Below Poverty by Sex and Age in St Matthews
With 5.3% poverty level for males and 9.0% for females among the residents of St Matthews, 18 to 24 year old males and 15 year old females are the most vulnerable to poverty, with 146 males (22.0%) and 18 females (24.0%) in their respective age groups living below the poverty level.
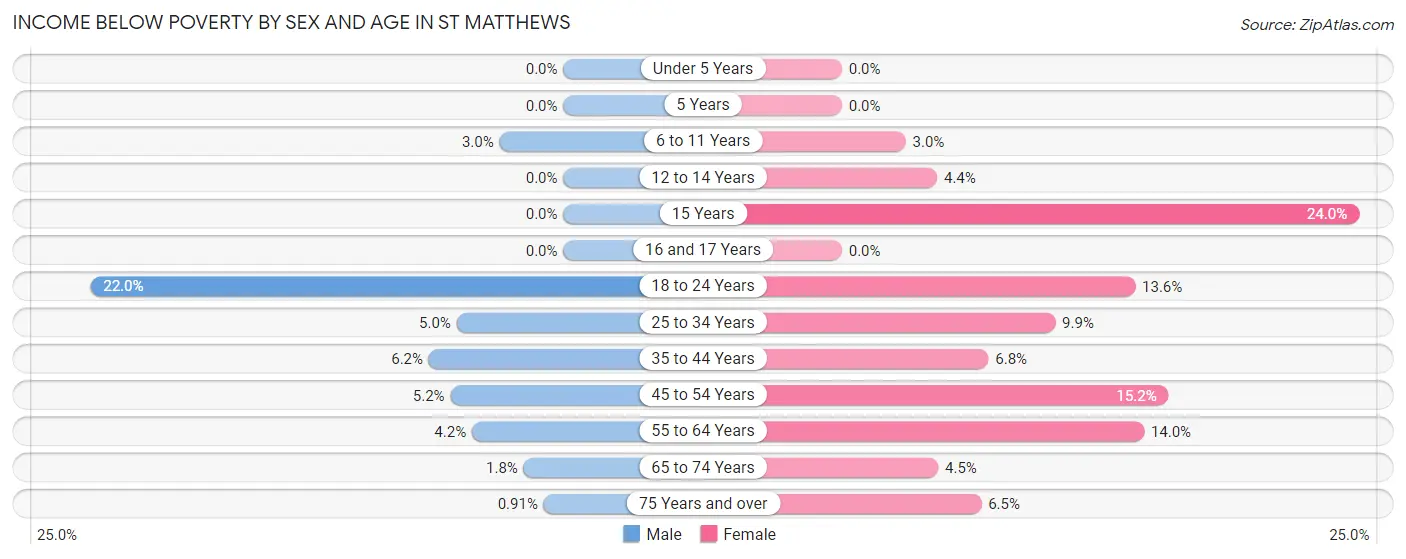
| Age Bracket | Male | Female |
| Under 5 Years | 0 (0.0%) | 0 (0.0%) |
| 5 Years | 0 (0.0%) | 0 (0.0%) |
| 6 to 11 Years | 10 (3.0%) | 17 (3.0%) |
| 12 to 14 Years | 0 (0.0%) | 8 (4.4%) |
| 15 Years | 0 (0.0%) | 18 (24.0%) |
| 16 and 17 Years | 0 (0.0%) | 0 (0.0%) |
| 18 to 24 Years | 146 (22.0%) | 109 (13.6%) |
| 25 to 34 Years | 102 (5.0%) | 194 (9.9%) |
| 35 to 44 Years | 74 (6.2%) | 73 (6.8%) |
| 45 to 54 Years | 43 (5.2%) | 143 (15.2%) |
| 55 to 64 Years | 32 (4.2%) | 163 (14.0%) |
| 65 to 74 Years | 13 (1.8%) | 42 (4.5%) |
| 75 Years and over | 5 (0.9%) | 58 (6.5%) |
| Total | 425 (5.3%) | 825 (9.0%) |
Income Above Poverty by Sex and Age in St Matthews
According to the poverty statistics in St Matthews, males aged under 5 years and females aged under 5 years are the age groups that are most secure financially, with 100.0% of males and 100.0% of females in these age groups living above the poverty line.
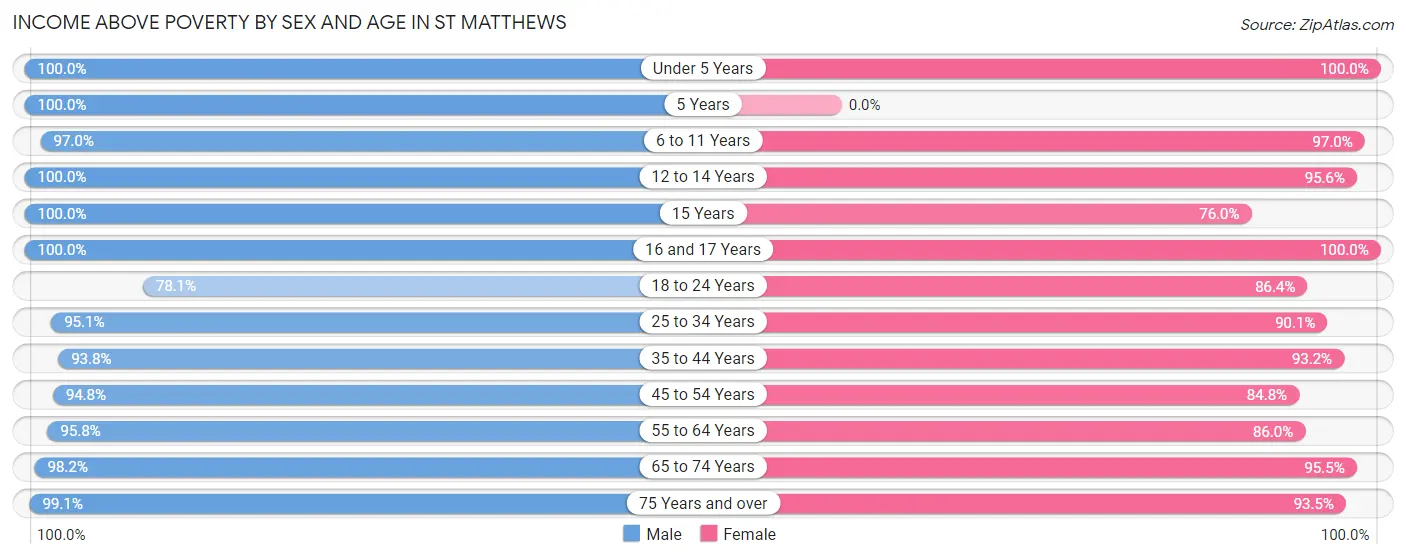
| Age Bracket | Male | Female |
| Under 5 Years | 376 (100.0%) | 409 (100.0%) |
| 5 Years | 111 (100.0%) | 0 (0.0%) |
| 6 to 11 Years | 328 (97.0%) | 558 (97.0%) |
| 12 to 14 Years | 206 (100.0%) | 173 (95.6%) |
| 15 Years | 51 (100.0%) | 57 (76.0%) |
| 16 and 17 Years | 187 (100.0%) | 97 (100.0%) |
| 18 to 24 Years | 519 (78.0%) | 692 (86.4%) |
| 25 to 34 Years | 1,960 (95.1%) | 1,765 (90.1%) |
| 35 to 44 Years | 1,111 (93.8%) | 1,001 (93.2%) |
| 45 to 54 Years | 777 (94.8%) | 800 (84.8%) |
| 55 to 64 Years | 722 (95.8%) | 1,000 (86.0%) |
| 65 to 74 Years | 693 (98.2%) | 897 (95.5%) |
| 75 Years and over | 545 (99.1%) | 838 (93.5%) |
| Total | 7,586 (94.7%) | 8,287 (90.9%) |
Income Below Poverty Among Married-Couple Families in St Matthews
The poverty statistics for married-couple families in St Matthews show that 2.3% or 73 of the total 3,199 families live below the poverty line. Families with no children have the highest poverty rate of 3.0%, comprising of 63 families. On the other hand, families with 3 or 4 children have the lowest poverty rate of 0.0%, which includes 0 families.
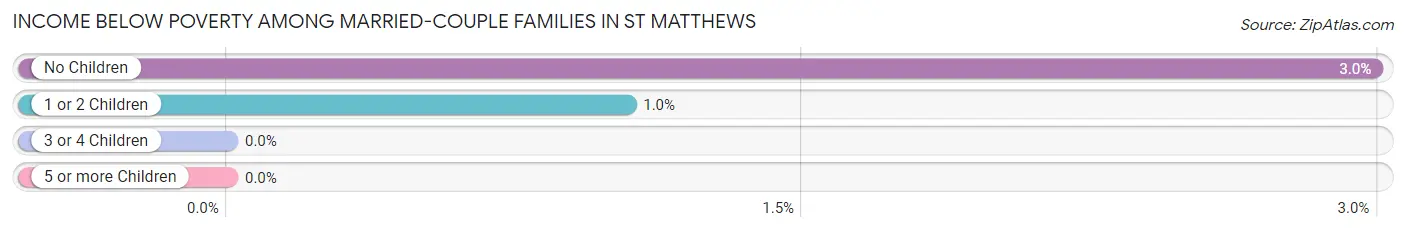
| Children | Above Poverty | Below Poverty |
| No Children | 2,041 (97.0%) | 63 (3.0%) |
| 1 or 2 Children | 954 (99.0%) | 10 (1.0%) |
| 3 or 4 Children | 131 (100.0%) | 0 (0.0%) |
| 5 or more Children | 0 (0.0%) | 0 (0.0%) |
| Total | 3,126 (97.7%) | 73 (2.3%) |
Income Below Poverty Among Single-Parent Households in St Matthews
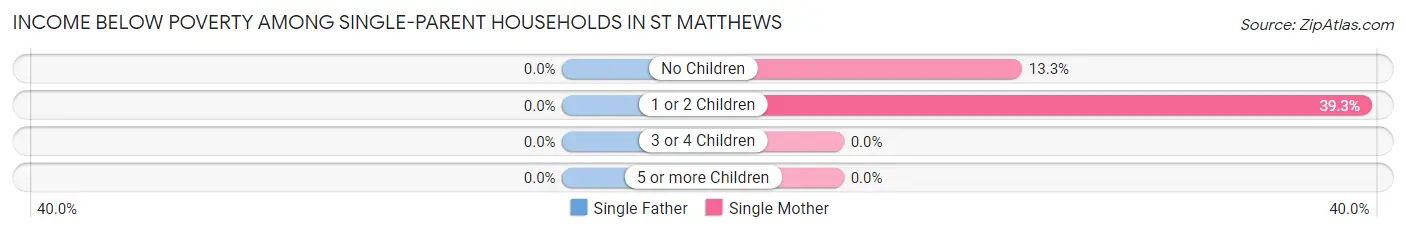
| Children | Single Father | Single Mother |
| No Children | 0 (0.0%) | 49 (13.3%) |
| 1 or 2 Children | 0 (0.0%) | 107 (39.3%) |
| 3 or 4 Children | 0 (0.0%) | 0 (0.0%) |
| 5 or more Children | 0 (0.0%) | 0 (0.0%) |
| Total | 0 (0.0%) | 156 (24.3%) |
Income Below Poverty Among Married-Couple vs Single-Parent Households in St Matthews
The poverty data for St Matthews shows that 73 of the married-couple family households (2.3%) and 156 of the single-parent households (16.0%) are living below the poverty level. Within the married-couple family households, those with no children have the highest poverty rate, with 63 households (3.0%) falling below the poverty line. Among the single-parent households, those with 1 or 2 children have the highest poverty rate, with 107 household (18.9%) living below poverty.
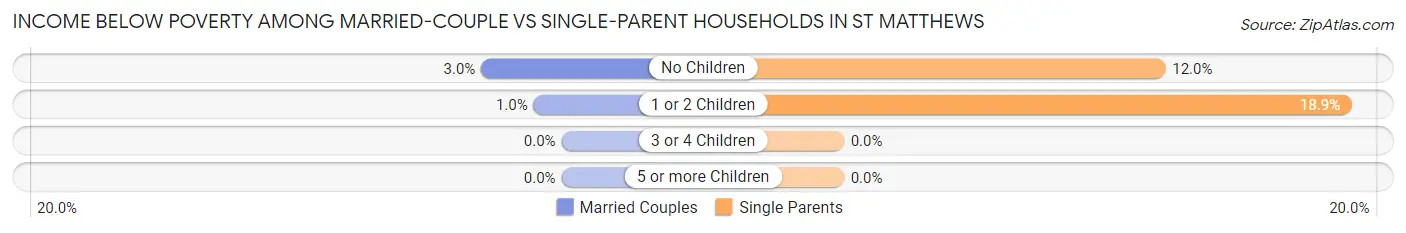
| Children | Married-Couple Families | Single-Parent Households |
| No Children | 63 (3.0%) | 49 (12.0%) |
| 1 or 2 Children | 10 (1.0%) | 107 (18.9%) |
| 3 or 4 Children | 0 (0.0%) | 0 (0.0%) |
| 5 or more Children | 0 (0.0%) | 0 (0.0%) |
| Total | 73 (2.3%) | 156 (16.0%) |
Race in St Matthews
The most populous races in St Matthews are White / Caucasian (15,211 | 86.9%), Black / African American (875 | 5.0%), and Two or more Races (711 | 4.1%).
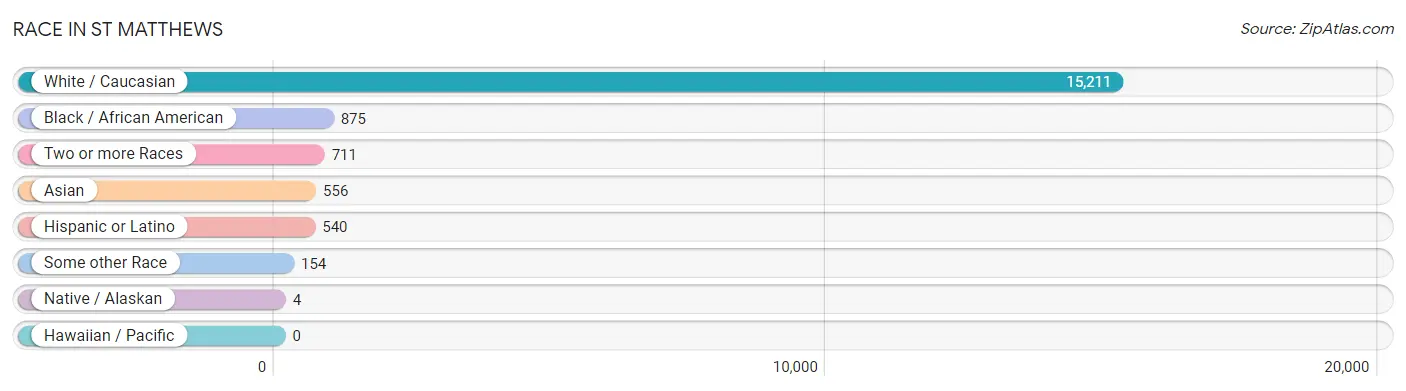
| Race | # Population | % Population |
| Asian | 556 | 3.2% |
| Black / African American | 875 | 5.0% |
| Hawaiian / Pacific | 0 | 0.0% |
| Hispanic or Latino | 540 | 3.1% |
| Native / Alaskan | 4 | 0.0% |
| White / Caucasian | 15,211 | 86.9% |
| Two or more Races | 711 | 4.1% |
| Some other Race | 154 | 0.9% |
| Total | 17,511 | 100.0% |
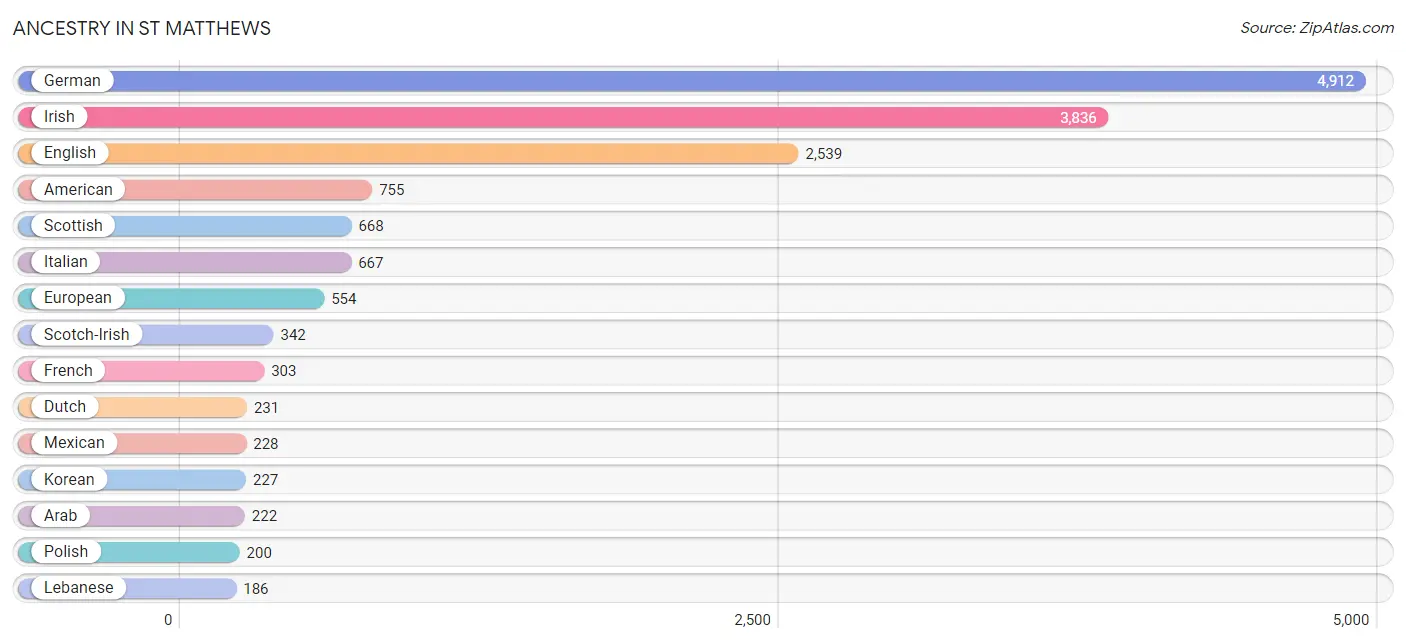
Ancestry in St Matthews
The most populous ancestries reported in St Matthews are German (4,912 | 28.1%), Irish (3,836 | 21.9%), English (2,539 | 14.5%), American (755 | 4.3%), and Scottish (668 | 3.8%), together accounting for 72.6% of all St Matthews residents.
| Ancestry | # Population | % Population |
| African | 73 | 0.4% |
| American | 755 | 4.3% |
| Arab | 222 | 1.3% |
| Argentinean | 30 | 0.2% |
| Armenian | 8 | 0.1% |
| Austrian | 18 | 0.1% |
| Belgian | 16 | 0.1% |
| Bhutanese | 55 | 0.3% |
| Bolivian | 18 | 0.1% |
| British | 119 | 0.7% |
| Burmese | 71 | 0.4% |
| Central American | 46 | 0.3% |
| Cherokee | 27 | 0.2% |
| Cuban | 102 | 0.6% |
| Czech | 51 | 0.3% |
| Danish | 32 | 0.2% |
| Dutch | 231 | 1.3% |
| Eastern European | 56 | 0.3% |
| English | 2,539 | 14.5% |
| Ethiopian | 16 | 0.1% |
| European | 554 | 3.2% |
| French | 303 | 1.7% |
| French Canadian | 63 | 0.4% |
| German | 4,912 | 28.1% |
| Greek | 23 | 0.1% |
| Guatemalan | 46 | 0.3% |
| Hungarian | 6 | 0.0% |
| Indian (Asian) | 113 | 0.6% |
| Irish | 3,836 | 21.9% |
| Italian | 667 | 3.8% |
| Korean | 227 | 1.3% |
| Latvian | 174 | 1.0% |
| Lebanese | 186 | 1.1% |
| Mexican | 228 | 1.3% |
| Native Hawaiian | 5 | 0.0% |
| New Zealander | 42 | 0.2% |
| Nigerian | 12 | 0.1% |
| Northern European | 94 | 0.5% |
| Norwegian | 40 | 0.2% |
| Palestinian | 10 | 0.1% |
| Pennsylvania German | 8 | 0.1% |
| Peruvian | 7 | 0.0% |
| Polish | 200 | 1.1% |
| Portuguese | 19 | 0.1% |
| Potawatomi | 15 | 0.1% |
| Puerto Rican | 97 | 0.5% |
| Romanian | 9 | 0.1% |
| Russian | 145 | 0.8% |
| Samoan | 12 | 0.1% |
| Scandinavian | 61 | 0.4% |
| Scotch-Irish | 342 | 1.9% |
| Scottish | 668 | 3.8% |
| Slovak | 18 | 0.1% |
| South American | 65 | 0.4% |
| Sri Lankan | 55 | 0.3% |
| Subsaharan African | 101 | 0.6% |
| Swedish | 153 | 0.9% |
| Swiss | 88 | 0.5% |
| Syrian | 10 | 0.1% |
| Thai | 69 | 0.4% |
| Ukrainian | 39 | 0.2% |
| Venezuelan | 10 | 0.1% |
| Vietnamese | 52 | 0.3% |
| Welsh | 102 | 0.6% |
| West Indian | 12 | 0.1% |
| Yugoslavian | 7 | 0.0% | View All 66 Rows |
Immigrants in St Matthews
The most numerous immigrant groups reported in St Matthews came from Asia (476 | 2.7%), South Central Asia (215 | 1.2%), Latin America (153 | 0.9%), Eastern Asia (114 | 0.6%), and Philippines (111 | 0.6%), together accounting for 6.1% of all St Matthews residents.
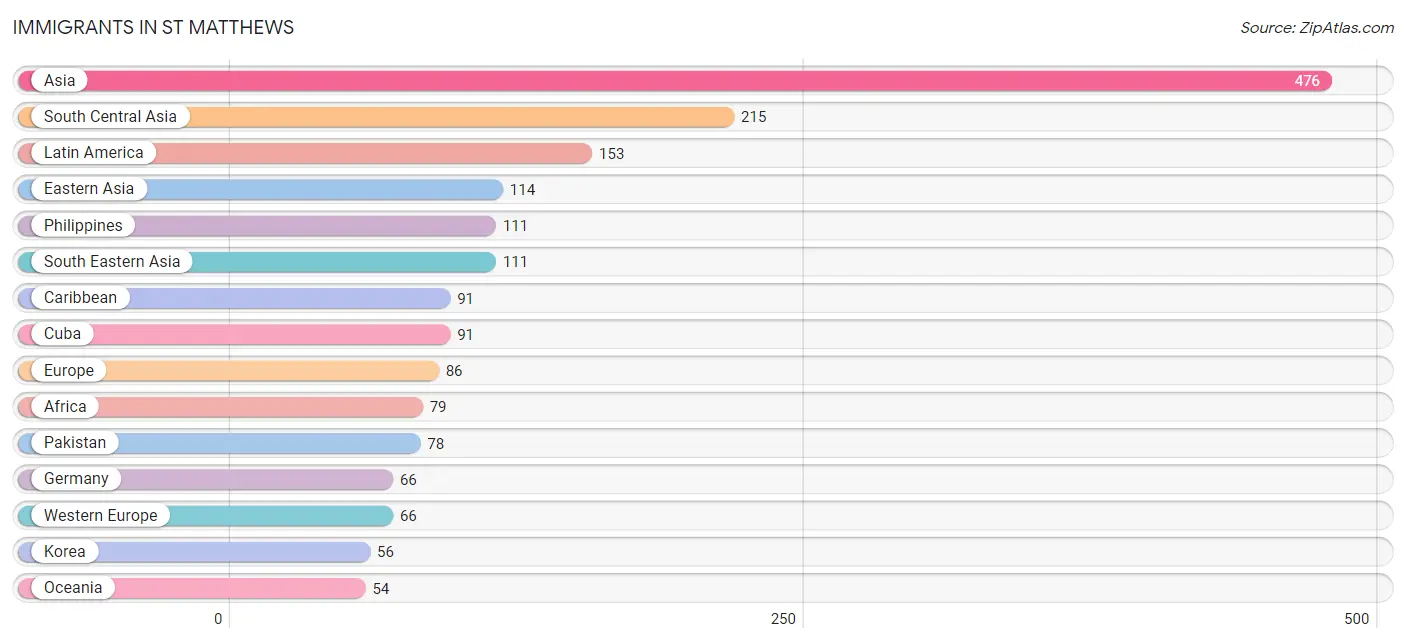
| Immigration Origin | # Population | % Population |
| Africa | 79 | 0.4% |
| Argentina | 13 | 0.1% |
| Asia | 476 | 2.7% |
| Bangladesh | 52 | 0.3% |
| Bosnia and Herzegovina | 7 | 0.0% |
| Brazil | 10 | 0.1% |
| Caribbean | 91 | 0.5% |
| Central America | 29 | 0.2% |
| China | 43 | 0.3% |
| Cuba | 91 | 0.5% |
| Eastern Africa | 13 | 0.1% |
| Eastern Asia | 114 | 0.6% |
| Eastern Europe | 7 | 0.0% |
| Ethiopia | 13 | 0.1% |
| Europe | 86 | 0.5% |
| Germany | 66 | 0.4% |
| India | 50 | 0.3% |
| Japan | 15 | 0.1% |
| Korea | 56 | 0.3% |
| Kuwait | 10 | 0.1% |
| Latin America | 153 | 0.9% |
| Mexico | 29 | 0.2% |
| Nepal | 35 | 0.2% |
| Northern Europe | 13 | 0.1% |
| Oceania | 54 | 0.3% |
| Pakistan | 78 | 0.4% |
| Philippines | 111 | 0.6% |
| Saudi Arabia | 26 | 0.2% |
| South Africa | 54 | 0.3% |
| South America | 33 | 0.2% |
| South Central Asia | 215 | 1.2% |
| South Eastern Asia | 111 | 0.6% |
| Venezuela | 10 | 0.1% |
| Western Africa | 12 | 0.1% |
| Western Asia | 36 | 0.2% |
| Western Europe | 66 | 0.4% | View All 36 Rows |
Sex and Age in St Matthews
Sex and Age in St Matthews
The most populous age groups in St Matthews are 30 to 34 Years (1,111 | 13.6%) for men and 25 to 29 Years (1,185 | 12.7%) for women.
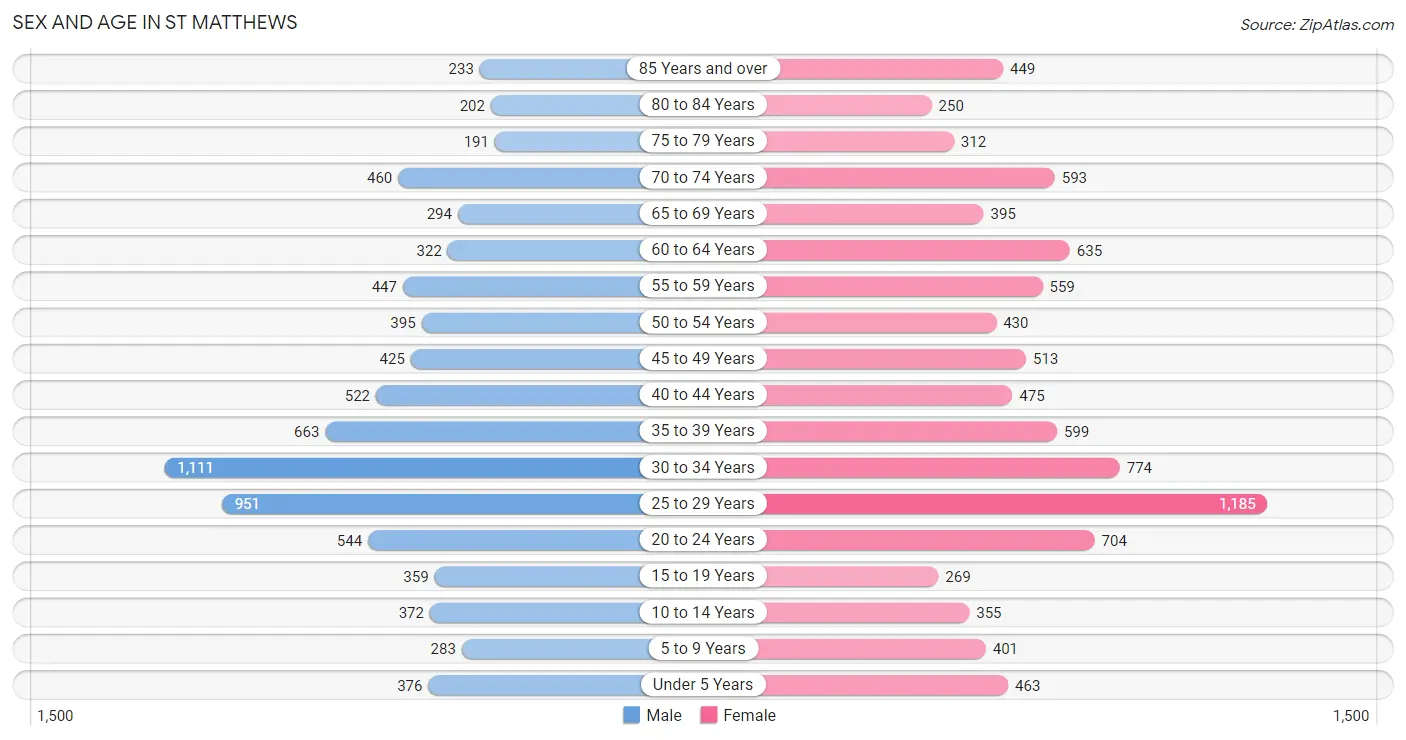
| Age Bracket | Male | Female |
| Under 5 Years | 376 (4.6%) | 463 (5.0%) |
| 5 to 9 Years | 283 (3.5%) | 401 (4.3%) |
| 10 to 14 Years | 372 (4.6%) | 355 (3.8%) |
| 15 to 19 Years | 359 (4.4%) | 269 (2.9%) |
| 20 to 24 Years | 544 (6.7%) | 704 (7.5%) |
| 25 to 29 Years | 951 (11.7%) | 1,185 (12.7%) |
| 30 to 34 Years | 1,111 (13.6%) | 774 (8.3%) |
| 35 to 39 Years | 663 (8.1%) | 599 (6.4%) |
| 40 to 44 Years | 522 (6.4%) | 475 (5.1%) |
| 45 to 49 Years | 425 (5.2%) | 513 (5.5%) |
| 50 to 54 Years | 395 (4.9%) | 430 (4.6%) |
| 55 to 59 Years | 447 (5.5%) | 559 (6.0%) |
| 60 to 64 Years | 322 (4.0%) | 635 (6.8%) |
| 65 to 69 Years | 294 (3.6%) | 395 (4.2%) |
| 70 to 74 Years | 460 (5.6%) | 593 (6.3%) |
| 75 to 79 Years | 191 (2.3%) | 312 (3.3%) |
| 80 to 84 Years | 202 (2.5%) | 250 (2.7%) |
| 85 Years and over | 233 (2.9%) | 449 (4.8%) |
| Total | 8,150 (100.0%) | 9,361 (100.0%) |
Families and Households in St Matthews
Median Family Size in St Matthews
The median family size in St Matthews is 2.68 persons per family, with married-couple families (3,199 | 76.7%) accounting for the largest median family size of 2.8 persons per family. On the other hand, single female/mother families (641 | 15.4%) represent the smallest median family size with 2.20 persons per family.
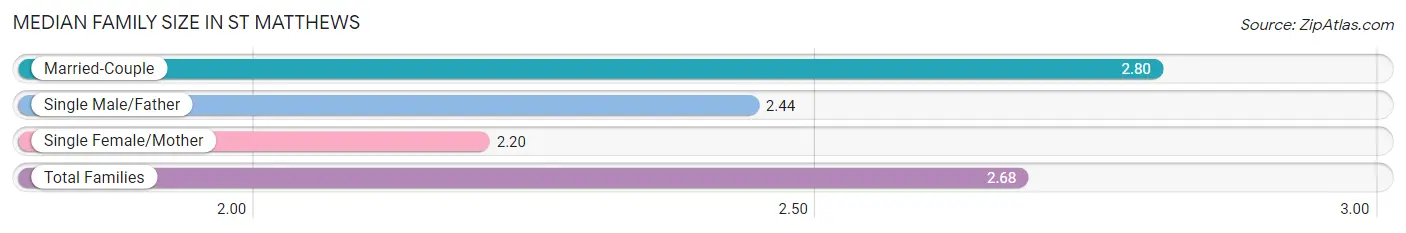
| Family Type | # Families | Family Size |
| Married-Couple | 3,199 (76.7%) | 2.80 |
| Single Male/Father | 333 (8.0%) | 2.44 |
| Single Female/Mother | 641 (15.4%) | 2.20 |
| Total Families | 4,173 (100.0%) | 2.68 |
Median Household Size in St Matthews
The median household size in St Matthews is 1.97 persons per household, with married-couple households (3,199 | 36.6%) accounting for the largest median household size of 2.82 persons per household. non-family households (4,564 | 52.2%) represent the smallest median household size with 1.29 persons per household.
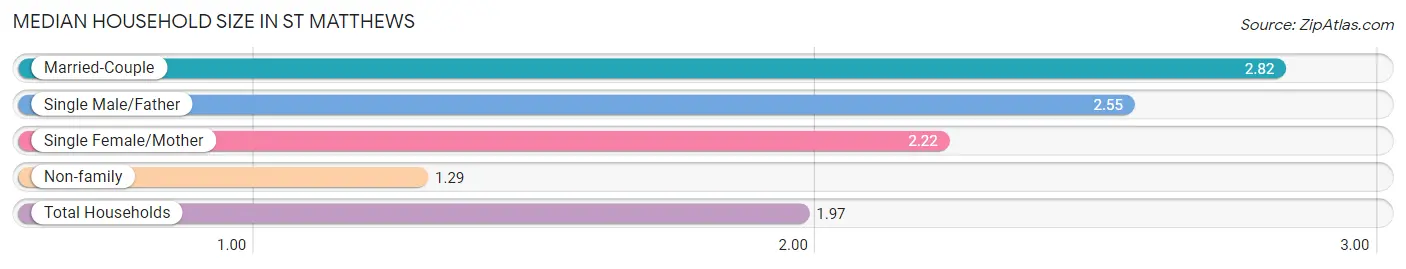
| Household Type | # Households | Household Size |
| Married-Couple | 3,199 (36.6%) | 2.82 |
| Single Male/Father | 333 (3.8%) | 2.55 |
| Single Female/Mother | 641 (7.3%) | 2.22 |
| Non-family | 4,564 (52.2%) | 1.29 |
| Total Households | 8,737 (100.0%) | 1.97 |
Household Size by Marriage Status in St Matthews
Out of a total of 8,737 households in St Matthews, 4,173 (47.8%) are family households, while 4,564 (52.2%) are nonfamily households. The most numerous type of family households are 2-person households, comprising 2,434, and the most common type of nonfamily households are 1-person households, comprising 3,559.
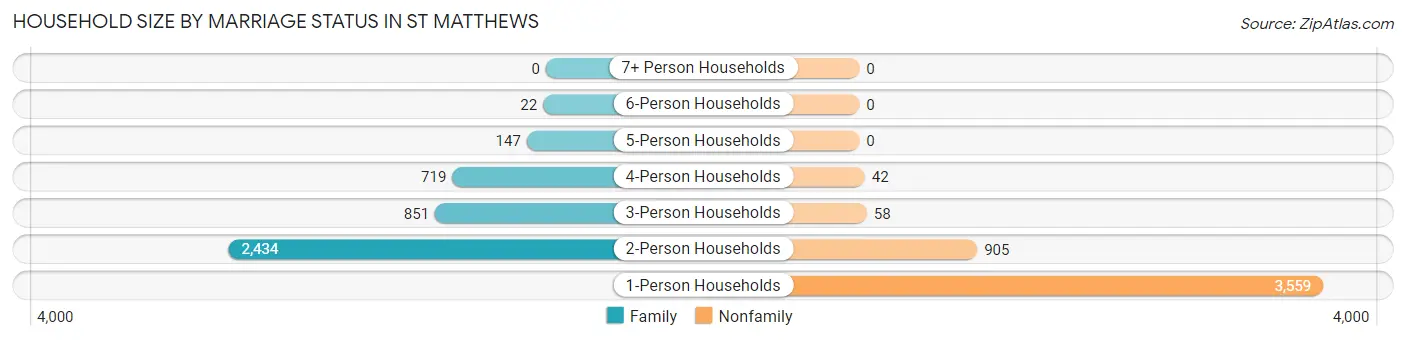
| Household Size | Family Households | Nonfamily Households |
| 1-Person Households | - | 3,559 (40.7%) |
| 2-Person Households | 2,434 (27.9%) | 905 (10.4%) |
| 3-Person Households | 851 (9.7%) | 58 (0.7%) |
| 4-Person Households | 719 (8.2%) | 42 (0.5%) |
| 5-Person Households | 147 (1.7%) | 0 (0.0%) |
| 6-Person Households | 22 (0.3%) | 0 (0.0%) |
| 7+ Person Households | 0 (0.0%) | 0 (0.0%) |
| Total | 4,173 (47.8%) | 4,564 (52.2%) |
Female Fertility in St Matthews
Fertility by Age in St Matthews
Average fertility rate in St Matthews is 41.0 births per 1,000 women. Women in the age bracket of 35 to 50 years have the highest fertility rate with 61.0 births per 1,000 women. Women in the age bracket of 35 to 50 years acount for 54.7% of all women with births.
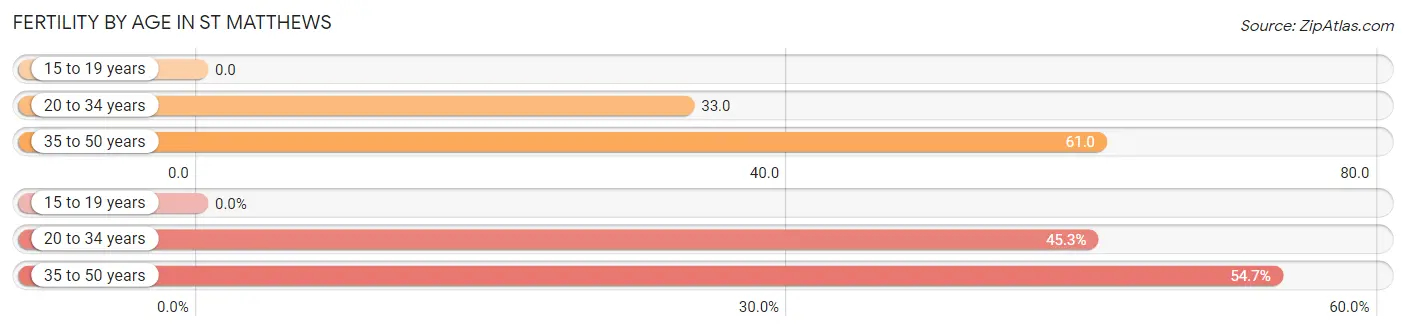
| Age Bracket | Women with Births | Births / 1,000 Women |
| 15 to 19 years | 0 (0.0%) | 0.0 |
| 20 to 34 years | 87 (45.3%) | 33.0 |
| 35 to 50 years | 105 (54.7%) | 61.0 |
| Total | 192 (100.0%) | 41.0 |
Fertility by Age by Marriage Status in St Matthews
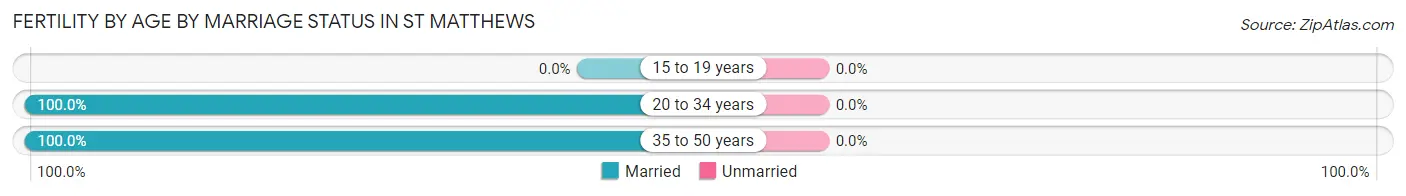
| Age Bracket | Married | Unmarried |
| 15 to 19 years | 0 (0.0%) | 0 (0.0%) |
| 20 to 34 years | 87 (100.0%) | 0 (0.0%) |
| 35 to 50 years | 105 (100.0%) | 0 (0.0%) |
| Total | 192 (100.0%) | 0 (0.0%) |
Fertility by Education in St Matthews
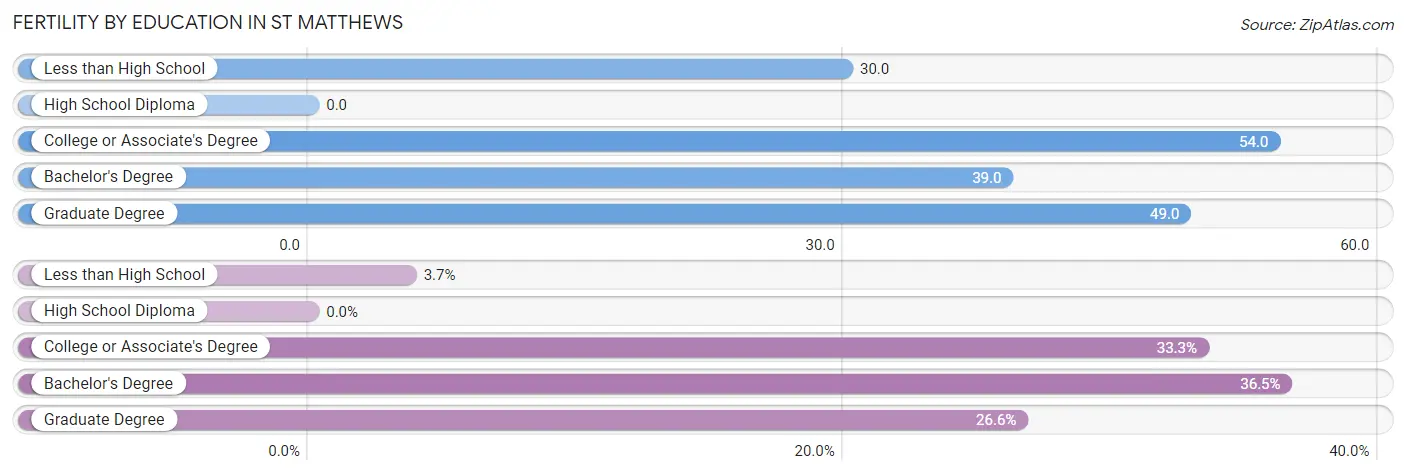
| Educational Attainment | Women with Births | Births / 1,000 Women |
| Less than High School | 7 (3.6%) | 30.0 |
| High School Diploma | 0 (0.0%) | 0.0 |
| College or Associate's Degree | 64 (33.3%) | 54.0 |
| Bachelor's Degree | 70 (36.5%) | 39.0 |
| Graduate Degree | 51 (26.6%) | 49.0 |
| Total | 192 (100.0%) | 41.0 |
Fertility by Education by Marriage Status in St Matthews
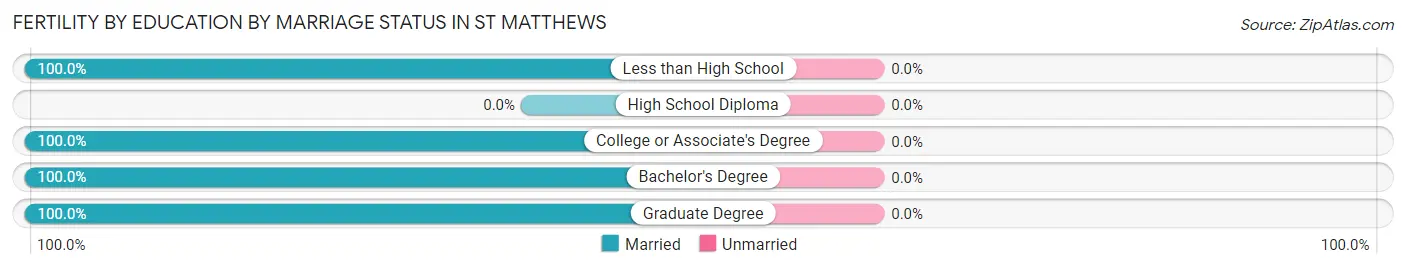
| Educational Attainment | Married | Unmarried |
| Less than High School | 7 (100.0%) | 0 (0.0%) |
| High School Diploma | 0 (0.0%) | 0 (0.0%) |
| College or Associate's Degree | 64 (100.0%) | 0 (0.0%) |
| Bachelor's Degree | 70 (100.0%) | 0 (0.0%) |
| Graduate Degree | 51 (100.0%) | 0 (0.0%) |
| Total | 192 (100.0%) | 0 (0.0%) |
Employment Characteristics in St Matthews
Employment by Class of Employer in St Matthews
Among the 10,324 employed individuals in St Matthews, private company employees (7,187 | 69.6%), not-for-profit organizations (1,258 | 12.2%), and local government employees (479 | 4.6%) make up the most common classes of employment.
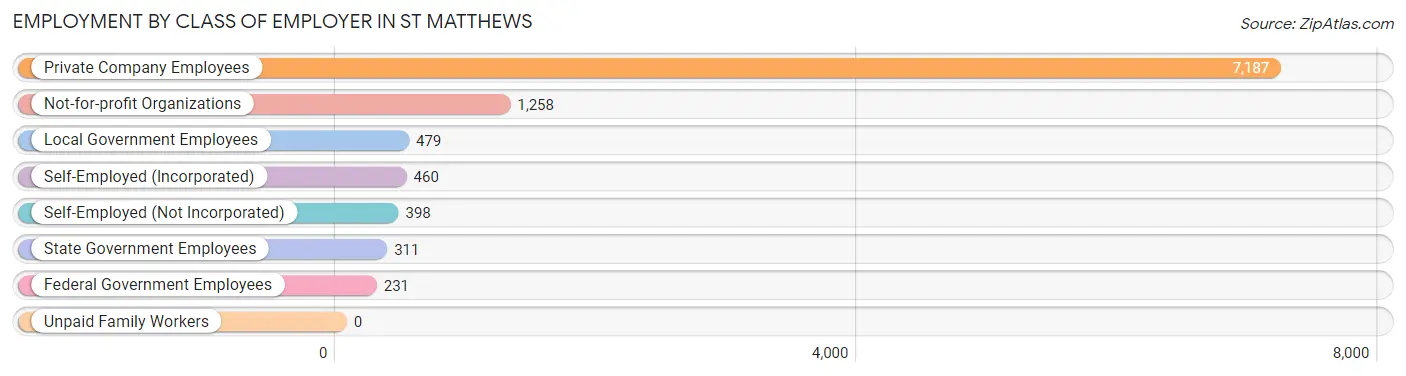
| Employer Class | # Employees | % Employees |
| Private Company Employees | 7,187 | 69.6% |
| Self-Employed (Incorporated) | 460 | 4.5% |
| Self-Employed (Not Incorporated) | 398 | 3.9% |
| Not-for-profit Organizations | 1,258 | 12.2% |
| Local Government Employees | 479 | 4.6% |
| State Government Employees | 311 | 3.0% |
| Federal Government Employees | 231 | 2.2% |
| Unpaid Family Workers | 0 | 0.0% |
| Total | 10,324 | 100.0% |
Employment Status by Age in St Matthews
According to the labor force statistics for St Matthews, out of the total population over 16 years of age (15,135), 72.2% or 10,927 individuals are in the labor force, with 3.7% or 404 of them unemployed. The age group with the highest labor force participation rate is 30 to 34 years, with 93.5% or 1,762 individuals in the labor force. Within the labor force, the 55 to 59 years age range has the highest percentage of unemployed individuals, with 9.9% or 90 of them being unemployed.
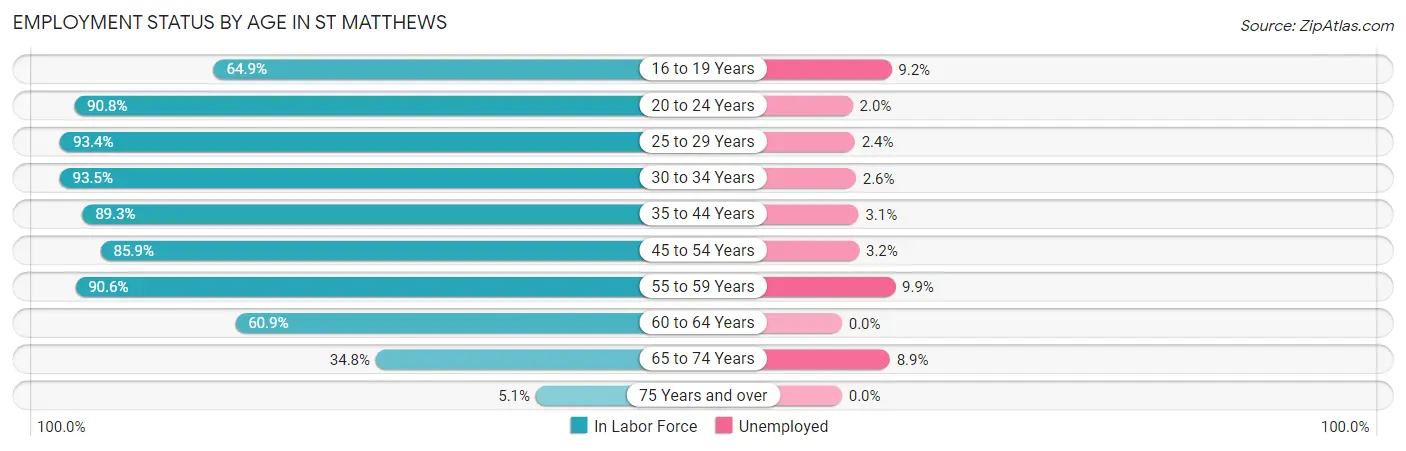
| Age Bracket | In Labor Force | Unemployed |
| 16 to 19 Years | 326 (64.9%) | 30 (9.2%) |
| 20 to 24 Years | 1,133 (90.8%) | 23 (2.0%) |
| 25 to 29 Years | 1,995 (93.4%) | 48 (2.4%) |
| 30 to 34 Years | 1,762 (93.5%) | 46 (2.6%) |
| 35 to 44 Years | 2,017 (89.3%) | 63 (3.1%) |
| 45 to 54 Years | 1,514 (85.9%) | 48 (3.2%) |
| 55 to 59 Years | 911 (90.6%) | 90 (9.9%) |
| 60 to 64 Years | 583 (60.9%) | 0 (0.0%) |
| 65 to 74 Years | 606 (34.8%) | 54 (8.9%) |
| 75 Years and over | 83 (5.1%) | 0 (0.0%) |
| Total | 10,927 (72.2%) | 404 (3.7%) |
Employment Status by Educational Attainment in St Matthews
According to labor force statistics for St Matthews, 87.8% of individuals (8,785) out of the total population between 25 and 64 years of age (10,006) are in the labor force, with 3.4% or 299 of them being unemployed. The group with the highest labor force participation rate are those with the educational attainment of bachelor's degree or higher, with 91.1% or 5,724 individuals in the labor force. Within the labor force, individuals with high school diploma education have the highest percentage of unemployment, with 8.9% or 51 of them being unemployed.
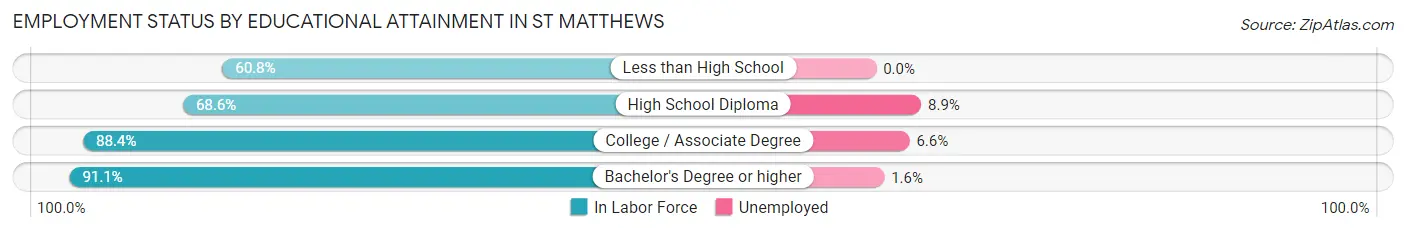
| Educational Attainment | In Labor Force | Unemployed |
| Less than High School | 141 (60.8%) | 0 (0.0%) |
| High School Diploma | 570 (68.6%) | 74 (8.9%) |
| College / Associate Degree | 2,351 (88.4%) | 176 (6.6%) |
| Bachelor's Degree or higher | 5,724 (91.1%) | 101 (1.6%) |
| Total | 8,785 (87.8%) | 340 (3.4%) |
Employment Occupations by Sex in St Matthews
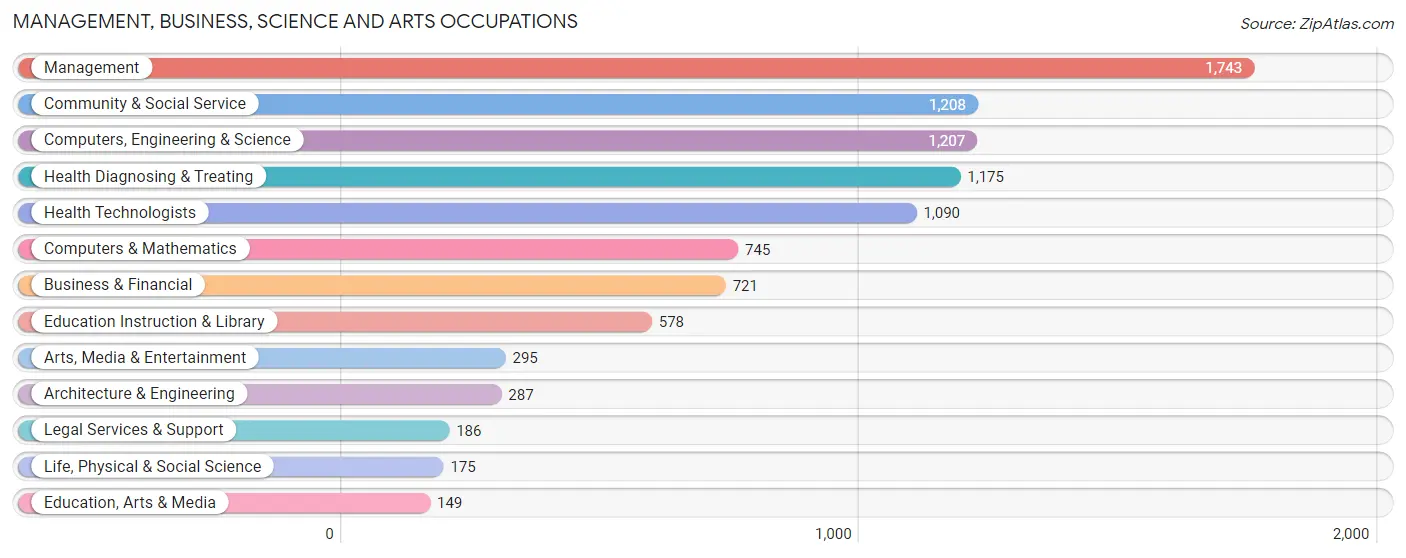
Management, Business, Science and Arts Occupations
The most common Management, Business, Science and Arts occupations in St Matthews are Management (1,743 | 16.7%), Community & Social Service (1,208 | 11.6%), Computers, Engineering & Science (1,207 | 11.6%), Health Diagnosing & Treating (1,175 | 11.2%), and Health Technologists (1,090 | 10.4%).
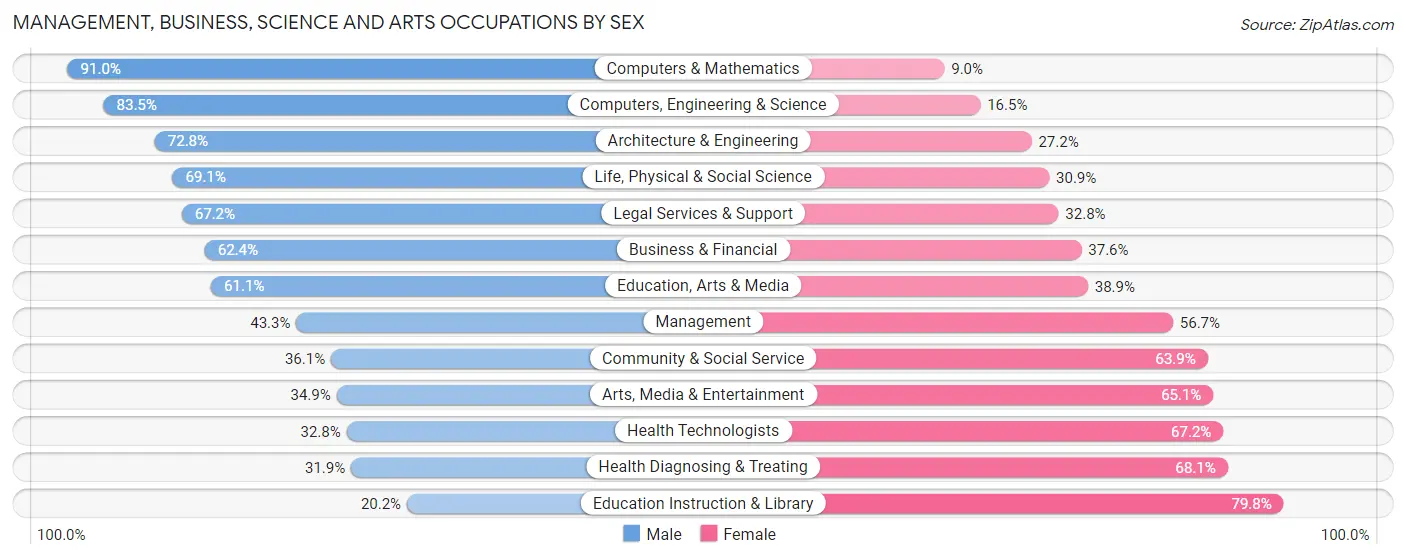
Management, Business, Science and Arts Occupations by Sex
Within the Management, Business, Science and Arts occupations in St Matthews, the most male-oriented occupations are Computers & Mathematics (91.0%), Computers, Engineering & Science (83.5%), and Architecture & Engineering (72.8%), while the most female-oriented occupations are Education Instruction & Library (79.8%), Health Diagnosing & Treating (68.1%), and Health Technologists (67.2%).
| Occupation | Male | Female |
| Management | 755 (43.3%) | 988 (56.7%) |
| Business & Financial | 450 (62.4%) | 271 (37.6%) |
| Computers, Engineering & Science | 1,008 (83.5%) | 199 (16.5%) |
| Computers & Mathematics | 678 (91.0%) | 67 (9.0%) |
| Architecture & Engineering | 209 (72.8%) | 78 (27.2%) |
| Life, Physical & Social Science | 121 (69.1%) | 54 (30.9%) |
| Community & Social Service | 436 (36.1%) | 772 (63.9%) |
| Education, Arts & Media | 91 (61.1%) | 58 (38.9%) |
| Legal Services & Support | 125 (67.2%) | 61 (32.8%) |
| Education Instruction & Library | 117 (20.2%) | 461 (79.8%) |
| Arts, Media & Entertainment | 103 (34.9%) | 192 (65.1%) |
| Health Diagnosing & Treating | 375 (31.9%) | 800 (68.1%) |
| Health Technologists | 358 (32.8%) | 732 (67.2%) |
| Total (Category) | 3,024 (49.9%) | 3,030 (50.0%) |
| Total (Overall) | 5,123 (49.0%) | 5,327 (51.0%) |
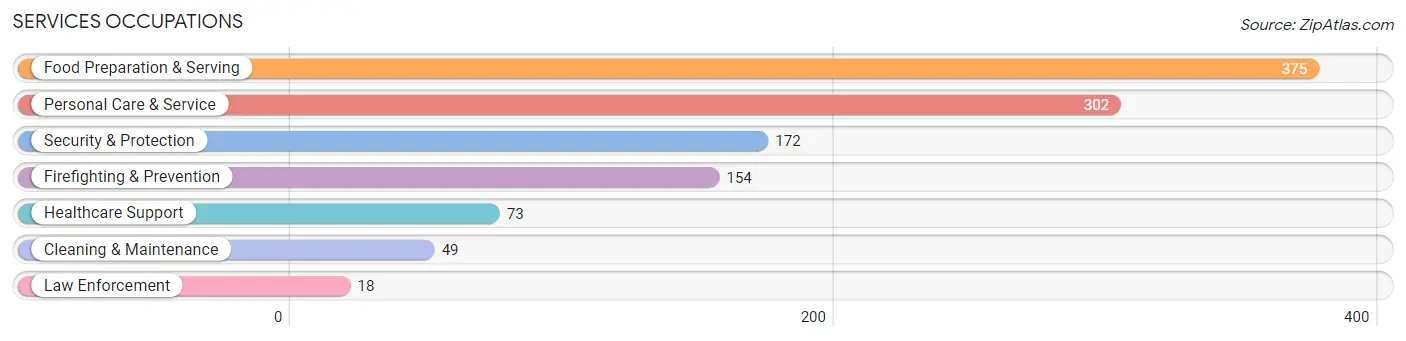
Services Occupations
The most common Services occupations in St Matthews are Food Preparation & Serving (375 | 3.6%), Personal Care & Service (302 | 2.9%), Security & Protection (172 | 1.7%), Firefighting & Prevention (154 | 1.5%), and Healthcare Support (73 | 0.7%).
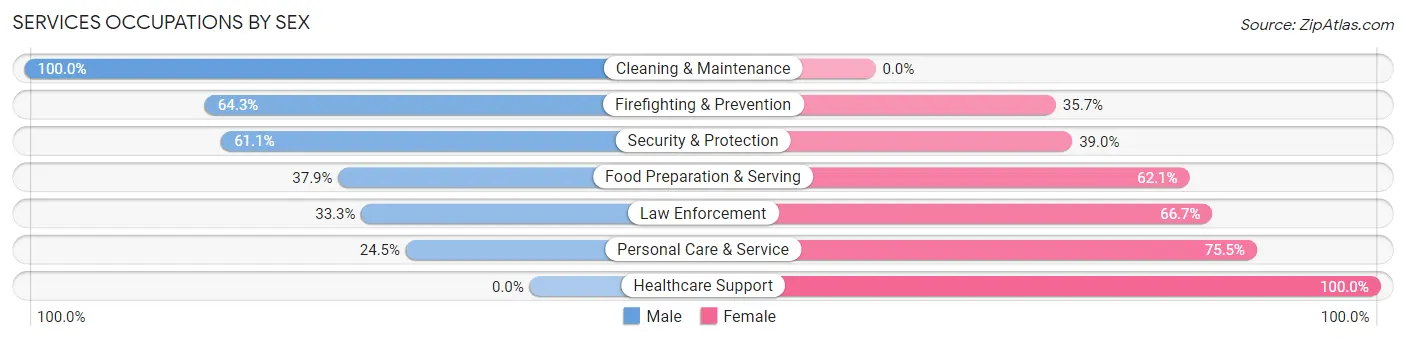
Services Occupations by Sex
Within the Services occupations in St Matthews, the most male-oriented occupations are Cleaning & Maintenance (100.0%), Firefighting & Prevention (64.3%), and Security & Protection (61.1%), while the most female-oriented occupations are Healthcare Support (100.0%), Personal Care & Service (75.5%), and Law Enforcement (66.7%).
| Occupation | Male | Female |
| Healthcare Support | 0 (0.0%) | 73 (100.0%) |
| Security & Protection | 105 (61.1%) | 67 (39.0%) |
| Firefighting & Prevention | 99 (64.3%) | 55 (35.7%) |
| Law Enforcement | 6 (33.3%) | 12 (66.7%) |
| Food Preparation & Serving | 142 (37.9%) | 233 (62.1%) |
| Cleaning & Maintenance | 49 (100.0%) | 0 (0.0%) |
| Personal Care & Service | 74 (24.5%) | 228 (75.5%) |
| Total (Category) | 370 (38.1%) | 601 (61.9%) |
| Total (Overall) | 5,123 (49.0%) | 5,327 (51.0%) |
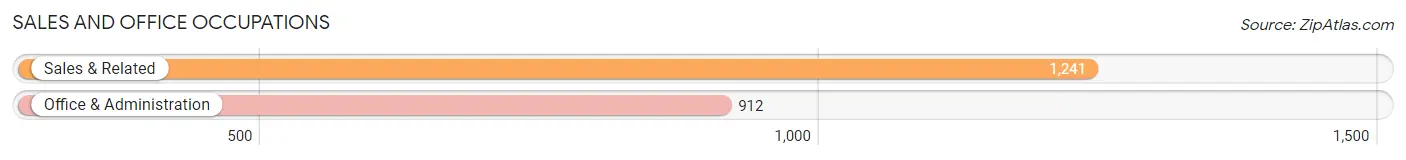
Sales and Office Occupations
The most common Sales and Office occupations in St Matthews are Sales & Related (1,241 | 11.9%), and Office & Administration (912 | 8.7%).
Sales and Office Occupations by Sex
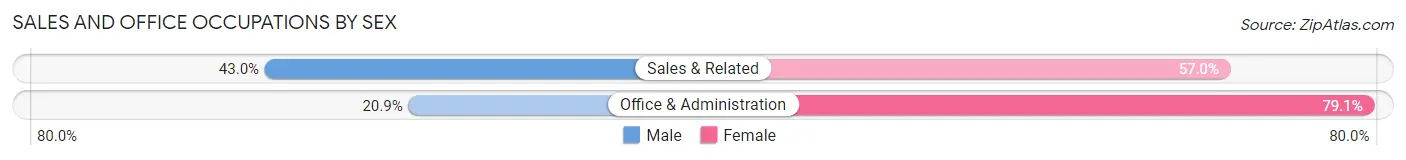
| Occupation | Male | Female |
| Sales & Related | 534 (43.0%) | 707 (57.0%) |
| Office & Administration | 191 (20.9%) | 721 (79.1%) |
| Total (Category) | 725 (33.7%) | 1,428 (66.3%) |
| Total (Overall) | 5,123 (49.0%) | 5,327 (51.0%) |
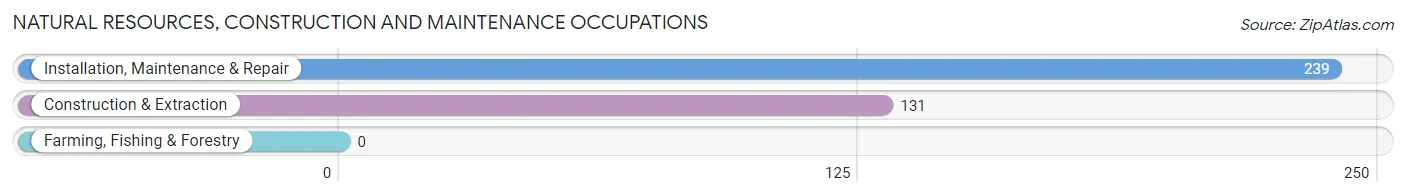
Natural Resources, Construction and Maintenance Occupations
The most common Natural Resources, Construction and Maintenance occupations in St Matthews are Installation, Maintenance & Repair (239 | 2.3%), and Construction & Extraction (131 | 1.3%).
Natural Resources, Construction and Maintenance Occupations by Sex
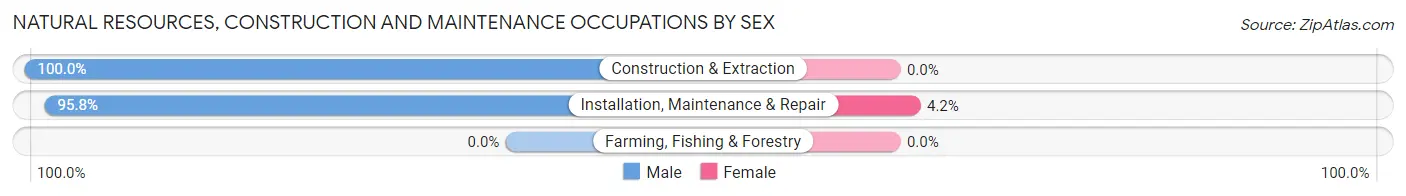
| Occupation | Male | Female |
| Farming, Fishing & Forestry | 0 (0.0%) | 0 (0.0%) |
| Construction & Extraction | 131 (100.0%) | 0 (0.0%) |
| Installation, Maintenance & Repair | 229 (95.8%) | 10 (4.2%) |
| Total (Category) | 360 (97.3%) | 10 (2.7%) |
| Total (Overall) | 5,123 (49.0%) | 5,327 (51.0%) |
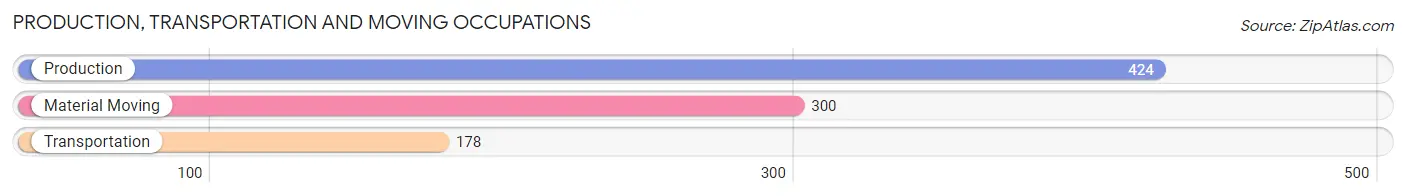
Production, Transportation and Moving Occupations
The most common Production, Transportation and Moving occupations in St Matthews are Production (424 | 4.1%), Material Moving (300 | 2.9%), and Transportation (178 | 1.7%).
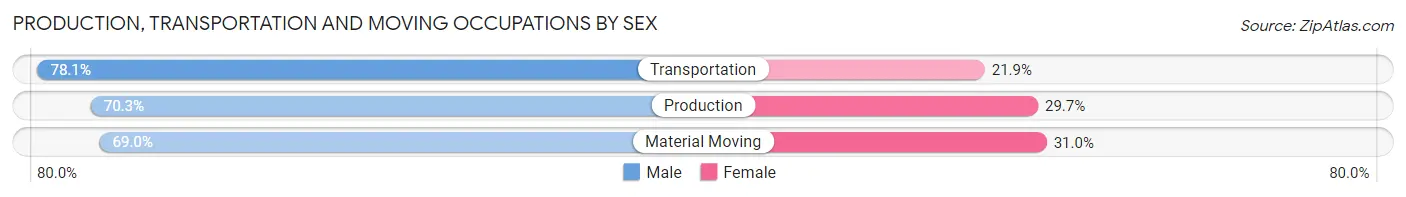
Production, Transportation and Moving Occupations by Sex
| Occupation | Male | Female |
| Production | 298 (70.3%) | 126 (29.7%) |
| Transportation | 139 (78.1%) | 39 (21.9%) |
| Material Moving | 207 (69.0%) | 93 (31.0%) |
| Total (Category) | 644 (71.4%) | 258 (28.6%) |
| Total (Overall) | 5,123 (49.0%) | 5,327 (51.0%) |
Employment Industries by Sex in St Matthews
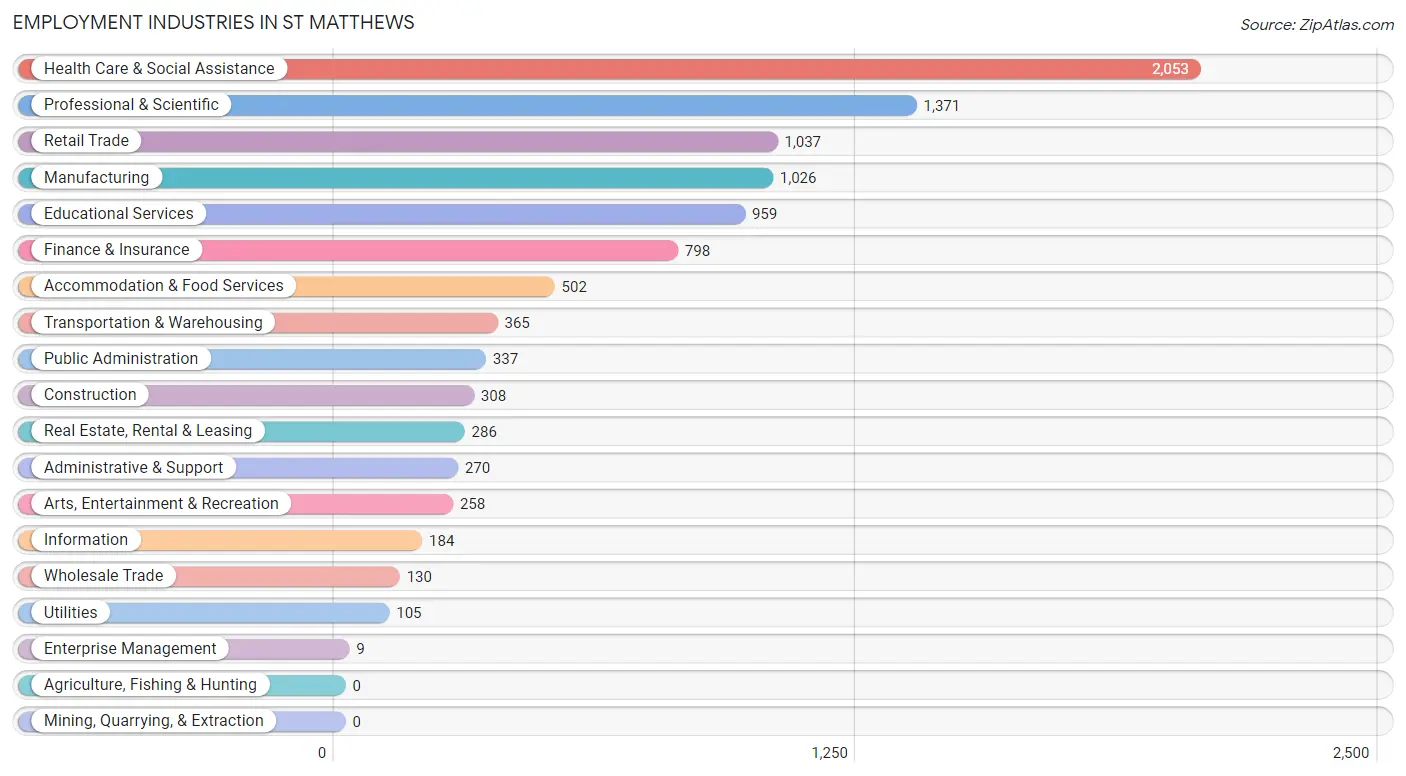
Employment Industries in St Matthews
The major employment industries in St Matthews include Health Care & Social Assistance (2,053 | 19.7%), Professional & Scientific (1,371 | 13.1%), Retail Trade (1,037 | 9.9%), Manufacturing (1,026 | 9.8%), and Educational Services (959 | 9.2%).
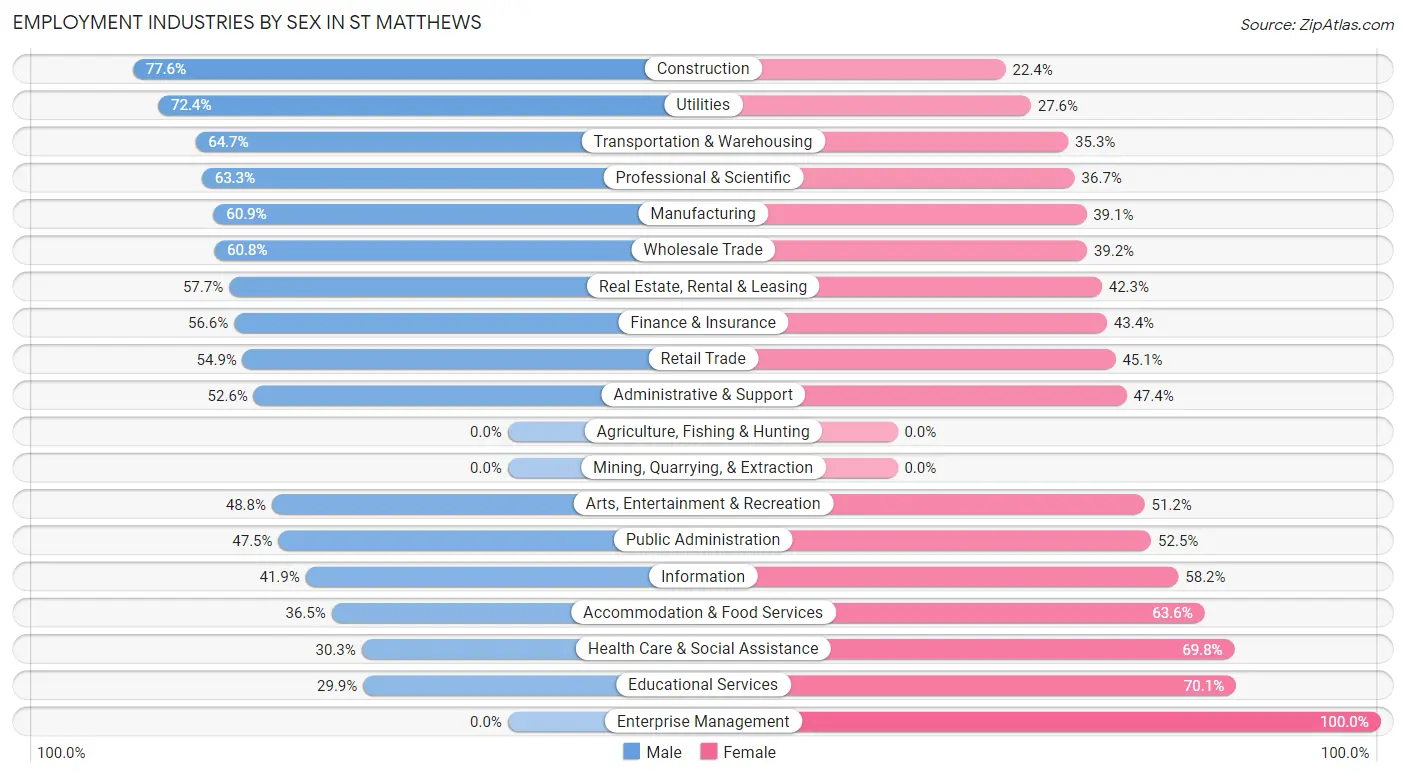
Employment Industries by Sex in St Matthews
The St Matthews industries that see more men than women are Construction (77.6%), Utilities (72.4%), and Transportation & Warehousing (64.7%), whereas the industries that tend to have a higher number of women are Enterprise Management (100.0%), Educational Services (70.1%), and Health Care & Social Assistance (69.8%).
| Industry | Male | Female |
| Agriculture, Fishing & Hunting | 0 (0.0%) | 0 (0.0%) |
| Mining, Quarrying, & Extraction | 0 (0.0%) | 0 (0.0%) |
| Construction | 239 (77.6%) | 69 (22.4%) |
| Manufacturing | 625 (60.9%) | 401 (39.1%) |
| Wholesale Trade | 79 (60.8%) | 51 (39.2%) |
| Retail Trade | 569 (54.9%) | 468 (45.1%) |
| Transportation & Warehousing | 236 (64.7%) | 129 (35.3%) |
| Utilities | 76 (72.4%) | 29 (27.6%) |
| Information | 77 (41.8%) | 107 (58.2%) |
| Finance & Insurance | 452 (56.6%) | 346 (43.4%) |
| Real Estate, Rental & Leasing | 165 (57.7%) | 121 (42.3%) |
| Professional & Scientific | 868 (63.3%) | 503 (36.7%) |
| Enterprise Management | 0 (0.0%) | 9 (100.0%) |
| Administrative & Support | 142 (52.6%) | 128 (47.4%) |
| Educational Services | 287 (29.9%) | 672 (70.1%) |
| Health Care & Social Assistance | 621 (30.2%) | 1,432 (69.8%) |
| Arts, Entertainment & Recreation | 126 (48.8%) | 132 (51.2%) |
| Accommodation & Food Services | 183 (36.4%) | 319 (63.5%) |
| Public Administration | 160 (47.5%) | 177 (52.5%) |
| Total | 5,123 (49.0%) | 5,327 (51.0%) |
Education in St Matthews
School Enrollment in St Matthews
The most common levels of schooling among the 2,895 students in St Matthews are middle school (611 | 21.1%), high school (491 | 17.0%), and elementary school (476 | 16.4%).
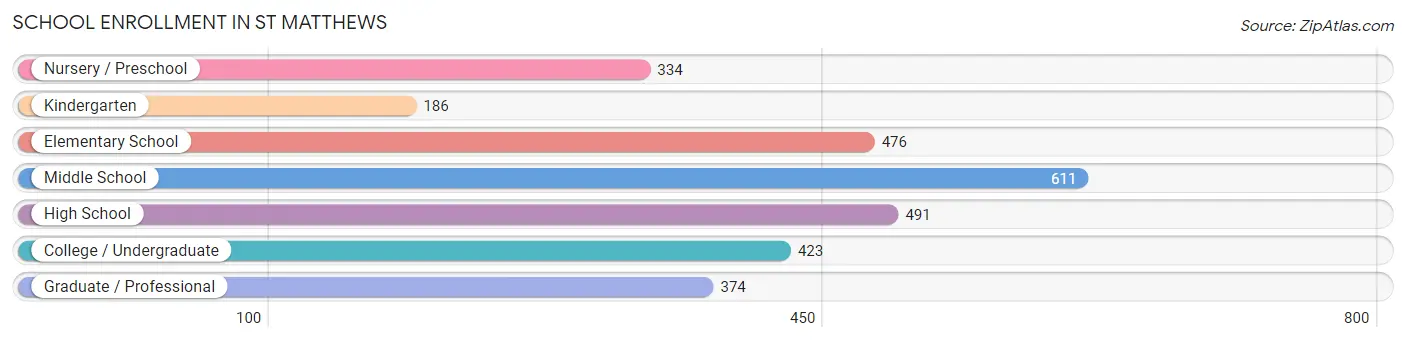
| School Level | # Students | % Students |
| Nursery / Preschool | 334 | 11.5% |
| Kindergarten | 186 | 6.4% |
| Elementary School | 476 | 16.4% |
| Middle School | 611 | 21.1% |
| High School | 491 | 17.0% |
| College / Undergraduate | 423 | 14.6% |
| Graduate / Professional | 374 | 12.9% |
| Total | 2,895 | 100.0% |
School Enrollment by Age by Funding Source in St Matthews
Out of a total of 2,895 students who are enrolled in schools in St Matthews, 1,277 (44.1%) attend a private institution, while the remaining 1,618 (55.9%) are enrolled in public schools. The age group of 3 to 4 year olds has the highest likelihood of being enrolled in private schools, with 177 (69.7% in the age bracket) enrolled. Conversely, the age group of 18 to 19 year olds has the lowest likelihood of being enrolled in a private school, with 124 (87.9% in the age bracket) attending a public institution.
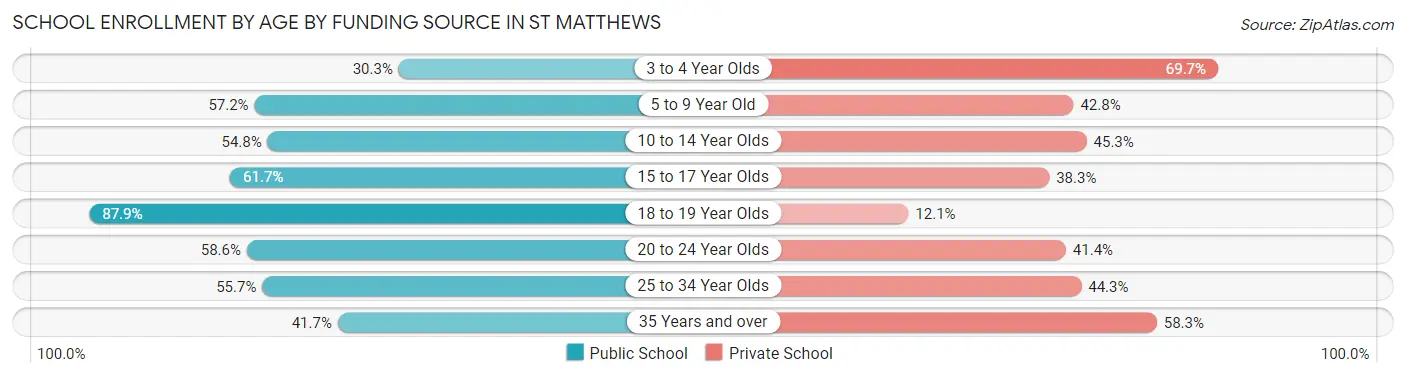
| Age Bracket | Public School | Private School |
| 3 to 4 Year Olds | 77 (30.3%) | 177 (69.7%) |
| 5 to 9 Year Old | 378 (57.2%) | 283 (42.8%) |
| 10 to 14 Year Olds | 398 (54.7%) | 329 (45.3%) |
| 15 to 17 Year Olds | 253 (61.7%) | 157 (38.3%) |
| 18 to 19 Year Olds | 124 (87.9%) | 17 (12.1%) |
| 20 to 24 Year Olds | 160 (58.6%) | 113 (41.4%) |
| 25 to 34 Year Olds | 199 (55.7%) | 158 (44.3%) |
| 35 Years and over | 30 (41.7%) | 42 (58.3%) |
| Total | 1,618 (55.9%) | 1,277 (44.1%) |
Educational Attainment by Field of Study in St Matthews
Business (1,508 | 17.9%), science & technology (794 | 9.4%), social sciences (676 | 8.0%), literature & languages (639 | 7.6%), and liberal arts & history (628 | 7.4%) are the most common fields of study among 8,429 individuals in St Matthews who have obtained a bachelor's degree or higher.
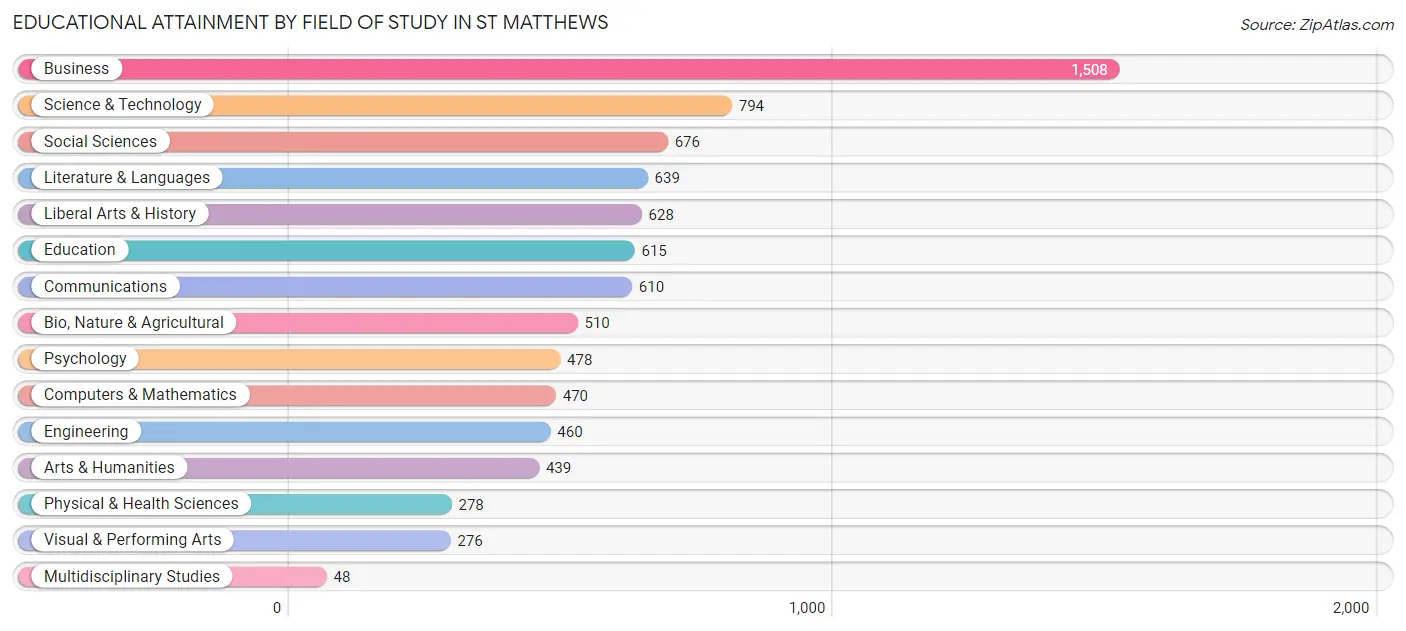
| Field of Study | # Graduates | % Graduates |
| Computers & Mathematics | 470 | 5.6% |
| Bio, Nature & Agricultural | 510 | 6.0% |
| Physical & Health Sciences | 278 | 3.3% |
| Psychology | 478 | 5.7% |
| Social Sciences | 676 | 8.0% |
| Engineering | 460 | 5.5% |
| Multidisciplinary Studies | 48 | 0.6% |
| Science & Technology | 794 | 9.4% |
| Business | 1,508 | 17.9% |
| Education | 615 | 7.3% |
| Literature & Languages | 639 | 7.6% |
| Liberal Arts & History | 628 | 7.4% |
| Visual & Performing Arts | 276 | 3.3% |
| Communications | 610 | 7.2% |
| Arts & Humanities | 439 | 5.2% |
| Total | 8,429 | 100.0% |
Transportation & Commute in St Matthews
Vehicle Availability by Sex in St Matthews
The most prevalent vehicle ownership categories in St Matthews are males with 2 vehicles (2,643, accounting for 51.5%) and females with 2 vehicles (2,642, making up 51.0%).
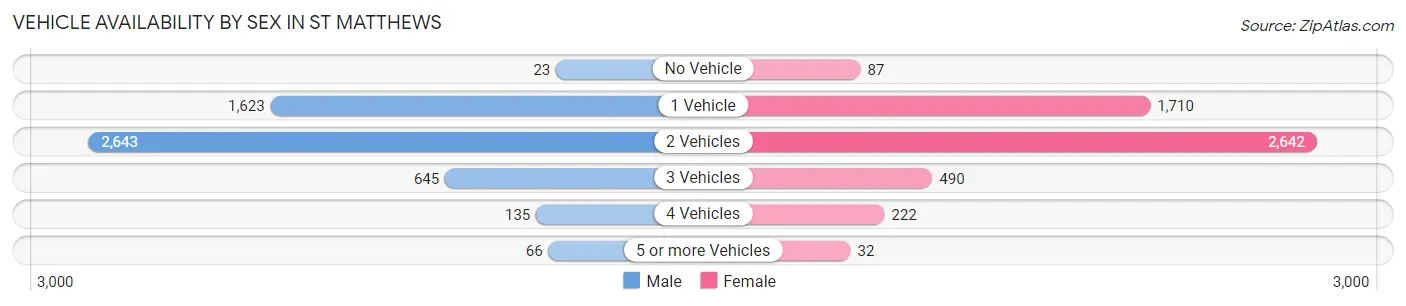
| Vehicles Available | Male | Female |
| No Vehicle | 23 (0.4%) | 87 (1.7%) |
| 1 Vehicle | 1,623 (31.6%) | 1,710 (33.0%) |
| 2 Vehicles | 2,643 (51.5%) | 2,642 (51.0%) |
| 3 Vehicles | 645 (12.6%) | 490 (9.5%) |
| 4 Vehicles | 135 (2.6%) | 222 (4.3%) |
| 5 or more Vehicles | 66 (1.3%) | 32 (0.6%) |
| Total | 5,135 (100.0%) | 5,183 (100.0%) |
Commute Time in St Matthews
The most frequently occuring commute durations in St Matthews are 15 to 19 minutes (2,700 commuters, 30.0%), 20 to 24 minutes (2,337 commuters, 26.0%), and 10 to 14 minutes (1,183 commuters, 13.2%).
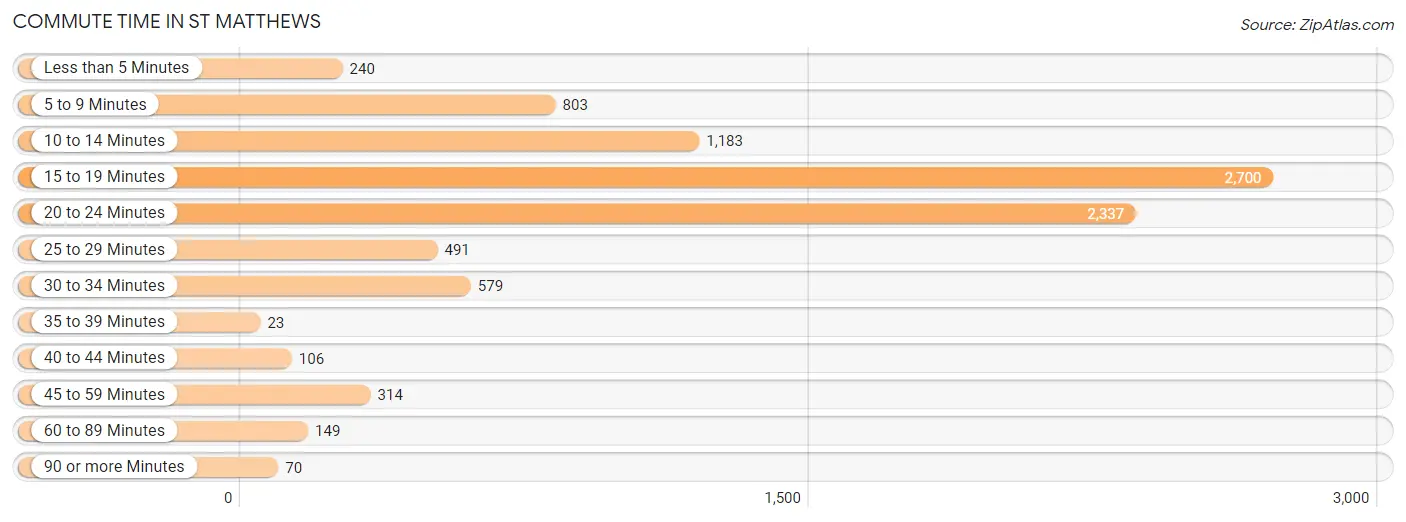
| Commute Time | # Commuters | % Commuters |
| Less than 5 Minutes | 240 | 2.7% |
| 5 to 9 Minutes | 803 | 8.9% |
| 10 to 14 Minutes | 1,183 | 13.2% |
| 15 to 19 Minutes | 2,700 | 30.0% |
| 20 to 24 Minutes | 2,337 | 26.0% |
| 25 to 29 Minutes | 491 | 5.5% |
| 30 to 34 Minutes | 579 | 6.4% |
| 35 to 39 Minutes | 23 | 0.3% |
| 40 to 44 Minutes | 106 | 1.2% |
| 45 to 59 Minutes | 314 | 3.5% |
| 60 to 89 Minutes | 149 | 1.7% |
| 90 or more Minutes | 70 | 0.8% |
Commute Time by Sex in St Matthews
The most common commute times in St Matthews are 20 to 24 minutes (1,268 commuters, 29.5%) for males and 15 to 19 minutes (1,505 commuters, 32.0%) for females.
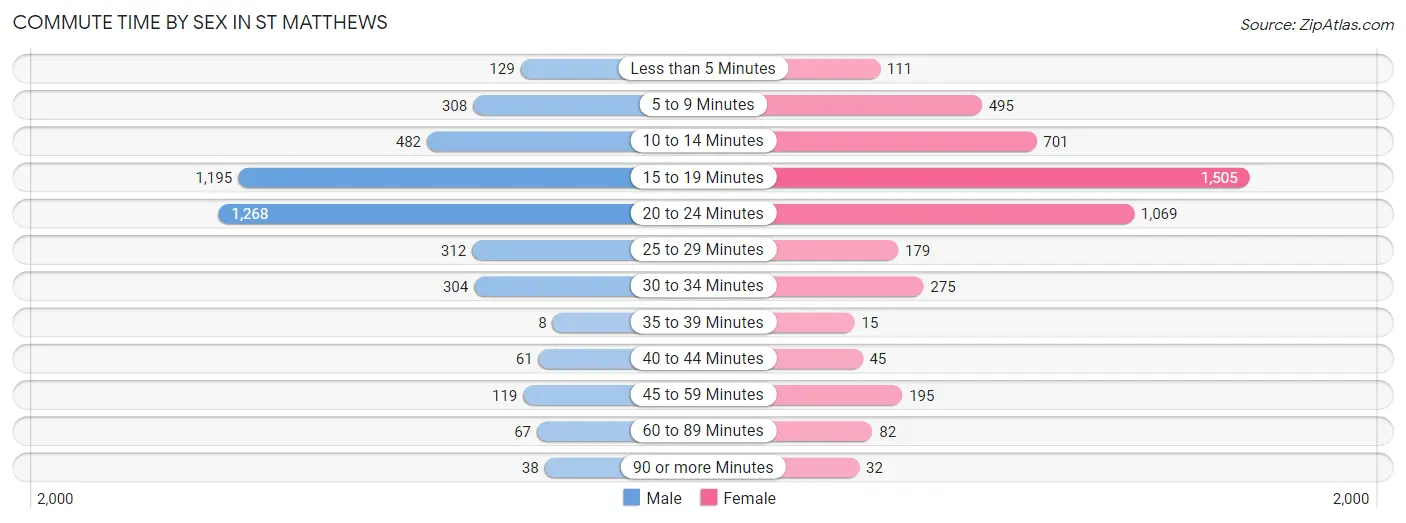
| Commute Time | Male | Female |
| Less than 5 Minutes | 129 (3.0%) | 111 (2.4%) |
| 5 to 9 Minutes | 308 (7.2%) | 495 (10.5%) |
| 10 to 14 Minutes | 482 (11.2%) | 701 (14.9%) |
| 15 to 19 Minutes | 1,195 (27.9%) | 1,505 (32.0%) |
| 20 to 24 Minutes | 1,268 (29.5%) | 1,069 (22.7%) |
| 25 to 29 Minutes | 312 (7.3%) | 179 (3.8%) |
| 30 to 34 Minutes | 304 (7.1%) | 275 (5.9%) |
| 35 to 39 Minutes | 8 (0.2%) | 15 (0.3%) |
| 40 to 44 Minutes | 61 (1.4%) | 45 (1.0%) |
| 45 to 59 Minutes | 119 (2.8%) | 195 (4.2%) |
| 60 to 89 Minutes | 67 (1.6%) | 82 (1.7%) |
| 90 or more Minutes | 38 (0.9%) | 32 (0.7%) |
Time of Departure to Work by Sex in St Matthews
The most frequent times of departure to work in St Matthews are 8:00 AM to 8:29 AM (742, 17.3%) for males and 7:30 AM to 7:59 AM (715, 15.2%) for females.
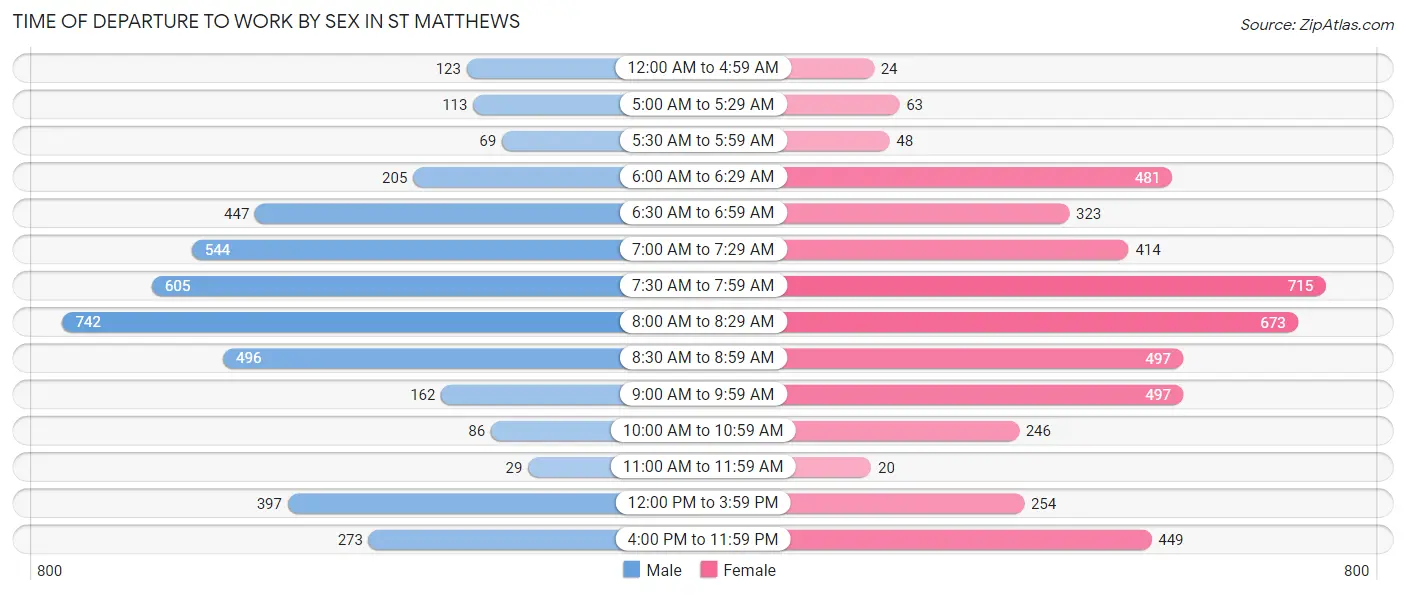
| Time of Departure | Male | Female |
| 12:00 AM to 4:59 AM | 123 (2.9%) | 24 (0.5%) |
| 5:00 AM to 5:29 AM | 113 (2.6%) | 63 (1.3%) |
| 5:30 AM to 5:59 AM | 69 (1.6%) | 48 (1.0%) |
| 6:00 AM to 6:29 AM | 205 (4.8%) | 481 (10.2%) |
| 6:30 AM to 6:59 AM | 447 (10.4%) | 323 (6.9%) |
| 7:00 AM to 7:29 AM | 544 (12.7%) | 414 (8.8%) |
| 7:30 AM to 7:59 AM | 605 (14.1%) | 715 (15.2%) |
| 8:00 AM to 8:29 AM | 742 (17.3%) | 673 (14.3%) |
| 8:30 AM to 8:59 AM | 496 (11.6%) | 497 (10.6%) |
| 9:00 AM to 9:59 AM | 162 (3.8%) | 497 (10.6%) |
| 10:00 AM to 10:59 AM | 86 (2.0%) | 246 (5.2%) |
| 11:00 AM to 11:59 AM | 29 (0.7%) | 20 (0.4%) |
| 12:00 PM to 3:59 PM | 397 (9.2%) | 254 (5.4%) |
| 4:00 PM to 11:59 PM | 273 (6.4%) | 449 (9.6%) |
| Total | 4,291 (100.0%) | 4,704 (100.0%) |
Housing Occupancy in St Matthews
Occupancy by Ownership in St Matthews
Of the total 8,737 dwellings in St Matthews, owner-occupied units account for 4,777 (54.7%), while renter-occupied units make up 3,960 (45.3%).
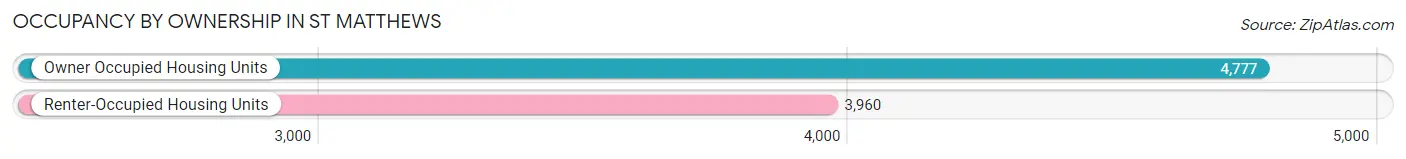
| Occupancy | # Housing Units | % Housing Units |
| Owner Occupied Housing Units | 4,777 | 54.7% |
| Renter-Occupied Housing Units | 3,960 | 45.3% |
| Total Occupied Housing Units | 8,737 | 100.0% |
Occupancy by Household Size in St Matthews
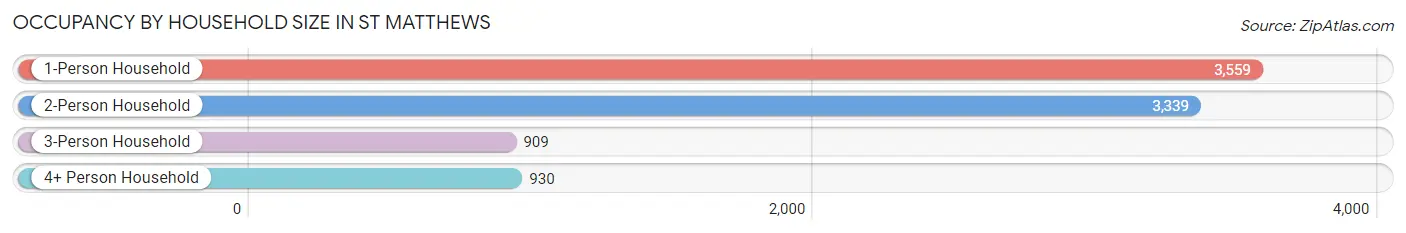
| Household Size | # Housing Units | % Housing Units |
| 1-Person Household | 3,559 | 40.7% |
| 2-Person Household | 3,339 | 38.2% |
| 3-Person Household | 909 | 10.4% |
| 4+ Person Household | 930 | 10.6% |
| Total Housing Units | 8,737 | 100.0% |
Occupancy by Ownership by Household Size in St Matthews
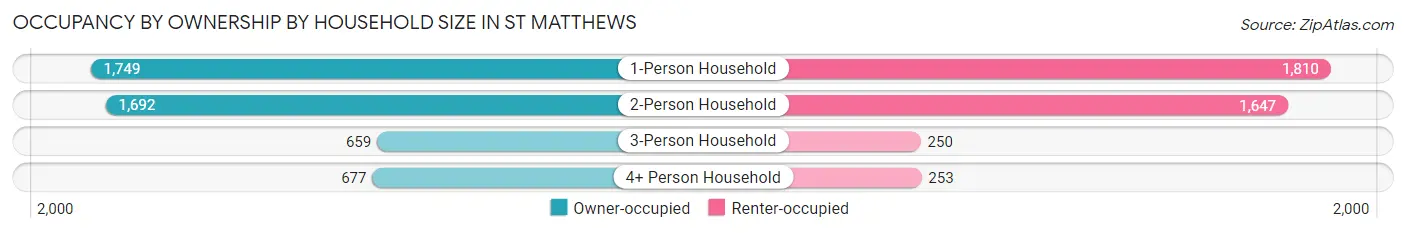
| Household Size | Owner-occupied | Renter-occupied |
| 1-Person Household | 1,749 (49.1%) | 1,810 (50.9%) |
| 2-Person Household | 1,692 (50.7%) | 1,647 (49.3%) |
| 3-Person Household | 659 (72.5%) | 250 (27.5%) |
| 4+ Person Household | 677 (72.8%) | 253 (27.2%) |
| Total Housing Units | 4,777 (54.7%) | 3,960 (45.3%) |
Occupancy by Educational Attainment in St Matthews
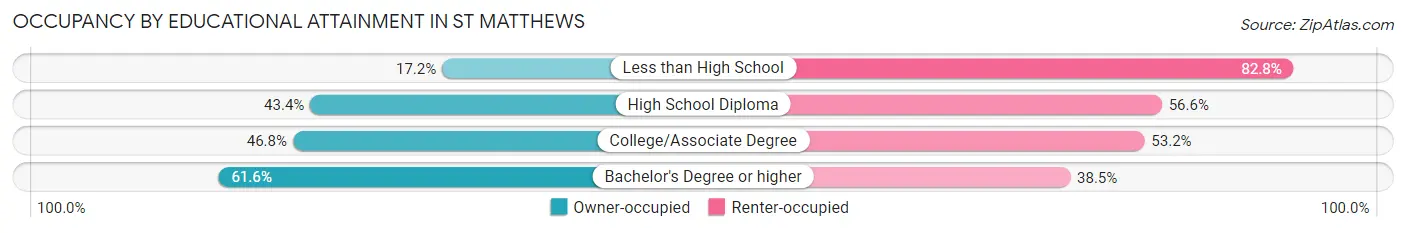
| Household Size | Owner-occupied | Renter-occupied |
| Less than High School | 30 (17.2%) | 144 (82.8%) |
| High School Diploma | 416 (43.4%) | 543 (56.6%) |
| College/Associate Degree | 1,110 (46.8%) | 1,261 (53.2%) |
| Bachelor's Degree or higher | 3,221 (61.6%) | 2,012 (38.5%) |
Occupancy by Age of Householder in St Matthews
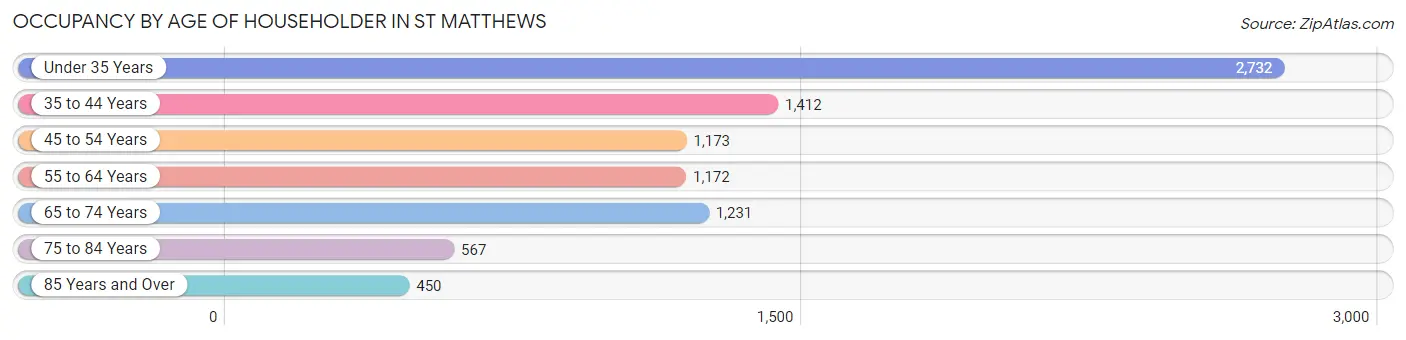
| Age Bracket | # Households | % Households |
| Under 35 Years | 2,732 | 31.3% |
| 35 to 44 Years | 1,412 | 16.2% |
| 45 to 54 Years | 1,173 | 13.4% |
| 55 to 64 Years | 1,172 | 13.4% |
| 65 to 74 Years | 1,231 | 14.1% |
| 75 to 84 Years | 567 | 6.5% |
| 85 Years and Over | 450 | 5.1% |
| Total | 8,737 | 100.0% |
Housing Finances in St Matthews
Median Income by Occupancy in St Matthews
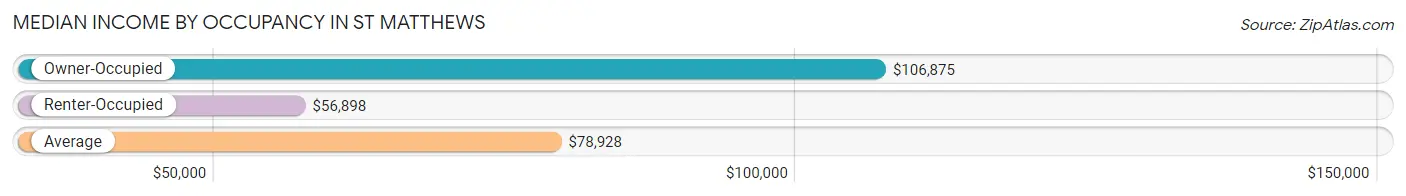
| Occupancy Type | # Households | Median Income |
| Owner-Occupied | 4,777 (54.7%) | $106,875 |
| Renter-Occupied | 3,960 (45.3%) | $56,898 |
| Average | 8,737 (100.0%) | $78,928 |
Occupancy by Householder Income Bracket in St Matthews
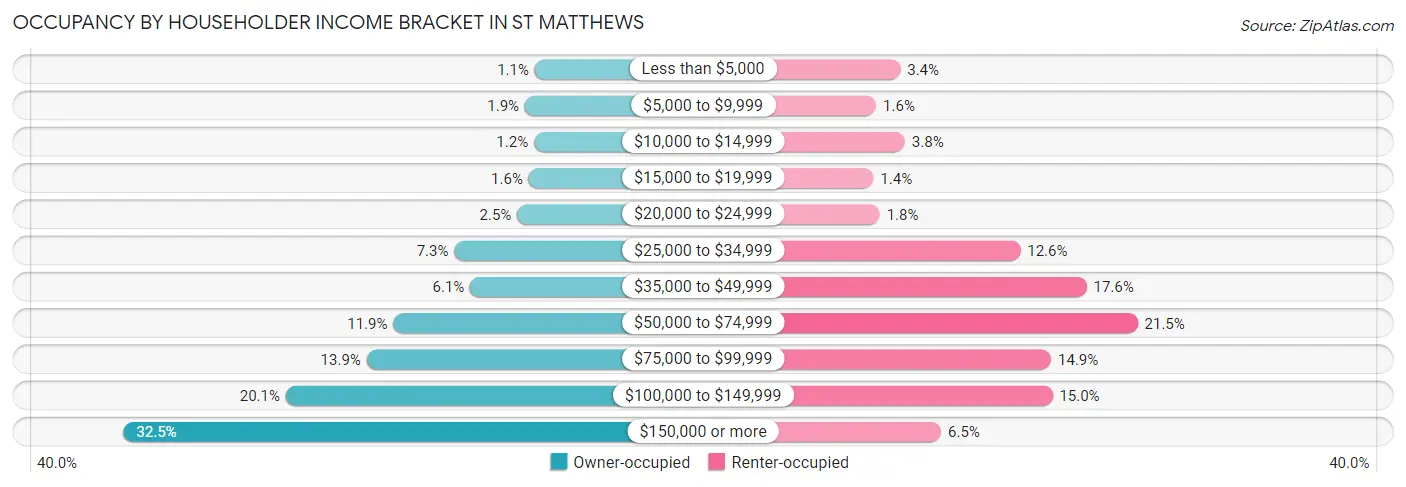
| Income Bracket | Owner-occupied | Renter-occupied |
| Less than $5,000 | 54 (1.1%) | 135 (3.4%) |
| $5,000 to $9,999 | 90 (1.9%) | 62 (1.6%) |
| $10,000 to $14,999 | 57 (1.2%) | 149 (3.8%) |
| $15,000 to $19,999 | 76 (1.6%) | 54 (1.4%) |
| $20,000 to $24,999 | 118 (2.5%) | 73 (1.8%) |
| $25,000 to $34,999 | 347 (7.3%) | 497 (12.6%) |
| $35,000 to $49,999 | 289 (6.0%) | 697 (17.6%) |
| $50,000 to $74,999 | 569 (11.9%) | 851 (21.5%) |
| $75,000 to $99,999 | 666 (13.9%) | 590 (14.9%) |
| $100,000 to $149,999 | 960 (20.1%) | 594 (15.0%) |
| $150,000 or more | 1,551 (32.5%) | 258 (6.5%) |
| Total | 4,777 (100.0%) | 3,960 (100.0%) |
Monthly Housing Cost Tiers in St Matthews
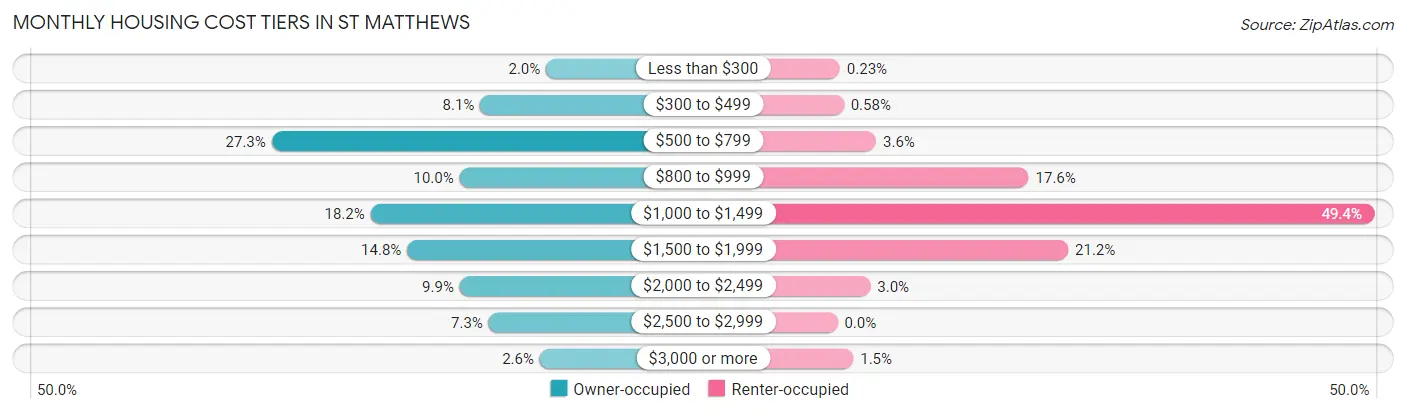
| Monthly Cost | Owner-occupied | Renter-occupied |
| Less than $300 | 95 (2.0%) | 9 (0.2%) |
| $300 to $499 | 385 (8.1%) | 23 (0.6%) |
| $500 to $799 | 1,302 (27.3%) | 141 (3.6%) |
| $800 to $999 | 476 (10.0%) | 697 (17.6%) |
| $1,000 to $1,499 | 867 (18.1%) | 1,955 (49.4%) |
| $1,500 to $1,999 | 706 (14.8%) | 841 (21.2%) |
| $2,000 to $2,499 | 475 (9.9%) | 120 (3.0%) |
| $2,500 to $2,999 | 348 (7.3%) | 0 (0.0%) |
| $3,000 or more | 123 (2.6%) | 58 (1.5%) |
| Total | 4,777 (100.0%) | 3,960 (100.0%) |
Physical Housing Characteristics in St Matthews
Housing Structures in St Matthews
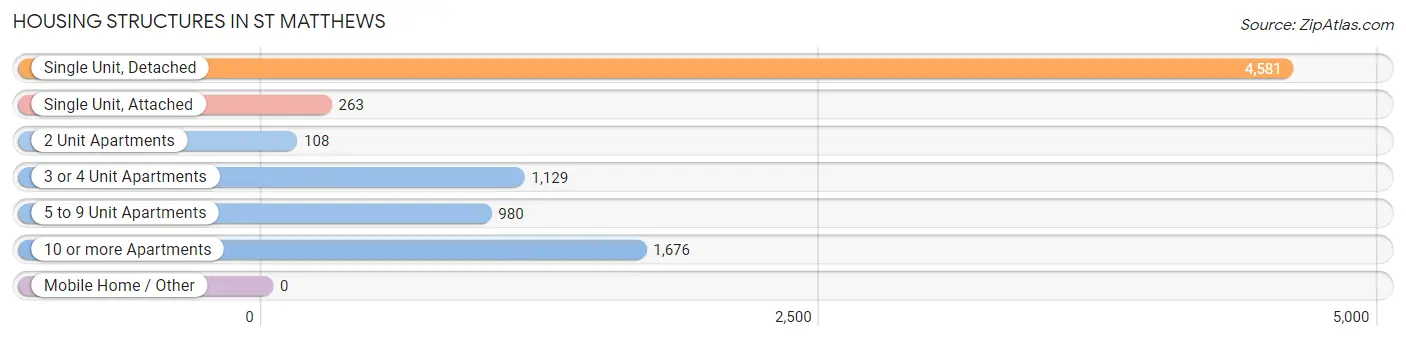
| Structure Type | # Housing Units | % Housing Units |
| Single Unit, Detached | 4,581 | 52.4% |
| Single Unit, Attached | 263 | 3.0% |
| 2 Unit Apartments | 108 | 1.2% |
| 3 or 4 Unit Apartments | 1,129 | 12.9% |
| 5 to 9 Unit Apartments | 980 | 11.2% |
| 10 or more Apartments | 1,676 | 19.2% |
| Mobile Home / Other | 0 | 0.0% |
| Total | 8,737 | 100.0% |
Housing Structures by Occupancy in St Matthews
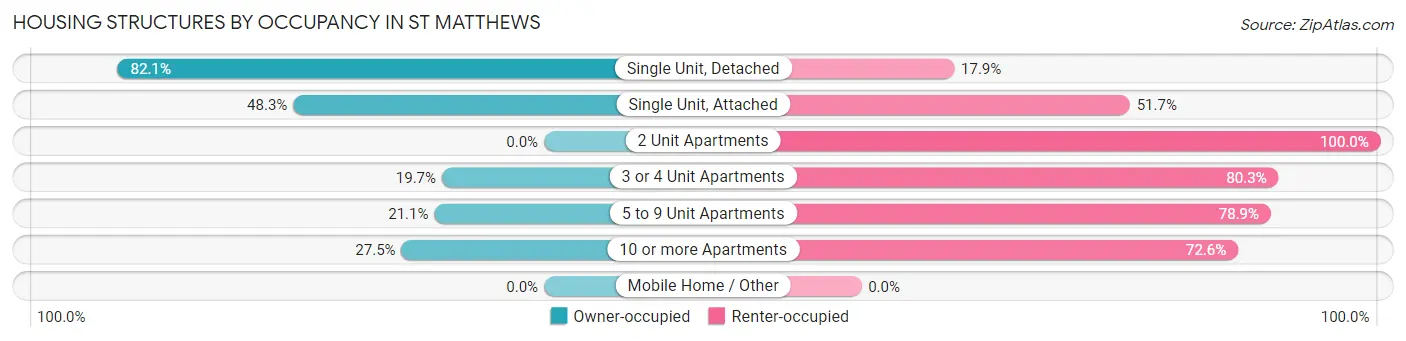
| Structure Type | Owner-occupied | Renter-occupied |
| Single Unit, Detached | 3,761 (82.1%) | 820 (17.9%) |
| Single Unit, Attached | 127 (48.3%) | 136 (51.7%) |
| 2 Unit Apartments | 0 (0.0%) | 108 (100.0%) |
| 3 or 4 Unit Apartments | 222 (19.7%) | 907 (80.3%) |
| 5 to 9 Unit Apartments | 207 (21.1%) | 773 (78.9%) |
| 10 or more Apartments | 460 (27.5%) | 1,216 (72.6%) |
| Mobile Home / Other | 0 (0.0%) | 0 (0.0%) |
| Total | 4,777 (54.7%) | 3,960 (45.3%) |
Housing Structures by Number of Rooms in St Matthews
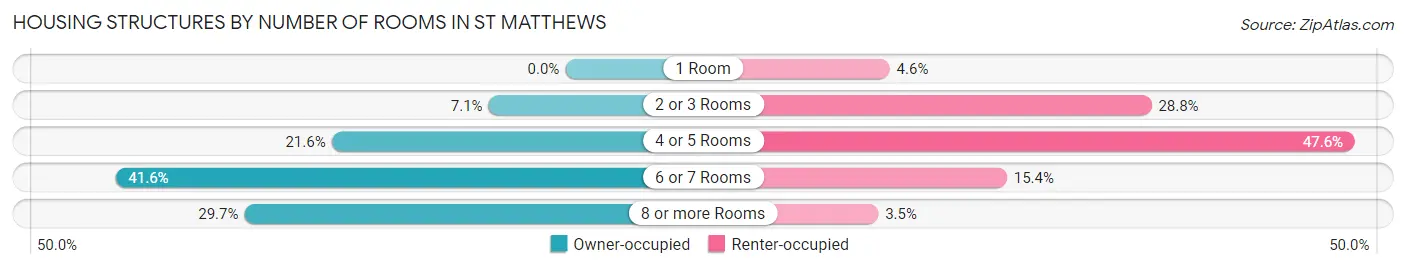
| Number of Rooms | Owner-occupied | Renter-occupied |
| 1 Room | 0 (0.0%) | 182 (4.6%) |
| 2 or 3 Rooms | 339 (7.1%) | 1,141 (28.8%) |
| 4 or 5 Rooms | 1,033 (21.6%) | 1,886 (47.6%) |
| 6 or 7 Rooms | 1,987 (41.6%) | 611 (15.4%) |
| 8 or more Rooms | 1,418 (29.7%) | 140 (3.5%) |
| Total | 4,777 (100.0%) | 3,960 (100.0%) |
Housing Structure by Heating Type in St Matthews
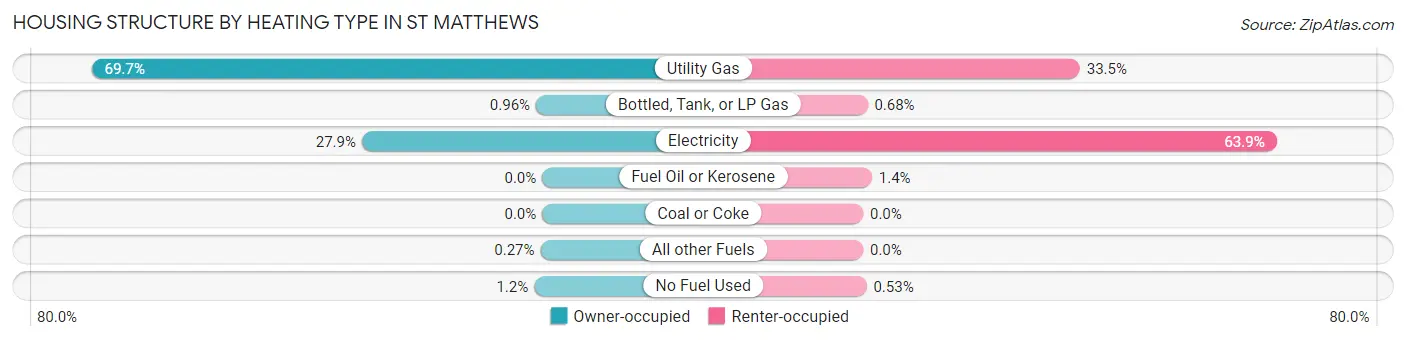
| Heating Type | Owner-occupied | Renter-occupied |
| Utility Gas | 3,327 (69.7%) | 1,327 (33.5%) |
| Bottled, Tank, or LP Gas | 46 (1.0%) | 27 (0.7%) |
| Electricity | 1,332 (27.9%) | 2,531 (63.9%) |
| Fuel Oil or Kerosene | 0 (0.0%) | 54 (1.4%) |
| Coal or Coke | 0 (0.0%) | 0 (0.0%) |
| All other Fuels | 13 (0.3%) | 0 (0.0%) |
| No Fuel Used | 59 (1.2%) | 21 (0.5%) |
| Total | 4,777 (100.0%) | 3,960 (100.0%) |
Household Vehicle Usage in St Matthews
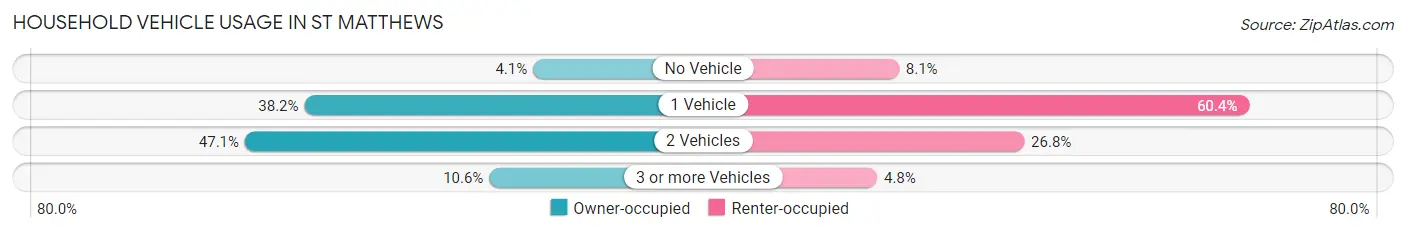
| Vehicles per Household | Owner-occupied | Renter-occupied |
| No Vehicle | 194 (4.1%) | 319 (8.1%) |
| 1 Vehicle | 1,826 (38.2%) | 2,391 (60.4%) |
| 2 Vehicles | 2,250 (47.1%) | 1,060 (26.8%) |
| 3 or more Vehicles | 507 (10.6%) | 190 (4.8%) |
| Total | 4,777 (100.0%) | 3,960 (100.0%) |
Real Estate & Mortgages in St Matthews
Real Estate and Mortgage Overview in St Matthews
| Characteristic | Without Mortgage | With Mortgage |
| Housing Units | 1,913 | 2,864 |
| Median Property Value | $313,400 | $302,700 |
| Median Household Income | $75,054 | $1,042 |
| Monthly Housing Costs | $591 | $112 |
| Real Estate Taxes | $2,630 | $45 |
Property Value by Mortgage Status in St Matthews
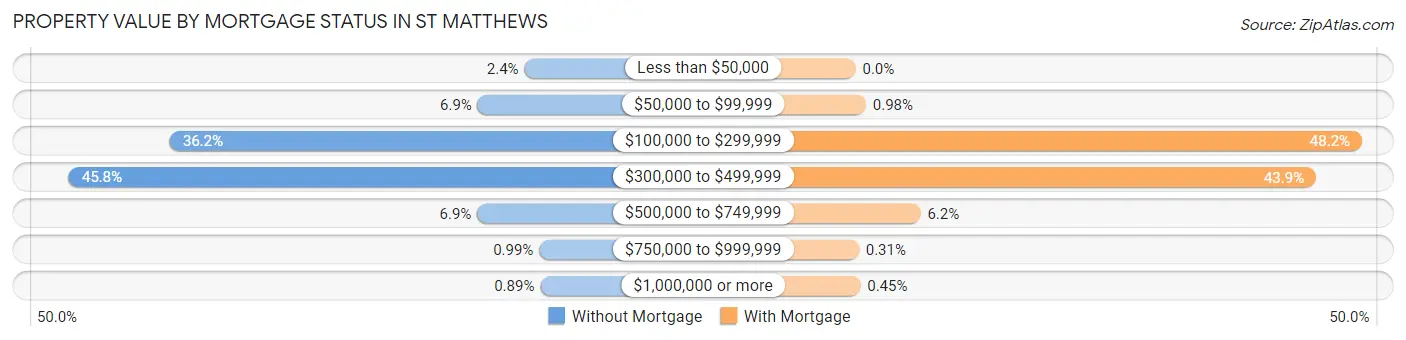
| Property Value | Without Mortgage | With Mortgage |
| Less than $50,000 | 46 (2.4%) | 0 (0.0%) |
| $50,000 to $99,999 | 131 (6.9%) | 28 (1.0%) |
| $100,000 to $299,999 | 692 (36.2%) | 1,381 (48.2%) |
| $300,000 to $499,999 | 876 (45.8%) | 1,256 (43.9%) |
| $500,000 to $749,999 | 132 (6.9%) | 177 (6.2%) |
| $750,000 to $999,999 | 19 (1.0%) | 9 (0.3%) |
| $1,000,000 or more | 17 (0.9%) | 13 (0.4%) |
| Total | 1,913 (100.0%) | 2,864 (100.0%) |
Household Income by Mortgage Status in St Matthews
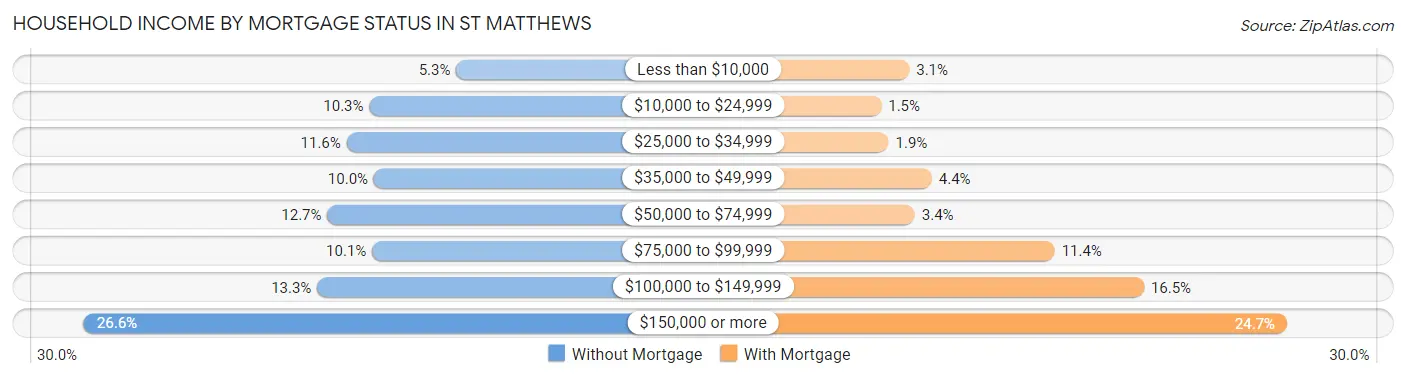
| Household Income | Without Mortgage | With Mortgage |
| Less than $10,000 | 102 (5.3%) | 88 (3.1%) |
| $10,000 to $24,999 | 197 (10.3%) | 42 (1.5%) |
| $25,000 to $34,999 | 222 (11.6%) | 54 (1.9%) |
| $35,000 to $49,999 | 192 (10.0%) | 125 (4.4%) |
| $50,000 to $74,999 | 243 (12.7%) | 97 (3.4%) |
| $75,000 to $99,999 | 194 (10.1%) | 326 (11.4%) |
| $100,000 to $149,999 | 254 (13.3%) | 472 (16.5%) |
| $150,000 or more | 509 (26.6%) | 706 (24.6%) |
| Total | 1,913 (100.0%) | 2,864 (100.0%) |
Property Value to Household Income Ratio in St Matthews
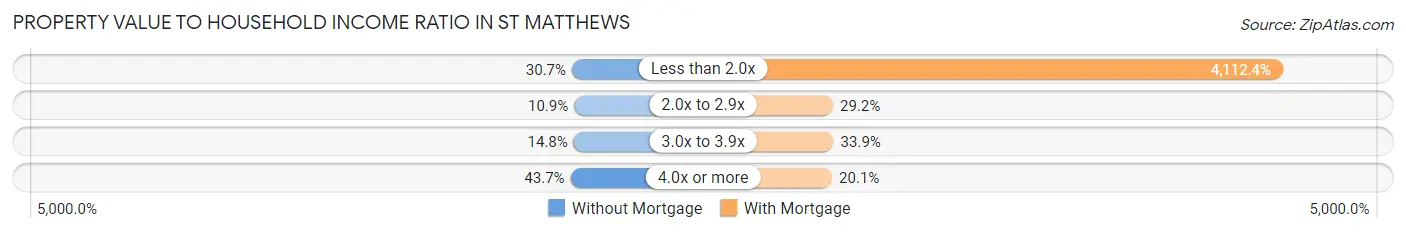
| Value-to-Income Ratio | Without Mortgage | With Mortgage |
| Less than 2.0x | 587 (30.7%) | 117,778 (4,112.4%) |
| 2.0x to 2.9x | 208 (10.9%) | 837 (29.2%) |
| 3.0x to 3.9x | 283 (14.8%) | 971 (33.9%) |
| 4.0x or more | 835 (43.6%) | 576 (20.1%) |
| Total | 1,913 (100.0%) | 2,864 (100.0%) |
Real Estate Taxes by Mortgage Status in St Matthews
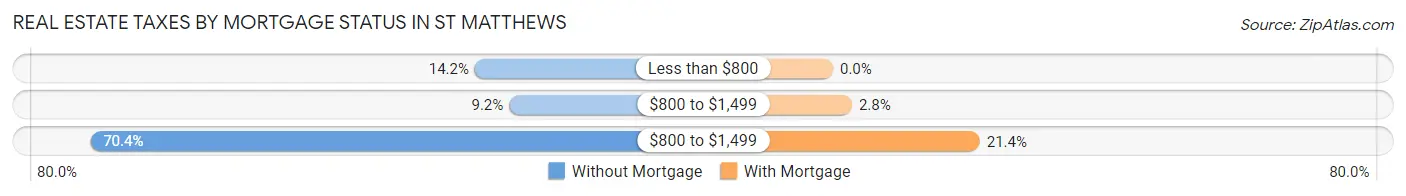
| Property Taxes | Without Mortgage | With Mortgage |
| Less than $800 | 272 (14.2%) | 0 (0.0%) |
| $800 to $1,499 | 176 (9.2%) | 79 (2.8%) |
| $800 to $1,499 | 1,347 (70.4%) | 614 (21.4%) |
| Total | 1,913 (100.0%) | 2,864 (100.0%) |
Health & Disability in St Matthews
Health Insurance Coverage by Age in St Matthews
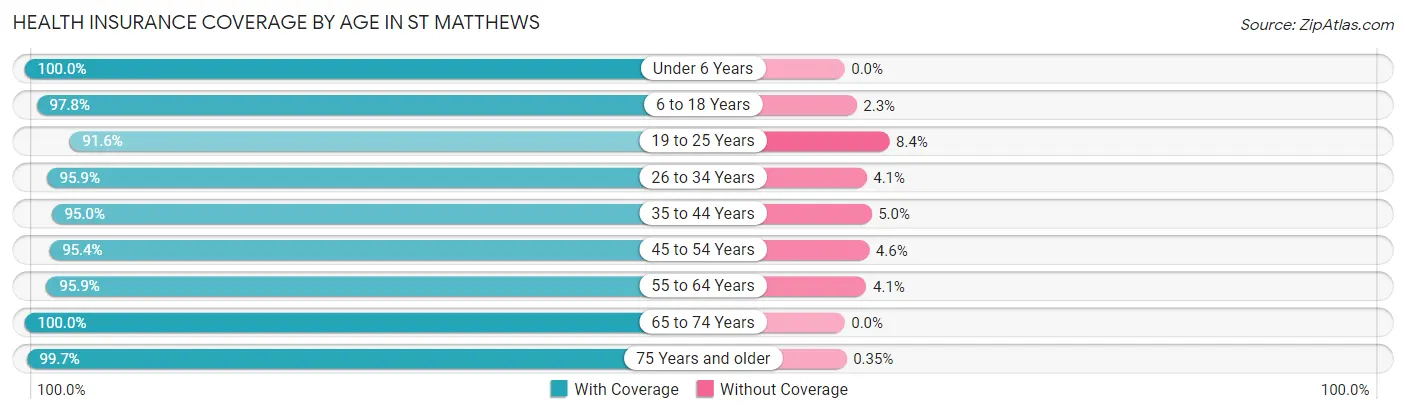
| Age Bracket | With Coverage | Without Coverage |
| Under 6 Years | 950 (100.0%) | 0 (0.0%) |
| 6 to 18 Years | 1,741 (97.8%) | 40 (2.2%) |
| 19 to 25 Years | 1,908 (91.6%) | 174 (8.4%) |
| 26 to 34 Years | 3,182 (95.9%) | 136 (4.1%) |
| 35 to 44 Years | 2,120 (95.0%) | 112 (5.0%) |
| 45 to 54 Years | 1,644 (95.4%) | 79 (4.6%) |
| 55 to 64 Years | 1,839 (95.9%) | 78 (4.1%) |
| 65 to 74 Years | 1,645 (100.0%) | 0 (0.0%) |
| 75 Years and older | 1,441 (99.7%) | 5 (0.4%) |
| Total | 16,470 (96.4%) | 624 (3.6%) |
Health Insurance Coverage by Citizenship Status in St Matthews
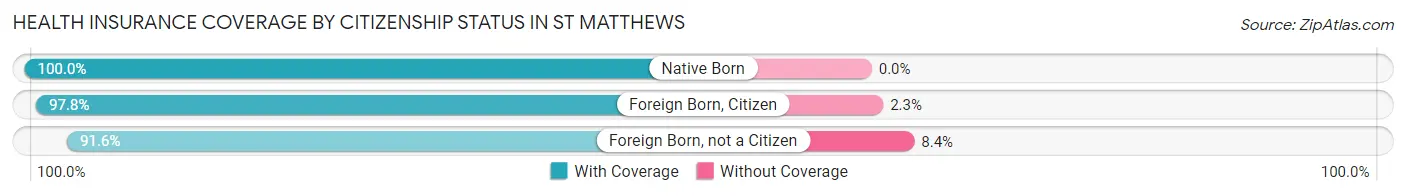
| Citizenship Status | With Coverage | Without Coverage |
| Native Born | 950 (100.0%) | 0 (0.0%) |
| Foreign Born, Citizen | 1,741 (97.8%) | 40 (2.2%) |
| Foreign Born, not a Citizen | 1,908 (91.6%) | 174 (8.4%) |
Health Insurance Coverage by Household Income in St Matthews
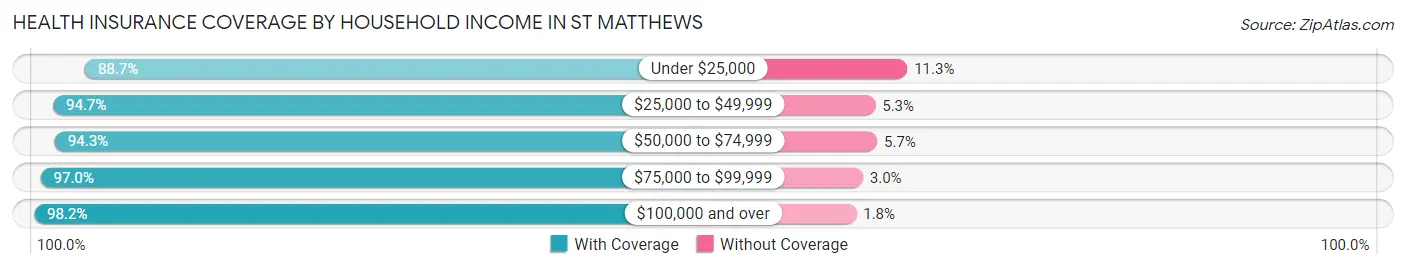
| Household Income | With Coverage | Without Coverage |
| Under $25,000 | 1,003 (88.7%) | 128 (11.3%) |
| $25,000 to $49,999 | 2,429 (94.7%) | 137 (5.3%) |
| $50,000 to $74,999 | 2,110 (94.3%) | 127 (5.7%) |
| $75,000 to $99,999 | 2,418 (97.0%) | 75 (3.0%) |
| $100,000 and over | 8,506 (98.2%) | 154 (1.8%) |
Public vs Private Health Insurance Coverage by Age in St Matthews
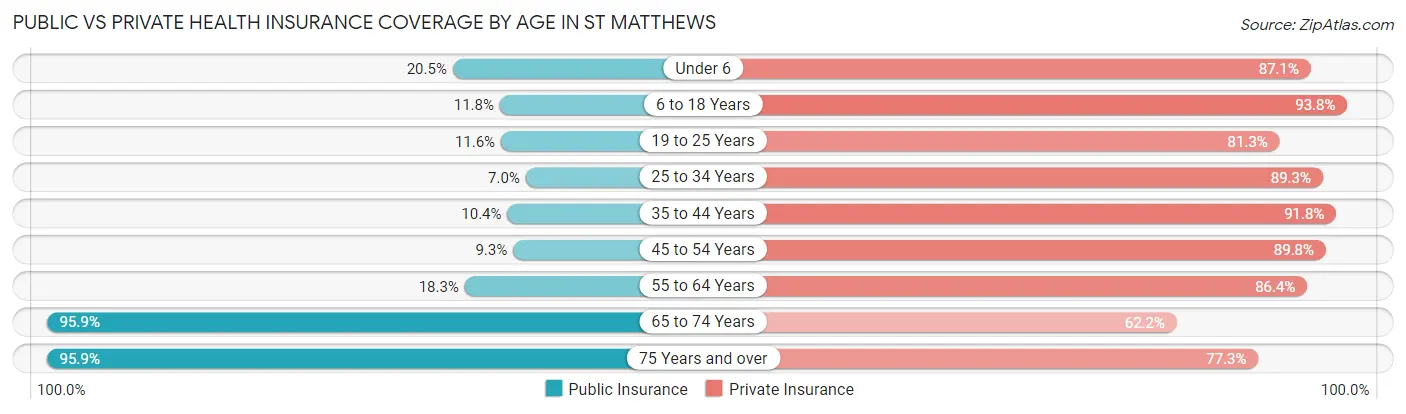
| Age Bracket | Public Insurance | Private Insurance |
| Under 6 | 195 (20.5%) | 827 (87.1%) |
| 6 to 18 Years | 210 (11.8%) | 1,671 (93.8%) |
| 19 to 25 Years | 241 (11.6%) | 1,692 (81.3%) |
| 25 to 34 Years | 232 (7.0%) | 2,962 (89.3%) |
| 35 to 44 Years | 232 (10.4%) | 2,048 (91.8%) |
| 45 to 54 Years | 161 (9.3%) | 1,548 (89.8%) |
| 55 to 64 Years | 351 (18.3%) | 1,656 (86.4%) |
| 65 to 74 Years | 1,578 (95.9%) | 1,023 (62.2%) |
| 75 Years and over | 1,387 (95.9%) | 1,118 (77.3%) |
| Total | 4,587 (26.8%) | 14,545 (85.1%) |
Disability Status by Sex by Age in St Matthews
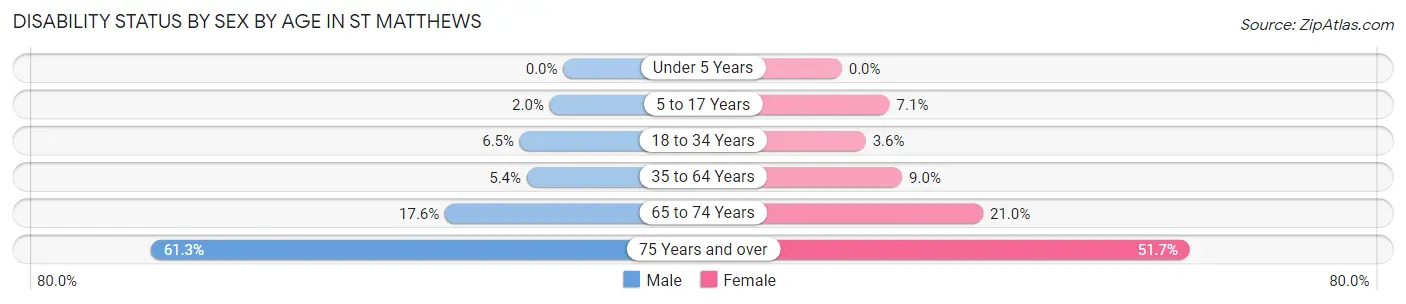
| Age Bracket | Male | Female |
| Under 5 Years | 0 (0.0%) | 0 (0.0%) |
| 5 to 17 Years | 18 (2.0%) | 66 (7.1%) |
| 18 to 34 Years | 175 (6.5%) | 98 (3.5%) |
| 35 to 64 Years | 146 (5.4%) | 285 (9.0%) |
| 65 to 74 Years | 124 (17.6%) | 197 (21.0%) |
| 75 Years and over | 337 (61.3%) | 463 (51.7%) |
Disability Class by Sex by Age in St Matthews
Disability Class: Hearing Difficulty
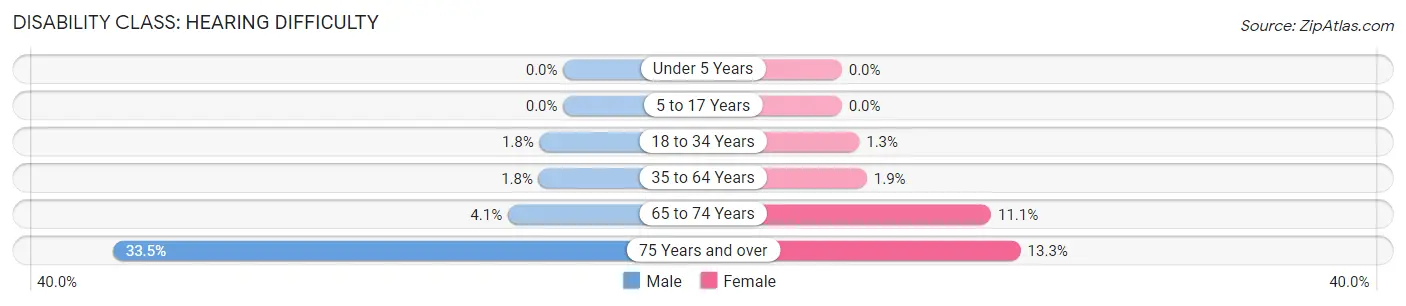
| Age Bracket | Male | Female |
| Under 5 Years | 0 (0.0%) | 0 (0.0%) |
| 5 to 17 Years | 0 (0.0%) | 0 (0.0%) |
| 18 to 34 Years | 48 (1.8%) | 36 (1.3%) |
| 35 to 64 Years | 49 (1.8%) | 59 (1.9%) |
| 65 to 74 Years | 29 (4.1%) | 104 (11.1%) |
| 75 Years and over | 184 (33.5%) | 119 (13.3%) |
Disability Class: Vision Difficulty
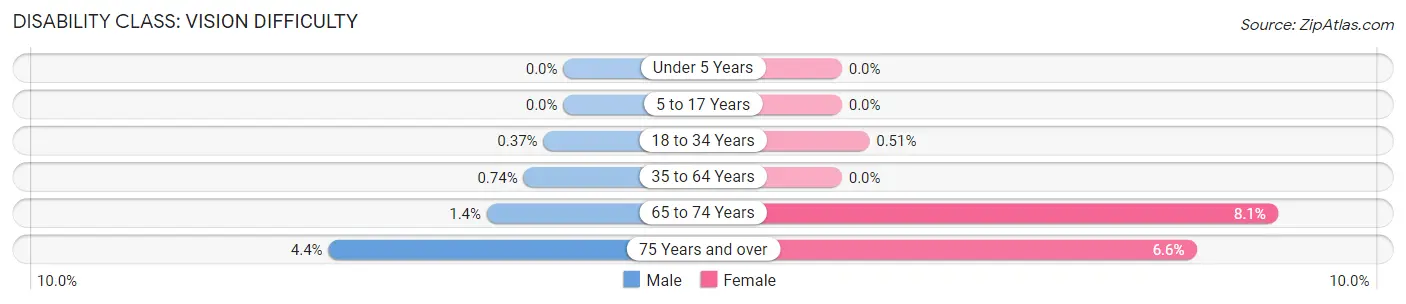
| Age Bracket | Male | Female |
| Under 5 Years | 0 (0.0%) | 0 (0.0%) |
| 5 to 17 Years | 0 (0.0%) | 0 (0.0%) |
| 18 to 34 Years | 10 (0.4%) | 14 (0.5%) |
| 35 to 64 Years | 20 (0.7%) | 0 (0.0%) |
| 65 to 74 Years | 10 (1.4%) | 76 (8.1%) |
| 75 Years and over | 24 (4.4%) | 59 (6.6%) |
Disability Class: Cognitive Difficulty
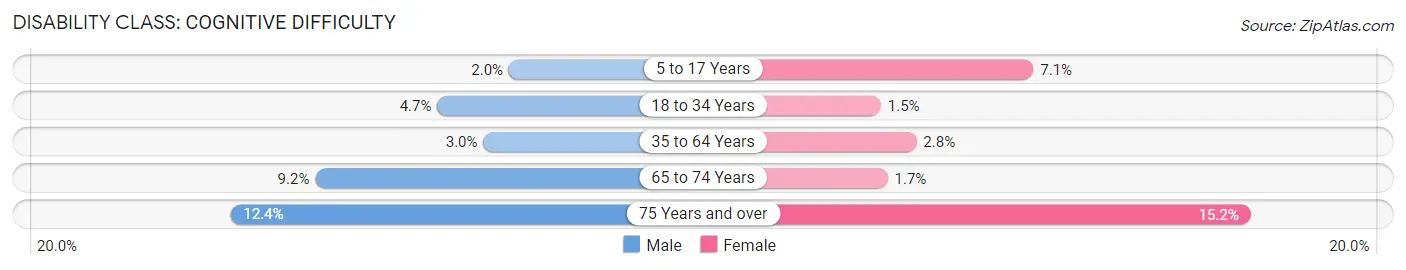
| Age Bracket | Male | Female |
| 5 to 17 Years | 18 (2.0%) | 66 (7.1%) |
| 18 to 34 Years | 127 (4.7%) | 40 (1.5%) |
| 35 to 64 Years | 80 (3.0%) | 88 (2.8%) |
| 65 to 74 Years | 65 (9.2%) | 16 (1.7%) |
| 75 Years and over | 68 (12.4%) | 136 (15.2%) |
Disability Class: Ambulatory Difficulty
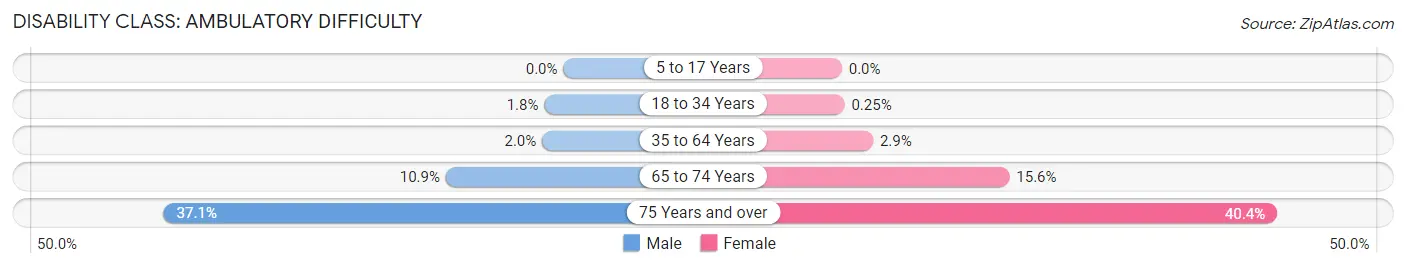
| Age Bracket | Male | Female |
| 5 to 17 Years | 0 (0.0%) | 0 (0.0%) |
| 18 to 34 Years | 48 (1.8%) | 7 (0.3%) |
| 35 to 64 Years | 53 (2.0%) | 92 (2.9%) |
| 65 to 74 Years | 77 (10.9%) | 146 (15.5%) |
| 75 Years and over | 204 (37.1%) | 362 (40.4%) |
Disability Class: Self-Care Difficulty
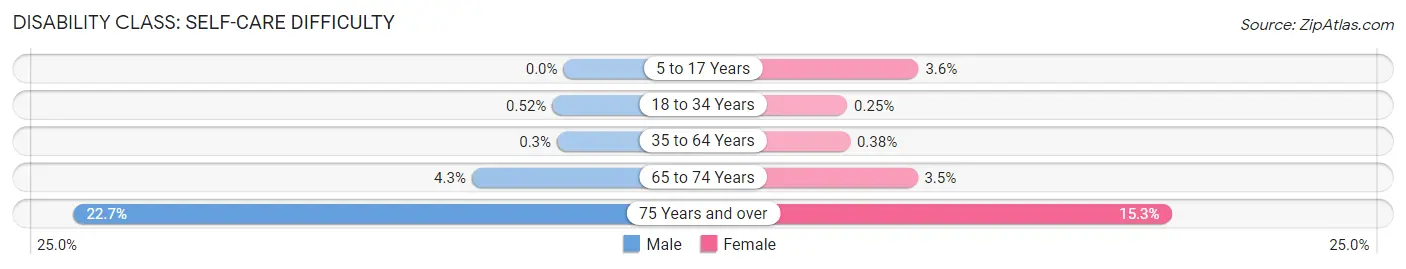
| Age Bracket | Male | Female |
| 5 to 17 Years | 0 (0.0%) | 33 (3.6%) |
| 18 to 34 Years | 14 (0.5%) | 7 (0.3%) |
| 35 to 64 Years | 8 (0.3%) | 12 (0.4%) |
| 65 to 74 Years | 30 (4.3%) | 33 (3.5%) |
| 75 Years and over | 125 (22.7%) | 137 (15.3%) |
Technology Access in St Matthews
Computing Device Access in St Matthews
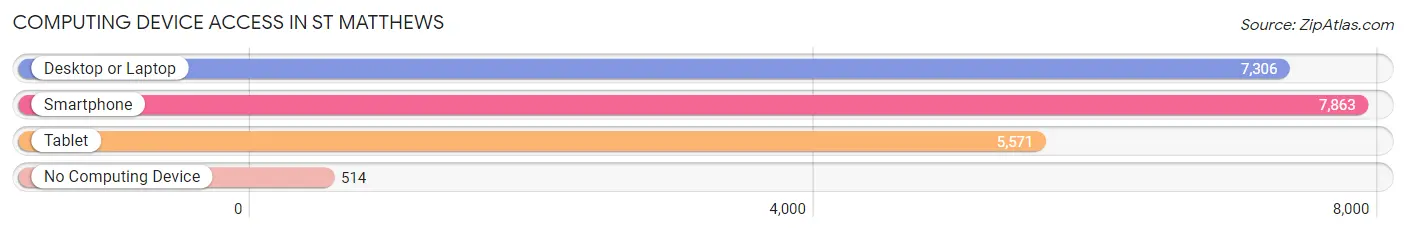
| Device Type | # Households | % Households |
| Desktop or Laptop | 7,306 | 83.6% |
| Smartphone | 7,863 | 90.0% |
| Tablet | 5,571 | 63.8% |
| No Computing Device | 514 | 5.9% |
| Total | 8,737 | 100.0% |
Internet Access in St Matthews
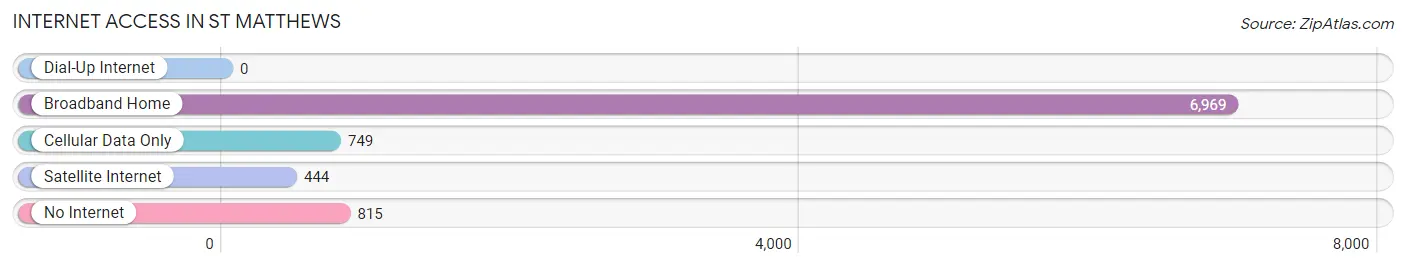
| Internet Type | # Households | % Households |
| Dial-Up Internet | 0 | 0.0% |
| Broadband Home | 6,969 | 79.8% |
| Cellular Data Only | 749 | 8.6% |
| Satellite Internet | 444 | 5.1% |
| No Internet | 815 | 9.3% |
| Total | 8,737 | 100.0% |
St Matthews Summary
St. Matthews is a city located in Jefferson County, Kentucky, United States. It is a suburb of Louisville and is part of the Louisville Metro government. The population was 15,852 at the 2010 census.
History
St. Matthews was founded in 1832 by a group of settlers from Maryland and Virginia. The city was named after the nearby St. Matthews Episcopal Church, which was built in 1835. The church was named after the patron saint of the Episcopal Church, St. Matthew.
The city was incorporated in 1842 and was the first city in Jefferson County to be incorporated. The city was originally a farming community, but it began to grow in the late 19th century when the Louisville and Nashville Railroad was built through the area.
The city continued to grow in the early 20th century, and by the 1950s, it had become a popular suburb of Louisville. The city has continued to grow since then, and today it is one of the most affluent suburbs of Louisville.
Geography
St. Matthews is located in Jefferson County, Kentucky, at 38°14'25" North, 85°41'17" West (38.240278, -85.688056). The city is located in the eastern part of the county, just south of Louisville.
The city has a total area of 4.2 square miles, all of which is land. The city is bordered by the cities of Lyndon, Middletown, and Anchorage.
Economy
St. Matthews is a primarily residential city, but it does have some commercial and industrial businesses. The city is home to several large retail stores, including Target, Walmart, and Lowe's. The city also has several restaurants, banks, and other businesses.
The city is also home to several large employers, including Baptist Health Louisville, Humana, and Brown-Forman.
Demographics
As of the 2010 census, there were 15,852 people, 6,845 households, and 4,093 families living in the city. The population density was 3,788.3 people per square mile. The racial makeup of the city was 90.2% White, 4.2% African American, 0.2% Native American, 2.7% Asian, 0.1% Pacific Islander, 1.2% from other races, and 1.6% from two or more races. Hispanic or Latino of any race were 3.2% of the population.
The median income for a household in the city was $60,945, and the median income for a family was $76,945. The per capita income for the city was $33,945. About 3.2% of families and 4.7% of the population were below the poverty line, including 5.3% of those under age 18 and 4.2% of those age 65 or over.
Common Questions
What is Per Capita Income in St Matthews?
Per Capita income in St Matthews is $53,401.
What is the Median Family Income in St Matthews?
Median Family Income in St Matthews is $118,250.
What is the Median Household income in St Matthews?
Median Household Income in St Matthews is $78,928.
What is Income or Wage Gap in St Matthews?
Income or Wage Gap in St Matthews is 16.2%.
Women in St Matthews earn 83.8 cents for every dollar earned by a man.
What is Family Income Deficit in St Matthews?
Family Income Deficit in St Matthews is $12,408.
Families that are below poverty line in St Matthews earn $12,408 less on average than the poverty threshold level.
What is Inequality or Gini Index in St Matthews?
Inequality or Gini Index in St Matthews is 0.44.
What is the Total Population of St Matthews?
Total Population of St Matthews is 17,511.
What is the Total Male Population of St Matthews?
Total Male Population of St Matthews is 8,150.
What is the Total Female Population of St Matthews?
Total Female Population of St Matthews is 9,361.
What is the Ratio of Males per 100 Females in St Matthews?
There are 87.06 Males per 100 Females in St Matthews.
What is the Ratio of Females per 100 Males in St Matthews?
There are 114.86 Females per 100 Males in St Matthews.
What is the Median Population Age in St Matthews?
Median Population Age in St Matthews is 37.5 Years.
What is the Average Family Size in St Matthews
Average Family Size in St Matthews is 2.7 People.
What is the Average Household Size in St Matthews
Average Household Size in St Matthews is 2.0 People.
How Large is the Labor Force in St Matthews?
There are 10,927 People in the Labor Forcein in St Matthews.
What is the Percentage of People in the Labor Force in St Matthews?
72.2% of People are in the Labor Force in St Matthews.
What is the Unemployment Rate in St Matthews?
Unemployment Rate in St Matthews is 3.7%.