Indian Hills, KY Map & Demographics
Indian Hills Map
Indian Hills Overview
$114,704
PER CAPITA INCOME
$244,479
AVG FAMILY INCOME
$178,250
AVG HOUSEHOLD INCOME
65.5%
WAGE / INCOME GAP [ % ]
34.5¢/ $1
WAGE / INCOME GAP [ $ ]
0.49
INEQUALITY / GINI INDEX
2,891
TOTAL POPULATION
1,455
MALE POPULATION
1,436
FEMALE POPULATION
101.32
MALES / 100 FEMALES
98.69
FEMALES / 100 MALES
52.2
MEDIAN AGE
2.8
AVG FAMILY SIZE
2.2
AVG HOUSEHOLD SIZE
1,344
LABOR FORCE [ PEOPLE ]
56.6%
PERCENT IN LABOR FORCE
2.1%
UNEMPLOYMENT RATE
Indian Hills Area Codes
Income in Indian Hills
Income Overview in Indian Hills
Per Capita Income in Indian Hills is $114,704, while median incomes of families and households are $244,479 and $178,250 respectively.
| Characteristic | Number | Measure |
| Per Capita Income | 2,891 | $114,704 |
| Median Family Income | 855 | $244,479 |
| Mean Family Income | 855 | $321,840 |
| Median Household Income | 1,283 | $178,250 |
| Mean Household Income | 1,283 | $259,128 |
| Income Deficit | 855 | $0 |
| Wage / Income Gap (%) | 2,891 | 65.54% |
| Wage / Income Gap ($) | 2,891 | 34.46¢ per $1 |
| Gini / Inequality Index | 2,891 | 0.49 |
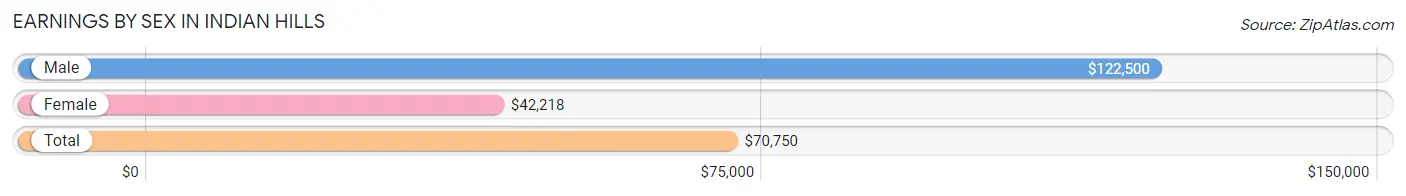
Earnings by Sex in Indian Hills
Average Earnings in Indian Hills are $70,750, $122,500 for men and $42,218 for women, a difference of 65.5%.
| Sex | Number | Average Earnings |
| Male | 872 (58.6%) | $122,500 |
| Female | 615 (41.4%) | $42,218 |
| Total | 1,487 (100.0%) | $70,750 |
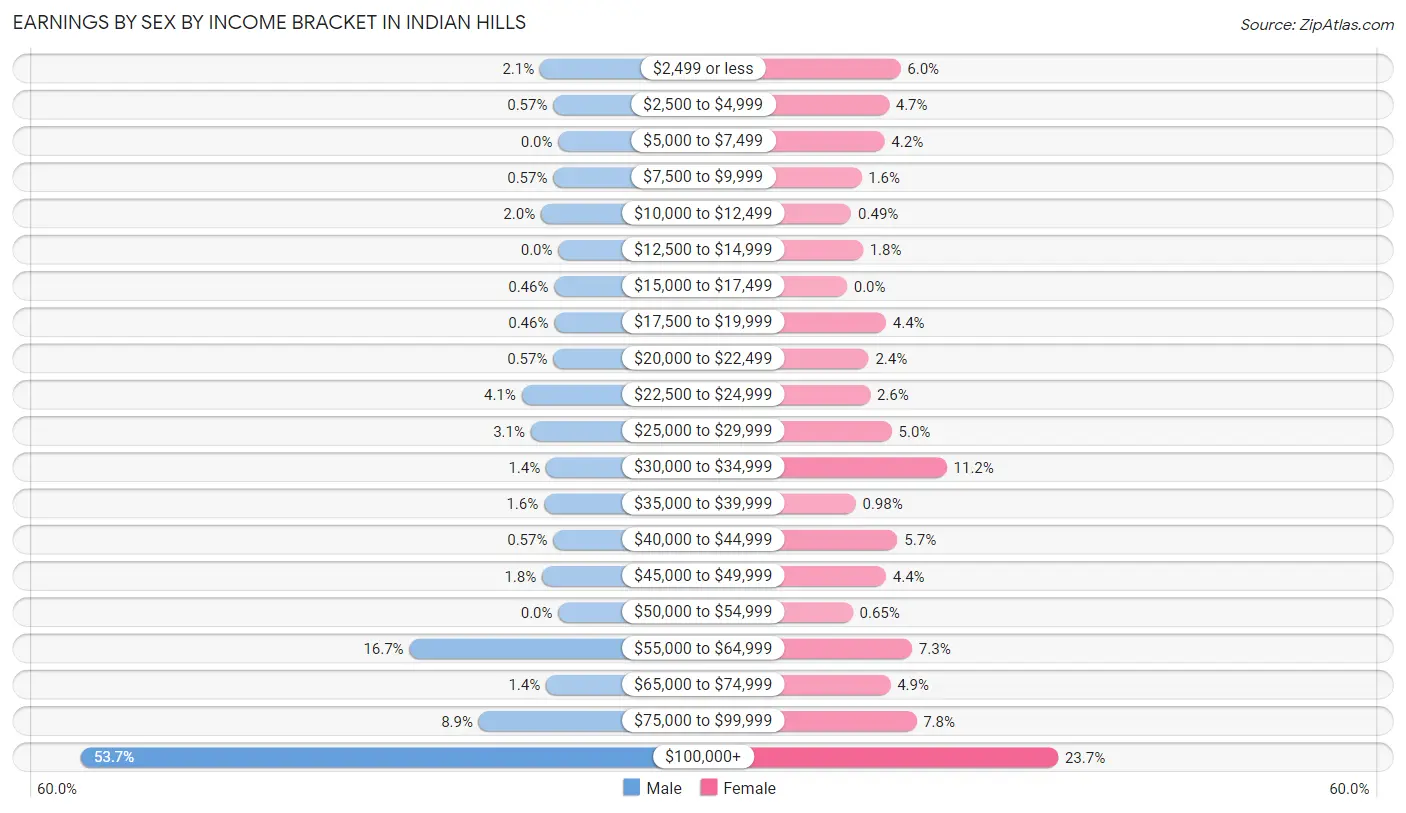
Earnings by Sex by Income Bracket in Indian Hills
The most common earnings brackets in Indian Hills are $100,000+ for men (468 | 53.7%) and $100,000+ for women (146 | 23.7%).
| Income | Male | Female |
| $2,499 or less | 18 (2.1%) | 37 (6.0%) |
| $2,500 to $4,999 | 5 (0.6%) | 29 (4.7%) |
| $5,000 to $7,499 | 0 (0.0%) | 26 (4.2%) |
| $7,500 to $9,999 | 5 (0.6%) | 10 (1.6%) |
| $10,000 to $12,499 | 17 (1.9%) | 3 (0.5%) |
| $12,500 to $14,999 | 0 (0.0%) | 11 (1.8%) |
| $15,000 to $17,499 | 4 (0.5%) | 0 (0.0%) |
| $17,500 to $19,999 | 4 (0.5%) | 27 (4.4%) |
| $20,000 to $22,499 | 5 (0.6%) | 15 (2.4%) |
| $22,500 to $24,999 | 36 (4.1%) | 16 (2.6%) |
| $25,000 to $29,999 | 27 (3.1%) | 31 (5.0%) |
| $30,000 to $34,999 | 12 (1.4%) | 69 (11.2%) |
| $35,000 to $39,999 | 14 (1.6%) | 6 (1.0%) |
| $40,000 to $44,999 | 5 (0.6%) | 35 (5.7%) |
| $45,000 to $49,999 | 16 (1.8%) | 27 (4.4%) |
| $50,000 to $54,999 | 0 (0.0%) | 4 (0.6%) |
| $55,000 to $64,999 | 146 (16.7%) | 45 (7.3%) |
| $65,000 to $74,999 | 12 (1.4%) | 30 (4.9%) |
| $75,000 to $99,999 | 78 (8.9%) | 48 (7.8%) |
| $100,000+ | 468 (53.7%) | 146 (23.7%) |
| Total | 872 (100.0%) | 615 (100.0%) |
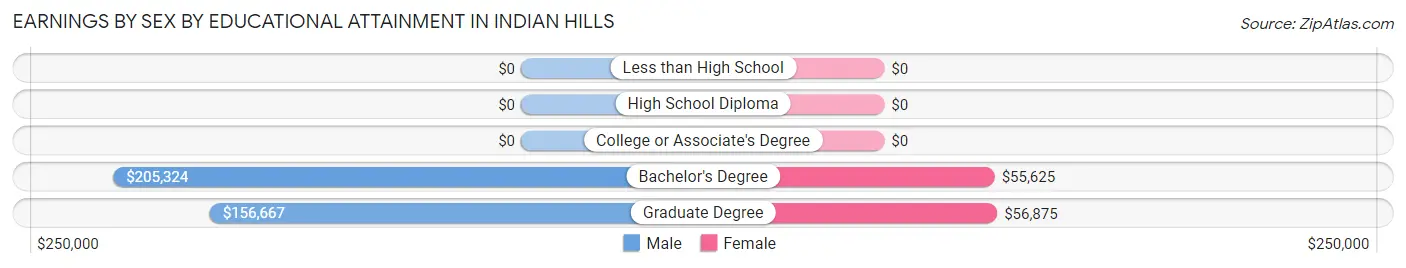
Earnings by Sex by Educational Attainment in Indian Hills
Average earnings in Indian Hills are $150,208 for men and $46,691 for women, a difference of 68.9%. Men with an educational attainment of bachelor's degree enjoy the highest average annual earnings of $205,324, while those with graduate degree education earn the least with $156,667. Women with an educational attainment of graduate degree earn the most with the average annual earnings of $56,875, while those with bachelor's degree education have the smallest earnings of $55,625.
| Educational Attainment | Male Income | Female Income |
| Less than High School | - | - |
| High School Diploma | - | - |
| College or Associate's Degree | - | - |
| Bachelor's Degree | $205,324 | $55,625 |
| Graduate Degree | $156,667 | $56,875 |
| Total | $150,208 | $46,691 |
Family Income in Indian Hills
Family Income Brackets in Indian Hills
According to the Indian Hills family income data, there are 531 families falling into the $200,000+ income range, which is the most common income bracket and makes up 62.1% of all families.
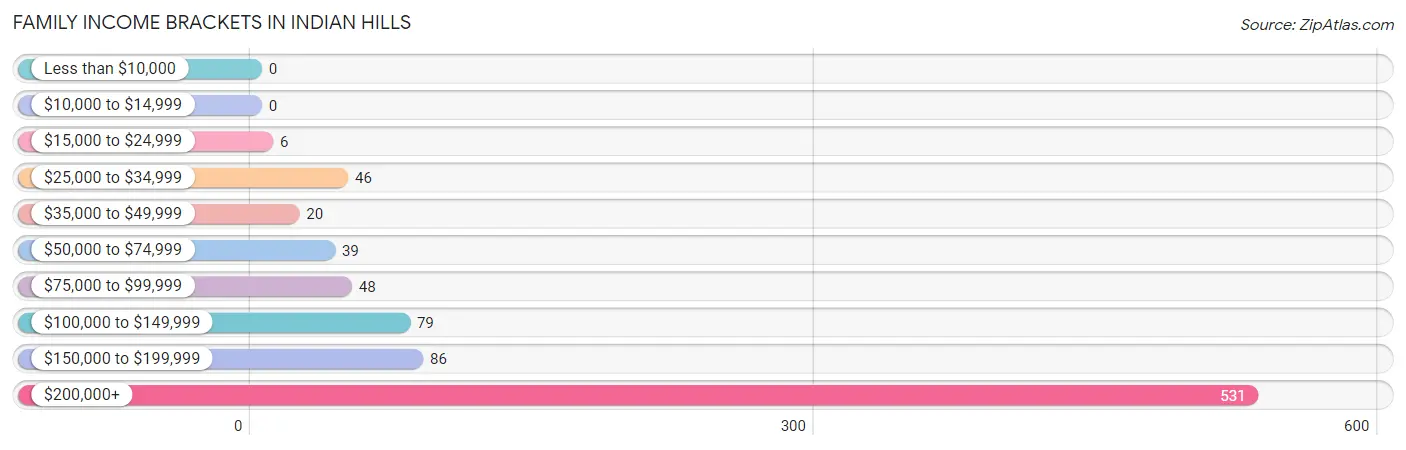
| Income Bracket | # Families | % Families |
| Less than $10,000 | 0 | 0.0% |
| $10,000 to $14,999 | 0 | 0.0% |
| $15,000 to $24,999 | 6 | 0.7% |
| $25,000 to $34,999 | 46 | 5.4% |
| $35,000 to $49,999 | 20 | 2.3% |
| $50,000 to $74,999 | 39 | 4.6% |
| $75,000 to $99,999 | 48 | 5.6% |
| $100,000 to $149,999 | 79 | 9.2% |
| $150,000 to $199,999 | 86 | 10.1% |
| $200,000+ | 531 | 62.1% |
Family Income by Famaliy Size in Indian Hills
3-person families (165 | 19.3%) account for the highest median family income in Indian Hills with $250,001 per family, while 2-person families (462 | 54.0%) have the highest median income of $110,060 per family member.
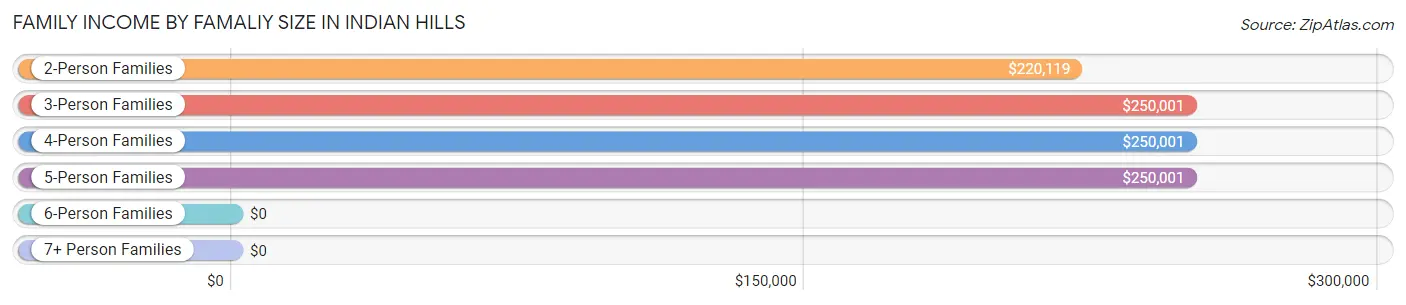
| Income Bracket | # Families | Median Income |
| 2-Person Families | 462 (54.0%) | $220,119 |
| 3-Person Families | 165 (19.3%) | $250,001 |
| 4-Person Families | 175 (20.5%) | $250,001 |
| 5-Person Families | 49 (5.7%) | $250,001 |
| 6-Person Families | 4 (0.5%) | $0 |
| 7+ Person Families | 0 (0.0%) | $0 |
| Total | 855 (100.0%) | $244,479 |
Family Income by Number of Earners in Indian Hills
The median family income in Indian Hills is $244,479, with families comprising 2 earners (342) having the highest median family income of $250,001, while families with no earners (159) have the lowest median family income of $140,313, accounting for 40.0% and 18.6% of families, respectively.
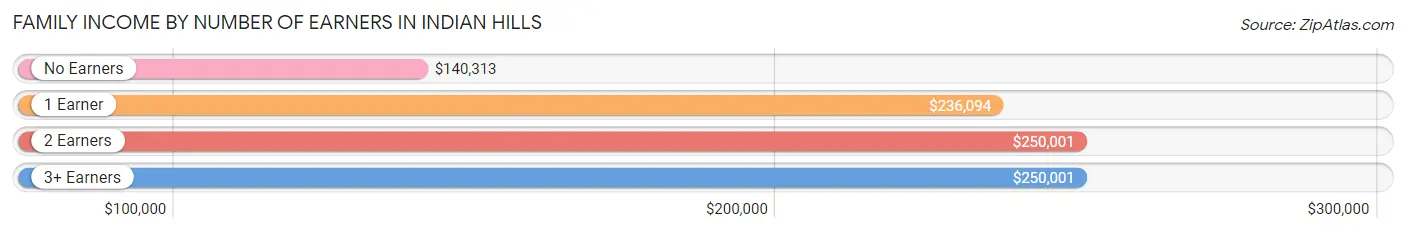
| Number of Earners | # Families | Median Income |
| No Earners | 159 (18.6%) | $140,313 |
| 1 Earner | 297 (34.7%) | $236,094 |
| 2 Earners | 342 (40.0%) | $250,001 |
| 3+ Earners | 57 (6.7%) | $250,001 |
| Total | 855 (100.0%) | $244,479 |
Household Income in Indian Hills
Household Income Brackets in Indian Hills
With 597 households falling in the category, the $200,000+ income range is the most frequent in Indian Hills, accounting for 46.5% of all households.
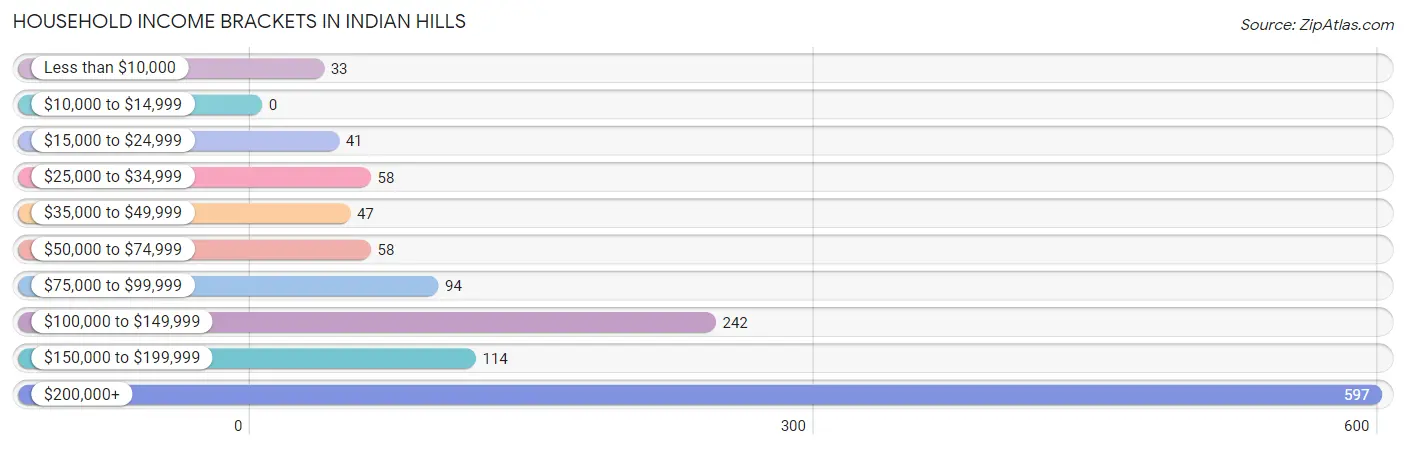
| Income Bracket | # Households | % Households |
| Less than $10,000 | 33 | 2.6% |
| $10,000 to $14,999 | 0 | 0.0% |
| $15,000 to $24,999 | 41 | 3.2% |
| $25,000 to $34,999 | 58 | 4.5% |
| $35,000 to $49,999 | 47 | 3.7% |
| $50,000 to $74,999 | 58 | 4.5% |
| $75,000 to $99,999 | 94 | 7.3% |
| $100,000 to $149,999 | 242 | 18.9% |
| $150,000 to $199,999 | 114 | 8.9% |
| $200,000+ | 597 | 46.5% |
Household Income by Householder Age in Indian Hills
The median household income in Indian Hills is $178,250, with the highest median household income of $250,001 found in the 25 to 44 years age bracket for the primary householder. A total of 236 households (18.4%) fall into this category.
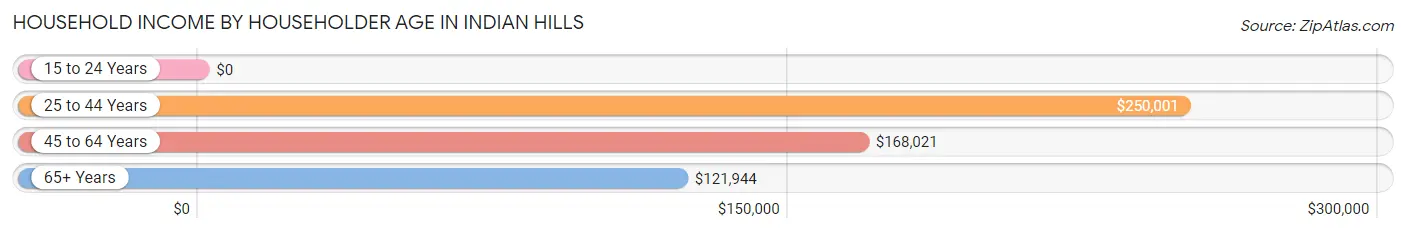
| Income Bracket | # Households | Median Income |
| 15 to 24 Years | 0 (0.0%) | $0 |
| 25 to 44 Years | 236 (18.4%) | $250,001 |
| 45 to 64 Years | 523 (40.8%) | $168,021 |
| 65+ Years | 524 (40.8%) | $121,944 |
| Total | 1,283 (100.0%) | $178,250 |
Poverty in Indian Hills
Income Below Poverty by Sex and Age in Indian Hills
With 1.0% poverty level for males and 3.3% for females among the residents of Indian Hills, 65 to 74 year old males and 45 to 54 year old females are the most vulnerable to poverty, with 15 males (6.8%) and 23 females (11.7%) in their respective age groups living below the poverty level.
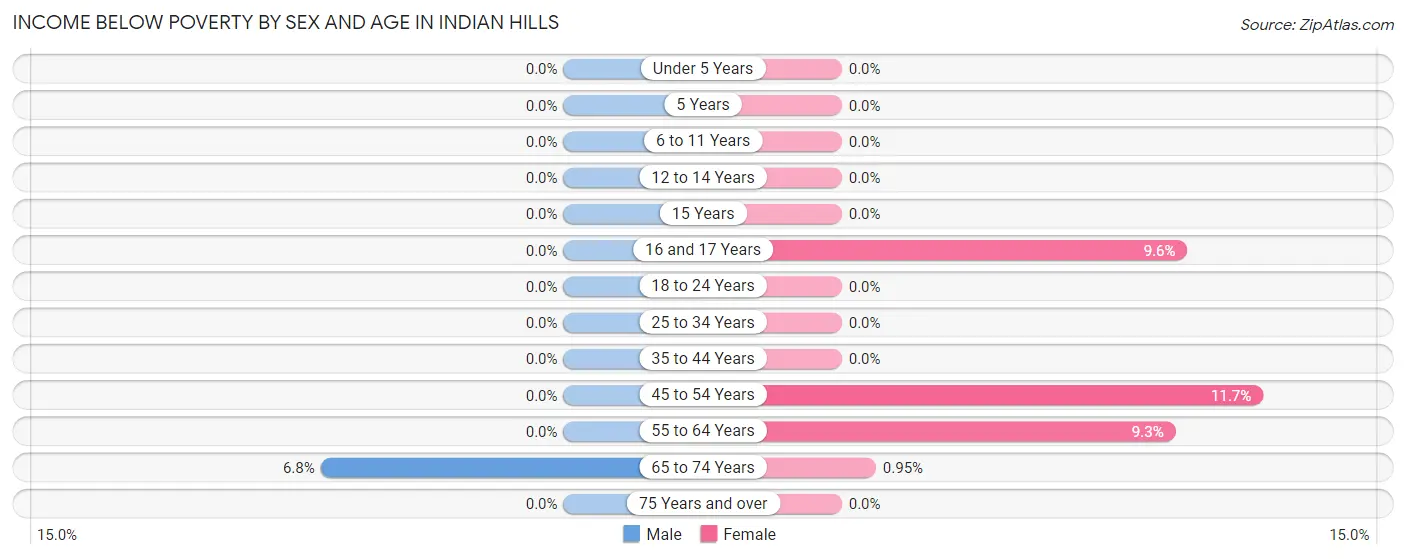
| Age Bracket | Male | Female |
| Under 5 Years | 0 (0.0%) | 0 (0.0%) |
| 5 Years | 0 (0.0%) | 0 (0.0%) |
| 6 to 11 Years | 0 (0.0%) | 0 (0.0%) |
| 12 to 14 Years | 0 (0.0%) | 0 (0.0%) |
| 15 Years | 0 (0.0%) | 0 (0.0%) |
| 16 and 17 Years | 0 (0.0%) | 5 (9.6%) |
| 18 to 24 Years | 0 (0.0%) | 0 (0.0%) |
| 25 to 34 Years | 0 (0.0%) | 0 (0.0%) |
| 35 to 44 Years | 0 (0.0%) | 0 (0.0%) |
| 45 to 54 Years | 0 (0.0%) | 23 (11.7%) |
| 55 to 64 Years | 0 (0.0%) | 17 (9.3%) |
| 65 to 74 Years | 15 (6.8%) | 3 (0.9%) |
| 75 Years and over | 0 (0.0%) | 0 (0.0%) |
| Total | 15 (1.0%) | 48 (3.3%) |
Income Above Poverty by Sex and Age in Indian Hills
According to the poverty statistics in Indian Hills, males aged under 5 years and females aged under 5 years are the age groups that are most secure financially, with 100.0% of males and 100.0% of females in these age groups living above the poverty line.
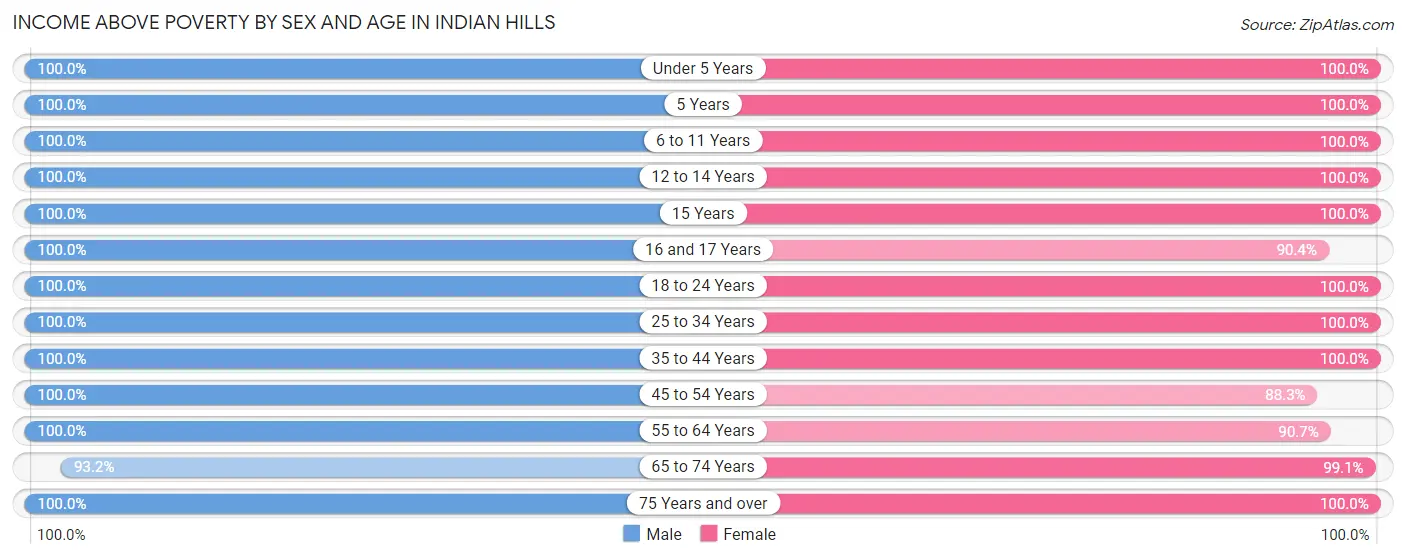
| Age Bracket | Male | Female |
| Under 5 Years | 78 (100.0%) | 32 (100.0%) |
| 5 Years | 29 (100.0%) | 22 (100.0%) |
| 6 to 11 Years | 103 (100.0%) | 80 (100.0%) |
| 12 to 14 Years | 56 (100.0%) | 43 (100.0%) |
| 15 Years | 21 (100.0%) | 52 (100.0%) |
| 16 and 17 Years | 17 (100.0%) | 47 (90.4%) |
| 18 to 24 Years | 46 (100.0%) | 34 (100.0%) |
| 25 to 34 Years | 74 (100.0%) | 64 (100.0%) |
| 35 to 44 Years | 176 (100.0%) | 181 (100.0%) |
| 45 to 54 Years | 179 (100.0%) | 173 (88.3%) |
| 55 to 64 Years | 241 (100.0%) | 166 (90.7%) |
| 65 to 74 Years | 207 (93.2%) | 314 (99.1%) |
| 75 Years and over | 213 (100.0%) | 180 (100.0%) |
| Total | 1,440 (99.0%) | 1,388 (96.7%) |
Income Below Poverty Among Married-Couple Families in Indian Hills
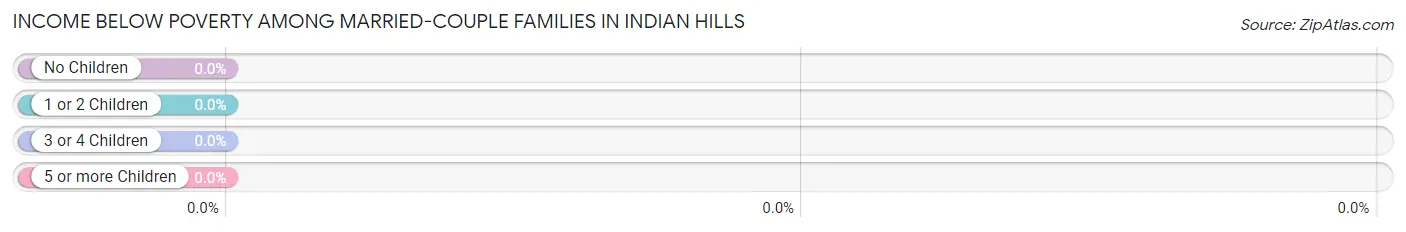
| Children | Above Poverty | Below Poverty |
| No Children | 485 (100.0%) | 0 (0.0%) |
| 1 or 2 Children | 215 (100.0%) | 0 (0.0%) |
| 3 or 4 Children | 53 (100.0%) | 0 (0.0%) |
| 5 or more Children | 0 (0.0%) | 0 (0.0%) |
| Total | 753 (100.0%) | 0 (0.0%) |
Income Below Poverty Among Single-Parent Households in Indian Hills
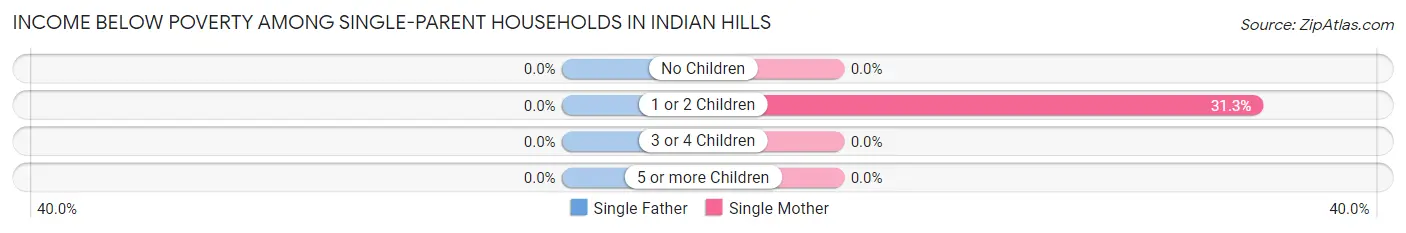
| Children | Single Father | Single Mother |
| No Children | 0 (0.0%) | 0 (0.0%) |
| 1 or 2 Children | 0 (0.0%) | 5 (31.2%) |
| 3 or 4 Children | 0 (0.0%) | 0 (0.0%) |
| 5 or more Children | 0 (0.0%) | 0 (0.0%) |
| Total | 0 (0.0%) | 5 (8.6%) |
Income Below Poverty Among Married-Couple vs Single-Parent Households in Indian Hills
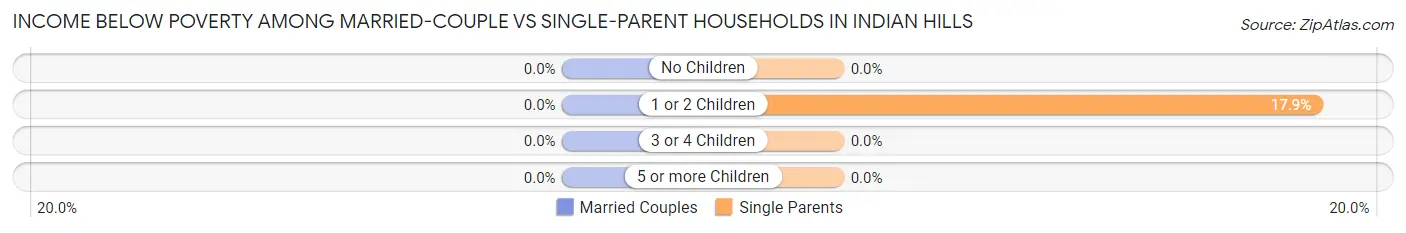
| Children | Married-Couple Families | Single-Parent Households |
| No Children | 0 (0.0%) | 0 (0.0%) |
| 1 or 2 Children | 0 (0.0%) | 5 (17.9%) |
| 3 or 4 Children | 0 (0.0%) | 0 (0.0%) |
| 5 or more Children | 0 (0.0%) | 0 (0.0%) |
| Total | 0 (0.0%) | 5 (4.9%) |
Race in Indian Hills
The most populous races in Indian Hills are White / Caucasian (2,709 | 93.7%), Asian (114 | 3.9%), and Some other Race (30 | 1.0%).
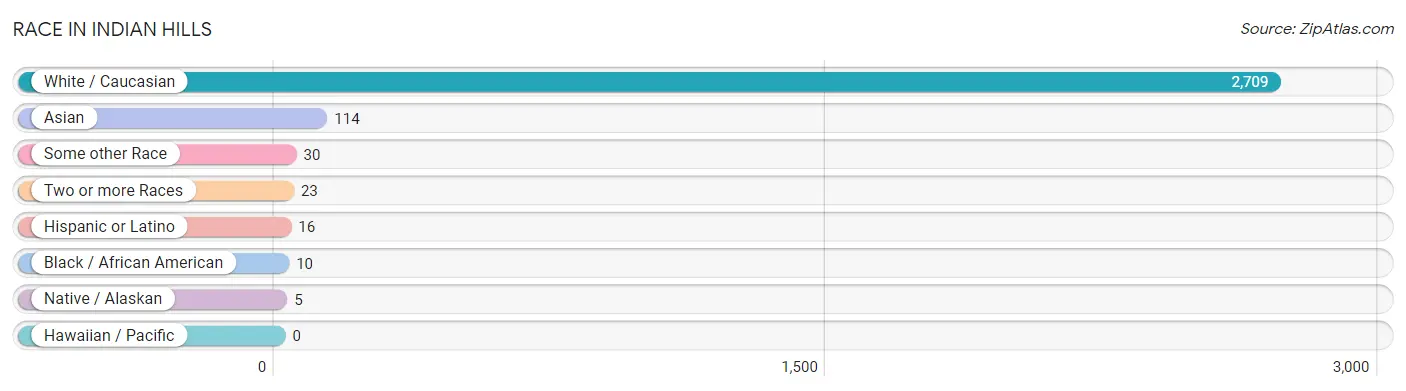
| Race | # Population | % Population |
| Asian | 114 | 3.9% |
| Black / African American | 10 | 0.4% |
| Hawaiian / Pacific | 0 | 0.0% |
| Hispanic or Latino | 16 | 0.5% |
| Native / Alaskan | 5 | 0.2% |
| White / Caucasian | 2,709 | 93.7% |
| Two or more Races | 23 | 0.8% |
| Some other Race | 30 | 1.0% |
| Total | 2,891 | 100.0% |
Ancestry in Indian Hills
The most populous ancestries reported in Indian Hills are English (772 | 26.7%), German (701 | 24.2%), Irish (423 | 14.6%), Italian (154 | 5.3%), and American (113 | 3.9%), together accounting for 74.8% of all Indian Hills residents.
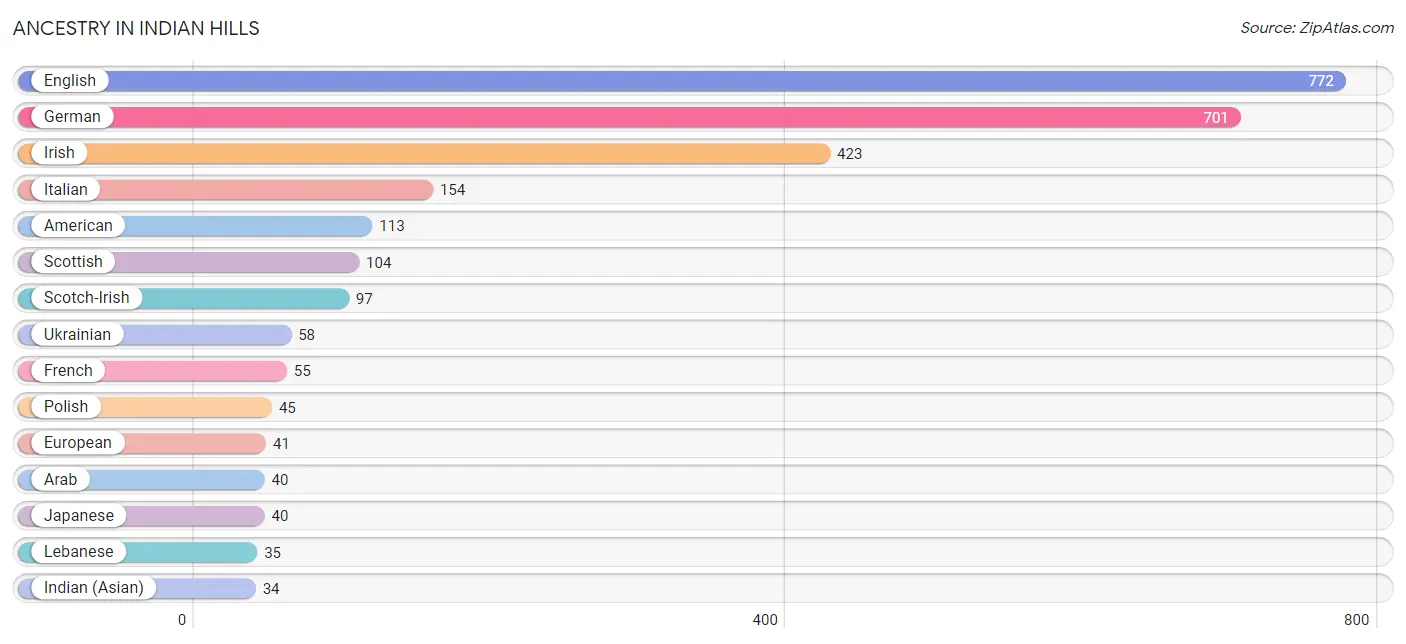
| Ancestry | # Population | % Population |
| American | 113 | 3.9% |
| Arab | 40 | 1.4% |
| Austrian | 6 | 0.2% |
| Belgian | 4 | 0.1% |
| Bhutanese | 12 | 0.4% |
| British | 31 | 1.1% |
| Burmese | 15 | 0.5% |
| Canadian | 31 | 1.1% |
| Central American | 11 | 0.4% |
| Central American Indian | 5 | 0.2% |
| Danish | 20 | 0.7% |
| Dutch | 7 | 0.2% |
| Eastern European | 17 | 0.6% |
| English | 772 | 26.7% |
| European | 41 | 1.4% |
| Finnish | 13 | 0.4% |
| French | 55 | 1.9% |
| French Canadian | 9 | 0.3% |
| German | 701 | 24.2% |
| Greek | 22 | 0.8% |
| Guatemalan | 11 | 0.4% |
| Hungarian | 8 | 0.3% |
| Indian (Asian) | 34 | 1.2% |
| Irish | 423 | 14.6% |
| Italian | 154 | 5.3% |
| Japanese | 40 | 1.4% |
| Lebanese | 35 | 1.2% |
| Lithuanian | 18 | 0.6% |
| Northern European | 13 | 0.4% |
| Norwegian | 1 | 0.0% |
| Polish | 45 | 1.6% |
| Portuguese | 5 | 0.2% |
| Puerto Rican | 5 | 0.2% |
| Russian | 19 | 0.7% |
| Scotch-Irish | 97 | 3.4% |
| Scottish | 104 | 3.6% |
| South African | 5 | 0.2% |
| Subsaharan African | 5 | 0.2% |
| Swedish | 10 | 0.4% |
| Swiss | 22 | 0.8% |
| Syrian | 5 | 0.2% |
| Thai | 18 | 0.6% |
| Turkish | 19 | 0.7% |
| Ukrainian | 58 | 2.0% |
| Welsh | 24 | 0.8% |
| Zimbabwean | 5 | 0.2% | View All 46 Rows |
Immigrants in Indian Hills
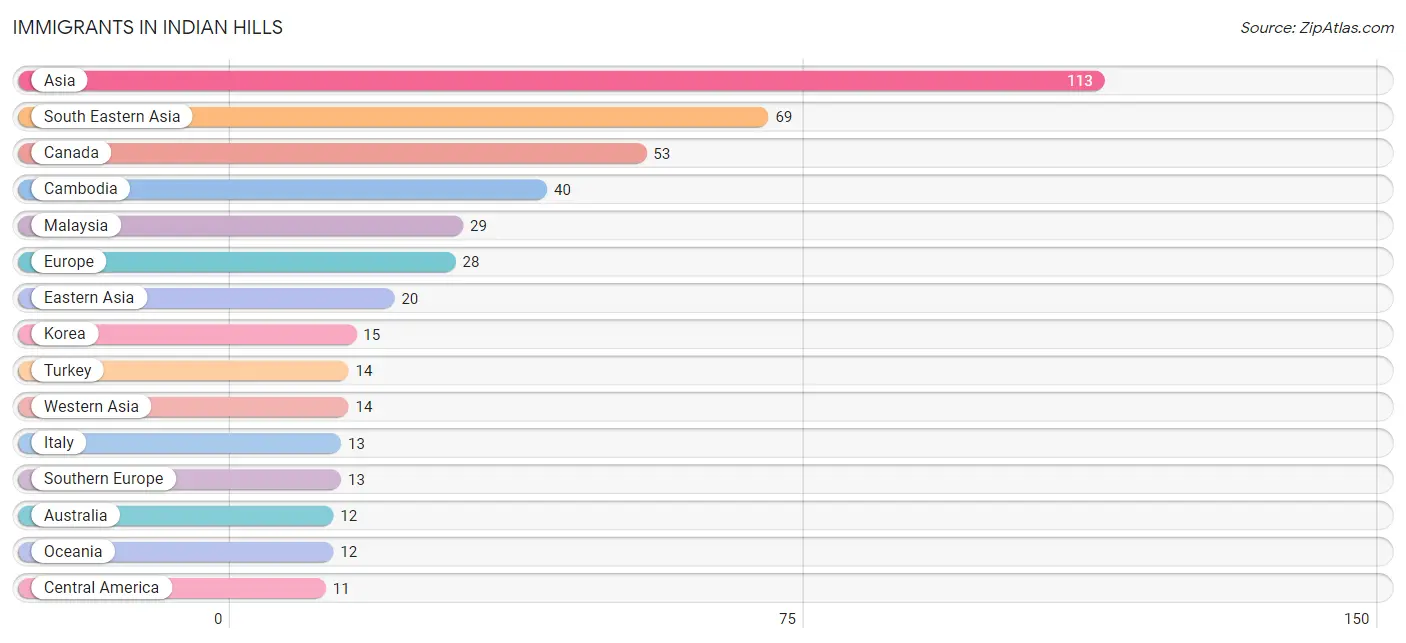
The most numerous immigrant groups reported in Indian Hills came from Asia (113 | 3.9%), South Eastern Asia (69 | 2.4%), Canada (53 | 1.8%), Cambodia (40 | 1.4%), and Malaysia (29 | 1.0%), together accounting for 10.5% of all Indian Hills residents.
| Immigration Origin | # Population | % Population |
| Africa | 5 | 0.2% |
| Asia | 113 | 3.9% |
| Australia | 12 | 0.4% |
| Cambodia | 40 | 1.4% |
| Canada | 53 | 1.8% |
| Central America | 11 | 0.4% |
| Eastern Africa | 5 | 0.2% |
| Eastern Asia | 20 | 0.7% |
| Eastern Europe | 5 | 0.2% |
| England | 4 | 0.1% |
| Europe | 28 | 1.0% |
| Germany | 6 | 0.2% |
| Guatemala | 11 | 0.4% |
| India | 10 | 0.4% |
| Italy | 13 | 0.4% |
| Japan | 5 | 0.2% |
| Korea | 15 | 0.5% |
| Latin America | 11 | 0.4% |
| Malaysia | 29 | 1.0% |
| Northern Europe | 4 | 0.1% |
| Oceania | 12 | 0.4% |
| Russia | 5 | 0.2% |
| South Central Asia | 10 | 0.4% |
| South Eastern Asia | 69 | 2.4% |
| Southern Europe | 13 | 0.4% |
| Turkey | 14 | 0.5% |
| Western Asia | 14 | 0.5% |
| Western Europe | 6 | 0.2% |
| Zimbabwe | 5 | 0.2% | View All 29 Rows |
Sex and Age in Indian Hills
Sex and Age in Indian Hills
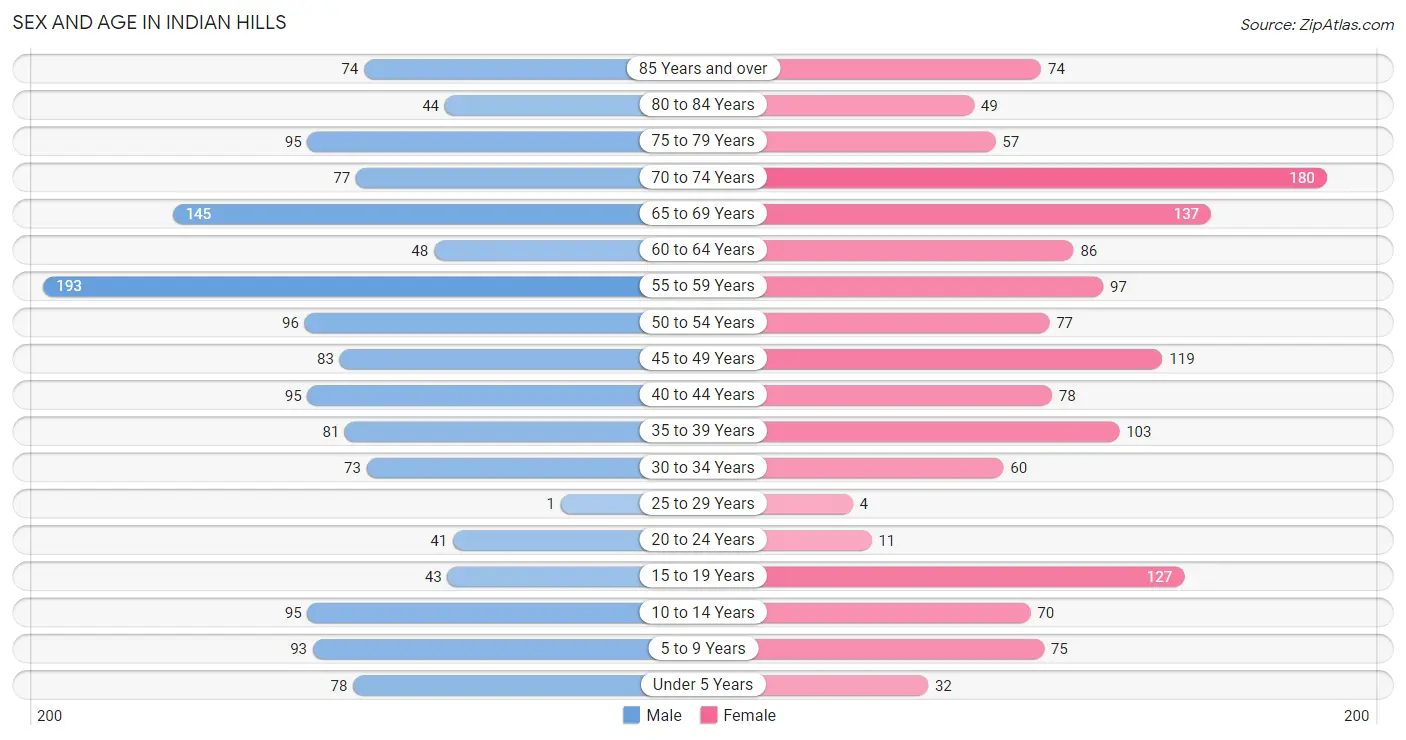
The most populous age groups in Indian Hills are 55 to 59 Years (193 | 13.3%) for men and 70 to 74 Years (180 | 12.5%) for women.
| Age Bracket | Male | Female |
| Under 5 Years | 78 (5.4%) | 32 (2.2%) |
| 5 to 9 Years | 93 (6.4%) | 75 (5.2%) |
| 10 to 14 Years | 95 (6.5%) | 70 (4.9%) |
| 15 to 19 Years | 43 (3.0%) | 127 (8.8%) |
| 20 to 24 Years | 41 (2.8%) | 11 (0.8%) |
| 25 to 29 Years | 1 (0.1%) | 4 (0.3%) |
| 30 to 34 Years | 73 (5.0%) | 60 (4.2%) |
| 35 to 39 Years | 81 (5.6%) | 103 (7.2%) |
| 40 to 44 Years | 95 (6.5%) | 78 (5.4%) |
| 45 to 49 Years | 83 (5.7%) | 119 (8.3%) |
| 50 to 54 Years | 96 (6.6%) | 77 (5.4%) |
| 55 to 59 Years | 193 (13.3%) | 97 (6.8%) |
| 60 to 64 Years | 48 (3.3%) | 86 (6.0%) |
| 65 to 69 Years | 145 (10.0%) | 137 (9.5%) |
| 70 to 74 Years | 77 (5.3%) | 180 (12.5%) |
| 75 to 79 Years | 95 (6.5%) | 57 (4.0%) |
| 80 to 84 Years | 44 (3.0%) | 49 (3.4%) |
| 85 Years and over | 74 (5.1%) | 74 (5.1%) |
| Total | 1,455 (100.0%) | 1,436 (100.0%) |
Families and Households in Indian Hills
Median Family Size in Indian Hills
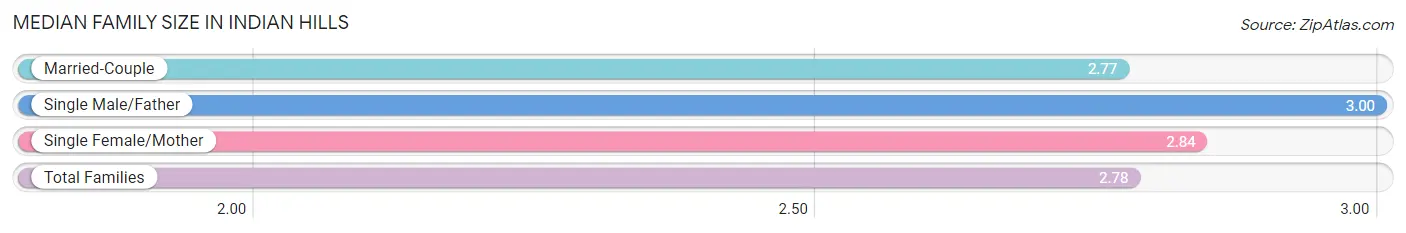
The median family size in Indian Hills is 2.78 persons per family, with single male/father families (44 | 5.1%) accounting for the largest median family size of 3 persons per family. On the other hand, married-couple families (753 | 88.1%) represent the smallest median family size with 2.77 persons per family.
| Family Type | # Families | Family Size |
| Married-Couple | 753 (88.1%) | 2.77 |
| Single Male/Father | 44 (5.1%) | 3.00 |
| Single Female/Mother | 58 (6.8%) | 2.84 |
| Total Families | 855 (100.0%) | 2.78 |
Median Household Size in Indian Hills
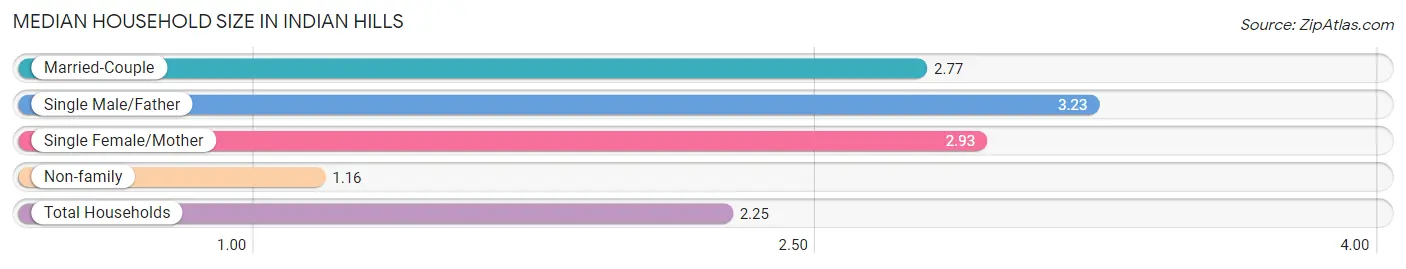
The median household size in Indian Hills is 2.25 persons per household, with single male/father households (44 | 3.4%) accounting for the largest median household size of 3.23 persons per household. non-family households (428 | 33.4%) represent the smallest median household size with 1.16 persons per household.
| Household Type | # Households | Household Size |
| Married-Couple | 753 (58.7%) | 2.77 |
| Single Male/Father | 44 (3.4%) | 3.23 |
| Single Female/Mother | 58 (4.5%) | 2.93 |
| Non-family | 428 (33.4%) | 1.16 |
| Total Households | 1,283 (100.0%) | 2.25 |
Household Size by Marriage Status in Indian Hills
Out of a total of 1,283 households in Indian Hills, 855 (66.6%) are family households, while 428 (33.4%) are nonfamily households. The most numerous type of family households are 2-person households, comprising 462, and the most common type of nonfamily households are 1-person households, comprising 364.
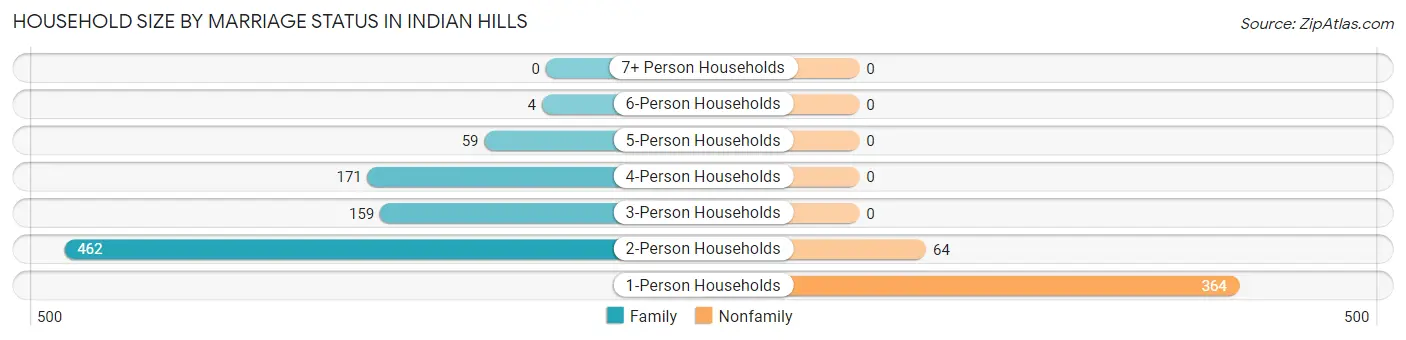
| Household Size | Family Households | Nonfamily Households |
| 1-Person Households | - | 364 (28.4%) |
| 2-Person Households | 462 (36.0%) | 64 (5.0%) |
| 3-Person Households | 159 (12.4%) | 0 (0.0%) |
| 4-Person Households | 171 (13.3%) | 0 (0.0%) |
| 5-Person Households | 59 (4.6%) | 0 (0.0%) |
| 6-Person Households | 4 (0.3%) | 0 (0.0%) |
| 7+ Person Households | 0 (0.0%) | 0 (0.0%) |
| Total | 855 (66.6%) | 428 (33.4%) |
Female Fertility in Indian Hills
Fertility by Age in Indian Hills
Average fertility rate in Indian Hills is 81.0 births per 1,000 women. Women in the age bracket of 20 to 34 years have the highest fertility rate with 280.0 births per 1,000 women. Women in the age bracket of 20 to 34 years acount for 50.0% of all women with births.
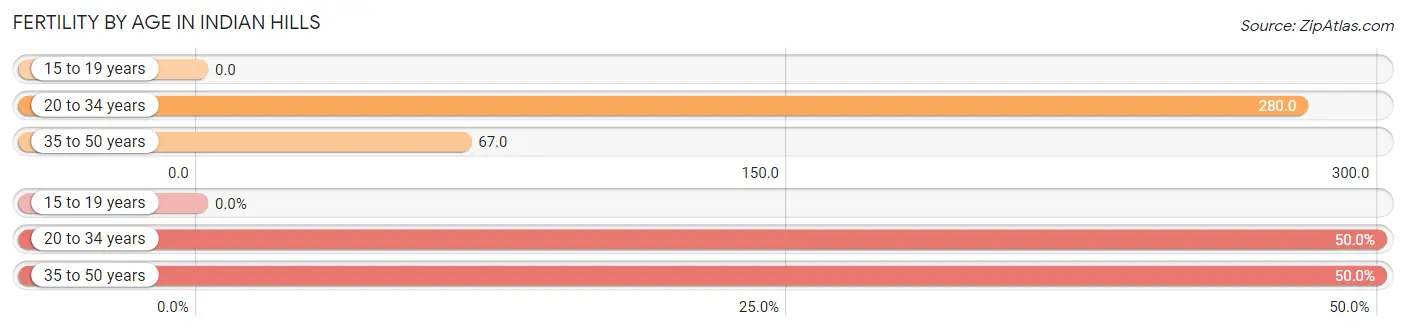
| Age Bracket | Women with Births | Births / 1,000 Women |
| 15 to 19 years | 0 (0.0%) | 0.0 |
| 20 to 34 years | 21 (50.0%) | 280.0 |
| 35 to 50 years | 21 (50.0%) | 67.0 |
| Total | 42 (100.0%) | 81.0 |
Fertility by Age by Marriage Status in Indian Hills
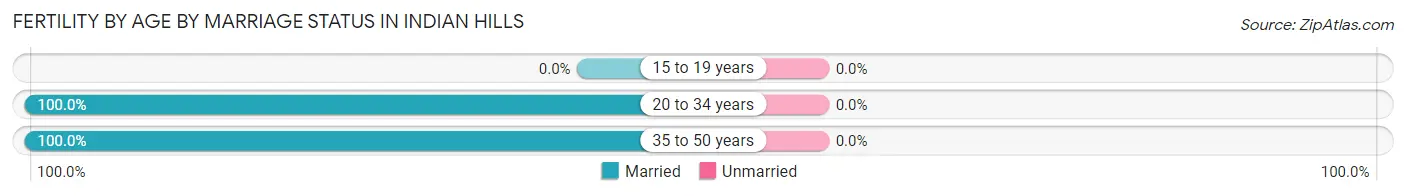
| Age Bracket | Married | Unmarried |
| 15 to 19 years | 0 (0.0%) | 0 (0.0%) |
| 20 to 34 years | 21 (100.0%) | 0 (0.0%) |
| 35 to 50 years | 21 (100.0%) | 0 (0.0%) |
| Total | 42 (100.0%) | 0 (0.0%) |
Fertility by Education in Indian Hills
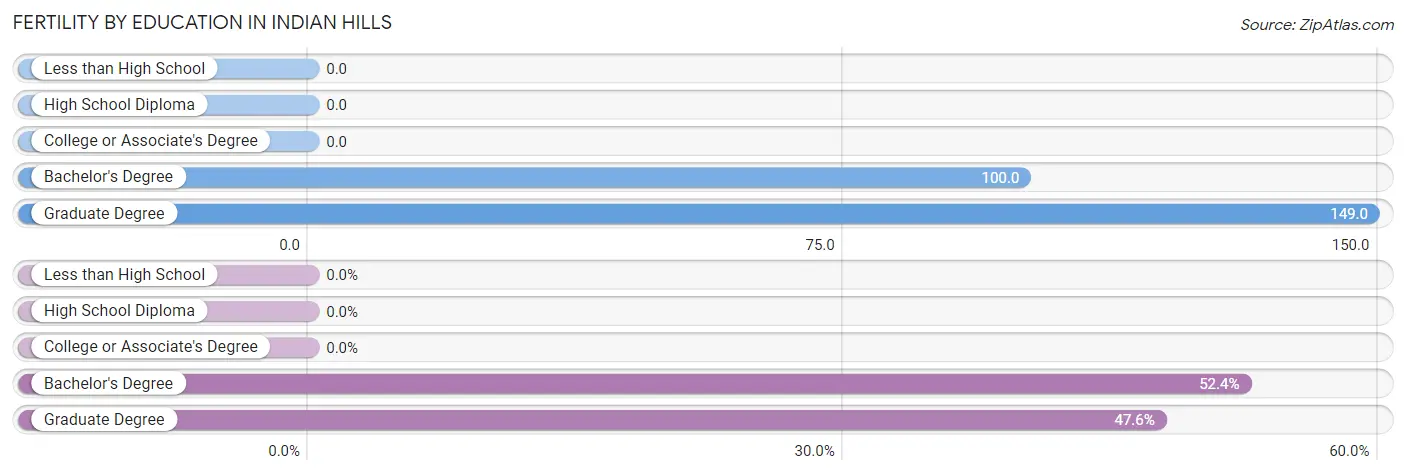
| Educational Attainment | Women with Births | Births / 1,000 Women |
| Less than High School | 0 (0.0%) | 0.0 |
| High School Diploma | 0 (0.0%) | 0.0 |
| College or Associate's Degree | 0 (0.0%) | 0.0 |
| Bachelor's Degree | 22 (52.4%) | 100.0 |
| Graduate Degree | 20 (47.6%) | 149.0 |
| Total | 42 (100.0%) | 81.0 |
Fertility by Education by Marriage Status in Indian Hills
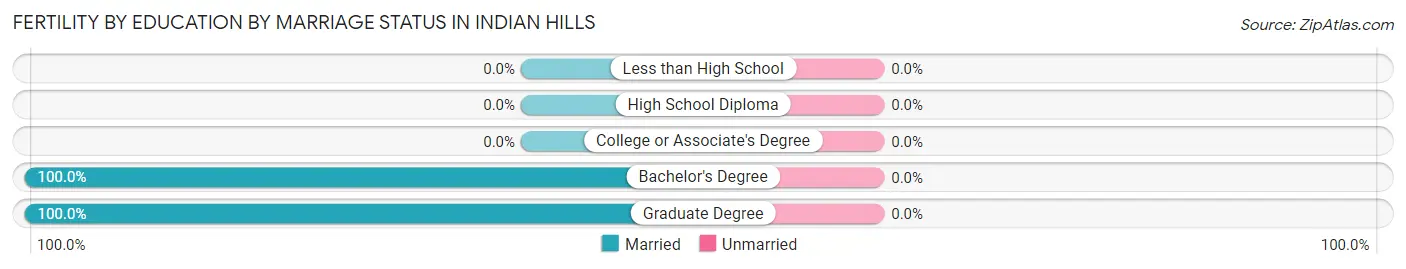
| Educational Attainment | Married | Unmarried |
| Less than High School | 0 (0.0%) | 0 (0.0%) |
| High School Diploma | 0 (0.0%) | 0 (0.0%) |
| College or Associate's Degree | 0 (0.0%) | 0 (0.0%) |
| Bachelor's Degree | 22 (100.0%) | 0 (0.0%) |
| Graduate Degree | 20 (100.0%) | 0 (0.0%) |
| Total | 42 (100.0%) | 0 (0.0%) |
Employment Characteristics in Indian Hills
Employment by Class of Employer in Indian Hills
Among the 1,300 employed individuals in Indian Hills, private company employees (848 | 65.2%), self-employed (incorporated) (188 | 14.5%), and not-for-profit organizations (115 | 8.8%) make up the most common classes of employment.
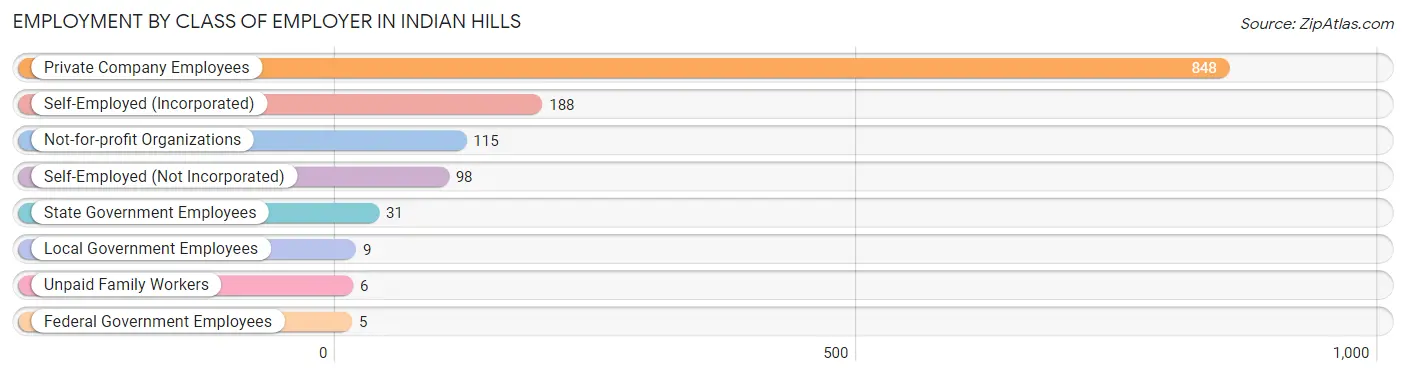
| Employer Class | # Employees | % Employees |
| Private Company Employees | 848 | 65.2% |
| Self-Employed (Incorporated) | 188 | 14.5% |
| Self-Employed (Not Incorporated) | 98 | 7.5% |
| Not-for-profit Organizations | 115 | 8.8% |
| Local Government Employees | 9 | 0.7% |
| State Government Employees | 31 | 2.4% |
| Federal Government Employees | 5 | 0.4% |
| Unpaid Family Workers | 6 | 0.5% |
| Total | 1,300 | 100.0% |
Employment Status by Age in Indian Hills
According to the labor force statistics for Indian Hills, out of the total population over 16 years of age (2,375), 56.6% or 1,344 individuals are in the labor force, with 2.1% or 28 of them unemployed. The age group with the highest labor force participation rate is 30 to 34 years, with 88.0% or 117 individuals in the labor force. Within the labor force, the 20 to 24 years age range has the highest percentage of unemployed individuals, with 13.3% or 4 of them being unemployed.
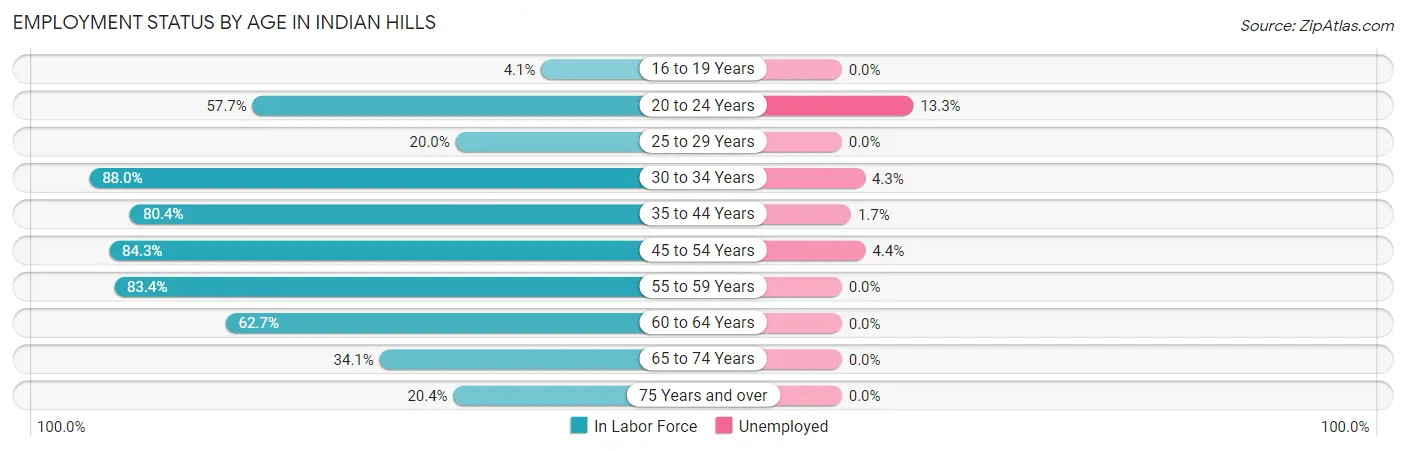
| Age Bracket | In Labor Force | Unemployed |
| 16 to 19 Years | 4 (4.1%) | 0 (0.0%) |
| 20 to 24 Years | 30 (57.7%) | 4 (13.3%) |
| 25 to 29 Years | 1 (20.0%) | 0 (0.0%) |
| 30 to 34 Years | 117 (88.0%) | 5 (4.3%) |
| 35 to 44 Years | 287 (80.4%) | 5 (1.7%) |
| 45 to 54 Years | 316 (84.3%) | 14 (4.4%) |
| 55 to 59 Years | 242 (83.4%) | 0 (0.0%) |
| 60 to 64 Years | 84 (62.7%) | 0 (0.0%) |
| 65 to 74 Years | 184 (34.1%) | 0 (0.0%) |
| 75 Years and over | 80 (20.4%) | 0 (0.0%) |
| Total | 1,344 (56.6%) | 28 (2.1%) |
Employment Status by Educational Attainment in Indian Hills
According to labor force statistics for Indian Hills, 80.9% of individuals (1,047) out of the total population between 25 and 64 years of age (1,294) are in the labor force, with 2.3% or 24 of them being unemployed. The group with the highest labor force participation rate are those with the educational attainment of less than high school, with 100.0% or 6 individuals in the labor force. Within the labor force, individuals with college / associate degree education have the highest percentage of unemployment, with 5.4% or 5 of them being unemployed.
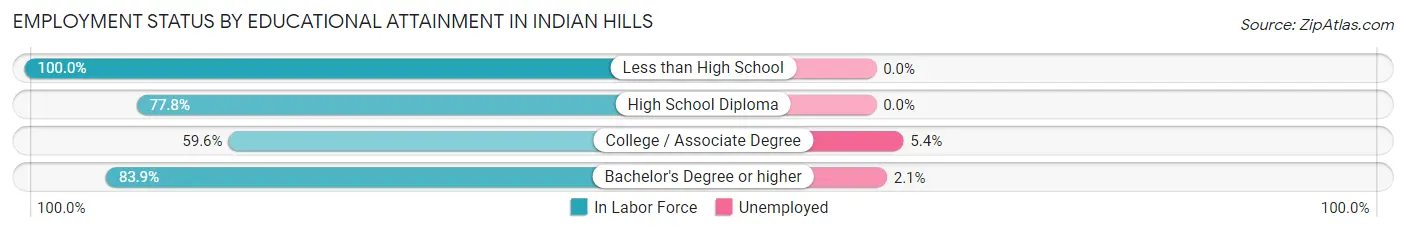
| Educational Attainment | In Labor Force | Unemployed |
| Less than High School | 6 (100.0%) | 0 (0.0%) |
| High School Diploma | 28 (77.8%) | 0 (0.0%) |
| College / Associate Degree | 93 (59.6%) | 8 (5.4%) |
| Bachelor's Degree or higher | 920 (83.9%) | 23 (2.1%) |
| Total | 1,047 (80.9%) | 30 (2.3%) |
Employment Occupations by Sex in Indian Hills
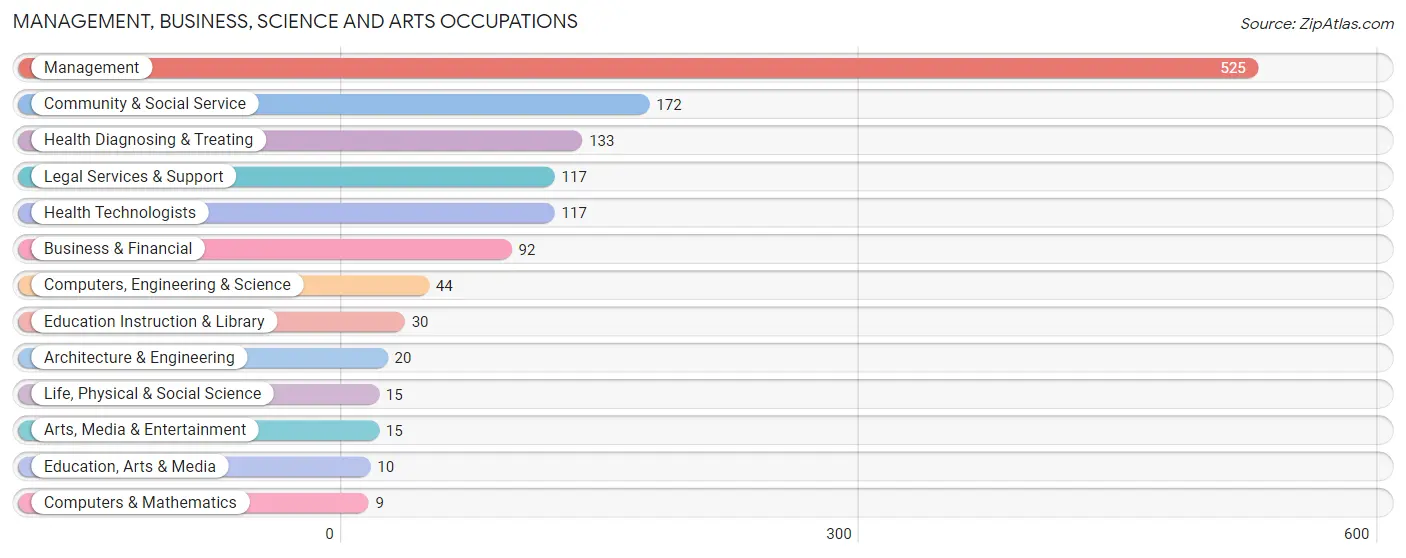
Management, Business, Science and Arts Occupations
The most common Management, Business, Science and Arts occupations in Indian Hills are Management (525 | 39.9%), Community & Social Service (172 | 13.1%), Health Diagnosing & Treating (133 | 10.1%), Legal Services & Support (117 | 8.9%), and Health Technologists (117 | 8.9%).
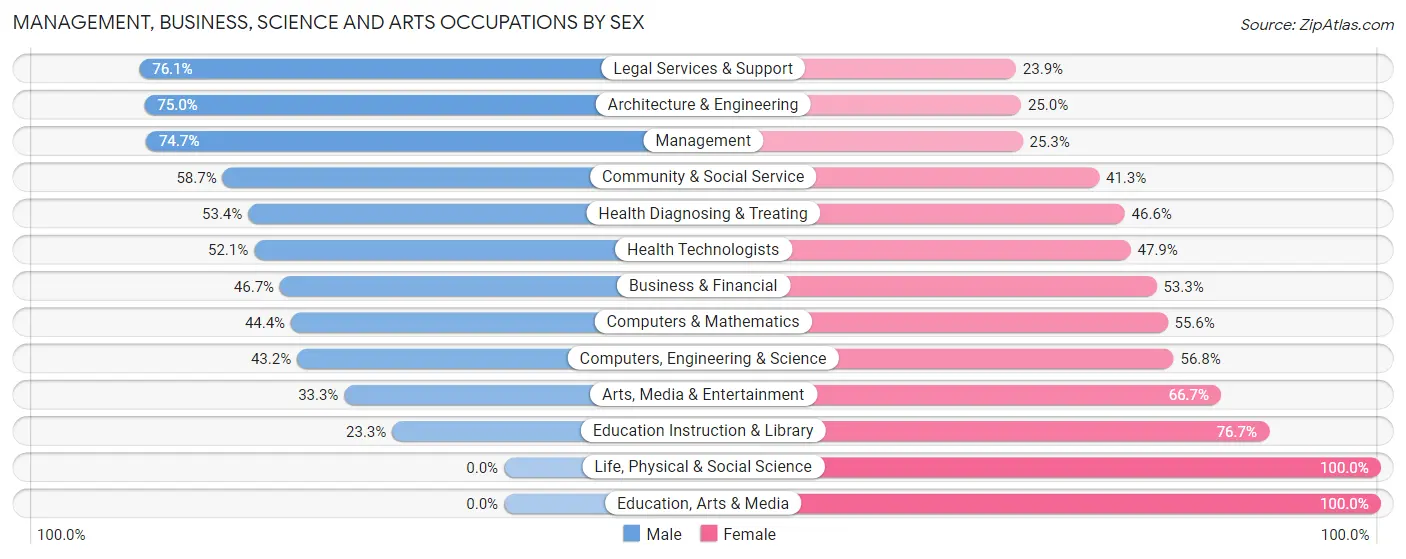
Management, Business, Science and Arts Occupations by Sex
Within the Management, Business, Science and Arts occupations in Indian Hills, the most male-oriented occupations are Legal Services & Support (76.1%), Architecture & Engineering (75.0%), and Management (74.7%), while the most female-oriented occupations are Life, Physical & Social Science (100.0%), Education, Arts & Media (100.0%), and Education Instruction & Library (76.7%).
| Occupation | Male | Female |
| Management | 392 (74.7%) | 133 (25.3%) |
| Business & Financial | 43 (46.7%) | 49 (53.3%) |
| Computers, Engineering & Science | 19 (43.2%) | 25 (56.8%) |
| Computers & Mathematics | 4 (44.4%) | 5 (55.6%) |
| Architecture & Engineering | 15 (75.0%) | 5 (25.0%) |
| Life, Physical & Social Science | 0 (0.0%) | 15 (100.0%) |
| Community & Social Service | 101 (58.7%) | 71 (41.3%) |
| Education, Arts & Media | 0 (0.0%) | 10 (100.0%) |
| Legal Services & Support | 89 (76.1%) | 28 (23.9%) |
| Education Instruction & Library | 7 (23.3%) | 23 (76.7%) |
| Arts, Media & Entertainment | 5 (33.3%) | 10 (66.7%) |
| Health Diagnosing & Treating | 71 (53.4%) | 62 (46.6%) |
| Health Technologists | 61 (52.1%) | 56 (47.9%) |
| Total (Category) | 626 (64.8%) | 340 (35.2%) |
| Total (Overall) | 785 (59.6%) | 532 (40.4%) |
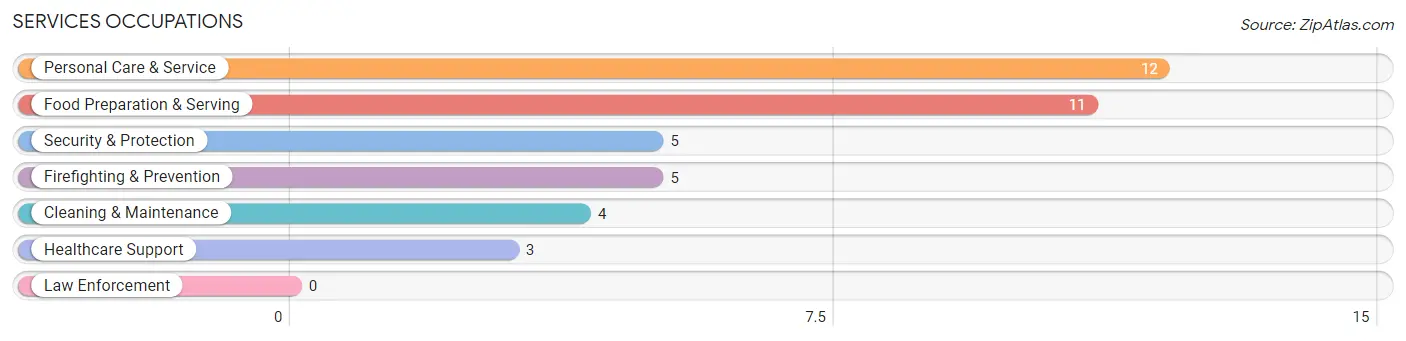
Services Occupations
The most common Services occupations in Indian Hills are Personal Care & Service (12 | 0.9%), Food Preparation & Serving (11 | 0.8%), Security & Protection (5 | 0.4%), Firefighting & Prevention (5 | 0.4%), and Cleaning & Maintenance (4 | 0.3%).
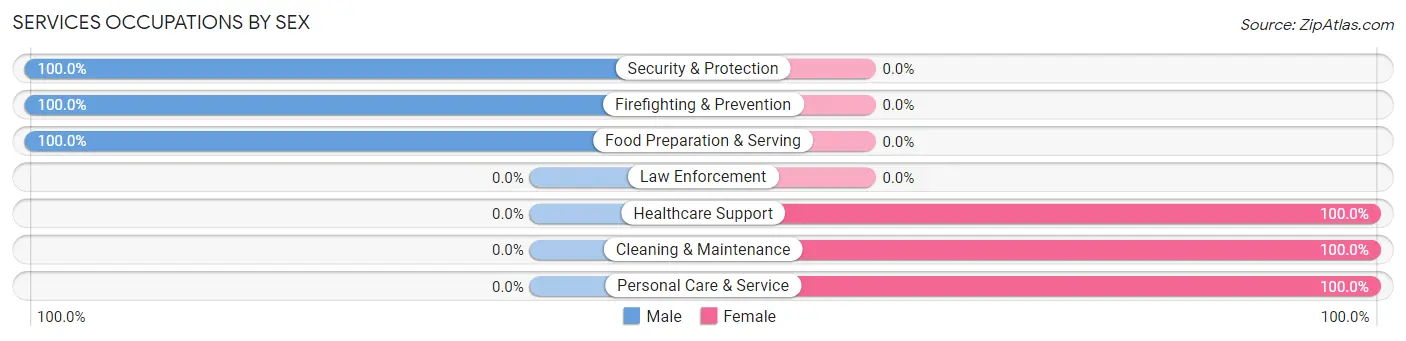
Services Occupations by Sex
Within the Services occupations in Indian Hills, the most male-oriented occupations are Security & Protection (100.0%), Firefighting & Prevention (100.0%), and Food Preparation & Serving (100.0%), while the most female-oriented occupations are Healthcare Support (100.0%), Cleaning & Maintenance (100.0%), and Personal Care & Service (100.0%).
| Occupation | Male | Female |
| Healthcare Support | 0 (0.0%) | 3 (100.0%) |
| Security & Protection | 5 (100.0%) | 0 (0.0%) |
| Firefighting & Prevention | 5 (100.0%) | 0 (0.0%) |
| Law Enforcement | 0 (0.0%) | 0 (0.0%) |
| Food Preparation & Serving | 11 (100.0%) | 0 (0.0%) |
| Cleaning & Maintenance | 0 (0.0%) | 4 (100.0%) |
| Personal Care & Service | 0 (0.0%) | 12 (100.0%) |
| Total (Category) | 16 (45.7%) | 19 (54.3%) |
| Total (Overall) | 785 (59.6%) | 532 (40.4%) |
Sales and Office Occupations
The most common Sales and Office occupations in Indian Hills are Sales & Related (147 | 11.2%), and Office & Administration (92 | 7.0%).
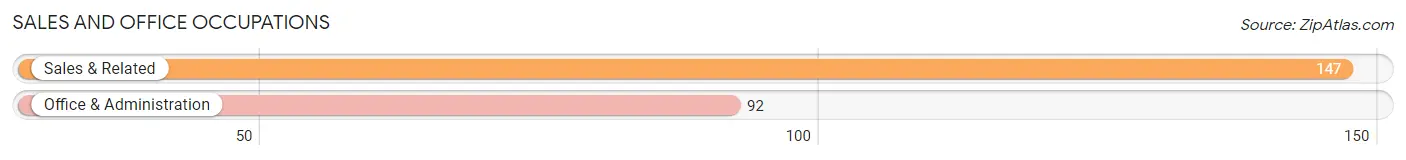
Sales and Office Occupations by Sex
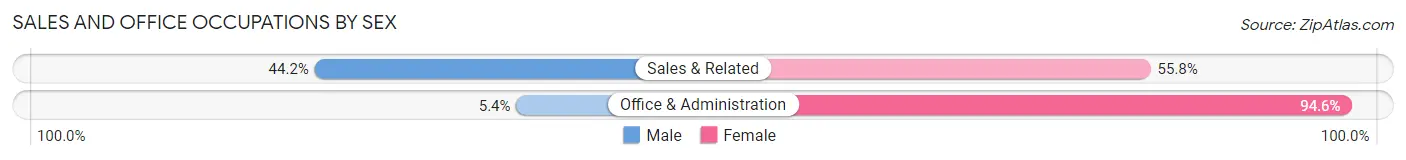
| Occupation | Male | Female |
| Sales & Related | 65 (44.2%) | 82 (55.8%) |
| Office & Administration | 5 (5.4%) | 87 (94.6%) |
| Total (Category) | 70 (29.3%) | 169 (70.7%) |
| Total (Overall) | 785 (59.6%) | 532 (40.4%) |
Natural Resources, Construction and Maintenance Occupations
The most common Natural Resources, Construction and Maintenance occupations in Indian Hills are Installation, Maintenance & Repair (11 | 0.8%), and Construction & Extraction (5 | 0.4%).
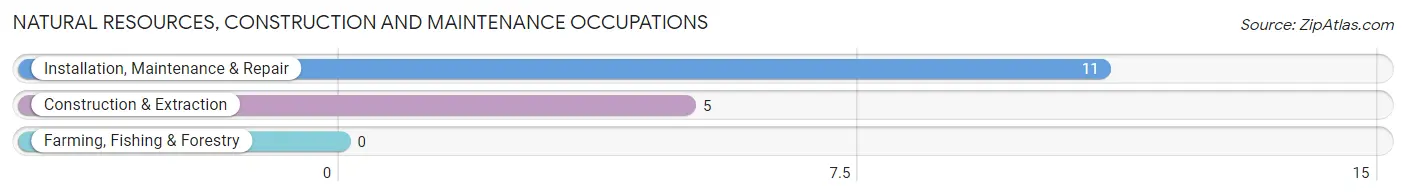
Natural Resources, Construction and Maintenance Occupations by Sex
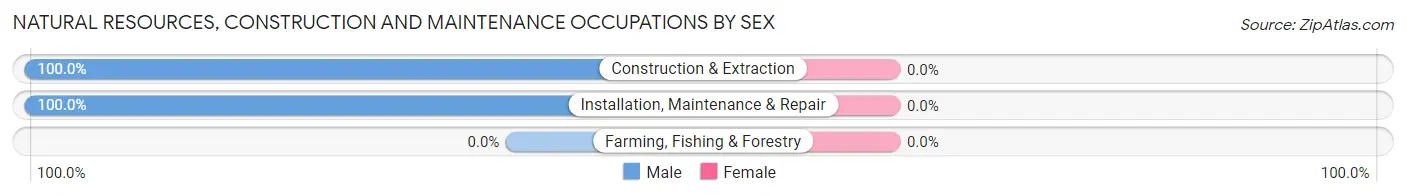
| Occupation | Male | Female |
| Farming, Fishing & Forestry | 0 (0.0%) | 0 (0.0%) |
| Construction & Extraction | 5 (100.0%) | 0 (0.0%) |
| Installation, Maintenance & Repair | 11 (100.0%) | 0 (0.0%) |
| Total (Category) | 16 (100.0%) | 0 (0.0%) |
| Total (Overall) | 785 (59.6%) | 532 (40.4%) |
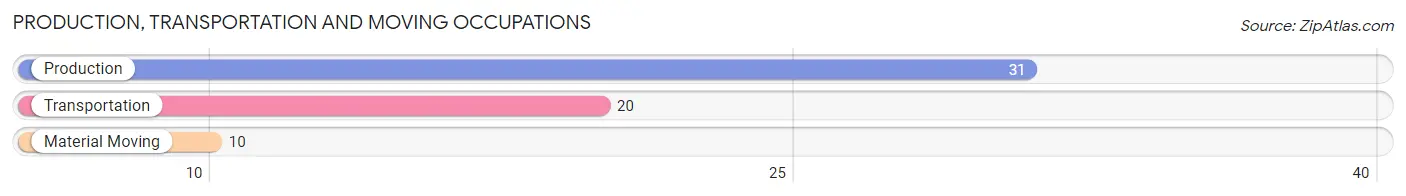
Production, Transportation and Moving Occupations
The most common Production, Transportation and Moving occupations in Indian Hills are Production (31 | 2.4%), Transportation (20 | 1.5%), and Material Moving (10 | 0.8%).
Production, Transportation and Moving Occupations by Sex
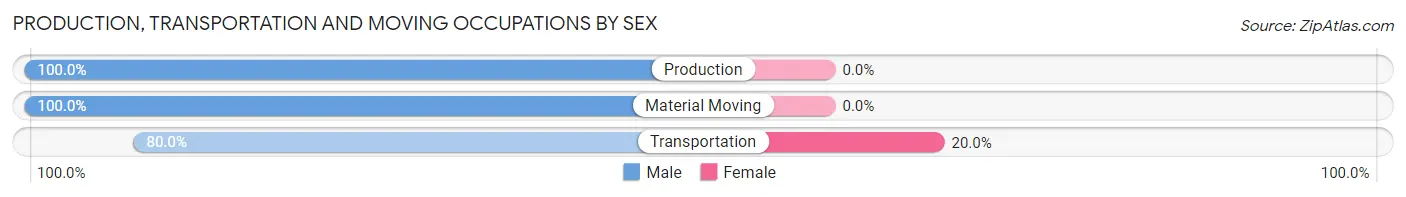
| Occupation | Male | Female |
| Production | 31 (100.0%) | 0 (0.0%) |
| Transportation | 16 (80.0%) | 4 (20.0%) |
| Material Moving | 10 (100.0%) | 0 (0.0%) |
| Total (Category) | 57 (93.4%) | 4 (6.6%) |
| Total (Overall) | 785 (59.6%) | 532 (40.4%) |
Employment Industries by Sex in Indian Hills
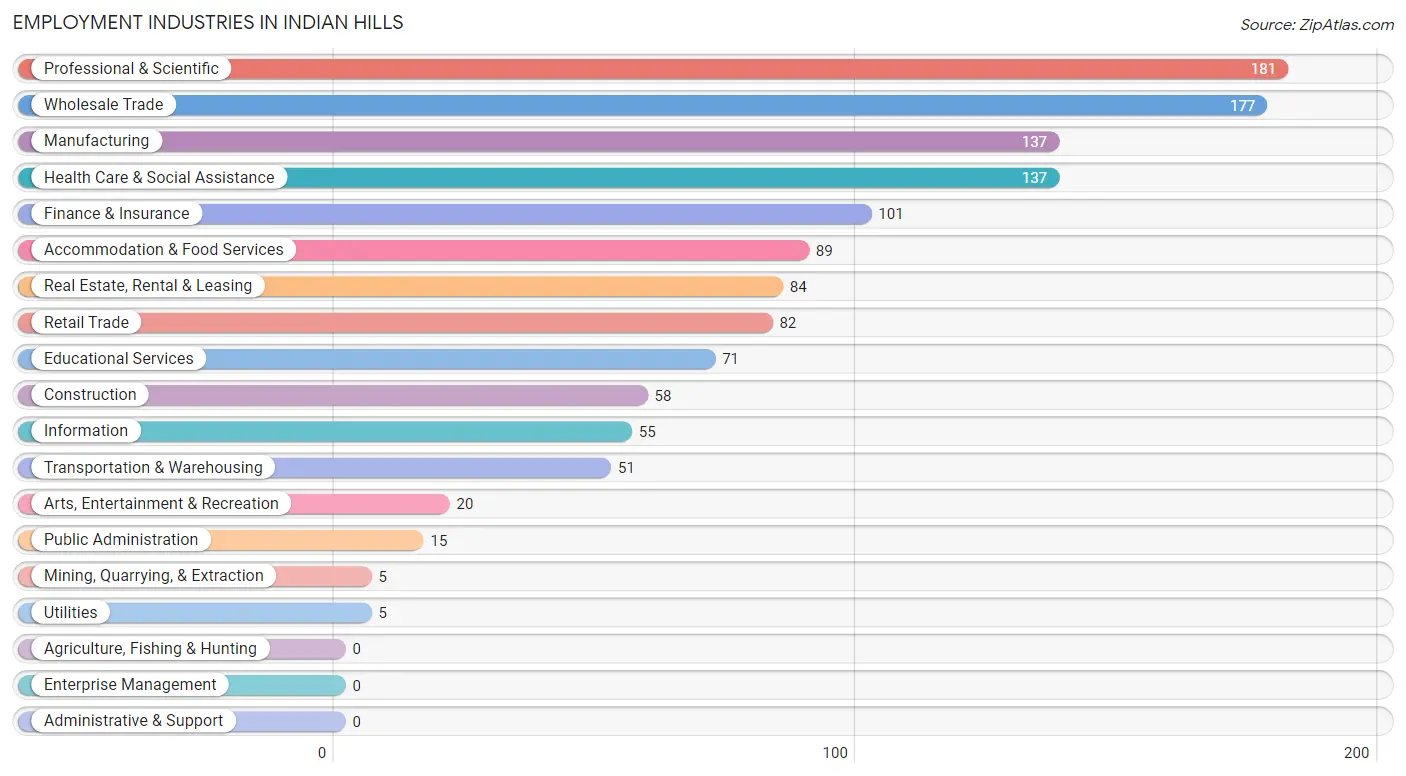
Employment Industries in Indian Hills
The major employment industries in Indian Hills include Professional & Scientific (181 | 13.7%), Wholesale Trade (177 | 13.4%), Manufacturing (137 | 10.4%), Health Care & Social Assistance (137 | 10.4%), and Finance & Insurance (101 | 7.7%).
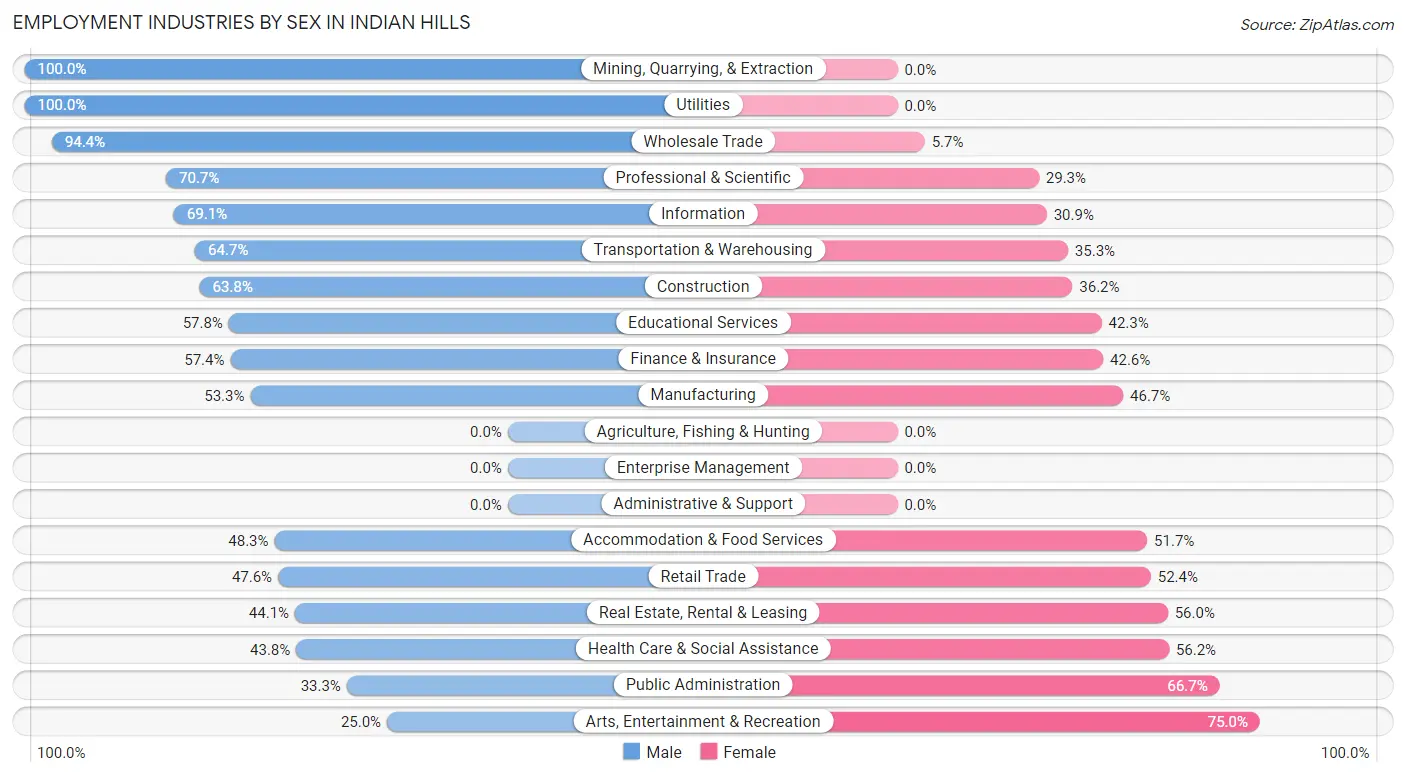
Employment Industries by Sex in Indian Hills
The Indian Hills industries that see more men than women are Mining, Quarrying, & Extraction (100.0%), Utilities (100.0%), and Wholesale Trade (94.4%), whereas the industries that tend to have a higher number of women are Arts, Entertainment & Recreation (75.0%), Public Administration (66.7%), and Health Care & Social Assistance (56.2%).
| Industry | Male | Female |
| Agriculture, Fishing & Hunting | 0 (0.0%) | 0 (0.0%) |
| Mining, Quarrying, & Extraction | 5 (100.0%) | 0 (0.0%) |
| Construction | 37 (63.8%) | 21 (36.2%) |
| Manufacturing | 73 (53.3%) | 64 (46.7%) |
| Wholesale Trade | 167 (94.4%) | 10 (5.7%) |
| Retail Trade | 39 (47.6%) | 43 (52.4%) |
| Transportation & Warehousing | 33 (64.7%) | 18 (35.3%) |
| Utilities | 5 (100.0%) | 0 (0.0%) |
| Information | 38 (69.1%) | 17 (30.9%) |
| Finance & Insurance | 58 (57.4%) | 43 (42.6%) |
| Real Estate, Rental & Leasing | 37 (44.1%) | 47 (55.9%) |
| Professional & Scientific | 128 (70.7%) | 53 (29.3%) |
| Enterprise Management | 0 (0.0%) | 0 (0.0%) |
| Administrative & Support | 0 (0.0%) | 0 (0.0%) |
| Educational Services | 41 (57.8%) | 30 (42.2%) |
| Health Care & Social Assistance | 60 (43.8%) | 77 (56.2%) |
| Arts, Entertainment & Recreation | 5 (25.0%) | 15 (75.0%) |
| Accommodation & Food Services | 43 (48.3%) | 46 (51.7%) |
| Public Administration | 5 (33.3%) | 10 (66.7%) |
| Total | 785 (59.6%) | 532 (40.4%) |
Education in Indian Hills
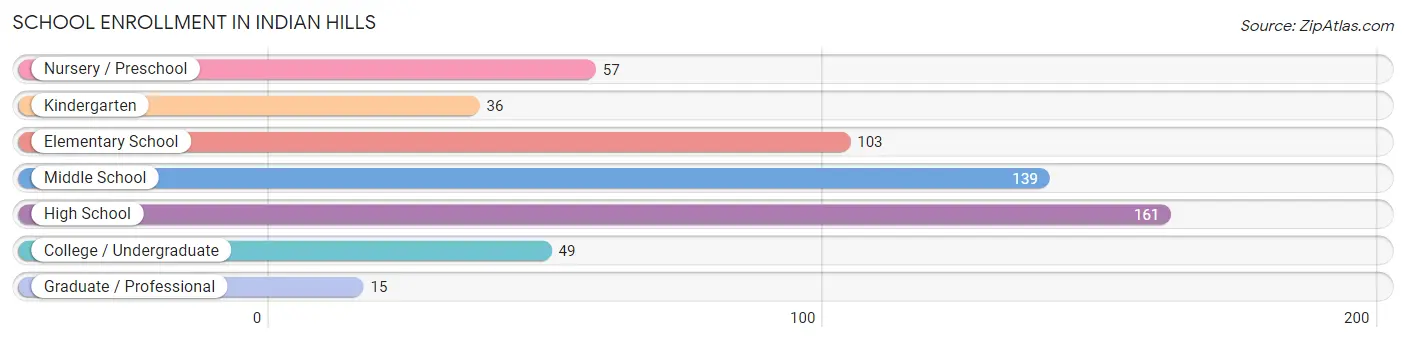
School Enrollment in Indian Hills
The most common levels of schooling among the 560 students in Indian Hills are high school (161 | 28.7%), middle school (139 | 24.8%), and elementary school (103 | 18.4%).
| School Level | # Students | % Students |
| Nursery / Preschool | 57 | 10.2% |
| Kindergarten | 36 | 6.4% |
| Elementary School | 103 | 18.4% |
| Middle School | 139 | 24.8% |
| High School | 161 | 28.7% |
| College / Undergraduate | 49 | 8.7% |
| Graduate / Professional | 15 | 2.7% |
| Total | 560 | 100.0% |
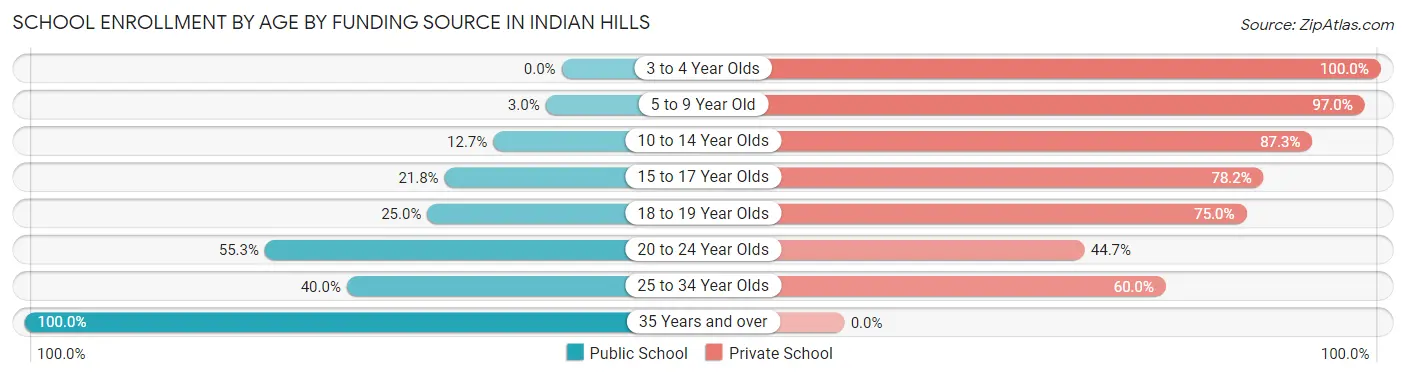
School Enrollment by Age by Funding Source in Indian Hills
Out of a total of 560 students who are enrolled in schools in Indian Hills, 469 (83.8%) attend a private institution, while the remaining 91 (16.2%) are enrolled in public schools. The age group of 3 to 4 year olds has the highest likelihood of being enrolled in private schools, with 17 (100.0% in the age bracket) enrolled. Conversely, the age group of 35 years and over has the lowest likelihood of being enrolled in a private school, with 5 (100.0% in the age bracket) attending a public institution.
| Age Bracket | Public School | Private School |
| 3 to 4 Year Olds | 0 (0.0%) | 17 (100.0%) |
| 5 to 9 Year Old | 5 (3.0%) | 163 (97.0%) |
| 10 to 14 Year Olds | 21 (12.7%) | 144 (87.3%) |
| 15 to 17 Year Olds | 29 (21.8%) | 104 (78.2%) |
| 18 to 19 Year Olds | 6 (25.0%) | 18 (75.0%) |
| 20 to 24 Year Olds | 21 (55.3%) | 17 (44.7%) |
| 25 to 34 Year Olds | 4 (40.0%) | 6 (60.0%) |
| 35 Years and over | 5 (100.0%) | 0 (0.0%) |
| Total | 91 (16.3%) | 469 (83.8%) |
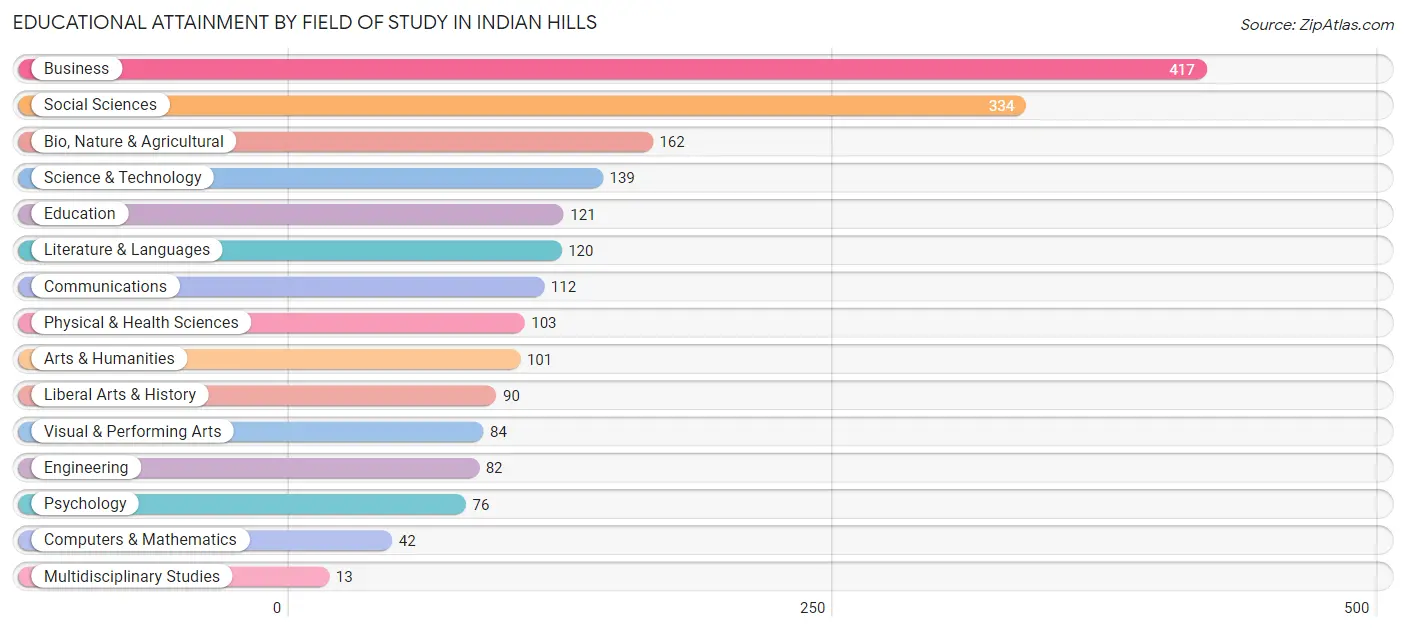
Educational Attainment by Field of Study in Indian Hills
Business (417 | 20.9%), social sciences (334 | 16.7%), bio, nature & agricultural (162 | 8.1%), science & technology (139 | 7.0%), and education (121 | 6.1%) are the most common fields of study among 1,996 individuals in Indian Hills who have obtained a bachelor's degree or higher.
| Field of Study | # Graduates | % Graduates |
| Computers & Mathematics | 42 | 2.1% |
| Bio, Nature & Agricultural | 162 | 8.1% |
| Physical & Health Sciences | 103 | 5.2% |
| Psychology | 76 | 3.8% |
| Social Sciences | 334 | 16.7% |
| Engineering | 82 | 4.1% |
| Multidisciplinary Studies | 13 | 0.6% |
| Science & Technology | 139 | 7.0% |
| Business | 417 | 20.9% |
| Education | 121 | 6.1% |
| Literature & Languages | 120 | 6.0% |
| Liberal Arts & History | 90 | 4.5% |
| Visual & Performing Arts | 84 | 4.2% |
| Communications | 112 | 5.6% |
| Arts & Humanities | 101 | 5.1% |
| Total | 1,996 | 100.0% |
Transportation & Commute in Indian Hills
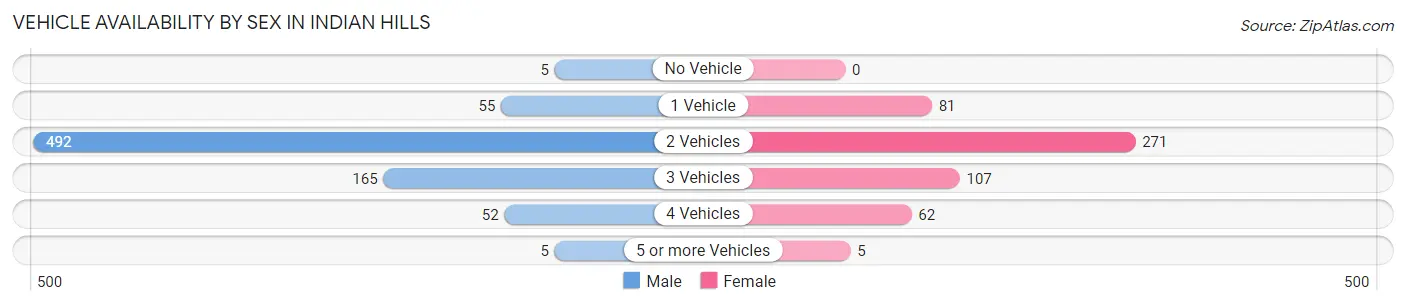
Vehicle Availability by Sex in Indian Hills
The most prevalent vehicle ownership categories in Indian Hills are males with 2 vehicles (492, accounting for 63.6%) and females with 2 vehicles (271, making up 93.5%).
| Vehicles Available | Male | Female |
| No Vehicle | 5 (0.6%) | 0 (0.0%) |
| 1 Vehicle | 55 (7.1%) | 81 (15.4%) |
| 2 Vehicles | 492 (63.6%) | 271 (51.5%) |
| 3 Vehicles | 165 (21.3%) | 107 (20.3%) |
| 4 Vehicles | 52 (6.7%) | 62 (11.8%) |
| 5 or more Vehicles | 5 (0.6%) | 5 (0.9%) |
| Total | 774 (100.0%) | 526 (100.0%) |
Commute Time in Indian Hills
The most frequently occuring commute durations in Indian Hills are 20 to 24 minutes (350 commuters, 32.9%), 15 to 19 minutes (326 commuters, 30.6%), and 10 to 14 minutes (160 commuters, 15.0%).
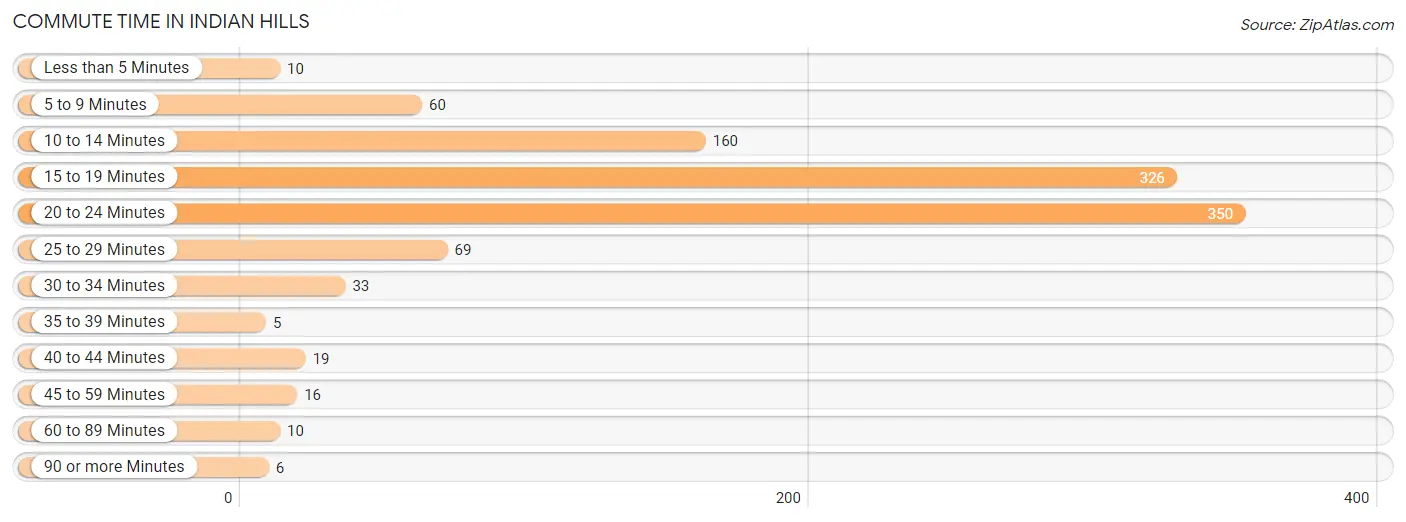
| Commute Time | # Commuters | % Commuters |
| Less than 5 Minutes | 10 | 0.9% |
| 5 to 9 Minutes | 60 | 5.6% |
| 10 to 14 Minutes | 160 | 15.0% |
| 15 to 19 Minutes | 326 | 30.6% |
| 20 to 24 Minutes | 350 | 32.9% |
| 25 to 29 Minutes | 69 | 6.5% |
| 30 to 34 Minutes | 33 | 3.1% |
| 35 to 39 Minutes | 5 | 0.5% |
| 40 to 44 Minutes | 19 | 1.8% |
| 45 to 59 Minutes | 16 | 1.5% |
| 60 to 89 Minutes | 10 | 0.9% |
| 90 or more Minutes | 6 | 0.6% |
Commute Time by Sex in Indian Hills
The most common commute times in Indian Hills are 20 to 24 minutes (241 commuters, 34.8%) for males and 15 to 19 minutes (110 commuters, 29.6%) for females.
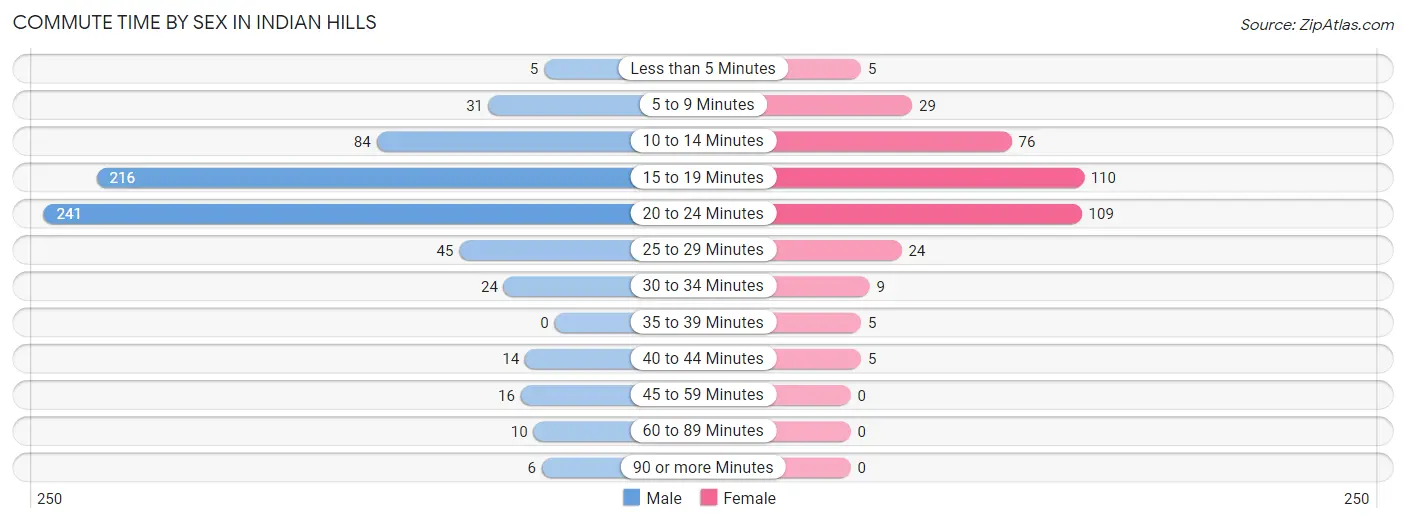
| Commute Time | Male | Female |
| Less than 5 Minutes | 5 (0.7%) | 5 (1.3%) |
| 5 to 9 Minutes | 31 (4.5%) | 29 (7.8%) |
| 10 to 14 Minutes | 84 (12.1%) | 76 (20.4%) |
| 15 to 19 Minutes | 216 (31.2%) | 110 (29.6%) |
| 20 to 24 Minutes | 241 (34.8%) | 109 (29.3%) |
| 25 to 29 Minutes | 45 (6.5%) | 24 (6.5%) |
| 30 to 34 Minutes | 24 (3.5%) | 9 (2.4%) |
| 35 to 39 Minutes | 0 (0.0%) | 5 (1.3%) |
| 40 to 44 Minutes | 14 (2.0%) | 5 (1.3%) |
| 45 to 59 Minutes | 16 (2.3%) | 0 (0.0%) |
| 60 to 89 Minutes | 10 (1.5%) | 0 (0.0%) |
| 90 or more Minutes | 6 (0.9%) | 0 (0.0%) |
Time of Departure to Work by Sex in Indian Hills
The most frequent times of departure to work in Indian Hills are 7:30 AM to 7:59 AM (204, 29.5%) for males and 8:00 AM to 8:29 AM (109, 29.3%) for females.
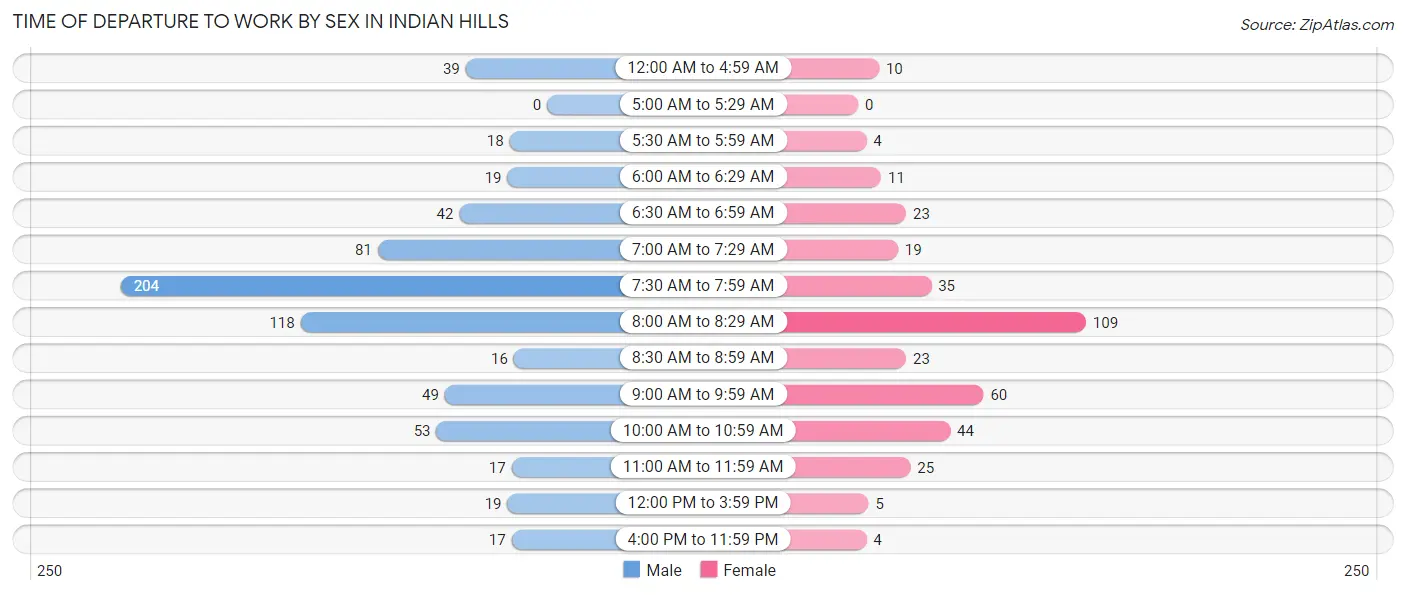
| Time of Departure | Male | Female |
| 12:00 AM to 4:59 AM | 39 (5.6%) | 10 (2.7%) |
| 5:00 AM to 5:29 AM | 0 (0.0%) | 0 (0.0%) |
| 5:30 AM to 5:59 AM | 18 (2.6%) | 4 (1.1%) |
| 6:00 AM to 6:29 AM | 19 (2.8%) | 11 (3.0%) |
| 6:30 AM to 6:59 AM | 42 (6.1%) | 23 (6.2%) |
| 7:00 AM to 7:29 AM | 81 (11.7%) | 19 (5.1%) |
| 7:30 AM to 7:59 AM | 204 (29.5%) | 35 (9.4%) |
| 8:00 AM to 8:29 AM | 118 (17.1%) | 109 (29.3%) |
| 8:30 AM to 8:59 AM | 16 (2.3%) | 23 (6.2%) |
| 9:00 AM to 9:59 AM | 49 (7.1%) | 60 (16.1%) |
| 10:00 AM to 10:59 AM | 53 (7.7%) | 44 (11.8%) |
| 11:00 AM to 11:59 AM | 17 (2.5%) | 25 (6.7%) |
| 12:00 PM to 3:59 PM | 19 (2.8%) | 5 (1.3%) |
| 4:00 PM to 11:59 PM | 17 (2.5%) | 4 (1.1%) |
| Total | 692 (100.0%) | 372 (100.0%) |
Housing Occupancy in Indian Hills
Occupancy by Ownership in Indian Hills
Of the total 1,283 dwellings in Indian Hills, owner-occupied units account for 1,263 (98.4%), while renter-occupied units make up 20 (1.6%).
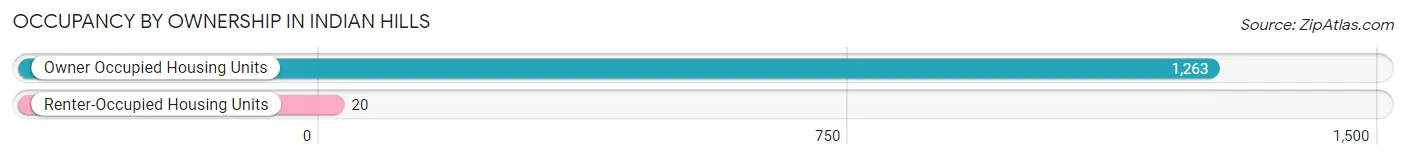
| Occupancy | # Housing Units | % Housing Units |
| Owner Occupied Housing Units | 1,263 | 98.4% |
| Renter-Occupied Housing Units | 20 | 1.6% |
| Total Occupied Housing Units | 1,283 | 100.0% |
Occupancy by Household Size in Indian Hills
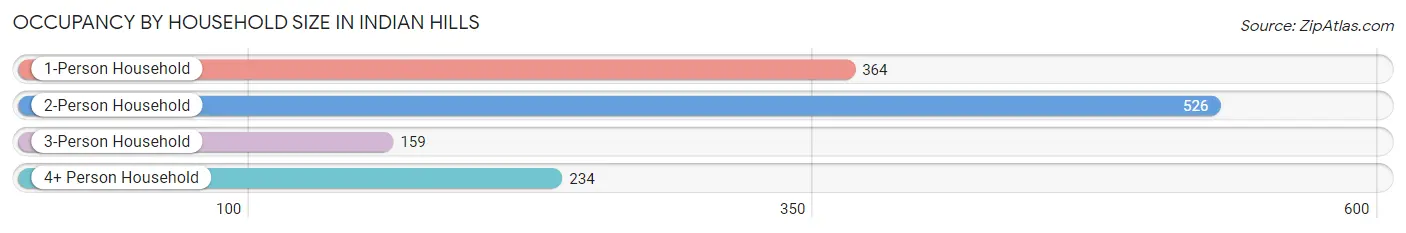
| Household Size | # Housing Units | % Housing Units |
| 1-Person Household | 364 | 28.4% |
| 2-Person Household | 526 | 41.0% |
| 3-Person Household | 159 | 12.4% |
| 4+ Person Household | 234 | 18.2% |
| Total Housing Units | 1,283 | 100.0% |
Occupancy by Ownership by Household Size in Indian Hills
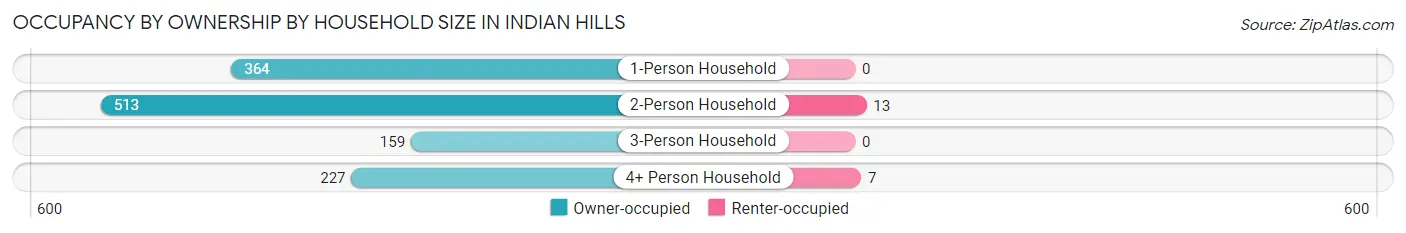
| Household Size | Owner-occupied | Renter-occupied |
| 1-Person Household | 364 (100.0%) | 0 (0.0%) |
| 2-Person Household | 513 (97.5%) | 13 (2.5%) |
| 3-Person Household | 159 (100.0%) | 0 (0.0%) |
| 4+ Person Household | 227 (97.0%) | 7 (3.0%) |
| Total Housing Units | 1,263 (98.4%) | 20 (1.6%) |
Occupancy by Educational Attainment in Indian Hills
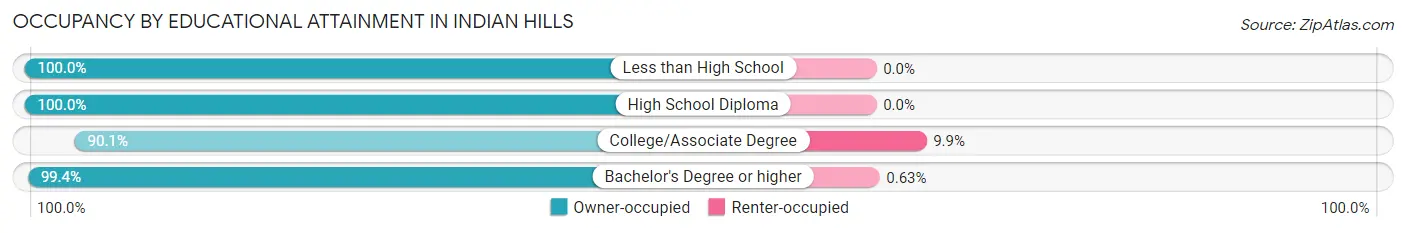
| Household Size | Owner-occupied | Renter-occupied |
| Less than High School | 2 (100.0%) | 0 (0.0%) |
| High School Diploma | 36 (100.0%) | 0 (0.0%) |
| College/Associate Degree | 118 (90.1%) | 13 (9.9%) |
| Bachelor's Degree or higher | 1,107 (99.4%) | 7 (0.6%) |
Occupancy by Age of Householder in Indian Hills
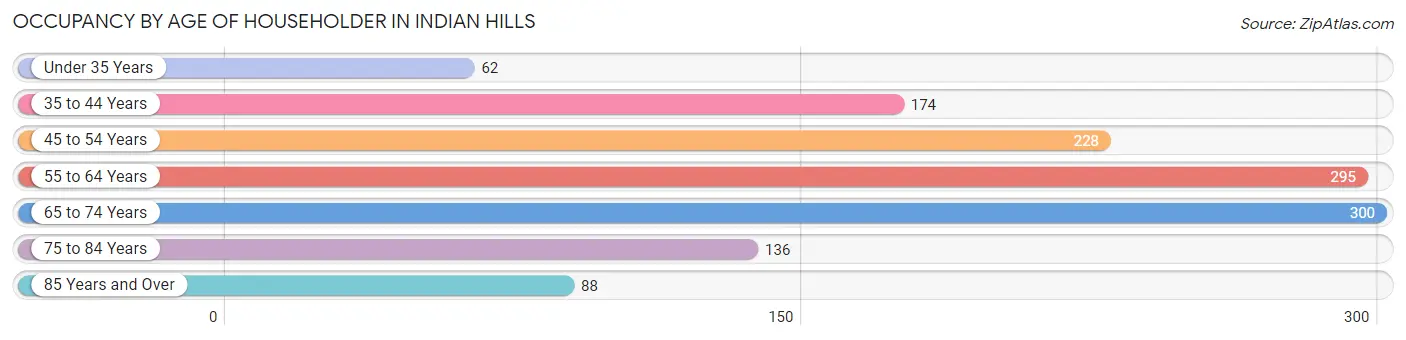
| Age Bracket | # Households | % Households |
| Under 35 Years | 62 | 4.8% |
| 35 to 44 Years | 174 | 13.6% |
| 45 to 54 Years | 228 | 17.8% |
| 55 to 64 Years | 295 | 23.0% |
| 65 to 74 Years | 300 | 23.4% |
| 75 to 84 Years | 136 | 10.6% |
| 85 Years and Over | 88 | 6.9% |
| Total | 1,283 | 100.0% |
Housing Finances in Indian Hills
Median Income by Occupancy in Indian Hills
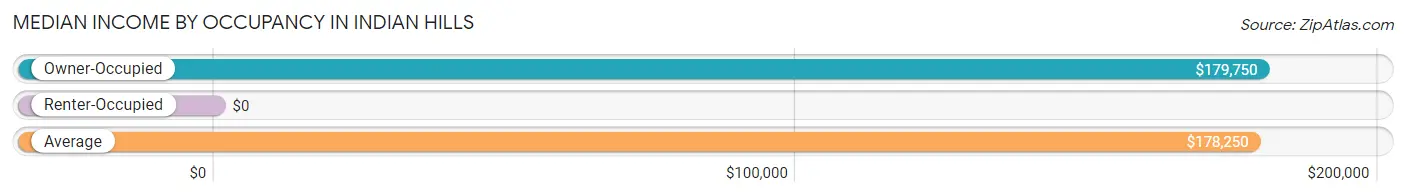
| Occupancy Type | # Households | Median Income |
| Owner-Occupied | 1,263 (98.4%) | $179,750 |
| Renter-Occupied | 20 (1.6%) | $0 |
| Average | 1,283 (100.0%) | $178,250 |
Occupancy by Householder Income Bracket in Indian Hills
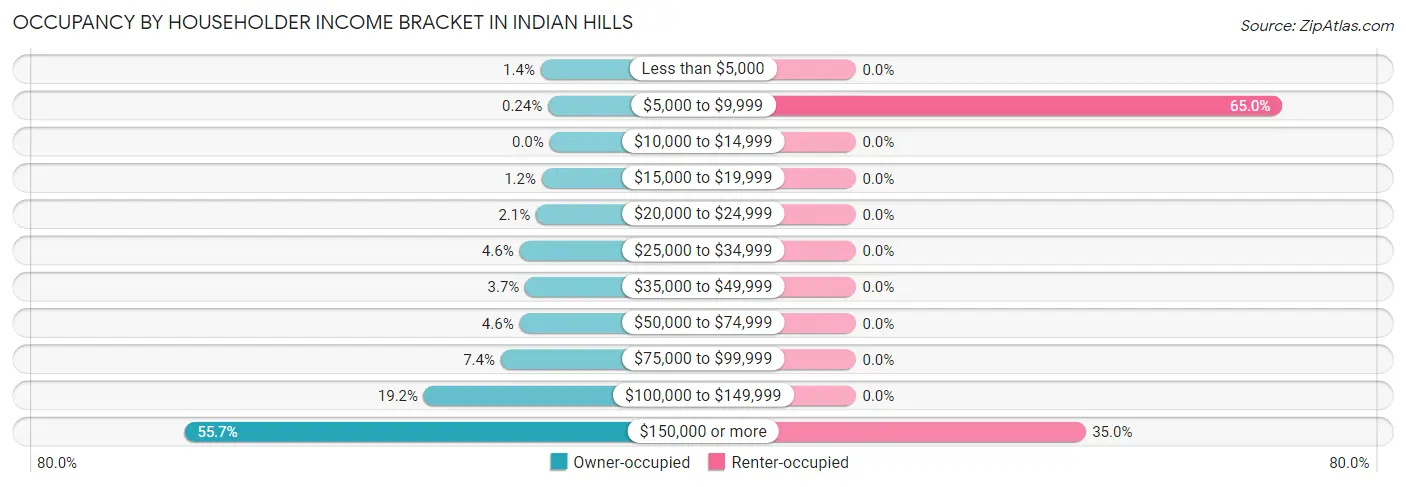
| Income Bracket | Owner-occupied | Renter-occupied |
| Less than $5,000 | 17 (1.3%) | 0 (0.0%) |
| $5,000 to $9,999 | 3 (0.2%) | 13 (65.0%) |
| $10,000 to $14,999 | 0 (0.0%) | 0 (0.0%) |
| $15,000 to $19,999 | 15 (1.2%) | 0 (0.0%) |
| $20,000 to $24,999 | 26 (2.1%) | 0 (0.0%) |
| $25,000 to $34,999 | 58 (4.6%) | 0 (0.0%) |
| $35,000 to $49,999 | 47 (3.7%) | 0 (0.0%) |
| $50,000 to $74,999 | 58 (4.6%) | 0 (0.0%) |
| $75,000 to $99,999 | 94 (7.4%) | 0 (0.0%) |
| $100,000 to $149,999 | 242 (19.2%) | 0 (0.0%) |
| $150,000 or more | 703 (55.7%) | 7 (35.0%) |
| Total | 1,263 (100.0%) | 20 (100.0%) |
Monthly Housing Cost Tiers in Indian Hills
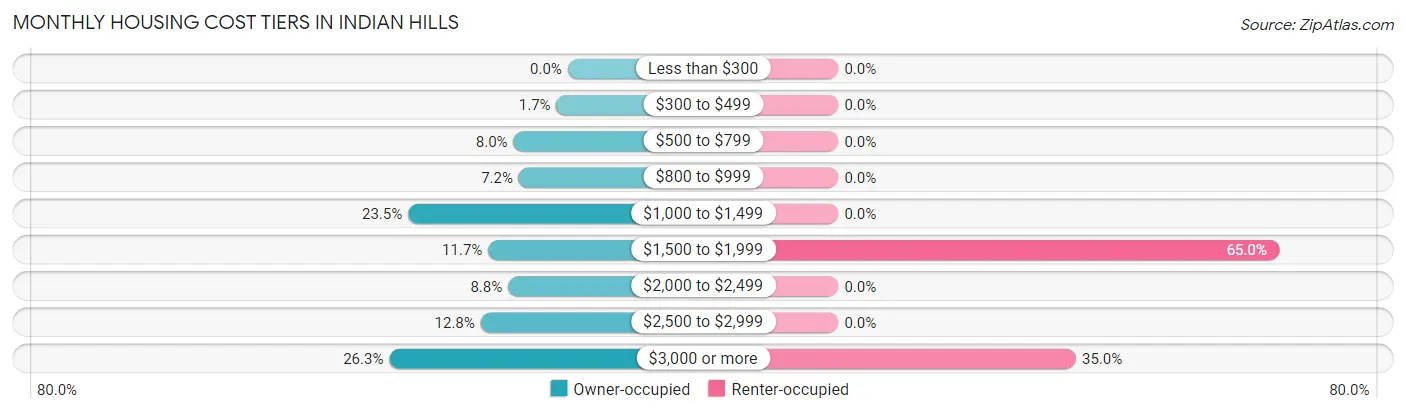
| Monthly Cost | Owner-occupied | Renter-occupied |
| Less than $300 | 0 (0.0%) | 0 (0.0%) |
| $300 to $499 | 21 (1.7%) | 0 (0.0%) |
| $500 to $799 | 101 (8.0%) | 0 (0.0%) |
| $800 to $999 | 91 (7.2%) | 0 (0.0%) |
| $1,000 to $1,499 | 297 (23.5%) | 0 (0.0%) |
| $1,500 to $1,999 | 148 (11.7%) | 13 (65.0%) |
| $2,000 to $2,499 | 111 (8.8%) | 0 (0.0%) |
| $2,500 to $2,999 | 162 (12.8%) | 0 (0.0%) |
| $3,000 or more | 332 (26.3%) | 7 (35.0%) |
| Total | 1,263 (100.0%) | 20 (100.0%) |
Physical Housing Characteristics in Indian Hills
Housing Structures in Indian Hills
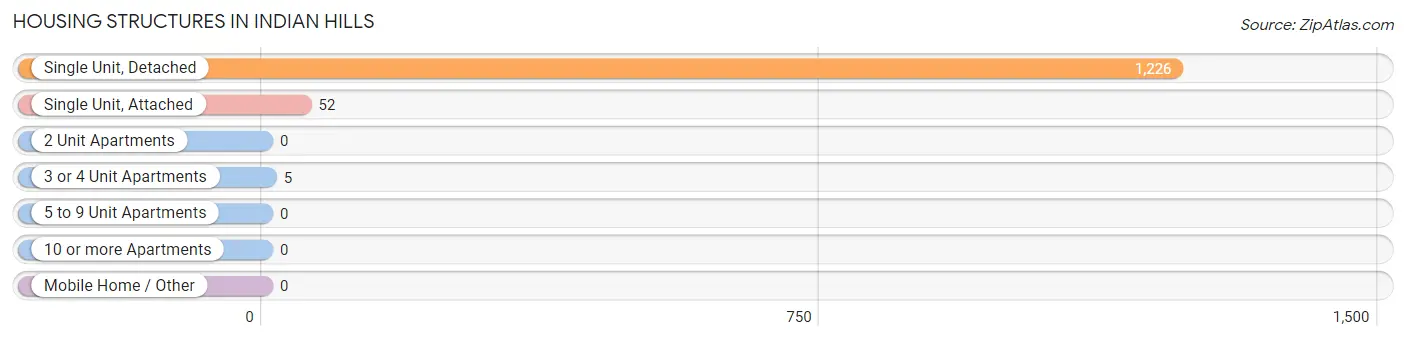
| Structure Type | # Housing Units | % Housing Units |
| Single Unit, Detached | 1,226 | 95.6% |
| Single Unit, Attached | 52 | 4.1% |
| 2 Unit Apartments | 0 | 0.0% |
| 3 or 4 Unit Apartments | 5 | 0.4% |
| 5 to 9 Unit Apartments | 0 | 0.0% |
| 10 or more Apartments | 0 | 0.0% |
| Mobile Home / Other | 0 | 0.0% |
| Total | 1,283 | 100.0% |
Housing Structures by Occupancy in Indian Hills
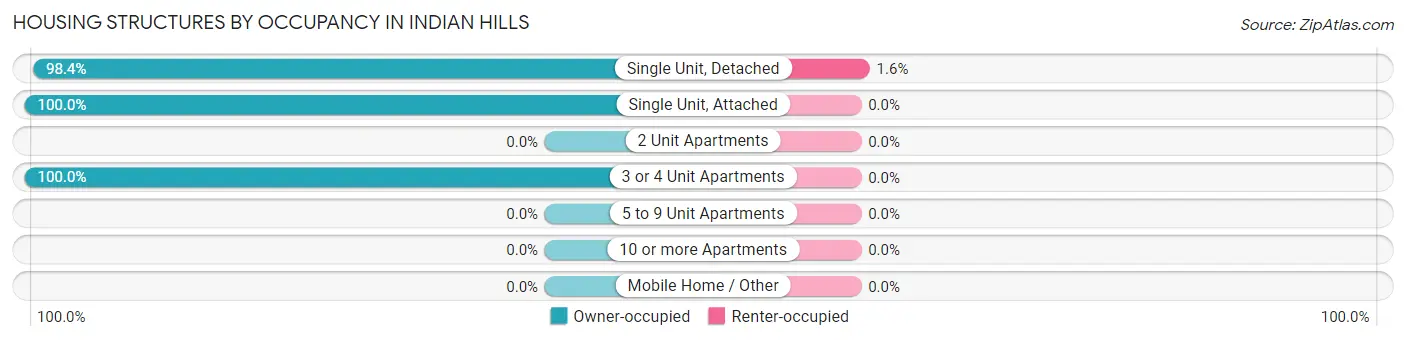
| Structure Type | Owner-occupied | Renter-occupied |
| Single Unit, Detached | 1,206 (98.4%) | 20 (1.6%) |
| Single Unit, Attached | 52 (100.0%) | 0 (0.0%) |
| 2 Unit Apartments | 0 (0.0%) | 0 (0.0%) |
| 3 or 4 Unit Apartments | 5 (100.0%) | 0 (0.0%) |
| 5 to 9 Unit Apartments | 0 (0.0%) | 0 (0.0%) |
| 10 or more Apartments | 0 (0.0%) | 0 (0.0%) |
| Mobile Home / Other | 0 (0.0%) | 0 (0.0%) |
| Total | 1,263 (98.4%) | 20 (1.6%) |
Housing Structures by Number of Rooms in Indian Hills
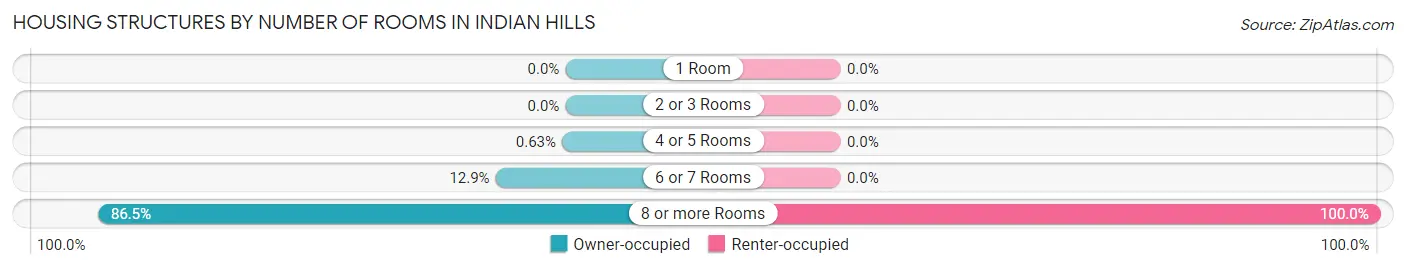
| Number of Rooms | Owner-occupied | Renter-occupied |
| 1 Room | 0 (0.0%) | 0 (0.0%) |
| 2 or 3 Rooms | 0 (0.0%) | 0 (0.0%) |
| 4 or 5 Rooms | 8 (0.6%) | 0 (0.0%) |
| 6 or 7 Rooms | 163 (12.9%) | 0 (0.0%) |
| 8 or more Rooms | 1,092 (86.5%) | 20 (100.0%) |
| Total | 1,263 (100.0%) | 20 (100.0%) |
Housing Structure by Heating Type in Indian Hills
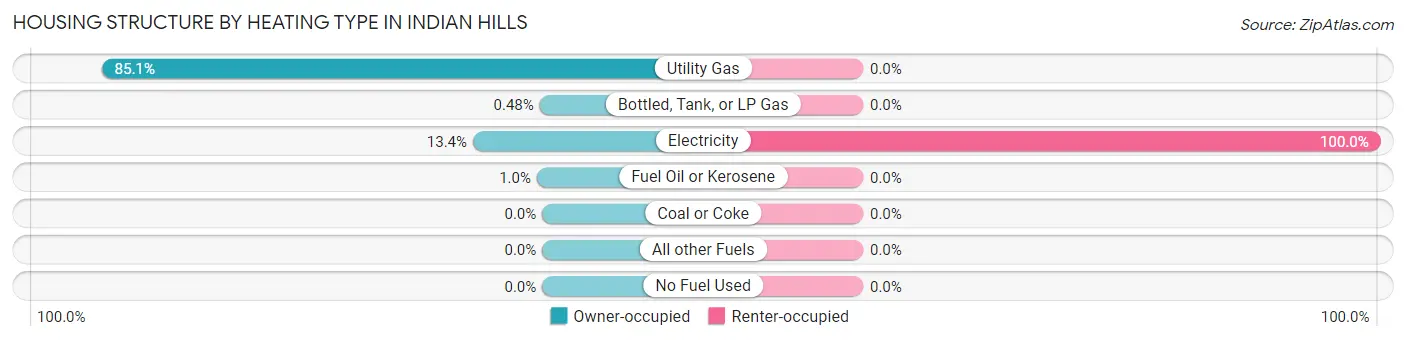
| Heating Type | Owner-occupied | Renter-occupied |
| Utility Gas | 1,075 (85.1%) | 0 (0.0%) |
| Bottled, Tank, or LP Gas | 6 (0.5%) | 0 (0.0%) |
| Electricity | 169 (13.4%) | 20 (100.0%) |
| Fuel Oil or Kerosene | 13 (1.0%) | 0 (0.0%) |
| Coal or Coke | 0 (0.0%) | 0 (0.0%) |
| All other Fuels | 0 (0.0%) | 0 (0.0%) |
| No Fuel Used | 0 (0.0%) | 0 (0.0%) |
| Total | 1,263 (100.0%) | 20 (100.0%) |
Household Vehicle Usage in Indian Hills
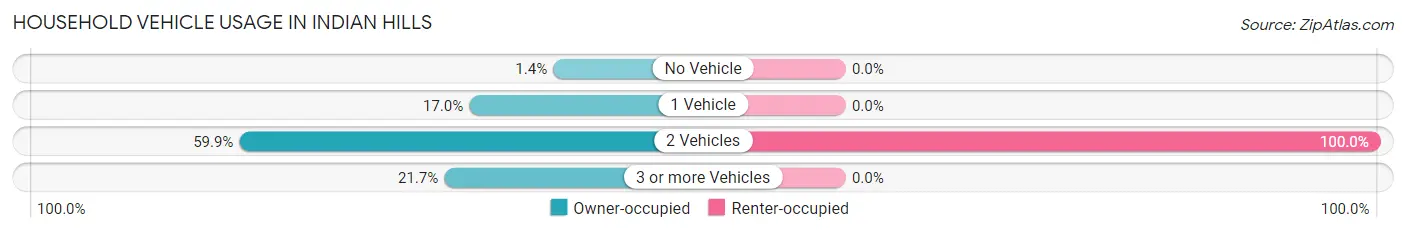
| Vehicles per Household | Owner-occupied | Renter-occupied |
| No Vehicle | 17 (1.3%) | 0 (0.0%) |
| 1 Vehicle | 215 (17.0%) | 0 (0.0%) |
| 2 Vehicles | 757 (59.9%) | 20 (100.0%) |
| 3 or more Vehicles | 274 (21.7%) | 0 (0.0%) |
| Total | 1,263 (100.0%) | 20 (100.0%) |
Real Estate & Mortgages in Indian Hills
Real Estate and Mortgage Overview in Indian Hills
| Characteristic | Without Mortgage | With Mortgage |
| Housing Units | 514 | 749 |
| Median Property Value | $654,900 | $631,000 |
| Median Household Income | $173,500 | $428 |
| Monthly Housing Costs | $1,204 | $322 |
| Real Estate Taxes | $5,344 | $5 |
Property Value by Mortgage Status in Indian Hills
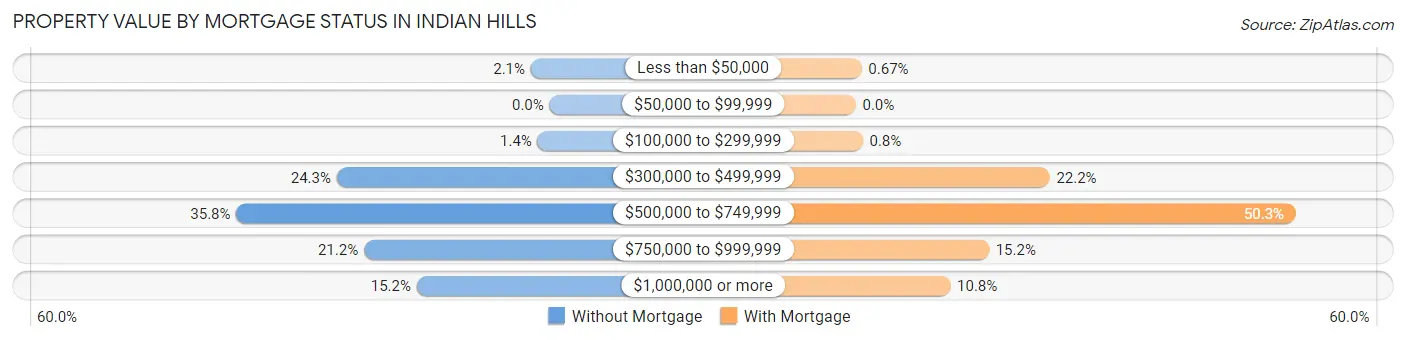
| Property Value | Without Mortgage | With Mortgage |
| Less than $50,000 | 11 (2.1%) | 5 (0.7%) |
| $50,000 to $99,999 | 0 (0.0%) | 0 (0.0%) |
| $100,000 to $299,999 | 7 (1.4%) | 6 (0.8%) |
| $300,000 to $499,999 | 125 (24.3%) | 166 (22.2%) |
| $500,000 to $749,999 | 184 (35.8%) | 377 (50.3%) |
| $750,000 to $999,999 | 109 (21.2%) | 114 (15.2%) |
| $1,000,000 or more | 78 (15.2%) | 81 (10.8%) |
| Total | 514 (100.0%) | 749 (100.0%) |
Household Income by Mortgage Status in Indian Hills
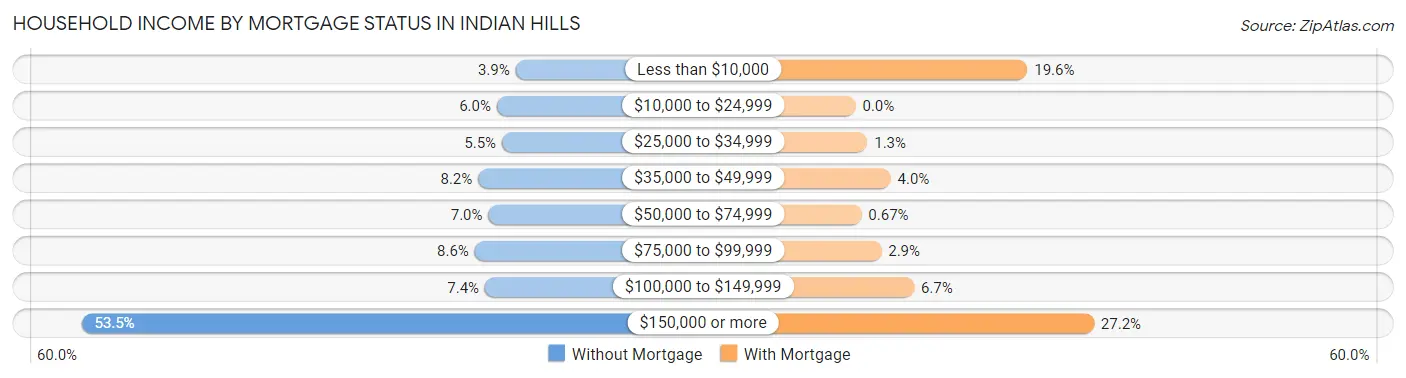
| Household Income | Without Mortgage | With Mortgage |
| Less than $10,000 | 20 (3.9%) | 147 (19.6%) |
| $10,000 to $24,999 | 31 (6.0%) | 0 (0.0%) |
| $25,000 to $34,999 | 28 (5.4%) | 10 (1.3%) |
| $35,000 to $49,999 | 42 (8.2%) | 30 (4.0%) |
| $50,000 to $74,999 | 36 (7.0%) | 5 (0.7%) |
| $75,000 to $99,999 | 44 (8.6%) | 22 (2.9%) |
| $100,000 to $149,999 | 38 (7.4%) | 50 (6.7%) |
| $150,000 or more | 275 (53.5%) | 204 (27.2%) |
| Total | 514 (100.0%) | 749 (100.0%) |
Property Value to Household Income Ratio in Indian Hills
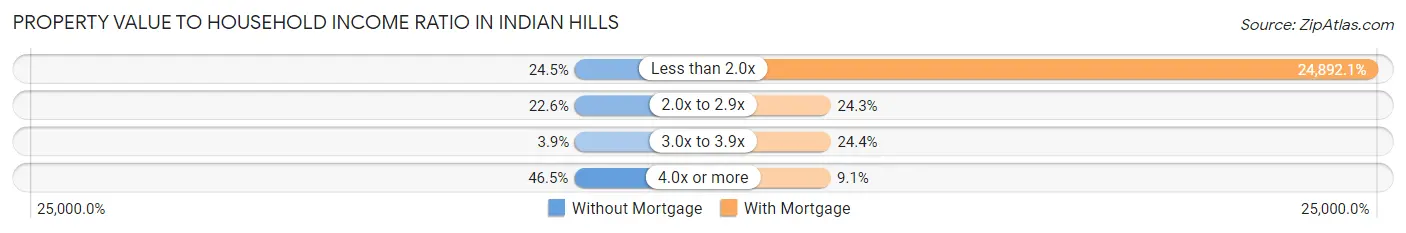
| Value-to-Income Ratio | Without Mortgage | With Mortgage |
| Less than 2.0x | 126 (24.5%) | 186,442 (24,892.1%) |
| 2.0x to 2.9x | 116 (22.6%) | 182 (24.3%) |
| 3.0x to 3.9x | 20 (3.9%) | 183 (24.4%) |
| 4.0x or more | 239 (46.5%) | 68 (9.1%) |
| Total | 514 (100.0%) | 749 (100.0%) |
Real Estate Taxes by Mortgage Status in Indian Hills
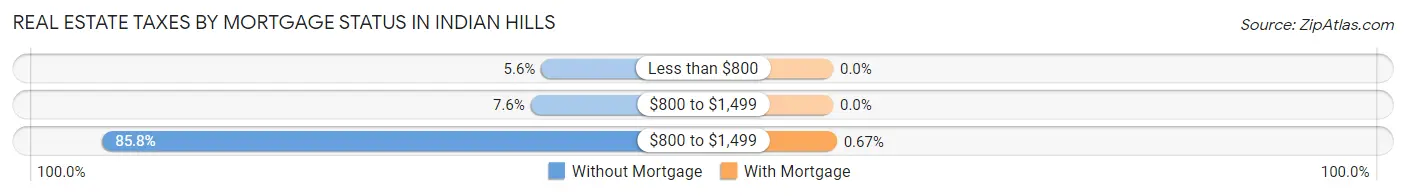
| Property Taxes | Without Mortgage | With Mortgage |
| Less than $800 | 29 (5.6%) | 0 (0.0%) |
| $800 to $1,499 | 39 (7.6%) | 0 (0.0%) |
| $800 to $1,499 | 441 (85.8%) | 5 (0.7%) |
| Total | 514 (100.0%) | 749 (100.0%) |
Health & Disability in Indian Hills
Health Insurance Coverage by Age in Indian Hills
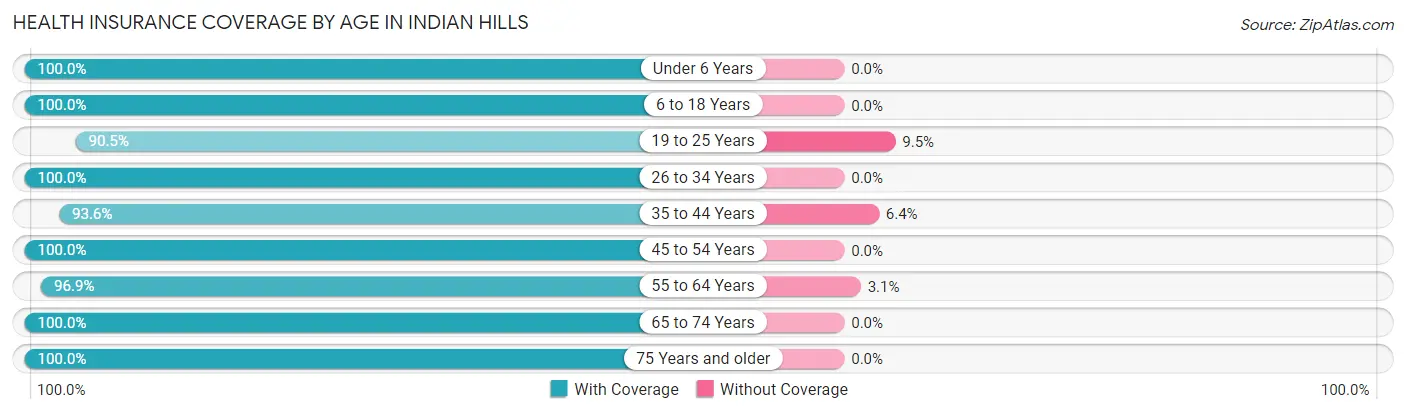
| Age Bracket | With Coverage | Without Coverage |
| Under 6 Years | 161 (100.0%) | 0 (0.0%) |
| 6 to 18 Years | 441 (100.0%) | 0 (0.0%) |
| 19 to 25 Years | 57 (90.5%) | 6 (9.5%) |
| 26 to 34 Years | 138 (100.0%) | 0 (0.0%) |
| 35 to 44 Years | 334 (93.6%) | 23 (6.4%) |
| 45 to 54 Years | 375 (100.0%) | 0 (0.0%) |
| 55 to 64 Years | 411 (96.9%) | 13 (3.1%) |
| 65 to 74 Years | 539 (100.0%) | 0 (0.0%) |
| 75 Years and older | 393 (100.0%) | 0 (0.0%) |
| Total | 2,849 (98.6%) | 42 (1.5%) |
Health Insurance Coverage by Citizenship Status in Indian Hills
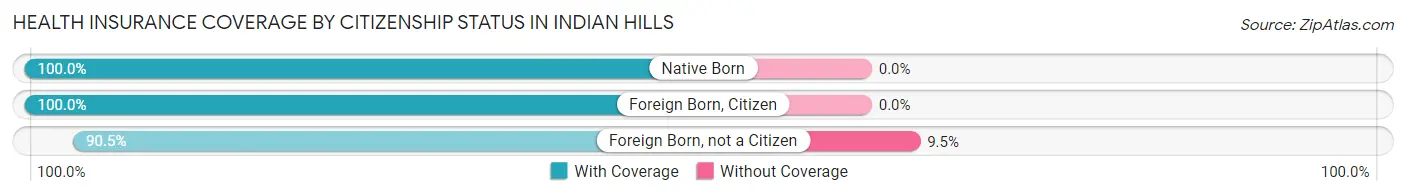
| Citizenship Status | With Coverage | Without Coverage |
| Native Born | 161 (100.0%) | 0 (0.0%) |
| Foreign Born, Citizen | 441 (100.0%) | 0 (0.0%) |
| Foreign Born, not a Citizen | 57 (90.5%) | 6 (9.5%) |
Health Insurance Coverage by Household Income in Indian Hills
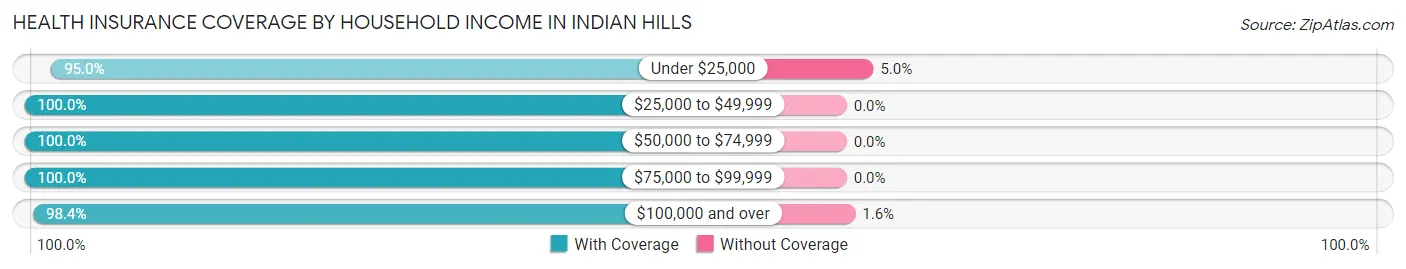
| Household Income | With Coverage | Without Coverage |
| Under $25,000 | 95 (95.0%) | 5 (5.0%) |
| $25,000 to $49,999 | 201 (100.0%) | 0 (0.0%) |
| $50,000 to $74,999 | 124 (100.0%) | 0 (0.0%) |
| $75,000 to $99,999 | 156 (100.0%) | 0 (0.0%) |
| $100,000 and over | 2,273 (98.4%) | 37 (1.6%) |
Public vs Private Health Insurance Coverage by Age in Indian Hills
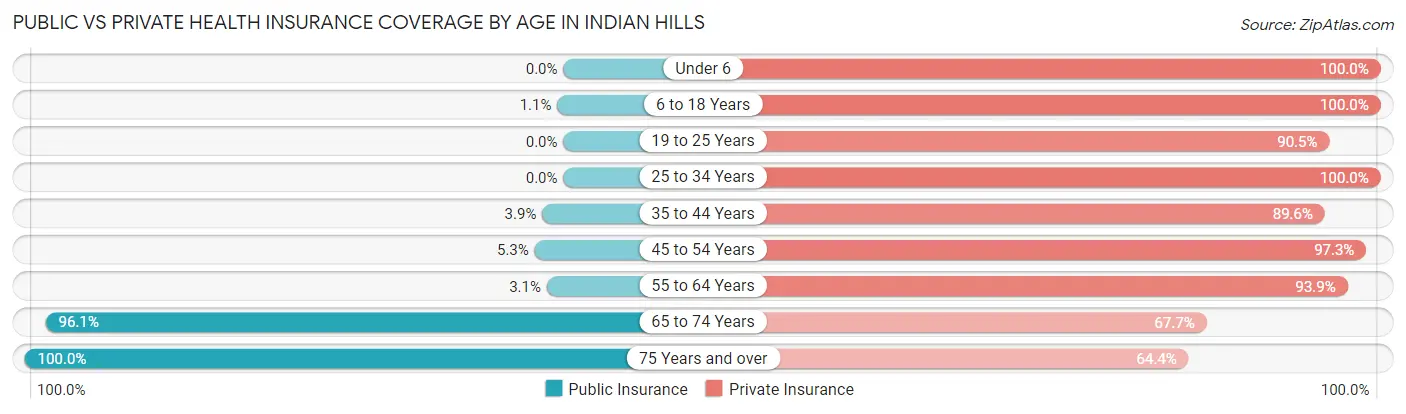
| Age Bracket | Public Insurance | Private Insurance |
| Under 6 | 0 (0.0%) | 161 (100.0%) |
| 6 to 18 Years | 5 (1.1%) | 441 (100.0%) |
| 19 to 25 Years | 0 (0.0%) | 57 (90.5%) |
| 25 to 34 Years | 0 (0.0%) | 138 (100.0%) |
| 35 to 44 Years | 14 (3.9%) | 320 (89.6%) |
| 45 to 54 Years | 20 (5.3%) | 365 (97.3%) |
| 55 to 64 Years | 13 (3.1%) | 398 (93.9%) |
| 65 to 74 Years | 518 (96.1%) | 365 (67.7%) |
| 75 Years and over | 393 (100.0%) | 253 (64.4%) |
| Total | 963 (33.3%) | 2,498 (86.4%) |
Disability Status by Sex by Age in Indian Hills
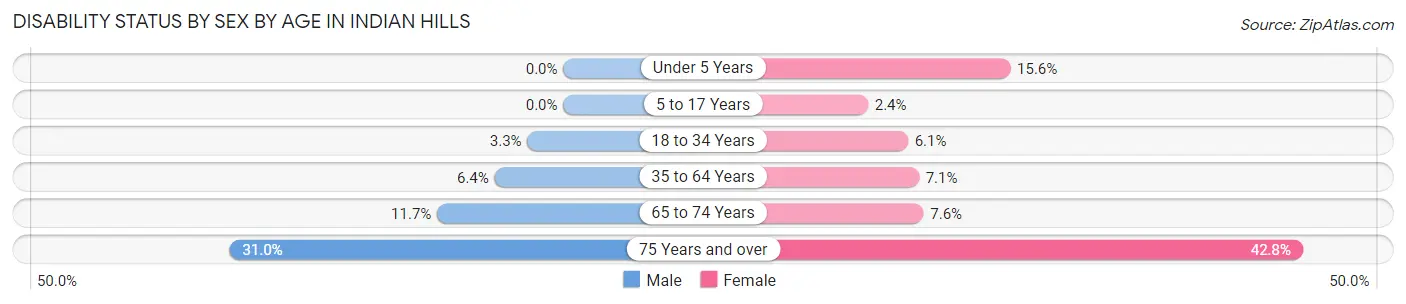
| Age Bracket | Male | Female |
| Under 5 Years | 0 (0.0%) | 5 (15.6%) |
| 5 to 17 Years | 0 (0.0%) | 6 (2.4%) |
| 18 to 34 Years | 4 (3.3%) | 6 (6.1%) |
| 35 to 64 Years | 38 (6.4%) | 40 (7.1%) |
| 65 to 74 Years | 26 (11.7%) | 24 (7.6%) |
| 75 Years and over | 66 (31.0%) | 77 (42.8%) |
Disability Class by Sex by Age in Indian Hills
Disability Class: Hearing Difficulty
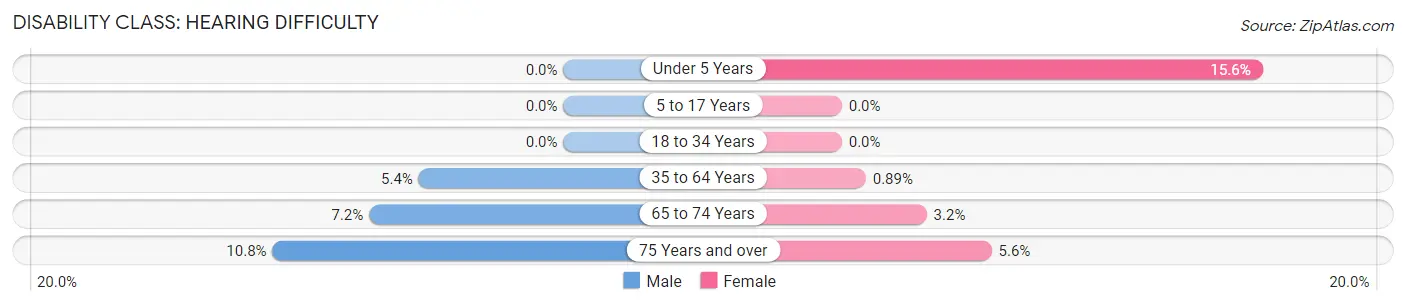
| Age Bracket | Male | Female |
| Under 5 Years | 0 (0.0%) | 5 (15.6%) |
| 5 to 17 Years | 0 (0.0%) | 0 (0.0%) |
| 18 to 34 Years | 0 (0.0%) | 0 (0.0%) |
| 35 to 64 Years | 32 (5.4%) | 5 (0.9%) |
| 65 to 74 Years | 16 (7.2%) | 10 (3.2%) |
| 75 Years and over | 23 (10.8%) | 10 (5.6%) |
Disability Class: Vision Difficulty
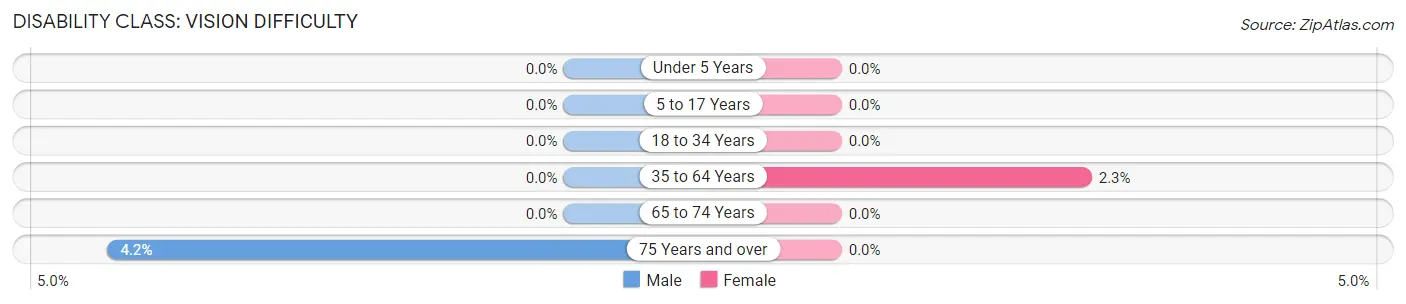
| Age Bracket | Male | Female |
| Under 5 Years | 0 (0.0%) | 0 (0.0%) |
| 5 to 17 Years | 0 (0.0%) | 0 (0.0%) |
| 18 to 34 Years | 0 (0.0%) | 0 (0.0%) |
| 35 to 64 Years | 0 (0.0%) | 13 (2.3%) |
| 65 to 74 Years | 0 (0.0%) | 0 (0.0%) |
| 75 Years and over | 9 (4.2%) | 0 (0.0%) |
Disability Class: Cognitive Difficulty
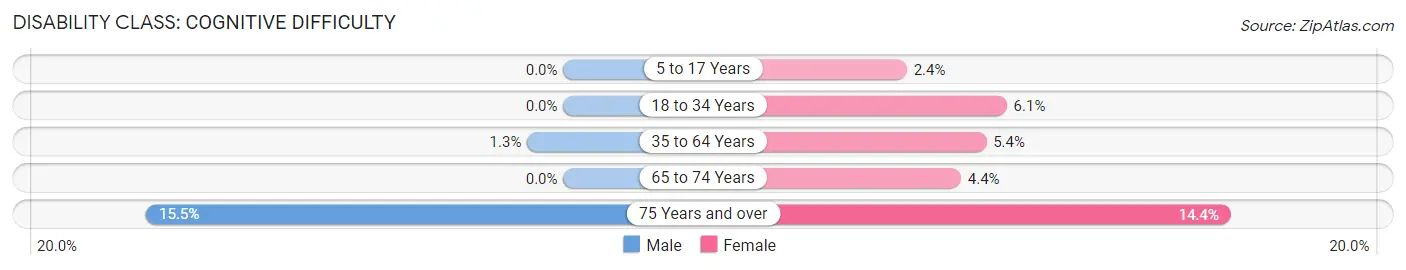
| Age Bracket | Male | Female |
| 5 to 17 Years | 0 (0.0%) | 6 (2.4%) |
| 18 to 34 Years | 0 (0.0%) | 6 (6.1%) |
| 35 to 64 Years | 8 (1.3%) | 30 (5.4%) |
| 65 to 74 Years | 0 (0.0%) | 14 (4.4%) |
| 75 Years and over | 33 (15.5%) | 26 (14.4%) |
Disability Class: Ambulatory Difficulty
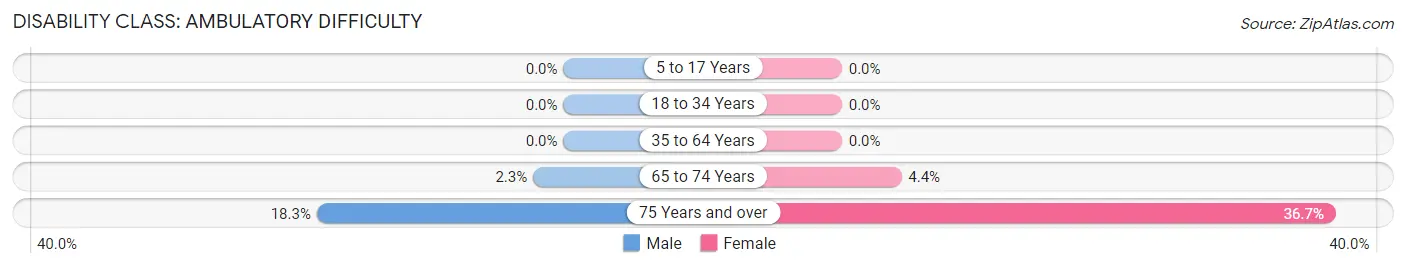
| Age Bracket | Male | Female |
| 5 to 17 Years | 0 (0.0%) | 0 (0.0%) |
| 18 to 34 Years | 0 (0.0%) | 0 (0.0%) |
| 35 to 64 Years | 0 (0.0%) | 0 (0.0%) |
| 65 to 74 Years | 5 (2.2%) | 14 (4.4%) |
| 75 Years and over | 39 (18.3%) | 66 (36.7%) |
Disability Class: Self-Care Difficulty
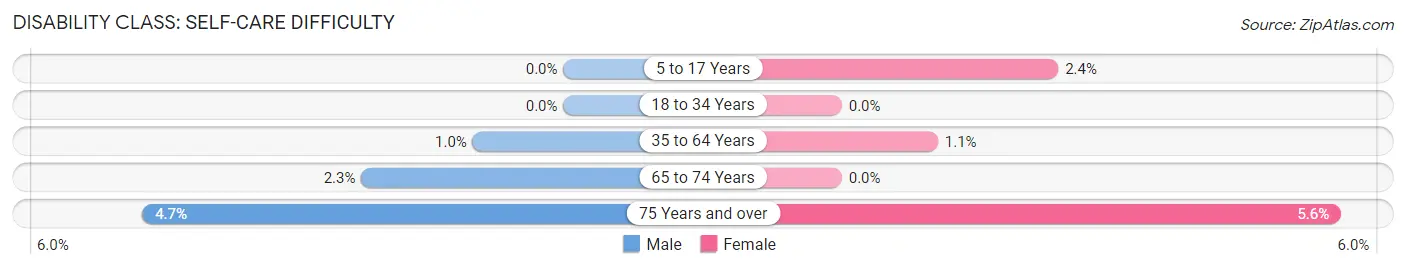
| Age Bracket | Male | Female |
| 5 to 17 Years | 0 (0.0%) | 6 (2.4%) |
| 18 to 34 Years | 0 (0.0%) | 0 (0.0%) |
| 35 to 64 Years | 6 (1.0%) | 6 (1.1%) |
| 65 to 74 Years | 5 (2.2%) | 0 (0.0%) |
| 75 Years and over | 10 (4.7%) | 10 (5.6%) |
Technology Access in Indian Hills
Computing Device Access in Indian Hills
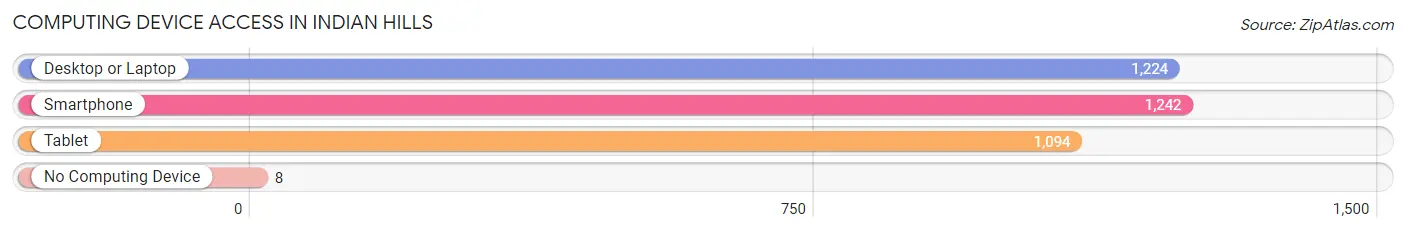
| Device Type | # Households | % Households |
| Desktop or Laptop | 1,224 | 95.4% |
| Smartphone | 1,242 | 96.8% |
| Tablet | 1,094 | 85.3% |
| No Computing Device | 8 | 0.6% |
| Total | 1,283 | 100.0% |
Internet Access in Indian Hills
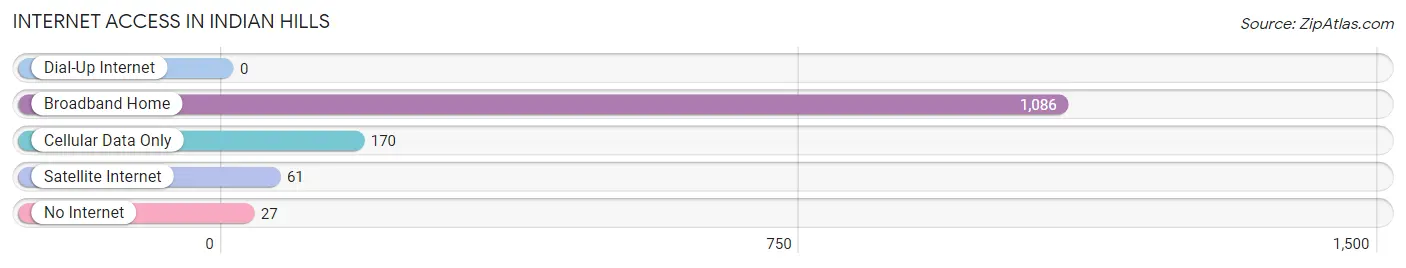
| Internet Type | # Households | % Households |
| Dial-Up Internet | 0 | 0.0% |
| Broadband Home | 1,086 | 84.7% |
| Cellular Data Only | 170 | 13.3% |
| Satellite Internet | 61 | 4.8% |
| No Internet | 27 | 2.1% |
| Total | 1,283 | 100.0% |
Indian Hills Summary
History
Indian Hills is a small unincorporated community located in Jefferson County, Kentucky. It is situated on the banks of the Ohio River, just south of Louisville. The area was first settled in the late 1700s by Native Americans, who were later displaced by European settlers. The area was originally known as Indian Hill, but the name was changed to Indian Hills in the early 1900s.
The area was primarily agricultural until the early 1900s, when the Louisville and Nashville Railroad began to run through the area. This allowed for the development of industry and commerce in the area, and the population began to grow. The area was also home to a number of coal mines, which provided employment for many of the residents.
In the 1950s, the area began to experience a population decline as many of the residents moved away in search of better economic opportunities. This trend continued until the late 1980s, when the area began to experience a resurgence in population growth. This was due in part to the development of the nearby Louisville International Airport, which provided employment opportunities for many of the residents.
Geography
Indian Hills is located in Jefferson County, Kentucky, on the banks of the Ohio River. It is situated just south of Louisville, and is bordered by the cities of Jeffersontown and St. Matthews. The area is primarily flat, with some rolling hills in the northern part of the community. The climate is humid subtropical, with hot summers and mild winters.
Economy
The economy of Indian Hills is primarily based on service industries, such as retail, healthcare, and education. The area is also home to a number of small businesses, such as restaurants, auto repair shops, and convenience stores. The area is also home to a number of manufacturing companies, such as the Louisville Stove Works and the Louisville Pipe and Foundry Company.
Demographics
As of the 2010 census, the population of Indian Hills was 2,845. The racial makeup of the area was 79.3% White, 15.2% African American, 0.3% Native American, 1.2% Asian, and 3.9% from other races. The median household income was $45,945, and the median family income was $54,945. The per capita income was $22,945. The unemployment rate was 5.2%.
Conclusion
Indian Hills is a small unincorporated community located in Jefferson County, Kentucky. It is situated on the banks of the Ohio River, just south of Louisville. The area was first settled in the late 1700s by Native Americans, and was later developed by European settlers. The area has experienced a resurgence in population growth in recent years, due in part to the development of the nearby Louisville International Airport. The economy of Indian Hills is primarily based on service industries, such as retail, healthcare, and education. The population of Indian Hills was 2,845 as of the 2010 census, with a median household income of $45,945 and a median family income of $54,945.
Common Questions
What is Per Capita Income in Indian Hills?
Per Capita income in Indian Hills is $114,704.
What is the Median Family Income in Indian Hills?
Median Family Income in Indian Hills is $244,479.
What is the Median Household income in Indian Hills?
Median Household Income in Indian Hills is $178,250.
What is Income or Wage Gap in Indian Hills?
Income or Wage Gap in Indian Hills is 65.5%.
Women in Indian Hills earn 34.5 cents for every dollar earned by a man.
What is Inequality or Gini Index in Indian Hills?
Inequality or Gini Index in Indian Hills is 0.49.
What is the Total Population of Indian Hills?
Total Population of Indian Hills is 2,891.
What is the Total Male Population of Indian Hills?
Total Male Population of Indian Hills is 1,455.
What is the Total Female Population of Indian Hills?
Total Female Population of Indian Hills is 1,436.
What is the Ratio of Males per 100 Females in Indian Hills?
There are 101.32 Males per 100 Females in Indian Hills.
What is the Ratio of Females per 100 Males in Indian Hills?
There are 98.69 Females per 100 Males in Indian Hills.
What is the Median Population Age in Indian Hills?
Median Population Age in Indian Hills is 52.2 Years.
What is the Average Family Size in Indian Hills
Average Family Size in Indian Hills is 2.8 People.
What is the Average Household Size in Indian Hills
Average Household Size in Indian Hills is 2.2 People.
How Large is the Labor Force in Indian Hills?
There are 1,344 People in the Labor Forcein in Indian Hills.
What is the Percentage of People in the Labor Force in Indian Hills?
56.6% of People are in the Labor Force in Indian Hills.
What is the Unemployment Rate in Indian Hills?
Unemployment Rate in Indian Hills is 2.1%.