Shepherdsville, KY Map & Demographics
Shepherdsville Map
Shepherdsville Overview
$27,773
PER CAPITA INCOME
$76,926
AVG FAMILY INCOME
$71,875
AVG HOUSEHOLD INCOME
38.9%
WAGE / INCOME GAP [ % ]
61.1¢/ $1
WAGE / INCOME GAP [ $ ]
$9,628
FAMILY INCOME DEFICIT
0.39
INEQUALITY / GINI INDEX
14,136
TOTAL POPULATION
6,753
MALE POPULATION
7,383
FEMALE POPULATION
91.47
MALES / 100 FEMALES
109.33
FEMALES / 100 MALES
35.3
MEDIAN AGE
3.1
AVG FAMILY SIZE
2.7
AVG HOUSEHOLD SIZE
7,144
LABOR FORCE [ PEOPLE ]
67.8%
PERCENT IN LABOR FORCE
3.6%
UNEMPLOYMENT RATE
Shepherdsville Zip Codes
Shepherdsville Area Codes
Income in Shepherdsville
Income Overview in Shepherdsville
Per Capita Income in Shepherdsville is $27,773, while median incomes of families and households are $76,926 and $71,875 respectively.
| Characteristic | Number | Measure |
| Per Capita Income | 14,136 | $27,773 |
| Median Family Income | 3,678 | $76,926 |
| Mean Family Income | 3,678 | $83,112 |
| Median Household Income | 5,128 | $71,875 |
| Mean Household Income | 5,128 | $75,049 |
| Income Deficit | 3,678 | $9,628 |
| Wage / Income Gap (%) | 14,136 | 38.91% |
| Wage / Income Gap ($) | 14,136 | 61.09¢ per $1 |
| Gini / Inequality Index | 14,136 | 0.39 |
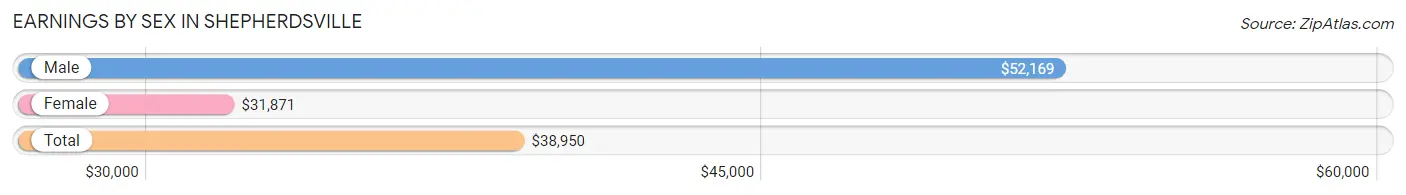
Earnings by Sex in Shepherdsville
Average Earnings in Shepherdsville are $38,950, $52,169 for men and $31,871 for women, a difference of 38.9%.
| Sex | Number | Average Earnings |
| Male | 3,651 (49.0%) | $52,169 |
| Female | 3,796 (51.0%) | $31,871 |
| Total | 7,447 (100.0%) | $38,950 |
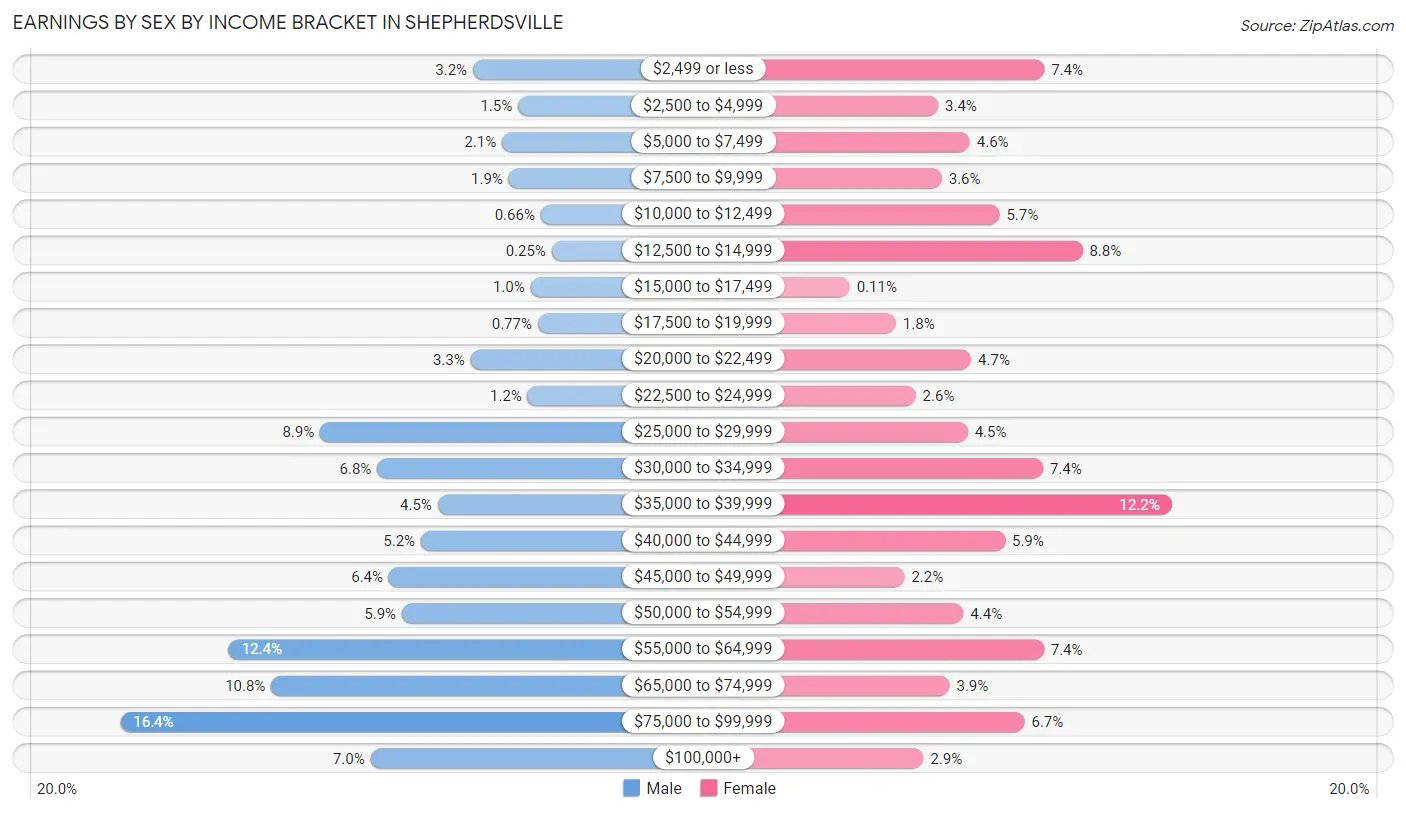
Earnings by Sex by Income Bracket in Shepherdsville
The most common earnings brackets in Shepherdsville are $75,000 to $99,999 for men (599 | 16.4%) and $35,000 to $39,999 for women (462 | 12.2%).
| Income | Male | Female |
| $2,499 or less | 117 (3.2%) | 281 (7.4%) |
| $2,500 to $4,999 | 55 (1.5%) | 130 (3.4%) |
| $5,000 to $7,499 | 77 (2.1%) | 175 (4.6%) |
| $7,500 to $9,999 | 68 (1.9%) | 135 (3.6%) |
| $10,000 to $12,499 | 24 (0.7%) | 217 (5.7%) |
| $12,500 to $14,999 | 9 (0.3%) | 335 (8.8%) |
| $15,000 to $17,499 | 38 (1.0%) | 4 (0.1%) |
| $17,500 to $19,999 | 28 (0.8%) | 70 (1.8%) |
| $20,000 to $22,499 | 120 (3.3%) | 177 (4.7%) |
| $22,500 to $24,999 | 42 (1.1%) | 98 (2.6%) |
| $25,000 to $29,999 | 326 (8.9%) | 172 (4.5%) |
| $30,000 to $34,999 | 248 (6.8%) | 279 (7.3%) |
| $35,000 to $39,999 | 165 (4.5%) | 462 (12.2%) |
| $40,000 to $44,999 | 188 (5.1%) | 225 (5.9%) |
| $45,000 to $49,999 | 232 (6.4%) | 82 (2.2%) |
| $50,000 to $54,999 | 214 (5.9%) | 166 (4.4%) |
| $55,000 to $64,999 | 451 (12.3%) | 280 (7.4%) |
| $65,000 to $74,999 | 393 (10.8%) | 146 (3.8%) |
| $75,000 to $99,999 | 599 (16.4%) | 253 (6.7%) |
| $100,000+ | 257 (7.0%) | 109 (2.9%) |
| Total | 3,651 (100.0%) | 3,796 (100.0%) |
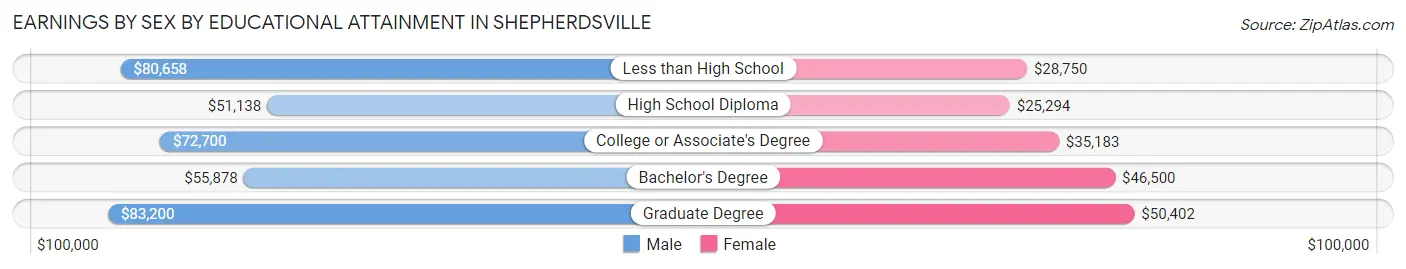
Earnings by Sex by Educational Attainment in Shepherdsville
Average earnings in Shepherdsville are $55,776 for men and $35,247 for women, a difference of 36.8%. Men with an educational attainment of graduate degree enjoy the highest average annual earnings of $83,200, while those with high school diploma education earn the least with $51,138. Women with an educational attainment of graduate degree earn the most with the average annual earnings of $50,402, while those with high school diploma education have the smallest earnings of $25,294.
| Educational Attainment | Male Income | Female Income |
| Less than High School | $80,658 | $28,750 |
| High School Diploma | $51,138 | $25,294 |
| College or Associate's Degree | $72,700 | $35,183 |
| Bachelor's Degree | $55,878 | $46,500 |
| Graduate Degree | $83,200 | $50,402 |
| Total | $55,776 | $35,247 |
Family Income in Shepherdsville
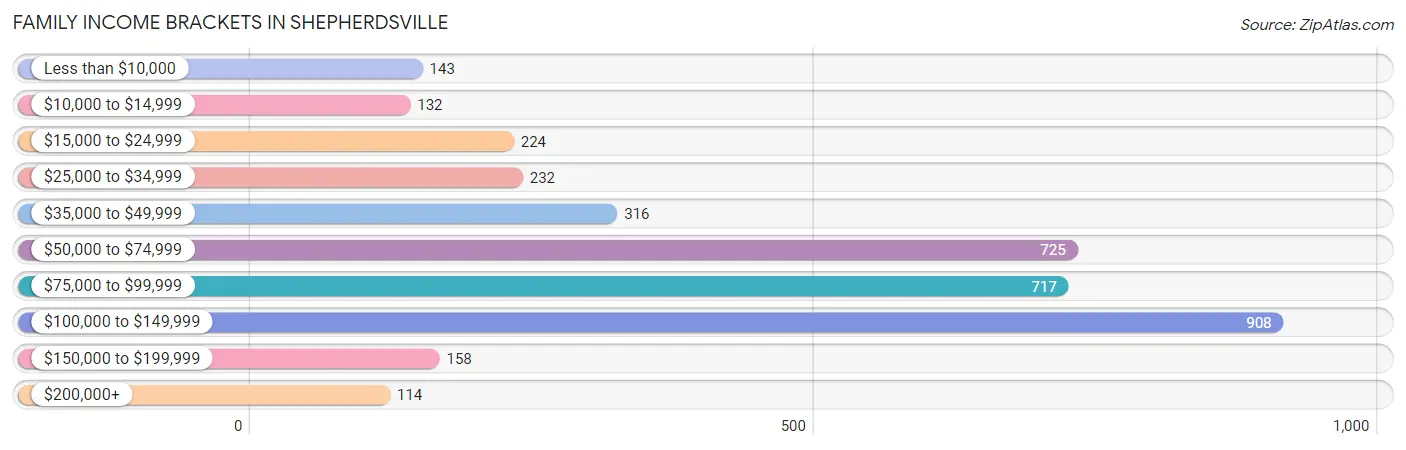
Family Income Brackets in Shepherdsville
According to the Shepherdsville family income data, there are 908 families falling into the $100,000 to $149,999 income range, which is the most common income bracket and makes up 24.7% of all families. Conversely, the $200,000+ income bracket is the least frequent group with only 114 families (3.1%) belonging to this category.
| Income Bracket | # Families | % Families |
| Less than $10,000 | 143 | 3.9% |
| $10,000 to $14,999 | 132 | 3.6% |
| $15,000 to $24,999 | 224 | 6.1% |
| $25,000 to $34,999 | 232 | 6.3% |
| $35,000 to $49,999 | 316 | 8.6% |
| $50,000 to $74,999 | 725 | 19.7% |
| $75,000 to $99,999 | 717 | 19.5% |
| $100,000 to $149,999 | 908 | 24.7% |
| $150,000 to $199,999 | 158 | 4.3% |
| $200,000+ | 114 | 3.1% |
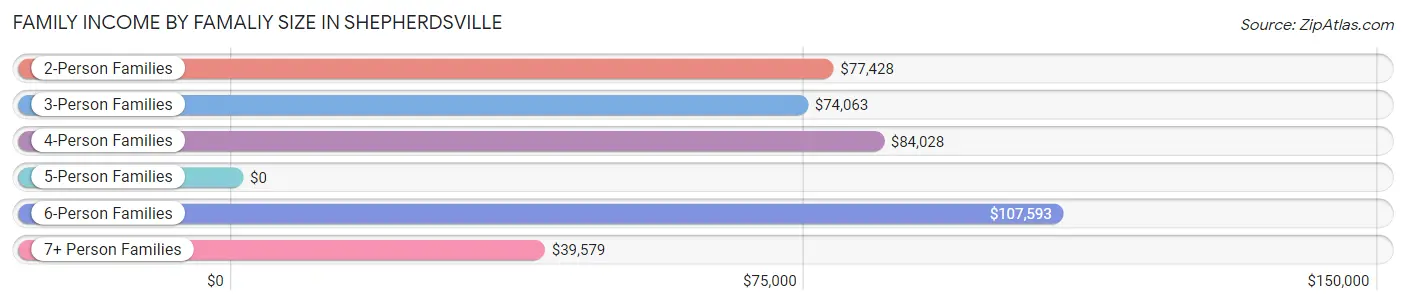
Family Income by Famaliy Size in Shepherdsville
6-person families (108 | 2.9%) account for the highest median family income in Shepherdsville with $107,593 per family, while 2-person families (1,575 | 42.8%) have the highest median income of $38,714 per family member.
| Income Bracket | # Families | Median Income |
| 2-Person Families | 1,575 (42.8%) | $77,428 |
| 3-Person Families | 1,116 (30.3%) | $74,063 |
| 4-Person Families | 480 (13.1%) | $84,028 |
| 5-Person Families | 246 (6.7%) | $0 |
| 6-Person Families | 108 (2.9%) | $107,593 |
| 7+ Person Families | 153 (4.2%) | $39,579 |
| Total | 3,678 (100.0%) | $76,926 |
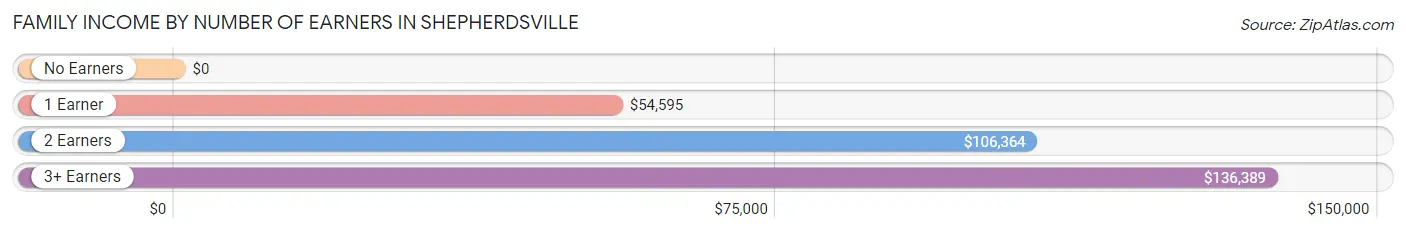
Family Income by Number of Earners in Shepherdsville
| Number of Earners | # Families | Median Income |
| No Earners | 442 (12.0%) | $0 |
| 1 Earner | 1,484 (40.4%) | $54,595 |
| 2 Earners | 1,382 (37.6%) | $106,364 |
| 3+ Earners | 370 (10.1%) | $136,389 |
| Total | 3,678 (100.0%) | $76,926 |
Household Income in Shepherdsville
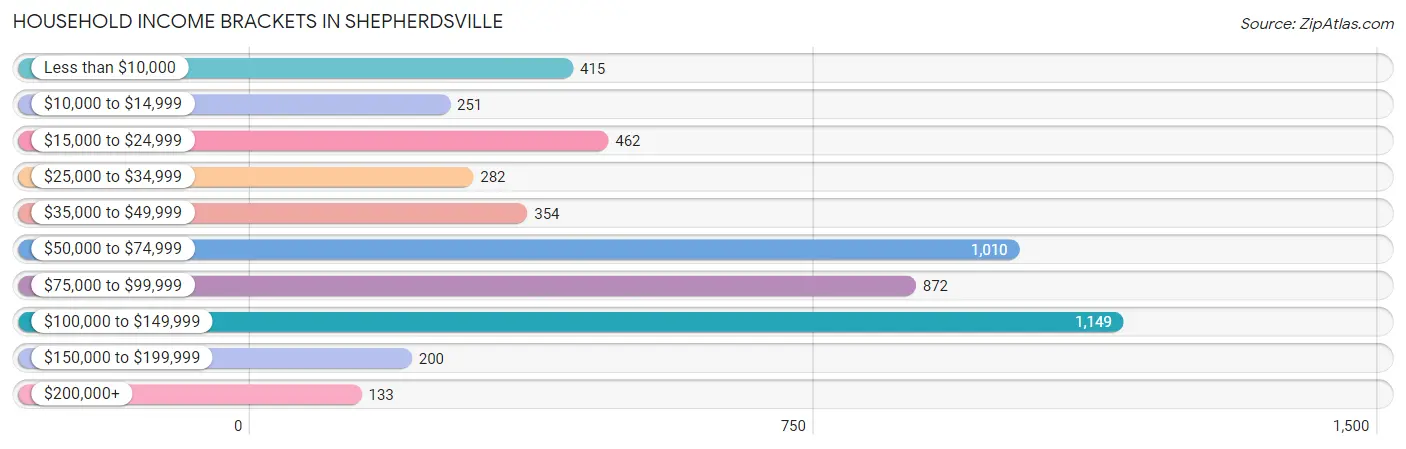
Household Income Brackets in Shepherdsville
With 1,149 households falling in the category, the $100,000 to $149,999 income range is the most frequent in Shepherdsville, accounting for 22.4% of all households. In contrast, only 133 households (2.6%) fall into the $200,000+ income bracket, making it the least populous group.
| Income Bracket | # Households | % Households |
| Less than $10,000 | 415 | 8.1% |
| $10,000 to $14,999 | 251 | 4.9% |
| $15,000 to $24,999 | 462 | 9.0% |
| $25,000 to $34,999 | 282 | 5.5% |
| $35,000 to $49,999 | 354 | 6.9% |
| $50,000 to $74,999 | 1,010 | 19.7% |
| $75,000 to $99,999 | 872 | 17.0% |
| $100,000 to $149,999 | 1,149 | 22.4% |
| $150,000 to $199,999 | 200 | 3.9% |
| $200,000+ | 133 | 2.6% |
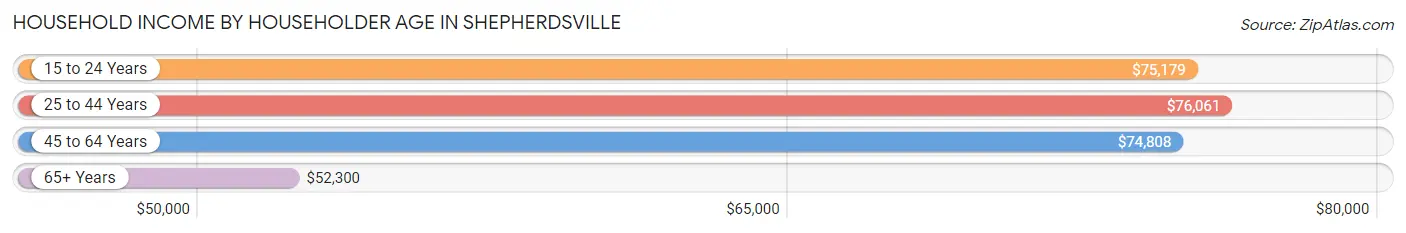
Household Income by Householder Age in Shepherdsville
The median household income in Shepherdsville is $71,875, with the highest median household income of $76,061 found in the 25 to 44 years age bracket for the primary householder. A total of 1,954 households (38.1%) fall into this category. Meanwhile, the 65+ years age bracket for the primary householder has the lowest median household income of $52,300, with 938 households (18.3%) in this group.
| Income Bracket | # Households | Median Income |
| 15 to 24 Years | 312 (6.1%) | $75,179 |
| 25 to 44 Years | 1,954 (38.1%) | $76,061 |
| 45 to 64 Years | 1,924 (37.5%) | $74,808 |
| 65+ Years | 938 (18.3%) | $52,300 |
| Total | 5,128 (100.0%) | $71,875 |
Poverty in Shepherdsville
Income Below Poverty by Sex and Age in Shepherdsville
With 15.5% poverty level for males and 32.3% for females among the residents of Shepherdsville, 5 year old males and 12 to 14 year old females are the most vulnerable to poverty, with 30 males (61.2%) and 189 females (57.1%) in their respective age groups living below the poverty level.
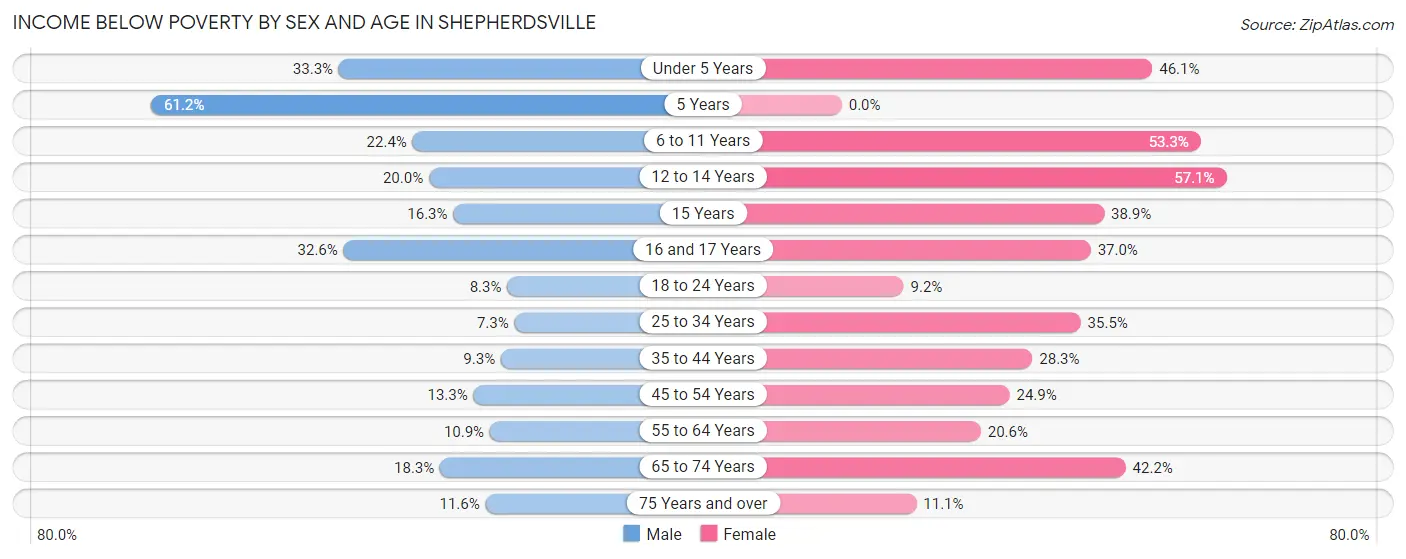
| Age Bracket | Male | Female |
| Under 5 Years | 226 (33.3%) | 225 (46.1%) |
| 5 Years | 30 (61.2%) | 0 (0.0%) |
| 6 to 11 Years | 128 (22.4%) | 421 (53.3%) |
| 12 to 14 Years | 74 (20.0%) | 189 (57.1%) |
| 15 Years | 16 (16.3%) | 44 (38.9%) |
| 16 and 17 Years | 62 (32.6%) | 51 (37.0%) |
| 18 to 24 Years | 54 (8.3%) | 47 (9.2%) |
| 25 to 34 Years | 64 (7.2%) | 321 (35.5%) |
| 35 to 44 Years | 88 (9.3%) | 322 (28.3%) |
| 45 to 54 Years | 91 (13.3%) | 272 (24.9%) |
| 55 to 64 Years | 98 (10.9%) | 173 (20.6%) |
| 65 to 74 Years | 73 (18.3%) | 255 (42.1%) |
| 75 Years and over | 17 (11.6%) | 32 (11.1%) |
| Total | 1,021 (15.5%) | 2,352 (32.3%) |
Income Above Poverty by Sex and Age in Shepherdsville
According to the poverty statistics in Shepherdsville, males aged 25 to 34 years and females aged 5 years are the age groups that are most secure financially, with 92.7% of males and 100.0% of females in these age groups living above the poverty line.
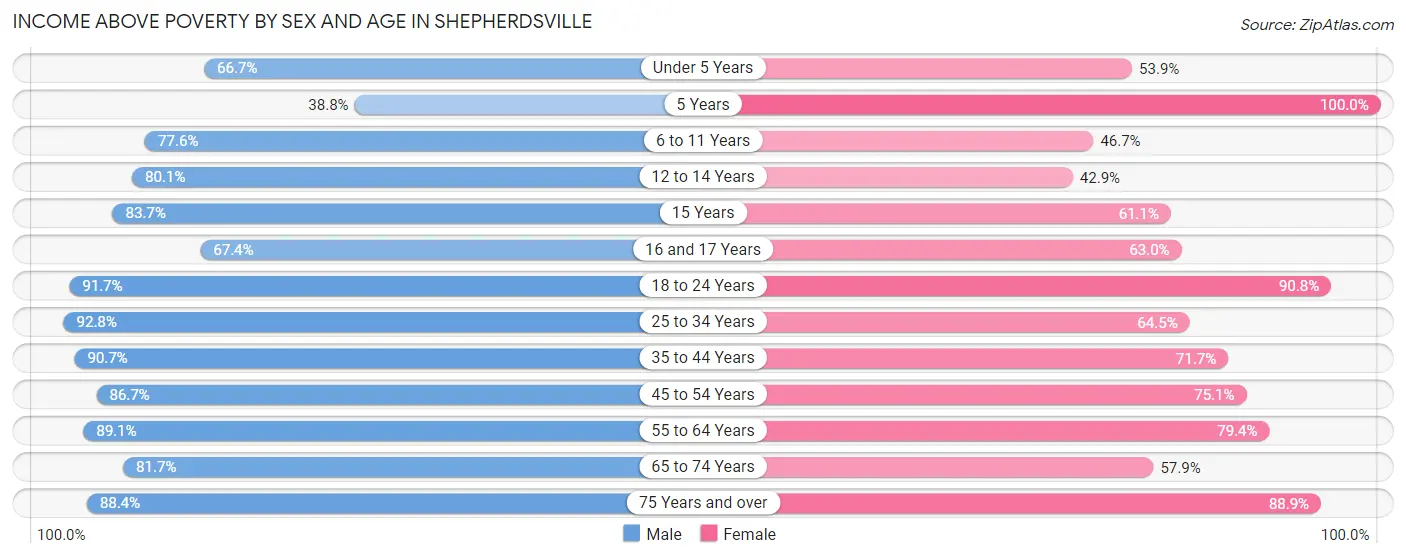
| Age Bracket | Male | Female |
| Under 5 Years | 452 (66.7%) | 263 (53.9%) |
| 5 Years | 19 (38.8%) | 34 (100.0%) |
| 6 to 11 Years | 444 (77.6%) | 369 (46.7%) |
| 12 to 14 Years | 297 (80.0%) | 142 (42.9%) |
| 15 Years | 82 (83.7%) | 69 (61.1%) |
| 16 and 17 Years | 128 (67.4%) | 87 (63.0%) |
| 18 to 24 Years | 595 (91.7%) | 465 (90.8%) |
| 25 to 34 Years | 819 (92.7%) | 584 (64.5%) |
| 35 to 44 Years | 862 (90.7%) | 816 (71.7%) |
| 45 to 54 Years | 591 (86.7%) | 820 (75.1%) |
| 55 to 64 Years | 801 (89.1%) | 665 (79.4%) |
| 65 to 74 Years | 326 (81.7%) | 350 (57.9%) |
| 75 Years and over | 130 (88.4%) | 257 (88.9%) |
| Total | 5,546 (84.5%) | 4,921 (67.7%) |
Income Below Poverty Among Married-Couple Families in Shepherdsville
The poverty statistics for married-couple families in Shepherdsville show that 10.6% or 267 of the total 2,528 families live below the poverty line. Families with 5 or more children have the highest poverty rate of 72.6%, comprising of 111 families. On the other hand, families with 1 or 2 children have the lowest poverty rate of 3.1%, which includes 24 families.
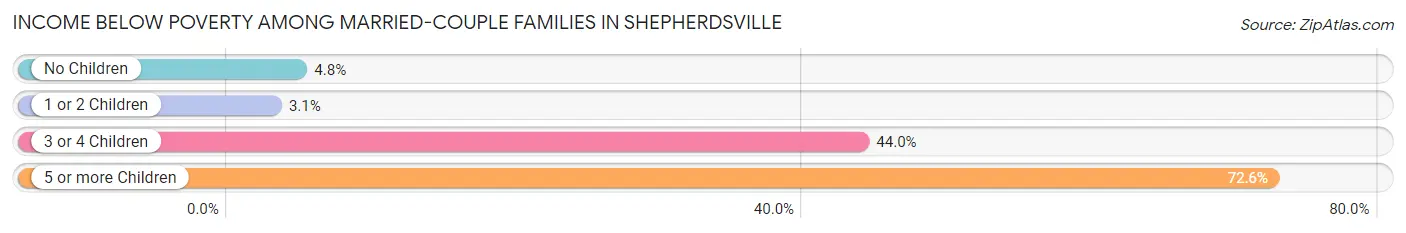
| Children | Above Poverty | Below Poverty |
| No Children | 1,380 (95.2%) | 70 (4.8%) |
| 1 or 2 Children | 760 (96.9%) | 24 (3.1%) |
| 3 or 4 Children | 79 (56.0%) | 62 (44.0%) |
| 5 or more Children | 42 (27.5%) | 111 (72.6%) |
| Total | 2,261 (89.4%) | 267 (10.6%) |
Income Below Poverty Among Single-Parent Households in Shepherdsville
According to the poverty data in Shepherdsville, 18.0% or 66 single-father households and 42.3% or 331 single-mother households are living below the poverty line. Among single-father households, those with 1 or 2 children have the highest poverty rate, with 66 households (28.6%) experiencing poverty. Likewise, among single-mother households, those with 3 or 4 children have the highest poverty rate, with 97 households (91.5%) falling below the poverty line.
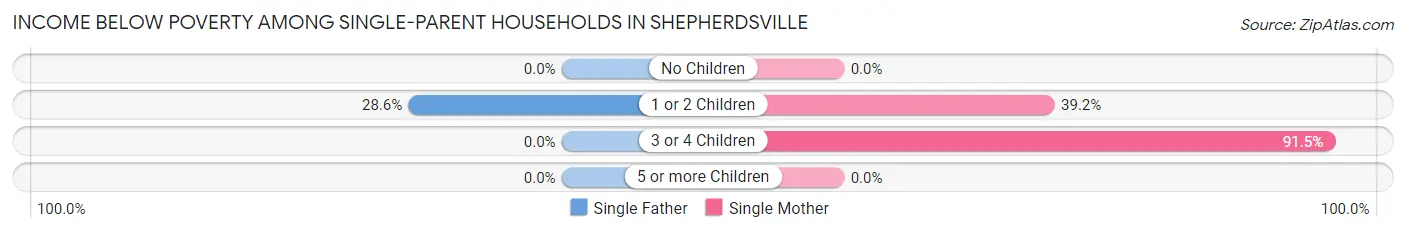
| Children | Single Father | Single Mother |
| No Children | 0 (0.0%) | 0 (0.0%) |
| 1 or 2 Children | 66 (28.6%) | 234 (39.2%) |
| 3 or 4 Children | 0 (0.0%) | 97 (91.5%) |
| 5 or more Children | 0 (0.0%) | 0 (0.0%) |
| Total | 66 (18.0%) | 331 (42.3%) |
Income Below Poverty Among Married-Couple vs Single-Parent Households in Shepherdsville
The poverty data for Shepherdsville shows that 267 of the married-couple family households (10.6%) and 397 of the single-parent households (34.5%) are living below the poverty level. Within the married-couple family households, those with 5 or more children have the highest poverty rate, with 111 households (72.6%) falling below the poverty line. Among the single-parent households, those with 3 or 4 children have the highest poverty rate, with 97 household (63.0%) living below poverty.
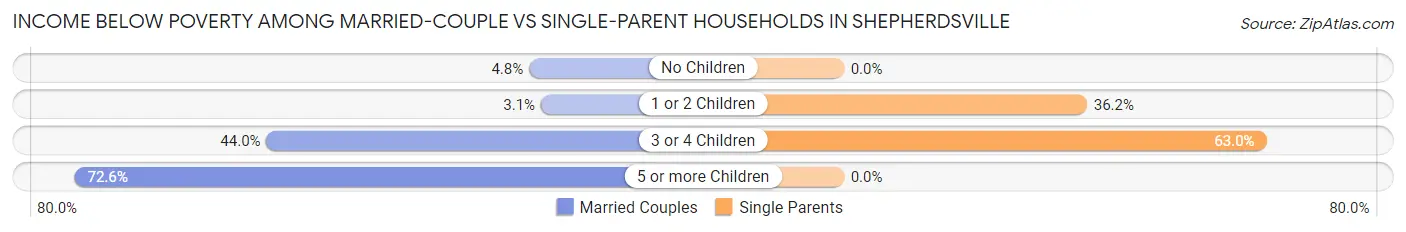
| Children | Married-Couple Families | Single-Parent Households |
| No Children | 70 (4.8%) | 0 (0.0%) |
| 1 or 2 Children | 24 (3.1%) | 300 (36.2%) |
| 3 or 4 Children | 62 (44.0%) | 97 (63.0%) |
| 5 or more Children | 111 (72.6%) | 0 (0.0%) |
| Total | 267 (10.6%) | 397 (34.5%) |
Race in Shepherdsville
The most populous races in Shepherdsville are White / Caucasian (13,186 | 93.3%), Two or more Races (487 | 3.5%), and Hispanic or Latino (380 | 2.7%).
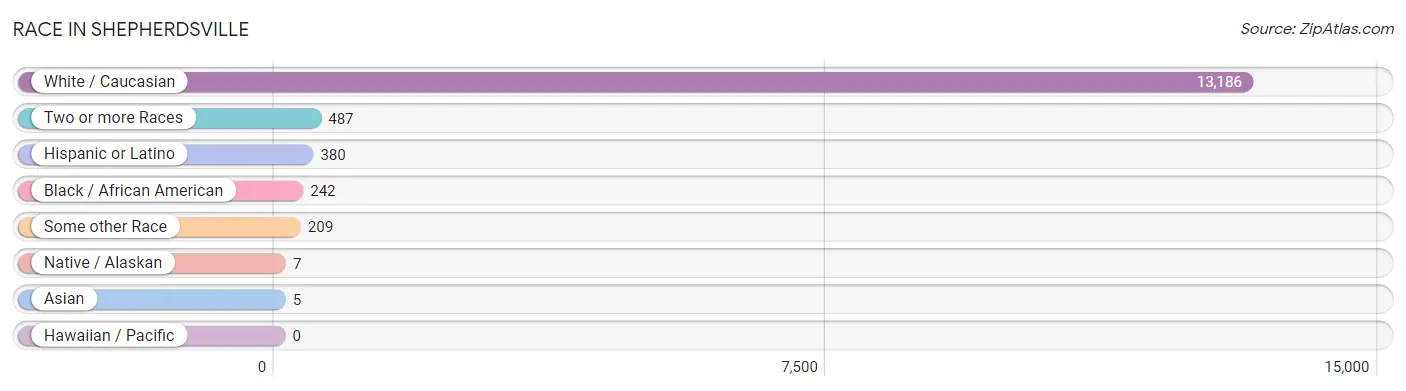
| Race | # Population | % Population |
| Asian | 5 | 0.0% |
| Black / African American | 242 | 1.7% |
| Hawaiian / Pacific | 0 | 0.0% |
| Hispanic or Latino | 380 | 2.7% |
| Native / Alaskan | 7 | 0.1% |
| White / Caucasian | 13,186 | 93.3% |
| Two or more Races | 487 | 3.5% |
| Some other Race | 209 | 1.5% |
| Total | 14,136 | 100.0% |
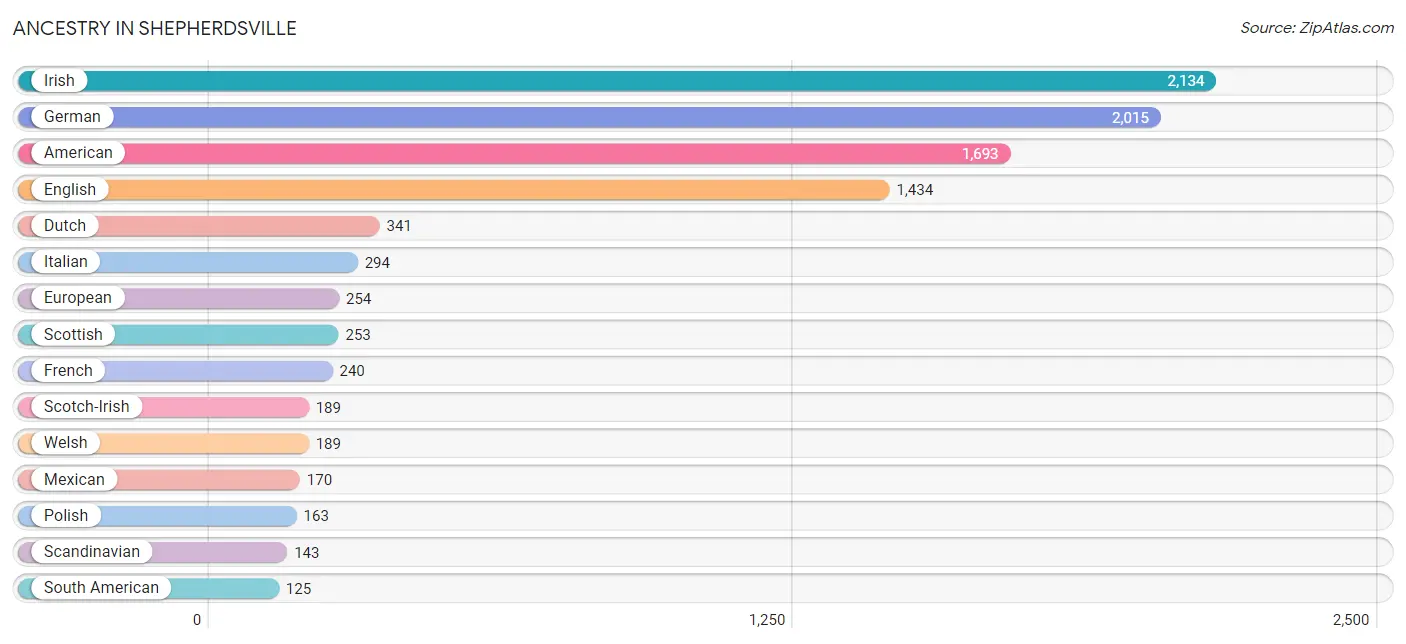
Ancestry in Shepherdsville
The most populous ancestries reported in Shepherdsville are Irish (2,134 | 15.1%), German (2,015 | 14.2%), American (1,693 | 12.0%), English (1,434 | 10.1%), and Dutch (341 | 2.4%), together accounting for 53.9% of all Shepherdsville residents.
| Ancestry | # Population | % Population |
| American | 1,693 | 12.0% |
| Arab | 13 | 0.1% |
| Australian | 27 | 0.2% |
| Austrian | 8 | 0.1% |
| Bhutanese | 4 | 0.0% |
| Blackfeet | 8 | 0.1% |
| British | 46 | 0.3% |
| Cherokee | 15 | 0.1% |
| Colombian | 36 | 0.3% |
| Cuban | 43 | 0.3% |
| Dutch | 341 | 2.4% |
| English | 1,434 | 10.1% |
| European | 254 | 1.8% |
| French | 240 | 1.7% |
| French Canadian | 16 | 0.1% |
| German | 2,015 | 14.2% |
| Greek | 17 | 0.1% |
| Icelander | 13 | 0.1% |
| Irish | 2,134 | 15.1% |
| Italian | 294 | 2.1% |
| Korean | 5 | 0.0% |
| Lebanese | 13 | 0.1% |
| Mexican | 170 | 1.2% |
| Norwegian | 71 | 0.5% |
| Polish | 163 | 1.1% |
| Portuguese | 31 | 0.2% |
| Puerto Rican | 42 | 0.3% |
| Russian | 6 | 0.0% |
| Scandinavian | 143 | 1.0% |
| Scotch-Irish | 189 | 1.3% |
| Scottish | 253 | 1.8% |
| South American | 125 | 0.9% |
| Swiss | 24 | 0.2% |
| Trinidadian and Tobagonian | 31 | 0.2% |
| Welsh | 189 | 1.3% | View All 35 Rows |
Immigrants in Shepherdsville
The most numerous immigrant groups reported in Shepherdsville came from Europe (104 | 0.7%), Northern Europe (104 | 0.7%), Latin America (73 | 0.5%), South America (73 | 0.5%), and Peru (37 | 0.3%), together accounting for 2.8% of all Shepherdsville residents.
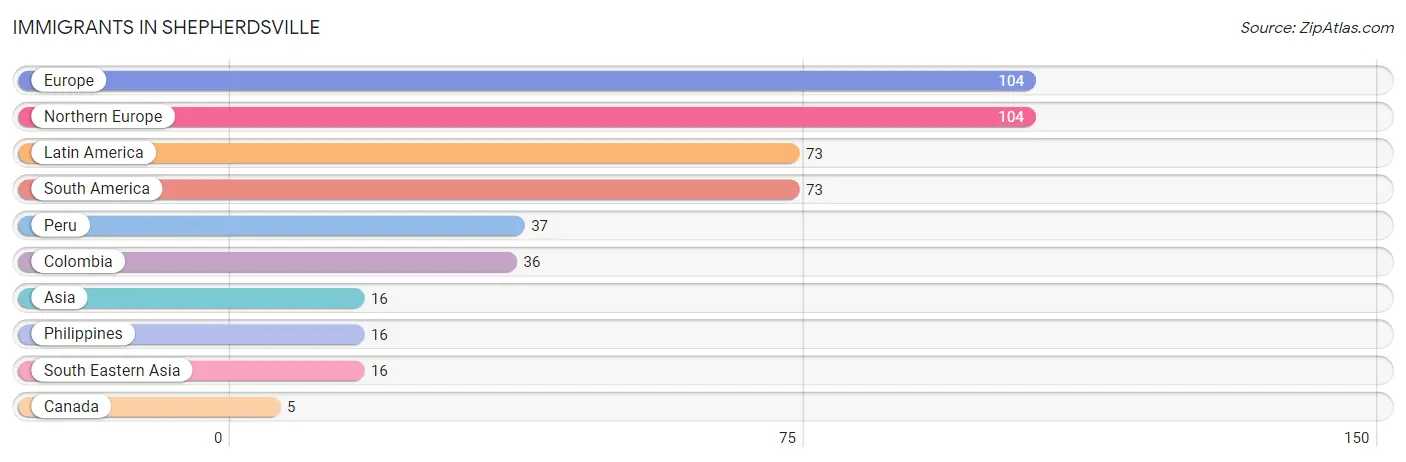
| Immigration Origin | # Population | % Population |
| Asia | 16 | 0.1% |
| Canada | 5 | 0.0% |
| Colombia | 36 | 0.3% |
| Europe | 104 | 0.7% |
| Latin America | 73 | 0.5% |
| Northern Europe | 104 | 0.7% |
| Peru | 37 | 0.3% |
| Philippines | 16 | 0.1% |
| South America | 73 | 0.5% |
| South Eastern Asia | 16 | 0.1% | View All 10 Rows |
Sex and Age in Shepherdsville
Sex and Age in Shepherdsville
The most populous age groups in Shepherdsville are Under 5 Years (678 | 10.0%) for men and 35 to 39 Years (668 | 9.0%) for women.
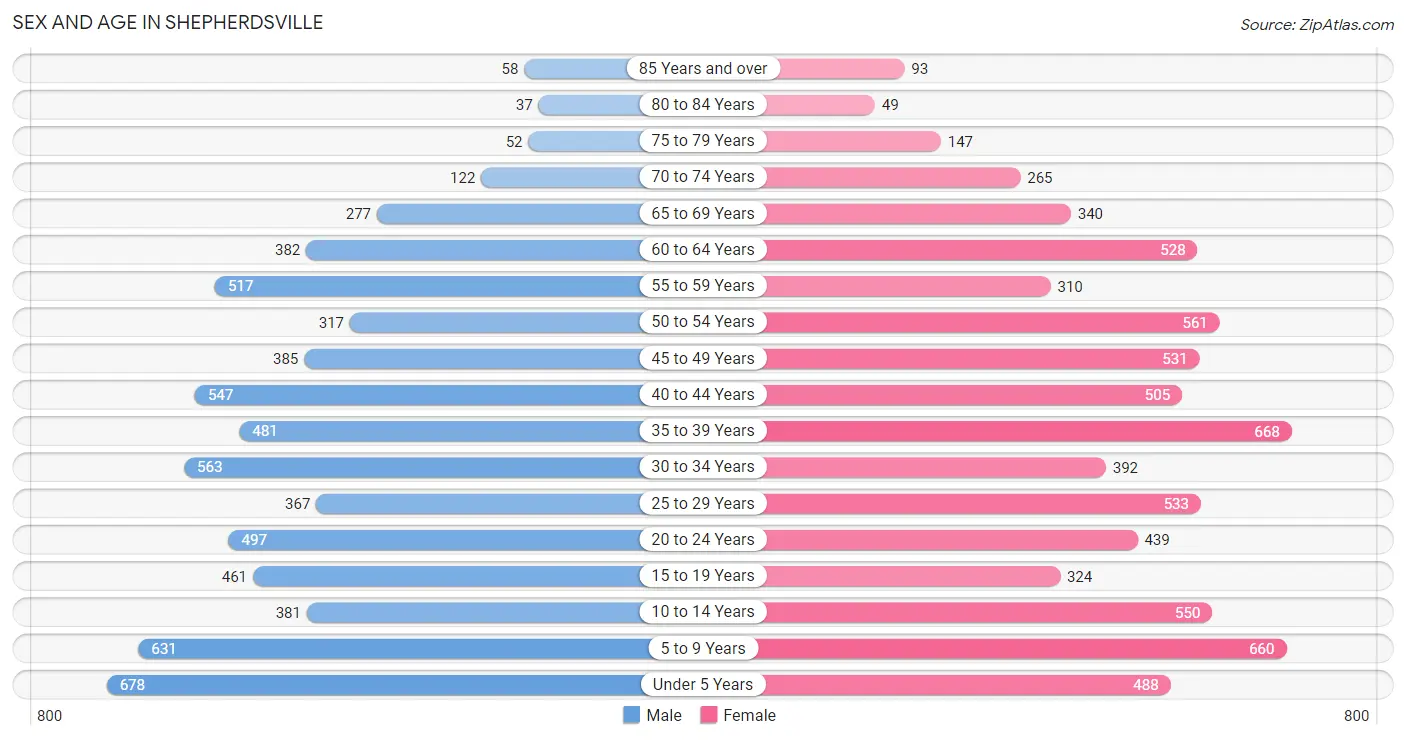
| Age Bracket | Male | Female |
| Under 5 Years | 678 (10.0%) | 488 (6.6%) |
| 5 to 9 Years | 631 (9.3%) | 660 (8.9%) |
| 10 to 14 Years | 381 (5.6%) | 550 (7.4%) |
| 15 to 19 Years | 461 (6.8%) | 324 (4.4%) |
| 20 to 24 Years | 497 (7.4%) | 439 (5.9%) |
| 25 to 29 Years | 367 (5.4%) | 533 (7.2%) |
| 30 to 34 Years | 563 (8.3%) | 392 (5.3%) |
| 35 to 39 Years | 481 (7.1%) | 668 (9.0%) |
| 40 to 44 Years | 547 (8.1%) | 505 (6.8%) |
| 45 to 49 Years | 385 (5.7%) | 531 (7.2%) |
| 50 to 54 Years | 317 (4.7%) | 561 (7.6%) |
| 55 to 59 Years | 517 (7.7%) | 310 (4.2%) |
| 60 to 64 Years | 382 (5.7%) | 528 (7.1%) |
| 65 to 69 Years | 277 (4.1%) | 340 (4.6%) |
| 70 to 74 Years | 122 (1.8%) | 265 (3.6%) |
| 75 to 79 Years | 52 (0.8%) | 147 (2.0%) |
| 80 to 84 Years | 37 (0.5%) | 49 (0.7%) |
| 85 Years and over | 58 (0.9%) | 93 (1.3%) |
| Total | 6,753 (100.0%) | 7,383 (100.0%) |
Families and Households in Shepherdsville
Median Family Size in Shepherdsville
The median family size in Shepherdsville is 3.11 persons per family, with single male/father families (367 | 10.0%) accounting for the largest median family size of 3.22 persons per family. On the other hand, married-couple families (2,528 | 68.7%) represent the smallest median family size with 3.09 persons per family.
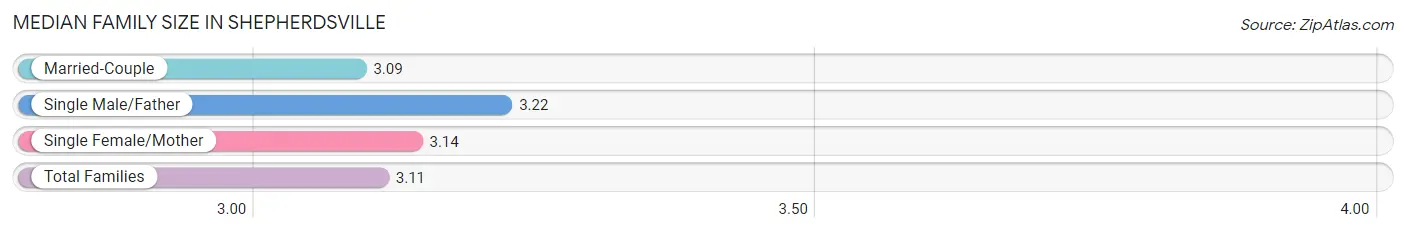
| Family Type | # Families | Family Size |
| Married-Couple | 2,528 (68.7%) | 3.09 |
| Single Male/Father | 367 (10.0%) | 3.22 |
| Single Female/Mother | 783 (21.3%) | 3.14 |
| Total Families | 3,678 (100.0%) | 3.11 |
Median Household Size in Shepherdsville
The median household size in Shepherdsville is 2.71 persons per household, with single male/father households (367 | 7.2%) accounting for the largest median household size of 3.7 persons per household. non-family households (1,450 | 28.3%) represent the smallest median household size with 1.30 persons per household.
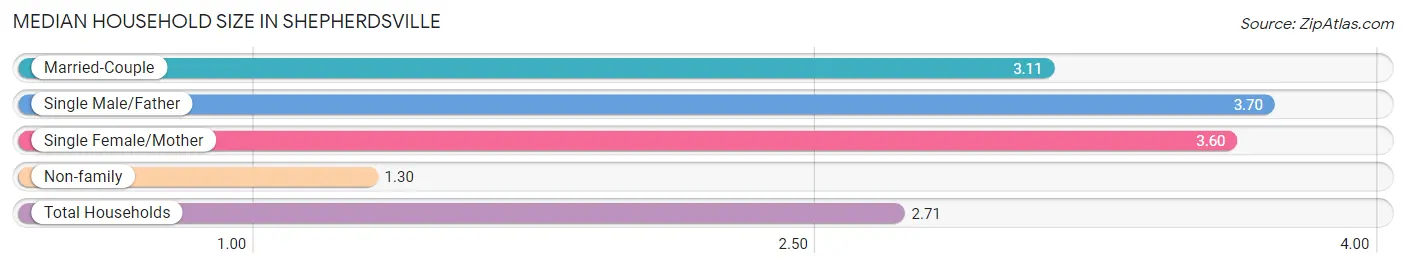
| Household Type | # Households | Household Size |
| Married-Couple | 2,528 (49.3%) | 3.11 |
| Single Male/Father | 367 (7.2%) | 3.70 |
| Single Female/Mother | 783 (15.3%) | 3.60 |
| Non-family | 1,450 (28.3%) | 1.30 |
| Total Households | 5,128 (100.0%) | 2.71 |
Household Size by Marriage Status in Shepherdsville
Out of a total of 5,128 households in Shepherdsville, 3,678 (71.7%) are family households, while 1,450 (28.3%) are nonfamily households. The most numerous type of family households are 2-person households, comprising 1,476, and the most common type of nonfamily households are 1-person households, comprising 1,069.
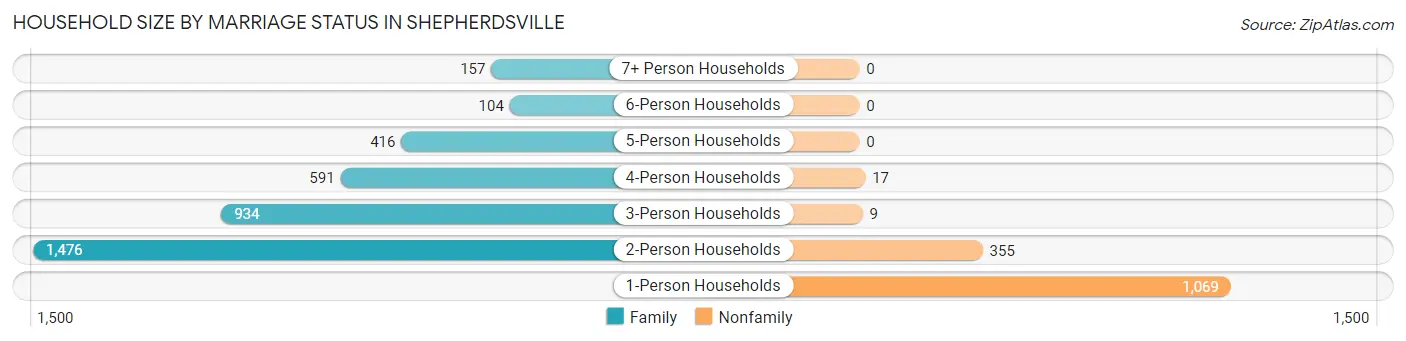
| Household Size | Family Households | Nonfamily Households |
| 1-Person Households | - | 1,069 (20.8%) |
| 2-Person Households | 1,476 (28.8%) | 355 (6.9%) |
| 3-Person Households | 934 (18.2%) | 9 (0.2%) |
| 4-Person Households | 591 (11.5%) | 17 (0.3%) |
| 5-Person Households | 416 (8.1%) | 0 (0.0%) |
| 6-Person Households | 104 (2.0%) | 0 (0.0%) |
| 7+ Person Households | 157 (3.1%) | 0 (0.0%) |
| Total | 3,678 (71.7%) | 1,450 (28.3%) |
Female Fertility in Shepherdsville
Fertility by Age in Shepherdsville
Average fertility rate in Shepherdsville is 47.0 births per 1,000 women. Women in the age bracket of 20 to 34 years have the highest fertility rate with 70.0 births per 1,000 women. Women in the age bracket of 20 to 34 years acount for 58.3% of all women with births.
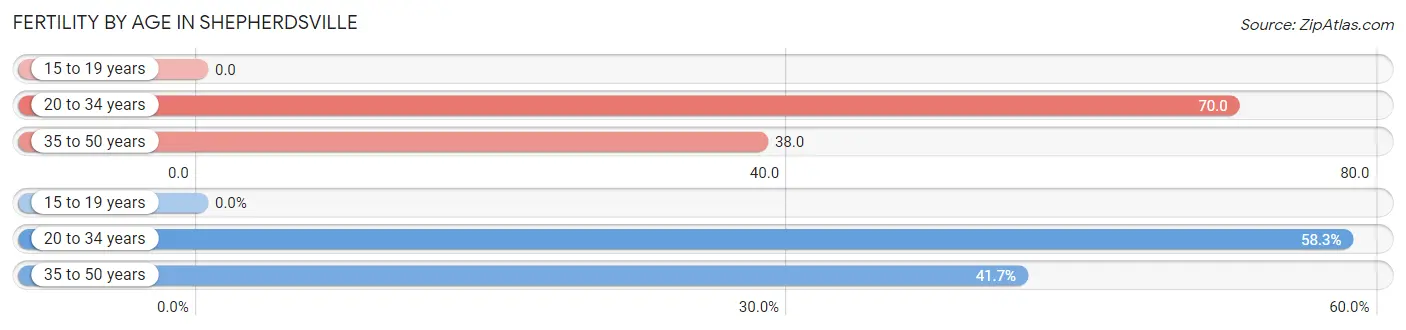
| Age Bracket | Women with Births | Births / 1,000 Women |
| 15 to 19 years | 0 (0.0%) | 0.0 |
| 20 to 34 years | 95 (58.3%) | 70.0 |
| 35 to 50 years | 68 (41.7%) | 38.0 |
| Total | 163 (100.0%) | 47.0 |
Fertility by Age by Marriage Status in Shepherdsville
95.7% of women with births (163) in Shepherdsville are married. The highest percentage of unmarried women with births falls into 20 to 34 years age bracket with 7.4% of them unmarried at the time of birth, while the lowest percentage of unmarried women with births belong to 35 to 50 years age bracket with 0.0% of them unmarried.
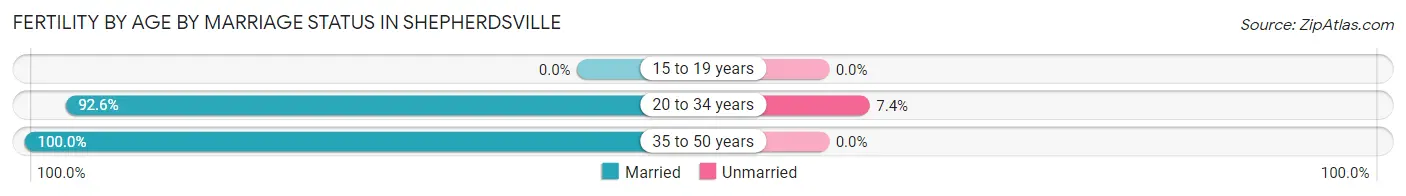
| Age Bracket | Married | Unmarried |
| 15 to 19 years | 0 (0.0%) | 0 (0.0%) |
| 20 to 34 years | 88 (92.6%) | 7 (7.4%) |
| 35 to 50 years | 68 (100.0%) | 0 (0.0%) |
| Total | 156 (95.7%) | 7 (4.3%) |
Fertility by Education in Shepherdsville
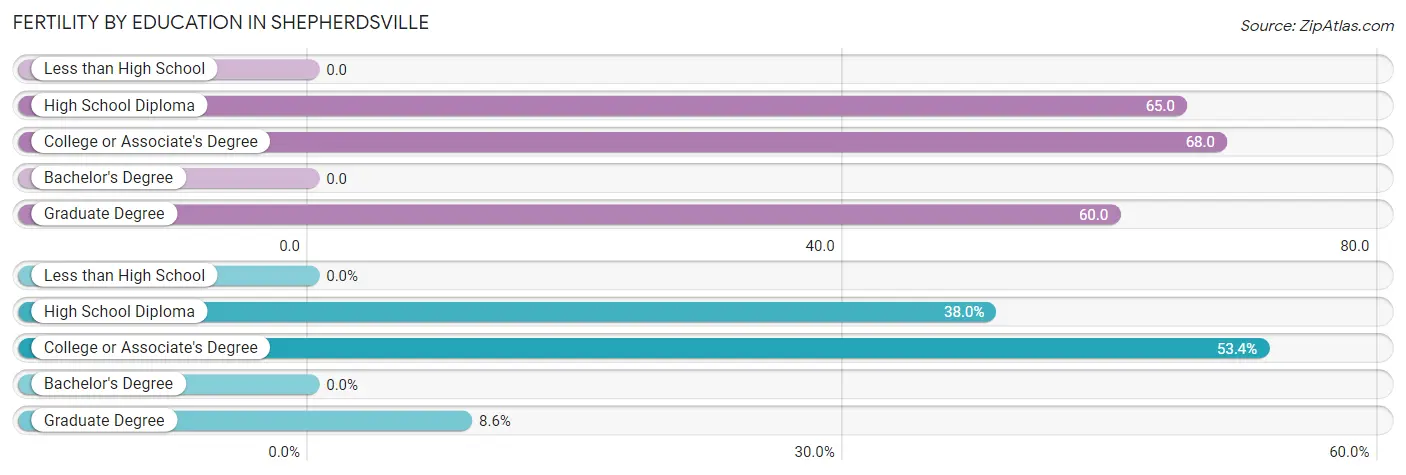
| Educational Attainment | Women with Births | Births / 1,000 Women |
| Less than High School | 0 (0.0%) | 0.0 |
| High School Diploma | 62 (38.0%) | 65.0 |
| College or Associate's Degree | 87 (53.4%) | 68.0 |
| Bachelor's Degree | 0 (0.0%) | 0.0 |
| Graduate Degree | 14 (8.6%) | 60.0 |
| Total | 163 (100.0%) | 47.0 |
Fertility by Education by Marriage Status in Shepherdsville
4.3% of women with births in Shepherdsville are unmarried. Women with the educational attainment of high school diploma are most likely to be married with 100.0% of them married at childbirth, while women with the educational attainment of college or associate's degree are least likely to be married with 8.1% of them unmarried at childbirth.
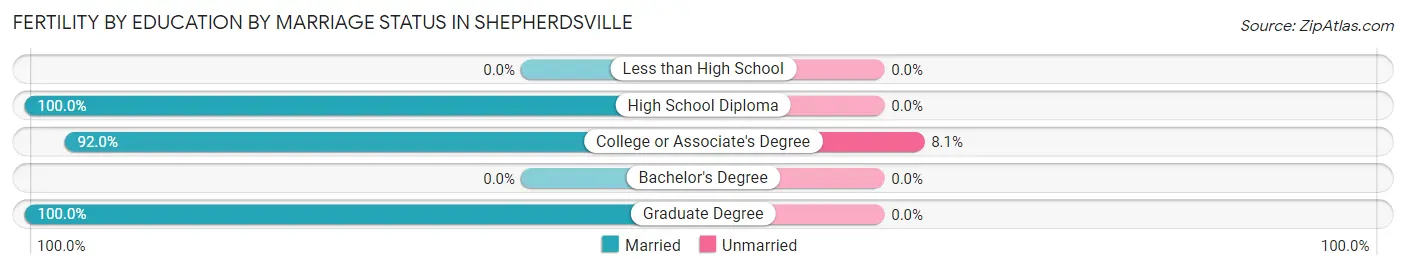
| Educational Attainment | Married | Unmarried |
| Less than High School | 0 (0.0%) | 0 (0.0%) |
| High School Diploma | 62 (100.0%) | 0 (0.0%) |
| College or Associate's Degree | 80 (91.9%) | 7 (8.1%) |
| Bachelor's Degree | 0 (0.0%) | 0 (0.0%) |
| Graduate Degree | 14 (100.0%) | 0 (0.0%) |
| Total | 156 (95.7%) | 7 (4.3%) |
Employment Characteristics in Shepherdsville
Employment by Class of Employer in Shepherdsville
Among the 6,691 employed individuals in Shepherdsville, private company employees (5,425 | 81.1%), local government employees (523 | 7.8%), and state government employees (252 | 3.8%) make up the most common classes of employment.
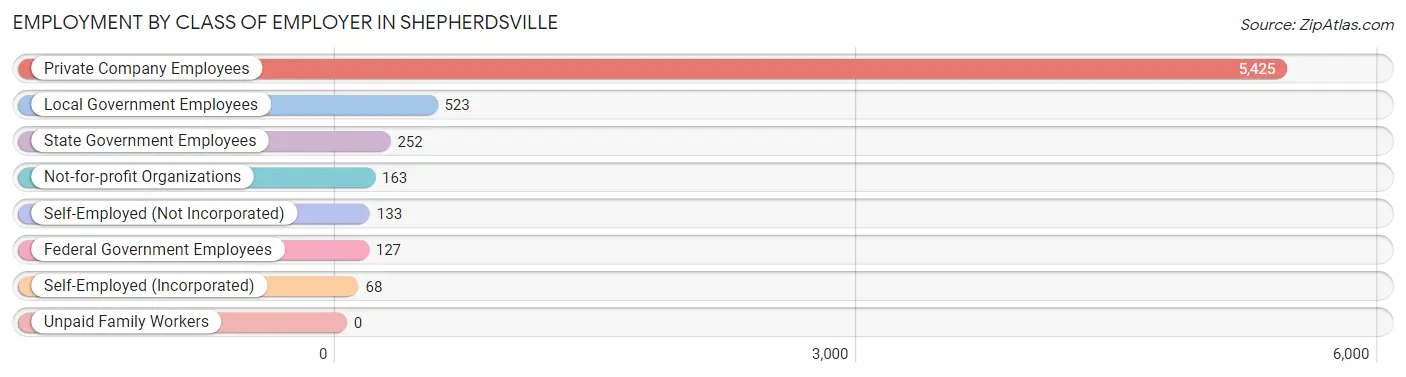
| Employer Class | # Employees | % Employees |
| Private Company Employees | 5,425 | 81.1% |
| Self-Employed (Incorporated) | 68 | 1.0% |
| Self-Employed (Not Incorporated) | 133 | 2.0% |
| Not-for-profit Organizations | 163 | 2.4% |
| Local Government Employees | 523 | 7.8% |
| State Government Employees | 252 | 3.8% |
| Federal Government Employees | 127 | 1.9% |
| Unpaid Family Workers | 0 | 0.0% |
| Total | 6,691 | 100.0% |
Employment Status by Age in Shepherdsville
According to the labor force statistics for Shepherdsville, out of the total population over 16 years of age (10,537), 67.8% or 7,144 individuals are in the labor force, with 3.6% or 257 of them unemployed. The age group with the highest labor force participation rate is 30 to 34 years, with 89.6% or 856 individuals in the labor force. Within the labor force, the 20 to 24 years age range has the highest percentage of unemployed individuals, with 8.8% or 73 of them being unemployed.
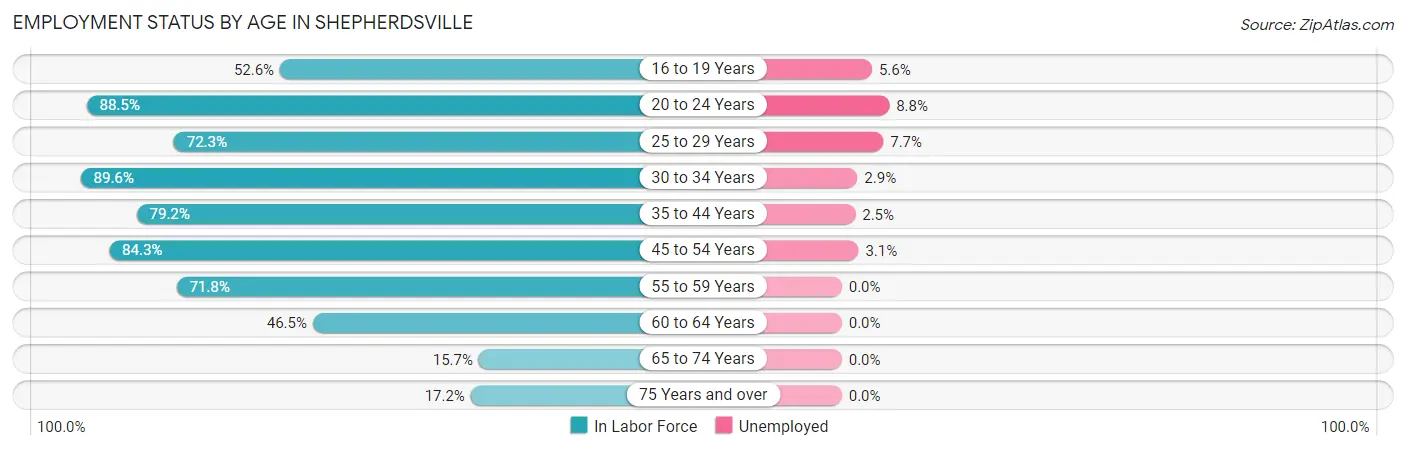
| Age Bracket | In Labor Force | Unemployed |
| 16 to 19 Years | 302 (52.6%) | 17 (5.6%) |
| 20 to 24 Years | 828 (88.5%) | 73 (8.8%) |
| 25 to 29 Years | 651 (72.3%) | 50 (7.7%) |
| 30 to 34 Years | 856 (89.6%) | 25 (2.9%) |
| 35 to 44 Years | 1,743 (79.2%) | 44 (2.5%) |
| 45 to 54 Years | 1,512 (84.3%) | 47 (3.1%) |
| 55 to 59 Years | 594 (71.8%) | 0 (0.0%) |
| 60 to 64 Years | 423 (46.5%) | 0 (0.0%) |
| 65 to 74 Years | 158 (15.7%) | 0 (0.0%) |
| 75 Years and over | 75 (17.2%) | 0 (0.0%) |
| Total | 7,144 (67.8%) | 257 (3.6%) |
Employment Status by Educational Attainment in Shepherdsville
According to labor force statistics for Shepherdsville, 76.2% of individuals (5,781) out of the total population between 25 and 64 years of age (7,587) are in the labor force, with 2.9% or 168 of them being unemployed. The group with the highest labor force participation rate are those with the educational attainment of bachelor's degree or higher, with 85.7% or 1,064 individuals in the labor force. Within the labor force, individuals with less than high school education have the highest percentage of unemployment, with 18.1% or 75 of them being unemployed.
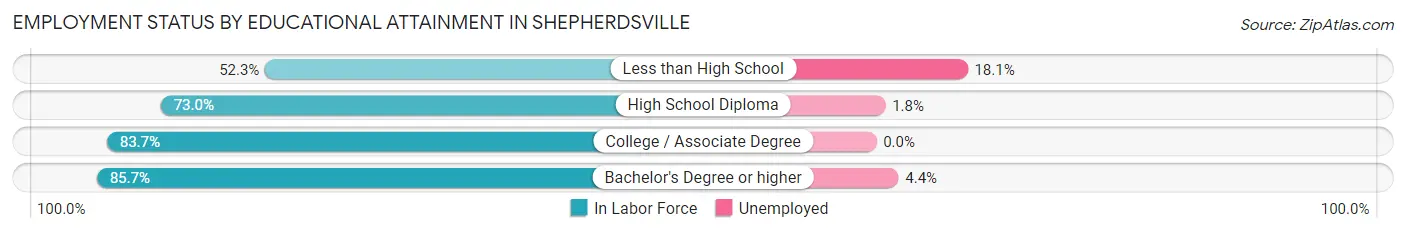
| Educational Attainment | In Labor Force | Unemployed |
| Less than High School | 415 (52.3%) | 144 (18.1%) |
| High School Diploma | 2,363 (73.0%) | 58 (1.8%) |
| College / Associate Degree | 1,937 (83.7%) | 0 (0.0%) |
| Bachelor's Degree or higher | 1,064 (85.7%) | 55 (4.4%) |
| Total | 5,781 (76.2%) | 220 (2.9%) |
Employment Occupations by Sex in Shepherdsville
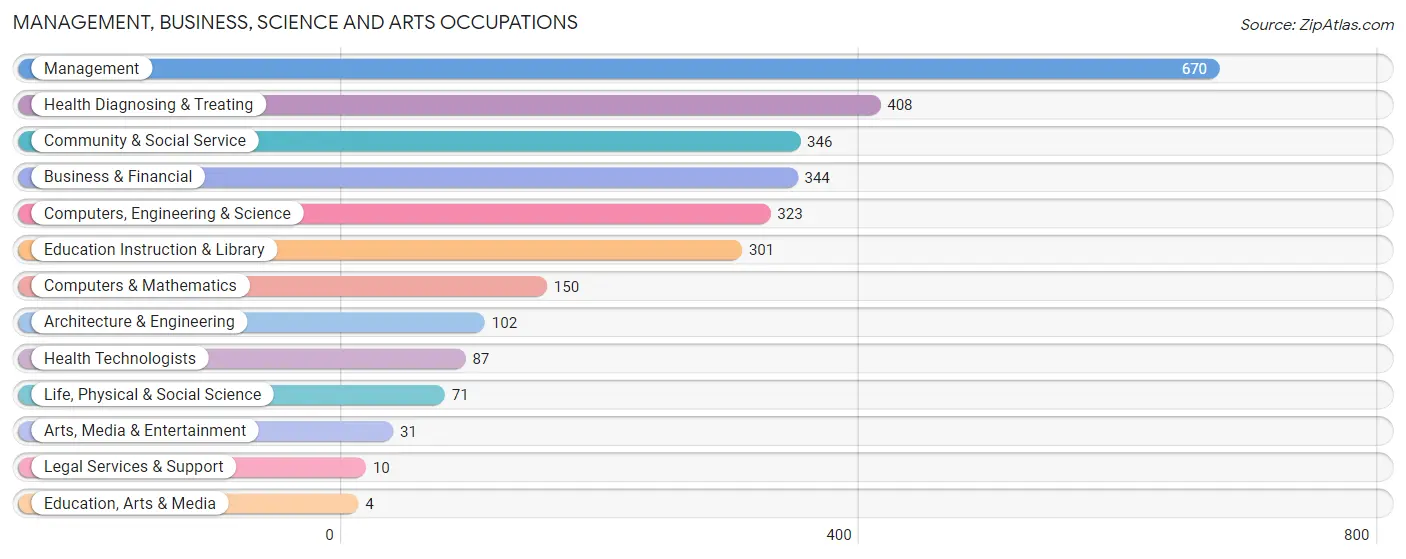
Management, Business, Science and Arts Occupations
The most common Management, Business, Science and Arts occupations in Shepherdsville are Management (670 | 9.7%), Health Diagnosing & Treating (408 | 5.9%), Community & Social Service (346 | 5.0%), Business & Financial (344 | 5.0%), and Computers, Engineering & Science (323 | 4.7%).
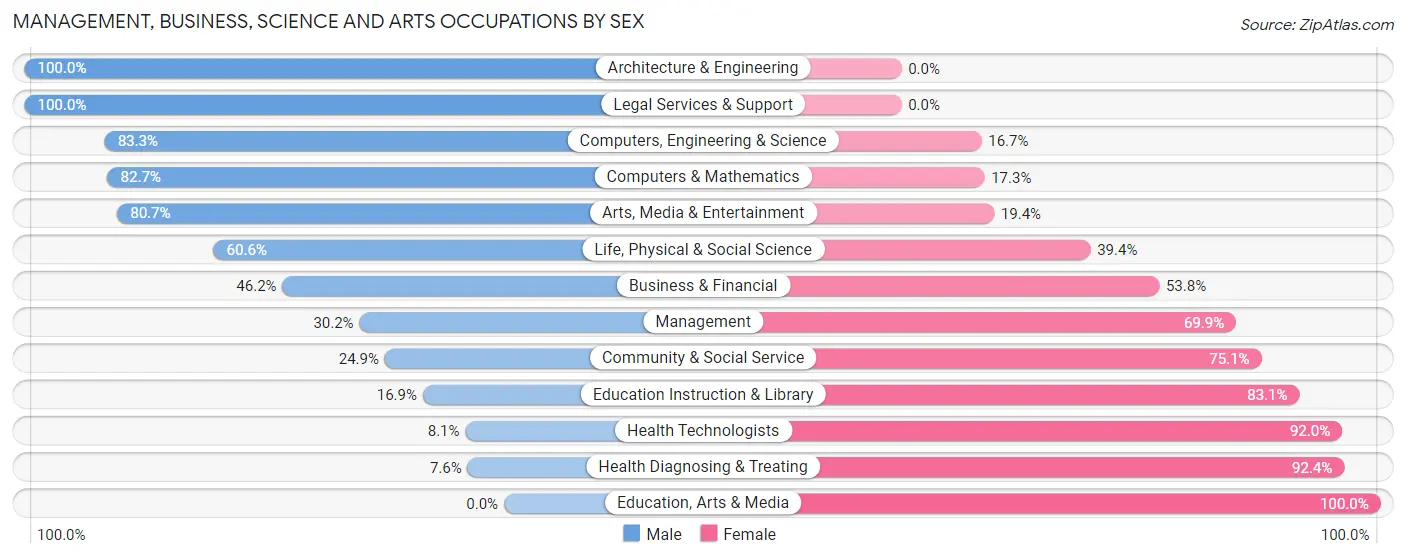
Management, Business, Science and Arts Occupations by Sex
Within the Management, Business, Science and Arts occupations in Shepherdsville, the most male-oriented occupations are Architecture & Engineering (100.0%), Legal Services & Support (100.0%), and Computers, Engineering & Science (83.3%), while the most female-oriented occupations are Education, Arts & Media (100.0%), Health Diagnosing & Treating (92.4%), and Health Technologists (91.9%).
| Occupation | Male | Female |
| Management | 202 (30.1%) | 468 (69.9%) |
| Business & Financial | 159 (46.2%) | 185 (53.8%) |
| Computers, Engineering & Science | 269 (83.3%) | 54 (16.7%) |
| Computers & Mathematics | 124 (82.7%) | 26 (17.3%) |
| Architecture & Engineering | 102 (100.0%) | 0 (0.0%) |
| Life, Physical & Social Science | 43 (60.6%) | 28 (39.4%) |
| Community & Social Service | 86 (24.9%) | 260 (75.1%) |
| Education, Arts & Media | 0 (0.0%) | 4 (100.0%) |
| Legal Services & Support | 10 (100.0%) | 0 (0.0%) |
| Education Instruction & Library | 51 (16.9%) | 250 (83.1%) |
| Arts, Media & Entertainment | 25 (80.6%) | 6 (19.4%) |
| Health Diagnosing & Treating | 31 (7.6%) | 377 (92.4%) |
| Health Technologists | 7 (8.1%) | 80 (91.9%) |
| Total (Category) | 747 (35.7%) | 1,344 (64.3%) |
| Total (Overall) | 3,468 (50.4%) | 3,409 (49.6%) |
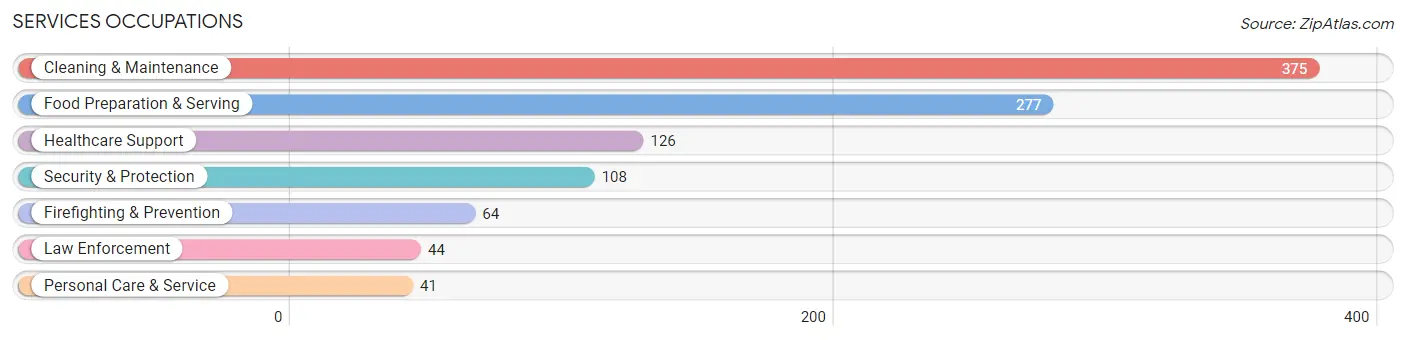
Services Occupations
The most common Services occupations in Shepherdsville are Cleaning & Maintenance (375 | 5.4%), Food Preparation & Serving (277 | 4.0%), Healthcare Support (126 | 1.8%), Security & Protection (108 | 1.6%), and Firefighting & Prevention (64 | 0.9%).
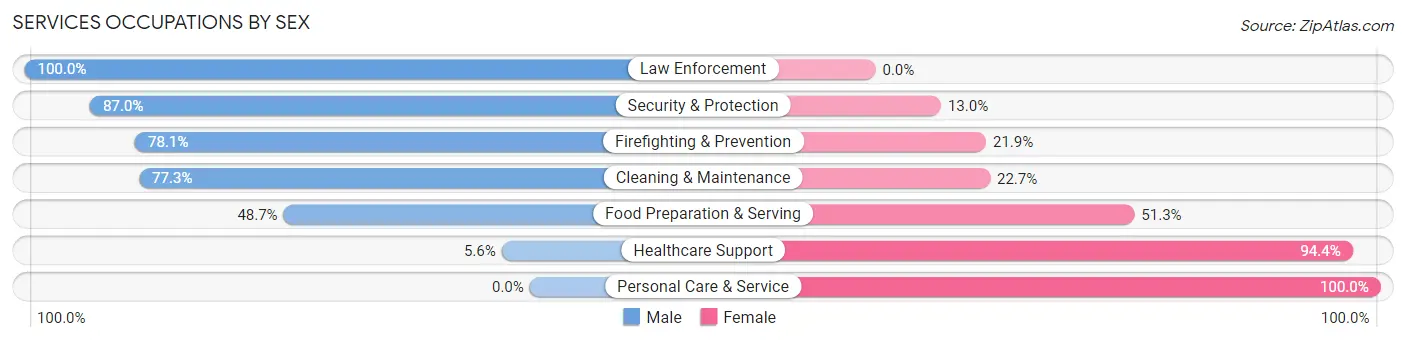
Services Occupations by Sex
Within the Services occupations in Shepherdsville, the most male-oriented occupations are Law Enforcement (100.0%), Security & Protection (87.0%), and Firefighting & Prevention (78.1%), while the most female-oriented occupations are Personal Care & Service (100.0%), Healthcare Support (94.4%), and Food Preparation & Serving (51.3%).
| Occupation | Male | Female |
| Healthcare Support | 7 (5.6%) | 119 (94.4%) |
| Security & Protection | 94 (87.0%) | 14 (13.0%) |
| Firefighting & Prevention | 50 (78.1%) | 14 (21.9%) |
| Law Enforcement | 44 (100.0%) | 0 (0.0%) |
| Food Preparation & Serving | 135 (48.7%) | 142 (51.3%) |
| Cleaning & Maintenance | 290 (77.3%) | 85 (22.7%) |
| Personal Care & Service | 0 (0.0%) | 41 (100.0%) |
| Total (Category) | 526 (56.7%) | 401 (43.3%) |
| Total (Overall) | 3,468 (50.4%) | 3,409 (49.6%) |
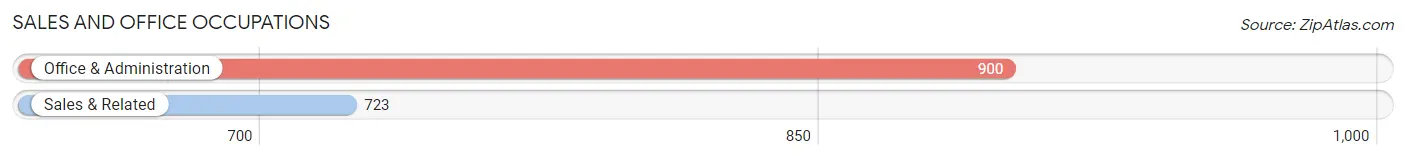
Sales and Office Occupations
The most common Sales and Office occupations in Shepherdsville are Office & Administration (900 | 13.1%), and Sales & Related (723 | 10.5%).
Sales and Office Occupations by Sex
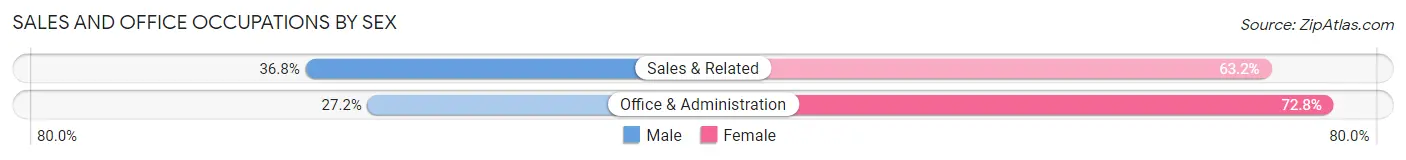
| Occupation | Male | Female |
| Sales & Related | 266 (36.8%) | 457 (63.2%) |
| Office & Administration | 245 (27.2%) | 655 (72.8%) |
| Total (Category) | 511 (31.5%) | 1,112 (68.5%) |
| Total (Overall) | 3,468 (50.4%) | 3,409 (49.6%) |
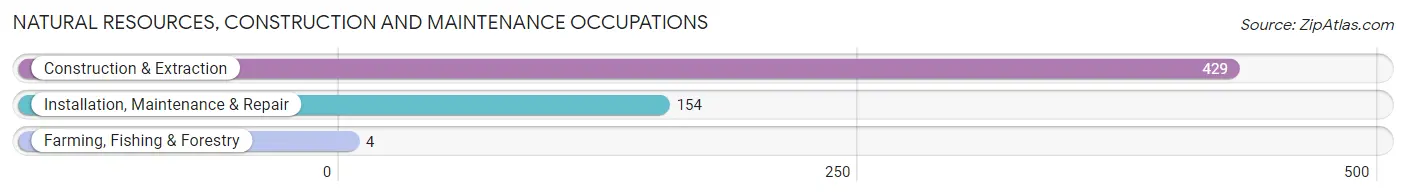
Natural Resources, Construction and Maintenance Occupations
The most common Natural Resources, Construction and Maintenance occupations in Shepherdsville are Construction & Extraction (429 | 6.2%), Installation, Maintenance & Repair (154 | 2.2%), and Farming, Fishing & Forestry (4 | 0.1%).
Natural Resources, Construction and Maintenance Occupations by Sex
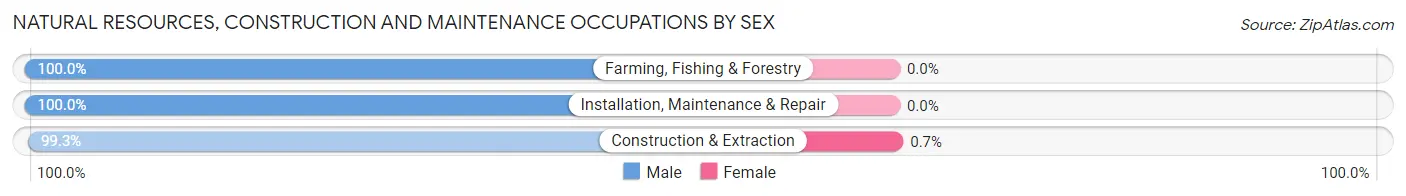
| Occupation | Male | Female |
| Farming, Fishing & Forestry | 4 (100.0%) | 0 (0.0%) |
| Construction & Extraction | 426 (99.3%) | 3 (0.7%) |
| Installation, Maintenance & Repair | 154 (100.0%) | 0 (0.0%) |
| Total (Category) | 584 (99.5%) | 3 (0.5%) |
| Total (Overall) | 3,468 (50.4%) | 3,409 (49.6%) |
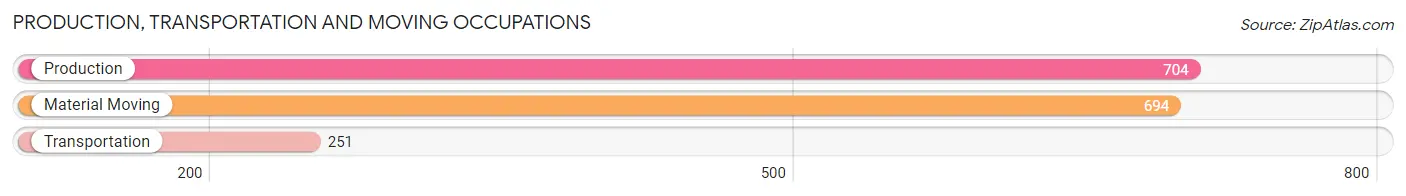
Production, Transportation and Moving Occupations
The most common Production, Transportation and Moving occupations in Shepherdsville are Production (704 | 10.2%), Material Moving (694 | 10.1%), and Transportation (251 | 3.6%).
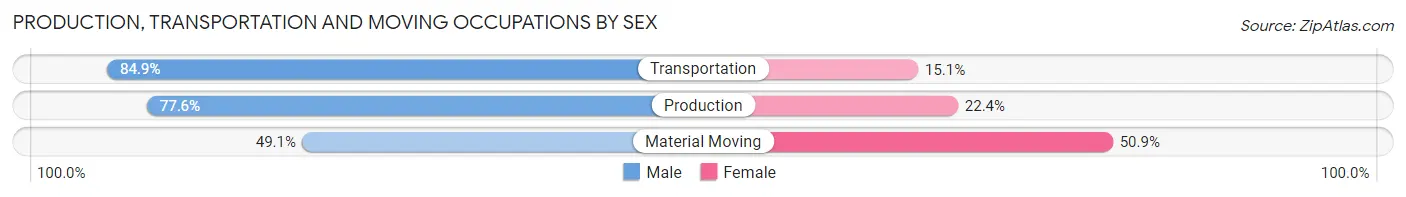
Production, Transportation and Moving Occupations by Sex
| Occupation | Male | Female |
| Production | 546 (77.6%) | 158 (22.4%) |
| Transportation | 213 (84.9%) | 38 (15.1%) |
| Material Moving | 341 (49.1%) | 353 (50.9%) |
| Total (Category) | 1,100 (66.7%) | 549 (33.3%) |
| Total (Overall) | 3,468 (50.4%) | 3,409 (49.6%) |
Employment Industries by Sex in Shepherdsville
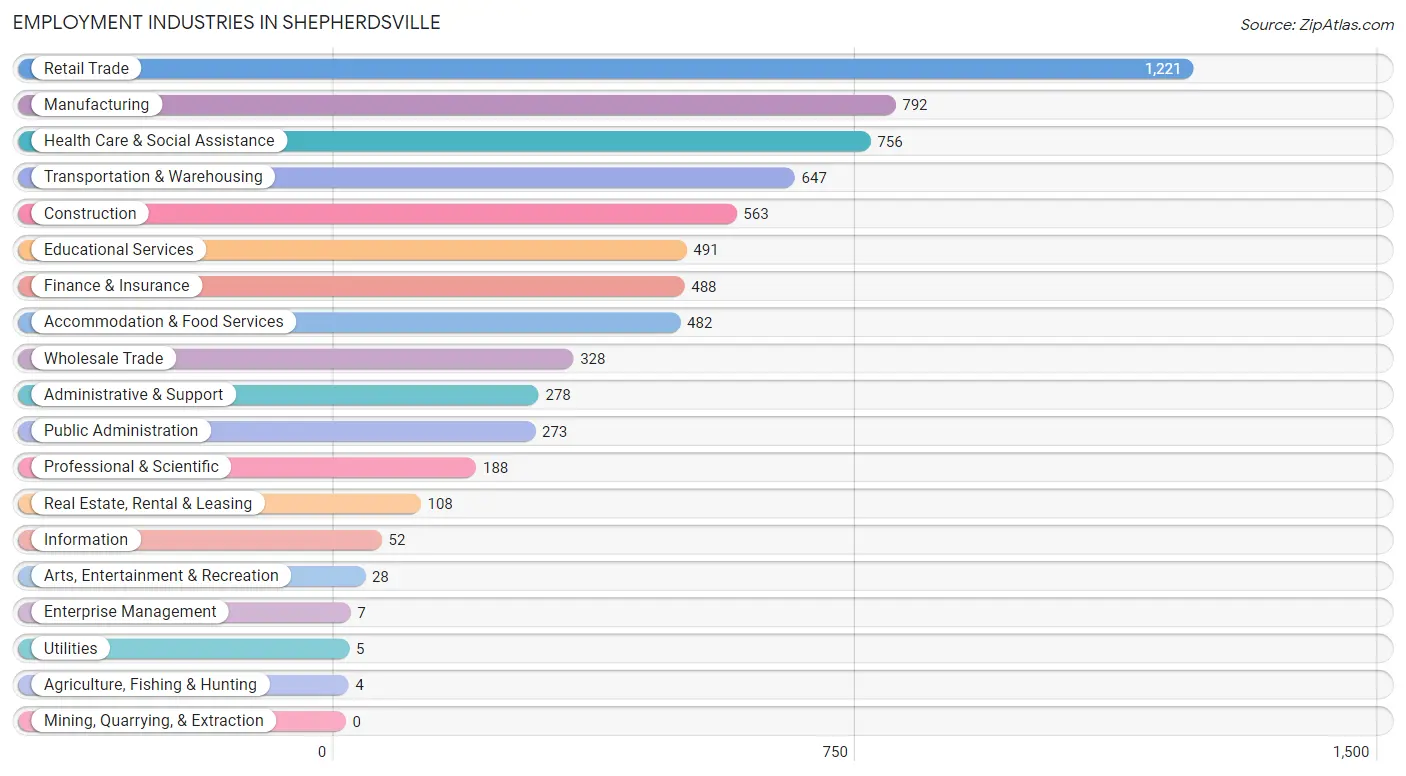
Employment Industries in Shepherdsville
The major employment industries in Shepherdsville include Retail Trade (1,221 | 17.7%), Manufacturing (792 | 11.5%), Health Care & Social Assistance (756 | 11.0%), Transportation & Warehousing (647 | 9.4%), and Construction (563 | 8.2%).
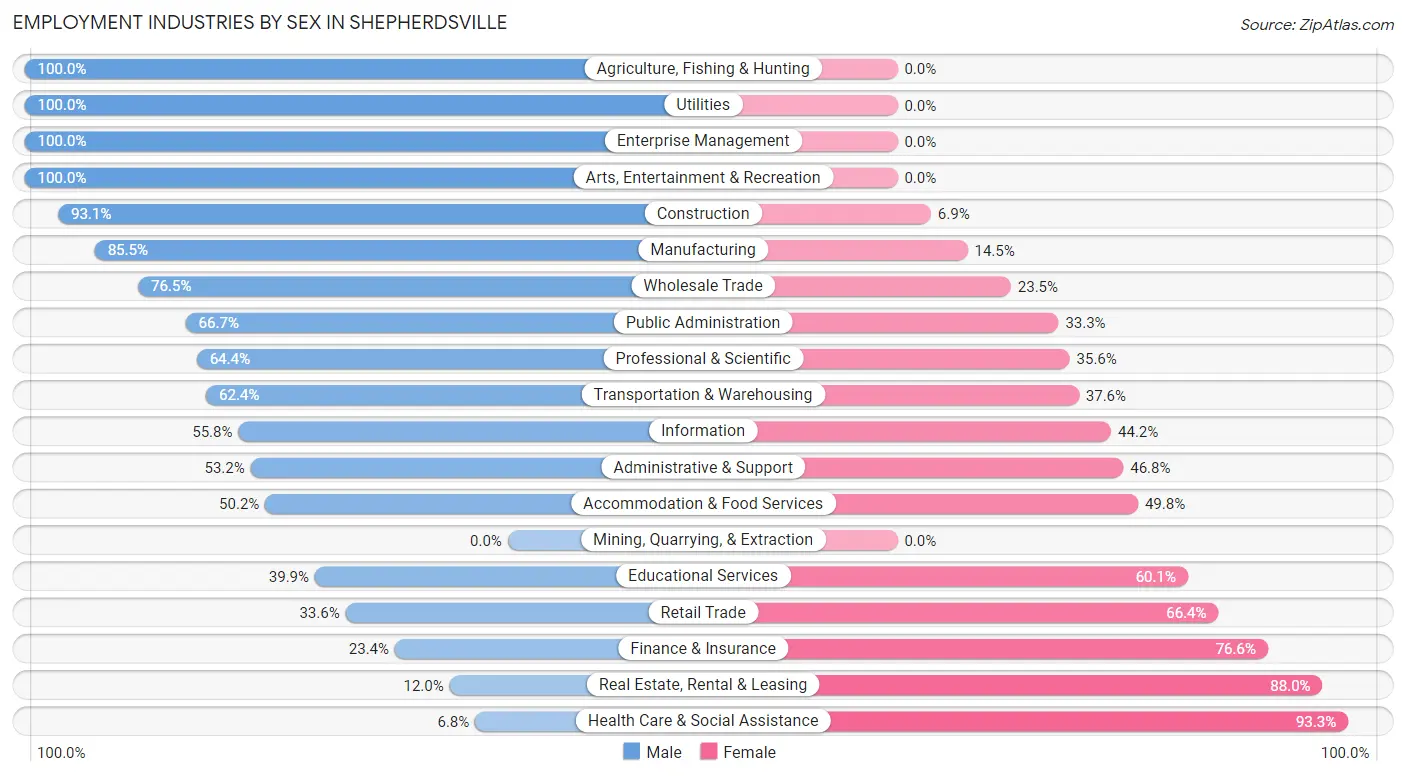
Employment Industries by Sex in Shepherdsville
The Shepherdsville industries that see more men than women are Agriculture, Fishing & Hunting (100.0%), Utilities (100.0%), and Enterprise Management (100.0%), whereas the industries that tend to have a higher number of women are Health Care & Social Assistance (93.2%), Real Estate, Rental & Leasing (88.0%), and Finance & Insurance (76.6%).
| Industry | Male | Female |
| Agriculture, Fishing & Hunting | 4 (100.0%) | 0 (0.0%) |
| Mining, Quarrying, & Extraction | 0 (0.0%) | 0 (0.0%) |
| Construction | 524 (93.1%) | 39 (6.9%) |
| Manufacturing | 677 (85.5%) | 115 (14.5%) |
| Wholesale Trade | 251 (76.5%) | 77 (23.5%) |
| Retail Trade | 410 (33.6%) | 811 (66.4%) |
| Transportation & Warehousing | 404 (62.4%) | 243 (37.6%) |
| Utilities | 5 (100.0%) | 0 (0.0%) |
| Information | 29 (55.8%) | 23 (44.2%) |
| Finance & Insurance | 114 (23.4%) | 374 (76.6%) |
| Real Estate, Rental & Leasing | 13 (12.0%) | 95 (88.0%) |
| Professional & Scientific | 121 (64.4%) | 67 (35.6%) |
| Enterprise Management | 7 (100.0%) | 0 (0.0%) |
| Administrative & Support | 148 (53.2%) | 130 (46.8%) |
| Educational Services | 196 (39.9%) | 295 (60.1%) |
| Health Care & Social Assistance | 51 (6.8%) | 705 (93.2%) |
| Arts, Entertainment & Recreation | 28 (100.0%) | 0 (0.0%) |
| Accommodation & Food Services | 242 (50.2%) | 240 (49.8%) |
| Public Administration | 182 (66.7%) | 91 (33.3%) |
| Total | 3,468 (50.4%) | 3,409 (49.6%) |
Education in Shepherdsville
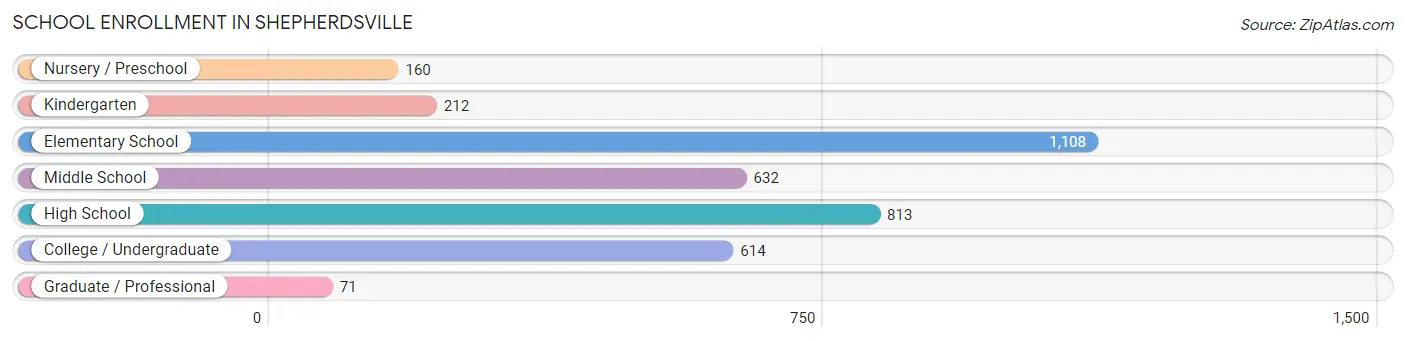
School Enrollment in Shepherdsville
The most common levels of schooling among the 3,610 students in Shepherdsville are elementary school (1,108 | 30.7%), high school (813 | 22.5%), and middle school (632 | 17.5%).
| School Level | # Students | % Students |
| Nursery / Preschool | 160 | 4.4% |
| Kindergarten | 212 | 5.9% |
| Elementary School | 1,108 | 30.7% |
| Middle School | 632 | 17.5% |
| High School | 813 | 22.5% |
| College / Undergraduate | 614 | 17.0% |
| Graduate / Professional | 71 | 2.0% |
| Total | 3,610 | 100.0% |
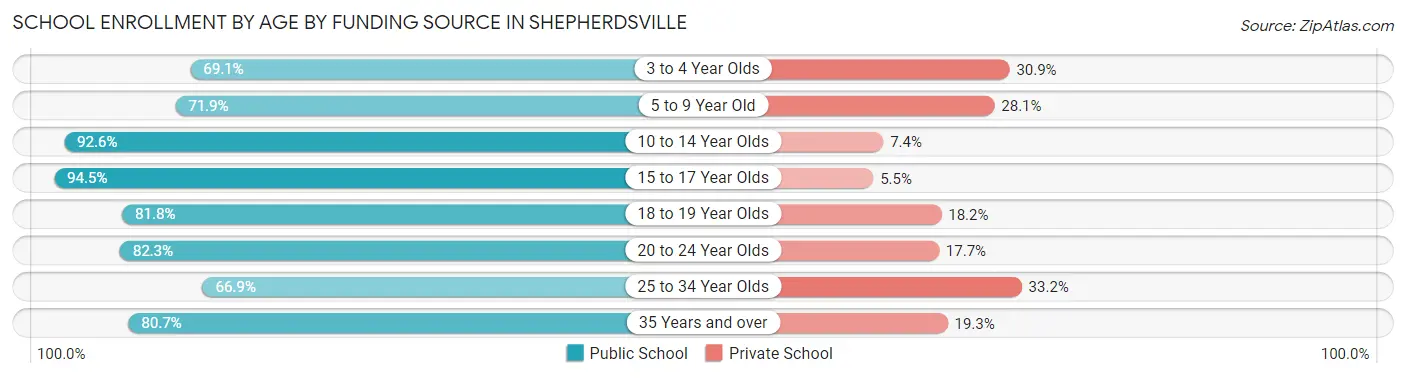
School Enrollment by Age by Funding Source in Shepherdsville
Out of a total of 3,610 students who are enrolled in schools in Shepherdsville, 661 (18.3%) attend a private institution, while the remaining 2,949 (81.7%) are enrolled in public schools. The age group of 25 to 34 year olds has the highest likelihood of being enrolled in private schools, with 60 (33.2% in the age bracket) enrolled. Conversely, the age group of 15 to 17 year olds has the lowest likelihood of being enrolled in a private school, with 498 (94.5% in the age bracket) attending a public institution.
| Age Bracket | Public School | Private School |
| 3 to 4 Year Olds | 94 (69.1%) | 42 (30.9%) |
| 5 to 9 Year Old | 897 (71.9%) | 350 (28.1%) |
| 10 to 14 Year Olds | 830 (92.6%) | 66 (7.4%) |
| 15 to 17 Year Olds | 498 (94.5%) | 29 (5.5%) |
| 18 to 19 Year Olds | 108 (81.8%) | 24 (18.2%) |
| 20 to 24 Year Olds | 255 (82.3%) | 55 (17.7%) |
| 25 to 34 Year Olds | 121 (66.8%) | 60 (33.2%) |
| 35 Years and over | 146 (80.7%) | 35 (19.3%) |
| Total | 2,949 (81.7%) | 661 (18.3%) |
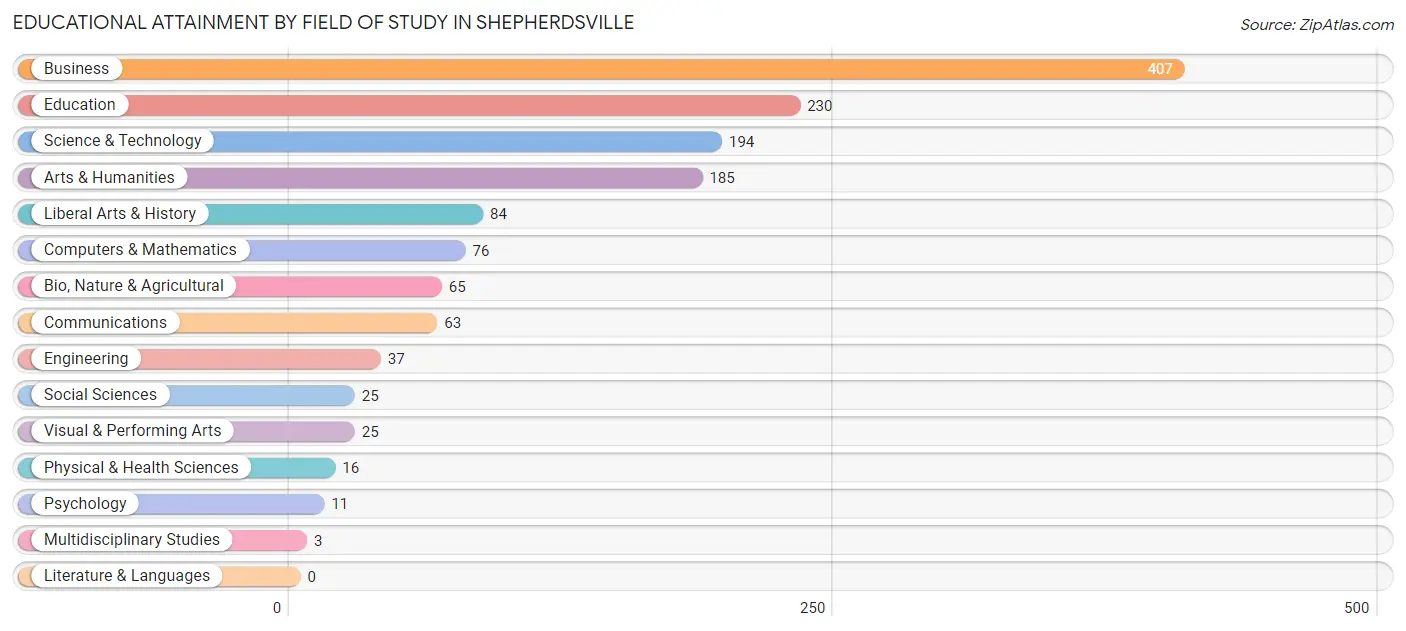
Educational Attainment by Field of Study in Shepherdsville
Business (407 | 28.6%), education (230 | 16.2%), science & technology (194 | 13.7%), arts & humanities (185 | 13.0%), and liberal arts & history (84 | 5.9%) are the most common fields of study among 1,421 individuals in Shepherdsville who have obtained a bachelor's degree or higher.
| Field of Study | # Graduates | % Graduates |
| Computers & Mathematics | 76 | 5.3% |
| Bio, Nature & Agricultural | 65 | 4.6% |
| Physical & Health Sciences | 16 | 1.1% |
| Psychology | 11 | 0.8% |
| Social Sciences | 25 | 1.8% |
| Engineering | 37 | 2.6% |
| Multidisciplinary Studies | 3 | 0.2% |
| Science & Technology | 194 | 13.7% |
| Business | 407 | 28.6% |
| Education | 230 | 16.2% |
| Literature & Languages | 0 | 0.0% |
| Liberal Arts & History | 84 | 5.9% |
| Visual & Performing Arts | 25 | 1.8% |
| Communications | 63 | 4.4% |
| Arts & Humanities | 185 | 13.0% |
| Total | 1,421 | 100.0% |
Transportation & Commute in Shepherdsville
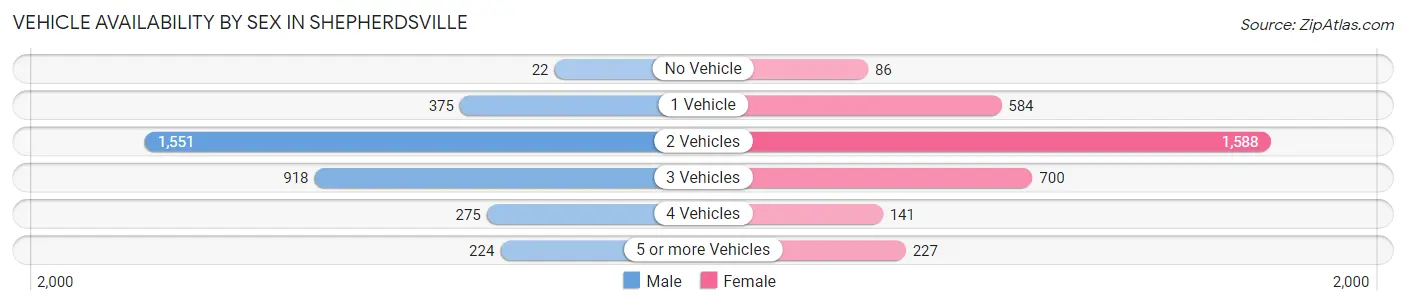
Vehicle Availability by Sex in Shepherdsville
The most prevalent vehicle ownership categories in Shepherdsville are males with 2 vehicles (1,551, accounting for 46.1%) and females with 2 vehicles (1,588, making up 46.6%).
| Vehicles Available | Male | Female |
| No Vehicle | 22 (0.6%) | 86 (2.6%) |
| 1 Vehicle | 375 (11.1%) | 584 (17.6%) |
| 2 Vehicles | 1,551 (46.1%) | 1,588 (47.7%) |
| 3 Vehicles | 918 (27.3%) | 700 (21.0%) |
| 4 Vehicles | 275 (8.2%) | 141 (4.2%) |
| 5 or more Vehicles | 224 (6.7%) | 227 (6.8%) |
| Total | 3,365 (100.0%) | 3,326 (100.0%) |
Commute Time in Shepherdsville
The most frequently occuring commute durations in Shepherdsville are 30 to 34 minutes (1,138 commuters, 18.4%), 5 to 9 minutes (986 commuters, 15.9%), and 10 to 14 minutes (867 commuters, 14.0%).
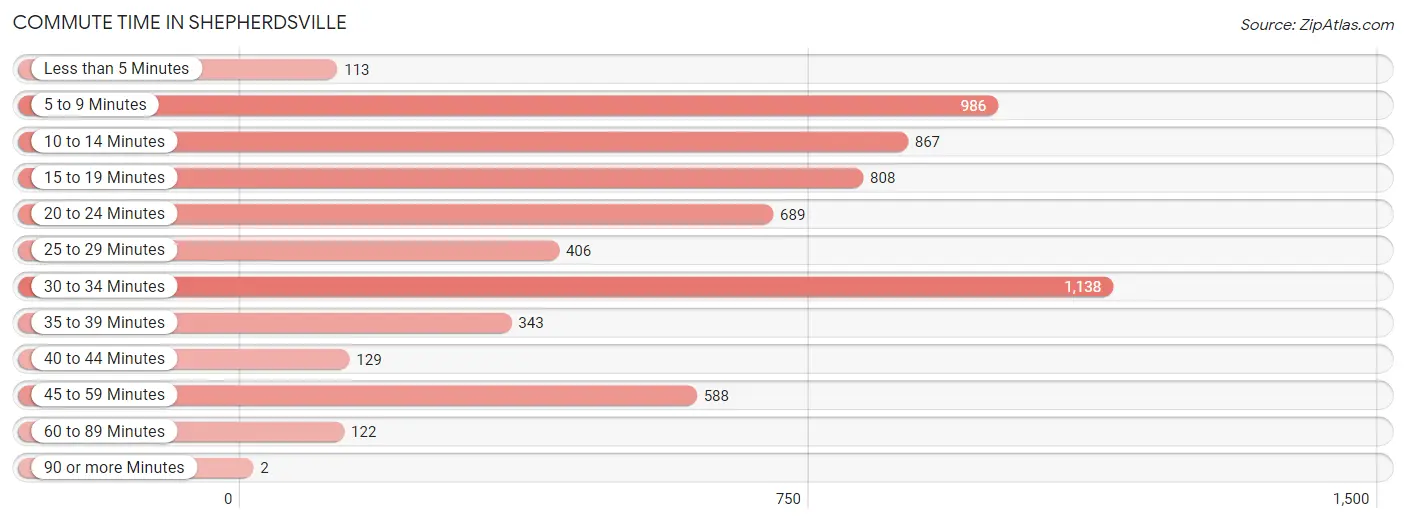
| Commute Time | # Commuters | % Commuters |
| Less than 5 Minutes | 113 | 1.8% |
| 5 to 9 Minutes | 986 | 15.9% |
| 10 to 14 Minutes | 867 | 14.0% |
| 15 to 19 Minutes | 808 | 13.1% |
| 20 to 24 Minutes | 689 | 11.1% |
| 25 to 29 Minutes | 406 | 6.6% |
| 30 to 34 Minutes | 1,138 | 18.4% |
| 35 to 39 Minutes | 343 | 5.5% |
| 40 to 44 Minutes | 129 | 2.1% |
| 45 to 59 Minutes | 588 | 9.5% |
| 60 to 89 Minutes | 122 | 2.0% |
| 90 or more Minutes | 2 | 0.0% |
Commute Time by Sex in Shepherdsville
The most common commute times in Shepherdsville are 30 to 34 minutes (699 commuters, 22.5%) for males and 5 to 9 minutes (595 commuters, 19.3%) for females.
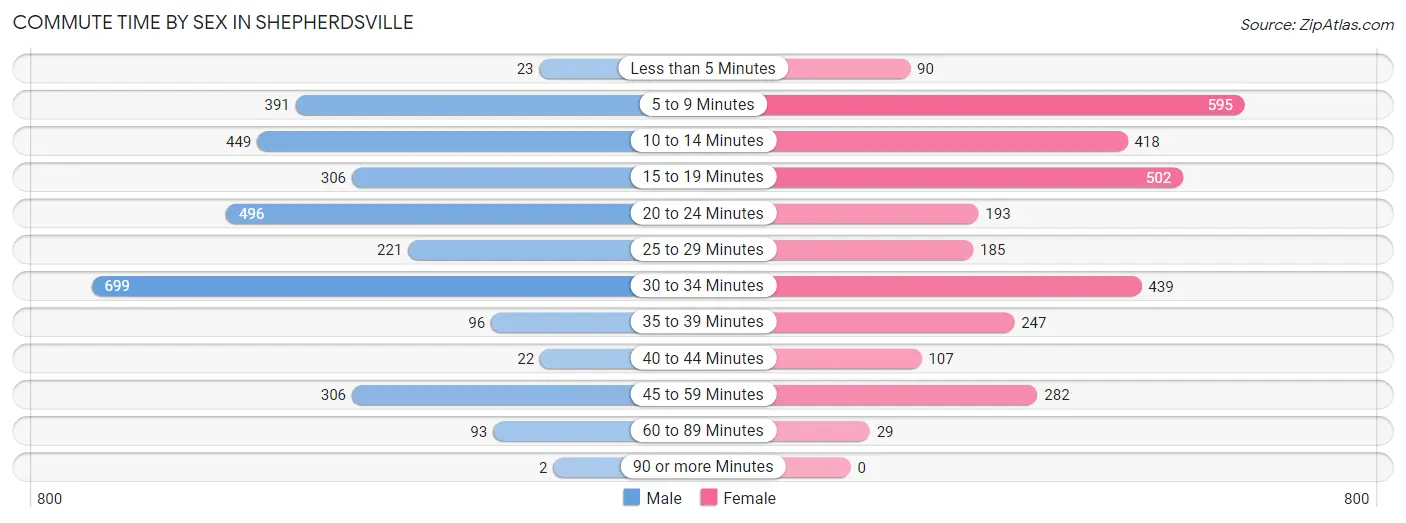
| Commute Time | Male | Female |
| Less than 5 Minutes | 23 (0.7%) | 90 (2.9%) |
| 5 to 9 Minutes | 391 (12.6%) | 595 (19.3%) |
| 10 to 14 Minutes | 449 (14.5%) | 418 (13.5%) |
| 15 to 19 Minutes | 306 (9.9%) | 502 (16.3%) |
| 20 to 24 Minutes | 496 (16.0%) | 193 (6.2%) |
| 25 to 29 Minutes | 221 (7.1%) | 185 (6.0%) |
| 30 to 34 Minutes | 699 (22.5%) | 439 (14.2%) |
| 35 to 39 Minutes | 96 (3.1%) | 247 (8.0%) |
| 40 to 44 Minutes | 22 (0.7%) | 107 (3.5%) |
| 45 to 59 Minutes | 306 (9.9%) | 282 (9.1%) |
| 60 to 89 Minutes | 93 (3.0%) | 29 (0.9%) |
| 90 or more Minutes | 2 (0.1%) | 0 (0.0%) |
Time of Departure to Work by Sex in Shepherdsville
The most frequent times of departure to work in Shepherdsville are 6:00 AM to 6:29 AM (543, 17.5%) for males and 7:30 AM to 7:59 AM (514, 16.7%) for females.
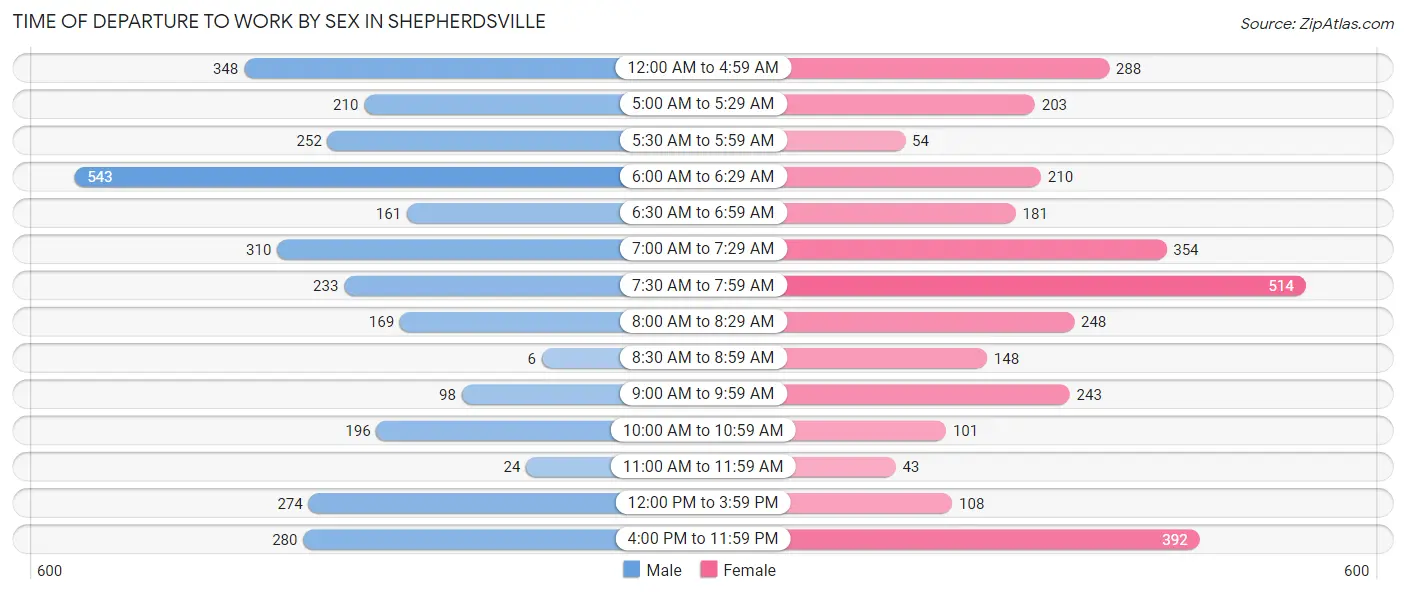
| Time of Departure | Male | Female |
| 12:00 AM to 4:59 AM | 348 (11.2%) | 288 (9.3%) |
| 5:00 AM to 5:29 AM | 210 (6.8%) | 203 (6.6%) |
| 5:30 AM to 5:59 AM | 252 (8.1%) | 54 (1.8%) |
| 6:00 AM to 6:29 AM | 543 (17.5%) | 210 (6.8%) |
| 6:30 AM to 6:59 AM | 161 (5.2%) | 181 (5.9%) |
| 7:00 AM to 7:29 AM | 310 (10.0%) | 354 (11.5%) |
| 7:30 AM to 7:59 AM | 233 (7.5%) | 514 (16.7%) |
| 8:00 AM to 8:29 AM | 169 (5.4%) | 248 (8.0%) |
| 8:30 AM to 8:59 AM | 6 (0.2%) | 148 (4.8%) |
| 9:00 AM to 9:59 AM | 98 (3.2%) | 243 (7.9%) |
| 10:00 AM to 10:59 AM | 196 (6.3%) | 101 (3.3%) |
| 11:00 AM to 11:59 AM | 24 (0.8%) | 43 (1.4%) |
| 12:00 PM to 3:59 PM | 274 (8.8%) | 108 (3.5%) |
| 4:00 PM to 11:59 PM | 280 (9.0%) | 392 (12.7%) |
| Total | 3,104 (100.0%) | 3,087 (100.0%) |
Housing Occupancy in Shepherdsville
Occupancy by Ownership in Shepherdsville
Of the total 5,128 dwellings in Shepherdsville, owner-occupied units account for 3,653 (71.2%), while renter-occupied units make up 1,475 (28.8%).
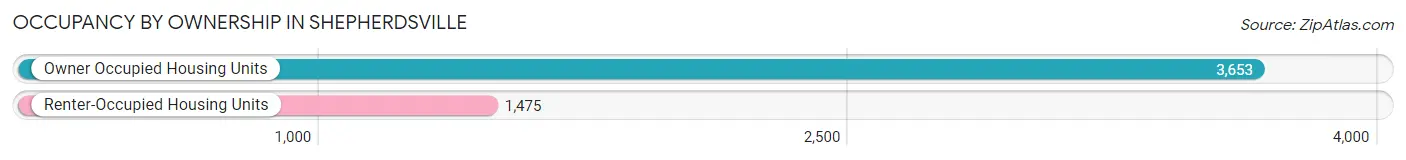
| Occupancy | # Housing Units | % Housing Units |
| Owner Occupied Housing Units | 3,653 | 71.2% |
| Renter-Occupied Housing Units | 1,475 | 28.8% |
| Total Occupied Housing Units | 5,128 | 100.0% |
Occupancy by Household Size in Shepherdsville
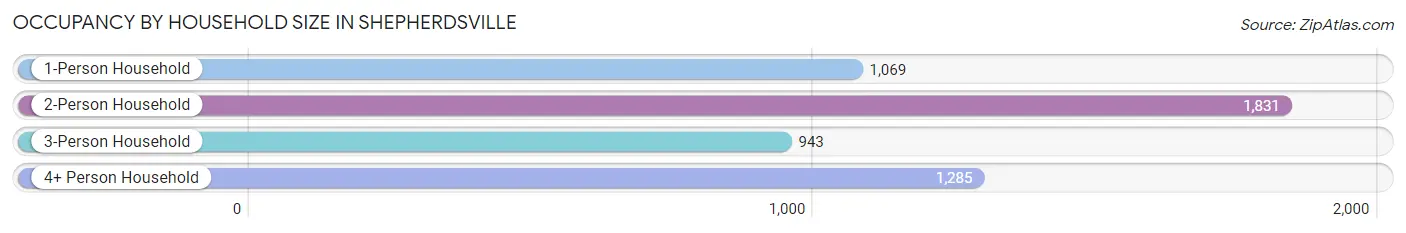
| Household Size | # Housing Units | % Housing Units |
| 1-Person Household | 1,069 | 20.8% |
| 2-Person Household | 1,831 | 35.7% |
| 3-Person Household | 943 | 18.4% |
| 4+ Person Household | 1,285 | 25.1% |
| Total Housing Units | 5,128 | 100.0% |
Occupancy by Ownership by Household Size in Shepherdsville
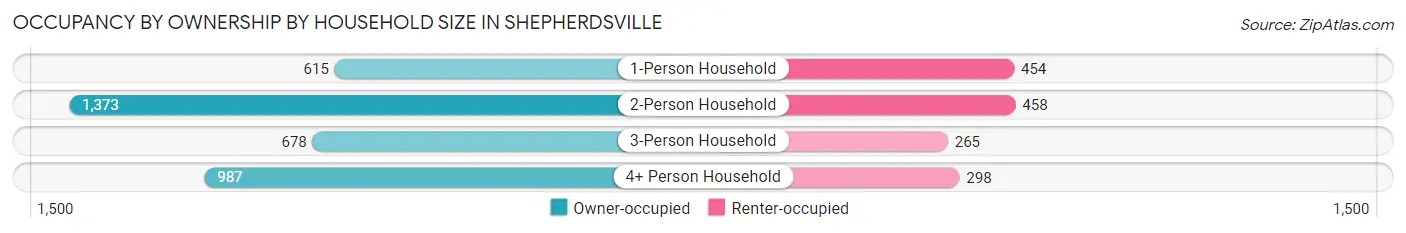
| Household Size | Owner-occupied | Renter-occupied |
| 1-Person Household | 615 (57.5%) | 454 (42.5%) |
| 2-Person Household | 1,373 (75.0%) | 458 (25.0%) |
| 3-Person Household | 678 (71.9%) | 265 (28.1%) |
| 4+ Person Household | 987 (76.8%) | 298 (23.2%) |
| Total Housing Units | 3,653 (71.2%) | 1,475 (28.8%) |
Occupancy by Educational Attainment in Shepherdsville
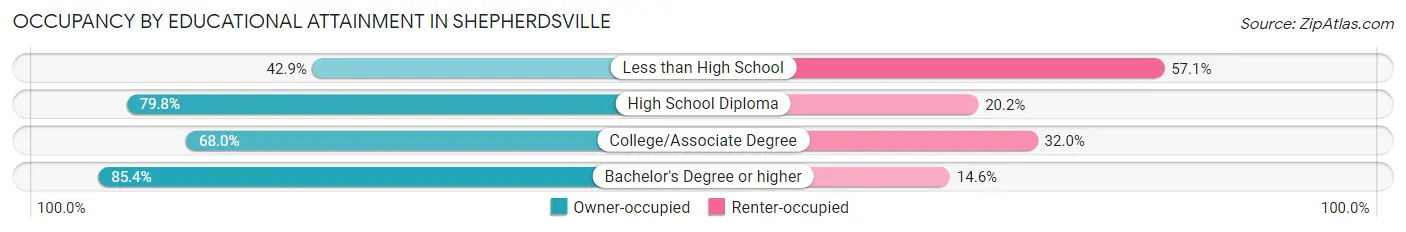
| Household Size | Owner-occupied | Renter-occupied |
| Less than High School | 371 (42.9%) | 494 (57.1%) |
| High School Diploma | 1,632 (79.8%) | 414 (20.2%) |
| College/Associate Degree | 949 (68.0%) | 447 (32.0%) |
| Bachelor's Degree or higher | 701 (85.4%) | 120 (14.6%) |
Occupancy by Age of Householder in Shepherdsville
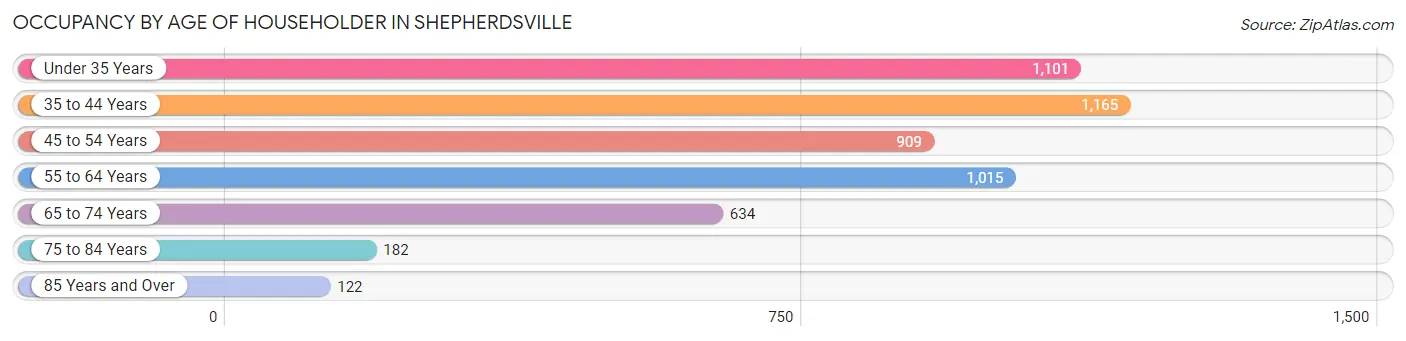
| Age Bracket | # Households | % Households |
| Under 35 Years | 1,101 | 21.5% |
| 35 to 44 Years | 1,165 | 22.7% |
| 45 to 54 Years | 909 | 17.7% |
| 55 to 64 Years | 1,015 | 19.8% |
| 65 to 74 Years | 634 | 12.4% |
| 75 to 84 Years | 182 | 3.5% |
| 85 Years and Over | 122 | 2.4% |
| Total | 5,128 | 100.0% |
Housing Finances in Shepherdsville
Median Income by Occupancy in Shepherdsville
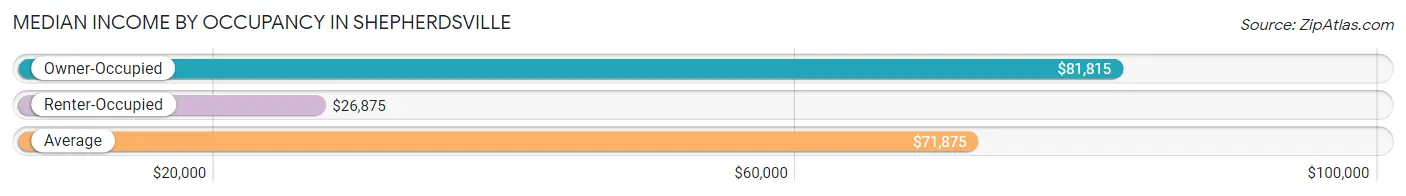
| Occupancy Type | # Households | Median Income |
| Owner-Occupied | 3,653 (71.2%) | $81,815 |
| Renter-Occupied | 1,475 (28.8%) | $26,875 |
| Average | 5,128 (100.0%) | $71,875 |
Occupancy by Householder Income Bracket in Shepherdsville
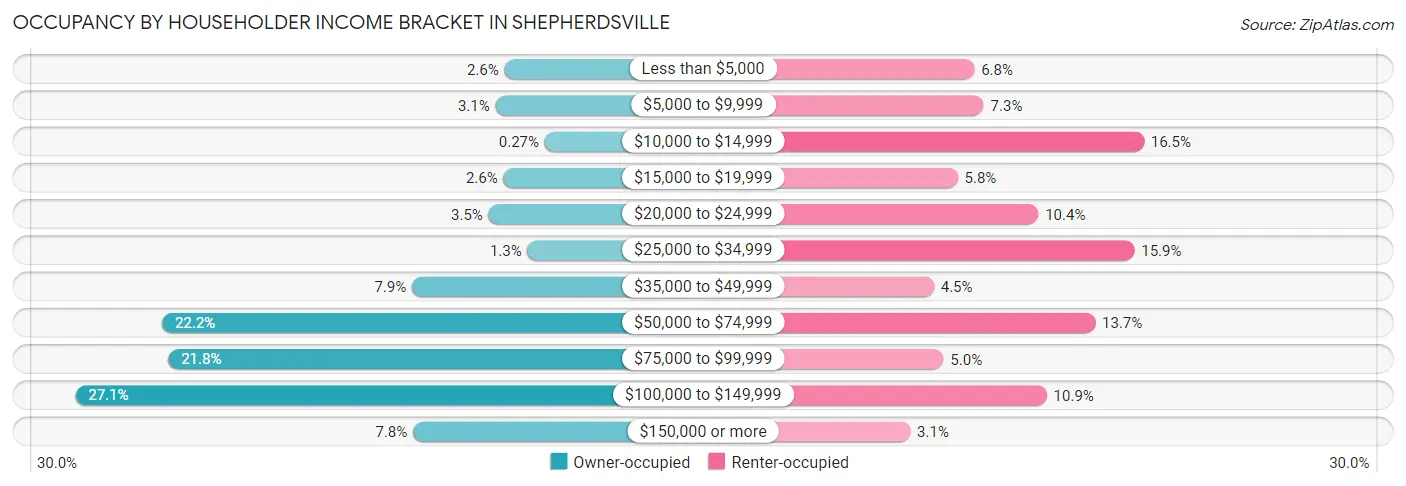
| Income Bracket | Owner-occupied | Renter-occupied |
| Less than $5,000 | 94 (2.6%) | 100 (6.8%) |
| $5,000 to $9,999 | 113 (3.1%) | 108 (7.3%) |
| $10,000 to $14,999 | 10 (0.3%) | 243 (16.5%) |
| $15,000 to $19,999 | 96 (2.6%) | 86 (5.8%) |
| $20,000 to $24,999 | 127 (3.5%) | 154 (10.4%) |
| $25,000 to $34,999 | 46 (1.3%) | 235 (15.9%) |
| $35,000 to $49,999 | 287 (7.9%) | 66 (4.5%) |
| $50,000 to $74,999 | 809 (22.2%) | 202 (13.7%) |
| $75,000 to $99,999 | 796 (21.8%) | 74 (5.0%) |
| $100,000 to $149,999 | 990 (27.1%) | 161 (10.9%) |
| $150,000 or more | 285 (7.8%) | 46 (3.1%) |
| Total | 3,653 (100.0%) | 1,475 (100.0%) |
Monthly Housing Cost Tiers in Shepherdsville
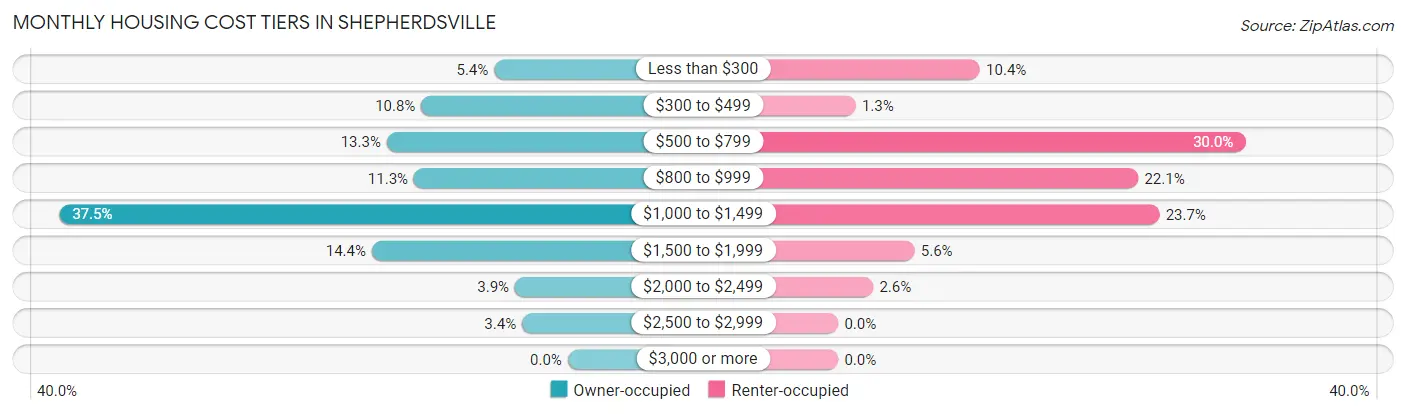
| Monthly Cost | Owner-occupied | Renter-occupied |
| Less than $300 | 198 (5.4%) | 154 (10.4%) |
| $300 to $499 | 394 (10.8%) | 19 (1.3%) |
| $500 to $799 | 487 (13.3%) | 443 (30.0%) |
| $800 to $999 | 414 (11.3%) | 326 (22.1%) |
| $1,000 to $1,499 | 1,368 (37.4%) | 349 (23.7%) |
| $1,500 to $1,999 | 527 (14.4%) | 83 (5.6%) |
| $2,000 to $2,499 | 142 (3.9%) | 38 (2.6%) |
| $2,500 to $2,999 | 123 (3.4%) | 0 (0.0%) |
| $3,000 or more | 0 (0.0%) | 0 (0.0%) |
| Total | 3,653 (100.0%) | 1,475 (100.0%) |
Physical Housing Characteristics in Shepherdsville
Housing Structures in Shepherdsville
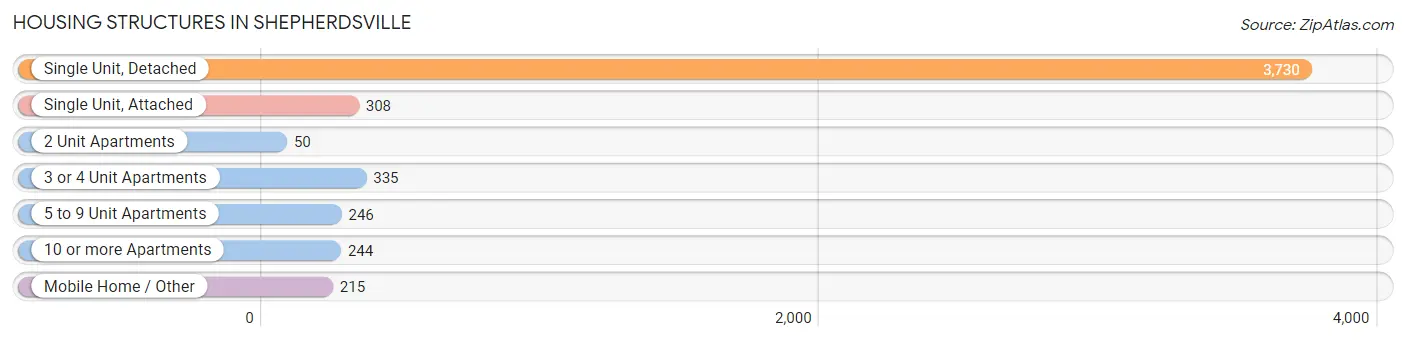
| Structure Type | # Housing Units | % Housing Units |
| Single Unit, Detached | 3,730 | 72.7% |
| Single Unit, Attached | 308 | 6.0% |
| 2 Unit Apartments | 50 | 1.0% |
| 3 or 4 Unit Apartments | 335 | 6.5% |
| 5 to 9 Unit Apartments | 246 | 4.8% |
| 10 or more Apartments | 244 | 4.8% |
| Mobile Home / Other | 215 | 4.2% |
| Total | 5,128 | 100.0% |
Housing Structures by Occupancy in Shepherdsville
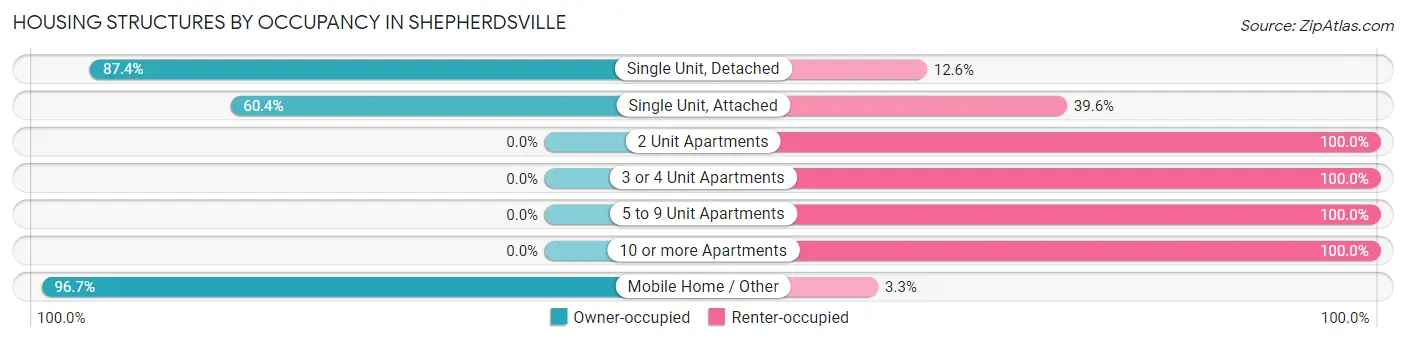
| Structure Type | Owner-occupied | Renter-occupied |
| Single Unit, Detached | 3,259 (87.4%) | 471 (12.6%) |
| Single Unit, Attached | 186 (60.4%) | 122 (39.6%) |
| 2 Unit Apartments | 0 (0.0%) | 50 (100.0%) |
| 3 or 4 Unit Apartments | 0 (0.0%) | 335 (100.0%) |
| 5 to 9 Unit Apartments | 0 (0.0%) | 246 (100.0%) |
| 10 or more Apartments | 0 (0.0%) | 244 (100.0%) |
| Mobile Home / Other | 208 (96.7%) | 7 (3.3%) |
| Total | 3,653 (71.2%) | 1,475 (28.8%) |
Housing Structures by Number of Rooms in Shepherdsville
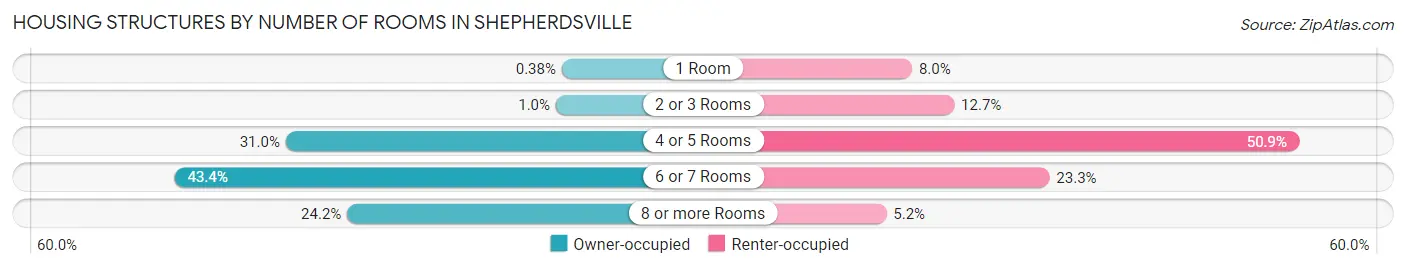
| Number of Rooms | Owner-occupied | Renter-occupied |
| 1 Room | 14 (0.4%) | 118 (8.0%) |
| 2 or 3 Rooms | 38 (1.0%) | 187 (12.7%) |
| 4 or 5 Rooms | 1,133 (31.0%) | 751 (50.9%) |
| 6 or 7 Rooms | 1,584 (43.4%) | 343 (23.3%) |
| 8 or more Rooms | 884 (24.2%) | 76 (5.1%) |
| Total | 3,653 (100.0%) | 1,475 (100.0%) |
Housing Structure by Heating Type in Shepherdsville
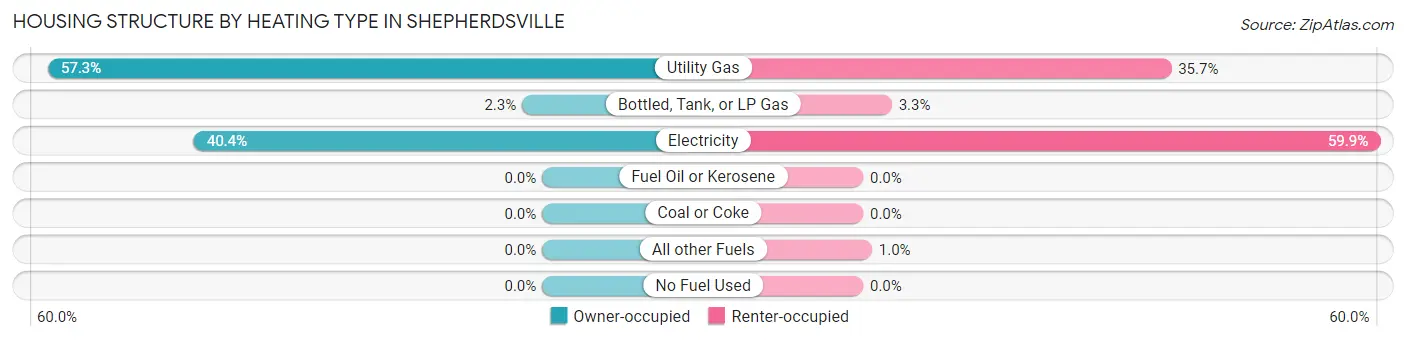
| Heating Type | Owner-occupied | Renter-occupied |
| Utility Gas | 2,093 (57.3%) | 527 (35.7%) |
| Bottled, Tank, or LP Gas | 85 (2.3%) | 49 (3.3%) |
| Electricity | 1,475 (40.4%) | 884 (59.9%) |
| Fuel Oil or Kerosene | 0 (0.0%) | 0 (0.0%) |
| Coal or Coke | 0 (0.0%) | 0 (0.0%) |
| All other Fuels | 0 (0.0%) | 15 (1.0%) |
| No Fuel Used | 0 (0.0%) | 0 (0.0%) |
| Total | 3,653 (100.0%) | 1,475 (100.0%) |
Household Vehicle Usage in Shepherdsville
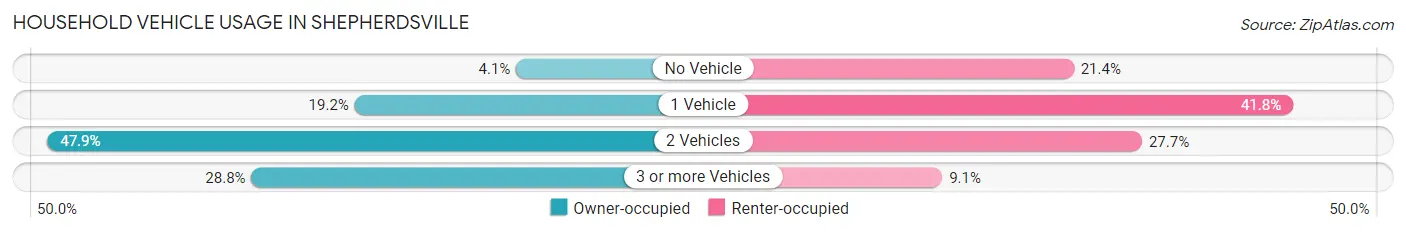
| Vehicles per Household | Owner-occupied | Renter-occupied |
| No Vehicle | 150 (4.1%) | 315 (21.4%) |
| 1 Vehicle | 701 (19.2%) | 617 (41.8%) |
| 2 Vehicles | 1,749 (47.9%) | 409 (27.7%) |
| 3 or more Vehicles | 1,053 (28.8%) | 134 (9.1%) |
| Total | 3,653 (100.0%) | 1,475 (100.0%) |
Real Estate & Mortgages in Shepherdsville
Real Estate and Mortgage Overview in Shepherdsville
| Characteristic | Without Mortgage | With Mortgage |
| Housing Units | 1,056 | 2,597 |
| Median Property Value | $192,100 | $188,900 |
| Median Household Income | $61,618 | $237 |
| Monthly Housing Costs | $439 | $0 |
| Real Estate Taxes | $1,376 | $60 |
Property Value by Mortgage Status in Shepherdsville
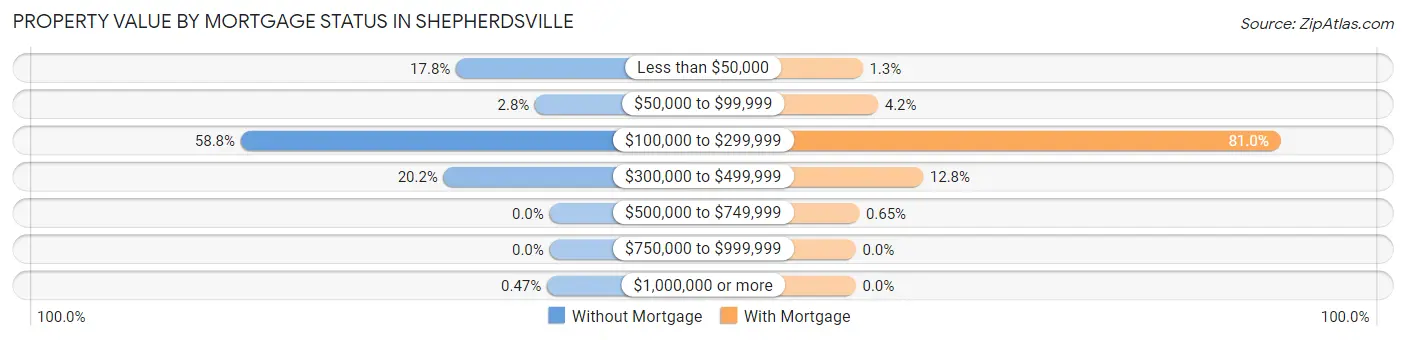
| Property Value | Without Mortgage | With Mortgage |
| Less than $50,000 | 188 (17.8%) | 34 (1.3%) |
| $50,000 to $99,999 | 29 (2.8%) | 110 (4.2%) |
| $100,000 to $299,999 | 621 (58.8%) | 2,103 (81.0%) |
| $300,000 to $499,999 | 213 (20.2%) | 333 (12.8%) |
| $500,000 to $749,999 | 0 (0.0%) | 17 (0.6%) |
| $750,000 to $999,999 | 0 (0.0%) | 0 (0.0%) |
| $1,000,000 or more | 5 (0.5%) | 0 (0.0%) |
| Total | 1,056 (100.0%) | 2,597 (100.0%) |
Household Income by Mortgage Status in Shepherdsville
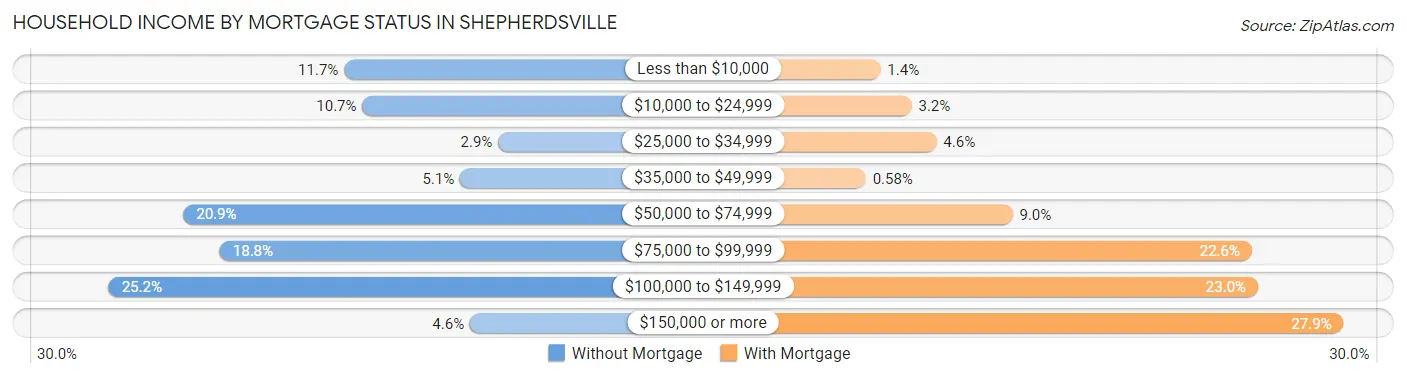
| Household Income | Without Mortgage | With Mortgage |
| Less than $10,000 | 124 (11.7%) | 37 (1.4%) |
| $10,000 to $24,999 | 113 (10.7%) | 83 (3.2%) |
| $25,000 to $34,999 | 31 (2.9%) | 120 (4.6%) |
| $35,000 to $49,999 | 54 (5.1%) | 15 (0.6%) |
| $50,000 to $74,999 | 221 (20.9%) | 233 (9.0%) |
| $75,000 to $99,999 | 199 (18.8%) | 588 (22.6%) |
| $100,000 to $149,999 | 266 (25.2%) | 597 (23.0%) |
| $150,000 or more | 48 (4.5%) | 724 (27.9%) |
| Total | 1,056 (100.0%) | 2,597 (100.0%) |
Property Value to Household Income Ratio in Shepherdsville
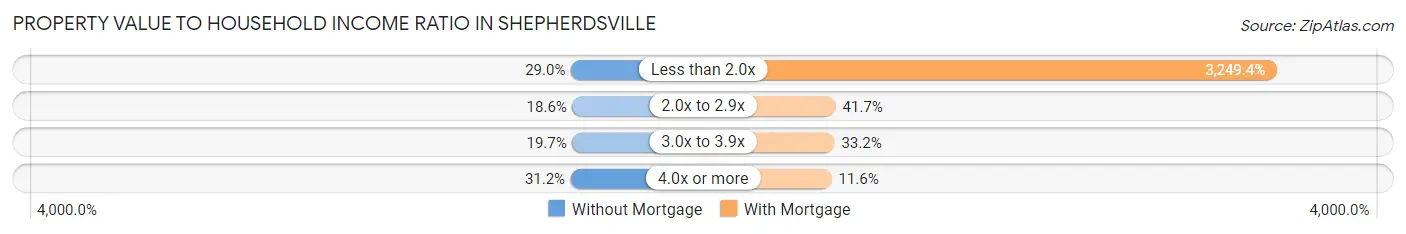
| Value-to-Income Ratio | Without Mortgage | With Mortgage |
| Less than 2.0x | 306 (29.0%) | 84,387 (3,249.4%) |
| 2.0x to 2.9x | 196 (18.6%) | 1,084 (41.7%) |
| 3.0x to 3.9x | 208 (19.7%) | 863 (33.2%) |
| 4.0x or more | 329 (31.2%) | 302 (11.6%) |
| Total | 1,056 (100.0%) | 2,597 (100.0%) |
Real Estate Taxes by Mortgage Status in Shepherdsville
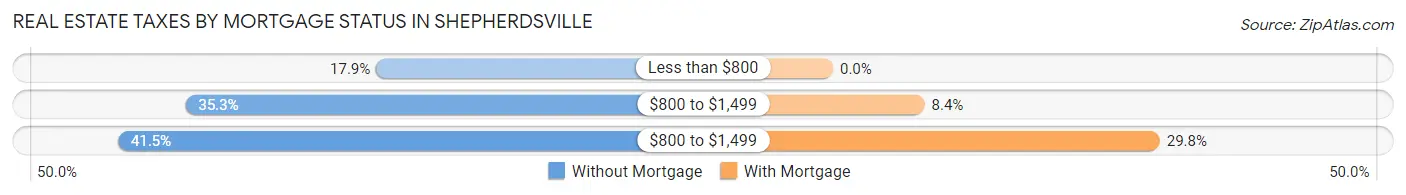
| Property Taxes | Without Mortgage | With Mortgage |
| Less than $800 | 189 (17.9%) | 0 (0.0%) |
| $800 to $1,499 | 373 (35.3%) | 217 (8.4%) |
| $800 to $1,499 | 438 (41.5%) | 775 (29.8%) |
| Total | 1,056 (100.0%) | 2,597 (100.0%) |
Health & Disability in Shepherdsville
Health Insurance Coverage by Age in Shepherdsville
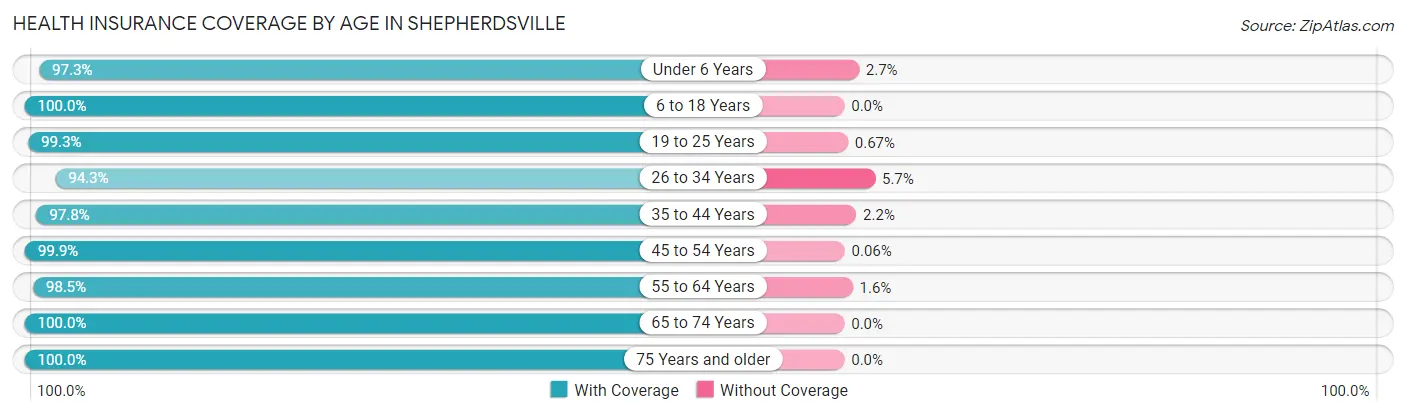
| Age Bracket | With Coverage | Without Coverage |
| Under 6 Years | 1,215 (97.3%) | 34 (2.7%) |
| 6 to 18 Years | 2,816 (100.0%) | 0 (0.0%) |
| 19 to 25 Years | 1,179 (99.3%) | 8 (0.7%) |
| 26 to 34 Years | 1,531 (94.3%) | 93 (5.7%) |
| 35 to 44 Years | 2,032 (97.8%) | 46 (2.2%) |
| 45 to 54 Years | 1,773 (99.9%) | 1 (0.1%) |
| 55 to 64 Years | 1,710 (98.5%) | 27 (1.5%) |
| 65 to 74 Years | 1,004 (100.0%) | 0 (0.0%) |
| 75 Years and older | 436 (100.0%) | 0 (0.0%) |
| Total | 13,696 (98.5%) | 209 (1.5%) |
Health Insurance Coverage by Citizenship Status in Shepherdsville
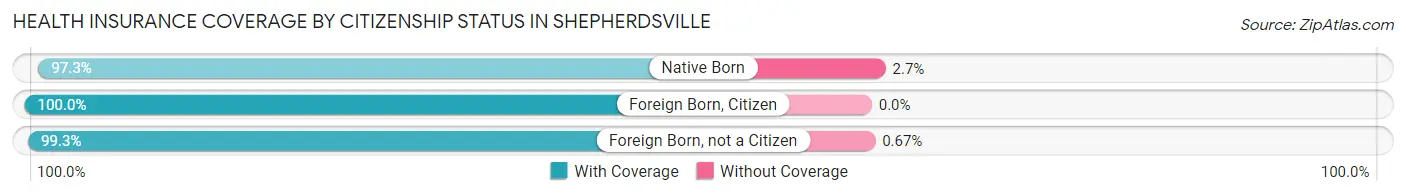
| Citizenship Status | With Coverage | Without Coverage |
| Native Born | 1,215 (97.3%) | 34 (2.7%) |
| Foreign Born, Citizen | 2,816 (100.0%) | 0 (0.0%) |
| Foreign Born, not a Citizen | 1,179 (99.3%) | 8 (0.7%) |
Health Insurance Coverage by Household Income in Shepherdsville
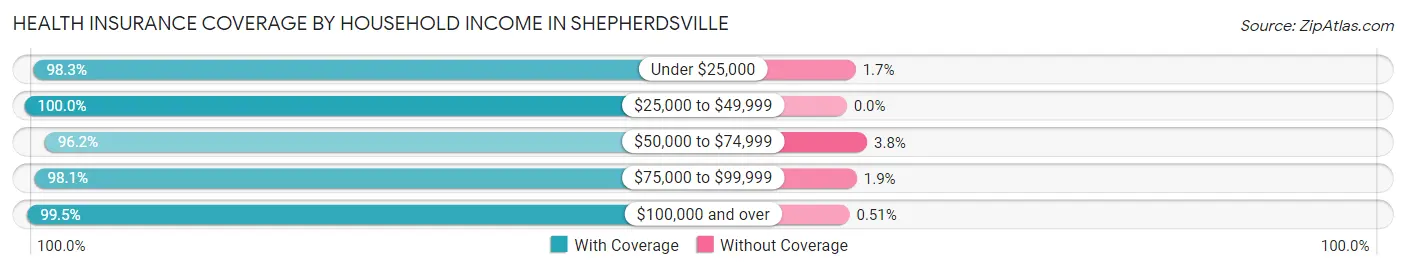
| Household Income | With Coverage | Without Coverage |
| Under $25,000 | 2,121 (98.3%) | 36 (1.7%) |
| $25,000 to $49,999 | 1,922 (100.0%) | 0 (0.0%) |
| $50,000 to $74,999 | 2,504 (96.2%) | 99 (3.8%) |
| $75,000 to $99,999 | 2,649 (98.1%) | 51 (1.9%) |
| $100,000 and over | 4,500 (99.5%) | 23 (0.5%) |
Public vs Private Health Insurance Coverage by Age in Shepherdsville
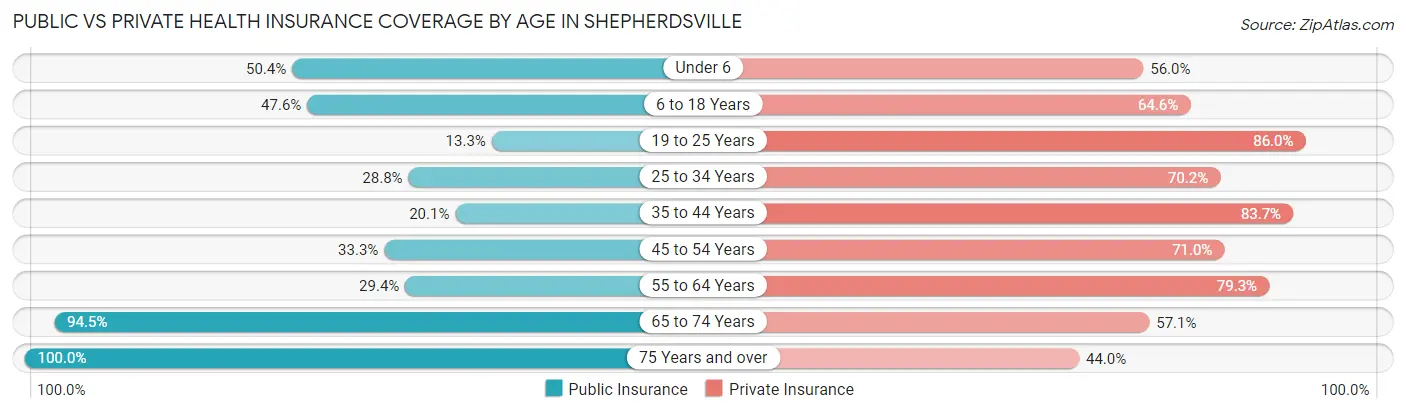
| Age Bracket | Public Insurance | Private Insurance |
| Under 6 | 629 (50.4%) | 699 (56.0%) |
| 6 to 18 Years | 1,339 (47.5%) | 1,820 (64.6%) |
| 19 to 25 Years | 158 (13.3%) | 1,021 (86.0%) |
| 25 to 34 Years | 467 (28.8%) | 1,140 (70.2%) |
| 35 to 44 Years | 417 (20.1%) | 1,740 (83.7%) |
| 45 to 54 Years | 590 (33.3%) | 1,259 (71.0%) |
| 55 to 64 Years | 510 (29.4%) | 1,377 (79.3%) |
| 65 to 74 Years | 949 (94.5%) | 573 (57.1%) |
| 75 Years and over | 436 (100.0%) | 192 (44.0%) |
| Total | 5,495 (39.5%) | 9,821 (70.6%) |
Disability Status by Sex by Age in Shepherdsville
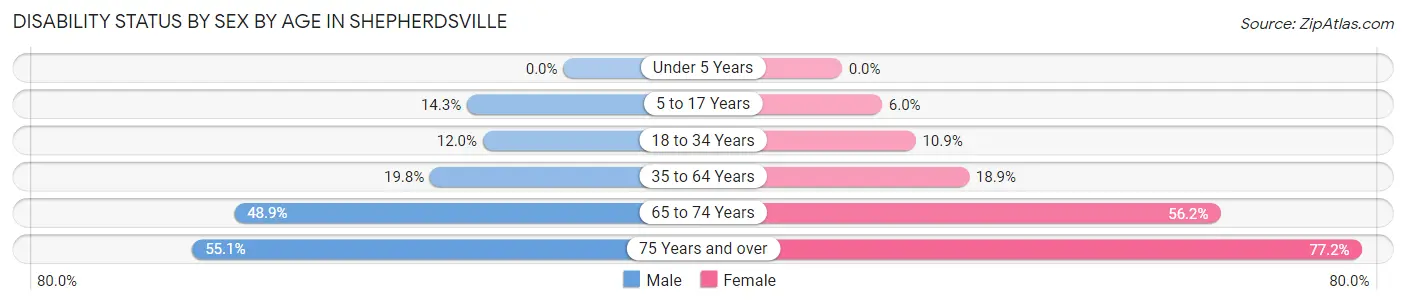
| Age Bracket | Male | Female |
| Under 5 Years | 0 (0.0%) | 0 (0.0%) |
| 5 to 17 Years | 186 (14.3%) | 87 (5.9%) |
| 18 to 34 Years | 183 (11.9%) | 155 (10.9%) |
| 35 to 64 Years | 499 (19.8%) | 579 (18.9%) |
| 65 to 74 Years | 195 (48.9%) | 340 (56.2%) |
| 75 Years and over | 81 (55.1%) | 223 (77.2%) |
Disability Class by Sex by Age in Shepherdsville
Disability Class: Hearing Difficulty
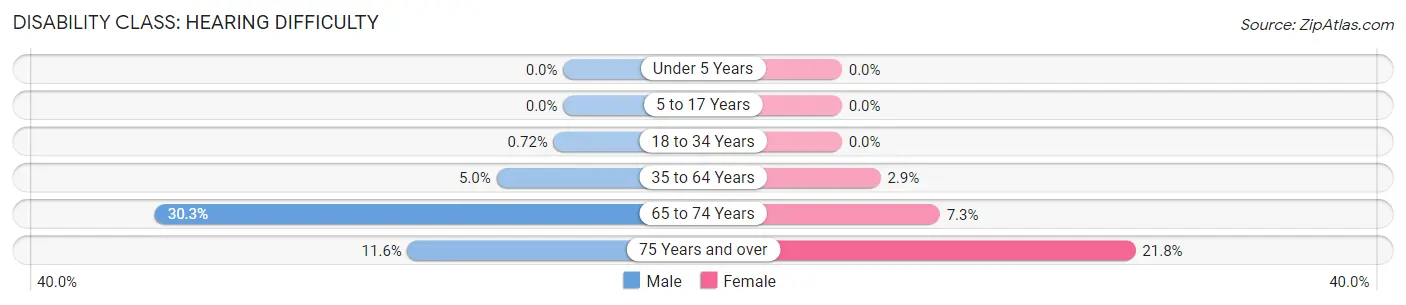
| Age Bracket | Male | Female |
| Under 5 Years | 0 (0.0%) | 0 (0.0%) |
| 5 to 17 Years | 0 (0.0%) | 0 (0.0%) |
| 18 to 34 Years | 11 (0.7%) | 0 (0.0%) |
| 35 to 64 Years | 125 (5.0%) | 88 (2.9%) |
| 65 to 74 Years | 121 (30.3%) | 44 (7.3%) |
| 75 Years and over | 17 (11.6%) | 63 (21.8%) |
Disability Class: Vision Difficulty
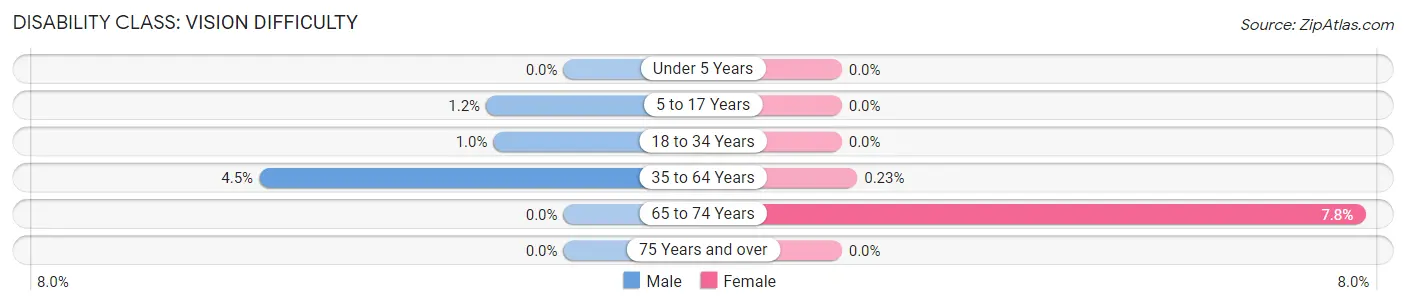
| Age Bracket | Male | Female |
| Under 5 Years | 0 (0.0%) | 0 (0.0%) |
| 5 to 17 Years | 15 (1.1%) | 0 (0.0%) |
| 18 to 34 Years | 16 (1.0%) | 0 (0.0%) |
| 35 to 64 Years | 114 (4.5%) | 7 (0.2%) |
| 65 to 74 Years | 0 (0.0%) | 47 (7.8%) |
| 75 Years and over | 0 (0.0%) | 0 (0.0%) |
Disability Class: Cognitive Difficulty
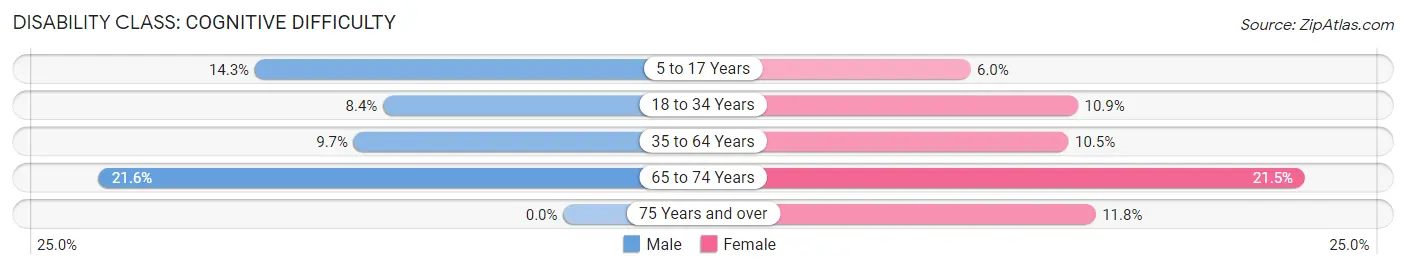
| Age Bracket | Male | Female |
| 5 to 17 Years | 186 (14.3%) | 87 (5.9%) |
| 18 to 34 Years | 128 (8.4%) | 155 (10.9%) |
| 35 to 64 Years | 245 (9.7%) | 322 (10.5%) |
| 65 to 74 Years | 86 (21.5%) | 130 (21.5%) |
| 75 Years and over | 0 (0.0%) | 34 (11.8%) |
Disability Class: Ambulatory Difficulty
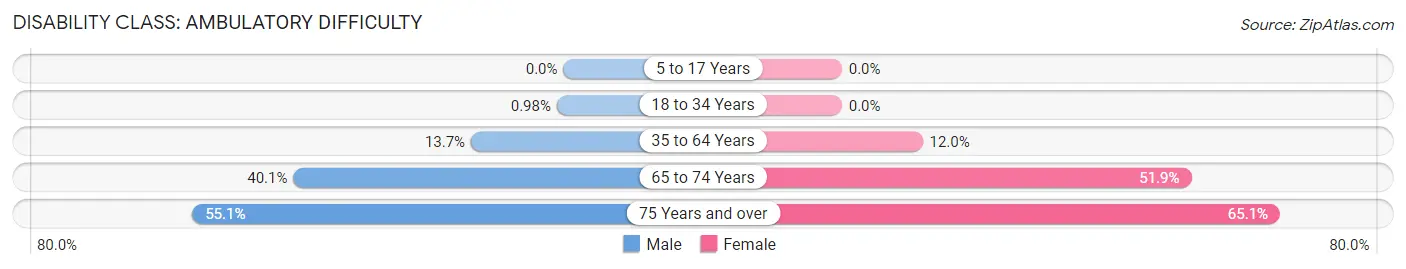
| Age Bracket | Male | Female |
| 5 to 17 Years | 0 (0.0%) | 0 (0.0%) |
| 18 to 34 Years | 15 (1.0%) | 0 (0.0%) |
| 35 to 64 Years | 346 (13.7%) | 368 (12.0%) |
| 65 to 74 Years | 160 (40.1%) | 314 (51.9%) |
| 75 Years and over | 81 (55.1%) | 188 (65.0%) |
Disability Class: Self-Care Difficulty
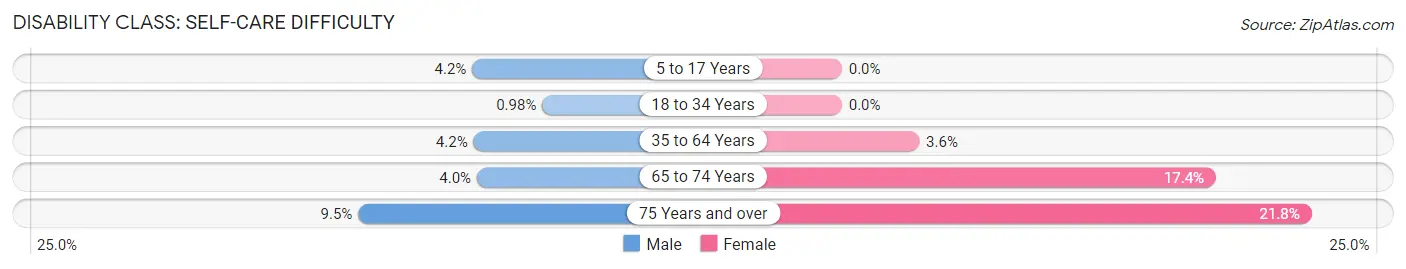
| Age Bracket | Male | Female |
| 5 to 17 Years | 55 (4.2%) | 0 (0.0%) |
| 18 to 34 Years | 15 (1.0%) | 0 (0.0%) |
| 35 to 64 Years | 105 (4.2%) | 110 (3.6%) |
| 65 to 74 Years | 16 (4.0%) | 105 (17.4%) |
| 75 Years and over | 14 (9.5%) | 63 (21.8%) |
Technology Access in Shepherdsville
Computing Device Access in Shepherdsville
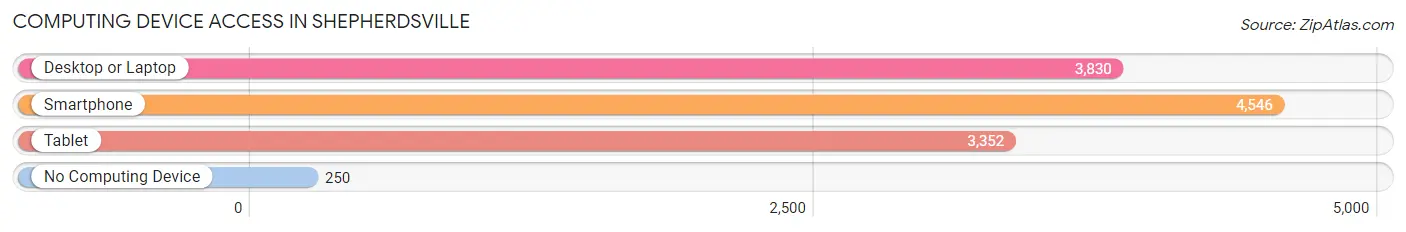
| Device Type | # Households | % Households |
| Desktop or Laptop | 3,830 | 74.7% |
| Smartphone | 4,546 | 88.6% |
| Tablet | 3,352 | 65.4% |
| No Computing Device | 250 | 4.9% |
| Total | 5,128 | 100.0% |
Internet Access in Shepherdsville
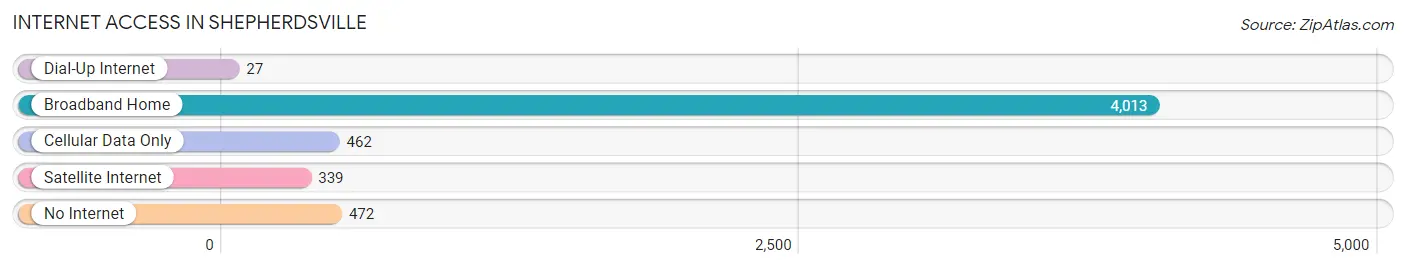
| Internet Type | # Households | % Households |
| Dial-Up Internet | 27 | 0.5% |
| Broadband Home | 4,013 | 78.3% |
| Cellular Data Only | 462 | 9.0% |
| Satellite Internet | 339 | 6.6% |
| No Internet | 472 | 9.2% |
| Total | 5,128 | 100.0% |
Shepherdsville Summary
Shepherdsville, Kentucky is a small city located in Bullitt County, Kentucky. It is situated along the Salt River, approximately 20 miles south of Louisville. The city has a population of 11,222 as of the 2010 census, making it the largest city in Bullitt County.
History
Shepherdsville was founded in 1793 by William Shepherd, a Revolutionary War veteran. He purchased the land from the local Native Americans and named the settlement after himself. The city was incorporated in 1848 and has since grown to become the largest city in Bullitt County.
The city was an important stop on the Louisville and Nashville Railroad, which ran through the city from 1859 to 1971. The railroad brought economic growth to the city, and it became a hub for the surrounding agricultural communities.
Geography
Shepherdsville is located in the rolling hills of central Kentucky. The city is situated along the Salt River, which flows through the city and provides a scenic backdrop. The city is located approximately 20 miles south of Louisville and is part of the Louisville metropolitan area.
The city has a total area of 5.3 square miles, all of which is land. The city is located at an elevation of 545 feet above sea level.
Economy
Shepherdsville’s economy is largely based on agriculture and manufacturing. The city is home to several large manufacturing plants, including a General Electric plant and a Ford Motor Company plant. The city is also home to several small businesses, including restaurants, retail stores, and service providers.
The city is also home to several large employers, including the Bullitt County Public Schools, the Bullitt County Health Department, and the Bullitt County Sheriff’s Office.
Demographics
As of the 2010 census, Shepherdsville had a population of 11,222. The racial makeup of the city was 94.3% White, 2.7% African American, 0.3% Native American, 0.7% Asian, 0.1% Pacific Islander, 0.9% from other races, and 1.0% from two or more races. Hispanic or Latino of any race were 2.2% of the population.
The median income for a household in the city was $41,945, and the median income for a family was $50,945. The per capita income for the city was $20,945. About 8.3% of families and 10.2% of the population were below the poverty line, including 14.2% of those under age 18 and 8.2% of those age 65 or over.
Common Questions
What is Per Capita Income in Shepherdsville?
Per Capita income in Shepherdsville is $27,773.
What is the Median Family Income in Shepherdsville?
Median Family Income in Shepherdsville is $76,926.
What is the Median Household income in Shepherdsville?
Median Household Income in Shepherdsville is $71,875.
What is Income or Wage Gap in Shepherdsville?
Income or Wage Gap in Shepherdsville is 38.9%.
Women in Shepherdsville earn 61.1 cents for every dollar earned by a man.
What is Family Income Deficit in Shepherdsville?
Family Income Deficit in Shepherdsville is $9,628.
Families that are below poverty line in Shepherdsville earn $9,628 less on average than the poverty threshold level.
What is Inequality or Gini Index in Shepherdsville?
Inequality or Gini Index in Shepherdsville is 0.39.
What is the Total Population of Shepherdsville?
Total Population of Shepherdsville is 14,136.
What is the Total Male Population of Shepherdsville?
Total Male Population of Shepherdsville is 6,753.
What is the Total Female Population of Shepherdsville?
Total Female Population of Shepherdsville is 7,383.
What is the Ratio of Males per 100 Females in Shepherdsville?
There are 91.47 Males per 100 Females in Shepherdsville.
What is the Ratio of Females per 100 Males in Shepherdsville?
There are 109.33 Females per 100 Males in Shepherdsville.
What is the Median Population Age in Shepherdsville?
Median Population Age in Shepherdsville is 35.3 Years.
What is the Average Family Size in Shepherdsville
Average Family Size in Shepherdsville is 3.1 People.
What is the Average Household Size in Shepherdsville
Average Household Size in Shepherdsville is 2.7 People.
How Large is the Labor Force in Shepherdsville?
There are 7,144 People in the Labor Forcein in Shepherdsville.
What is the Percentage of People in the Labor Force in Shepherdsville?
67.8% of People are in the Labor Force in Shepherdsville.
What is the Unemployment Rate in Shepherdsville?
Unemployment Rate in Shepherdsville is 3.6%.