Audubon Park, KY Map & Demographics
Audubon Park Map
Audubon Park Overview
$52,792
PER CAPITA INCOME
$120,357
AVG FAMILY INCOME
$104,107
AVG HOUSEHOLD INCOME
18.3%
WAGE / INCOME GAP [ % ]
81.7¢/ $1
WAGE / INCOME GAP [ $ ]
0.37
INEQUALITY / GINI INDEX
1,412
TOTAL POPULATION
650
MALE POPULATION
762
FEMALE POPULATION
85.30
MALES / 100 FEMALES
117.23
FEMALES / 100 MALES
40.3
MEDIAN AGE
2.8
AVG FAMILY SIZE
2.4
AVG HOUSEHOLD SIZE
794
LABOR FORCE [ PEOPLE ]
69.6%
PERCENT IN LABOR FORCE
1.1%
UNEMPLOYMENT RATE
Audubon Park Area Codes
Income in Audubon Park
Income Overview in Audubon Park
Per Capita Income in Audubon Park is $52,792, while median incomes of families and households are $120,357 and $104,107 respectively.
| Characteristic | Number | Measure |
| Per Capita Income | 1,412 | $52,792 |
| Median Family Income | 422 | $120,357 |
| Mean Family Income | 422 | $144,160 |
| Median Household Income | 598 | $104,107 |
| Mean Household Income | 598 | $123,863 |
| Income Deficit | 422 | $0 |
| Wage / Income Gap (%) | 1,412 | 18.32% |
| Wage / Income Gap ($) | 1,412 | 81.68¢ per $1 |
| Gini / Inequality Index | 1,412 | 0.37 |
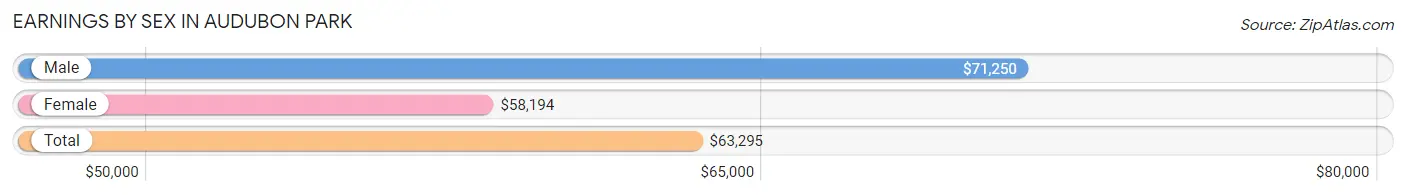
Earnings by Sex in Audubon Park
Average Earnings in Audubon Park are $63,295, $71,250 for men and $58,194 for women, a difference of 18.3%.
| Sex | Number | Average Earnings |
| Male | 398 (49.9%) | $71,250 |
| Female | 399 (50.1%) | $58,194 |
| Total | 797 (100.0%) | $63,295 |
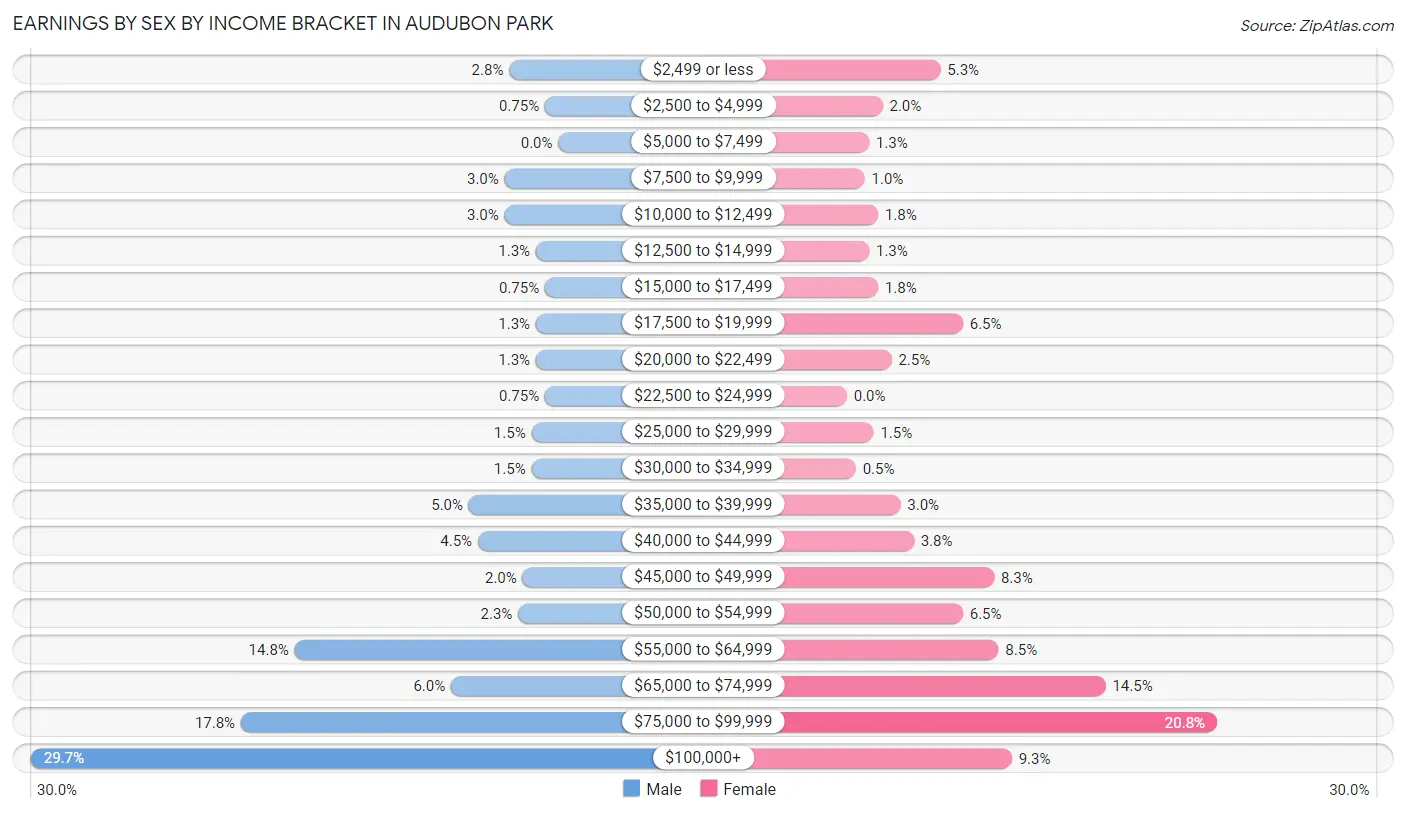
Earnings by Sex by Income Bracket in Audubon Park
The most common earnings brackets in Audubon Park are $100,000+ for men (118 | 29.6%) and $75,000 to $99,999 for women (83 | 20.8%).
| Income | Male | Female |
| $2,499 or less | 11 (2.8%) | 21 (5.3%) |
| $2,500 to $4,999 | 3 (0.7%) | 8 (2.0%) |
| $5,000 to $7,499 | 0 (0.0%) | 5 (1.3%) |
| $7,500 to $9,999 | 12 (3.0%) | 4 (1.0%) |
| $10,000 to $12,499 | 12 (3.0%) | 7 (1.8%) |
| $12,500 to $14,999 | 5 (1.3%) | 5 (1.3%) |
| $15,000 to $17,499 | 3 (0.7%) | 7 (1.8%) |
| $17,500 to $19,999 | 5 (1.3%) | 26 (6.5%) |
| $20,000 to $22,499 | 5 (1.3%) | 10 (2.5%) |
| $22,500 to $24,999 | 3 (0.7%) | 0 (0.0%) |
| $25,000 to $29,999 | 6 (1.5%) | 6 (1.5%) |
| $30,000 to $34,999 | 6 (1.5%) | 2 (0.5%) |
| $35,000 to $39,999 | 20 (5.0%) | 12 (3.0%) |
| $40,000 to $44,999 | 18 (4.5%) | 15 (3.8%) |
| $45,000 to $49,999 | 8 (2.0%) | 33 (8.3%) |
| $50,000 to $54,999 | 9 (2.3%) | 26 (6.5%) |
| $55,000 to $64,999 | 59 (14.8%) | 34 (8.5%) |
| $65,000 to $74,999 | 24 (6.0%) | 58 (14.5%) |
| $75,000 to $99,999 | 71 (17.8%) | 83 (20.8%) |
| $100,000+ | 118 (29.6%) | 37 (9.3%) |
| Total | 398 (100.0%) | 399 (100.0%) |
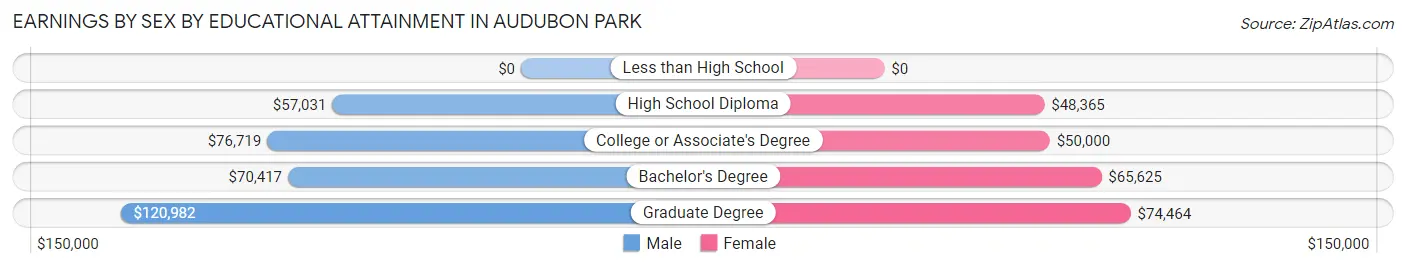
Earnings by Sex by Educational Attainment in Audubon Park
Average earnings in Audubon Park are $76,250 for men and $60,481 for women, a difference of 20.7%. Men with an educational attainment of graduate degree enjoy the highest average annual earnings of $120,982, while those with high school diploma education earn the least with $57,031. Women with an educational attainment of graduate degree earn the most with the average annual earnings of $74,464, while those with high school diploma education have the smallest earnings of $48,365.
| Educational Attainment | Male Income | Female Income |
| Less than High School | - | - |
| High School Diploma | $57,031 | $48,365 |
| College or Associate's Degree | $76,719 | $50,000 |
| Bachelor's Degree | $70,417 | $65,625 |
| Graduate Degree | $120,982 | $74,464 |
| Total | $76,250 | $60,481 |
Family Income in Audubon Park
Family Income Brackets in Audubon Park
According to the Audubon Park family income data, there are 114 families falling into the $100,000 to $149,999 income range, which is the most common income bracket and makes up 27.0% of all families.
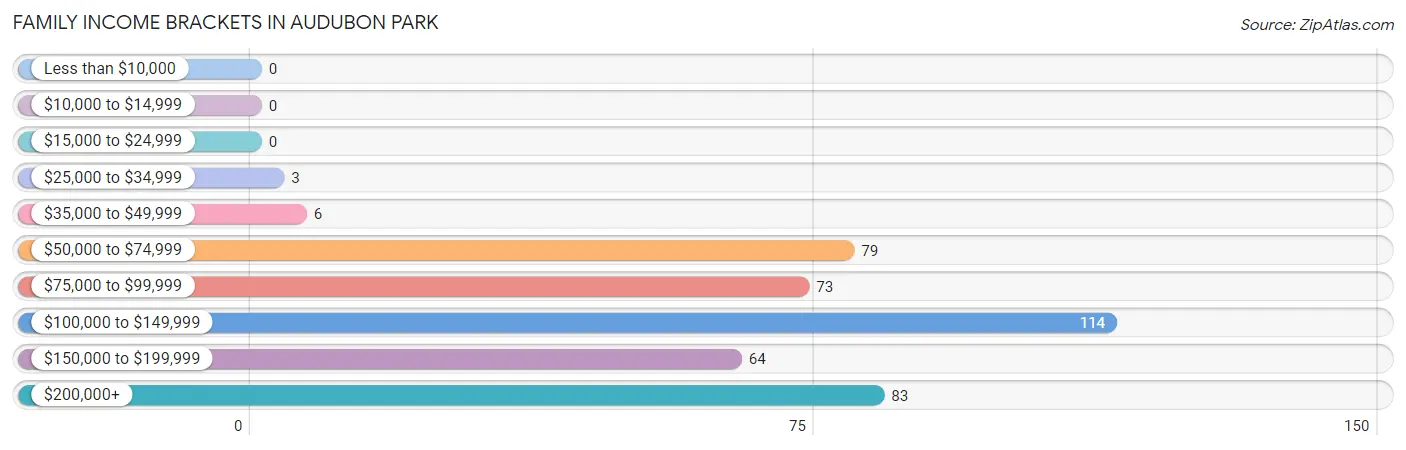
| Income Bracket | # Families | % Families |
| Less than $10,000 | 0 | 0.0% |
| $10,000 to $14,999 | 0 | 0.0% |
| $15,000 to $24,999 | 0 | 0.0% |
| $25,000 to $34,999 | 3 | 0.7% |
| $35,000 to $49,999 | 6 | 1.4% |
| $50,000 to $74,999 | 79 | 18.7% |
| $75,000 to $99,999 | 73 | 17.3% |
| $100,000 to $149,999 | 114 | 27.0% |
| $150,000 to $199,999 | 64 | 15.2% |
| $200,000+ | 83 | 19.7% |
Family Income by Famaliy Size in Audubon Park
4-person families (91 | 21.6%) account for the highest median family income in Audubon Park with $151,875 per family, while 2-person families (237 | 56.2%) have the highest median income of $42,708 per family member.
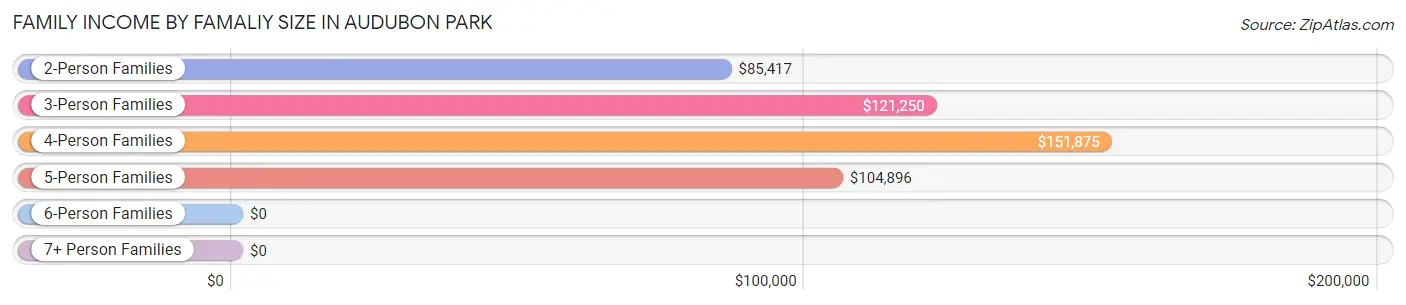
| Income Bracket | # Families | Median Income |
| 2-Person Families | 237 (56.2%) | $85,417 |
| 3-Person Families | 56 (13.3%) | $121,250 |
| 4-Person Families | 91 (21.6%) | $151,875 |
| 5-Person Families | 23 (5.4%) | $104,896 |
| 6-Person Families | 0 (0.0%) | $0 |
| 7+ Person Families | 15 (3.5%) | $0 |
| Total | 422 (100.0%) | $120,357 |
Family Income by Number of Earners in Audubon Park
The median family income in Audubon Park is $120,357, with families comprising 3+ earners (43) having the highest median family income of $250,001, while families with no earners (56) have the lowest median family income of $73,958, accounting for 10.2% and 13.3% of families, respectively.
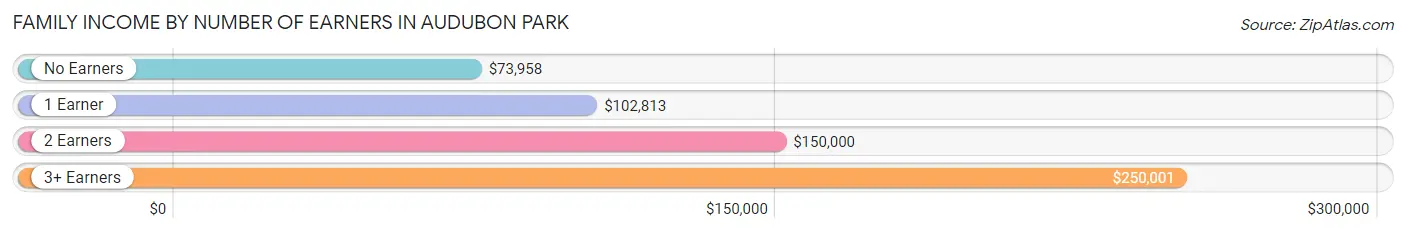
| Number of Earners | # Families | Median Income |
| No Earners | 56 (13.3%) | $73,958 |
| 1 Earner | 151 (35.8%) | $102,813 |
| 2 Earners | 172 (40.8%) | $150,000 |
| 3+ Earners | 43 (10.2%) | $250,001 |
| Total | 422 (100.0%) | $120,357 |
Household Income in Audubon Park
Household Income Brackets in Audubon Park
With 147 households falling in the category, the $100,000 to $149,999 income range is the most frequent in Audubon Park, accounting for 24.6% of all households.
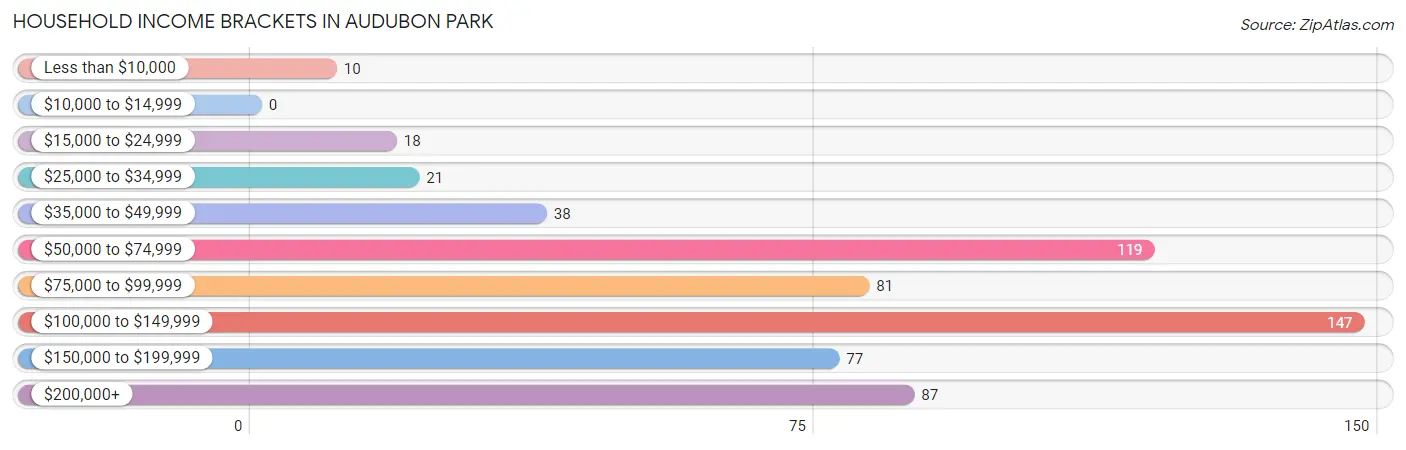
| Income Bracket | # Households | % Households |
| Less than $10,000 | 10 | 1.7% |
| $10,000 to $14,999 | 0 | 0.0% |
| $15,000 to $24,999 | 18 | 3.0% |
| $25,000 to $34,999 | 21 | 3.5% |
| $35,000 to $49,999 | 38 | 6.4% |
| $50,000 to $74,999 | 119 | 19.9% |
| $75,000 to $99,999 | 81 | 13.5% |
| $100,000 to $149,999 | 147 | 24.6% |
| $150,000 to $199,999 | 77 | 12.9% |
| $200,000+ | 87 | 14.5% |
Household Income by Householder Age in Audubon Park
The median household income in Audubon Park is $104,107, with the highest median household income of $155,625 found in the 45 to 64 years age bracket for the primary householder. A total of 149 households (24.9%) fall into this category. Meanwhile, the 15 to 24 years age bracket for the primary householder has the lowest median household income of $35,417, with 10 households (1.7%) in this group.
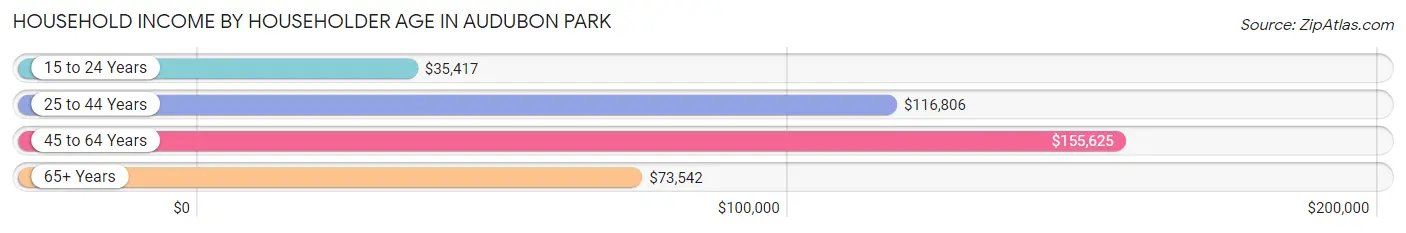
| Income Bracket | # Households | Median Income |
| 15 to 24 Years | 10 (1.7%) | $35,417 |
| 25 to 44 Years | 247 (41.3%) | $116,806 |
| 45 to 64 Years | 149 (24.9%) | $155,625 |
| 65+ Years | 192 (32.1%) | $73,542 |
| Total | 598 (100.0%) | $104,107 |
Poverty in Audubon Park
Income Below Poverty by Sex and Age in Audubon Park
With 2.6% poverty level for males and 0.5% for females among the residents of Audubon Park, 75 year old and over males and 75 year old and over females are the most vulnerable to poverty, with 6 males (14.3%) and 3 females (5.1%) in their respective age groups living below the poverty level.
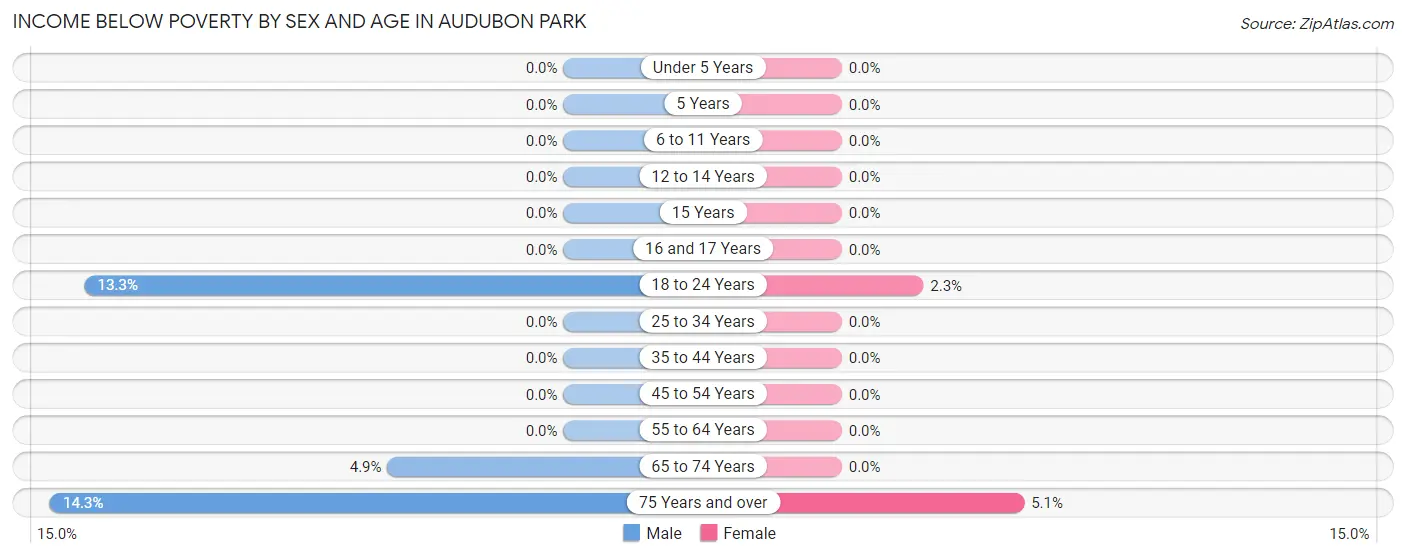
| Age Bracket | Male | Female |
| Under 5 Years | 0 (0.0%) | 0 (0.0%) |
| 5 Years | 0 (0.0%) | 0 (0.0%) |
| 6 to 11 Years | 0 (0.0%) | 0 (0.0%) |
| 12 to 14 Years | 0 (0.0%) | 0 (0.0%) |
| 15 Years | 0 (0.0%) | 0 (0.0%) |
| 16 and 17 Years | 0 (0.0%) | 0 (0.0%) |
| 18 to 24 Years | 6 (13.3%) | 1 (2.3%) |
| 25 to 34 Years | 0 (0.0%) | 0 (0.0%) |
| 35 to 44 Years | 0 (0.0%) | 0 (0.0%) |
| 45 to 54 Years | 0 (0.0%) | 0 (0.0%) |
| 55 to 64 Years | 0 (0.0%) | 0 (0.0%) |
| 65 to 74 Years | 5 (4.9%) | 0 (0.0%) |
| 75 Years and over | 6 (14.3%) | 3 (5.1%) |
| Total | 17 (2.6%) | 4 (0.5%) |
Income Above Poverty by Sex and Age in Audubon Park
According to the poverty statistics in Audubon Park, males aged under 5 years and females aged under 5 years are the age groups that are most secure financially, with 100.0% of males and 100.0% of females in these age groups living above the poverty line.
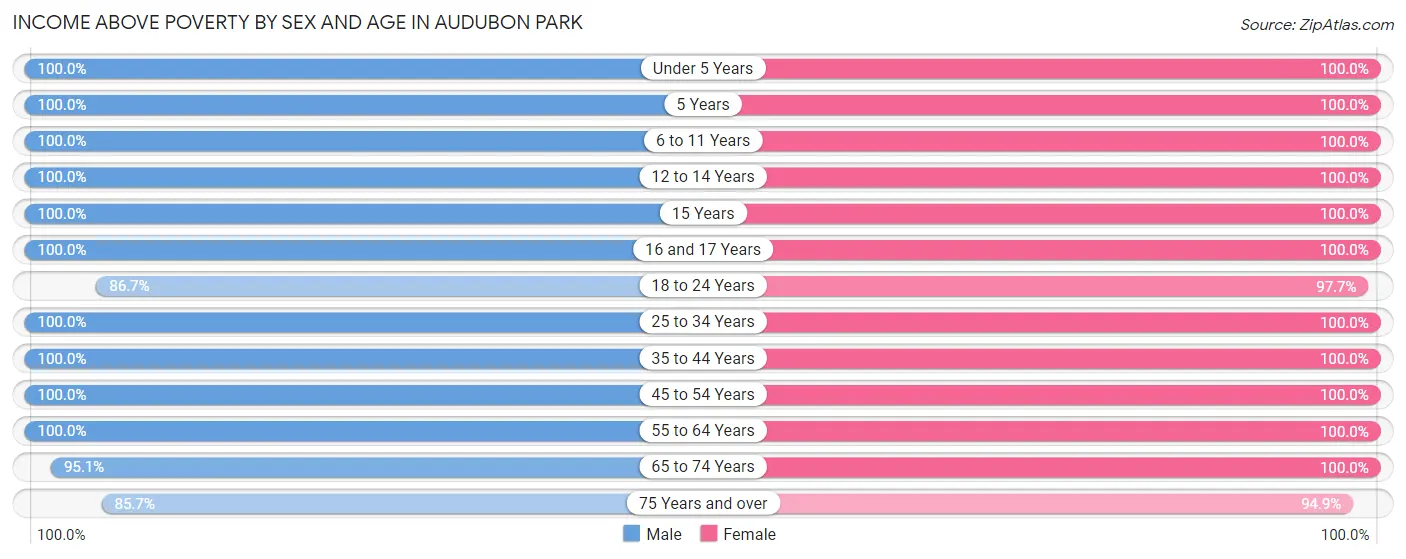
| Age Bracket | Male | Female |
| Under 5 Years | 46 (100.0%) | 65 (100.0%) |
| 5 Years | 16 (100.0%) | 5 (100.0%) |
| 6 to 11 Years | 43 (100.0%) | 38 (100.0%) |
| 12 to 14 Years | 7 (100.0%) | 31 (100.0%) |
| 15 Years | 7 (100.0%) | 13 (100.0%) |
| 16 and 17 Years | 12 (100.0%) | 27 (100.0%) |
| 18 to 24 Years | 39 (86.7%) | 43 (97.7%) |
| 25 to 34 Years | 77 (100.0%) | 65 (100.0%) |
| 35 to 44 Years | 118 (100.0%) | 150 (100.0%) |
| 45 to 54 Years | 56 (100.0%) | 65 (100.0%) |
| 55 to 64 Years | 79 (100.0%) | 82 (100.0%) |
| 65 to 74 Years | 97 (95.1%) | 118 (100.0%) |
| 75 Years and over | 36 (85.7%) | 56 (94.9%) |
| Total | 633 (97.4%) | 758 (99.5%) |
Income Below Poverty Among Married-Couple Families in Audubon Park
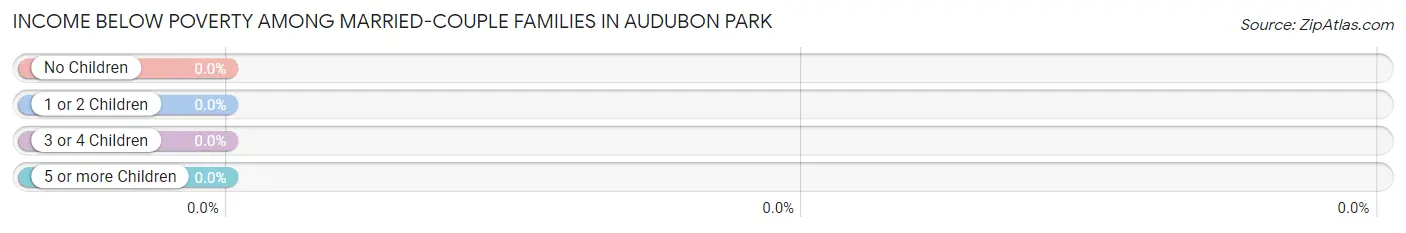
| Children | Above Poverty | Below Poverty |
| No Children | 197 (100.0%) | 0 (0.0%) |
| 1 or 2 Children | 101 (100.0%) | 0 (0.0%) |
| 3 or 4 Children | 30 (100.0%) | 0 (0.0%) |
| 5 or more Children | 0 (0.0%) | 0 (0.0%) |
| Total | 328 (100.0%) | 0 (0.0%) |
Income Below Poverty Among Single-Parent Households in Audubon Park
| Children | Single Father | Single Mother |
| No Children | 0 (0.0%) | 0 (0.0%) |
| 1 or 2 Children | 0 (0.0%) | 0 (0.0%) |
| 3 or 4 Children | 0 (0.0%) | 0 (0.0%) |
| 5 or more Children | 0 (0.0%) | 0 (0.0%) |
| Total | 0 (0.0%) | 0 (0.0%) |
Income Below Poverty Among Married-Couple vs Single-Parent Households in Audubon Park
| Children | Married-Couple Families | Single-Parent Households |
| No Children | 0 (0.0%) | 0 (0.0%) |
| 1 or 2 Children | 0 (0.0%) | 0 (0.0%) |
| 3 or 4 Children | 0 (0.0%) | 0 (0.0%) |
| 5 or more Children | 0 (0.0%) | 0 (0.0%) |
| Total | 0 (0.0%) | 0 (0.0%) |
Race in Audubon Park
The most populous races in Audubon Park are White / Caucasian (1,304 | 92.3%), Black / African American (48 | 3.4%), and Hispanic or Latino (42 | 3.0%).
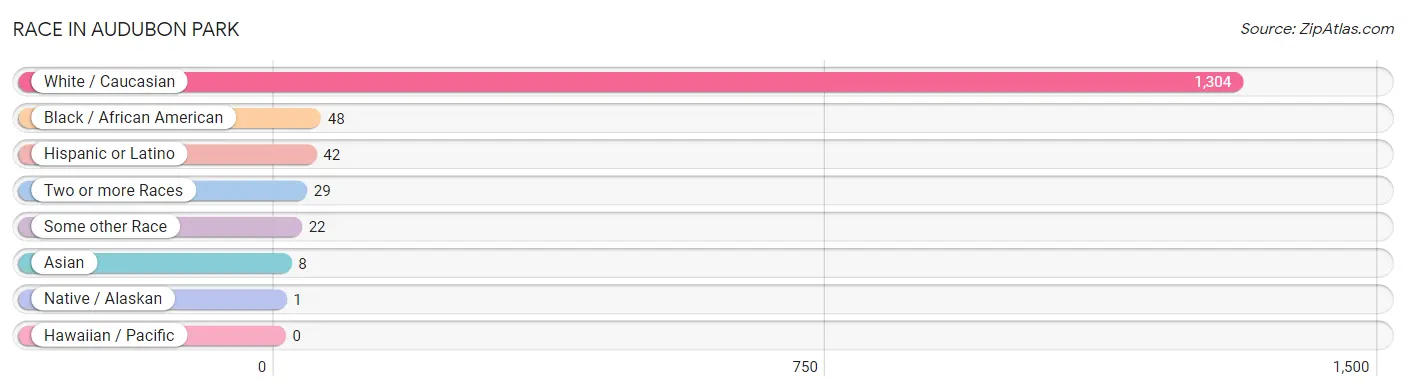
| Race | # Population | % Population |
| Asian | 8 | 0.6% |
| Black / African American | 48 | 3.4% |
| Hawaiian / Pacific | 0 | 0.0% |
| Hispanic or Latino | 42 | 3.0% |
| Native / Alaskan | 1 | 0.1% |
| White / Caucasian | 1,304 | 92.3% |
| Two or more Races | 29 | 2.1% |
| Some other Race | 22 | 1.6% |
| Total | 1,412 | 100.0% |
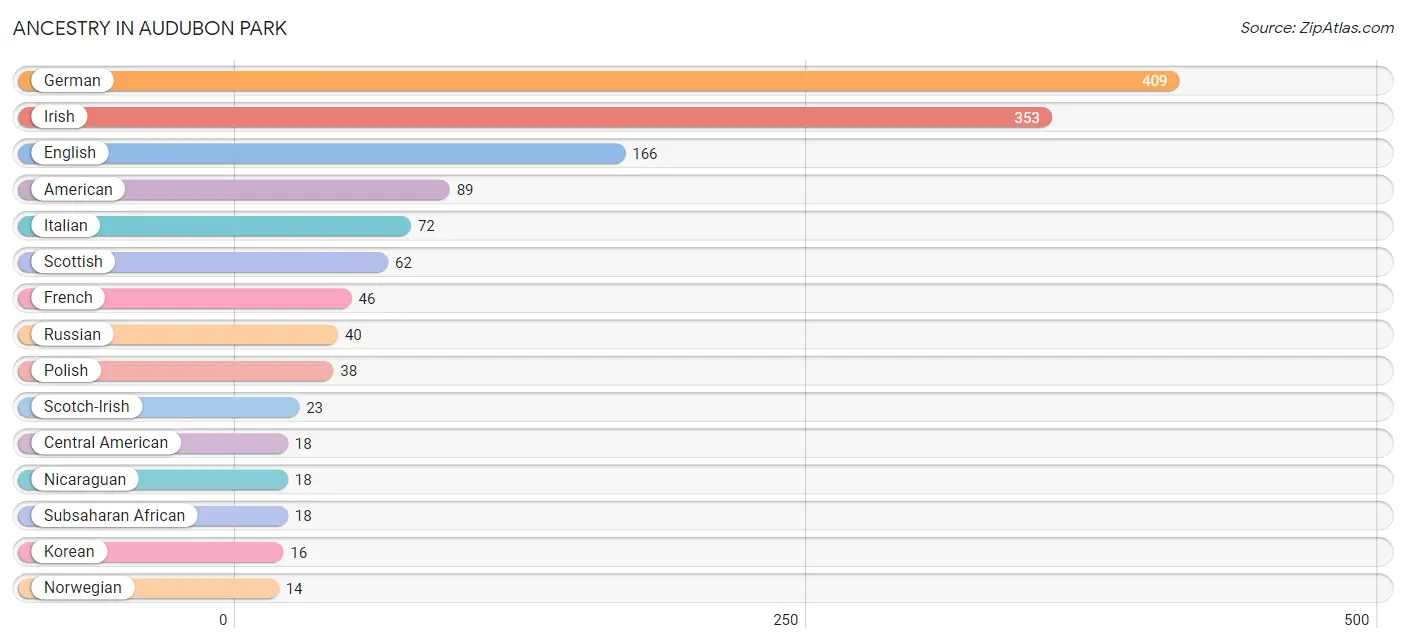
Ancestry in Audubon Park
The most populous ancestries reported in Audubon Park are German (409 | 29.0%), Irish (353 | 25.0%), English (166 | 11.8%), American (89 | 6.3%), and Italian (72 | 5.1%), together accounting for 77.1% of all Audubon Park residents.
| Ancestry | # Population | % Population |
| African | 5 | 0.4% |
| American | 89 | 6.3% |
| Arab | 5 | 0.4% |
| Belgian | 9 | 0.6% |
| British | 5 | 0.4% |
| Burmese | 4 | 0.3% |
| Central American | 18 | 1.3% |
| Cherokee | 1 | 0.1% |
| Choctaw | 1 | 0.1% |
| Czech | 5 | 0.4% |
| Dutch | 9 | 0.6% |
| English | 166 | 11.8% |
| Ethiopian | 13 | 0.9% |
| European | 12 | 0.9% |
| French | 46 | 3.3% |
| French Canadian | 4 | 0.3% |
| German | 409 | 29.0% |
| Hungarian | 2 | 0.1% |
| Irish | 353 | 25.0% |
| Italian | 72 | 5.1% |
| Korean | 16 | 1.1% |
| Lebanese | 5 | 0.4% |
| Lithuanian | 4 | 0.3% |
| Mexican | 13 | 0.9% |
| Nicaraguan | 18 | 1.3% |
| Northern European | 2 | 0.1% |
| Norwegian | 14 | 1.0% |
| Polish | 38 | 2.7% |
| Puerto Rican | 2 | 0.1% |
| Romanian | 2 | 0.1% |
| Russian | 40 | 2.8% |
| Scandinavian | 9 | 0.6% |
| Scotch-Irish | 23 | 1.6% |
| Scottish | 62 | 4.4% |
| Slovak | 5 | 0.4% |
| Spaniard | 9 | 0.6% |
| Subsaharan African | 18 | 1.3% |
| Swedish | 6 | 0.4% |
| Swiss | 9 | 0.6% |
| Ukrainian | 8 | 0.6% |
| Welsh | 2 | 0.1% | View All 41 Rows |
Immigrants in Audubon Park
The most numerous immigrant groups reported in Audubon Park came from Central America (9 | 0.6%), Latin America (9 | 0.6%), Nicaragua (5 | 0.4%), Asia (4 | 0.3%), and Eastern Asia (4 | 0.3%), together accounting for 2.2% of all Audubon Park residents.
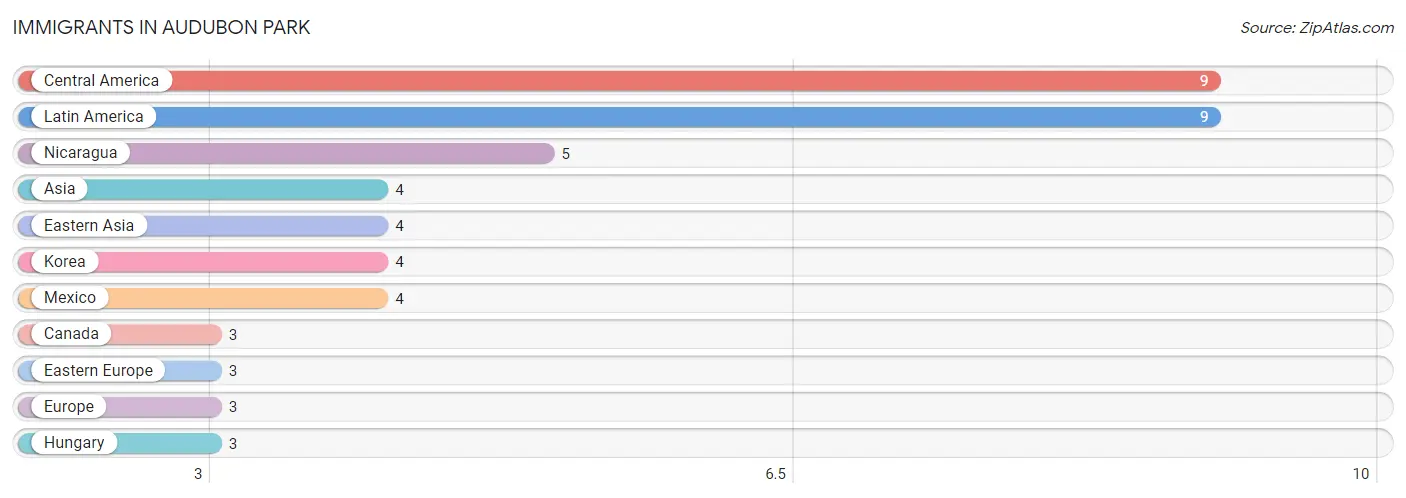
| Immigration Origin | # Population | % Population |
| Asia | 4 | 0.3% |
| Canada | 3 | 0.2% |
| Central America | 9 | 0.6% |
| Eastern Asia | 4 | 0.3% |
| Eastern Europe | 3 | 0.2% |
| Europe | 3 | 0.2% |
| Hungary | 3 | 0.2% |
| Korea | 4 | 0.3% |
| Latin America | 9 | 0.6% |
| Mexico | 4 | 0.3% |
| Nicaragua | 5 | 0.4% | View All 11 Rows |
Sex and Age in Audubon Park
Sex and Age in Audubon Park
The most populous age groups in Audubon Park are 35 to 39 Years (82 | 12.6%) for men and 40 to 44 Years (87 | 11.4%) for women.
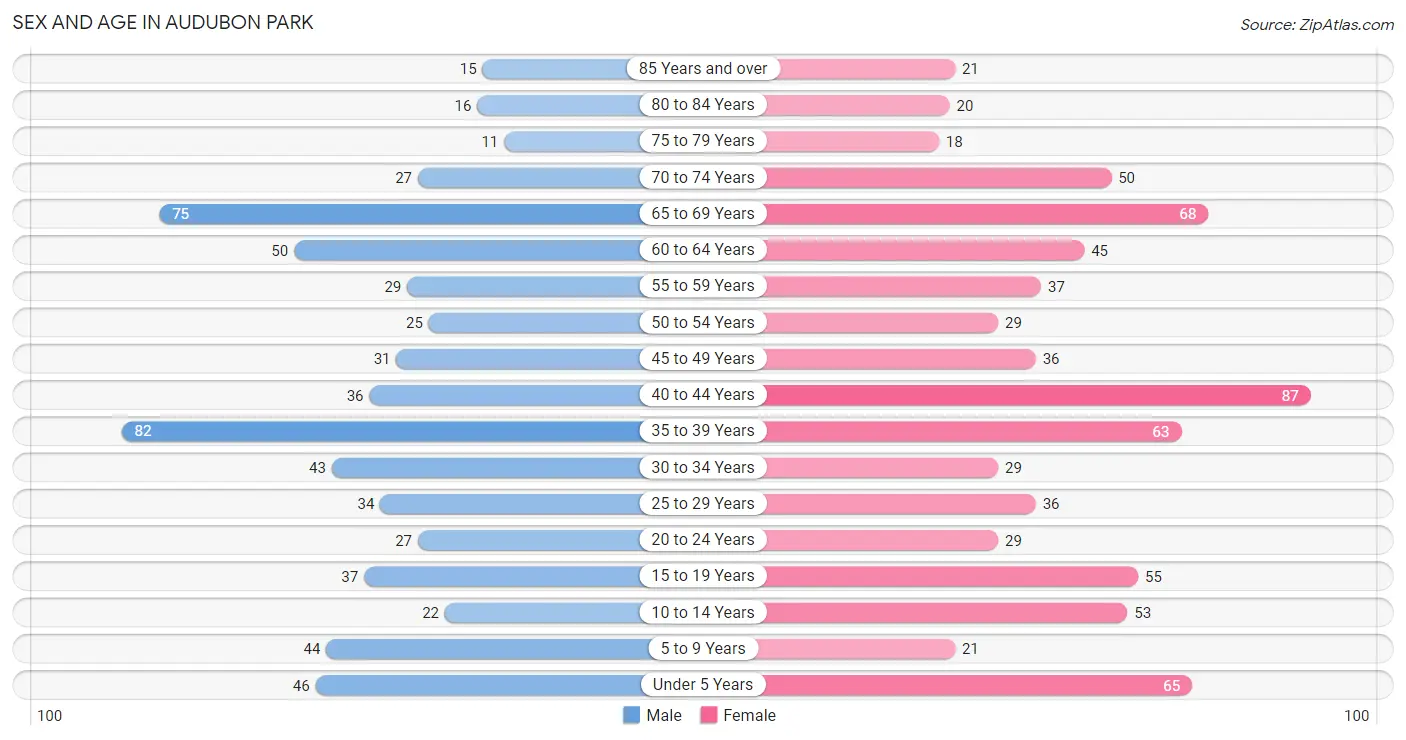
| Age Bracket | Male | Female |
| Under 5 Years | 46 (7.1%) | 65 (8.5%) |
| 5 to 9 Years | 44 (6.8%) | 21 (2.8%) |
| 10 to 14 Years | 22 (3.4%) | 53 (7.0%) |
| 15 to 19 Years | 37 (5.7%) | 55 (7.2%) |
| 20 to 24 Years | 27 (4.2%) | 29 (3.8%) |
| 25 to 29 Years | 34 (5.2%) | 36 (4.7%) |
| 30 to 34 Years | 43 (6.6%) | 29 (3.8%) |
| 35 to 39 Years | 82 (12.6%) | 63 (8.3%) |
| 40 to 44 Years | 36 (5.5%) | 87 (11.4%) |
| 45 to 49 Years | 31 (4.8%) | 36 (4.7%) |
| 50 to 54 Years | 25 (3.8%) | 29 (3.8%) |
| 55 to 59 Years | 29 (4.5%) | 37 (4.9%) |
| 60 to 64 Years | 50 (7.7%) | 45 (5.9%) |
| 65 to 69 Years | 75 (11.5%) | 68 (8.9%) |
| 70 to 74 Years | 27 (4.2%) | 50 (6.6%) |
| 75 to 79 Years | 11 (1.7%) | 18 (2.4%) |
| 80 to 84 Years | 16 (2.5%) | 20 (2.6%) |
| 85 Years and over | 15 (2.3%) | 21 (2.8%) |
| Total | 650 (100.0%) | 762 (100.0%) |
Families and Households in Audubon Park
Median Family Size in Audubon Park
The median family size in Audubon Park is 2.82 persons per family, with married-couple families (328 | 77.7%) accounting for the largest median family size of 3.08 persons per family. On the other hand, single female/mother families (72 | 17.1%) represent the smallest median family size with 1.76 persons per family.
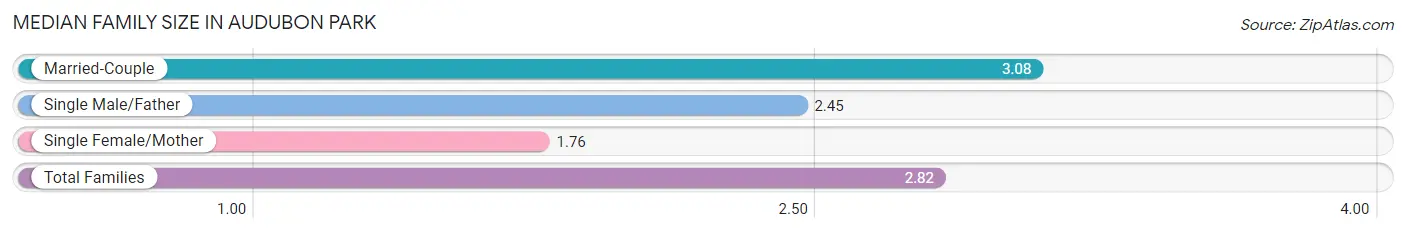
| Family Type | # Families | Family Size |
| Married-Couple | 328 (77.7%) | 3.08 |
| Single Male/Father | 22 (5.2%) | 2.45 |
| Single Female/Mother | 72 (17.1%) | 1.76 |
| Total Families | 422 (100.0%) | 2.82 |
Median Household Size in Audubon Park
The median household size in Audubon Park is 2.36 persons per household, with married-couple households (328 | 54.8%) accounting for the largest median household size of 3.08 persons per household. non-family households (176 | 29.4%) represent the smallest median household size with 1.22 persons per household.
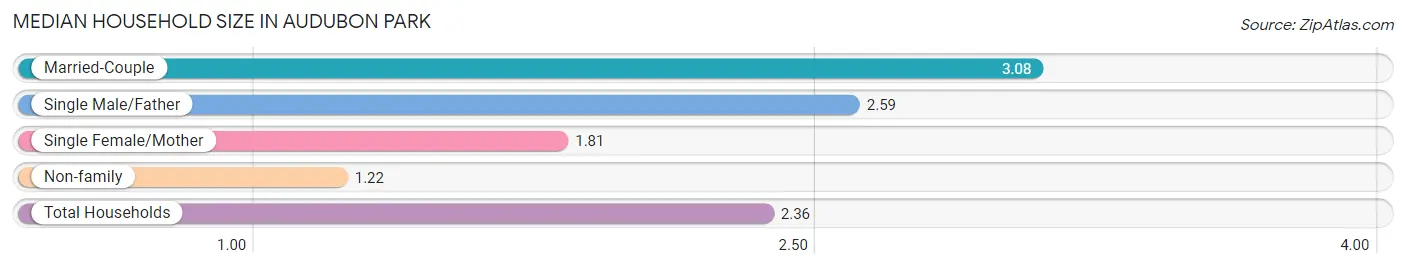
| Household Type | # Households | Household Size |
| Married-Couple | 328 (54.8%) | 3.08 |
| Single Male/Father | 22 (3.7%) | 2.59 |
| Single Female/Mother | 72 (12.0%) | 1.81 |
| Non-family | 176 (29.4%) | 1.22 |
| Total Households | 598 (100.0%) | 2.36 |
Household Size by Marriage Status in Audubon Park
Out of a total of 598 households in Audubon Park, 422 (70.6%) are family households, while 176 (29.4%) are nonfamily households. The most numerous type of family households are 2-person households, comprising 234, and the most common type of nonfamily households are 1-person households, comprising 141.
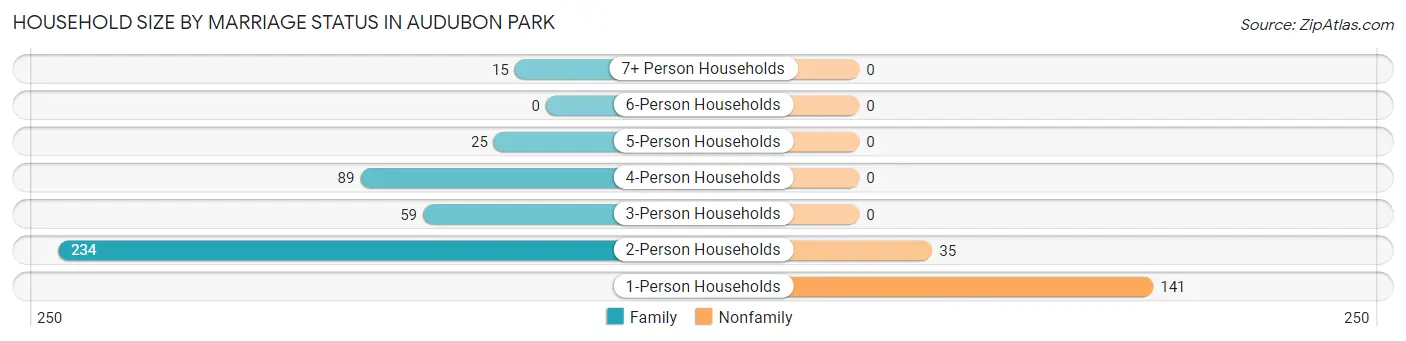
| Household Size | Family Households | Nonfamily Households |
| 1-Person Households | - | 141 (23.6%) |
| 2-Person Households | 234 (39.1%) | 35 (5.9%) |
| 3-Person Households | 59 (9.9%) | 0 (0.0%) |
| 4-Person Households | 89 (14.9%) | 0 (0.0%) |
| 5-Person Households | 25 (4.2%) | 0 (0.0%) |
| 6-Person Households | 0 (0.0%) | 0 (0.0%) |
| 7+ Person Households | 15 (2.5%) | 0 (0.0%) |
| Total | 422 (70.6%) | 176 (29.4%) |
Female Fertility in Audubon Park
Fertility by Age in Audubon Park
Average fertility rate in Audubon Park is 104.0 births per 1,000 women. Women in the age bracket of 20 to 34 years have the highest fertility rate with 287.0 births per 1,000 women. Women in the age bracket of 20 to 34 years acount for 77.1% of all women with births.
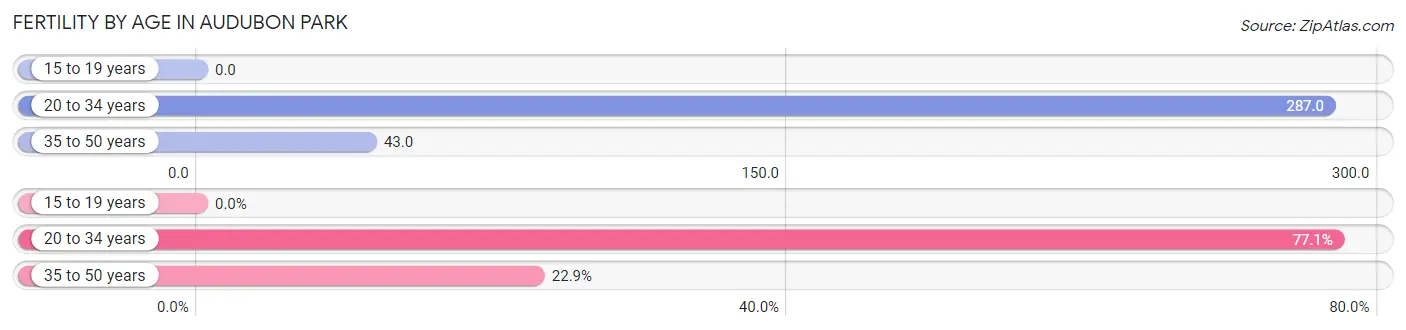
| Age Bracket | Women with Births | Births / 1,000 Women |
| 15 to 19 years | 0 (0.0%) | 0.0 |
| 20 to 34 years | 27 (77.1%) | 287.0 |
| 35 to 50 years | 8 (22.9%) | 43.0 |
| Total | 35 (100.0%) | 104.0 |
Fertility by Age by Marriage Status in Audubon Park
91.4% of women with births (35) in Audubon Park are married. The highest percentage of unmarried women with births falls into 20 to 34 years age bracket with 11.1% of them unmarried at the time of birth, while the lowest percentage of unmarried women with births belong to 35 to 50 years age bracket with 0.0% of them unmarried.
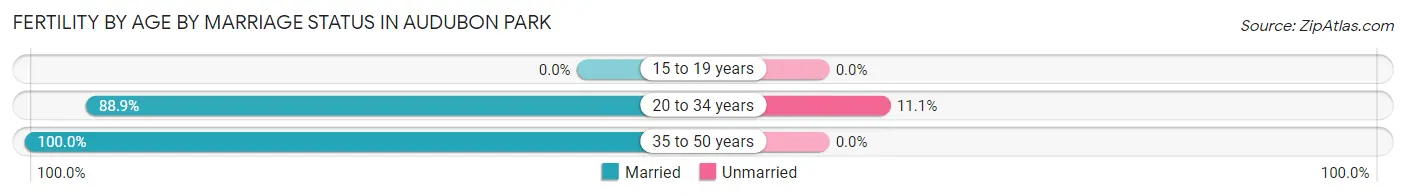
| Age Bracket | Married | Unmarried |
| 15 to 19 years | 0 (0.0%) | 0 (0.0%) |
| 20 to 34 years | 24 (88.9%) | 3 (11.1%) |
| 35 to 50 years | 8 (100.0%) | 0 (0.0%) |
| Total | 32 (91.4%) | 3 (8.6%) |
Fertility by Education in Audubon Park
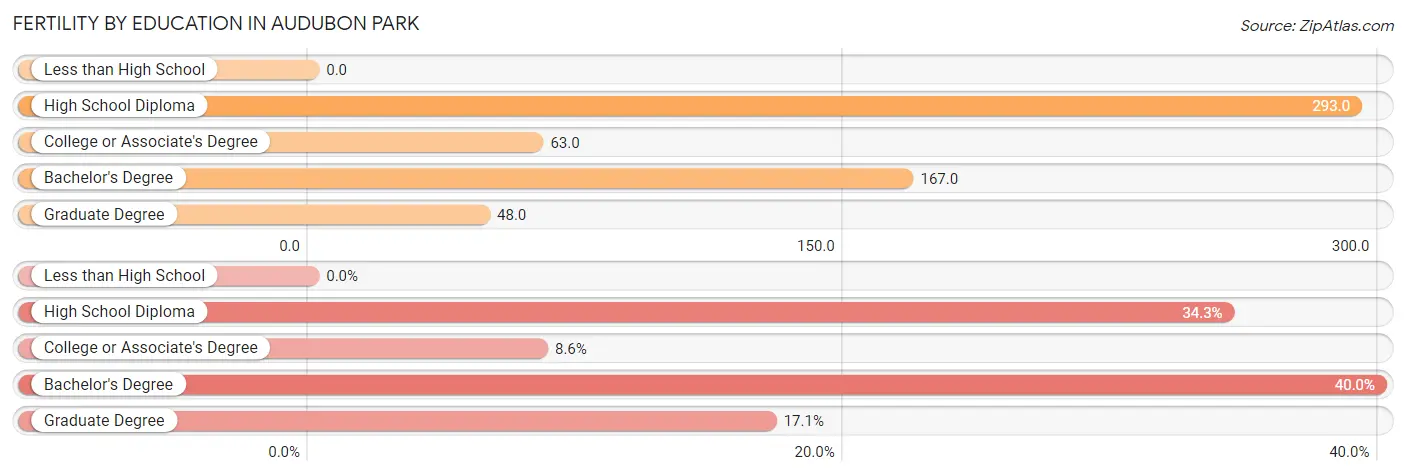
| Educational Attainment | Women with Births | Births / 1,000 Women |
| Less than High School | 0 (0.0%) | 0.0 |
| High School Diploma | 12 (34.3%) | 293.0 |
| College or Associate's Degree | 3 (8.6%) | 63.0 |
| Bachelor's Degree | 14 (40.0%) | 167.0 |
| Graduate Degree | 6 (17.1%) | 48.0 |
| Total | 35 (100.0%) | 104.0 |
Fertility by Education by Marriage Status in Audubon Park
8.6% of women with births in Audubon Park are unmarried. Women with the educational attainment of high school diploma are most likely to be married with 100.0% of them married at childbirth, while women with the educational attainment of college or associate's degree are least likely to be married with 100.0% of them unmarried at childbirth.
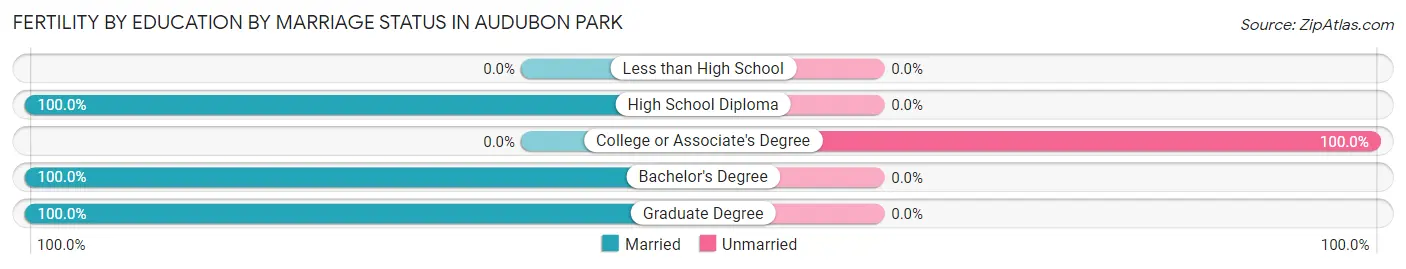
| Educational Attainment | Married | Unmarried |
| Less than High School | 0 (0.0%) | 0 (0.0%) |
| High School Diploma | 12 (100.0%) | 0 (0.0%) |
| College or Associate's Degree | 0 (0.0%) | 3 (100.0%) |
| Bachelor's Degree | 14 (100.0%) | 0 (0.0%) |
| Graduate Degree | 6 (100.0%) | 0 (0.0%) |
| Total | 32 (91.4%) | 3 (8.6%) |
Employment Characteristics in Audubon Park
Employment by Class of Employer in Audubon Park
Among the 781 employed individuals in Audubon Park, private company employees (428 | 54.8%), local government employees (101 | 12.9%), and not-for-profit organizations (91 | 11.7%) make up the most common classes of employment.
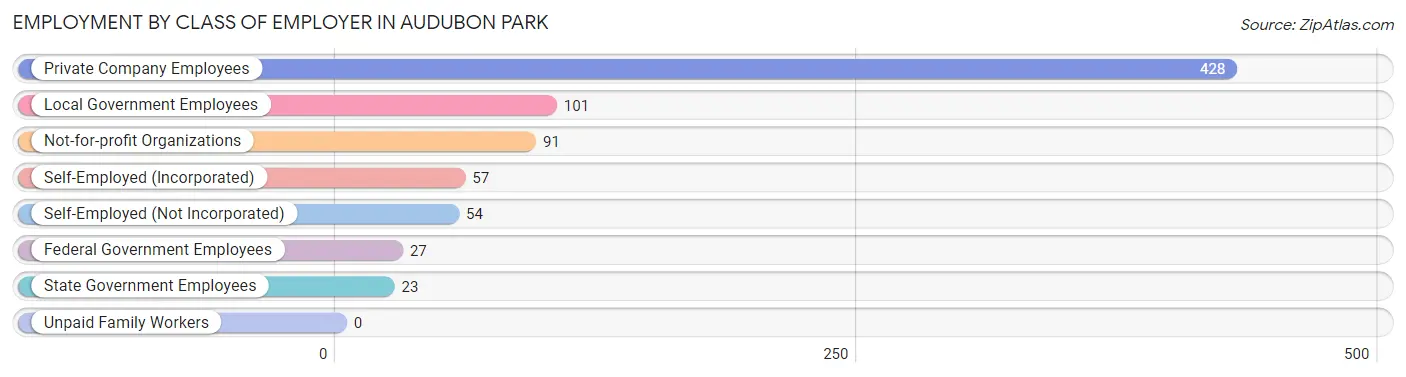
| Employer Class | # Employees | % Employees |
| Private Company Employees | 428 | 54.8% |
| Self-Employed (Incorporated) | 57 | 7.3% |
| Self-Employed (Not Incorporated) | 54 | 6.9% |
| Not-for-profit Organizations | 91 | 11.7% |
| Local Government Employees | 101 | 12.9% |
| State Government Employees | 23 | 2.9% |
| Federal Government Employees | 27 | 3.5% |
| Unpaid Family Workers | 0 | 0.0% |
| Total | 781 | 100.0% |
Employment Status by Age in Audubon Park
According to the labor force statistics for Audubon Park, out of the total population over 16 years of age (1,141), 69.6% or 794 individuals are in the labor force, with 1.1% or 9 of them unemployed. The age group with the highest labor force participation rate is 30 to 34 years, with 100.0% or 72 individuals in the labor force. Within the labor force, the 20 to 24 years age range has the highest percentage of unemployed individuals, with 5.5% or 3 of them being unemployed.
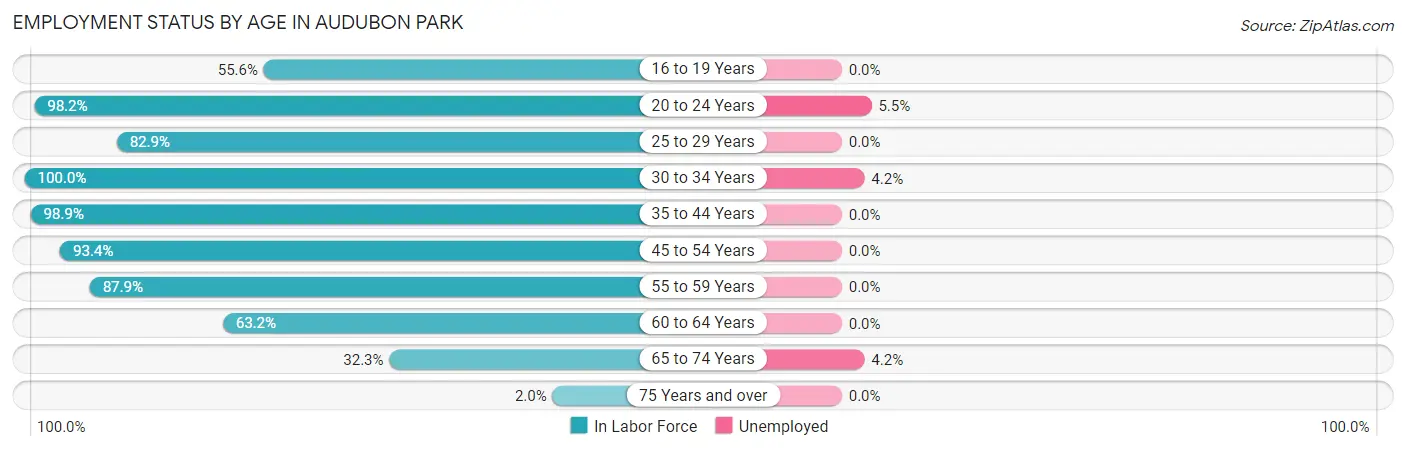
| Age Bracket | In Labor Force | Unemployed |
| 16 to 19 Years | 40 (55.6%) | 0 (0.0%) |
| 20 to 24 Years | 55 (98.2%) | 3 (5.5%) |
| 25 to 29 Years | 58 (82.9%) | 0 (0.0%) |
| 30 to 34 Years | 72 (100.0%) | 3 (4.2%) |
| 35 to 44 Years | 265 (98.9%) | 0 (0.0%) |
| 45 to 54 Years | 113 (93.4%) | 0 (0.0%) |
| 55 to 59 Years | 58 (87.9%) | 0 (0.0%) |
| 60 to 64 Years | 60 (63.2%) | 0 (0.0%) |
| 65 to 74 Years | 71 (32.3%) | 3 (4.2%) |
| 75 Years and over | 2 (2.0%) | 0 (0.0%) |
| Total | 794 (69.6%) | 9 (1.1%) |
Employment Status by Educational Attainment in Audubon Park
According to labor force statistics for Audubon Park, 90.5% of individuals (626) out of the total population between 25 and 64 years of age (692) are in the labor force, with 0.5% or 3 of them being unemployed. The group with the highest labor force participation rate are those with the educational attainment of less than high school, with 100.0% or 4 individuals in the labor force. Within the labor force, individuals with high school diploma education have the highest percentage of unemployment, with 3.2% or 3 of them being unemployed.
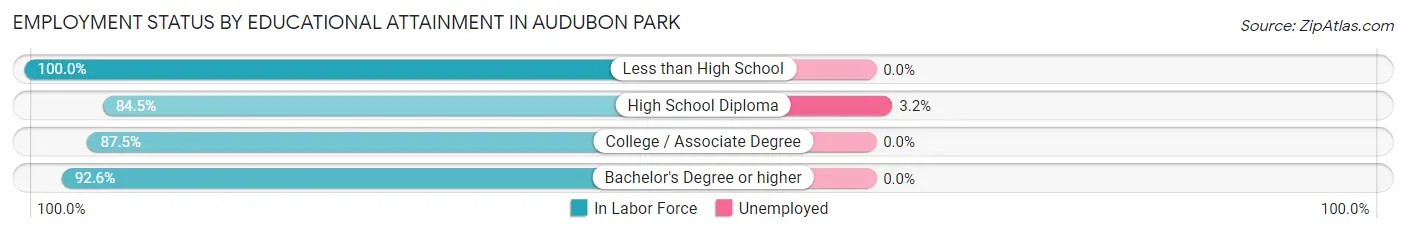
| Educational Attainment | In Labor Force | Unemployed |
| Less than High School | 4 (100.0%) | 0 (0.0%) |
| High School Diploma | 93 (84.5%) | 4 (3.2%) |
| College / Associate Degree | 105 (87.5%) | 0 (0.0%) |
| Bachelor's Degree or higher | 424 (92.6%) | 0 (0.0%) |
| Total | 626 (90.5%) | 3 (0.5%) |
Employment Occupations by Sex in Audubon Park
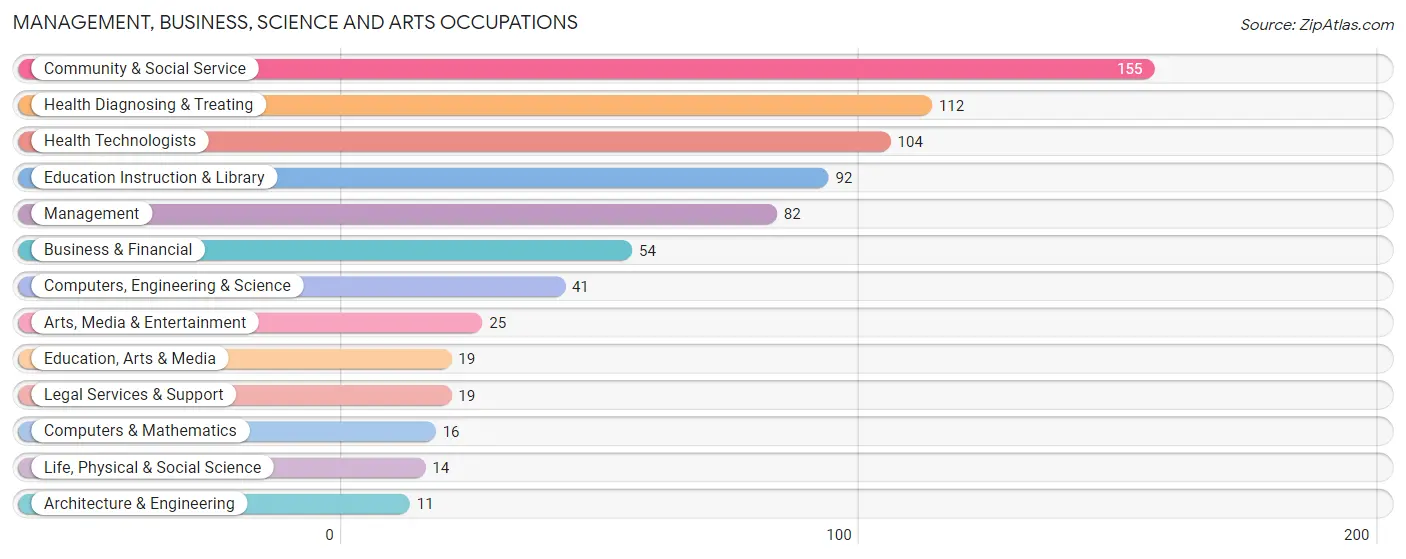
Management, Business, Science and Arts Occupations
The most common Management, Business, Science and Arts occupations in Audubon Park are Community & Social Service (155 | 19.8%), Health Diagnosing & Treating (112 | 14.3%), Health Technologists (104 | 13.3%), Education Instruction & Library (92 | 11.7%), and Management (82 | 10.5%).
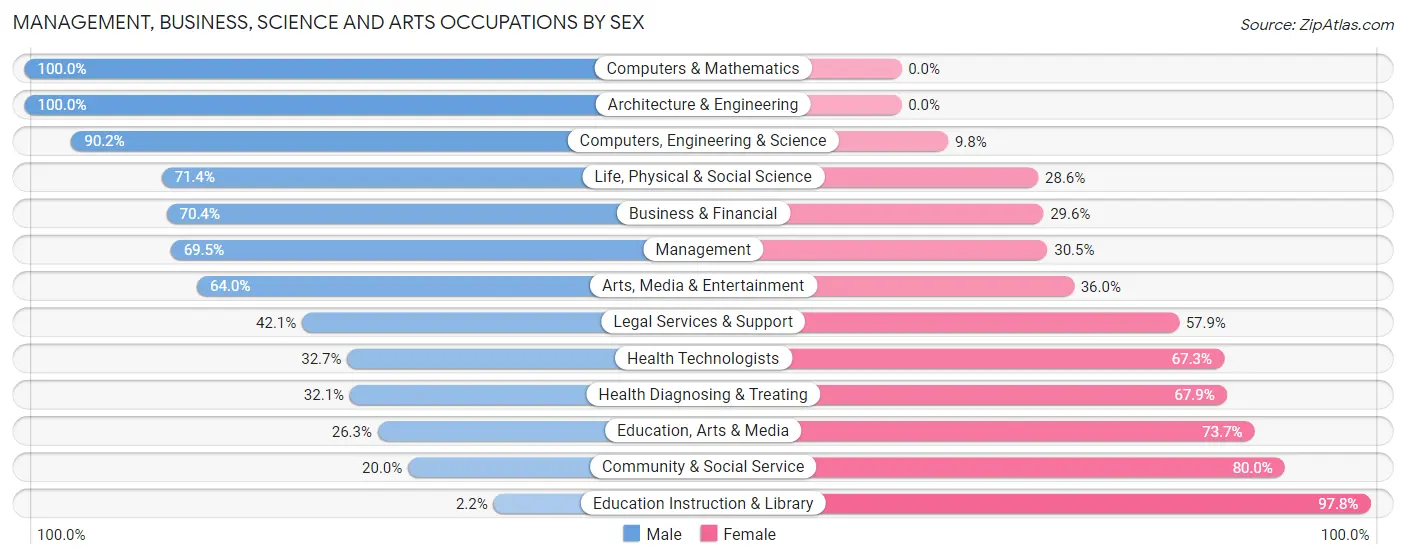
Management, Business, Science and Arts Occupations by Sex
Within the Management, Business, Science and Arts occupations in Audubon Park, the most male-oriented occupations are Computers & Mathematics (100.0%), Architecture & Engineering (100.0%), and Computers, Engineering & Science (90.2%), while the most female-oriented occupations are Education Instruction & Library (97.8%), Community & Social Service (80.0%), and Education, Arts & Media (73.7%).
| Occupation | Male | Female |
| Management | 57 (69.5%) | 25 (30.5%) |
| Business & Financial | 38 (70.4%) | 16 (29.6%) |
| Computers, Engineering & Science | 37 (90.2%) | 4 (9.8%) |
| Computers & Mathematics | 16 (100.0%) | 0 (0.0%) |
| Architecture & Engineering | 11 (100.0%) | 0 (0.0%) |
| Life, Physical & Social Science | 10 (71.4%) | 4 (28.6%) |
| Community & Social Service | 31 (20.0%) | 124 (80.0%) |
| Education, Arts & Media | 5 (26.3%) | 14 (73.7%) |
| Legal Services & Support | 8 (42.1%) | 11 (57.9%) |
| Education Instruction & Library | 2 (2.2%) | 90 (97.8%) |
| Arts, Media & Entertainment | 16 (64.0%) | 9 (36.0%) |
| Health Diagnosing & Treating | 36 (32.1%) | 76 (67.9%) |
| Health Technologists | 34 (32.7%) | 70 (67.3%) |
| Total (Category) | 199 (44.8%) | 245 (55.2%) |
| Total (Overall) | 393 (50.2%) | 390 (49.8%) |
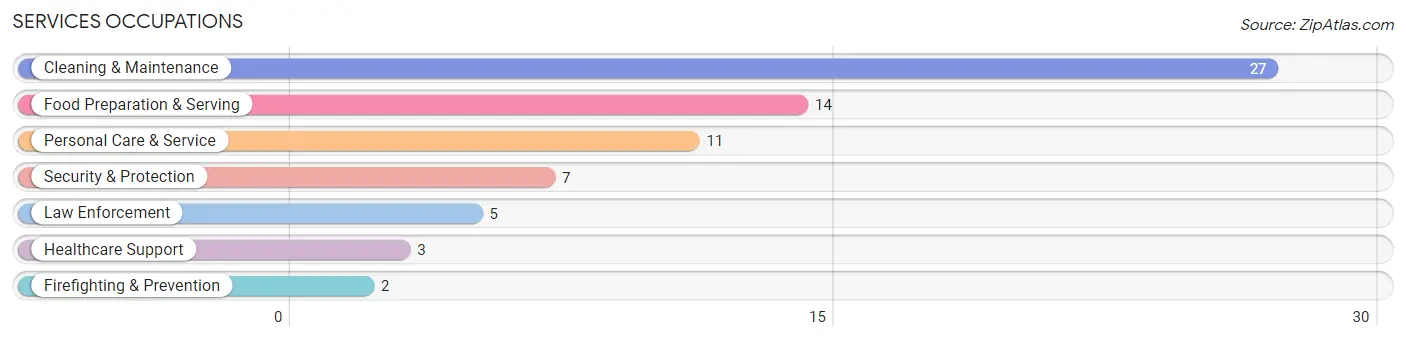
Services Occupations
The most common Services occupations in Audubon Park are Cleaning & Maintenance (27 | 3.5%), Food Preparation & Serving (14 | 1.8%), Personal Care & Service (11 | 1.4%), Security & Protection (7 | 0.9%), and Law Enforcement (5 | 0.6%).
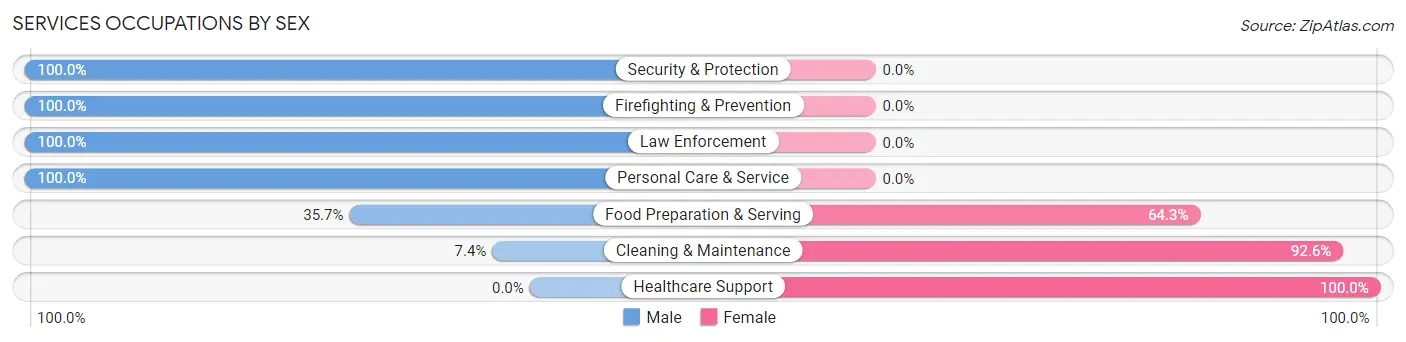
Services Occupations by Sex
Within the Services occupations in Audubon Park, the most male-oriented occupations are Security & Protection (100.0%), Firefighting & Prevention (100.0%), and Law Enforcement (100.0%), while the most female-oriented occupations are Healthcare Support (100.0%), Cleaning & Maintenance (92.6%), and Food Preparation & Serving (64.3%).
| Occupation | Male | Female |
| Healthcare Support | 0 (0.0%) | 3 (100.0%) |
| Security & Protection | 7 (100.0%) | 0 (0.0%) |
| Firefighting & Prevention | 2 (100.0%) | 0 (0.0%) |
| Law Enforcement | 5 (100.0%) | 0 (0.0%) |
| Food Preparation & Serving | 5 (35.7%) | 9 (64.3%) |
| Cleaning & Maintenance | 2 (7.4%) | 25 (92.6%) |
| Personal Care & Service | 11 (100.0%) | 0 (0.0%) |
| Total (Category) | 25 (40.3%) | 37 (59.7%) |
| Total (Overall) | 393 (50.2%) | 390 (49.8%) |
Sales and Office Occupations
The most common Sales and Office occupations in Audubon Park are Sales & Related (82 | 10.5%), and Office & Administration (70 | 8.9%).
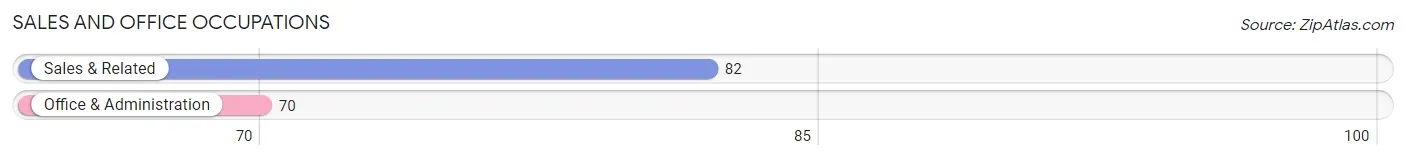
Sales and Office Occupations by Sex
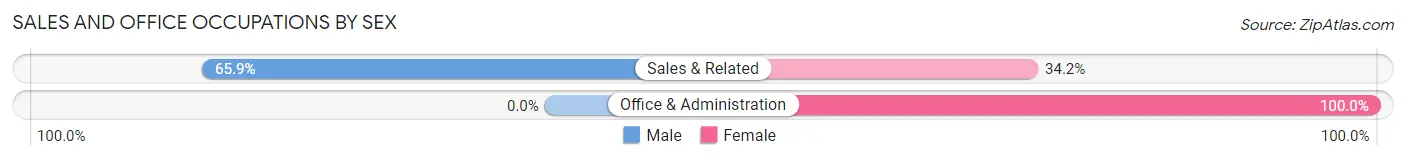
| Occupation | Male | Female |
| Sales & Related | 54 (65.8%) | 28 (34.2%) |
| Office & Administration | 0 (0.0%) | 70 (100.0%) |
| Total (Category) | 54 (35.5%) | 98 (64.5%) |
| Total (Overall) | 393 (50.2%) | 390 (49.8%) |
Natural Resources, Construction and Maintenance Occupations
The most common Natural Resources, Construction and Maintenance occupations in Audubon Park are Installation, Maintenance & Repair (63 | 8.1%), and Construction & Extraction (11 | 1.4%).
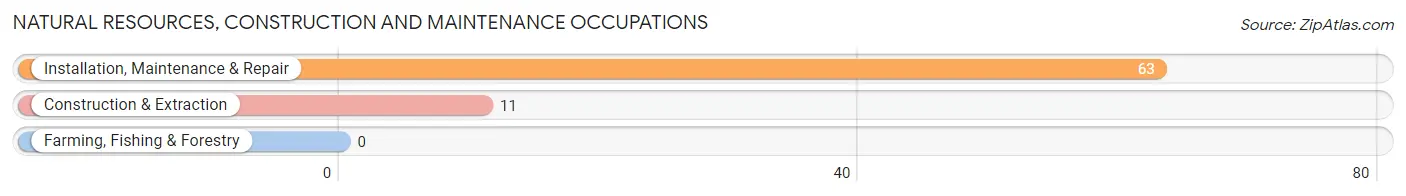
Natural Resources, Construction and Maintenance Occupations by Sex

| Occupation | Male | Female |
| Farming, Fishing & Forestry | 0 (0.0%) | 0 (0.0%) |
| Construction & Extraction | 11 (100.0%) | 0 (0.0%) |
| Installation, Maintenance & Repair | 63 (100.0%) | 0 (0.0%) |
| Total (Category) | 74 (100.0%) | 0 (0.0%) |
| Total (Overall) | 393 (50.2%) | 390 (49.8%) |
Production, Transportation and Moving Occupations
The most common Production, Transportation and Moving occupations in Audubon Park are Material Moving (24 | 3.1%), Transportation (16 | 2.0%), and Production (11 | 1.4%).
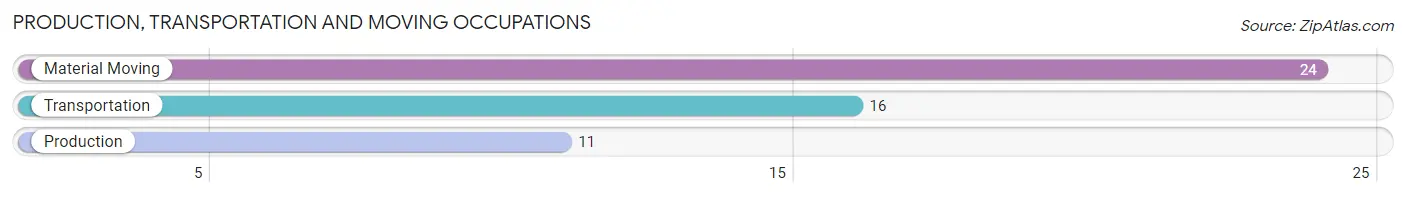
Production, Transportation and Moving Occupations by Sex
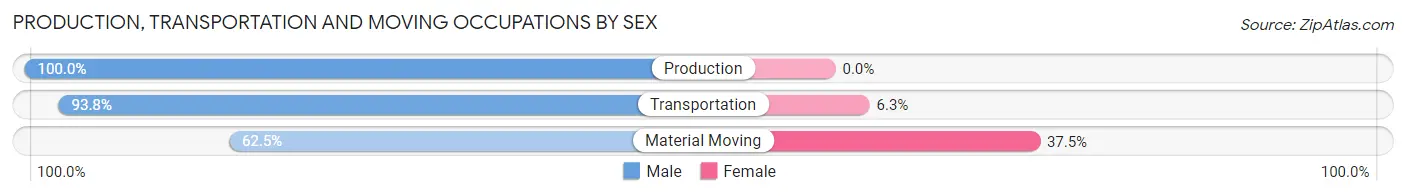
| Occupation | Male | Female |
| Production | 11 (100.0%) | 0 (0.0%) |
| Transportation | 15 (93.8%) | 1 (6.2%) |
| Material Moving | 15 (62.5%) | 9 (37.5%) |
| Total (Category) | 41 (80.4%) | 10 (19.6%) |
| Total (Overall) | 393 (50.2%) | 390 (49.8%) |
Employment Industries by Sex in Audubon Park
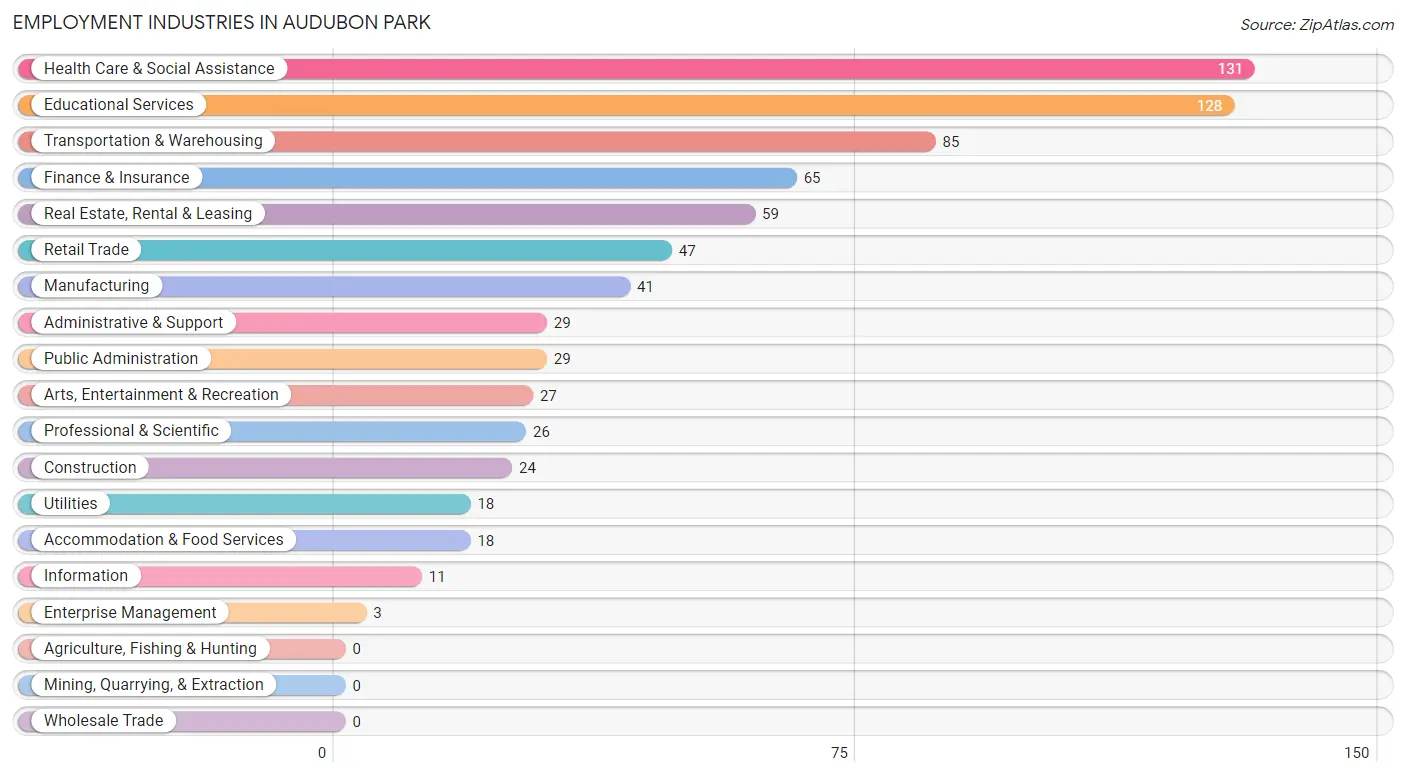
Employment Industries in Audubon Park
The major employment industries in Audubon Park include Health Care & Social Assistance (131 | 16.7%), Educational Services (128 | 16.4%), Transportation & Warehousing (85 | 10.9%), Finance & Insurance (65 | 8.3%), and Real Estate, Rental & Leasing (59 | 7.5%).
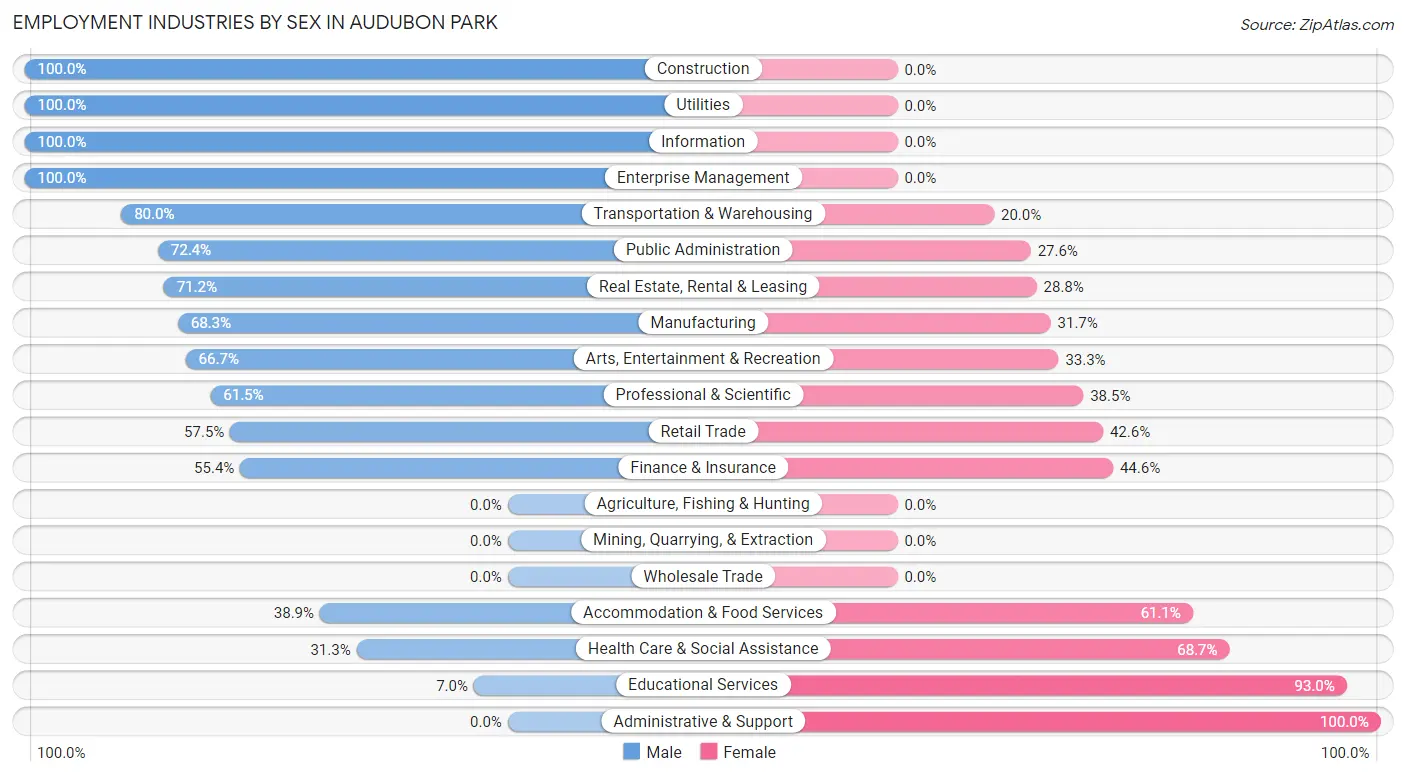
Employment Industries by Sex in Audubon Park
The Audubon Park industries that see more men than women are Construction (100.0%), Utilities (100.0%), and Information (100.0%), whereas the industries that tend to have a higher number of women are Administrative & Support (100.0%), Educational Services (93.0%), and Health Care & Social Assistance (68.7%).
| Industry | Male | Female |
| Agriculture, Fishing & Hunting | 0 (0.0%) | 0 (0.0%) |
| Mining, Quarrying, & Extraction | 0 (0.0%) | 0 (0.0%) |
| Construction | 24 (100.0%) | 0 (0.0%) |
| Manufacturing | 28 (68.3%) | 13 (31.7%) |
| Wholesale Trade | 0 (0.0%) | 0 (0.0%) |
| Retail Trade | 27 (57.5%) | 20 (42.5%) |
| Transportation & Warehousing | 68 (80.0%) | 17 (20.0%) |
| Utilities | 18 (100.0%) | 0 (0.0%) |
| Information | 11 (100.0%) | 0 (0.0%) |
| Finance & Insurance | 36 (55.4%) | 29 (44.6%) |
| Real Estate, Rental & Leasing | 42 (71.2%) | 17 (28.8%) |
| Professional & Scientific | 16 (61.5%) | 10 (38.5%) |
| Enterprise Management | 3 (100.0%) | 0 (0.0%) |
| Administrative & Support | 0 (0.0%) | 29 (100.0%) |
| Educational Services | 9 (7.0%) | 119 (93.0%) |
| Health Care & Social Assistance | 41 (31.3%) | 90 (68.7%) |
| Arts, Entertainment & Recreation | 18 (66.7%) | 9 (33.3%) |
| Accommodation & Food Services | 7 (38.9%) | 11 (61.1%) |
| Public Administration | 21 (72.4%) | 8 (27.6%) |
| Total | 393 (50.2%) | 390 (49.8%) |
Education in Audubon Park
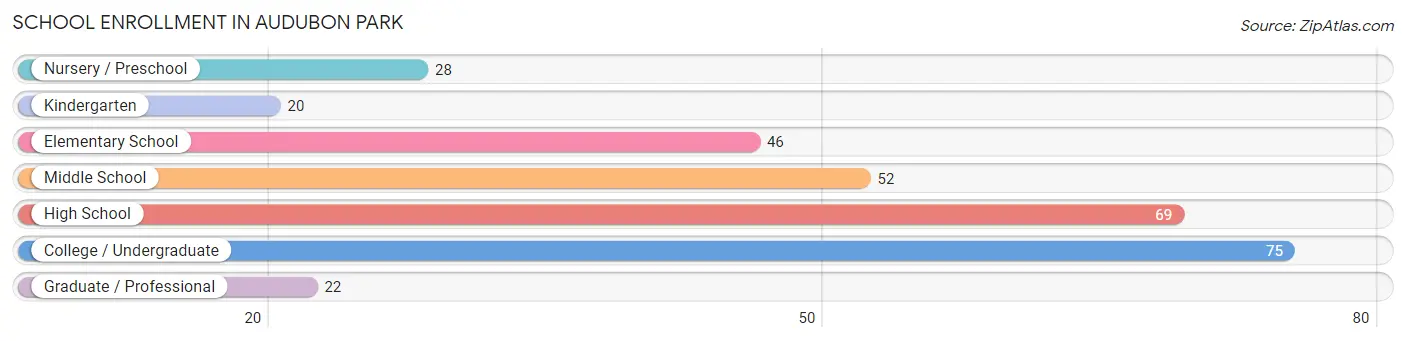
School Enrollment in Audubon Park
The most common levels of schooling among the 312 students in Audubon Park are college / undergraduate (75 | 24.0%), high school (69 | 22.1%), and middle school (52 | 16.7%).
| School Level | # Students | % Students |
| Nursery / Preschool | 28 | 9.0% |
| Kindergarten | 20 | 6.4% |
| Elementary School | 46 | 14.7% |
| Middle School | 52 | 16.7% |
| High School | 69 | 22.1% |
| College / Undergraduate | 75 | 24.0% |
| Graduate / Professional | 22 | 7.0% |
| Total | 312 | 100.0% |
School Enrollment by Age by Funding Source in Audubon Park
Out of a total of 312 students who are enrolled in schools in Audubon Park, 179 (57.4%) attend a private institution, while the remaining 133 (42.6%) are enrolled in public schools. The age group of 3 to 4 year olds has the highest likelihood of being enrolled in private schools, with 12 (100.0% in the age bracket) enrolled. Conversely, the age group of 35 years and over has the lowest likelihood of being enrolled in a private school, with 30 (100.0% in the age bracket) attending a public institution.
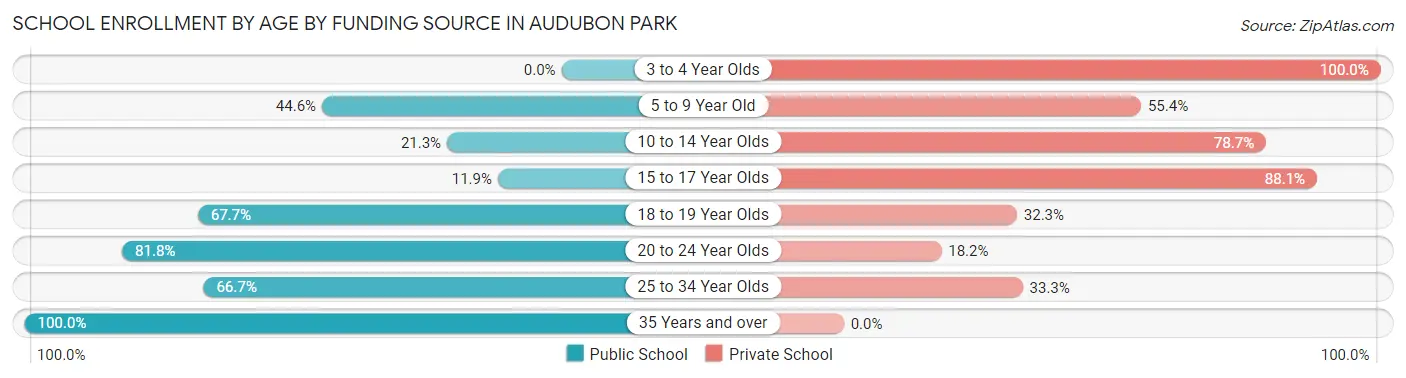
| Age Bracket | Public School | Private School |
| 3 to 4 Year Olds | 0 (0.0%) | 12 (100.0%) |
| 5 to 9 Year Old | 29 (44.6%) | 36 (55.4%) |
| 10 to 14 Year Olds | 16 (21.3%) | 59 (78.7%) |
| 15 to 17 Year Olds | 7 (11.9%) | 52 (88.1%) |
| 18 to 19 Year Olds | 21 (67.7%) | 10 (32.3%) |
| 20 to 24 Year Olds | 18 (81.8%) | 4 (18.2%) |
| 25 to 34 Year Olds | 12 (66.7%) | 6 (33.3%) |
| 35 Years and over | 30 (100.0%) | 0 (0.0%) |
| Total | 133 (42.6%) | 179 (57.4%) |
Educational Attainment by Field of Study in Audubon Park
Business (159 | 23.6%), science & technology (85 | 12.6%), literature & languages (55 | 8.2%), bio, nature & agricultural (53 | 7.9%), and communications (51 | 7.6%) are the most common fields of study among 675 individuals in Audubon Park who have obtained a bachelor's degree or higher.
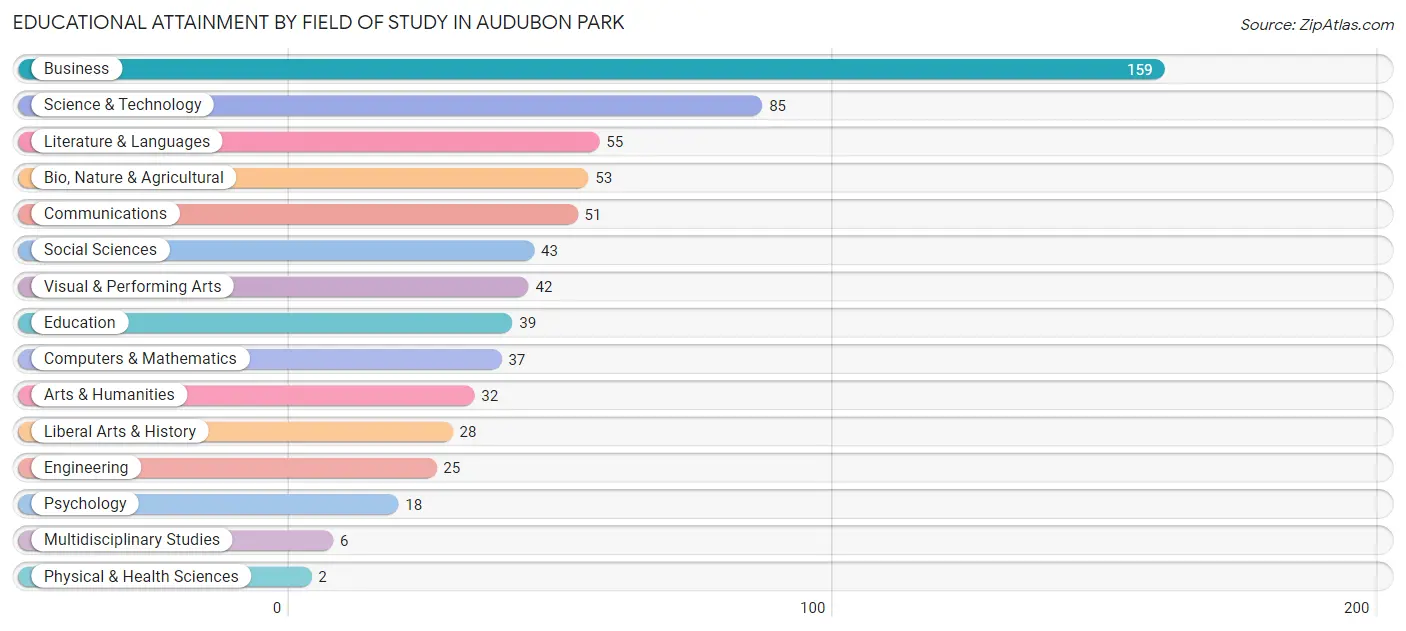
| Field of Study | # Graduates | % Graduates |
| Computers & Mathematics | 37 | 5.5% |
| Bio, Nature & Agricultural | 53 | 7.9% |
| Physical & Health Sciences | 2 | 0.3% |
| Psychology | 18 | 2.7% |
| Social Sciences | 43 | 6.4% |
| Engineering | 25 | 3.7% |
| Multidisciplinary Studies | 6 | 0.9% |
| Science & Technology | 85 | 12.6% |
| Business | 159 | 23.6% |
| Education | 39 | 5.8% |
| Literature & Languages | 55 | 8.2% |
| Liberal Arts & History | 28 | 4.2% |
| Visual & Performing Arts | 42 | 6.2% |
| Communications | 51 | 7.6% |
| Arts & Humanities | 32 | 4.7% |
| Total | 675 | 100.0% |
Transportation & Commute in Audubon Park
Vehicle Availability by Sex in Audubon Park
The most prevalent vehicle ownership categories in Audubon Park are males with 2 vehicles (193, accounting for 48.9%) and females with 2 vehicles (150, making up 50.0%).
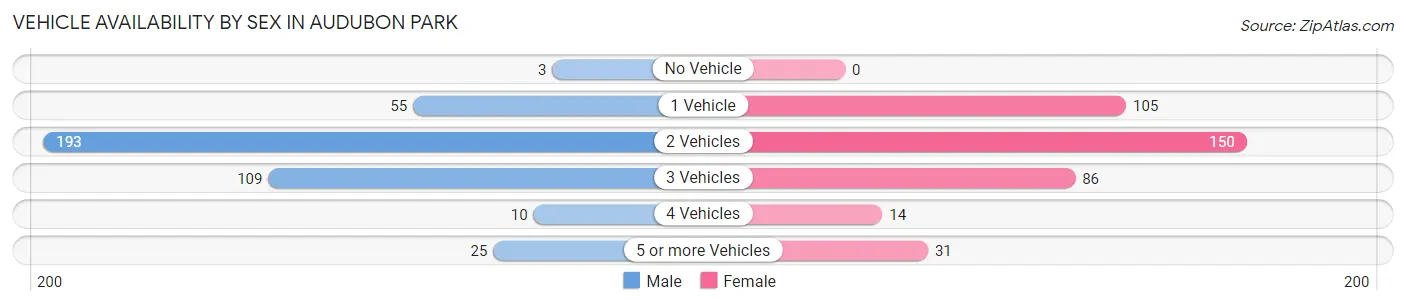
| Vehicles Available | Male | Female |
| No Vehicle | 3 (0.8%) | 0 (0.0%) |
| 1 Vehicle | 55 (13.9%) | 105 (27.2%) |
| 2 Vehicles | 193 (48.9%) | 150 (38.9%) |
| 3 Vehicles | 109 (27.6%) | 86 (22.3%) |
| 4 Vehicles | 10 (2.5%) | 14 (3.6%) |
| 5 or more Vehicles | 25 (6.3%) | 31 (8.0%) |
| Total | 395 (100.0%) | 386 (100.0%) |
Commute Time in Audubon Park
The most frequently occuring commute durations in Audubon Park are 15 to 19 minutes (281 commuters, 39.1%), 20 to 24 minutes (114 commuters, 15.9%), and 10 to 14 minutes (108 commuters, 15.0%).
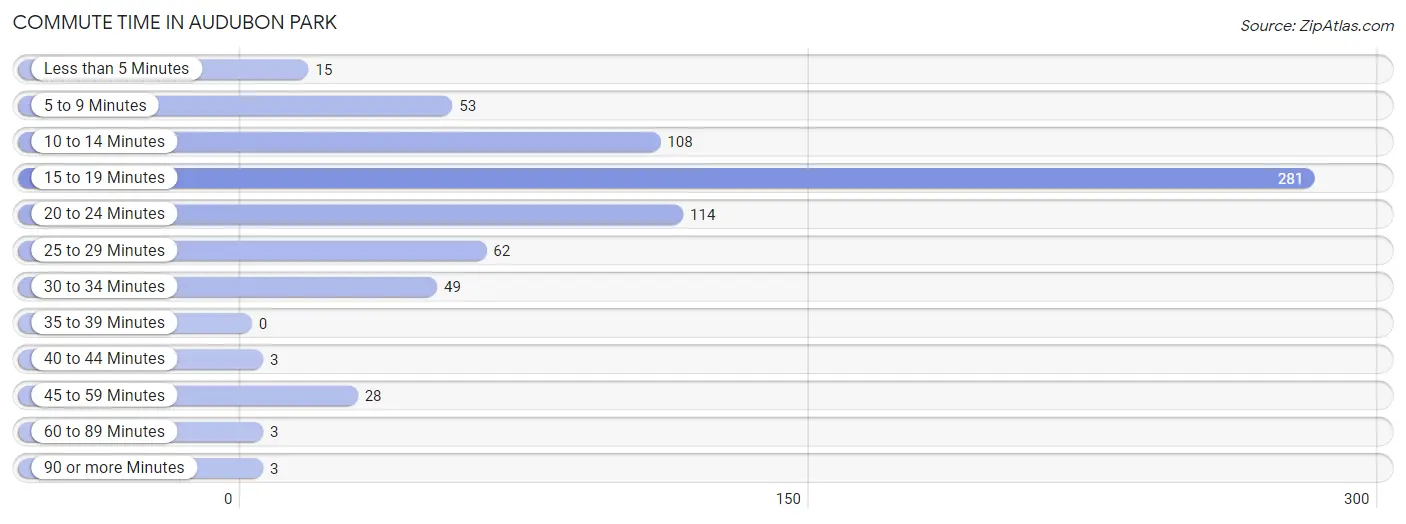
| Commute Time | # Commuters | % Commuters |
| Less than 5 Minutes | 15 | 2.1% |
| 5 to 9 Minutes | 53 | 7.4% |
| 10 to 14 Minutes | 108 | 15.0% |
| 15 to 19 Minutes | 281 | 39.1% |
| 20 to 24 Minutes | 114 | 15.9% |
| 25 to 29 Minutes | 62 | 8.6% |
| 30 to 34 Minutes | 49 | 6.8% |
| 35 to 39 Minutes | 0 | 0.0% |
| 40 to 44 Minutes | 3 | 0.4% |
| 45 to 59 Minutes | 28 | 3.9% |
| 60 to 89 Minutes | 3 | 0.4% |
| 90 or more Minutes | 3 | 0.4% |
Commute Time by Sex in Audubon Park
The most common commute times in Audubon Park are 15 to 19 minutes (123 commuters, 32.5%) for males and 15 to 19 minutes (158 commuters, 46.5%) for females.
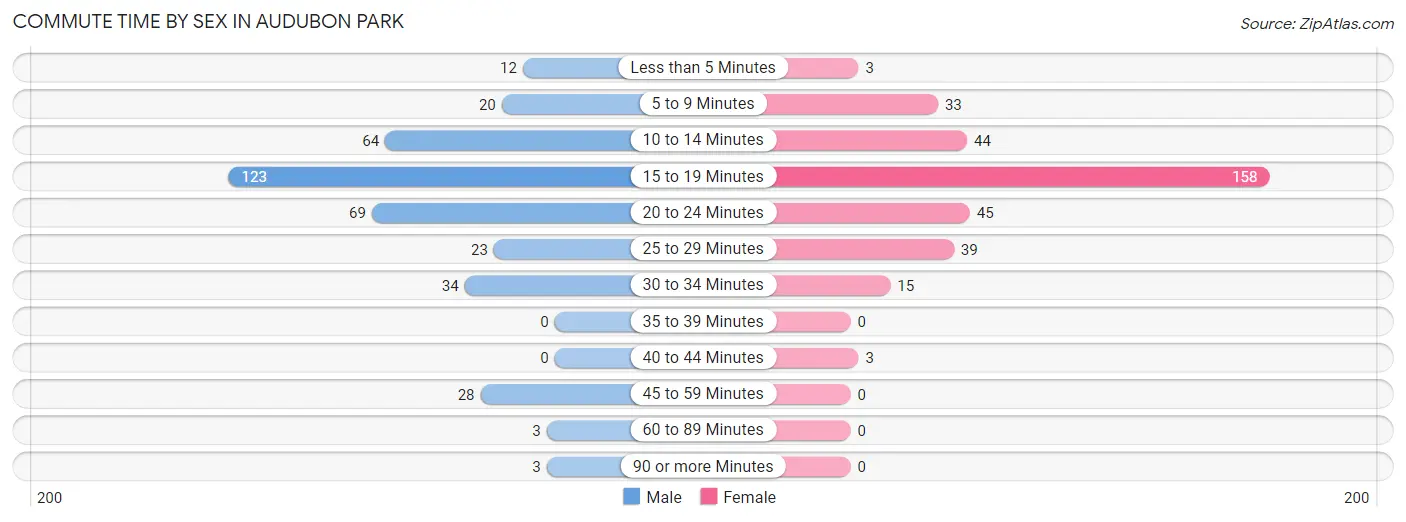
| Commute Time | Male | Female |
| Less than 5 Minutes | 12 (3.2%) | 3 (0.9%) |
| 5 to 9 Minutes | 20 (5.3%) | 33 (9.7%) |
| 10 to 14 Minutes | 64 (16.9%) | 44 (12.9%) |
| 15 to 19 Minutes | 123 (32.5%) | 158 (46.5%) |
| 20 to 24 Minutes | 69 (18.2%) | 45 (13.2%) |
| 25 to 29 Minutes | 23 (6.1%) | 39 (11.5%) |
| 30 to 34 Minutes | 34 (9.0%) | 15 (4.4%) |
| 35 to 39 Minutes | 0 (0.0%) | 0 (0.0%) |
| 40 to 44 Minutes | 0 (0.0%) | 3 (0.9%) |
| 45 to 59 Minutes | 28 (7.4%) | 0 (0.0%) |
| 60 to 89 Minutes | 3 (0.8%) | 0 (0.0%) |
| 90 or more Minutes | 3 (0.8%) | 0 (0.0%) |
Time of Departure to Work by Sex in Audubon Park
The most frequent times of departure to work in Audubon Park are 7:00 AM to 7:29 AM (113, 29.8%) for males and 8:00 AM to 8:29 AM (95, 27.9%) for females.
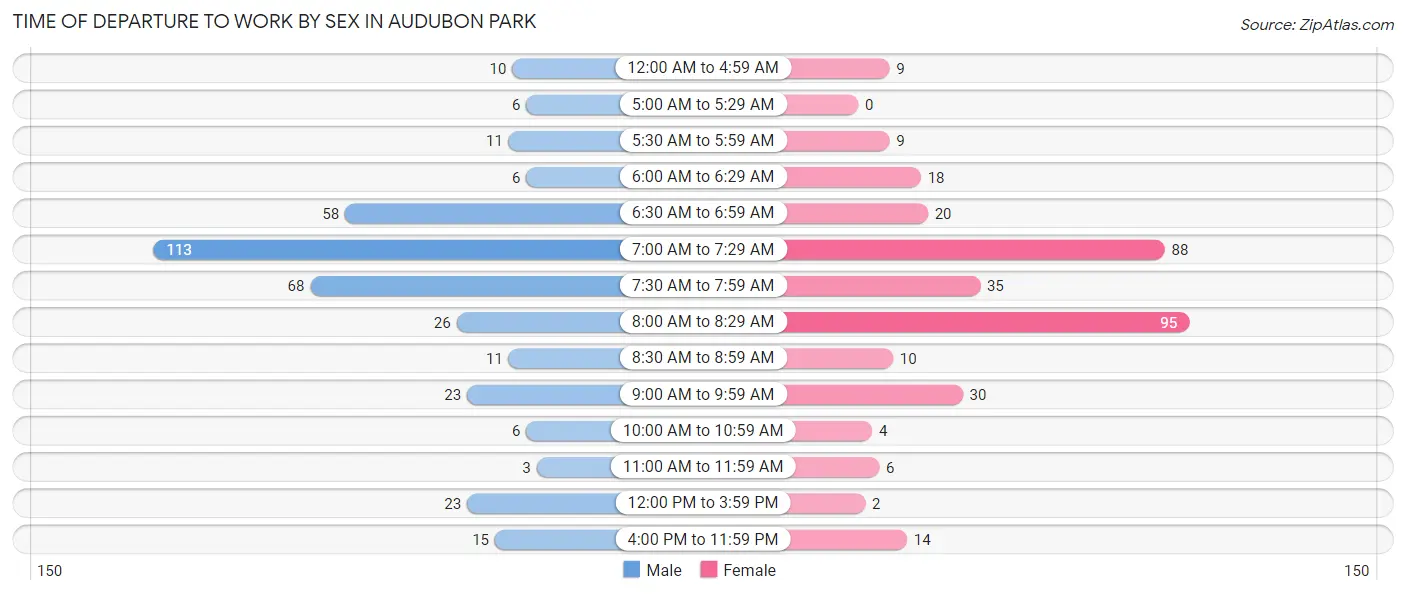
| Time of Departure | Male | Female |
| 12:00 AM to 4:59 AM | 10 (2.6%) | 9 (2.6%) |
| 5:00 AM to 5:29 AM | 6 (1.6%) | 0 (0.0%) |
| 5:30 AM to 5:59 AM | 11 (2.9%) | 9 (2.6%) |
| 6:00 AM to 6:29 AM | 6 (1.6%) | 18 (5.3%) |
| 6:30 AM to 6:59 AM | 58 (15.3%) | 20 (5.9%) |
| 7:00 AM to 7:29 AM | 113 (29.8%) | 88 (25.9%) |
| 7:30 AM to 7:59 AM | 68 (17.9%) | 35 (10.3%) |
| 8:00 AM to 8:29 AM | 26 (6.9%) | 95 (27.9%) |
| 8:30 AM to 8:59 AM | 11 (2.9%) | 10 (2.9%) |
| 9:00 AM to 9:59 AM | 23 (6.1%) | 30 (8.8%) |
| 10:00 AM to 10:59 AM | 6 (1.6%) | 4 (1.2%) |
| 11:00 AM to 11:59 AM | 3 (0.8%) | 6 (1.8%) |
| 12:00 PM to 3:59 PM | 23 (6.1%) | 2 (0.6%) |
| 4:00 PM to 11:59 PM | 15 (4.0%) | 14 (4.1%) |
| Total | 379 (100.0%) | 340 (100.0%) |
Housing Occupancy in Audubon Park
Occupancy by Ownership in Audubon Park
Of the total 598 dwellings in Audubon Park, owner-occupied units account for 496 (82.9%), while renter-occupied units make up 102 (17.1%).
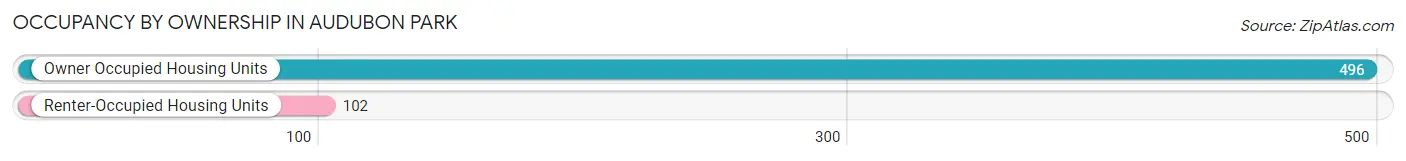
| Occupancy | # Housing Units | % Housing Units |
| Owner Occupied Housing Units | 496 | 82.9% |
| Renter-Occupied Housing Units | 102 | 17.1% |
| Total Occupied Housing Units | 598 | 100.0% |
Occupancy by Household Size in Audubon Park
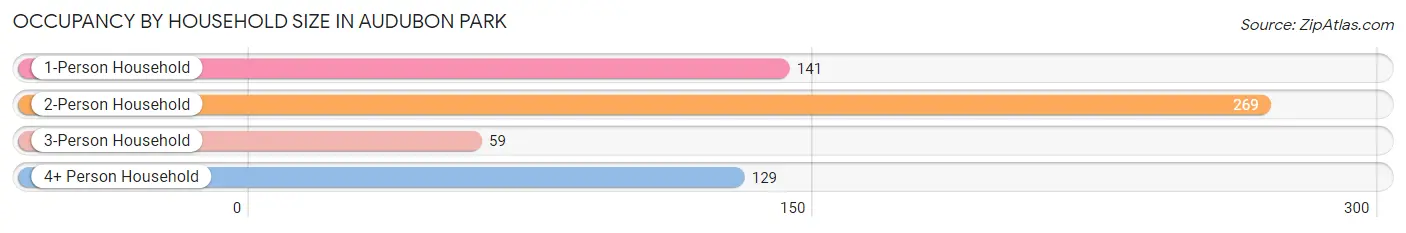
| Household Size | # Housing Units | % Housing Units |
| 1-Person Household | 141 | 23.6% |
| 2-Person Household | 269 | 45.0% |
| 3-Person Household | 59 | 9.9% |
| 4+ Person Household | 129 | 21.6% |
| Total Housing Units | 598 | 100.0% |
Occupancy by Ownership by Household Size in Audubon Park
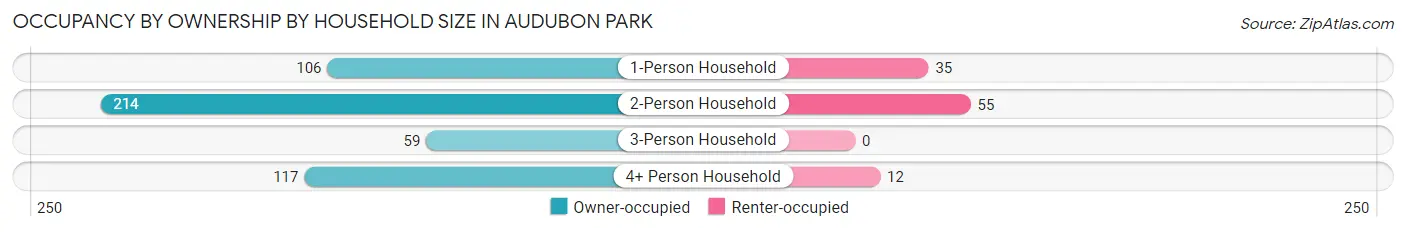
| Household Size | Owner-occupied | Renter-occupied |
| 1-Person Household | 106 (75.2%) | 35 (24.8%) |
| 2-Person Household | 214 (79.5%) | 55 (20.4%) |
| 3-Person Household | 59 (100.0%) | 0 (0.0%) |
| 4+ Person Household | 117 (90.7%) | 12 (9.3%) |
| Total Housing Units | 496 (82.9%) | 102 (17.1%) |
Occupancy by Educational Attainment in Audubon Park
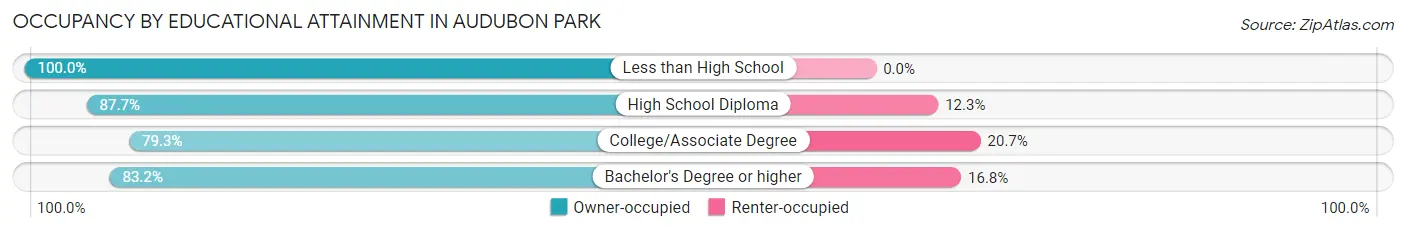
| Household Size | Owner-occupied | Renter-occupied |
| Less than High School | 7 (100.0%) | 0 (0.0%) |
| High School Diploma | 57 (87.7%) | 8 (12.3%) |
| College/Associate Degree | 111 (79.3%) | 29 (20.7%) |
| Bachelor's Degree or higher | 321 (83.2%) | 65 (16.8%) |
Occupancy by Age of Householder in Audubon Park
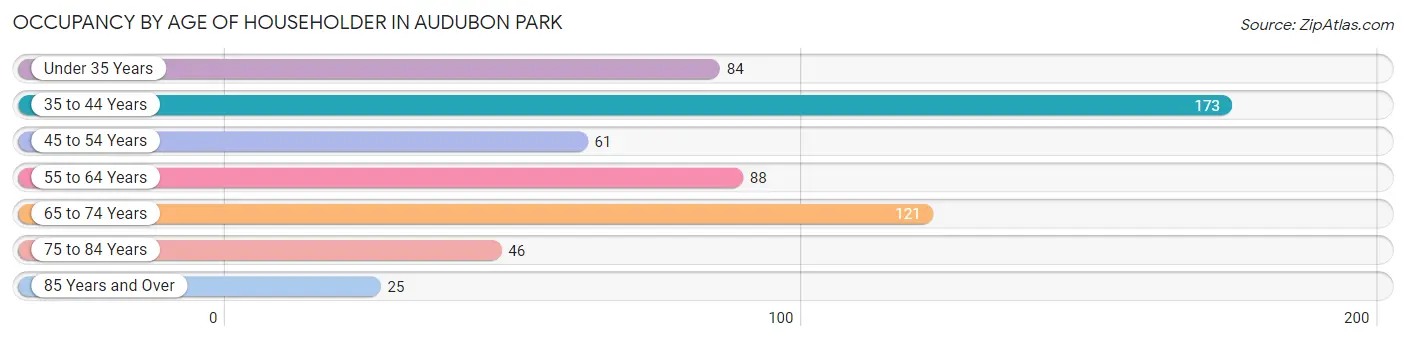
| Age Bracket | # Households | % Households |
| Under 35 Years | 84 | 14.1% |
| 35 to 44 Years | 173 | 28.9% |
| 45 to 54 Years | 61 | 10.2% |
| 55 to 64 Years | 88 | 14.7% |
| 65 to 74 Years | 121 | 20.2% |
| 75 to 84 Years | 46 | 7.7% |
| 85 Years and Over | 25 | 4.2% |
| Total | 598 | 100.0% |
Housing Finances in Audubon Park
Median Income by Occupancy in Audubon Park
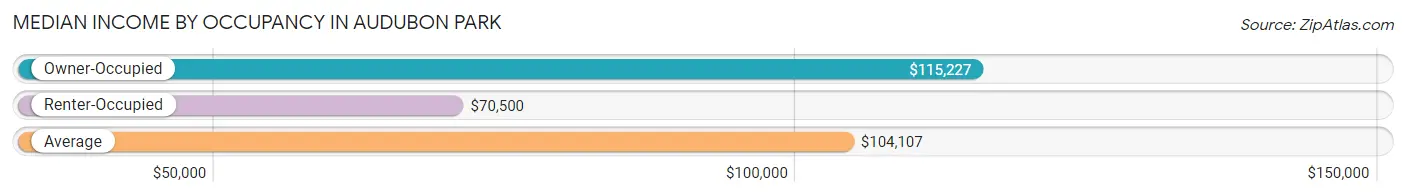
| Occupancy Type | # Households | Median Income |
| Owner-Occupied | 496 (82.9%) | $115,227 |
| Renter-Occupied | 102 (17.1%) | $70,500 |
| Average | 598 (100.0%) | $104,107 |
Occupancy by Householder Income Bracket in Audubon Park
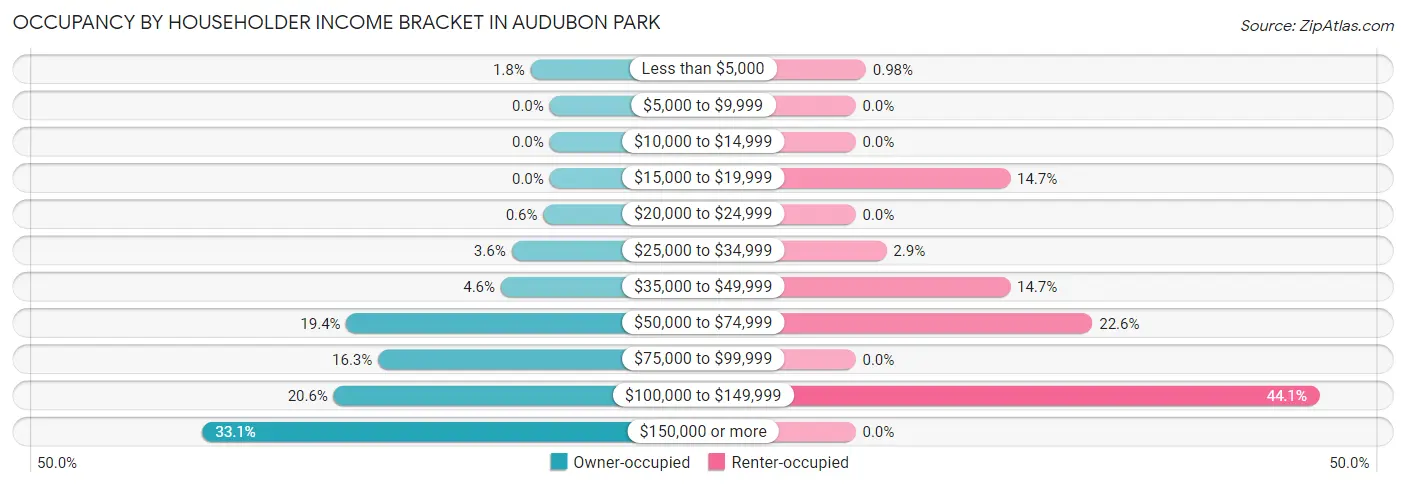
| Income Bracket | Owner-occupied | Renter-occupied |
| Less than $5,000 | 9 (1.8%) | 1 (1.0%) |
| $5,000 to $9,999 | 0 (0.0%) | 0 (0.0%) |
| $10,000 to $14,999 | 0 (0.0%) | 0 (0.0%) |
| $15,000 to $19,999 | 0 (0.0%) | 15 (14.7%) |
| $20,000 to $24,999 | 3 (0.6%) | 0 (0.0%) |
| $25,000 to $34,999 | 18 (3.6%) | 3 (2.9%) |
| $35,000 to $49,999 | 23 (4.6%) | 15 (14.7%) |
| $50,000 to $74,999 | 96 (19.4%) | 23 (22.6%) |
| $75,000 to $99,999 | 81 (16.3%) | 0 (0.0%) |
| $100,000 to $149,999 | 102 (20.6%) | 45 (44.1%) |
| $150,000 or more | 164 (33.1%) | 0 (0.0%) |
| Total | 496 (100.0%) | 102 (100.0%) |
Monthly Housing Cost Tiers in Audubon Park
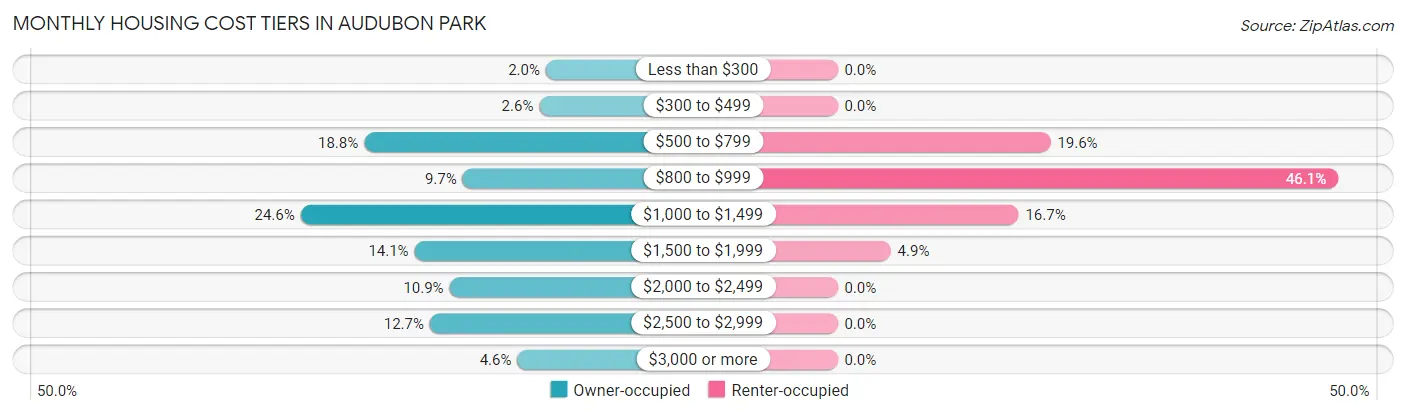
| Monthly Cost | Owner-occupied | Renter-occupied |
| Less than $300 | 10 (2.0%) | 0 (0.0%) |
| $300 to $499 | 13 (2.6%) | 0 (0.0%) |
| $500 to $799 | 93 (18.8%) | 20 (19.6%) |
| $800 to $999 | 48 (9.7%) | 47 (46.1%) |
| $1,000 to $1,499 | 122 (24.6%) | 17 (16.7%) |
| $1,500 to $1,999 | 70 (14.1%) | 5 (4.9%) |
| $2,000 to $2,499 | 54 (10.9%) | 0 (0.0%) |
| $2,500 to $2,999 | 63 (12.7%) | 0 (0.0%) |
| $3,000 or more | 23 (4.6%) | 0 (0.0%) |
| Total | 496 (100.0%) | 102 (100.0%) |
Physical Housing Characteristics in Audubon Park
Housing Structures in Audubon Park
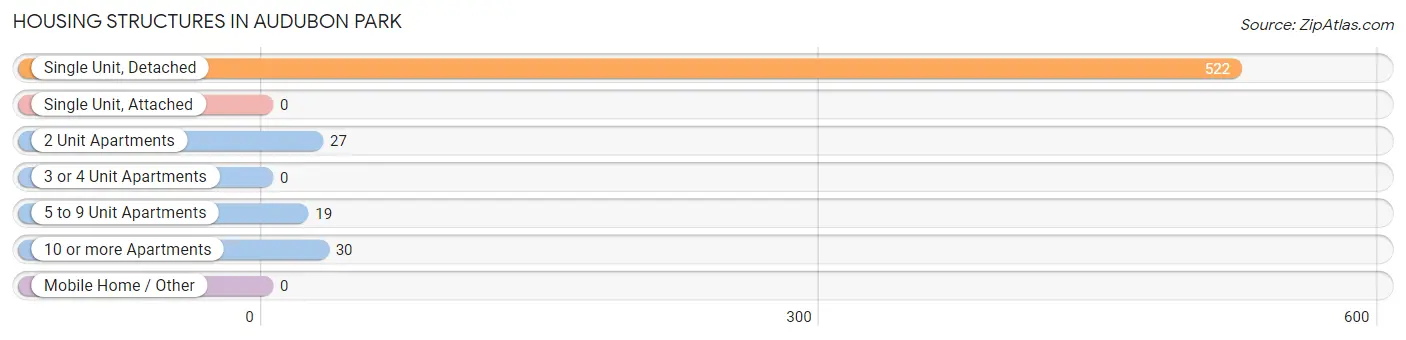
| Structure Type | # Housing Units | % Housing Units |
| Single Unit, Detached | 522 | 87.3% |
| Single Unit, Attached | 0 | 0.0% |
| 2 Unit Apartments | 27 | 4.5% |
| 3 or 4 Unit Apartments | 0 | 0.0% |
| 5 to 9 Unit Apartments | 19 | 3.2% |
| 10 or more Apartments | 30 | 5.0% |
| Mobile Home / Other | 0 | 0.0% |
| Total | 598 | 100.0% |
Housing Structures by Occupancy in Audubon Park
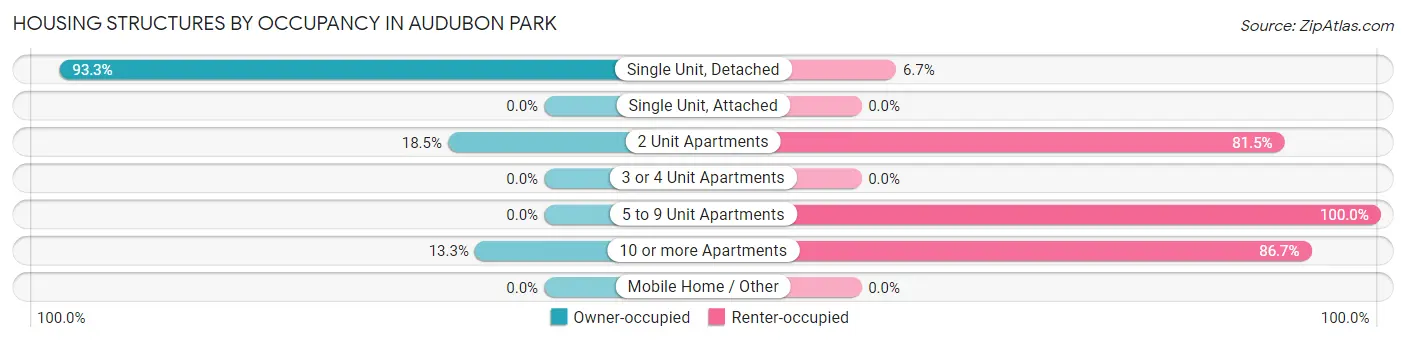
| Structure Type | Owner-occupied | Renter-occupied |
| Single Unit, Detached | 487 (93.3%) | 35 (6.7%) |
| Single Unit, Attached | 0 (0.0%) | 0 (0.0%) |
| 2 Unit Apartments | 5 (18.5%) | 22 (81.5%) |
| 3 or 4 Unit Apartments | 0 (0.0%) | 0 (0.0%) |
| 5 to 9 Unit Apartments | 0 (0.0%) | 19 (100.0%) |
| 10 or more Apartments | 4 (13.3%) | 26 (86.7%) |
| Mobile Home / Other | 0 (0.0%) | 0 (0.0%) |
| Total | 496 (82.9%) | 102 (17.1%) |
Housing Structures by Number of Rooms in Audubon Park
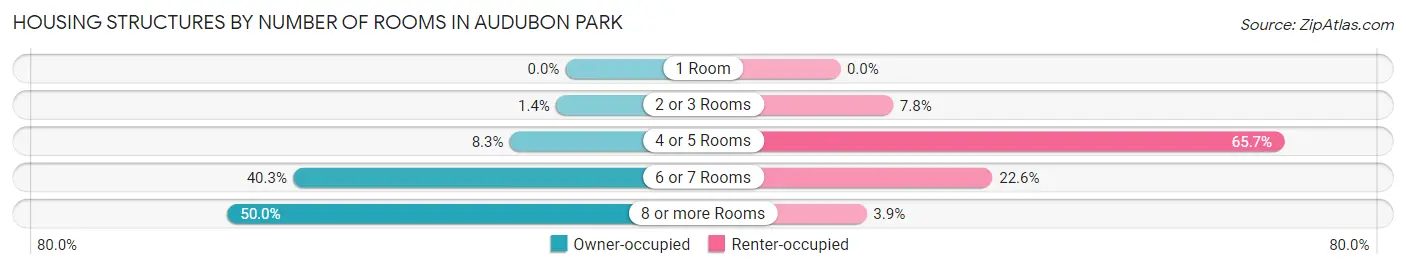
| Number of Rooms | Owner-occupied | Renter-occupied |
| 1 Room | 0 (0.0%) | 0 (0.0%) |
| 2 or 3 Rooms | 7 (1.4%) | 8 (7.8%) |
| 4 or 5 Rooms | 41 (8.3%) | 67 (65.7%) |
| 6 or 7 Rooms | 200 (40.3%) | 23 (22.6%) |
| 8 or more Rooms | 248 (50.0%) | 4 (3.9%) |
| Total | 496 (100.0%) | 102 (100.0%) |
Housing Structure by Heating Type in Audubon Park
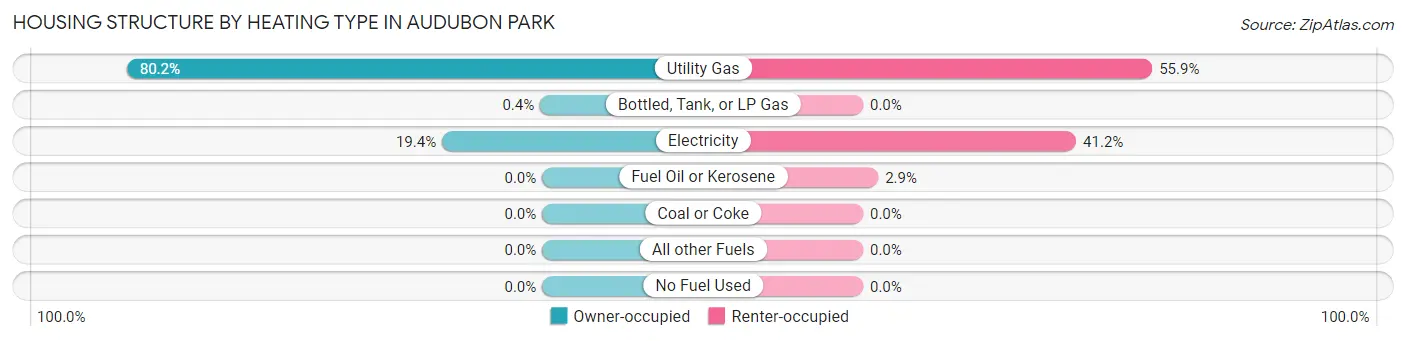
| Heating Type | Owner-occupied | Renter-occupied |
| Utility Gas | 398 (80.2%) | 57 (55.9%) |
| Bottled, Tank, or LP Gas | 2 (0.4%) | 0 (0.0%) |
| Electricity | 96 (19.4%) | 42 (41.2%) |
| Fuel Oil or Kerosene | 0 (0.0%) | 3 (2.9%) |
| Coal or Coke | 0 (0.0%) | 0 (0.0%) |
| All other Fuels | 0 (0.0%) | 0 (0.0%) |
| No Fuel Used | 0 (0.0%) | 0 (0.0%) |
| Total | 496 (100.0%) | 102 (100.0%) |
Household Vehicle Usage in Audubon Park
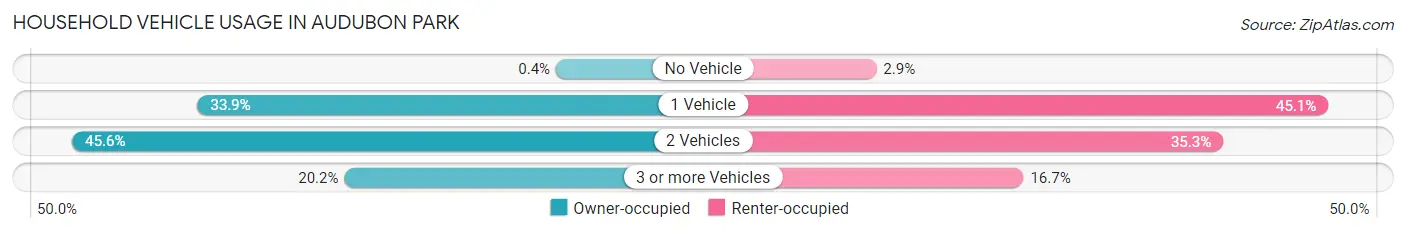
| Vehicles per Household | Owner-occupied | Renter-occupied |
| No Vehicle | 2 (0.4%) | 3 (2.9%) |
| 1 Vehicle | 168 (33.9%) | 46 (45.1%) |
| 2 Vehicles | 226 (45.6%) | 36 (35.3%) |
| 3 or more Vehicles | 100 (20.2%) | 17 (16.7%) |
| Total | 496 (100.0%) | 102 (100.0%) |
Real Estate & Mortgages in Audubon Park
Real Estate and Mortgage Overview in Audubon Park
| Characteristic | Without Mortgage | With Mortgage |
| Housing Units | 189 | 307 |
| Median Property Value | $328,000 | $330,700 |
| Median Household Income | $76,750 | $121 |
| Monthly Housing Costs | $742 | $23 |
| Real Estate Taxes | $2,650 | $0 |
Property Value by Mortgage Status in Audubon Park
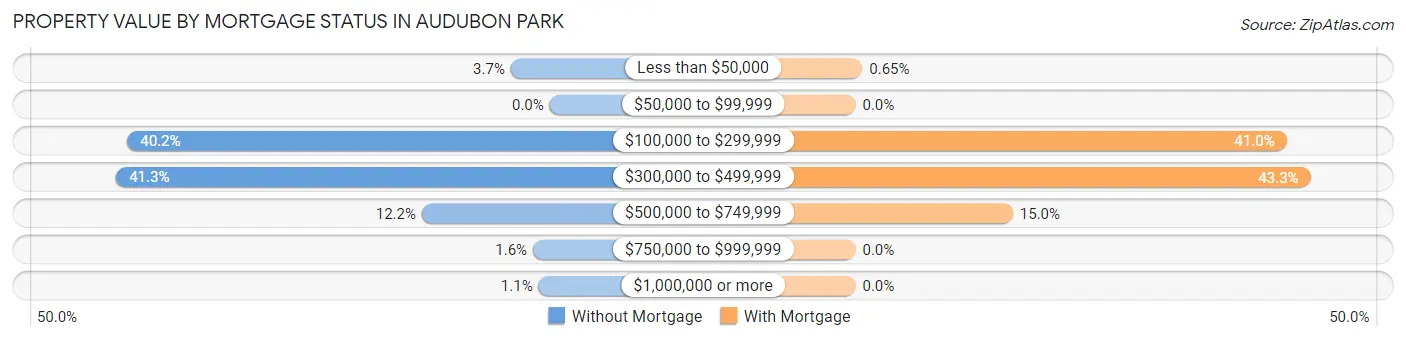
| Property Value | Without Mortgage | With Mortgage |
| Less than $50,000 | 7 (3.7%) | 2 (0.6%) |
| $50,000 to $99,999 | 0 (0.0%) | 0 (0.0%) |
| $100,000 to $299,999 | 76 (40.2%) | 126 (41.0%) |
| $300,000 to $499,999 | 78 (41.3%) | 133 (43.3%) |
| $500,000 to $749,999 | 23 (12.2%) | 46 (15.0%) |
| $750,000 to $999,999 | 3 (1.6%) | 0 (0.0%) |
| $1,000,000 or more | 2 (1.1%) | 0 (0.0%) |
| Total | 189 (100.0%) | 307 (100.0%) |
Household Income by Mortgage Status in Audubon Park
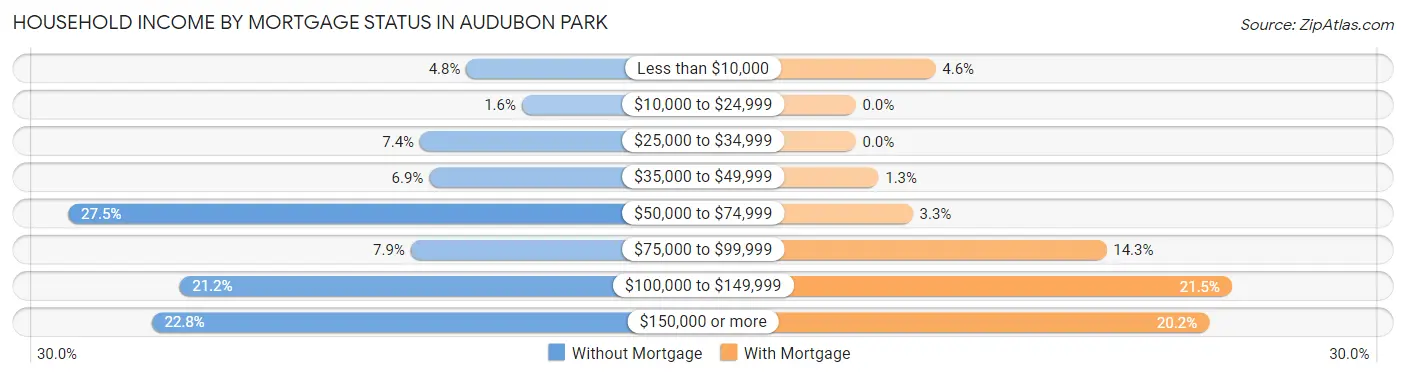
| Household Income | Without Mortgage | With Mortgage |
| Less than $10,000 | 9 (4.8%) | 14 (4.6%) |
| $10,000 to $24,999 | 3 (1.6%) | 0 (0.0%) |
| $25,000 to $34,999 | 14 (7.4%) | 0 (0.0%) |
| $35,000 to $49,999 | 13 (6.9%) | 4 (1.3%) |
| $50,000 to $74,999 | 52 (27.5%) | 10 (3.3%) |
| $75,000 to $99,999 | 15 (7.9%) | 44 (14.3%) |
| $100,000 to $149,999 | 40 (21.2%) | 66 (21.5%) |
| $150,000 or more | 43 (22.8%) | 62 (20.2%) |
| Total | 189 (100.0%) | 307 (100.0%) |
Property Value to Household Income Ratio in Audubon Park
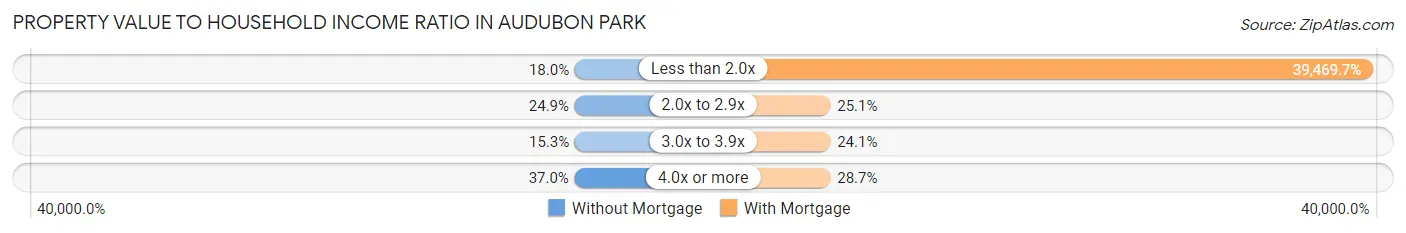
| Value-to-Income Ratio | Without Mortgage | With Mortgage |
| Less than 2.0x | 34 (18.0%) | 121,172 (39,469.7%) |
| 2.0x to 2.9x | 47 (24.9%) | 77 (25.1%) |
| 3.0x to 3.9x | 29 (15.3%) | 74 (24.1%) |
| 4.0x or more | 70 (37.0%) | 88 (28.7%) |
| Total | 189 (100.0%) | 307 (100.0%) |
Real Estate Taxes by Mortgage Status in Audubon Park
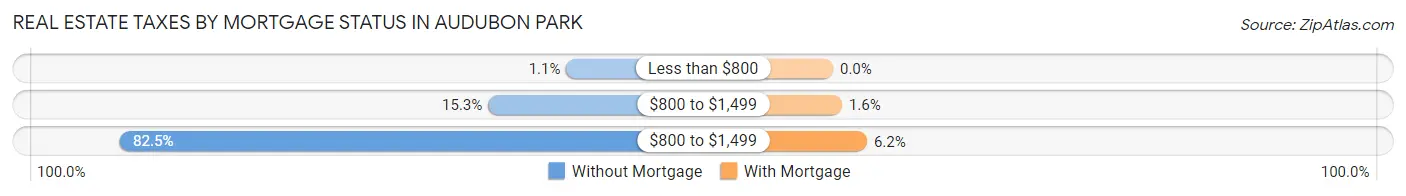
| Property Taxes | Without Mortgage | With Mortgage |
| Less than $800 | 2 (1.1%) | 0 (0.0%) |
| $800 to $1,499 | 29 (15.3%) | 5 (1.6%) |
| $800 to $1,499 | 156 (82.5%) | 19 (6.2%) |
| Total | 189 (100.0%) | 307 (100.0%) |
Health & Disability in Audubon Park
Health Insurance Coverage by Age in Audubon Park
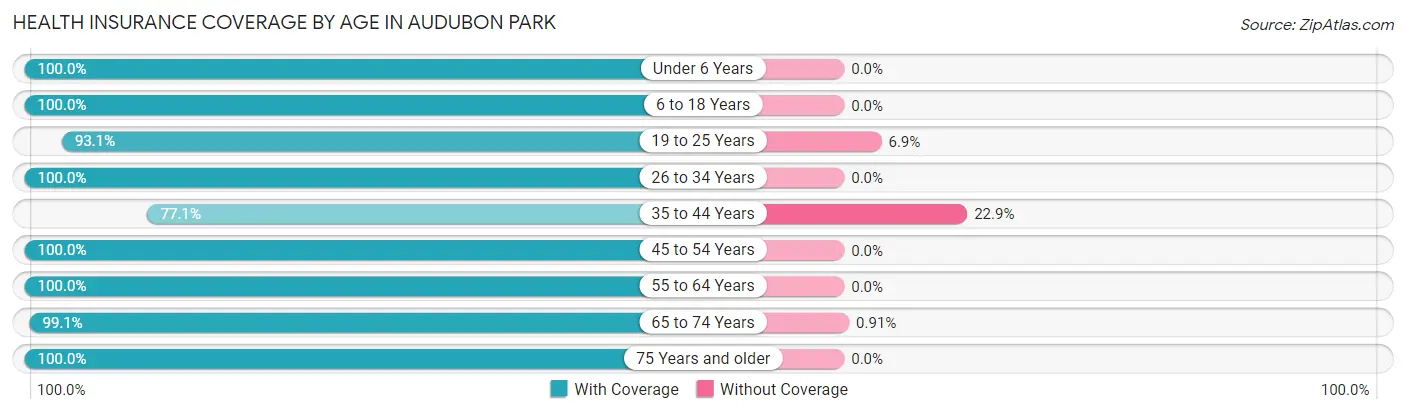
| Age Bracket | With Coverage | Without Coverage |
| Under 6 Years | 132 (100.0%) | 0 (0.0%) |
| 6 to 18 Years | 199 (100.0%) | 0 (0.0%) |
| 19 to 25 Years | 67 (93.1%) | 5 (6.9%) |
| 26 to 34 Years | 138 (100.0%) | 0 (0.0%) |
| 35 to 44 Years | 205 (77.1%) | 61 (22.9%) |
| 45 to 54 Years | 121 (100.0%) | 0 (0.0%) |
| 55 to 64 Years | 161 (100.0%) | 0 (0.0%) |
| 65 to 74 Years | 218 (99.1%) | 2 (0.9%) |
| 75 Years and older | 101 (100.0%) | 0 (0.0%) |
| Total | 1,342 (95.2%) | 68 (4.8%) |
Health Insurance Coverage by Citizenship Status in Audubon Park
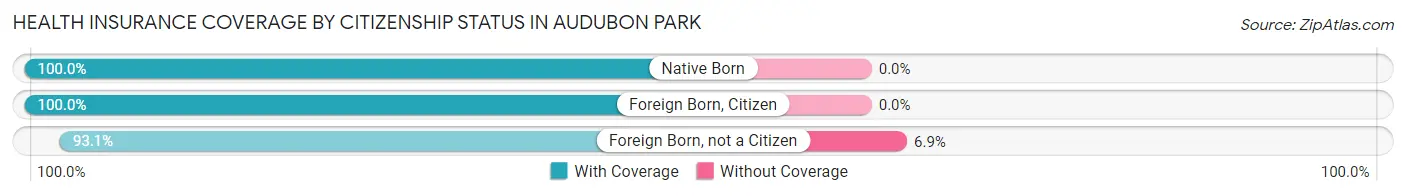
| Citizenship Status | With Coverage | Without Coverage |
| Native Born | 132 (100.0%) | 0 (0.0%) |
| Foreign Born, Citizen | 199 (100.0%) | 0 (0.0%) |
| Foreign Born, not a Citizen | 67 (93.1%) | 5 (6.9%) |
Health Insurance Coverage by Household Income in Audubon Park
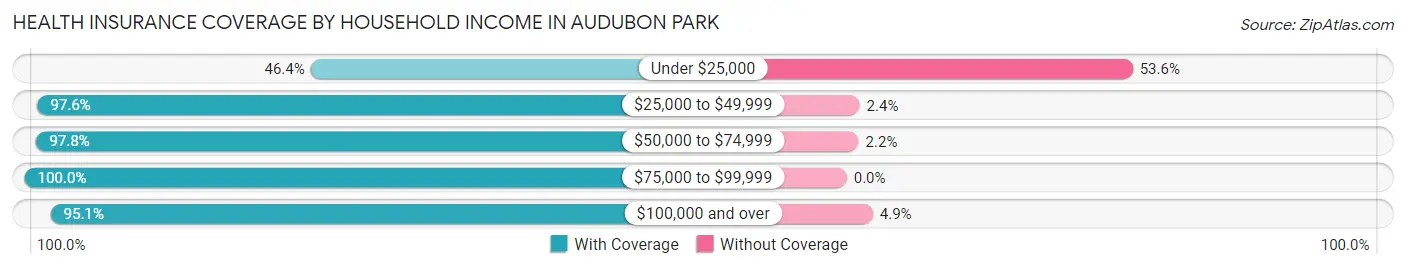
| Household Income | With Coverage | Without Coverage |
| Under $25,000 | 13 (46.4%) | 15 (53.6%) |
| $25,000 to $49,999 | 81 (97.6%) | 2 (2.4%) |
| $50,000 to $74,999 | 220 (97.8%) | 5 (2.2%) |
| $75,000 to $99,999 | 131 (100.0%) | 0 (0.0%) |
| $100,000 and over | 897 (95.1%) | 46 (4.9%) |
Public vs Private Health Insurance Coverage by Age in Audubon Park
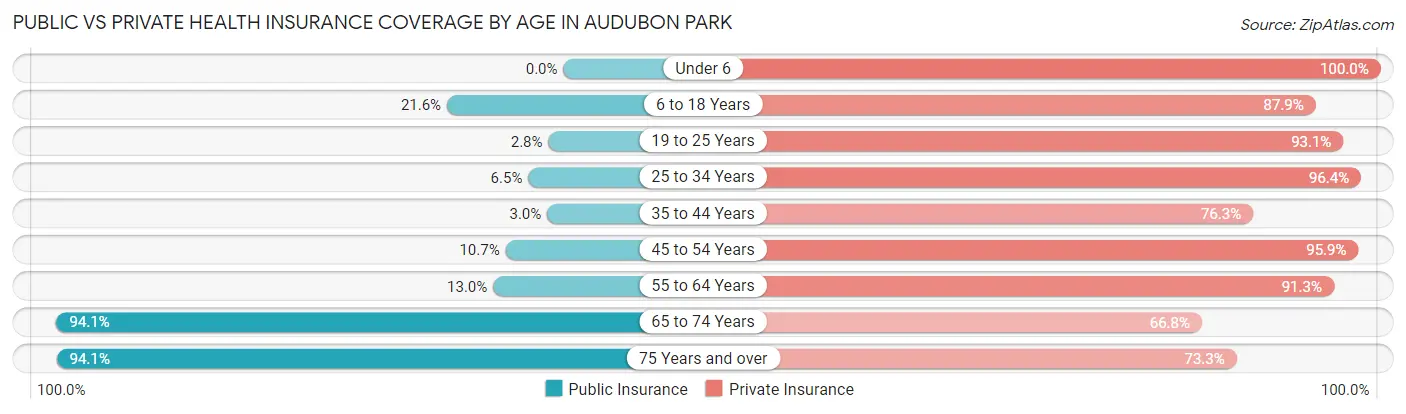
| Age Bracket | Public Insurance | Private Insurance |
| Under 6 | 0 (0.0%) | 132 (100.0%) |
| 6 to 18 Years | 43 (21.6%) | 175 (87.9%) |
| 19 to 25 Years | 2 (2.8%) | 67 (93.1%) |
| 25 to 34 Years | 9 (6.5%) | 133 (96.4%) |
| 35 to 44 Years | 8 (3.0%) | 203 (76.3%) |
| 45 to 54 Years | 13 (10.7%) | 116 (95.9%) |
| 55 to 64 Years | 21 (13.0%) | 147 (91.3%) |
| 65 to 74 Years | 207 (94.1%) | 147 (66.8%) |
| 75 Years and over | 95 (94.1%) | 74 (73.3%) |
| Total | 398 (28.2%) | 1,194 (84.7%) |
Disability Status by Sex by Age in Audubon Park
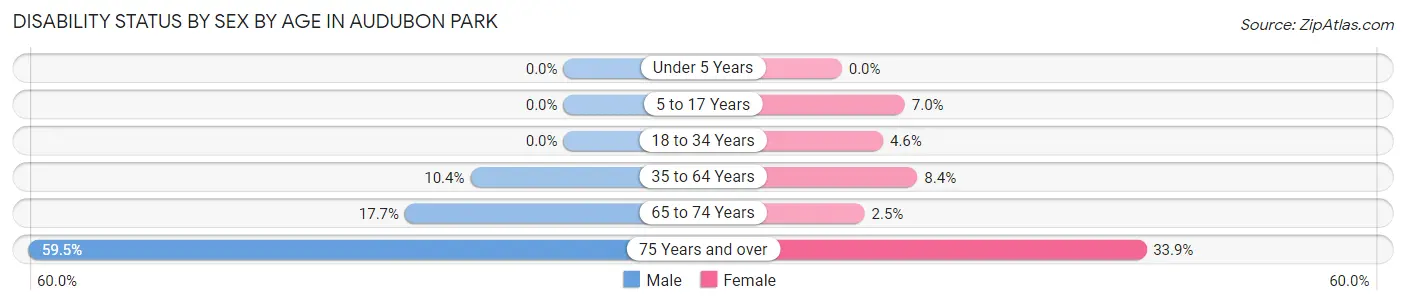
| Age Bracket | Male | Female |
| Under 5 Years | 0 (0.0%) | 0 (0.0%) |
| 5 to 17 Years | 0 (0.0%) | 8 (7.0%) |
| 18 to 34 Years | 0 (0.0%) | 5 (4.6%) |
| 35 to 64 Years | 26 (10.4%) | 25 (8.4%) |
| 65 to 74 Years | 18 (17.6%) | 3 (2.5%) |
| 75 Years and over | 25 (59.5%) | 20 (33.9%) |
Disability Class by Sex by Age in Audubon Park
Disability Class: Hearing Difficulty
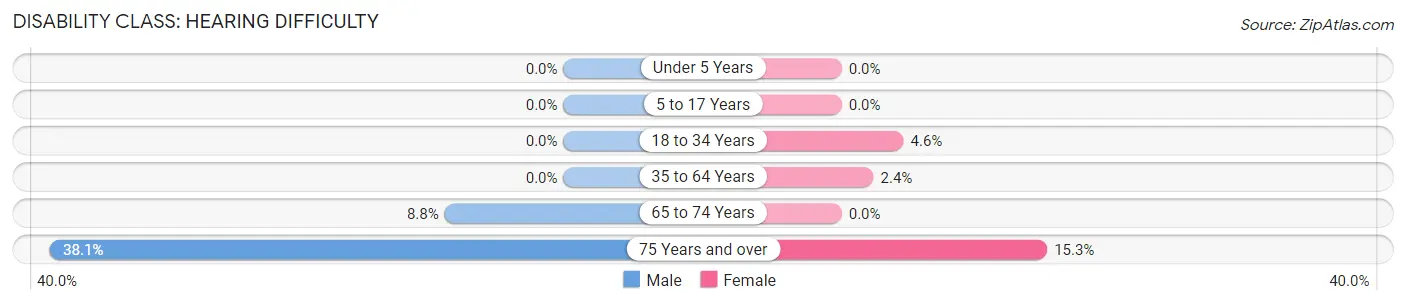
| Age Bracket | Male | Female |
| Under 5 Years | 0 (0.0%) | 0 (0.0%) |
| 5 to 17 Years | 0 (0.0%) | 0 (0.0%) |
| 18 to 34 Years | 0 (0.0%) | 5 (4.6%) |
| 35 to 64 Years | 0 (0.0%) | 7 (2.4%) |
| 65 to 74 Years | 9 (8.8%) | 0 (0.0%) |
| 75 Years and over | 16 (38.1%) | 9 (15.2%) |
Disability Class: Vision Difficulty
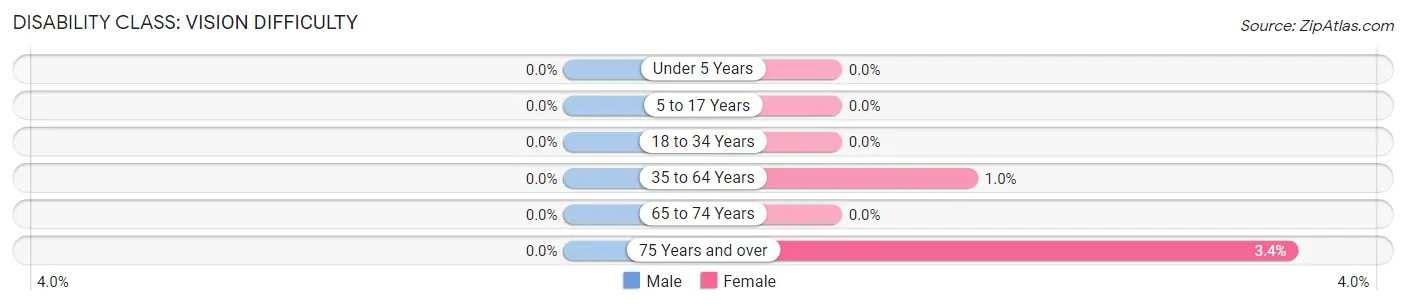
| Age Bracket | Male | Female |
| Under 5 Years | 0 (0.0%) | 0 (0.0%) |
| 5 to 17 Years | 0 (0.0%) | 0 (0.0%) |
| 18 to 34 Years | 0 (0.0%) | 0 (0.0%) |
| 35 to 64 Years | 0 (0.0%) | 3 (1.0%) |
| 65 to 74 Years | 0 (0.0%) | 0 (0.0%) |
| 75 Years and over | 0 (0.0%) | 2 (3.4%) |
Disability Class: Cognitive Difficulty
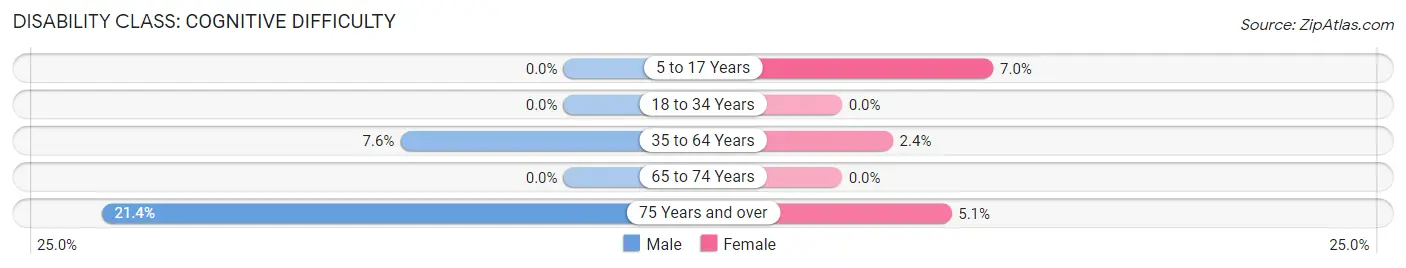
| Age Bracket | Male | Female |
| 5 to 17 Years | 0 (0.0%) | 8 (7.0%) |
| 18 to 34 Years | 0 (0.0%) | 0 (0.0%) |
| 35 to 64 Years | 19 (7.6%) | 7 (2.4%) |
| 65 to 74 Years | 0 (0.0%) | 0 (0.0%) |
| 75 Years and over | 9 (21.4%) | 3 (5.1%) |
Disability Class: Ambulatory Difficulty
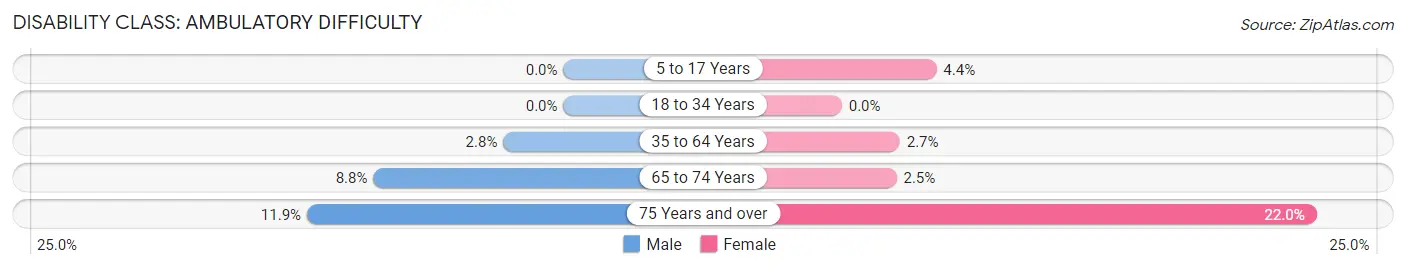
| Age Bracket | Male | Female |
| 5 to 17 Years | 0 (0.0%) | 5 (4.4%) |
| 18 to 34 Years | 0 (0.0%) | 0 (0.0%) |
| 35 to 64 Years | 7 (2.8%) | 8 (2.7%) |
| 65 to 74 Years | 9 (8.8%) | 3 (2.5%) |
| 75 Years and over | 5 (11.9%) | 13 (22.0%) |
Disability Class: Self-Care Difficulty
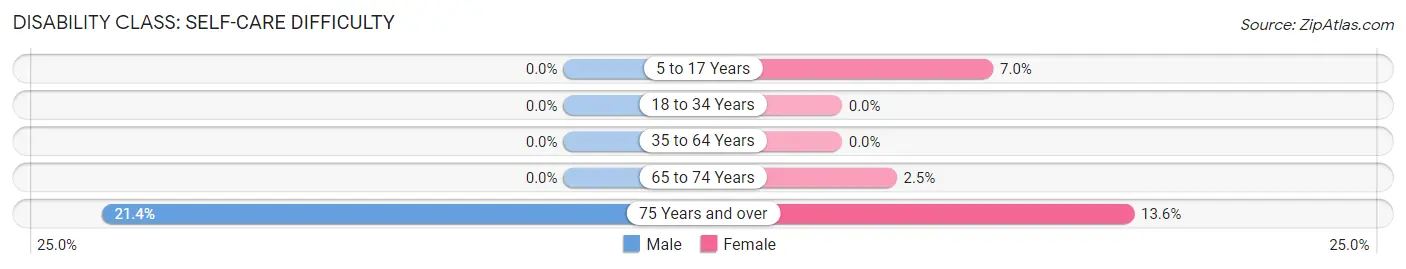
| Age Bracket | Male | Female |
| 5 to 17 Years | 0 (0.0%) | 8 (7.0%) |
| 18 to 34 Years | 0 (0.0%) | 0 (0.0%) |
| 35 to 64 Years | 0 (0.0%) | 0 (0.0%) |
| 65 to 74 Years | 0 (0.0%) | 3 (2.5%) |
| 75 Years and over | 9 (21.4%) | 8 (13.6%) |
Technology Access in Audubon Park
Computing Device Access in Audubon Park
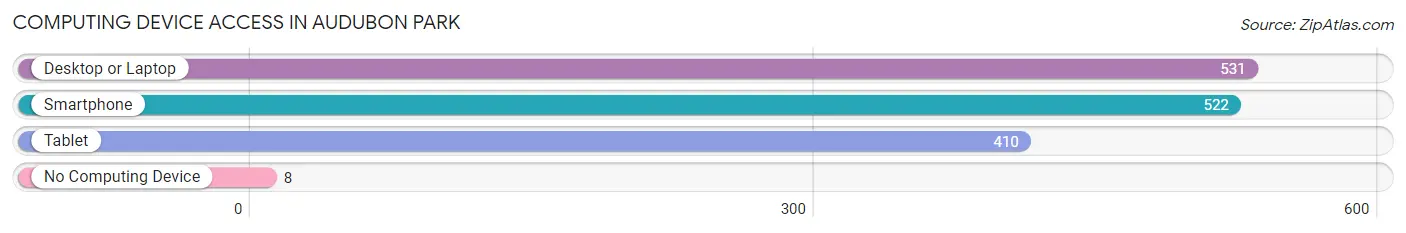
| Device Type | # Households | % Households |
| Desktop or Laptop | 531 | 88.8% |
| Smartphone | 522 | 87.3% |
| Tablet | 410 | 68.6% |
| No Computing Device | 8 | 1.3% |
| Total | 598 | 100.0% |
Internet Access in Audubon Park
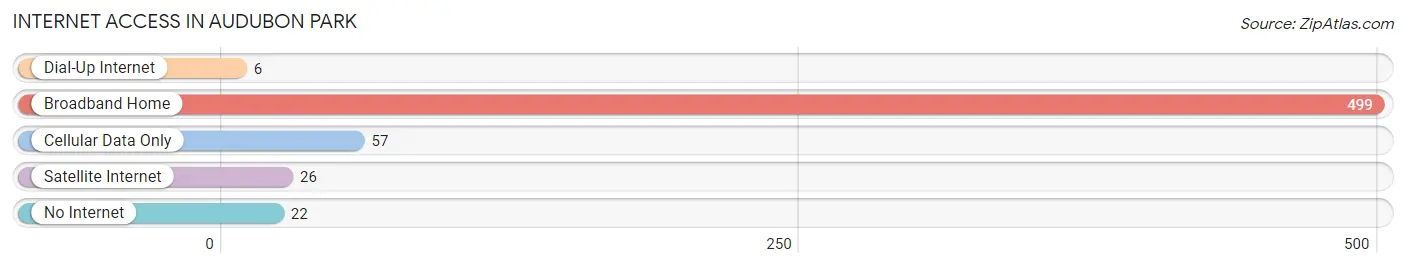
| Internet Type | # Households | % Households |
| Dial-Up Internet | 6 | 1.0% |
| Broadband Home | 499 | 83.4% |
| Cellular Data Only | 57 | 9.5% |
| Satellite Internet | 26 | 4.3% |
| No Internet | 22 | 3.7% |
| Total | 598 | 100.0% |
Audubon Park Summary
Audubon Park is a small city located in Jefferson County, Kentucky. It is situated on the banks of the Ohio River, just south of Louisville. The city has a population of approximately 2,000 people and is part of the Louisville metropolitan area.
History
Audubon Park was founded in 1883 by the Louisville and Nashville Railroad. The city was named after the famous naturalist and artist John James Audubon, who had visited the area in 1810. The city was originally a small farming community, but it soon grew into a bustling industrial center. The city was home to several factories, including a paper mill, a tobacco warehouse, and a distillery.
In the early 1900s, the city began to experience a period of growth and prosperity. The city was home to several large businesses, including the Louisville and Nashville Railroad, the Louisville and Jeffersonville Railroad, and the Louisville and Nashville Electric Company. The city also had a thriving entertainment district, with several theaters, restaurants, and bars.
In the 1950s, the city began to decline as the factories and businesses began to close. The city was hit hard by the Great Depression and the decline of the railroad industry. By the 1970s, the city had become a ghost town, with only a few businesses remaining.
Geography
Audubon Park is located in Jefferson County, Kentucky. It is situated on the banks of the Ohio River, just south of Louisville. The city has a total area of 0.9 square miles, all of which is land. The city is located in a hilly area, with the highest point being the Audubon Park Hill, which is located at an elevation of 545 feet.
The city is located in a humid subtropical climate zone, with hot, humid summers and mild winters. The average annual temperature is around 60 degrees Fahrenheit, with the average high temperature in the summer months reaching around 90 degrees Fahrenheit.
Economy
The economy of Audubon Park is largely based on tourism and retail. The city is home to several small businesses, including restaurants, bars, and shops. The city is also home to several large employers, including the Louisville and Nashville Railroad, the Louisville and Jeffersonville Railroad, and the Louisville and Nashville Electric Company.
The city is also home to several educational institutions, including the University of Louisville and Jefferson Community and Technical College.
Demographics
As of the 2010 census, the population of Audubon Park was 2,000 people. The racial makeup of the city was 94.2% White, 2.2% African American, 0.2% Native American, 0.6% Asian, 0.1% Pacific Islander, and 2.7% from other races. The median household income was $37,500, and the median family income was $45,000. The per capita income was $19,000.
Conclusion
Audubon Park is a small city located in Jefferson County, Kentucky. It is situated on the banks of the Ohio River, just south of Louisville. The city has a population of approximately 2,000 people and is part of the Louisville metropolitan area. The city has a largely tourism and retail-based economy, and is home to several educational institutions. The population of the city is largely white, with a median household income of $37,500.
Common Questions
What is Per Capita Income in Audubon Park?
Per Capita income in Audubon Park is $52,792.
What is the Median Family Income in Audubon Park?
Median Family Income in Audubon Park is $120,357.
What is the Median Household income in Audubon Park?
Median Household Income in Audubon Park is $104,107.
What is Income or Wage Gap in Audubon Park?
Income or Wage Gap in Audubon Park is 18.3%.
Women in Audubon Park earn 81.7 cents for every dollar earned by a man.
What is Inequality or Gini Index in Audubon Park?
Inequality or Gini Index in Audubon Park is 0.37.
What is the Total Population of Audubon Park?
Total Population of Audubon Park is 1,412.
What is the Total Male Population of Audubon Park?
Total Male Population of Audubon Park is 650.
What is the Total Female Population of Audubon Park?
Total Female Population of Audubon Park is 762.
What is the Ratio of Males per 100 Females in Audubon Park?
There are 85.30 Males per 100 Females in Audubon Park.
What is the Ratio of Females per 100 Males in Audubon Park?
There are 117.23 Females per 100 Males in Audubon Park.
What is the Median Population Age in Audubon Park?
Median Population Age in Audubon Park is 40.3 Years.
What is the Average Family Size in Audubon Park
Average Family Size in Audubon Park is 2.8 People.
What is the Average Household Size in Audubon Park
Average Household Size in Audubon Park is 2.4 People.
How Large is the Labor Force in Audubon Park?
There are 794 People in the Labor Forcein in Audubon Park.
What is the Percentage of People in the Labor Force in Audubon Park?
69.6% of People are in the Labor Force in Audubon Park.
What is the Unemployment Rate in Audubon Park?
Unemployment Rate in Audubon Park is 1.1%.