Zip Codes with the Highest Percentage of Population Employed in Life, Physical & Social Science in Louisville, KY
RELATED REPORTS & OPTIONS
Life, Physical & Social Science
Louisville
Compare Zip Codes
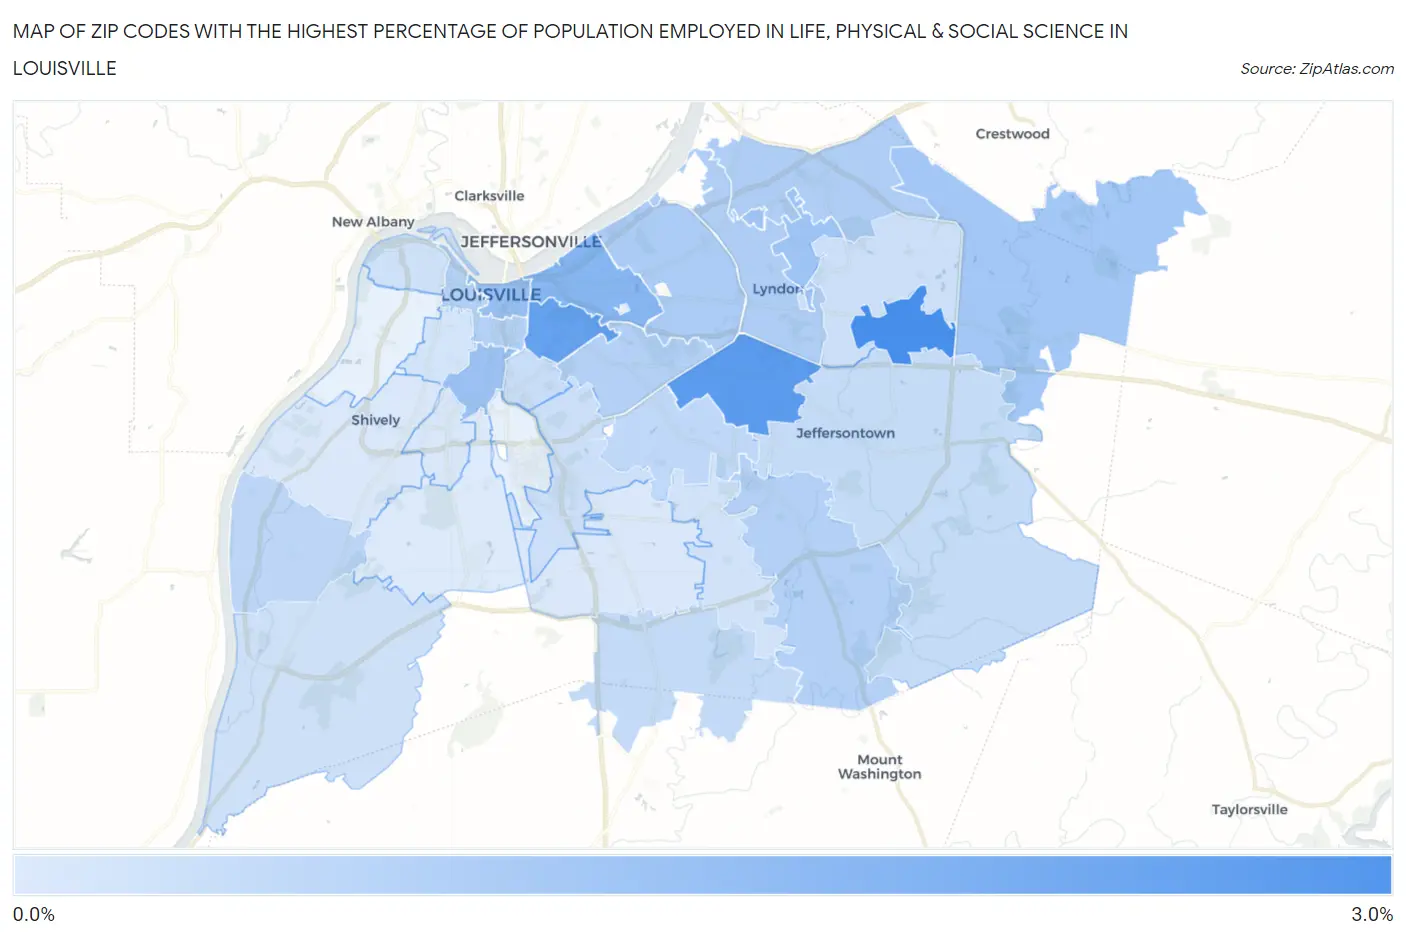
Map of Zip Codes with the Highest Percentage of Population Employed in Life, Physical & Social Science in Louisville
0.088%
2.8%
Zip Codes with the Highest Percentage of Population Employed in Life, Physical & Social Science in Louisville, KY
| Zip Code | % Employed | vs State | vs National | |
| 1. | 40243 | 2.8% | 0.77%(+2.06)#25 | 1.1%(+1.74)#2,080 |
| 2. | 40220 | 2.5% | 0.77%(+1.73)#31 | 1.1%(+1.41)#2,578 |
| 3. | 40204 | 2.3% | 0.77%(+1.50)#35 | 1.1%(+1.18)#3,026 |
| 4. | 40206 | 1.7% | 0.77%(+0.888)#52 | 1.1%(+0.564)#4,923 |
| 5. | 40202 | 1.3% | 0.77%(+0.556)#76 | 1.1%(+0.232)#6,643 |
| 6. | 40208 | 1.3% | 0.77%(+0.506)#84 | 1.1%(+0.182)#6,978 |
| 7. | 40242 | 1.2% | 0.77%(+0.433)#90 | 1.1%(+0.109)#7,496 |
| 8. | 40245 | 1.2% | 0.77%(+0.384)#93 | 1.1%(+0.060)#7,852 |
| 9. | 40207 | 0.98% | 0.77%(+0.212)#110 | 1.1%(-0.112)#9,239 |
| 10. | 40241 | 0.94% | 0.77%(+0.176)#117 | 1.1%(-0.148)#9,553 |
| 11. | 40222 | 0.93% | 0.77%(+0.167)#119 | 1.1%(-0.156)#9,624 |
| 12. | 40205 | 0.83% | 0.77%(+0.067)#129 | 1.1%(-0.257)#10,643 |
| 13. | 40291 | 0.83% | 0.77%(+0.064)#133 | 1.1%(-0.260)#10,680 |
| 14. | 40203 | 0.83% | 0.77%(+0.064)#134 | 1.1%(-0.260)#10,684 |
| 15. | 40258 | 0.66% | 0.77%(-0.107)#163 | 1.1%(-0.431)#12,530 |
| 16. | 40218 | 0.63% | 0.77%(-0.138)#170 | 1.1%(-0.461)#12,913 |
| 17. | 40229 | 0.54% | 0.77%(-0.224)#180 | 1.1%(-0.548)#13,987 |
| 18. | 40299 | 0.51% | 0.77%(-0.252)#186 | 1.1%(-0.576)#14,322 |
| 19. | 40217 | 0.46% | 0.77%(-0.305)#194 | 1.1%(-0.629)#15,002 |
| 20. | 40223 | 0.40% | 0.77%(-0.372)#209 | 1.1%(-0.696)#15,816 |
| 21. | 40213 | 0.37% | 0.77%(-0.397)#214 | 1.1%(-0.721)#16,139 |
| 22. | 40272 | 0.34% | 0.77%(-0.424)#222 | 1.1%(-0.748)#16,495 |
| 23. | 40212 | 0.34% | 0.77%(-0.428)#224 | 1.1%(-0.752)#16,550 |
| 24. | 40228 | 0.29% | 0.77%(-0.473)#231 | 1.1%(-0.797)#17,137 |
| 25. | 40210 | 0.25% | 0.77%(-0.512)#237 | 1.1%(-0.836)#17,587 |
| 26. | 40215 | 0.18% | 0.77%(-0.589)#249 | 1.1%(-0.912)#18,417 |
| 27. | 40219 | 0.13% | 0.77%(-0.633)#258 | 1.1%(-0.957)#18,813 |
| 28. | 40216 | 0.13% | 0.77%(-0.641)#261 | 1.1%(-0.965)#18,889 |
| 29. | 40214 | 0.088% | 0.77%(-0.679)#266 | 1.1%(-1.00)#19,145 |
1
Common Questions
What are the Top 10 Zip Codes with the Highest Percentage of Population Employed in Life, Physical & Social Science in Louisville, KY?
Top 10 Zip Codes with the Highest Percentage of Population Employed in Life, Physical & Social Science in Louisville, KY are:
What zip code has the Highest Percentage of Population Employed in Life, Physical & Social Science in Louisville, KY?
40243 has the Highest Percentage of Population Employed in Life, Physical & Social Science in Louisville, KY with 2.8%.
What is the Percentage of Population Employed in Life, Physical & Social Science in Louisville, KY?
Percentage of Population Employed in Life, Physical & Social Science in Louisville is 0.64%.
What is the Percentage of Population Employed in Life, Physical & Social Science in Kentucky?
Percentage of Population Employed in Life, Physical & Social Science in Kentucky is 0.77%.
What is the Percentage of Population Employed in Life, Physical & Social Science in the United States?
Percentage of Population Employed in Life, Physical & Social Science in the United States is 1.1%.