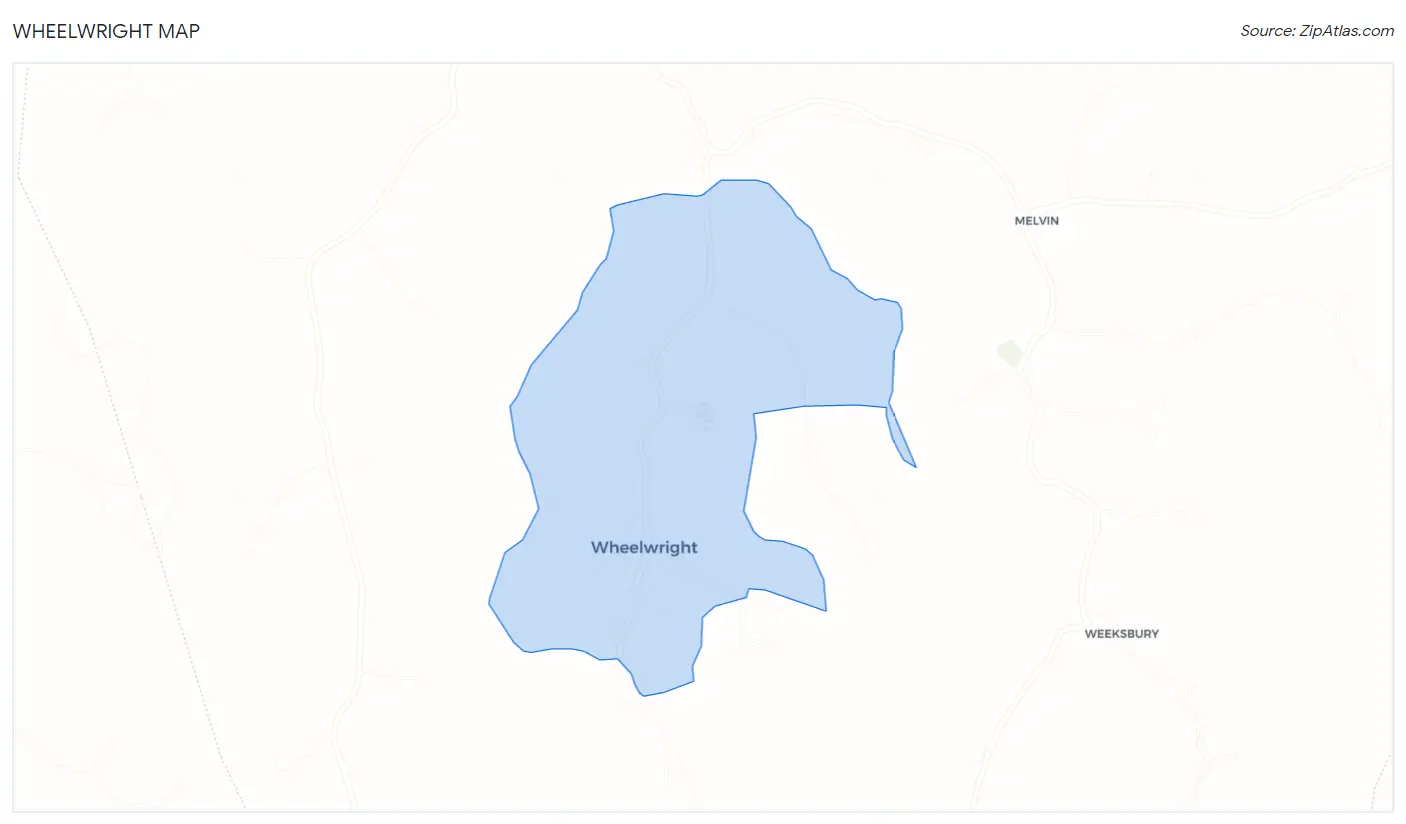
Wheelwright, KY Map & Demographics
Wheelwright Map
Wheelwright Overview
$17,626
PER CAPITA INCOME
$80,568
AVG FAMILY INCOME
42.6%
WAGE / INCOME GAP [ % ]
57.4¢/ $1
WAGE / INCOME GAP [ $ ]
0.44
INEQUALITY / GINI INDEX
850
TOTAL POPULATION
439
MALE POPULATION
411
FEMALE POPULATION
106.81
MALES / 100 FEMALES
93.62
FEMALES / 100 MALES
38.6
MEDIAN AGE
3.2
AVG FAMILY SIZE
2.6
AVG HOUSEHOLD SIZE
206
LABOR FORCE [ PEOPLE ]
29.1%
PERCENT IN LABOR FORCE
12.1%
UNEMPLOYMENT RATE
Wheelwright Zip Codes
Wheelwright Area Codes
Income in Wheelwright
Income Overview in Wheelwright
| Characteristic | Number | Measure |
| Per Capita Income | 850 | $17,626 |
| Median Family Income | 162 | $80,568 |
| Mean Family Income | 162 | $68,140 |
| Median Household Income | 235 | $0 |
| Mean Household Income | 235 | $54,183 |
| Income Deficit | 162 | $0 |
| Wage / Income Gap (%) | 850 | 42.64% |
| Wage / Income Gap ($) | 850 | 57.36¢ per $1 |
| Gini / Inequality Index | 850 | 0.44 |
Earnings by Sex in Wheelwright
Average Earnings in Wheelwright are $34,926, $50,625 for men and $29,038 for women, a difference of 42.6%.
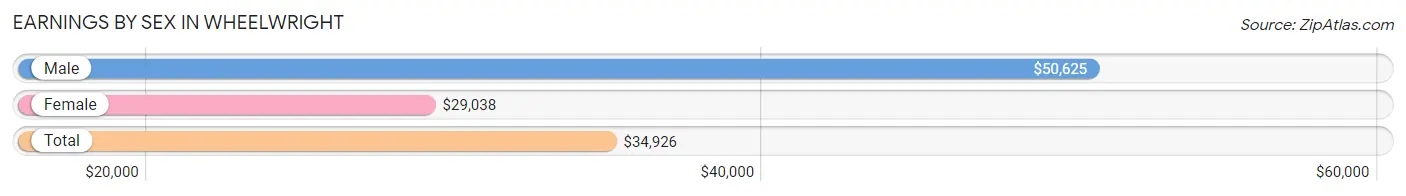
| Sex | Number | Average Earnings |
| Male | 165 (54.1%) | $50,625 |
| Female | 140 (45.9%) | $29,038 |
| Total | 305 (100.0%) | $34,926 |
Earnings by Sex by Income Bracket in Wheelwright
The most common earnings brackets in Wheelwright are $55,000 to $64,999 for men (54 | 32.7%) and $50,000 to $54,999 for women (26 | 18.6%).
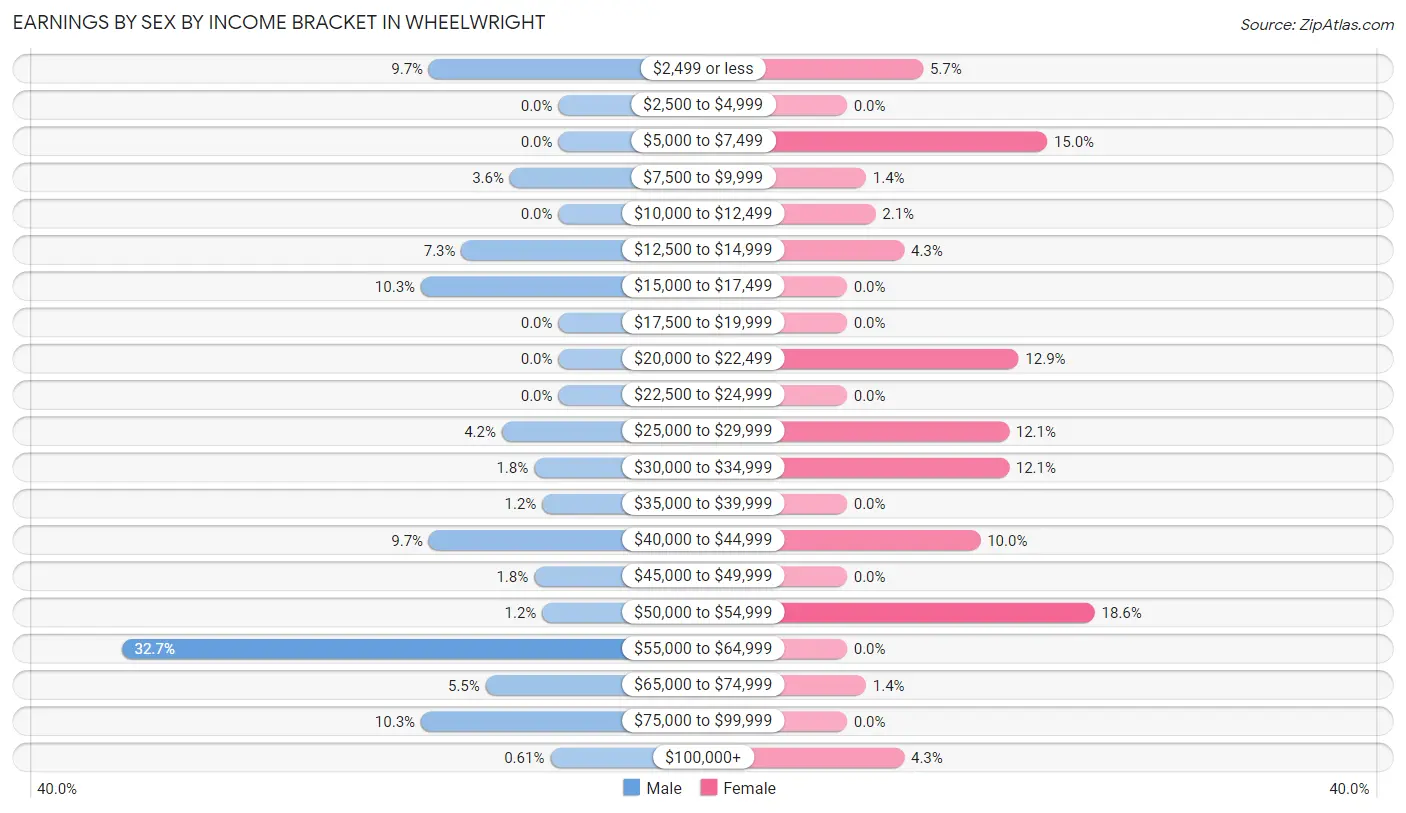
| Income | Male | Female |
| $2,499 or less | 16 (9.7%) | 8 (5.7%) |
| $2,500 to $4,999 | 0 (0.0%) | 0 (0.0%) |
| $5,000 to $7,499 | 0 (0.0%) | 21 (15.0%) |
| $7,500 to $9,999 | 6 (3.6%) | 2 (1.4%) |
| $10,000 to $12,499 | 0 (0.0%) | 3 (2.1%) |
| $12,500 to $14,999 | 12 (7.3%) | 6 (4.3%) |
| $15,000 to $17,499 | 17 (10.3%) | 0 (0.0%) |
| $17,500 to $19,999 | 0 (0.0%) | 0 (0.0%) |
| $20,000 to $22,499 | 0 (0.0%) | 18 (12.9%) |
| $22,500 to $24,999 | 0 (0.0%) | 0 (0.0%) |
| $25,000 to $29,999 | 7 (4.2%) | 17 (12.1%) |
| $30,000 to $34,999 | 3 (1.8%) | 17 (12.1%) |
| $35,000 to $39,999 | 2 (1.2%) | 0 (0.0%) |
| $40,000 to $44,999 | 16 (9.7%) | 14 (10.0%) |
| $45,000 to $49,999 | 3 (1.8%) | 0 (0.0%) |
| $50,000 to $54,999 | 2 (1.2%) | 26 (18.6%) |
| $55,000 to $64,999 | 54 (32.7%) | 0 (0.0%) |
| $65,000 to $74,999 | 9 (5.4%) | 2 (1.4%) |
| $75,000 to $99,999 | 17 (10.3%) | 0 (0.0%) |
| $100,000+ | 1 (0.6%) | 6 (4.3%) |
| Total | 165 (100.0%) | 140 (100.0%) |
Earnings by Sex by Educational Attainment in Wheelwright
Average earnings in Wheelwright are $55,104 for men and $29,327 for women, a difference of 46.8%. Men with an educational attainment of college or associate's degree enjoy the highest average annual earnings of $56,250, while those with college or associate's degree education earn the least with $56,250. Women with an educational attainment of high school diploma earn the most with the average annual earnings of $32,794, while those with high school diploma education have the smallest earnings of $32,794.
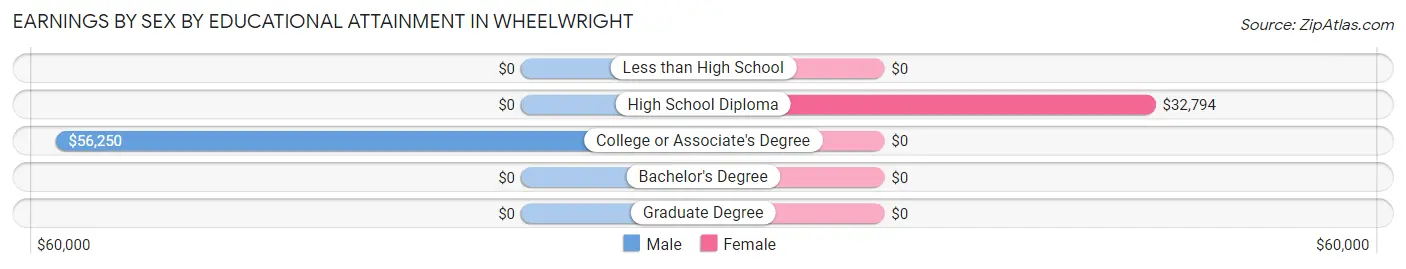
| Educational Attainment | Male Income | Female Income |
| Less than High School | - | - |
| High School Diploma | - | - |
| College or Associate's Degree | $56,250 | $0 |
| Bachelor's Degree | - | - |
| Graduate Degree | - | - |
| Total | $55,104 | $29,327 |
Family Income in Wheelwright
Family Income Brackets in Wheelwright
According to the Wheelwright family income data, there are 47 families falling into the $75,000 to $99,999 income range, which is the most common income bracket and makes up 29.0% of all families.
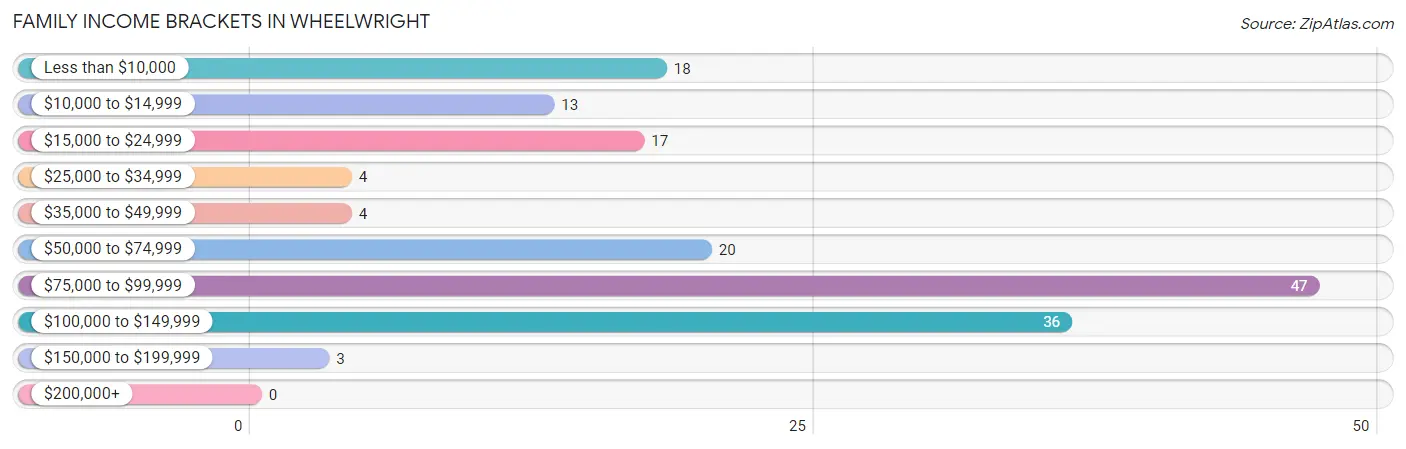
| Income Bracket | # Families | % Families |
| Less than $10,000 | 18 | 11.1% |
| $10,000 to $14,999 | 13 | 8.0% |
| $15,000 to $24,999 | 17 | 10.5% |
| $25,000 to $34,999 | 4 | 2.5% |
| $35,000 to $49,999 | 4 | 2.5% |
| $50,000 to $74,999 | 20 | 12.3% |
| $75,000 to $99,999 | 47 | 29.0% |
| $100,000 to $149,999 | 36 | 22.2% |
| $150,000 to $199,999 | 3 | 1.9% |
| $200,000+ | 0 | 0.0% |
Family Income by Famaliy Size in Wheelwright
5-person families (32 | 19.8%) account for the highest median family income in Wheelwright with $93,393 per family, while 5-person families (32 | 19.8%) have the highest median income of $18,679 per family member.
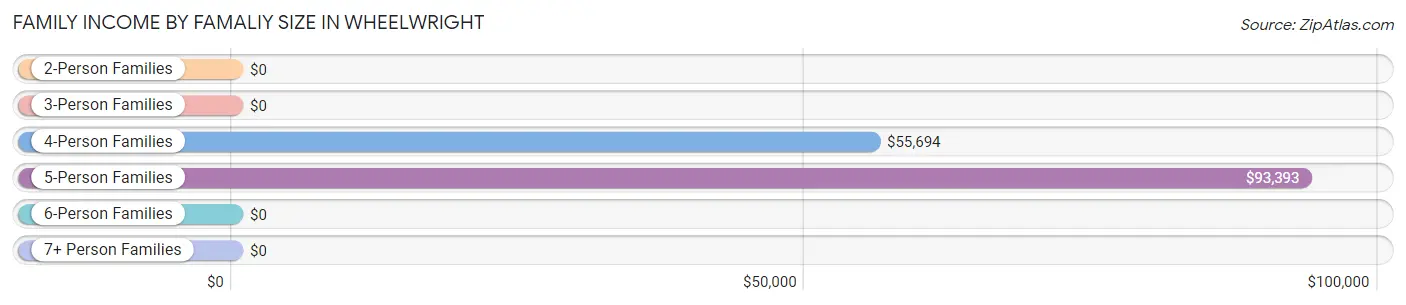
| Income Bracket | # Families | Median Income |
| 2-Person Families | 65 (40.1%) | $0 |
| 3-Person Families | 47 (29.0%) | $0 |
| 4-Person Families | 13 (8.0%) | $55,694 |
| 5-Person Families | 32 (19.8%) | $93,393 |
| 6-Person Families | 5 (3.1%) | $0 |
| 7+ Person Families | 0 (0.0%) | $0 |
| Total | 162 (100.0%) | $80,568 |
Family Income by Number of Earners in Wheelwright
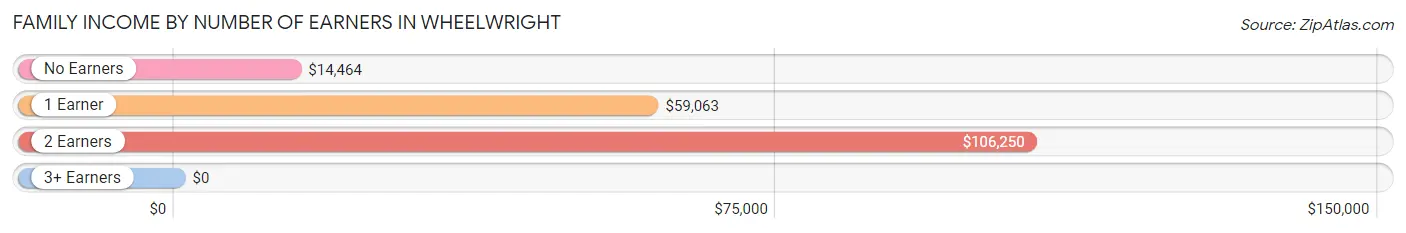
| Number of Earners | # Families | Median Income |
| No Earners | 37 (22.8%) | $14,464 |
| 1 Earner | 62 (38.3%) | $59,063 |
| 2 Earners | 63 (38.9%) | $106,250 |
| 3+ Earners | 0 (0.0%) | $0 |
| Total | 162 (100.0%) | $80,568 |
Household Income in Wheelwright
Household Income Brackets in Wheelwright
With 52 households falling in the category, the $15,000 to $24,999 income range is the most frequent in Wheelwright, accounting for 22.1% of all households.
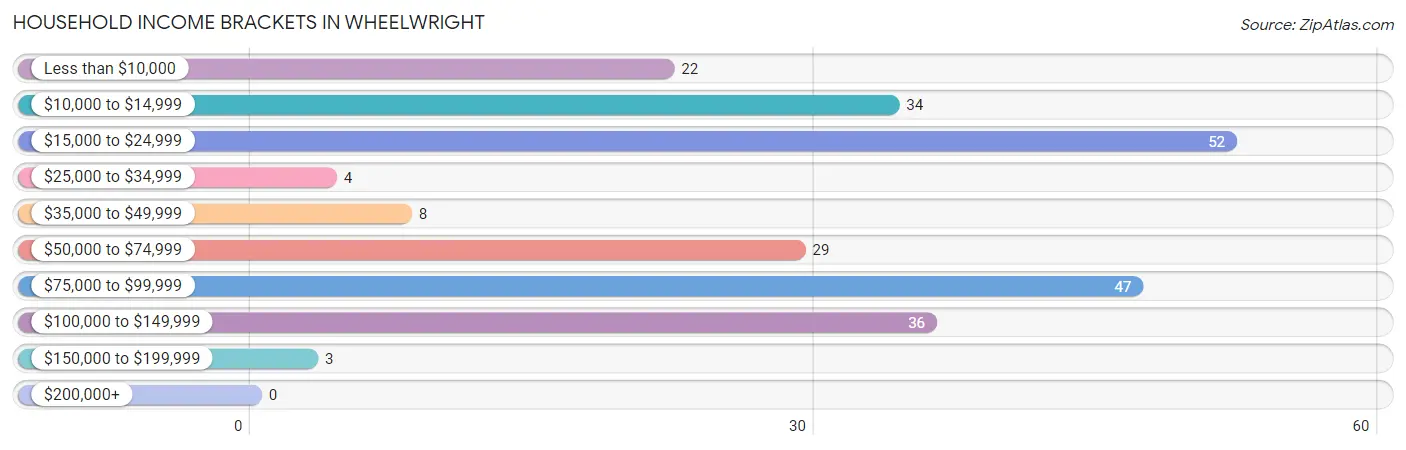
| Income Bracket | # Households | % Households |
| Less than $10,000 | 22 | 9.4% |
| $10,000 to $14,999 | 34 | 14.5% |
| $15,000 to $24,999 | 52 | 22.1% |
| $25,000 to $34,999 | 4 | 1.7% |
| $35,000 to $49,999 | 8 | 3.4% |
| $50,000 to $74,999 | 29 | 12.3% |
| $75,000 to $99,999 | 47 | 20.0% |
| $100,000 to $149,999 | 36 | 15.3% |
| $150,000 to $199,999 | 3 | 1.3% |
| $200,000+ | 0 | 0.0% |
Household Income by Householder Age in Wheelwright
The median household income in Wheelwright is $0, with the highest median household income of $89,886 found in the 25 to 44 years age bracket for the primary householder. A total of 77 households (32.8%) fall into this category. Meanwhile, the 15 to 24 years age bracket for the primary householder has the lowest median household income of $0, with 9 households (3.8%) in this group.
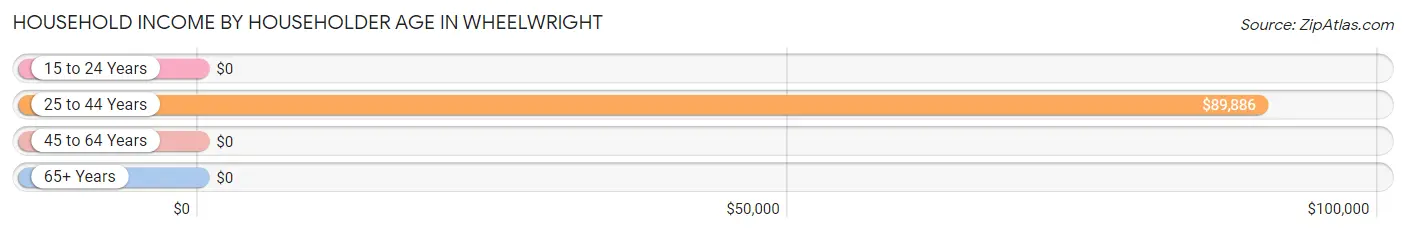
| Income Bracket | # Households | Median Income |
| 15 to 24 Years | 9 (3.8%) | $0 |
| 25 to 44 Years | 77 (32.8%) | $89,886 |
| 45 to 64 Years | 115 (48.9%) | $0 |
| 65+ Years | 34 (14.5%) | $0 |
| Total | 235 (100.0%) | $0 |
Poverty in Wheelwright
Income Below Poverty by Sex and Age in Wheelwright
With 33.5% poverty level for males and 32.5% for females among the residents of Wheelwright, 18 to 24 year old males and 65 to 74 year old females are the most vulnerable to poverty, with 20 males (100.0%) and 25 females (71.4%) in their respective age groups living below the poverty level.
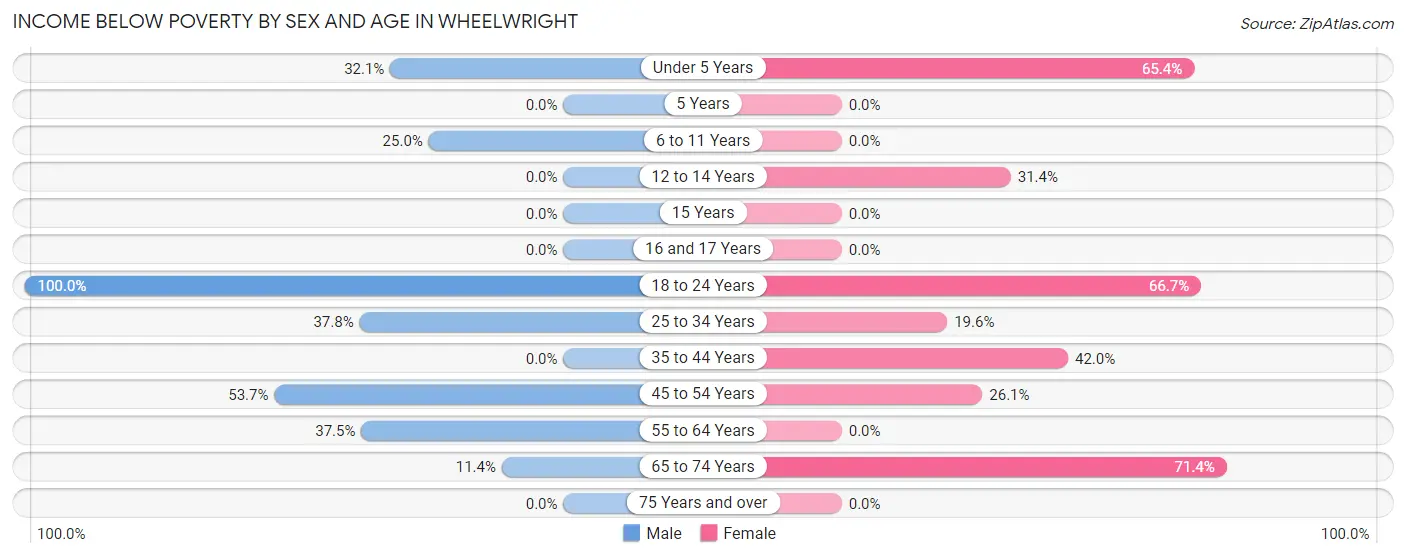
| Age Bracket | Male | Female |
| Under 5 Years | 9 (32.1%) | 17 (65.4%) |
| 5 Years | 0 (0.0%) | 0 (0.0%) |
| 6 to 11 Years | 5 (25.0%) | 0 (0.0%) |
| 12 to 14 Years | 0 (0.0%) | 16 (31.4%) |
| 15 Years | 0 (0.0%) | 0 (0.0%) |
| 16 and 17 Years | 0 (0.0%) | 0 (0.0%) |
| 18 to 24 Years | 20 (100.0%) | 12 (66.7%) |
| 25 to 34 Years | 14 (37.8%) | 9 (19.6%) |
| 35 to 44 Years | 0 (0.0%) | 21 (42.0%) |
| 45 to 54 Years | 22 (53.7%) | 6 (26.1%) |
| 55 to 64 Years | 18 (37.5%) | 0 (0.0%) |
| 65 to 74 Years | 4 (11.4%) | 25 (71.4%) |
| 75 Years and over | 0 (0.0%) | 0 (0.0%) |
| Total | 92 (33.5%) | 106 (32.5%) |
Income Above Poverty by Sex and Age in Wheelwright
According to the poverty statistics in Wheelwright, males aged 5 years and females aged 6 to 11 years are the age groups that are most secure financially, with 100.0% of males and 100.0% of females in these age groups living above the poverty line.
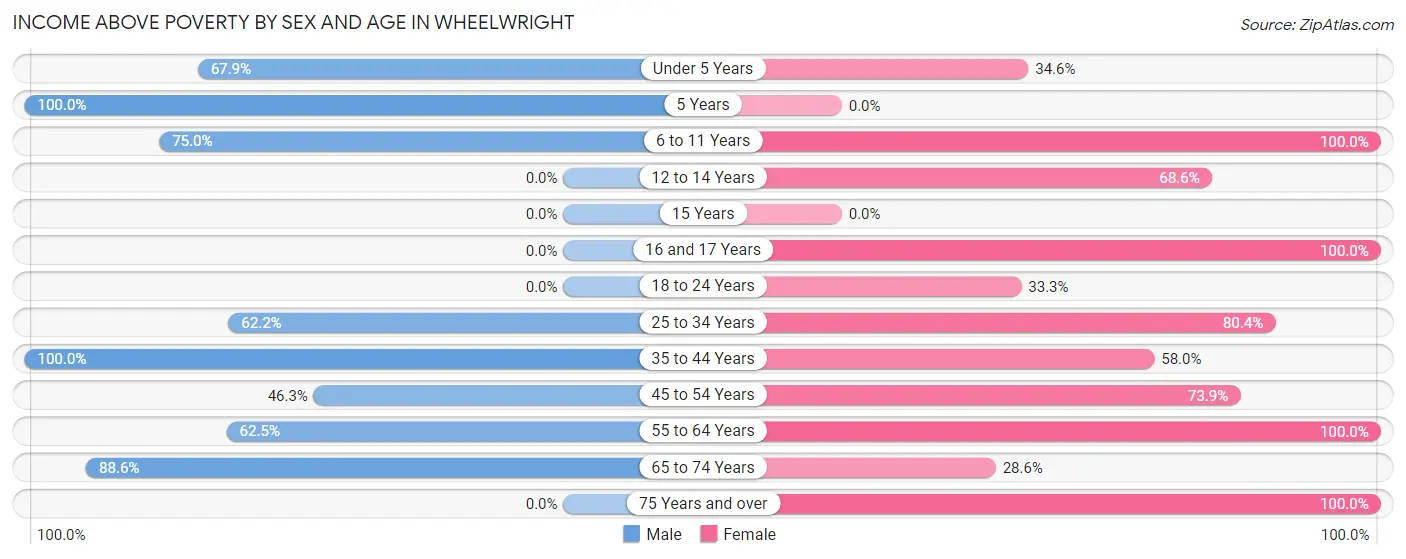
| Age Bracket | Male | Female |
| Under 5 Years | 19 (67.9%) | 9 (34.6%) |
| 5 Years | 7 (100.0%) | 0 (0.0%) |
| 6 to 11 Years | 15 (75.0%) | 8 (100.0%) |
| 12 to 14 Years | 0 (0.0%) | 35 (68.6%) |
| 15 Years | 0 (0.0%) | 0 (0.0%) |
| 16 and 17 Years | 0 (0.0%) | 15 (100.0%) |
| 18 to 24 Years | 0 (0.0%) | 6 (33.3%) |
| 25 to 34 Years | 23 (62.2%) | 37 (80.4%) |
| 35 to 44 Years | 39 (100.0%) | 29 (58.0%) |
| 45 to 54 Years | 19 (46.3%) | 17 (73.9%) |
| 55 to 64 Years | 30 (62.5%) | 47 (100.0%) |
| 65 to 74 Years | 31 (88.6%) | 10 (28.6%) |
| 75 Years and over | 0 (0.0%) | 7 (100.0%) |
| Total | 183 (66.5%) | 220 (67.5%) |
Income Below Poverty Among Married-Couple Families in Wheelwright
The poverty statistics for married-couple families in Wheelwright show that 21.4% or 27 of the total 126 families live below the poverty line. Families with no children have the highest poverty rate of 31.0%, comprising of 18 families. On the other hand, families with 3 or 4 children have the lowest poverty rate of 0.0%, which includes 0 families.
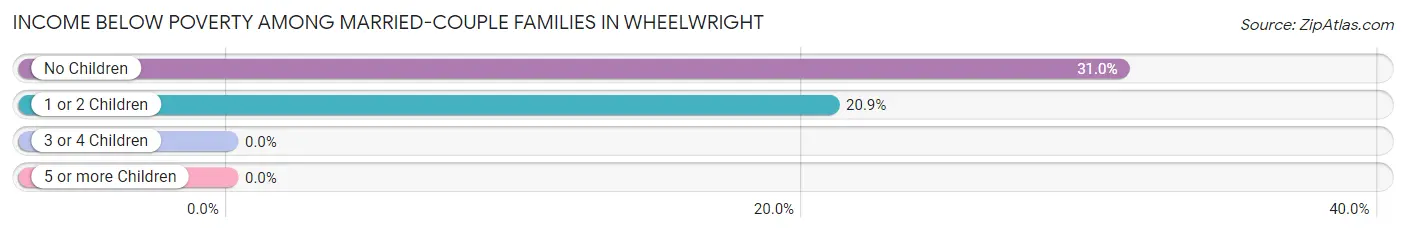
| Children | Above Poverty | Below Poverty |
| No Children | 40 (69.0%) | 18 (31.0%) |
| 1 or 2 Children | 34 (79.1%) | 9 (20.9%) |
| 3 or 4 Children | 25 (100.0%) | 0 (0.0%) |
| 5 or more Children | 0 (0.0%) | 0 (0.0%) |
| Total | 99 (78.6%) | 27 (21.4%) |
Income Below Poverty Among Single-Parent Households in Wheelwright
According to the poverty data in Wheelwright, 40.0% or 2 single-father households and 64.5% or 20 single-mother households are living below the poverty line. Among single-father households, those with 3 or 4 children have the highest poverty rate, with 2 households (100.0%) experiencing poverty. Likewise, among single-mother households, those with 1 or 2 children have the highest poverty rate, with 10 households (100.0%) falling below the poverty line.
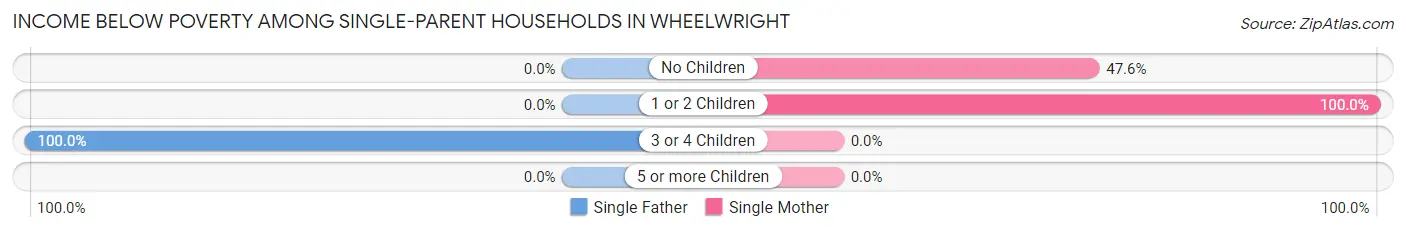
| Children | Single Father | Single Mother |
| No Children | 0 (0.0%) | 10 (47.6%) |
| 1 or 2 Children | 0 (0.0%) | 10 (100.0%) |
| 3 or 4 Children | 2 (100.0%) | 0 (0.0%) |
| 5 or more Children | 0 (0.0%) | 0 (0.0%) |
| Total | 2 (40.0%) | 20 (64.5%) |
Income Below Poverty Among Married-Couple vs Single-Parent Households in Wheelwright
The poverty data for Wheelwright shows that 27 of the married-couple family households (21.4%) and 22 of the single-parent households (61.1%) are living below the poverty level. Within the married-couple family households, those with no children have the highest poverty rate, with 18 households (31.0%) falling below the poverty line. Among the single-parent households, those with 1 or 2 children have the highest poverty rate, with 10 household (100.0%) living below poverty.
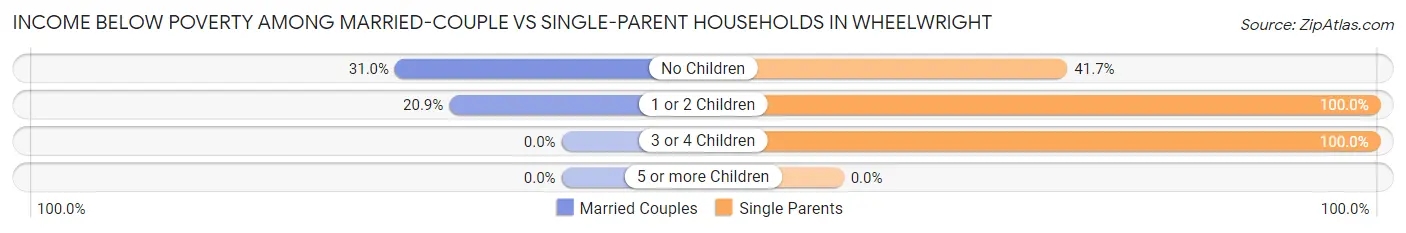
| Children | Married-Couple Families | Single-Parent Households |
| No Children | 18 (31.0%) | 10 (41.7%) |
| 1 or 2 Children | 9 (20.9%) | 10 (100.0%) |
| 3 or 4 Children | 0 (0.0%) | 2 (100.0%) |
| 5 or more Children | 0 (0.0%) | 0 (0.0%) |
| Total | 27 (21.4%) | 22 (61.1%) |
Race in Wheelwright
The most populous races in Wheelwright are White / Caucasian (819 | 96.4%), Black / African American (20 | 2.4%), and Two or more Races (11 | 1.3%).
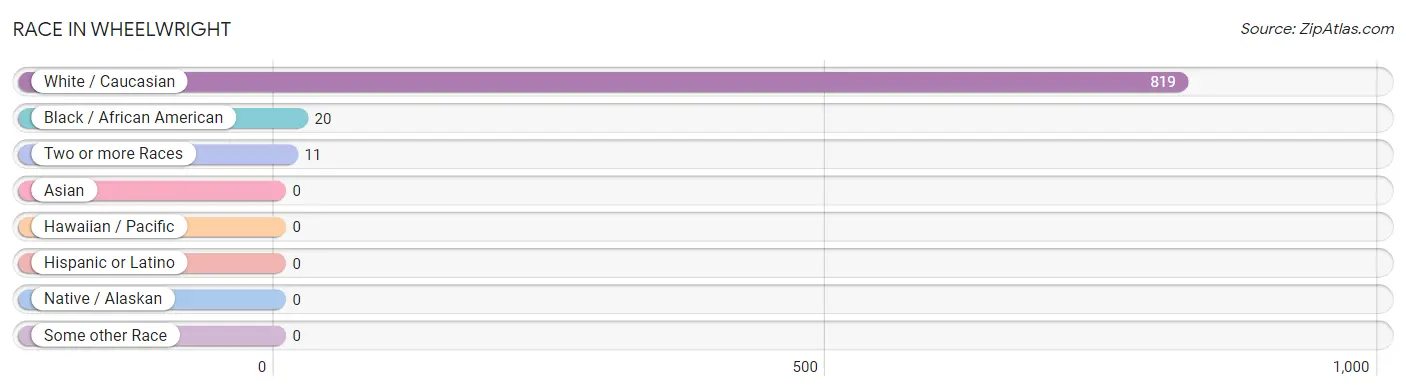
| Race | # Population | % Population |
| Asian | 0 | 0.0% |
| Black / African American | 20 | 2.4% |
| Hawaiian / Pacific | 0 | 0.0% |
| Hispanic or Latino | 0 | 0.0% |
| Native / Alaskan | 0 | 0.0% |
| White / Caucasian | 819 | 96.4% |
| Two or more Races | 11 | 1.3% |
| Some other Race | 0 | 0.0% |
| Total | 850 | 100.0% |
Ancestry in Wheelwright
The most populous ancestries reported in Wheelwright are American (218 | 25.7%), Scottish (37 | 4.3%), English (24 | 2.8%), Irish (18 | 2.1%), and Welsh (17 | 2.0%), together accounting for 36.9% of all Wheelwright residents.
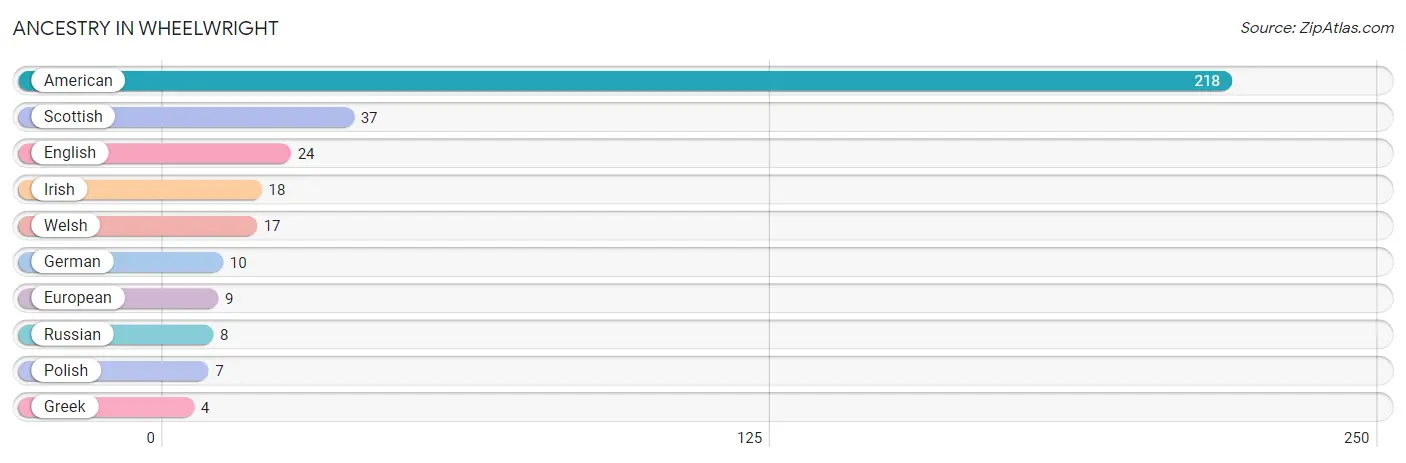
| Ancestry | # Population | % Population |
| American | 218 | 25.7% |
| English | 24 | 2.8% |
| European | 9 | 1.1% |
| German | 10 | 1.2% |
| Greek | 4 | 0.5% |
| Irish | 18 | 2.1% |
| Polish | 7 | 0.8% |
| Russian | 8 | 0.9% |
| Scottish | 37 | 4.3% |
| Welsh | 17 | 2.0% | View All 10 Rows |
Immigrants in Wheelwright

| Immigration Origin | # Population | % Population | View All 0 Rows |
Sex and Age in Wheelwright
Sex and Age in Wheelwright
The most populous age groups in Wheelwright are 55 to 59 Years (85 | 19.4%) for men and 10 to 14 Years (51 | 12.4%) for women.
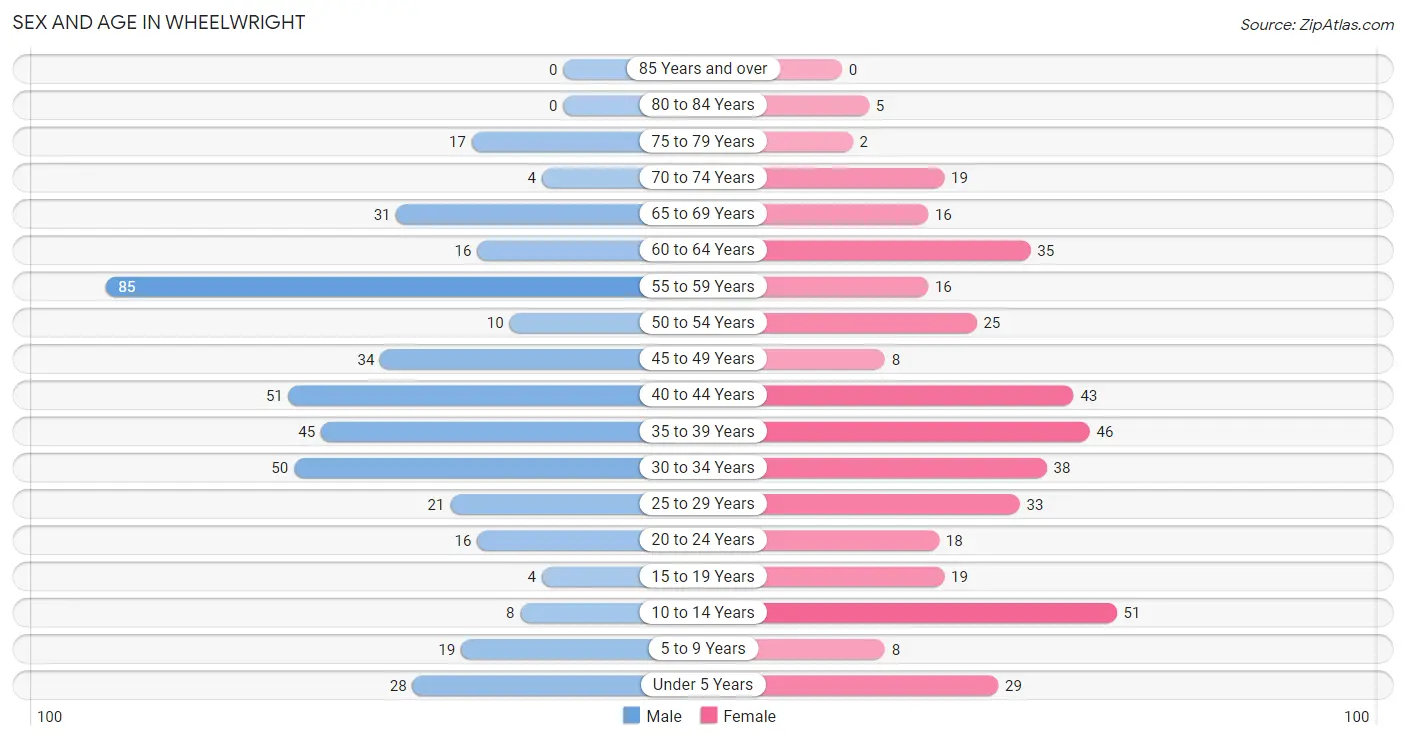
| Age Bracket | Male | Female |
| Under 5 Years | 28 (6.4%) | 29 (7.1%) |
| 5 to 9 Years | 19 (4.3%) | 8 (1.9%) |
| 10 to 14 Years | 8 (1.8%) | 51 (12.4%) |
| 15 to 19 Years | 4 (0.9%) | 19 (4.6%) |
| 20 to 24 Years | 16 (3.6%) | 18 (4.4%) |
| 25 to 29 Years | 21 (4.8%) | 33 (8.0%) |
| 30 to 34 Years | 50 (11.4%) | 38 (9.2%) |
| 35 to 39 Years | 45 (10.2%) | 46 (11.2%) |
| 40 to 44 Years | 51 (11.6%) | 43 (10.5%) |
| 45 to 49 Years | 34 (7.7%) | 8 (1.9%) |
| 50 to 54 Years | 10 (2.3%) | 25 (6.1%) |
| 55 to 59 Years | 85 (19.4%) | 16 (3.9%) |
| 60 to 64 Years | 16 (3.6%) | 35 (8.5%) |
| 65 to 69 Years | 31 (7.1%) | 16 (3.9%) |
| 70 to 74 Years | 4 (0.9%) | 19 (4.6%) |
| 75 to 79 Years | 17 (3.9%) | 2 (0.5%) |
| 80 to 84 Years | 0 (0.0%) | 5 (1.2%) |
| 85 Years and over | 0 (0.0%) | 0 (0.0%) |
| Total | 439 (100.0%) | 411 (100.0%) |
Families and Households in Wheelwright
Median Family Size in Wheelwright
The median family size in Wheelwright is 3.19 persons per family, with single male/father families (5 | 3.1%) accounting for the largest median family size of 8.4 persons per family. On the other hand, single female/mother families (31 | 19.1%) represent the smallest median family size with 2.42 persons per family.
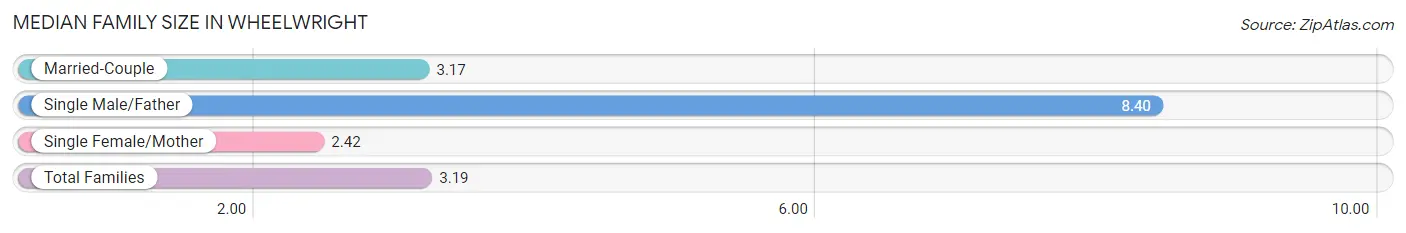
| Family Type | # Families | Family Size |
| Married-Couple | 126 (77.8%) | 3.17 |
| Single Male/Father | 5 (3.1%) | 8.40 |
| Single Female/Mother | 31 (19.1%) | 2.42 |
| Total Families | 162 (100.0%) | 3.19 |
Median Household Size in Wheelwright
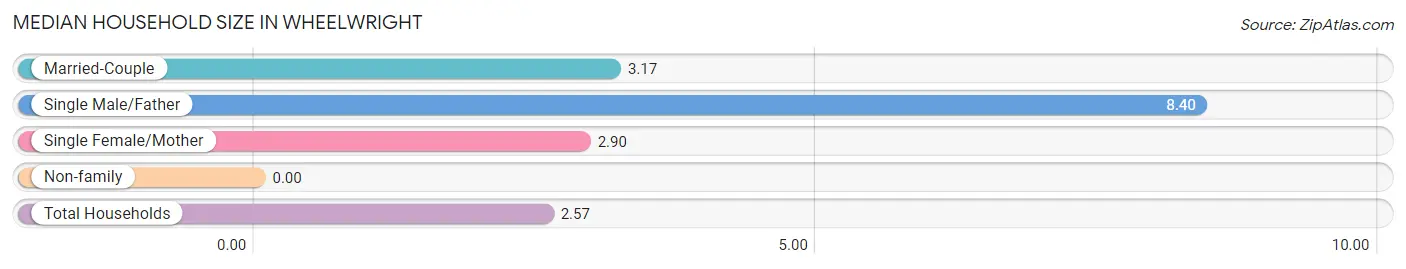
| Household Type | # Households | Household Size |
| Married-Couple | 126 (53.6%) | 3.17 |
| Single Male/Father | 5 (2.1%) | 8.40 |
| Single Female/Mother | 31 (13.2%) | 2.90 |
| Non-family | 73 (31.1%) | - |
| Total Households | 235 (100.0%) | 2.57 |
Household Size by Marriage Status in Wheelwright
Out of a total of 235 households in Wheelwright, 162 (68.9%) are family households, while 73 (31.1%) are nonfamily households. The most numerous type of family households are 2-person households, comprising 62, and the most common type of nonfamily households are 1-person households, comprising 73.
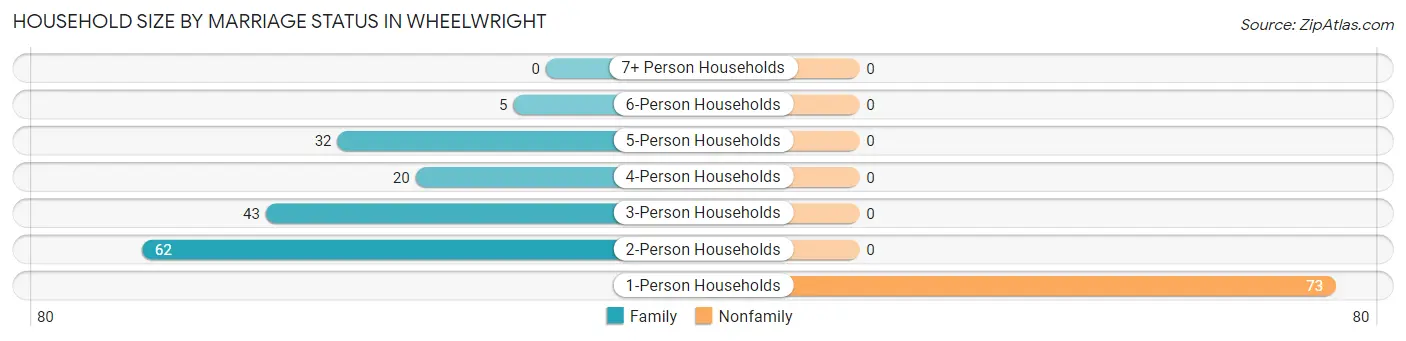
| Household Size | Family Households | Nonfamily Households |
| 1-Person Households | - | 73 (31.1%) |
| 2-Person Households | 62 (26.4%) | 0 (0.0%) |
| 3-Person Households | 43 (18.3%) | 0 (0.0%) |
| 4-Person Households | 20 (8.5%) | 0 (0.0%) |
| 5-Person Households | 32 (13.6%) | 0 (0.0%) |
| 6-Person Households | 5 (2.1%) | 0 (0.0%) |
| 7+ Person Households | 0 (0.0%) | 0 (0.0%) |
| Total | 162 (68.9%) | 73 (31.1%) |
Female Fertility in Wheelwright
Fertility by Age in Wheelwright
Average fertility rate in Wheelwright is 29.0 births per 1,000 women. Women in the age bracket of 20 to 34 years have the highest fertility rate with 67.0 births per 1,000 women. Women in the age bracket of 20 to 34 years acount for 100.0% of all women with births.
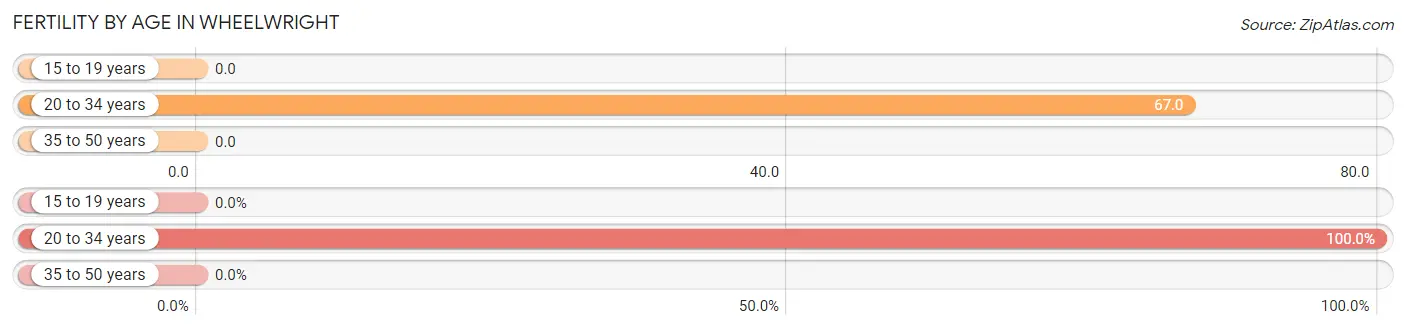
| Age Bracket | Women with Births | Births / 1,000 Women |
| 15 to 19 years | 0 (0.0%) | 0.0 |
| 20 to 34 years | 6 (100.0%) | 67.0 |
| 35 to 50 years | 0 (0.0%) | 0.0 |
| Total | 6 (100.0%) | 29.0 |
Fertility by Age by Marriage Status in Wheelwright
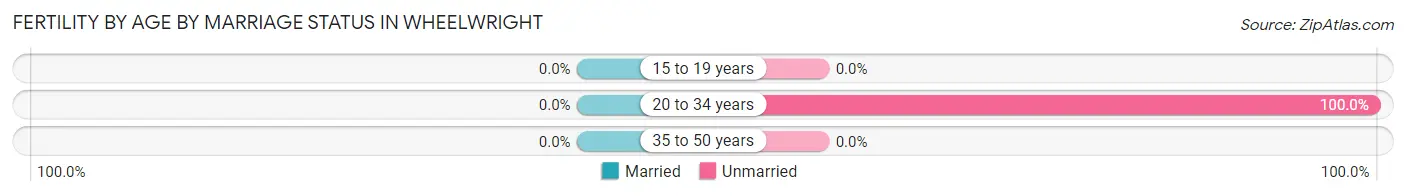
| Age Bracket | Married | Unmarried |
| 15 to 19 years | 0 (0.0%) | 0 (0.0%) |
| 20 to 34 years | 0 (0.0%) | 6 (100.0%) |
| 35 to 50 years | 0 (0.0%) | 0 (0.0%) |
| Total | 0 (0.0%) | 6 (100.0%) |
Fertility by Education in Wheelwright
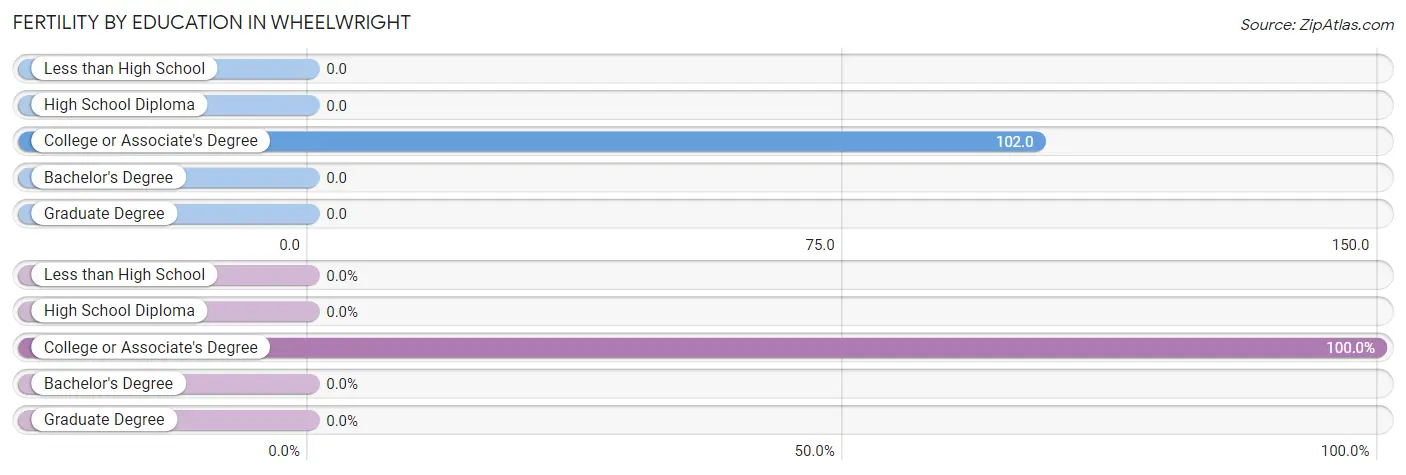
| Educational Attainment | Women with Births | Births / 1,000 Women |
| Less than High School | 0 (0.0%) | 0.0 |
| High School Diploma | 0 (0.0%) | 0.0 |
| College or Associate's Degree | 6 (100.0%) | 102.0 |
| Bachelor's Degree | 0 (0.0%) | 0.0 |
| Graduate Degree | 0 (0.0%) | 0.0 |
| Total | 6 (100.0%) | 29.0 |
Fertility by Education by Marriage Status in Wheelwright
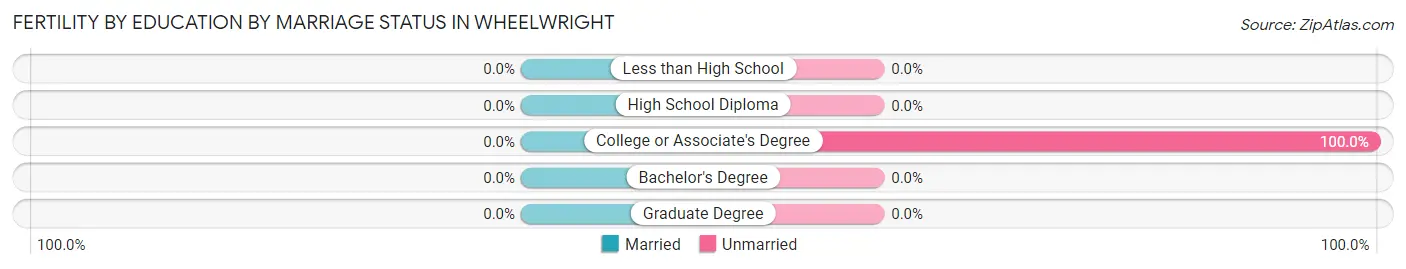
| Educational Attainment | Married | Unmarried |
| Less than High School | 0 (0.0%) | 0 (0.0%) |
| High School Diploma | 0 (0.0%) | 0 (0.0%) |
| College or Associate's Degree | 0 (0.0%) | 6 (100.0%) |
| Bachelor's Degree | 0 (0.0%) | 0 (0.0%) |
| Graduate Degree | 0 (0.0%) | 0 (0.0%) |
| Total | 0 (0.0%) | 6 (100.0%) |
Employment Characteristics in Wheelwright
Employment by Class of Employer in Wheelwright
Among the 181 employed individuals in Wheelwright, private company employees (90 | 49.7%), state government employees (36 | 19.9%), and not-for-profit organizations (30 | 16.6%) make up the most common classes of employment.
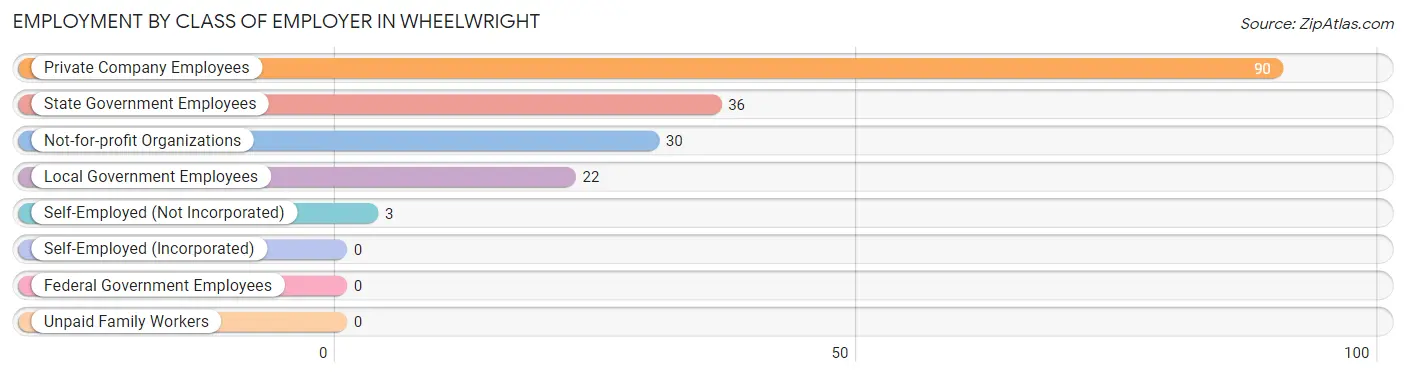
| Employer Class | # Employees | % Employees |
| Private Company Employees | 90 | 49.7% |
| Self-Employed (Incorporated) | 0 | 0.0% |
| Self-Employed (Not Incorporated) | 3 | 1.7% |
| Not-for-profit Organizations | 30 | 16.6% |
| Local Government Employees | 22 | 12.1% |
| State Government Employees | 36 | 19.9% |
| Federal Government Employees | 0 | 0.0% |
| Unpaid Family Workers | 0 | 0.0% |
| Total | 181 | 100.0% |
Employment Status by Age in Wheelwright
According to the labor force statistics for Wheelwright, out of the total population over 16 years of age (707), 29.1% or 206 individuals are in the labor force, with 12.1% or 25 of them unemployed. The age group with the highest labor force participation rate is 35 to 44 years, with 38.9% or 72 individuals in the labor force. Within the labor force, the 35 to 44 years age range has the highest percentage of unemployed individuals, with 34.7% or 25 of them being unemployed.
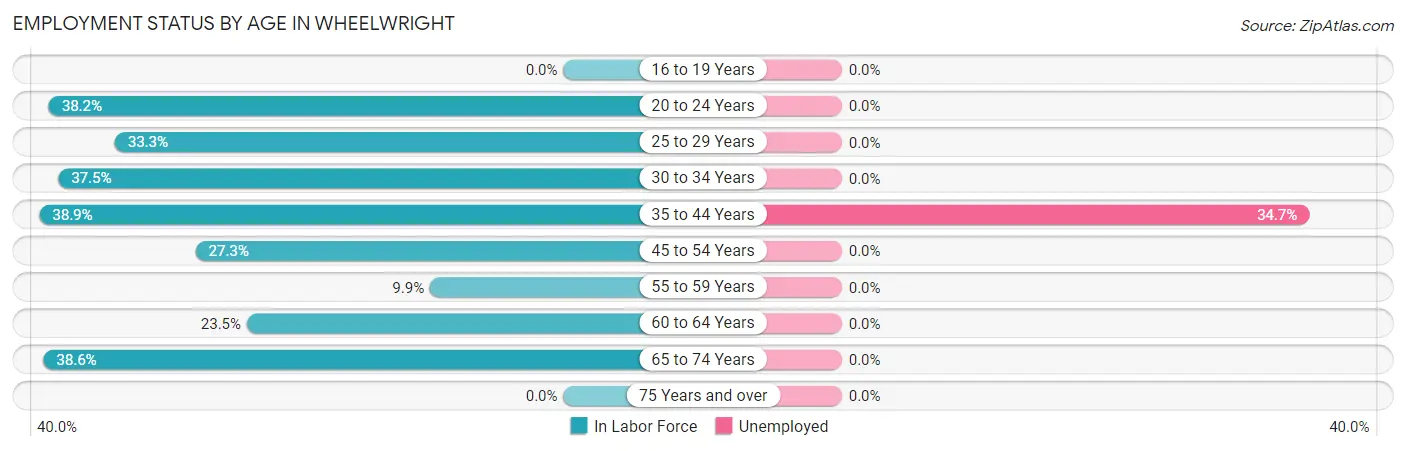
| Age Bracket | In Labor Force | Unemployed |
| 16 to 19 Years | 0 (0.0%) | 0 (0.0%) |
| 20 to 24 Years | 13 (38.2%) | 0 (0.0%) |
| 25 to 29 Years | 18 (33.3%) | 0 (0.0%) |
| 30 to 34 Years | 33 (37.5%) | 0 (0.0%) |
| 35 to 44 Years | 72 (38.9%) | 25 (34.7%) |
| 45 to 54 Years | 21 (27.3%) | 0 (0.0%) |
| 55 to 59 Years | 10 (9.9%) | 0 (0.0%) |
| 60 to 64 Years | 12 (23.5%) | 0 (0.0%) |
| 65 to 74 Years | 27 (38.6%) | 0 (0.0%) |
| 75 Years and over | 0 (0.0%) | 0 (0.0%) |
| Total | 206 (29.1%) | 25 (12.1%) |
Employment Status by Educational Attainment in Wheelwright
According to labor force statistics for Wheelwright, 29.9% of individuals (166) out of the total population between 25 and 64 years of age (556) are in the labor force, with 15.1% or 25 of them being unemployed. The group with the highest labor force participation rate are those with the educational attainment of bachelor's degree or higher, with 94.1% or 32 individuals in the labor force. Within the labor force, individuals with high school diploma education have the highest percentage of unemployment, with 29.1% or 23 of them being unemployed.

| Educational Attainment | In Labor Force | Unemployed |
| Less than High School | 21 (15.1%) | 0 (0.0%) |
| High School Diploma | 79 (33.9%) | 68 (29.1%) |
| College / Associate Degree | 34 (22.7%) | 9 (5.9%) |
| Bachelor's Degree or higher | 32 (94.1%) | 0 (0.0%) |
| Total | 166 (29.9%) | 84 (15.1%) |
Employment Occupations by Sex in Wheelwright
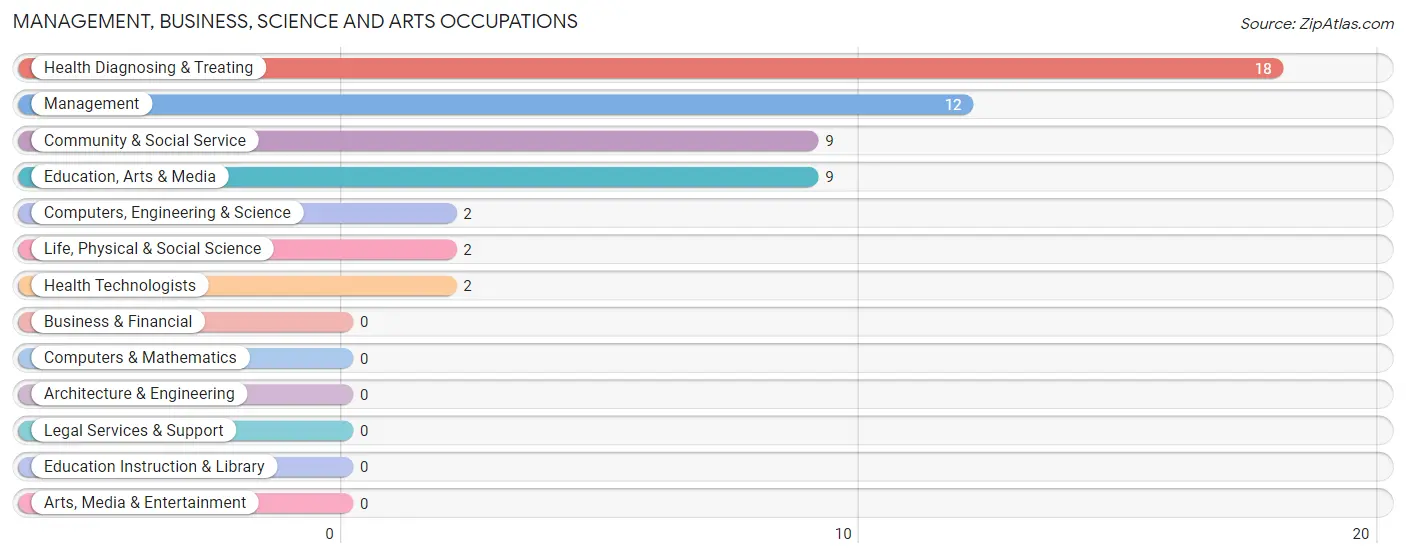
Management, Business, Science and Arts Occupations
The most common Management, Business, Science and Arts occupations in Wheelwright are Health Diagnosing & Treating (18 | 9.9%), Management (12 | 6.6%), Community & Social Service (9 | 5.0%), Education, Arts & Media (9 | 5.0%), and Computers, Engineering & Science (2 | 1.1%).
Management, Business, Science and Arts Occupations by Sex
Within the Management, Business, Science and Arts occupations in Wheelwright, the most male-oriented occupations are Computers, Engineering & Science (100.0%), Life, Physical & Social Science (100.0%), and Community & Social Service (22.2%), while the most female-oriented occupations are Health Diagnosing & Treating (100.0%), Health Technologists (100.0%), and Management (91.7%).
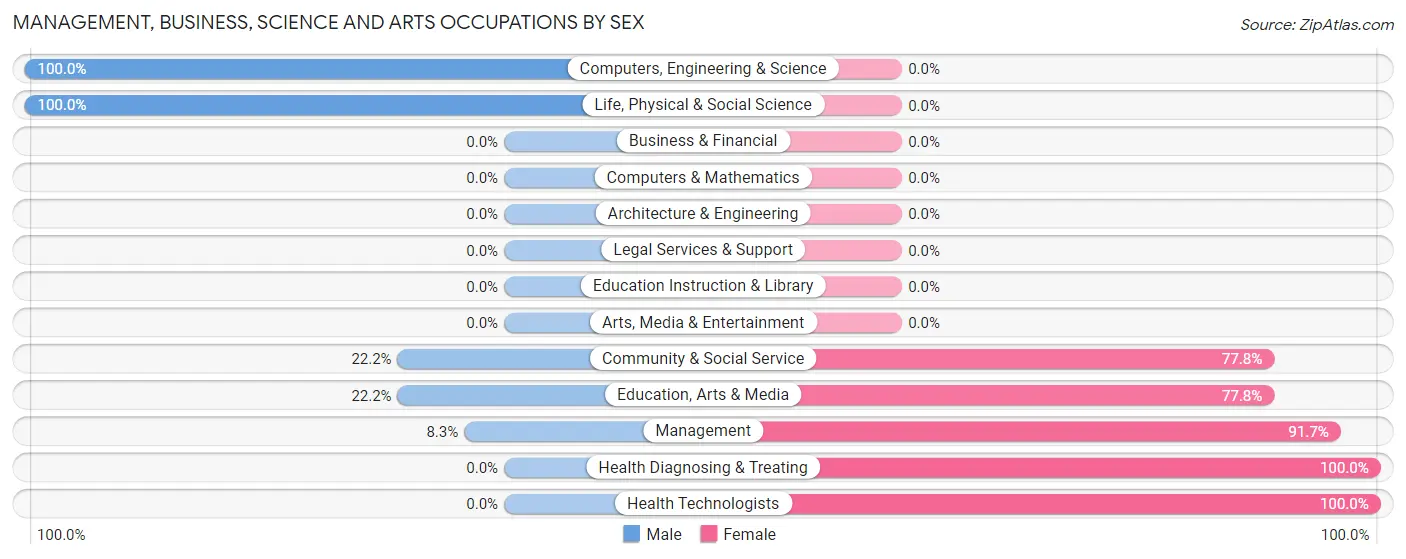
| Occupation | Male | Female |
| Management | 1 (8.3%) | 11 (91.7%) |
| Business & Financial | 0 (0.0%) | 0 (0.0%) |
| Computers, Engineering & Science | 2 (100.0%) | 0 (0.0%) |
| Computers & Mathematics | 0 (0.0%) | 0 (0.0%) |
| Architecture & Engineering | 0 (0.0%) | 0 (0.0%) |
| Life, Physical & Social Science | 2 (100.0%) | 0 (0.0%) |
| Community & Social Service | 2 (22.2%) | 7 (77.8%) |
| Education, Arts & Media | 2 (22.2%) | 7 (77.8%) |
| Legal Services & Support | 0 (0.0%) | 0 (0.0%) |
| Education Instruction & Library | 0 (0.0%) | 0 (0.0%) |
| Arts, Media & Entertainment | 0 (0.0%) | 0 (0.0%) |
| Health Diagnosing & Treating | 0 (0.0%) | 18 (100.0%) |
| Health Technologists | 0 (0.0%) | 2 (100.0%) |
| Total (Category) | 5 (12.2%) | 36 (87.8%) |
| Total (Overall) | 106 (58.6%) | 75 (41.4%) |
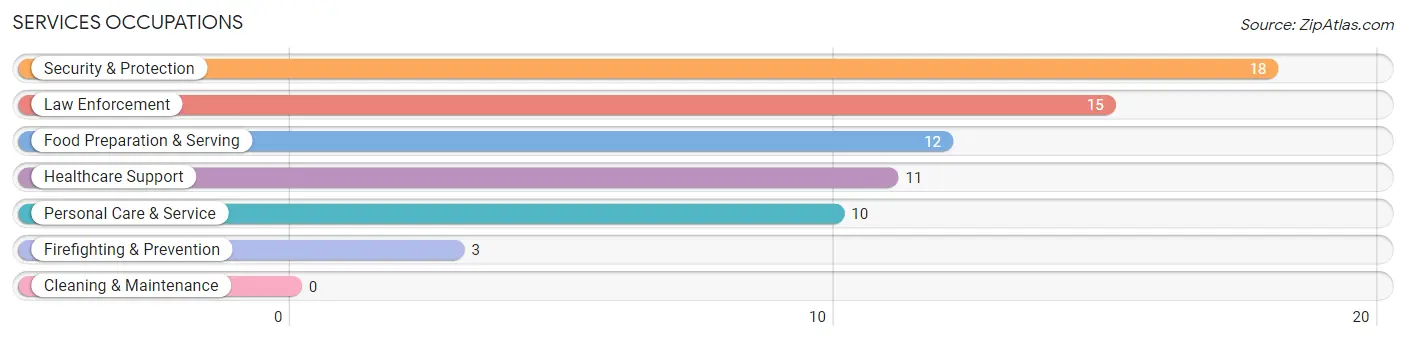
Services Occupations
The most common Services occupations in Wheelwright are Security & Protection (18 | 9.9%), Law Enforcement (15 | 8.3%), Food Preparation & Serving (12 | 6.6%), Healthcare Support (11 | 6.1%), and Personal Care & Service (10 | 5.5%).
Services Occupations by Sex
Within the Services occupations in Wheelwright, the most male-oriented occupations are Firefighting & Prevention (100.0%), Food Preparation & Serving (100.0%), and Security & Protection (66.7%), while the most female-oriented occupations are Healthcare Support (100.0%), Personal Care & Service (100.0%), and Law Enforcement (40.0%).
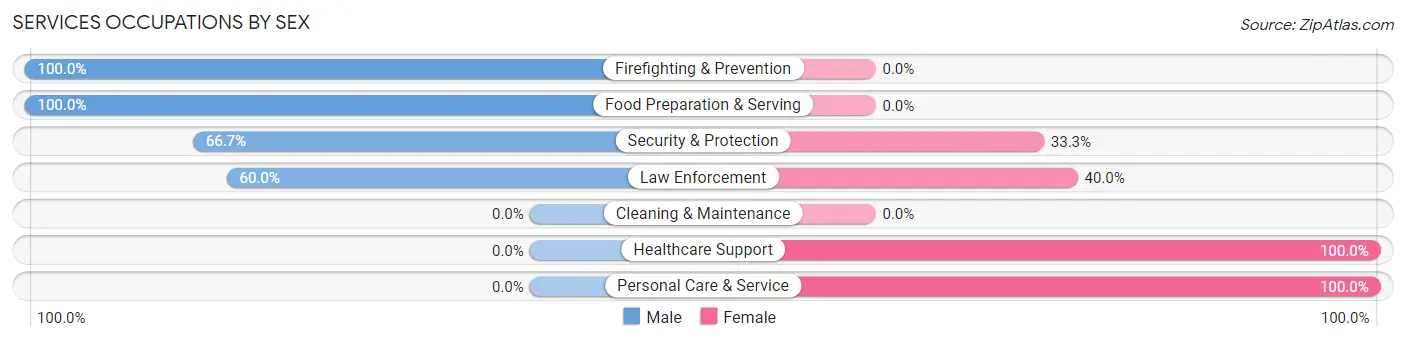
| Occupation | Male | Female |
| Healthcare Support | 0 (0.0%) | 11 (100.0%) |
| Security & Protection | 12 (66.7%) | 6 (33.3%) |
| Firefighting & Prevention | 3 (100.0%) | 0 (0.0%) |
| Law Enforcement | 9 (60.0%) | 6 (40.0%) |
| Food Preparation & Serving | 12 (100.0%) | 0 (0.0%) |
| Cleaning & Maintenance | 0 (0.0%) | 0 (0.0%) |
| Personal Care & Service | 0 (0.0%) | 10 (100.0%) |
| Total (Category) | 24 (47.1%) | 27 (52.9%) |
| Total (Overall) | 106 (58.6%) | 75 (41.4%) |
Sales and Office Occupations
The most common Sales and Office occupations in Wheelwright are Sales & Related (35 | 19.3%), and Office & Administration (21 | 11.6%).

Sales and Office Occupations by Sex

| Occupation | Male | Female |
| Sales & Related | 33 (94.3%) | 2 (5.7%) |
| Office & Administration | 14 (66.7%) | 7 (33.3%) |
| Total (Category) | 47 (83.9%) | 9 (16.1%) |
| Total (Overall) | 106 (58.6%) | 75 (41.4%) |
Natural Resources, Construction and Maintenance Occupations
The most common Natural Resources, Construction and Maintenance occupations in Wheelwright are Construction & Extraction (3 | 1.7%), and Installation, Maintenance & Repair (2 | 1.1%).

Natural Resources, Construction and Maintenance Occupations by Sex

| Occupation | Male | Female |
| Farming, Fishing & Forestry | 0 (0.0%) | 0 (0.0%) |
| Construction & Extraction | 0 (0.0%) | 3 (100.0%) |
| Installation, Maintenance & Repair | 2 (100.0%) | 0 (0.0%) |
| Total (Category) | 2 (40.0%) | 3 (60.0%) |
| Total (Overall) | 106 (58.6%) | 75 (41.4%) |
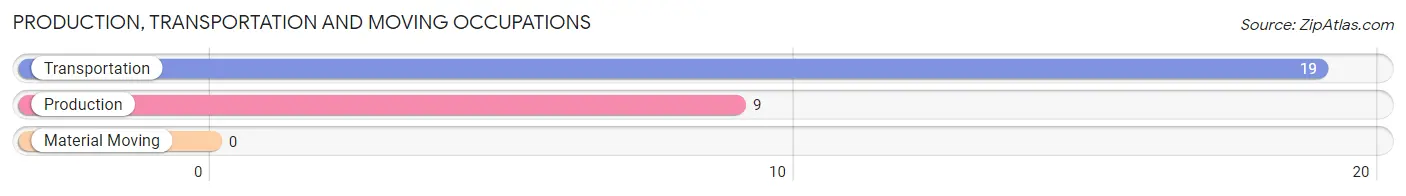
Production, Transportation and Moving Occupations
The most common Production, Transportation and Moving occupations in Wheelwright are Transportation (19 | 10.5%), and Production (9 | 5.0%).
Production, Transportation and Moving Occupations by Sex
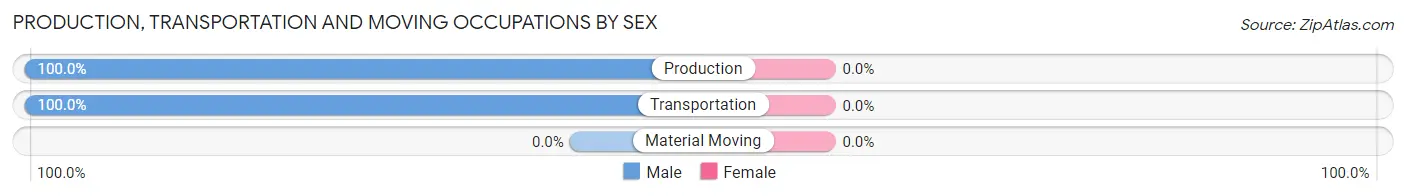
| Occupation | Male | Female |
| Production | 9 (100.0%) | 0 (0.0%) |
| Transportation | 19 (100.0%) | 0 (0.0%) |
| Material Moving | 0 (0.0%) | 0 (0.0%) |
| Total (Category) | 28 (100.0%) | 0 (0.0%) |
| Total (Overall) | 106 (58.6%) | 75 (41.4%) |
Employment Industries by Sex in Wheelwright
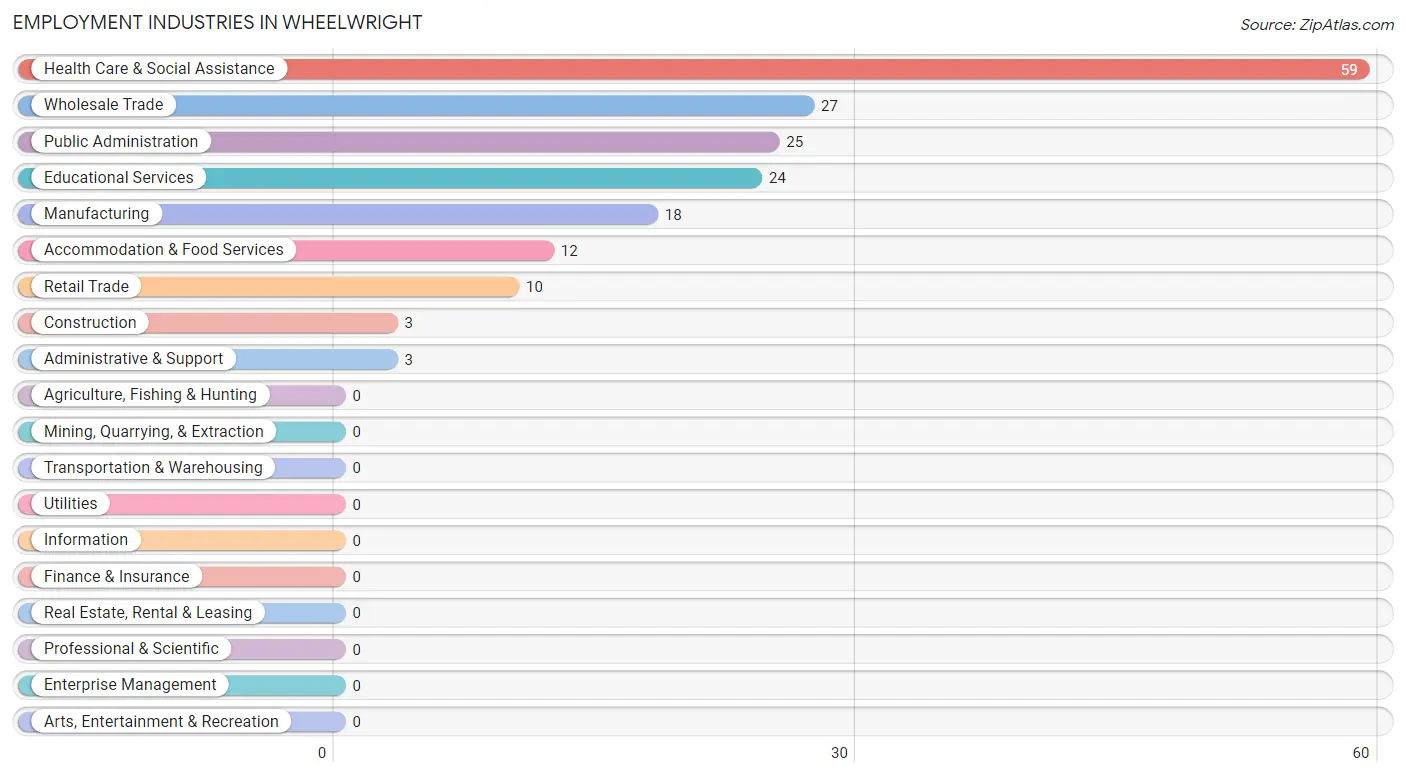
Employment Industries in Wheelwright
The major employment industries in Wheelwright include Health Care & Social Assistance (59 | 32.6%), Wholesale Trade (27 | 14.9%), Public Administration (25 | 13.8%), Educational Services (24 | 13.3%), and Manufacturing (18 | 9.9%).
Employment Industries by Sex in Wheelwright
The Wheelwright industries that see more men than women are Manufacturing (100.0%), Wholesale Trade (100.0%), and Administrative & Support (100.0%), whereas the industries that tend to have a higher number of women are Construction (100.0%), Educational Services (70.8%), and Health Care & Social Assistance (67.8%).
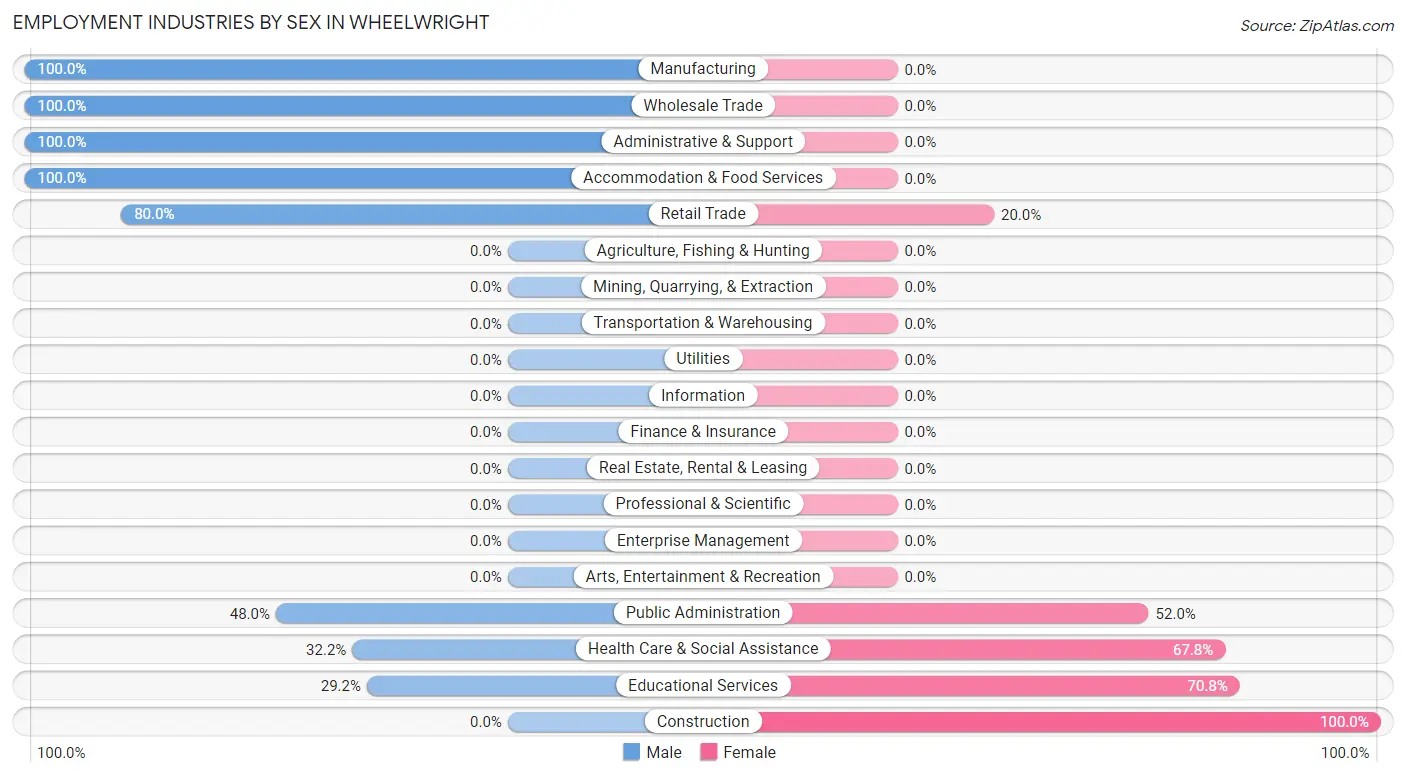
| Industry | Male | Female |
| Agriculture, Fishing & Hunting | 0 (0.0%) | 0 (0.0%) |
| Mining, Quarrying, & Extraction | 0 (0.0%) | 0 (0.0%) |
| Construction | 0 (0.0%) | 3 (100.0%) |
| Manufacturing | 18 (100.0%) | 0 (0.0%) |
| Wholesale Trade | 27 (100.0%) | 0 (0.0%) |
| Retail Trade | 8 (80.0%) | 2 (20.0%) |
| Transportation & Warehousing | 0 (0.0%) | 0 (0.0%) |
| Utilities | 0 (0.0%) | 0 (0.0%) |
| Information | 0 (0.0%) | 0 (0.0%) |
| Finance & Insurance | 0 (0.0%) | 0 (0.0%) |
| Real Estate, Rental & Leasing | 0 (0.0%) | 0 (0.0%) |
| Professional & Scientific | 0 (0.0%) | 0 (0.0%) |
| Enterprise Management | 0 (0.0%) | 0 (0.0%) |
| Administrative & Support | 3 (100.0%) | 0 (0.0%) |
| Educational Services | 7 (29.2%) | 17 (70.8%) |
| Health Care & Social Assistance | 19 (32.2%) | 40 (67.8%) |
| Arts, Entertainment & Recreation | 0 (0.0%) | 0 (0.0%) |
| Accommodation & Food Services | 12 (100.0%) | 0 (0.0%) |
| Public Administration | 12 (48.0%) | 13 (52.0%) |
| Total | 106 (58.6%) | 75 (41.4%) |
Education in Wheelwright
School Enrollment in Wheelwright
The most common levels of schooling among the 154 students in Wheelwright are middle school (51 | 33.1%), college / undergraduate (26 | 16.9%), and elementary school (25 | 16.2%).
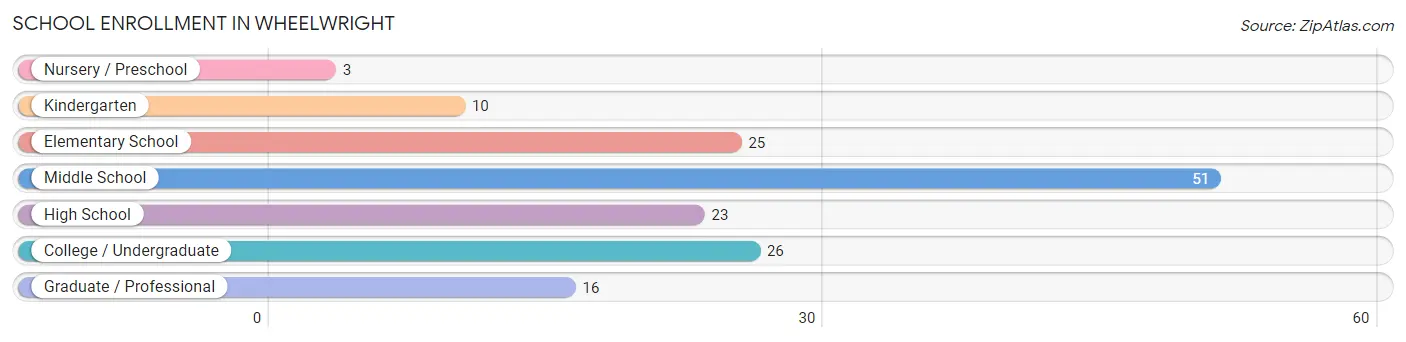
| School Level | # Students | % Students |
| Nursery / Preschool | 3 | 1.9% |
| Kindergarten | 10 | 6.5% |
| Elementary School | 25 | 16.2% |
| Middle School | 51 | 33.1% |
| High School | 23 | 14.9% |
| College / Undergraduate | 26 | 16.9% |
| Graduate / Professional | 16 | 10.4% |
| Total | 154 | 100.0% |
School Enrollment by Age by Funding Source in Wheelwright
Out of a total of 154 students who are enrolled in schools in Wheelwright, 23 (14.9%) attend a private institution, while the remaining 131 (85.1%) are enrolled in public schools. The age group of 35 years and over has the highest likelihood of being enrolled in private schools, with 14 (40.0% in the age bracket) enrolled. Conversely, the age group of 3 to 4 year olds has the lowest likelihood of being enrolled in a private school, with 3 (100.0% in the age bracket) attending a public institution.
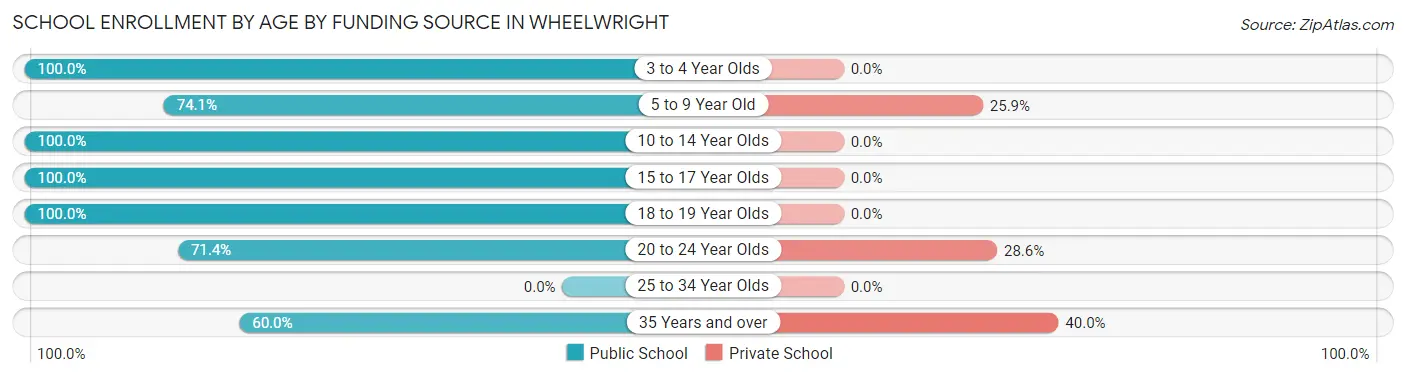
| Age Bracket | Public School | Private School |
| 3 to 4 Year Olds | 3 (100.0%) | 0 (0.0%) |
| 5 to 9 Year Old | 20 (74.1%) | 7 (25.9%) |
| 10 to 14 Year Olds | 59 (100.0%) | 0 (0.0%) |
| 15 to 17 Year Olds | 15 (100.0%) | 0 (0.0%) |
| 18 to 19 Year Olds | 8 (100.0%) | 0 (0.0%) |
| 20 to 24 Year Olds | 5 (71.4%) | 2 (28.6%) |
| 25 to 34 Year Olds | 0 (0.0%) | 0 (0.0%) |
| 35 Years and over | 21 (60.0%) | 14 (40.0%) |
| Total | 131 (85.1%) | 23 (14.9%) |
Educational Attainment by Field of Study in Wheelwright
Engineering (17 | 28.8%), business (14 | 23.7%), communications (11 | 18.6%), science & technology (8 | 13.6%), and psychology (7 | 11.9%) are the most common fields of study among 59 individuals in Wheelwright who have obtained a bachelor's degree or higher.
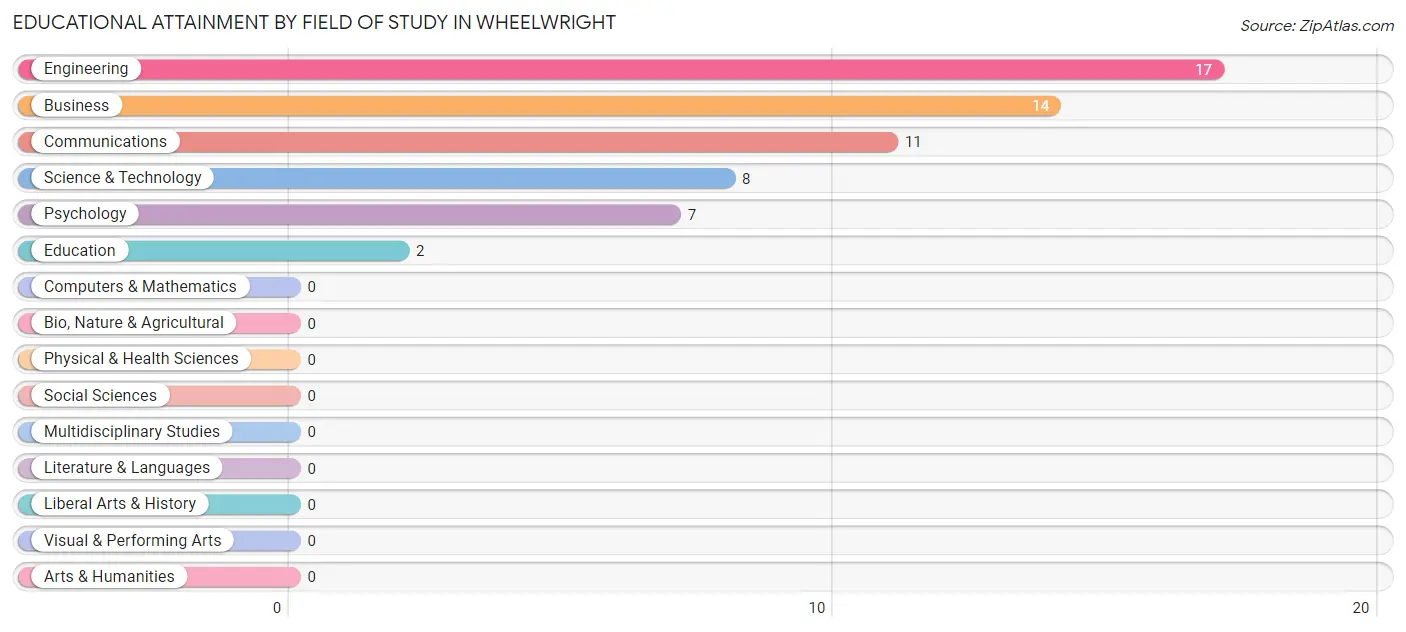
| Field of Study | # Graduates | % Graduates |
| Computers & Mathematics | 0 | 0.0% |
| Bio, Nature & Agricultural | 0 | 0.0% |
| Physical & Health Sciences | 0 | 0.0% |
| Psychology | 7 | 11.9% |
| Social Sciences | 0 | 0.0% |
| Engineering | 17 | 28.8% |
| Multidisciplinary Studies | 0 | 0.0% |
| Science & Technology | 8 | 13.6% |
| Business | 14 | 23.7% |
| Education | 2 | 3.4% |
| Literature & Languages | 0 | 0.0% |
| Liberal Arts & History | 0 | 0.0% |
| Visual & Performing Arts | 0 | 0.0% |
| Communications | 11 | 18.6% |
| Arts & Humanities | 0 | 0.0% |
| Total | 59 | 100.0% |
Transportation & Commute in Wheelwright
Vehicle Availability by Sex in Wheelwright
The most prevalent vehicle ownership categories in Wheelwright are males with 2 vehicles (57, accounting for 53.8%) and females with 2 vehicles (51, making up 76.0%).
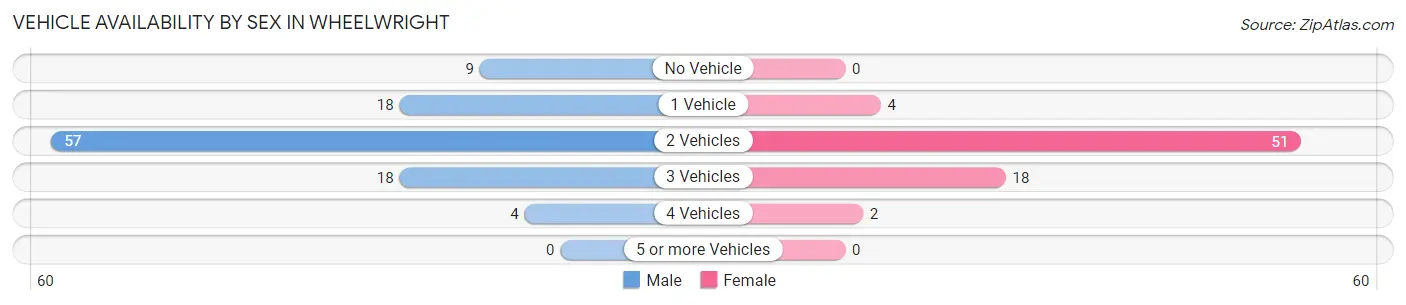
| Vehicles Available | Male | Female |
| No Vehicle | 9 (8.5%) | 0 (0.0%) |
| 1 Vehicle | 18 (17.0%) | 4 (5.3%) |
| 2 Vehicles | 57 (53.8%) | 51 (68.0%) |
| 3 Vehicles | 18 (17.0%) | 18 (24.0%) |
| 4 Vehicles | 4 (3.8%) | 2 (2.7%) |
| 5 or more Vehicles | 0 (0.0%) | 0 (0.0%) |
| Total | 106 (100.0%) | 75 (100.0%) |
Commute Time in Wheelwright
The most frequently occuring commute durations in Wheelwright are 45 to 59 minutes (73 commuters, 40.3%), 30 to 34 minutes (44 commuters, 24.3%), and 40 to 44 minutes (18 commuters, 9.9%).
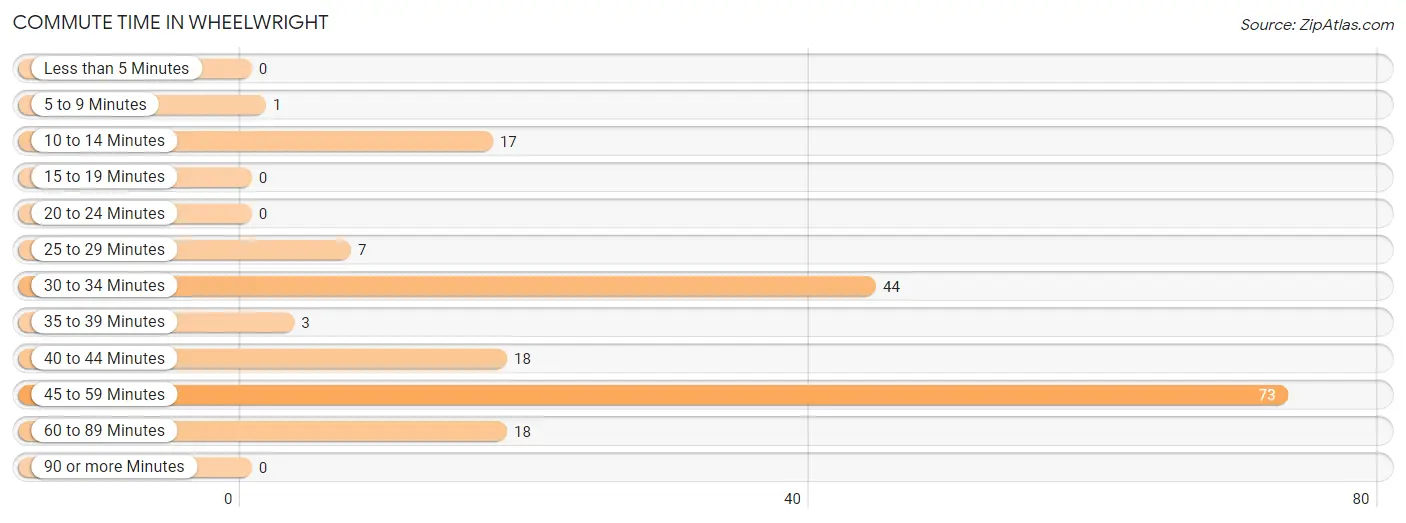
| Commute Time | # Commuters | % Commuters |
| Less than 5 Minutes | 0 | 0.0% |
| 5 to 9 Minutes | 1 | 0.5% |
| 10 to 14 Minutes | 17 | 9.4% |
| 15 to 19 Minutes | 0 | 0.0% |
| 20 to 24 Minutes | 0 | 0.0% |
| 25 to 29 Minutes | 7 | 3.9% |
| 30 to 34 Minutes | 44 | 24.3% |
| 35 to 39 Minutes | 3 | 1.7% |
| 40 to 44 Minutes | 18 | 9.9% |
| 45 to 59 Minutes | 73 | 40.3% |
| 60 to 89 Minutes | 18 | 9.9% |
| 90 or more Minutes | 0 | 0.0% |
Commute Time by Sex in Wheelwright
The most common commute times in Wheelwright are 45 to 59 minutes (60 commuters, 56.6%) for males and 30 to 34 minutes (28 commuters, 37.3%) for females.
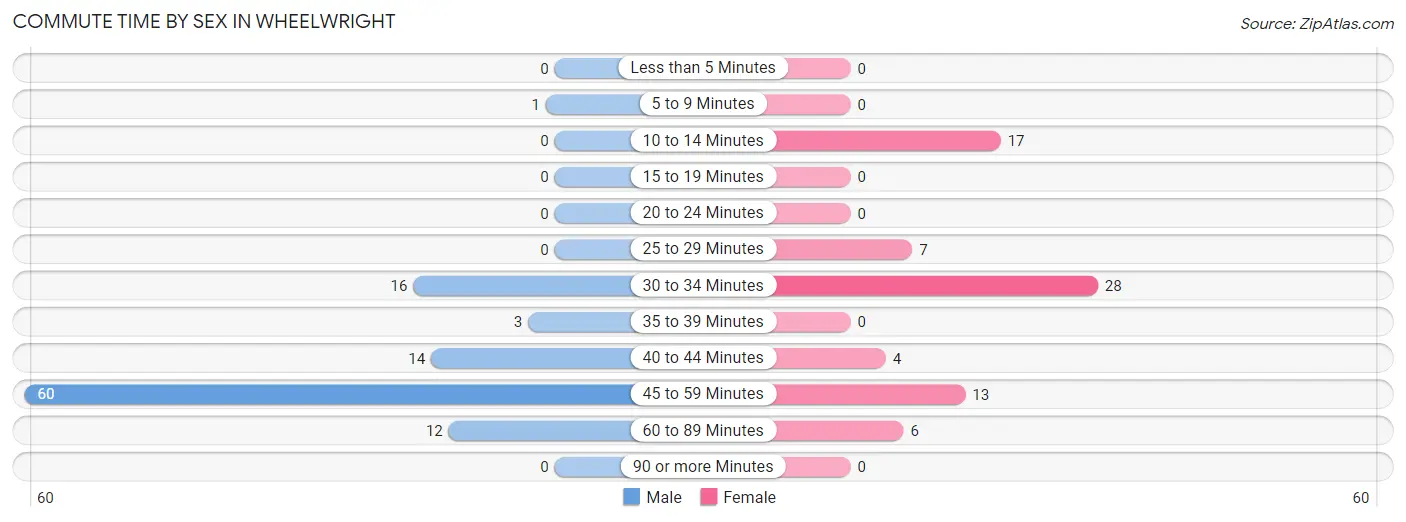
| Commute Time | Male | Female |
| Less than 5 Minutes | 0 (0.0%) | 0 (0.0%) |
| 5 to 9 Minutes | 1 (0.9%) | 0 (0.0%) |
| 10 to 14 Minutes | 0 (0.0%) | 17 (22.7%) |
| 15 to 19 Minutes | 0 (0.0%) | 0 (0.0%) |
| 20 to 24 Minutes | 0 (0.0%) | 0 (0.0%) |
| 25 to 29 Minutes | 0 (0.0%) | 7 (9.3%) |
| 30 to 34 Minutes | 16 (15.1%) | 28 (37.3%) |
| 35 to 39 Minutes | 3 (2.8%) | 0 (0.0%) |
| 40 to 44 Minutes | 14 (13.2%) | 4 (5.3%) |
| 45 to 59 Minutes | 60 (56.6%) | 13 (17.3%) |
| 60 to 89 Minutes | 12 (11.3%) | 6 (8.0%) |
| 90 or more Minutes | 0 (0.0%) | 0 (0.0%) |
Time of Departure to Work by Sex in Wheelwright
The most frequent times of departure to work in Wheelwright are 6:30 AM to 6:59 AM (27, 25.5%) for males and 6:00 AM to 6:29 AM (17, 22.7%) for females.
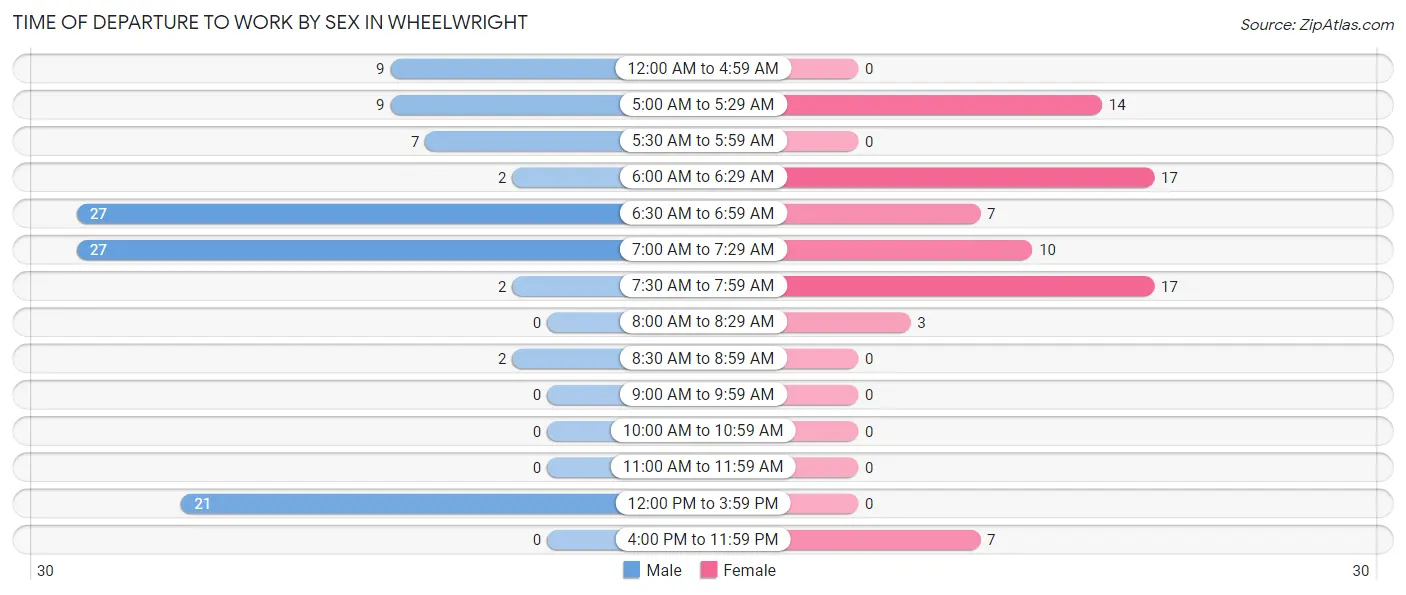
| Time of Departure | Male | Female |
| 12:00 AM to 4:59 AM | 9 (8.5%) | 0 (0.0%) |
| 5:00 AM to 5:29 AM | 9 (8.5%) | 14 (18.7%) |
| 5:30 AM to 5:59 AM | 7 (6.6%) | 0 (0.0%) |
| 6:00 AM to 6:29 AM | 2 (1.9%) | 17 (22.7%) |
| 6:30 AM to 6:59 AM | 27 (25.5%) | 7 (9.3%) |
| 7:00 AM to 7:29 AM | 27 (25.5%) | 10 (13.3%) |
| 7:30 AM to 7:59 AM | 2 (1.9%) | 17 (22.7%) |
| 8:00 AM to 8:29 AM | 0 (0.0%) | 3 (4.0%) |
| 8:30 AM to 8:59 AM | 2 (1.9%) | 0 (0.0%) |
| 9:00 AM to 9:59 AM | 0 (0.0%) | 0 (0.0%) |
| 10:00 AM to 10:59 AM | 0 (0.0%) | 0 (0.0%) |
| 11:00 AM to 11:59 AM | 0 (0.0%) | 0 (0.0%) |
| 12:00 PM to 3:59 PM | 21 (19.8%) | 0 (0.0%) |
| 4:00 PM to 11:59 PM | 0 (0.0%) | 7 (9.3%) |
| Total | 106 (100.0%) | 75 (100.0%) |
Housing Occupancy in Wheelwright
Occupancy by Ownership in Wheelwright
Of the total 235 dwellings in Wheelwright, owner-occupied units account for 157 (66.8%), while renter-occupied units make up 78 (33.2%).
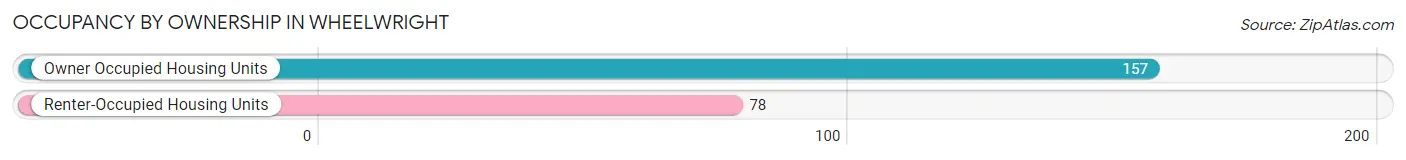
| Occupancy | # Housing Units | % Housing Units |
| Owner Occupied Housing Units | 157 | 66.8% |
| Renter-Occupied Housing Units | 78 | 33.2% |
| Total Occupied Housing Units | 235 | 100.0% |
Occupancy by Household Size in Wheelwright
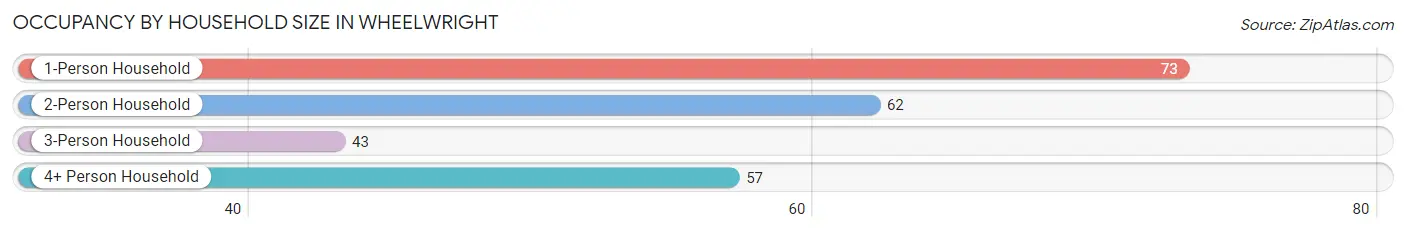
| Household Size | # Housing Units | % Housing Units |
| 1-Person Household | 73 | 31.1% |
| 2-Person Household | 62 | 26.4% |
| 3-Person Household | 43 | 18.3% |
| 4+ Person Household | 57 | 24.3% |
| Total Housing Units | 235 | 100.0% |
Occupancy by Ownership by Household Size in Wheelwright
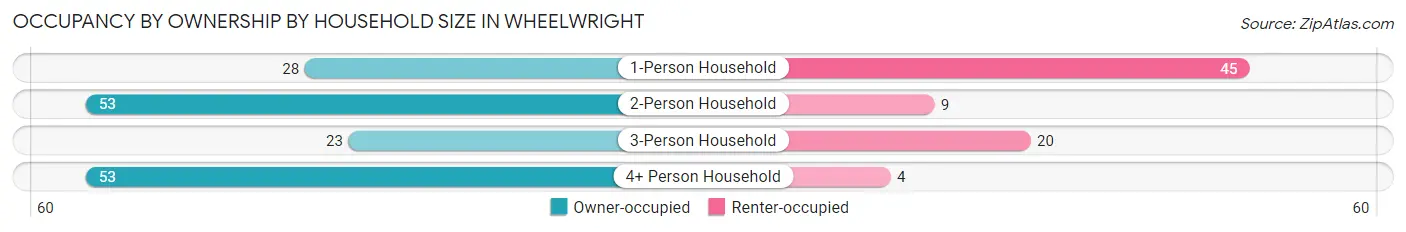
| Household Size | Owner-occupied | Renter-occupied |
| 1-Person Household | 28 (38.4%) | 45 (61.6%) |
| 2-Person Household | 53 (85.5%) | 9 (14.5%) |
| 3-Person Household | 23 (53.5%) | 20 (46.5%) |
| 4+ Person Household | 53 (93.0%) | 4 (7.0%) |
| Total Housing Units | 157 (66.8%) | 78 (33.2%) |
Occupancy by Educational Attainment in Wheelwright
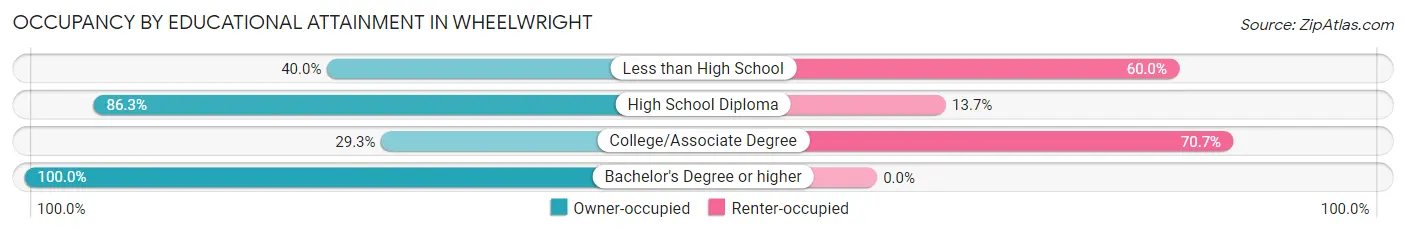
| Household Size | Owner-occupied | Renter-occupied |
| Less than High School | 22 (40.0%) | 33 (60.0%) |
| High School Diploma | 101 (86.3%) | 16 (13.7%) |
| College/Associate Degree | 12 (29.3%) | 29 (70.7%) |
| Bachelor's Degree or higher | 22 (100.0%) | 0 (0.0%) |
Occupancy by Age of Householder in Wheelwright
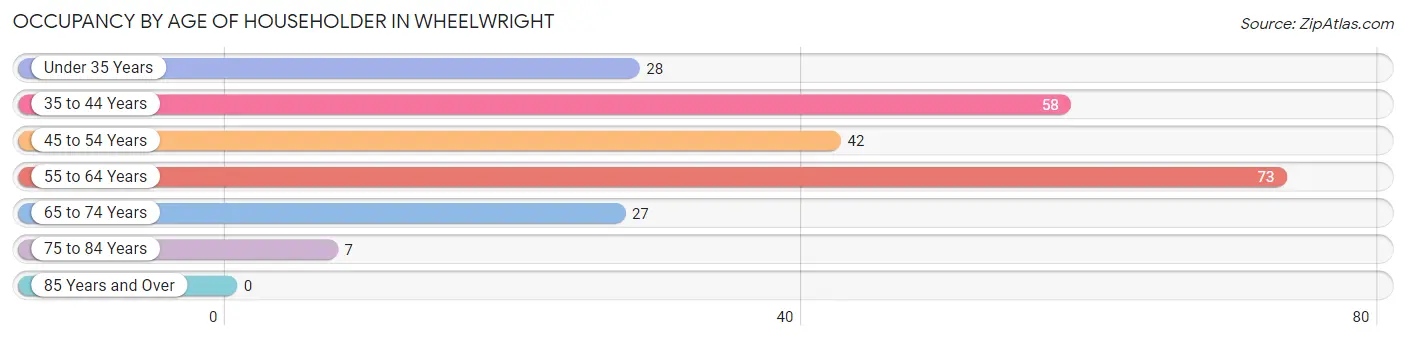
| Age Bracket | # Households | % Households |
| Under 35 Years | 28 | 11.9% |
| 35 to 44 Years | 58 | 24.7% |
| 45 to 54 Years | 42 | 17.9% |
| 55 to 64 Years | 73 | 31.1% |
| 65 to 74 Years | 27 | 11.5% |
| 75 to 84 Years | 7 | 3.0% |
| 85 Years and Over | 0 | 0.0% |
| Total | 235 | 100.0% |
Housing Finances in Wheelwright
Median Income by Occupancy in Wheelwright
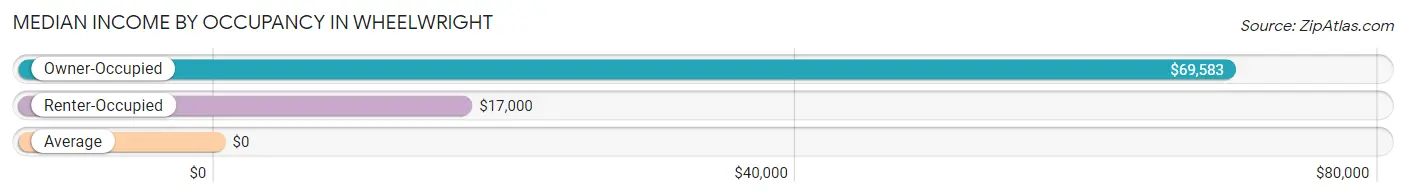
| Occupancy Type | # Households | Median Income |
| Owner-Occupied | 157 (66.8%) | $69,583 |
| Renter-Occupied | 78 (33.2%) | $17,000 |
| Average | 235 (100.0%) | $0 |
Occupancy by Householder Income Bracket in Wheelwright
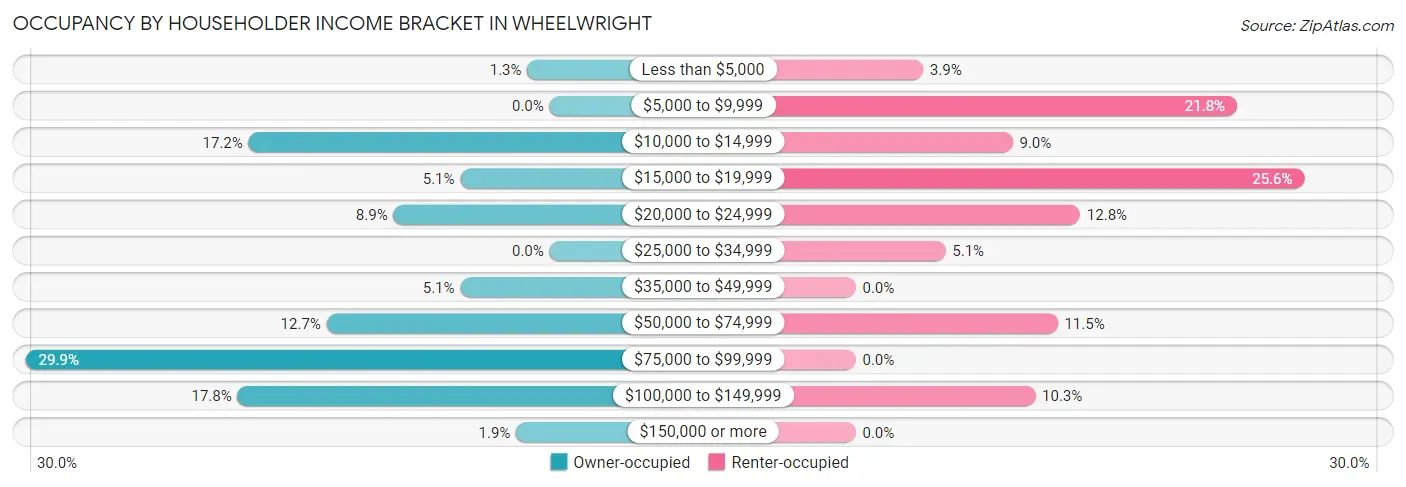
| Income Bracket | Owner-occupied | Renter-occupied |
| Less than $5,000 | 2 (1.3%) | 3 (3.8%) |
| $5,000 to $9,999 | 0 (0.0%) | 17 (21.8%) |
| $10,000 to $14,999 | 27 (17.2%) | 7 (9.0%) |
| $15,000 to $19,999 | 8 (5.1%) | 20 (25.6%) |
| $20,000 to $24,999 | 14 (8.9%) | 10 (12.8%) |
| $25,000 to $34,999 | 0 (0.0%) | 4 (5.1%) |
| $35,000 to $49,999 | 8 (5.1%) | 0 (0.0%) |
| $50,000 to $74,999 | 20 (12.7%) | 9 (11.5%) |
| $75,000 to $99,999 | 47 (29.9%) | 0 (0.0%) |
| $100,000 to $149,999 | 28 (17.8%) | 8 (10.3%) |
| $150,000 or more | 3 (1.9%) | 0 (0.0%) |
| Total | 157 (100.0%) | 78 (100.0%) |
Monthly Housing Cost Tiers in Wheelwright
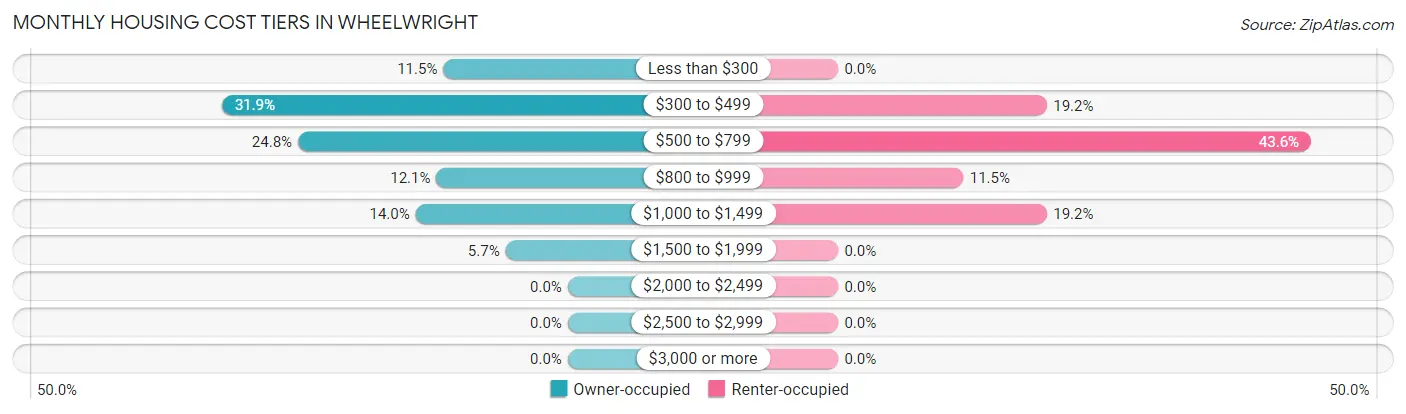
| Monthly Cost | Owner-occupied | Renter-occupied |
| Less than $300 | 18 (11.5%) | 0 (0.0%) |
| $300 to $499 | 50 (31.9%) | 15 (19.2%) |
| $500 to $799 | 39 (24.8%) | 34 (43.6%) |
| $800 to $999 | 19 (12.1%) | 9 (11.5%) |
| $1,000 to $1,499 | 22 (14.0%) | 15 (19.2%) |
| $1,500 to $1,999 | 9 (5.7%) | 0 (0.0%) |
| $2,000 to $2,499 | 0 (0.0%) | 0 (0.0%) |
| $2,500 to $2,999 | 0 (0.0%) | 0 (0.0%) |
| $3,000 or more | 0 (0.0%) | 0 (0.0%) |
| Total | 157 (100.0%) | 78 (100.0%) |
Physical Housing Characteristics in Wheelwright
Housing Structures in Wheelwright
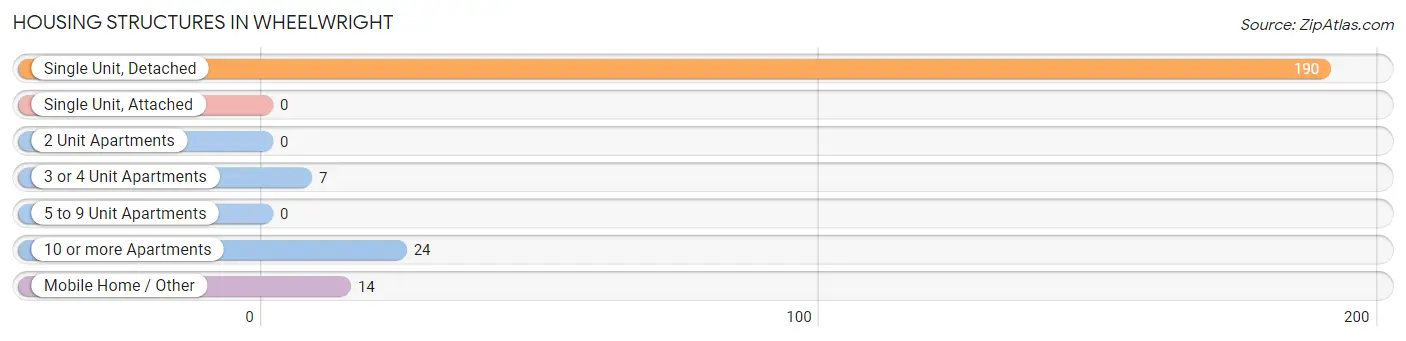
| Structure Type | # Housing Units | % Housing Units |
| Single Unit, Detached | 190 | 80.8% |
| Single Unit, Attached | 0 | 0.0% |
| 2 Unit Apartments | 0 | 0.0% |
| 3 or 4 Unit Apartments | 7 | 3.0% |
| 5 to 9 Unit Apartments | 0 | 0.0% |
| 10 or more Apartments | 24 | 10.2% |
| Mobile Home / Other | 14 | 6.0% |
| Total | 235 | 100.0% |
Housing Structures by Occupancy in Wheelwright
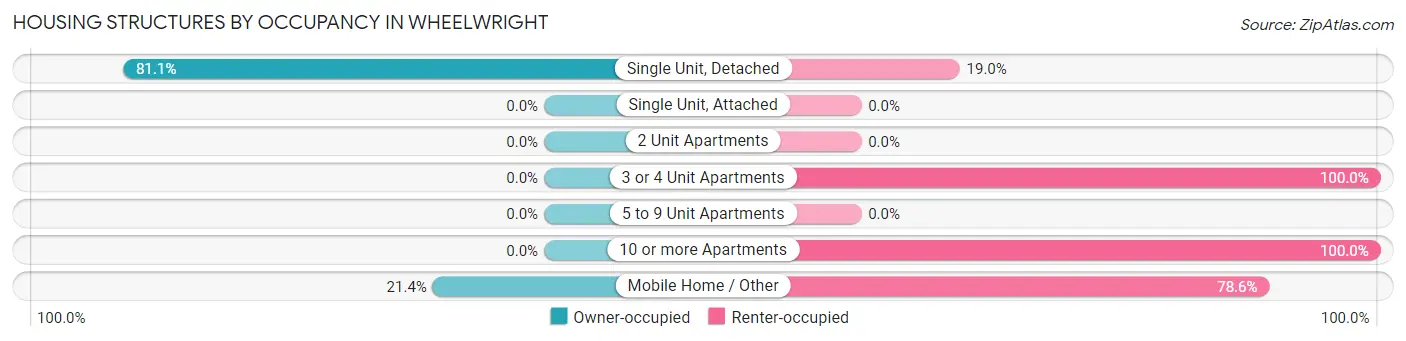
| Structure Type | Owner-occupied | Renter-occupied |
| Single Unit, Detached | 154 (81.0%) | 36 (19.0%) |
| Single Unit, Attached | 0 (0.0%) | 0 (0.0%) |
| 2 Unit Apartments | 0 (0.0%) | 0 (0.0%) |
| 3 or 4 Unit Apartments | 0 (0.0%) | 7 (100.0%) |
| 5 to 9 Unit Apartments | 0 (0.0%) | 0 (0.0%) |
| 10 or more Apartments | 0 (0.0%) | 24 (100.0%) |
| Mobile Home / Other | 3 (21.4%) | 11 (78.6%) |
| Total | 157 (66.8%) | 78 (33.2%) |
Housing Structures by Number of Rooms in Wheelwright
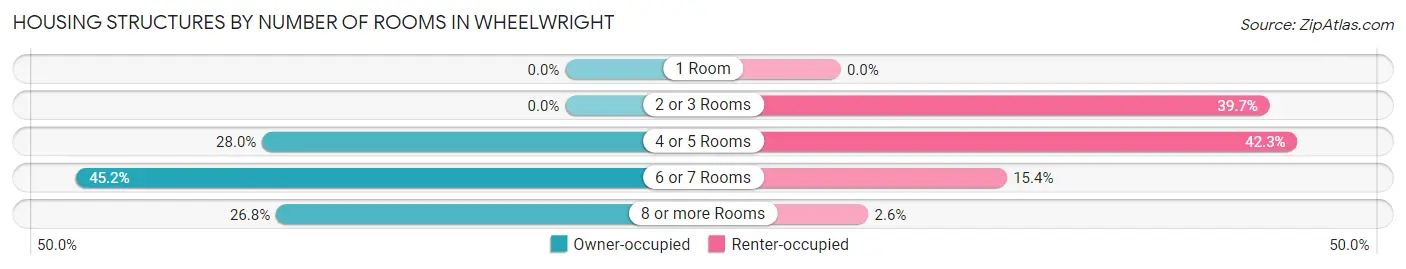
| Number of Rooms | Owner-occupied | Renter-occupied |
| 1 Room | 0 (0.0%) | 0 (0.0%) |
| 2 or 3 Rooms | 0 (0.0%) | 31 (39.7%) |
| 4 or 5 Rooms | 44 (28.0%) | 33 (42.3%) |
| 6 or 7 Rooms | 71 (45.2%) | 12 (15.4%) |
| 8 or more Rooms | 42 (26.8%) | 2 (2.6%) |
| Total | 157 (100.0%) | 78 (100.0%) |
Housing Structure by Heating Type in Wheelwright
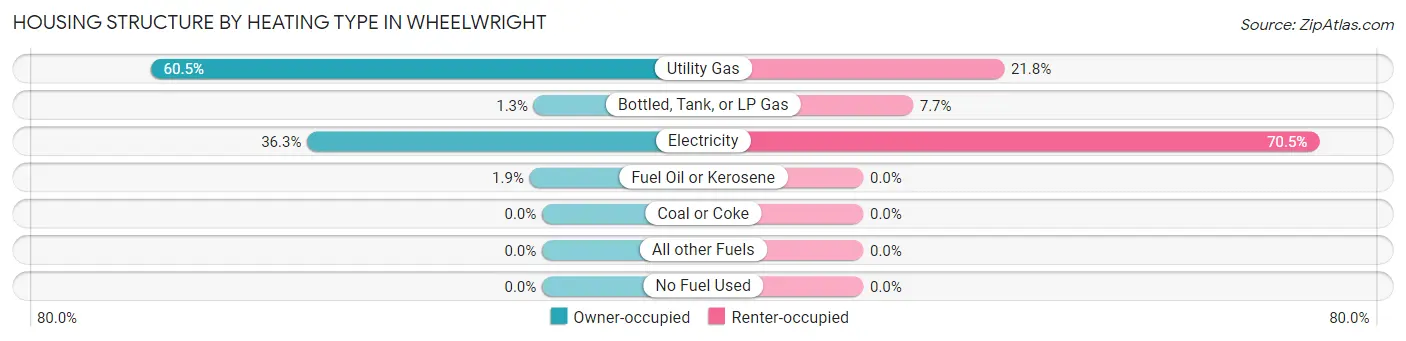
| Heating Type | Owner-occupied | Renter-occupied |
| Utility Gas | 95 (60.5%) | 17 (21.8%) |
| Bottled, Tank, or LP Gas | 2 (1.3%) | 6 (7.7%) |
| Electricity | 57 (36.3%) | 55 (70.5%) |
| Fuel Oil or Kerosene | 3 (1.9%) | 0 (0.0%) |
| Coal or Coke | 0 (0.0%) | 0 (0.0%) |
| All other Fuels | 0 (0.0%) | 0 (0.0%) |
| No Fuel Used | 0 (0.0%) | 0 (0.0%) |
| Total | 157 (100.0%) | 78 (100.0%) |
Household Vehicle Usage in Wheelwright
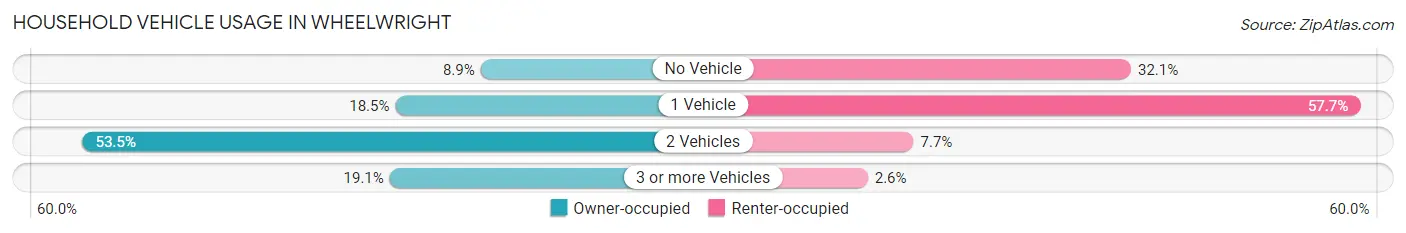
| Vehicles per Household | Owner-occupied | Renter-occupied |
| No Vehicle | 14 (8.9%) | 25 (32.1%) |
| 1 Vehicle | 29 (18.5%) | 45 (57.7%) |
| 2 Vehicles | 84 (53.5%) | 6 (7.7%) |
| 3 or more Vehicles | 30 (19.1%) | 2 (2.6%) |
| Total | 157 (100.0%) | 78 (100.0%) |
Real Estate & Mortgages in Wheelwright
Real Estate and Mortgage Overview in Wheelwright
| Characteristic | Without Mortgage | With Mortgage |
| Housing Units | 94 | 63 |
| Median Property Value | $40,700 | $112,800 |
| Median Household Income | $55,833 | $0 |
| Monthly Housing Costs | $435 | $0 |
| Real Estate Taxes | $345 | $9 |
Property Value by Mortgage Status in Wheelwright
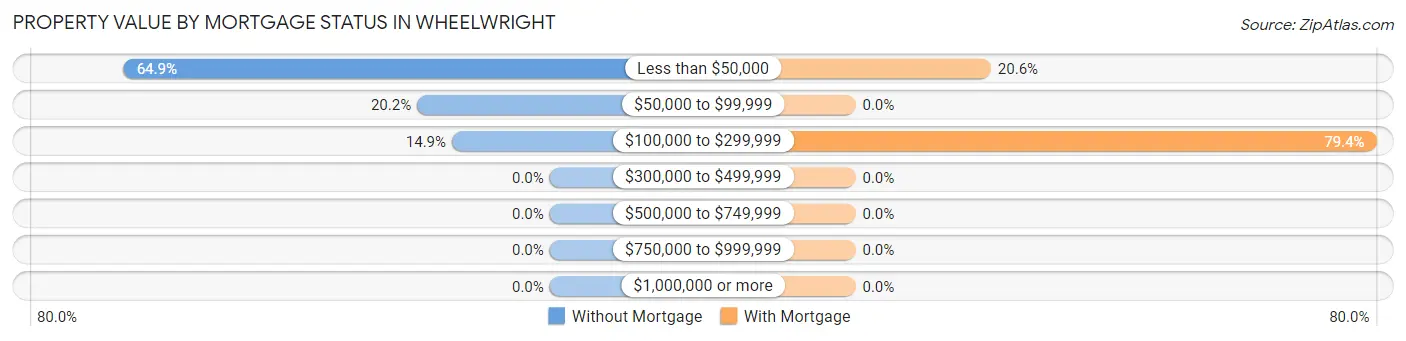
| Property Value | Without Mortgage | With Mortgage |
| Less than $50,000 | 61 (64.9%) | 13 (20.6%) |
| $50,000 to $99,999 | 19 (20.2%) | 0 (0.0%) |
| $100,000 to $299,999 | 14 (14.9%) | 50 (79.4%) |
| $300,000 to $499,999 | 0 (0.0%) | 0 (0.0%) |
| $500,000 to $749,999 | 0 (0.0%) | 0 (0.0%) |
| $750,000 to $999,999 | 0 (0.0%) | 0 (0.0%) |
| $1,000,000 or more | 0 (0.0%) | 0 (0.0%) |
| Total | 94 (100.0%) | 63 (100.0%) |
Household Income by Mortgage Status in Wheelwright
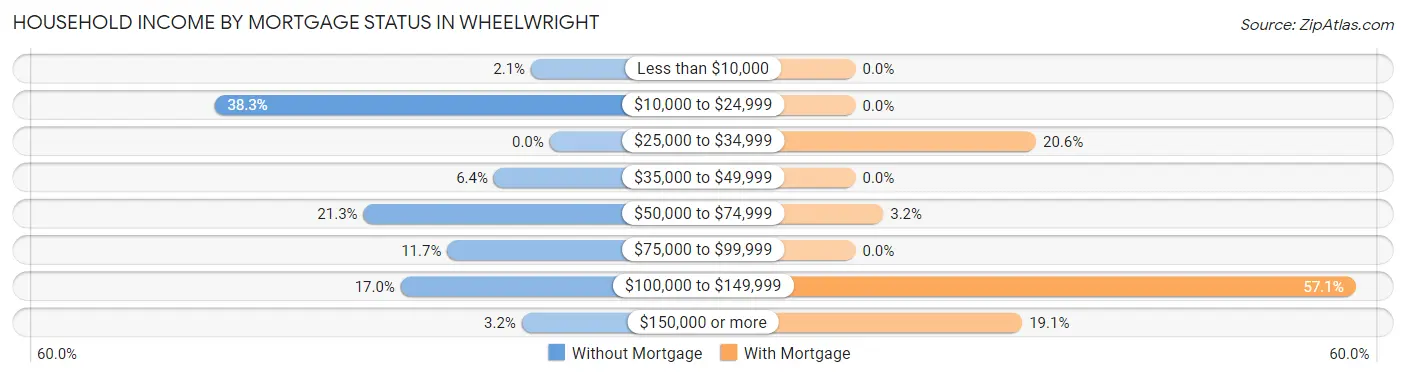
| Household Income | Without Mortgage | With Mortgage |
| Less than $10,000 | 2 (2.1%) | 0 (0.0%) |
| $10,000 to $24,999 | 36 (38.3%) | 0 (0.0%) |
| $25,000 to $34,999 | 0 (0.0%) | 13 (20.6%) |
| $35,000 to $49,999 | 6 (6.4%) | 0 (0.0%) |
| $50,000 to $74,999 | 20 (21.3%) | 2 (3.2%) |
| $75,000 to $99,999 | 11 (11.7%) | 0 (0.0%) |
| $100,000 to $149,999 | 16 (17.0%) | 36 (57.1%) |
| $150,000 or more | 3 (3.2%) | 12 (19.1%) |
| Total | 94 (100.0%) | 63 (100.0%) |
Property Value to Household Income Ratio in Wheelwright
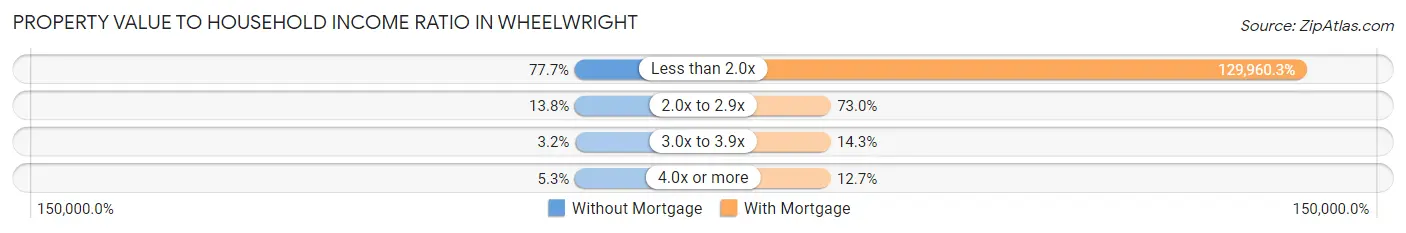
| Value-to-Income Ratio | Without Mortgage | With Mortgage |
| Less than 2.0x | 73 (77.7%) | 81,875 (129,960.3%) |
| 2.0x to 2.9x | 13 (13.8%) | 46 (73.0%) |
| 3.0x to 3.9x | 3 (3.2%) | 9 (14.3%) |
| 4.0x or more | 5 (5.3%) | 8 (12.7%) |
| Total | 94 (100.0%) | 63 (100.0%) |
Real Estate Taxes by Mortgage Status in Wheelwright
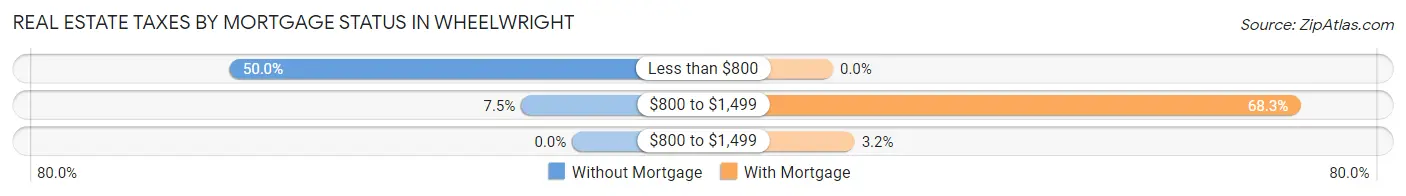
| Property Taxes | Without Mortgage | With Mortgage |
| Less than $800 | 47 (50.0%) | 0 (0.0%) |
| $800 to $1,499 | 7 (7.4%) | 43 (68.2%) |
| $800 to $1,499 | 0 (0.0%) | 2 (3.2%) |
| Total | 94 (100.0%) | 63 (100.0%) |
Health & Disability in Wheelwright
Health Insurance Coverage by Age in Wheelwright
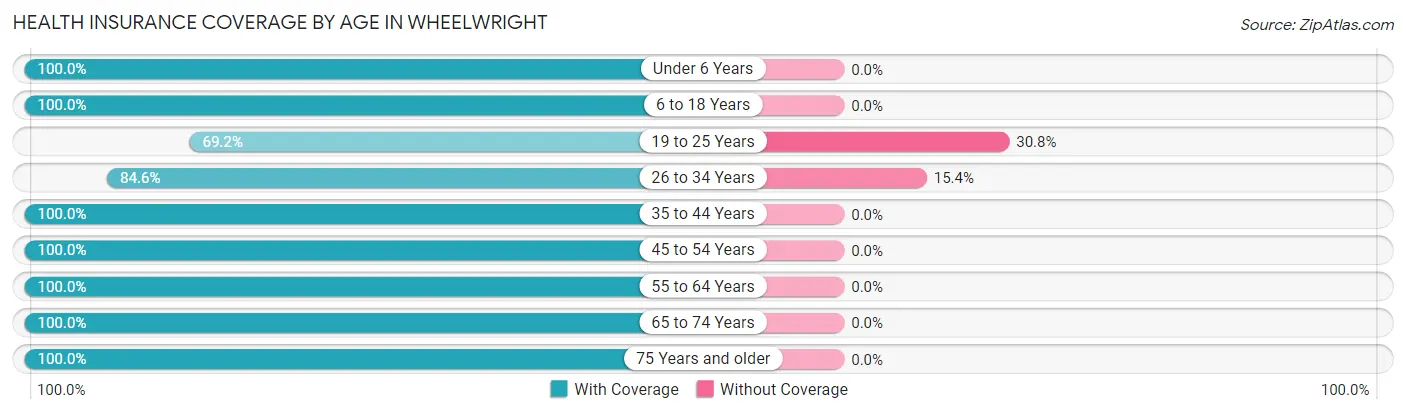
| Age Bracket | With Coverage | Without Coverage |
| Under 6 Years | 64 (100.0%) | 0 (0.0%) |
| 6 to 18 Years | 98 (100.0%) | 0 (0.0%) |
| 19 to 25 Years | 27 (69.2%) | 12 (30.8%) |
| 26 to 34 Years | 66 (84.6%) | 12 (15.4%) |
| 35 to 44 Years | 89 (100.0%) | 0 (0.0%) |
| 45 to 54 Years | 64 (100.0%) | 0 (0.0%) |
| 55 to 64 Years | 95 (100.0%) | 0 (0.0%) |
| 65 to 74 Years | 70 (100.0%) | 0 (0.0%) |
| 75 Years and older | 7 (100.0%) | 0 (0.0%) |
| Total | 580 (96.0%) | 24 (4.0%) |
Health Insurance Coverage by Citizenship Status in Wheelwright

| Citizenship Status | With Coverage | Without Coverage |
| Native Born | 64 (100.0%) | 0 (0.0%) |
| Foreign Born, Citizen | 98 (100.0%) | 0 (0.0%) |
| Foreign Born, not a Citizen | 27 (69.2%) | 12 (30.8%) |
Health Insurance Coverage by Household Income in Wheelwright
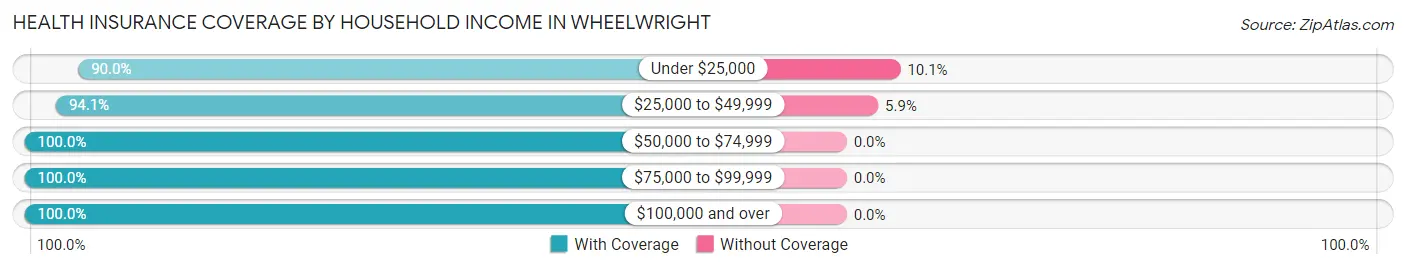
| Household Income | With Coverage | Without Coverage |
| Under $25,000 | 197 (89.9%) | 22 (10.1%) |
| $25,000 to $49,999 | 32 (94.1%) | 2 (5.9%) |
| $50,000 to $74,999 | 61 (100.0%) | 0 (0.0%) |
| $75,000 to $99,999 | 142 (100.0%) | 0 (0.0%) |
| $100,000 and over | 148 (100.0%) | 0 (0.0%) |
Public vs Private Health Insurance Coverage by Age in Wheelwright
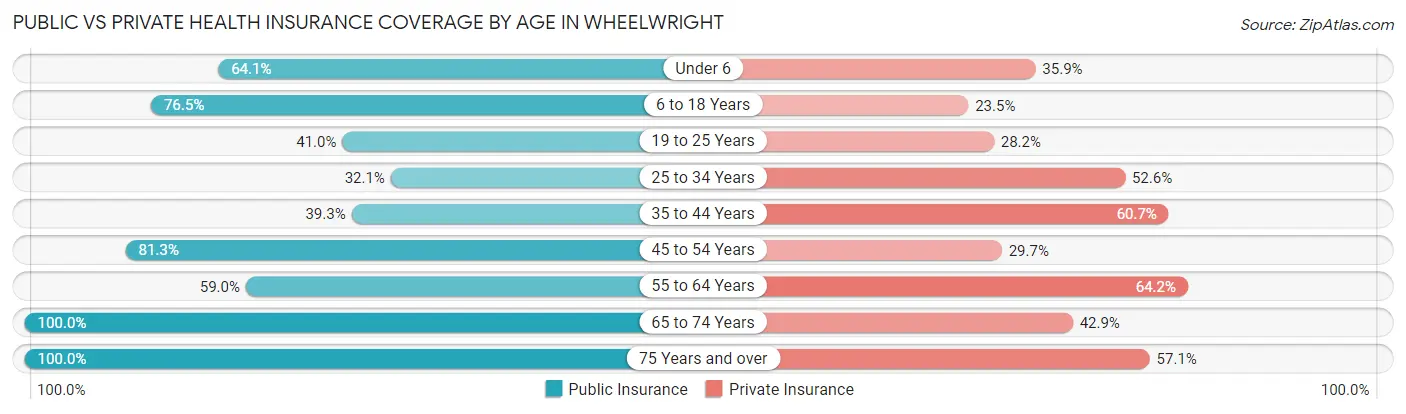
| Age Bracket | Public Insurance | Private Insurance |
| Under 6 | 41 (64.1%) | 23 (35.9%) |
| 6 to 18 Years | 75 (76.5%) | 23 (23.5%) |
| 19 to 25 Years | 16 (41.0%) | 11 (28.2%) |
| 25 to 34 Years | 25 (32.1%) | 41 (52.6%) |
| 35 to 44 Years | 35 (39.3%) | 54 (60.7%) |
| 45 to 54 Years | 52 (81.2%) | 19 (29.7%) |
| 55 to 64 Years | 56 (59.0%) | 61 (64.2%) |
| 65 to 74 Years | 70 (100.0%) | 30 (42.9%) |
| 75 Years and over | 7 (100.0%) | 4 (57.1%) |
| Total | 377 (62.4%) | 266 (44.0%) |
Disability Status by Sex by Age in Wheelwright
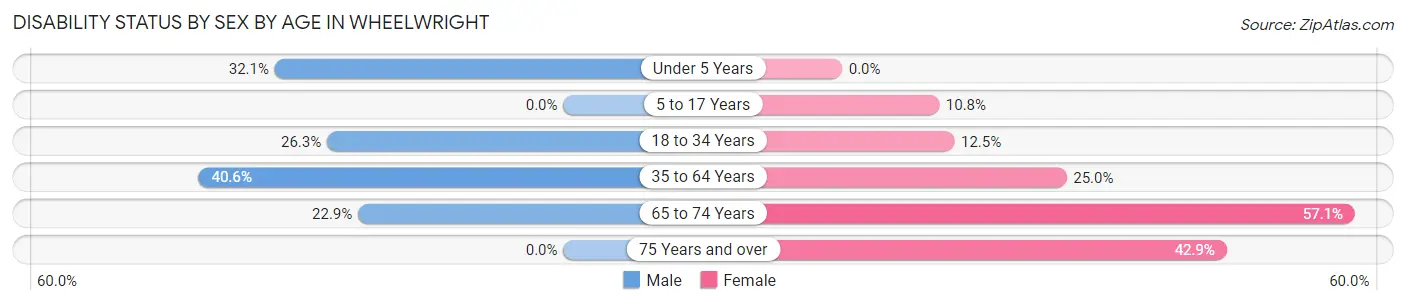
| Age Bracket | Male | Female |
| Under 5 Years | 9 (32.1%) | 0 (0.0%) |
| 5 to 17 Years | 0 (0.0%) | 8 (10.8%) |
| 18 to 34 Years | 15 (26.3%) | 8 (12.5%) |
| 35 to 64 Years | 52 (40.6%) | 30 (25.0%) |
| 65 to 74 Years | 8 (22.9%) | 20 (57.1%) |
| 75 Years and over | 0 (0.0%) | 3 (42.9%) |
Disability Class by Sex by Age in Wheelwright
Disability Class: Hearing Difficulty
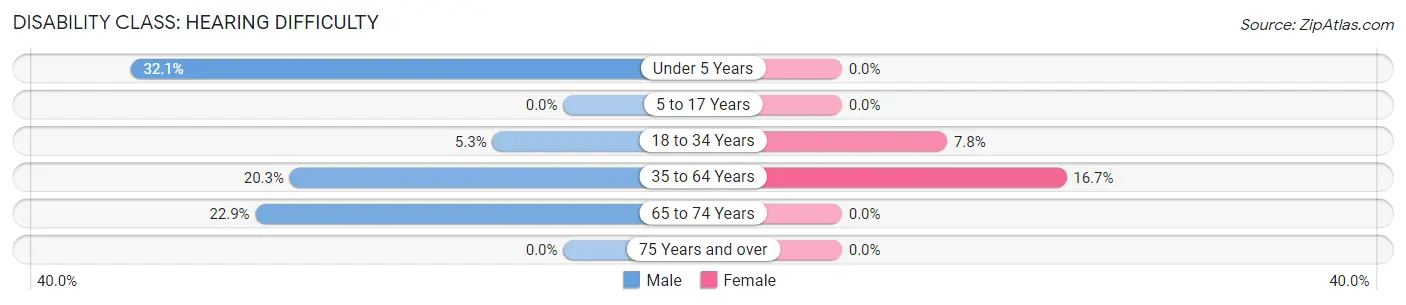
| Age Bracket | Male | Female |
| Under 5 Years | 9 (32.1%) | 0 (0.0%) |
| 5 to 17 Years | 0 (0.0%) | 0 (0.0%) |
| 18 to 34 Years | 3 (5.3%) | 5 (7.8%) |
| 35 to 64 Years | 26 (20.3%) | 20 (16.7%) |
| 65 to 74 Years | 8 (22.9%) | 0 (0.0%) |
| 75 Years and over | 0 (0.0%) | 0 (0.0%) |
Disability Class: Vision Difficulty
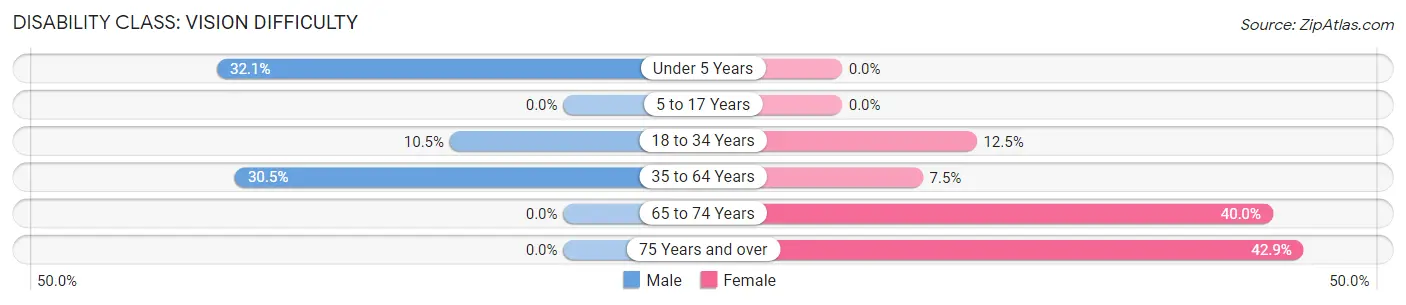
| Age Bracket | Male | Female |
| Under 5 Years | 9 (32.1%) | 0 (0.0%) |
| 5 to 17 Years | 0 (0.0%) | 0 (0.0%) |
| 18 to 34 Years | 6 (10.5%) | 8 (12.5%) |
| 35 to 64 Years | 39 (30.5%) | 9 (7.5%) |
| 65 to 74 Years | 0 (0.0%) | 14 (40.0%) |
| 75 Years and over | 0 (0.0%) | 3 (42.9%) |
Disability Class: Cognitive Difficulty

| Age Bracket | Male | Female |
| 5 to 17 Years | 0 (0.0%) | 8 (10.8%) |
| 18 to 34 Years | 7 (12.3%) | 3 (4.7%) |
| 35 to 64 Years | 37 (28.9%) | 13 (10.8%) |
| 65 to 74 Years | 0 (0.0%) | 8 (22.9%) |
| 75 Years and over | 0 (0.0%) | 3 (42.9%) |
Disability Class: Ambulatory Difficulty
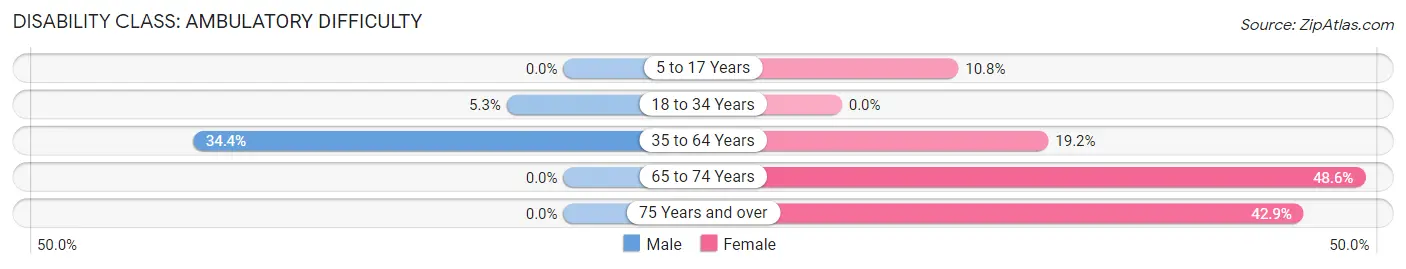
| Age Bracket | Male | Female |
| 5 to 17 Years | 0 (0.0%) | 8 (10.8%) |
| 18 to 34 Years | 3 (5.3%) | 0 (0.0%) |
| 35 to 64 Years | 44 (34.4%) | 23 (19.2%) |
| 65 to 74 Years | 0 (0.0%) | 17 (48.6%) |
| 75 Years and over | 0 (0.0%) | 3 (42.9%) |
Disability Class: Self-Care Difficulty
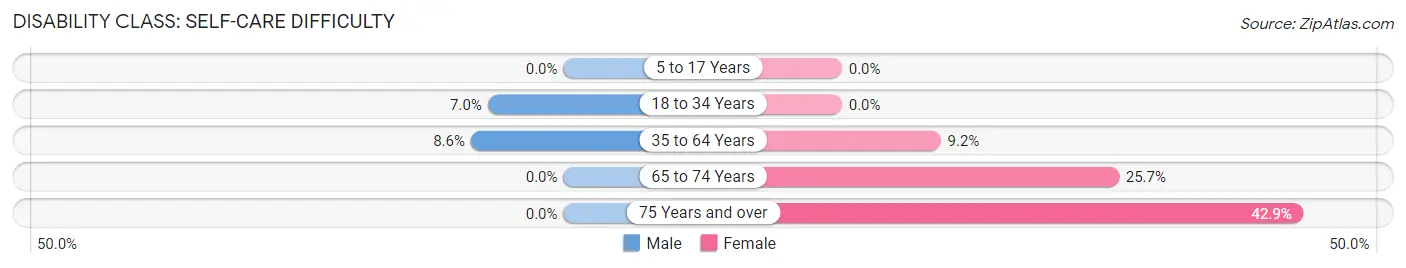
| Age Bracket | Male | Female |
| 5 to 17 Years | 0 (0.0%) | 0 (0.0%) |
| 18 to 34 Years | 4 (7.0%) | 0 (0.0%) |
| 35 to 64 Years | 11 (8.6%) | 11 (9.2%) |
| 65 to 74 Years | 0 (0.0%) | 9 (25.7%) |
| 75 Years and over | 0 (0.0%) | 3 (42.9%) |
Technology Access in Wheelwright
Computing Device Access in Wheelwright
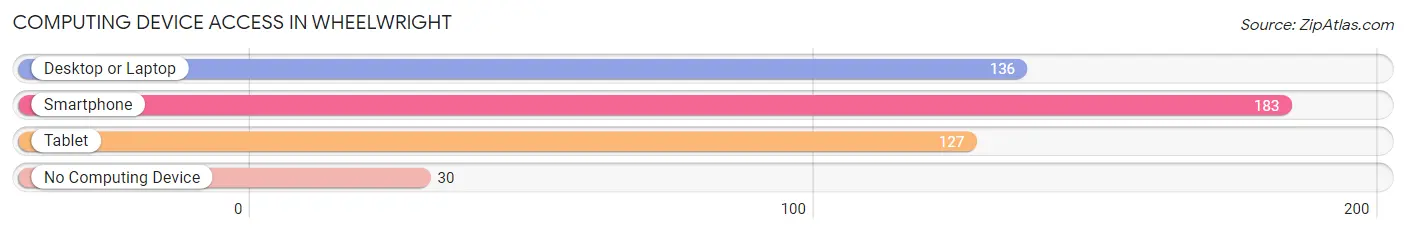
| Device Type | # Households | % Households |
| Desktop or Laptop | 136 | 57.9% |
| Smartphone | 183 | 77.9% |
| Tablet | 127 | 54.0% |
| No Computing Device | 30 | 12.8% |
| Total | 235 | 100.0% |
Internet Access in Wheelwright
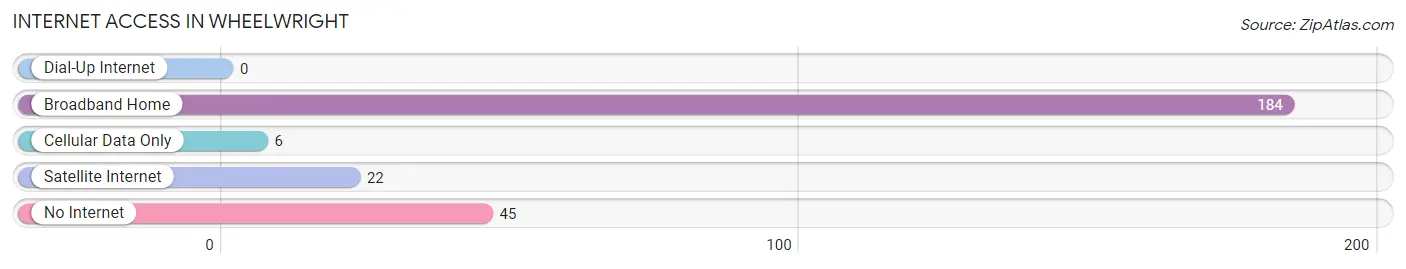
| Internet Type | # Households | % Households |
| Dial-Up Internet | 0 | 0.0% |
| Broadband Home | 184 | 78.3% |
| Cellular Data Only | 6 | 2.5% |
| Satellite Internet | 22 | 9.4% |
| No Internet | 45 | 19.2% |
| Total | 235 | 100.0% |
Wheelwright Summary
Wheelwright is a small unincorporated community located in Floyd County, Kentucky. It is situated in the Appalachian Mountains, near the Kentucky-Virginia border. The population of Wheelwright was estimated to be around 500 in 2020.
History
Wheelwright was founded in the late 1800s by a group of coal miners who were looking for a place to settle down. The town was named after the wheelwright, a craftsman who made and repaired wooden wheels for wagons and carts. The town was originally a coal mining town, and the coal industry was the main source of income for the town. The coal industry began to decline in the early 1900s, and the town began to decline as well.
In the 1950s, the town began to experience a revival as the coal industry began to pick up again. The town was revitalized and new businesses began to open up. The town also began to attract tourists, as it was located near the Kentucky-Virginia border.
Geography
Wheelwright is located in the Appalachian Mountains, near the Kentucky-Virginia border. The town is situated in a valley, surrounded by hills and mountains. The town is located at an elevation of 1,400 feet above sea level. The climate in Wheelwright is humid and subtropical, with hot summers and mild winters.
Economy
The economy of Wheelwright is largely based on the coal industry. The town is home to several coal mines, and the coal industry is the main source of income for the town. The town also has a few small businesses, such as restaurants, stores, and gas stations. Tourism is also an important part of the economy, as the town is located near the Kentucky-Virginia border.
Demographics
The population of Wheelwright was estimated to be around 500 in 2020. The town is predominantly white, with a small minority population. The median household income in Wheelwright is around $30,000, and the median age is around 40 years old. The town has a high rate of poverty, with around 30% of the population living below the poverty line.
Wheelwright is a small town with a rich history and a unique culture. The town has experienced a revival in recent years, and it is now a popular tourist destination. The town is home to a diverse population, and it is a great place to live and work.
Common Questions
What is Per Capita Income in Wheelwright?
Per Capita income in Wheelwright is $17,626.
What is the Median Family Income in Wheelwright?
Median Family Income in Wheelwright is $80,568.
What is Income or Wage Gap in Wheelwright?
Income or Wage Gap in Wheelwright is 42.6%.
Women in Wheelwright earn 57.4 cents for every dollar earned by a man.
What is Inequality or Gini Index in Wheelwright?
Inequality or Gini Index in Wheelwright is 0.44.
What is the Total Population of Wheelwright?
Total Population of Wheelwright is 850.
What is the Total Male Population of Wheelwright?
Total Male Population of Wheelwright is 439.
What is the Total Female Population of Wheelwright?
Total Female Population of Wheelwright is 411.
What is the Ratio of Males per 100 Females in Wheelwright?
There are 106.81 Males per 100 Females in Wheelwright.
What is the Ratio of Females per 100 Males in Wheelwright?
There are 93.62 Females per 100 Males in Wheelwright.
What is the Median Population Age in Wheelwright?
Median Population Age in Wheelwright is 38.6 Years.
What is the Average Family Size in Wheelwright
Average Family Size in Wheelwright is 3.2 People.
What is the Average Household Size in Wheelwright
Average Household Size in Wheelwright is 2.6 People.
How Large is the Labor Force in Wheelwright?
There are 206 People in the Labor Forcein in Wheelwright.
What is the Percentage of People in the Labor Force in Wheelwright?
29.1% of People are in the Labor Force in Wheelwright.
What is the Unemployment Rate in Wheelwright?
Unemployment Rate in Wheelwright is 12.1%.