Union, KY Map & Demographics
Union Map
Union Overview
$48,165
PER CAPITA INCOME
$134,770
AVG FAMILY INCOME
$131,047
AVG HOUSEHOLD INCOME
53.5%
WAGE / INCOME GAP [ % ]
46.5¢/ $1
WAGE / INCOME GAP [ $ ]
0.29
INEQUALITY / GINI INDEX
7,369
TOTAL POPULATION
3,797
MALE POPULATION
3,572
FEMALE POPULATION
106.30
MALES / 100 FEMALES
94.07
FEMALES / 100 MALES
36.7
MEDIAN AGE
3.2
AVG FAMILY SIZE
3.0
AVG HOUSEHOLD SIZE
4,001
LABOR FORCE [ PEOPLE ]
71.6%
PERCENT IN LABOR FORCE
0.8%
UNEMPLOYMENT RATE
Union Zip Codes
Union Area Codes
Income in Union
Income Overview in Union
Per Capita Income in Union is $48,165, while median incomes of families and households are $134,770 and $131,047 respectively.
| Characteristic | Number | Measure |
| Per Capita Income | 7,369 | $48,165 |
| Median Family Income | 2,229 | $134,770 |
| Mean Family Income | 2,229 | $148,066 |
| Median Household Income | 2,414 | $131,047 |
| Mean Household Income | 2,414 | $144,094 |
| Income Deficit | 2,229 | $0 |
| Wage / Income Gap (%) | 7,369 | 53.52% |
| Wage / Income Gap ($) | 7,369 | 46.48¢ per $1 |
| Gini / Inequality Index | 7,369 | 0.29 |
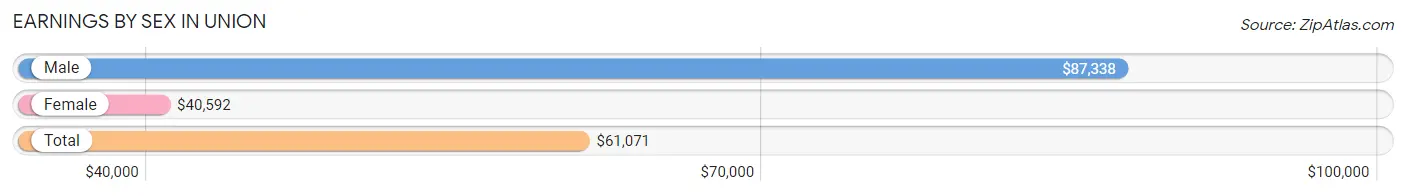
Earnings by Sex in Union
Average Earnings in Union are $61,071, $87,338 for men and $40,592 for women, a difference of 53.5%.
| Sex | Number | Average Earnings |
| Male | 2,164 (51.3%) | $87,338 |
| Female | 2,058 (48.7%) | $40,592 |
| Total | 4,222 (100.0%) | $61,071 |
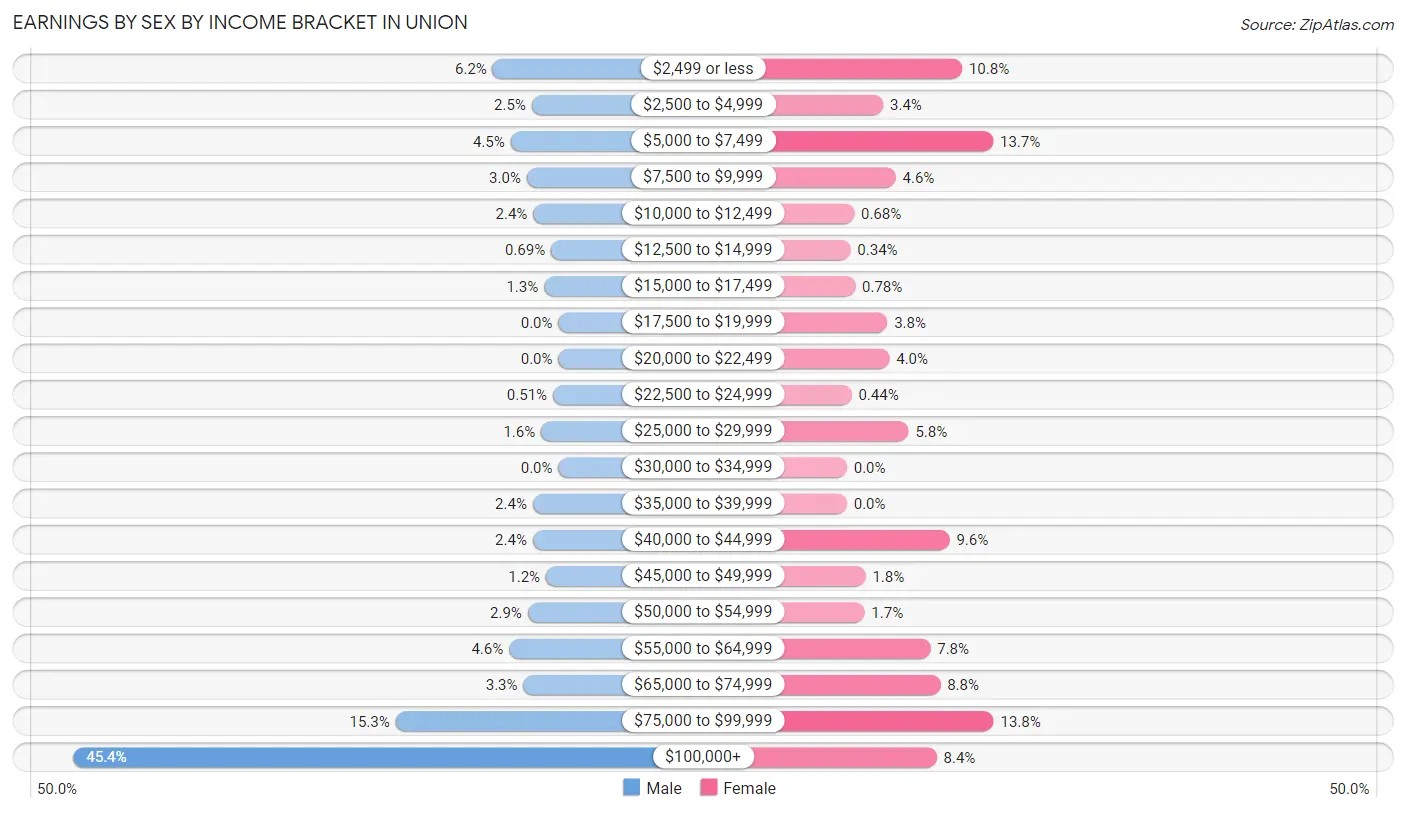
Earnings by Sex by Income Bracket in Union
The most common earnings brackets in Union are $100,000+ for men (983 | 45.4%) and $75,000 to $99,999 for women (283 | 13.8%).
| Income | Male | Female |
| $2,499 or less | 133 (6.1%) | 222 (10.8%) |
| $2,500 to $4,999 | 54 (2.5%) | 70 (3.4%) |
| $5,000 to $7,499 | 97 (4.5%) | 282 (13.7%) |
| $7,500 to $9,999 | 64 (3.0%) | 94 (4.6%) |
| $10,000 to $12,499 | 51 (2.4%) | 14 (0.7%) |
| $12,500 to $14,999 | 15 (0.7%) | 7 (0.3%) |
| $15,000 to $17,499 | 29 (1.3%) | 16 (0.8%) |
| $17,500 to $19,999 | 0 (0.0%) | 78 (3.8%) |
| $20,000 to $22,499 | 0 (0.0%) | 82 (4.0%) |
| $22,500 to $24,999 | 11 (0.5%) | 9 (0.4%) |
| $25,000 to $29,999 | 35 (1.6%) | 119 (5.8%) |
| $30,000 to $34,999 | 0 (0.0%) | 0 (0.0%) |
| $35,000 to $39,999 | 52 (2.4%) | 0 (0.0%) |
| $40,000 to $44,999 | 52 (2.4%) | 198 (9.6%) |
| $45,000 to $49,999 | 25 (1.2%) | 36 (1.8%) |
| $50,000 to $54,999 | 62 (2.9%) | 34 (1.7%) |
| $55,000 to $64,999 | 100 (4.6%) | 161 (7.8%) |
| $65,000 to $74,999 | 71 (3.3%) | 180 (8.7%) |
| $75,000 to $99,999 | 330 (15.2%) | 283 (13.8%) |
| $100,000+ | 983 (45.4%) | 173 (8.4%) |
| Total | 2,164 (100.0%) | 2,058 (100.0%) |
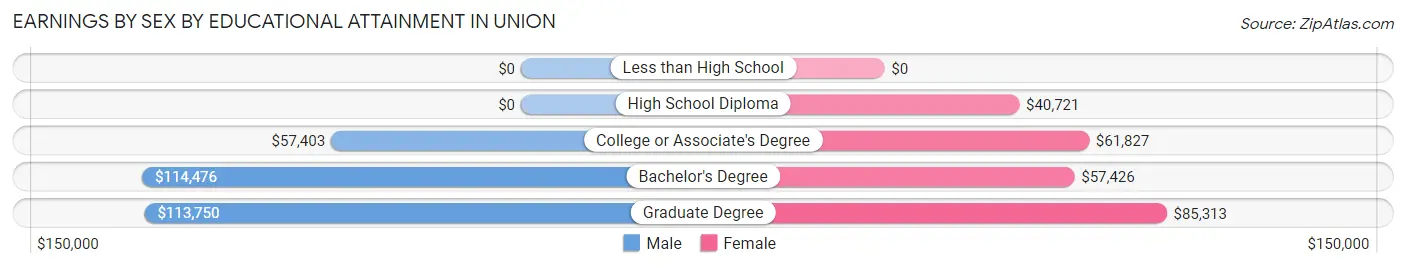
Earnings by Sex by Educational Attainment in Union
Average earnings in Union are $102,176 for men and $57,778 for women, a difference of 43.4%. Men with an educational attainment of bachelor's degree enjoy the highest average annual earnings of $114,476, while those with college or associate's degree education earn the least with $57,403. Women with an educational attainment of graduate degree earn the most with the average annual earnings of $85,313, while those with high school diploma education have the smallest earnings of $40,721.
| Educational Attainment | Male Income | Female Income |
| Less than High School | - | - |
| High School Diploma | - | - |
| College or Associate's Degree | $57,403 | $61,827 |
| Bachelor's Degree | $114,476 | $57,426 |
| Graduate Degree | $113,750 | $85,313 |
| Total | $102,176 | $57,778 |
Family Income in Union
Family Income Brackets in Union
According to the Union family income data, there are 863 families falling into the $100,000 to $149,999 income range, which is the most common income bracket and makes up 38.7% of all families. Conversely, the less than $10,000 income bracket is the least frequent group with only 9 families (0.4%) belonging to this category.
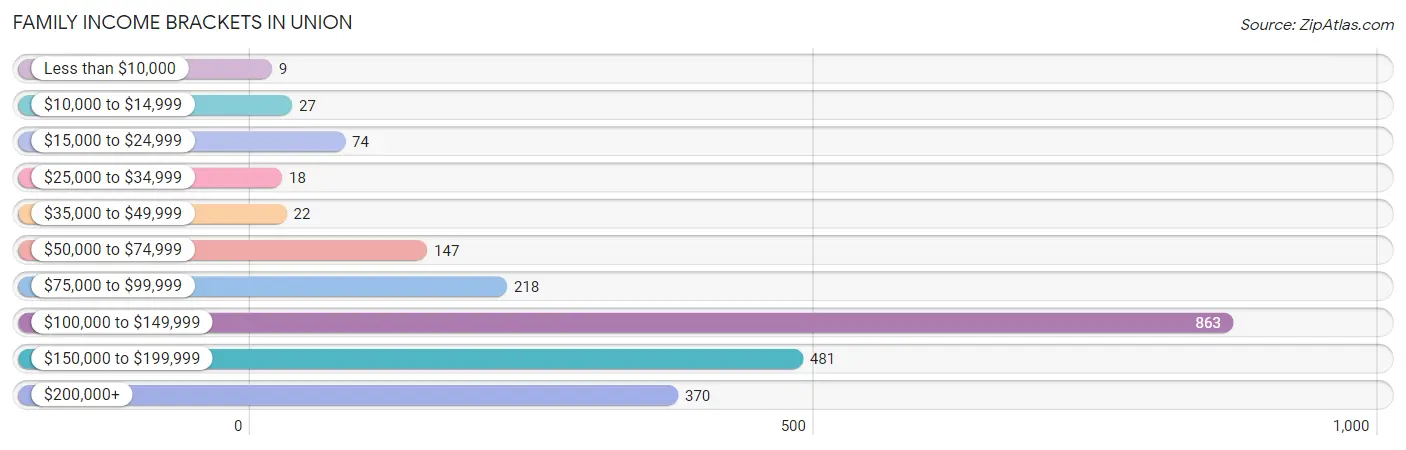
| Income Bracket | # Families | % Families |
| Less than $10,000 | 9 | 0.4% |
| $10,000 to $14,999 | 27 | 1.2% |
| $15,000 to $24,999 | 74 | 3.3% |
| $25,000 to $34,999 | 18 | 0.8% |
| $35,000 to $49,999 | 22 | 1.0% |
| $50,000 to $74,999 | 147 | 6.6% |
| $75,000 to $99,999 | 218 | 9.8% |
| $100,000 to $149,999 | 863 | 38.7% |
| $150,000 to $199,999 | 481 | 21.6% |
| $200,000+ | 370 | 16.6% |
Family Income by Famaliy Size in Union
6-person families (79 | 3.5%) account for the highest median family income in Union with $250,001 per family, while 2-person families (887 | 39.8%) have the highest median income of $53,114 per family member.
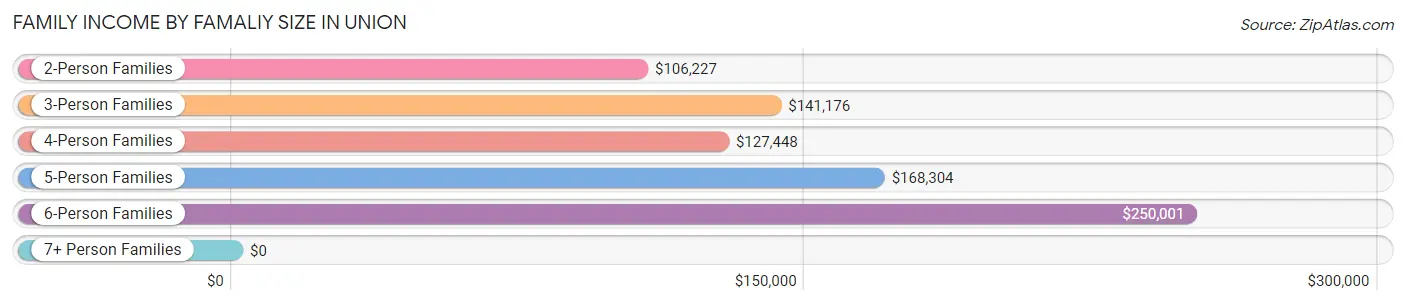
| Income Bracket | # Families | Median Income |
| 2-Person Families | 887 (39.8%) | $106,227 |
| 3-Person Families | 502 (22.5%) | $141,176 |
| 4-Person Families | 498 (22.3%) | $127,448 |
| 5-Person Families | 251 (11.3%) | $168,304 |
| 6-Person Families | 79 (3.5%) | $250,001 |
| 7+ Person Families | 12 (0.5%) | $0 |
| Total | 2,229 (100.0%) | $134,770 |
Family Income by Number of Earners in Union
The median family income in Union is $134,770, with families comprising 2 earners (798) having the highest median family income of $153,906, while families with no earners (267) have the lowest median family income of $64,861, accounting for 35.8% and 12.0% of families, respectively.
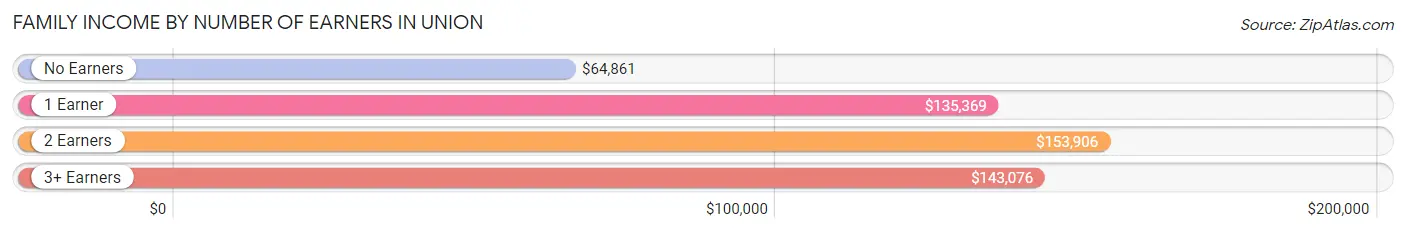
| Number of Earners | # Families | Median Income |
| No Earners | 267 (12.0%) | $64,861 |
| 1 Earner | 595 (26.7%) | $135,369 |
| 2 Earners | 798 (35.8%) | $153,906 |
| 3+ Earners | 569 (25.5%) | $143,076 |
| Total | 2,229 (100.0%) | $134,770 |
Household Income in Union
Household Income Brackets in Union
With 927 households falling in the category, the $100,000 to $149,999 income range is the most frequent in Union, accounting for 38.4% of all households. In contrast, only 10 households (0.4%) fall into the less than $10,000 income bracket, making it the least populous group.
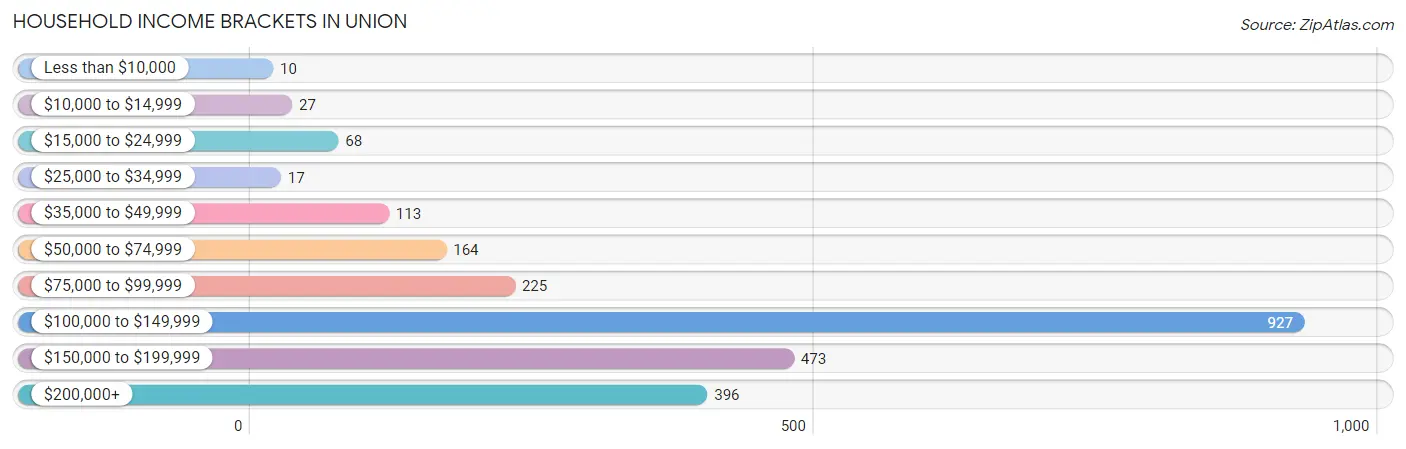
| Income Bracket | # Households | % Households |
| Less than $10,000 | 10 | 0.4% |
| $10,000 to $14,999 | 27 | 1.1% |
| $15,000 to $24,999 | 68 | 2.8% |
| $25,000 to $34,999 | 17 | 0.7% |
| $35,000 to $49,999 | 113 | 4.7% |
| $50,000 to $74,999 | 164 | 6.8% |
| $75,000 to $99,999 | 225 | 9.3% |
| $100,000 to $149,999 | 927 | 38.4% |
| $150,000 to $199,999 | 473 | 19.6% |
| $200,000+ | 396 | 16.4% |
Household Income by Householder Age in Union
The median household income in Union is $131,047, with the highest median household income of $144,789 found in the 25 to 44 years age bracket for the primary householder. A total of 835 households (34.6%) fall into this category. Meanwhile, the 15 to 24 years age bracket for the primary householder has the lowest median household income of $0, with 84 households (3.5%) in this group.
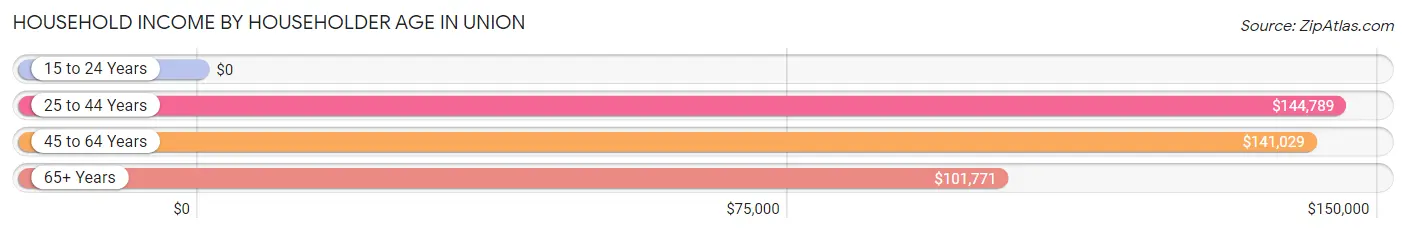
| Income Bracket | # Households | Median Income |
| 15 to 24 Years | 84 (3.5%) | $0 |
| 25 to 44 Years | 835 (34.6%) | $144,789 |
| 45 to 64 Years | 826 (34.2%) | $141,029 |
| 65+ Years | 669 (27.7%) | $101,771 |
| Total | 2,414 (100.0%) | $131,047 |
Poverty in Union
Income Below Poverty by Sex and Age in Union
With 2.6% poverty level for males and 5.4% for females among the residents of Union, 75 year old and over males and 75 year old and over females are the most vulnerable to poverty, with 27 males (16.6%) and 33 females (30.0%) in their respective age groups living below the poverty level.
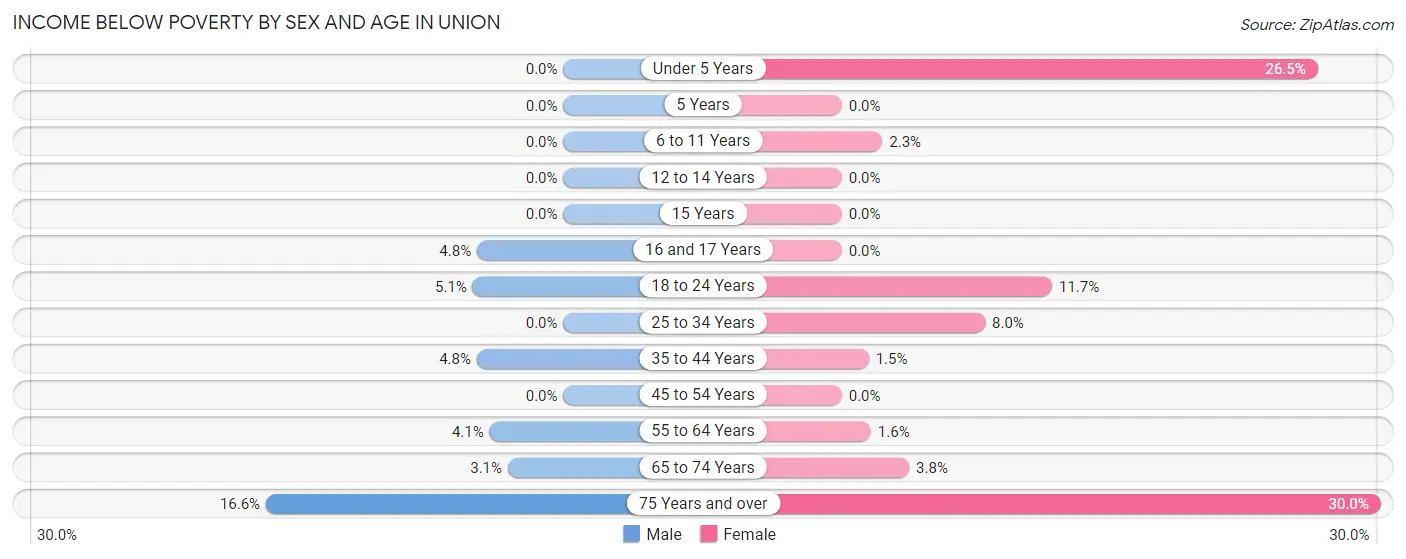
| Age Bracket | Male | Female |
| Under 5 Years | 0 (0.0%) | 49 (26.5%) |
| 5 Years | 0 (0.0%) | 0 (0.0%) |
| 6 to 11 Years | 0 (0.0%) | 6 (2.3%) |
| 12 to 14 Years | 0 (0.0%) | 0 (0.0%) |
| 15 Years | 0 (0.0%) | 0 (0.0%) |
| 16 and 17 Years | 9 (4.8%) | 0 (0.0%) |
| 18 to 24 Years | 11 (5.1%) | 48 (11.7%) |
| 25 to 34 Years | 0 (0.0%) | 26 (8.0%) |
| 35 to 44 Years | 29 (4.8%) | 6 (1.5%) |
| 45 to 54 Years | 0 (0.0%) | 0 (0.0%) |
| 55 to 64 Years | 9 (4.1%) | 9 (1.6%) |
| 65 to 74 Years | 15 (3.1%) | 15 (3.7%) |
| 75 Years and over | 27 (16.6%) | 33 (30.0%) |
| Total | 100 (2.6%) | 192 (5.4%) |
Income Above Poverty by Sex and Age in Union
According to the poverty statistics in Union, males aged under 5 years and females aged 5 years are the age groups that are most secure financially, with 100.0% of males and 100.0% of females in these age groups living above the poverty line.
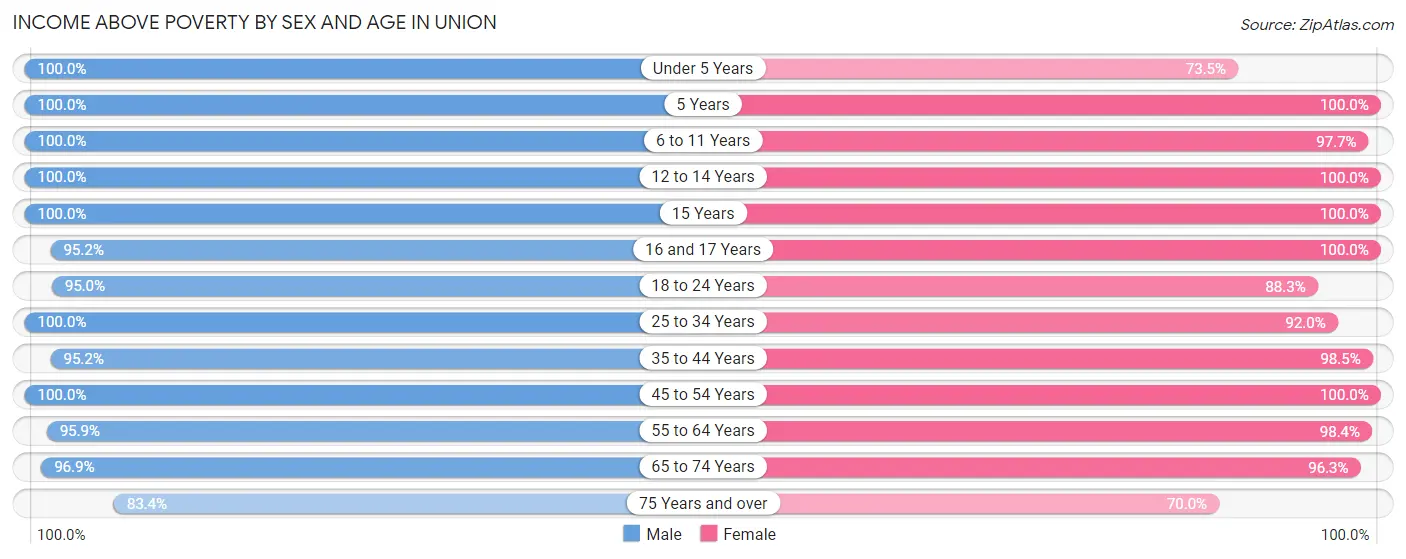
| Age Bracket | Male | Female |
| Under 5 Years | 286 (100.0%) | 136 (73.5%) |
| 5 Years | 57 (100.0%) | 95 (100.0%) |
| 6 to 11 Years | 536 (100.0%) | 260 (97.7%) |
| 12 to 14 Years | 133 (100.0%) | 170 (100.0%) |
| 15 Years | 33 (100.0%) | 20 (100.0%) |
| 16 and 17 Years | 178 (95.2%) | 98 (100.0%) |
| 18 to 24 Years | 207 (95.0%) | 362 (88.3%) |
| 25 to 34 Years | 420 (100.0%) | 300 (92.0%) |
| 35 to 44 Years | 573 (95.2%) | 394 (98.5%) |
| 45 to 54 Years | 457 (100.0%) | 536 (100.0%) |
| 55 to 64 Years | 210 (95.9%) | 547 (98.4%) |
| 65 to 74 Years | 471 (96.9%) | 385 (96.3%) |
| 75 Years and over | 136 (83.4%) | 77 (70.0%) |
| Total | 3,697 (97.4%) | 3,380 (94.6%) |
Income Below Poverty Among Married-Couple Families in Union
The poverty statistics for married-couple families in Union show that 4.1% or 77 of the total 1,868 families live below the poverty line. Families with no children have the highest poverty rate of 5.7%, comprising of 51 families. On the other hand, families with 3 or 4 children have the lowest poverty rate of 0.0%, which includes 0 families.
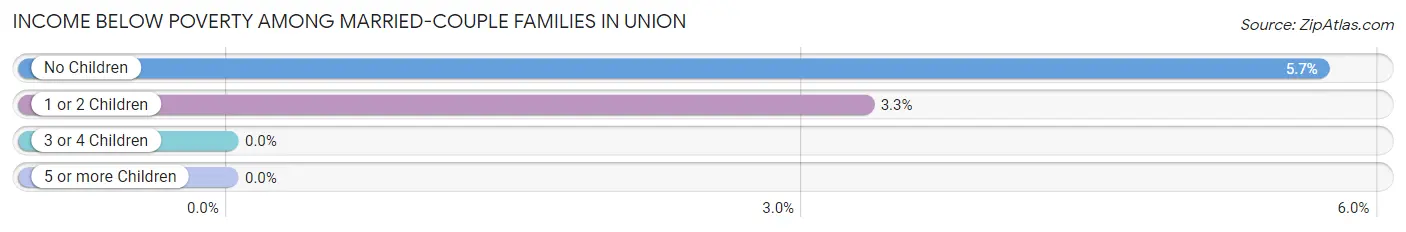
| Children | Above Poverty | Below Poverty |
| No Children | 843 (94.3%) | 51 (5.7%) |
| 1 or 2 Children | 757 (96.7%) | 26 (3.3%) |
| 3 or 4 Children | 191 (100.0%) | 0 (0.0%) |
| 5 or more Children | 0 (0.0%) | 0 (0.0%) |
| Total | 1,791 (95.9%) | 77 (4.1%) |
Income Below Poverty Among Single-Parent Households in Union
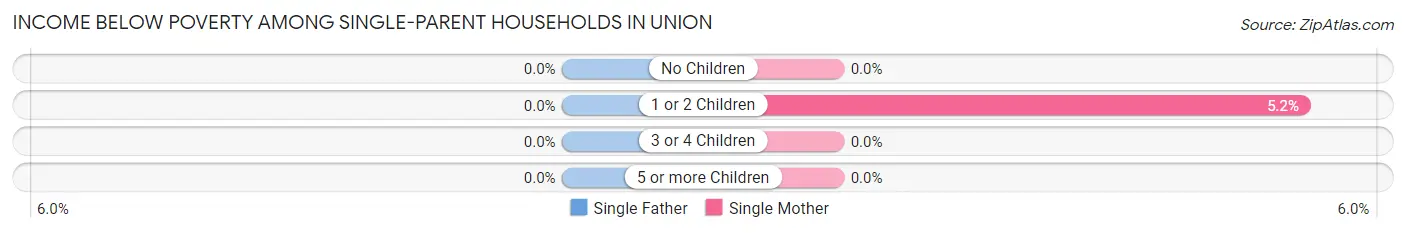
| Children | Single Father | Single Mother |
| No Children | 0 (0.0%) | 0 (0.0%) |
| 1 or 2 Children | 0 (0.0%) | 6 (5.2%) |
| 3 or 4 Children | 0 (0.0%) | 0 (0.0%) |
| 5 or more Children | 0 (0.0%) | 0 (0.0%) |
| Total | 0 (0.0%) | 6 (2.8%) |
Income Below Poverty Among Married-Couple vs Single-Parent Households in Union
The poverty data for Union shows that 77 of the married-couple family households (4.1%) and 6 of the single-parent households (1.7%) are living below the poverty level. Within the married-couple family households, those with no children have the highest poverty rate, with 51 households (5.7%) falling below the poverty line. Among the single-parent households, those with 1 or 2 children have the highest poverty rate, with 6 household (4.3%) living below poverty.
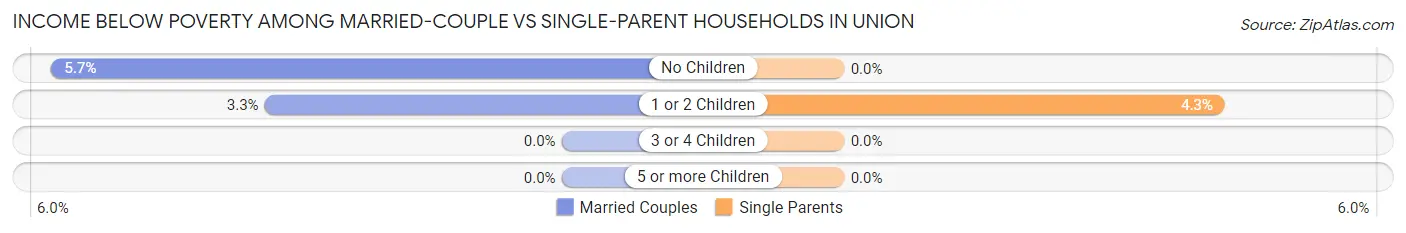
| Children | Married-Couple Families | Single-Parent Households |
| No Children | 51 (5.7%) | 0 (0.0%) |
| 1 or 2 Children | 26 (3.3%) | 6 (4.3%) |
| 3 or 4 Children | 0 (0.0%) | 0 (0.0%) |
| 5 or more Children | 0 (0.0%) | 0 (0.0%) |
| Total | 77 (4.1%) | 6 (1.7%) |
Race in Union
The most populous races in Union are White / Caucasian (6,772 | 91.9%), Two or more Races (452 | 6.1%), and Hispanic or Latino (193 | 2.6%).
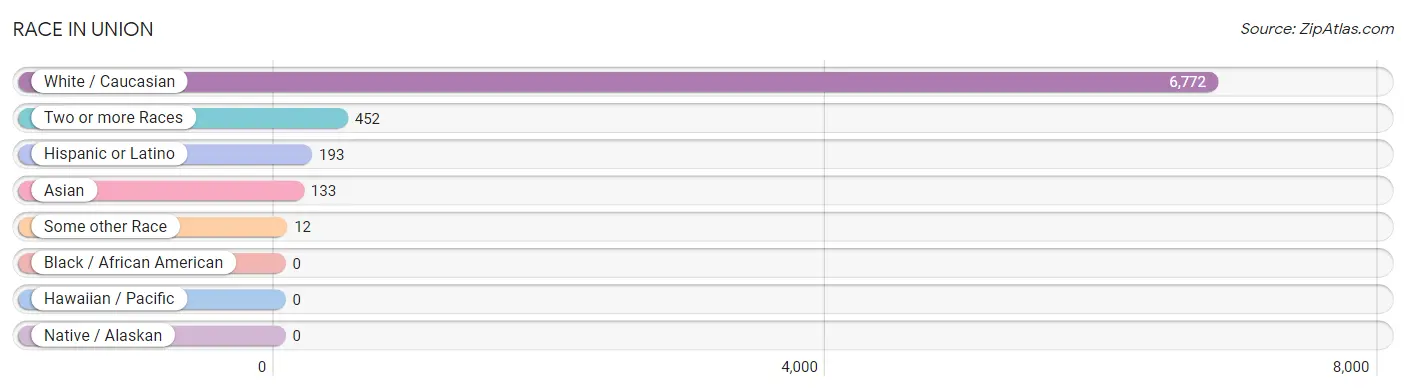
| Race | # Population | % Population |
| Asian | 133 | 1.8% |
| Black / African American | 0 | 0.0% |
| Hawaiian / Pacific | 0 | 0.0% |
| Hispanic or Latino | 193 | 2.6% |
| Native / Alaskan | 0 | 0.0% |
| White / Caucasian | 6,772 | 91.9% |
| Two or more Races | 452 | 6.1% |
| Some other Race | 12 | 0.2% |
| Total | 7,369 | 100.0% |
Ancestry in Union
The most populous ancestries reported in Union are German (2,554 | 34.7%), English (1,439 | 19.5%), Irish (1,163 | 15.8%), American (532 | 7.2%), and French (532 | 7.2%), together accounting for 84.4% of all Union residents.
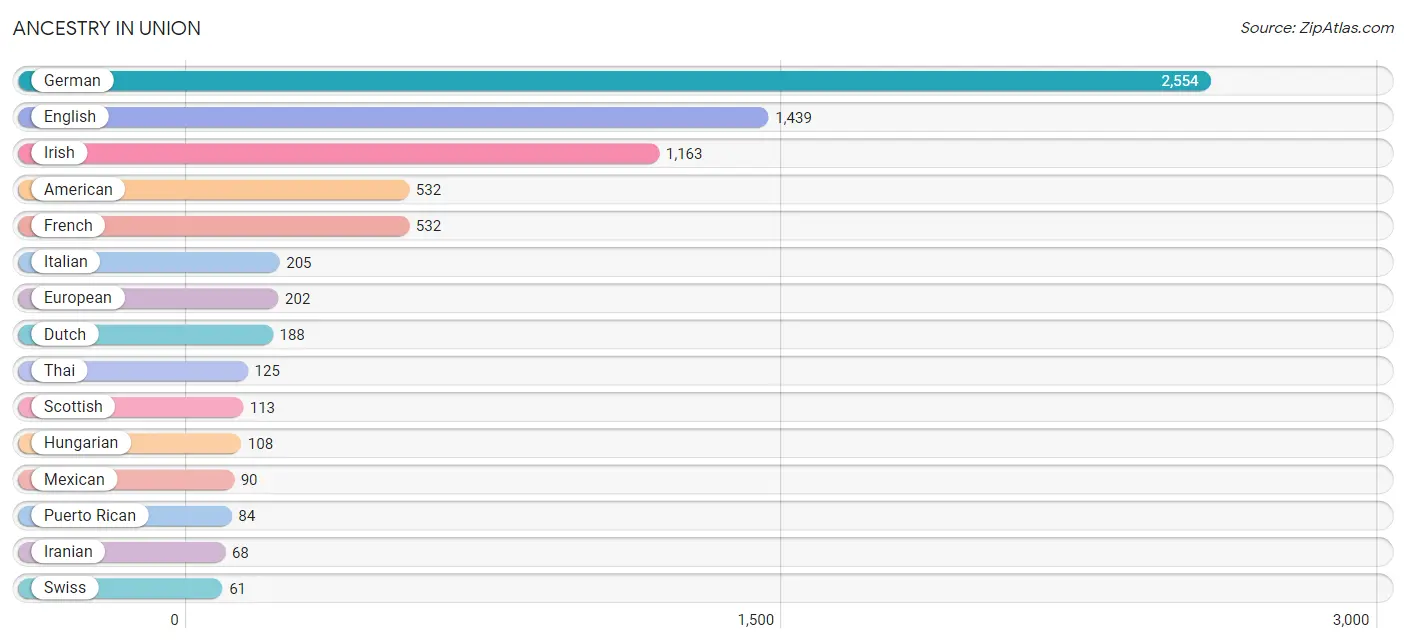
| Ancestry | # Population | % Population |
| American | 532 | 7.2% |
| Belgian | 8 | 0.1% |
| British | 52 | 0.7% |
| Central American | 19 | 0.3% |
| Cherokee | 49 | 0.7% |
| Croatian | 42 | 0.6% |
| Czech | 23 | 0.3% |
| Danish | 15 | 0.2% |
| Dutch | 188 | 2.5% |
| English | 1,439 | 19.5% |
| European | 202 | 2.7% |
| French | 532 | 7.2% |
| French Canadian | 7 | 0.1% |
| German | 2,554 | 34.7% |
| Hungarian | 108 | 1.5% |
| Indian (Asian) | 15 | 0.2% |
| Iranian | 68 | 0.9% |
| Irish | 1,163 | 15.8% |
| Italian | 205 | 2.8% |
| Lithuanian | 10 | 0.1% |
| Mexican | 90 | 1.2% |
| Northern European | 42 | 0.6% |
| Panamanian | 19 | 0.3% |
| Polish | 15 | 0.2% |
| Puerto Rican | 84 | 1.1% |
| Scotch-Irish | 59 | 0.8% |
| Scottish | 113 | 1.5% |
| Slovak | 15 | 0.2% |
| Swedish | 59 | 0.8% |
| Swiss | 61 | 0.8% |
| Thai | 125 | 1.7% |
| Welsh | 17 | 0.2% | View All 32 Rows |
Immigrants in Union
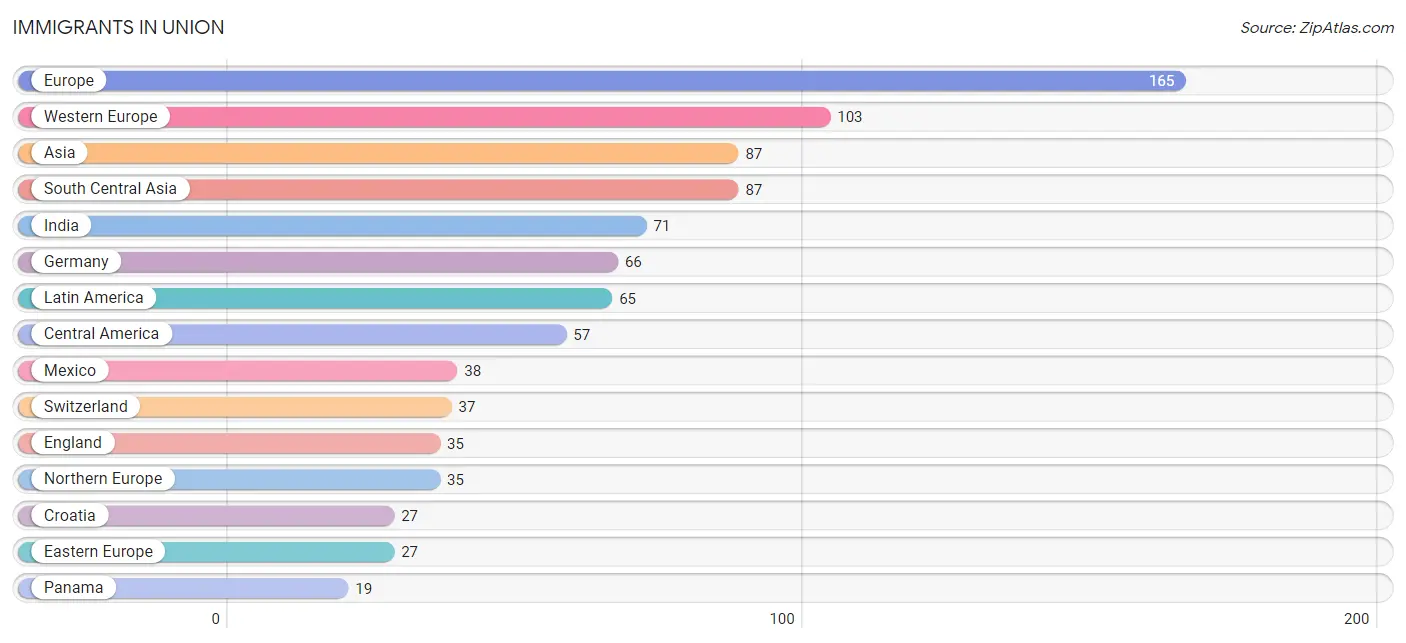
The most numerous immigrant groups reported in Union came from Europe (165 | 2.2%), Western Europe (103 | 1.4%), Asia (87 | 1.2%), South Central Asia (87 | 1.2%), and India (71 | 1.0%), together accounting for 7.0% of all Union residents.
| Immigration Origin | # Population | % Population |
| Asia | 87 | 1.2% |
| Central America | 57 | 0.8% |
| Croatia | 27 | 0.4% |
| Eastern Europe | 27 | 0.4% |
| England | 35 | 0.5% |
| Europe | 165 | 2.2% |
| Germany | 66 | 0.9% |
| India | 71 | 1.0% |
| Iran | 16 | 0.2% |
| Latin America | 65 | 0.9% |
| Mexico | 38 | 0.5% |
| Northern Europe | 35 | 0.5% |
| Panama | 19 | 0.3% |
| South America | 8 | 0.1% |
| South Central Asia | 87 | 1.2% |
| Switzerland | 37 | 0.5% |
| Western Europe | 103 | 1.4% | View All 17 Rows |
Sex and Age in Union
Sex and Age in Union
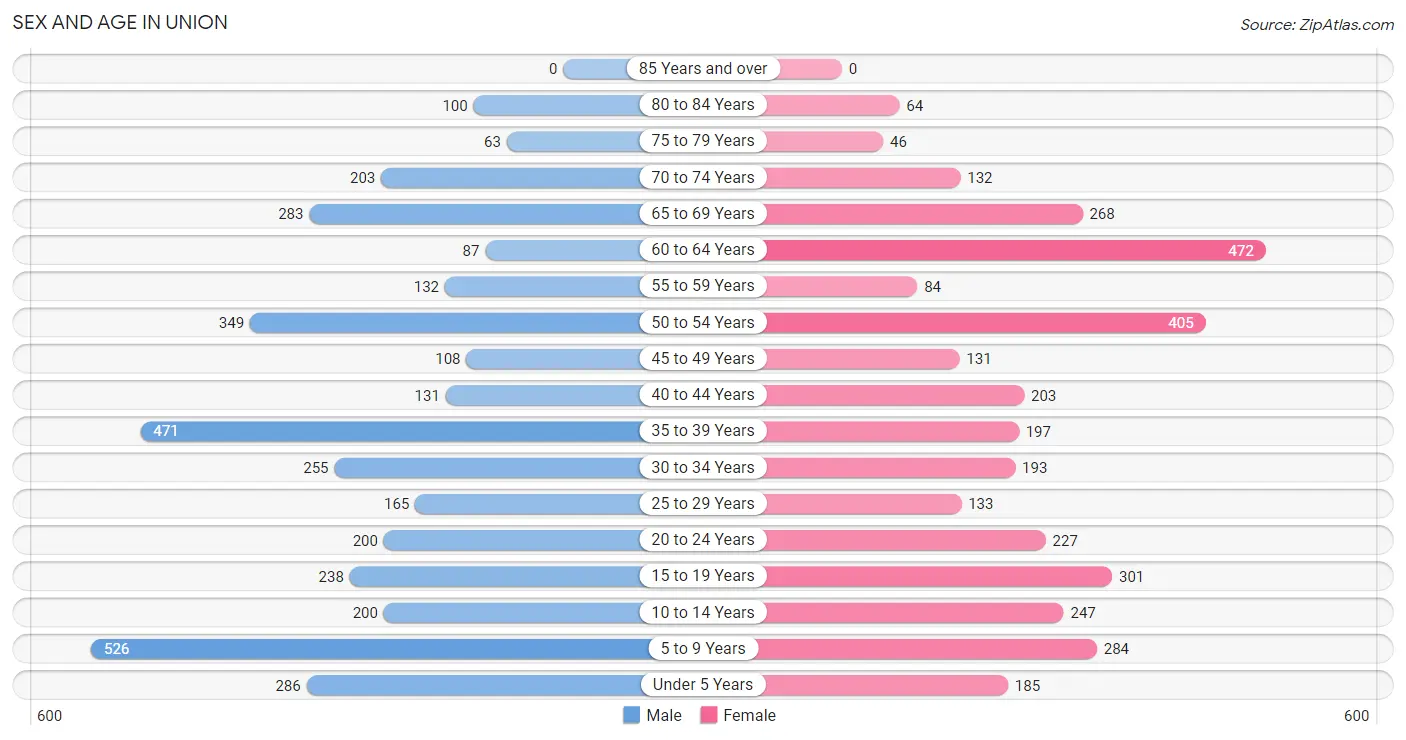
The most populous age groups in Union are 5 to 9 Years (526 | 13.9%) for men and 60 to 64 Years (472 | 13.2%) for women.
| Age Bracket | Male | Female |
| Under 5 Years | 286 (7.5%) | 185 (5.2%) |
| 5 to 9 Years | 526 (13.9%) | 284 (8.0%) |
| 10 to 14 Years | 200 (5.3%) | 247 (6.9%) |
| 15 to 19 Years | 238 (6.3%) | 301 (8.4%) |
| 20 to 24 Years | 200 (5.3%) | 227 (6.4%) |
| 25 to 29 Years | 165 (4.3%) | 133 (3.7%) |
| 30 to 34 Years | 255 (6.7%) | 193 (5.4%) |
| 35 to 39 Years | 471 (12.4%) | 197 (5.5%) |
| 40 to 44 Years | 131 (3.5%) | 203 (5.7%) |
| 45 to 49 Years | 108 (2.8%) | 131 (3.7%) |
| 50 to 54 Years | 349 (9.2%) | 405 (11.3%) |
| 55 to 59 Years | 132 (3.5%) | 84 (2.4%) |
| 60 to 64 Years | 87 (2.3%) | 472 (13.2%) |
| 65 to 69 Years | 283 (7.4%) | 268 (7.5%) |
| 70 to 74 Years | 203 (5.3%) | 132 (3.7%) |
| 75 to 79 Years | 63 (1.7%) | 46 (1.3%) |
| 80 to 84 Years | 100 (2.6%) | 64 (1.8%) |
| 85 Years and over | 0 (0.0%) | 0 (0.0%) |
| Total | 3,797 (100.0%) | 3,572 (100.0%) |
Families and Households in Union
Median Family Size in Union
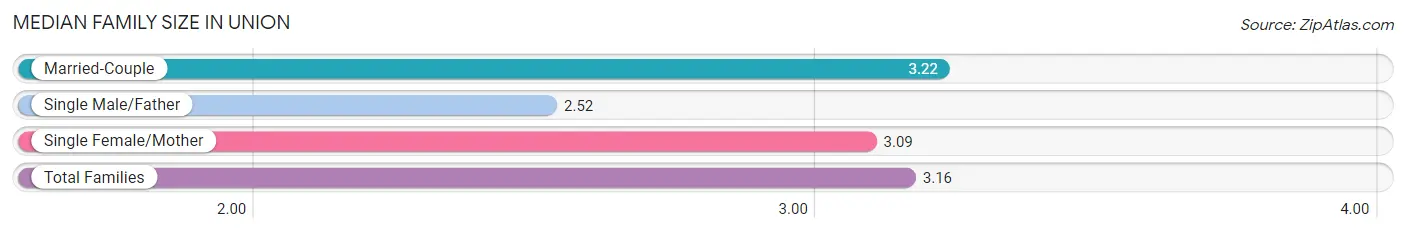
The median family size in Union is 3.16 persons per family, with married-couple families (1,868 | 83.8%) accounting for the largest median family size of 3.22 persons per family. On the other hand, single male/father families (149 | 6.7%) represent the smallest median family size with 2.52 persons per family.
| Family Type | # Families | Family Size |
| Married-Couple | 1,868 (83.8%) | 3.22 |
| Single Male/Father | 149 (6.7%) | 2.52 |
| Single Female/Mother | 212 (9.5%) | 3.09 |
| Total Families | 2,229 (100.0%) | 3.16 |
Median Household Size in Union
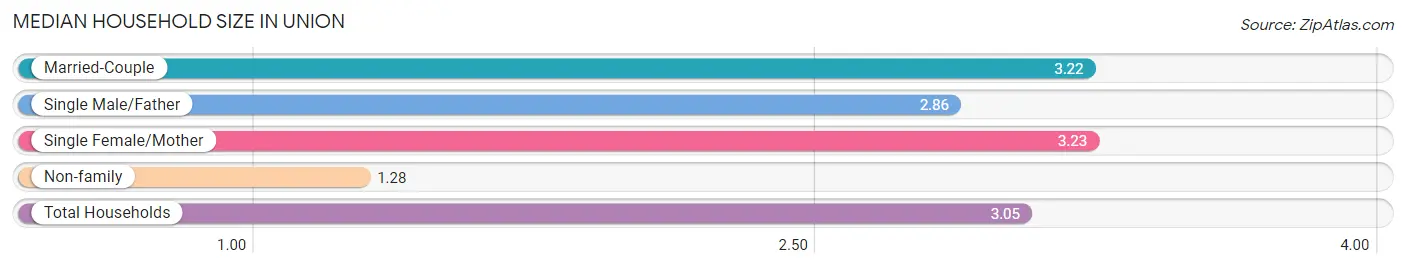
The median household size in Union is 3.05 persons per household, with single female/mother households (212 | 8.8%) accounting for the largest median household size of 3.23 persons per household. non-family households (185 | 7.7%) represent the smallest median household size with 1.28 persons per household.
| Household Type | # Households | Household Size |
| Married-Couple | 1,868 (77.4%) | 3.22 |
| Single Male/Father | 149 (6.2%) | 2.86 |
| Single Female/Mother | 212 (8.8%) | 3.23 |
| Non-family | 185 (7.7%) | 1.28 |
| Total Households | 2,414 (100.0%) | 3.05 |
Household Size by Marriage Status in Union
Out of a total of 2,414 households in Union, 2,229 (92.3%) are family households, while 185 (7.7%) are nonfamily households. The most numerous type of family households are 2-person households, comprising 887, and the most common type of nonfamily households are 1-person households, comprising 137.
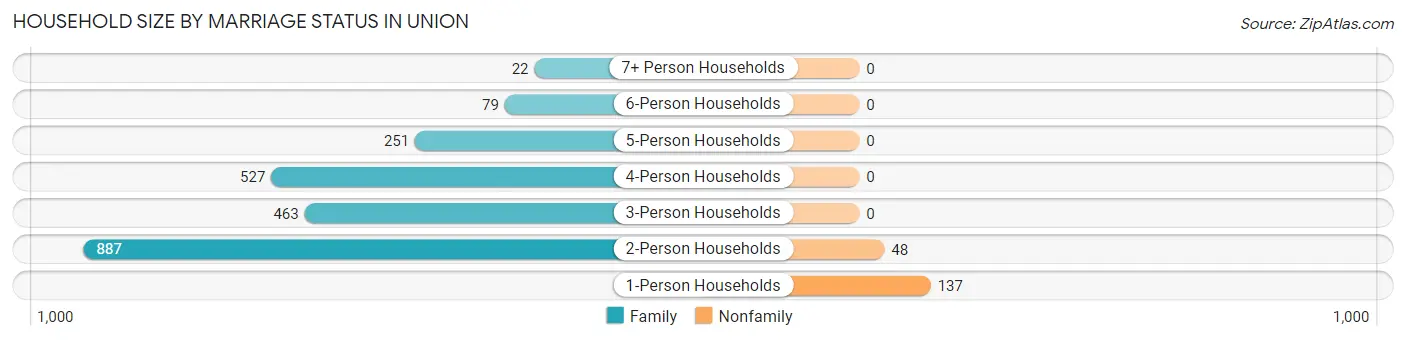
| Household Size | Family Households | Nonfamily Households |
| 1-Person Households | - | 137 (5.7%) |
| 2-Person Households | 887 (36.7%) | 48 (2.0%) |
| 3-Person Households | 463 (19.2%) | 0 (0.0%) |
| 4-Person Households | 527 (21.8%) | 0 (0.0%) |
| 5-Person Households | 251 (10.4%) | 0 (0.0%) |
| 6-Person Households | 79 (3.3%) | 0 (0.0%) |
| 7+ Person Households | 22 (0.9%) | 0 (0.0%) |
| Total | 2,229 (92.3%) | 185 (7.7%) |
Female Fertility in Union
Fertility by Age in Union
Average fertility rate in Union is 27.0 births per 1,000 women. Women in the age bracket of 20 to 34 years have the highest fertility rate with 80.0 births per 1,000 women. Women in the age bracket of 20 to 34 years acount for 100.0% of all women with births.
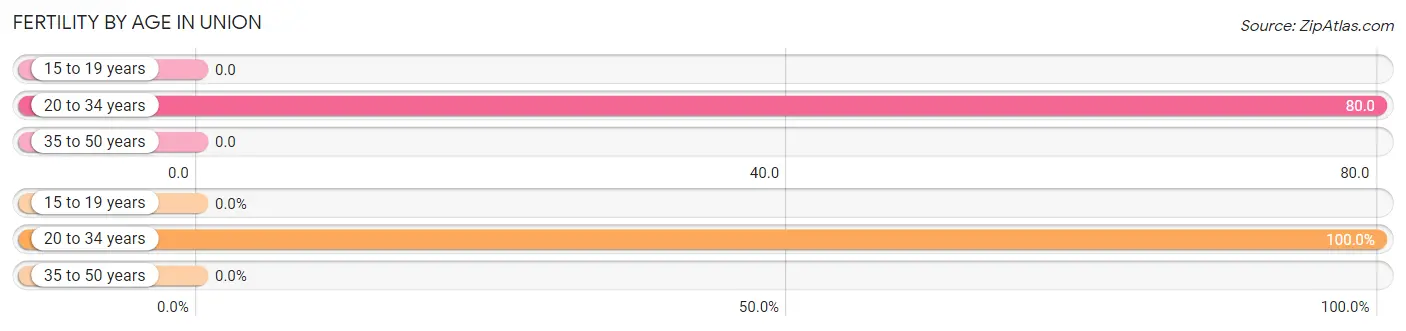
| Age Bracket | Women with Births | Births / 1,000 Women |
| 15 to 19 years | 0 (0.0%) | 0.0 |
| 20 to 34 years | 44 (100.0%) | 80.0 |
| 35 to 50 years | 0 (0.0%) | 0.0 |
| Total | 44 (100.0%) | 27.0 |
Fertility by Age by Marriage Status in Union
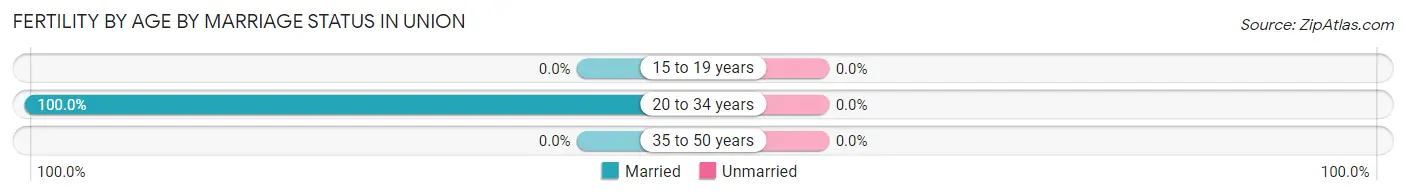
| Age Bracket | Married | Unmarried |
| 15 to 19 years | 0 (0.0%) | 0 (0.0%) |
| 20 to 34 years | 44 (100.0%) | 0 (0.0%) |
| 35 to 50 years | 0 (0.0%) | 0 (0.0%) |
| Total | 44 (100.0%) | 0 (0.0%) |
Fertility by Education in Union
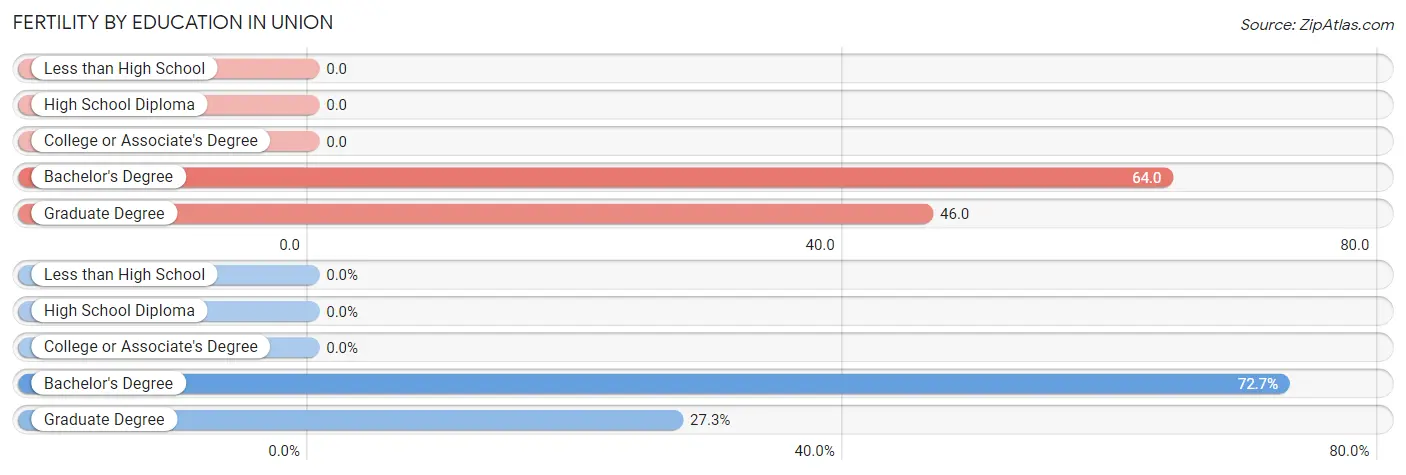
| Educational Attainment | Women with Births | Births / 1,000 Women |
| Less than High School | 0 (0.0%) | 0.0 |
| High School Diploma | 0 (0.0%) | 0.0 |
| College or Associate's Degree | 0 (0.0%) | 0.0 |
| Bachelor's Degree | 32 (72.7%) | 64.0 |
| Graduate Degree | 12 (27.3%) | 46.0 |
| Total | 44 (100.0%) | 27.0 |
Fertility by Education by Marriage Status in Union
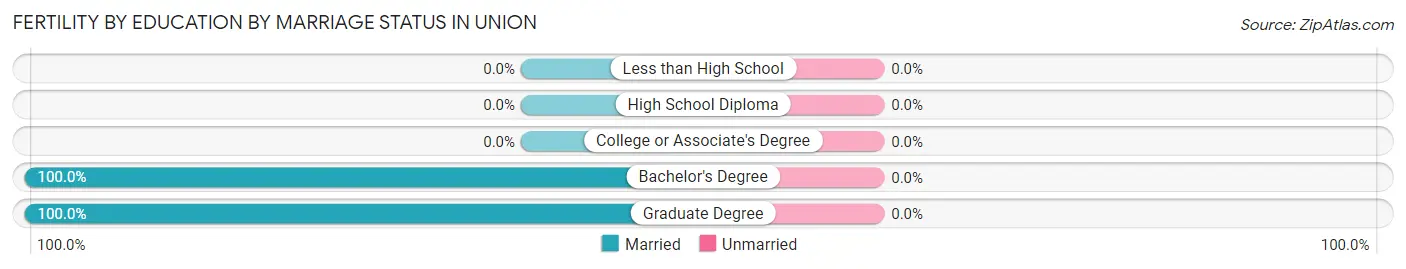
| Educational Attainment | Married | Unmarried |
| Less than High School | 0 (0.0%) | 0 (0.0%) |
| High School Diploma | 0 (0.0%) | 0 (0.0%) |
| College or Associate's Degree | 0 (0.0%) | 0 (0.0%) |
| Bachelor's Degree | 32 (100.0%) | 0 (0.0%) |
| Graduate Degree | 12 (100.0%) | 0 (0.0%) |
| Total | 44 (100.0%) | 0 (0.0%) |
Employment Characteristics in Union
Employment by Class of Employer in Union
Among the 3,899 employed individuals in Union, private company employees (2,706 | 69.4%), not-for-profit organizations (358 | 9.2%), and self-employed (incorporated) (255 | 6.5%) make up the most common classes of employment.
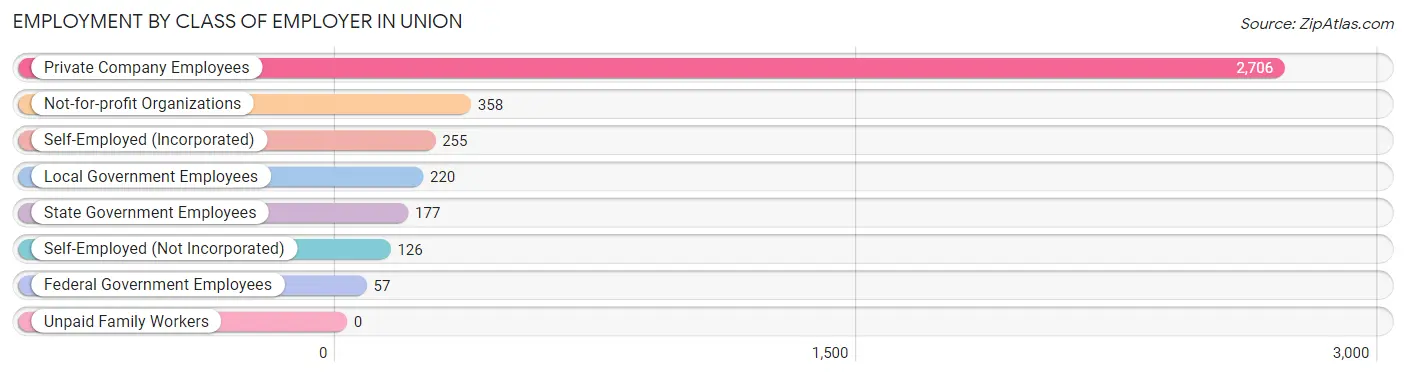
| Employer Class | # Employees | % Employees |
| Private Company Employees | 2,706 | 69.4% |
| Self-Employed (Incorporated) | 255 | 6.5% |
| Self-Employed (Not Incorporated) | 126 | 3.2% |
| Not-for-profit Organizations | 358 | 9.2% |
| Local Government Employees | 220 | 5.6% |
| State Government Employees | 177 | 4.5% |
| Federal Government Employees | 57 | 1.5% |
| Unpaid Family Workers | 0 | 0.0% |
| Total | 3,899 | 100.0% |
Employment Status by Age in Union
According to the labor force statistics for Union, out of the total population over 16 years of age (5,588), 71.6% or 4,001 individuals are in the labor force, with 0.8% or 32 of them unemployed. The age group with the highest labor force participation rate is 25 to 29 years, with 100.0% or 298 individuals in the labor force. Within the labor force, the 20 to 24 years age range has the highest percentage of unemployed individuals, with 8.6% or 33 of them being unemployed.
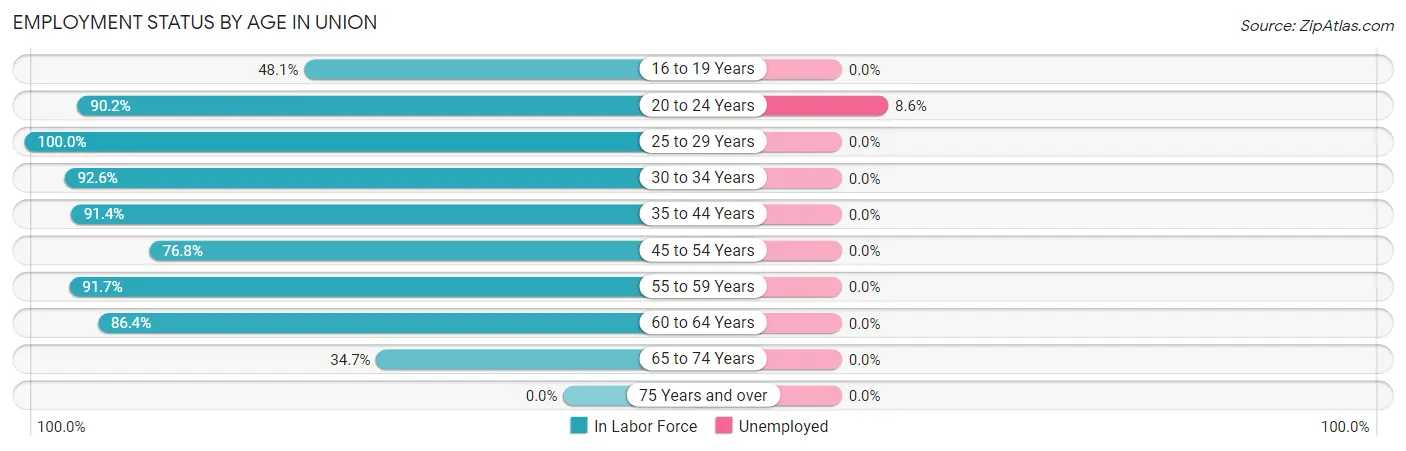
| Age Bracket | In Labor Force | Unemployed |
| 16 to 19 Years | 234 (48.1%) | 0 (0.0%) |
| 20 to 24 Years | 385 (90.2%) | 33 (8.6%) |
| 25 to 29 Years | 298 (100.0%) | 0 (0.0%) |
| 30 to 34 Years | 415 (92.6%) | 0 (0.0%) |
| 35 to 44 Years | 916 (91.4%) | 0 (0.0%) |
| 45 to 54 Years | 763 (76.8%) | 0 (0.0%) |
| 55 to 59 Years | 198 (91.7%) | 0 (0.0%) |
| 60 to 64 Years | 483 (86.4%) | 0 (0.0%) |
| 65 to 74 Years | 307 (34.7%) | 0 (0.0%) |
| 75 Years and over | 0 (0.0%) | 0 (0.0%) |
| Total | 4,001 (71.6%) | 32 (0.8%) |
Employment Status by Educational Attainment in Union
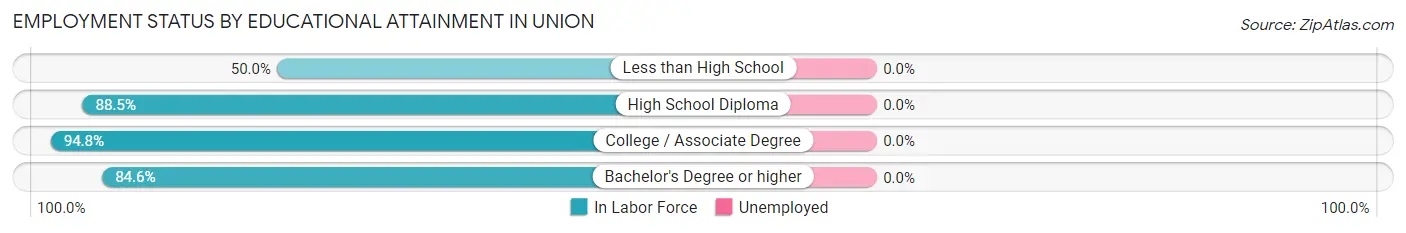
| Educational Attainment | In Labor Force | Unemployed |
| Less than High School | 9 (50.0%) | 0 (0.0%) |
| High School Diploma | 509 (88.5%) | 0 (0.0%) |
| College / Associate Degree | 763 (94.8%) | 0 (0.0%) |
| Bachelor's Degree or higher | 1,792 (84.6%) | 0 (0.0%) |
| Total | 3,073 (87.4%) | 0 (0.0%) |
Employment Occupations by Sex in Union
Management, Business, Science and Arts Occupations
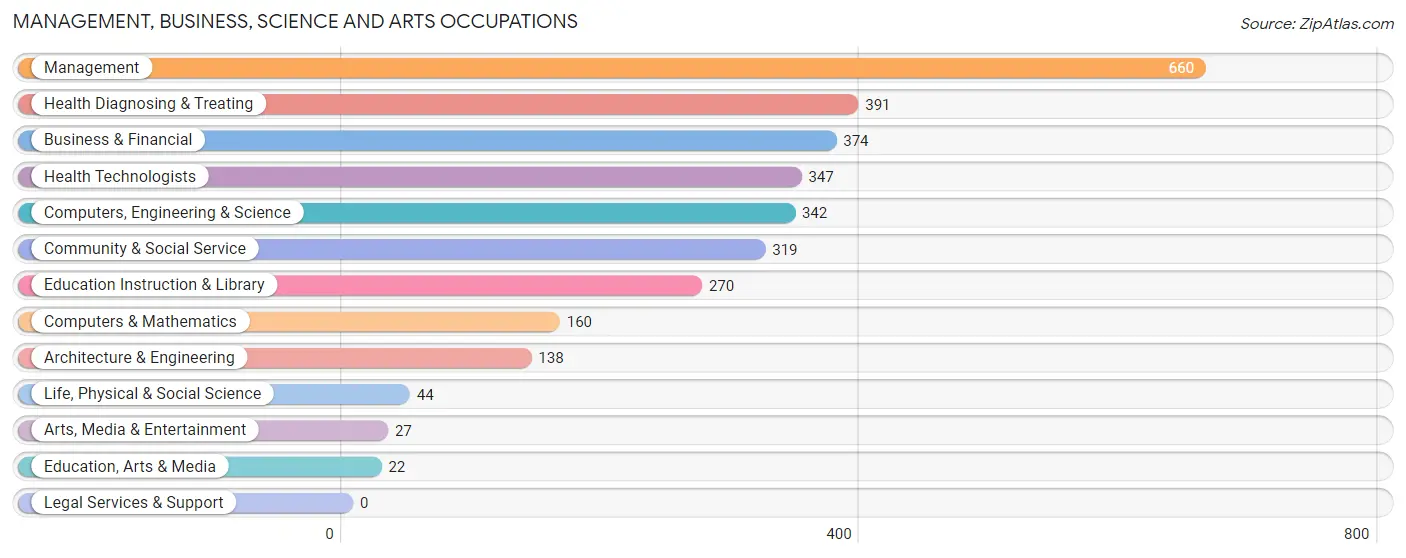
The most common Management, Business, Science and Arts occupations in Union are Management (660 | 16.6%), Health Diagnosing & Treating (391 | 9.9%), Business & Financial (374 | 9.4%), Health Technologists (347 | 8.7%), and Computers, Engineering & Science (342 | 8.6%).
Management, Business, Science and Arts Occupations by Sex
Within the Management, Business, Science and Arts occupations in Union, the most male-oriented occupations are Architecture & Engineering (100.0%), Life, Physical & Social Science (100.0%), and Education, Arts & Media (100.0%), while the most female-oriented occupations are Education Instruction & Library (95.9%), Community & Social Service (88.4%), and Health Technologists (85.6%).
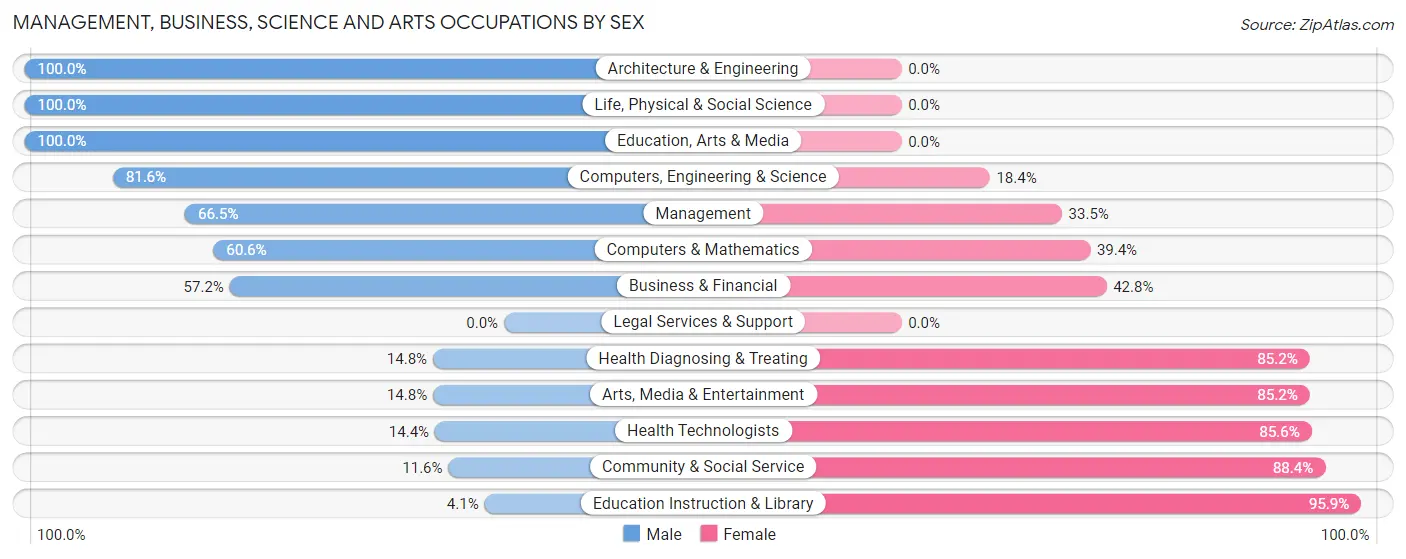
| Occupation | Male | Female |
| Management | 439 (66.5%) | 221 (33.5%) |
| Business & Financial | 214 (57.2%) | 160 (42.8%) |
| Computers, Engineering & Science | 279 (81.6%) | 63 (18.4%) |
| Computers & Mathematics | 97 (60.6%) | 63 (39.4%) |
| Architecture & Engineering | 138 (100.0%) | 0 (0.0%) |
| Life, Physical & Social Science | 44 (100.0%) | 0 (0.0%) |
| Community & Social Service | 37 (11.6%) | 282 (88.4%) |
| Education, Arts & Media | 22 (100.0%) | 0 (0.0%) |
| Legal Services & Support | 0 (0.0%) | 0 (0.0%) |
| Education Instruction & Library | 11 (4.1%) | 259 (95.9%) |
| Arts, Media & Entertainment | 4 (14.8%) | 23 (85.2%) |
| Health Diagnosing & Treating | 58 (14.8%) | 333 (85.2%) |
| Health Technologists | 50 (14.4%) | 297 (85.6%) |
| Total (Category) | 1,027 (49.2%) | 1,059 (50.8%) |
| Total (Overall) | 2,078 (52.4%) | 1,888 (47.6%) |
Services Occupations
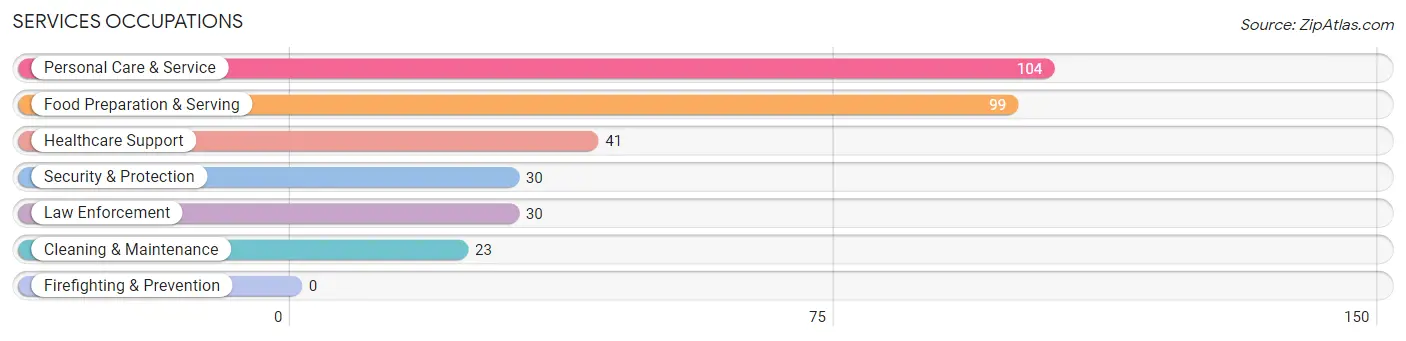
The most common Services occupations in Union are Personal Care & Service (104 | 2.6%), Food Preparation & Serving (99 | 2.5%), Healthcare Support (41 | 1.0%), Security & Protection (30 | 0.8%), and Law Enforcement (30 | 0.8%).
Services Occupations by Sex
Within the Services occupations in Union, the most male-oriented occupations are Security & Protection (100.0%), Law Enforcement (100.0%), and Cleaning & Maintenance (100.0%), while the most female-oriented occupations are Healthcare Support (100.0%), Personal Care & Service (100.0%), and Food Preparation & Serving (54.5%).
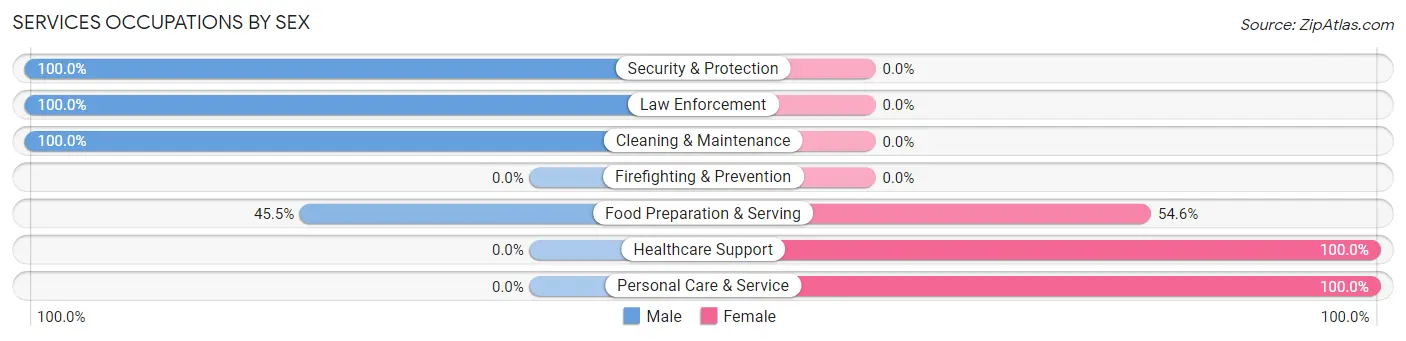
| Occupation | Male | Female |
| Healthcare Support | 0 (0.0%) | 41 (100.0%) |
| Security & Protection | 30 (100.0%) | 0 (0.0%) |
| Firefighting & Prevention | 0 (0.0%) | 0 (0.0%) |
| Law Enforcement | 30 (100.0%) | 0 (0.0%) |
| Food Preparation & Serving | 45 (45.5%) | 54 (54.5%) |
| Cleaning & Maintenance | 23 (100.0%) | 0 (0.0%) |
| Personal Care & Service | 0 (0.0%) | 104 (100.0%) |
| Total (Category) | 98 (33.0%) | 199 (67.0%) |
| Total (Overall) | 2,078 (52.4%) | 1,888 (47.6%) |
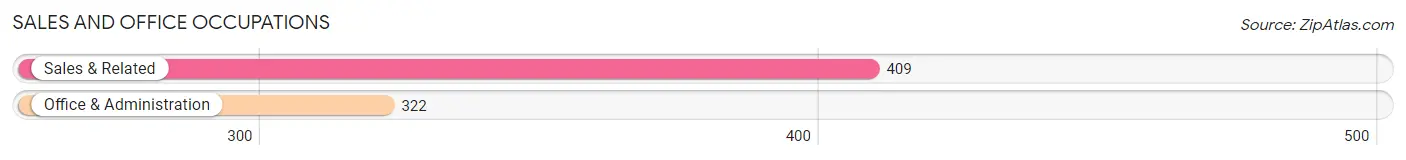
Sales and Office Occupations
The most common Sales and Office occupations in Union are Sales & Related (409 | 10.3%), and Office & Administration (322 | 8.1%).
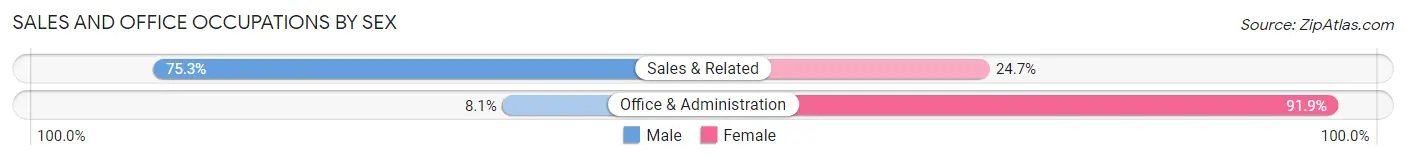
Sales and Office Occupations by Sex
| Occupation | Male | Female |
| Sales & Related | 308 (75.3%) | 101 (24.7%) |
| Office & Administration | 26 (8.1%) | 296 (91.9%) |
| Total (Category) | 334 (45.7%) | 397 (54.3%) |
| Total (Overall) | 2,078 (52.4%) | 1,888 (47.6%) |
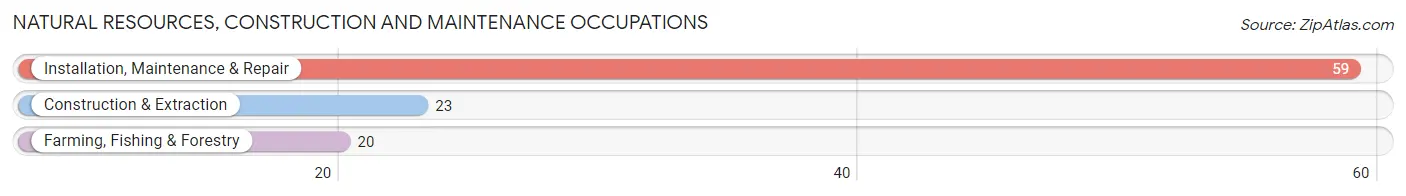
Natural Resources, Construction and Maintenance Occupations
The most common Natural Resources, Construction and Maintenance occupations in Union are Installation, Maintenance & Repair (59 | 1.5%), Construction & Extraction (23 | 0.6%), and Farming, Fishing & Forestry (20 | 0.5%).
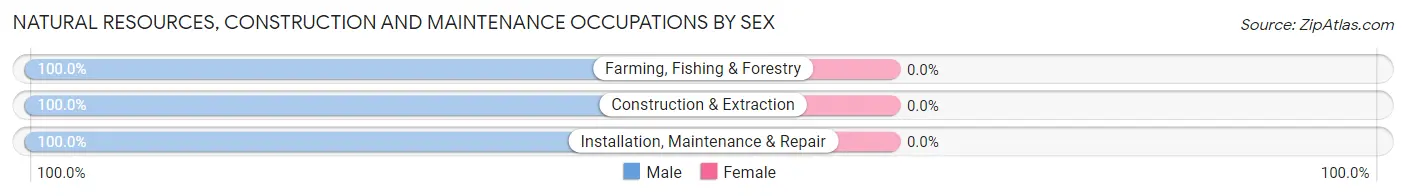
Natural Resources, Construction and Maintenance Occupations by Sex
| Occupation | Male | Female |
| Farming, Fishing & Forestry | 20 (100.0%) | 0 (0.0%) |
| Construction & Extraction | 23 (100.0%) | 0 (0.0%) |
| Installation, Maintenance & Repair | 59 (100.0%) | 0 (0.0%) |
| Total (Category) | 102 (100.0%) | 0 (0.0%) |
| Total (Overall) | 2,078 (52.4%) | 1,888 (47.6%) |
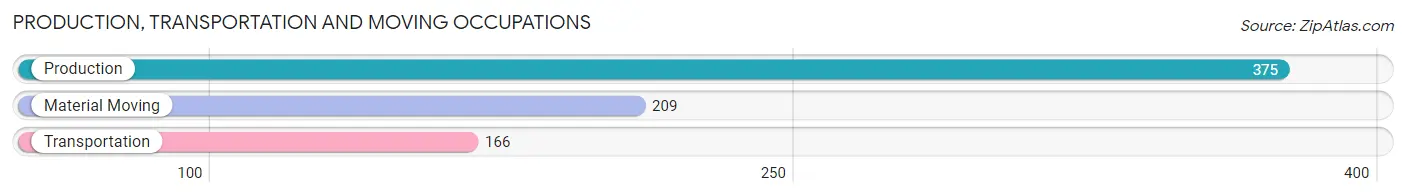
Production, Transportation and Moving Occupations
The most common Production, Transportation and Moving occupations in Union are Production (375 | 9.5%), Material Moving (209 | 5.3%), and Transportation (166 | 4.2%).
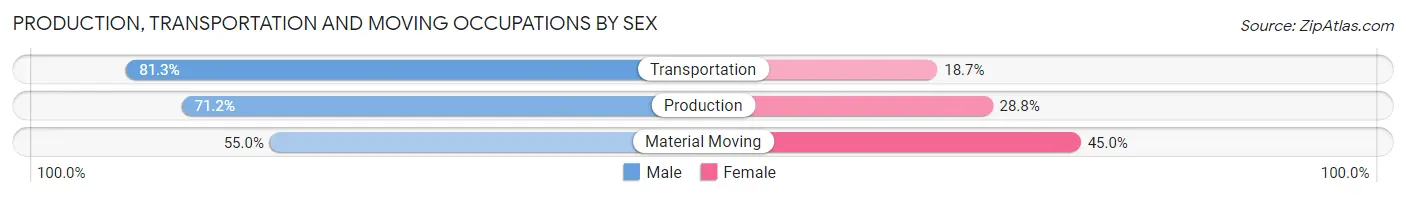
Production, Transportation and Moving Occupations by Sex
| Occupation | Male | Female |
| Production | 267 (71.2%) | 108 (28.8%) |
| Transportation | 135 (81.3%) | 31 (18.7%) |
| Material Moving | 115 (55.0%) | 94 (45.0%) |
| Total (Category) | 517 (68.9%) | 233 (31.1%) |
| Total (Overall) | 2,078 (52.4%) | 1,888 (47.6%) |
Employment Industries by Sex in Union
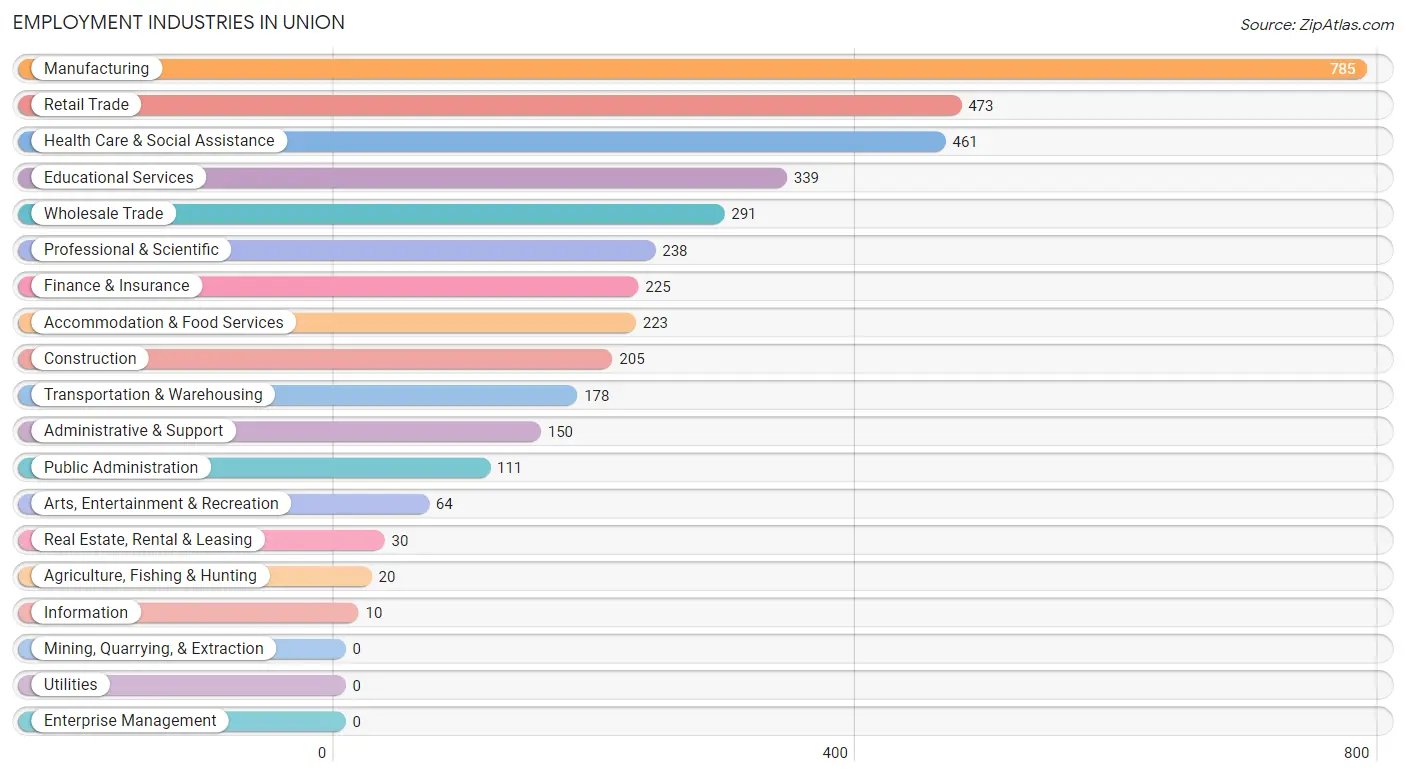
Employment Industries in Union
The major employment industries in Union include Manufacturing (785 | 19.8%), Retail Trade (473 | 11.9%), Health Care & Social Assistance (461 | 11.6%), Educational Services (339 | 8.6%), and Wholesale Trade (291 | 7.3%).
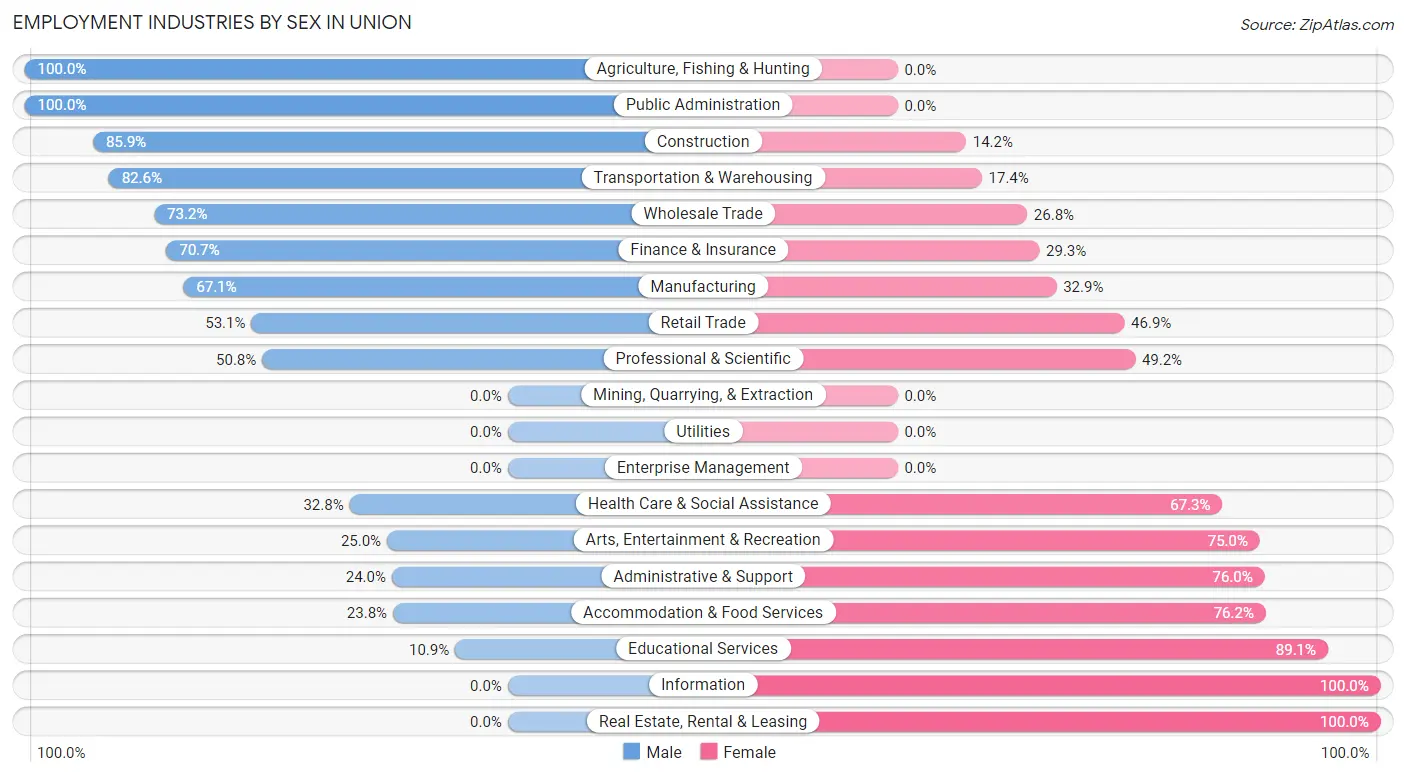
Employment Industries by Sex in Union
The Union industries that see more men than women are Agriculture, Fishing & Hunting (100.0%), Public Administration (100.0%), and Construction (85.9%), whereas the industries that tend to have a higher number of women are Information (100.0%), Real Estate, Rental & Leasing (100.0%), and Educational Services (89.1%).
| Industry | Male | Female |
| Agriculture, Fishing & Hunting | 20 (100.0%) | 0 (0.0%) |
| Mining, Quarrying, & Extraction | 0 (0.0%) | 0 (0.0%) |
| Construction | 176 (85.9%) | 29 (14.1%) |
| Manufacturing | 527 (67.1%) | 258 (32.9%) |
| Wholesale Trade | 213 (73.2%) | 78 (26.8%) |
| Retail Trade | 251 (53.1%) | 222 (46.9%) |
| Transportation & Warehousing | 147 (82.6%) | 31 (17.4%) |
| Utilities | 0 (0.0%) | 0 (0.0%) |
| Information | 0 (0.0%) | 10 (100.0%) |
| Finance & Insurance | 159 (70.7%) | 66 (29.3%) |
| Real Estate, Rental & Leasing | 0 (0.0%) | 30 (100.0%) |
| Professional & Scientific | 121 (50.8%) | 117 (49.2%) |
| Enterprise Management | 0 (0.0%) | 0 (0.0%) |
| Administrative & Support | 36 (24.0%) | 114 (76.0%) |
| Educational Services | 37 (10.9%) | 302 (89.1%) |
| Health Care & Social Assistance | 151 (32.8%) | 310 (67.2%) |
| Arts, Entertainment & Recreation | 16 (25.0%) | 48 (75.0%) |
| Accommodation & Food Services | 53 (23.8%) | 170 (76.2%) |
| Public Administration | 111 (100.0%) | 0 (0.0%) |
| Total | 2,078 (52.4%) | 1,888 (47.6%) |
Education in Union
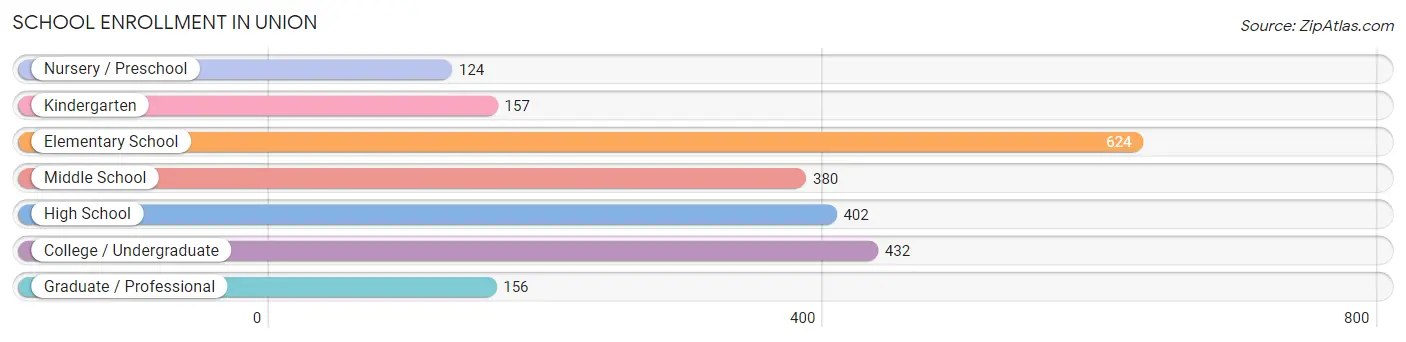
School Enrollment in Union
The most common levels of schooling among the 2,275 students in Union are elementary school (624 | 27.4%), college / undergraduate (432 | 19.0%), and high school (402 | 17.7%).
| School Level | # Students | % Students |
| Nursery / Preschool | 124 | 5.4% |
| Kindergarten | 157 | 6.9% |
| Elementary School | 624 | 27.4% |
| Middle School | 380 | 16.7% |
| High School | 402 | 17.7% |
| College / Undergraduate | 432 | 19.0% |
| Graduate / Professional | 156 | 6.9% |
| Total | 2,275 | 100.0% |
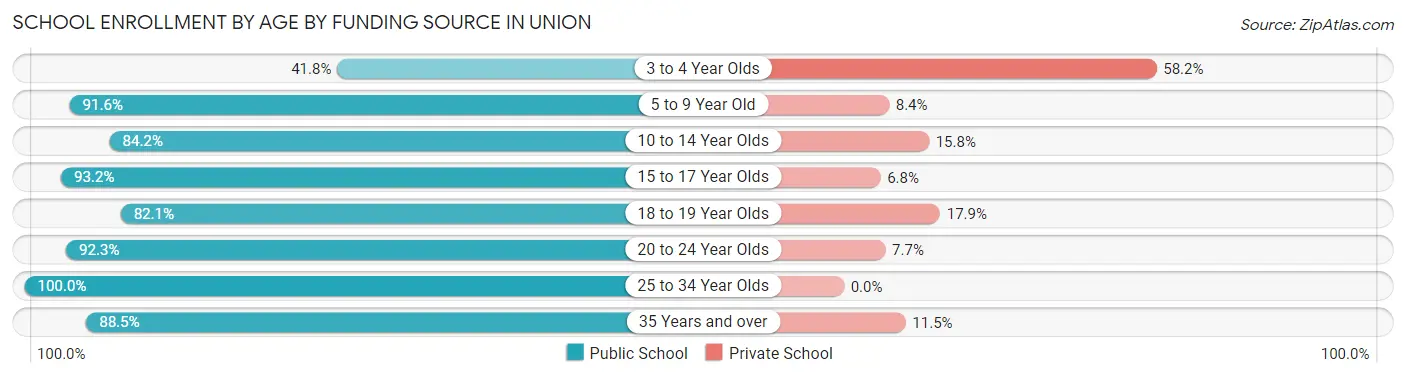
School Enrollment by Age by Funding Source in Union
Out of a total of 2,275 students who are enrolled in schools in Union, 273 (12.0%) attend a private institution, while the remaining 2,002 (88.0%) are enrolled in public schools. The age group of 3 to 4 year olds has the highest likelihood of being enrolled in private schools, with 46 (58.2% in the age bracket) enrolled. Conversely, the age group of 25 to 34 year olds has the lowest likelihood of being enrolled in a private school, with 85 (100.0% in the age bracket) attending a public institution.
| Age Bracket | Public School | Private School |
| 3 to 4 Year Olds | 33 (41.8%) | 46 (58.2%) |
| 5 to 9 Year Old | 742 (91.6%) | 68 (8.4%) |
| 10 to 14 Year Olds | 372 (84.2%) | 70 (15.8%) |
| 15 to 17 Year Olds | 315 (93.2%) | 23 (6.8%) |
| 18 to 19 Year Olds | 165 (82.1%) | 36 (17.9%) |
| 20 to 24 Year Olds | 191 (92.3%) | 16 (7.7%) |
| 25 to 34 Year Olds | 85 (100.0%) | 0 (0.0%) |
| 35 Years and over | 100 (88.5%) | 13 (11.5%) |
| Total | 2,002 (88.0%) | 273 (12.0%) |
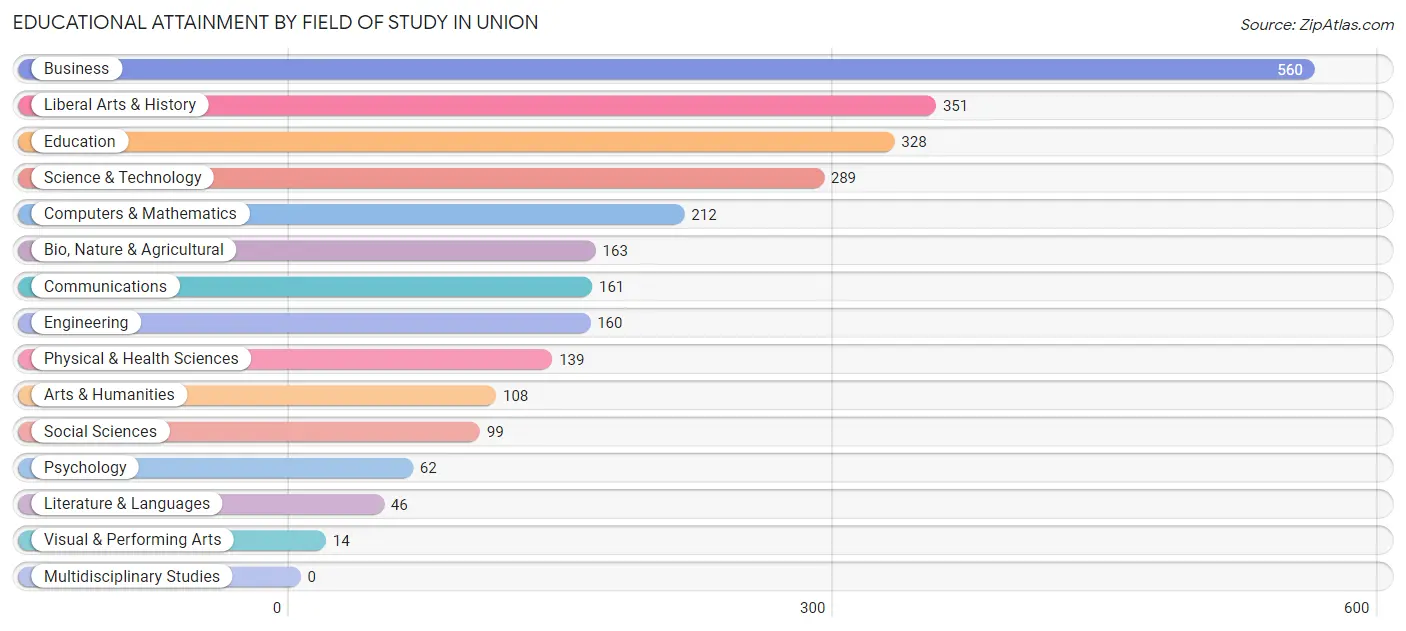
Educational Attainment by Field of Study in Union
Business (560 | 20.8%), liberal arts & history (351 | 13.0%), education (328 | 12.2%), science & technology (289 | 10.7%), and computers & mathematics (212 | 7.9%) are the most common fields of study among 2,692 individuals in Union who have obtained a bachelor's degree or higher.
| Field of Study | # Graduates | % Graduates |
| Computers & Mathematics | 212 | 7.9% |
| Bio, Nature & Agricultural | 163 | 6.0% |
| Physical & Health Sciences | 139 | 5.2% |
| Psychology | 62 | 2.3% |
| Social Sciences | 99 | 3.7% |
| Engineering | 160 | 5.9% |
| Multidisciplinary Studies | 0 | 0.0% |
| Science & Technology | 289 | 10.7% |
| Business | 560 | 20.8% |
| Education | 328 | 12.2% |
| Literature & Languages | 46 | 1.7% |
| Liberal Arts & History | 351 | 13.0% |
| Visual & Performing Arts | 14 | 0.5% |
| Communications | 161 | 6.0% |
| Arts & Humanities | 108 | 4.0% |
| Total | 2,692 | 100.0% |
Transportation & Commute in Union
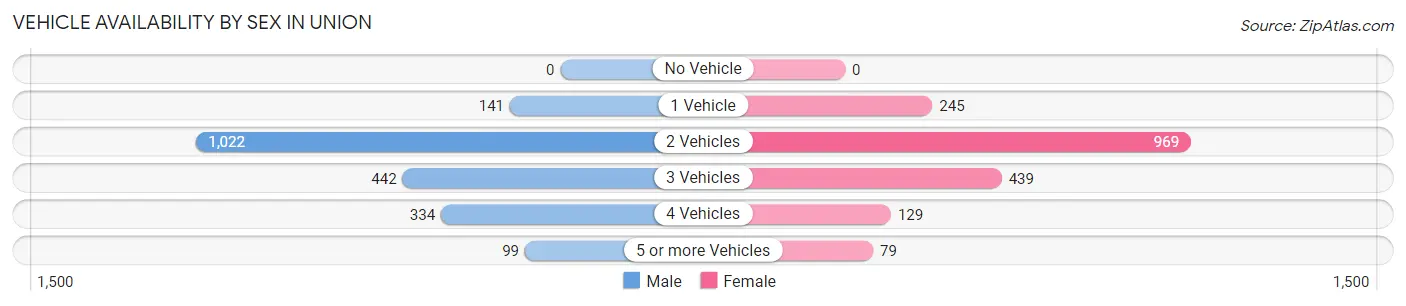
Vehicle Availability by Sex in Union
The most prevalent vehicle ownership categories in Union are males with 2 vehicles (1,022, accounting for 50.1%) and females with 2 vehicles (969, making up 54.9%).
| Vehicles Available | Male | Female |
| No Vehicle | 0 (0.0%) | 0 (0.0%) |
| 1 Vehicle | 141 (6.9%) | 245 (13.2%) |
| 2 Vehicles | 1,022 (50.1%) | 969 (52.1%) |
| 3 Vehicles | 442 (21.7%) | 439 (23.6%) |
| 4 Vehicles | 334 (16.4%) | 129 (6.9%) |
| 5 or more Vehicles | 99 (4.9%) | 79 (4.3%) |
| Total | 2,038 (100.0%) | 1,861 (100.0%) |
Commute Time in Union
The most frequently occuring commute durations in Union are 10 to 14 minutes (763 commuters, 23.3%), 20 to 24 minutes (494 commuters, 15.1%), and 15 to 19 minutes (453 commuters, 13.8%).
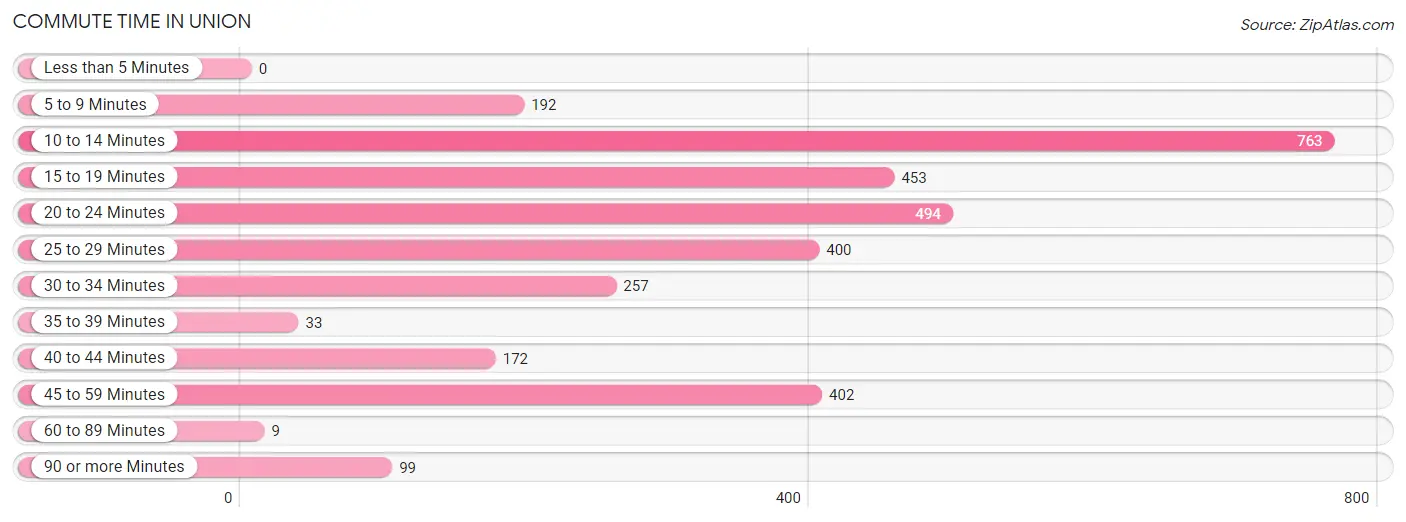
| Commute Time | # Commuters | % Commuters |
| Less than 5 Minutes | 0 | 0.0% |
| 5 to 9 Minutes | 192 | 5.9% |
| 10 to 14 Minutes | 763 | 23.3% |
| 15 to 19 Minutes | 453 | 13.8% |
| 20 to 24 Minutes | 494 | 15.1% |
| 25 to 29 Minutes | 400 | 12.2% |
| 30 to 34 Minutes | 257 | 7.9% |
| 35 to 39 Minutes | 33 | 1.0% |
| 40 to 44 Minutes | 172 | 5.2% |
| 45 to 59 Minutes | 402 | 12.3% |
| 60 to 89 Minutes | 9 | 0.3% |
| 90 or more Minutes | 99 | 3.0% |
Commute Time by Sex in Union
The most common commute times in Union are 10 to 14 minutes (323 commuters, 19.4%) for males and 10 to 14 minutes (440 commuters, 27.4%) for females.
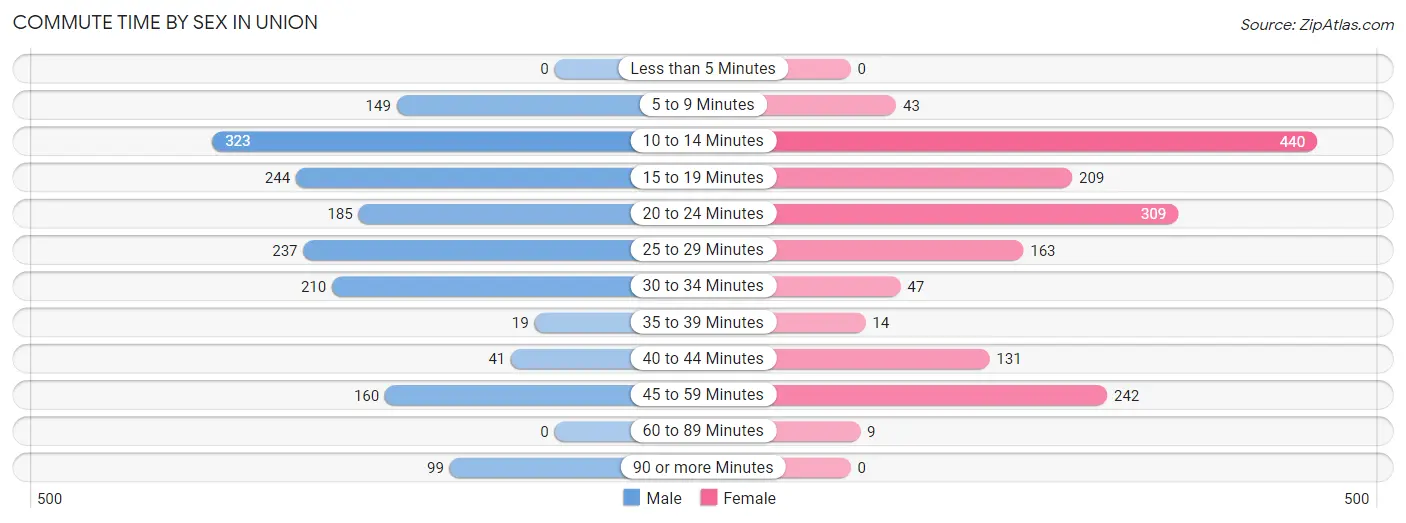
| Commute Time | Male | Female |
| Less than 5 Minutes | 0 (0.0%) | 0 (0.0%) |
| 5 to 9 Minutes | 149 (8.9%) | 43 (2.7%) |
| 10 to 14 Minutes | 323 (19.4%) | 440 (27.4%) |
| 15 to 19 Minutes | 244 (14.6%) | 209 (13.0%) |
| 20 to 24 Minutes | 185 (11.1%) | 309 (19.2%) |
| 25 to 29 Minutes | 237 (14.2%) | 163 (10.1%) |
| 30 to 34 Minutes | 210 (12.6%) | 47 (2.9%) |
| 35 to 39 Minutes | 19 (1.1%) | 14 (0.9%) |
| 40 to 44 Minutes | 41 (2.5%) | 131 (8.2%) |
| 45 to 59 Minutes | 160 (9.6%) | 242 (15.1%) |
| 60 to 89 Minutes | 0 (0.0%) | 9 (0.6%) |
| 90 or more Minutes | 99 (5.9%) | 0 (0.0%) |
Time of Departure to Work by Sex in Union
The most frequent times of departure to work in Union are 7:00 AM to 7:29 AM (272, 16.3%) for males and 4:00 PM to 11:59 PM (325, 20.2%) for females.
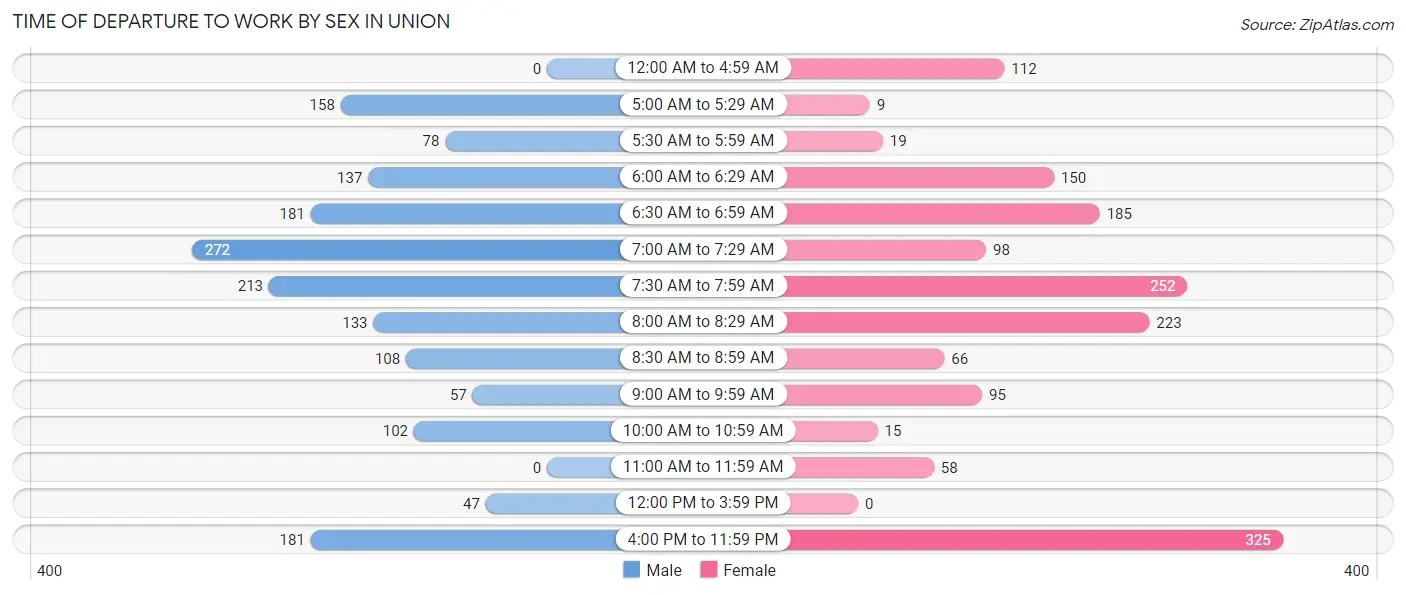
| Time of Departure | Male | Female |
| 12:00 AM to 4:59 AM | 0 (0.0%) | 112 (7.0%) |
| 5:00 AM to 5:29 AM | 158 (9.5%) | 9 (0.6%) |
| 5:30 AM to 5:59 AM | 78 (4.7%) | 19 (1.2%) |
| 6:00 AM to 6:29 AM | 137 (8.2%) | 150 (9.3%) |
| 6:30 AM to 6:59 AM | 181 (10.9%) | 185 (11.5%) |
| 7:00 AM to 7:29 AM | 272 (16.3%) | 98 (6.1%) |
| 7:30 AM to 7:59 AM | 213 (12.8%) | 252 (15.7%) |
| 8:00 AM to 8:29 AM | 133 (8.0%) | 223 (13.9%) |
| 8:30 AM to 8:59 AM | 108 (6.5%) | 66 (4.1%) |
| 9:00 AM to 9:59 AM | 57 (3.4%) | 95 (5.9%) |
| 10:00 AM to 10:59 AM | 102 (6.1%) | 15 (0.9%) |
| 11:00 AM to 11:59 AM | 0 (0.0%) | 58 (3.6%) |
| 12:00 PM to 3:59 PM | 47 (2.8%) | 0 (0.0%) |
| 4:00 PM to 11:59 PM | 181 (10.9%) | 325 (20.2%) |
| Total | 1,667 (100.0%) | 1,607 (100.0%) |
Housing Occupancy in Union
Occupancy by Ownership in Union
Of the total 2,414 dwellings in Union, owner-occupied units account for 2,097 (86.9%), while renter-occupied units make up 317 (13.1%).
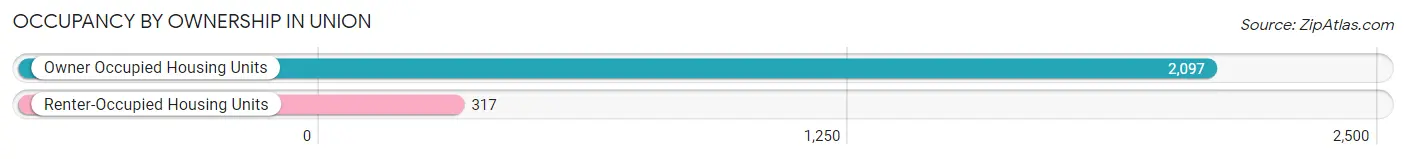
| Occupancy | # Housing Units | % Housing Units |
| Owner Occupied Housing Units | 2,097 | 86.9% |
| Renter-Occupied Housing Units | 317 | 13.1% |
| Total Occupied Housing Units | 2,414 | 100.0% |
Occupancy by Household Size in Union

| Household Size | # Housing Units | % Housing Units |
| 1-Person Household | 137 | 5.7% |
| 2-Person Household | 935 | 38.7% |
| 3-Person Household | 463 | 19.2% |
| 4+ Person Household | 879 | 36.4% |
| Total Housing Units | 2,414 | 100.0% |
Occupancy by Ownership by Household Size in Union
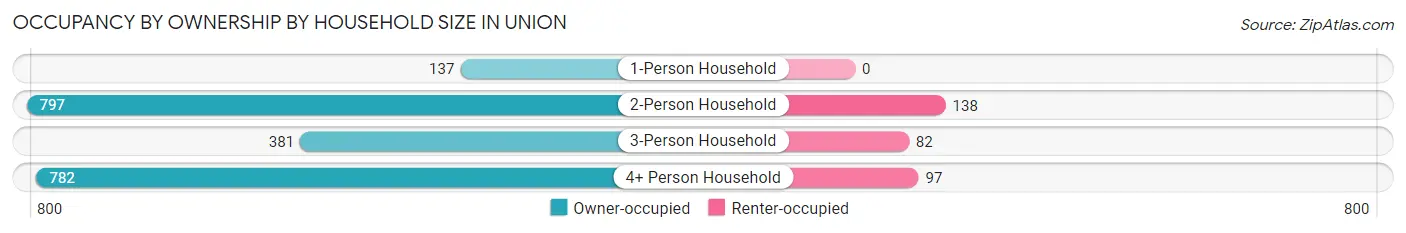
| Household Size | Owner-occupied | Renter-occupied |
| 1-Person Household | 137 (100.0%) | 0 (0.0%) |
| 2-Person Household | 797 (85.2%) | 138 (14.8%) |
| 3-Person Household | 381 (82.3%) | 82 (17.7%) |
| 4+ Person Household | 782 (89.0%) | 97 (11.0%) |
| Total Housing Units | 2,097 (86.9%) | 317 (13.1%) |
Occupancy by Educational Attainment in Union
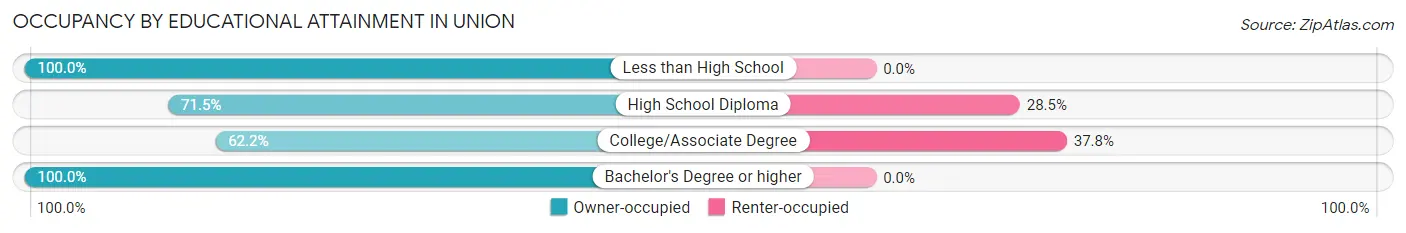
| Household Size | Owner-occupied | Renter-occupied |
| Less than High School | 9 (100.0%) | 0 (0.0%) |
| High School Diploma | 314 (71.5%) | 125 (28.5%) |
| College/Associate Degree | 316 (62.2%) | 192 (37.8%) |
| Bachelor's Degree or higher | 1,458 (100.0%) | 0 (0.0%) |
Occupancy by Age of Householder in Union
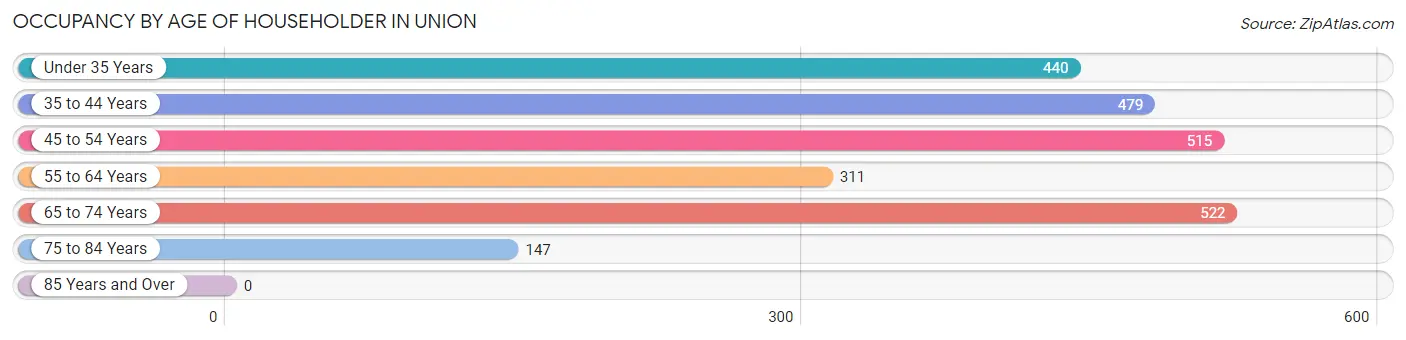
| Age Bracket | # Households | % Households |
| Under 35 Years | 440 | 18.2% |
| 35 to 44 Years | 479 | 19.8% |
| 45 to 54 Years | 515 | 21.3% |
| 55 to 64 Years | 311 | 12.9% |
| 65 to 74 Years | 522 | 21.6% |
| 75 to 84 Years | 147 | 6.1% |
| 85 Years and Over | 0 | 0.0% |
| Total | 2,414 | 100.0% |
Housing Finances in Union
Median Income by Occupancy in Union
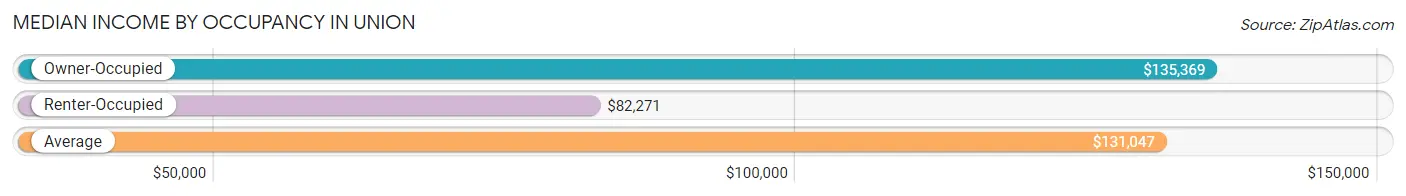
| Occupancy Type | # Households | Median Income |
| Owner-Occupied | 2,097 (86.9%) | $135,369 |
| Renter-Occupied | 317 (13.1%) | $82,271 |
| Average | 2,414 (100.0%) | $131,047 |
Occupancy by Householder Income Bracket in Union
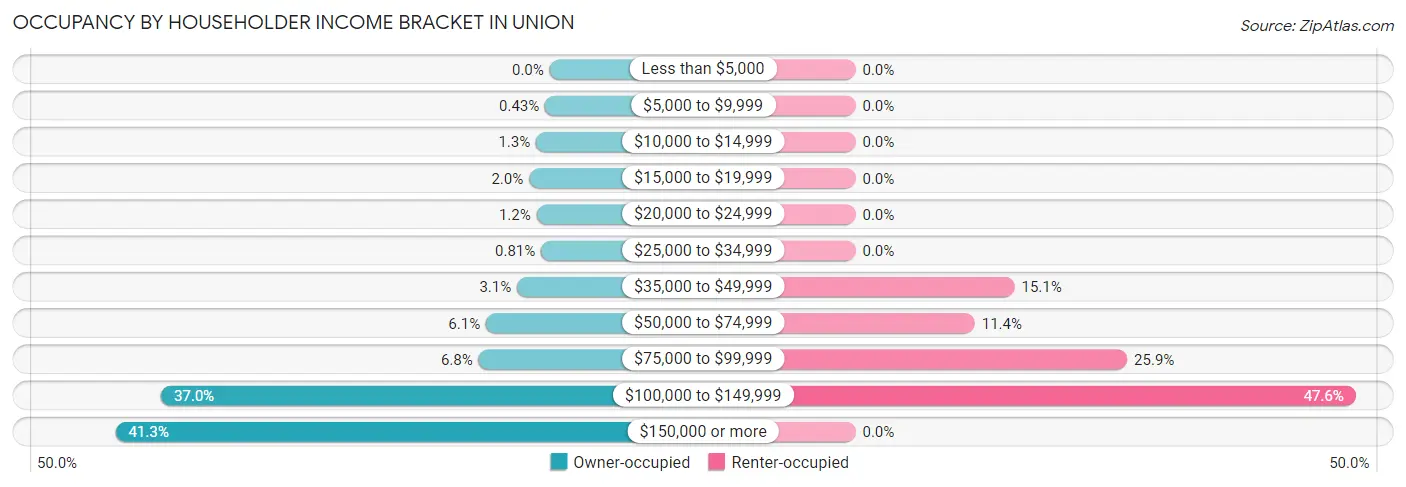
| Income Bracket | Owner-occupied | Renter-occupied |
| Less than $5,000 | 0 (0.0%) | 0 (0.0%) |
| $5,000 to $9,999 | 9 (0.4%) | 0 (0.0%) |
| $10,000 to $14,999 | 27 (1.3%) | 0 (0.0%) |
| $15,000 to $19,999 | 41 (2.0%) | 0 (0.0%) |
| $20,000 to $24,999 | 26 (1.2%) | 0 (0.0%) |
| $25,000 to $34,999 | 17 (0.8%) | 0 (0.0%) |
| $35,000 to $49,999 | 65 (3.1%) | 48 (15.1%) |
| $50,000 to $74,999 | 127 (6.1%) | 36 (11.4%) |
| $75,000 to $99,999 | 142 (6.8%) | 82 (25.9%) |
| $100,000 to $149,999 | 776 (37.0%) | 151 (47.6%) |
| $150,000 or more | 867 (41.3%) | 0 (0.0%) |
| Total | 2,097 (100.0%) | 317 (100.0%) |
Monthly Housing Cost Tiers in Union
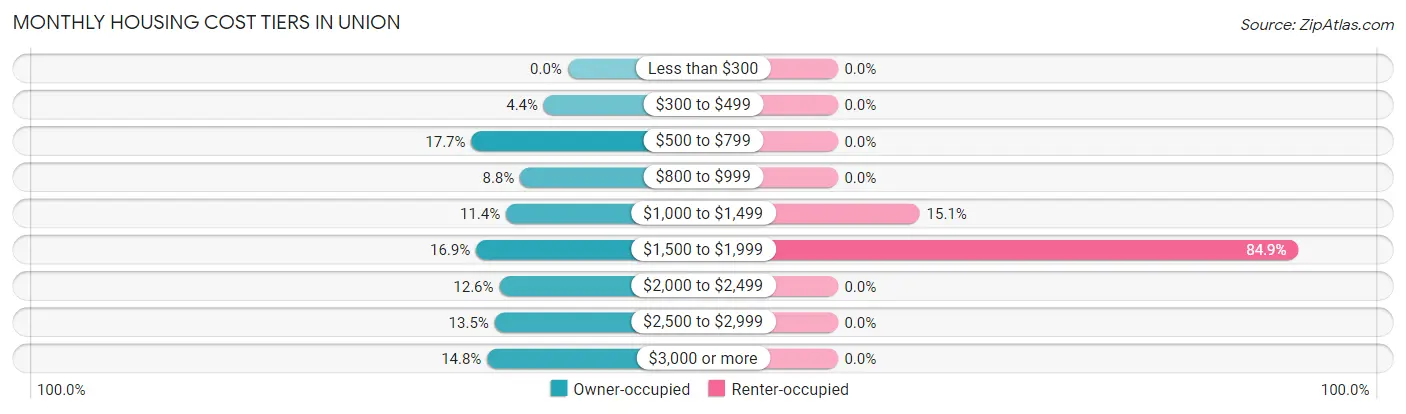
| Monthly Cost | Owner-occupied | Renter-occupied |
| Less than $300 | 0 (0.0%) | 0 (0.0%) |
| $300 to $499 | 92 (4.4%) | 0 (0.0%) |
| $500 to $799 | 372 (17.7%) | 0 (0.0%) |
| $800 to $999 | 184 (8.8%) | 0 (0.0%) |
| $1,000 to $1,499 | 238 (11.4%) | 48 (15.1%) |
| $1,500 to $1,999 | 354 (16.9%) | 269 (84.9%) |
| $2,000 to $2,499 | 264 (12.6%) | 0 (0.0%) |
| $2,500 to $2,999 | 282 (13.5%) | 0 (0.0%) |
| $3,000 or more | 311 (14.8%) | 0 (0.0%) |
| Total | 2,097 (100.0%) | 317 (100.0%) |
Physical Housing Characteristics in Union
Housing Structures in Union
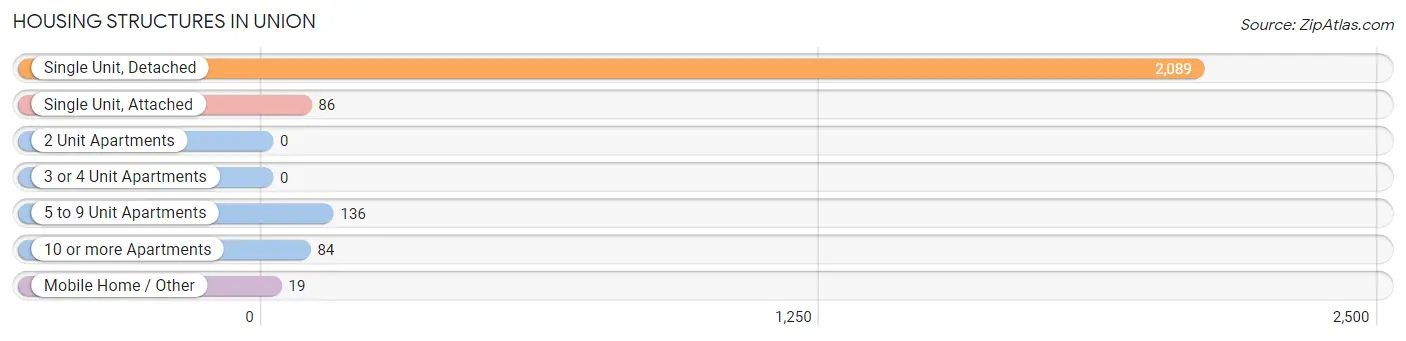
| Structure Type | # Housing Units | % Housing Units |
| Single Unit, Detached | 2,089 | 86.5% |
| Single Unit, Attached | 86 | 3.6% |
| 2 Unit Apartments | 0 | 0.0% |
| 3 or 4 Unit Apartments | 0 | 0.0% |
| 5 to 9 Unit Apartments | 136 | 5.6% |
| 10 or more Apartments | 84 | 3.5% |
| Mobile Home / Other | 19 | 0.8% |
| Total | 2,414 | 100.0% |
Housing Structures by Occupancy in Union
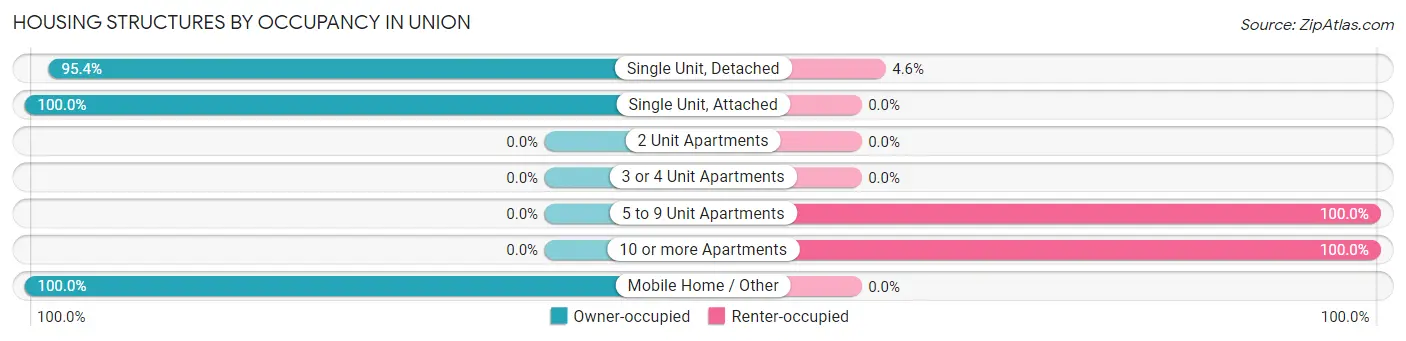
| Structure Type | Owner-occupied | Renter-occupied |
| Single Unit, Detached | 1,992 (95.4%) | 97 (4.6%) |
| Single Unit, Attached | 86 (100.0%) | 0 (0.0%) |
| 2 Unit Apartments | 0 (0.0%) | 0 (0.0%) |
| 3 or 4 Unit Apartments | 0 (0.0%) | 0 (0.0%) |
| 5 to 9 Unit Apartments | 0 (0.0%) | 136 (100.0%) |
| 10 or more Apartments | 0 (0.0%) | 84 (100.0%) |
| Mobile Home / Other | 19 (100.0%) | 0 (0.0%) |
| Total | 2,097 (86.9%) | 317 (13.1%) |
Housing Structures by Number of Rooms in Union
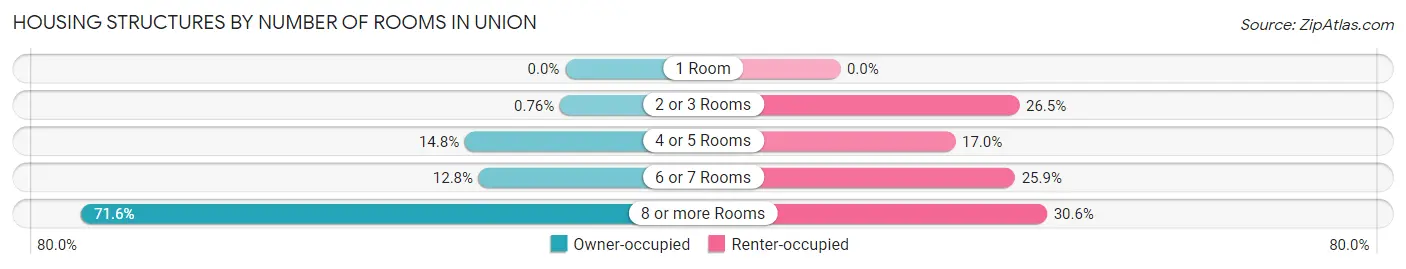
| Number of Rooms | Owner-occupied | Renter-occupied |
| 1 Room | 0 (0.0%) | 0 (0.0%) |
| 2 or 3 Rooms | 16 (0.8%) | 84 (26.5%) |
| 4 or 5 Rooms | 311 (14.8%) | 54 (17.0%) |
| 6 or 7 Rooms | 268 (12.8%) | 82 (25.9%) |
| 8 or more Rooms | 1,502 (71.6%) | 97 (30.6%) |
| Total | 2,097 (100.0%) | 317 (100.0%) |
Housing Structure by Heating Type in Union
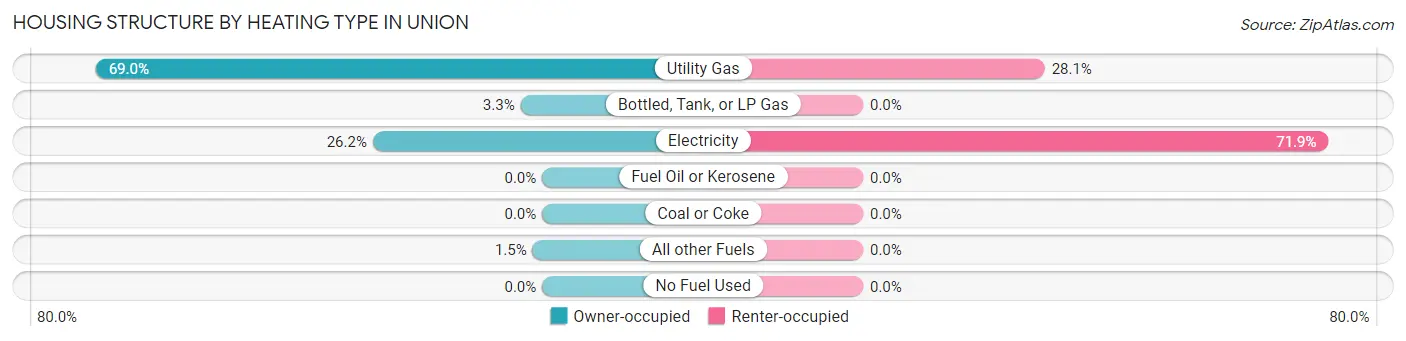
| Heating Type | Owner-occupied | Renter-occupied |
| Utility Gas | 1,447 (69.0%) | 89 (28.1%) |
| Bottled, Tank, or LP Gas | 70 (3.3%) | 0 (0.0%) |
| Electricity | 549 (26.2%) | 228 (71.9%) |
| Fuel Oil or Kerosene | 0 (0.0%) | 0 (0.0%) |
| Coal or Coke | 0 (0.0%) | 0 (0.0%) |
| All other Fuels | 31 (1.5%) | 0 (0.0%) |
| No Fuel Used | 0 (0.0%) | 0 (0.0%) |
| Total | 2,097 (100.0%) | 317 (100.0%) |
Household Vehicle Usage in Union
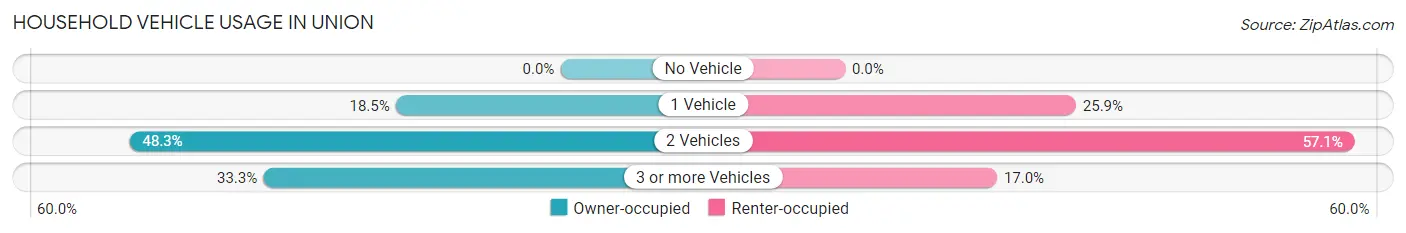
| Vehicles per Household | Owner-occupied | Renter-occupied |
| No Vehicle | 0 (0.0%) | 0 (0.0%) |
| 1 Vehicle | 387 (18.4%) | 82 (25.9%) |
| 2 Vehicles | 1,012 (48.3%) | 181 (57.1%) |
| 3 or more Vehicles | 698 (33.3%) | 54 (17.0%) |
| Total | 2,097 (100.0%) | 317 (100.0%) |
Real Estate & Mortgages in Union
Real Estate and Mortgage Overview in Union
| Characteristic | Without Mortgage | With Mortgage |
| Housing Units | 515 | 1,582 |
| Median Property Value | $316,700 | $348,600 |
| Median Household Income | $119,550 | $738 |
| Monthly Housing Costs | $675 | $311 |
| Real Estate Taxes | $3,150 | $12 |
Property Value by Mortgage Status in Union
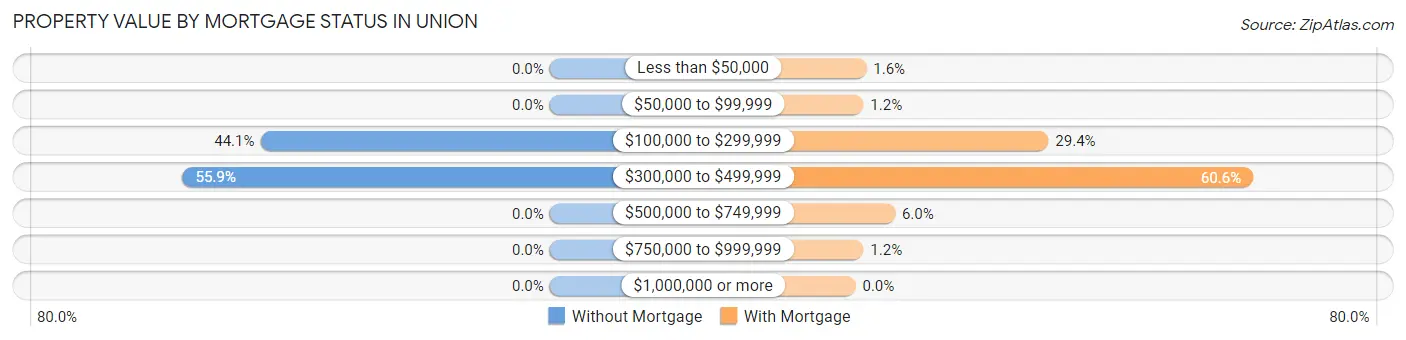
| Property Value | Without Mortgage | With Mortgage |
| Less than $50,000 | 0 (0.0%) | 26 (1.6%) |
| $50,000 to $99,999 | 0 (0.0%) | 19 (1.2%) |
| $100,000 to $299,999 | 227 (44.1%) | 465 (29.4%) |
| $300,000 to $499,999 | 288 (55.9%) | 958 (60.6%) |
| $500,000 to $749,999 | 0 (0.0%) | 95 (6.0%) |
| $750,000 to $999,999 | 0 (0.0%) | 19 (1.2%) |
| $1,000,000 or more | 0 (0.0%) | 0 (0.0%) |
| Total | 515 (100.0%) | 1,582 (100.0%) |
Household Income by Mortgage Status in Union
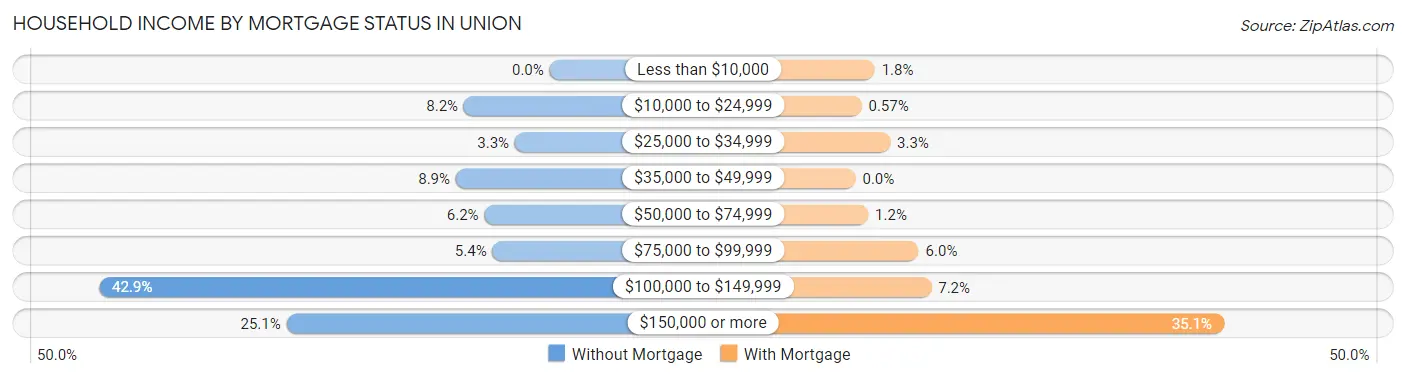
| Household Income | Without Mortgage | With Mortgage |
| Less than $10,000 | 0 (0.0%) | 29 (1.8%) |
| $10,000 to $24,999 | 42 (8.2%) | 9 (0.6%) |
| $25,000 to $34,999 | 17 (3.3%) | 52 (3.3%) |
| $35,000 to $49,999 | 46 (8.9%) | 0 (0.0%) |
| $50,000 to $74,999 | 32 (6.2%) | 19 (1.2%) |
| $75,000 to $99,999 | 28 (5.4%) | 95 (6.0%) |
| $100,000 to $149,999 | 221 (42.9%) | 114 (7.2%) |
| $150,000 or more | 129 (25.1%) | 555 (35.1%) |
| Total | 515 (100.0%) | 1,582 (100.0%) |
Property Value to Household Income Ratio in Union
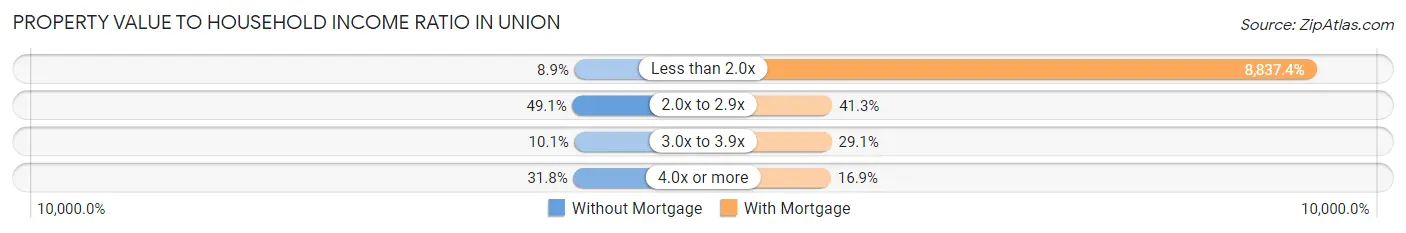
| Value-to-Income Ratio | Without Mortgage | With Mortgage |
| Less than 2.0x | 46 (8.9%) | 139,808 (8,837.4%) |
| 2.0x to 2.9x | 253 (49.1%) | 654 (41.3%) |
| 3.0x to 3.9x | 52 (10.1%) | 460 (29.1%) |
| 4.0x or more | 164 (31.8%) | 268 (16.9%) |
| Total | 515 (100.0%) | 1,582 (100.0%) |
Real Estate Taxes by Mortgage Status in Union
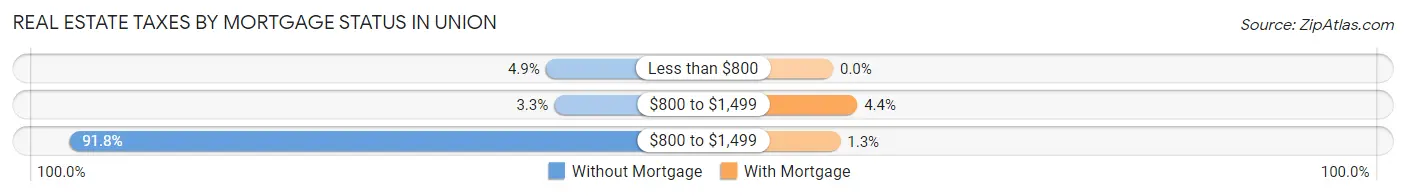
| Property Taxes | Without Mortgage | With Mortgage |
| Less than $800 | 25 (4.9%) | 0 (0.0%) |
| $800 to $1,499 | 17 (3.3%) | 70 (4.4%) |
| $800 to $1,499 | 473 (91.8%) | 21 (1.3%) |
| Total | 515 (100.0%) | 1,582 (100.0%) |
Health & Disability in Union
Health Insurance Coverage by Age in Union
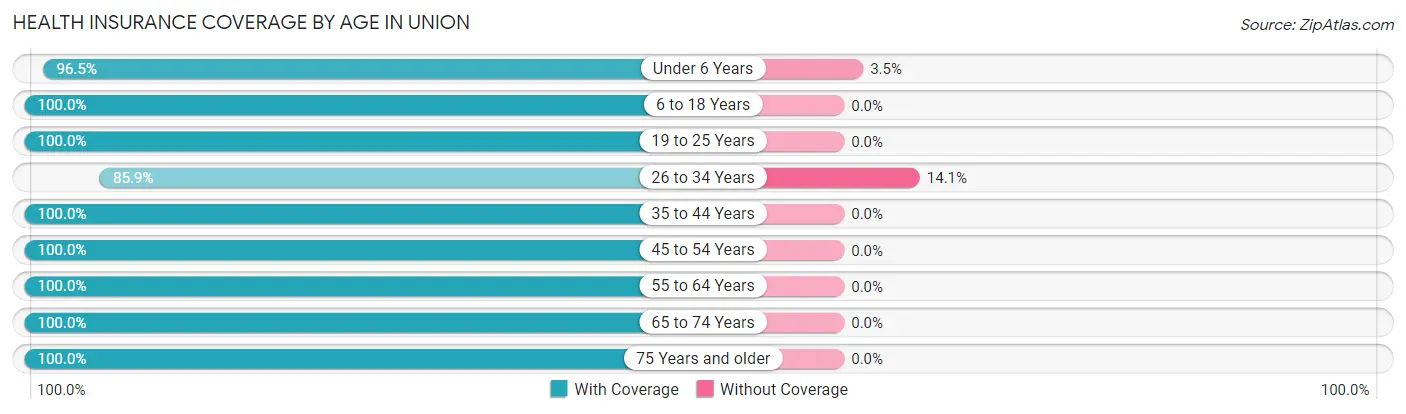
| Age Bracket | With Coverage | Without Coverage |
| Under 6 Years | 601 (96.5%) | 22 (3.5%) |
| 6 to 18 Years | 1,461 (100.0%) | 0 (0.0%) |
| 19 to 25 Years | 618 (100.0%) | 0 (0.0%) |
| 26 to 34 Years | 634 (85.9%) | 104 (14.1%) |
| 35 to 44 Years | 1,002 (100.0%) | 0 (0.0%) |
| 45 to 54 Years | 993 (100.0%) | 0 (0.0%) |
| 55 to 64 Years | 775 (100.0%) | 0 (0.0%) |
| 65 to 74 Years | 886 (100.0%) | 0 (0.0%) |
| 75 Years and older | 273 (100.0%) | 0 (0.0%) |
| Total | 7,243 (98.3%) | 126 (1.7%) |
Health Insurance Coverage by Citizenship Status in Union
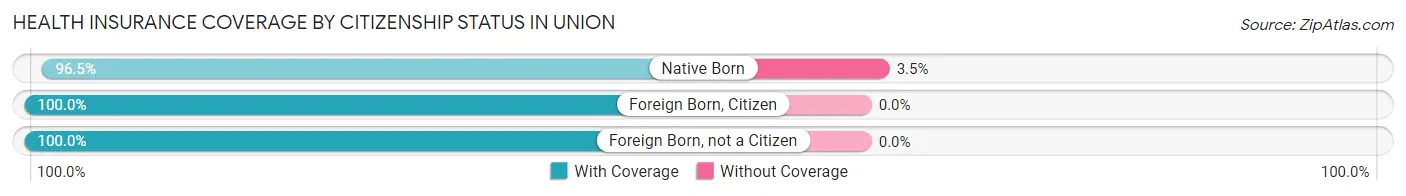
| Citizenship Status | With Coverage | Without Coverage |
| Native Born | 601 (96.5%) | 22 (3.5%) |
| Foreign Born, Citizen | 1,461 (100.0%) | 0 (0.0%) |
| Foreign Born, not a Citizen | 618 (100.0%) | 0 (0.0%) |
Health Insurance Coverage by Household Income in Union
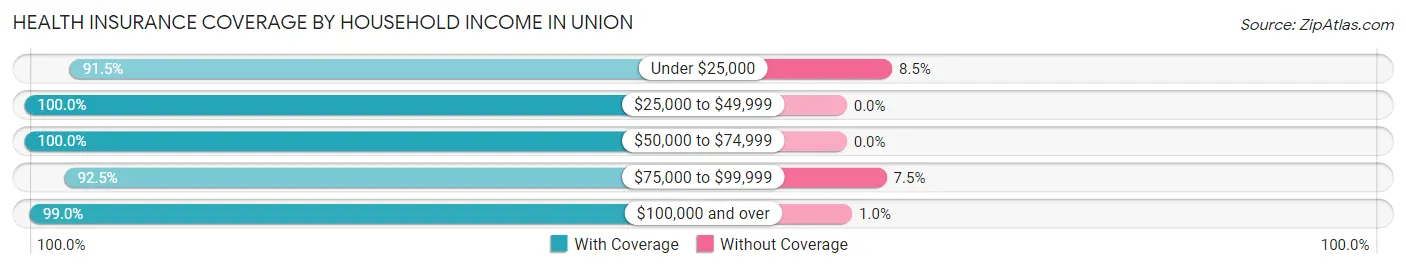
| Household Income | With Coverage | Without Coverage |
| Under $25,000 | 237 (91.5%) | 22 (8.5%) |
| $25,000 to $49,999 | 216 (100.0%) | 0 (0.0%) |
| $50,000 to $74,999 | 322 (100.0%) | 0 (0.0%) |
| $75,000 to $99,999 | 545 (92.5%) | 44 (7.5%) |
| $100,000 and over | 5,923 (99.0%) | 60 (1.0%) |
Public vs Private Health Insurance Coverage by Age in Union
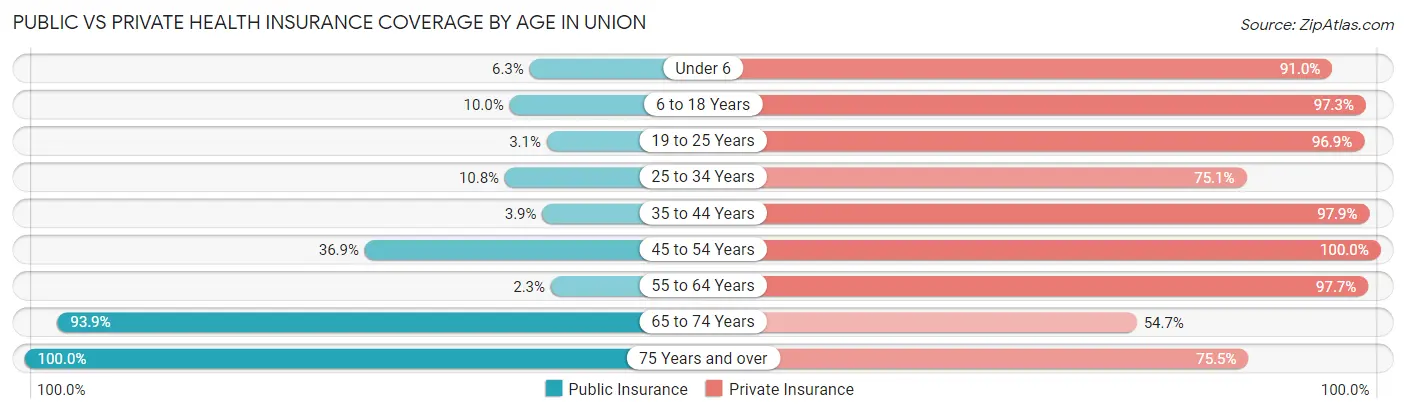
| Age Bracket | Public Insurance | Private Insurance |
| Under 6 | 39 (6.3%) | 567 (91.0%) |
| 6 to 18 Years | 146 (10.0%) | 1,421 (97.3%) |
| 19 to 25 Years | 19 (3.1%) | 599 (96.9%) |
| 25 to 34 Years | 80 (10.8%) | 554 (75.1%) |
| 35 to 44 Years | 39 (3.9%) | 981 (97.9%) |
| 45 to 54 Years | 366 (36.9%) | 993 (100.0%) |
| 55 to 64 Years | 18 (2.3%) | 757 (97.7%) |
| 65 to 74 Years | 832 (93.9%) | 485 (54.7%) |
| 75 Years and over | 273 (100.0%) | 206 (75.5%) |
| Total | 1,812 (24.6%) | 6,563 (89.1%) |
Disability Status by Sex by Age in Union
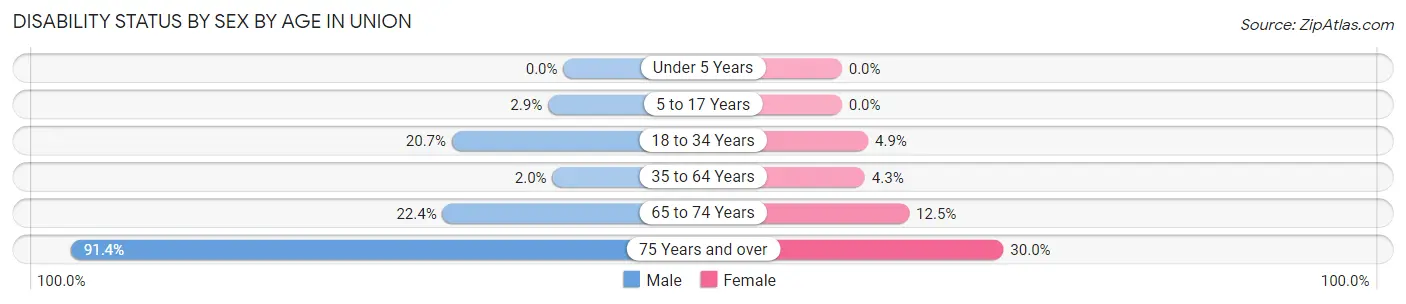
| Age Bracket | Male | Female |
| Under 5 Years | 0 (0.0%) | 0 (0.0%) |
| 5 to 17 Years | 27 (2.9%) | 0 (0.0%) |
| 18 to 34 Years | 132 (20.7%) | 36 (4.9%) |
| 35 to 64 Years | 26 (2.0%) | 64 (4.3%) |
| 65 to 74 Years | 109 (22.4%) | 50 (12.5%) |
| 75 Years and over | 149 (91.4%) | 33 (30.0%) |
Disability Class by Sex by Age in Union
Disability Class: Hearing Difficulty
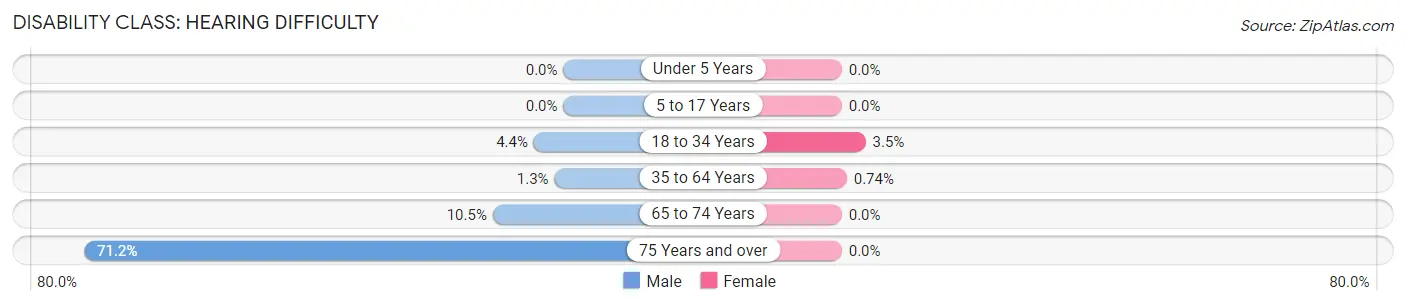
| Age Bracket | Male | Female |
| Under 5 Years | 0 (0.0%) | 0 (0.0%) |
| 5 to 17 Years | 0 (0.0%) | 0 (0.0%) |
| 18 to 34 Years | 28 (4.4%) | 26 (3.5%) |
| 35 to 64 Years | 17 (1.3%) | 11 (0.7%) |
| 65 to 74 Years | 51 (10.5%) | 0 (0.0%) |
| 75 Years and over | 116 (71.2%) | 0 (0.0%) |
Disability Class: Vision Difficulty
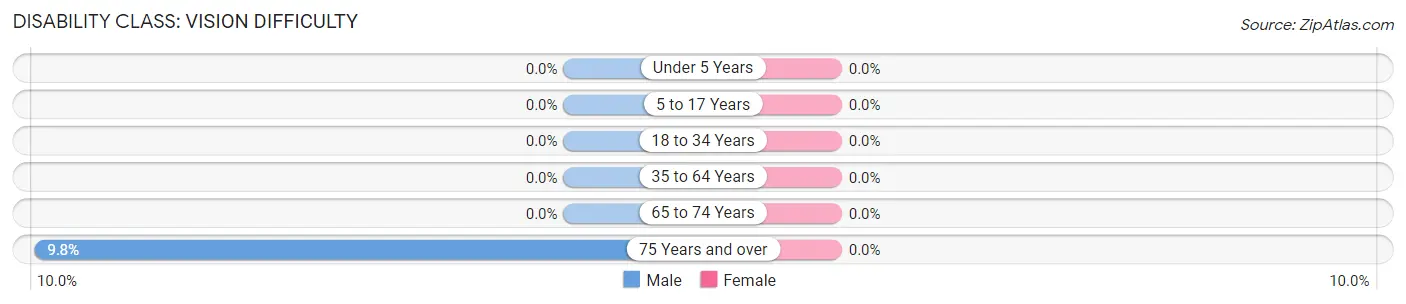
| Age Bracket | Male | Female |
| Under 5 Years | 0 (0.0%) | 0 (0.0%) |
| 5 to 17 Years | 0 (0.0%) | 0 (0.0%) |
| 18 to 34 Years | 0 (0.0%) | 0 (0.0%) |
| 35 to 64 Years | 0 (0.0%) | 0 (0.0%) |
| 65 to 74 Years | 0 (0.0%) | 0 (0.0%) |
| 75 Years and over | 16 (9.8%) | 0 (0.0%) |
Disability Class: Cognitive Difficulty
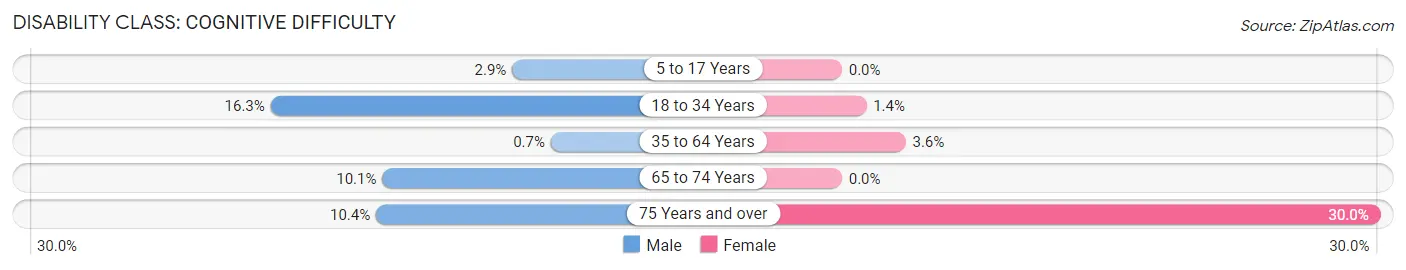
| Age Bracket | Male | Female |
| 5 to 17 Years | 27 (2.9%) | 0 (0.0%) |
| 18 to 34 Years | 104 (16.3%) | 10 (1.4%) |
| 35 to 64 Years | 9 (0.7%) | 53 (3.5%) |
| 65 to 74 Years | 49 (10.1%) | 0 (0.0%) |
| 75 Years and over | 17 (10.4%) | 33 (30.0%) |
Disability Class: Ambulatory Difficulty
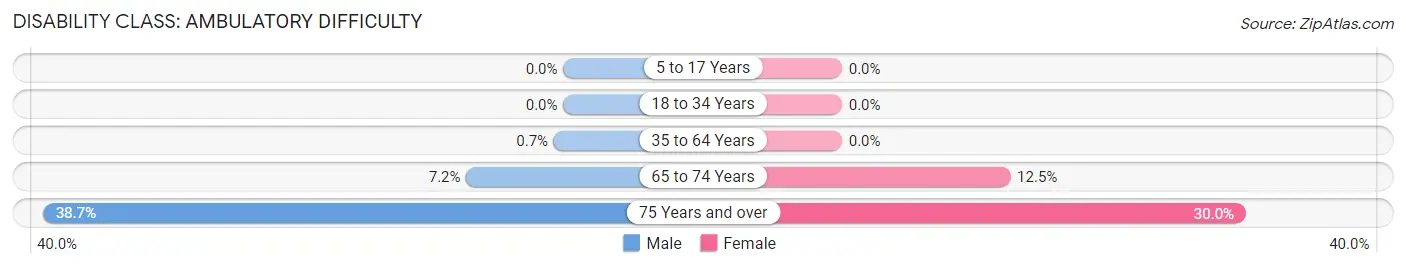
| Age Bracket | Male | Female |
| 5 to 17 Years | 0 (0.0%) | 0 (0.0%) |
| 18 to 34 Years | 0 (0.0%) | 0 (0.0%) |
| 35 to 64 Years | 9 (0.7%) | 0 (0.0%) |
| 65 to 74 Years | 35 (7.2%) | 50 (12.5%) |
| 75 Years and over | 63 (38.7%) | 33 (30.0%) |
Disability Class: Self-Care Difficulty

| Age Bracket | Male | Female |
| 5 to 17 Years | 12 (1.3%) | 0 (0.0%) |
| 18 to 34 Years | 0 (0.0%) | 0 (0.0%) |
| 35 to 64 Years | 9 (0.7%) | 0 (0.0%) |
| 65 to 74 Years | 0 (0.0%) | 26 (6.5%) |
| 75 Years and over | 30 (18.4%) | 33 (30.0%) |
Technology Access in Union
Computing Device Access in Union
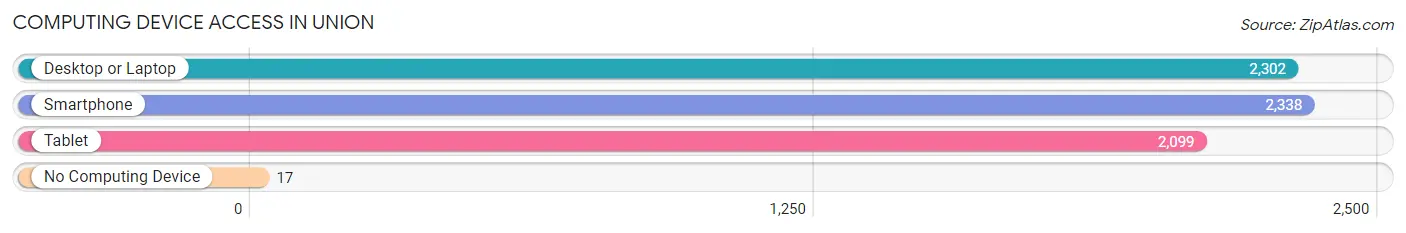
| Device Type | # Households | % Households |
| Desktop or Laptop | 2,302 | 95.4% |
| Smartphone | 2,338 | 96.9% |
| Tablet | 2,099 | 87.0% |
| No Computing Device | 17 | 0.7% |
| Total | 2,414 | 100.0% |
Internet Access in Union
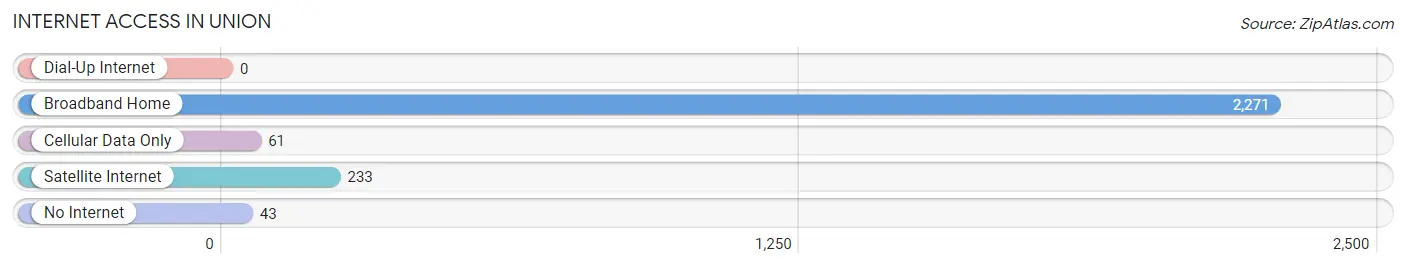
| Internet Type | # Households | % Households |
| Dial-Up Internet | 0 | 0.0% |
| Broadband Home | 2,271 | 94.1% |
| Cellular Data Only | 61 | 2.5% |
| Satellite Internet | 233 | 9.7% |
| No Internet | 43 | 1.8% |
| Total | 2,414 | 100.0% |
Union Summary
Union, Kentucky is a small city located in the northern part of the state, in Boone County. It is situated on the banks of the Ohio River, and is part of the Cincinnati metropolitan area. The city has a population of approximately 8,000 people, and is the county seat of Boone County.
History
Union, Kentucky was founded in 1810 by a group of settlers from Uniontown, Pennsylvania. The city was named after the Uniontown settlers, and was originally known as Uniontown. The city was incorporated in 1817, and was the first city in Boone County.
In the early 19th century, Union was a thriving river port, and was a major stop on the Ohio and Mississippi Railroad. The city was also a major center for the production of tobacco, and was home to several tobacco warehouses.
In the late 19th century, Union was a major center for the production of coal and iron. The city was home to several coal mines, and was a major supplier of coal to the steel industry.
Geography
Union is located in the northern part of Boone County, in the Cincinnati metropolitan area. The city is situated on the banks of the Ohio River, and is bordered by the cities of Florence, Walton, and Verona. The city has a total area of 4.2 square miles, and has an elevation of 590 feet.
Economy
Union’s economy is largely based on manufacturing and retail. The city is home to several manufacturing companies, including a steel mill, a paper mill, and a plastics plant. The city is also home to several retail stores, including a Walmart Supercenter, a Kroger grocery store, and a Home Depot.
Demographics
As of the 2010 census, Union had a population of 8,000 people. The racial makeup of the city was 94.3% White, 2.2% African American, 0.7% Native American, 0.7% Asian, 0.2% Pacific Islander, and 1.9% from other races. The median household income was $41,000, and the median family income was $50,000.
Conclusion
Union, Kentucky is a small city located in the northern part of the state, in Boone County. It is situated on the banks of the Ohio River, and is part of the Cincinnati metropolitan area. The city has a population of approximately 8,000 people, and is the county seat of Boone County. Union’s economy is largely based on manufacturing and retail, and the city is home to several manufacturing companies and retail stores. The racial makeup of the city is 94.3% White, 2.2% African American, 0.7% Native American, 0.7% Asian, 0.2% Pacific Islander, and 1.9% from other races. The median household income was $41,000, and the median family income was $50,000.
Common Questions
What is Per Capita Income in Union?
Per Capita income in Union is $48,165.
What is the Median Family Income in Union?
Median Family Income in Union is $134,770.
What is the Median Household income in Union?
Median Household Income in Union is $131,047.
What is Income or Wage Gap in Union?
Income or Wage Gap in Union is 53.5%.
Women in Union earn 46.5 cents for every dollar earned by a man.
What is Inequality or Gini Index in Union?
Inequality or Gini Index in Union is 0.29.
What is the Total Population of Union?
Total Population of Union is 7,369.
What is the Total Male Population of Union?
Total Male Population of Union is 3,797.
What is the Total Female Population of Union?
Total Female Population of Union is 3,572.
What is the Ratio of Males per 100 Females in Union?
There are 106.30 Males per 100 Females in Union.
What is the Ratio of Females per 100 Males in Union?
There are 94.07 Females per 100 Males in Union.
What is the Median Population Age in Union?
Median Population Age in Union is 36.7 Years.
What is the Average Family Size in Union
Average Family Size in Union is 3.2 People.
What is the Average Household Size in Union
Average Household Size in Union is 3.0 People.
How Large is the Labor Force in Union?
There are 4,001 People in the Labor Forcein in Union.
What is the Percentage of People in the Labor Force in Union?
71.6% of People are in the Labor Force in Union.
What is the Unemployment Rate in Union?
Unemployment Rate in Union is 0.8%.