Old Brownsboro Place, KY Map & Demographics
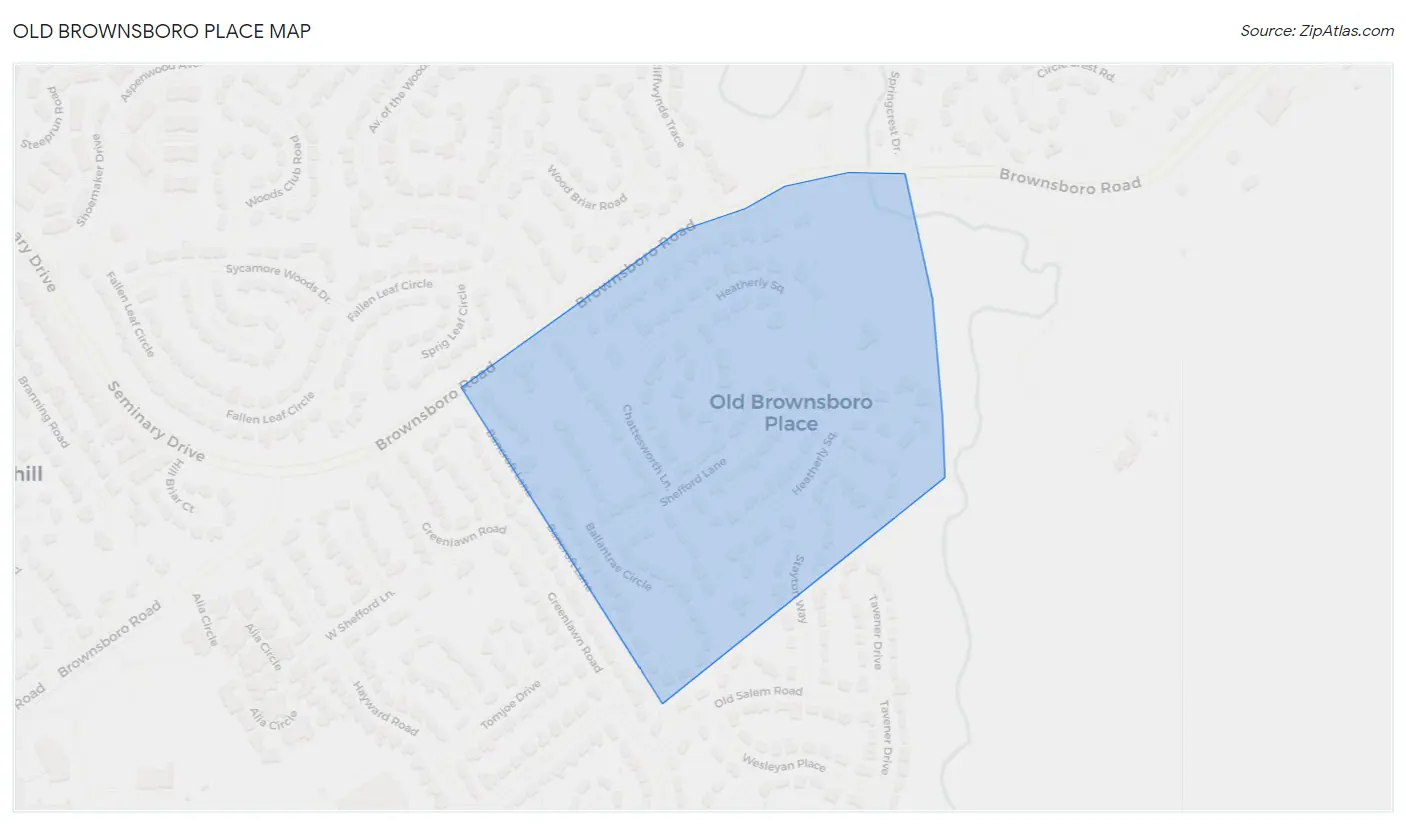
Old Brownsboro Place Map
Old Brownsboro Place Overview
$63,794
PER CAPITA INCOME
$146,500
AVG FAMILY INCOME
$145,750
AVG HOUSEHOLD INCOME
45.1%
WAGE / INCOME GAP [ % ]
54.9¢/ $1
WAGE / INCOME GAP [ $ ]
0.36
INEQUALITY / GINI INDEX
384
TOTAL POPULATION
180
MALE POPULATION
204
FEMALE POPULATION
88.24
MALES / 100 FEMALES
113.33
FEMALES / 100 MALES
55.8
MEDIAN AGE
2.6
AVG FAMILY SIZE
2.4
AVG HOUSEHOLD SIZE
177
LABOR FORCE [ PEOPLE ]
53.3%
PERCENT IN LABOR FORCE
2.3%
UNEMPLOYMENT RATE
Old Brownsboro Place Area Codes
Income in Old Brownsboro Place
Income Overview in Old Brownsboro Place
Per Capita Income in Old Brownsboro Place is $63,794, while median incomes of families and households are $146,500 and $145,750 respectively.
| Characteristic | Number | Measure |
| Per Capita Income | 384 | $63,794 |
| Median Family Income | 138 | $146,500 |
| Mean Family Income | 138 | $160,762 |
| Median Household Income | 158 | $145,750 |
| Mean Household Income | 158 | $154,942 |
| Income Deficit | 138 | $0 |
| Wage / Income Gap (%) | 384 | 45.13% |
| Wage / Income Gap ($) | 384 | 54.87¢ per $1 |
| Gini / Inequality Index | 384 | 0.36 |
Earnings by Sex in Old Brownsboro Place
Average Earnings in Old Brownsboro Place are $65,500, $100,625 for men and $55,208 for women, a difference of 45.1%.
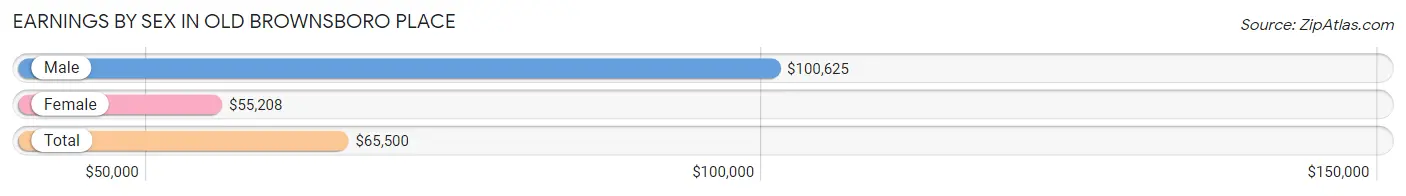
| Sex | Number | Average Earnings |
| Male | 109 (56.8%) | $100,625 |
| Female | 83 (43.2%) | $55,208 |
| Total | 192 (100.0%) | $65,500 |
Earnings by Sex by Income Bracket in Old Brownsboro Place
The most common earnings brackets in Old Brownsboro Place are $100,000+ for men (55 | 50.5%) and $55,000 to $64,999 for women (17 | 20.5%).
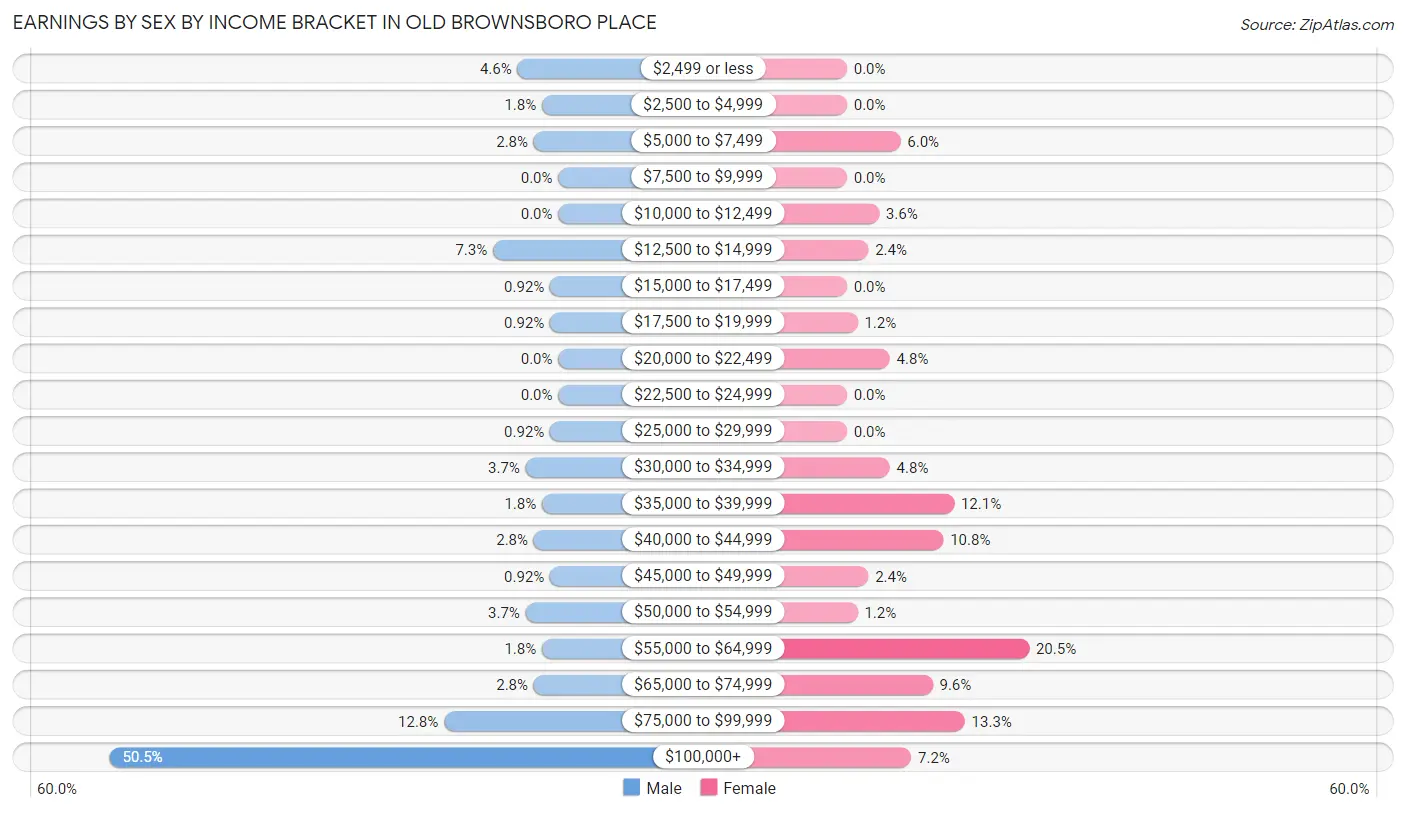
| Income | Male | Female |
| $2,499 or less | 5 (4.6%) | 0 (0.0%) |
| $2,500 to $4,999 | 2 (1.8%) | 0 (0.0%) |
| $5,000 to $7,499 | 3 (2.8%) | 5 (6.0%) |
| $7,500 to $9,999 | 0 (0.0%) | 0 (0.0%) |
| $10,000 to $12,499 | 0 (0.0%) | 3 (3.6%) |
| $12,500 to $14,999 | 8 (7.3%) | 2 (2.4%) |
| $15,000 to $17,499 | 1 (0.9%) | 0 (0.0%) |
| $17,500 to $19,999 | 1 (0.9%) | 1 (1.2%) |
| $20,000 to $22,499 | 0 (0.0%) | 4 (4.8%) |
| $22,500 to $24,999 | 0 (0.0%) | 0 (0.0%) |
| $25,000 to $29,999 | 1 (0.9%) | 0 (0.0%) |
| $30,000 to $34,999 | 4 (3.7%) | 4 (4.8%) |
| $35,000 to $39,999 | 2 (1.8%) | 10 (12.0%) |
| $40,000 to $44,999 | 3 (2.8%) | 9 (10.8%) |
| $45,000 to $49,999 | 1 (0.9%) | 2 (2.4%) |
| $50,000 to $54,999 | 4 (3.7%) | 1 (1.2%) |
| $55,000 to $64,999 | 2 (1.8%) | 17 (20.5%) |
| $65,000 to $74,999 | 3 (2.8%) | 8 (9.6%) |
| $75,000 to $99,999 | 14 (12.8%) | 11 (13.3%) |
| $100,000+ | 55 (50.5%) | 6 (7.2%) |
| Total | 109 (100.0%) | 83 (100.0%) |
Earnings by Sex by Educational Attainment in Old Brownsboro Place
Average earnings in Old Brownsboro Place are $108,750 for men and $56,042 for women, a difference of 48.5%. Men with an educational attainment of graduate degree enjoy the highest average annual earnings of $148,125, while those with college or associate's degree education earn the least with $92,188. Women with an educational attainment of graduate degree earn the most with the average annual earnings of $57,813, while those with bachelor's degree education have the smallest earnings of $55,000.
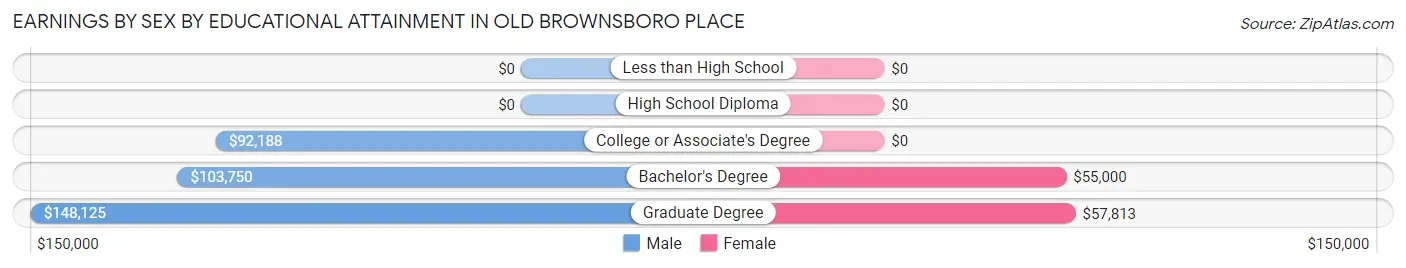
| Educational Attainment | Male Income | Female Income |
| Less than High School | - | - |
| High School Diploma | - | - |
| College or Associate's Degree | $92,188 | $0 |
| Bachelor's Degree | $103,750 | $55,000 |
| Graduate Degree | $148,125 | $57,813 |
| Total | $108,750 | $56,042 |
Family Income in Old Brownsboro Place
Family Income Brackets in Old Brownsboro Place
According to the Old Brownsboro Place family income data, there are 36 families falling into the $200,000+ income range, which is the most common income bracket and makes up 26.1% of all families.
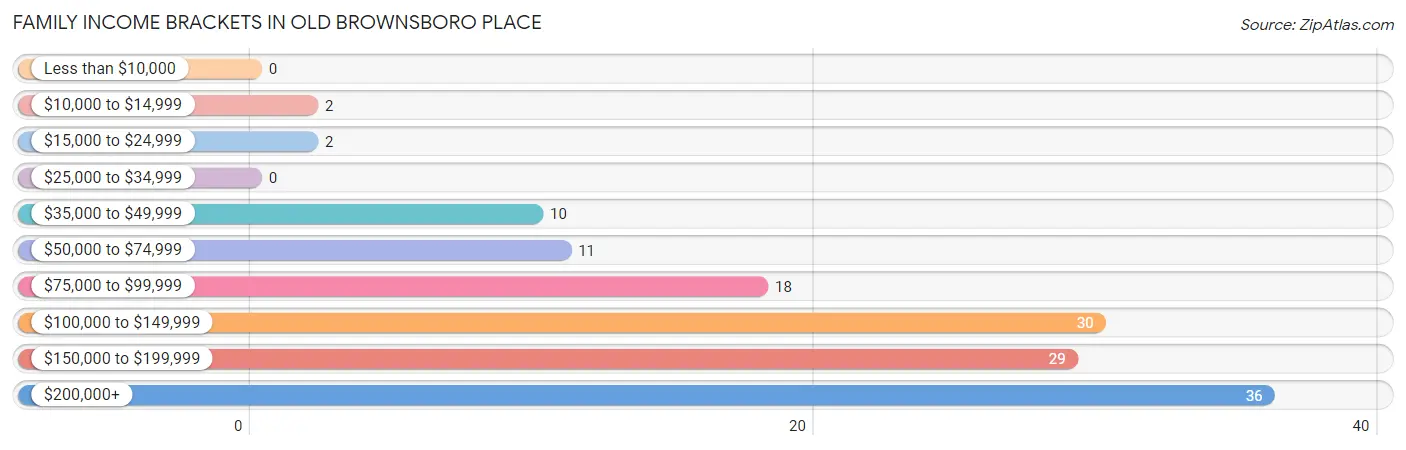
| Income Bracket | # Families | % Families |
| Less than $10,000 | 0 | 0.0% |
| $10,000 to $14,999 | 2 | 1.4% |
| $15,000 to $24,999 | 2 | 1.4% |
| $25,000 to $34,999 | 0 | 0.0% |
| $35,000 to $49,999 | 10 | 7.2% |
| $50,000 to $74,999 | 11 | 8.0% |
| $75,000 to $99,999 | 18 | 13.0% |
| $100,000 to $149,999 | 30 | 21.7% |
| $150,000 to $199,999 | 29 | 21.0% |
| $200,000+ | 36 | 26.1% |
Family Income by Famaliy Size in Old Brownsboro Place
5-person families (9 | 6.5%) account for the highest median family income in Old Brownsboro Place with $193,750 per family, while 2-person families (91 | 65.9%) have the highest median income of $72,562 per family member.
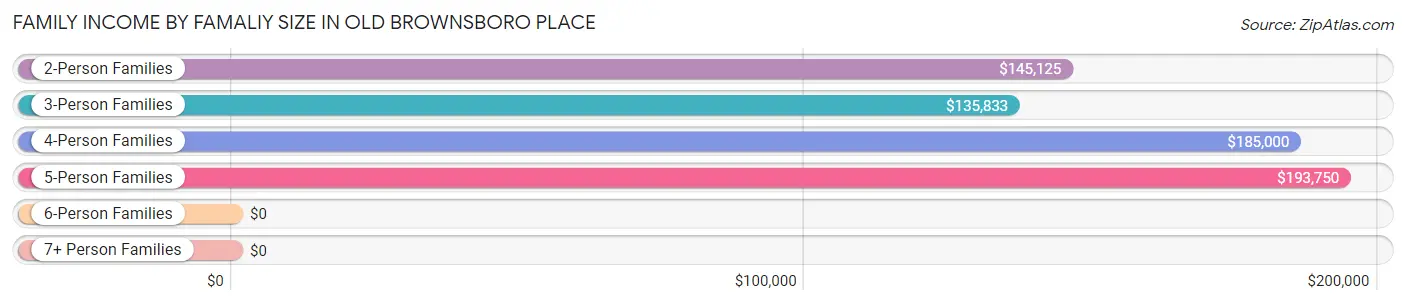
| Income Bracket | # Families | Median Income |
| 2-Person Families | 91 (65.9%) | $145,125 |
| 3-Person Families | 26 (18.8%) | $135,833 |
| 4-Person Families | 12 (8.7%) | $185,000 |
| 5-Person Families | 9 (6.5%) | $193,750 |
| 6-Person Families | 0 (0.0%) | $0 |
| 7+ Person Families | 0 (0.0%) | $0 |
| Total | 138 (100.0%) | $146,500 |
Family Income by Number of Earners in Old Brownsboro Place
The median family income in Old Brownsboro Place is $146,500, with families comprising 3+ earners (10) having the highest median family income of $176,250, while families with no earners (40) have the lowest median family income of $78,409, accounting for 7.2% and 29.0% of families, respectively.
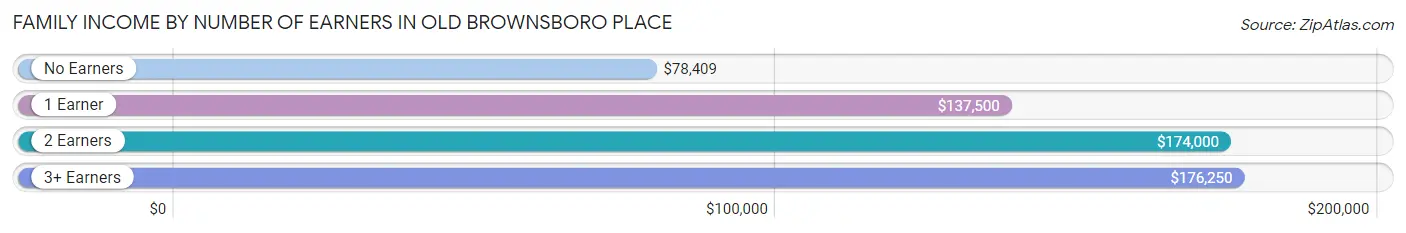
| Number of Earners | # Families | Median Income |
| No Earners | 40 (29.0%) | $78,409 |
| 1 Earner | 28 (20.3%) | $137,500 |
| 2 Earners | 60 (43.5%) | $174,000 |
| 3+ Earners | 10 (7.2%) | $176,250 |
| Total | 138 (100.0%) | $146,500 |
Household Income in Old Brownsboro Place
Household Income Brackets in Old Brownsboro Place
With 41 households falling in the category, the $200,000+ income range is the most frequent in Old Brownsboro Place, accounting for 26.0% of all households. In contrast, only 2 households (1.3%) fall into the less than $10,000 income bracket, making it the least populous group.
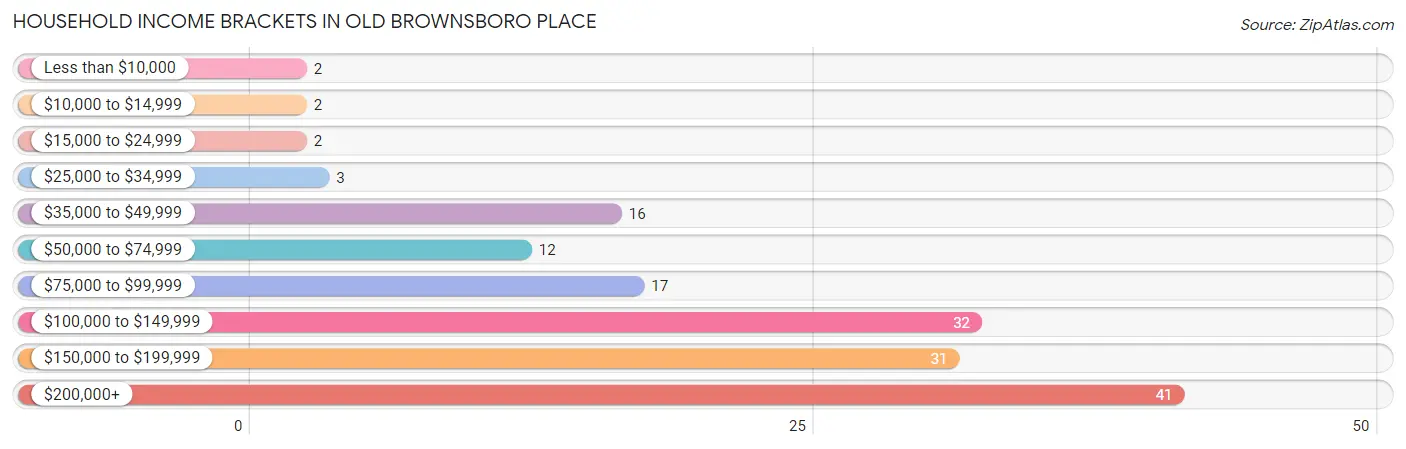
| Income Bracket | # Households | % Households |
| Less than $10,000 | 2 | 1.3% |
| $10,000 to $14,999 | 2 | 1.3% |
| $15,000 to $24,999 | 2 | 1.3% |
| $25,000 to $34,999 | 3 | 1.9% |
| $35,000 to $49,999 | 16 | 10.1% |
| $50,000 to $74,999 | 12 | 7.6% |
| $75,000 to $99,999 | 17 | 10.8% |
| $100,000 to $149,999 | 32 | 20.3% |
| $150,000 to $199,999 | 31 | 19.6% |
| $200,000+ | 41 | 25.9% |
Household Income by Householder Age in Old Brownsboro Place
The median household income in Old Brownsboro Place is $145,750, with the highest median household income of $182,188 found in the 25 to 44 years age bracket for the primary householder. A total of 25 households (15.8%) fall into this category.
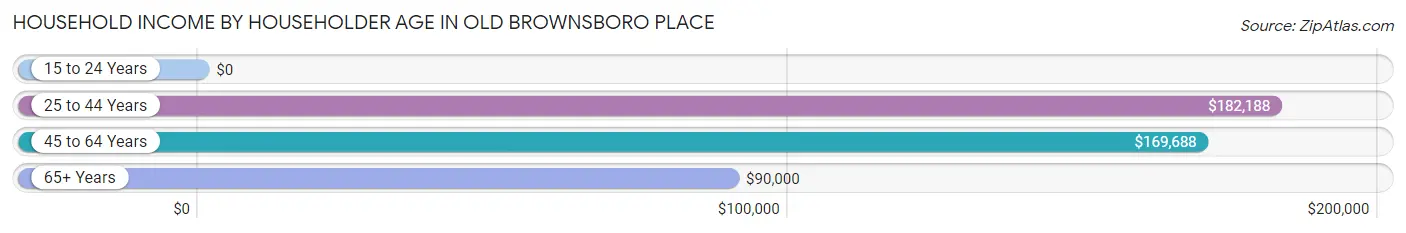
| Income Bracket | # Households | Median Income |
| 15 to 24 Years | 0 (0.0%) | $0 |
| 25 to 44 Years | 25 (15.8%) | $182,188 |
| 45 to 64 Years | 51 (32.3%) | $169,688 |
| 65+ Years | 82 (51.9%) | $90,000 |
| Total | 158 (100.0%) | $145,750 |
Poverty in Old Brownsboro Place
Income Below Poverty by Sex and Age in Old Brownsboro Place
With 1.7% poverty level for males and 3.9% for females among the residents of Old Brownsboro Place, 18 to 24 year old males and 75 year old and over females are the most vulnerable to poverty, with 1 males (16.7%) and 6 females (16.2%) in their respective age groups living below the poverty level.
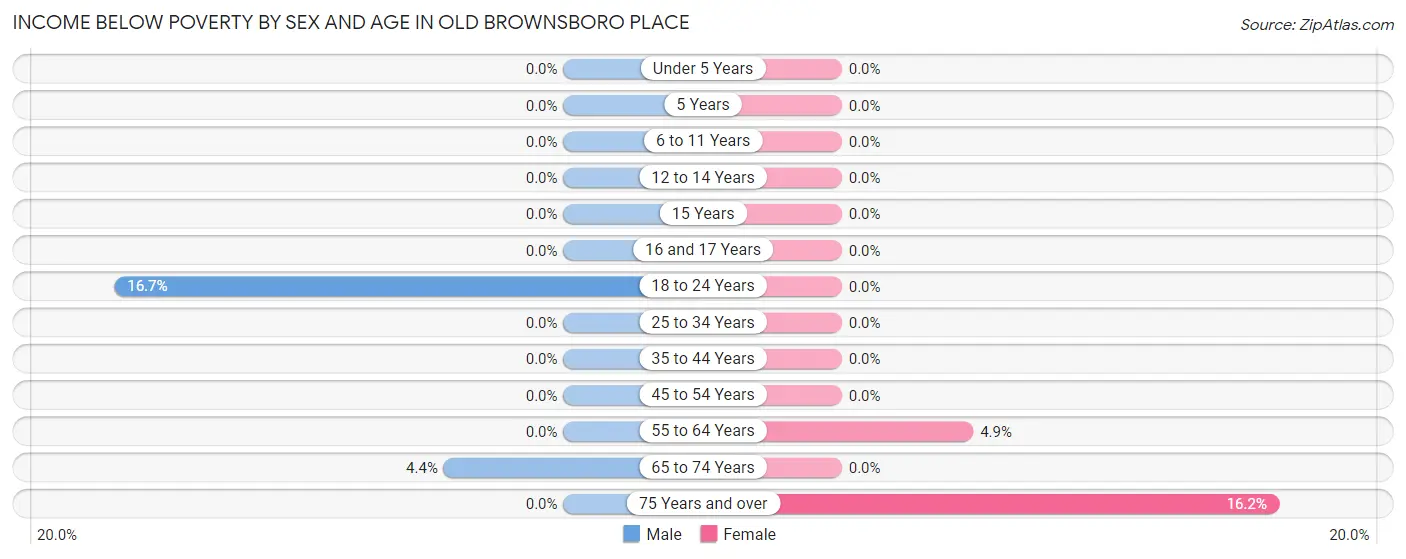
| Age Bracket | Male | Female |
| Under 5 Years | 0 (0.0%) | 0 (0.0%) |
| 5 Years | 0 (0.0%) | 0 (0.0%) |
| 6 to 11 Years | 0 (0.0%) | 0 (0.0%) |
| 12 to 14 Years | 0 (0.0%) | 0 (0.0%) |
| 15 Years | 0 (0.0%) | 0 (0.0%) |
| 16 and 17 Years | 0 (0.0%) | 0 (0.0%) |
| 18 to 24 Years | 1 (16.7%) | 0 (0.0%) |
| 25 to 34 Years | 0 (0.0%) | 0 (0.0%) |
| 35 to 44 Years | 0 (0.0%) | 0 (0.0%) |
| 45 to 54 Years | 0 (0.0%) | 0 (0.0%) |
| 55 to 64 Years | 0 (0.0%) | 2 (4.9%) |
| 65 to 74 Years | 2 (4.4%) | 0 (0.0%) |
| 75 Years and over | 0 (0.0%) | 6 (16.2%) |
| Total | 3 (1.7%) | 8 (3.9%) |
Income Above Poverty by Sex and Age in Old Brownsboro Place
According to the poverty statistics in Old Brownsboro Place, males aged under 5 years and females aged under 5 years are the age groups that are most secure financially, with 100.0% of males and 100.0% of females in these age groups living above the poverty line.
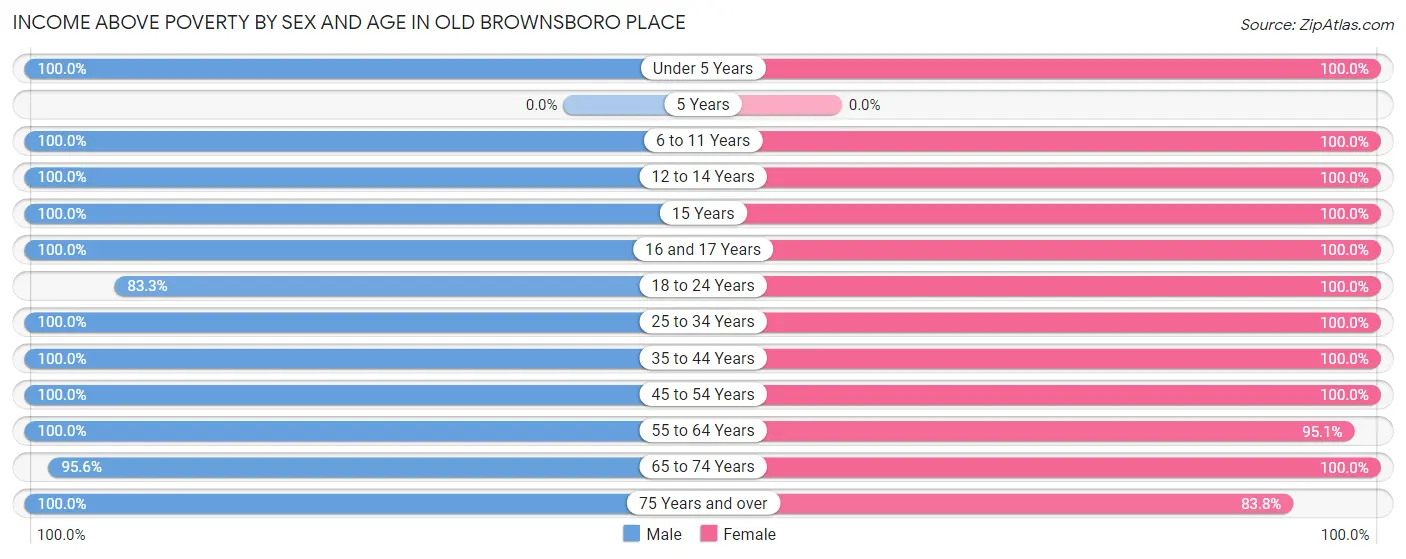
| Age Bracket | Male | Female |
| Under 5 Years | 10 (100.0%) | 5 (100.0%) |
| 5 Years | 0 (0.0%) | 0 (0.0%) |
| 6 to 11 Years | 12 (100.0%) | 6 (100.0%) |
| 12 to 14 Years | 3 (100.0%) | 7 (100.0%) |
| 15 Years | 7 (100.0%) | 2 (100.0%) |
| 16 and 17 Years | 4 (100.0%) | 4 (100.0%) |
| 18 to 24 Years | 5 (83.3%) | 2 (100.0%) |
| 25 to 34 Years | 13 (100.0%) | 13 (100.0%) |
| 35 to 44 Years | 17 (100.0%) | 16 (100.0%) |
| 45 to 54 Years | 29 (100.0%) | 28 (100.0%) |
| 55 to 64 Years | 20 (100.0%) | 39 (95.1%) |
| 65 to 74 Years | 43 (95.6%) | 43 (100.0%) |
| 75 Years and over | 14 (100.0%) | 31 (83.8%) |
| Total | 177 (98.3%) | 196 (96.1%) |
Income Below Poverty Among Married-Couple Families in Old Brownsboro Place
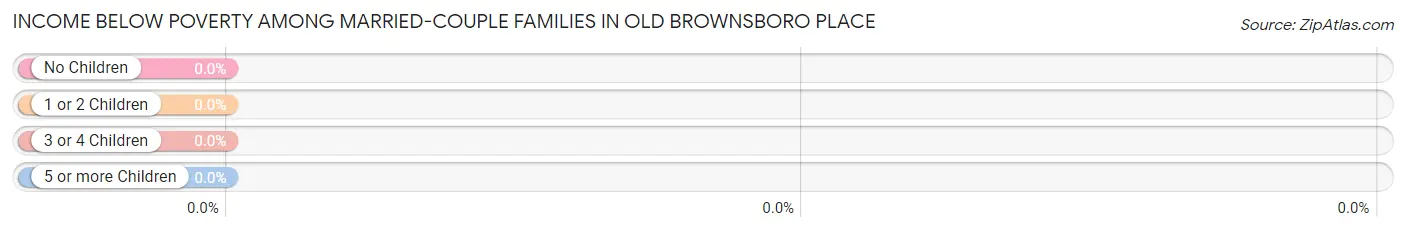
| Children | Above Poverty | Below Poverty |
| No Children | 92 (100.0%) | 0 (0.0%) |
| 1 or 2 Children | 22 (100.0%) | 0 (0.0%) |
| 3 or 4 Children | 7 (100.0%) | 0 (0.0%) |
| 5 or more Children | 0 (0.0%) | 0 (0.0%) |
| Total | 121 (100.0%) | 0 (0.0%) |
Income Below Poverty Among Single-Parent Households in Old Brownsboro Place
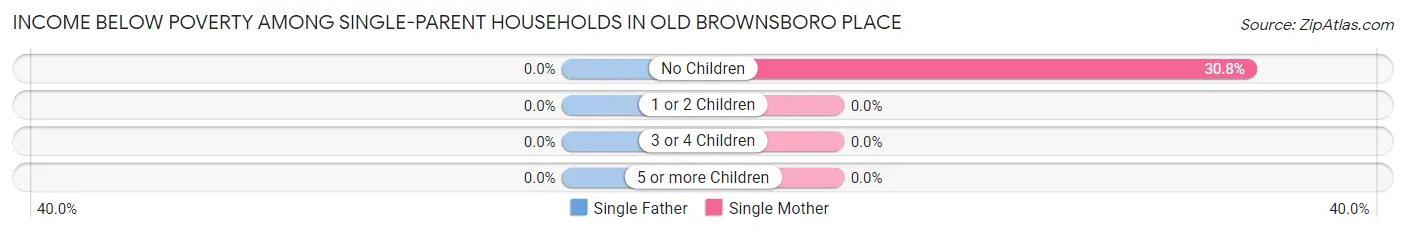
| Children | Single Father | Single Mother |
| No Children | 0 (0.0%) | 4 (30.8%) |
| 1 or 2 Children | 0 (0.0%) | 0 (0.0%) |
| 3 or 4 Children | 0 (0.0%) | 0 (0.0%) |
| 5 or more Children | 0 (0.0%) | 0 (0.0%) |
| Total | 0 (0.0%) | 4 (30.8%) |
Income Below Poverty Among Married-Couple vs Single-Parent Households in Old Brownsboro Place
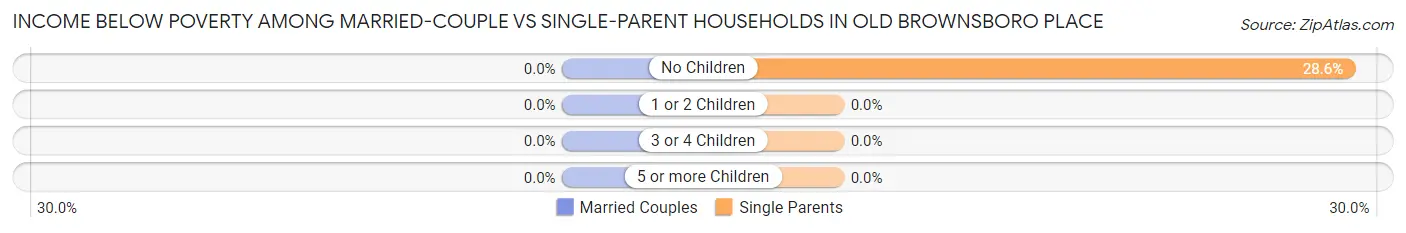
| Children | Married-Couple Families | Single-Parent Households |
| No Children | 0 (0.0%) | 4 (28.6%) |
| 1 or 2 Children | 0 (0.0%) | 0 (0.0%) |
| 3 or 4 Children | 0 (0.0%) | 0 (0.0%) |
| 5 or more Children | 0 (0.0%) | 0 (0.0%) |
| Total | 0 (0.0%) | 4 (23.5%) |
Race in Old Brownsboro Place
The most populous races in Old Brownsboro Place are White / Caucasian (363 | 94.5%), Asian (13 | 3.4%), and Black / African American (5 | 1.3%).
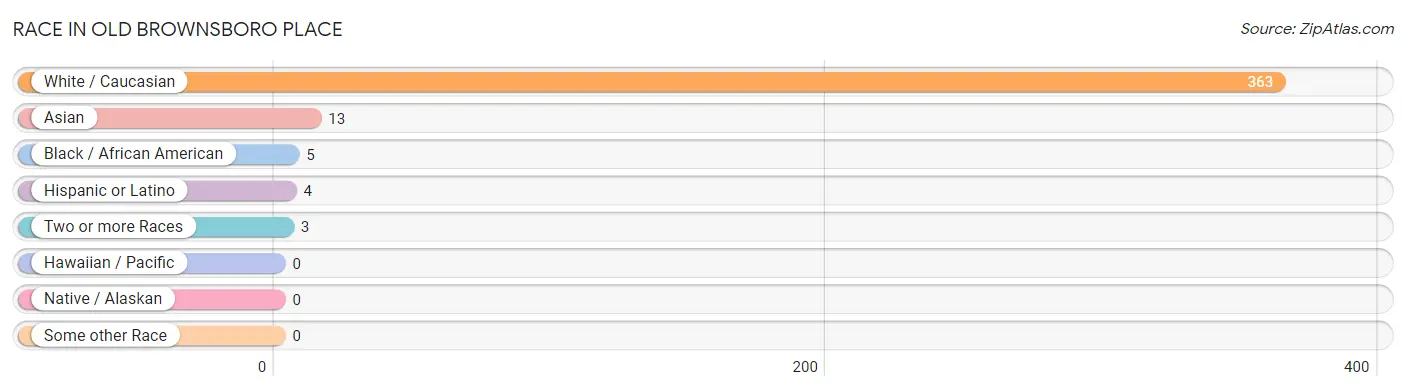
| Race | # Population | % Population |
| Asian | 13 | 3.4% |
| Black / African American | 5 | 1.3% |
| Hawaiian / Pacific | 0 | 0.0% |
| Hispanic or Latino | 4 | 1.0% |
| Native / Alaskan | 0 | 0.0% |
| White / Caucasian | 363 | 94.5% |
| Two or more Races | 3 | 0.8% |
| Some other Race | 0 | 0.0% |
| Total | 384 | 100.0% |
Ancestry in Old Brownsboro Place
The most populous ancestries reported in Old Brownsboro Place are German (99 | 25.8%), Irish (72 | 18.8%), English (63 | 16.4%), American (39 | 10.2%), and Polish (28 | 7.3%), together accounting for 78.4% of all Old Brownsboro Place residents.
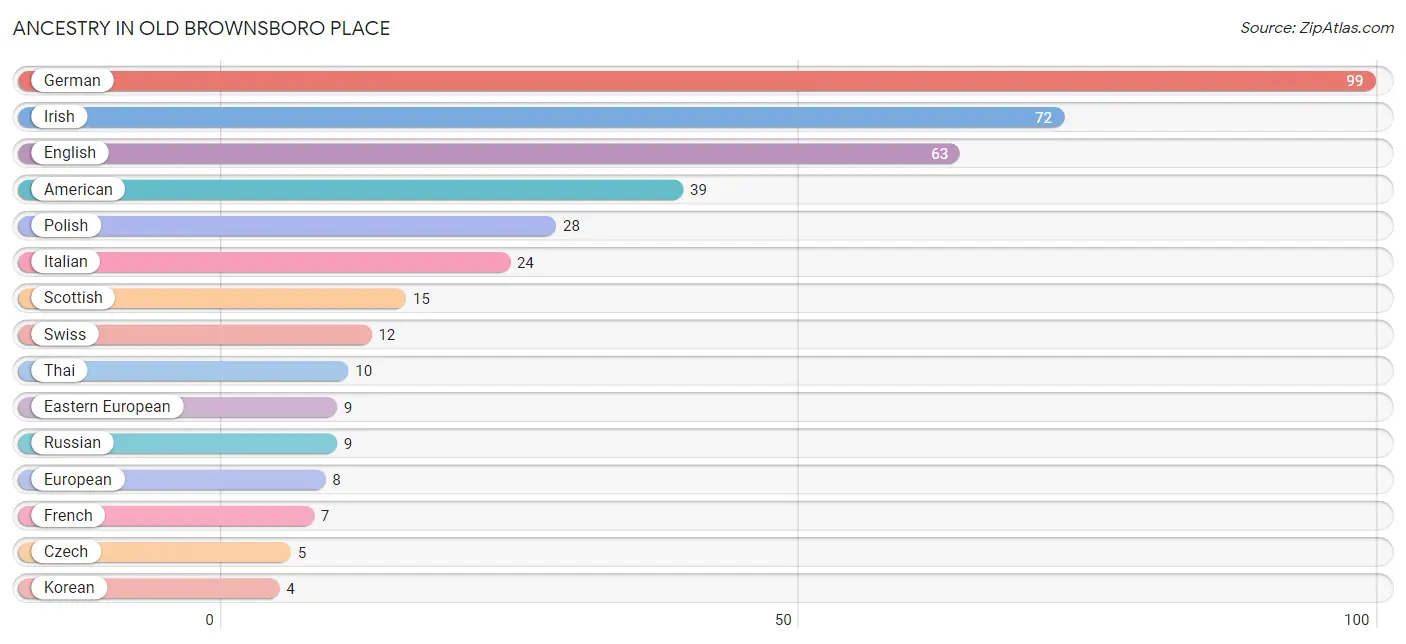
| Ancestry | # Population | % Population |
| American | 39 | 10.2% |
| British | 3 | 0.8% |
| Canadian | 2 | 0.5% |
| Cuban | 1 | 0.3% |
| Czech | 5 | 1.3% |
| Dutch | 2 | 0.5% |
| Eastern European | 9 | 2.3% |
| English | 63 | 16.4% |
| European | 8 | 2.1% |
| Finnish | 2 | 0.5% |
| French | 7 | 1.8% |
| French Canadian | 2 | 0.5% |
| German | 99 | 25.8% |
| Greek | 1 | 0.3% |
| Hungarian | 3 | 0.8% |
| Irish | 72 | 18.8% |
| Italian | 24 | 6.2% |
| Korean | 4 | 1.0% |
| Lithuanian | 3 | 0.8% |
| Luxembourger | 1 | 0.3% |
| Norwegian | 4 | 1.0% |
| Polish | 28 | 7.3% |
| Russian | 9 | 2.3% |
| Scandinavian | 3 | 0.8% |
| Scotch-Irish | 3 | 0.8% |
| Scottish | 15 | 3.9% |
| South American | 2 | 0.5% |
| Spaniard | 1 | 0.3% |
| Swedish | 1 | 0.3% |
| Swiss | 12 | 3.1% |
| Thai | 10 | 2.6% |
| Ukrainian | 3 | 0.8% |
| Welsh | 2 | 0.5% | View All 33 Rows |
Immigrants in Old Brownsboro Place
The most numerous immigrant groups reported in Old Brownsboro Place came from Asia (11 | 2.9%), Eastern Europe (7 | 1.8%), Europe (7 | 1.8%), China (5 | 1.3%), and Eastern Asia (5 | 1.3%), together accounting for 9.1% of all Old Brownsboro Place residents.
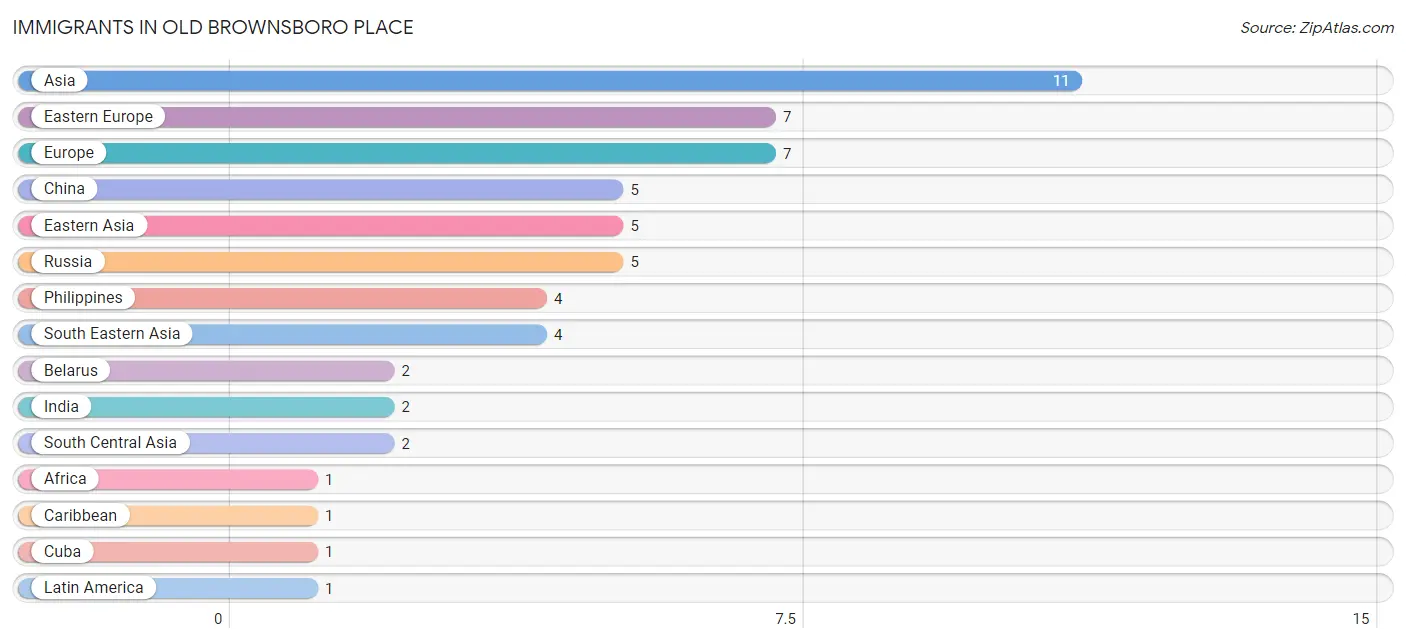
| Immigration Origin | # Population | % Population |
| Africa | 1 | 0.3% |
| Asia | 11 | 2.9% |
| Belarus | 2 | 0.5% |
| Caribbean | 1 | 0.3% |
| China | 5 | 1.3% |
| Cuba | 1 | 0.3% |
| Eastern Asia | 5 | 1.3% |
| Eastern Europe | 7 | 1.8% |
| Europe | 7 | 1.8% |
| India | 2 | 0.5% |
| Latin America | 1 | 0.3% |
| Northern Africa | 1 | 0.3% |
| Philippines | 4 | 1.0% |
| Russia | 5 | 1.3% |
| South Central Asia | 2 | 0.5% |
| South Eastern Asia | 4 | 1.0% | View All 16 Rows |
Sex and Age in Old Brownsboro Place
Sex and Age in Old Brownsboro Place
The most populous age groups in Old Brownsboro Place are 70 to 74 Years (34 | 18.9%) for men and 55 to 59 Years (30 | 14.7%) for women.
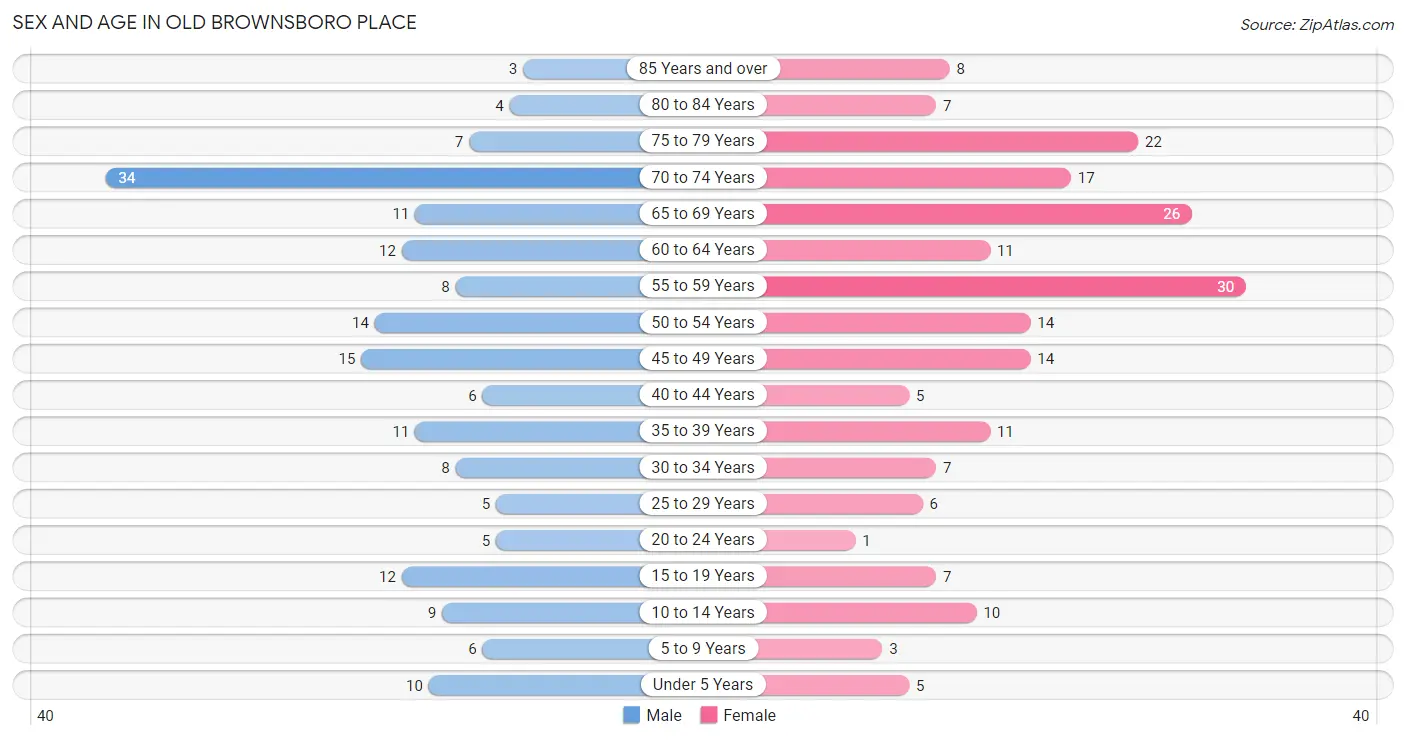
| Age Bracket | Male | Female |
| Under 5 Years | 10 (5.6%) | 5 (2.5%) |
| 5 to 9 Years | 6 (3.3%) | 3 (1.5%) |
| 10 to 14 Years | 9 (5.0%) | 10 (4.9%) |
| 15 to 19 Years | 12 (6.7%) | 7 (3.4%) |
| 20 to 24 Years | 5 (2.8%) | 1 (0.5%) |
| 25 to 29 Years | 5 (2.8%) | 6 (2.9%) |
| 30 to 34 Years | 8 (4.4%) | 7 (3.4%) |
| 35 to 39 Years | 11 (6.1%) | 11 (5.4%) |
| 40 to 44 Years | 6 (3.3%) | 5 (2.5%) |
| 45 to 49 Years | 15 (8.3%) | 14 (6.9%) |
| 50 to 54 Years | 14 (7.8%) | 14 (6.9%) |
| 55 to 59 Years | 8 (4.4%) | 30 (14.7%) |
| 60 to 64 Years | 12 (6.7%) | 11 (5.4%) |
| 65 to 69 Years | 11 (6.1%) | 26 (12.8%) |
| 70 to 74 Years | 34 (18.9%) | 17 (8.3%) |
| 75 to 79 Years | 7 (3.9%) | 22 (10.8%) |
| 80 to 84 Years | 4 (2.2%) | 7 (3.4%) |
| 85 Years and over | 3 (1.7%) | 8 (3.9%) |
| Total | 180 (100.0%) | 204 (100.0%) |
Families and Households in Old Brownsboro Place
Median Family Size in Old Brownsboro Place
The median family size in Old Brownsboro Place is 2.57 persons per family, with single male/father families (4 | 2.9%) accounting for the largest median family size of 2.75 persons per family. On the other hand, single female/mother families (13 | 9.4%) represent the smallest median family size with 2.54 persons per family.
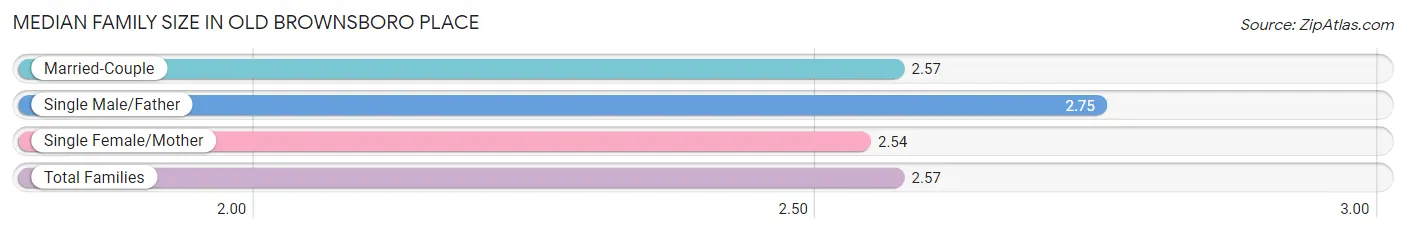
| Family Type | # Families | Family Size |
| Married-Couple | 121 (87.7%) | 2.57 |
| Single Male/Father | 4 (2.9%) | 2.75 |
| Single Female/Mother | 13 (9.4%) | 2.54 |
| Total Families | 138 (100.0%) | 2.57 |
Median Household Size in Old Brownsboro Place
The median household size in Old Brownsboro Place is 2.43 persons per household, with single male/father households (4 | 2.5%) accounting for the largest median household size of 3 persons per household. non-family households (20 | 12.7%) represent the smallest median household size with 1.25 persons per household.
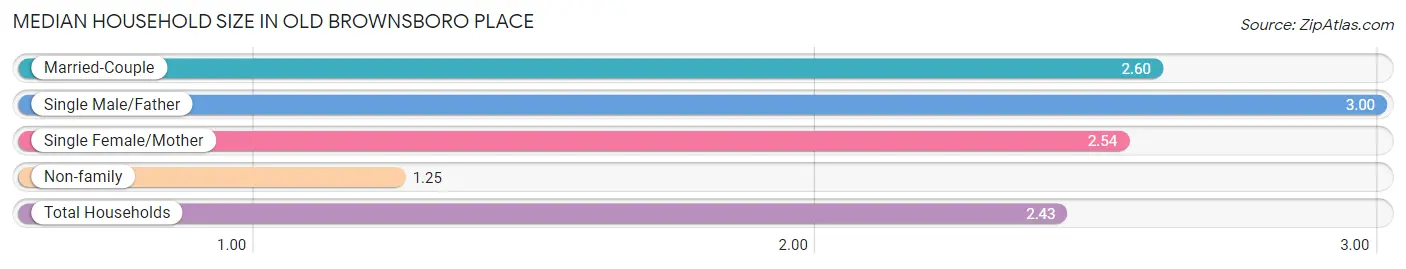
| Household Type | # Households | Household Size |
| Married-Couple | 121 (76.6%) | 2.60 |
| Single Male/Father | 4 (2.5%) | 3.00 |
| Single Female/Mother | 13 (8.2%) | 2.54 |
| Non-family | 20 (12.7%) | 1.25 |
| Total Households | 158 (100.0%) | 2.43 |
Household Size by Marriage Status in Old Brownsboro Place
Out of a total of 158 households in Old Brownsboro Place, 138 (87.3%) are family households, while 20 (12.7%) are nonfamily households. The most numerous type of family households are 2-person households, comprising 91, and the most common type of nonfamily households are 1-person households, comprising 16.
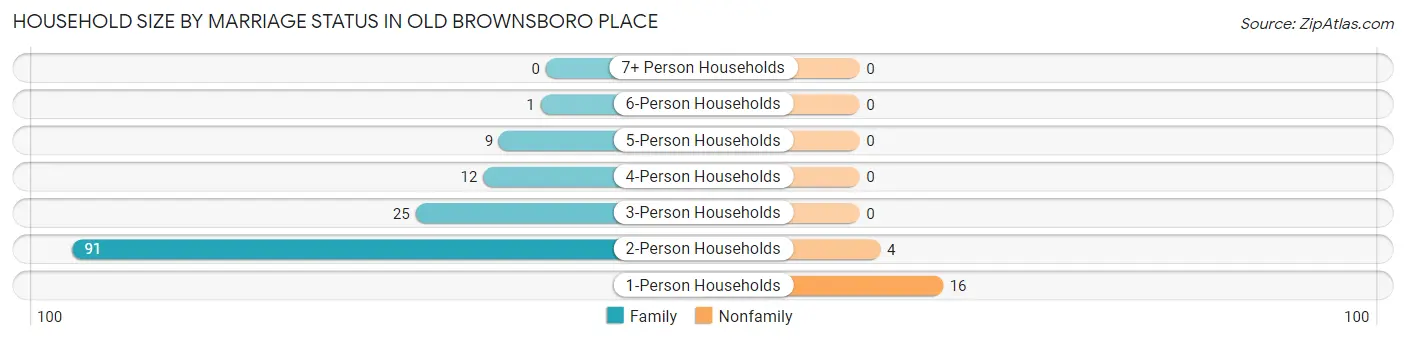
| Household Size | Family Households | Nonfamily Households |
| 1-Person Households | - | 16 (10.1%) |
| 2-Person Households | 91 (57.6%) | 4 (2.5%) |
| 3-Person Households | 25 (15.8%) | 0 (0.0%) |
| 4-Person Households | 12 (7.6%) | 0 (0.0%) |
| 5-Person Households | 9 (5.7%) | 0 (0.0%) |
| 6-Person Households | 1 (0.6%) | 0 (0.0%) |
| 7+ Person Households | 0 (0.0%) | 0 (0.0%) |
| Total | 138 (87.3%) | 20 (12.7%) |
Female Fertility in Old Brownsboro Place
Fertility by Age in Old Brownsboro Place
Average fertility rate in Old Brownsboro Place is 58.0 births per 1,000 women. Women in the age bracket of 20 to 34 years have the highest fertility rate with 214.0 births per 1,000 women. Women in the age bracket of 20 to 34 years acount for 100.0% of all women with births.
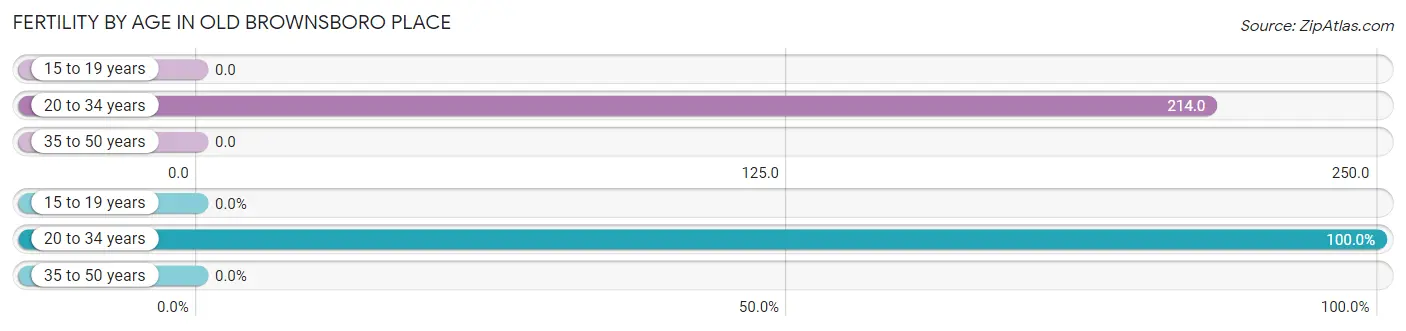
| Age Bracket | Women with Births | Births / 1,000 Women |
| 15 to 19 years | 0 (0.0%) | 0.0 |
| 20 to 34 years | 3 (100.0%) | 214.0 |
| 35 to 50 years | 0 (0.0%) | 0.0 |
| Total | 3 (100.0%) | 58.0 |
Fertility by Age by Marriage Status in Old Brownsboro Place
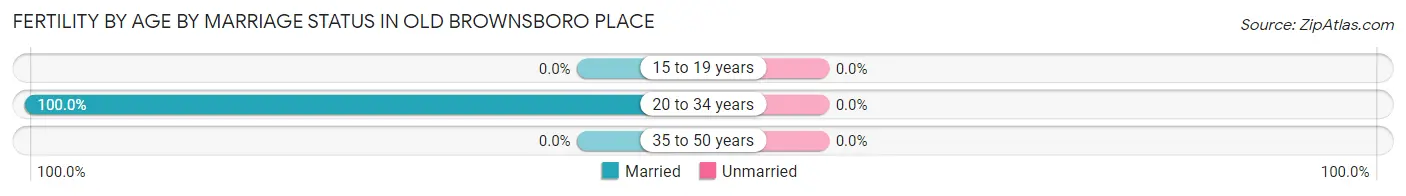
| Age Bracket | Married | Unmarried |
| 15 to 19 years | 0 (0.0%) | 0 (0.0%) |
| 20 to 34 years | 3 (100.0%) | 0 (0.0%) |
| 35 to 50 years | 0 (0.0%) | 0 (0.0%) |
| Total | 3 (100.0%) | 0 (0.0%) |
Fertility by Education in Old Brownsboro Place
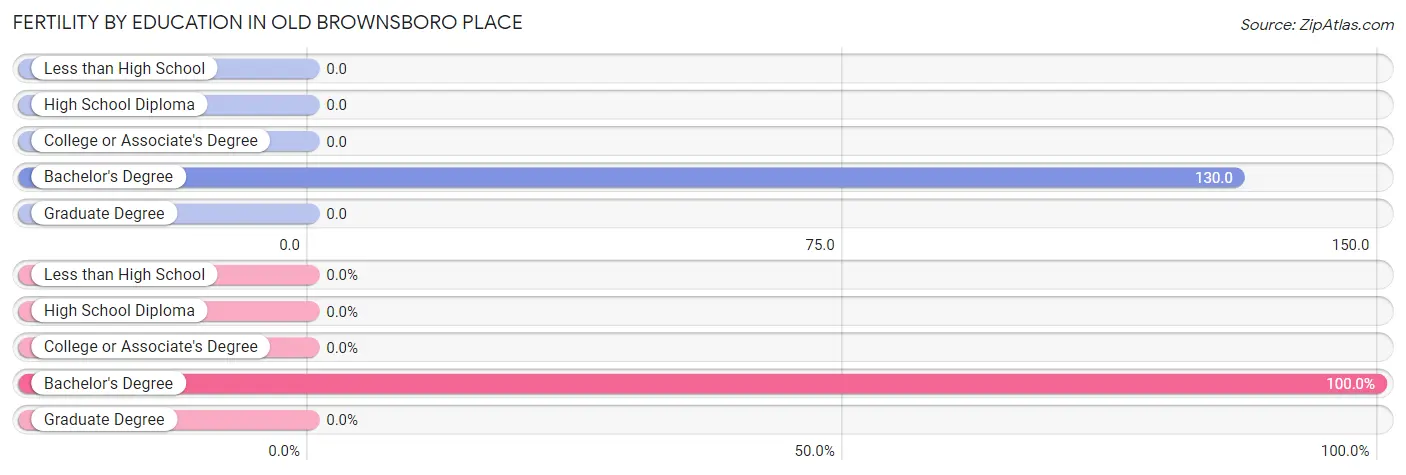
| Educational Attainment | Women with Births | Births / 1,000 Women |
| Less than High School | 0 (0.0%) | 0.0 |
| High School Diploma | 0 (0.0%) | 0.0 |
| College or Associate's Degree | 0 (0.0%) | 0.0 |
| Bachelor's Degree | 3 (100.0%) | 130.0 |
| Graduate Degree | 0 (0.0%) | 0.0 |
| Total | 3 (100.0%) | 58.0 |
Fertility by Education by Marriage Status in Old Brownsboro Place
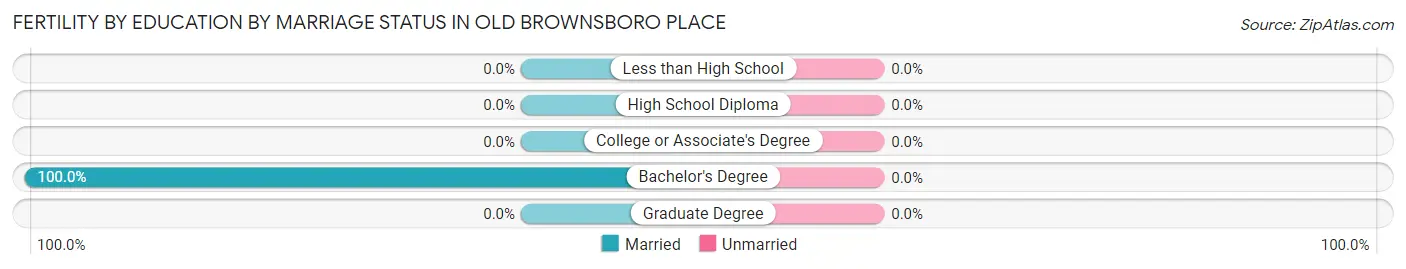
| Educational Attainment | Married | Unmarried |
| Less than High School | 0 (0.0%) | 0 (0.0%) |
| High School Diploma | 0 (0.0%) | 0 (0.0%) |
| College or Associate's Degree | 0 (0.0%) | 0 (0.0%) |
| Bachelor's Degree | 3 (100.0%) | 0 (0.0%) |
| Graduate Degree | 0 (0.0%) | 0 (0.0%) |
| Total | 3 (100.0%) | 0 (0.0%) |
Employment Characteristics in Old Brownsboro Place
Employment by Class of Employer in Old Brownsboro Place
Among the 167 employed individuals in Old Brownsboro Place, private company employees (99 | 59.3%), not-for-profit organizations (24 | 14.4%), and self-employed (not incorporated) (13 | 7.8%) make up the most common classes of employment.
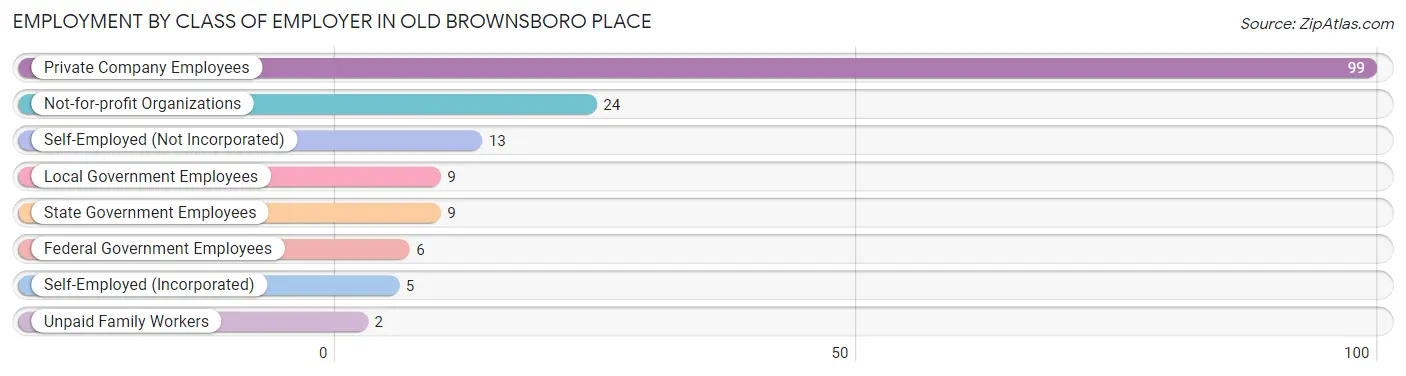
| Employer Class | # Employees | % Employees |
| Private Company Employees | 99 | 59.3% |
| Self-Employed (Incorporated) | 5 | 3.0% |
| Self-Employed (Not Incorporated) | 13 | 7.8% |
| Not-for-profit Organizations | 24 | 14.4% |
| Local Government Employees | 9 | 5.4% |
| State Government Employees | 9 | 5.4% |
| Federal Government Employees | 6 | 3.6% |
| Unpaid Family Workers | 2 | 1.2% |
| Total | 167 | 100.0% |
Employment Status by Age in Old Brownsboro Place
According to the labor force statistics for Old Brownsboro Place, out of the total population over 16 years of age (332), 53.3% or 177 individuals are in the labor force, with 2.3% or 4 of them unemployed. The age group with the highest labor force participation rate is 25 to 29 years, with 100.0% or 11 individuals in the labor force. Within the labor force, the 20 to 24 years age range has the highest percentage of unemployed individuals, with 33.3% or 1 of them being unemployed.
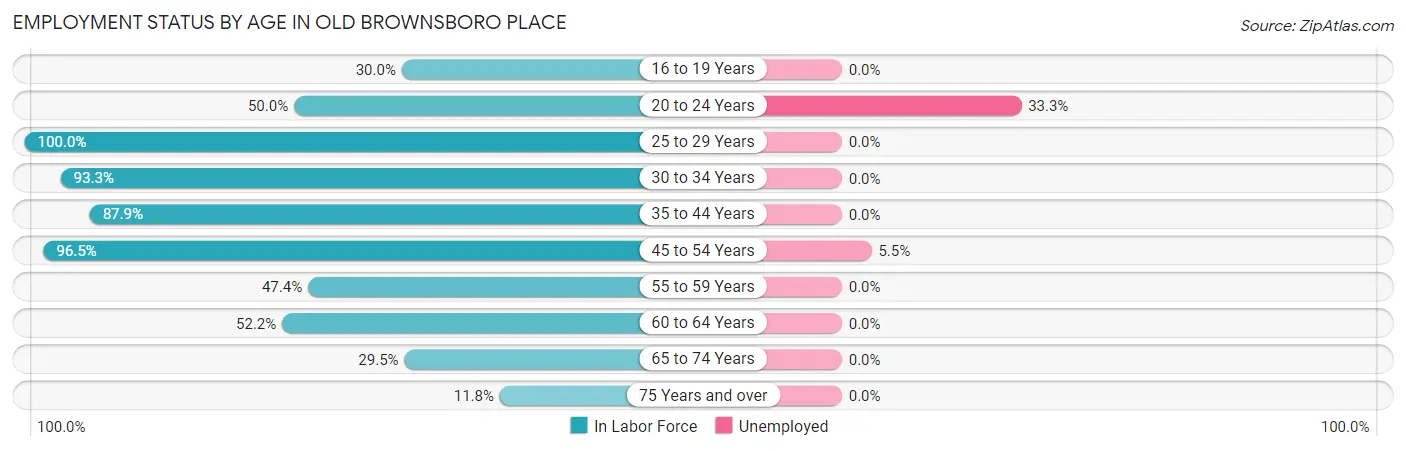
| Age Bracket | In Labor Force | Unemployed |
| 16 to 19 Years | 3 (30.0%) | 0 (0.0%) |
| 20 to 24 Years | 3 (50.0%) | 1 (33.3%) |
| 25 to 29 Years | 11 (100.0%) | 0 (0.0%) |
| 30 to 34 Years | 14 (93.3%) | 0 (0.0%) |
| 35 to 44 Years | 29 (87.9%) | 0 (0.0%) |
| 45 to 54 Years | 55 (96.5%) | 3 (5.5%) |
| 55 to 59 Years | 18 (47.4%) | 0 (0.0%) |
| 60 to 64 Years | 12 (52.2%) | 0 (0.0%) |
| 65 to 74 Years | 26 (29.5%) | 0 (0.0%) |
| 75 Years and over | 6 (11.8%) | 0 (0.0%) |
| Total | 177 (53.3%) | 4 (2.3%) |
Employment Status by Educational Attainment in Old Brownsboro Place
According to labor force statistics for Old Brownsboro Place, 78.5% of individuals (139) out of the total population between 25 and 64 years of age (177) are in the labor force, with 2.2% or 3 of them being unemployed. The group with the highest labor force participation rate are those with the educational attainment of less than high school, with 100.0% or 4 individuals in the labor force. Within the labor force, individuals with high school diploma education have the highest percentage of unemployment, with 100.0% or 3 of them being unemployed.
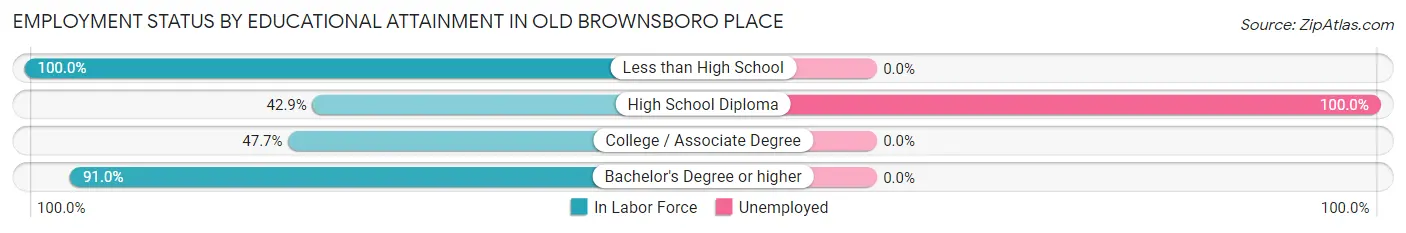
| Educational Attainment | In Labor Force | Unemployed |
| Less than High School | 4 (100.0%) | 0 (0.0%) |
| High School Diploma | 3 (42.9%) | 7 (100.0%) |
| College / Associate Degree | 21 (47.7%) | 0 (0.0%) |
| Bachelor's Degree or higher | 111 (91.0%) | 0 (0.0%) |
| Total | 139 (78.5%) | 4 (2.2%) |
Employment Occupations by Sex in Old Brownsboro Place
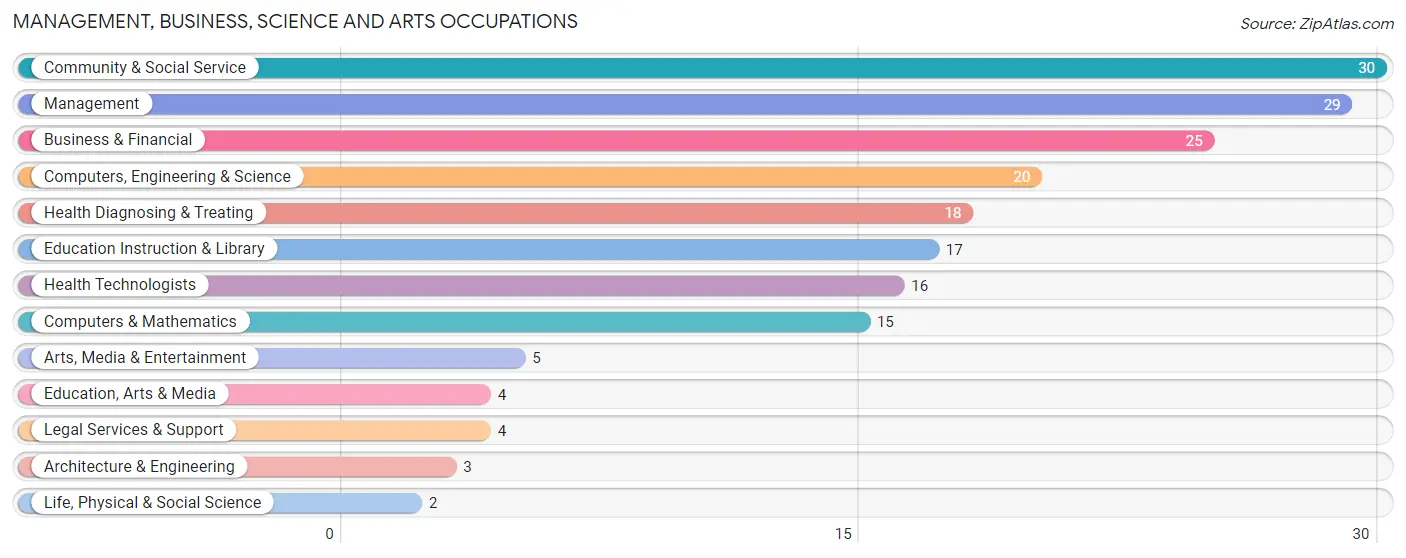
Management, Business, Science and Arts Occupations
The most common Management, Business, Science and Arts occupations in Old Brownsboro Place are Community & Social Service (30 | 17.3%), Management (29 | 16.8%), Business & Financial (25 | 14.4%), Computers, Engineering & Science (20 | 11.6%), and Health Diagnosing & Treating (18 | 10.4%).
Management, Business, Science and Arts Occupations by Sex
Within the Management, Business, Science and Arts occupations in Old Brownsboro Place, the most male-oriented occupations are Architecture & Engineering (100.0%), Life, Physical & Social Science (100.0%), and Computers, Engineering & Science (95.0%), while the most female-oriented occupations are Education, Arts & Media (100.0%), Education Instruction & Library (76.5%), and Community & Social Service (70.0%).
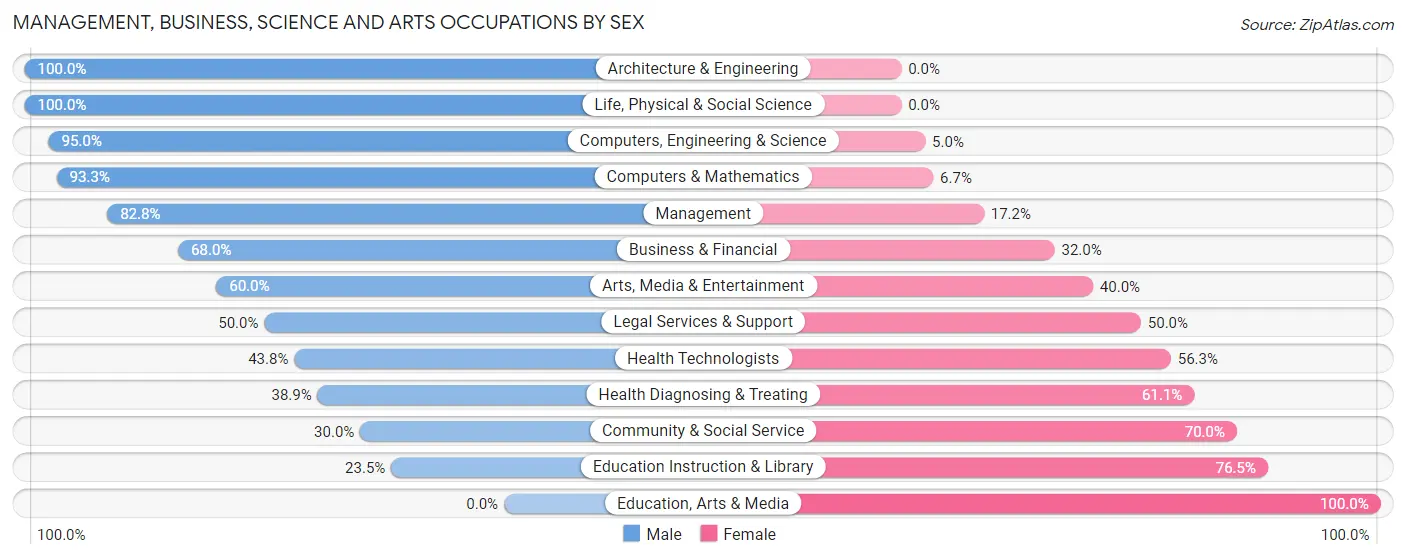
| Occupation | Male | Female |
| Management | 24 (82.8%) | 5 (17.2%) |
| Business & Financial | 17 (68.0%) | 8 (32.0%) |
| Computers, Engineering & Science | 19 (95.0%) | 1 (5.0%) |
| Computers & Mathematics | 14 (93.3%) | 1 (6.7%) |
| Architecture & Engineering | 3 (100.0%) | 0 (0.0%) |
| Life, Physical & Social Science | 2 (100.0%) | 0 (0.0%) |
| Community & Social Service | 9 (30.0%) | 21 (70.0%) |
| Education, Arts & Media | 0 (0.0%) | 4 (100.0%) |
| Legal Services & Support | 2 (50.0%) | 2 (50.0%) |
| Education Instruction & Library | 4 (23.5%) | 13 (76.5%) |
| Arts, Media & Entertainment | 3 (60.0%) | 2 (40.0%) |
| Health Diagnosing & Treating | 7 (38.9%) | 11 (61.1%) |
| Health Technologists | 7 (43.8%) | 9 (56.2%) |
| Total (Category) | 76 (62.3%) | 46 (37.7%) |
| Total (Overall) | 101 (58.4%) | 72 (41.6%) |
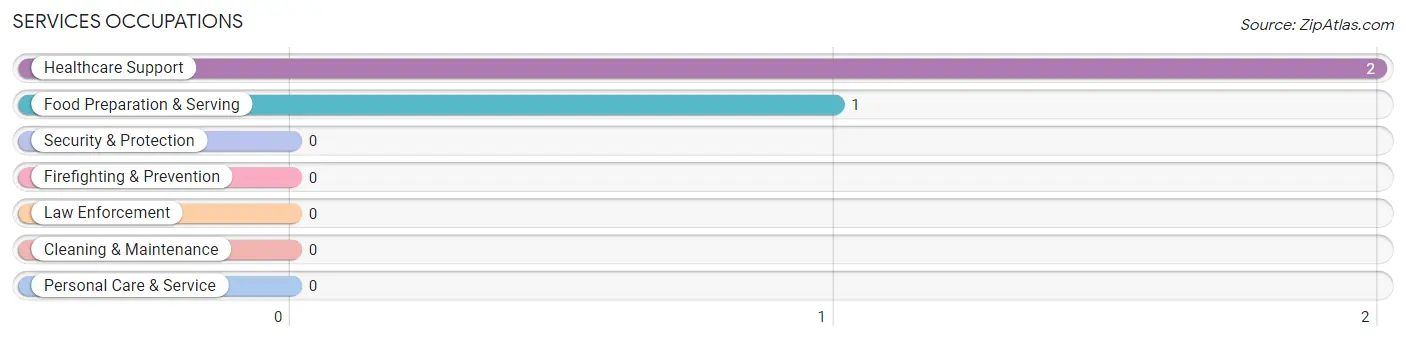
Services Occupations
The most common Services occupations in Old Brownsboro Place are Healthcare Support (2 | 1.2%), and Food Preparation & Serving (1 | 0.6%).
Services Occupations by Sex
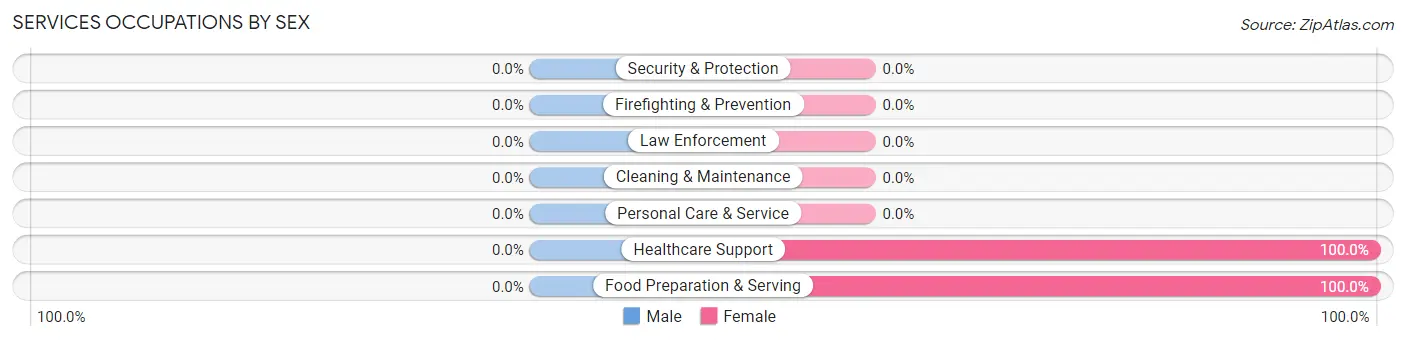
| Occupation | Male | Female |
| Healthcare Support | 0 (0.0%) | 2 (100.0%) |
| Security & Protection | 0 (0.0%) | 0 (0.0%) |
| Firefighting & Prevention | 0 (0.0%) | 0 (0.0%) |
| Law Enforcement | 0 (0.0%) | 0 (0.0%) |
| Food Preparation & Serving | 0 (0.0%) | 1 (100.0%) |
| Cleaning & Maintenance | 0 (0.0%) | 0 (0.0%) |
| Personal Care & Service | 0 (0.0%) | 0 (0.0%) |
| Total (Category) | 0 (0.0%) | 3 (100.0%) |
| Total (Overall) | 101 (58.4%) | 72 (41.6%) |
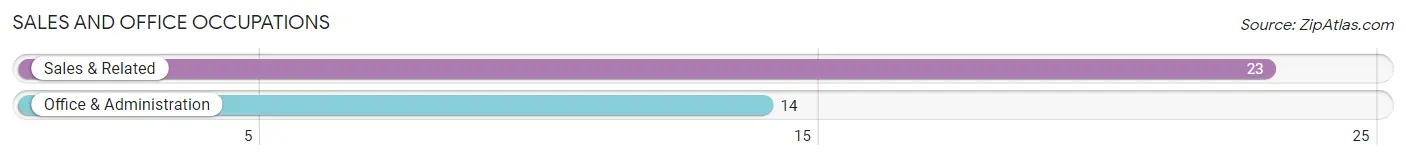
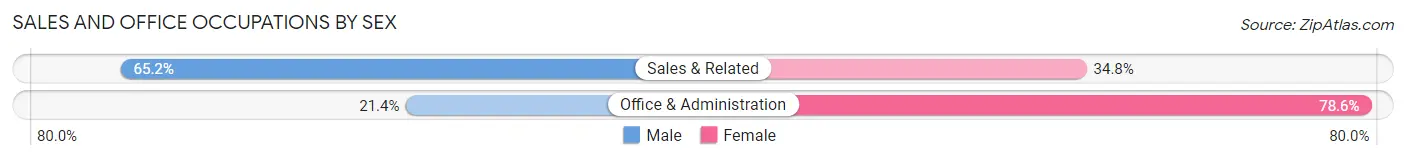
Sales and Office Occupations
The most common Sales and Office occupations in Old Brownsboro Place are Sales & Related (23 | 13.3%), and Office & Administration (14 | 8.1%).
Sales and Office Occupations by Sex
| Occupation | Male | Female |
| Sales & Related | 15 (65.2%) | 8 (34.8%) |
| Office & Administration | 3 (21.4%) | 11 (78.6%) |
| Total (Category) | 18 (48.6%) | 19 (51.3%) |
| Total (Overall) | 101 (58.4%) | 72 (41.6%) |
Natural Resources, Construction and Maintenance Occupations

Natural Resources, Construction and Maintenance Occupations by Sex
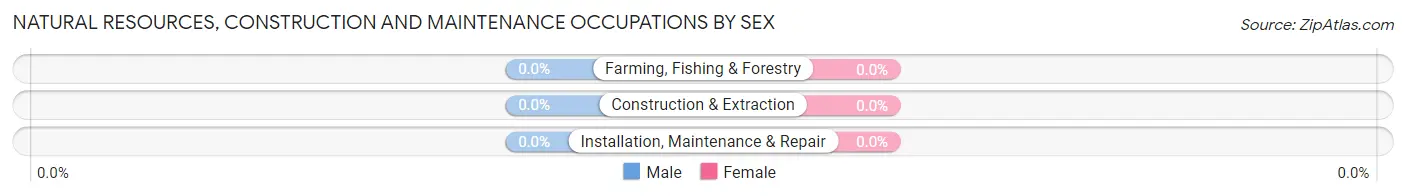
| Occupation | Male | Female |
| Farming, Fishing & Forestry | 0 (0.0%) | 0 (0.0%) |
| Construction & Extraction | 0 (0.0%) | 0 (0.0%) |
| Installation, Maintenance & Repair | 0 (0.0%) | 0 (0.0%) |
| Total (Category) | 0 (0.0%) | 0 (0.0%) |
| Total (Overall) | 101 (58.4%) | 72 (41.6%) |
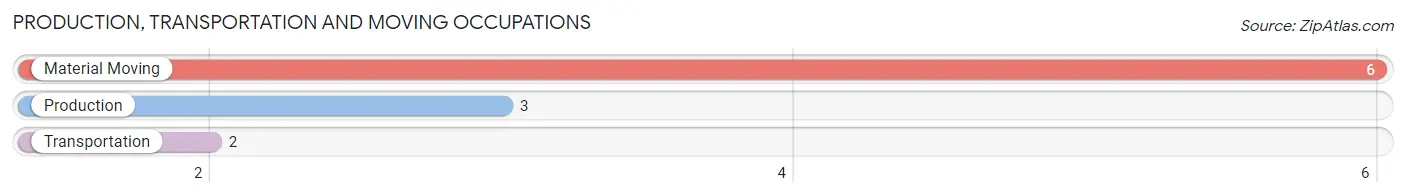
Production, Transportation and Moving Occupations
The most common Production, Transportation and Moving occupations in Old Brownsboro Place are Material Moving (6 | 3.5%), Production (3 | 1.7%), and Transportation (2 | 1.2%).
Production, Transportation and Moving Occupations by Sex
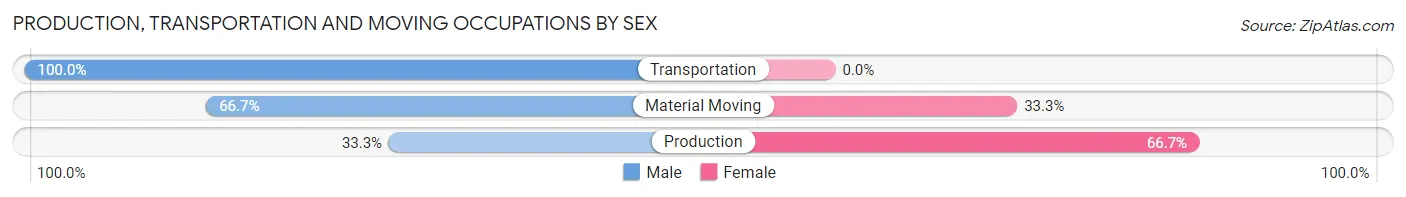
| Occupation | Male | Female |
| Production | 1 (33.3%) | 2 (66.7%) |
| Transportation | 2 (100.0%) | 0 (0.0%) |
| Material Moving | 4 (66.7%) | 2 (33.3%) |
| Total (Category) | 7 (63.6%) | 4 (36.4%) |
| Total (Overall) | 101 (58.4%) | 72 (41.6%) |
Employment Industries by Sex in Old Brownsboro Place
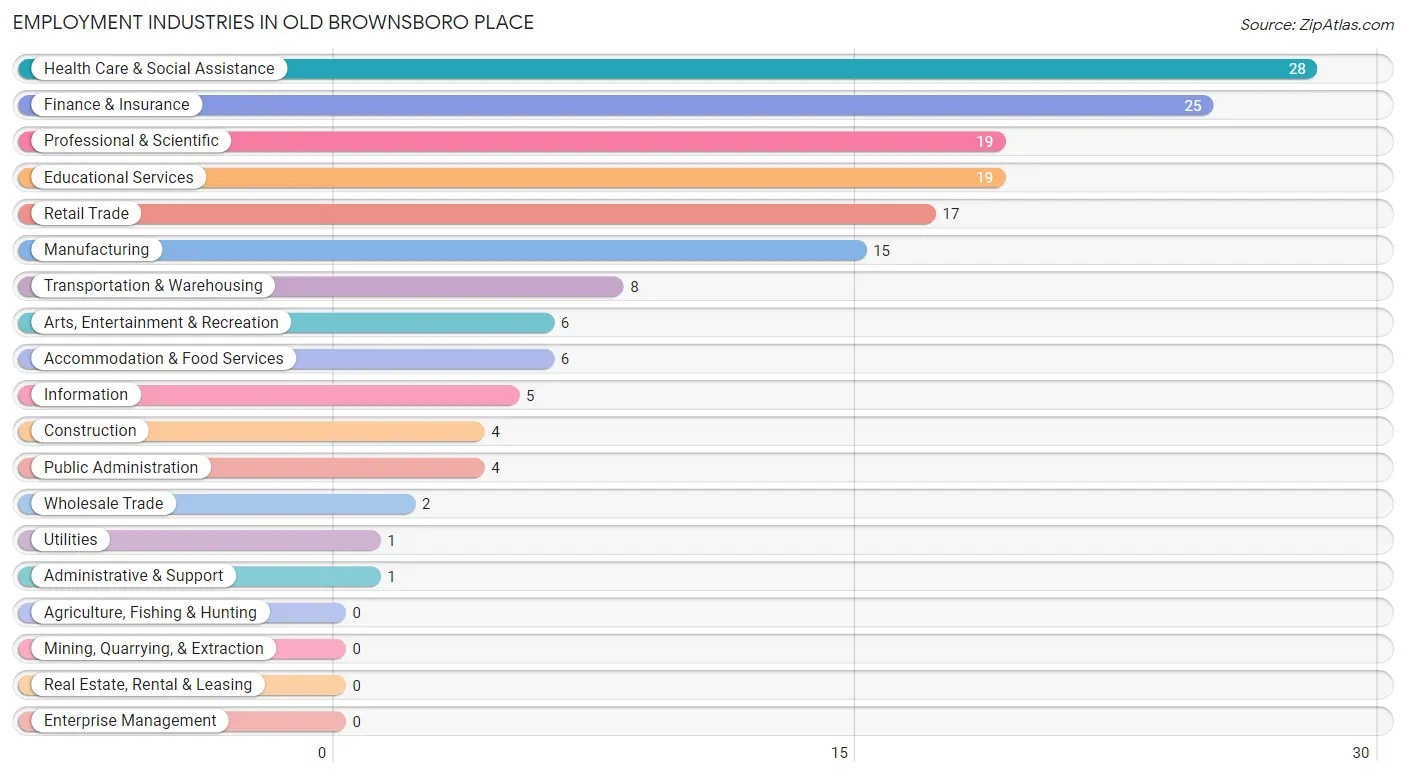
Employment Industries in Old Brownsboro Place
The major employment industries in Old Brownsboro Place include Health Care & Social Assistance (28 | 16.2%), Finance & Insurance (25 | 14.4%), Professional & Scientific (19 | 11.0%), Educational Services (19 | 11.0%), and Retail Trade (17 | 9.8%).
Employment Industries by Sex in Old Brownsboro Place
The Old Brownsboro Place industries that see more men than women are Construction (100.0%), Transportation & Warehousing (100.0%), and Information (100.0%), whereas the industries that tend to have a higher number of women are Utilities (100.0%), Administrative & Support (100.0%), and Educational Services (73.7%).
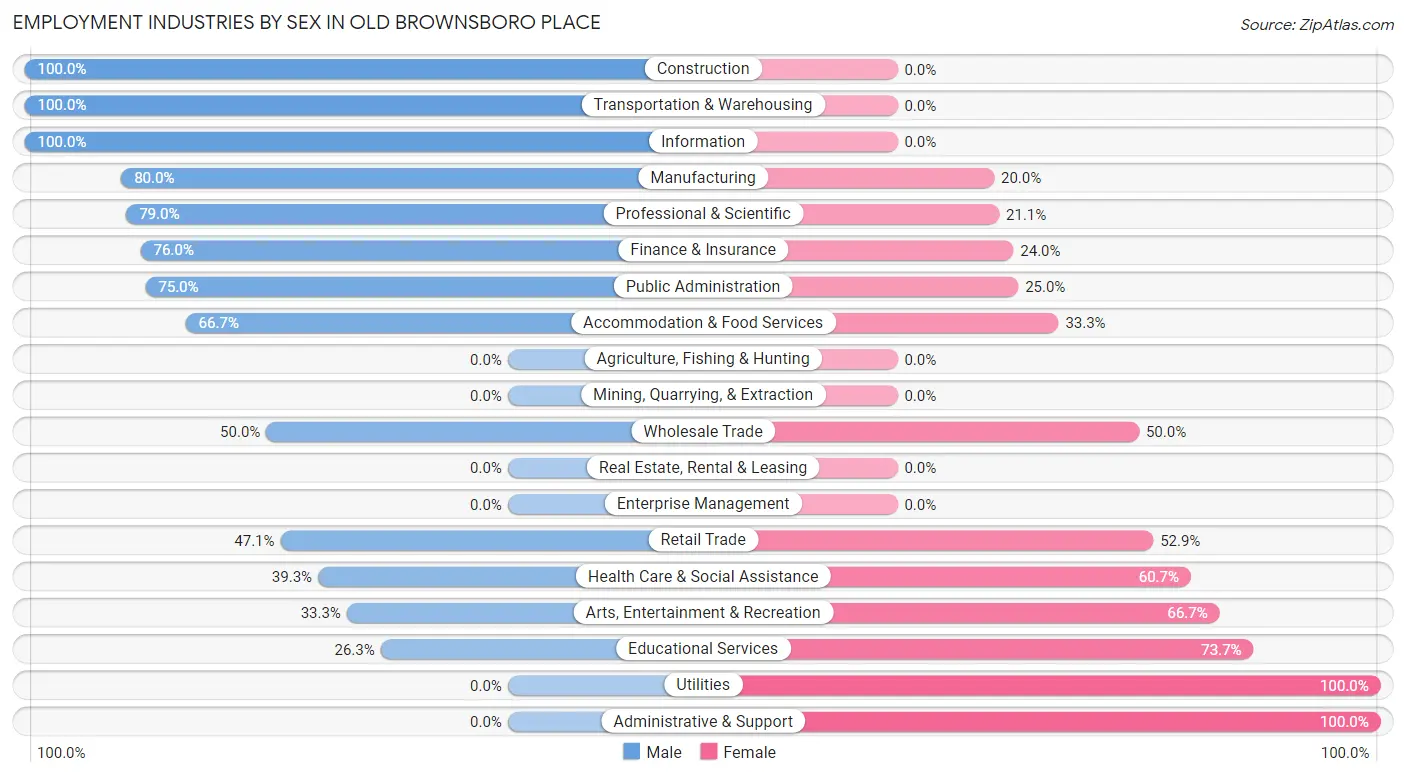
| Industry | Male | Female |
| Agriculture, Fishing & Hunting | 0 (0.0%) | 0 (0.0%) |
| Mining, Quarrying, & Extraction | 0 (0.0%) | 0 (0.0%) |
| Construction | 4 (100.0%) | 0 (0.0%) |
| Manufacturing | 12 (80.0%) | 3 (20.0%) |
| Wholesale Trade | 1 (50.0%) | 1 (50.0%) |
| Retail Trade | 8 (47.1%) | 9 (52.9%) |
| Transportation & Warehousing | 8 (100.0%) | 0 (0.0%) |
| Utilities | 0 (0.0%) | 1 (100.0%) |
| Information | 5 (100.0%) | 0 (0.0%) |
| Finance & Insurance | 19 (76.0%) | 6 (24.0%) |
| Real Estate, Rental & Leasing | 0 (0.0%) | 0 (0.0%) |
| Professional & Scientific | 15 (78.9%) | 4 (21.0%) |
| Enterprise Management | 0 (0.0%) | 0 (0.0%) |
| Administrative & Support | 0 (0.0%) | 1 (100.0%) |
| Educational Services | 5 (26.3%) | 14 (73.7%) |
| Health Care & Social Assistance | 11 (39.3%) | 17 (60.7%) |
| Arts, Entertainment & Recreation | 2 (33.3%) | 4 (66.7%) |
| Accommodation & Food Services | 4 (66.7%) | 2 (33.3%) |
| Public Administration | 3 (75.0%) | 1 (25.0%) |
| Total | 101 (58.4%) | 72 (41.6%) |
Education in Old Brownsboro Place
School Enrollment in Old Brownsboro Place
The most common levels of schooling among the 62 students in Old Brownsboro Place are middle school (16 | 25.8%), high school (15 | 24.2%), and elementary school (14 | 22.6%).
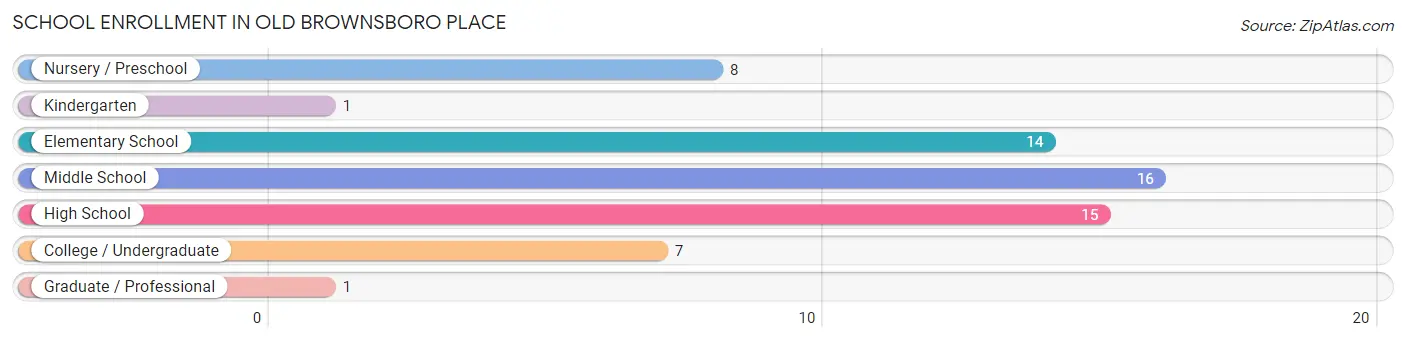
| School Level | # Students | % Students |
| Nursery / Preschool | 8 | 12.9% |
| Kindergarten | 1 | 1.6% |
| Elementary School | 14 | 22.6% |
| Middle School | 16 | 25.8% |
| High School | 15 | 24.2% |
| College / Undergraduate | 7 | 11.3% |
| Graduate / Professional | 1 | 1.6% |
| Total | 62 | 100.0% |
School Enrollment by Age by Funding Source in Old Brownsboro Place
Out of a total of 62 students who are enrolled in schools in Old Brownsboro Place, 21 (33.9%) attend a private institution, while the remaining 41 (66.1%) are enrolled in public schools. The age group of 3 to 4 year olds has the highest likelihood of being enrolled in private schools, with 8 (100.0% in the age bracket) enrolled. Conversely, the age group of 18 to 19 year olds has the lowest likelihood of being enrolled in a private school, with 2 (100.0% in the age bracket) attending a public institution.
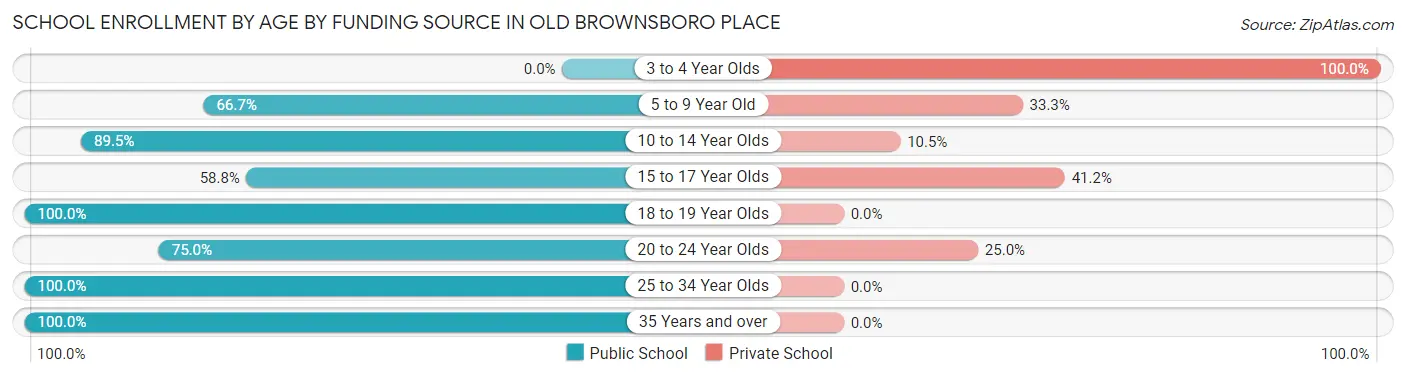
| Age Bracket | Public School | Private School |
| 3 to 4 Year Olds | 0 (0.0%) | 8 (100.0%) |
| 5 to 9 Year Old | 6 (66.7%) | 3 (33.3%) |
| 10 to 14 Year Olds | 17 (89.5%) | 2 (10.5%) |
| 15 to 17 Year Olds | 10 (58.8%) | 7 (41.2%) |
| 18 to 19 Year Olds | 2 (100.0%) | 0 (0.0%) |
| 20 to 24 Year Olds | 3 (75.0%) | 1 (25.0%) |
| 25 to 34 Year Olds | 2 (100.0%) | 0 (0.0%) |
| 35 Years and over | 1 (100.0%) | 0 (0.0%) |
| Total | 41 (66.1%) | 21 (33.9%) |
Educational Attainment by Field of Study in Old Brownsboro Place
Business (54 | 22.9%), education (33 | 14.0%), liberal arts & history (25 | 10.6%), communications (24 | 10.2%), and engineering (19 | 8.1%) are the most common fields of study among 236 individuals in Old Brownsboro Place who have obtained a bachelor's degree or higher.
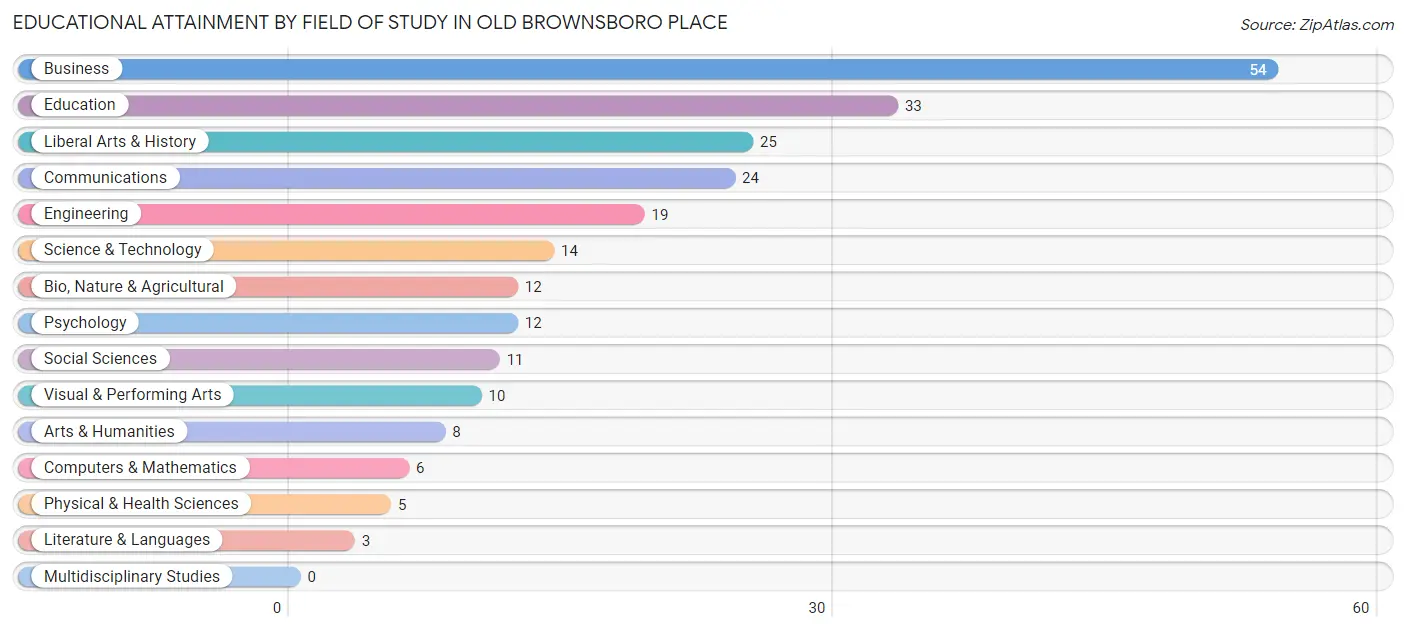
| Field of Study | # Graduates | % Graduates |
| Computers & Mathematics | 6 | 2.5% |
| Bio, Nature & Agricultural | 12 | 5.1% |
| Physical & Health Sciences | 5 | 2.1% |
| Psychology | 12 | 5.1% |
| Social Sciences | 11 | 4.7% |
| Engineering | 19 | 8.1% |
| Multidisciplinary Studies | 0 | 0.0% |
| Science & Technology | 14 | 5.9% |
| Business | 54 | 22.9% |
| Education | 33 | 14.0% |
| Literature & Languages | 3 | 1.3% |
| Liberal Arts & History | 25 | 10.6% |
| Visual & Performing Arts | 10 | 4.2% |
| Communications | 24 | 10.2% |
| Arts & Humanities | 8 | 3.4% |
| Total | 236 | 100.0% |
Transportation & Commute in Old Brownsboro Place
Vehicle Availability by Sex in Old Brownsboro Place
The most prevalent vehicle ownership categories in Old Brownsboro Place are males with 2 vehicles (63, accounting for 63.6%) and females with 2 vehicles (38, making up 92.6%).
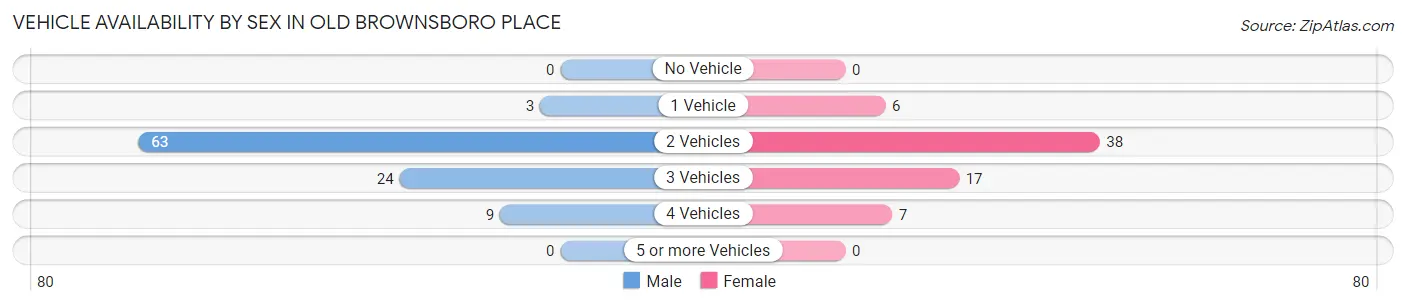
| Vehicles Available | Male | Female |
| No Vehicle | 0 (0.0%) | 0 (0.0%) |
| 1 Vehicle | 3 (3.0%) | 6 (8.8%) |
| 2 Vehicles | 63 (63.6%) | 38 (55.9%) |
| 3 Vehicles | 24 (24.2%) | 17 (25.0%) |
| 4 Vehicles | 9 (9.1%) | 7 (10.3%) |
| 5 or more Vehicles | 0 (0.0%) | 0 (0.0%) |
| Total | 99 (100.0%) | 68 (100.0%) |
Commute Time in Old Brownsboro Place
The most frequently occuring commute durations in Old Brownsboro Place are 20 to 24 minutes (41 commuters, 30.8%), 15 to 19 minutes (38 commuters, 28.6%), and 25 to 29 minutes (16 commuters, 12.0%).
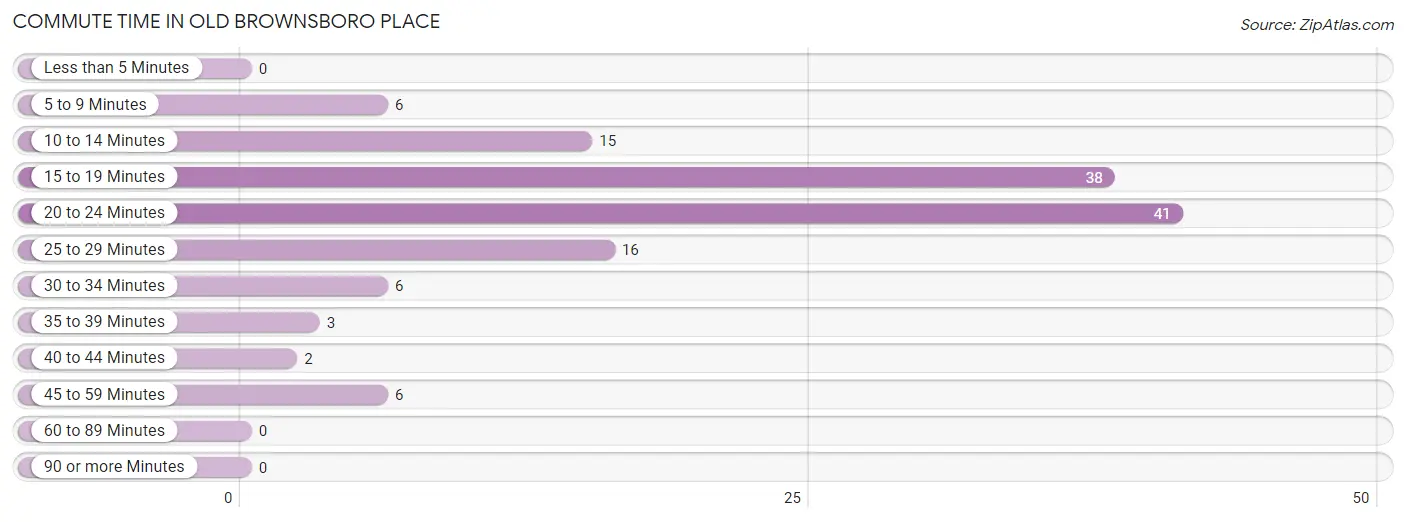
| Commute Time | # Commuters | % Commuters |
| Less than 5 Minutes | 0 | 0.0% |
| 5 to 9 Minutes | 6 | 4.5% |
| 10 to 14 Minutes | 15 | 11.3% |
| 15 to 19 Minutes | 38 | 28.6% |
| 20 to 24 Minutes | 41 | 30.8% |
| 25 to 29 Minutes | 16 | 12.0% |
| 30 to 34 Minutes | 6 | 4.5% |
| 35 to 39 Minutes | 3 | 2.3% |
| 40 to 44 Minutes | 2 | 1.5% |
| 45 to 59 Minutes | 6 | 4.5% |
| 60 to 89 Minutes | 0 | 0.0% |
| 90 or more Minutes | 0 | 0.0% |
Commute Time by Sex in Old Brownsboro Place
The most common commute times in Old Brownsboro Place are 20 to 24 minutes (26 commuters, 34.7%) for males and 15 to 19 minutes (27 commuters, 46.6%) for females.
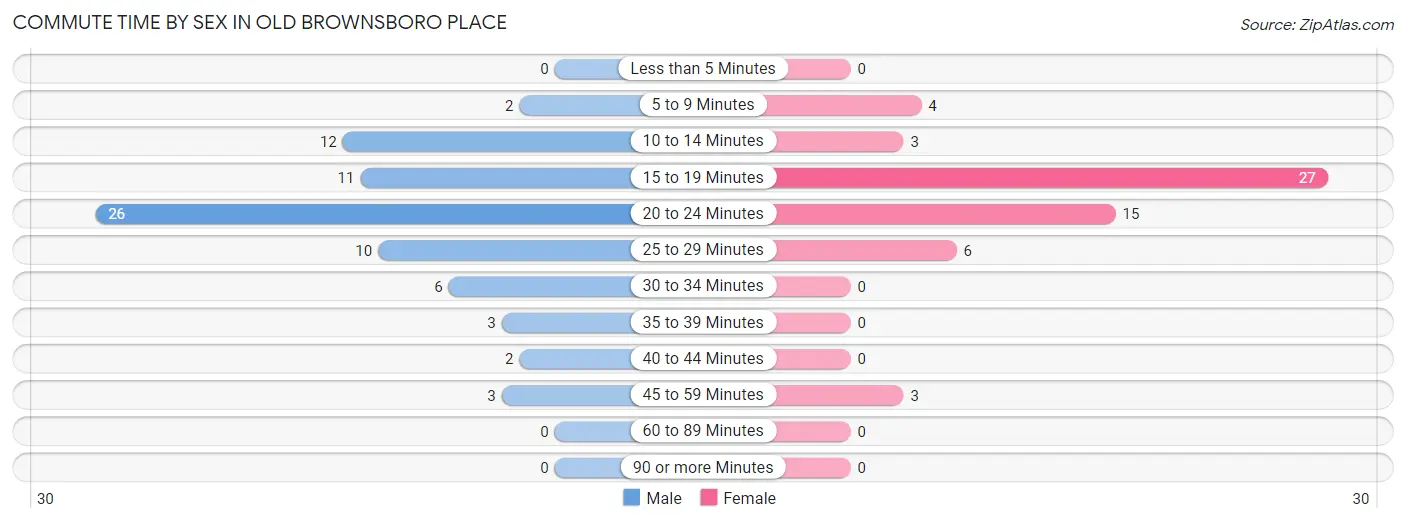
| Commute Time | Male | Female |
| Less than 5 Minutes | 0 (0.0%) | 0 (0.0%) |
| 5 to 9 Minutes | 2 (2.7%) | 4 (6.9%) |
| 10 to 14 Minutes | 12 (16.0%) | 3 (5.2%) |
| 15 to 19 Minutes | 11 (14.7%) | 27 (46.6%) |
| 20 to 24 Minutes | 26 (34.7%) | 15 (25.9%) |
| 25 to 29 Minutes | 10 (13.3%) | 6 (10.3%) |
| 30 to 34 Minutes | 6 (8.0%) | 0 (0.0%) |
| 35 to 39 Minutes | 3 (4.0%) | 0 (0.0%) |
| 40 to 44 Minutes | 2 (2.7%) | 0 (0.0%) |
| 45 to 59 Minutes | 3 (4.0%) | 3 (5.2%) |
| 60 to 89 Minutes | 0 (0.0%) | 0 (0.0%) |
| 90 or more Minutes | 0 (0.0%) | 0 (0.0%) |
Time of Departure to Work by Sex in Old Brownsboro Place
The most frequent times of departure to work in Old Brownsboro Place are 7:00 AM to 7:29 AM (17, 22.7%) for males and 7:00 AM to 7:29 AM (14, 24.1%) for females.
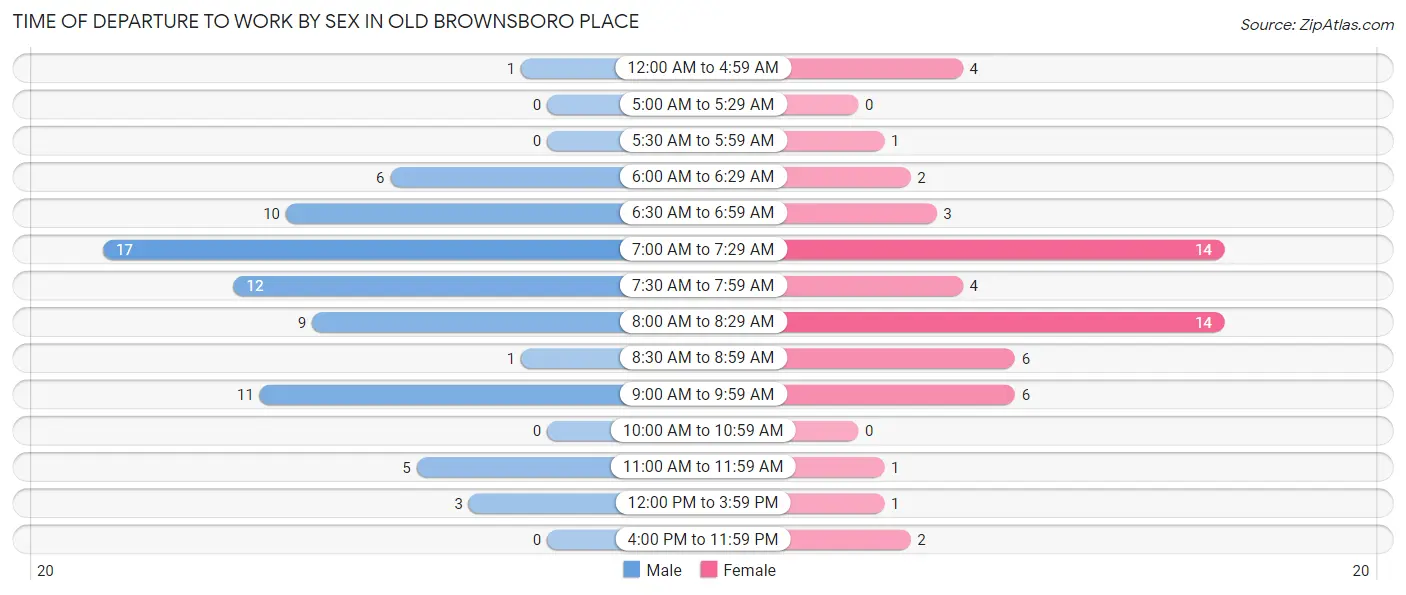
| Time of Departure | Male | Female |
| 12:00 AM to 4:59 AM | 1 (1.3%) | 4 (6.9%) |
| 5:00 AM to 5:29 AM | 0 (0.0%) | 0 (0.0%) |
| 5:30 AM to 5:59 AM | 0 (0.0%) | 1 (1.7%) |
| 6:00 AM to 6:29 AM | 6 (8.0%) | 2 (3.5%) |
| 6:30 AM to 6:59 AM | 10 (13.3%) | 3 (5.2%) |
| 7:00 AM to 7:29 AM | 17 (22.7%) | 14 (24.1%) |
| 7:30 AM to 7:59 AM | 12 (16.0%) | 4 (6.9%) |
| 8:00 AM to 8:29 AM | 9 (12.0%) | 14 (24.1%) |
| 8:30 AM to 8:59 AM | 1 (1.3%) | 6 (10.3%) |
| 9:00 AM to 9:59 AM | 11 (14.7%) | 6 (10.3%) |
| 10:00 AM to 10:59 AM | 0 (0.0%) | 0 (0.0%) |
| 11:00 AM to 11:59 AM | 5 (6.7%) | 1 (1.7%) |
| 12:00 PM to 3:59 PM | 3 (4.0%) | 1 (1.7%) |
| 4:00 PM to 11:59 PM | 0 (0.0%) | 2 (3.5%) |
| Total | 75 (100.0%) | 58 (100.0%) |
Housing Occupancy in Old Brownsboro Place
Occupancy by Ownership in Old Brownsboro Place
Of the total 158 dwellings in Old Brownsboro Place, owner-occupied units account for 154 (97.5%), while renter-occupied units make up 4 (2.5%).
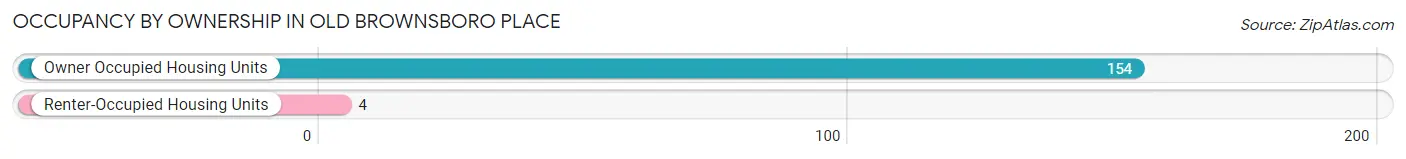
| Occupancy | # Housing Units | % Housing Units |
| Owner Occupied Housing Units | 154 | 97.5% |
| Renter-Occupied Housing Units | 4 | 2.5% |
| Total Occupied Housing Units | 158 | 100.0% |
Occupancy by Household Size in Old Brownsboro Place
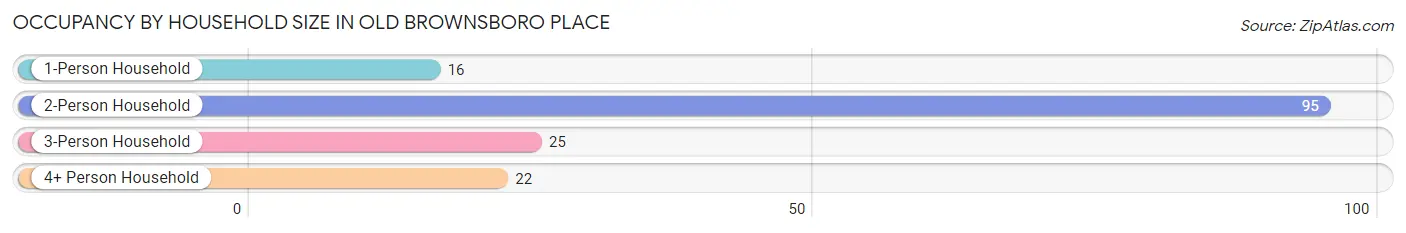
| Household Size | # Housing Units | % Housing Units |
| 1-Person Household | 16 | 10.1% |
| 2-Person Household | 95 | 60.1% |
| 3-Person Household | 25 | 15.8% |
| 4+ Person Household | 22 | 13.9% |
| Total Housing Units | 158 | 100.0% |
Occupancy by Ownership by Household Size in Old Brownsboro Place
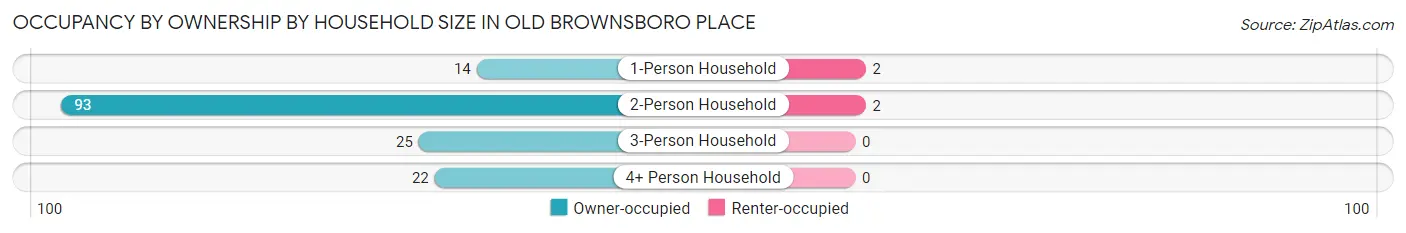
| Household Size | Owner-occupied | Renter-occupied |
| 1-Person Household | 14 (87.5%) | 2 (12.5%) |
| 2-Person Household | 93 (97.9%) | 2 (2.1%) |
| 3-Person Household | 25 (100.0%) | 0 (0.0%) |
| 4+ Person Household | 22 (100.0%) | 0 (0.0%) |
| Total Housing Units | 154 (97.5%) | 4 (2.5%) |
Occupancy by Educational Attainment in Old Brownsboro Place
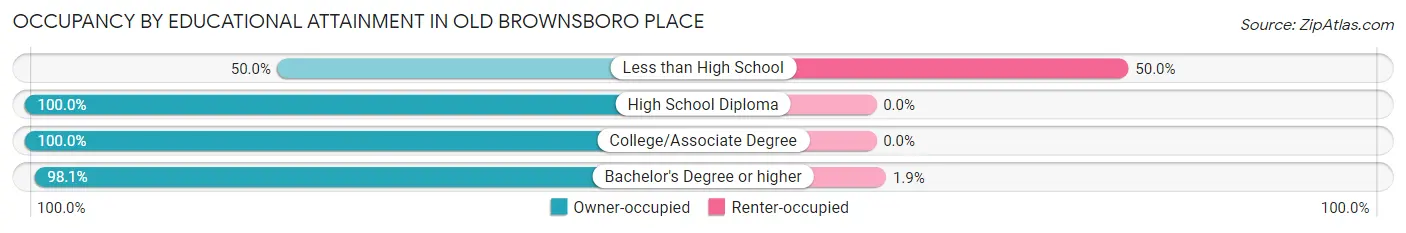
| Household Size | Owner-occupied | Renter-occupied |
| Less than High School | 2 (50.0%) | 2 (50.0%) |
| High School Diploma | 20 (100.0%) | 0 (0.0%) |
| College/Associate Degree | 31 (100.0%) | 0 (0.0%) |
| Bachelor's Degree or higher | 101 (98.1%) | 2 (1.9%) |
Occupancy by Age of Householder in Old Brownsboro Place
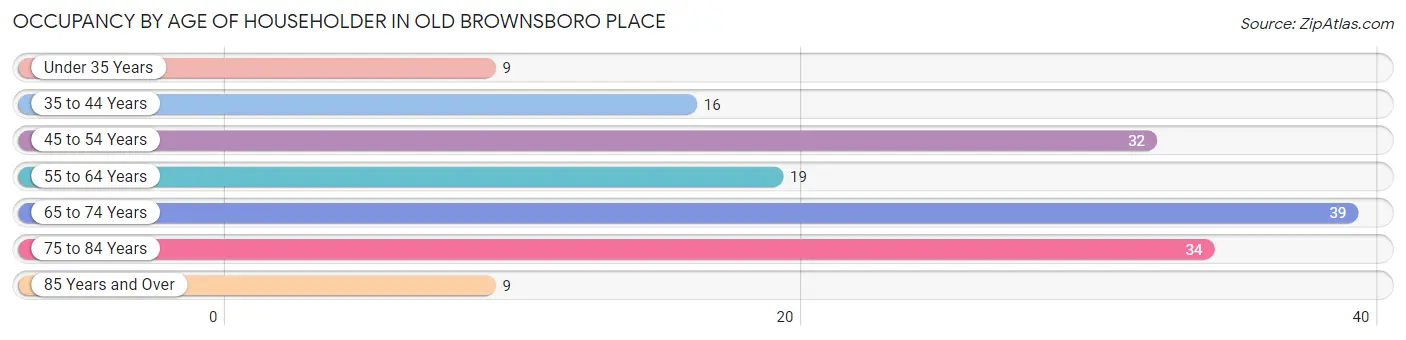
| Age Bracket | # Households | % Households |
| Under 35 Years | 9 | 5.7% |
| 35 to 44 Years | 16 | 10.1% |
| 45 to 54 Years | 32 | 20.3% |
| 55 to 64 Years | 19 | 12.0% |
| 65 to 74 Years | 39 | 24.7% |
| 75 to 84 Years | 34 | 21.5% |
| 85 Years and Over | 9 | 5.7% |
| Total | 158 | 100.0% |
Housing Finances in Old Brownsboro Place
Median Income by Occupancy in Old Brownsboro Place
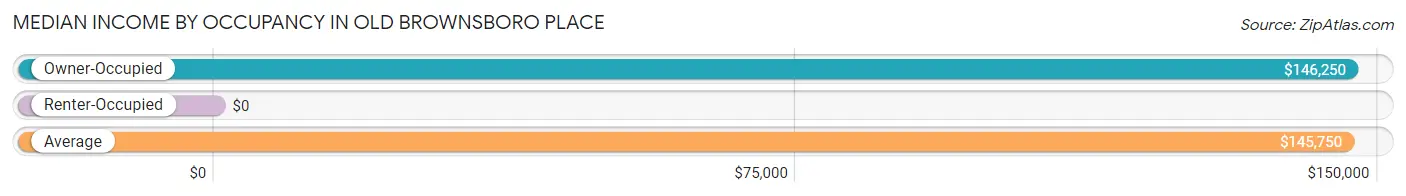
| Occupancy Type | # Households | Median Income |
| Owner-Occupied | 154 (97.5%) | $146,250 |
| Renter-Occupied | 4 (2.5%) | $0 |
| Average | 158 (100.0%) | $145,750 |
Occupancy by Householder Income Bracket in Old Brownsboro Place
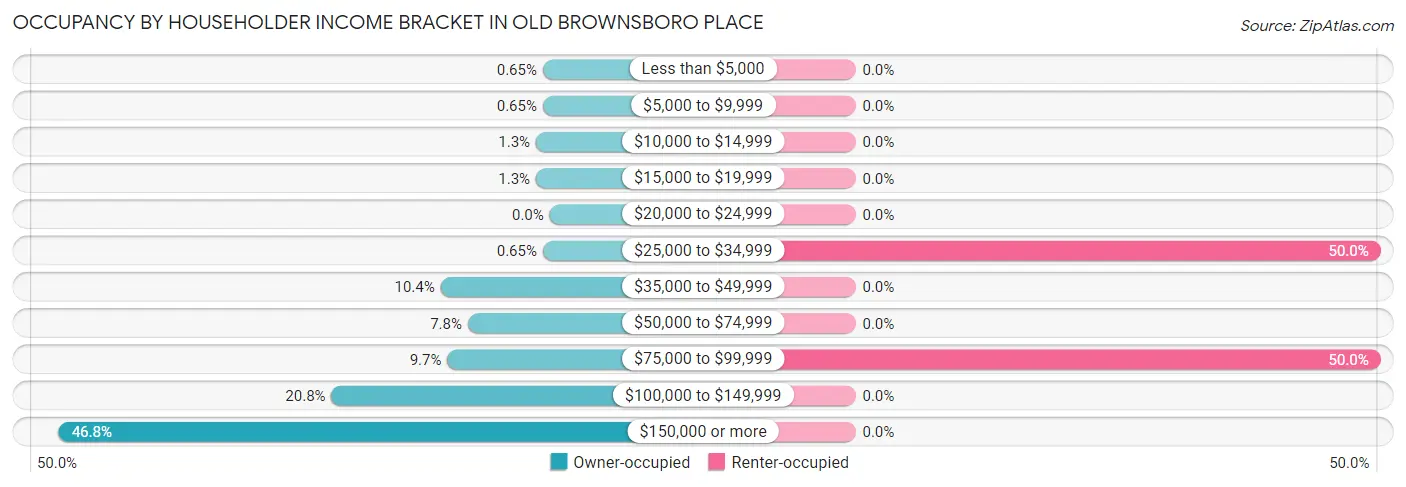
| Income Bracket | Owner-occupied | Renter-occupied |
| Less than $5,000 | 1 (0.6%) | 0 (0.0%) |
| $5,000 to $9,999 | 1 (0.6%) | 0 (0.0%) |
| $10,000 to $14,999 | 2 (1.3%) | 0 (0.0%) |
| $15,000 to $19,999 | 2 (1.3%) | 0 (0.0%) |
| $20,000 to $24,999 | 0 (0.0%) | 0 (0.0%) |
| $25,000 to $34,999 | 1 (0.6%) | 2 (50.0%) |
| $35,000 to $49,999 | 16 (10.4%) | 0 (0.0%) |
| $50,000 to $74,999 | 12 (7.8%) | 0 (0.0%) |
| $75,000 to $99,999 | 15 (9.7%) | 2 (50.0%) |
| $100,000 to $149,999 | 32 (20.8%) | 0 (0.0%) |
| $150,000 or more | 72 (46.8%) | 0 (0.0%) |
| Total | 154 (100.0%) | 4 (100.0%) |
Monthly Housing Cost Tiers in Old Brownsboro Place
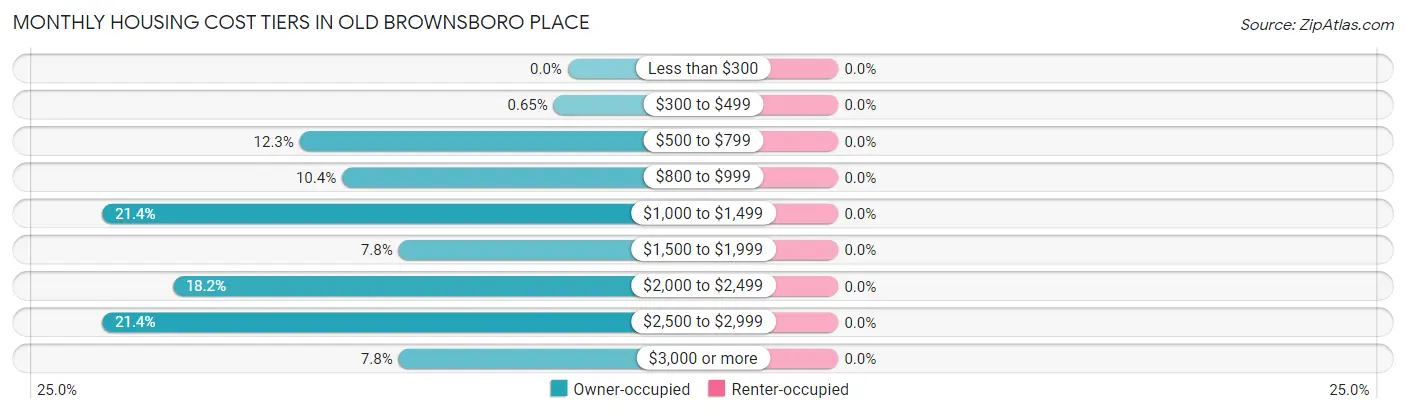
| Monthly Cost | Owner-occupied | Renter-occupied |
| Less than $300 | 0 (0.0%) | 0 (0.0%) |
| $300 to $499 | 1 (0.6%) | 0 (0.0%) |
| $500 to $799 | 19 (12.3%) | 0 (0.0%) |
| $800 to $999 | 16 (10.4%) | 0 (0.0%) |
| $1,000 to $1,499 | 33 (21.4%) | 0 (0.0%) |
| $1,500 to $1,999 | 12 (7.8%) | 0 (0.0%) |
| $2,000 to $2,499 | 28 (18.2%) | 0 (0.0%) |
| $2,500 to $2,999 | 33 (21.4%) | 0 (0.0%) |
| $3,000 or more | 12 (7.8%) | 0 (0.0%) |
| Total | 154 (100.0%) | 4 (100.0%) |
Physical Housing Characteristics in Old Brownsboro Place
Housing Structures in Old Brownsboro Place
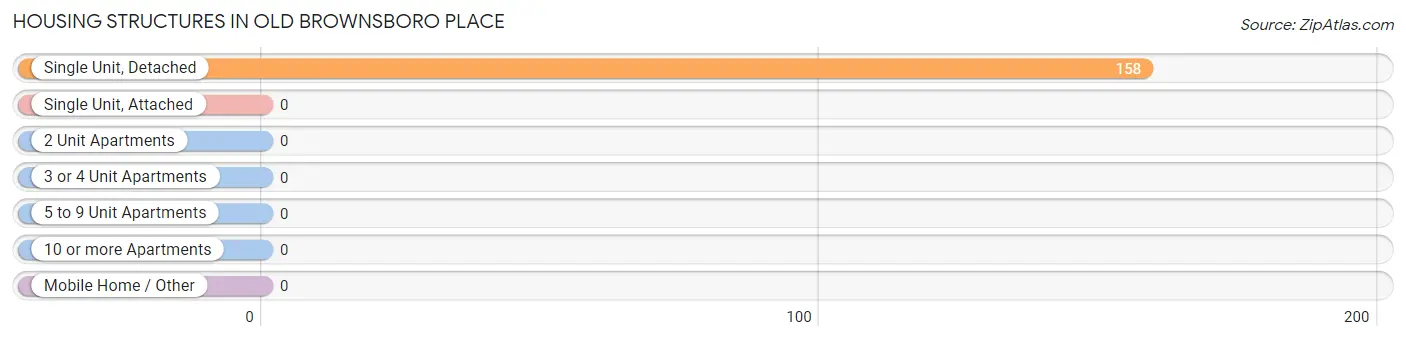
| Structure Type | # Housing Units | % Housing Units |
| Single Unit, Detached | 158 | 100.0% |
| Single Unit, Attached | 0 | 0.0% |
| 2 Unit Apartments | 0 | 0.0% |
| 3 or 4 Unit Apartments | 0 | 0.0% |
| 5 to 9 Unit Apartments | 0 | 0.0% |
| 10 or more Apartments | 0 | 0.0% |
| Mobile Home / Other | 0 | 0.0% |
| Total | 158 | 100.0% |
Housing Structures by Occupancy in Old Brownsboro Place
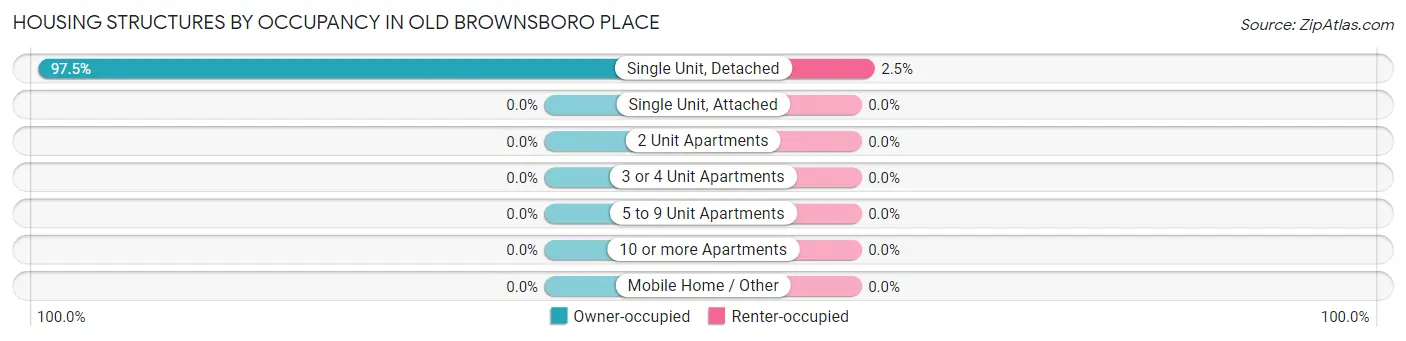
| Structure Type | Owner-occupied | Renter-occupied |
| Single Unit, Detached | 154 (97.5%) | 4 (2.5%) |
| Single Unit, Attached | 0 (0.0%) | 0 (0.0%) |
| 2 Unit Apartments | 0 (0.0%) | 0 (0.0%) |
| 3 or 4 Unit Apartments | 0 (0.0%) | 0 (0.0%) |
| 5 to 9 Unit Apartments | 0 (0.0%) | 0 (0.0%) |
| 10 or more Apartments | 0 (0.0%) | 0 (0.0%) |
| Mobile Home / Other | 0 (0.0%) | 0 (0.0%) |
| Total | 154 (97.5%) | 4 (2.5%) |
Housing Structures by Number of Rooms in Old Brownsboro Place
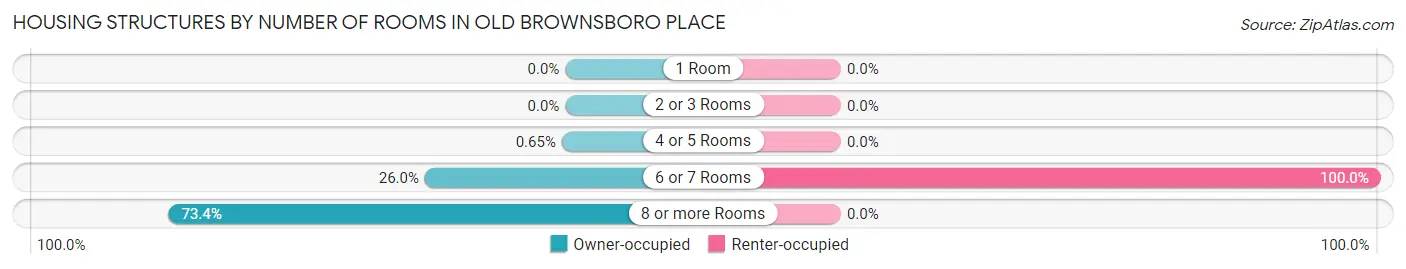
| Number of Rooms | Owner-occupied | Renter-occupied |
| 1 Room | 0 (0.0%) | 0 (0.0%) |
| 2 or 3 Rooms | 0 (0.0%) | 0 (0.0%) |
| 4 or 5 Rooms | 1 (0.6%) | 0 (0.0%) |
| 6 or 7 Rooms | 40 (26.0%) | 4 (100.0%) |
| 8 or more Rooms | 113 (73.4%) | 0 (0.0%) |
| Total | 154 (100.0%) | 4 (100.0%) |
Housing Structure by Heating Type in Old Brownsboro Place
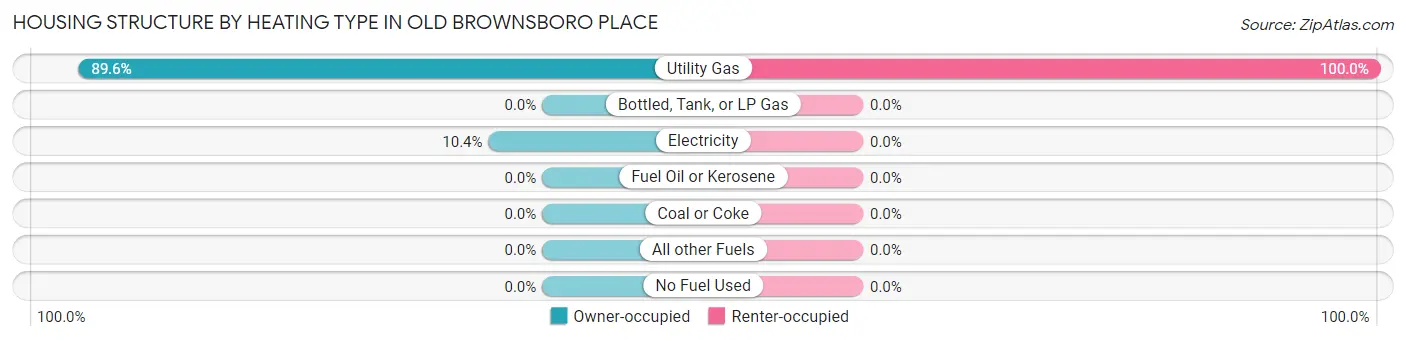
| Heating Type | Owner-occupied | Renter-occupied |
| Utility Gas | 138 (89.6%) | 4 (100.0%) |
| Bottled, Tank, or LP Gas | 0 (0.0%) | 0 (0.0%) |
| Electricity | 16 (10.4%) | 0 (0.0%) |
| Fuel Oil or Kerosene | 0 (0.0%) | 0 (0.0%) |
| Coal or Coke | 0 (0.0%) | 0 (0.0%) |
| All other Fuels | 0 (0.0%) | 0 (0.0%) |
| No Fuel Used | 0 (0.0%) | 0 (0.0%) |
| Total | 154 (100.0%) | 4 (100.0%) |
Household Vehicle Usage in Old Brownsboro Place

| Vehicles per Household | Owner-occupied | Renter-occupied |
| No Vehicle | 2 (1.3%) | 0 (0.0%) |
| 1 Vehicle | 18 (11.7%) | 0 (0.0%) |
| 2 Vehicles | 89 (57.8%) | 4 (100.0%) |
| 3 or more Vehicles | 45 (29.2%) | 0 (0.0%) |
| Total | 154 (100.0%) | 4 (100.0%) |
Real Estate & Mortgages in Old Brownsboro Place
Real Estate and Mortgage Overview in Old Brownsboro Place
| Characteristic | Without Mortgage | With Mortgage |
| Housing Units | 44 | 110 |
| Median Property Value | $381,800 | $440,600 |
| Median Household Income | $81,250 | $58 |
| Monthly Housing Costs | $815 | $12 |
| Real Estate Taxes | $3,194 | $0 |
Property Value by Mortgage Status in Old Brownsboro Place
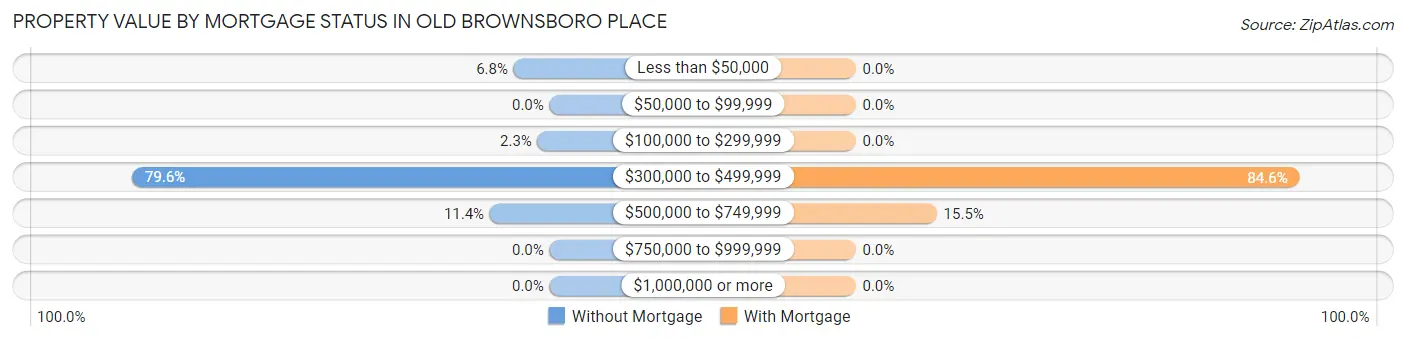
| Property Value | Without Mortgage | With Mortgage |
| Less than $50,000 | 3 (6.8%) | 0 (0.0%) |
| $50,000 to $99,999 | 0 (0.0%) | 0 (0.0%) |
| $100,000 to $299,999 | 1 (2.3%) | 0 (0.0%) |
| $300,000 to $499,999 | 35 (79.5%) | 93 (84.6%) |
| $500,000 to $749,999 | 5 (11.4%) | 17 (15.4%) |
| $750,000 to $999,999 | 0 (0.0%) | 0 (0.0%) |
| $1,000,000 or more | 0 (0.0%) | 0 (0.0%) |
| Total | 44 (100.0%) | 110 (100.0%) |
Household Income by Mortgage Status in Old Brownsboro Place
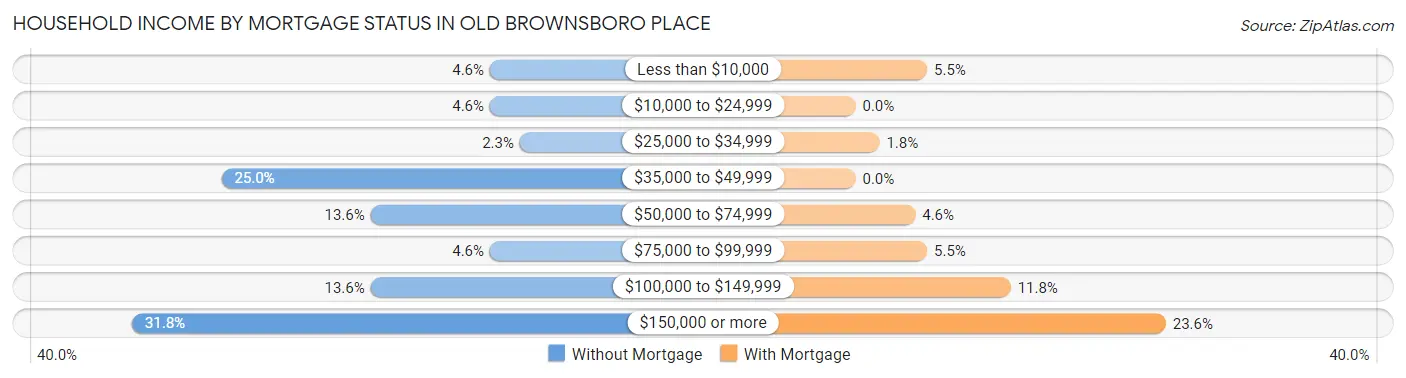
| Household Income | Without Mortgage | With Mortgage |
| Less than $10,000 | 2 (4.5%) | 6 (5.4%) |
| $10,000 to $24,999 | 2 (4.5%) | 0 (0.0%) |
| $25,000 to $34,999 | 1 (2.3%) | 2 (1.8%) |
| $35,000 to $49,999 | 11 (25.0%) | 0 (0.0%) |
| $50,000 to $74,999 | 6 (13.6%) | 5 (4.5%) |
| $75,000 to $99,999 | 2 (4.5%) | 6 (5.4%) |
| $100,000 to $149,999 | 6 (13.6%) | 13 (11.8%) |
| $150,000 or more | 14 (31.8%) | 26 (23.6%) |
| Total | 44 (100.0%) | 110 (100.0%) |
Property Value to Household Income Ratio in Old Brownsboro Place
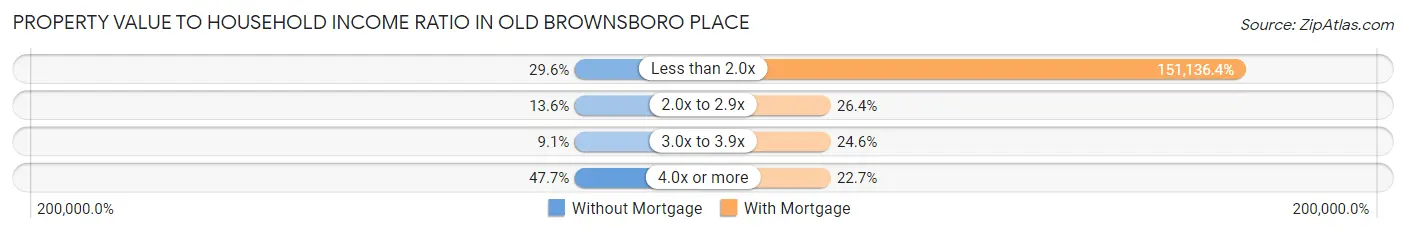
| Value-to-Income Ratio | Without Mortgage | With Mortgage |
| Less than 2.0x | 13 (29.5%) | 166,250 (151,136.4%) |
| 2.0x to 2.9x | 6 (13.6%) | 29 (26.4%) |
| 3.0x to 3.9x | 4 (9.1%) | 27 (24.5%) |
| 4.0x or more | 21 (47.7%) | 25 (22.7%) |
| Total | 44 (100.0%) | 110 (100.0%) |
Real Estate Taxes by Mortgage Status in Old Brownsboro Place
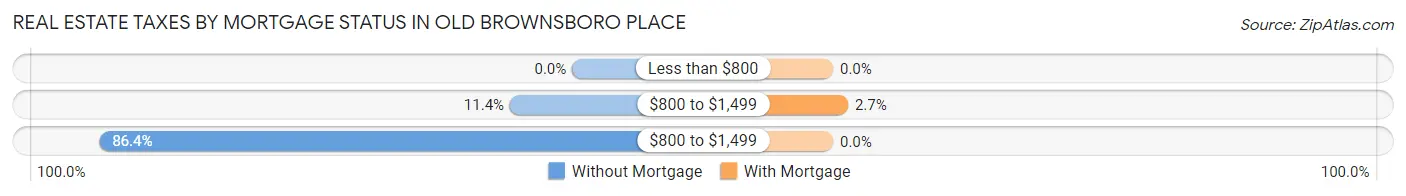
| Property Taxes | Without Mortgage | With Mortgage |
| Less than $800 | 0 (0.0%) | 0 (0.0%) |
| $800 to $1,499 | 5 (11.4%) | 3 (2.7%) |
| $800 to $1,499 | 38 (86.4%) | 0 (0.0%) |
| Total | 44 (100.0%) | 110 (100.0%) |
Health & Disability in Old Brownsboro Place
Health Insurance Coverage by Age in Old Brownsboro Place
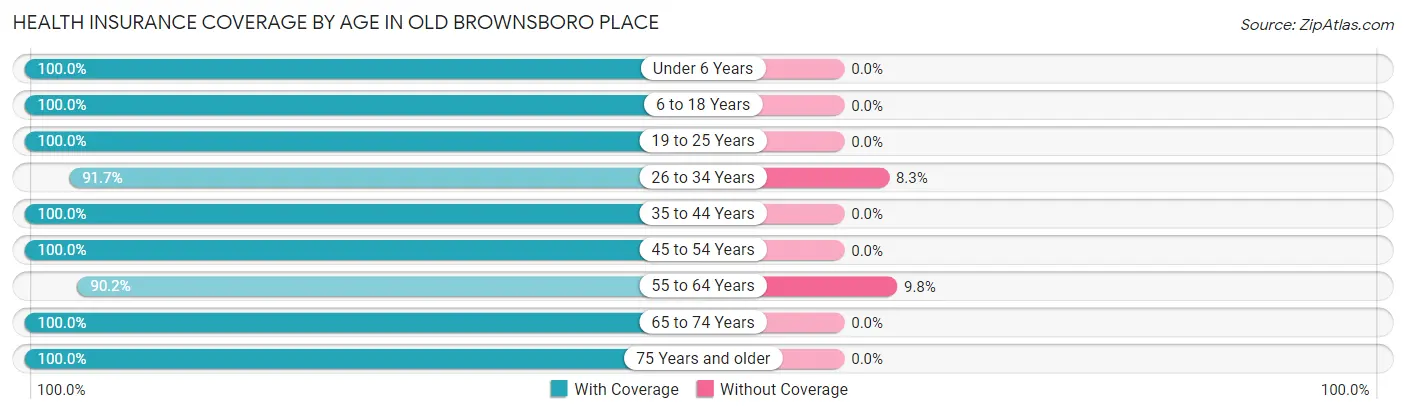
| Age Bracket | With Coverage | Without Coverage |
| Under 6 Years | 15 (100.0%) | 0 (0.0%) |
| 6 to 18 Years | 46 (100.0%) | 0 (0.0%) |
| 19 to 25 Years | 9 (100.0%) | 0 (0.0%) |
| 26 to 34 Years | 22 (91.7%) | 2 (8.3%) |
| 35 to 44 Years | 33 (100.0%) | 0 (0.0%) |
| 45 to 54 Years | 57 (100.0%) | 0 (0.0%) |
| 55 to 64 Years | 55 (90.2%) | 6 (9.8%) |
| 65 to 74 Years | 88 (100.0%) | 0 (0.0%) |
| 75 Years and older | 51 (100.0%) | 0 (0.0%) |
| Total | 376 (97.9%) | 8 (2.1%) |
Health Insurance Coverage by Citizenship Status in Old Brownsboro Place
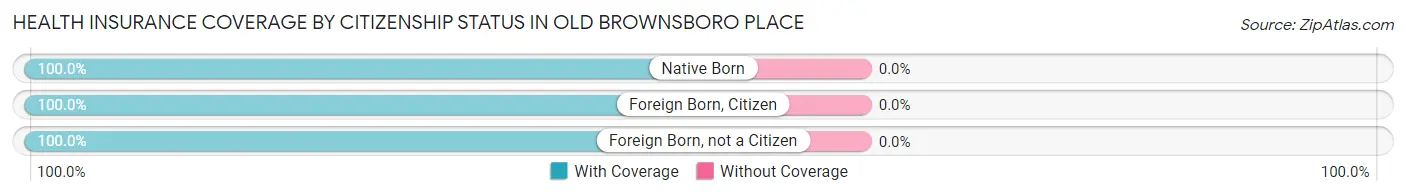
| Citizenship Status | With Coverage | Without Coverage |
| Native Born | 15 (100.0%) | 0 (0.0%) |
| Foreign Born, Citizen | 46 (100.0%) | 0 (0.0%) |
| Foreign Born, not a Citizen | 9 (100.0%) | 0 (0.0%) |
Health Insurance Coverage by Household Income in Old Brownsboro Place
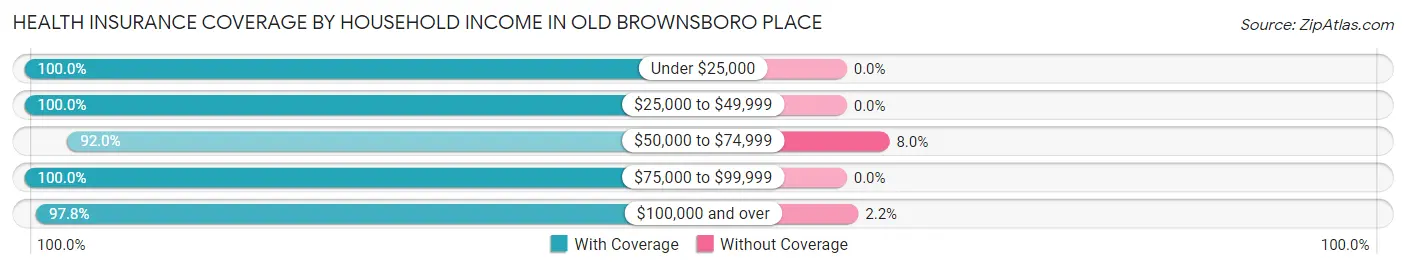
| Household Income | With Coverage | Without Coverage |
| Under $25,000 | 9 (100.0%) | 0 (0.0%) |
| $25,000 to $49,999 | 37 (100.0%) | 0 (0.0%) |
| $50,000 to $74,999 | 23 (92.0%) | 2 (8.0%) |
| $75,000 to $99,999 | 35 (100.0%) | 0 (0.0%) |
| $100,000 and over | 272 (97.8%) | 6 (2.2%) |
Public vs Private Health Insurance Coverage by Age in Old Brownsboro Place
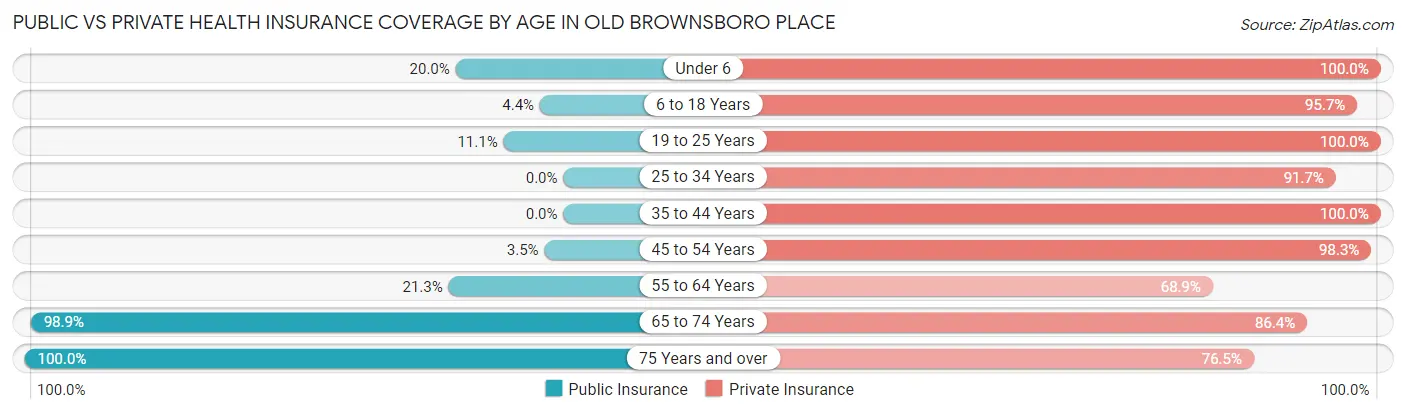
| Age Bracket | Public Insurance | Private Insurance |
| Under 6 | 3 (20.0%) | 15 (100.0%) |
| 6 to 18 Years | 2 (4.3%) | 44 (95.7%) |
| 19 to 25 Years | 1 (11.1%) | 9 (100.0%) |
| 25 to 34 Years | 0 (0.0%) | 22 (91.7%) |
| 35 to 44 Years | 0 (0.0%) | 33 (100.0%) |
| 45 to 54 Years | 2 (3.5%) | 56 (98.3%) |
| 55 to 64 Years | 13 (21.3%) | 42 (68.9%) |
| 65 to 74 Years | 87 (98.9%) | 76 (86.4%) |
| 75 Years and over | 51 (100.0%) | 39 (76.5%) |
| Total | 159 (41.4%) | 336 (87.5%) |
Disability Status by Sex by Age in Old Brownsboro Place
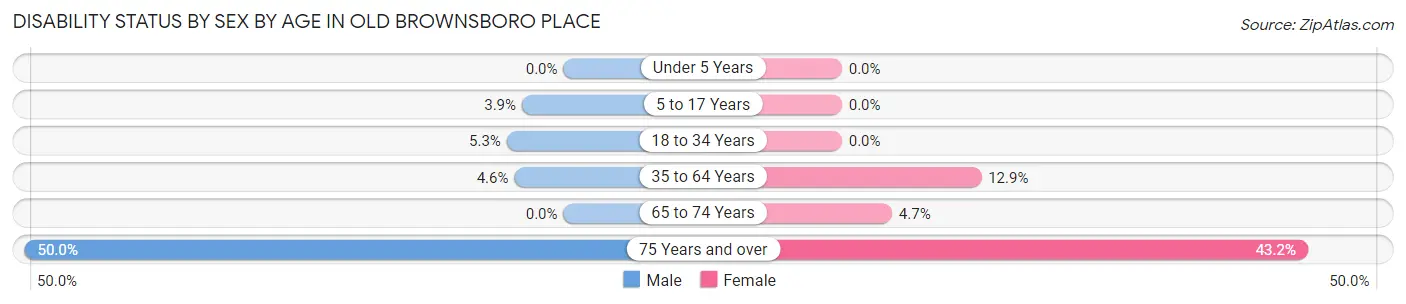
| Age Bracket | Male | Female |
| Under 5 Years | 0 (0.0%) | 0 (0.0%) |
| 5 to 17 Years | 1 (3.8%) | 0 (0.0%) |
| 18 to 34 Years | 1 (5.3%) | 0 (0.0%) |
| 35 to 64 Years | 3 (4.5%) | 11 (12.9%) |
| 65 to 74 Years | 0 (0.0%) | 2 (4.6%) |
| 75 Years and over | 7 (50.0%) | 16 (43.2%) |
Disability Class by Sex by Age in Old Brownsboro Place
Disability Class: Hearing Difficulty
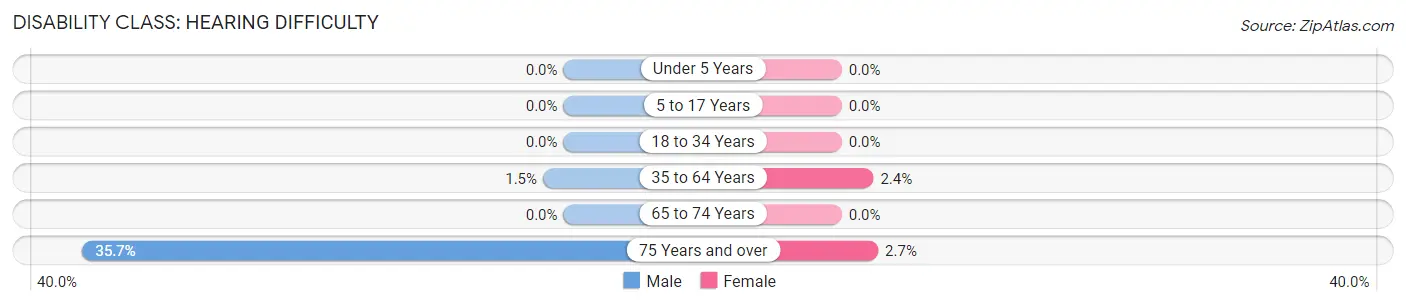
| Age Bracket | Male | Female |
| Under 5 Years | 0 (0.0%) | 0 (0.0%) |
| 5 to 17 Years | 0 (0.0%) | 0 (0.0%) |
| 18 to 34 Years | 0 (0.0%) | 0 (0.0%) |
| 35 to 64 Years | 1 (1.5%) | 2 (2.4%) |
| 65 to 74 Years | 0 (0.0%) | 0 (0.0%) |
| 75 Years and over | 5 (35.7%) | 1 (2.7%) |
Disability Class: Vision Difficulty

| Age Bracket | Male | Female |
| Under 5 Years | 0 (0.0%) | 0 (0.0%) |
| 5 to 17 Years | 0 (0.0%) | 0 (0.0%) |
| 18 to 34 Years | 0 (0.0%) | 0 (0.0%) |
| 35 to 64 Years | 0 (0.0%) | 0 (0.0%) |
| 65 to 74 Years | 0 (0.0%) | 1 (2.3%) |
| 75 Years and over | 0 (0.0%) | 2 (5.4%) |
Disability Class: Cognitive Difficulty
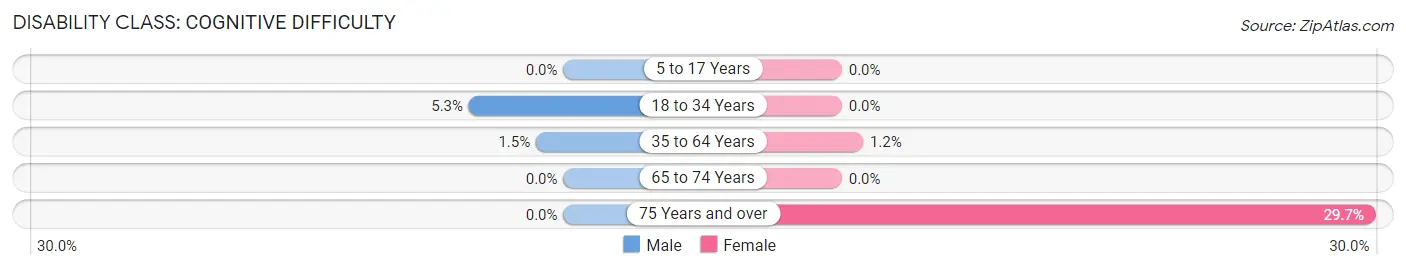
| Age Bracket | Male | Female |
| 5 to 17 Years | 0 (0.0%) | 0 (0.0%) |
| 18 to 34 Years | 1 (5.3%) | 0 (0.0%) |
| 35 to 64 Years | 1 (1.5%) | 1 (1.2%) |
| 65 to 74 Years | 0 (0.0%) | 0 (0.0%) |
| 75 Years and over | 0 (0.0%) | 11 (29.7%) |
Disability Class: Ambulatory Difficulty
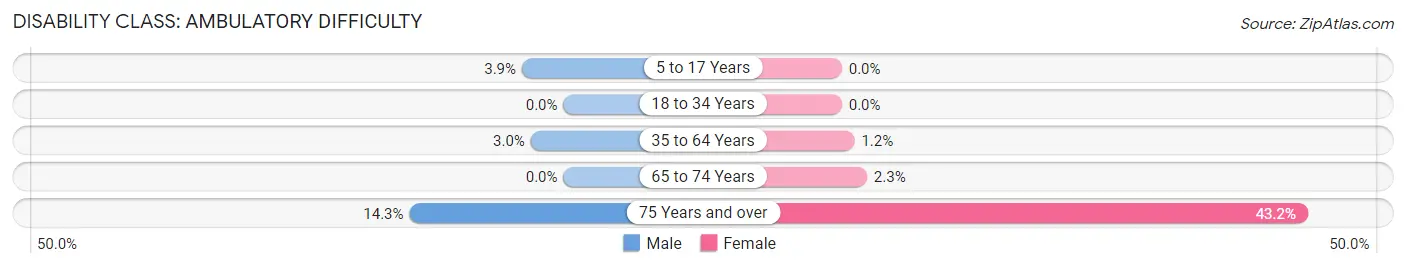
| Age Bracket | Male | Female |
| 5 to 17 Years | 1 (3.8%) | 0 (0.0%) |
| 18 to 34 Years | 0 (0.0%) | 0 (0.0%) |
| 35 to 64 Years | 2 (3.0%) | 1 (1.2%) |
| 65 to 74 Years | 0 (0.0%) | 1 (2.3%) |
| 75 Years and over | 2 (14.3%) | 16 (43.2%) |
Disability Class: Self-Care Difficulty
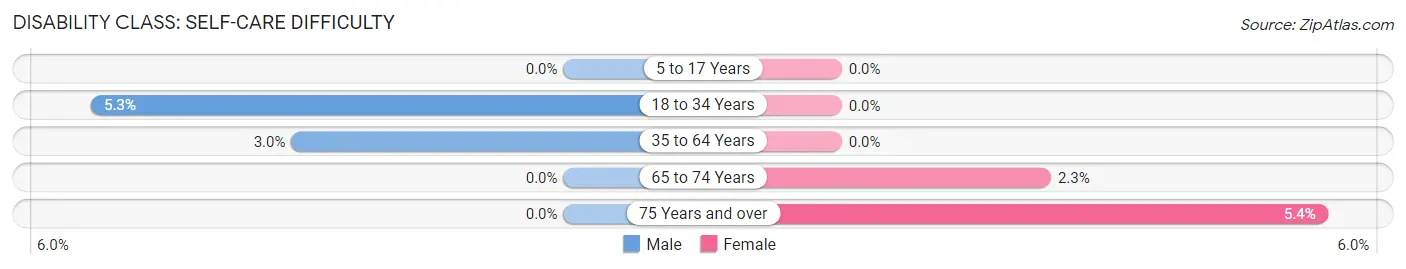
| Age Bracket | Male | Female |
| 5 to 17 Years | 0 (0.0%) | 0 (0.0%) |
| 18 to 34 Years | 1 (5.3%) | 0 (0.0%) |
| 35 to 64 Years | 2 (3.0%) | 0 (0.0%) |
| 65 to 74 Years | 0 (0.0%) | 1 (2.3%) |
| 75 Years and over | 0 (0.0%) | 2 (5.4%) |
Technology Access in Old Brownsboro Place
Computing Device Access in Old Brownsboro Place
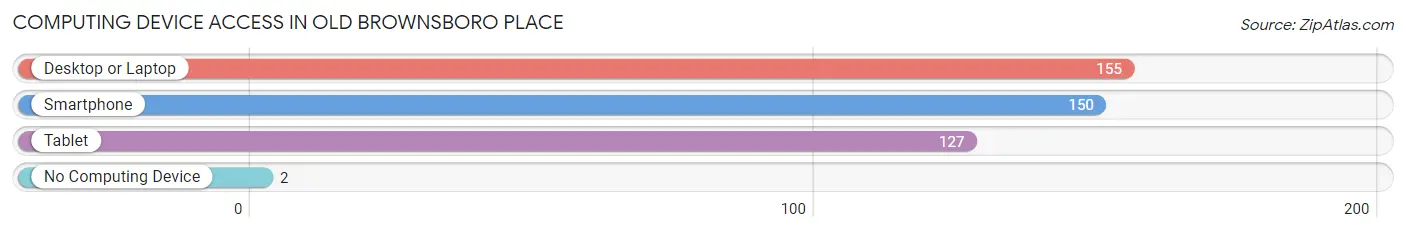
| Device Type | # Households | % Households |
| Desktop or Laptop | 155 | 98.1% |
| Smartphone | 150 | 94.9% |
| Tablet | 127 | 80.4% |
| No Computing Device | 2 | 1.3% |
| Total | 158 | 100.0% |
Internet Access in Old Brownsboro Place
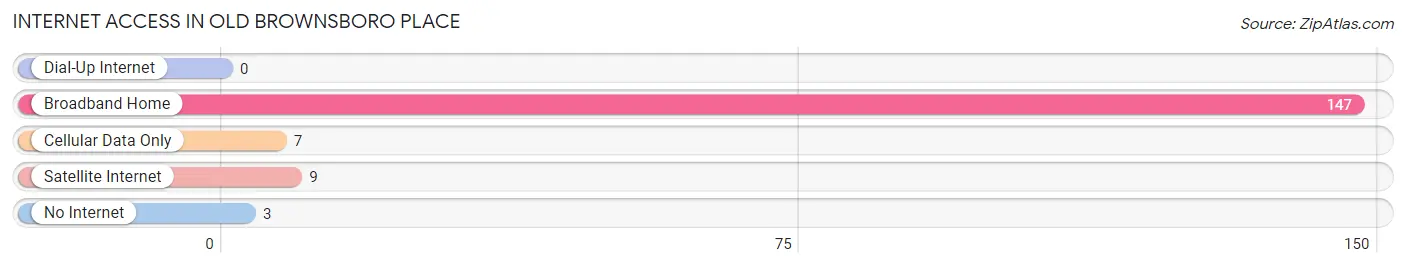
| Internet Type | # Households | % Households |
| Dial-Up Internet | 0 | 0.0% |
| Broadband Home | 147 | 93.0% |
| Cellular Data Only | 7 | 4.4% |
| Satellite Internet | 9 | 5.7% |
| No Internet | 3 | 1.9% |
| Total | 158 | 100.0% |
Old Brownsboro Place Summary
Old Brownsboro Place is a small city located in the state of Kentucky, United States. It is situated in the northeastern part of the state, in Jefferson County, and is part of the Louisville metropolitan area. The city has a population of approximately 4,000 people, and is known for its small-town charm and close-knit community.
History
Old Brownsboro Place was founded in the late 1800s by a group of settlers from the nearby city of Brownsboro. The settlers were looking for a place to call home and found the area to be ideal for farming and raising livestock. The town was originally known as Brownsboro Place, but the name was changed to Old Brownsboro Place in the early 1900s.
The city was incorporated in 1912 and has remained a small, rural community ever since. The city has seen some growth in recent years, with the addition of several new businesses and residential developments.
Geography
Old Brownsboro Place is located in the northeastern part of Jefferson County, Kentucky. It is situated on the banks of the Ohio River, and is bordered by the cities of Prospect and Harrods Creek. The city covers an area of approximately 4.5 square miles, and has a population density of 890 people per square mile.
The city is located in a hilly region, with the highest point being the summit of Old Brownsboro Hill, which is located at an elevation of 845 feet. The city is also home to several small creeks and streams, including Harrods Creek, which flows through the city.
Economy
Old Brownsboro Place has a strong economy, with a variety of businesses and industries located in the city. The city is home to several manufacturing companies, including a furniture factory, a printing company, and a plastics manufacturer. The city also has a number of retail stores, restaurants, and other businesses.
The city is also home to several educational institutions, including a community college and a technical school. The city is also home to a number of medical facilities, including a hospital and several clinics.
Demographics
As of the 2010 census, Old Brownsboro Place had a population of 4,000 people. The racial makeup of the city was 94.3% White, 2.2% African American, 0.7% Asian, 0.3% Native American, and 2.5% from other races. The median household income was $45,000, and the median family income was $50,000.
The city has a large number of elderly residents, with nearly 20% of the population over the age of 65. The city also has a large number of children, with nearly 30% of the population under the age of 18. The city has a low unemployment rate, with only 4.2% of the population unemployed.
Conclusion
Old Brownsboro Place is a small city located in the northeastern part of Jefferson County, Kentucky. The city has a population of approximately 4,000 people, and is known for its small-town charm and close-knit community. The city has a strong economy, with a variety of businesses and industries located in the city. The city also has a large number of elderly residents, with nearly 20% of the population over the age of 65. The city has a low unemployment rate, with only 4.2% of the population unemployed. Old Brownsboro Place is a great place to live, work, and raise a family.
Common Questions
What is Per Capita Income in Old Brownsboro Place?
Per Capita income in Old Brownsboro Place is $63,794.
What is the Median Family Income in Old Brownsboro Place?
Median Family Income in Old Brownsboro Place is $146,500.
What is the Median Household income in Old Brownsboro Place?
Median Household Income in Old Brownsboro Place is $145,750.
What is Income or Wage Gap in Old Brownsboro Place?
Income or Wage Gap in Old Brownsboro Place is 45.1%.
Women in Old Brownsboro Place earn 54.9 cents for every dollar earned by a man.
What is Inequality or Gini Index in Old Brownsboro Place?
Inequality or Gini Index in Old Brownsboro Place is 0.36.
What is the Total Population of Old Brownsboro Place?
Total Population of Old Brownsboro Place is 384.
What is the Total Male Population of Old Brownsboro Place?
Total Male Population of Old Brownsboro Place is 180.
What is the Total Female Population of Old Brownsboro Place?
Total Female Population of Old Brownsboro Place is 204.
What is the Ratio of Males per 100 Females in Old Brownsboro Place?
There are 88.24 Males per 100 Females in Old Brownsboro Place.
What is the Ratio of Females per 100 Males in Old Brownsboro Place?
There are 113.33 Females per 100 Males in Old Brownsboro Place.
What is the Median Population Age in Old Brownsboro Place?
Median Population Age in Old Brownsboro Place is 55.8 Years.
What is the Average Family Size in Old Brownsboro Place
Average Family Size in Old Brownsboro Place is 2.6 People.
What is the Average Household Size in Old Brownsboro Place
Average Household Size in Old Brownsboro Place is 2.4 People.
How Large is the Labor Force in Old Brownsboro Place?
There are 177 People in the Labor Forcein in Old Brownsboro Place.
What is the Percentage of People in the Labor Force in Old Brownsboro Place?
53.3% of People are in the Labor Force in Old Brownsboro Place.
What is the Unemployment Rate in Old Brownsboro Place?
Unemployment Rate in Old Brownsboro Place is 2.3%.