Grayson, KY Map & Demographics
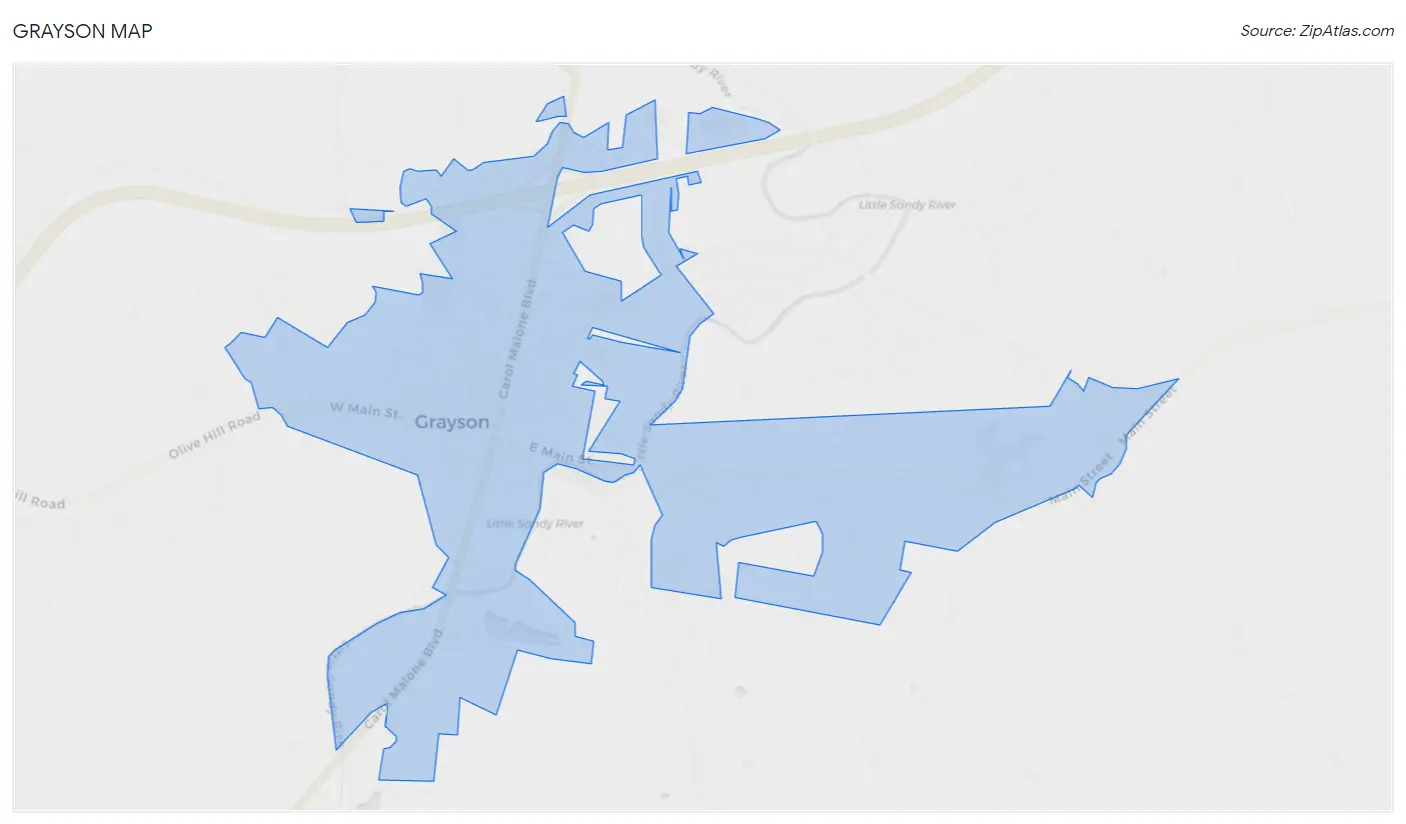
Grayson Map
Grayson Overview
$17,077
PER CAPITA INCOME
$40,417
AVG FAMILY INCOME
$27,045
AVG HOUSEHOLD INCOME
30.3%
WAGE / INCOME GAP [ % ]
69.7¢/ $1
WAGE / INCOME GAP [ $ ]
0.54
INEQUALITY / GINI INDEX
3,841
TOTAL POPULATION
2,033
MALE POPULATION
1,808
FEMALE POPULATION
112.44
MALES / 100 FEMALES
88.93
FEMALES / 100 MALES
32.8
MEDIAN AGE
3.5
AVG FAMILY SIZE
2.3
AVG HOUSEHOLD SIZE
1,412
LABOR FORCE [ PEOPLE ]
44.0%
PERCENT IN LABOR FORCE
13.4%
UNEMPLOYMENT RATE
Grayson Zip Codes
Grayson Area Codes
Income in Grayson
Income Overview in Grayson
Per Capita Income in Grayson is $17,077, while median incomes of families and households are $40,417 and $27,045 respectively.
| Characteristic | Number | Measure |
| Per Capita Income | 3,841 | $17,077 |
| Median Family Income | 718 | $40,417 |
| Mean Family Income | 718 | $58,026 |
| Median Household Income | 1,364 | $27,045 |
| Mean Household Income | 1,364 | $42,499 |
| Income Deficit | 718 | $0 |
| Wage / Income Gap (%) | 3,841 | 30.35% |
| Wage / Income Gap ($) | 3,841 | 69.65¢ per $1 |
| Gini / Inequality Index | 3,841 | 0.54 |
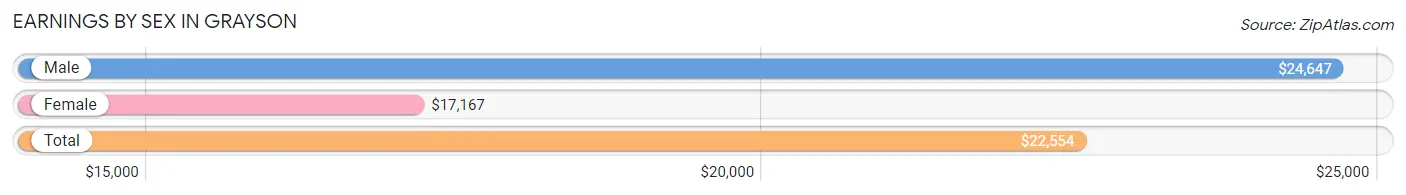
Earnings by Sex in Grayson
Average Earnings in Grayson are $22,554, $24,647 for men and $17,167 for women, a difference of 30.3%.
| Sex | Number | Average Earnings |
| Male | 822 (57.3%) | $24,647 |
| Female | 612 (42.7%) | $17,167 |
| Total | 1,434 (100.0%) | $22,554 |
Earnings by Sex by Income Bracket in Grayson
The most common earnings brackets in Grayson are $45,000 to $49,999 for men (157 | 19.1%) and $15,000 to $17,499 for women (90 | 14.7%).
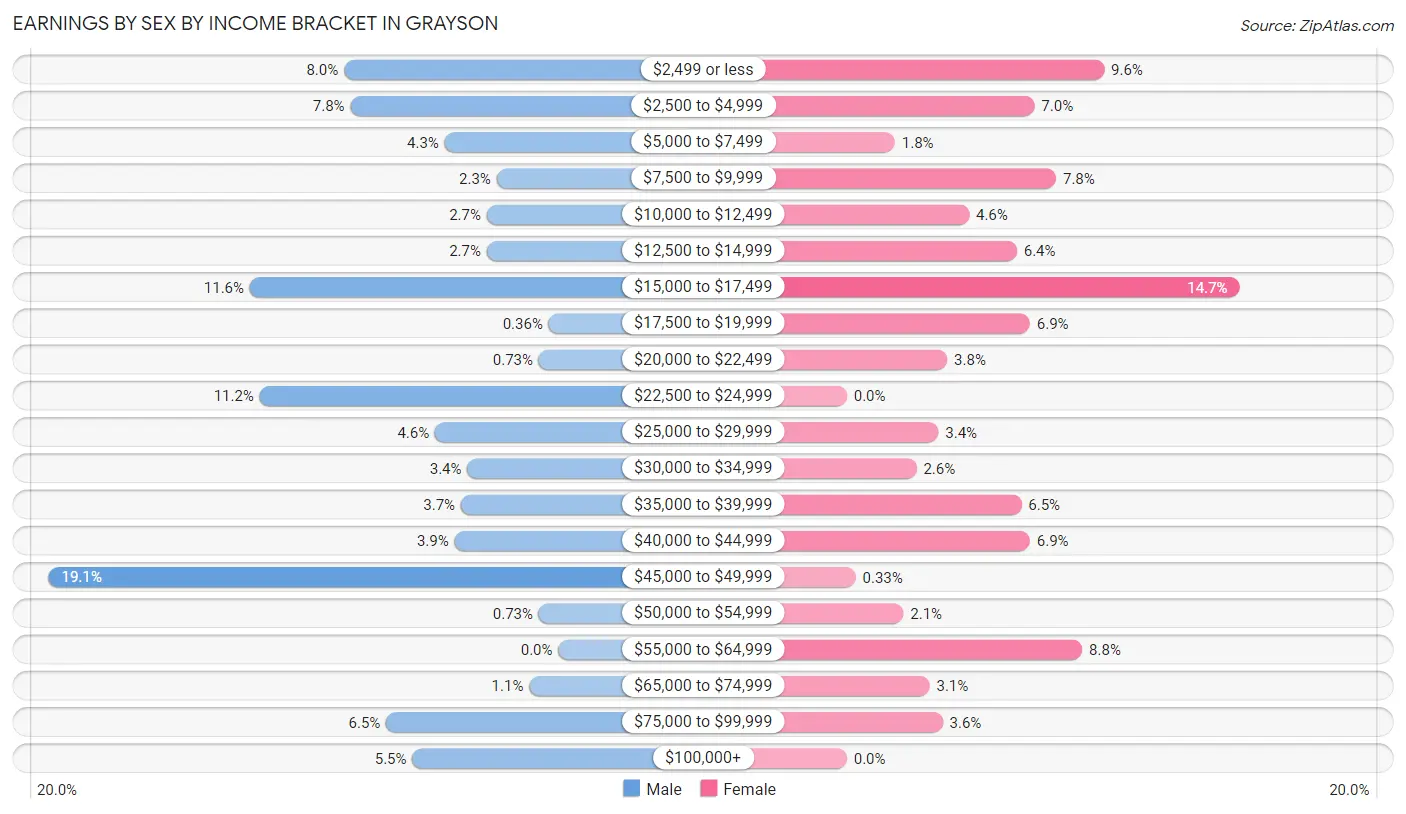
| Income | Male | Female |
| $2,499 or less | 66 (8.0%) | 59 (9.6%) |
| $2,500 to $4,999 | 64 (7.8%) | 43 (7.0%) |
| $5,000 to $7,499 | 35 (4.3%) | 11 (1.8%) |
| $7,500 to $9,999 | 19 (2.3%) | 48 (7.8%) |
| $10,000 to $12,499 | 22 (2.7%) | 28 (4.6%) |
| $12,500 to $14,999 | 22 (2.7%) | 39 (6.4%) |
| $15,000 to $17,499 | 95 (11.6%) | 90 (14.7%) |
| $17,500 to $19,999 | 3 (0.4%) | 42 (6.9%) |
| $20,000 to $22,499 | 6 (0.7%) | 23 (3.8%) |
| $22,500 to $24,999 | 92 (11.2%) | 0 (0.0%) |
| $25,000 to $29,999 | 38 (4.6%) | 21 (3.4%) |
| $30,000 to $34,999 | 28 (3.4%) | 16 (2.6%) |
| $35,000 to $39,999 | 30 (3.6%) | 40 (6.5%) |
| $40,000 to $44,999 | 32 (3.9%) | 42 (6.9%) |
| $45,000 to $49,999 | 157 (19.1%) | 2 (0.3%) |
| $50,000 to $54,999 | 6 (0.7%) | 13 (2.1%) |
| $55,000 to $64,999 | 0 (0.0%) | 54 (8.8%) |
| $65,000 to $74,999 | 9 (1.1%) | 19 (3.1%) |
| $75,000 to $99,999 | 53 (6.5%) | 22 (3.6%) |
| $100,000+ | 45 (5.5%) | 0 (0.0%) |
| Total | 822 (100.0%) | 612 (100.0%) |
Earnings by Sex by Educational Attainment in Grayson
Average earnings in Grayson are $36,111 for men and $28,988 for women, a difference of 19.7%. Men with an educational attainment of bachelor's degree enjoy the highest average annual earnings of $95,893, while those with high school diploma education earn the least with $39,643. Women with an educational attainment of high school diploma earn the most with the average annual earnings of $19,613, while those with high school diploma education have the smallest earnings of $19,613.
| Educational Attainment | Male Income | Female Income |
| Less than High School | - | - |
| High School Diploma | $39,643 | $19,613 |
| College or Associate's Degree | - | - |
| Bachelor's Degree | $95,893 | $0 |
| Graduate Degree | - | - |
| Total | $36,111 | $28,988 |
Family Income in Grayson
Family Income Brackets in Grayson
According to the Grayson family income data, there are 190 families falling into the $100,000 to $149,999 income range, which is the most common income bracket and makes up 26.5% of all families.
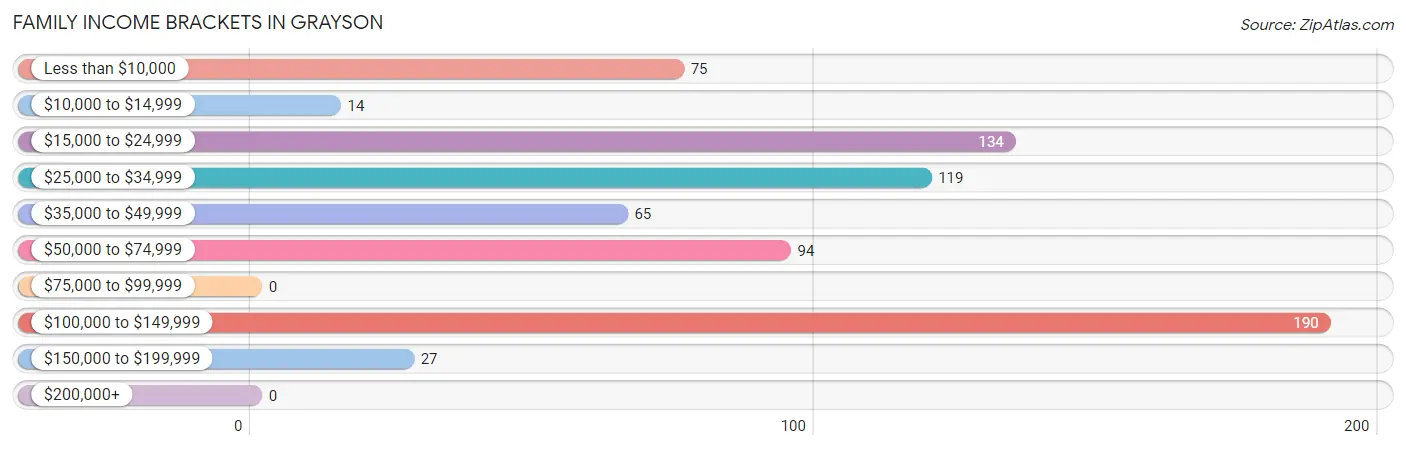
| Income Bracket | # Families | % Families |
| Less than $10,000 | 75 | 10.4% |
| $10,000 to $14,999 | 14 | 1.9% |
| $15,000 to $24,999 | 134 | 18.7% |
| $25,000 to $34,999 | 119 | 16.6% |
| $35,000 to $49,999 | 65 | 9.1% |
| $50,000 to $74,999 | 94 | 13.1% |
| $75,000 to $99,999 | 0 | 0.0% |
| $100,000 to $149,999 | 190 | 26.5% |
| $150,000 to $199,999 | 27 | 3.8% |
| $200,000+ | 0 | 0.0% |
Family Income by Famaliy Size in Grayson
2-person families (292 | 40.7%) account for the highest median family income in Grayson with $57,875 per family, while 2-person families (292 | 40.7%) have the highest median income of $28,938 per family member.
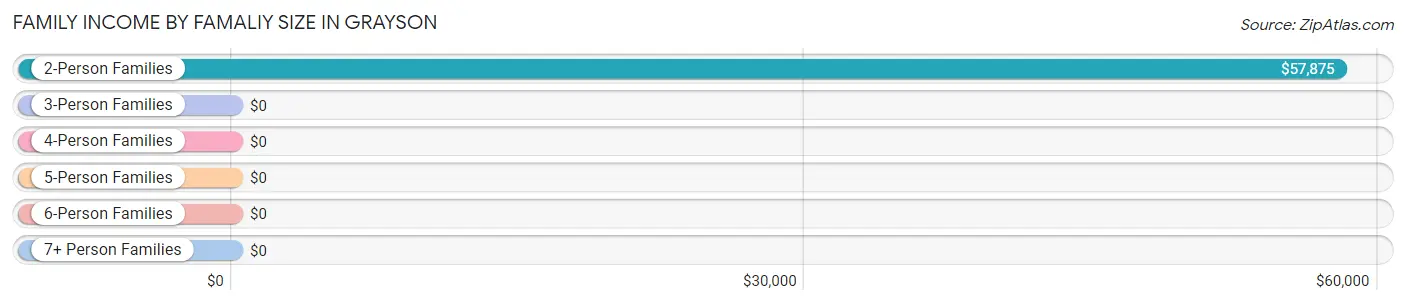
| Income Bracket | # Families | Median Income |
| 2-Person Families | 292 (40.7%) | $57,875 |
| 3-Person Families | 140 (19.5%) | $0 |
| 4-Person Families | 141 (19.6%) | $0 |
| 5-Person Families | 104 (14.5%) | $0 |
| 6-Person Families | 0 (0.0%) | $0 |
| 7+ Person Families | 41 (5.7%) | $0 |
| Total | 718 (100.0%) | $40,417 |
Family Income by Number of Earners in Grayson
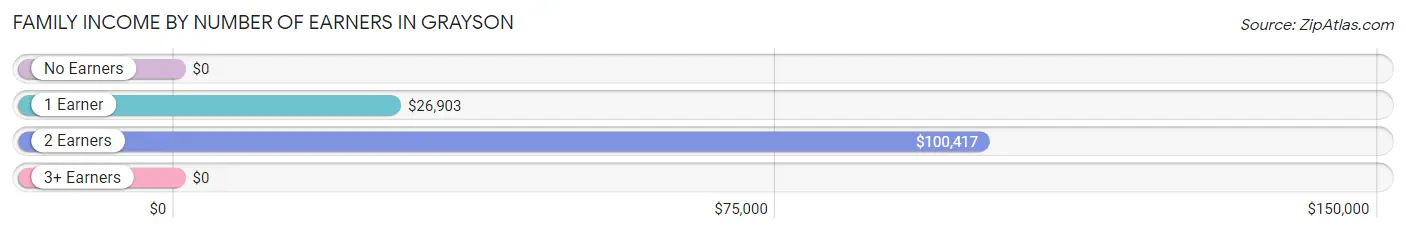
| Number of Earners | # Families | Median Income |
| No Earners | 203 (28.3%) | $0 |
| 1 Earner | 300 (41.8%) | $26,903 |
| 2 Earners | 176 (24.5%) | $100,417 |
| 3+ Earners | 39 (5.4%) | $0 |
| Total | 718 (100.0%) | $40,417 |
Household Income in Grayson
Household Income Brackets in Grayson
With 359 households falling in the category, the less than $10,000 income range is the most frequent in Grayson, accounting for 26.3% of all households.
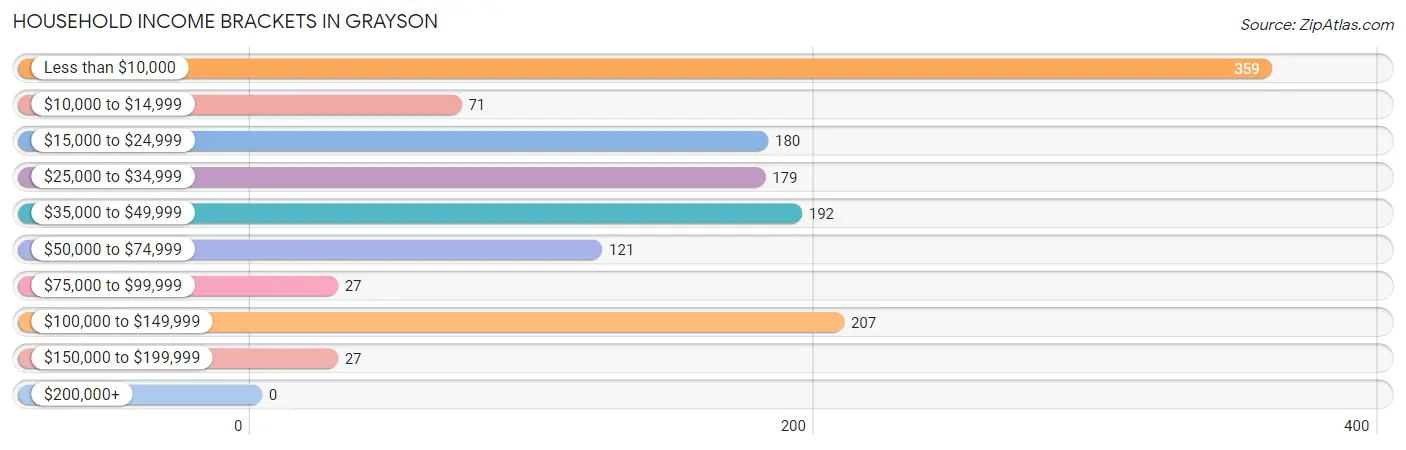
| Income Bracket | # Households | % Households |
| Less than $10,000 | 359 | 26.3% |
| $10,000 to $14,999 | 71 | 5.2% |
| $15,000 to $24,999 | 180 | 13.2% |
| $25,000 to $34,999 | 179 | 13.1% |
| $35,000 to $49,999 | 192 | 14.1% |
| $50,000 to $74,999 | 121 | 8.9% |
| $75,000 to $99,999 | 27 | 2.0% |
| $100,000 to $149,999 | 207 | 15.2% |
| $150,000 to $199,999 | 27 | 2.0% |
| $200,000+ | 0 | 0.0% |
Household Income by Householder Age in Grayson
The median household income in Grayson is $27,045, with the highest median household income of $45,428 found in the 45 to 64 years age bracket for the primary householder. A total of 533 households (39.1%) fall into this category. Meanwhile, the 15 to 24 years age bracket for the primary householder has the lowest median household income of $0, with 28 households (2.1%) in this group.
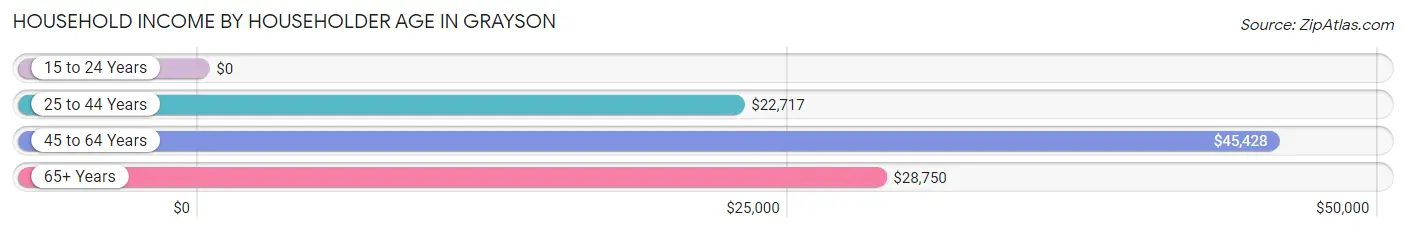
| Income Bracket | # Households | Median Income |
| 15 to 24 Years | 28 (2.1%) | $0 |
| 25 to 44 Years | 474 (34.7%) | $22,717 |
| 45 to 64 Years | 533 (39.1%) | $45,428 |
| 65+ Years | 329 (24.1%) | $28,750 |
| Total | 1,364 (100.0%) | $27,045 |
Poverty in Grayson
Income Below Poverty by Sex and Age in Grayson
With 49.9% poverty level for males and 50.8% for females among the residents of Grayson, 6 to 11 year old males and 6 to 11 year old females are the most vulnerable to poverty, with 251 males (100.0%) and 38 females (100.0%) in their respective age groups living below the poverty level.
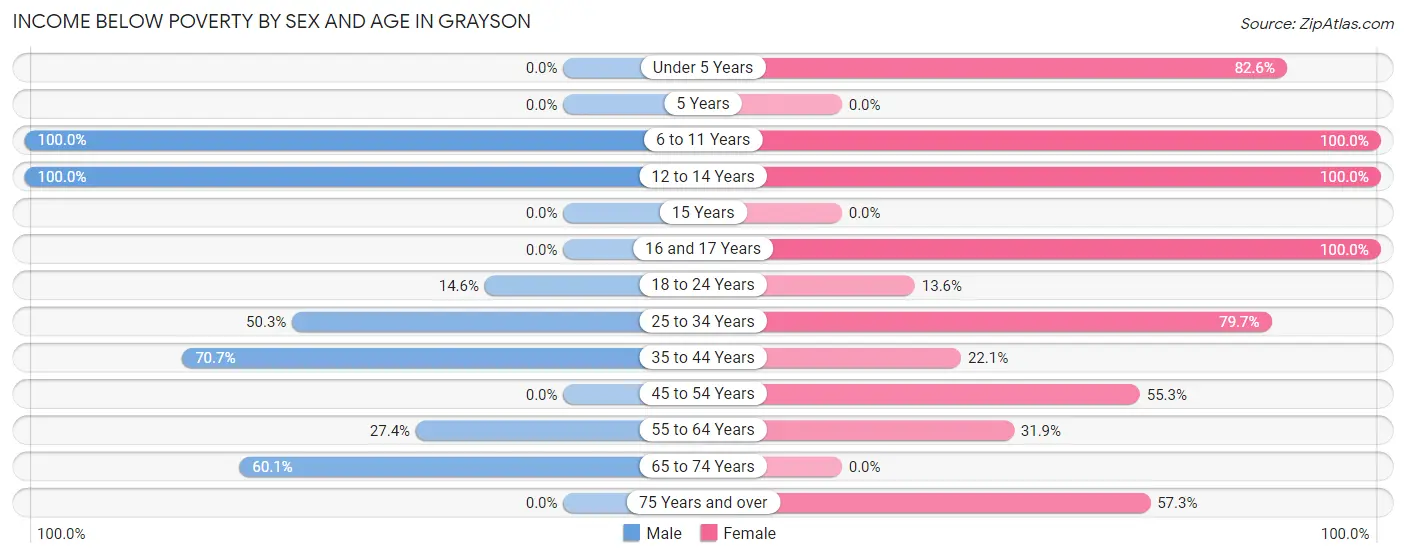
| Age Bracket | Male | Female |
| Under 5 Years | 0 (0.0%) | 128 (82.6%) |
| 5 Years | 0 (0.0%) | 0 (0.0%) |
| 6 to 11 Years | 251 (100.0%) | 38 (100.0%) |
| 12 to 14 Years | 59 (100.0%) | 55 (100.0%) |
| 15 Years | 0 (0.0%) | 0 (0.0%) |
| 16 and 17 Years | 0 (0.0%) | 17 (100.0%) |
| 18 to 24 Years | 14 (14.6%) | 8 (13.6%) |
| 25 to 34 Years | 222 (50.3%) | 232 (79.7%) |
| 35 to 44 Years | 145 (70.7%) | 23 (22.1%) |
| 45 to 54 Years | 0 (0.0%) | 78 (55.3%) |
| 55 to 64 Years | 49 (27.4%) | 107 (31.9%) |
| 65 to 74 Years | 101 (60.1%) | 0 (0.0%) |
| 75 Years and over | 0 (0.0%) | 79 (57.3%) |
| Total | 841 (49.9%) | 765 (50.8%) |
Income Above Poverty by Sex and Age in Grayson
According to the poverty statistics in Grayson, males aged under 5 years and females aged 65 to 74 years are the age groups that are most secure financially, with 100.0% of males and 100.0% of females in these age groups living above the poverty line.
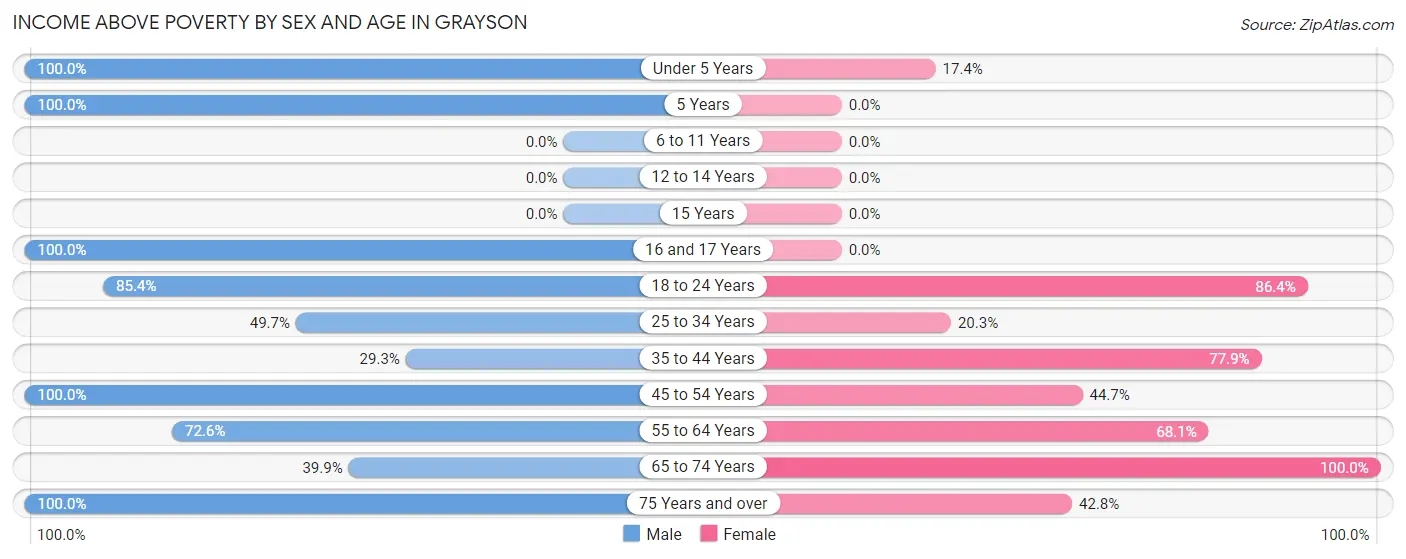
| Age Bracket | Male | Female |
| Under 5 Years | 68 (100.0%) | 27 (17.4%) |
| 5 Years | 6 (100.0%) | 0 (0.0%) |
| 6 to 11 Years | 0 (0.0%) | 0 (0.0%) |
| 12 to 14 Years | 0 (0.0%) | 0 (0.0%) |
| 15 Years | 0 (0.0%) | 0 (0.0%) |
| 16 and 17 Years | 23 (100.0%) | 0 (0.0%) |
| 18 to 24 Years | 82 (85.4%) | 51 (86.4%) |
| 25 to 34 Years | 219 (49.7%) | 59 (20.3%) |
| 35 to 44 Years | 60 (29.3%) | 81 (77.9%) |
| 45 to 54 Years | 134 (100.0%) | 63 (44.7%) |
| 55 to 64 Years | 130 (72.6%) | 228 (68.1%) |
| 65 to 74 Years | 67 (39.9%) | 174 (100.0%) |
| 75 Years and over | 55 (100.0%) | 59 (42.7%) |
| Total | 844 (50.1%) | 742 (49.2%) |
Income Below Poverty Among Married-Couple Families in Grayson
The poverty statistics for married-couple families in Grayson show that 45.3% or 214 of the total 472 families live below the poverty line. Families with 3 or 4 children have the highest poverty rate of 100.0%, comprising of 84 families. On the other hand, families with no children have the lowest poverty rate of 14.9%, which includes 28 families.
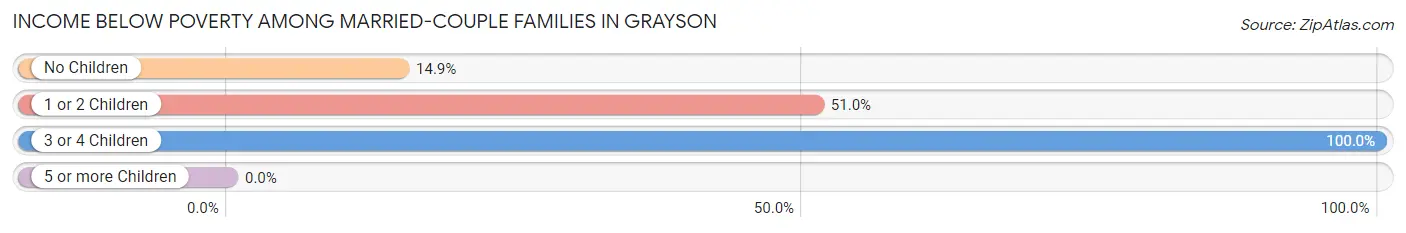
| Children | Above Poverty | Below Poverty |
| No Children | 160 (85.1%) | 28 (14.9%) |
| 1 or 2 Children | 98 (49.0%) | 102 (51.0%) |
| 3 or 4 Children | 0 (0.0%) | 84 (100.0%) |
| 5 or more Children | 0 (0.0%) | 0 (0.0%) |
| Total | 258 (54.7%) | 214 (45.3%) |
Income Below Poverty Among Single-Parent Households in Grayson
According to the poverty data in Grayson, 75.3% or 55 single-father households and 24.3% or 42 single-mother households are living below the poverty line. Among single-father households, those with 1 or 2 children have the highest poverty rate, with 14 households (100.0%) experiencing poverty. Likewise, among single-mother households, those with 1 or 2 children have the highest poverty rate, with 42 households (67.7%) falling below the poverty line.
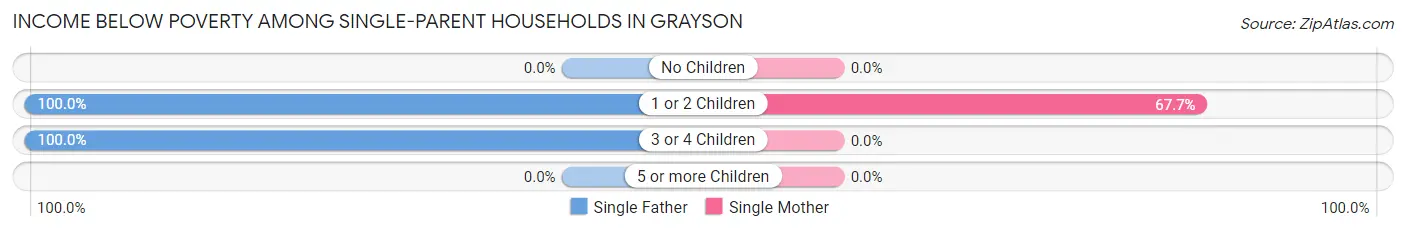
| Children | Single Father | Single Mother |
| No Children | 0 (0.0%) | 0 (0.0%) |
| 1 or 2 Children | 14 (100.0%) | 42 (67.7%) |
| 3 or 4 Children | 41 (100.0%) | 0 (0.0%) |
| 5 or more Children | 0 (0.0%) | 0 (0.0%) |
| Total | 55 (75.3%) | 42 (24.3%) |
Income Below Poverty Among Married-Couple vs Single-Parent Households in Grayson
The poverty data for Grayson shows that 214 of the married-couple family households (45.3%) and 97 of the single-parent households (39.4%) are living below the poverty level. Within the married-couple family households, those with 3 or 4 children have the highest poverty rate, with 84 households (100.0%) falling below the poverty line. Among the single-parent households, those with 3 or 4 children have the highest poverty rate, with 41 household (100.0%) living below poverty.
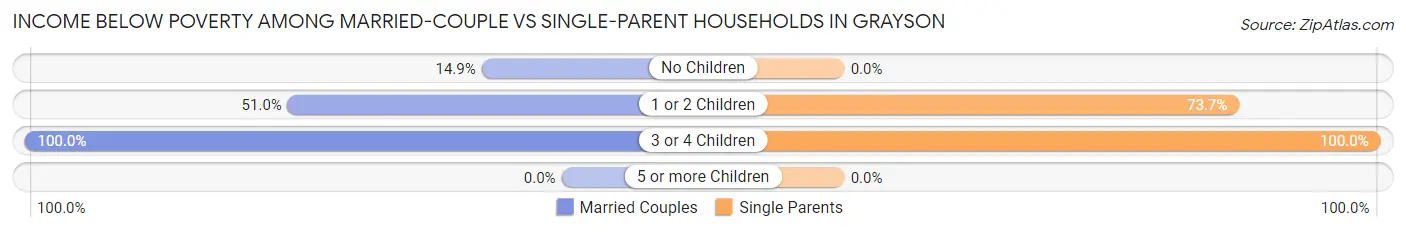
| Children | Married-Couple Families | Single-Parent Households |
| No Children | 28 (14.9%) | 0 (0.0%) |
| 1 or 2 Children | 102 (51.0%) | 56 (73.7%) |
| 3 or 4 Children | 84 (100.0%) | 41 (100.0%) |
| 5 or more Children | 0 (0.0%) | 0 (0.0%) |
| Total | 214 (45.3%) | 97 (39.4%) |
Race in Grayson
The most populous races in Grayson are White / Caucasian (3,555 | 92.5%), Two or more Races (169 | 4.4%), and Black / African American (104 | 2.7%).
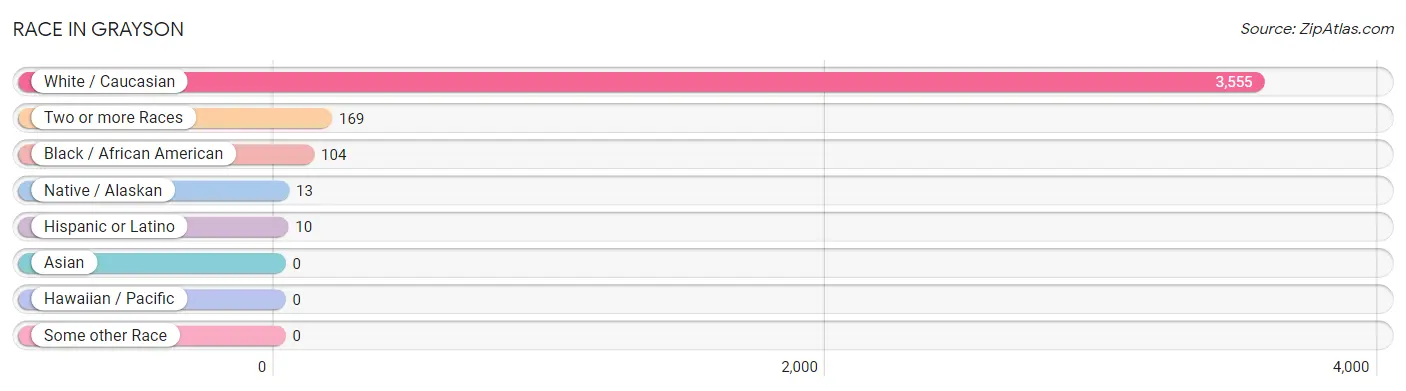
| Race | # Population | % Population |
| Asian | 0 | 0.0% |
| Black / African American | 104 | 2.7% |
| Hawaiian / Pacific | 0 | 0.0% |
| Hispanic or Latino | 10 | 0.3% |
| Native / Alaskan | 13 | 0.3% |
| White / Caucasian | 3,555 | 92.5% |
| Two or more Races | 169 | 4.4% |
| Some other Race | 0 | 0.0% |
| Total | 3,841 | 100.0% |
Ancestry in Grayson
The most populous ancestries reported in Grayson are English (943 | 24.5%), American (628 | 16.4%), German (318 | 8.3%), Scotch-Irish (218 | 5.7%), and Irish (205 | 5.3%), together accounting for 60.2% of all Grayson residents.
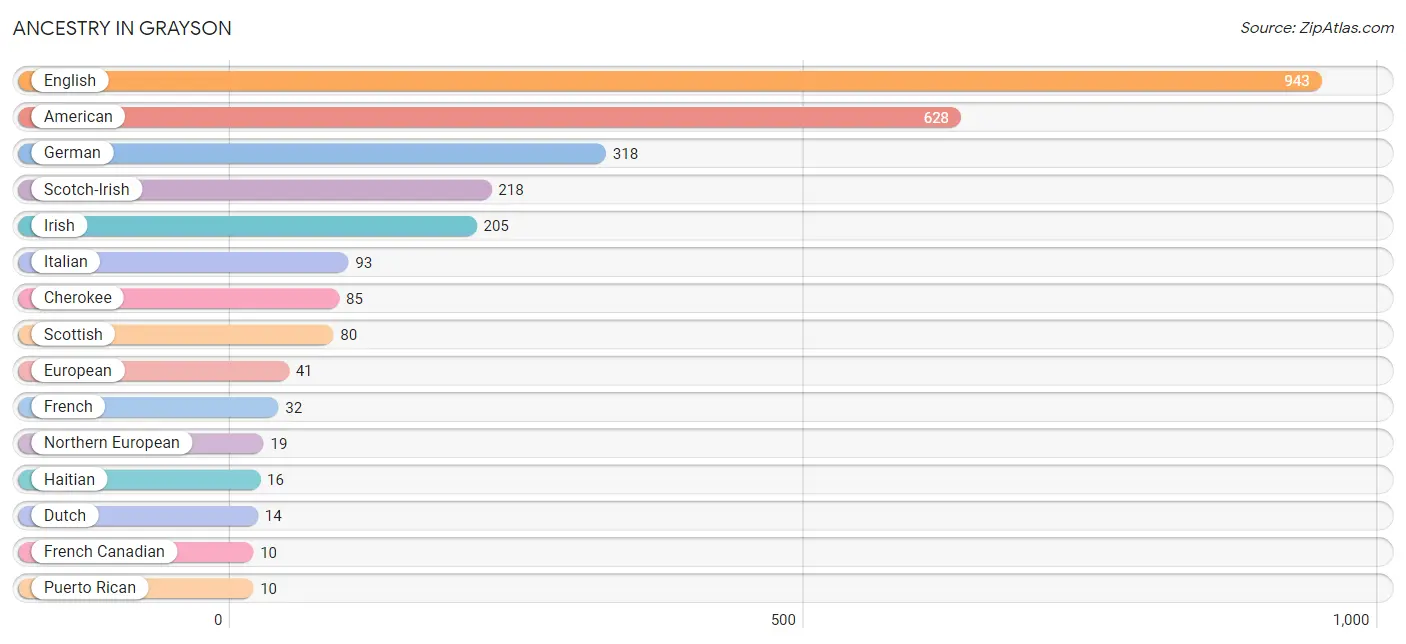
| Ancestry | # Population | % Population |
| African | 4 | 0.1% |
| American | 628 | 16.4% |
| Arab | 4 | 0.1% |
| Bahamian | 3 | 0.1% |
| Blackfeet | 3 | 0.1% |
| British | 8 | 0.2% |
| Cherokee | 85 | 2.2% |
| Dutch | 14 | 0.4% |
| English | 943 | 24.5% |
| European | 41 | 1.1% |
| French | 32 | 0.8% |
| French Canadian | 10 | 0.3% |
| German | 318 | 8.3% |
| Haitian | 16 | 0.4% |
| Hungarian | 9 | 0.2% |
| Irish | 205 | 5.3% |
| Israeli | 6 | 0.2% |
| Italian | 93 | 2.4% |
| Northern European | 19 | 0.5% |
| Polish | 6 | 0.2% |
| Puerto Rican | 10 | 0.3% |
| Scotch-Irish | 218 | 5.7% |
| Scottish | 80 | 2.1% |
| Subsaharan African | 4 | 0.1% |
| Welsh | 3 | 0.1% | View All 25 Rows |
Immigrants in Grayson
The most numerous immigrant groups reported in Grayson came from Asia (4 | 0.1%), Israel (4 | 0.1%), and Western Asia (4 | 0.1%), together accounting for 0.3% of all Grayson residents.
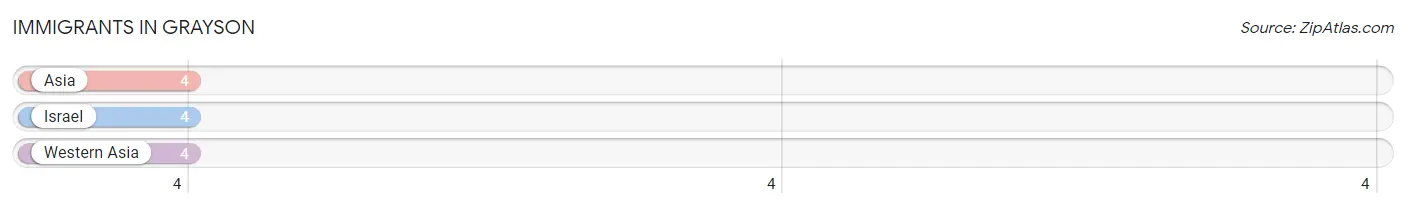
| Immigration Origin | # Population | % Population |
| Asia | 4 | 0.1% |
| Israel | 4 | 0.1% |
| Western Asia | 4 | 0.1% | View All 3 Rows |
Sex and Age in Grayson
Sex and Age in Grayson
The most populous age groups in Grayson are 30 to 34 Years (295 | 14.5%) for men and 60 to 64 Years (187 | 10.3%) for women.
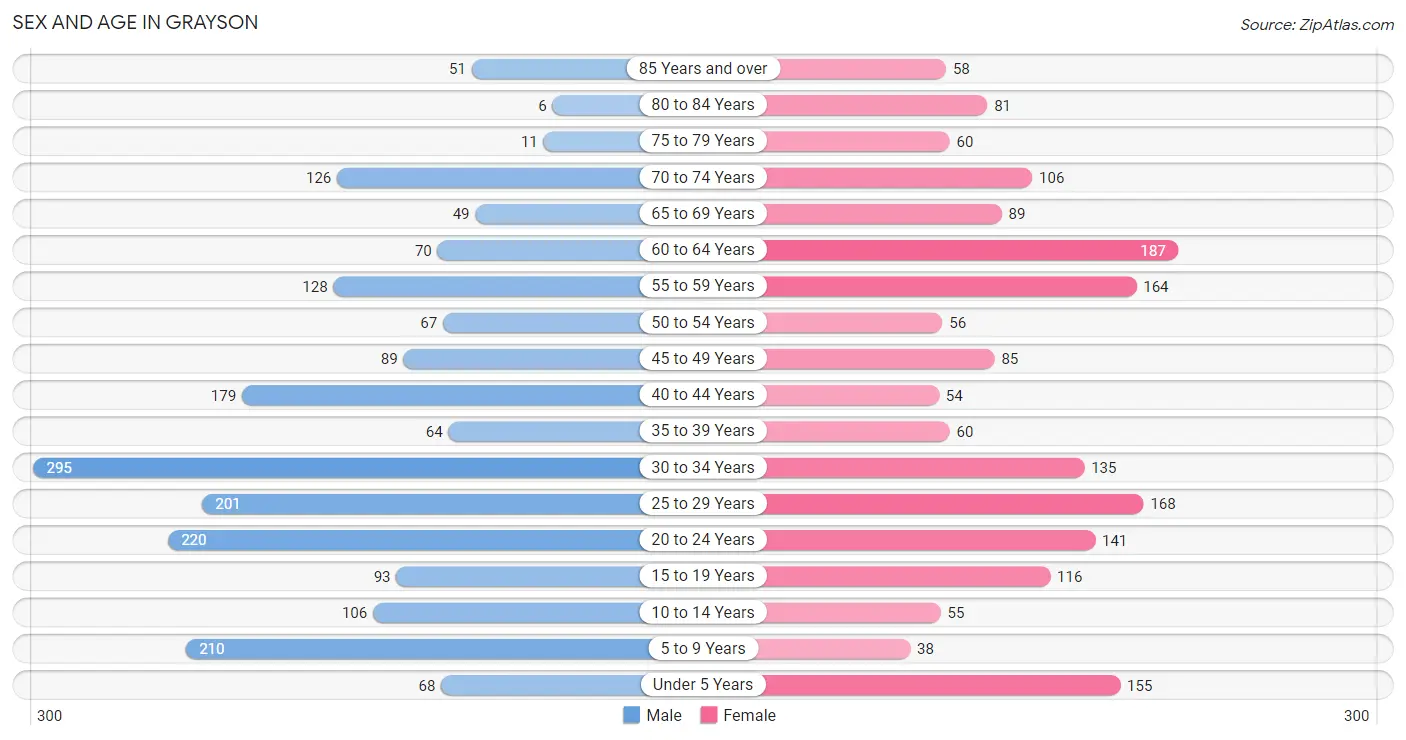
| Age Bracket | Male | Female |
| Under 5 Years | 68 (3.3%) | 155 (8.6%) |
| 5 to 9 Years | 210 (10.3%) | 38 (2.1%) |
| 10 to 14 Years | 106 (5.2%) | 55 (3.0%) |
| 15 to 19 Years | 93 (4.6%) | 116 (6.4%) |
| 20 to 24 Years | 220 (10.8%) | 141 (7.8%) |
| 25 to 29 Years | 201 (9.9%) | 168 (9.3%) |
| 30 to 34 Years | 295 (14.5%) | 135 (7.5%) |
| 35 to 39 Years | 64 (3.2%) | 60 (3.3%) |
| 40 to 44 Years | 179 (8.8%) | 54 (3.0%) |
| 45 to 49 Years | 89 (4.4%) | 85 (4.7%) |
| 50 to 54 Years | 67 (3.3%) | 56 (3.1%) |
| 55 to 59 Years | 128 (6.3%) | 164 (9.1%) |
| 60 to 64 Years | 70 (3.4%) | 187 (10.3%) |
| 65 to 69 Years | 49 (2.4%) | 89 (4.9%) |
| 70 to 74 Years | 126 (6.2%) | 106 (5.9%) |
| 75 to 79 Years | 11 (0.5%) | 60 (3.3%) |
| 80 to 84 Years | 6 (0.3%) | 81 (4.5%) |
| 85 Years and over | 51 (2.5%) | 58 (3.2%) |
| Total | 2,033 (100.0%) | 1,808 (100.0%) |
Families and Households in Grayson
Median Family Size in Grayson
The median family size in Grayson is 3.49 persons per family, with single male/father families (73 | 10.2%) accounting for the largest median family size of 5.44 persons per family. On the other hand, married-couple families (472 | 65.7%) represent the smallest median family size with 3.18 persons per family.
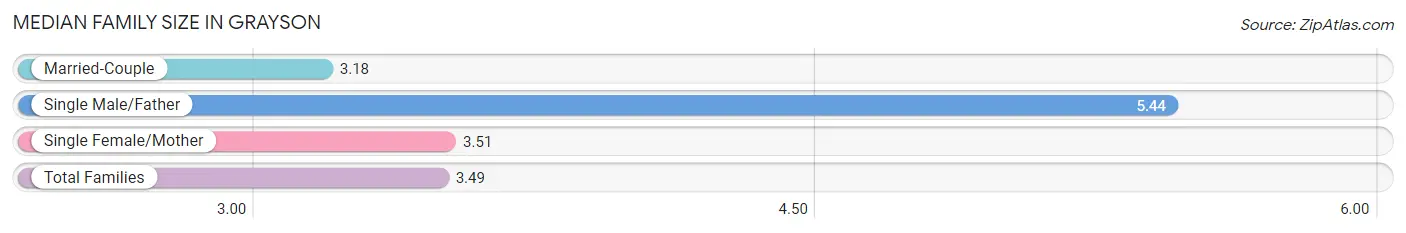
| Family Type | # Families | Family Size |
| Married-Couple | 472 (65.7%) | 3.18 |
| Single Male/Father | 73 (10.2%) | 5.44 |
| Single Female/Mother | 173 (24.1%) | 3.51 |
| Total Families | 718 (100.0%) | 3.49 |
Median Household Size in Grayson
The median household size in Grayson is 2.34 persons per household, with single male/father households (73 | 5.3%) accounting for the largest median household size of 5.44 persons per household. non-family households (646 | 47.4%) represent the smallest median household size with 1.04 persons per household.
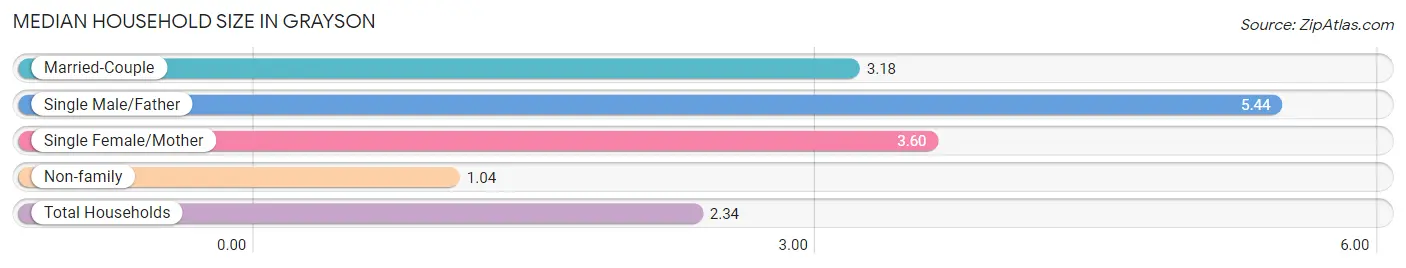
| Household Type | # Households | Household Size |
| Married-Couple | 472 (34.6%) | 3.18 |
| Single Male/Father | 73 (5.3%) | 5.44 |
| Single Female/Mother | 173 (12.7%) | 3.60 |
| Non-family | 646 (47.4%) | 1.04 |
| Total Households | 1,364 (100.0%) | 2.34 |
Household Size by Marriage Status in Grayson
Out of a total of 1,364 households in Grayson, 718 (52.6%) are family households, while 646 (47.4%) are nonfamily households. The most numerous type of family households are 2-person households, comprising 284, and the most common type of nonfamily households are 1-person households, comprising 613.
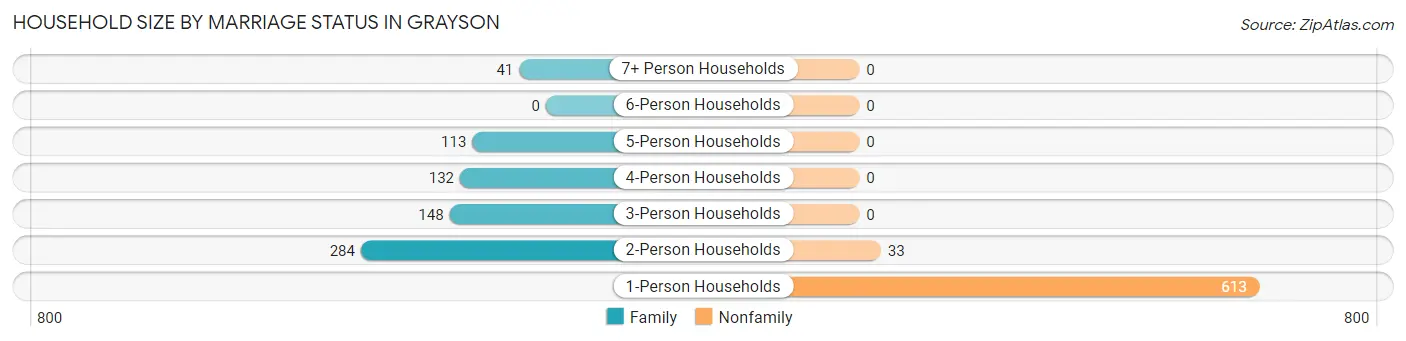
| Household Size | Family Households | Nonfamily Households |
| 1-Person Households | - | 613 (44.9%) |
| 2-Person Households | 284 (20.8%) | 33 (2.4%) |
| 3-Person Households | 148 (10.8%) | 0 (0.0%) |
| 4-Person Households | 132 (9.7%) | 0 (0.0%) |
| 5-Person Households | 113 (8.3%) | 0 (0.0%) |
| 6-Person Households | 0 (0.0%) | 0 (0.0%) |
| 7+ Person Households | 41 (3.0%) | 0 (0.0%) |
| Total | 718 (52.6%) | 646 (47.4%) |
Female Fertility in Grayson
Fertility by Age in Grayson
| Age Bracket | Women with Births | Births / 1,000 Women |
| 15 to 19 years | 0 (0.0%) | 0.0 |
| 20 to 34 years | 0 (0.0%) | 0.0 |
| 35 to 50 years | 0 (0.0%) | 0.0 |
| Total | 0 (0.0%) | 0.0 |
Fertility by Age by Marriage Status in Grayson
| Age Bracket | Married | Unmarried |
| 15 to 19 years | 0 (0.0%) | 0 (0.0%) |
| 20 to 34 years | 0 (0.0%) | 0 (0.0%) |
| 35 to 50 years | 0 (0.0%) | 0 (0.0%) |
| Total | 0 (0.0%) | 0 (0.0%) |
Fertility by Education in Grayson
| Educational Attainment | Women with Births | Births / 1,000 Women |
| Less than High School | 0 (0.0%) | 0.0 |
| High School Diploma | 0 (0.0%) | 0.0 |
| College or Associate's Degree | 0 (0.0%) | 0.0 |
| Bachelor's Degree | 0 (0.0%) | 0.0 |
| Graduate Degree | 0 (0.0%) | 0.0 |
| Total | 0 (0.0%) | 0.0 |
Fertility by Education by Marriage Status in Grayson
| Educational Attainment | Married | Unmarried |
| Less than High School | 0 (0.0%) | 0 (0.0%) |
| High School Diploma | 0 (0.0%) | 0 (0.0%) |
| College or Associate's Degree | 0 (0.0%) | 0 (0.0%) |
| Bachelor's Degree | 0 (0.0%) | 0 (0.0%) |
| Graduate Degree | 0 (0.0%) | 0 (0.0%) |
| Total | 0 (0.0%) | 0 (0.0%) |
Employment Characteristics in Grayson
Employment by Class of Employer in Grayson
Among the 1,209 employed individuals in Grayson, private company employees (969 | 80.1%), not-for-profit organizations (145 | 12.0%), and local government employees (45 | 3.7%) make up the most common classes of employment.
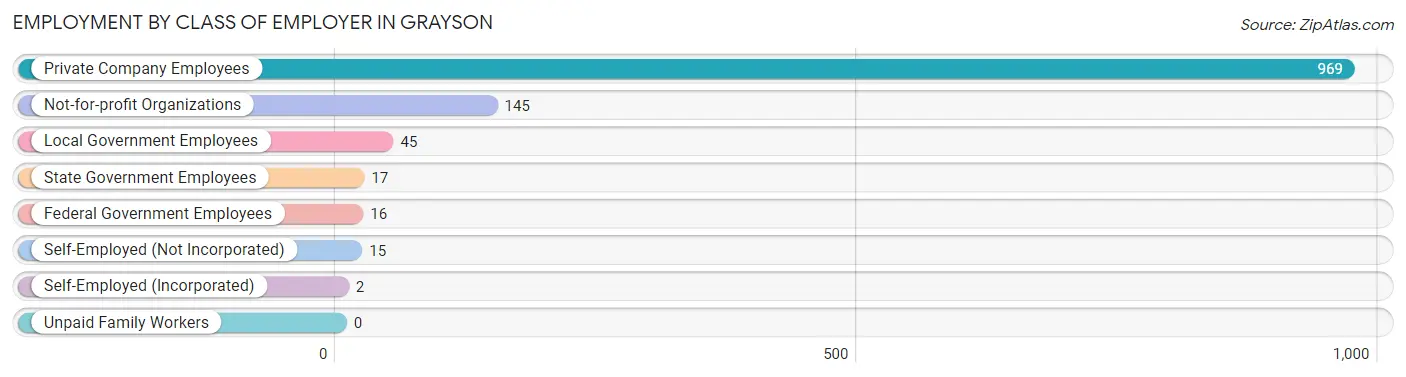
| Employer Class | # Employees | % Employees |
| Private Company Employees | 969 | 80.1% |
| Self-Employed (Incorporated) | 2 | 0.2% |
| Self-Employed (Not Incorporated) | 15 | 1.2% |
| Not-for-profit Organizations | 145 | 12.0% |
| Local Government Employees | 45 | 3.7% |
| State Government Employees | 17 | 1.4% |
| Federal Government Employees | 16 | 1.3% |
| Unpaid Family Workers | 0 | 0.0% |
| Total | 1,209 | 100.0% |
Employment Status by Age in Grayson
According to the labor force statistics for Grayson, out of the total population over 16 years of age (3,209), 44.0% or 1,412 individuals are in the labor force, with 13.4% or 189 of them unemployed. The age group with the highest labor force participation rate is 30 to 34 years, with 73.5% or 316 individuals in the labor force. Within the labor force, the 30 to 34 years age range has the highest percentage of unemployed individuals, with 35.1% or 111 of them being unemployed.
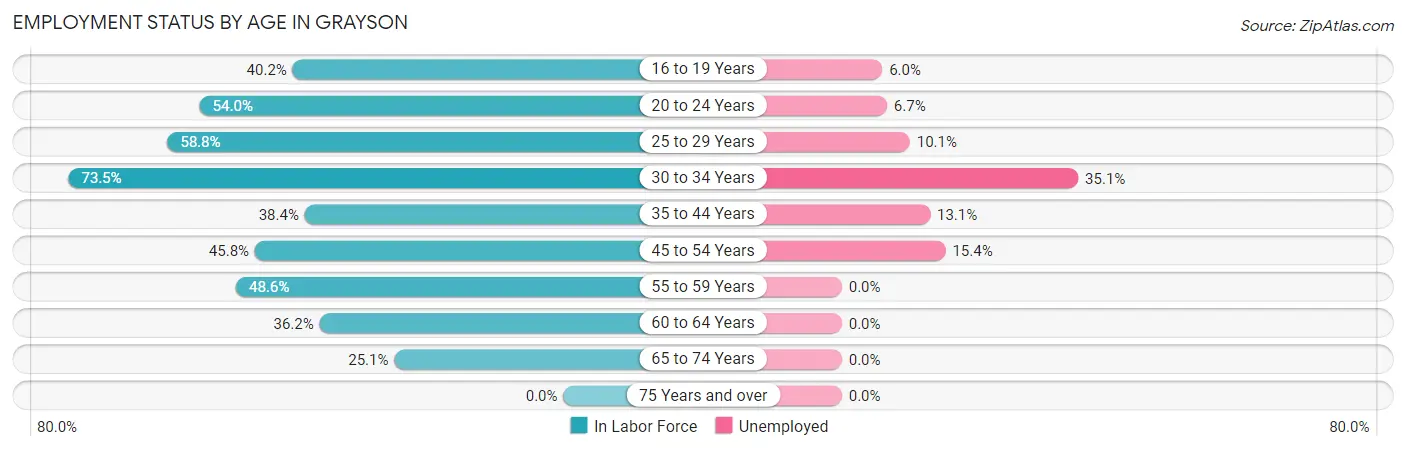
| Age Bracket | In Labor Force | Unemployed |
| 16 to 19 Years | 84 (40.2%) | 5 (6.0%) |
| 20 to 24 Years | 195 (54.0%) | 13 (6.7%) |
| 25 to 29 Years | 217 (58.8%) | 22 (10.1%) |
| 30 to 34 Years | 316 (73.5%) | 111 (35.1%) |
| 35 to 44 Years | 137 (38.4%) | 18 (13.1%) |
| 45 to 54 Years | 136 (45.8%) | 21 (15.4%) |
| 55 to 59 Years | 142 (48.6%) | 0 (0.0%) |
| 60 to 64 Years | 93 (36.2%) | 0 (0.0%) |
| 65 to 74 Years | 93 (25.1%) | 0 (0.0%) |
| 75 Years and over | 0 (0.0%) | 0 (0.0%) |
| Total | 1,412 (44.0%) | 189 (13.4%) |
Employment Status by Educational Attainment in Grayson
According to labor force statistics for Grayson, 52.0% of individuals (1,041) out of the total population between 25 and 64 years of age (2,002) are in the labor force, with 16.5% or 172 of them being unemployed. The group with the highest labor force participation rate are those with the educational attainment of bachelor's degree or higher, with 70.1% or 176 individuals in the labor force. Within the labor force, individuals with high school diploma education have the highest percentage of unemployment, with 22.1% or 150 of them being unemployed.
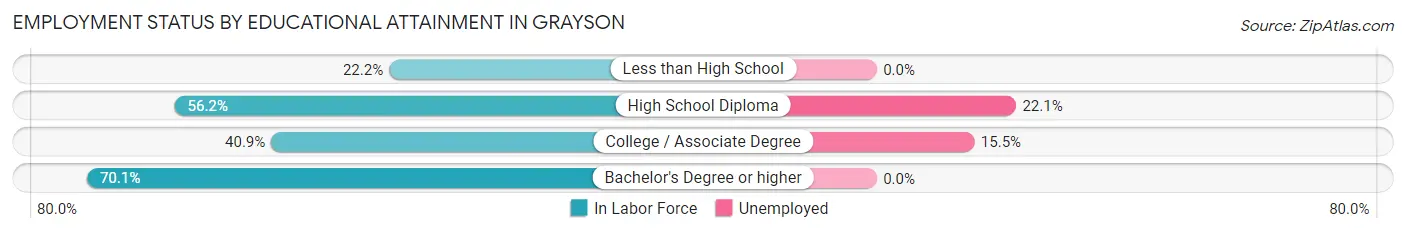
| Educational Attainment | In Labor Force | Unemployed |
| Less than High School | 43 (22.2%) | 0 (0.0%) |
| High School Diploma | 680 (56.2%) | 267 (22.1%) |
| College / Associate Degree | 142 (40.9%) | 54 (15.5%) |
| Bachelor's Degree or higher | 176 (70.1%) | 0 (0.0%) |
| Total | 1,041 (52.0%) | 330 (16.5%) |
Employment Occupations by Sex in Grayson
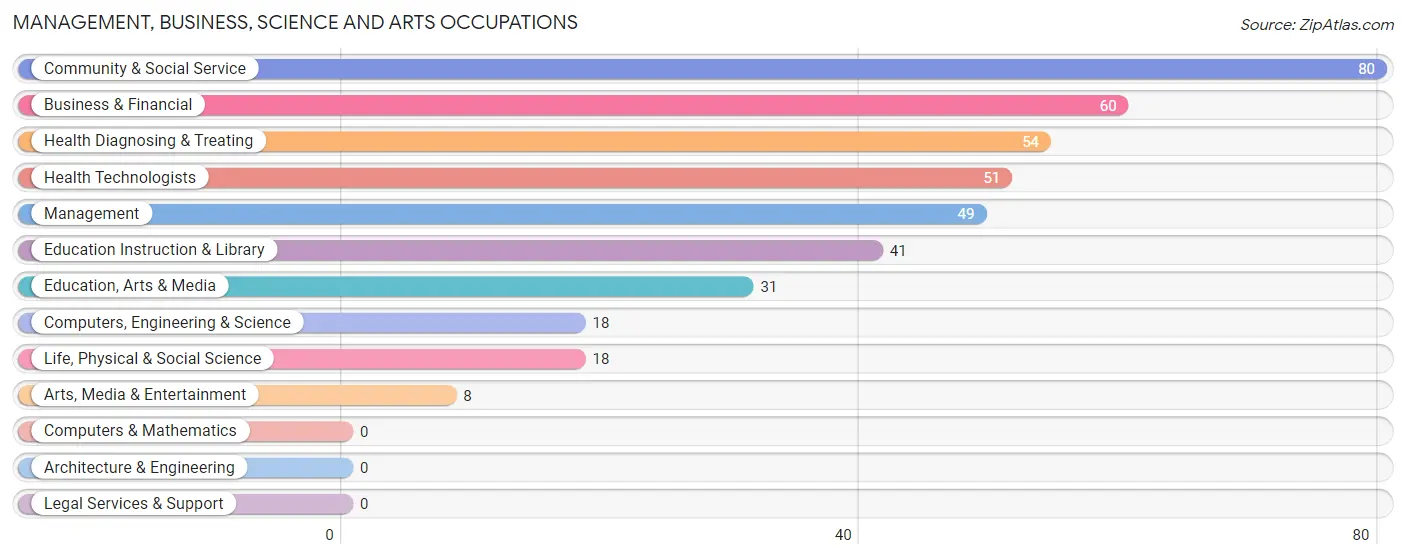
Management, Business, Science and Arts Occupations
The most common Management, Business, Science and Arts occupations in Grayson are Community & Social Service (80 | 6.5%), Business & Financial (60 | 4.9%), Health Diagnosing & Treating (54 | 4.4%), Health Technologists (51 | 4.2%), and Management (49 | 4.0%).
Management, Business, Science and Arts Occupations by Sex
Within the Management, Business, Science and Arts occupations in Grayson, the most male-oriented occupations are Management (100.0%), Computers, Engineering & Science (100.0%), and Life, Physical & Social Science (100.0%), while the most female-oriented occupations are Arts, Media & Entertainment (100.0%), Health Diagnosing & Treating (88.9%), and Health Technologists (88.2%).
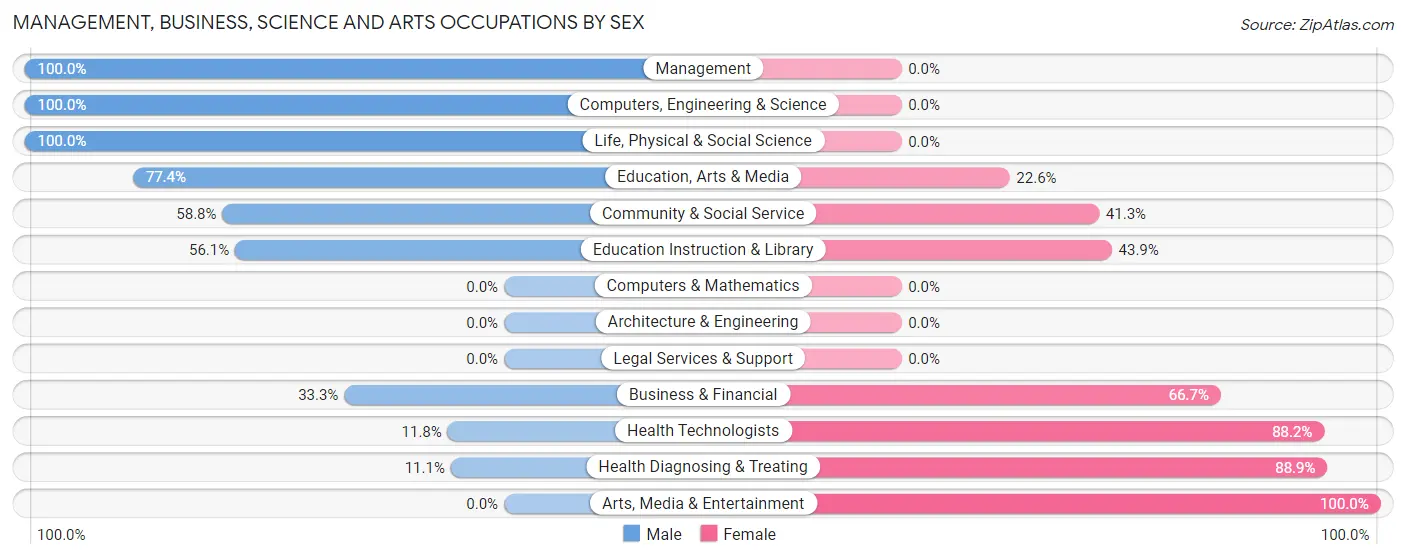
| Occupation | Male | Female |
| Management | 49 (100.0%) | 0 (0.0%) |
| Business & Financial | 20 (33.3%) | 40 (66.7%) |
| Computers, Engineering & Science | 18 (100.0%) | 0 (0.0%) |
| Computers & Mathematics | 0 (0.0%) | 0 (0.0%) |
| Architecture & Engineering | 0 (0.0%) | 0 (0.0%) |
| Life, Physical & Social Science | 18 (100.0%) | 0 (0.0%) |
| Community & Social Service | 47 (58.8%) | 33 (41.2%) |
| Education, Arts & Media | 24 (77.4%) | 7 (22.6%) |
| Legal Services & Support | 0 (0.0%) | 0 (0.0%) |
| Education Instruction & Library | 23 (56.1%) | 18 (43.9%) |
| Arts, Media & Entertainment | 0 (0.0%) | 8 (100.0%) |
| Health Diagnosing & Treating | 6 (11.1%) | 48 (88.9%) |
| Health Technologists | 6 (11.8%) | 45 (88.2%) |
| Total (Category) | 140 (53.6%) | 121 (46.4%) |
| Total (Overall) | 728 (59.5%) | 495 (40.5%) |
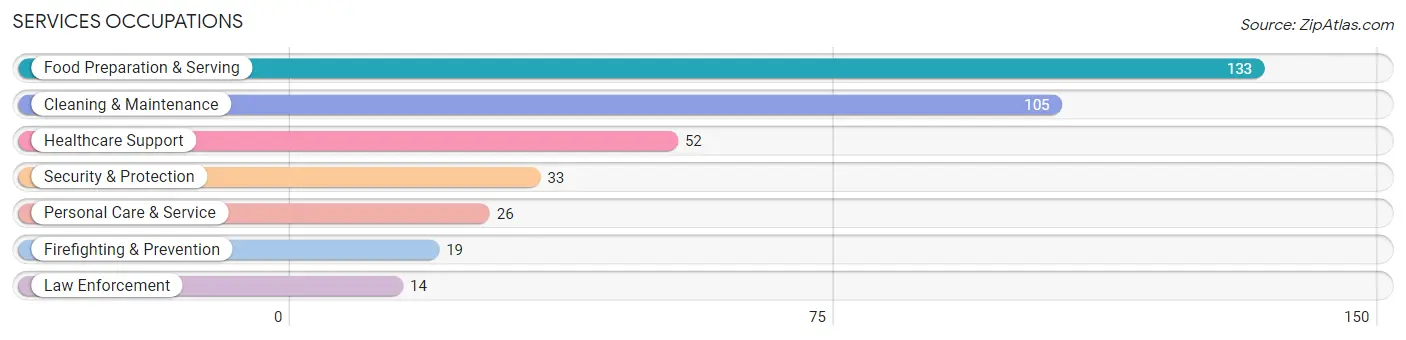
Services Occupations
The most common Services occupations in Grayson are Food Preparation & Serving (133 | 10.9%), Cleaning & Maintenance (105 | 8.6%), Healthcare Support (52 | 4.3%), Security & Protection (33 | 2.7%), and Personal Care & Service (26 | 2.1%).
Services Occupations by Sex
Within the Services occupations in Grayson, the most male-oriented occupations are Security & Protection (100.0%), Firefighting & Prevention (100.0%), and Law Enforcement (100.0%), while the most female-oriented occupations are Healthcare Support (100.0%), Food Preparation & Serving (75.9%), and Personal Care & Service (57.7%).
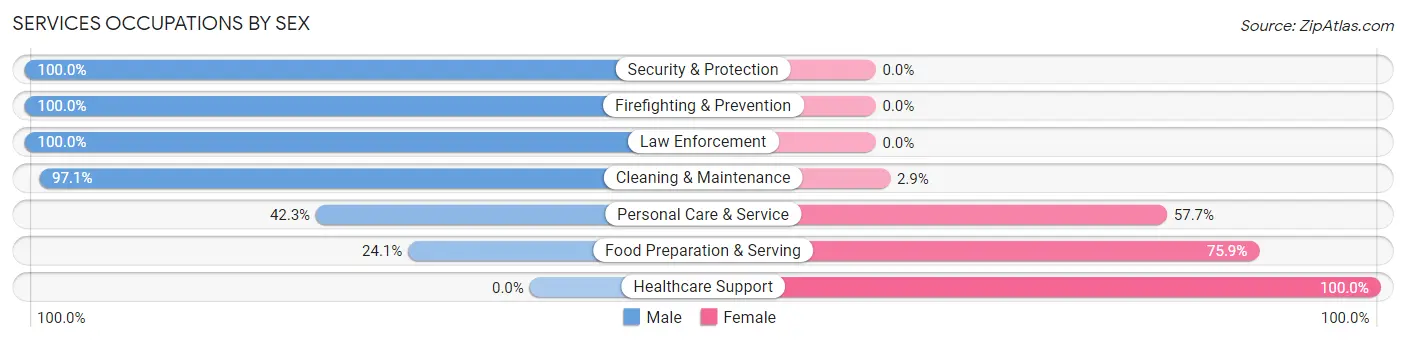
| Occupation | Male | Female |
| Healthcare Support | 0 (0.0%) | 52 (100.0%) |
| Security & Protection | 33 (100.0%) | 0 (0.0%) |
| Firefighting & Prevention | 19 (100.0%) | 0 (0.0%) |
| Law Enforcement | 14 (100.0%) | 0 (0.0%) |
| Food Preparation & Serving | 32 (24.1%) | 101 (75.9%) |
| Cleaning & Maintenance | 102 (97.1%) | 3 (2.9%) |
| Personal Care & Service | 11 (42.3%) | 15 (57.7%) |
| Total (Category) | 178 (51.0%) | 171 (49.0%) |
| Total (Overall) | 728 (59.5%) | 495 (40.5%) |
Sales and Office Occupations
The most common Sales and Office occupations in Grayson are Sales & Related (105 | 8.6%), and Office & Administration (62 | 5.1%).
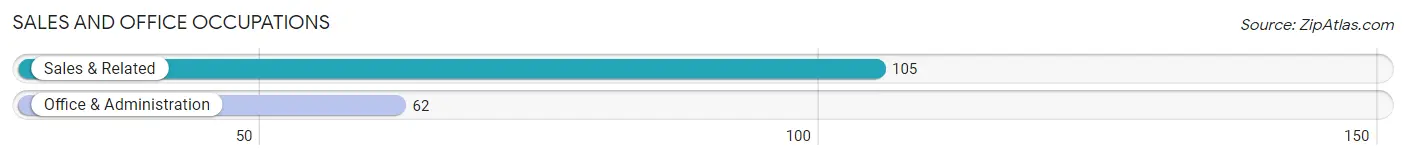
Sales and Office Occupations by Sex
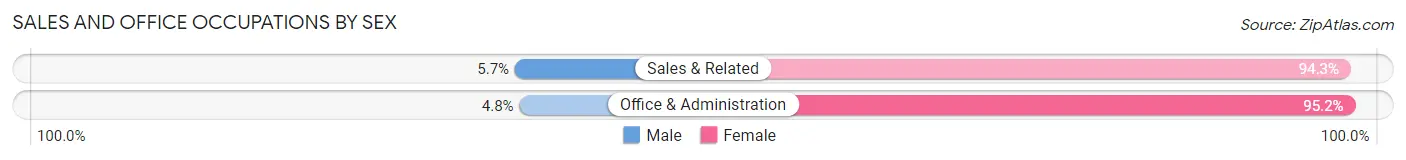
| Occupation | Male | Female |
| Sales & Related | 6 (5.7%) | 99 (94.3%) |
| Office & Administration | 3 (4.8%) | 59 (95.2%) |
| Total (Category) | 9 (5.4%) | 158 (94.6%) |
| Total (Overall) | 728 (59.5%) | 495 (40.5%) |
Natural Resources, Construction and Maintenance Occupations
The most common Natural Resources, Construction and Maintenance occupations in Grayson are Construction & Extraction (71 | 5.8%), and Installation, Maintenance & Repair (11 | 0.9%).
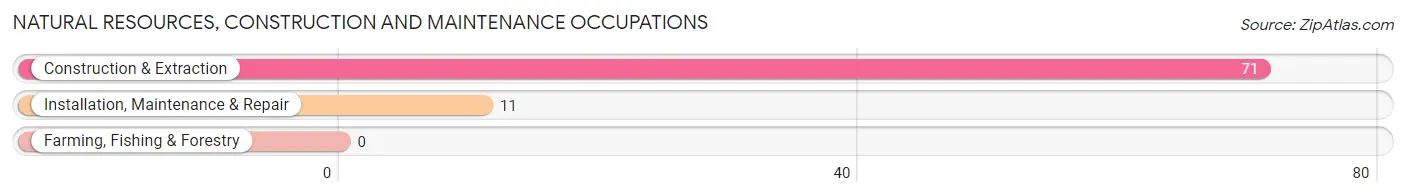
Natural Resources, Construction and Maintenance Occupations by Sex
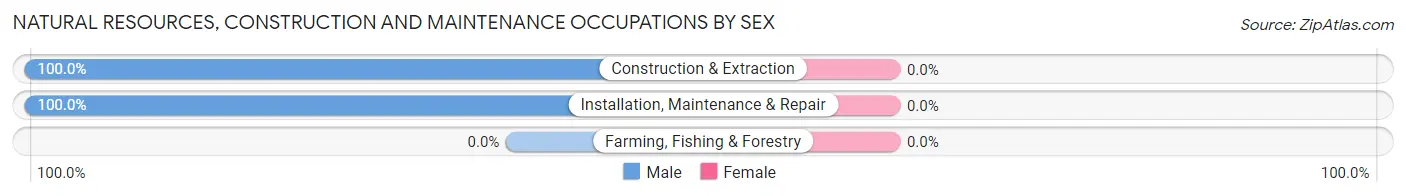
| Occupation | Male | Female |
| Farming, Fishing & Forestry | 0 (0.0%) | 0 (0.0%) |
| Construction & Extraction | 71 (100.0%) | 0 (0.0%) |
| Installation, Maintenance & Repair | 11 (100.0%) | 0 (0.0%) |
| Total (Category) | 82 (100.0%) | 0 (0.0%) |
| Total (Overall) | 728 (59.5%) | 495 (40.5%) |
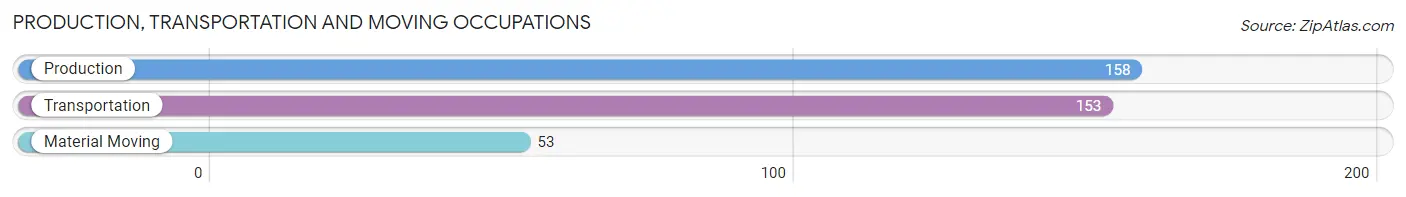
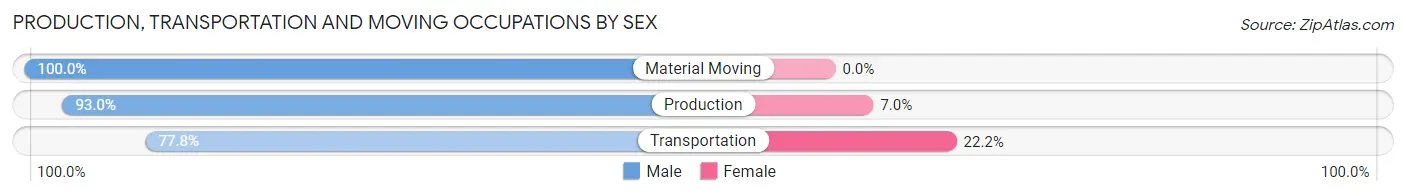
Production, Transportation and Moving Occupations
The most common Production, Transportation and Moving occupations in Grayson are Production (158 | 12.9%), Transportation (153 | 12.5%), and Material Moving (53 | 4.3%).
Production, Transportation and Moving Occupations by Sex
| Occupation | Male | Female |
| Production | 147 (93.0%) | 11 (7.0%) |
| Transportation | 119 (77.8%) | 34 (22.2%) |
| Material Moving | 53 (100.0%) | 0 (0.0%) |
| Total (Category) | 319 (87.6%) | 45 (12.4%) |
| Total (Overall) | 728 (59.5%) | 495 (40.5%) |
Employment Industries by Sex in Grayson
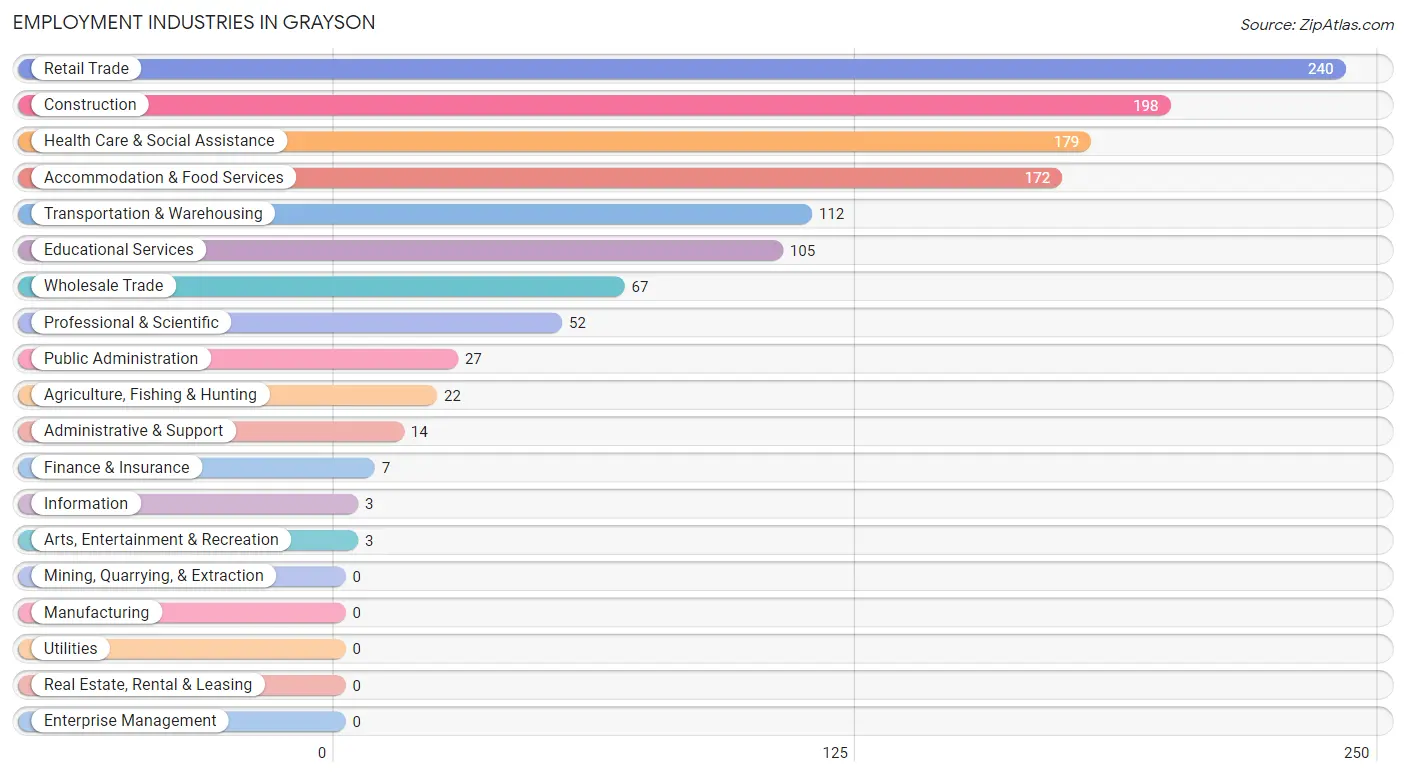
Employment Industries in Grayson
The major employment industries in Grayson include Retail Trade (240 | 19.6%), Construction (198 | 16.2%), Health Care & Social Assistance (179 | 14.6%), Accommodation & Food Services (172 | 14.1%), and Transportation & Warehousing (112 | 9.2%).
Employment Industries by Sex in Grayson
The Grayson industries that see more men than women are Agriculture, Fishing & Hunting (100.0%), Construction (100.0%), and Wholesale Trade (100.0%), whereas the industries that tend to have a higher number of women are Information (100.0%), Finance & Insurance (100.0%), and Transportation & Warehousing (83.9%).
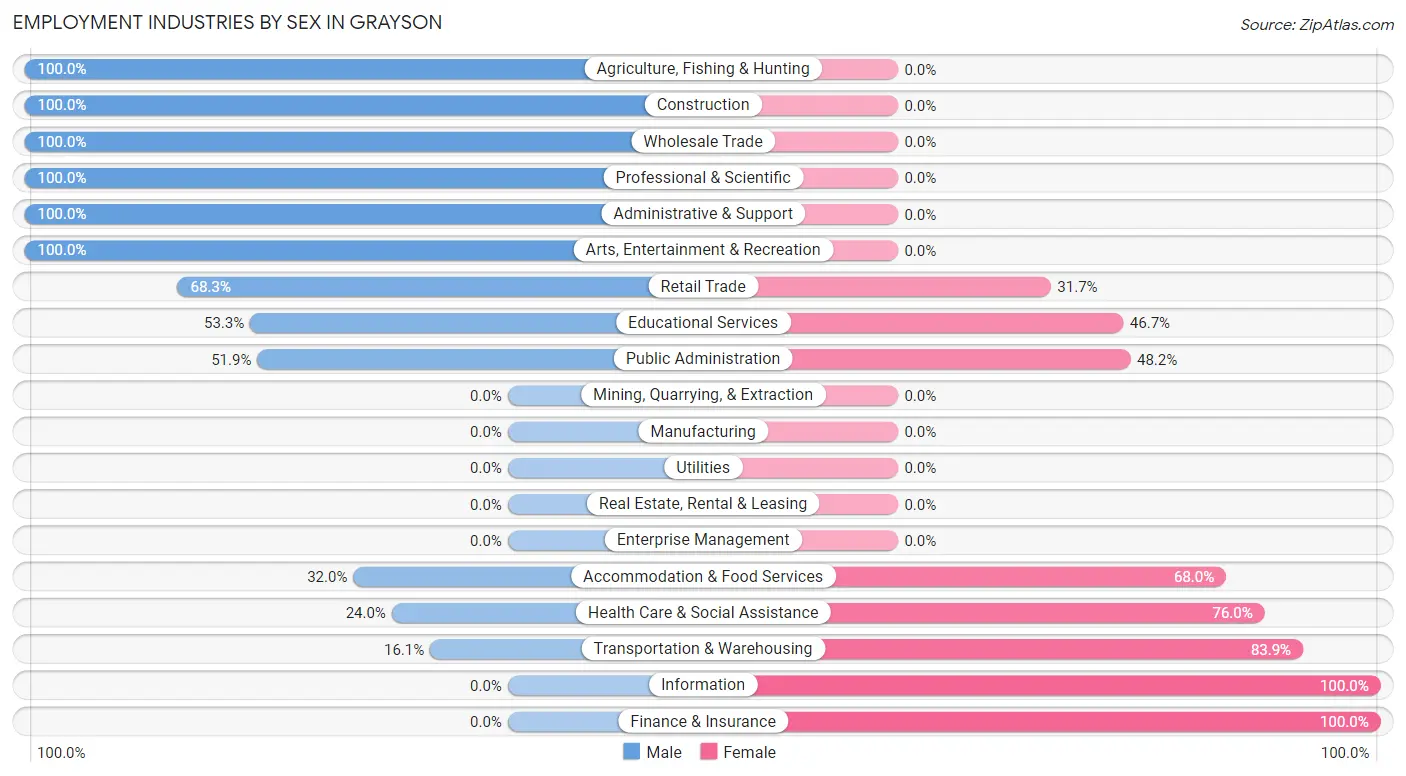
| Industry | Male | Female |
| Agriculture, Fishing & Hunting | 22 (100.0%) | 0 (0.0%) |
| Mining, Quarrying, & Extraction | 0 (0.0%) | 0 (0.0%) |
| Construction | 198 (100.0%) | 0 (0.0%) |
| Manufacturing | 0 (0.0%) | 0 (0.0%) |
| Wholesale Trade | 67 (100.0%) | 0 (0.0%) |
| Retail Trade | 164 (68.3%) | 76 (31.7%) |
| Transportation & Warehousing | 18 (16.1%) | 94 (83.9%) |
| Utilities | 0 (0.0%) | 0 (0.0%) |
| Information | 0 (0.0%) | 3 (100.0%) |
| Finance & Insurance | 0 (0.0%) | 7 (100.0%) |
| Real Estate, Rental & Leasing | 0 (0.0%) | 0 (0.0%) |
| Professional & Scientific | 52 (100.0%) | 0 (0.0%) |
| Enterprise Management | 0 (0.0%) | 0 (0.0%) |
| Administrative & Support | 14 (100.0%) | 0 (0.0%) |
| Educational Services | 56 (53.3%) | 49 (46.7%) |
| Health Care & Social Assistance | 43 (24.0%) | 136 (76.0%) |
| Arts, Entertainment & Recreation | 3 (100.0%) | 0 (0.0%) |
| Accommodation & Food Services | 55 (32.0%) | 117 (68.0%) |
| Public Administration | 14 (51.8%) | 13 (48.1%) |
| Total | 728 (59.5%) | 495 (40.5%) |
Education in Grayson
School Enrollment in Grayson
The most common levels of schooling among the 730 students in Grayson are college / undergraduate (389 | 53.3%), elementary school (136 | 18.6%), and middle school (102 | 14.0%).
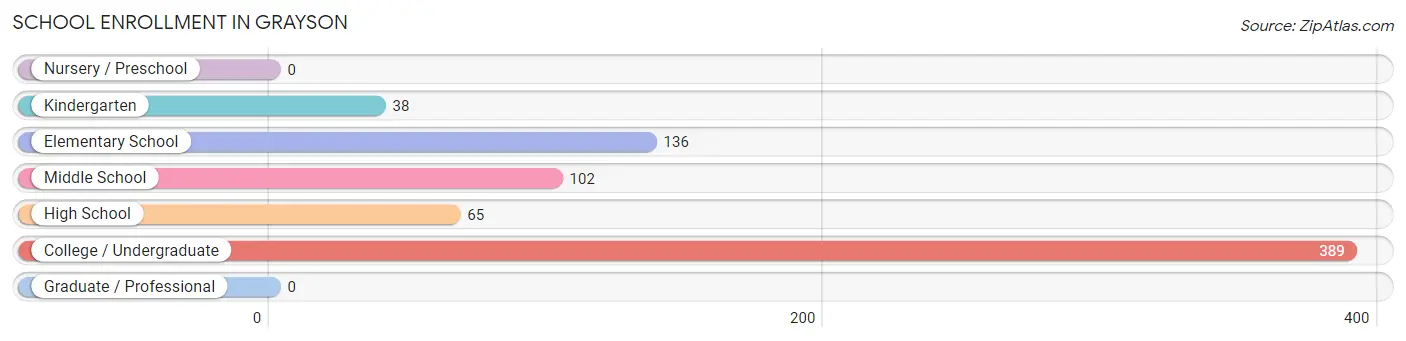
| School Level | # Students | % Students |
| Nursery / Preschool | 0 | 0.0% |
| Kindergarten | 38 | 5.2% |
| Elementary School | 136 | 18.6% |
| Middle School | 102 | 14.0% |
| High School | 65 | 8.9% |
| College / Undergraduate | 389 | 53.3% |
| Graduate / Professional | 0 | 0.0% |
| Total | 730 | 100.0% |
School Enrollment by Age by Funding Source in Grayson
Out of a total of 730 students who are enrolled in schools in Grayson, 196 (26.8%) attend a private institution, while the remaining 534 (73.2%) are enrolled in public schools. The age group of 18 to 19 year olds has the highest likelihood of being enrolled in private schools, with 100 (61.7% in the age bracket) enrolled. Conversely, the age group of 5 to 9 year old has the lowest likelihood of being enrolled in a private school, with 174 (100.0% in the age bracket) attending a public institution.
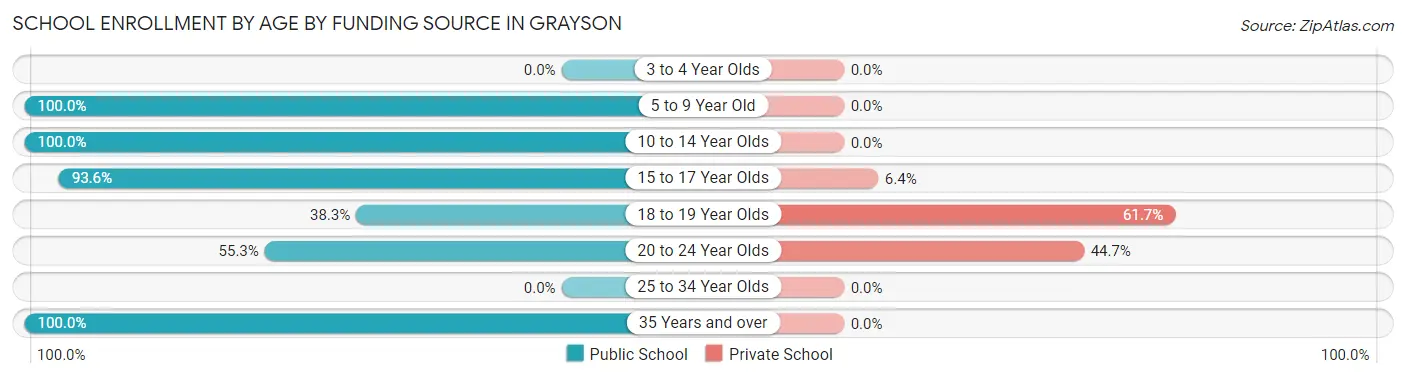
| Age Bracket | Public School | Private School |
| 3 to 4 Year Olds | 0 (0.0%) | 0 (0.0%) |
| 5 to 9 Year Old | 174 (100.0%) | 0 (0.0%) |
| 10 to 14 Year Olds | 127 (100.0%) | 0 (0.0%) |
| 15 to 17 Year Olds | 44 (93.6%) | 3 (6.4%) |
| 18 to 19 Year Olds | 62 (38.3%) | 100 (61.7%) |
| 20 to 24 Year Olds | 115 (55.3%) | 93 (44.7%) |
| 25 to 34 Year Olds | 0 (0.0%) | 0 (0.0%) |
| 35 Years and over | 12 (100.0%) | 0 (0.0%) |
| Total | 534 (73.2%) | 196 (26.8%) |
Educational Attainment by Field of Study in Grayson
Education (170 | 50.0%), arts & humanities (47 | 13.8%), science & technology (41 | 12.1%), social sciences (28 | 8.2%), and bio, nature & agricultural (20 | 5.9%) are the most common fields of study among 340 individuals in Grayson who have obtained a bachelor's degree or higher.
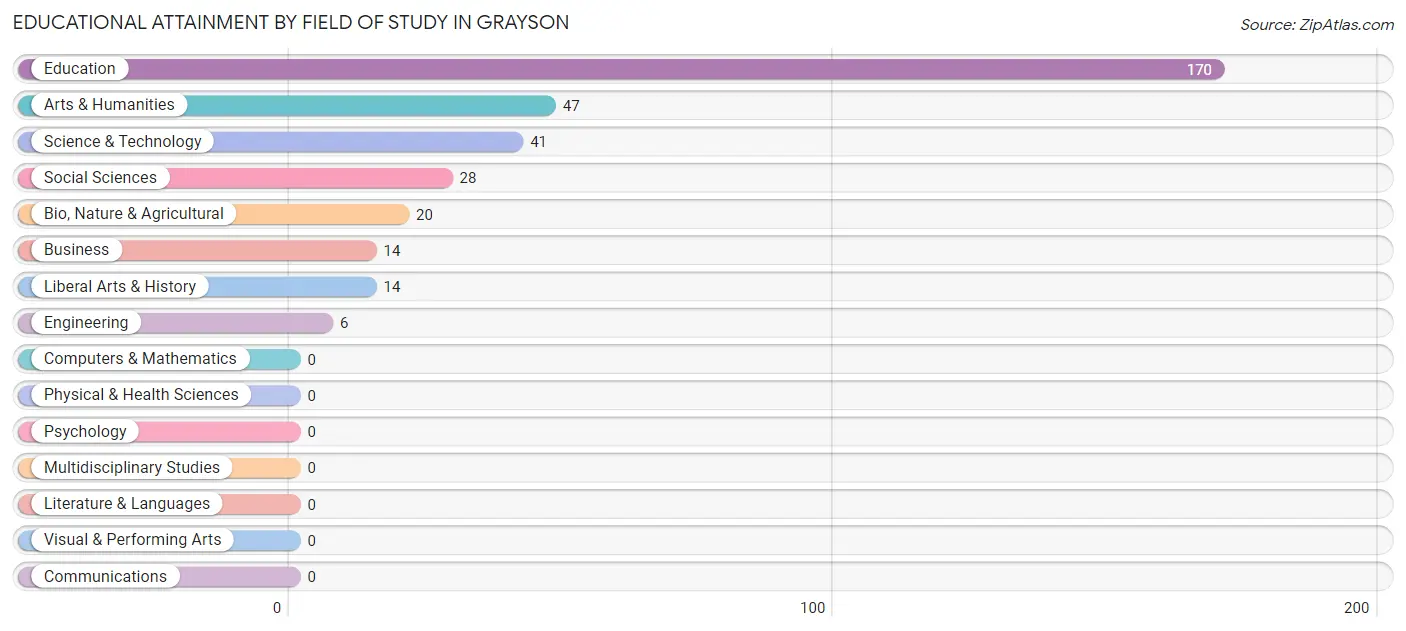
| Field of Study | # Graduates | % Graduates |
| Computers & Mathematics | 0 | 0.0% |
| Bio, Nature & Agricultural | 20 | 5.9% |
| Physical & Health Sciences | 0 | 0.0% |
| Psychology | 0 | 0.0% |
| Social Sciences | 28 | 8.2% |
| Engineering | 6 | 1.8% |
| Multidisciplinary Studies | 0 | 0.0% |
| Science & Technology | 41 | 12.1% |
| Business | 14 | 4.1% |
| Education | 170 | 50.0% |
| Literature & Languages | 0 | 0.0% |
| Liberal Arts & History | 14 | 4.1% |
| Visual & Performing Arts | 0 | 0.0% |
| Communications | 0 | 0.0% |
| Arts & Humanities | 47 | 13.8% |
| Total | 340 | 100.0% |
Transportation & Commute in Grayson
Vehicle Availability by Sex in Grayson
The most prevalent vehicle ownership categories in Grayson are males with 2 vehicles (387, accounting for 60.9%) and females with 2 vehicles (173, making up 89.6%).
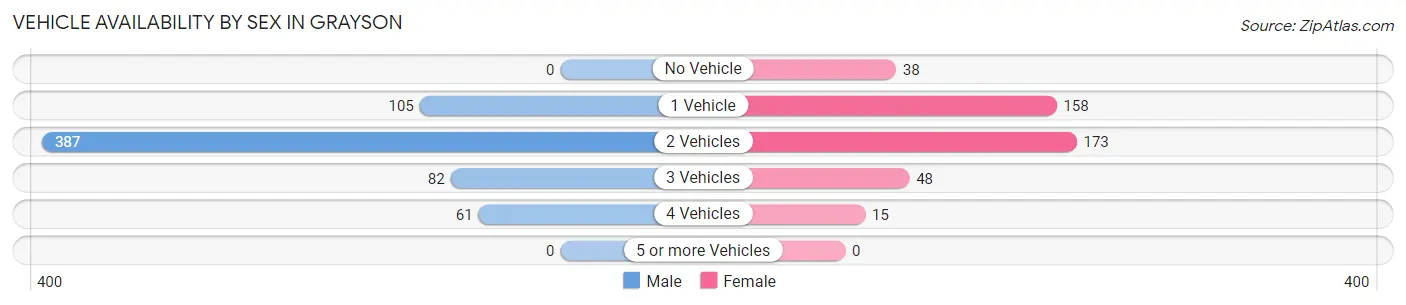
| Vehicles Available | Male | Female |
| No Vehicle | 0 (0.0%) | 38 (8.8%) |
| 1 Vehicle | 105 (16.5%) | 158 (36.6%) |
| 2 Vehicles | 387 (60.9%) | 173 (40.1%) |
| 3 Vehicles | 82 (12.9%) | 48 (11.1%) |
| 4 Vehicles | 61 (9.6%) | 15 (3.5%) |
| 5 or more Vehicles | 0 (0.0%) | 0 (0.0%) |
| Total | 635 (100.0%) | 432 (100.0%) |
Commute Time in Grayson
The most frequently occuring commute durations in Grayson are 30 to 34 minutes (200 commuters, 17.5%), less than 5 minutes (196 commuters, 17.2%), and 45 to 59 minutes (165 commuters, 14.4%).
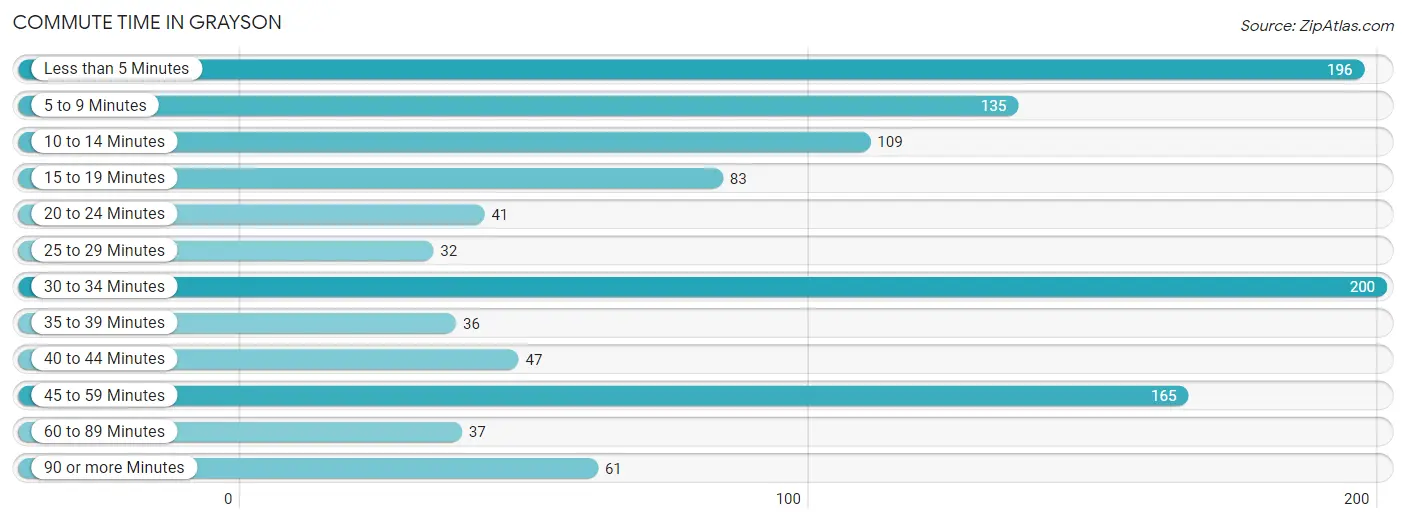
| Commute Time | # Commuters | % Commuters |
| Less than 5 Minutes | 196 | 17.2% |
| 5 to 9 Minutes | 135 | 11.8% |
| 10 to 14 Minutes | 109 | 9.5% |
| 15 to 19 Minutes | 83 | 7.3% |
| 20 to 24 Minutes | 41 | 3.6% |
| 25 to 29 Minutes | 32 | 2.8% |
| 30 to 34 Minutes | 200 | 17.5% |
| 35 to 39 Minutes | 36 | 3.2% |
| 40 to 44 Minutes | 47 | 4.1% |
| 45 to 59 Minutes | 165 | 14.4% |
| 60 to 89 Minutes | 37 | 3.2% |
| 90 or more Minutes | 61 | 5.3% |
Commute Time by Sex in Grayson
The most common commute times in Grayson are 30 to 34 minutes (191 commuters, 28.4%) for males and 5 to 9 minutes (98 commuters, 20.9%) for females.
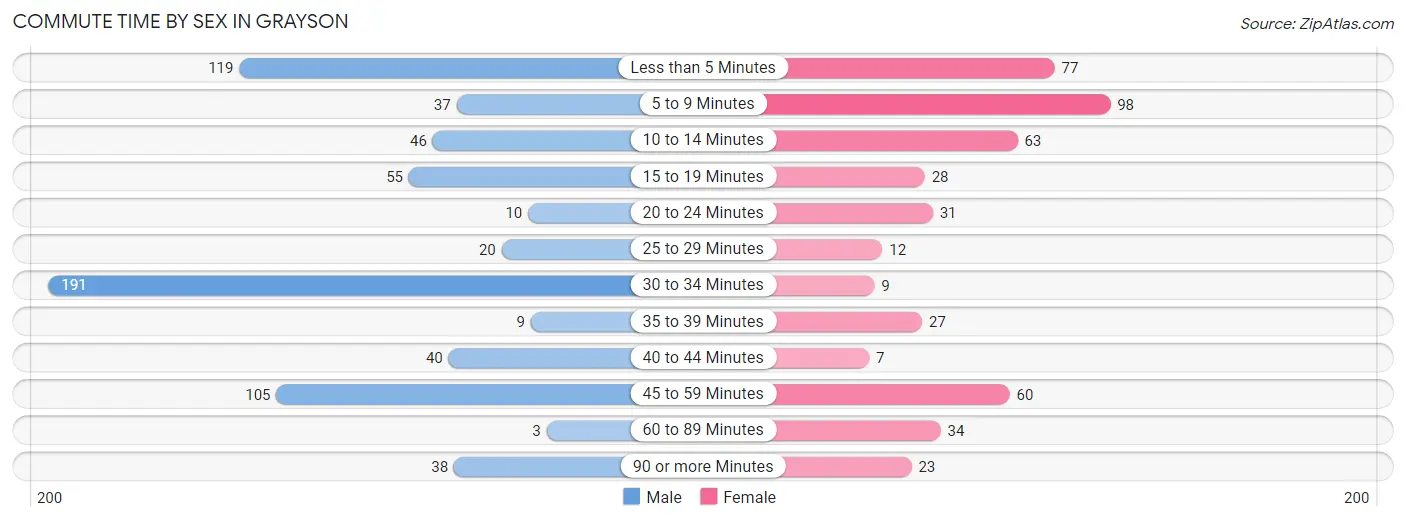
| Commute Time | Male | Female |
| Less than 5 Minutes | 119 (17.7%) | 77 (16.4%) |
| 5 to 9 Minutes | 37 (5.5%) | 98 (20.9%) |
| 10 to 14 Minutes | 46 (6.8%) | 63 (13.4%) |
| 15 to 19 Minutes | 55 (8.2%) | 28 (6.0%) |
| 20 to 24 Minutes | 10 (1.5%) | 31 (6.6%) |
| 25 to 29 Minutes | 20 (3.0%) | 12 (2.6%) |
| 30 to 34 Minutes | 191 (28.4%) | 9 (1.9%) |
| 35 to 39 Minutes | 9 (1.3%) | 27 (5.8%) |
| 40 to 44 Minutes | 40 (5.9%) | 7 (1.5%) |
| 45 to 59 Minutes | 105 (15.6%) | 60 (12.8%) |
| 60 to 89 Minutes | 3 (0.4%) | 34 (7.2%) |
| 90 or more Minutes | 38 (5.7%) | 23 (4.9%) |
Time of Departure to Work by Sex in Grayson
The most frequent times of departure to work in Grayson are 5:00 AM to 5:29 AM (147, 21.8%) for males and 12:00 PM to 3:59 PM (73, 15.6%) for females.
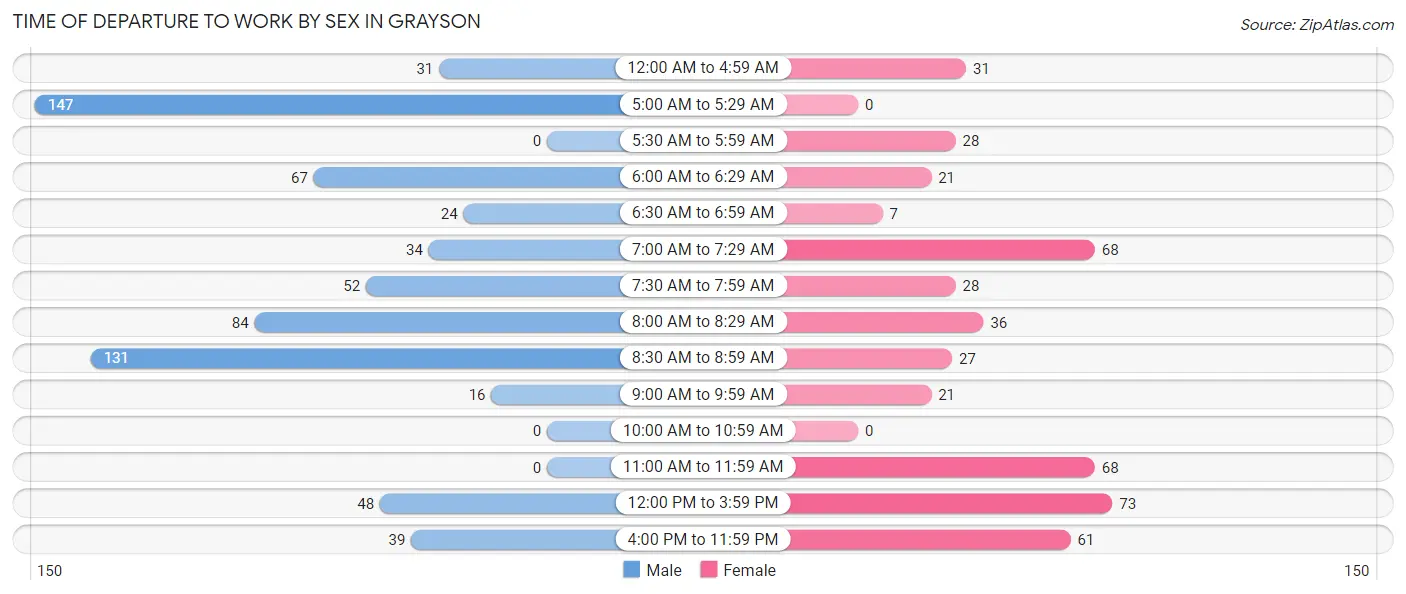
| Time of Departure | Male | Female |
| 12:00 AM to 4:59 AM | 31 (4.6%) | 31 (6.6%) |
| 5:00 AM to 5:29 AM | 147 (21.8%) | 0 (0.0%) |
| 5:30 AM to 5:59 AM | 0 (0.0%) | 28 (6.0%) |
| 6:00 AM to 6:29 AM | 67 (10.0%) | 21 (4.5%) |
| 6:30 AM to 6:59 AM | 24 (3.6%) | 7 (1.5%) |
| 7:00 AM to 7:29 AM | 34 (5.1%) | 68 (14.5%) |
| 7:30 AM to 7:59 AM | 52 (7.7%) | 28 (6.0%) |
| 8:00 AM to 8:29 AM | 84 (12.5%) | 36 (7.7%) |
| 8:30 AM to 8:59 AM | 131 (19.5%) | 27 (5.8%) |
| 9:00 AM to 9:59 AM | 16 (2.4%) | 21 (4.5%) |
| 10:00 AM to 10:59 AM | 0 (0.0%) | 0 (0.0%) |
| 11:00 AM to 11:59 AM | 0 (0.0%) | 68 (14.5%) |
| 12:00 PM to 3:59 PM | 48 (7.1%) | 73 (15.6%) |
| 4:00 PM to 11:59 PM | 39 (5.8%) | 61 (13.0%) |
| Total | 673 (100.0%) | 469 (100.0%) |
Housing Occupancy in Grayson
Occupancy by Ownership in Grayson
Of the total 1,364 dwellings in Grayson, owner-occupied units account for 643 (47.1%), while renter-occupied units make up 721 (52.9%).
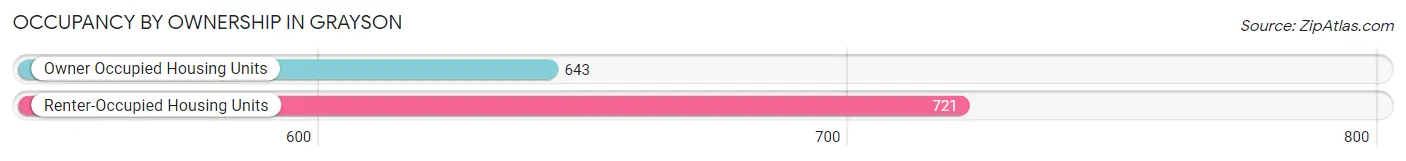
| Occupancy | # Housing Units | % Housing Units |
| Owner Occupied Housing Units | 643 | 47.1% |
| Renter-Occupied Housing Units | 721 | 52.9% |
| Total Occupied Housing Units | 1,364 | 100.0% |
Occupancy by Household Size in Grayson
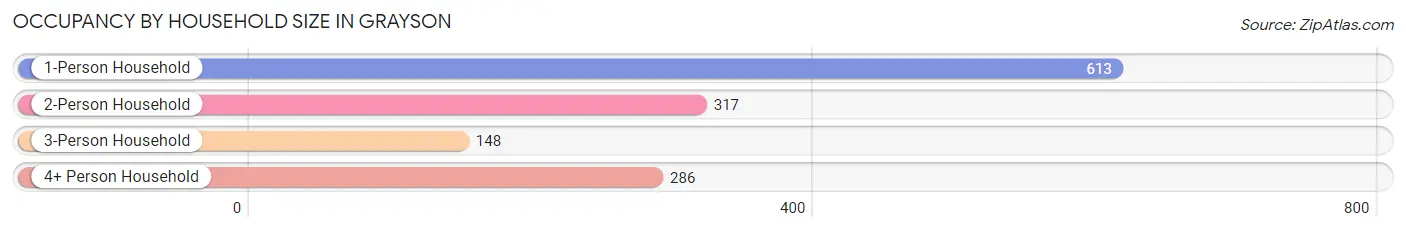
| Household Size | # Housing Units | % Housing Units |
| 1-Person Household | 613 | 44.9% |
| 2-Person Household | 317 | 23.2% |
| 3-Person Household | 148 | 10.8% |
| 4+ Person Household | 286 | 21.0% |
| Total Housing Units | 1,364 | 100.0% |
Occupancy by Ownership by Household Size in Grayson
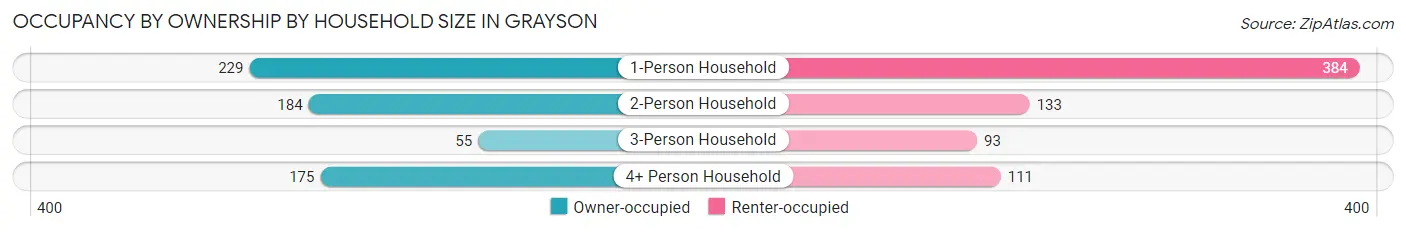
| Household Size | Owner-occupied | Renter-occupied |
| 1-Person Household | 229 (37.4%) | 384 (62.6%) |
| 2-Person Household | 184 (58.0%) | 133 (42.0%) |
| 3-Person Household | 55 (37.2%) | 93 (62.8%) |
| 4+ Person Household | 175 (61.2%) | 111 (38.8%) |
| Total Housing Units | 643 (47.1%) | 721 (52.9%) |
Occupancy by Educational Attainment in Grayson
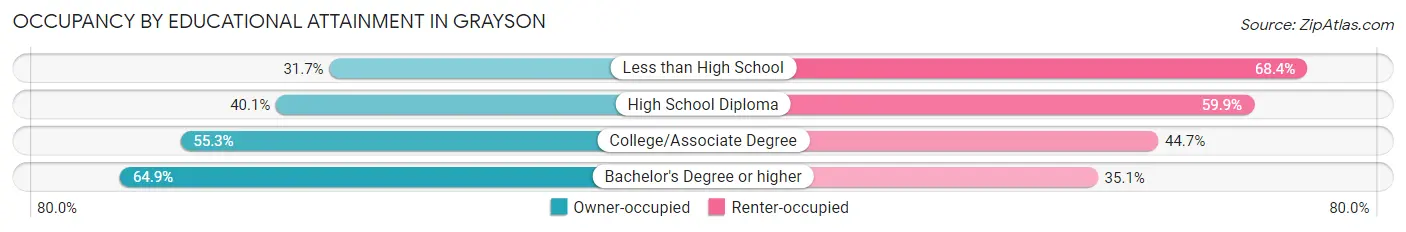
| Household Size | Owner-occupied | Renter-occupied |
| Less than High School | 44 (31.7%) | 95 (68.3%) |
| High School Diploma | 277 (40.1%) | 414 (59.9%) |
| College/Associate Degree | 141 (55.3%) | 114 (44.7%) |
| Bachelor's Degree or higher | 181 (64.9%) | 98 (35.1%) |
Occupancy by Age of Householder in Grayson
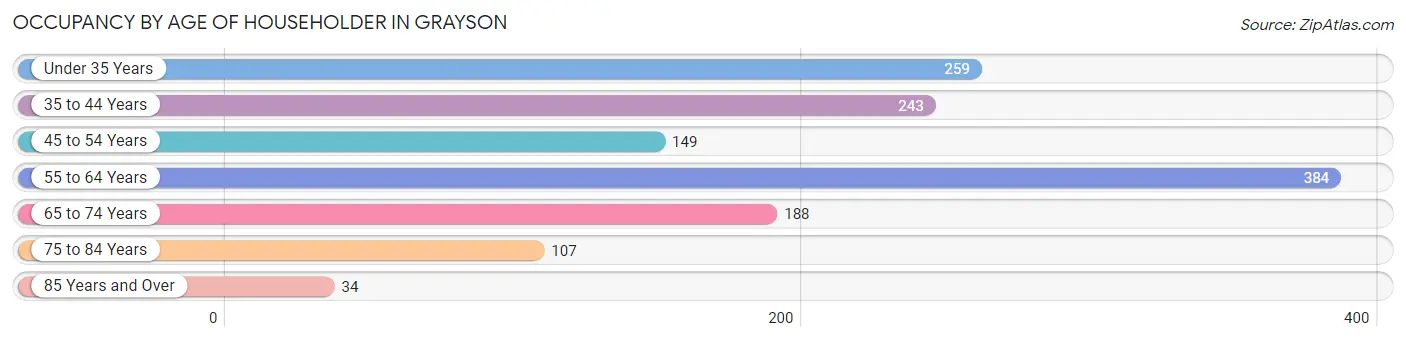
| Age Bracket | # Households | % Households |
| Under 35 Years | 259 | 19.0% |
| 35 to 44 Years | 243 | 17.8% |
| 45 to 54 Years | 149 | 10.9% |
| 55 to 64 Years | 384 | 28.1% |
| 65 to 74 Years | 188 | 13.8% |
| 75 to 84 Years | 107 | 7.8% |
| 85 Years and Over | 34 | 2.5% |
| Total | 1,364 | 100.0% |
Housing Finances in Grayson
Median Income by Occupancy in Grayson
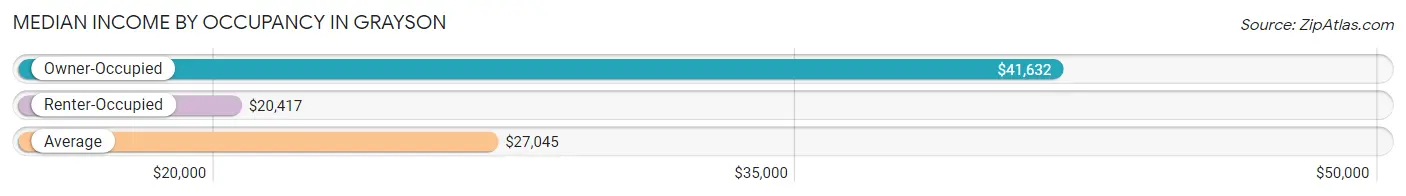
| Occupancy Type | # Households | Median Income |
| Owner-Occupied | 643 (47.1%) | $41,632 |
| Renter-Occupied | 721 (52.9%) | $20,417 |
| Average | 1,364 (100.0%) | $27,045 |
Occupancy by Householder Income Bracket in Grayson
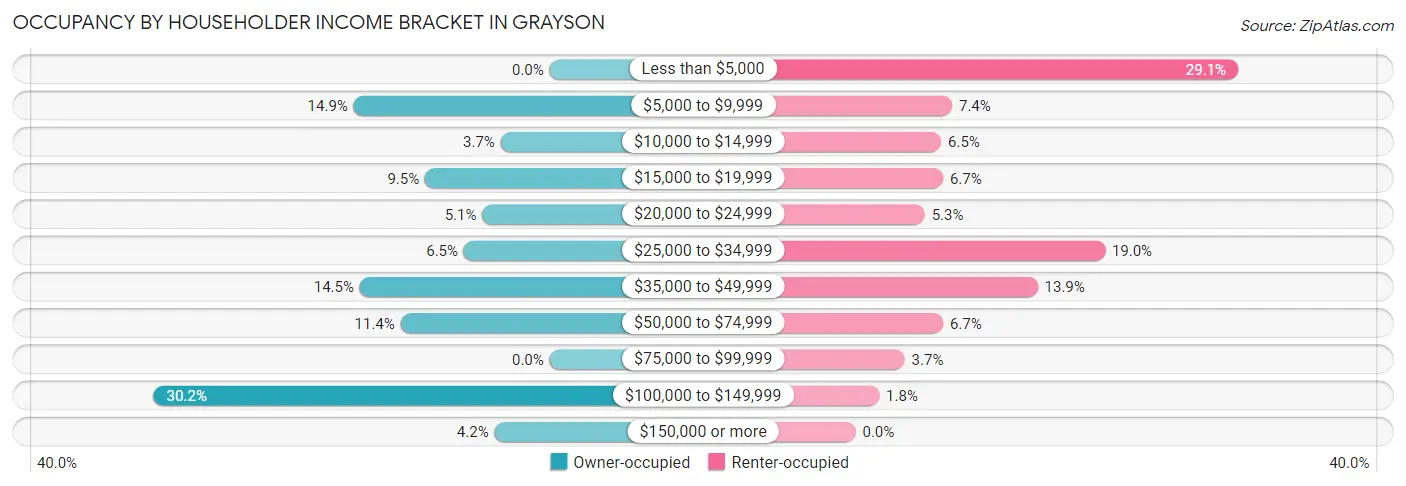
| Income Bracket | Owner-occupied | Renter-occupied |
| Less than $5,000 | 0 (0.0%) | 210 (29.1%) |
| $5,000 to $9,999 | 96 (14.9%) | 53 (7.3%) |
| $10,000 to $14,999 | 24 (3.7%) | 47 (6.5%) |
| $15,000 to $19,999 | 61 (9.5%) | 48 (6.7%) |
| $20,000 to $24,999 | 33 (5.1%) | 38 (5.3%) |
| $25,000 to $34,999 | 42 (6.5%) | 137 (19.0%) |
| $35,000 to $49,999 | 93 (14.5%) | 100 (13.9%) |
| $50,000 to $74,999 | 73 (11.4%) | 48 (6.7%) |
| $75,000 to $99,999 | 0 (0.0%) | 27 (3.7%) |
| $100,000 to $149,999 | 194 (30.2%) | 13 (1.8%) |
| $150,000 or more | 27 (4.2%) | 0 (0.0%) |
| Total | 643 (100.0%) | 721 (100.0%) |
Monthly Housing Cost Tiers in Grayson
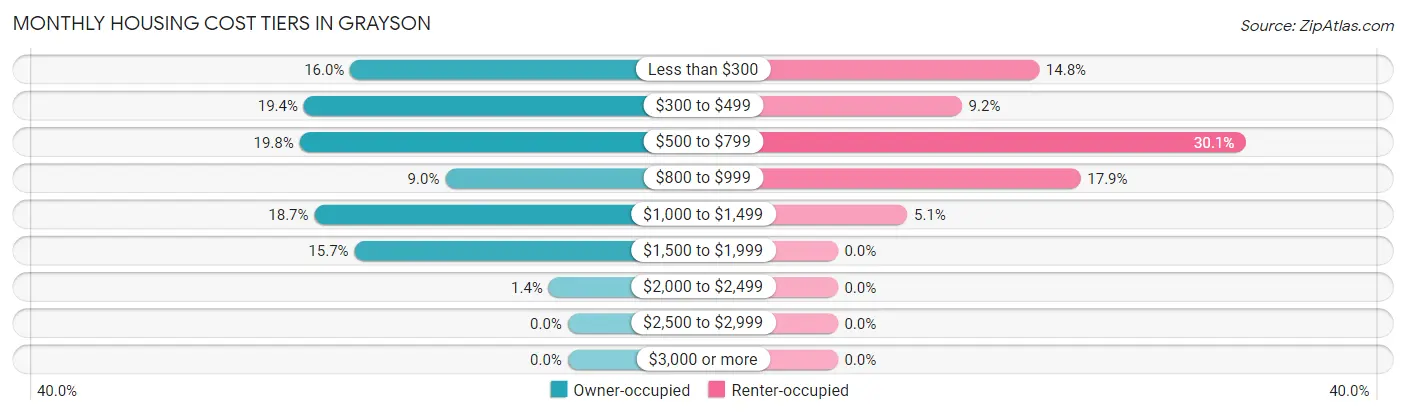
| Monthly Cost | Owner-occupied | Renter-occupied |
| Less than $300 | 103 (16.0%) | 107 (14.8%) |
| $300 to $499 | 125 (19.4%) | 66 (9.1%) |
| $500 to $799 | 127 (19.8%) | 217 (30.1%) |
| $800 to $999 | 58 (9.0%) | 129 (17.9%) |
| $1,000 to $1,499 | 120 (18.7%) | 37 (5.1%) |
| $1,500 to $1,999 | 101 (15.7%) | 0 (0.0%) |
| $2,000 to $2,499 | 9 (1.4%) | 0 (0.0%) |
| $2,500 to $2,999 | 0 (0.0%) | 0 (0.0%) |
| $3,000 or more | 0 (0.0%) | 0 (0.0%) |
| Total | 643 (100.0%) | 721 (100.0%) |
Physical Housing Characteristics in Grayson
Housing Structures in Grayson
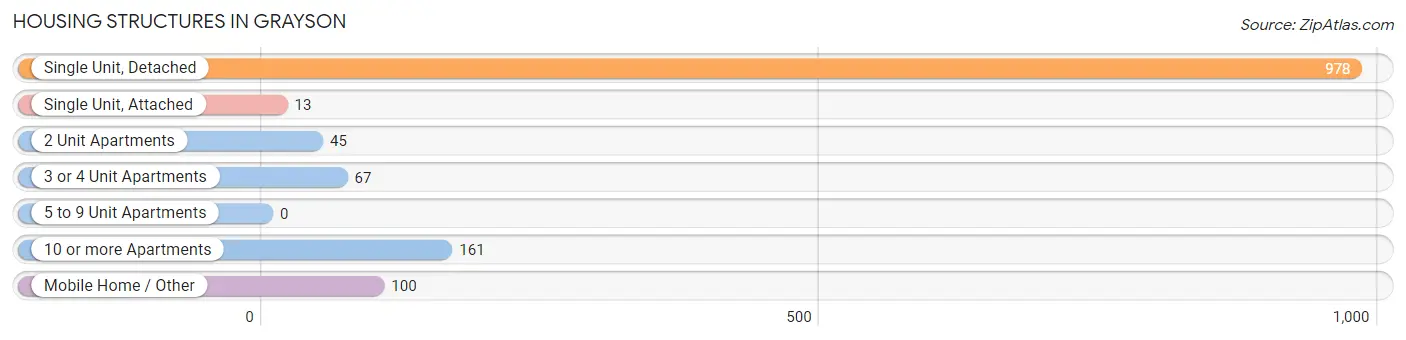
| Structure Type | # Housing Units | % Housing Units |
| Single Unit, Detached | 978 | 71.7% |
| Single Unit, Attached | 13 | 0.9% |
| 2 Unit Apartments | 45 | 3.3% |
| 3 or 4 Unit Apartments | 67 | 4.9% |
| 5 to 9 Unit Apartments | 0 | 0.0% |
| 10 or more Apartments | 161 | 11.8% |
| Mobile Home / Other | 100 | 7.3% |
| Total | 1,364 | 100.0% |
Housing Structures by Occupancy in Grayson
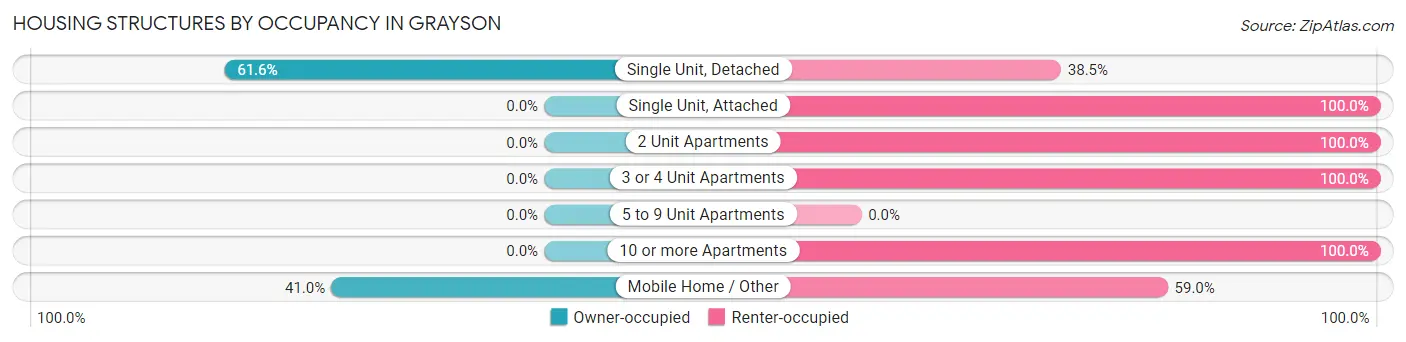
| Structure Type | Owner-occupied | Renter-occupied |
| Single Unit, Detached | 602 (61.6%) | 376 (38.5%) |
| Single Unit, Attached | 0 (0.0%) | 13 (100.0%) |
| 2 Unit Apartments | 0 (0.0%) | 45 (100.0%) |
| 3 or 4 Unit Apartments | 0 (0.0%) | 67 (100.0%) |
| 5 to 9 Unit Apartments | 0 (0.0%) | 0 (0.0%) |
| 10 or more Apartments | 0 (0.0%) | 161 (100.0%) |
| Mobile Home / Other | 41 (41.0%) | 59 (59.0%) |
| Total | 643 (47.1%) | 721 (52.9%) |
Housing Structures by Number of Rooms in Grayson
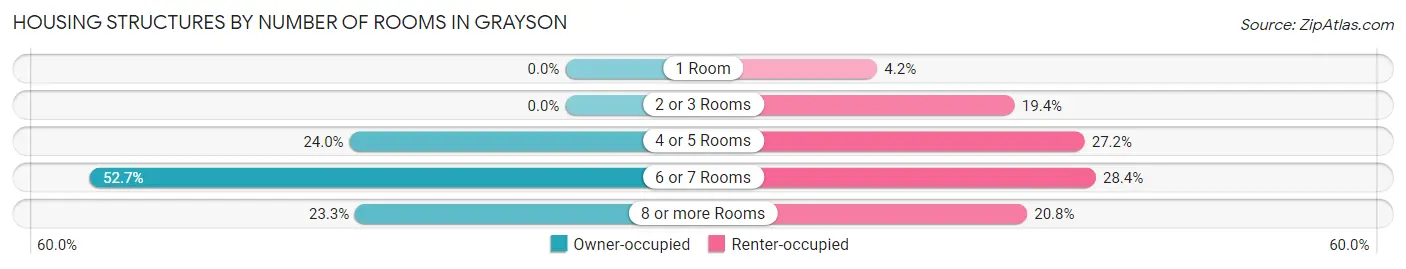
| Number of Rooms | Owner-occupied | Renter-occupied |
| 1 Room | 0 (0.0%) | 30 (4.2%) |
| 2 or 3 Rooms | 0 (0.0%) | 140 (19.4%) |
| 4 or 5 Rooms | 154 (23.9%) | 196 (27.2%) |
| 6 or 7 Rooms | 339 (52.7%) | 205 (28.4%) |
| 8 or more Rooms | 150 (23.3%) | 150 (20.8%) |
| Total | 643 (100.0%) | 721 (100.0%) |
Housing Structure by Heating Type in Grayson
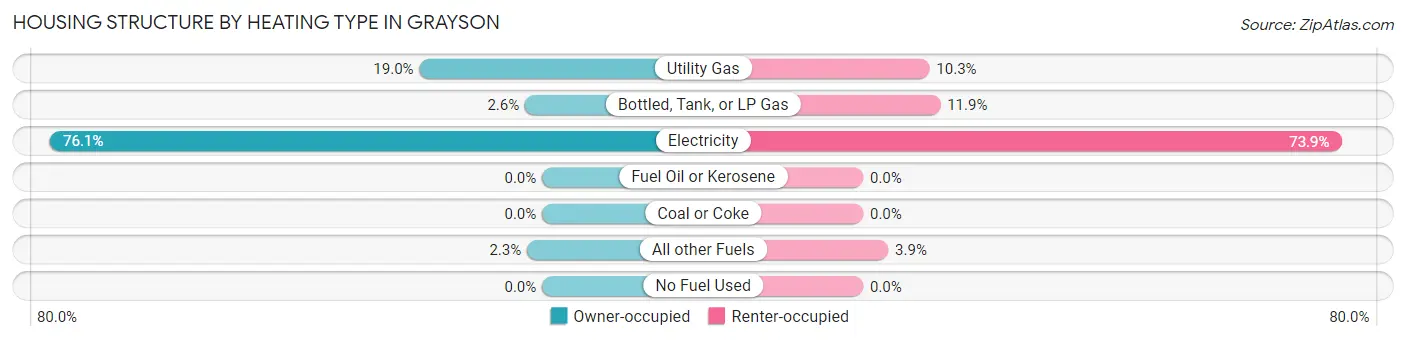
| Heating Type | Owner-occupied | Renter-occupied |
| Utility Gas | 122 (19.0%) | 74 (10.3%) |
| Bottled, Tank, or LP Gas | 17 (2.6%) | 86 (11.9%) |
| Electricity | 489 (76.0%) | 533 (73.9%) |
| Fuel Oil or Kerosene | 0 (0.0%) | 0 (0.0%) |
| Coal or Coke | 0 (0.0%) | 0 (0.0%) |
| All other Fuels | 15 (2.3%) | 28 (3.9%) |
| No Fuel Used | 0 (0.0%) | 0 (0.0%) |
| Total | 643 (100.0%) | 721 (100.0%) |
Household Vehicle Usage in Grayson
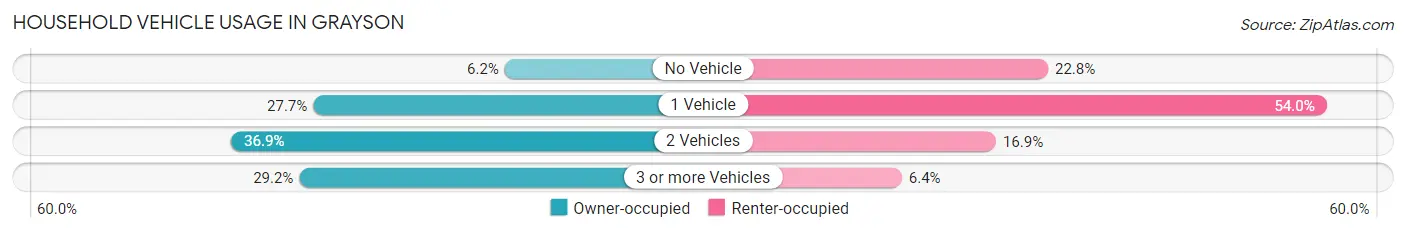
| Vehicles per Household | Owner-occupied | Renter-occupied |
| No Vehicle | 40 (6.2%) | 164 (22.8%) |
| 1 Vehicle | 178 (27.7%) | 389 (53.9%) |
| 2 Vehicles | 237 (36.9%) | 122 (16.9%) |
| 3 or more Vehicles | 188 (29.2%) | 46 (6.4%) |
| Total | 643 (100.0%) | 721 (100.0%) |
Real Estate & Mortgages in Grayson
Real Estate and Mortgage Overview in Grayson
| Characteristic | Without Mortgage | With Mortgage |
| Housing Units | 287 | 356 |
| Median Property Value | $103,400 | $148,300 |
| Median Household Income | $30,592 | $27 |
| Monthly Housing Costs | $408 | $0 |
| Real Estate Taxes | - | - |
Property Value by Mortgage Status in Grayson
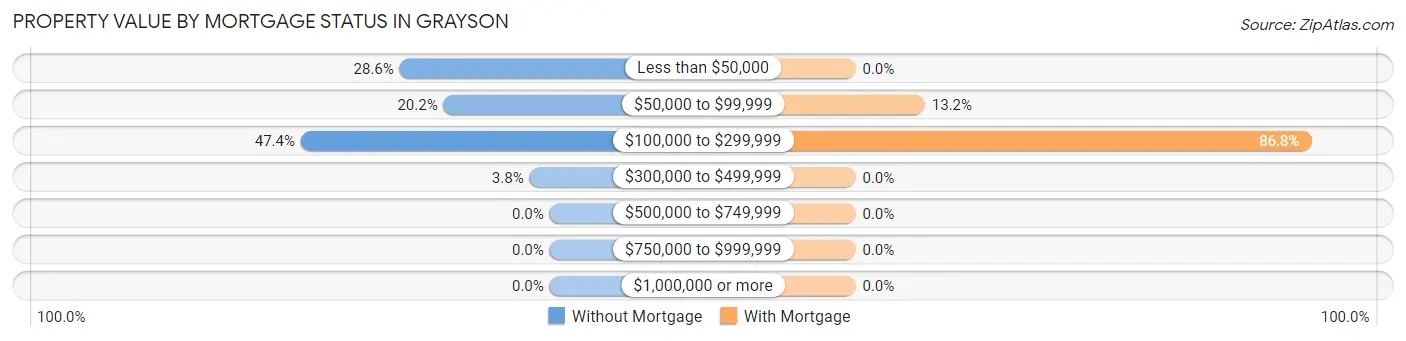
| Property Value | Without Mortgage | With Mortgage |
| Less than $50,000 | 82 (28.6%) | 0 (0.0%) |
| $50,000 to $99,999 | 58 (20.2%) | 47 (13.2%) |
| $100,000 to $299,999 | 136 (47.4%) | 309 (86.8%) |
| $300,000 to $499,999 | 11 (3.8%) | 0 (0.0%) |
| $500,000 to $749,999 | 0 (0.0%) | 0 (0.0%) |
| $750,000 to $999,999 | 0 (0.0%) | 0 (0.0%) |
| $1,000,000 or more | 0 (0.0%) | 0 (0.0%) |
| Total | 287 (100.0%) | 356 (100.0%) |
Household Income by Mortgage Status in Grayson
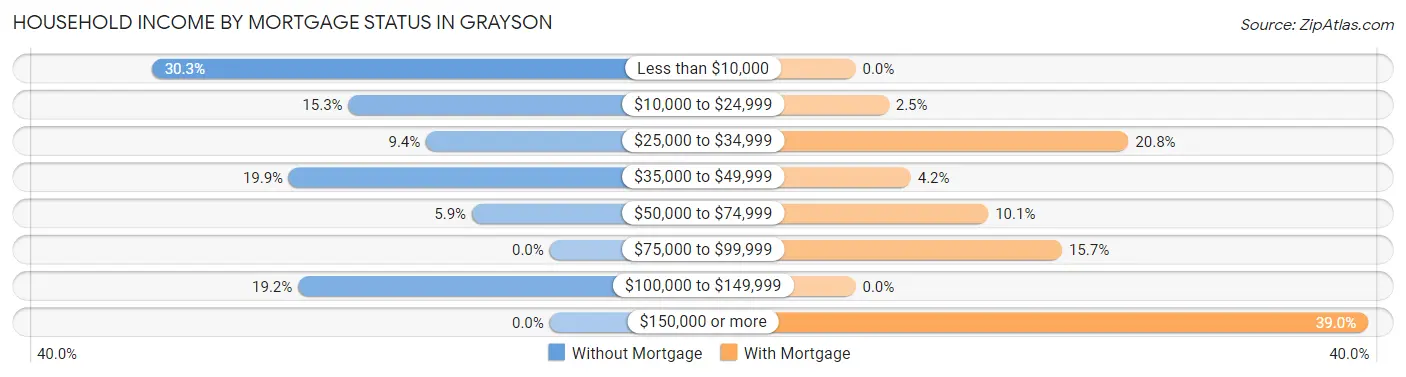
| Household Income | Without Mortgage | With Mortgage |
| Less than $10,000 | 87 (30.3%) | 0 (0.0%) |
| $10,000 to $24,999 | 44 (15.3%) | 9 (2.5%) |
| $25,000 to $34,999 | 27 (9.4%) | 74 (20.8%) |
| $35,000 to $49,999 | 57 (19.9%) | 15 (4.2%) |
| $50,000 to $74,999 | 17 (5.9%) | 36 (10.1%) |
| $75,000 to $99,999 | 0 (0.0%) | 56 (15.7%) |
| $100,000 to $149,999 | 55 (19.2%) | 0 (0.0%) |
| $150,000 or more | 0 (0.0%) | 139 (39.0%) |
| Total | 287 (100.0%) | 356 (100.0%) |
Property Value to Household Income Ratio in Grayson

| Value-to-Income Ratio | Without Mortgage | With Mortgage |
| Less than 2.0x | 75 (26.1%) | 67,069 (18,839.6%) |
| 2.0x to 2.9x | 72 (25.1%) | 175 (49.2%) |
| 3.0x to 3.9x | 19 (6.6%) | 50 (14.0%) |
| 4.0x or more | 121 (42.2%) | 20 (5.6%) |
| Total | 287 (100.0%) | 356 (100.0%) |
Real Estate Taxes by Mortgage Status in Grayson
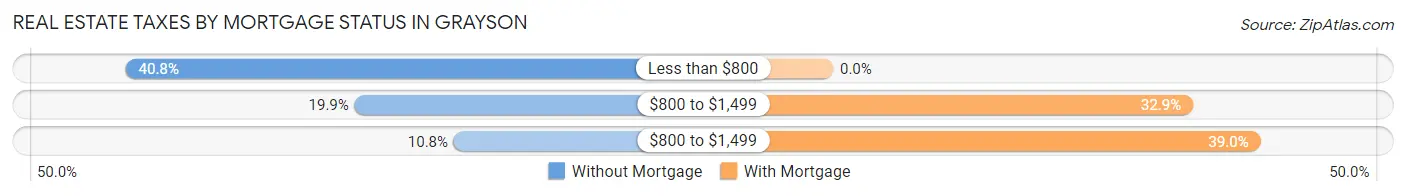
| Property Taxes | Without Mortgage | With Mortgage |
| Less than $800 | 117 (40.8%) | 0 (0.0%) |
| $800 to $1,499 | 57 (19.9%) | 117 (32.9%) |
| $800 to $1,499 | 31 (10.8%) | 139 (39.0%) |
| Total | 287 (100.0%) | 356 (100.0%) |
Health & Disability in Grayson
Health Insurance Coverage by Age in Grayson
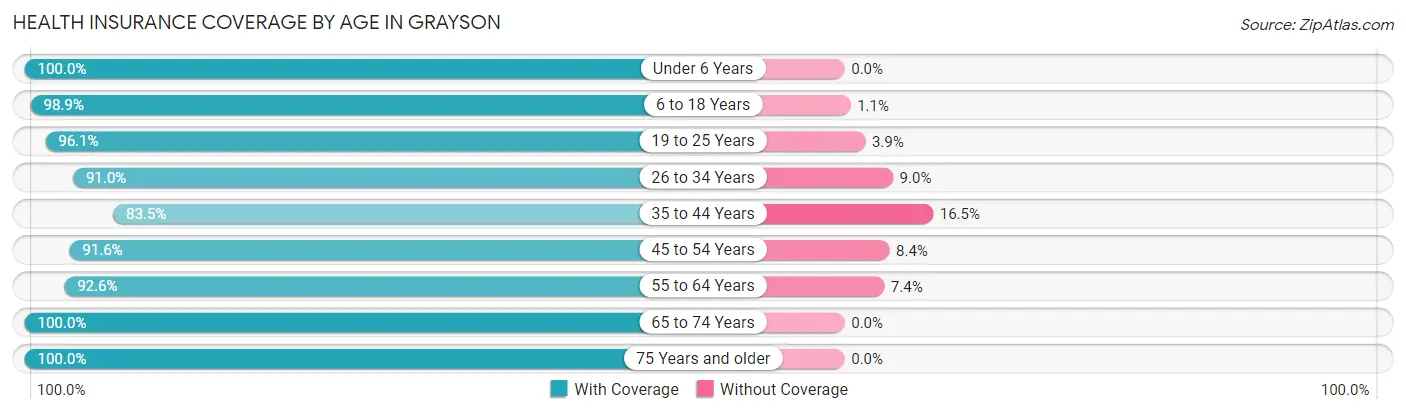
| Age Bracket | With Coverage | Without Coverage |
| Under 6 Years | 229 (100.0%) | 0 (0.0%) |
| 6 to 18 Years | 535 (98.9%) | 6 (1.1%) |
| 19 to 25 Years | 399 (96.1%) | 16 (3.9%) |
| 26 to 34 Years | 656 (91.0%) | 65 (9.0%) |
| 35 to 44 Years | 258 (83.5%) | 51 (16.5%) |
| 45 to 54 Years | 252 (91.6%) | 23 (8.4%) |
| 55 to 64 Years | 476 (92.6%) | 38 (7.4%) |
| 65 to 74 Years | 342 (100.0%) | 0 (0.0%) |
| 75 Years and older | 193 (100.0%) | 0 (0.0%) |
| Total | 3,340 (94.4%) | 199 (5.6%) |
Health Insurance Coverage by Citizenship Status in Grayson
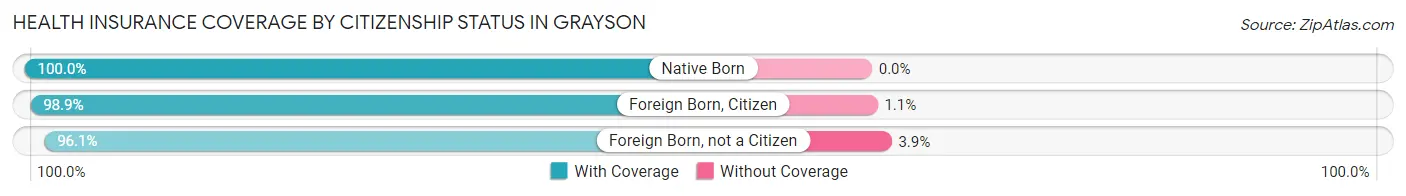
| Citizenship Status | With Coverage | Without Coverage |
| Native Born | 229 (100.0%) | 0 (0.0%) |
| Foreign Born, Citizen | 535 (98.9%) | 6 (1.1%) |
| Foreign Born, not a Citizen | 399 (96.1%) | 16 (3.9%) |
Health Insurance Coverage by Household Income in Grayson
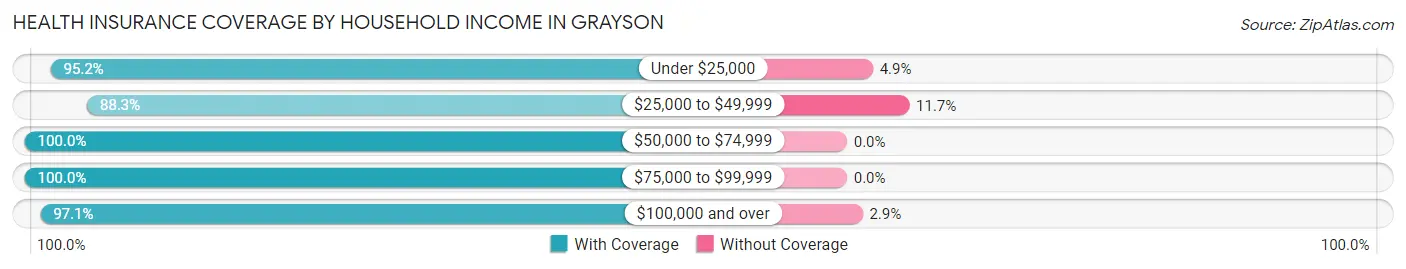
| Household Income | With Coverage | Without Coverage |
| Under $25,000 | 1,275 (95.2%) | 65 (4.9%) |
| $25,000 to $49,999 | 681 (88.3%) | 90 (11.7%) |
| $50,000 to $74,999 | 303 (100.0%) | 0 (0.0%) |
| $75,000 to $99,999 | 27 (100.0%) | 0 (0.0%) |
| $100,000 and over | 729 (97.1%) | 22 (2.9%) |
Public vs Private Health Insurance Coverage by Age in Grayson
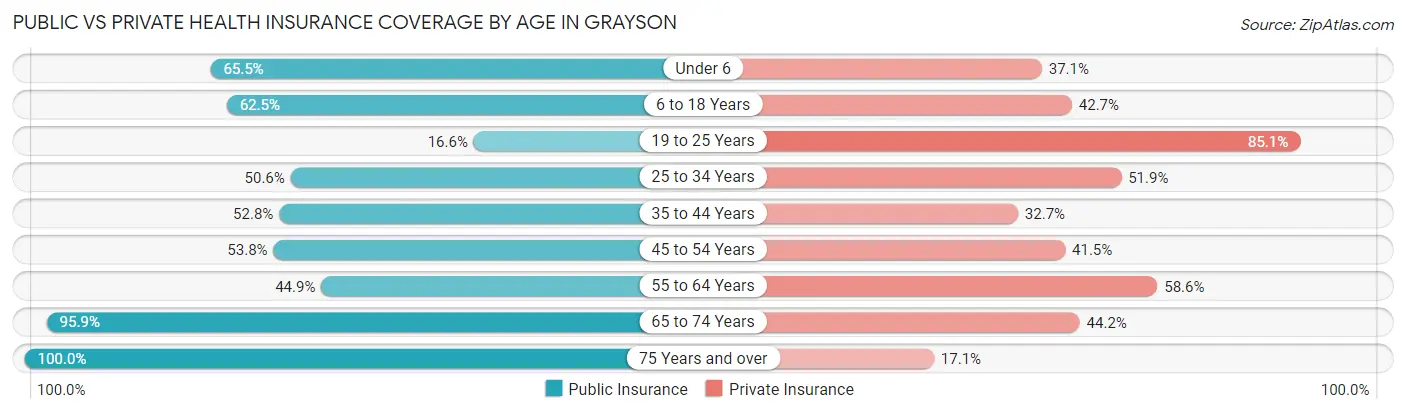
| Age Bracket | Public Insurance | Private Insurance |
| Under 6 | 150 (65.5%) | 85 (37.1%) |
| 6 to 18 Years | 338 (62.5%) | 231 (42.7%) |
| 19 to 25 Years | 69 (16.6%) | 353 (85.1%) |
| 25 to 34 Years | 365 (50.6%) | 374 (51.9%) |
| 35 to 44 Years | 163 (52.7%) | 101 (32.7%) |
| 45 to 54 Years | 148 (53.8%) | 114 (41.4%) |
| 55 to 64 Years | 231 (44.9%) | 301 (58.6%) |
| 65 to 74 Years | 328 (95.9%) | 151 (44.2%) |
| 75 Years and over | 193 (100.0%) | 33 (17.1%) |
| Total | 1,985 (56.1%) | 1,743 (49.2%) |
Disability Status by Sex by Age in Grayson
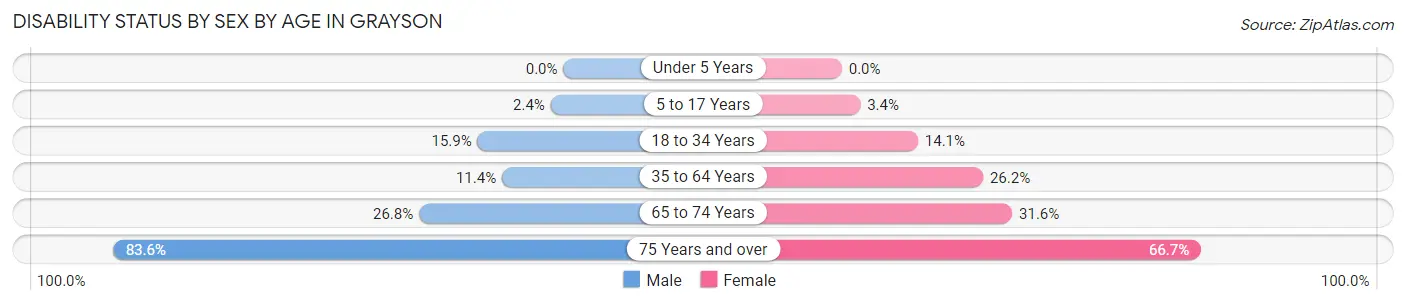
| Age Bracket | Male | Female |
| Under 5 Years | 0 (0.0%) | 0 (0.0%) |
| 5 to 17 Years | 8 (2.4%) | 4 (3.4%) |
| 18 to 34 Years | 112 (15.9%) | 74 (14.1%) |
| 35 to 64 Years | 59 (11.4%) | 152 (26.2%) |
| 65 to 74 Years | 45 (26.8%) | 55 (31.6%) |
| 75 Years and over | 46 (83.6%) | 92 (66.7%) |
Disability Class by Sex by Age in Grayson
Disability Class: Hearing Difficulty
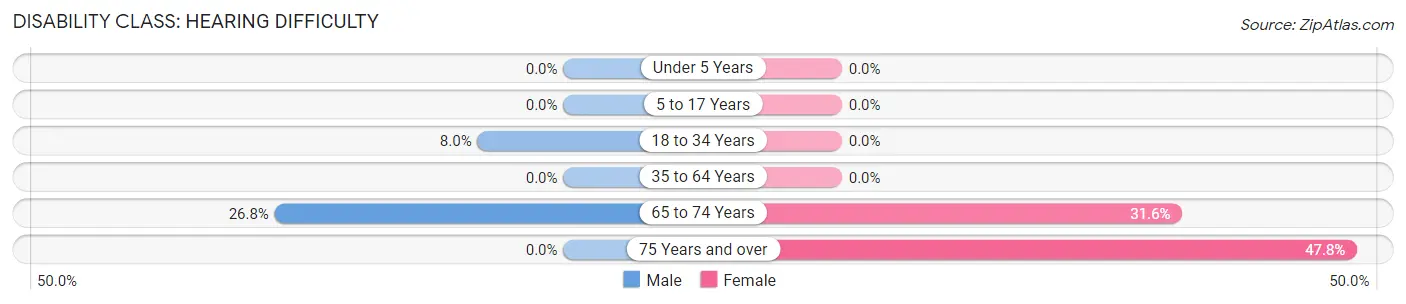
| Age Bracket | Male | Female |
| Under 5 Years | 0 (0.0%) | 0 (0.0%) |
| 5 to 17 Years | 0 (0.0%) | 0 (0.0%) |
| 18 to 34 Years | 56 (8.0%) | 0 (0.0%) |
| 35 to 64 Years | 0 (0.0%) | 0 (0.0%) |
| 65 to 74 Years | 45 (26.8%) | 55 (31.6%) |
| 75 Years and over | 0 (0.0%) | 66 (47.8%) |
Disability Class: Vision Difficulty
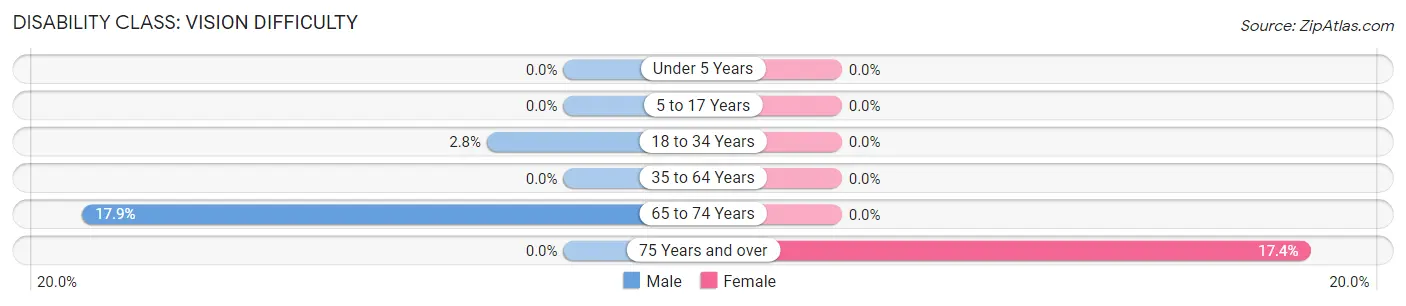
| Age Bracket | Male | Female |
| Under 5 Years | 0 (0.0%) | 0 (0.0%) |
| 5 to 17 Years | 0 (0.0%) | 0 (0.0%) |
| 18 to 34 Years | 20 (2.8%) | 0 (0.0%) |
| 35 to 64 Years | 0 (0.0%) | 0 (0.0%) |
| 65 to 74 Years | 30 (17.9%) | 0 (0.0%) |
| 75 Years and over | 0 (0.0%) | 24 (17.4%) |
Disability Class: Cognitive Difficulty
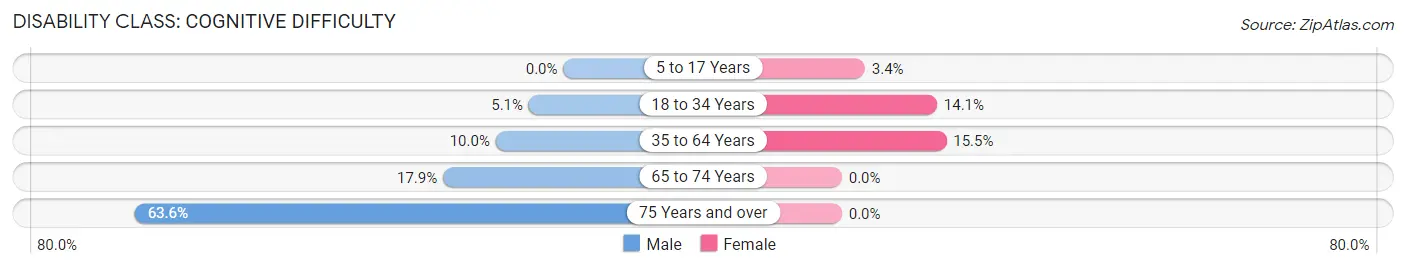
| Age Bracket | Male | Female |
| 5 to 17 Years | 0 (0.0%) | 4 (3.4%) |
| 18 to 34 Years | 36 (5.1%) | 74 (14.1%) |
| 35 to 64 Years | 52 (10.0%) | 90 (15.5%) |
| 65 to 74 Years | 30 (17.9%) | 0 (0.0%) |
| 75 Years and over | 35 (63.6%) | 0 (0.0%) |
Disability Class: Ambulatory Difficulty
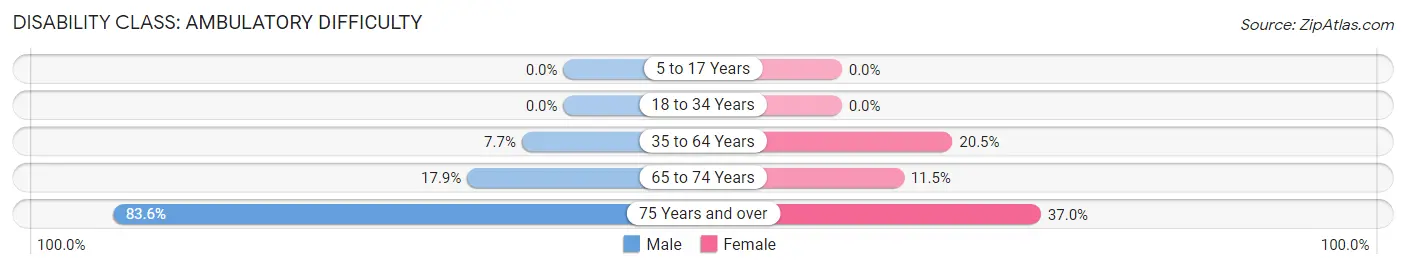
| Age Bracket | Male | Female |
| 5 to 17 Years | 0 (0.0%) | 0 (0.0%) |
| 18 to 34 Years | 0 (0.0%) | 0 (0.0%) |
| 35 to 64 Years | 40 (7.7%) | 119 (20.5%) |
| 65 to 74 Years | 30 (17.9%) | 20 (11.5%) |
| 75 Years and over | 46 (83.6%) | 51 (37.0%) |
Disability Class: Self-Care Difficulty
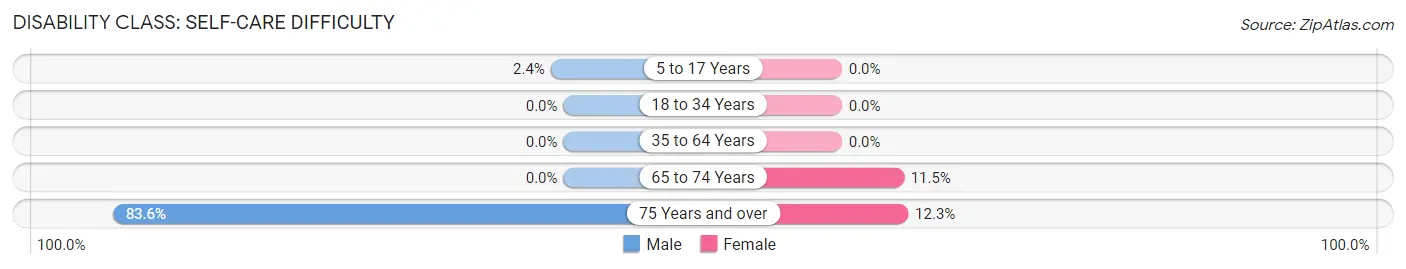
| Age Bracket | Male | Female |
| 5 to 17 Years | 8 (2.4%) | 0 (0.0%) |
| 18 to 34 Years | 0 (0.0%) | 0 (0.0%) |
| 35 to 64 Years | 0 (0.0%) | 0 (0.0%) |
| 65 to 74 Years | 0 (0.0%) | 20 (11.5%) |
| 75 Years and over | 46 (83.6%) | 17 (12.3%) |
Technology Access in Grayson
Computing Device Access in Grayson
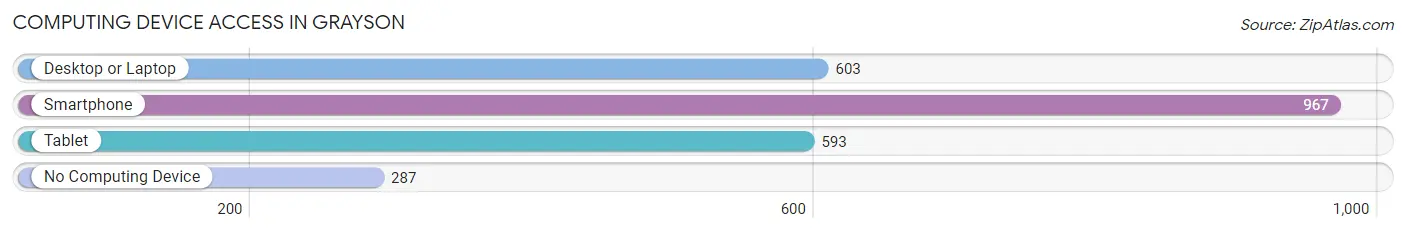
| Device Type | # Households | % Households |
| Desktop or Laptop | 603 | 44.2% |
| Smartphone | 967 | 70.9% |
| Tablet | 593 | 43.5% |
| No Computing Device | 287 | 21.0% |
| Total | 1,364 | 100.0% |
Internet Access in Grayson
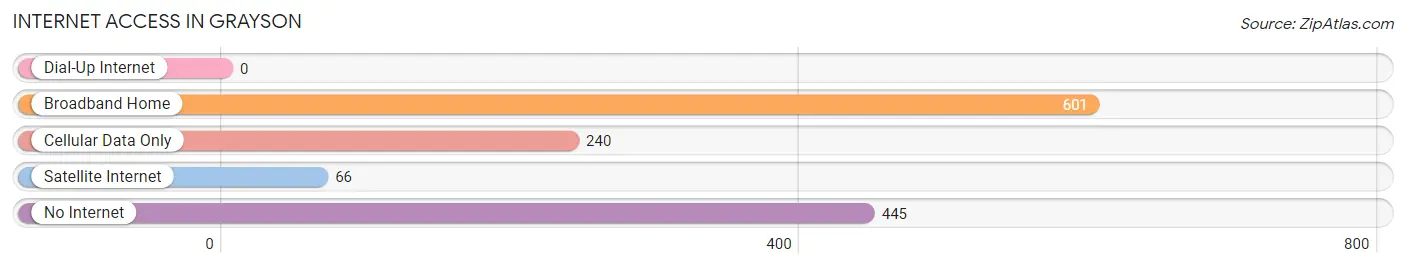
| Internet Type | # Households | % Households |
| Dial-Up Internet | 0 | 0.0% |
| Broadband Home | 601 | 44.1% |
| Cellular Data Only | 240 | 17.6% |
| Satellite Internet | 66 | 4.8% |
| No Internet | 445 | 32.6% |
| Total | 1,364 | 100.0% |
Grayson Summary
Grayson, Kentucky is a small city located in Carter County, Kentucky. It is situated on the banks of the Little Sandy River, and is part of the Huntington-Ashland metropolitan area. The city has a population of approximately 4,000 people, and is the county seat of Carter County.
History
Grayson was founded in 1810 by William Grayson, a Revolutionary War veteran. The city was originally known as Grayson’s Station, and was a stop on the stagecoach route between Lexington and Maysville. In 1817, the city was officially incorporated as Grayson.
In the early 19th century, Grayson was a thriving river port, and was a major stop on the Ohio and Kentucky Railroad. The city was also home to several mills, including a grist mill, a saw mill, and a woolen mill.
In the late 19th century, Grayson experienced a period of growth and prosperity. The city was home to several businesses, including a bank, a newspaper, a hotel, and a variety of stores.
Geography
Grayson is located in the foothills of the Appalachian Mountains, and is situated on the banks of the Little Sandy River. The city is located approximately 30 miles east of Lexington, and is part of the Huntington-Ashland metropolitan area.
The city has a total area of 2.2 square miles, all of which is land. The city is located at an elevation of 845 feet above sea level.
Economy
Grayson’s economy is largely based on agriculture and tourism. The city is home to several farms, and is a popular destination for outdoor recreation.
The city is also home to several businesses, including a bank, a newspaper, a hotel, and a variety of stores.
Demographics
As of the 2010 census, Grayson had a population of 4,000 people. The racial makeup of the city was 97.2% White, 0.7% African American, 0.2% Native American, 0.2% Asian, 0.2% from other races, and 1.7% from two or more races. Hispanic or Latino of any race were 0.7% of the population.
The median income for a household in Grayson was $30,000, and the median income for a family was $35,000. The per capita income for the city was $15,000. About 17.2% of families and 19.2% of the population were below the poverty line, including 25.2% of those under age 18 and 11.2% of those age 65 or over.
Common Questions
What is Per Capita Income in Grayson?
Per Capita income in Grayson is $17,077.
What is the Median Family Income in Grayson?
Median Family Income in Grayson is $40,417.
What is the Median Household income in Grayson?
Median Household Income in Grayson is $27,045.
What is Income or Wage Gap in Grayson?
Income or Wage Gap in Grayson is 30.3%.
Women in Grayson earn 69.7 cents for every dollar earned by a man.
What is Inequality or Gini Index in Grayson?
Inequality or Gini Index in Grayson is 0.54.
What is the Total Population of Grayson?
Total Population of Grayson is 3,841.
What is the Total Male Population of Grayson?
Total Male Population of Grayson is 2,033.
What is the Total Female Population of Grayson?
Total Female Population of Grayson is 1,808.
What is the Ratio of Males per 100 Females in Grayson?
There are 112.44 Males per 100 Females in Grayson.
What is the Ratio of Females per 100 Males in Grayson?
There are 88.93 Females per 100 Males in Grayson.
What is the Median Population Age in Grayson?
Median Population Age in Grayson is 32.8 Years.
What is the Average Family Size in Grayson
Average Family Size in Grayson is 3.5 People.
What is the Average Household Size in Grayson
Average Household Size in Grayson is 2.3 People.
How Large is the Labor Force in Grayson?
There are 1,412 People in the Labor Forcein in Grayson.
What is the Percentage of People in the Labor Force in Grayson?
44.0% of People are in the Labor Force in Grayson.
What is the Unemployment Rate in Grayson?
Unemployment Rate in Grayson is 13.4%.