Bellefonte, KY Map & Demographics
Bellefonte Map
Bellefonte Overview
$58,194
PER CAPITA INCOME
$123,958
AVG FAMILY INCOME
$109,750
AVG HOUSEHOLD INCOME
57.0%
WAGE / INCOME GAP [ % ]
43.0¢/ $1
WAGE / INCOME GAP [ $ ]
0.48
INEQUALITY / GINI INDEX
1,216
TOTAL POPULATION
558
MALE POPULATION
658
FEMALE POPULATION
84.80
MALES / 100 FEMALES
117.92
FEMALES / 100 MALES
39.5
MEDIAN AGE
3.1
AVG FAMILY SIZE
2.8
AVG HOUSEHOLD SIZE
525
LABOR FORCE [ PEOPLE ]
60.0%
PERCENT IN LABOR FORCE
2.7%
UNEMPLOYMENT RATE
Income in Bellefonte
Income Overview in Bellefonte
Per Capita Income in Bellefonte is $58,194, while median incomes of families and households are $123,958 and $109,750 respectively.
| Characteristic | Number | Measure |
| Per Capita Income | 1,216 | $58,194 |
| Median Family Income | 348 | $123,958 |
| Mean Family Income | 348 | $185,574 |
| Median Household Income | 429 | $109,750 |
| Mean Household Income | 429 | $164,505 |
| Income Deficit | 348 | $0 |
| Wage / Income Gap (%) | 1,216 | 57.02% |
| Wage / Income Gap ($) | 1,216 | 42.98¢ per $1 |
| Gini / Inequality Index | 1,216 | 0.48 |
Earnings by Sex in Bellefonte
Average Earnings in Bellefonte are $69,653, $110,313 for men and $47,414 for women, a difference of 57.0%.
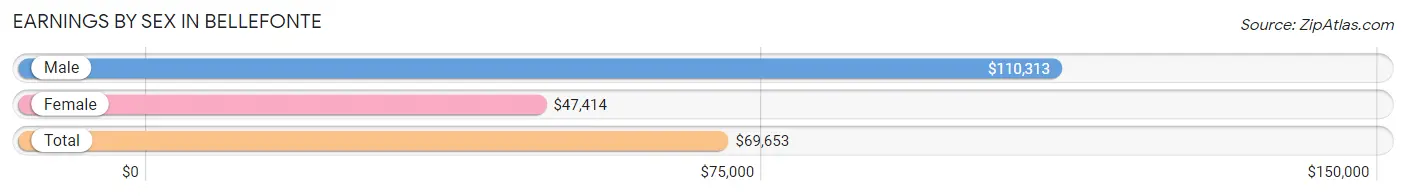
| Sex | Number | Average Earnings |
| Male | 269 (49.5%) | $110,313 |
| Female | 274 (50.5%) | $47,414 |
| Total | 543 (100.0%) | $69,653 |
Earnings by Sex by Income Bracket in Bellefonte
The most common earnings brackets in Bellefonte are $100,000+ for men (139 | 51.7%) and $100,000+ for women (47 | 17.2%).
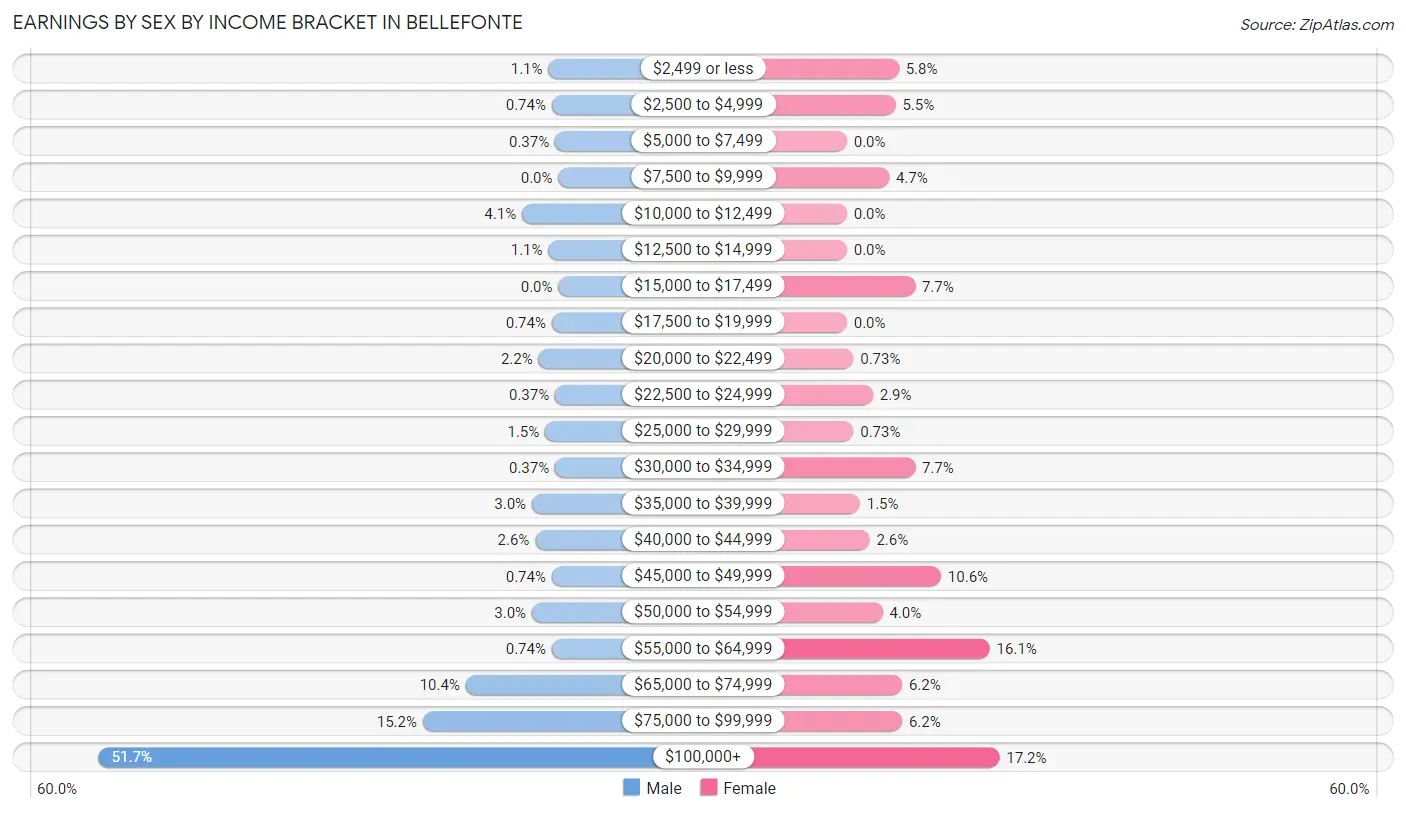
| Income | Male | Female |
| $2,499 or less | 3 (1.1%) | 16 (5.8%) |
| $2,500 to $4,999 | 2 (0.7%) | 15 (5.5%) |
| $5,000 to $7,499 | 1 (0.4%) | 0 (0.0%) |
| $7,500 to $9,999 | 0 (0.0%) | 13 (4.7%) |
| $10,000 to $12,499 | 11 (4.1%) | 0 (0.0%) |
| $12,500 to $14,999 | 3 (1.1%) | 0 (0.0%) |
| $15,000 to $17,499 | 0 (0.0%) | 21 (7.7%) |
| $17,500 to $19,999 | 2 (0.7%) | 0 (0.0%) |
| $20,000 to $22,499 | 6 (2.2%) | 2 (0.7%) |
| $22,500 to $24,999 | 1 (0.4%) | 8 (2.9%) |
| $25,000 to $29,999 | 4 (1.5%) | 2 (0.7%) |
| $30,000 to $34,999 | 1 (0.4%) | 21 (7.7%) |
| $35,000 to $39,999 | 8 (3.0%) | 4 (1.5%) |
| $40,000 to $44,999 | 7 (2.6%) | 7 (2.5%) |
| $45,000 to $49,999 | 2 (0.7%) | 29 (10.6%) |
| $50,000 to $54,999 | 8 (3.0%) | 11 (4.0%) |
| $55,000 to $64,999 | 2 (0.7%) | 44 (16.1%) |
| $65,000 to $74,999 | 28 (10.4%) | 17 (6.2%) |
| $75,000 to $99,999 | 41 (15.2%) | 17 (6.2%) |
| $100,000+ | 139 (51.7%) | 47 (17.2%) |
| Total | 269 (100.0%) | 274 (100.0%) |
Earnings by Sex by Educational Attainment in Bellefonte
Average earnings in Bellefonte are $116,875 for men and $51,250 for women, a difference of 56.1%. Men with an educational attainment of graduate degree enjoy the highest average annual earnings of $177,917, while those with high school diploma education earn the least with $63,750. Women with an educational attainment of bachelor's degree earn the most with the average annual earnings of $56,563, while those with graduate degree education have the smallest earnings of $56,023.
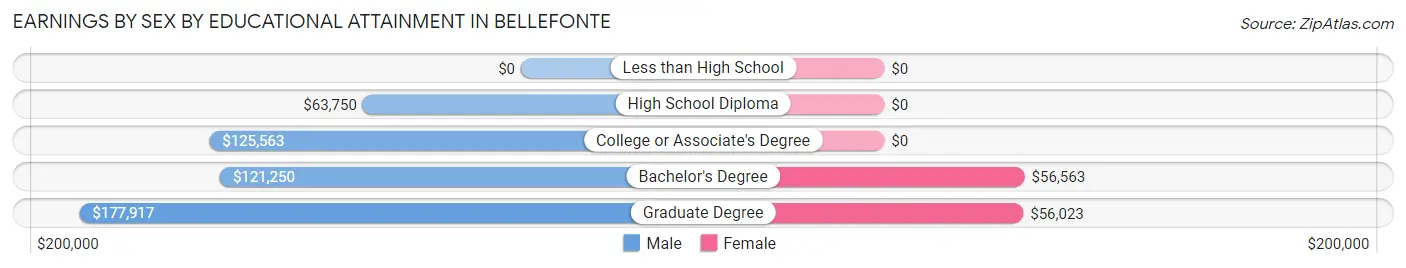
| Educational Attainment | Male Income | Female Income |
| Less than High School | - | - |
| High School Diploma | $63,750 | $0 |
| College or Associate's Degree | $125,563 | $0 |
| Bachelor's Degree | $121,250 | $56,563 |
| Graduate Degree | $177,917 | $56,023 |
| Total | $116,875 | $51,250 |
Family Income in Bellefonte
Family Income Brackets in Bellefonte
According to the Bellefonte family income data, there are 105 families falling into the $200,000+ income range, which is the most common income bracket and makes up 30.2% of all families. Conversely, the $10,000 to $14,999 income bracket is the least frequent group with only 6 families (1.7%) belonging to this category.
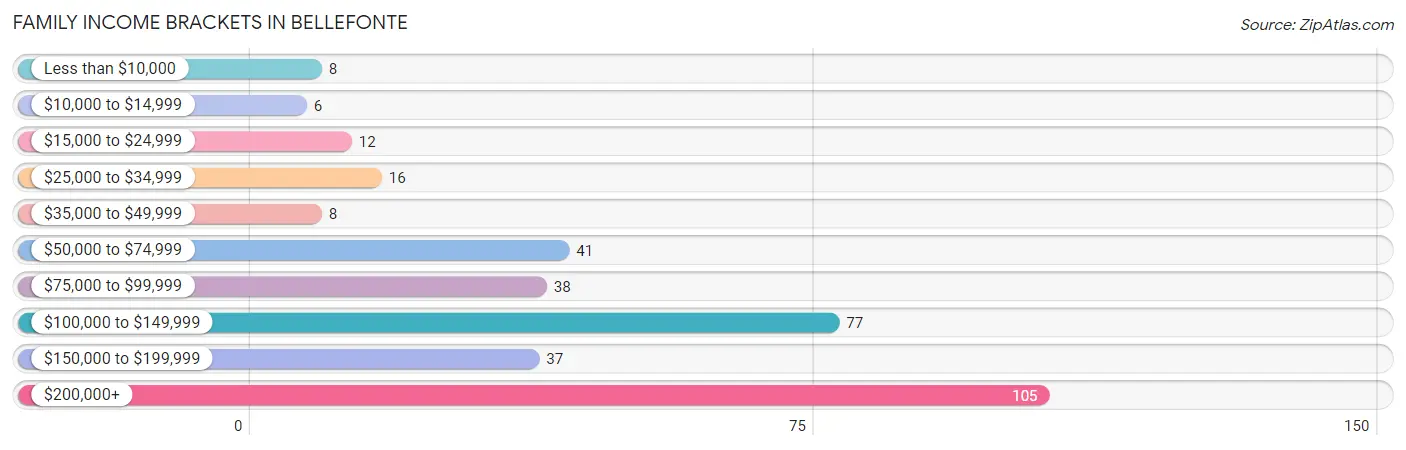
| Income Bracket | # Families | % Families |
| Less than $10,000 | 8 | 2.3% |
| $10,000 to $14,999 | 6 | 1.7% |
| $15,000 to $24,999 | 12 | 3.4% |
| $25,000 to $34,999 | 16 | 4.6% |
| $35,000 to $49,999 | 8 | 2.3% |
| $50,000 to $74,999 | 41 | 11.8% |
| $75,000 to $99,999 | 38 | 10.9% |
| $100,000 to $149,999 | 77 | 22.1% |
| $150,000 to $199,999 | 37 | 10.6% |
| $200,000+ | 105 | 30.2% |
Family Income by Famaliy Size in Bellefonte
4-person families (67 | 19.3%) account for the highest median family income in Bellefonte with $192,917 per family, while 2-person families (177 | 50.9%) have the highest median income of $59,610 per family member.
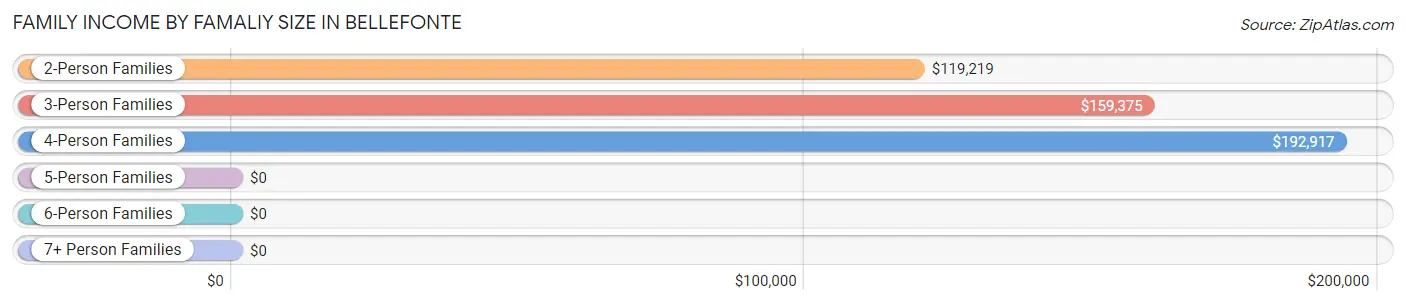
| Income Bracket | # Families | Median Income |
| 2-Person Families | 177 (50.9%) | $119,219 |
| 3-Person Families | 60 (17.2%) | $159,375 |
| 4-Person Families | 67 (19.3%) | $192,917 |
| 5-Person Families | 20 (5.8%) | $0 |
| 6-Person Families | 24 (6.9%) | $0 |
| 7+ Person Families | 0 (0.0%) | $0 |
| Total | 348 (100.0%) | $123,958 |
Family Income by Number of Earners in Bellefonte
The median family income in Bellefonte is $123,958, with families comprising 3+ earners (18) having the highest median family income of $250,001, while families with no earners (71) have the lowest median family income of $70,625, accounting for 5.2% and 20.4% of families, respectively.
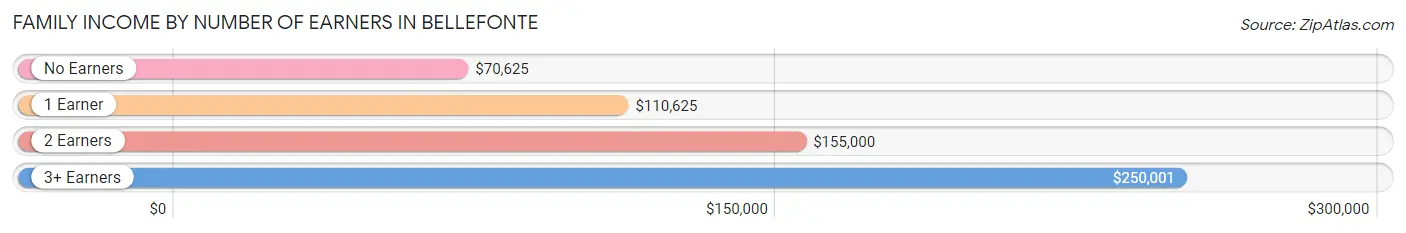
| Number of Earners | # Families | Median Income |
| No Earners | 71 (20.4%) | $70,625 |
| 1 Earner | 99 (28.4%) | $110,625 |
| 2 Earners | 160 (46.0%) | $155,000 |
| 3+ Earners | 18 (5.2%) | $250,001 |
| Total | 348 (100.0%) | $123,958 |
Household Income in Bellefonte
Household Income Brackets in Bellefonte
With 106 households falling in the category, the $200,000+ income range is the most frequent in Bellefonte, accounting for 24.7% of all households. In contrast, only 9 households (2.1%) fall into the $10,000 to $14,999 income bracket, making it the least populous group.
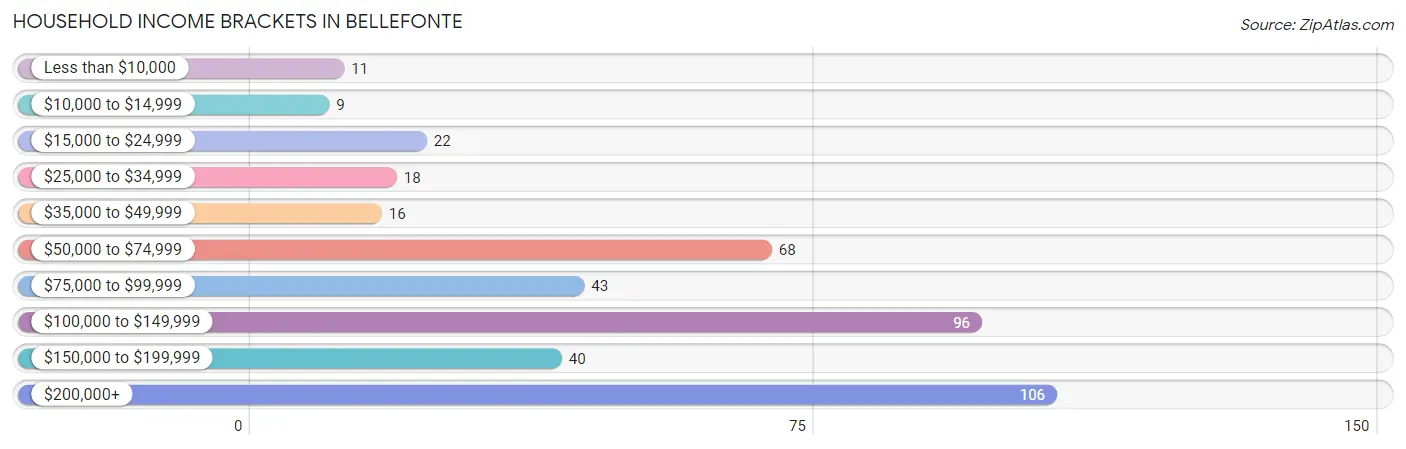
| Income Bracket | # Households | % Households |
| Less than $10,000 | 11 | 2.6% |
| $10,000 to $14,999 | 9 | 2.1% |
| $15,000 to $24,999 | 22 | 5.1% |
| $25,000 to $34,999 | 18 | 4.2% |
| $35,000 to $49,999 | 16 | 3.7% |
| $50,000 to $74,999 | 68 | 15.9% |
| $75,000 to $99,999 | 43 | 10.0% |
| $100,000 to $149,999 | 96 | 22.4% |
| $150,000 to $199,999 | 40 | 9.3% |
| $200,000+ | 106 | 24.7% |
Household Income by Householder Age in Bellefonte
The median household income in Bellefonte is $109,750, with the highest median household income of $183,750 found in the 25 to 44 years age bracket for the primary householder. A total of 142 households (33.1%) fall into this category. Meanwhile, the 15 to 24 years age bracket for the primary householder has the lowest median household income of $0, with 8 households (1.9%) in this group.
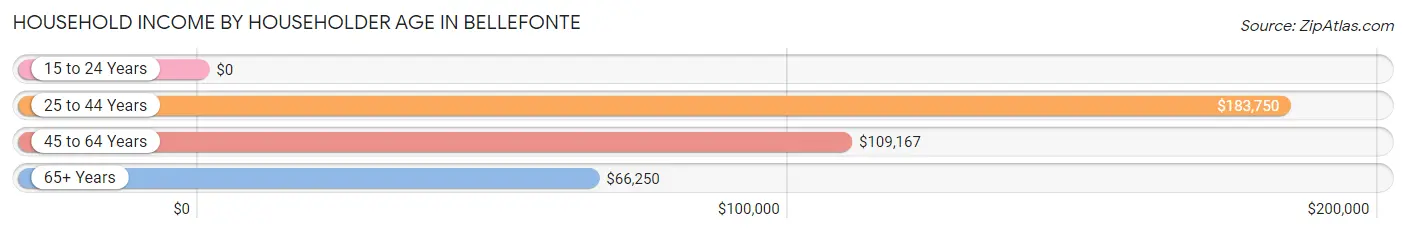
| Income Bracket | # Households | Median Income |
| 15 to 24 Years | 8 (1.9%) | $0 |
| 25 to 44 Years | 142 (33.1%) | $183,750 |
| 45 to 64 Years | 158 (36.8%) | $109,167 |
| 65+ Years | 121 (28.2%) | $66,250 |
| Total | 429 (100.0%) | $109,750 |
Poverty in Bellefonte
Income Below Poverty by Sex and Age in Bellefonte
With 7.9% poverty level for males and 8.2% for females among the residents of Bellefonte, 18 to 24 year old males and 18 to 24 year old females are the most vulnerable to poverty, with 6 males (46.2%) and 6 females (75.0%) in their respective age groups living below the poverty level.
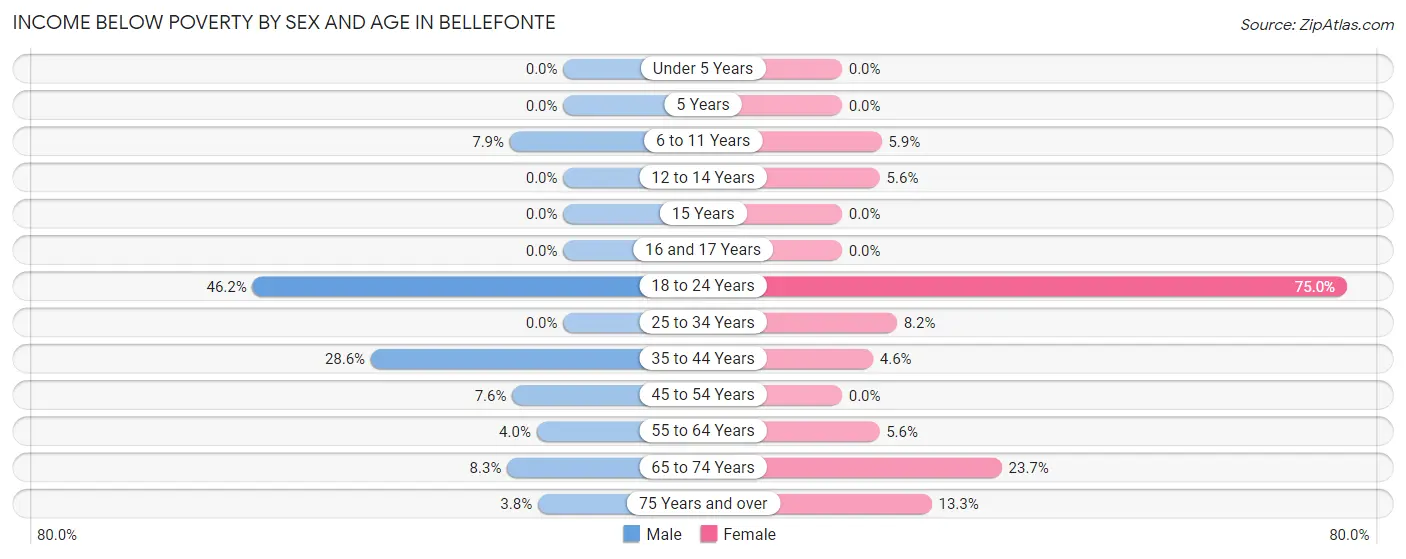
| Age Bracket | Male | Female |
| Under 5 Years | 0 (0.0%) | 0 (0.0%) |
| 5 Years | 0 (0.0%) | 0 (0.0%) |
| 6 to 11 Years | 5 (7.9%) | 5 (5.9%) |
| 12 to 14 Years | 0 (0.0%) | 5 (5.6%) |
| 15 Years | 0 (0.0%) | 0 (0.0%) |
| 16 and 17 Years | 0 (0.0%) | 0 (0.0%) |
| 18 to 24 Years | 6 (46.2%) | 6 (75.0%) |
| 25 to 34 Years | 0 (0.0%) | 4 (8.2%) |
| 35 to 44 Years | 20 (28.6%) | 7 (4.6%) |
| 45 to 54 Years | 5 (7.6%) | 0 (0.0%) |
| 55 to 64 Years | 3 (4.0%) | 3 (5.6%) |
| 65 to 74 Years | 3 (8.3%) | 14 (23.7%) |
| 75 Years and over | 2 (3.8%) | 10 (13.3%) |
| Total | 44 (7.9%) | 54 (8.2%) |
Income Above Poverty by Sex and Age in Bellefonte
According to the poverty statistics in Bellefonte, males aged under 5 years and females aged under 5 years are the age groups that are most secure financially, with 100.0% of males and 100.0% of females in these age groups living above the poverty line.
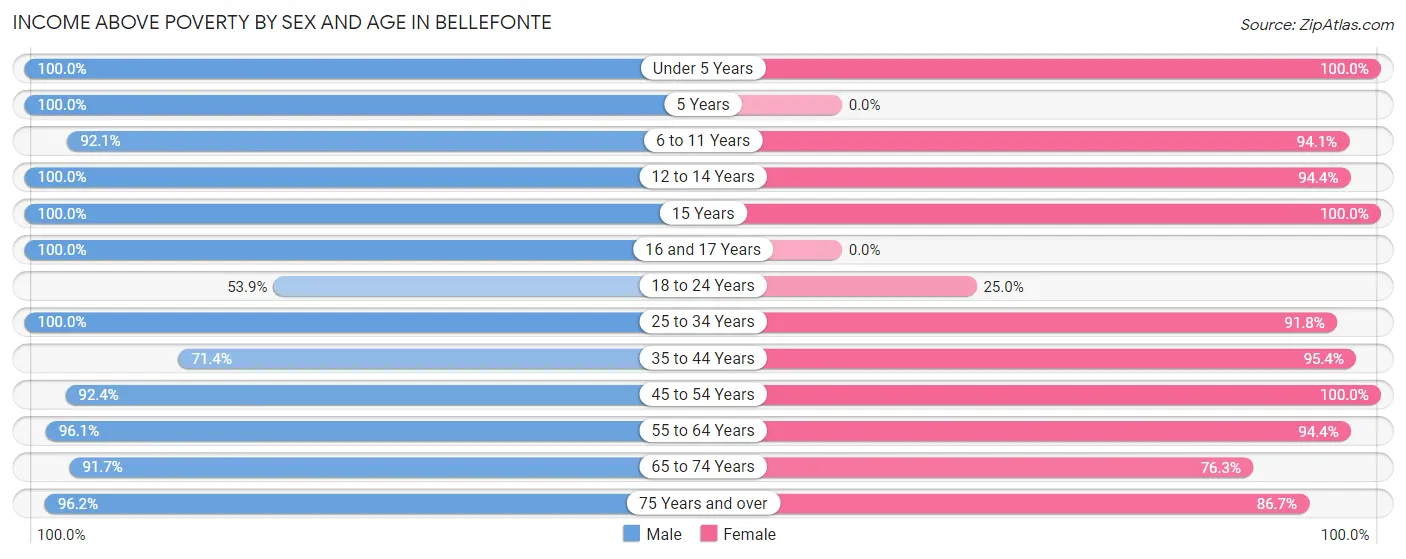
| Age Bracket | Male | Female |
| Under 5 Years | 29 (100.0%) | 23 (100.0%) |
| 5 Years | 3 (100.0%) | 0 (0.0%) |
| 6 to 11 Years | 58 (92.1%) | 80 (94.1%) |
| 12 to 14 Years | 41 (100.0%) | 84 (94.4%) |
| 15 Years | 4 (100.0%) | 2 (100.0%) |
| 16 and 17 Years | 10 (100.0%) | 0 (0.0%) |
| 18 to 24 Years | 7 (53.8%) | 2 (25.0%) |
| 25 to 34 Years | 92 (100.0%) | 45 (91.8%) |
| 35 to 44 Years | 50 (71.4%) | 145 (95.4%) |
| 45 to 54 Years | 61 (92.4%) | 62 (100.0%) |
| 55 to 64 Years | 73 (96.1%) | 51 (94.4%) |
| 65 to 74 Years | 33 (91.7%) | 45 (76.3%) |
| 75 Years and over | 51 (96.2%) | 65 (86.7%) |
| Total | 512 (92.1%) | 604 (91.8%) |
Income Below Poverty Among Married-Couple Families in Bellefonte
The poverty statistics for married-couple families in Bellefonte show that 4.7% or 14 of the total 296 families live below the poverty line. Families with 3 or 4 children have the highest poverty rate of 15.4%, comprising of 6 families. On the other hand, families with 1 or 2 children have the lowest poverty rate of 0.0%, which includes 0 families.
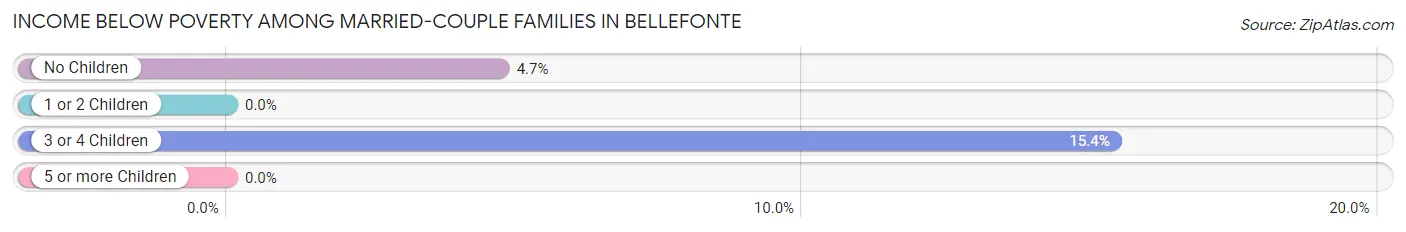
| Children | Above Poverty | Below Poverty |
| No Children | 161 (95.3%) | 8 (4.7%) |
| 1 or 2 Children | 88 (100.0%) | 0 (0.0%) |
| 3 or 4 Children | 33 (84.6%) | 6 (15.4%) |
| 5 or more Children | 0 (0.0%) | 0 (0.0%) |
| Total | 282 (95.3%) | 14 (4.7%) |
Income Below Poverty Among Single-Parent Households in Bellefonte
According to the poverty data in Bellefonte, 25.0% or 6 single-father households and 21.4% or 6 single-mother households are living below the poverty line. Among single-father households, those with no children have the highest poverty rate, with 6 households (100.0%) experiencing poverty. Likewise, among single-mother households, those with no children have the highest poverty rate, with 6 households (66.7%) falling below the poverty line.
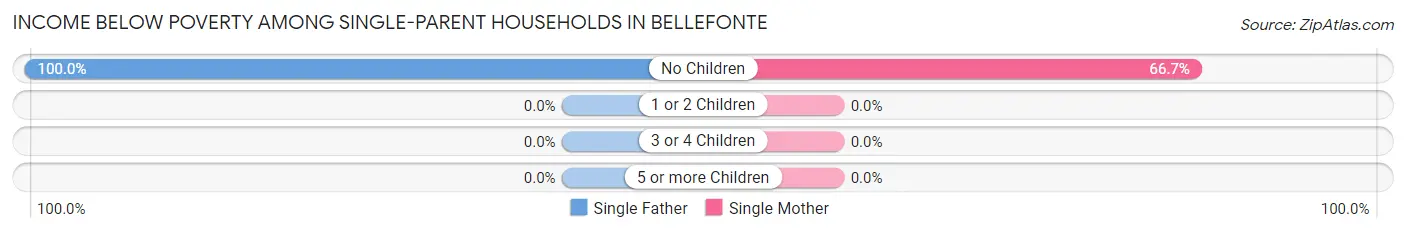
| Children | Single Father | Single Mother |
| No Children | 6 (100.0%) | 6 (66.7%) |
| 1 or 2 Children | 0 (0.0%) | 0 (0.0%) |
| 3 or 4 Children | 0 (0.0%) | 0 (0.0%) |
| 5 or more Children | 0 (0.0%) | 0 (0.0%) |
| Total | 6 (25.0%) | 6 (21.4%) |
Income Below Poverty Among Married-Couple vs Single-Parent Households in Bellefonte
The poverty data for Bellefonte shows that 14 of the married-couple family households (4.7%) and 12 of the single-parent households (23.1%) are living below the poverty level. Within the married-couple family households, those with 3 or 4 children have the highest poverty rate, with 6 households (15.4%) falling below the poverty line. Among the single-parent households, those with no children have the highest poverty rate, with 12 household (80.0%) living below poverty.
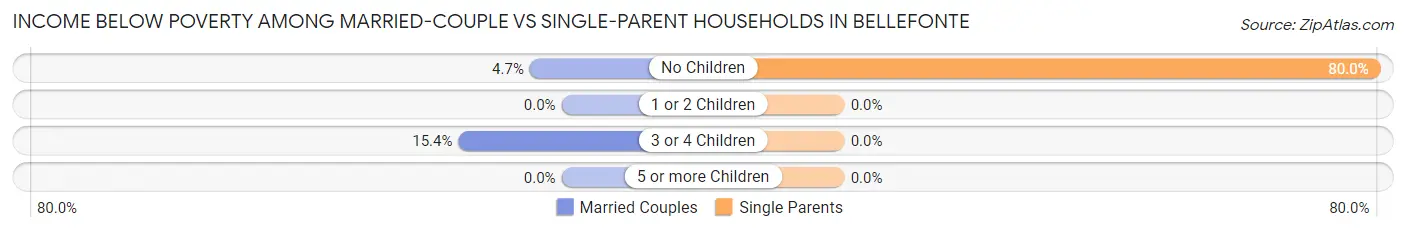
| Children | Married-Couple Families | Single-Parent Households |
| No Children | 8 (4.7%) | 12 (80.0%) |
| 1 or 2 Children | 0 (0.0%) | 0 (0.0%) |
| 3 or 4 Children | 6 (15.4%) | 0 (0.0%) |
| 5 or more Children | 0 (0.0%) | 0 (0.0%) |
| Total | 14 (4.7%) | 12 (23.1%) |
Race in Bellefonte
The most populous races in Bellefonte are White / Caucasian (1,033 | 85.0%), Asian (65 | 5.3%), and Two or more Races (63 | 5.2%).
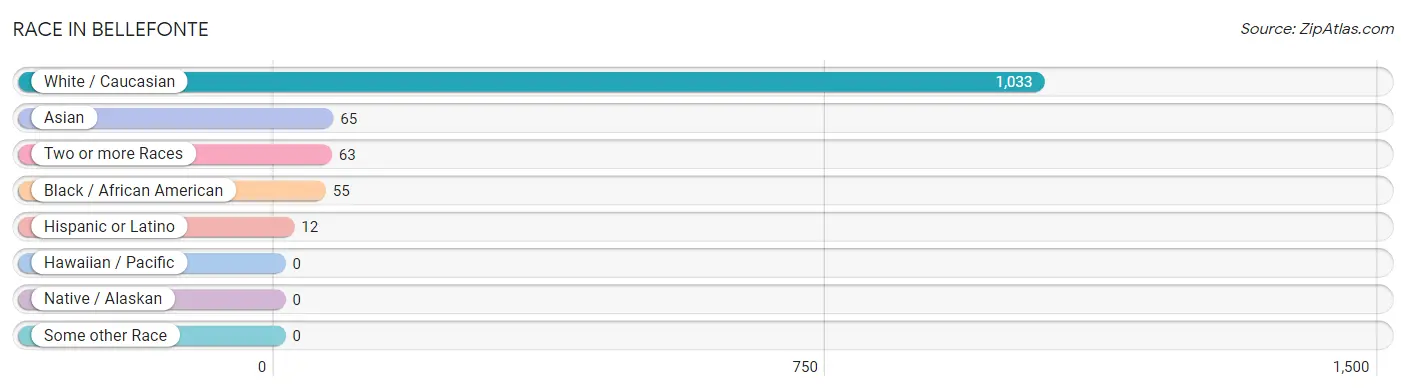
| Race | # Population | % Population |
| Asian | 65 | 5.3% |
| Black / African American | 55 | 4.5% |
| Hawaiian / Pacific | 0 | 0.0% |
| Hispanic or Latino | 12 | 1.0% |
| Native / Alaskan | 0 | 0.0% |
| White / Caucasian | 1,033 | 85.0% |
| Two or more Races | 63 | 5.2% |
| Some other Race | 0 | 0.0% |
| Total | 1,216 | 100.0% |
Ancestry in Bellefonte
The most populous ancestries reported in Bellefonte are Irish (193 | 15.9%), English (192 | 15.8%), Thai (85 | 7.0%), German (77 | 6.3%), and American (65 | 5.3%), together accounting for 50.3% of all Bellefonte residents.
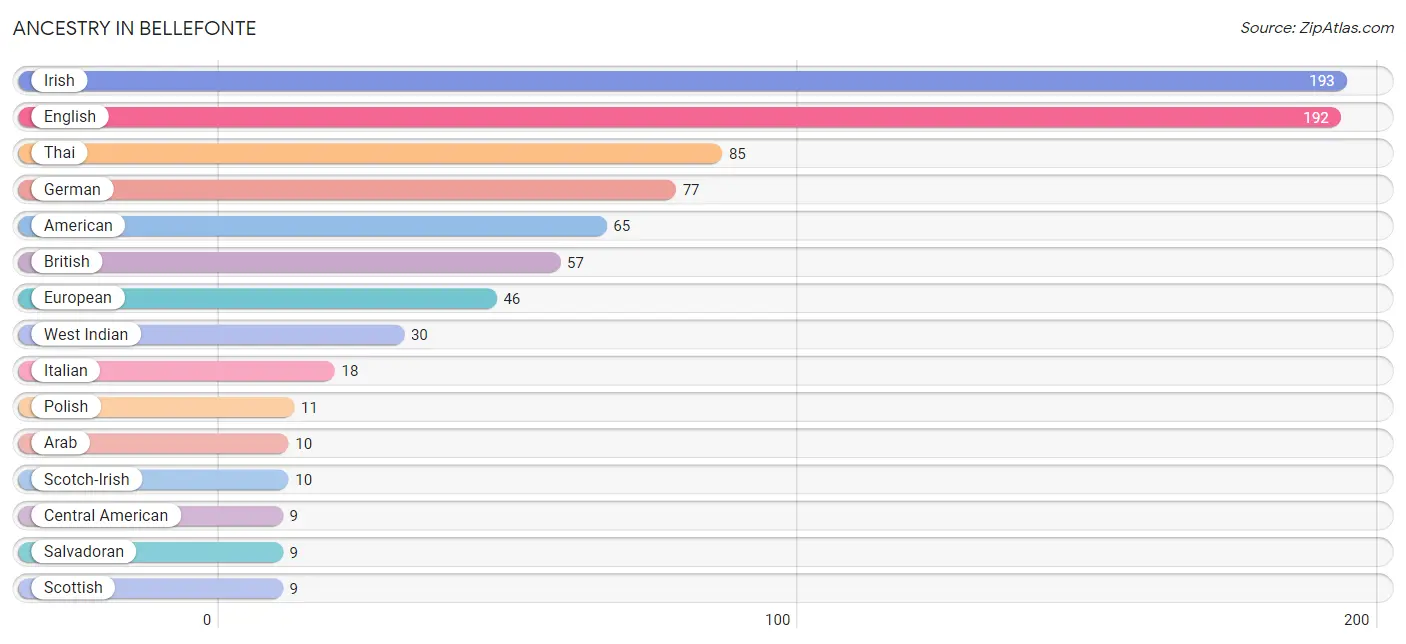
| Ancestry | # Population | % Population |
| American | 65 | 5.3% |
| Arab | 10 | 0.8% |
| British | 57 | 4.7% |
| Burmese | 7 | 0.6% |
| Central American | 9 | 0.7% |
| Cherokee | 1 | 0.1% |
| Croatian | 1 | 0.1% |
| Dutch | 3 | 0.3% |
| Eastern European | 3 | 0.3% |
| Egyptian | 2 | 0.2% |
| English | 192 | 15.8% |
| European | 46 | 3.8% |
| French | 8 | 0.7% |
| French Canadian | 1 | 0.1% |
| German | 77 | 6.3% |
| Hungarian | 7 | 0.6% |
| Icelander | 2 | 0.2% |
| Irish | 193 | 15.9% |
| Italian | 18 | 1.5% |
| Lebanese | 6 | 0.5% |
| Northern European | 4 | 0.3% |
| Norwegian | 2 | 0.2% |
| Polish | 11 | 0.9% |
| Salvadoran | 9 | 0.7% |
| Scandinavian | 4 | 0.3% |
| Scotch-Irish | 10 | 0.8% |
| Scottish | 9 | 0.7% |
| Spaniard | 3 | 0.3% |
| Swedish | 2 | 0.2% |
| Thai | 85 | 7.0% |
| Welsh | 8 | 0.7% |
| West Indian | 30 | 2.5% | View All 32 Rows |
Immigrants in Bellefonte
The most numerous immigrant groups reported in Bellefonte came from Asia (71 | 5.8%), South Central Asia (62 | 5.1%), Latin America (47 | 3.9%), Caribbean (33 | 2.7%), and Grenada (33 | 2.7%), together accounting for 20.2% of all Bellefonte residents.
| Immigration Origin | # Population | % Population |
| Asia | 71 | 5.8% |
| Caribbean | 33 | 2.7% |
| Central America | 14 | 1.1% |
| Eastern Asia | 3 | 0.3% |
| Eastern Europe | 3 | 0.3% |
| El Salvador | 9 | 0.7% |
| Europe | 8 | 0.7% |
| Grenada | 33 | 2.7% |
| Korea | 3 | 0.3% |
| Latin America | 47 | 3.9% |
| Lebanon | 6 | 0.5% |
| Northern Europe | 2 | 0.2% |
| Panama | 5 | 0.4% |
| Poland | 3 | 0.3% |
| South Central Asia | 62 | 5.1% |
| Southern Europe | 3 | 0.3% |
| Spain | 3 | 0.3% |
| Western Asia | 6 | 0.5% | View All 18 Rows |
Sex and Age in Bellefonte
Sex and Age in Bellefonte
The most populous age groups in Bellefonte are 10 to 14 Years (59 | 10.6%) for men and 10 to 14 Years (123 | 18.7%) for women.
| Age Bracket | Male | Female |
| Under 5 Years | 29 (5.2%) | 23 (3.5%) |
| 5 to 9 Years | 50 (9.0%) | 51 (7.7%) |
| 10 to 14 Years | 59 (10.6%) | 123 (18.7%) |
| 15 to 19 Years | 18 (3.2%) | 8 (1.2%) |
| 20 to 24 Years | 9 (1.6%) | 2 (0.3%) |
| 25 to 29 Years | 55 (9.9%) | 31 (4.7%) |
| 30 to 34 Years | 37 (6.6%) | 18 (2.7%) |
| 35 to 39 Years | 38 (6.8%) | 63 (9.6%) |
| 40 to 44 Years | 32 (5.7%) | 89 (13.5%) |
| 45 to 49 Years | 51 (9.1%) | 30 (4.6%) |
| 50 to 54 Years | 15 (2.7%) | 32 (4.9%) |
| 55 to 59 Years | 43 (7.7%) | 18 (2.7%) |
| 60 to 64 Years | 33 (5.9%) | 36 (5.5%) |
| 65 to 69 Years | 13 (2.3%) | 29 (4.4%) |
| 70 to 74 Years | 23 (4.1%) | 30 (4.6%) |
| 75 to 79 Years | 35 (6.3%) | 35 (5.3%) |
| 80 to 84 Years | 14 (2.5%) | 22 (3.3%) |
| 85 Years and over | 4 (0.7%) | 18 (2.7%) |
| Total | 558 (100.0%) | 658 (100.0%) |
Families and Households in Bellefonte
Median Family Size in Bellefonte
The median family size in Bellefonte is 3.10 persons per family, with single male/father families (24 | 6.9%) accounting for the largest median family size of 3.5 persons per family. On the other hand, single female/mother families (28 | 8.1%) represent the smallest median family size with 2.46 persons per family.
| Family Type | # Families | Family Size |
| Married-Couple | 296 (85.1%) | 3.13 |
| Single Male/Father | 24 (6.9%) | 3.50 |
| Single Female/Mother | 28 (8.1%) | 2.46 |
| Total Families | 348 (100.0%) | 3.10 |
Median Household Size in Bellefonte
The median household size in Bellefonte is 2.83 persons per household, with single male/father households (24 | 5.6%) accounting for the largest median household size of 4.42 persons per household. non-family households (81 | 18.9%) represent the smallest median household size with 1.06 persons per household.
| Household Type | # Households | Household Size |
| Married-Couple | 296 (69.0%) | 3.16 |
| Single Male/Father | 24 (5.6%) | 4.42 |
| Single Female/Mother | 28 (6.5%) | 3.18 |
| Non-family | 81 (18.9%) | 1.06 |
| Total Households | 429 (100.0%) | 2.83 |
Household Size by Marriage Status in Bellefonte
Out of a total of 429 households in Bellefonte, 348 (81.1%) are family households, while 81 (18.9%) are nonfamily households. The most numerous type of family households are 2-person households, comprising 171, and the most common type of nonfamily households are 1-person households, comprising 75.
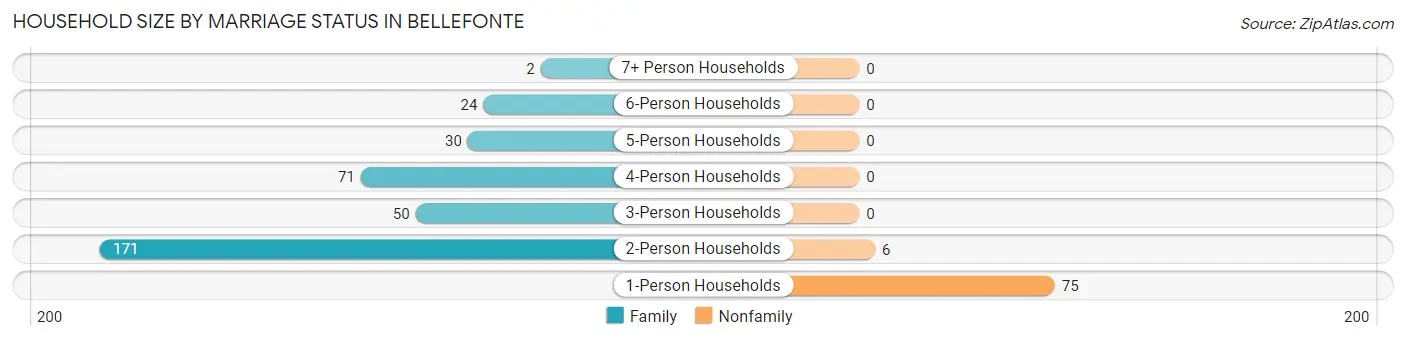
| Household Size | Family Households | Nonfamily Households |
| 1-Person Households | - | 75 (17.5%) |
| 2-Person Households | 171 (39.9%) | 6 (1.4%) |
| 3-Person Households | 50 (11.7%) | 0 (0.0%) |
| 4-Person Households | 71 (16.6%) | 0 (0.0%) |
| 5-Person Households | 30 (7.0%) | 0 (0.0%) |
| 6-Person Households | 24 (5.6%) | 0 (0.0%) |
| 7+ Person Households | 2 (0.5%) | 0 (0.0%) |
| Total | 348 (81.1%) | 81 (18.9%) |
Female Fertility in Bellefonte
Fertility by Age in Bellefonte
Average fertility rate in Bellefonte is 107.0 births per 1,000 women. Women in the age bracket of 20 to 34 years have the highest fertility rate with 255.0 births per 1,000 women. Women in the age bracket of 20 to 34 years acount for 50.0% of all women with births.
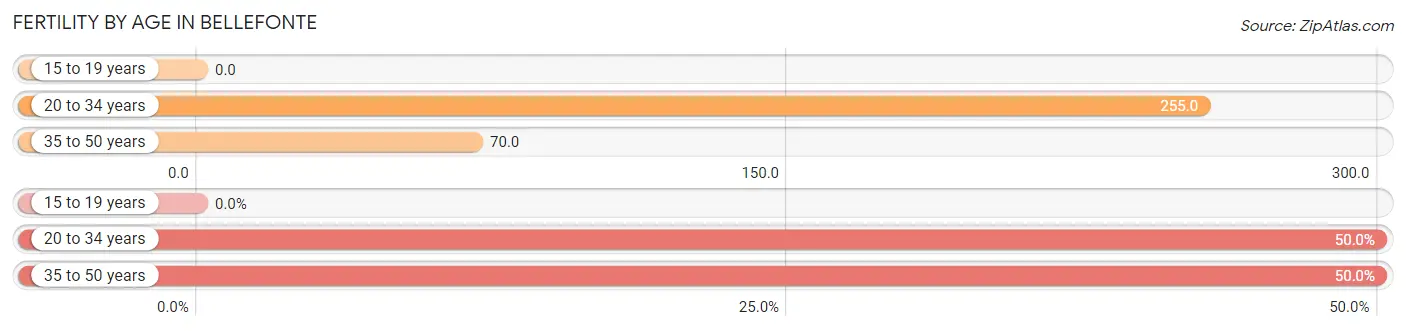
| Age Bracket | Women with Births | Births / 1,000 Women |
| 15 to 19 years | 0 (0.0%) | 0.0 |
| 20 to 34 years | 13 (50.0%) | 255.0 |
| 35 to 50 years | 13 (50.0%) | 70.0 |
| Total | 26 (100.0%) | 107.0 |
Fertility by Age by Marriage Status in Bellefonte
38.5% of women with births (26) in Bellefonte are married. The highest percentage of unmarried women with births falls into 35 to 50 years age bracket with 100.0% of them unmarried at the time of birth, while the lowest percentage of unmarried women with births belong to 20 to 34 years age bracket with 23.1% of them unmarried.
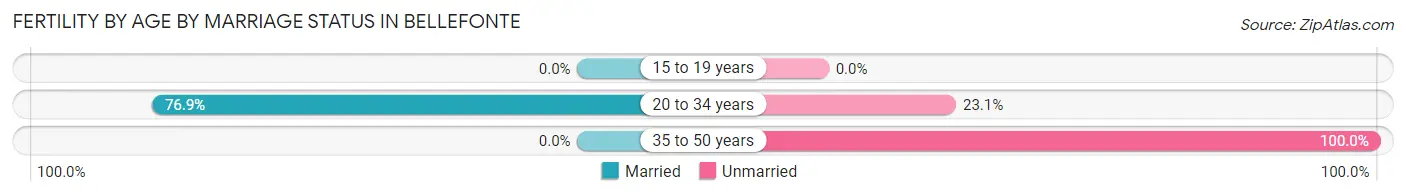
| Age Bracket | Married | Unmarried |
| 15 to 19 years | 0 (0.0%) | 0 (0.0%) |
| 20 to 34 years | 10 (76.9%) | 3 (23.1%) |
| 35 to 50 years | 0 (0.0%) | 13 (100.0%) |
| Total | 10 (38.5%) | 16 (61.5%) |
Fertility by Education in Bellefonte
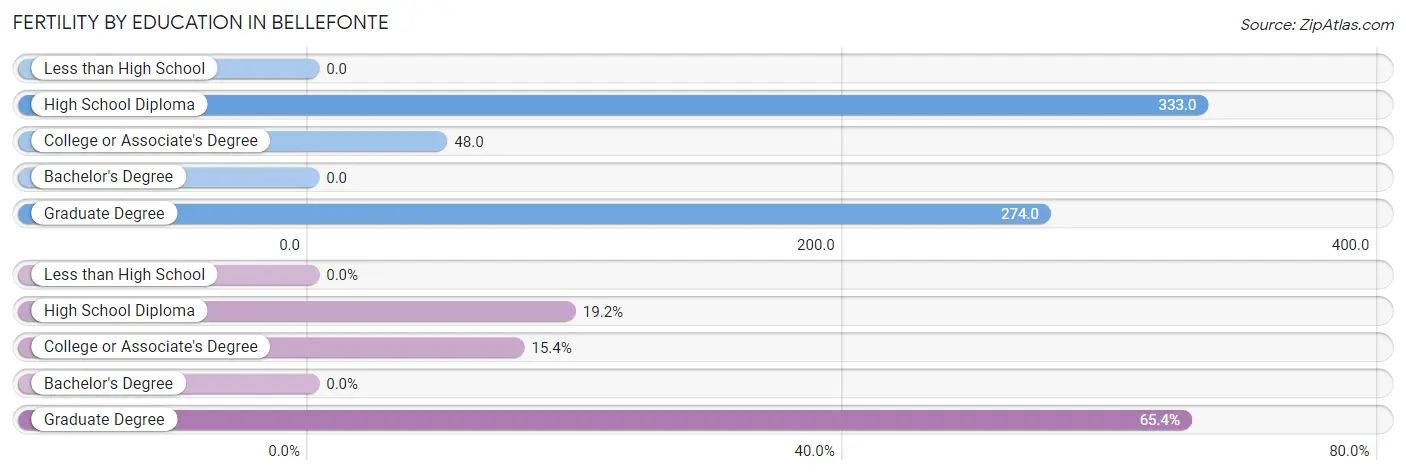
| Educational Attainment | Women with Births | Births / 1,000 Women |
| Less than High School | 0 (0.0%) | 0.0 |
| High School Diploma | 5 (19.2%) | 333.0 |
| College or Associate's Degree | 4 (15.4%) | 48.0 |
| Bachelor's Degree | 0 (0.0%) | 0.0 |
| Graduate Degree | 17 (65.4%) | 274.0 |
| Total | 26 (100.0%) | 107.0 |
Fertility by Education by Marriage Status in Bellefonte
61.5% of women with births in Bellefonte are unmarried. Women with the educational attainment of high school diploma are most likely to be married with 100.0% of them married at childbirth, while women with the educational attainment of graduate degree are least likely to be married with 76.5% of them unmarried at childbirth.
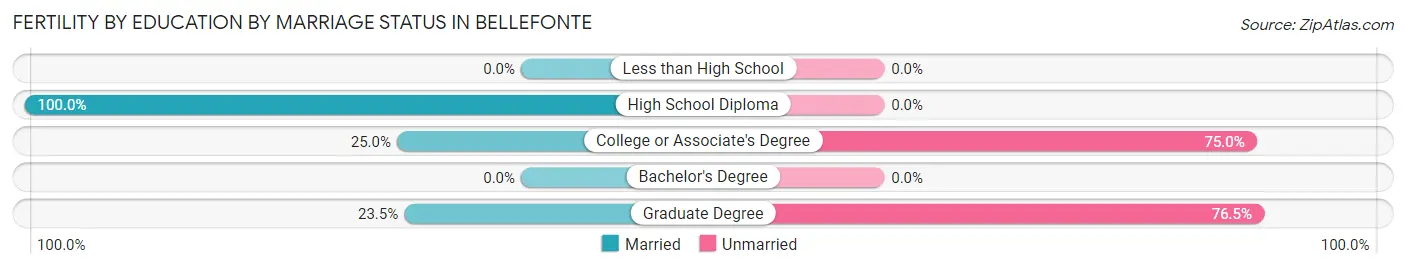
| Educational Attainment | Married | Unmarried |
| Less than High School | 0 (0.0%) | 0 (0.0%) |
| High School Diploma | 5 (100.0%) | 0 (0.0%) |
| College or Associate's Degree | 1 (25.0%) | 3 (75.0%) |
| Bachelor's Degree | 0 (0.0%) | 0 (0.0%) |
| Graduate Degree | 4 (23.5%) | 13 (76.5%) |
| Total | 10 (38.5%) | 16 (61.5%) |
Employment Characteristics in Bellefonte
Employment by Class of Employer in Bellefonte
Among the 509 employed individuals in Bellefonte, private company employees (319 | 62.7%), state government employees (60 | 11.8%), and not-for-profit organizations (45 | 8.8%) make up the most common classes of employment.
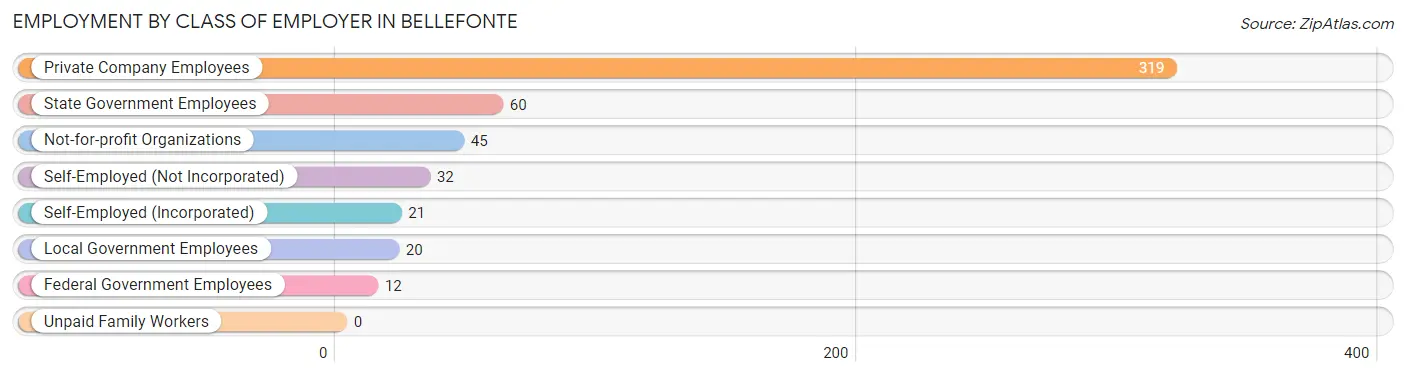
| Employer Class | # Employees | % Employees |
| Private Company Employees | 319 | 62.7% |
| Self-Employed (Incorporated) | 21 | 4.1% |
| Self-Employed (Not Incorporated) | 32 | 6.3% |
| Not-for-profit Organizations | 45 | 8.8% |
| Local Government Employees | 20 | 3.9% |
| State Government Employees | 60 | 11.8% |
| Federal Government Employees | 12 | 2.4% |
| Unpaid Family Workers | 0 | 0.0% |
| Total | 509 | 100.0% |
Employment Status by Age in Bellefonte
According to the labor force statistics for Bellefonte, out of the total population over 16 years of age (875), 60.0% or 525 individuals are in the labor force, with 2.7% or 14 of them unemployed. The age group with the highest labor force participation rate is 20 to 24 years, with 100.0% or 11 individuals in the labor force. Within the labor force, the 30 to 34 years age range has the highest percentage of unemployed individuals, with 9.6% or 5 of them being unemployed.
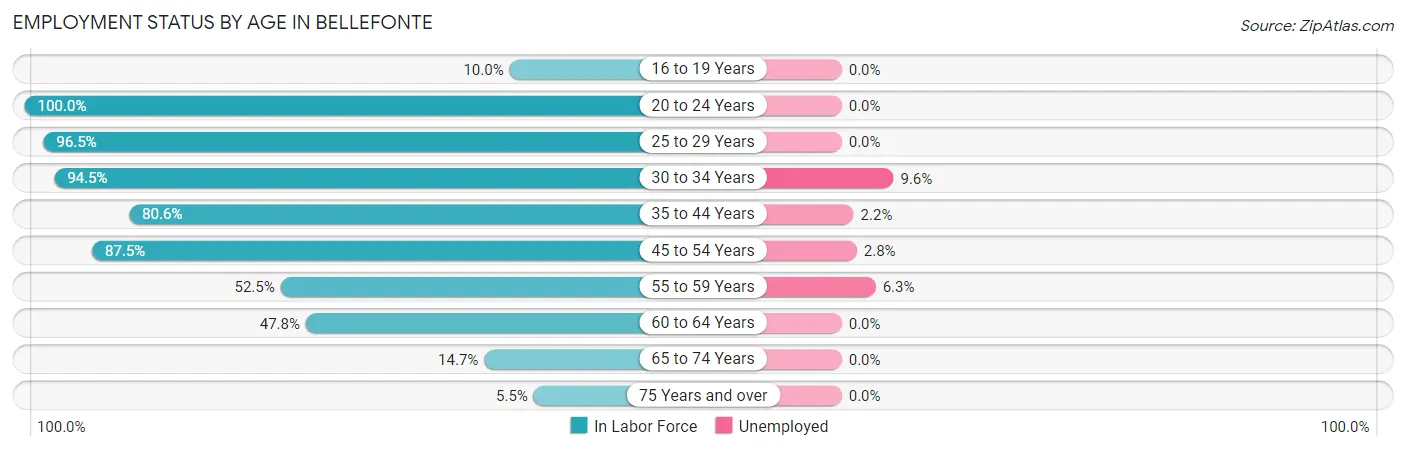
| Age Bracket | In Labor Force | Unemployed |
| 16 to 19 Years | 2 (10.0%) | 0 (0.0%) |
| 20 to 24 Years | 11 (100.0%) | 0 (0.0%) |
| 25 to 29 Years | 83 (96.5%) | 0 (0.0%) |
| 30 to 34 Years | 52 (94.5%) | 5 (9.6%) |
| 35 to 44 Years | 179 (80.6%) | 4 (2.2%) |
| 45 to 54 Years | 112 (87.5%) | 3 (2.8%) |
| 55 to 59 Years | 32 (52.5%) | 2 (6.3%) |
| 60 to 64 Years | 33 (47.8%) | 0 (0.0%) |
| 65 to 74 Years | 14 (14.7%) | 0 (0.0%) |
| 75 Years and over | 7 (5.5%) | 0 (0.0%) |
| Total | 525 (60.0%) | 14 (2.7%) |
Employment Status by Educational Attainment in Bellefonte
According to labor force statistics for Bellefonte, 79.1% of individuals (491) out of the total population between 25 and 64 years of age (621) are in the labor force, with 2.9% or 14 of them being unemployed. The group with the highest labor force participation rate are those with the educational attainment of college / associate degree, with 83.6% or 184 individuals in the labor force. Within the labor force, individuals with high school diploma education have the highest percentage of unemployment, with 7.8% or 4 of them being unemployed.
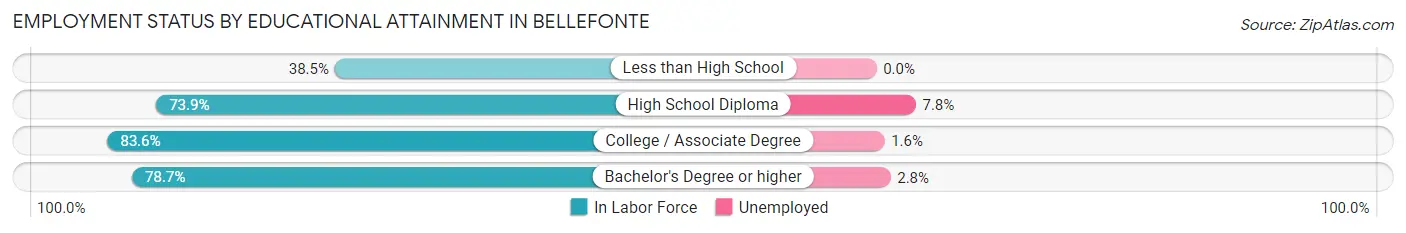
| Educational Attainment | In Labor Force | Unemployed |
| Less than High School | 5 (38.5%) | 0 (0.0%) |
| High School Diploma | 51 (73.9%) | 5 (7.8%) |
| College / Associate Degree | 184 (83.6%) | 4 (1.6%) |
| Bachelor's Degree or higher | 251 (78.7%) | 9 (2.8%) |
| Total | 491 (79.1%) | 18 (2.9%) |
Employment Occupations by Sex in Bellefonte
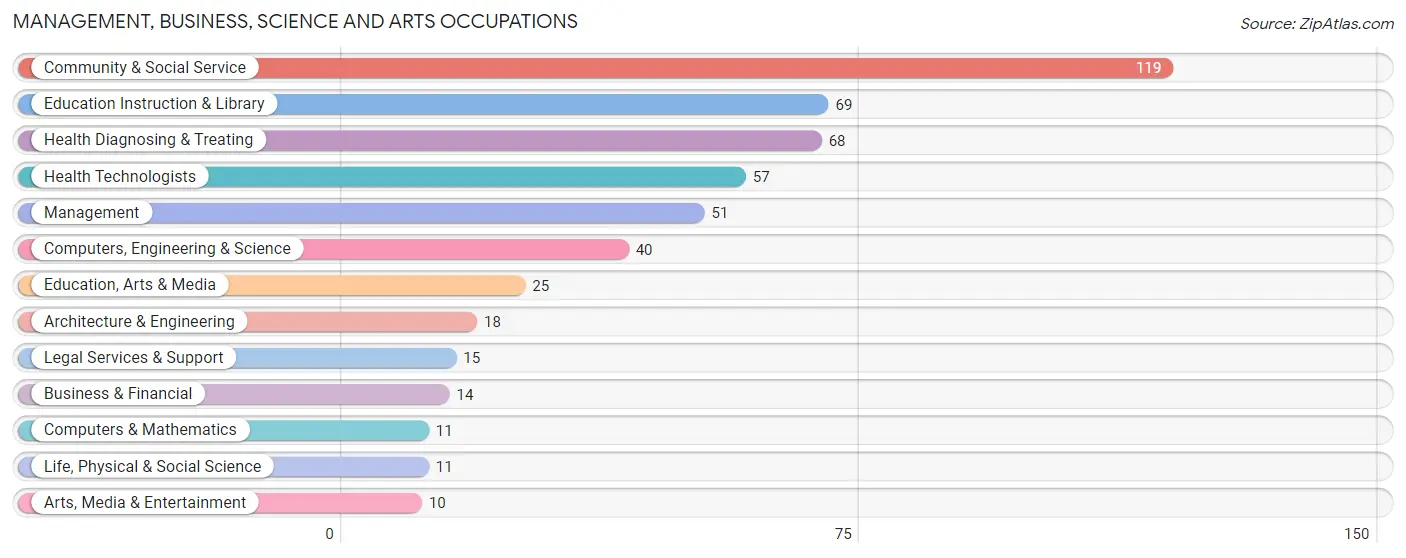
Management, Business, Science and Arts Occupations
The most common Management, Business, Science and Arts occupations in Bellefonte are Community & Social Service (119 | 23.4%), Education Instruction & Library (69 | 13.6%), Health Diagnosing & Treating (68 | 13.4%), Health Technologists (57 | 11.2%), and Management (51 | 10.0%).
Management, Business, Science and Arts Occupations by Sex
Within the Management, Business, Science and Arts occupations in Bellefonte, the most male-oriented occupations are Computers & Mathematics (100.0%), Architecture & Engineering (94.4%), and Computers, Engineering & Science (92.5%), while the most female-oriented occupations are Education, Arts & Media (100.0%), Education Instruction & Library (98.6%), and Community & Social Service (89.9%).
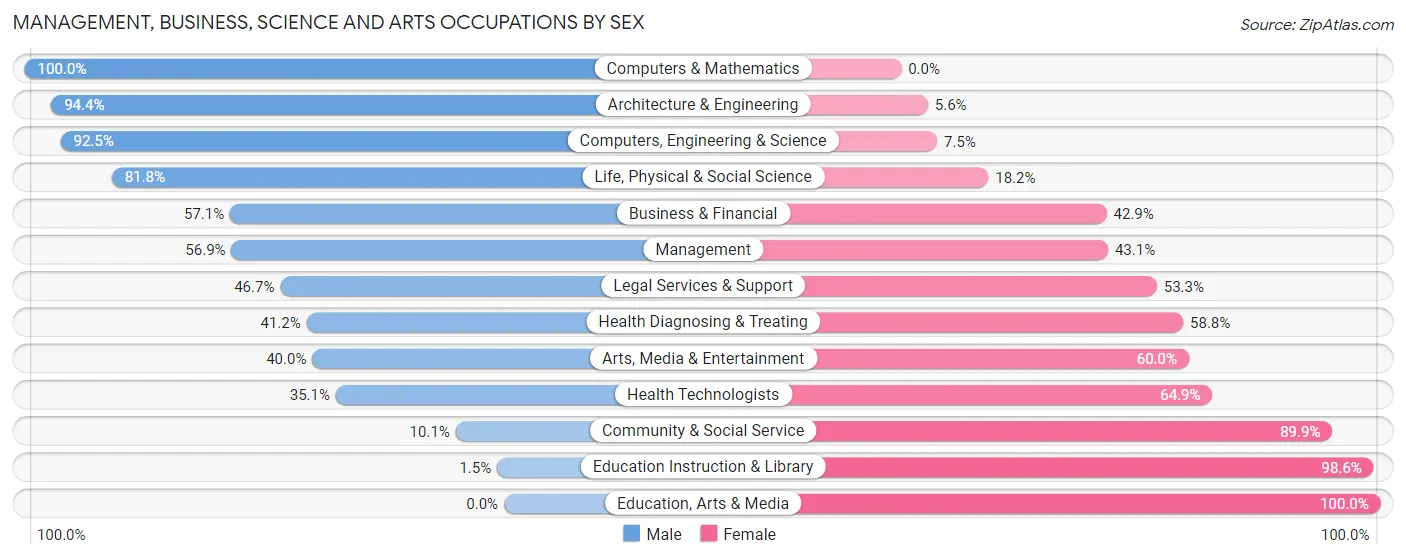
| Occupation | Male | Female |
| Management | 29 (56.9%) | 22 (43.1%) |
| Business & Financial | 8 (57.1%) | 6 (42.9%) |
| Computers, Engineering & Science | 37 (92.5%) | 3 (7.5%) |
| Computers & Mathematics | 11 (100.0%) | 0 (0.0%) |
| Architecture & Engineering | 17 (94.4%) | 1 (5.6%) |
| Life, Physical & Social Science | 9 (81.8%) | 2 (18.2%) |
| Community & Social Service | 12 (10.1%) | 107 (89.9%) |
| Education, Arts & Media | 0 (0.0%) | 25 (100.0%) |
| Legal Services & Support | 7 (46.7%) | 8 (53.3%) |
| Education Instruction & Library | 1 (1.5%) | 68 (98.6%) |
| Arts, Media & Entertainment | 4 (40.0%) | 6 (60.0%) |
| Health Diagnosing & Treating | 28 (41.2%) | 40 (58.8%) |
| Health Technologists | 20 (35.1%) | 37 (64.9%) |
| Total (Category) | 114 (39.0%) | 178 (61.0%) |
| Total (Overall) | 253 (49.8%) | 255 (50.2%) |
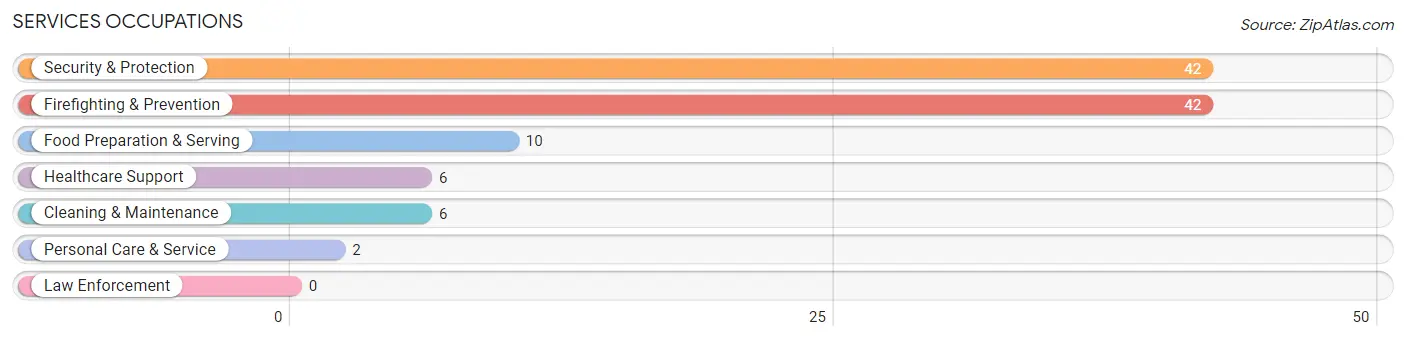
Services Occupations
The most common Services occupations in Bellefonte are Security & Protection (42 | 8.3%), Firefighting & Prevention (42 | 8.3%), Food Preparation & Serving (10 | 2.0%), Healthcare Support (6 | 1.2%), and Cleaning & Maintenance (6 | 1.2%).
Services Occupations by Sex
Within the Services occupations in Bellefonte, the most male-oriented occupations are Security & Protection (100.0%), Firefighting & Prevention (100.0%), and Cleaning & Maintenance (100.0%), while the most female-oriented occupations are Personal Care & Service (100.0%), Healthcare Support (66.7%), and Food Preparation & Serving (40.0%).
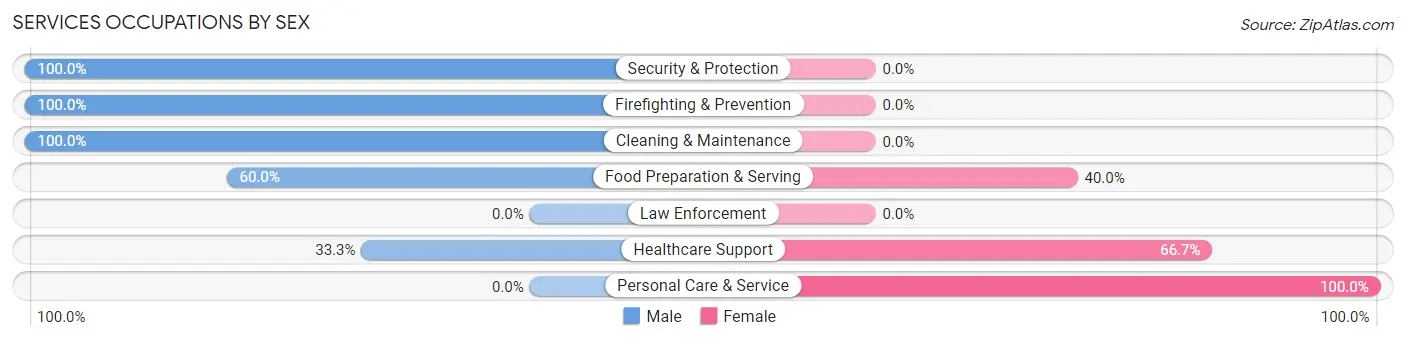
| Occupation | Male | Female |
| Healthcare Support | 2 (33.3%) | 4 (66.7%) |
| Security & Protection | 42 (100.0%) | 0 (0.0%) |
| Firefighting & Prevention | 42 (100.0%) | 0 (0.0%) |
| Law Enforcement | 0 (0.0%) | 0 (0.0%) |
| Food Preparation & Serving | 6 (60.0%) | 4 (40.0%) |
| Cleaning & Maintenance | 6 (100.0%) | 0 (0.0%) |
| Personal Care & Service | 0 (0.0%) | 2 (100.0%) |
| Total (Category) | 56 (84.9%) | 10 (15.1%) |
| Total (Overall) | 253 (49.8%) | 255 (50.2%) |
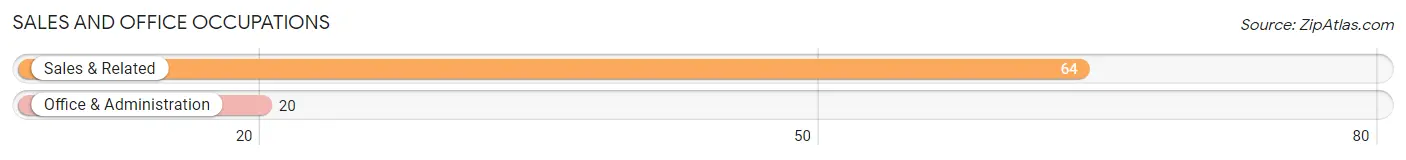
Sales and Office Occupations
The most common Sales and Office occupations in Bellefonte are Sales & Related (64 | 12.6%), and Office & Administration (20 | 3.9%).
Sales and Office Occupations by Sex
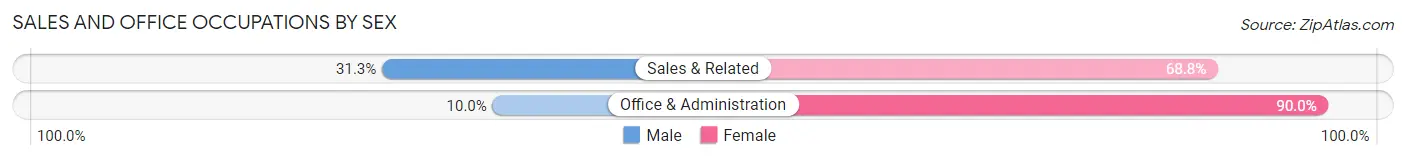
| Occupation | Male | Female |
| Sales & Related | 20 (31.2%) | 44 (68.8%) |
| Office & Administration | 2 (10.0%) | 18 (90.0%) |
| Total (Category) | 22 (26.2%) | 62 (73.8%) |
| Total (Overall) | 253 (49.8%) | 255 (50.2%) |
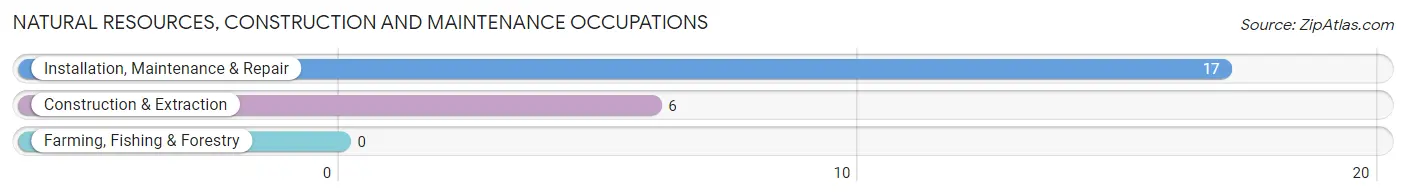
Natural Resources, Construction and Maintenance Occupations
The most common Natural Resources, Construction and Maintenance occupations in Bellefonte are Installation, Maintenance & Repair (17 | 3.4%), and Construction & Extraction (6 | 1.2%).
Natural Resources, Construction and Maintenance Occupations by Sex
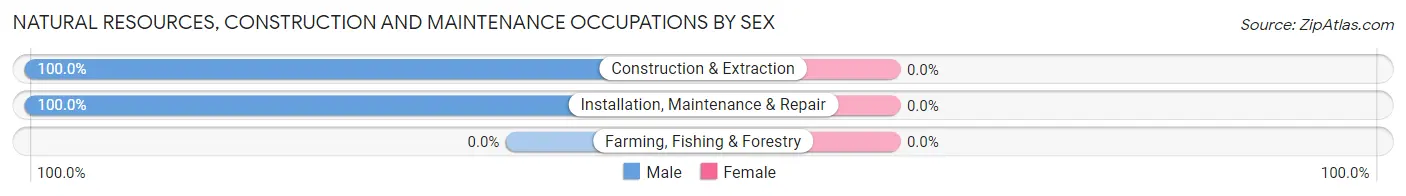
| Occupation | Male | Female |
| Farming, Fishing & Forestry | 0 (0.0%) | 0 (0.0%) |
| Construction & Extraction | 6 (100.0%) | 0 (0.0%) |
| Installation, Maintenance & Repair | 17 (100.0%) | 0 (0.0%) |
| Total (Category) | 23 (100.0%) | 0 (0.0%) |
| Total (Overall) | 253 (49.8%) | 255 (50.2%) |
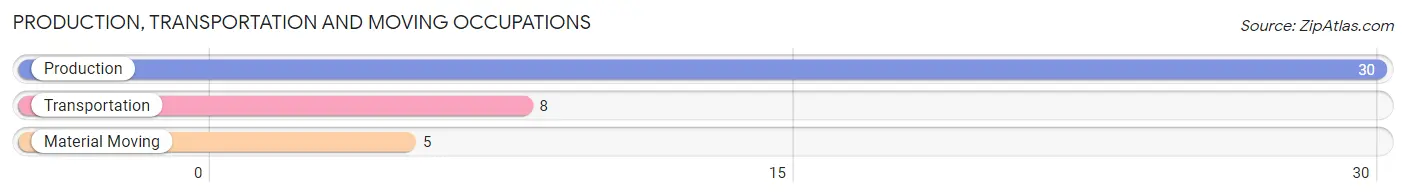
Production, Transportation and Moving Occupations
The most common Production, Transportation and Moving occupations in Bellefonte are Production (30 | 5.9%), Transportation (8 | 1.6%), and Material Moving (5 | 1.0%).
Production, Transportation and Moving Occupations by Sex
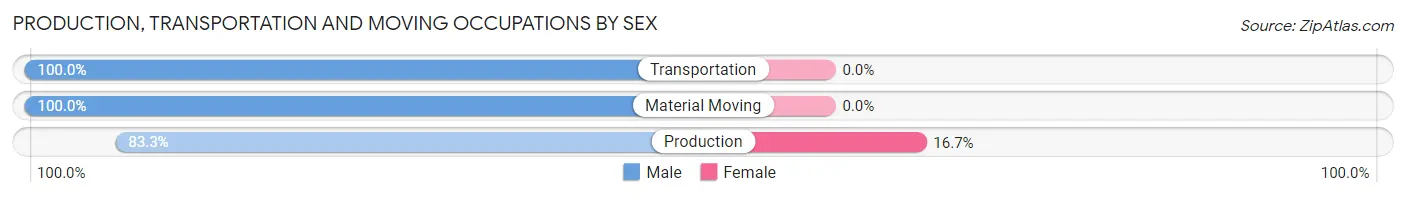
| Occupation | Male | Female |
| Production | 25 (83.3%) | 5 (16.7%) |
| Transportation | 8 (100.0%) | 0 (0.0%) |
| Material Moving | 5 (100.0%) | 0 (0.0%) |
| Total (Category) | 38 (88.4%) | 5 (11.6%) |
| Total (Overall) | 253 (49.8%) | 255 (50.2%) |
Employment Industries by Sex in Bellefonte
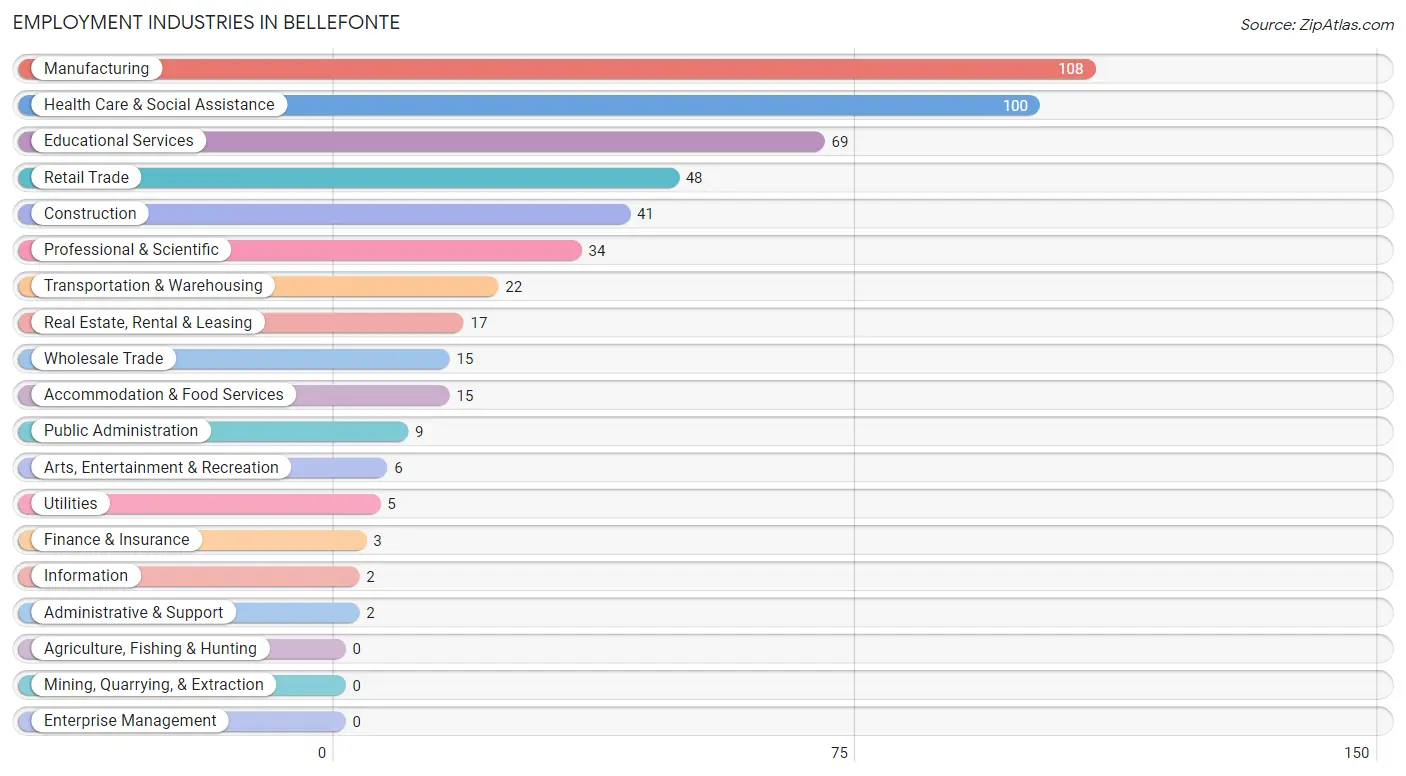
Employment Industries in Bellefonte
The major employment industries in Bellefonte include Manufacturing (108 | 21.3%), Health Care & Social Assistance (100 | 19.7%), Educational Services (69 | 13.6%), Retail Trade (48 | 9.5%), and Construction (41 | 8.1%).
Employment Industries by Sex in Bellefonte
The Bellefonte industries that see more men than women are Construction (100.0%), Information (100.0%), and Finance & Insurance (100.0%), whereas the industries that tend to have a higher number of women are Educational Services (95.7%), Real Estate, Rental & Leasing (94.1%), and Accommodation & Food Services (73.3%).
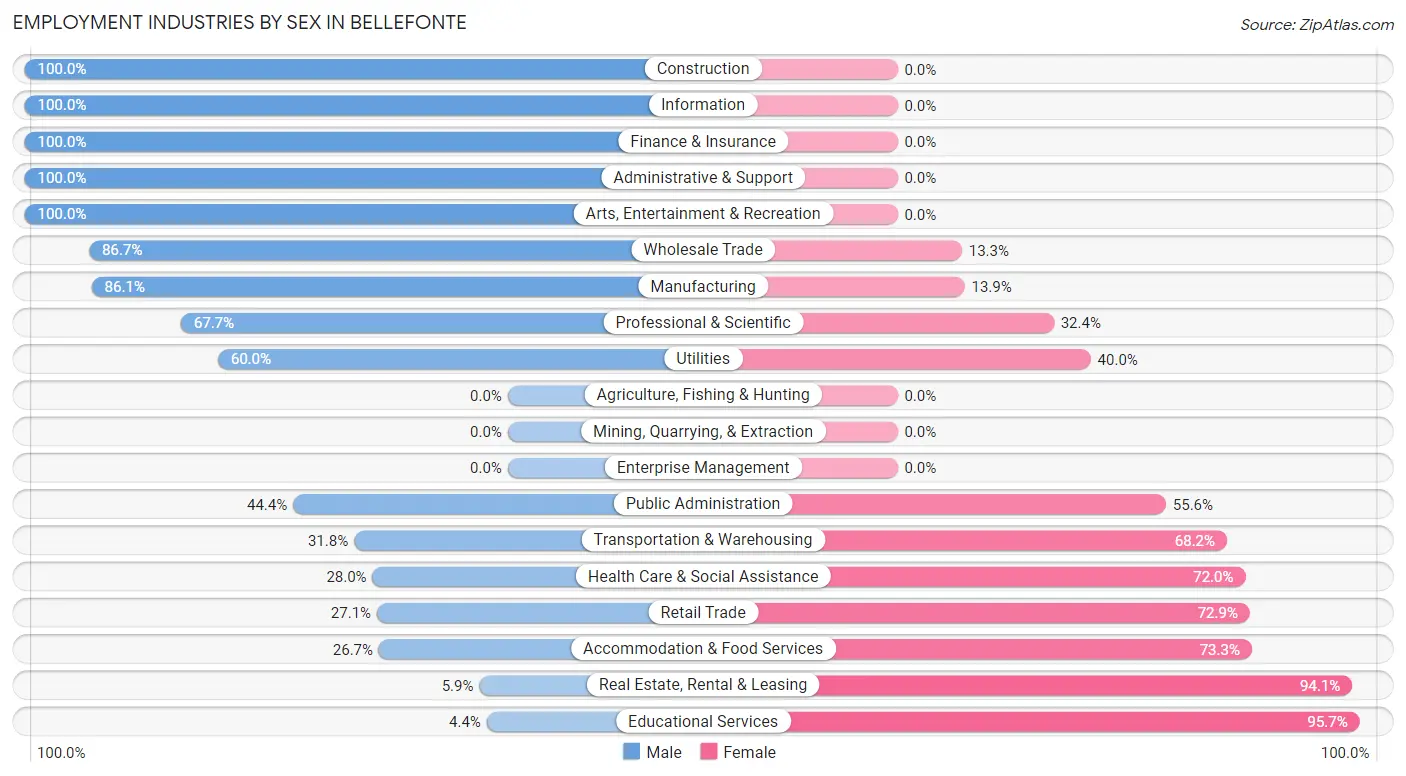
| Industry | Male | Female |
| Agriculture, Fishing & Hunting | 0 (0.0%) | 0 (0.0%) |
| Mining, Quarrying, & Extraction | 0 (0.0%) | 0 (0.0%) |
| Construction | 41 (100.0%) | 0 (0.0%) |
| Manufacturing | 93 (86.1%) | 15 (13.9%) |
| Wholesale Trade | 13 (86.7%) | 2 (13.3%) |
| Retail Trade | 13 (27.1%) | 35 (72.9%) |
| Transportation & Warehousing | 7 (31.8%) | 15 (68.2%) |
| Utilities | 3 (60.0%) | 2 (40.0%) |
| Information | 2 (100.0%) | 0 (0.0%) |
| Finance & Insurance | 3 (100.0%) | 0 (0.0%) |
| Real Estate, Rental & Leasing | 1 (5.9%) | 16 (94.1%) |
| Professional & Scientific | 23 (67.6%) | 11 (32.4%) |
| Enterprise Management | 0 (0.0%) | 0 (0.0%) |
| Administrative & Support | 2 (100.0%) | 0 (0.0%) |
| Educational Services | 3 (4.3%) | 66 (95.7%) |
| Health Care & Social Assistance | 28 (28.0%) | 72 (72.0%) |
| Arts, Entertainment & Recreation | 6 (100.0%) | 0 (0.0%) |
| Accommodation & Food Services | 4 (26.7%) | 11 (73.3%) |
| Public Administration | 4 (44.4%) | 5 (55.6%) |
| Total | 253 (49.8%) | 255 (50.2%) |
Education in Bellefonte
School Enrollment in Bellefonte
The most common levels of schooling among the 373 students in Bellefonte are middle school (137 | 36.7%), elementary school (133 | 35.7%), and graduate / professional (35 | 9.4%).
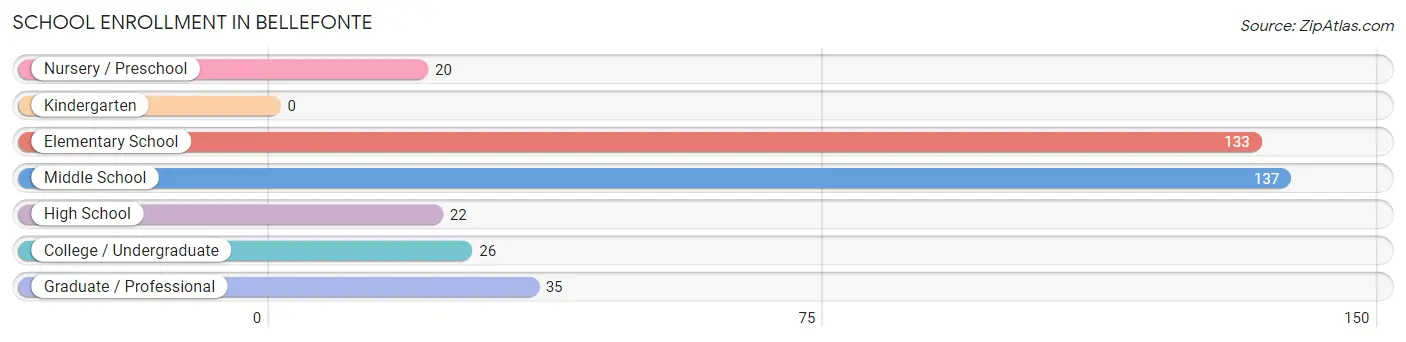
| School Level | # Students | % Students |
| Nursery / Preschool | 20 | 5.4% |
| Kindergarten | 0 | 0.0% |
| Elementary School | 133 | 35.7% |
| Middle School | 137 | 36.7% |
| High School | 22 | 5.9% |
| College / Undergraduate | 26 | 7.0% |
| Graduate / Professional | 35 | 9.4% |
| Total | 373 | 100.0% |
School Enrollment by Age by Funding Source in Bellefonte
Out of a total of 373 students who are enrolled in schools in Bellefonte, 32 (8.6%) attend a private institution, while the remaining 341 (91.4%) are enrolled in public schools. The age group of 25 to 34 year olds has the highest likelihood of being enrolled in private schools, with 11 (36.7% in the age bracket) enrolled. Conversely, the age group of 15 to 17 year olds has the lowest likelihood of being enrolled in a private school, with 16 (100.0% in the age bracket) attending a public institution.
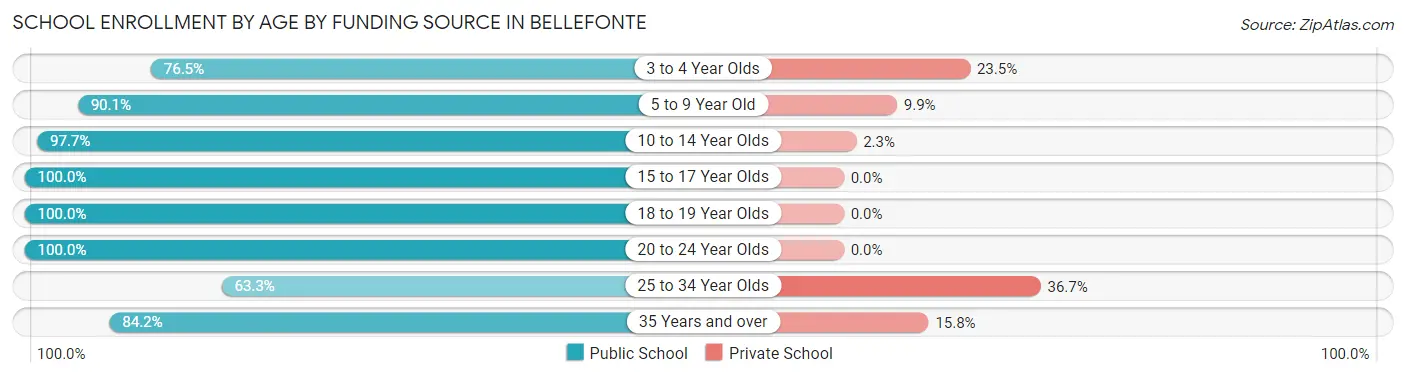
| Age Bracket | Public School | Private School |
| 3 to 4 Year Olds | 13 (76.5%) | 4 (23.5%) |
| 5 to 9 Year Old | 91 (90.1%) | 10 (9.9%) |
| 10 to 14 Year Olds | 168 (97.7%) | 4 (2.3%) |
| 15 to 17 Year Olds | 16 (100.0%) | 0 (0.0%) |
| 18 to 19 Year Olds | 10 (100.0%) | 0 (0.0%) |
| 20 to 24 Year Olds | 8 (100.0%) | 0 (0.0%) |
| 25 to 34 Year Olds | 19 (63.3%) | 11 (36.7%) |
| 35 Years and over | 16 (84.2%) | 3 (15.8%) |
| Total | 341 (91.4%) | 32 (8.6%) |
Educational Attainment by Field of Study in Bellefonte
Science & technology (86 | 20.9%), business (85 | 20.7%), education (62 | 15.1%), bio, nature & agricultural (49 | 11.9%), and arts & humanities (33 | 8.0%) are the most common fields of study among 411 individuals in Bellefonte who have obtained a bachelor's degree or higher.
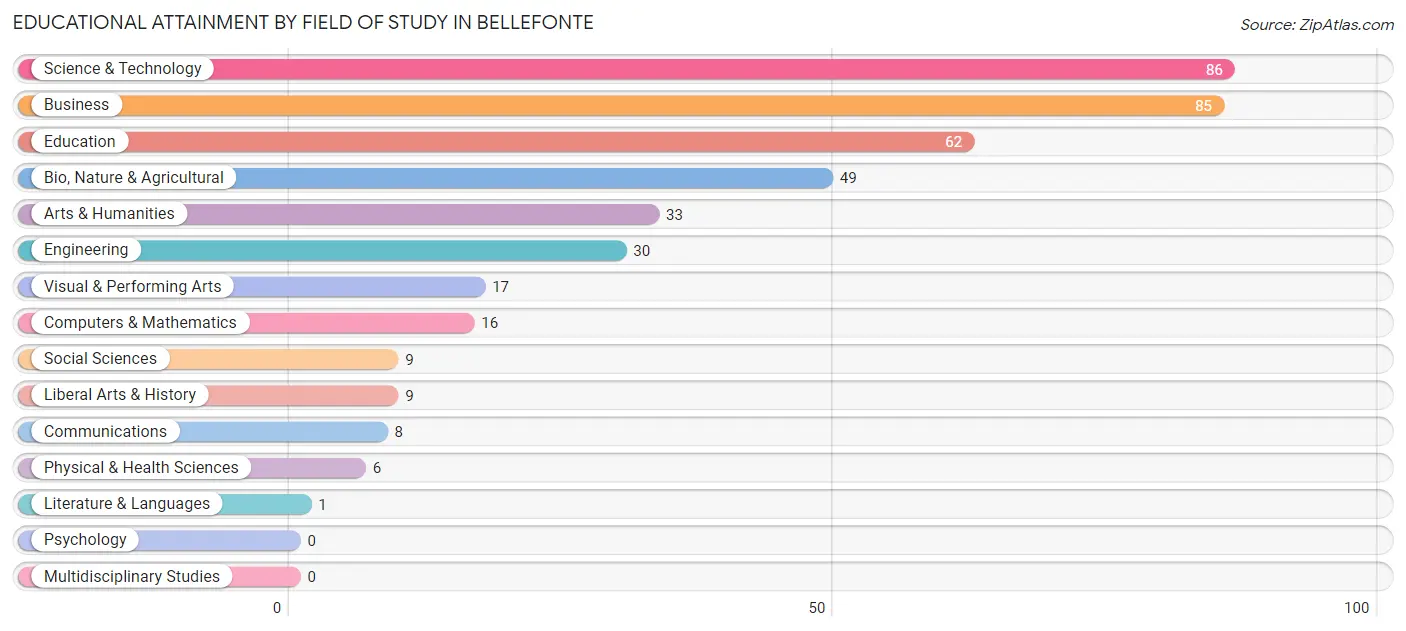
| Field of Study | # Graduates | % Graduates |
| Computers & Mathematics | 16 | 3.9% |
| Bio, Nature & Agricultural | 49 | 11.9% |
| Physical & Health Sciences | 6 | 1.5% |
| Psychology | 0 | 0.0% |
| Social Sciences | 9 | 2.2% |
| Engineering | 30 | 7.3% |
| Multidisciplinary Studies | 0 | 0.0% |
| Science & Technology | 86 | 20.9% |
| Business | 85 | 20.7% |
| Education | 62 | 15.1% |
| Literature & Languages | 1 | 0.2% |
| Liberal Arts & History | 9 | 2.2% |
| Visual & Performing Arts | 17 | 4.1% |
| Communications | 8 | 1.9% |
| Arts & Humanities | 33 | 8.0% |
| Total | 411 | 100.0% |
Transportation & Commute in Bellefonte
Vehicle Availability by Sex in Bellefonte
The most prevalent vehicle ownership categories in Bellefonte are males with 2 vehicles (134, accounting for 52.8%) and females with 2 vehicles (134, making up 52.5%).
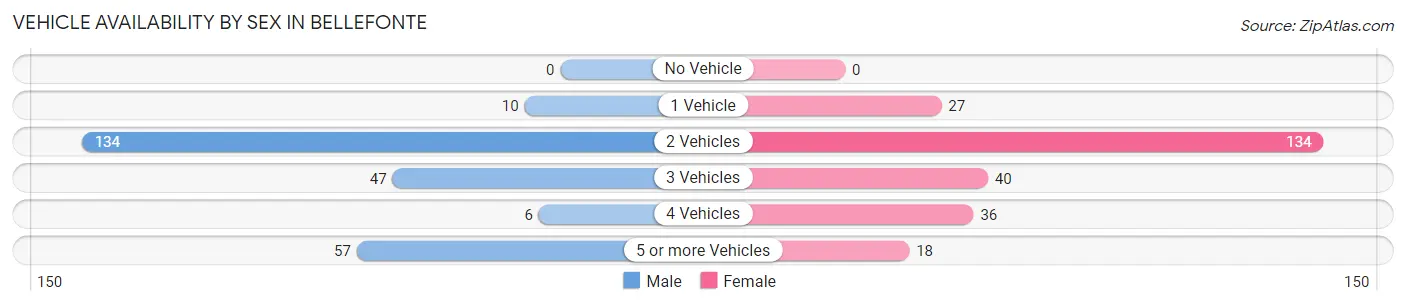
| Vehicles Available | Male | Female |
| No Vehicle | 0 (0.0%) | 0 (0.0%) |
| 1 Vehicle | 10 (3.9%) | 27 (10.6%) |
| 2 Vehicles | 134 (52.8%) | 134 (52.5%) |
| 3 Vehicles | 47 (18.5%) | 40 (15.7%) |
| 4 Vehicles | 6 (2.4%) | 36 (14.1%) |
| 5 or more Vehicles | 57 (22.4%) | 18 (7.1%) |
| Total | 254 (100.0%) | 255 (100.0%) |
Commute Time in Bellefonte
The most frequently occuring commute durations in Bellefonte are 5 to 9 minutes (86 commuters, 17.9%), 10 to 14 minutes (73 commuters, 15.2%), and 30 to 34 minutes (68 commuters, 14.1%).
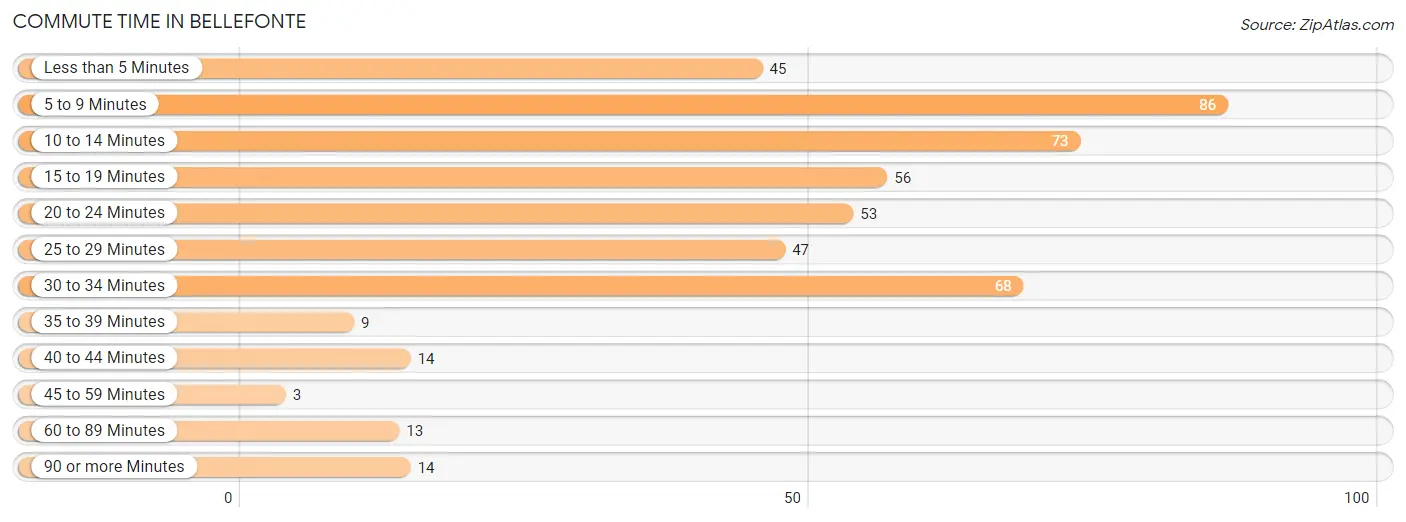
| Commute Time | # Commuters | % Commuters |
| Less than 5 Minutes | 45 | 9.4% |
| 5 to 9 Minutes | 86 | 17.9% |
| 10 to 14 Minutes | 73 | 15.2% |
| 15 to 19 Minutes | 56 | 11.6% |
| 20 to 24 Minutes | 53 | 11.0% |
| 25 to 29 Minutes | 47 | 9.8% |
| 30 to 34 Minutes | 68 | 14.1% |
| 35 to 39 Minutes | 9 | 1.9% |
| 40 to 44 Minutes | 14 | 2.9% |
| 45 to 59 Minutes | 3 | 0.6% |
| 60 to 89 Minutes | 13 | 2.7% |
| 90 or more Minutes | 14 | 2.9% |
Commute Time by Sex in Bellefonte
The most common commute times in Bellefonte are 30 to 34 minutes (42 commuters, 17.6%) for males and 5 to 9 minutes (68 commuters, 28.0%) for females.
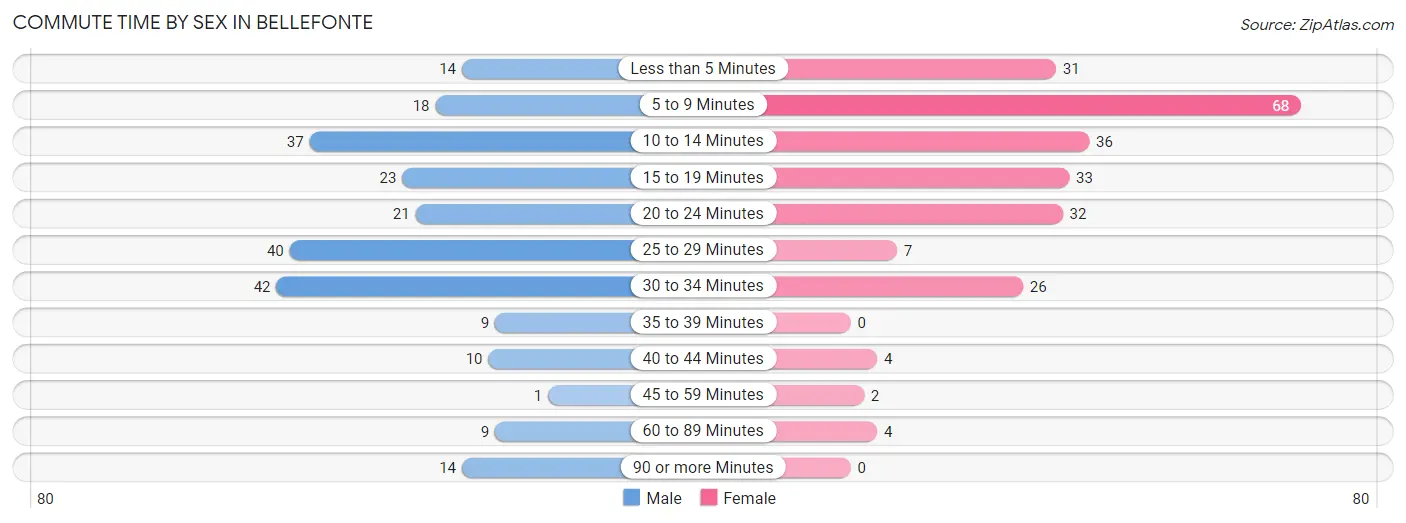
| Commute Time | Male | Female |
| Less than 5 Minutes | 14 (5.9%) | 31 (12.8%) |
| 5 to 9 Minutes | 18 (7.6%) | 68 (28.0%) |
| 10 to 14 Minutes | 37 (15.5%) | 36 (14.8%) |
| 15 to 19 Minutes | 23 (9.7%) | 33 (13.6%) |
| 20 to 24 Minutes | 21 (8.8%) | 32 (13.2%) |
| 25 to 29 Minutes | 40 (16.8%) | 7 (2.9%) |
| 30 to 34 Minutes | 42 (17.6%) | 26 (10.7%) |
| 35 to 39 Minutes | 9 (3.8%) | 0 (0.0%) |
| 40 to 44 Minutes | 10 (4.2%) | 4 (1.7%) |
| 45 to 59 Minutes | 1 (0.4%) | 2 (0.8%) |
| 60 to 89 Minutes | 9 (3.8%) | 4 (1.7%) |
| 90 or more Minutes | 14 (5.9%) | 0 (0.0%) |
Time of Departure to Work by Sex in Bellefonte
The most frequent times of departure to work in Bellefonte are 7:30 AM to 7:59 AM (48, 20.2%) for males and 7:00 AM to 7:29 AM (68, 28.0%) for females.
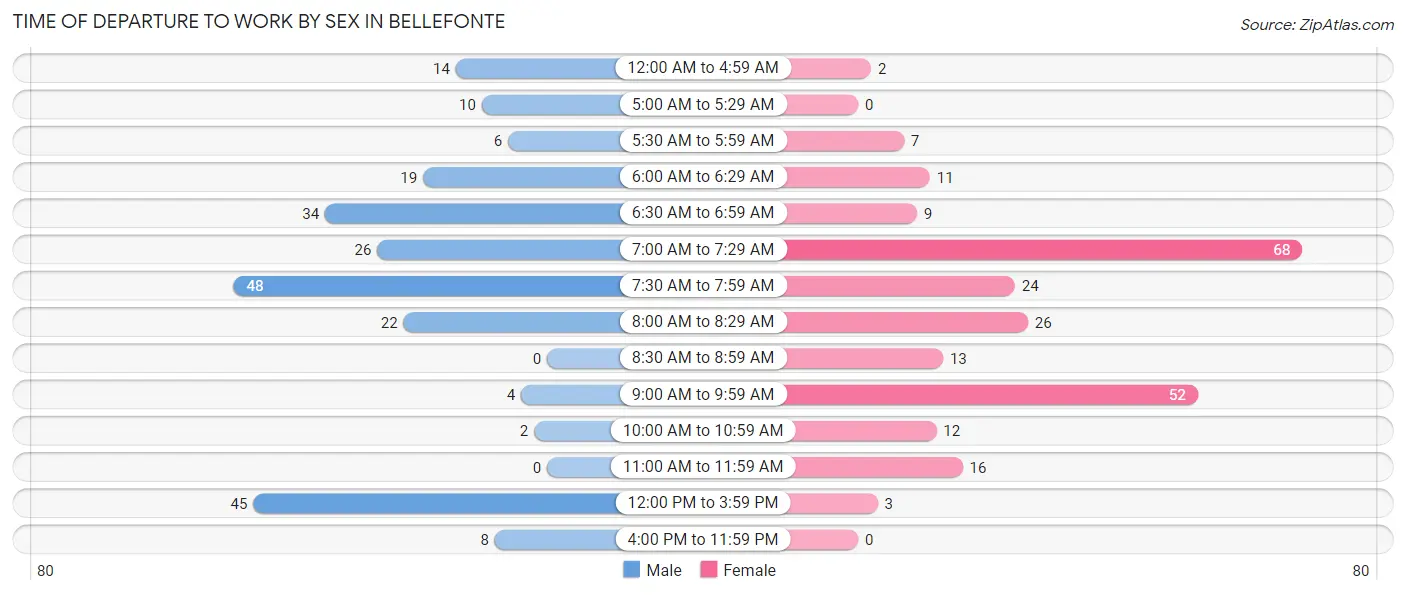
| Time of Departure | Male | Female |
| 12:00 AM to 4:59 AM | 14 (5.9%) | 2 (0.8%) |
| 5:00 AM to 5:29 AM | 10 (4.2%) | 0 (0.0%) |
| 5:30 AM to 5:59 AM | 6 (2.5%) | 7 (2.9%) |
| 6:00 AM to 6:29 AM | 19 (8.0%) | 11 (4.5%) |
| 6:30 AM to 6:59 AM | 34 (14.3%) | 9 (3.7%) |
| 7:00 AM to 7:29 AM | 26 (10.9%) | 68 (28.0%) |
| 7:30 AM to 7:59 AM | 48 (20.2%) | 24 (9.9%) |
| 8:00 AM to 8:29 AM | 22 (9.2%) | 26 (10.7%) |
| 8:30 AM to 8:59 AM | 0 (0.0%) | 13 (5.3%) |
| 9:00 AM to 9:59 AM | 4 (1.7%) | 52 (21.4%) |
| 10:00 AM to 10:59 AM | 2 (0.8%) | 12 (4.9%) |
| 11:00 AM to 11:59 AM | 0 (0.0%) | 16 (6.6%) |
| 12:00 PM to 3:59 PM | 45 (18.9%) | 3 (1.2%) |
| 4:00 PM to 11:59 PM | 8 (3.4%) | 0 (0.0%) |
| Total | 238 (100.0%) | 243 (100.0%) |
Housing Occupancy in Bellefonte
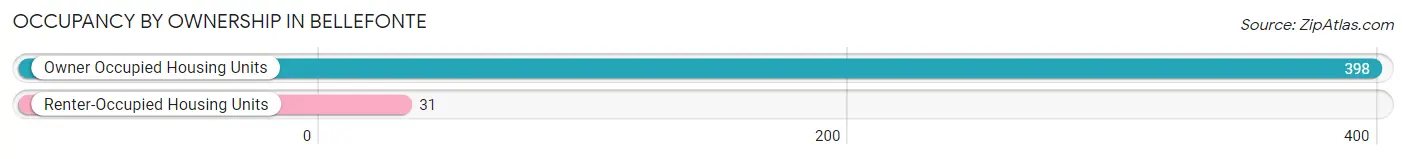
Occupancy by Ownership in Bellefonte
Of the total 429 dwellings in Bellefonte, owner-occupied units account for 398 (92.8%), while renter-occupied units make up 31 (7.2%).
| Occupancy | # Housing Units | % Housing Units |
| Owner Occupied Housing Units | 398 | 92.8% |
| Renter-Occupied Housing Units | 31 | 7.2% |
| Total Occupied Housing Units | 429 | 100.0% |
Occupancy by Household Size in Bellefonte
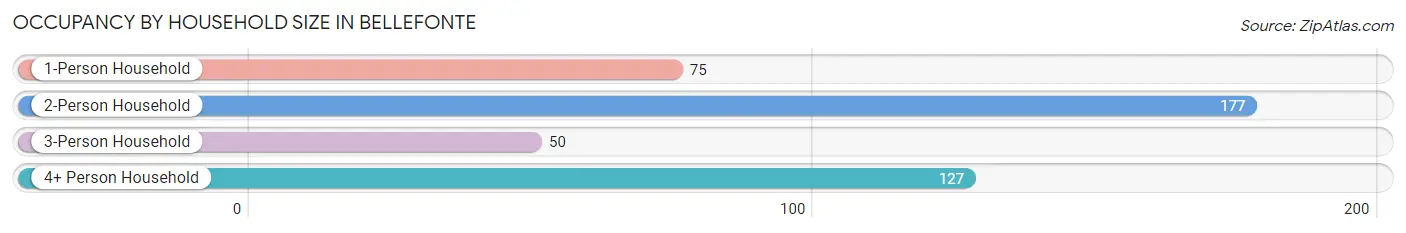
| Household Size | # Housing Units | % Housing Units |
| 1-Person Household | 75 | 17.5% |
| 2-Person Household | 177 | 41.3% |
| 3-Person Household | 50 | 11.7% |
| 4+ Person Household | 127 | 29.6% |
| Total Housing Units | 429 | 100.0% |
Occupancy by Ownership by Household Size in Bellefonte
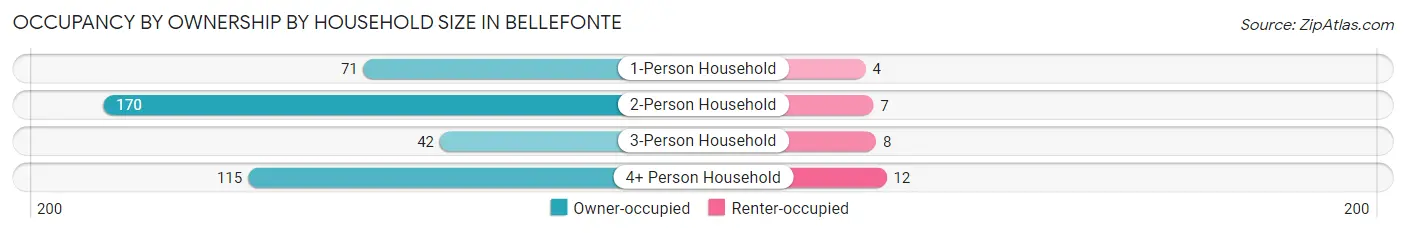
| Household Size | Owner-occupied | Renter-occupied |
| 1-Person Household | 71 (94.7%) | 4 (5.3%) |
| 2-Person Household | 170 (96.1%) | 7 (4.0%) |
| 3-Person Household | 42 (84.0%) | 8 (16.0%) |
| 4+ Person Household | 115 (90.5%) | 12 (9.5%) |
| Total Housing Units | 398 (92.8%) | 31 (7.2%) |
Occupancy by Educational Attainment in Bellefonte
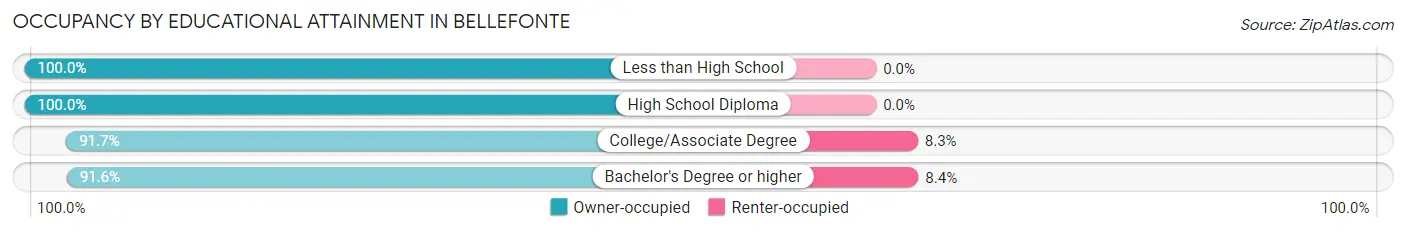
| Household Size | Owner-occupied | Renter-occupied |
| Less than High School | 7 (100.0%) | 0 (0.0%) |
| High School Diploma | 50 (100.0%) | 0 (0.0%) |
| College/Associate Degree | 111 (91.7%) | 10 (8.3%) |
| Bachelor's Degree or higher | 230 (91.6%) | 21 (8.4%) |
Occupancy by Age of Householder in Bellefonte
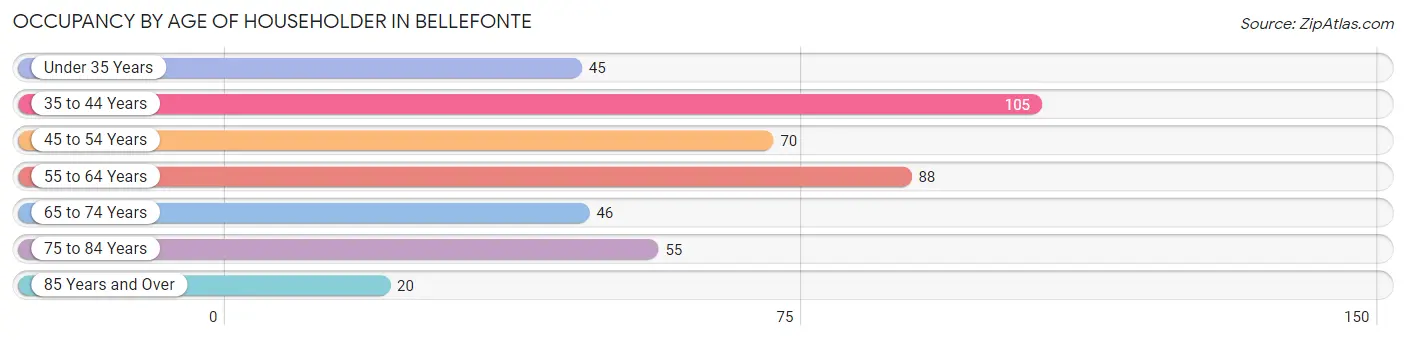
| Age Bracket | # Households | % Households |
| Under 35 Years | 45 | 10.5% |
| 35 to 44 Years | 105 | 24.5% |
| 45 to 54 Years | 70 | 16.3% |
| 55 to 64 Years | 88 | 20.5% |
| 65 to 74 Years | 46 | 10.7% |
| 75 to 84 Years | 55 | 12.8% |
| 85 Years and Over | 20 | 4.7% |
| Total | 429 | 100.0% |
Housing Finances in Bellefonte
Median Income by Occupancy in Bellefonte
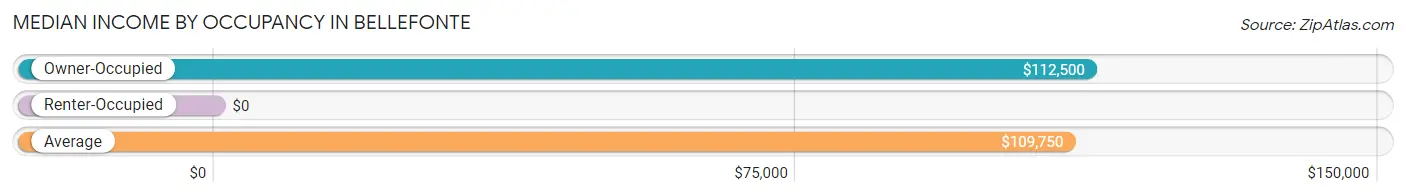
| Occupancy Type | # Households | Median Income |
| Owner-Occupied | 398 (92.8%) | $112,500 |
| Renter-Occupied | 31 (7.2%) | $0 |
| Average | 429 (100.0%) | $109,750 |
Occupancy by Householder Income Bracket in Bellefonte
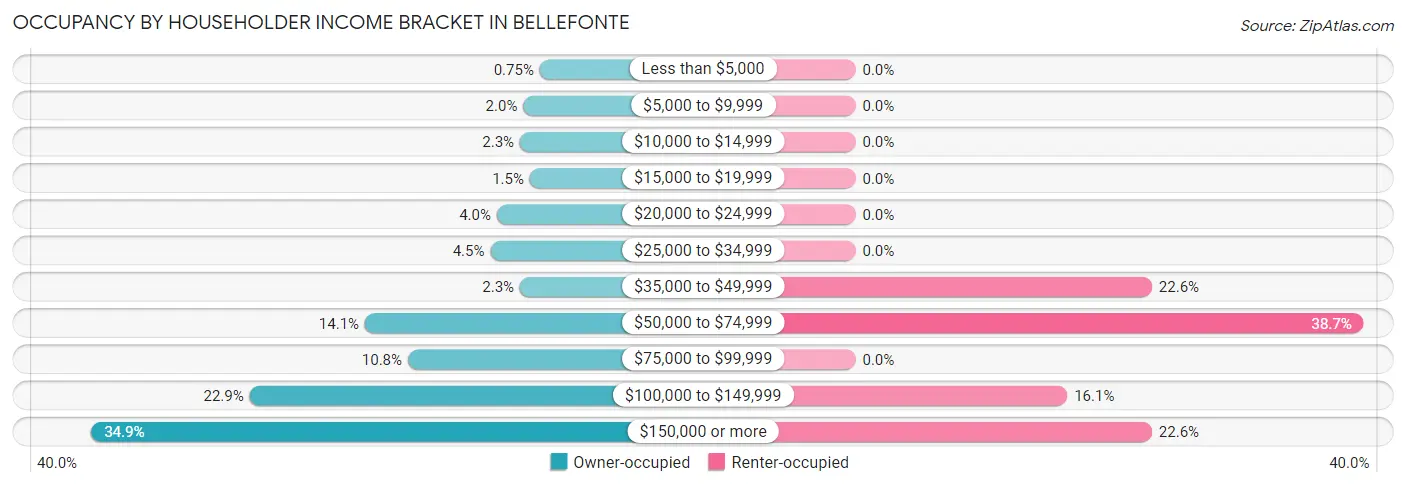
| Income Bracket | Owner-occupied | Renter-occupied |
| Less than $5,000 | 3 (0.7%) | 0 (0.0%) |
| $5,000 to $9,999 | 8 (2.0%) | 0 (0.0%) |
| $10,000 to $14,999 | 9 (2.3%) | 0 (0.0%) |
| $15,000 to $19,999 | 6 (1.5%) | 0 (0.0%) |
| $20,000 to $24,999 | 16 (4.0%) | 0 (0.0%) |
| $25,000 to $34,999 | 18 (4.5%) | 0 (0.0%) |
| $35,000 to $49,999 | 9 (2.3%) | 7 (22.6%) |
| $50,000 to $74,999 | 56 (14.1%) | 12 (38.7%) |
| $75,000 to $99,999 | 43 (10.8%) | 0 (0.0%) |
| $100,000 to $149,999 | 91 (22.9%) | 5 (16.1%) |
| $150,000 or more | 139 (34.9%) | 7 (22.6%) |
| Total | 398 (100.0%) | 31 (100.0%) |
Monthly Housing Cost Tiers in Bellefonte
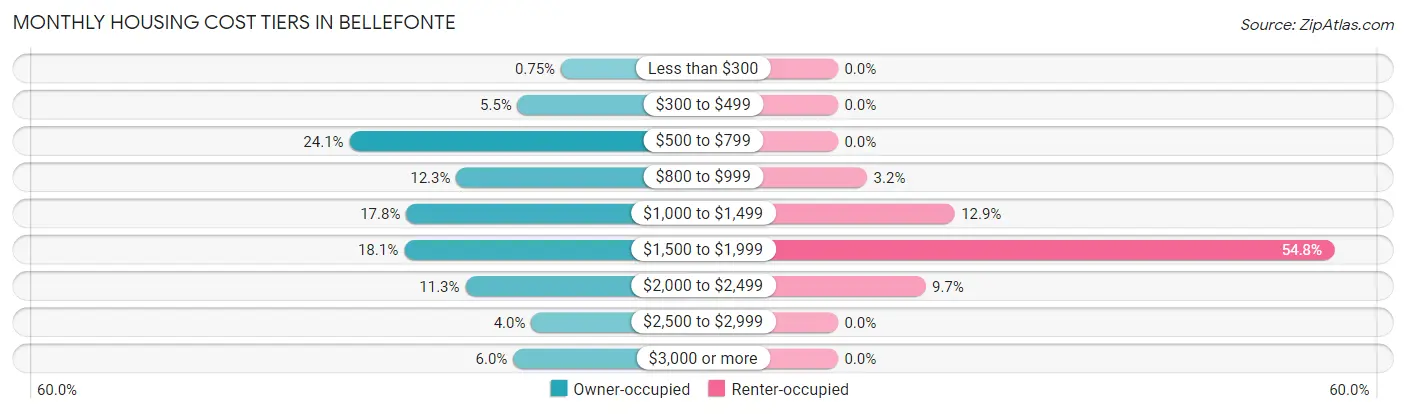
| Monthly Cost | Owner-occupied | Renter-occupied |
| Less than $300 | 3 (0.7%) | 0 (0.0%) |
| $300 to $499 | 22 (5.5%) | 0 (0.0%) |
| $500 to $799 | 96 (24.1%) | 0 (0.0%) |
| $800 to $999 | 49 (12.3%) | 1 (3.2%) |
| $1,000 to $1,499 | 71 (17.8%) | 4 (12.9%) |
| $1,500 to $1,999 | 72 (18.1%) | 17 (54.8%) |
| $2,000 to $2,499 | 45 (11.3%) | 3 (9.7%) |
| $2,500 to $2,999 | 16 (4.0%) | 0 (0.0%) |
| $3,000 or more | 24 (6.0%) | 0 (0.0%) |
| Total | 398 (100.0%) | 31 (100.0%) |
Physical Housing Characteristics in Bellefonte
Housing Structures in Bellefonte
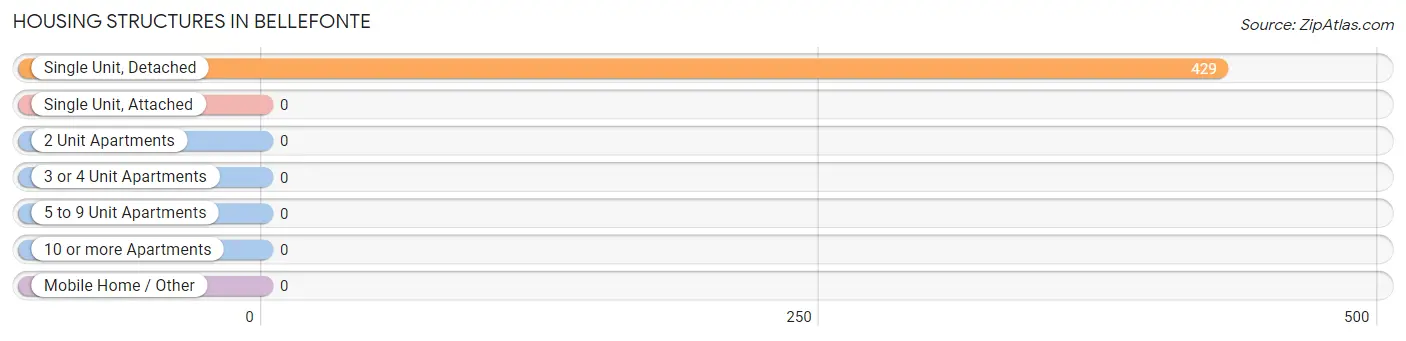
| Structure Type | # Housing Units | % Housing Units |
| Single Unit, Detached | 429 | 100.0% |
| Single Unit, Attached | 0 | 0.0% |
| 2 Unit Apartments | 0 | 0.0% |
| 3 or 4 Unit Apartments | 0 | 0.0% |
| 5 to 9 Unit Apartments | 0 | 0.0% |
| 10 or more Apartments | 0 | 0.0% |
| Mobile Home / Other | 0 | 0.0% |
| Total | 429 | 100.0% |
Housing Structures by Occupancy in Bellefonte
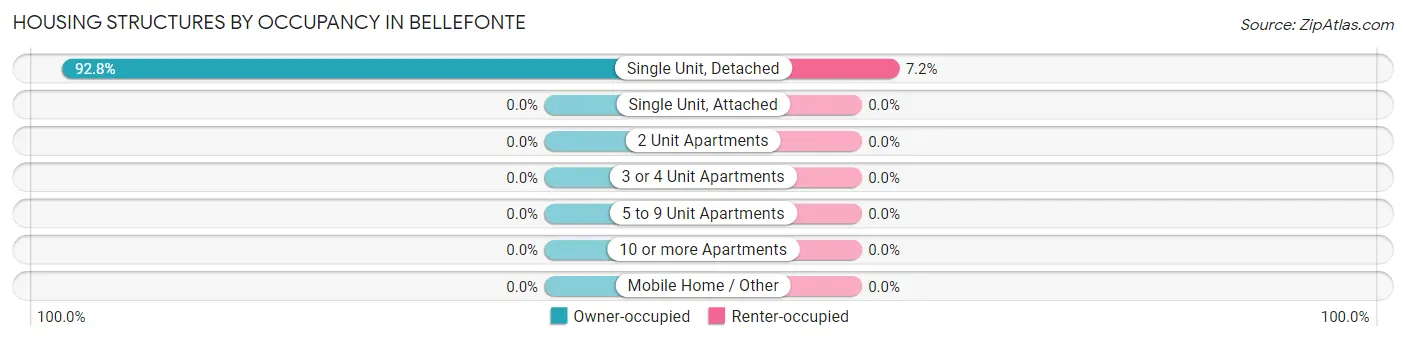
| Structure Type | Owner-occupied | Renter-occupied |
| Single Unit, Detached | 398 (92.8%) | 31 (7.2%) |
| Single Unit, Attached | 0 (0.0%) | 0 (0.0%) |
| 2 Unit Apartments | 0 (0.0%) | 0 (0.0%) |
| 3 or 4 Unit Apartments | 0 (0.0%) | 0 (0.0%) |
| 5 to 9 Unit Apartments | 0 (0.0%) | 0 (0.0%) |
| 10 or more Apartments | 0 (0.0%) | 0 (0.0%) |
| Mobile Home / Other | 0 (0.0%) | 0 (0.0%) |
| Total | 398 (92.8%) | 31 (7.2%) |
Housing Structures by Number of Rooms in Bellefonte
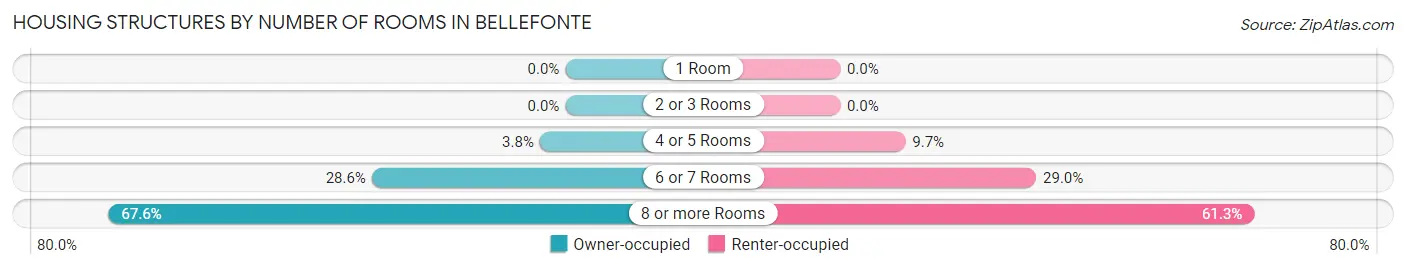
| Number of Rooms | Owner-occupied | Renter-occupied |
| 1 Room | 0 (0.0%) | 0 (0.0%) |
| 2 or 3 Rooms | 0 (0.0%) | 0 (0.0%) |
| 4 or 5 Rooms | 15 (3.8%) | 3 (9.7%) |
| 6 or 7 Rooms | 114 (28.6%) | 9 (29.0%) |
| 8 or more Rooms | 269 (67.6%) | 19 (61.3%) |
| Total | 398 (100.0%) | 31 (100.0%) |
Housing Structure by Heating Type in Bellefonte
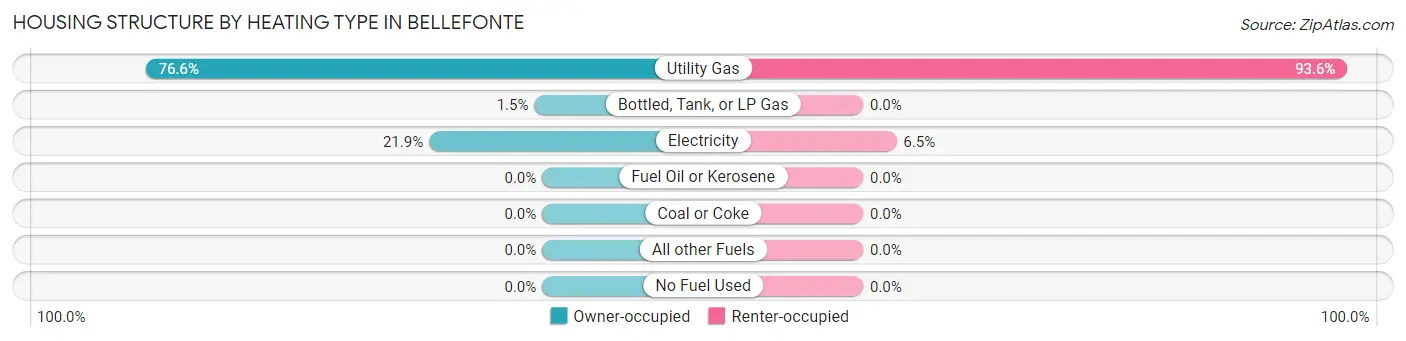
| Heating Type | Owner-occupied | Renter-occupied |
| Utility Gas | 305 (76.6%) | 29 (93.5%) |
| Bottled, Tank, or LP Gas | 6 (1.5%) | 0 (0.0%) |
| Electricity | 87 (21.9%) | 2 (6.5%) |
| Fuel Oil or Kerosene | 0 (0.0%) | 0 (0.0%) |
| Coal or Coke | 0 (0.0%) | 0 (0.0%) |
| All other Fuels | 0 (0.0%) | 0 (0.0%) |
| No Fuel Used | 0 (0.0%) | 0 (0.0%) |
| Total | 398 (100.0%) | 31 (100.0%) |
Household Vehicle Usage in Bellefonte
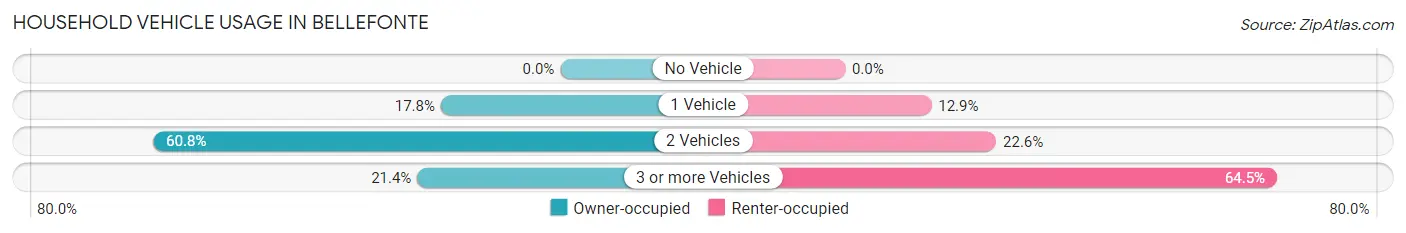
| Vehicles per Household | Owner-occupied | Renter-occupied |
| No Vehicle | 0 (0.0%) | 0 (0.0%) |
| 1 Vehicle | 71 (17.8%) | 4 (12.9%) |
| 2 Vehicles | 242 (60.8%) | 7 (22.6%) |
| 3 or more Vehicles | 85 (21.4%) | 20 (64.5%) |
| Total | 398 (100.0%) | 31 (100.0%) |
Real Estate & Mortgages in Bellefonte
Real Estate and Mortgage Overview in Bellefonte
| Characteristic | Without Mortgage | With Mortgage |
| Housing Units | 195 | 203 |
| Median Property Value | $293,100 | $237,800 |
| Median Household Income | $108,417 | $75 |
| Monthly Housing Costs | $676 | $24 |
| Real Estate Taxes | $3,048 | $0 |
Property Value by Mortgage Status in Bellefonte
| Property Value | Without Mortgage | With Mortgage |
| Less than $50,000 | 2 (1.0%) | 0 (0.0%) |
| $50,000 to $99,999 | 2 (1.0%) | 3 (1.5%) |
| $100,000 to $299,999 | 99 (50.8%) | 125 (61.6%) |
| $300,000 to $499,999 | 69 (35.4%) | 36 (17.7%) |
| $500,000 to $749,999 | 4 (2.1%) | 34 (16.8%) |
| $750,000 to $999,999 | 19 (9.7%) | 5 (2.5%) |
| $1,000,000 or more | 0 (0.0%) | 0 (0.0%) |
| Total | 195 (100.0%) | 203 (100.0%) |
Household Income by Mortgage Status in Bellefonte
| Household Income | Without Mortgage | With Mortgage |
| Less than $10,000 | 7 (3.6%) | 25 (12.3%) |
| $10,000 to $24,999 | 22 (11.3%) | 4 (2.0%) |
| $25,000 to $34,999 | 5 (2.6%) | 9 (4.4%) |
| $35,000 to $49,999 | 0 (0.0%) | 13 (6.4%) |
| $50,000 to $74,999 | 42 (21.5%) | 9 (4.4%) |
| $75,000 to $99,999 | 10 (5.1%) | 14 (6.9%) |
| $100,000 to $149,999 | 45 (23.1%) | 33 (16.3%) |
| $150,000 or more | 64 (32.8%) | 46 (22.7%) |
| Total | 195 (100.0%) | 203 (100.0%) |
Property Value to Household Income Ratio in Bellefonte
| Value-to-Income Ratio | Without Mortgage | With Mortgage |
| Less than 2.0x | 65 (33.3%) | 123,021 (60,601.5%) |
| 2.0x to 2.9x | 23 (11.8%) | 98 (48.3%) |
| 3.0x to 3.9x | 37 (19.0%) | 43 (21.2%) |
| 4.0x or more | 70 (35.9%) | 22 (10.8%) |
| Total | 195 (100.0%) | 203 (100.0%) |
Real Estate Taxes by Mortgage Status in Bellefonte
| Property Taxes | Without Mortgage | With Mortgage |
| Less than $800 | 0 (0.0%) | 0 (0.0%) |
| $800 to $1,499 | 21 (10.8%) | 8 (3.9%) |
| $800 to $1,499 | 171 (87.7%) | 32 (15.8%) |
| Total | 195 (100.0%) | 203 (100.0%) |
Health & Disability in Bellefonte
Health Insurance Coverage by Age in Bellefonte
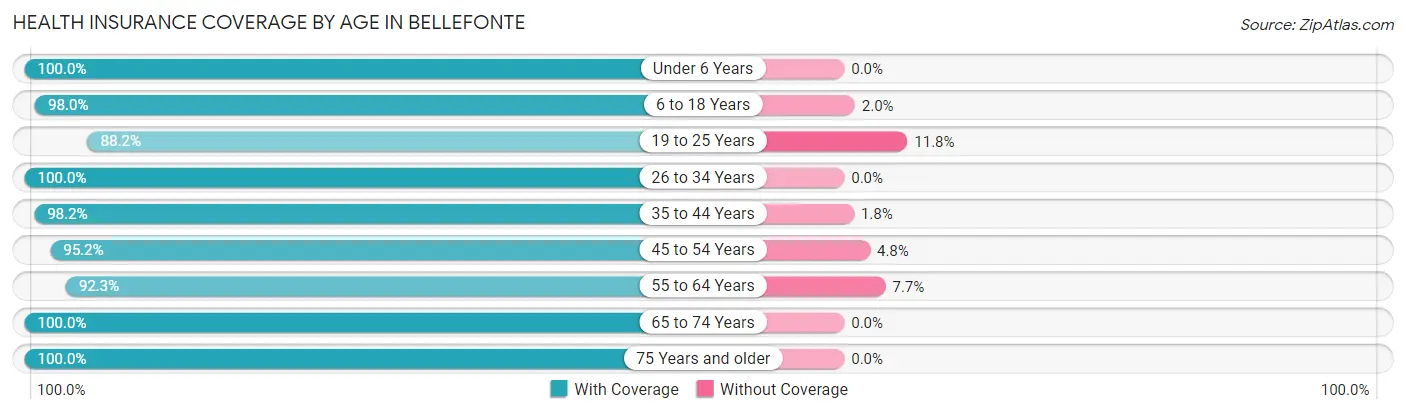
| Age Bracket | With Coverage | Without Coverage |
| Under 6 Years | 55 (100.0%) | 0 (0.0%) |
| 6 to 18 Years | 300 (98.0%) | 6 (2.0%) |
| 19 to 25 Years | 45 (88.2%) | 6 (11.8%) |
| 26 to 34 Years | 101 (100.0%) | 0 (0.0%) |
| 35 to 44 Years | 218 (98.2%) | 4 (1.8%) |
| 45 to 54 Years | 119 (95.2%) | 6 (4.8%) |
| 55 to 64 Years | 120 (92.3%) | 10 (7.7%) |
| 65 to 74 Years | 95 (100.0%) | 0 (0.0%) |
| 75 Years and older | 128 (100.0%) | 0 (0.0%) |
| Total | 1,181 (97.4%) | 32 (2.6%) |
Health Insurance Coverage by Citizenship Status in Bellefonte
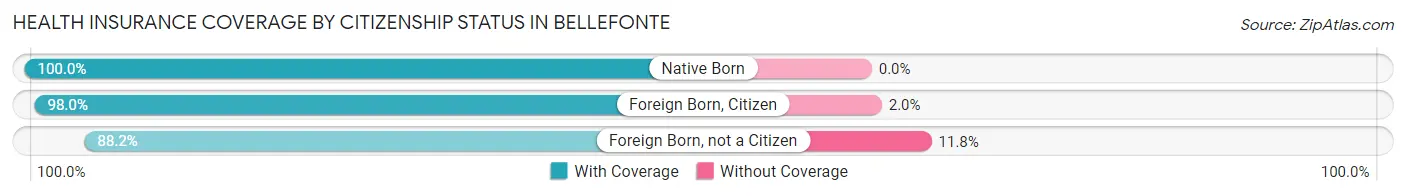
| Citizenship Status | With Coverage | Without Coverage |
| Native Born | 55 (100.0%) | 0 (0.0%) |
| Foreign Born, Citizen | 300 (98.0%) | 6 (2.0%) |
| Foreign Born, not a Citizen | 45 (88.2%) | 6 (11.8%) |
Health Insurance Coverage by Household Income in Bellefonte
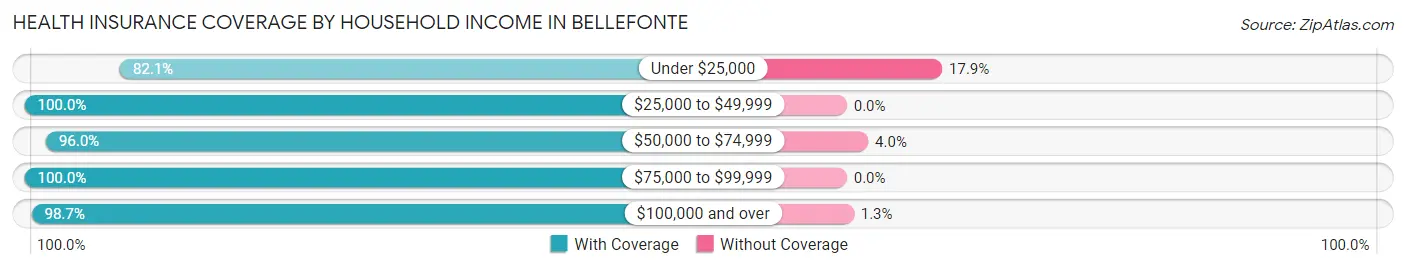
| Household Income | With Coverage | Without Coverage |
| Under $25,000 | 69 (82.1%) | 15 (17.9%) |
| $25,000 to $49,999 | 56 (100.0%) | 0 (0.0%) |
| $50,000 to $74,999 | 168 (96.0%) | 7 (4.0%) |
| $75,000 to $99,999 | 135 (100.0%) | 0 (0.0%) |
| $100,000 and over | 753 (98.7%) | 10 (1.3%) |
Public vs Private Health Insurance Coverage by Age in Bellefonte
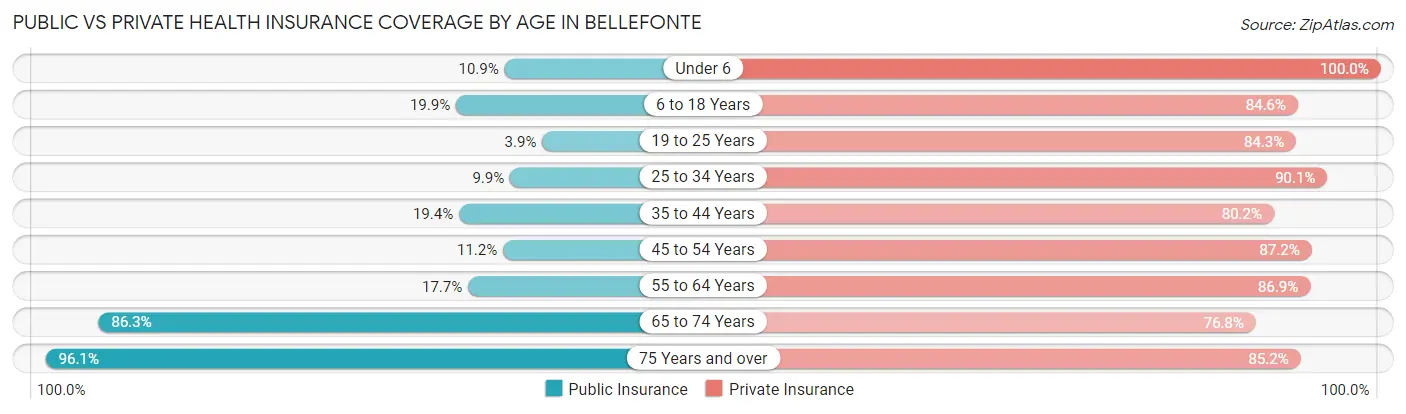
| Age Bracket | Public Insurance | Private Insurance |
| Under 6 | 6 (10.9%) | 55 (100.0%) |
| 6 to 18 Years | 61 (19.9%) | 259 (84.6%) |
| 19 to 25 Years | 2 (3.9%) | 43 (84.3%) |
| 25 to 34 Years | 10 (9.9%) | 91 (90.1%) |
| 35 to 44 Years | 43 (19.4%) | 178 (80.2%) |
| 45 to 54 Years | 14 (11.2%) | 109 (87.2%) |
| 55 to 64 Years | 23 (17.7%) | 113 (86.9%) |
| 65 to 74 Years | 82 (86.3%) | 73 (76.8%) |
| 75 Years and over | 123 (96.1%) | 109 (85.2%) |
| Total | 364 (30.0%) | 1,030 (84.9%) |
Disability Status by Sex by Age in Bellefonte
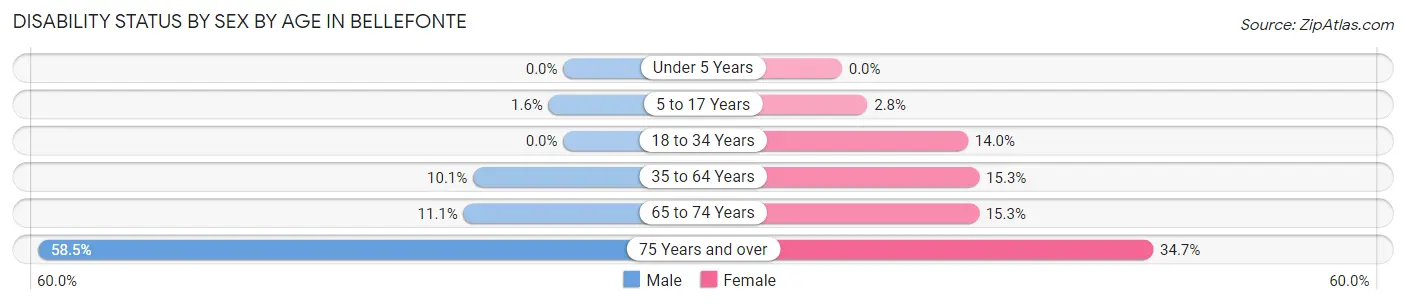
| Age Bracket | Male | Female |
| Under 5 Years | 0 (0.0%) | 0 (0.0%) |
| 5 to 17 Years | 2 (1.6%) | 5 (2.8%) |
| 18 to 34 Years | 0 (0.0%) | 8 (14.0%) |
| 35 to 64 Years | 21 (10.1%) | 41 (15.3%) |
| 65 to 74 Years | 4 (11.1%) | 9 (15.2%) |
| 75 Years and over | 31 (58.5%) | 26 (34.7%) |
Disability Class by Sex by Age in Bellefonte
Disability Class: Hearing Difficulty
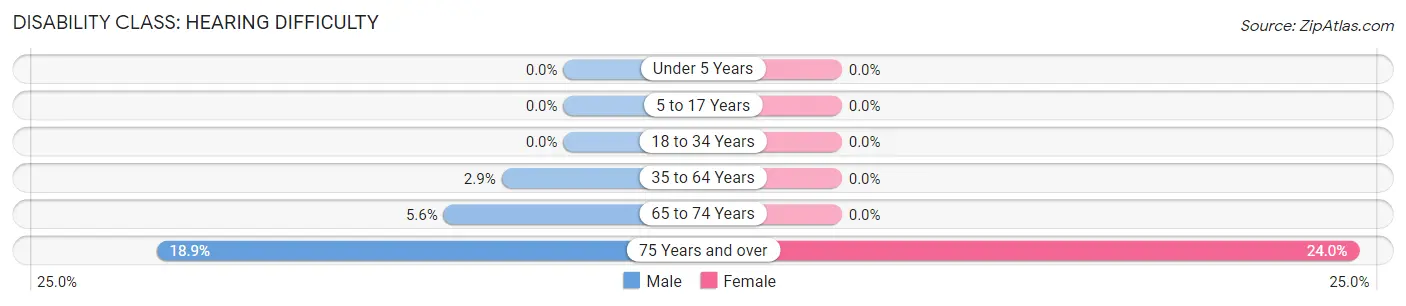
| Age Bracket | Male | Female |
| Under 5 Years | 0 (0.0%) | 0 (0.0%) |
| 5 to 17 Years | 0 (0.0%) | 0 (0.0%) |
| 18 to 34 Years | 0 (0.0%) | 0 (0.0%) |
| 35 to 64 Years | 6 (2.9%) | 0 (0.0%) |
| 65 to 74 Years | 2 (5.6%) | 0 (0.0%) |
| 75 Years and over | 10 (18.9%) | 18 (24.0%) |
Disability Class: Vision Difficulty
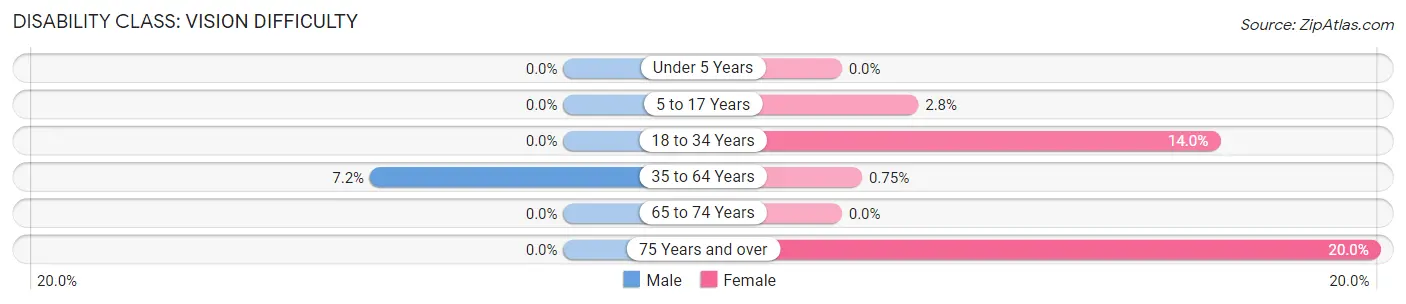
| Age Bracket | Male | Female |
| Under 5 Years | 0 (0.0%) | 0 (0.0%) |
| 5 to 17 Years | 0 (0.0%) | 5 (2.8%) |
| 18 to 34 Years | 0 (0.0%) | 8 (14.0%) |
| 35 to 64 Years | 15 (7.2%) | 2 (0.7%) |
| 65 to 74 Years | 0 (0.0%) | 0 (0.0%) |
| 75 Years and over | 0 (0.0%) | 15 (20.0%) |
Disability Class: Cognitive Difficulty
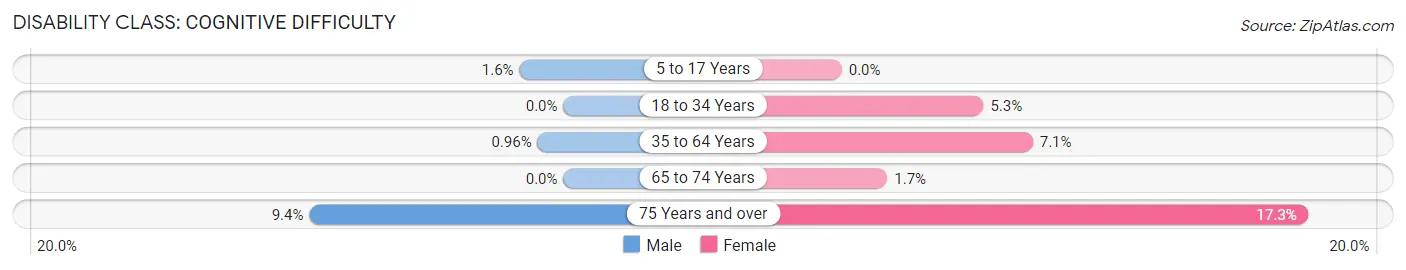
| Age Bracket | Male | Female |
| 5 to 17 Years | 2 (1.6%) | 0 (0.0%) |
| 18 to 34 Years | 0 (0.0%) | 3 (5.3%) |
| 35 to 64 Years | 2 (1.0%) | 19 (7.1%) |
| 65 to 74 Years | 0 (0.0%) | 1 (1.7%) |
| 75 Years and over | 5 (9.4%) | 13 (17.3%) |
Disability Class: Ambulatory Difficulty
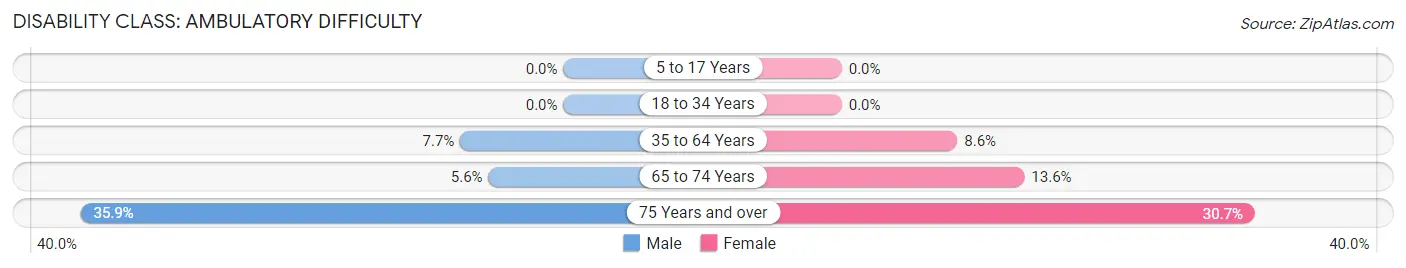
| Age Bracket | Male | Female |
| 5 to 17 Years | 0 (0.0%) | 0 (0.0%) |
| 18 to 34 Years | 0 (0.0%) | 0 (0.0%) |
| 35 to 64 Years | 16 (7.7%) | 23 (8.6%) |
| 65 to 74 Years | 2 (5.6%) | 8 (13.6%) |
| 75 Years and over | 19 (35.8%) | 23 (30.7%) |
Disability Class: Self-Care Difficulty

| Age Bracket | Male | Female |
| 5 to 17 Years | 0 (0.0%) | 0 (0.0%) |
| 18 to 34 Years | 0 (0.0%) | 0 (0.0%) |
| 35 to 64 Years | 4 (1.9%) | 3 (1.1%) |
| 65 to 74 Years | 0 (0.0%) | 0 (0.0%) |
| 75 Years and over | 3 (5.7%) | 13 (17.3%) |
Technology Access in Bellefonte
Computing Device Access in Bellefonte
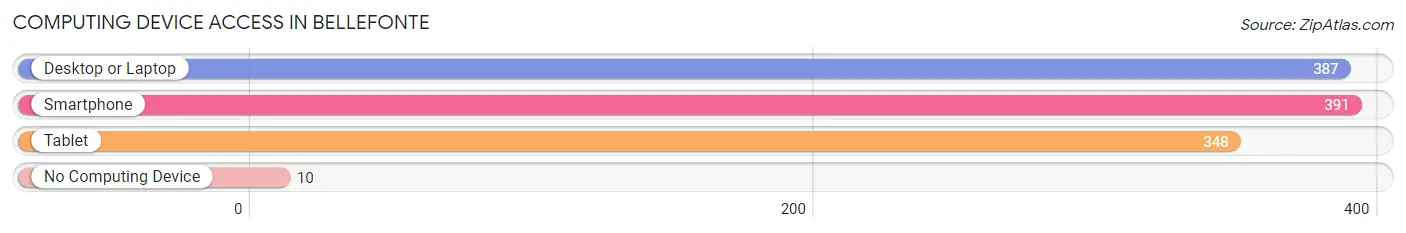
| Device Type | # Households | % Households |
| Desktop or Laptop | 387 | 90.2% |
| Smartphone | 391 | 91.1% |
| Tablet | 348 | 81.1% |
| No Computing Device | 10 | 2.3% |
| Total | 429 | 100.0% |
Internet Access in Bellefonte
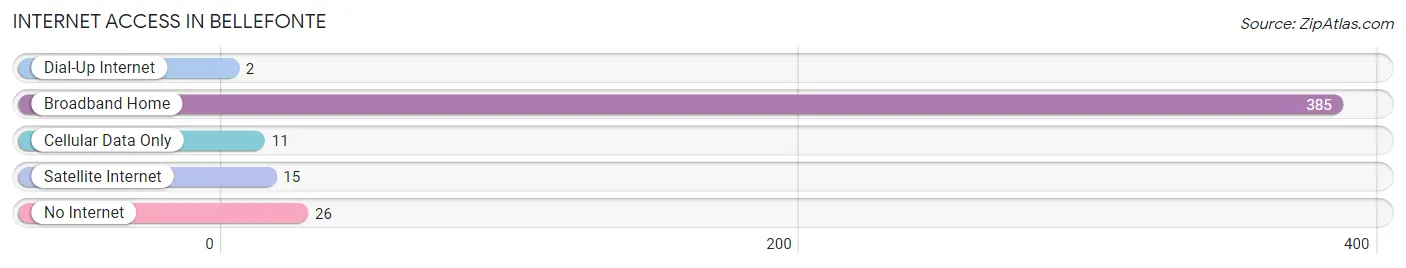
| Internet Type | # Households | % Households |
| Dial-Up Internet | 2 | 0.5% |
| Broadband Home | 385 | 89.7% |
| Cellular Data Only | 11 | 2.6% |
| Satellite Internet | 15 | 3.5% |
| No Internet | 26 | 6.1% |
| Total | 429 | 100.0% |
Bellefonte Summary
Bellefonte is a small unincorporated community located in the state of Kentucky, in the United States. It is situated in the foothills of the Appalachian Mountains, in the southeastern corner of the state. The community is located in the county of Bell County, and is part of the Middlesboro Micropolitan Statistical Area. The population of Bellefonte was estimated to be around 1,000 people in the year 2000.
History
Bellefonte was first settled in the early 1800s by a group of settlers from Virginia. The community was originally known as “Bellefontaine”, which is French for “beautiful fountain”. The name was changed to Bellefonte in 1845. The community was originally a farming community, and the main crops grown were corn, wheat, and tobacco.
In the late 1800s, the community began to grow and develop. The Louisville and Nashville Railroad was built through the area in 1883, and this helped to spur economic growth. The railroad brought new businesses and industries to the area, and the population began to grow.
In the early 1900s, the coal mining industry began to take off in the area. The coal mines provided jobs for many of the residents of Bellefonte, and the population continued to grow. The coal mining industry continued to be a major part of the economy until the late 1970s, when the industry began to decline.
Geography
Bellefonte is located in the southeastern corner of Kentucky, in the foothills of the Appalachian Mountains. The community is situated in Bell County, and is part of the Middlesboro Micropolitan Statistical Area. The town is located at an elevation of 1,000 feet above sea level.
The climate in Bellefonte is humid subtropical, with hot summers and mild winters. The average annual temperature is around 60 degrees Fahrenheit, and the average annual precipitation is around 45 inches.
Economy
The economy of Bellefonte is largely based on agriculture and tourism. The main crops grown in the area are corn, wheat, and tobacco. The town is also home to several small businesses, including restaurants, shops, and other services.
Tourism is also an important part of the economy. The town is home to several attractions, including the Bellefonte Historic District, which is listed on the National Register of Historic Places. The town also hosts several festivals and events throughout the year, including the Bellefonte Arts and Crafts Festival and the Bellefonte Music Festival.
Demographics
As of the year 2000, the population of Bellefonte was estimated to be around 1,000 people. The racial makeup of the town was 97.2% White, 0.7% African American, 0.3% Native American, 0.3% Asian, and 1.5% from other races. The median household income was $25,000, and the median family income was $30,000. The per capita income was $14,000.
Common Questions
What is Per Capita Income in Bellefonte?
Per Capita income in Bellefonte is $58,194.
What is the Median Family Income in Bellefonte?
Median Family Income in Bellefonte is $123,958.
What is the Median Household income in Bellefonte?
Median Household Income in Bellefonte is $109,750.
What is Income or Wage Gap in Bellefonte?
Income or Wage Gap in Bellefonte is 57.0%.
Women in Bellefonte earn 43.0 cents for every dollar earned by a man.
What is Inequality or Gini Index in Bellefonte?
Inequality or Gini Index in Bellefonte is 0.48.
What is the Total Population of Bellefonte?
Total Population of Bellefonte is 1,216.
What is the Total Male Population of Bellefonte?
Total Male Population of Bellefonte is 558.
What is the Total Female Population of Bellefonte?
Total Female Population of Bellefonte is 658.
What is the Ratio of Males per 100 Females in Bellefonte?
There are 84.80 Males per 100 Females in Bellefonte.
What is the Ratio of Females per 100 Males in Bellefonte?
There are 117.92 Females per 100 Males in Bellefonte.
What is the Median Population Age in Bellefonte?
Median Population Age in Bellefonte is 39.5 Years.
What is the Average Family Size in Bellefonte
Average Family Size in Bellefonte is 3.1 People.
What is the Average Household Size in Bellefonte
Average Household Size in Bellefonte is 2.8 People.
How Large is the Labor Force in Bellefonte?
There are 525 People in the Labor Forcein in Bellefonte.
What is the Percentage of People in the Labor Force in Bellefonte?
60.0% of People are in the Labor Force in Bellefonte.
What is the Unemployment Rate in Bellefonte?
Unemployment Rate in Bellefonte is 2.7%.