Barbourmeade, KY Map & Demographics
Barbourmeade Map
Barbourmeade Overview
$46,475
PER CAPITA INCOME
$116,389
AVG FAMILY INCOME
$105,074
AVG HOUSEHOLD INCOME
25.5%
WAGE / INCOME GAP [ % ]
74.5¢/ $1
WAGE / INCOME GAP [ $ ]
0.34
INEQUALITY / GINI INDEX
1,213
TOTAL POPULATION
581
MALE POPULATION
632
FEMALE POPULATION
91.93
MALES / 100 FEMALES
108.78
FEMALES / 100 MALES
46.9
MEDIAN AGE
2.9
AVG FAMILY SIZE
2.6
AVG HOUSEHOLD SIZE
570
LABOR FORCE [ PEOPLE ]
59.1%
PERCENT IN LABOR FORCE
6.5%
UNEMPLOYMENT RATE
Barbourmeade Area Codes
Income in Barbourmeade
Income Overview in Barbourmeade
Per Capita Income in Barbourmeade is $46,475, while median incomes of families and households are $116,389 and $105,074 respectively.
| Characteristic | Number | Measure |
| Per Capita Income | 1,213 | $46,475 |
| Median Family Income | 372 | $116,389 |
| Mean Family Income | 372 | $130,879 |
| Median Household Income | 471 | $105,074 |
| Mean Household Income | 471 | $118,503 |
| Income Deficit | 372 | $0 |
| Wage / Income Gap (%) | 1,213 | 25.50% |
| Wage / Income Gap ($) | 1,213 | 74.50¢ per $1 |
| Gini / Inequality Index | 1,213 | 0.34 |
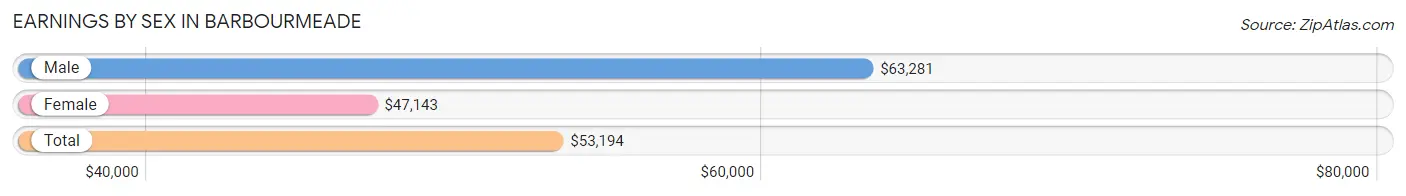
Earnings by Sex in Barbourmeade
Average Earnings in Barbourmeade are $53,194, $63,281 for men and $47,143 for women, a difference of 25.5%.
| Sex | Number | Average Earnings |
| Male | 303 (50.9%) | $63,281 |
| Female | 292 (49.1%) | $47,143 |
| Total | 595 (100.0%) | $53,194 |
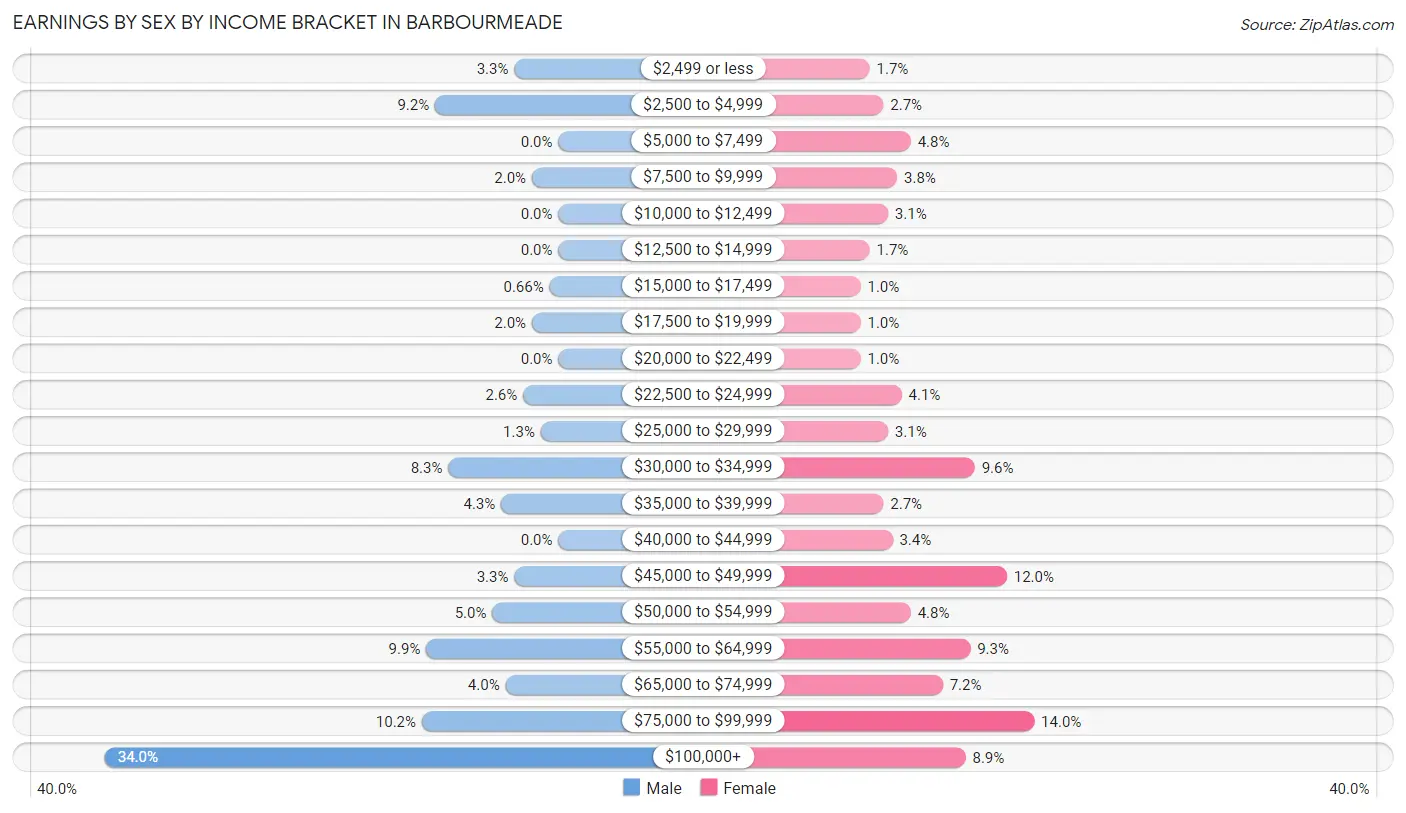
Earnings by Sex by Income Bracket in Barbourmeade
The most common earnings brackets in Barbourmeade are $100,000+ for men (103 | 34.0%) and $75,000 to $99,999 for women (41 | 14.0%).
| Income | Male | Female |
| $2,499 or less | 10 (3.3%) | 5 (1.7%) |
| $2,500 to $4,999 | 28 (9.2%) | 8 (2.7%) |
| $5,000 to $7,499 | 0 (0.0%) | 14 (4.8%) |
| $7,500 to $9,999 | 6 (2.0%) | 11 (3.8%) |
| $10,000 to $12,499 | 0 (0.0%) | 9 (3.1%) |
| $12,500 to $14,999 | 0 (0.0%) | 5 (1.7%) |
| $15,000 to $17,499 | 2 (0.7%) | 3 (1.0%) |
| $17,500 to $19,999 | 6 (2.0%) | 3 (1.0%) |
| $20,000 to $22,499 | 0 (0.0%) | 3 (1.0%) |
| $22,500 to $24,999 | 8 (2.6%) | 12 (4.1%) |
| $25,000 to $29,999 | 4 (1.3%) | 9 (3.1%) |
| $30,000 to $34,999 | 25 (8.3%) | 28 (9.6%) |
| $35,000 to $39,999 | 13 (4.3%) | 8 (2.7%) |
| $40,000 to $44,999 | 0 (0.0%) | 10 (3.4%) |
| $45,000 to $49,999 | 10 (3.3%) | 35 (12.0%) |
| $50,000 to $54,999 | 15 (5.0%) | 14 (4.8%) |
| $55,000 to $64,999 | 30 (9.9%) | 27 (9.2%) |
| $65,000 to $74,999 | 12 (4.0%) | 21 (7.2%) |
| $75,000 to $99,999 | 31 (10.2%) | 41 (14.0%) |
| $100,000+ | 103 (34.0%) | 26 (8.9%) |
| Total | 303 (100.0%) | 292 (100.0%) |
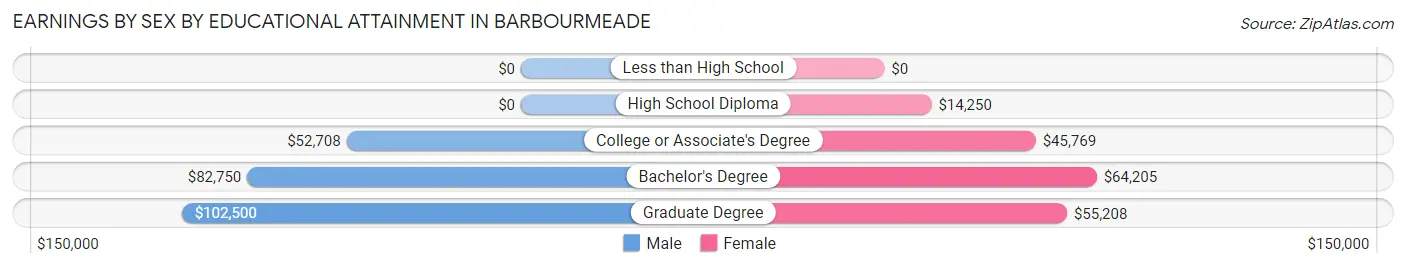
Earnings by Sex by Educational Attainment in Barbourmeade
Average earnings in Barbourmeade are $73,750 for men and $48,304 for women, a difference of 34.5%. Men with an educational attainment of graduate degree enjoy the highest average annual earnings of $102,500, while those with college or associate's degree education earn the least with $52,708. Women with an educational attainment of bachelor's degree earn the most with the average annual earnings of $64,205, while those with high school diploma education have the smallest earnings of $14,250.
| Educational Attainment | Male Income | Female Income |
| Less than High School | - | - |
| High School Diploma | - | - |
| College or Associate's Degree | $52,708 | $45,769 |
| Bachelor's Degree | $82,750 | $64,205 |
| Graduate Degree | $102,500 | $55,208 |
| Total | $73,750 | $48,304 |
Family Income in Barbourmeade
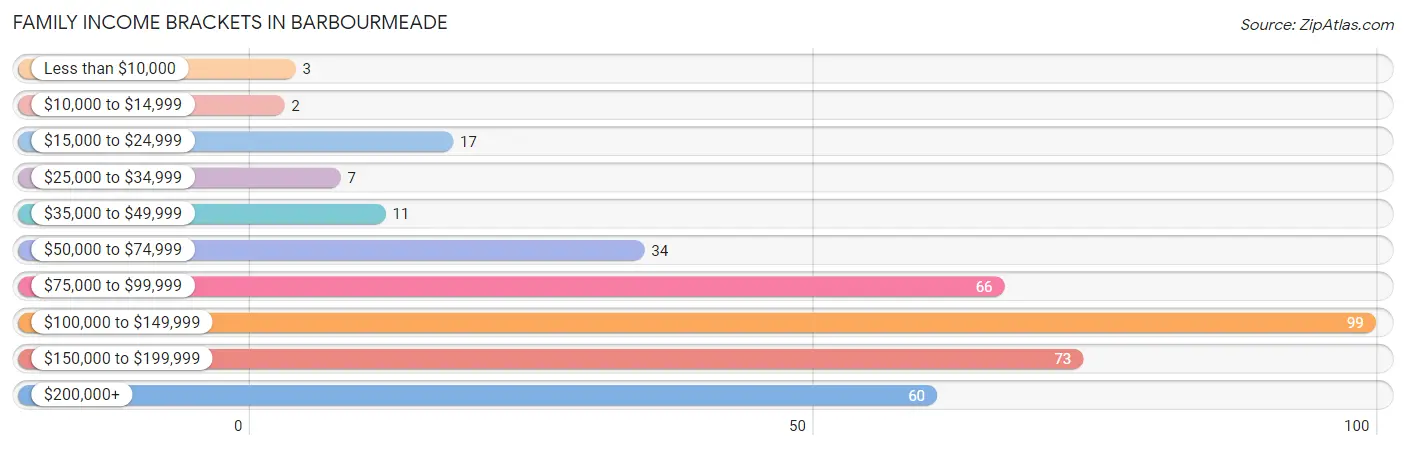
Family Income Brackets in Barbourmeade
According to the Barbourmeade family income data, there are 99 families falling into the $100,000 to $149,999 income range, which is the most common income bracket and makes up 26.6% of all families. Conversely, the $10,000 to $14,999 income bracket is the least frequent group with only 2 families (0.5%) belonging to this category.
| Income Bracket | # Families | % Families |
| Less than $10,000 | 3 | 0.8% |
| $10,000 to $14,999 | 2 | 0.5% |
| $15,000 to $24,999 | 17 | 4.6% |
| $25,000 to $34,999 | 7 | 1.9% |
| $35,000 to $49,999 | 11 | 3.0% |
| $50,000 to $74,999 | 34 | 9.1% |
| $75,000 to $99,999 | 66 | 17.7% |
| $100,000 to $149,999 | 99 | 26.6% |
| $150,000 to $199,999 | 73 | 19.6% |
| $200,000+ | 60 | 16.1% |
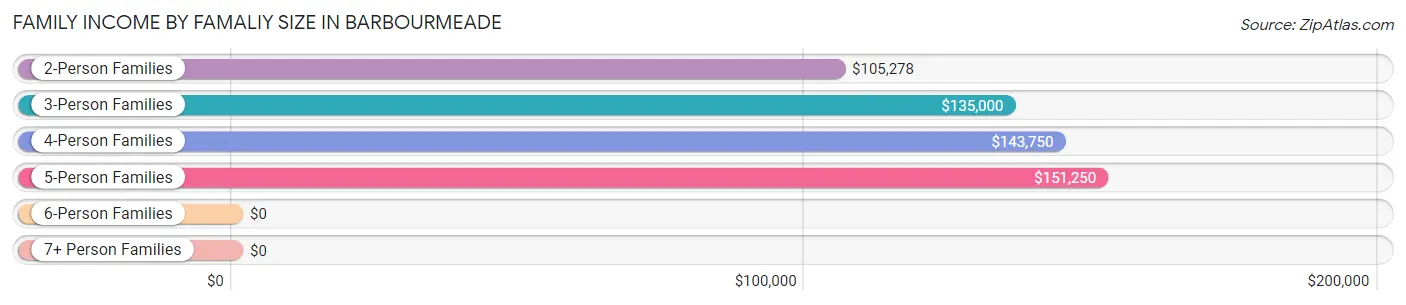
Family Income by Famaliy Size in Barbourmeade
5-person families (14 | 3.8%) account for the highest median family income in Barbourmeade with $151,250 per family, while 2-person families (188 | 50.5%) have the highest median income of $52,639 per family member.
| Income Bracket | # Families | Median Income |
| 2-Person Families | 188 (50.5%) | $105,278 |
| 3-Person Families | 78 (21.0%) | $135,000 |
| 4-Person Families | 92 (24.7%) | $143,750 |
| 5-Person Families | 14 (3.8%) | $151,250 |
| 6-Person Families | 0 (0.0%) | $0 |
| 7+ Person Families | 0 (0.0%) | $0 |
| Total | 372 (100.0%) | $116,389 |
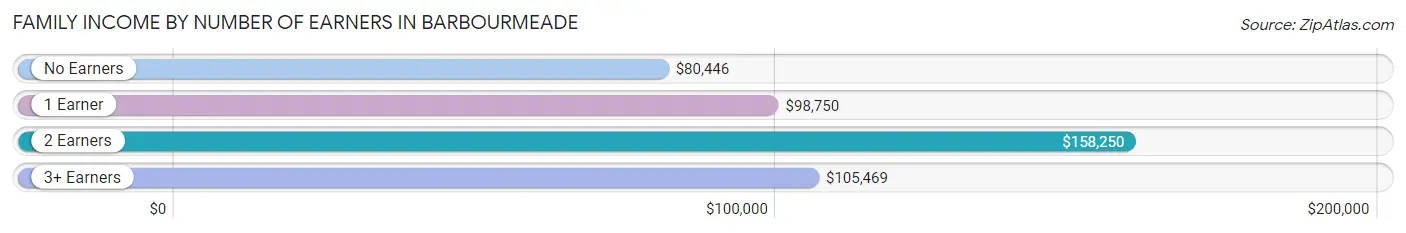
Family Income by Number of Earners in Barbourmeade
The median family income in Barbourmeade is $116,389, with families comprising 2 earners (177) having the highest median family income of $158,250, while families with no earners (79) have the lowest median family income of $80,446, accounting for 47.6% and 21.2% of families, respectively.
| Number of Earners | # Families | Median Income |
| No Earners | 79 (21.2%) | $80,446 |
| 1 Earner | 65 (17.5%) | $98,750 |
| 2 Earners | 177 (47.6%) | $158,250 |
| 3+ Earners | 51 (13.7%) | $105,469 |
| Total | 372 (100.0%) | $116,389 |
Household Income in Barbourmeade
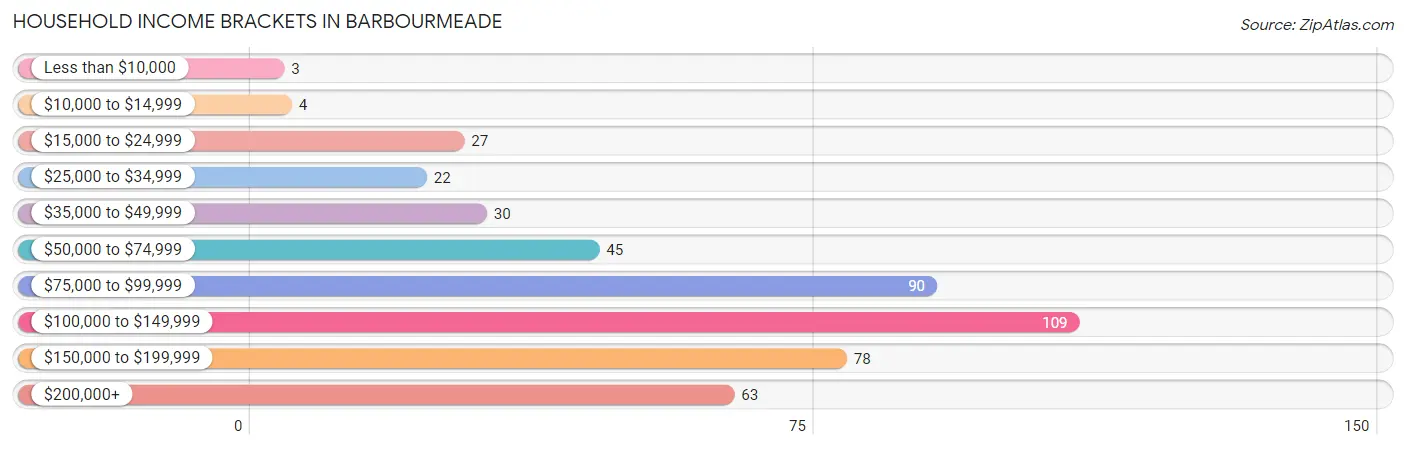
Household Income Brackets in Barbourmeade
With 109 households falling in the category, the $100,000 to $149,999 income range is the most frequent in Barbourmeade, accounting for 23.1% of all households. In contrast, only 3 households (0.6%) fall into the less than $10,000 income bracket, making it the least populous group.
| Income Bracket | # Households | % Households |
| Less than $10,000 | 3 | 0.6% |
| $10,000 to $14,999 | 4 | 0.8% |
| $15,000 to $24,999 | 27 | 5.7% |
| $25,000 to $34,999 | 22 | 4.7% |
| $35,000 to $49,999 | 30 | 6.4% |
| $50,000 to $74,999 | 45 | 9.6% |
| $75,000 to $99,999 | 90 | 19.1% |
| $100,000 to $149,999 | 109 | 23.1% |
| $150,000 to $199,999 | 78 | 16.6% |
| $200,000+ | 63 | 13.4% |
Household Income by Householder Age in Barbourmeade
The median household income in Barbourmeade is $105,074, with the highest median household income of $160,938 found in the 25 to 44 years age bracket for the primary householder. A total of 119 households (25.3%) fall into this category.
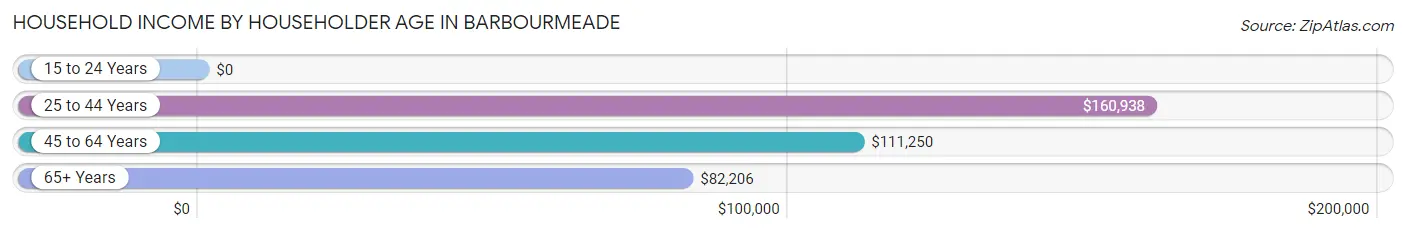
| Income Bracket | # Households | Median Income |
| 15 to 24 Years | 0 (0.0%) | $0 |
| 25 to 44 Years | 119 (25.3%) | $160,938 |
| 45 to 64 Years | 140 (29.7%) | $111,250 |
| 65+ Years | 212 (45.0%) | $82,206 |
| Total | 471 (100.0%) | $105,074 |
Poverty in Barbourmeade
Income Below Poverty by Sex and Age in Barbourmeade
With 6.4% poverty level for males and 11.1% for females among the residents of Barbourmeade, 6 to 11 year old males and 6 to 11 year old females are the most vulnerable to poverty, with 18 males (37.5%) and 43 females (59.7%) in their respective age groups living below the poverty level.
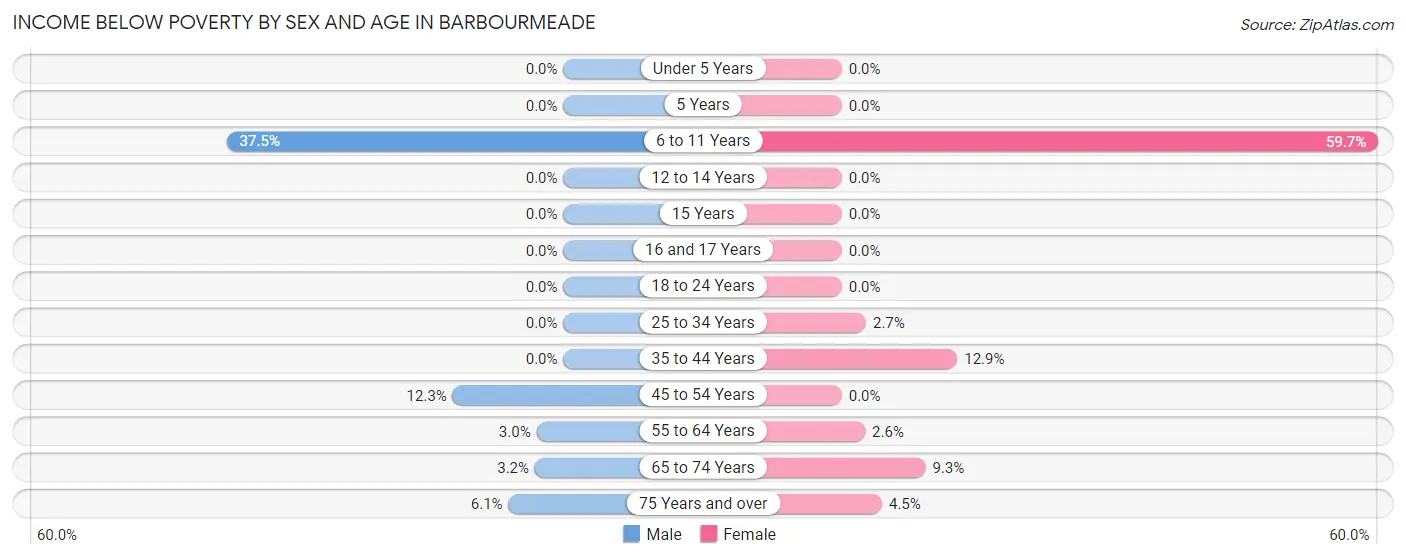
| Age Bracket | Male | Female |
| Under 5 Years | 0 (0.0%) | 0 (0.0%) |
| 5 Years | 0 (0.0%) | 0 (0.0%) |
| 6 to 11 Years | 18 (37.5%) | 43 (59.7%) |
| 12 to 14 Years | 0 (0.0%) | 0 (0.0%) |
| 15 Years | 0 (0.0%) | 0 (0.0%) |
| 16 and 17 Years | 0 (0.0%) | 0 (0.0%) |
| 18 to 24 Years | 0 (0.0%) | 0 (0.0%) |
| 25 to 34 Years | 0 (0.0%) | 2 (2.7%) |
| 35 to 44 Years | 0 (0.0%) | 9 (12.9%) |
| 45 to 54 Years | 9 (12.3%) | 0 (0.0%) |
| 55 to 64 Years | 2 (3.0%) | 2 (2.6%) |
| 65 to 74 Years | 2 (3.2%) | 11 (9.3%) |
| 75 Years and over | 6 (6.1%) | 3 (4.5%) |
| Total | 37 (6.4%) | 70 (11.1%) |
Income Above Poverty by Sex and Age in Barbourmeade
According to the poverty statistics in Barbourmeade, males aged under 5 years and females aged under 5 years are the age groups that are most secure financially, with 100.0% of males and 100.0% of females in these age groups living above the poverty line.
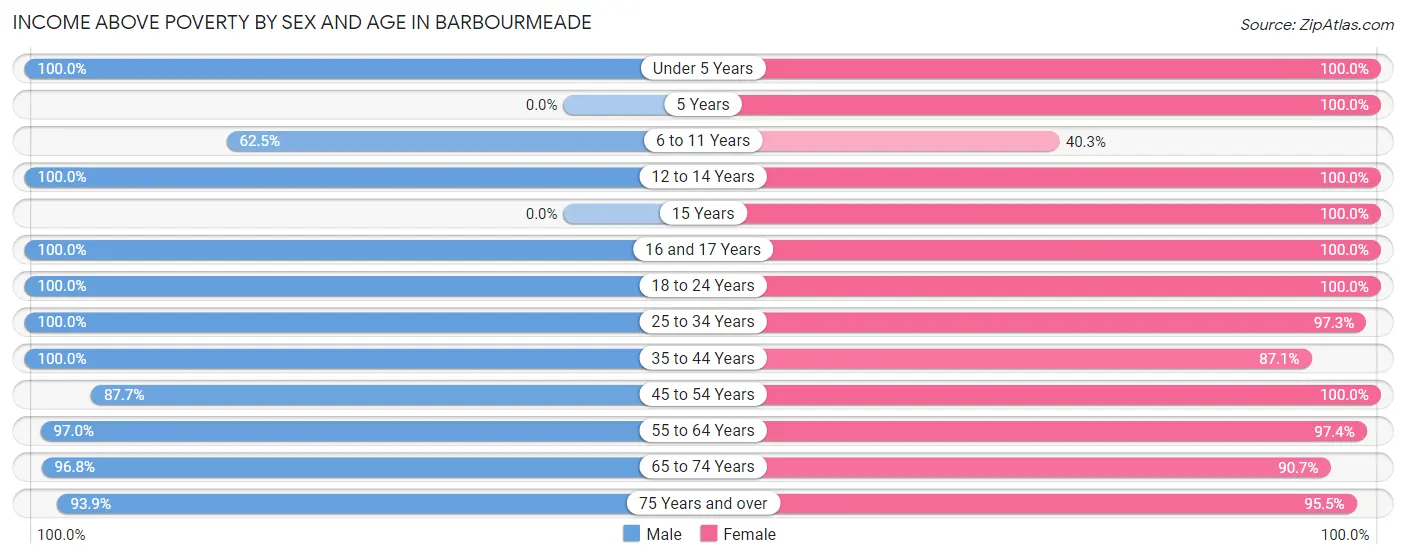
| Age Bracket | Male | Female |
| Under 5 Years | 52 (100.0%) | 27 (100.0%) |
| 5 Years | 0 (0.0%) | 5 (100.0%) |
| 6 to 11 Years | 30 (62.5%) | 29 (40.3%) |
| 12 to 14 Years | 18 (100.0%) | 19 (100.0%) |
| 15 Years | 0 (0.0%) | 7 (100.0%) |
| 16 and 17 Years | 16 (100.0%) | 20 (100.0%) |
| 18 to 24 Years | 27 (100.0%) | 13 (100.0%) |
| 25 to 34 Years | 44 (100.0%) | 72 (97.3%) |
| 35 to 44 Years | 75 (100.0%) | 61 (87.1%) |
| 45 to 54 Years | 64 (87.7%) | 63 (100.0%) |
| 55 to 64 Years | 65 (97.0%) | 75 (97.4%) |
| 65 to 74 Years | 61 (96.8%) | 107 (90.7%) |
| 75 Years and over | 92 (93.9%) | 64 (95.5%) |
| Total | 544 (93.6%) | 562 (88.9%) |
Income Below Poverty Among Married-Couple Families in Barbourmeade
The poverty statistics for married-couple families in Barbourmeade show that 3.9% or 13 of the total 335 families live below the poverty line. Families with no children have the highest poverty rate of 6.0%, comprising of 13 families. On the other hand, families with 1 or 2 children have the lowest poverty rate of 0.0%, which includes 0 families.
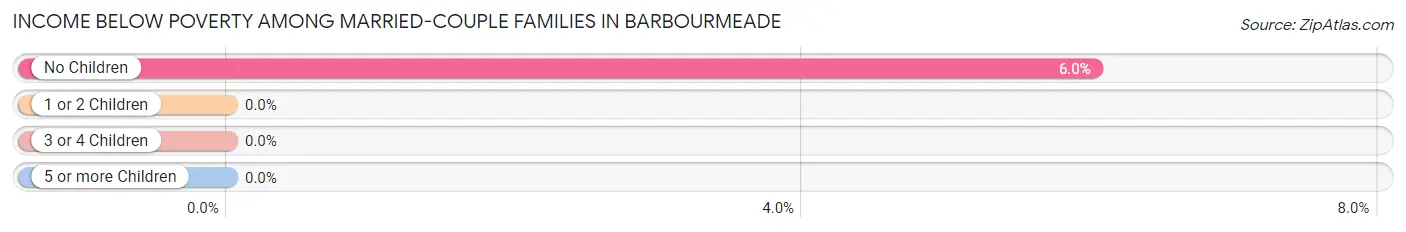
| Children | Above Poverty | Below Poverty |
| No Children | 203 (94.0%) | 13 (6.0%) |
| 1 or 2 Children | 112 (100.0%) | 0 (0.0%) |
| 3 or 4 Children | 7 (100.0%) | 0 (0.0%) |
| 5 or more Children | 0 (0.0%) | 0 (0.0%) |
| Total | 322 (96.1%) | 13 (3.9%) |
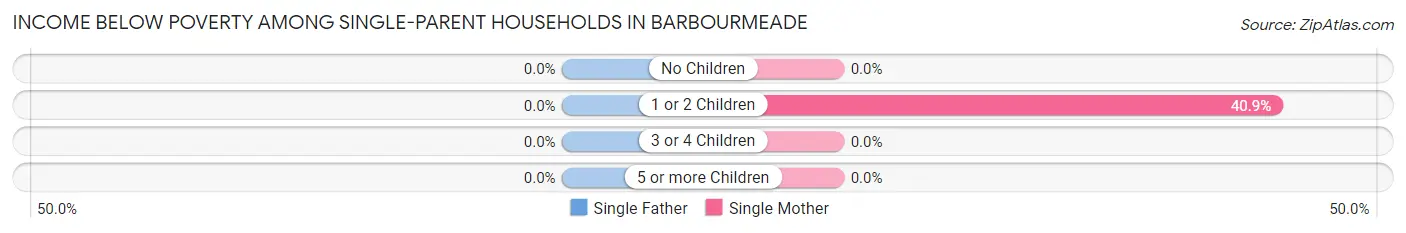
Income Below Poverty Among Single-Parent Households in Barbourmeade
| Children | Single Father | Single Mother |
| No Children | 0 (0.0%) | 0 (0.0%) |
| 1 or 2 Children | 0 (0.0%) | 9 (40.9%) |
| 3 or 4 Children | 0 (0.0%) | 0 (0.0%) |
| 5 or more Children | 0 (0.0%) | 0 (0.0%) |
| Total | 0 (0.0%) | 9 (28.1%) |
Income Below Poverty Among Married-Couple vs Single-Parent Households in Barbourmeade
The poverty data for Barbourmeade shows that 13 of the married-couple family households (3.9%) and 9 of the single-parent households (24.3%) are living below the poverty level. Within the married-couple family households, those with no children have the highest poverty rate, with 13 households (6.0%) falling below the poverty line. Among the single-parent households, those with 1 or 2 children have the highest poverty rate, with 9 household (40.9%) living below poverty.
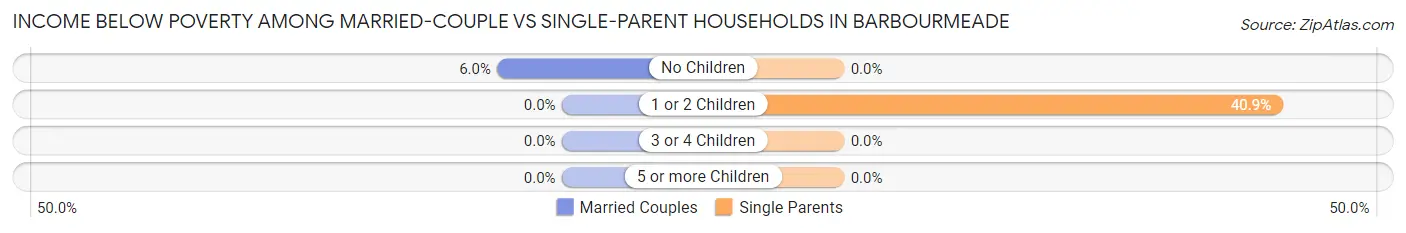
| Children | Married-Couple Families | Single-Parent Households |
| No Children | 13 (6.0%) | 0 (0.0%) |
| 1 or 2 Children | 0 (0.0%) | 9 (40.9%) |
| 3 or 4 Children | 0 (0.0%) | 0 (0.0%) |
| 5 or more Children | 0 (0.0%) | 0 (0.0%) |
| Total | 13 (3.9%) | 9 (24.3%) |
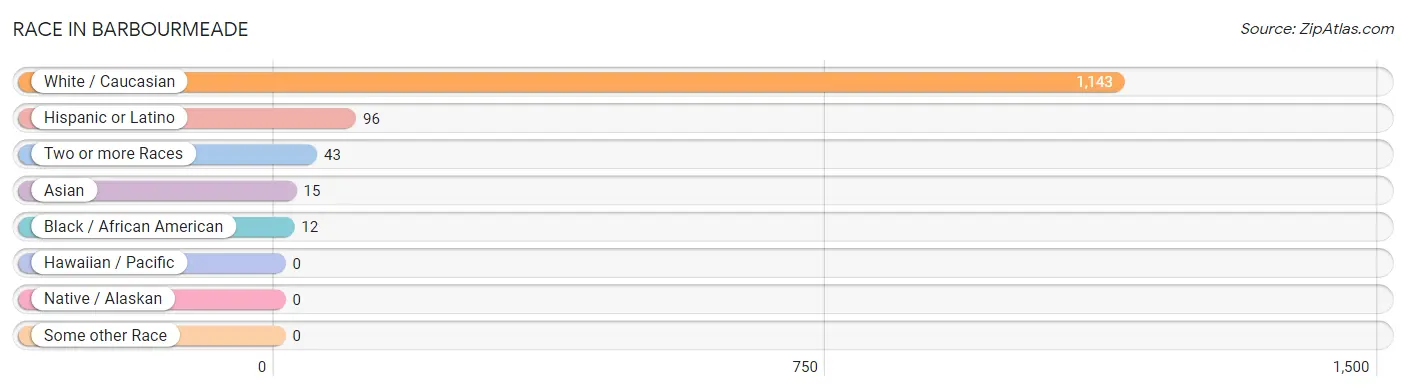
Race in Barbourmeade
The most populous races in Barbourmeade are White / Caucasian (1,143 | 94.2%), Hispanic or Latino (96 | 7.9%), and Two or more Races (43 | 3.5%).
| Race | # Population | % Population |
| Asian | 15 | 1.2% |
| Black / African American | 12 | 1.0% |
| Hawaiian / Pacific | 0 | 0.0% |
| Hispanic or Latino | 96 | 7.9% |
| Native / Alaskan | 0 | 0.0% |
| White / Caucasian | 1,143 | 94.2% |
| Two or more Races | 43 | 3.5% |
| Some other Race | 0 | 0.0% |
| Total | 1,213 | 100.0% |
Ancestry in Barbourmeade
The most populous ancestries reported in Barbourmeade are German (328 | 27.0%), English (242 | 20.0%), Irish (195 | 16.1%), American (80 | 6.6%), and Spaniard (61 | 5.0%), together accounting for 74.7% of all Barbourmeade residents.
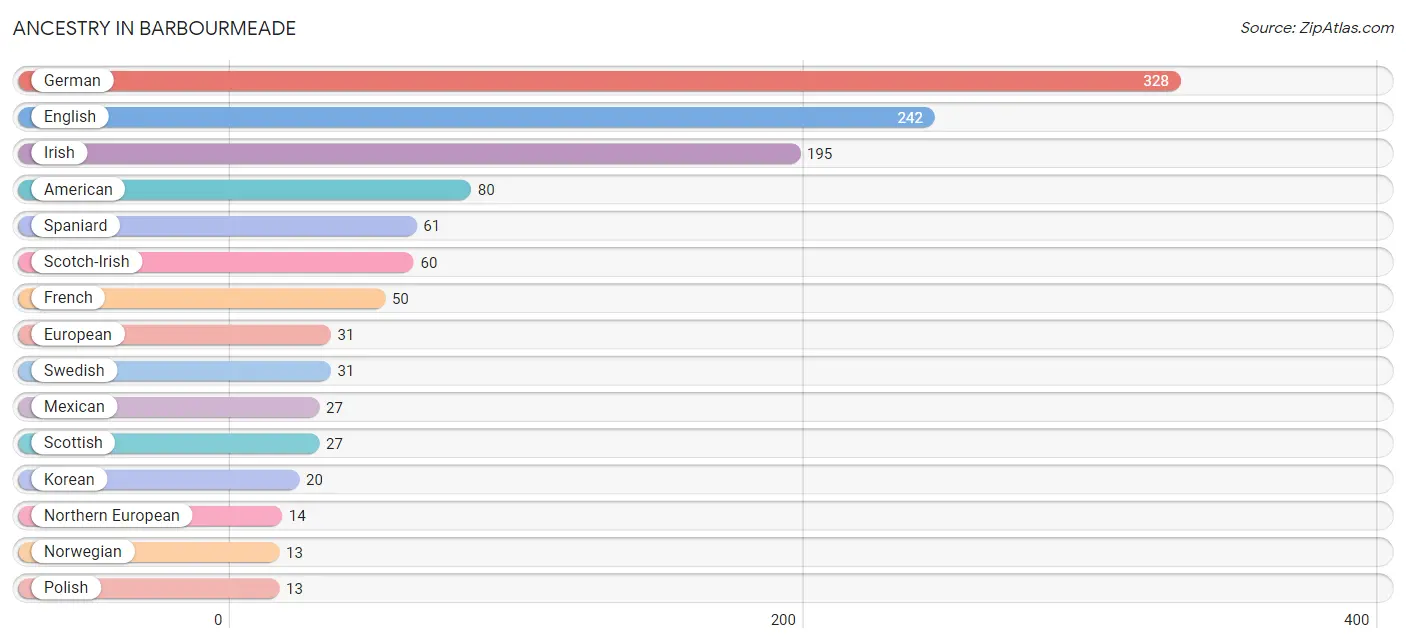
| Ancestry | # Population | % Population |
| American | 80 | 6.6% |
| Arab | 6 | 0.5% |
| Bhutanese | 1 | 0.1% |
| Canadian | 6 | 0.5% |
| Danish | 2 | 0.2% |
| Dutch | 5 | 0.4% |
| Eastern European | 12 | 1.0% |
| English | 242 | 20.0% |
| European | 31 | 2.6% |
| French | 50 | 4.1% |
| German | 328 | 27.0% |
| Indian (Asian) | 6 | 0.5% |
| Irish | 195 | 16.1% |
| Italian | 11 | 0.9% |
| Korean | 20 | 1.7% |
| Lebanese | 6 | 0.5% |
| Mexican | 27 | 2.2% |
| Northern European | 14 | 1.1% |
| Norwegian | 13 | 1.1% |
| Pakistani | 7 | 0.6% |
| Polish | 13 | 1.1% |
| Puerto Rican | 8 | 0.7% |
| Russian | 10 | 0.8% |
| Scandinavian | 7 | 0.6% |
| Scotch-Irish | 60 | 5.0% |
| Scottish | 27 | 2.2% |
| Spaniard | 61 | 5.0% |
| Swedish | 31 | 2.6% |
| Swiss | 2 | 0.2% |
| Welsh | 8 | 0.7% | View All 30 Rows |
Immigrants in Barbourmeade
The most numerous immigrant groups reported in Barbourmeade came from Asia (31 | 2.6%), South Eastern Asia (22 | 1.8%), Philippines (20 | 1.7%), Central America (12 | 1.0%), and Latin America (12 | 1.0%), together accounting for 8.0% of all Barbourmeade residents.
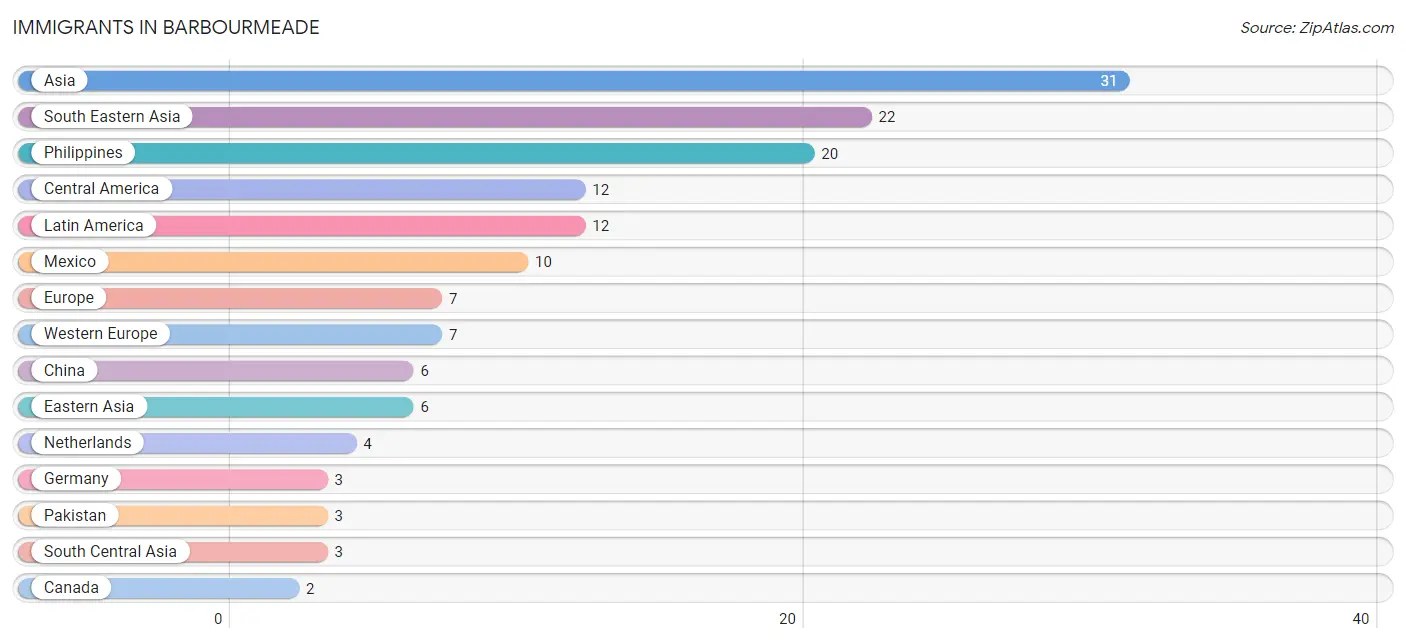
| Immigration Origin | # Population | % Population |
| Asia | 31 | 2.6% |
| Canada | 2 | 0.2% |
| Central America | 12 | 1.0% |
| China | 6 | 0.5% |
| Eastern Asia | 6 | 0.5% |
| Europe | 7 | 0.6% |
| Germany | 3 | 0.3% |
| Latin America | 12 | 1.0% |
| Mexico | 10 | 0.8% |
| Netherlands | 4 | 0.3% |
| Pakistan | 3 | 0.3% |
| Panama | 2 | 0.2% |
| Philippines | 20 | 1.7% |
| South Central Asia | 3 | 0.3% |
| South Eastern Asia | 22 | 1.8% |
| Thailand | 2 | 0.2% |
| Western Europe | 7 | 0.6% | View All 17 Rows |
Sex and Age in Barbourmeade
Sex and Age in Barbourmeade
The most populous age groups in Barbourmeade are Under 5 Years (52 | 8.9%) for men and 70 to 74 Years (92 | 14.6%) for women.
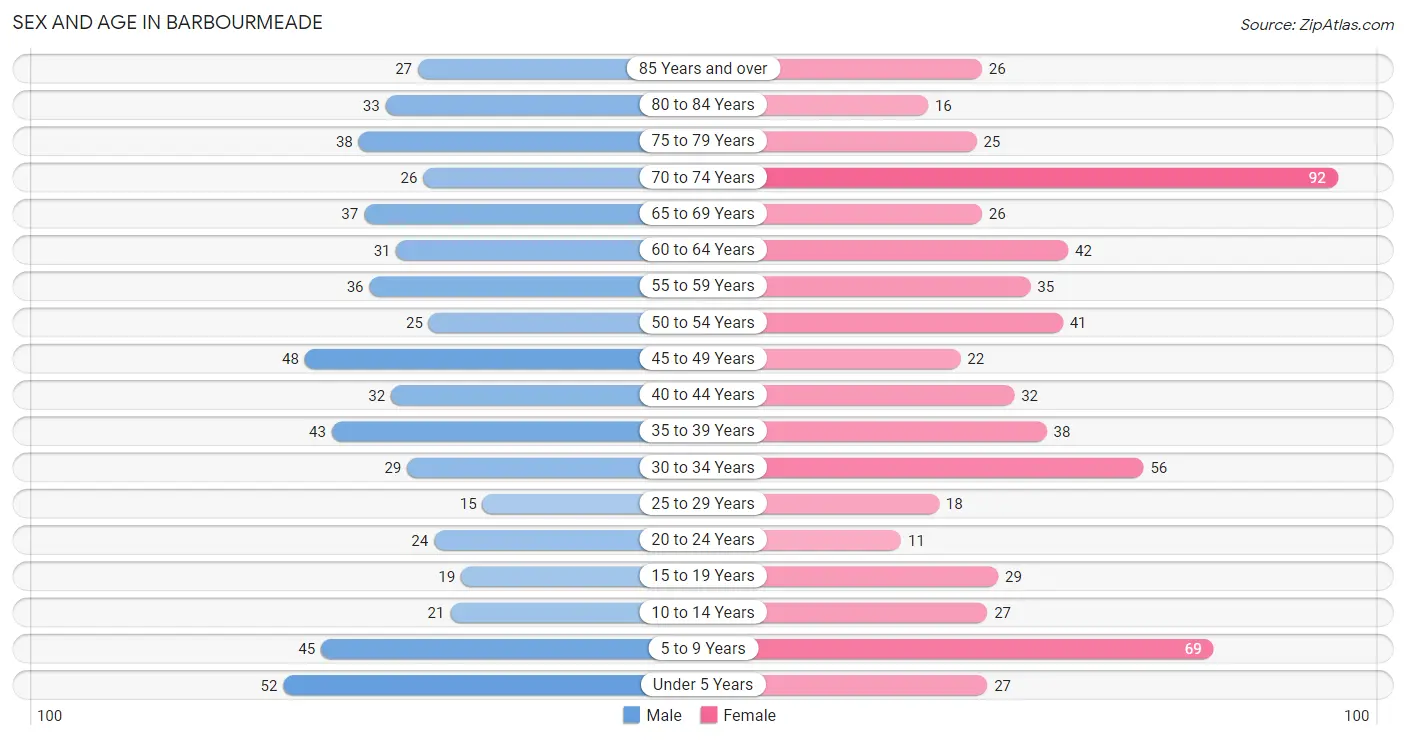
| Age Bracket | Male | Female |
| Under 5 Years | 52 (8.9%) | 27 (4.3%) |
| 5 to 9 Years | 45 (7.7%) | 69 (10.9%) |
| 10 to 14 Years | 21 (3.6%) | 27 (4.3%) |
| 15 to 19 Years | 19 (3.3%) | 29 (4.6%) |
| 20 to 24 Years | 24 (4.1%) | 11 (1.7%) |
| 25 to 29 Years | 15 (2.6%) | 18 (2.9%) |
| 30 to 34 Years | 29 (5.0%) | 56 (8.9%) |
| 35 to 39 Years | 43 (7.4%) | 38 (6.0%) |
| 40 to 44 Years | 32 (5.5%) | 32 (5.1%) |
| 45 to 49 Years | 48 (8.3%) | 22 (3.5%) |
| 50 to 54 Years | 25 (4.3%) | 41 (6.5%) |
| 55 to 59 Years | 36 (6.2%) | 35 (5.5%) |
| 60 to 64 Years | 31 (5.3%) | 42 (6.7%) |
| 65 to 69 Years | 37 (6.4%) | 26 (4.1%) |
| 70 to 74 Years | 26 (4.5%) | 92 (14.6%) |
| 75 to 79 Years | 38 (6.5%) | 25 (4.0%) |
| 80 to 84 Years | 33 (5.7%) | 16 (2.5%) |
| 85 Years and over | 27 (4.6%) | 26 (4.1%) |
| Total | 581 (100.0%) | 632 (100.0%) |
Families and Households in Barbourmeade
Median Family Size in Barbourmeade
The median family size in Barbourmeade is 2.94 persons per family, with single female/mother families (32 | 8.6%) accounting for the largest median family size of 4.06 persons per family. On the other hand, single male/father families (5 | 1.3%) represent the smallest median family size with 2.20 persons per family.
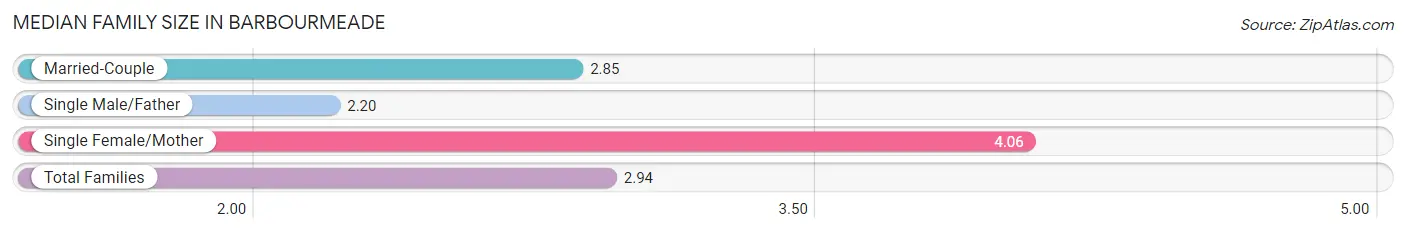
| Family Type | # Families | Family Size |
| Married-Couple | 335 (90.0%) | 2.85 |
| Single Male/Father | 5 (1.3%) | 2.20 |
| Single Female/Mother | 32 (8.6%) | 4.06 |
| Total Families | 372 (100.0%) | 2.94 |
Median Household Size in Barbourmeade
The median household size in Barbourmeade is 2.58 persons per household, with single female/mother households (32 | 6.8%) accounting for the largest median household size of 4.06 persons per household. non-family households (99 | 21.0%) represent the smallest median household size with 1.19 persons per household.
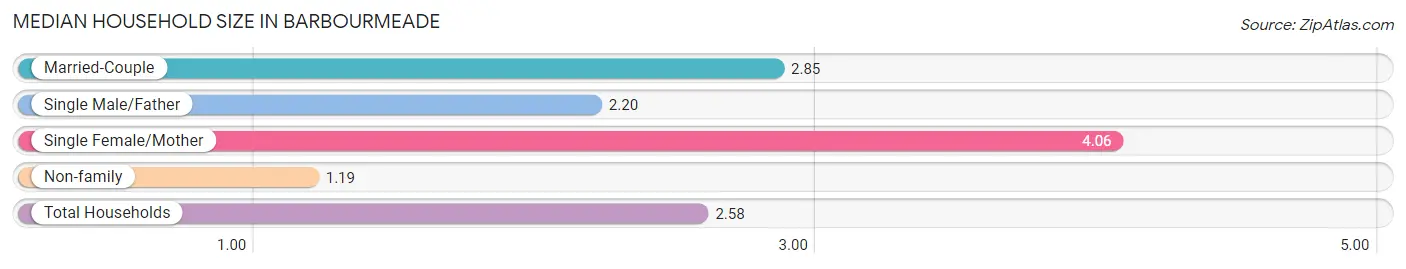
| Household Type | # Households | Household Size |
| Married-Couple | 335 (71.1%) | 2.85 |
| Single Male/Father | 5 (1.1%) | 2.20 |
| Single Female/Mother | 32 (6.8%) | 4.06 |
| Non-family | 99 (21.0%) | 1.19 |
| Total Households | 471 (100.0%) | 2.58 |
Household Size by Marriage Status in Barbourmeade
Out of a total of 471 households in Barbourmeade, 372 (79.0%) are family households, while 99 (21.0%) are nonfamily households. The most numerous type of family households are 2-person households, comprising 188, and the most common type of nonfamily households are 1-person households, comprising 80.
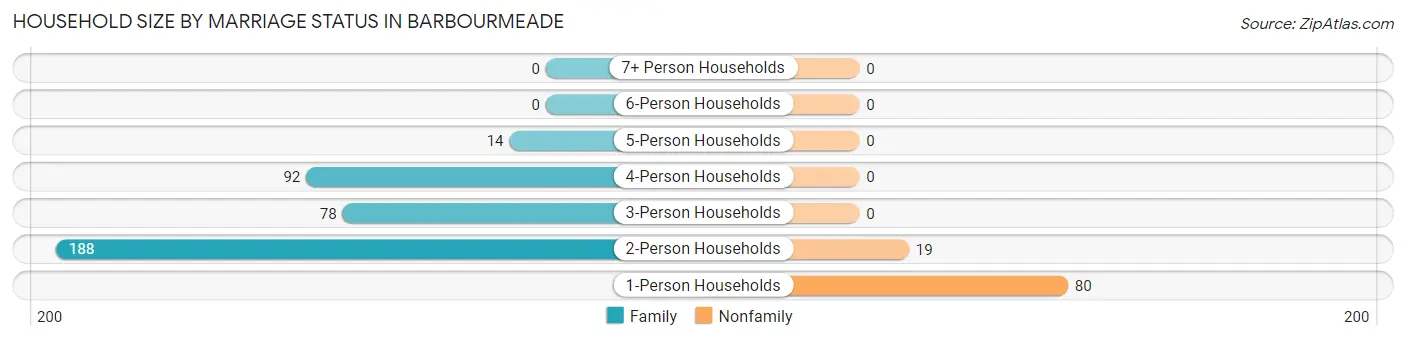
| Household Size | Family Households | Nonfamily Households |
| 1-Person Households | - | 80 (17.0%) |
| 2-Person Households | 188 (39.9%) | 19 (4.0%) |
| 3-Person Households | 78 (16.6%) | 0 (0.0%) |
| 4-Person Households | 92 (19.5%) | 0 (0.0%) |
| 5-Person Households | 14 (3.0%) | 0 (0.0%) |
| 6-Person Households | 0 (0.0%) | 0 (0.0%) |
| 7+ Person Households | 0 (0.0%) | 0 (0.0%) |
| Total | 372 (79.0%) | 99 (21.0%) |
Female Fertility in Barbourmeade
Fertility by Age in Barbourmeade
Average fertility rate in Barbourmeade is 101.0 births per 1,000 women. Women in the age bracket of 20 to 34 years have the highest fertility rate with 259.0 births per 1,000 women. Women in the age bracket of 20 to 34 years acount for 100.0% of all women with births.
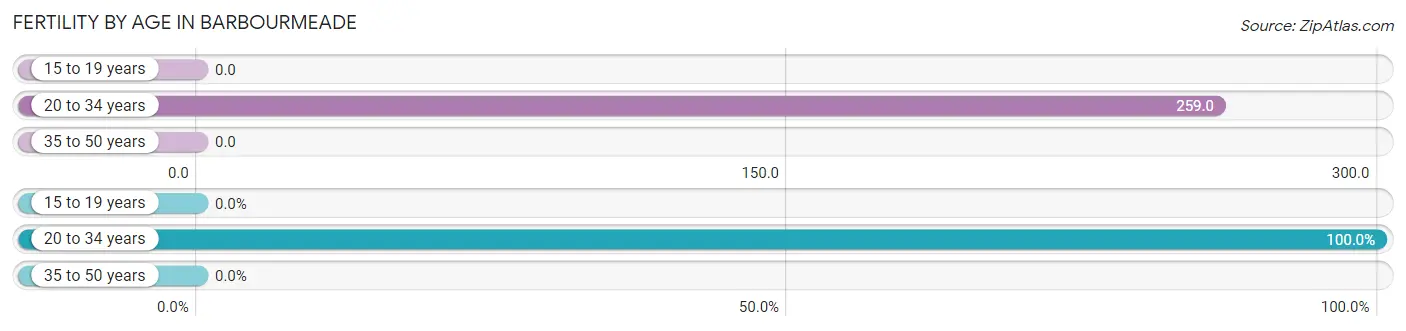
| Age Bracket | Women with Births | Births / 1,000 Women |
| 15 to 19 years | 0 (0.0%) | 0.0 |
| 20 to 34 years | 22 (100.0%) | 259.0 |
| 35 to 50 years | 0 (0.0%) | 0.0 |
| Total | 22 (100.0%) | 101.0 |
Fertility by Age by Marriage Status in Barbourmeade
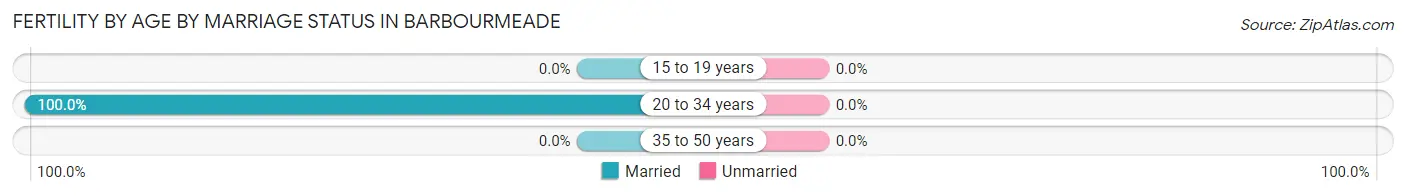
| Age Bracket | Married | Unmarried |
| 15 to 19 years | 0 (0.0%) | 0 (0.0%) |
| 20 to 34 years | 22 (100.0%) | 0 (0.0%) |
| 35 to 50 years | 0 (0.0%) | 0 (0.0%) |
| Total | 22 (100.0%) | 0 (0.0%) |
Fertility by Education in Barbourmeade
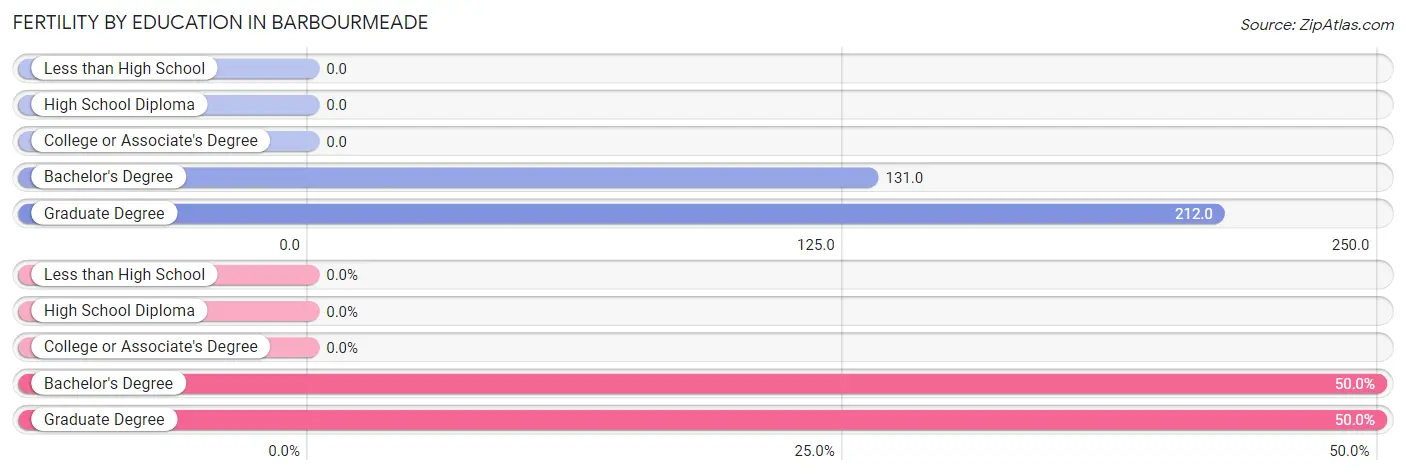
| Educational Attainment | Women with Births | Births / 1,000 Women |
| Less than High School | 0 (0.0%) | 0.0 |
| High School Diploma | 0 (0.0%) | 0.0 |
| College or Associate's Degree | 0 (0.0%) | 0.0 |
| Bachelor's Degree | 11 (50.0%) | 131.0 |
| Graduate Degree | 11 (50.0%) | 212.0 |
| Total | 22 (100.0%) | 101.0 |
Fertility by Education by Marriage Status in Barbourmeade
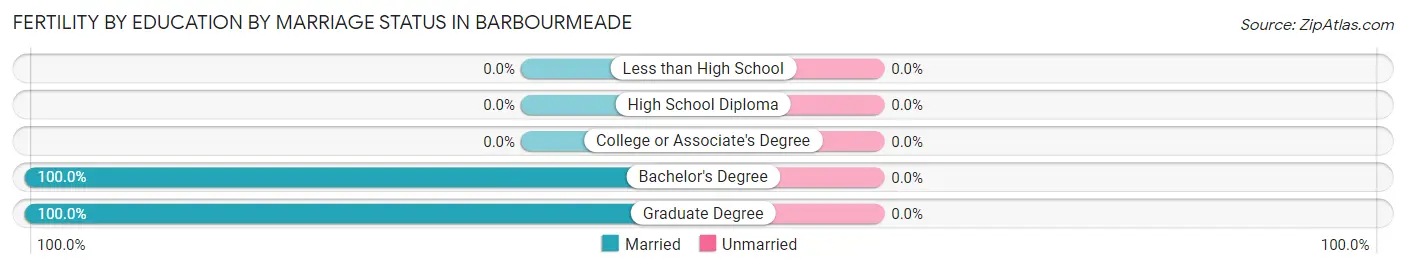
| Educational Attainment | Married | Unmarried |
| Less than High School | 0 (0.0%) | 0 (0.0%) |
| High School Diploma | 0 (0.0%) | 0 (0.0%) |
| College or Associate's Degree | 0 (0.0%) | 0 (0.0%) |
| Bachelor's Degree | 11 (100.0%) | 0 (0.0%) |
| Graduate Degree | 11 (100.0%) | 0 (0.0%) |
| Total | 22 (100.0%) | 0 (0.0%) |
Employment Characteristics in Barbourmeade
Employment by Class of Employer in Barbourmeade
Among the 523 employed individuals in Barbourmeade, private company employees (323 | 61.8%), not-for-profit organizations (58 | 11.1%), and local government employees (38 | 7.3%) make up the most common classes of employment.
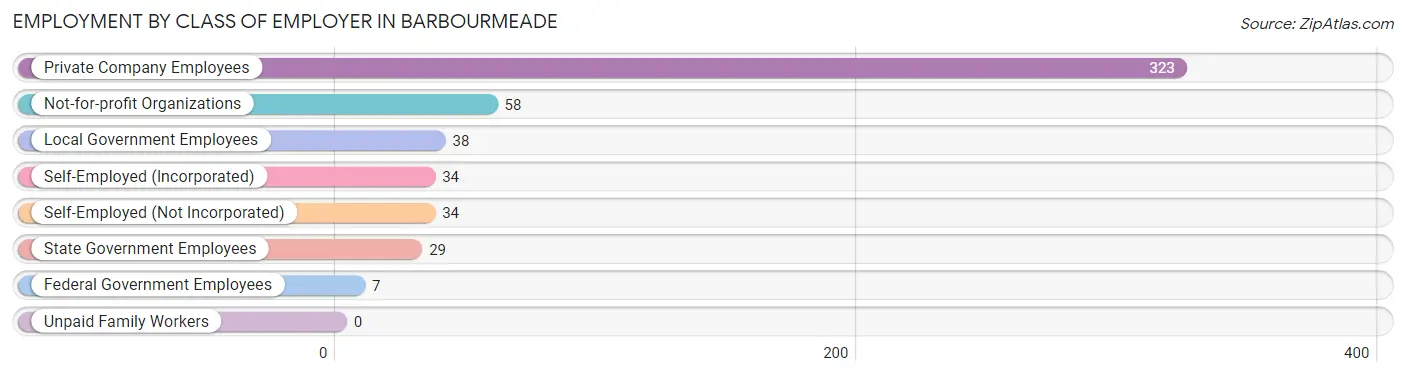
| Employer Class | # Employees | % Employees |
| Private Company Employees | 323 | 61.8% |
| Self-Employed (Incorporated) | 34 | 6.5% |
| Self-Employed (Not Incorporated) | 34 | 6.5% |
| Not-for-profit Organizations | 58 | 11.1% |
| Local Government Employees | 38 | 7.3% |
| State Government Employees | 29 | 5.5% |
| Federal Government Employees | 7 | 1.3% |
| Unpaid Family Workers | 0 | 0.0% |
| Total | 523 | 100.0% |
Employment Status by Age in Barbourmeade
According to the labor force statistics for Barbourmeade, out of the total population over 16 years of age (965), 59.1% or 570 individuals are in the labor force, with 6.5% or 37 of them unemployed. The age group with the highest labor force participation rate is 25 to 29 years, with 100.0% or 33 individuals in the labor force. Within the labor force, the 75 years and over age range has the highest percentage of unemployed individuals, with 42.3% or 11 of them being unemployed.
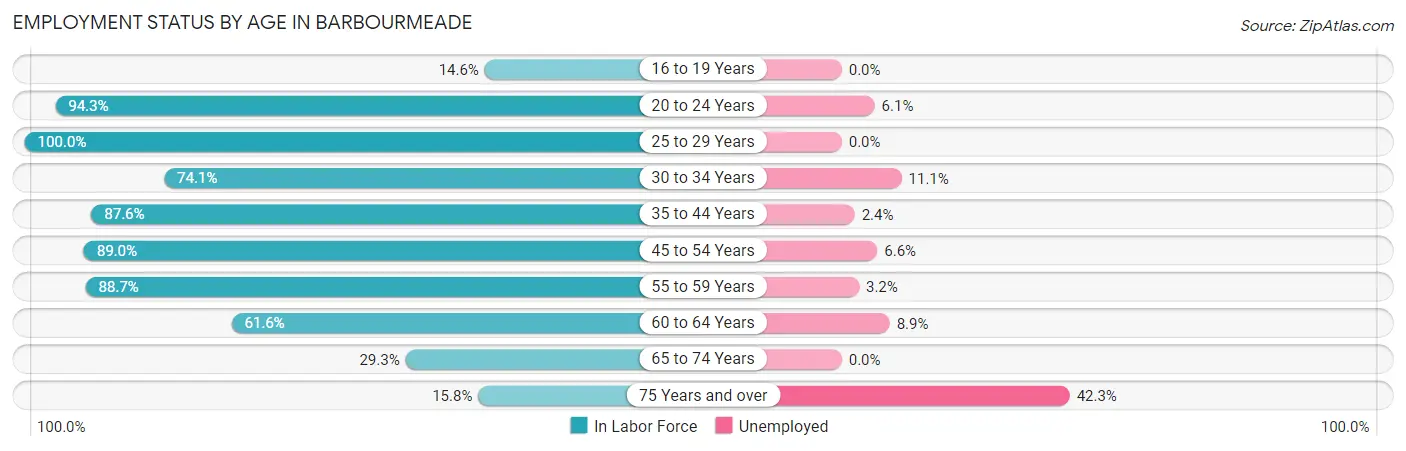
| Age Bracket | In Labor Force | Unemployed |
| 16 to 19 Years | 6 (14.6%) | 0 (0.0%) |
| 20 to 24 Years | 33 (94.3%) | 2 (6.1%) |
| 25 to 29 Years | 33 (100.0%) | 0 (0.0%) |
| 30 to 34 Years | 63 (74.1%) | 7 (11.1%) |
| 35 to 44 Years | 127 (87.6%) | 3 (2.4%) |
| 45 to 54 Years | 121 (89.0%) | 8 (6.6%) |
| 55 to 59 Years | 63 (88.7%) | 2 (3.2%) |
| 60 to 64 Years | 45 (61.6%) | 4 (8.9%) |
| 65 to 74 Years | 53 (29.3%) | 0 (0.0%) |
| 75 Years and over | 26 (15.8%) | 11 (42.3%) |
| Total | 570 (59.1%) | 37 (6.5%) |
Employment Status by Educational Attainment in Barbourmeade
According to labor force statistics for Barbourmeade, 83.2% of individuals (452) out of the total population between 25 and 64 years of age (543) are in the labor force, with 5.3% or 24 of them being unemployed. The group with the highest labor force participation rate are those with the educational attainment of less than high school, with 100.0% or 10 individuals in the labor force. Within the labor force, individuals with bachelor's degree or higher education have the highest percentage of unemployment, with 8.0% or 24 of them being unemployed.
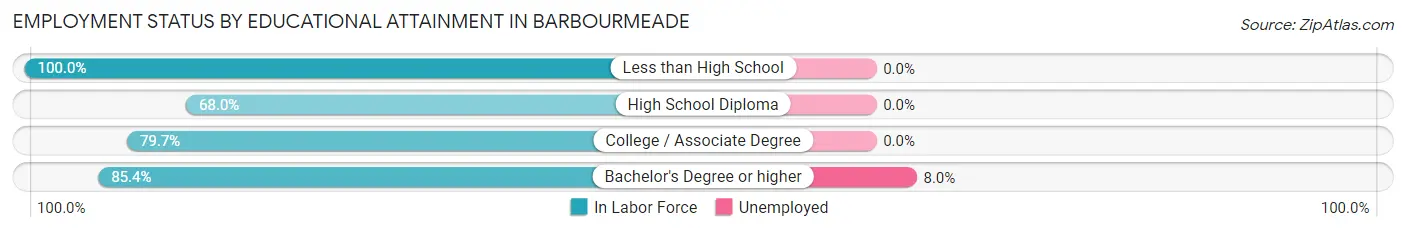
| Educational Attainment | In Labor Force | Unemployed |
| Less than High School | 10 (100.0%) | 0 (0.0%) |
| High School Diploma | 17 (68.0%) | 0 (0.0%) |
| College / Associate Degree | 126 (79.7%) | 0 (0.0%) |
| Bachelor's Degree or higher | 299 (85.4%) | 28 (8.0%) |
| Total | 452 (83.2%) | 29 (5.3%) |
Employment Occupations by Sex in Barbourmeade
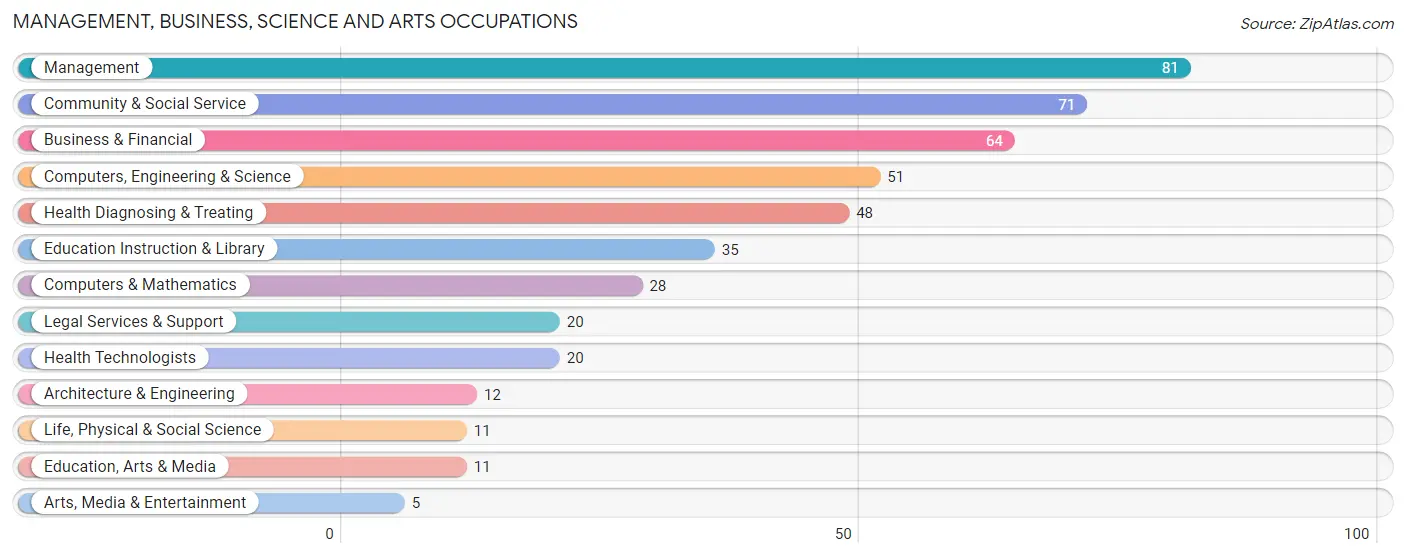
Management, Business, Science and Arts Occupations
The most common Management, Business, Science and Arts occupations in Barbourmeade are Management (81 | 15.2%), Community & Social Service (71 | 13.3%), Business & Financial (64 | 12.0%), Computers, Engineering & Science (51 | 9.6%), and Health Diagnosing & Treating (48 | 9.0%).
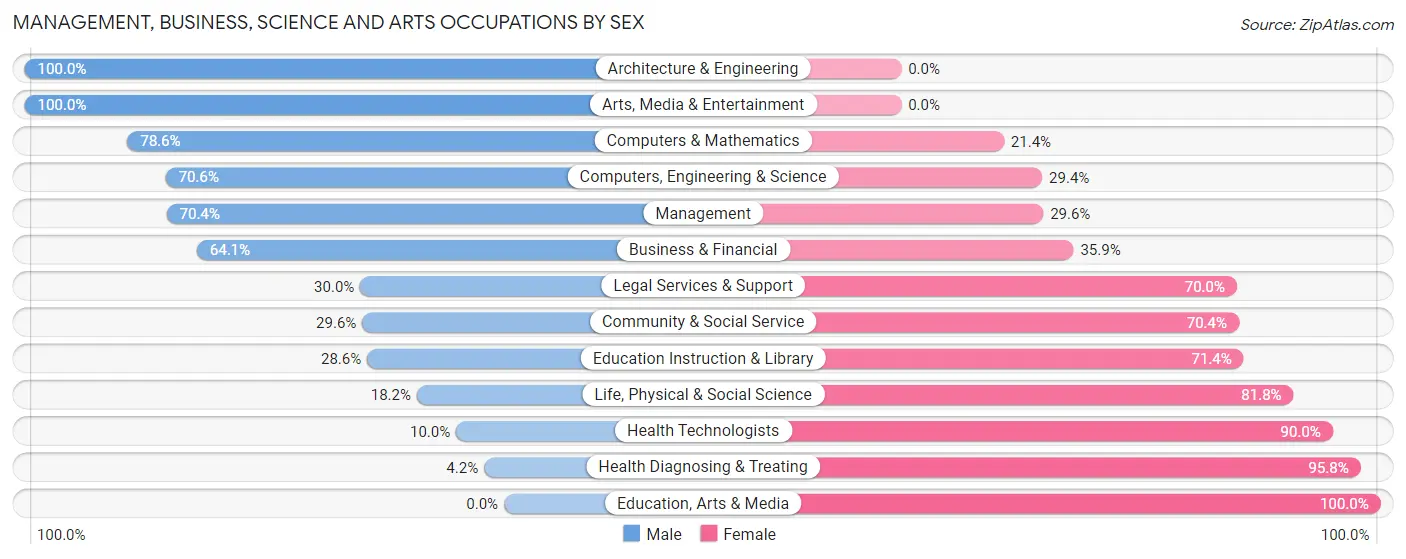
Management, Business, Science and Arts Occupations by Sex
Within the Management, Business, Science and Arts occupations in Barbourmeade, the most male-oriented occupations are Architecture & Engineering (100.0%), Arts, Media & Entertainment (100.0%), and Computers & Mathematics (78.6%), while the most female-oriented occupations are Education, Arts & Media (100.0%), Health Diagnosing & Treating (95.8%), and Health Technologists (90.0%).
| Occupation | Male | Female |
| Management | 57 (70.4%) | 24 (29.6%) |
| Business & Financial | 41 (64.1%) | 23 (35.9%) |
| Computers, Engineering & Science | 36 (70.6%) | 15 (29.4%) |
| Computers & Mathematics | 22 (78.6%) | 6 (21.4%) |
| Architecture & Engineering | 12 (100.0%) | 0 (0.0%) |
| Life, Physical & Social Science | 2 (18.2%) | 9 (81.8%) |
| Community & Social Service | 21 (29.6%) | 50 (70.4%) |
| Education, Arts & Media | 0 (0.0%) | 11 (100.0%) |
| Legal Services & Support | 6 (30.0%) | 14 (70.0%) |
| Education Instruction & Library | 10 (28.6%) | 25 (71.4%) |
| Arts, Media & Entertainment | 5 (100.0%) | 0 (0.0%) |
| Health Diagnosing & Treating | 2 (4.2%) | 46 (95.8%) |
| Health Technologists | 2 (10.0%) | 18 (90.0%) |
| Total (Category) | 157 (49.8%) | 158 (50.2%) |
| Total (Overall) | 275 (51.6%) | 258 (48.4%) |
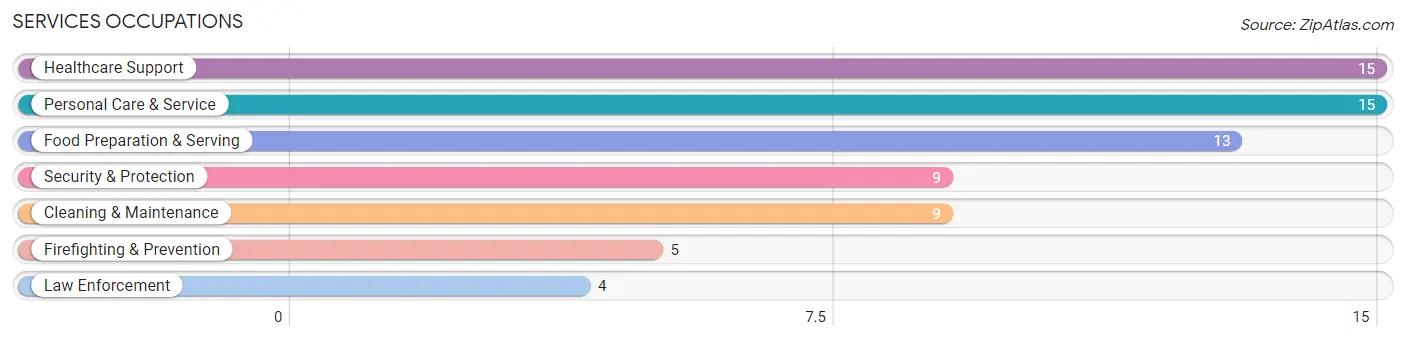
Services Occupations
The most common Services occupations in Barbourmeade are Healthcare Support (15 | 2.8%), Personal Care & Service (15 | 2.8%), Food Preparation & Serving (13 | 2.4%), Security & Protection (9 | 1.7%), and Cleaning & Maintenance (9 | 1.7%).
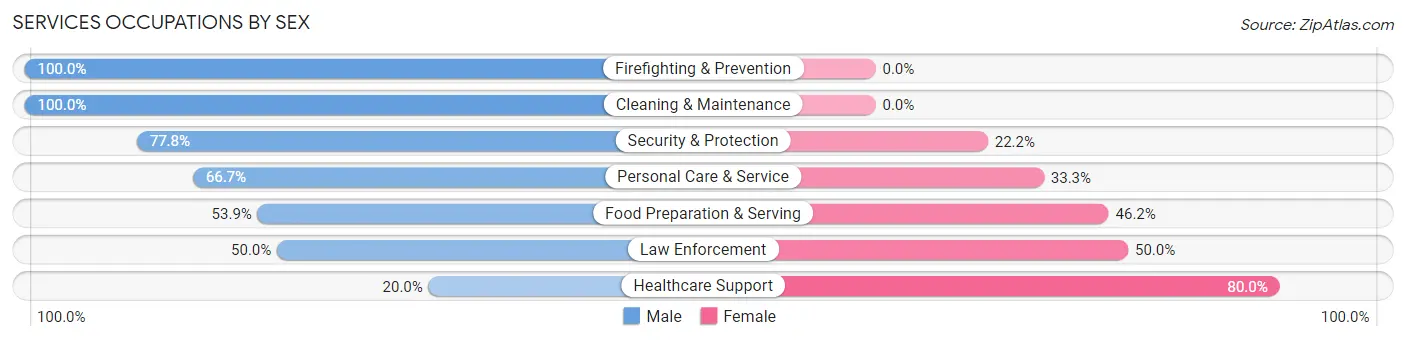
Services Occupations by Sex
Within the Services occupations in Barbourmeade, the most male-oriented occupations are Firefighting & Prevention (100.0%), Cleaning & Maintenance (100.0%), and Security & Protection (77.8%), while the most female-oriented occupations are Healthcare Support (80.0%), Law Enforcement (50.0%), and Food Preparation & Serving (46.2%).
| Occupation | Male | Female |
| Healthcare Support | 3 (20.0%) | 12 (80.0%) |
| Security & Protection | 7 (77.8%) | 2 (22.2%) |
| Firefighting & Prevention | 5 (100.0%) | 0 (0.0%) |
| Law Enforcement | 2 (50.0%) | 2 (50.0%) |
| Food Preparation & Serving | 7 (53.8%) | 6 (46.2%) |
| Cleaning & Maintenance | 9 (100.0%) | 0 (0.0%) |
| Personal Care & Service | 10 (66.7%) | 5 (33.3%) |
| Total (Category) | 36 (59.0%) | 25 (41.0%) |
| Total (Overall) | 275 (51.6%) | 258 (48.4%) |
Sales and Office Occupations
The most common Sales and Office occupations in Barbourmeade are Sales & Related (87 | 16.3%), and Office & Administration (36 | 6.8%).

Sales and Office Occupations by Sex
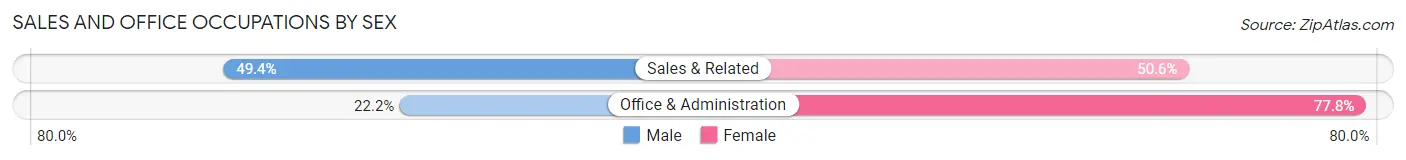
| Occupation | Male | Female |
| Sales & Related | 43 (49.4%) | 44 (50.6%) |
| Office & Administration | 8 (22.2%) | 28 (77.8%) |
| Total (Category) | 51 (41.5%) | 72 (58.5%) |
| Total (Overall) | 275 (51.6%) | 258 (48.4%) |
Natural Resources, Construction and Maintenance Occupations
The most common Natural Resources, Construction and Maintenance occupations in Barbourmeade are , and Installation, Maintenance & Repair (3 | 0.6%).
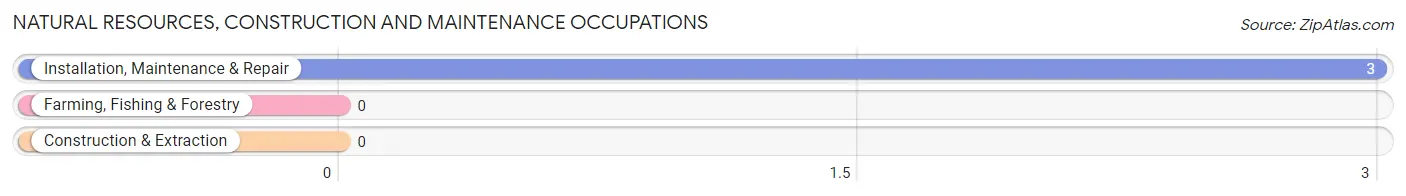
Natural Resources, Construction and Maintenance Occupations by Sex
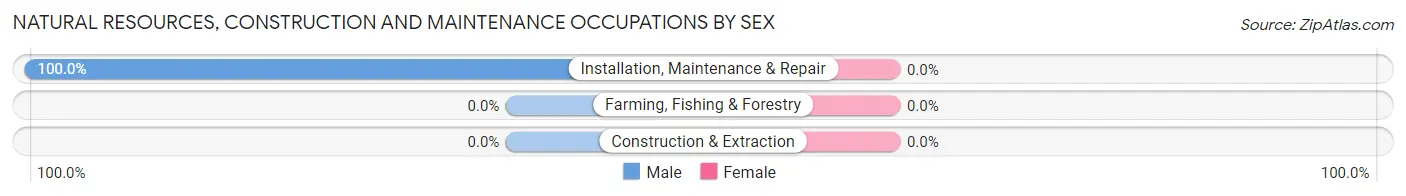
| Occupation | Male | Female |
| Farming, Fishing & Forestry | 0 (0.0%) | 0 (0.0%) |
| Construction & Extraction | 0 (0.0%) | 0 (0.0%) |
| Installation, Maintenance & Repair | 3 (100.0%) | 0 (0.0%) |
| Total (Category) | 3 (100.0%) | 0 (0.0%) |
| Total (Overall) | 275 (51.6%) | 258 (48.4%) |
Production, Transportation and Moving Occupations
The most common Production, Transportation and Moving occupations in Barbourmeade are Material Moving (26 | 4.9%), and Transportation (5 | 0.9%).
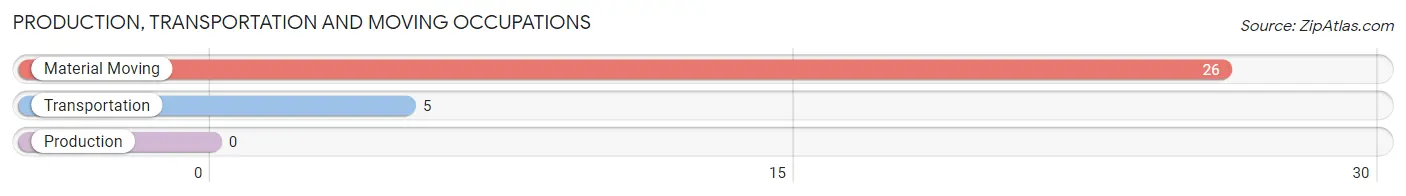
Production, Transportation and Moving Occupations by Sex
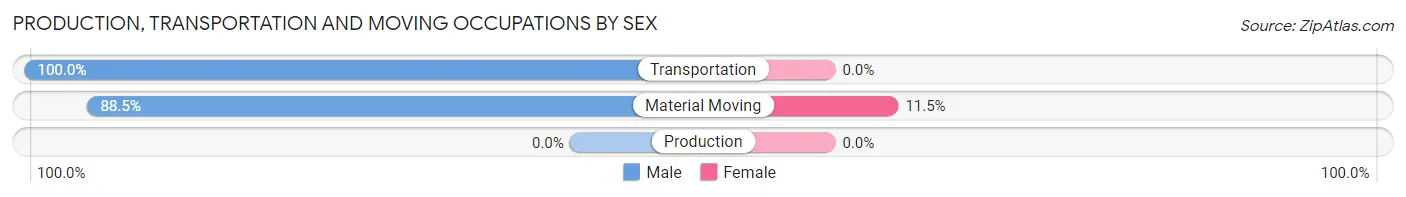
| Occupation | Male | Female |
| Production | 0 (0.0%) | 0 (0.0%) |
| Transportation | 5 (100.0%) | 0 (0.0%) |
| Material Moving | 23 (88.5%) | 3 (11.5%) |
| Total (Category) | 28 (90.3%) | 3 (9.7%) |
| Total (Overall) | 275 (51.6%) | 258 (48.4%) |
Employment Industries by Sex in Barbourmeade
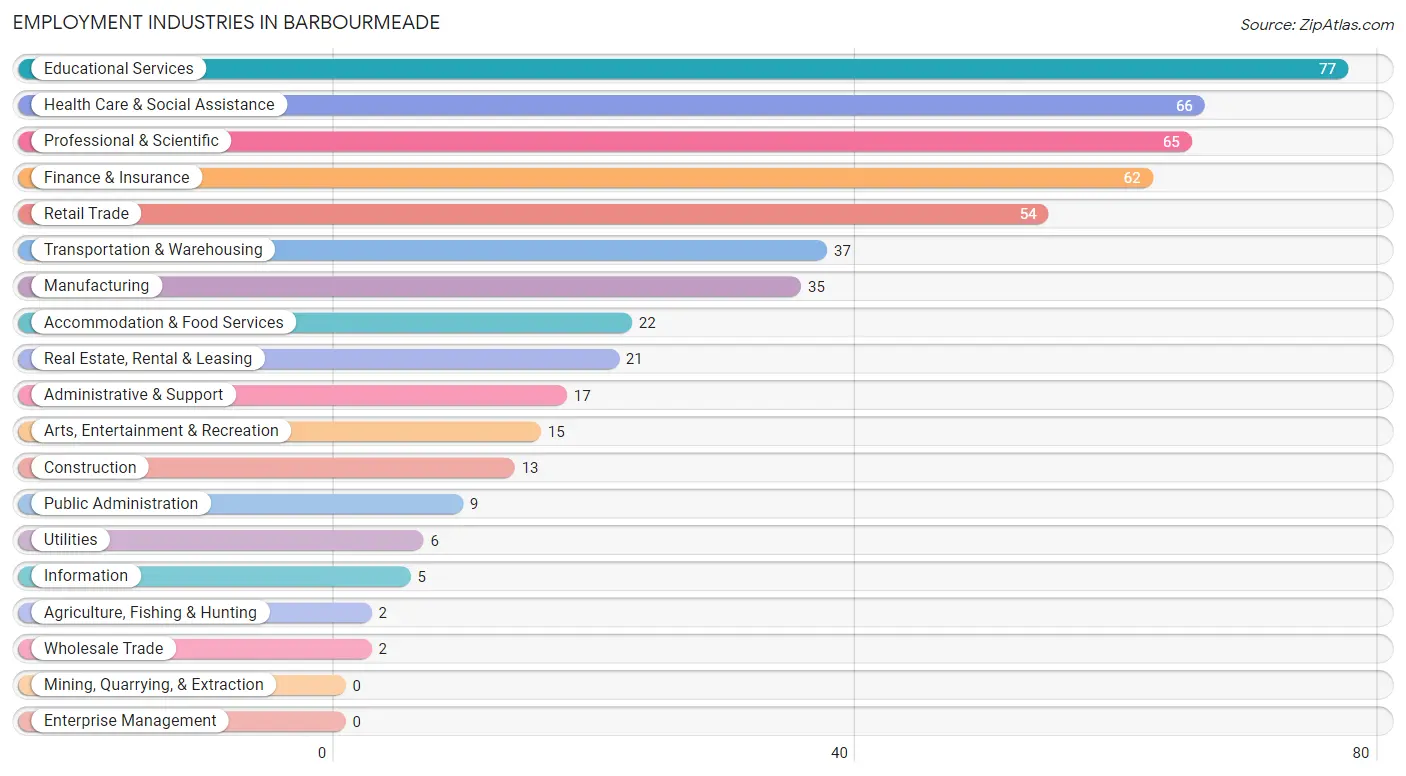
Employment Industries in Barbourmeade
The major employment industries in Barbourmeade include Educational Services (77 | 14.4%), Health Care & Social Assistance (66 | 12.4%), Professional & Scientific (65 | 12.2%), Finance & Insurance (62 | 11.6%), and Retail Trade (54 | 10.1%).
Employment Industries by Sex in Barbourmeade
The Barbourmeade industries that see more men than women are Agriculture, Fishing & Hunting (100.0%), Wholesale Trade (100.0%), and Transportation & Warehousing (100.0%), whereas the industries that tend to have a higher number of women are Health Care & Social Assistance (87.9%), Retail Trade (74.1%), and Educational Services (61.0%).
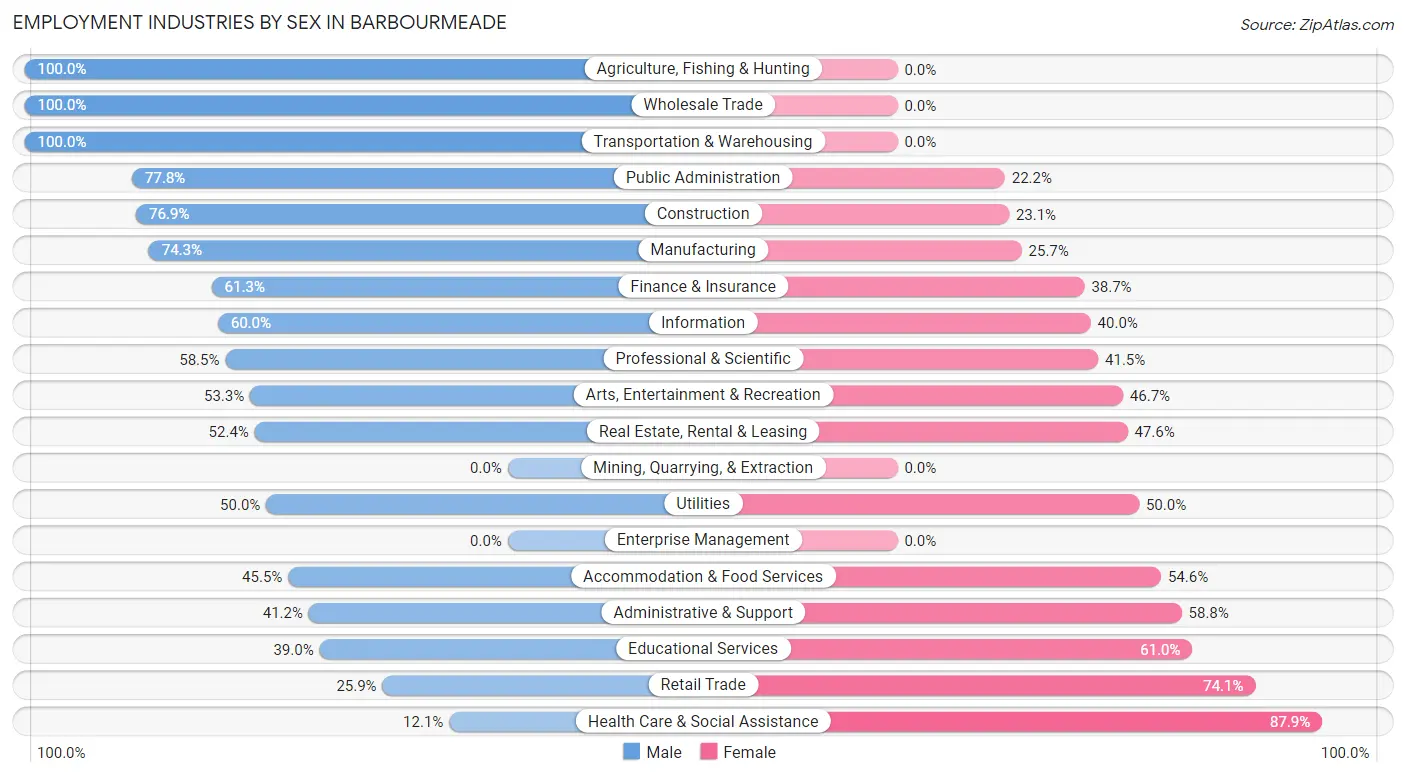
| Industry | Male | Female |
| Agriculture, Fishing & Hunting | 2 (100.0%) | 0 (0.0%) |
| Mining, Quarrying, & Extraction | 0 (0.0%) | 0 (0.0%) |
| Construction | 10 (76.9%) | 3 (23.1%) |
| Manufacturing | 26 (74.3%) | 9 (25.7%) |
| Wholesale Trade | 2 (100.0%) | 0 (0.0%) |
| Retail Trade | 14 (25.9%) | 40 (74.1%) |
| Transportation & Warehousing | 37 (100.0%) | 0 (0.0%) |
| Utilities | 3 (50.0%) | 3 (50.0%) |
| Information | 3 (60.0%) | 2 (40.0%) |
| Finance & Insurance | 38 (61.3%) | 24 (38.7%) |
| Real Estate, Rental & Leasing | 11 (52.4%) | 10 (47.6%) |
| Professional & Scientific | 38 (58.5%) | 27 (41.5%) |
| Enterprise Management | 0 (0.0%) | 0 (0.0%) |
| Administrative & Support | 7 (41.2%) | 10 (58.8%) |
| Educational Services | 30 (39.0%) | 47 (61.0%) |
| Health Care & Social Assistance | 8 (12.1%) | 58 (87.9%) |
| Arts, Entertainment & Recreation | 8 (53.3%) | 7 (46.7%) |
| Accommodation & Food Services | 10 (45.5%) | 12 (54.5%) |
| Public Administration | 7 (77.8%) | 2 (22.2%) |
| Total | 275 (51.6%) | 258 (48.4%) |
Education in Barbourmeade
School Enrollment in Barbourmeade
The most common levels of schooling among the 262 students in Barbourmeade are elementary school (102 | 38.9%), college / undergraduate (46 | 17.6%), and middle school (39 | 14.9%).
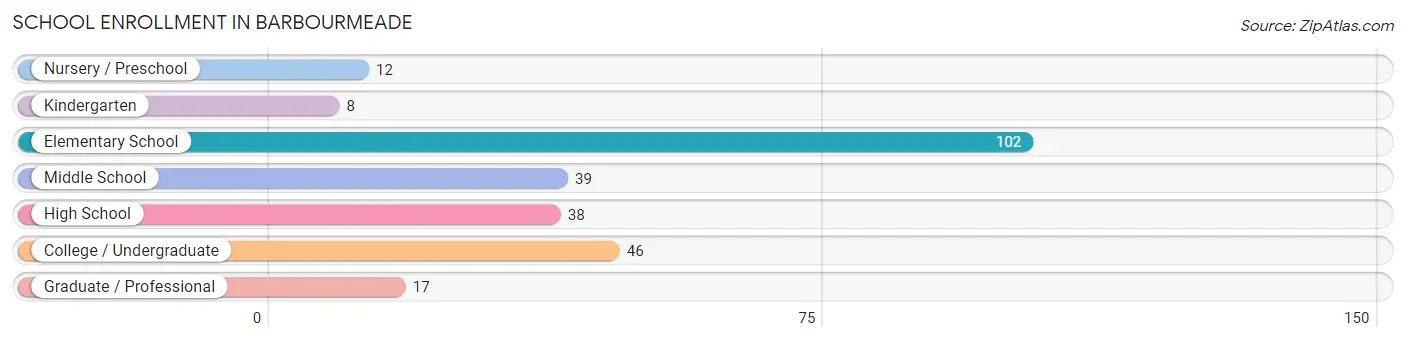
| School Level | # Students | % Students |
| Nursery / Preschool | 12 | 4.6% |
| Kindergarten | 8 | 3.0% |
| Elementary School | 102 | 38.9% |
| Middle School | 39 | 14.9% |
| High School | 38 | 14.5% |
| College / Undergraduate | 46 | 17.6% |
| Graduate / Professional | 17 | 6.5% |
| Total | 262 | 100.0% |
School Enrollment by Age by Funding Source in Barbourmeade
Out of a total of 262 students who are enrolled in schools in Barbourmeade, 72 (27.5%) attend a private institution, while the remaining 190 (72.5%) are enrolled in public schools. The age group of 3 to 4 year olds has the highest likelihood of being enrolled in private schools, with 7 (100.0% in the age bracket) enrolled. Conversely, the age group of 18 to 19 year olds has the lowest likelihood of being enrolled in a private school, with 2 (100.0% in the age bracket) attending a public institution.
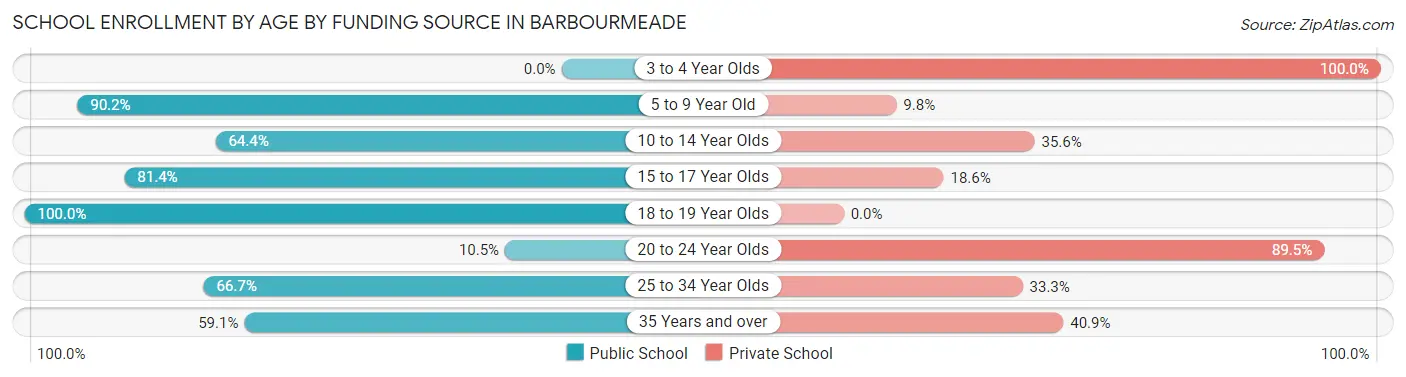
| Age Bracket | Public School | Private School |
| 3 to 4 Year Olds | 0 (0.0%) | 7 (100.0%) |
| 5 to 9 Year Old | 101 (90.2%) | 11 (9.8%) |
| 10 to 14 Year Olds | 29 (64.4%) | 16 (35.6%) |
| 15 to 17 Year Olds | 35 (81.4%) | 8 (18.6%) |
| 18 to 19 Year Olds | 2 (100.0%) | 0 (0.0%) |
| 20 to 24 Year Olds | 2 (10.5%) | 17 (89.5%) |
| 25 to 34 Year Olds | 8 (66.7%) | 4 (33.3%) |
| 35 Years and over | 13 (59.1%) | 9 (40.9%) |
| Total | 190 (72.5%) | 72 (27.5%) |
Educational Attainment by Field of Study in Barbourmeade
Business (141 | 23.2%), education (74 | 12.1%), social sciences (61 | 10.0%), science & technology (58 | 9.5%), and psychology (41 | 6.7%) are the most common fields of study among 609 individuals in Barbourmeade who have obtained a bachelor's degree or higher.
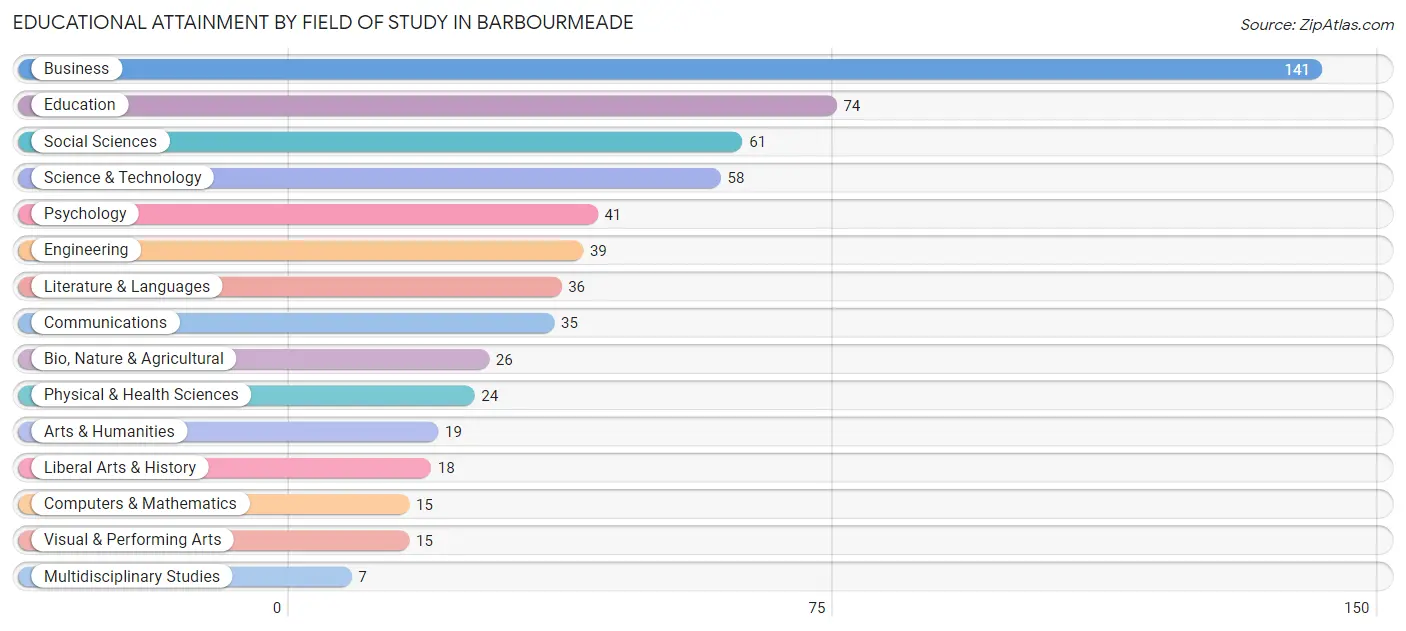
| Field of Study | # Graduates | % Graduates |
| Computers & Mathematics | 15 | 2.5% |
| Bio, Nature & Agricultural | 26 | 4.3% |
| Physical & Health Sciences | 24 | 3.9% |
| Psychology | 41 | 6.7% |
| Social Sciences | 61 | 10.0% |
| Engineering | 39 | 6.4% |
| Multidisciplinary Studies | 7 | 1.1% |
| Science & Technology | 58 | 9.5% |
| Business | 141 | 23.2% |
| Education | 74 | 12.1% |
| Literature & Languages | 36 | 5.9% |
| Liberal Arts & History | 18 | 3.0% |
| Visual & Performing Arts | 15 | 2.5% |
| Communications | 35 | 5.8% |
| Arts & Humanities | 19 | 3.1% |
| Total | 609 | 100.0% |
Transportation & Commute in Barbourmeade
Vehicle Availability by Sex in Barbourmeade
The most prevalent vehicle ownership categories in Barbourmeade are males with 2 vehicles (161, accounting for 59.2%) and females with 2 vehicles (159, making up 64.1%).
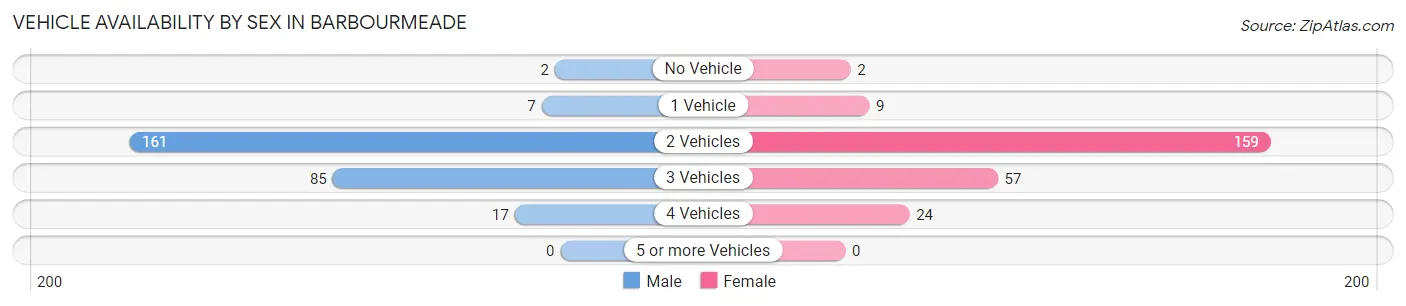
| Vehicles Available | Male | Female |
| No Vehicle | 2 (0.7%) | 2 (0.8%) |
| 1 Vehicle | 7 (2.6%) | 9 (3.6%) |
| 2 Vehicles | 161 (59.2%) | 159 (63.3%) |
| 3 Vehicles | 85 (31.2%) | 57 (22.7%) |
| 4 Vehicles | 17 (6.2%) | 24 (9.6%) |
| 5 or more Vehicles | 0 (0.0%) | 0 (0.0%) |
| Total | 272 (100.0%) | 251 (100.0%) |
Commute Time in Barbourmeade
The most frequently occuring commute durations in Barbourmeade are 20 to 24 minutes (150 commuters, 37.7%), 15 to 19 minutes (74 commuters, 18.6%), and 30 to 34 minutes (57 commuters, 14.3%).
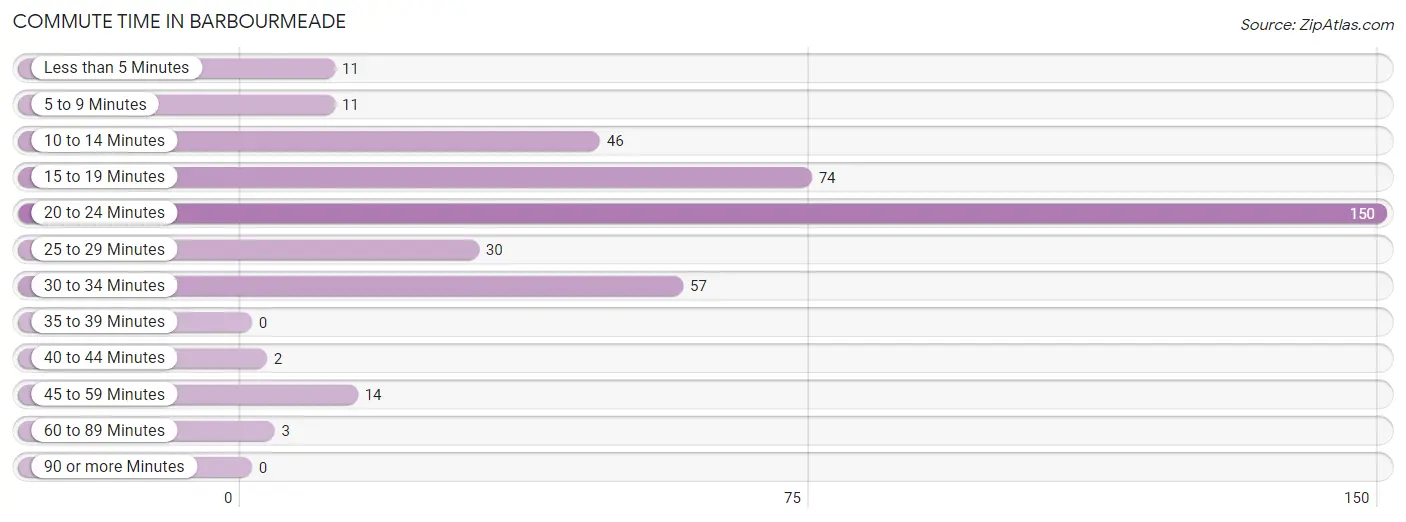
| Commute Time | # Commuters | % Commuters |
| Less than 5 Minutes | 11 | 2.8% |
| 5 to 9 Minutes | 11 | 2.8% |
| 10 to 14 Minutes | 46 | 11.6% |
| 15 to 19 Minutes | 74 | 18.6% |
| 20 to 24 Minutes | 150 | 37.7% |
| 25 to 29 Minutes | 30 | 7.5% |
| 30 to 34 Minutes | 57 | 14.3% |
| 35 to 39 Minutes | 0 | 0.0% |
| 40 to 44 Minutes | 2 | 0.5% |
| 45 to 59 Minutes | 14 | 3.5% |
| 60 to 89 Minutes | 3 | 0.7% |
| 90 or more Minutes | 0 | 0.0% |
Commute Time by Sex in Barbourmeade
The most common commute times in Barbourmeade are 20 to 24 minutes (92 commuters, 43.6%) for males and 20 to 24 minutes (58 commuters, 31.0%) for females.
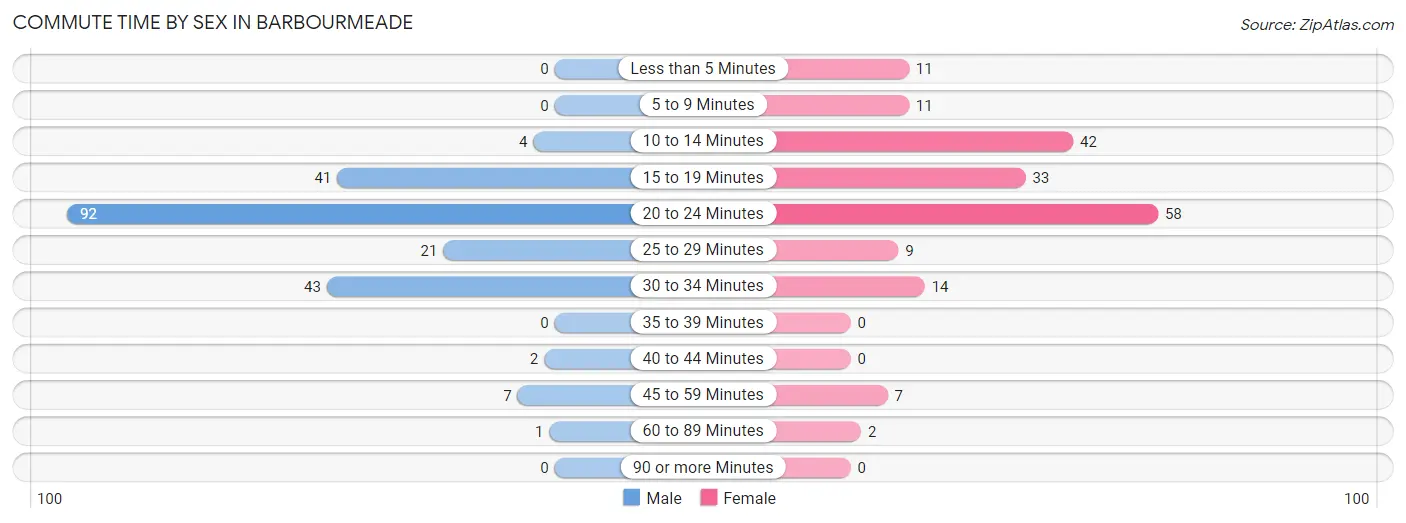
| Commute Time | Male | Female |
| Less than 5 Minutes | 0 (0.0%) | 11 (5.9%) |
| 5 to 9 Minutes | 0 (0.0%) | 11 (5.9%) |
| 10 to 14 Minutes | 4 (1.9%) | 42 (22.5%) |
| 15 to 19 Minutes | 41 (19.4%) | 33 (17.6%) |
| 20 to 24 Minutes | 92 (43.6%) | 58 (31.0%) |
| 25 to 29 Minutes | 21 (10.0%) | 9 (4.8%) |
| 30 to 34 Minutes | 43 (20.4%) | 14 (7.5%) |
| 35 to 39 Minutes | 0 (0.0%) | 0 (0.0%) |
| 40 to 44 Minutes | 2 (0.9%) | 0 (0.0%) |
| 45 to 59 Minutes | 7 (3.3%) | 7 (3.7%) |
| 60 to 89 Minutes | 1 (0.5%) | 2 (1.1%) |
| 90 or more Minutes | 0 (0.0%) | 0 (0.0%) |
Time of Departure to Work by Sex in Barbourmeade
The most frequent times of departure to work in Barbourmeade are 7:00 AM to 7:29 AM (52, 24.6%) for males and 8:30 AM to 8:59 AM (42, 22.5%) for females.
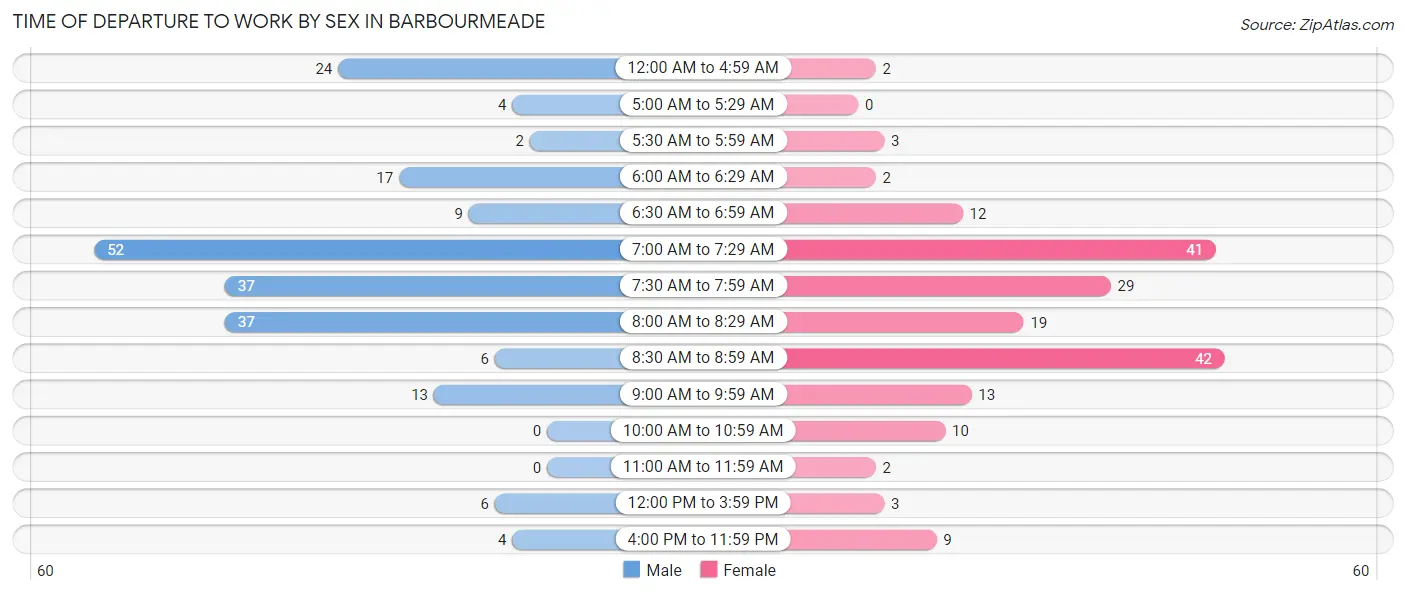
| Time of Departure | Male | Female |
| 12:00 AM to 4:59 AM | 24 (11.4%) | 2 (1.1%) |
| 5:00 AM to 5:29 AM | 4 (1.9%) | 0 (0.0%) |
| 5:30 AM to 5:59 AM | 2 (0.9%) | 3 (1.6%) |
| 6:00 AM to 6:29 AM | 17 (8.1%) | 2 (1.1%) |
| 6:30 AM to 6:59 AM | 9 (4.3%) | 12 (6.4%) |
| 7:00 AM to 7:29 AM | 52 (24.6%) | 41 (21.9%) |
| 7:30 AM to 7:59 AM | 37 (17.5%) | 29 (15.5%) |
| 8:00 AM to 8:29 AM | 37 (17.5%) | 19 (10.2%) |
| 8:30 AM to 8:59 AM | 6 (2.8%) | 42 (22.5%) |
| 9:00 AM to 9:59 AM | 13 (6.2%) | 13 (7.0%) |
| 10:00 AM to 10:59 AM | 0 (0.0%) | 10 (5.3%) |
| 11:00 AM to 11:59 AM | 0 (0.0%) | 2 (1.1%) |
| 12:00 PM to 3:59 PM | 6 (2.8%) | 3 (1.6%) |
| 4:00 PM to 11:59 PM | 4 (1.9%) | 9 (4.8%) |
| Total | 211 (100.0%) | 187 (100.0%) |
Housing Occupancy in Barbourmeade
Occupancy by Ownership in Barbourmeade
Of the total 471 dwellings in Barbourmeade, owner-occupied units account for 436 (92.6%), while renter-occupied units make up 35 (7.4%).
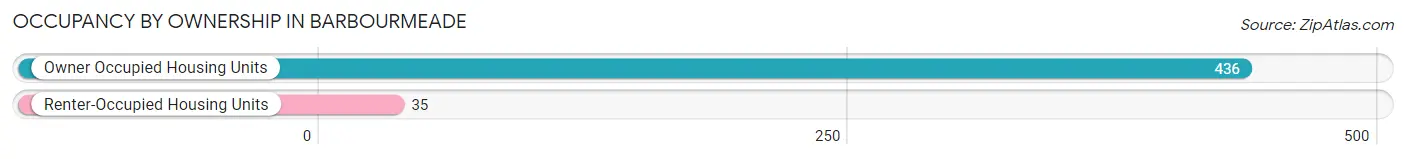
| Occupancy | # Housing Units | % Housing Units |
| Owner Occupied Housing Units | 436 | 92.6% |
| Renter-Occupied Housing Units | 35 | 7.4% |
| Total Occupied Housing Units | 471 | 100.0% |
Occupancy by Household Size in Barbourmeade
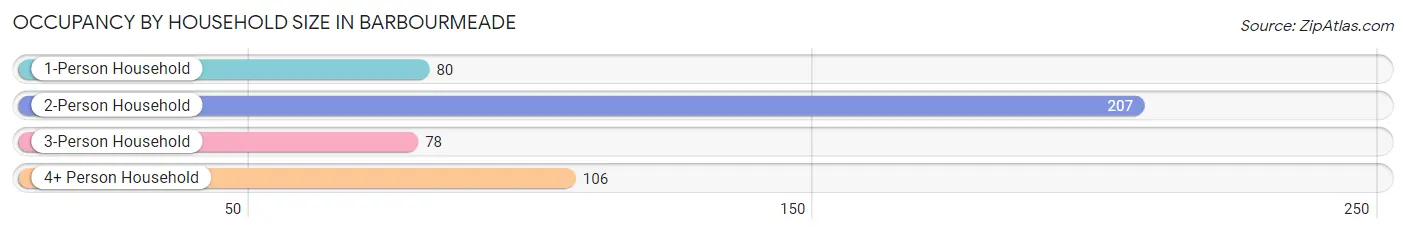
| Household Size | # Housing Units | % Housing Units |
| 1-Person Household | 80 | 17.0% |
| 2-Person Household | 207 | 44.0% |
| 3-Person Household | 78 | 16.6% |
| 4+ Person Household | 106 | 22.5% |
| Total Housing Units | 471 | 100.0% |
Occupancy by Ownership by Household Size in Barbourmeade
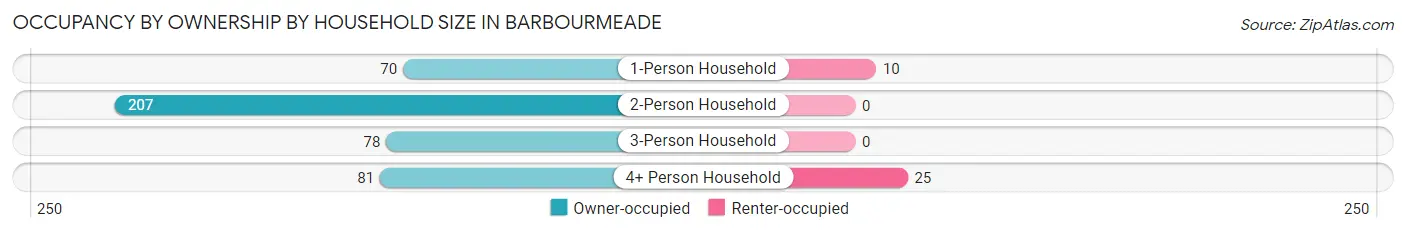
| Household Size | Owner-occupied | Renter-occupied |
| 1-Person Household | 70 (87.5%) | 10 (12.5%) |
| 2-Person Household | 207 (100.0%) | 0 (0.0%) |
| 3-Person Household | 78 (100.0%) | 0 (0.0%) |
| 4+ Person Household | 81 (76.4%) | 25 (23.6%) |
| Total Housing Units | 436 (92.6%) | 35 (7.4%) |
Occupancy by Educational Attainment in Barbourmeade
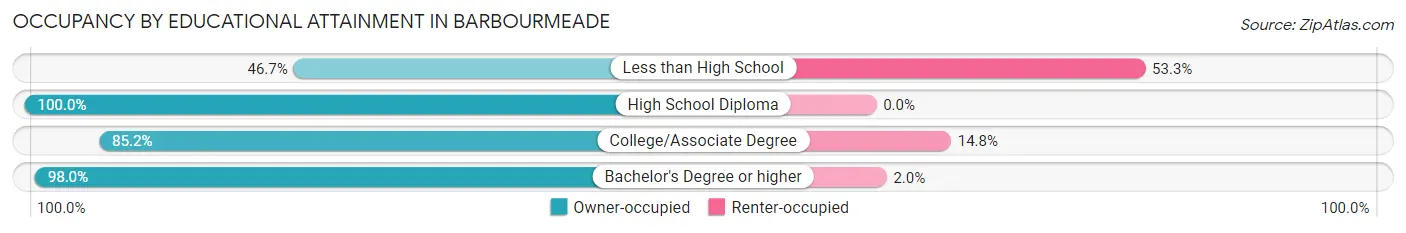
| Household Size | Owner-occupied | Renter-occupied |
| Less than High School | 7 (46.7%) | 8 (53.3%) |
| High School Diploma | 20 (100.0%) | 0 (0.0%) |
| College/Associate Degree | 121 (85.2%) | 21 (14.8%) |
| Bachelor's Degree or higher | 288 (98.0%) | 6 (2.0%) |
Occupancy by Age of Householder in Barbourmeade
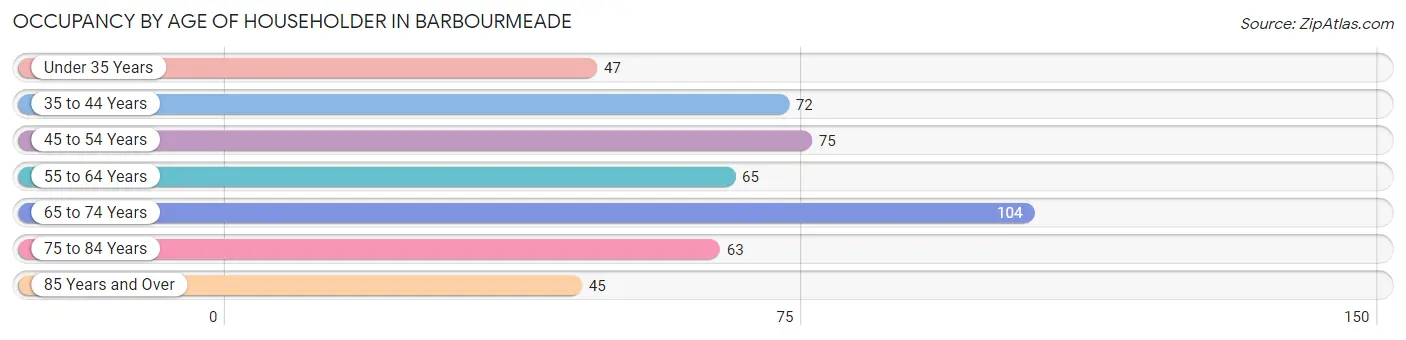
| Age Bracket | # Households | % Households |
| Under 35 Years | 47 | 10.0% |
| 35 to 44 Years | 72 | 15.3% |
| 45 to 54 Years | 75 | 15.9% |
| 55 to 64 Years | 65 | 13.8% |
| 65 to 74 Years | 104 | 22.1% |
| 75 to 84 Years | 63 | 13.4% |
| 85 Years and Over | 45 | 9.6% |
| Total | 471 | 100.0% |
Housing Finances in Barbourmeade
Median Income by Occupancy in Barbourmeade
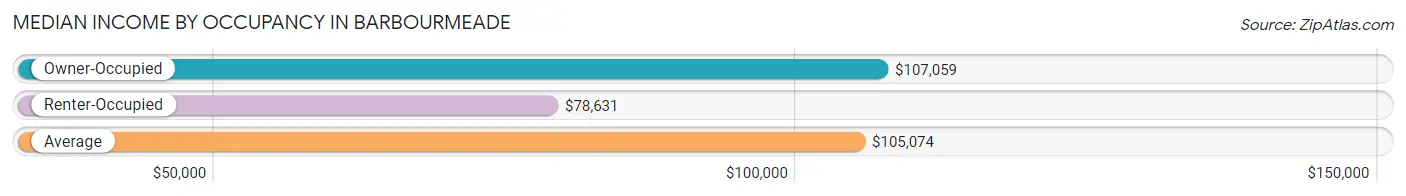
| Occupancy Type | # Households | Median Income |
| Owner-Occupied | 436 (92.6%) | $107,059 |
| Renter-Occupied | 35 (7.4%) | $78,631 |
| Average | 471 (100.0%) | $105,074 |
Occupancy by Householder Income Bracket in Barbourmeade
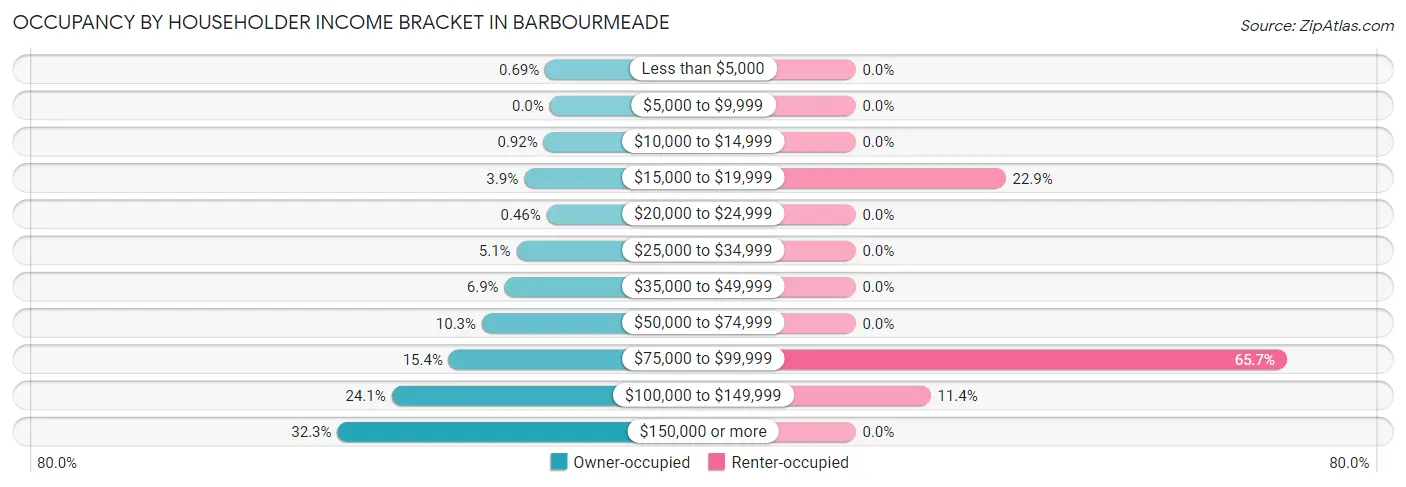
| Income Bracket | Owner-occupied | Renter-occupied |
| Less than $5,000 | 3 (0.7%) | 0 (0.0%) |
| $5,000 to $9,999 | 0 (0.0%) | 0 (0.0%) |
| $10,000 to $14,999 | 4 (0.9%) | 0 (0.0%) |
| $15,000 to $19,999 | 17 (3.9%) | 8 (22.9%) |
| $20,000 to $24,999 | 2 (0.5%) | 0 (0.0%) |
| $25,000 to $34,999 | 22 (5.1%) | 0 (0.0%) |
| $35,000 to $49,999 | 30 (6.9%) | 0 (0.0%) |
| $50,000 to $74,999 | 45 (10.3%) | 0 (0.0%) |
| $75,000 to $99,999 | 67 (15.4%) | 23 (65.7%) |
| $100,000 to $149,999 | 105 (24.1%) | 4 (11.4%) |
| $150,000 or more | 141 (32.3%) | 0 (0.0%) |
| Total | 436 (100.0%) | 35 (100.0%) |
Monthly Housing Cost Tiers in Barbourmeade
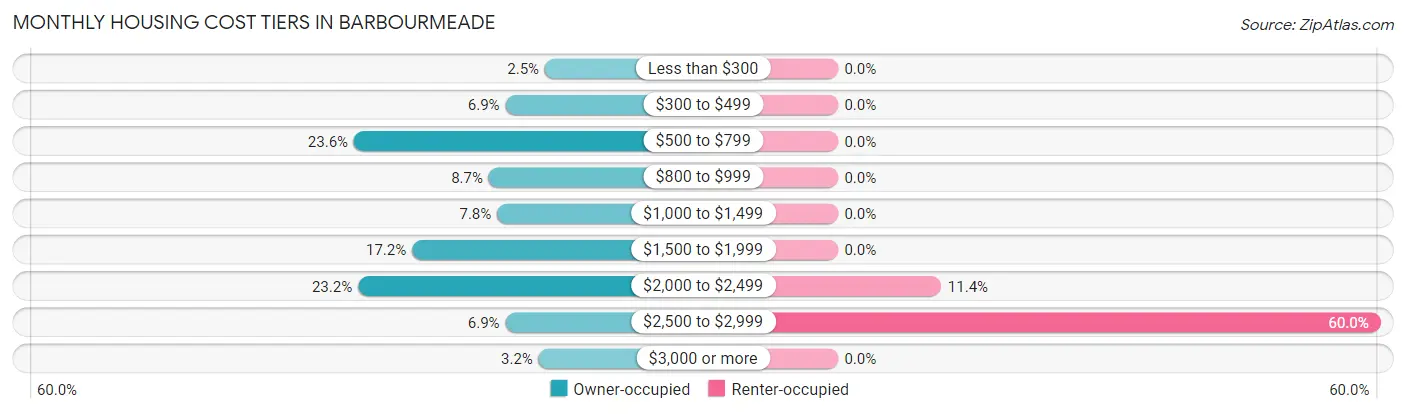
| Monthly Cost | Owner-occupied | Renter-occupied |
| Less than $300 | 11 (2.5%) | 0 (0.0%) |
| $300 to $499 | 30 (6.9%) | 0 (0.0%) |
| $500 to $799 | 103 (23.6%) | 0 (0.0%) |
| $800 to $999 | 38 (8.7%) | 0 (0.0%) |
| $1,000 to $1,499 | 34 (7.8%) | 0 (0.0%) |
| $1,500 to $1,999 | 75 (17.2%) | 0 (0.0%) |
| $2,000 to $2,499 | 101 (23.2%) | 4 (11.4%) |
| $2,500 to $2,999 | 30 (6.9%) | 21 (60.0%) |
| $3,000 or more | 14 (3.2%) | 0 (0.0%) |
| Total | 436 (100.0%) | 35 (100.0%) |
Physical Housing Characteristics in Barbourmeade
Housing Structures in Barbourmeade
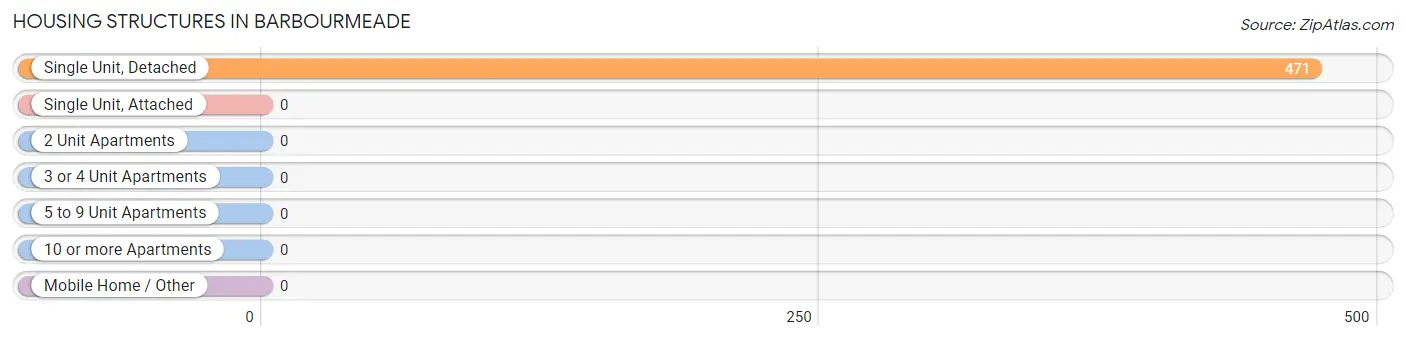
| Structure Type | # Housing Units | % Housing Units |
| Single Unit, Detached | 471 | 100.0% |
| Single Unit, Attached | 0 | 0.0% |
| 2 Unit Apartments | 0 | 0.0% |
| 3 or 4 Unit Apartments | 0 | 0.0% |
| 5 to 9 Unit Apartments | 0 | 0.0% |
| 10 or more Apartments | 0 | 0.0% |
| Mobile Home / Other | 0 | 0.0% |
| Total | 471 | 100.0% |
Housing Structures by Occupancy in Barbourmeade
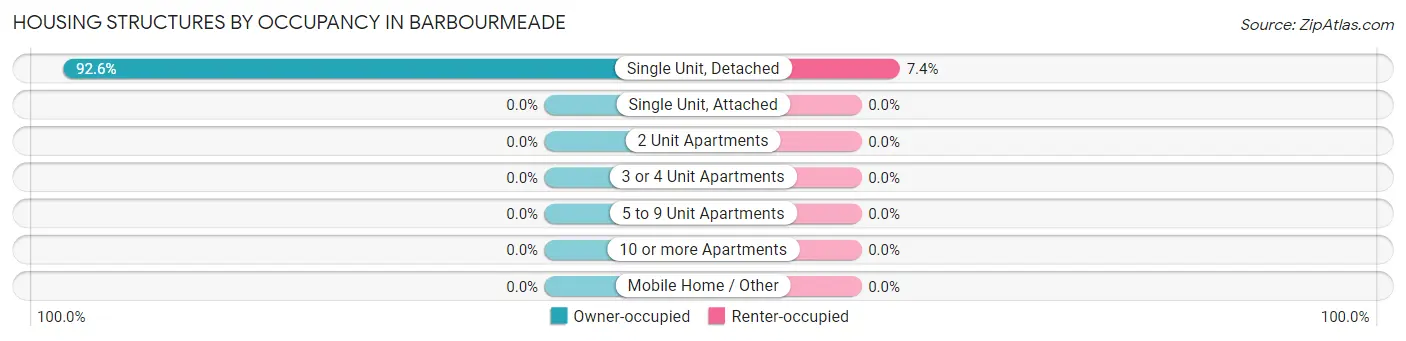
| Structure Type | Owner-occupied | Renter-occupied |
| Single Unit, Detached | 436 (92.6%) | 35 (7.4%) |
| Single Unit, Attached | 0 (0.0%) | 0 (0.0%) |
| 2 Unit Apartments | 0 (0.0%) | 0 (0.0%) |
| 3 or 4 Unit Apartments | 0 (0.0%) | 0 (0.0%) |
| 5 to 9 Unit Apartments | 0 (0.0%) | 0 (0.0%) |
| 10 or more Apartments | 0 (0.0%) | 0 (0.0%) |
| Mobile Home / Other | 0 (0.0%) | 0 (0.0%) |
| Total | 436 (92.6%) | 35 (7.4%) |
Housing Structures by Number of Rooms in Barbourmeade
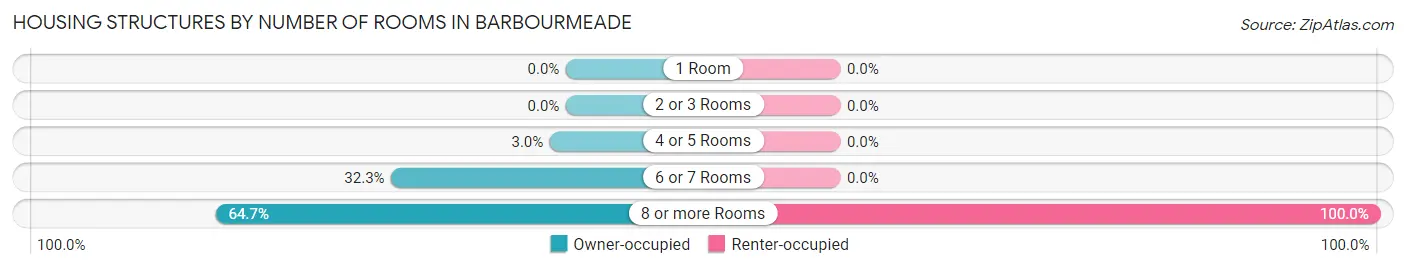
| Number of Rooms | Owner-occupied | Renter-occupied |
| 1 Room | 0 (0.0%) | 0 (0.0%) |
| 2 or 3 Rooms | 0 (0.0%) | 0 (0.0%) |
| 4 or 5 Rooms | 13 (3.0%) | 0 (0.0%) |
| 6 or 7 Rooms | 141 (32.3%) | 0 (0.0%) |
| 8 or more Rooms | 282 (64.7%) | 35 (100.0%) |
| Total | 436 (100.0%) | 35 (100.0%) |
Housing Structure by Heating Type in Barbourmeade
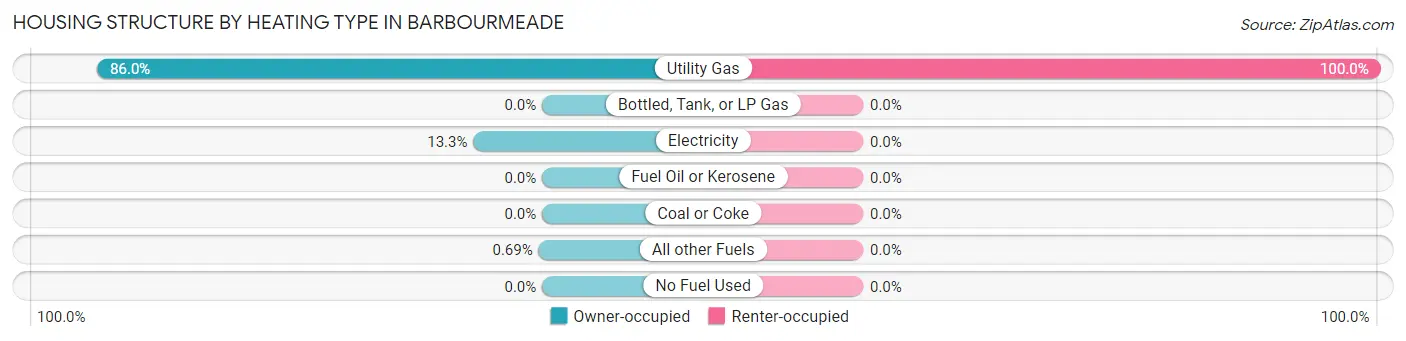
| Heating Type | Owner-occupied | Renter-occupied |
| Utility Gas | 375 (86.0%) | 35 (100.0%) |
| Bottled, Tank, or LP Gas | 0 (0.0%) | 0 (0.0%) |
| Electricity | 58 (13.3%) | 0 (0.0%) |
| Fuel Oil or Kerosene | 0 (0.0%) | 0 (0.0%) |
| Coal or Coke | 0 (0.0%) | 0 (0.0%) |
| All other Fuels | 3 (0.7%) | 0 (0.0%) |
| No Fuel Used | 0 (0.0%) | 0 (0.0%) |
| Total | 436 (100.0%) | 35 (100.0%) |
Household Vehicle Usage in Barbourmeade
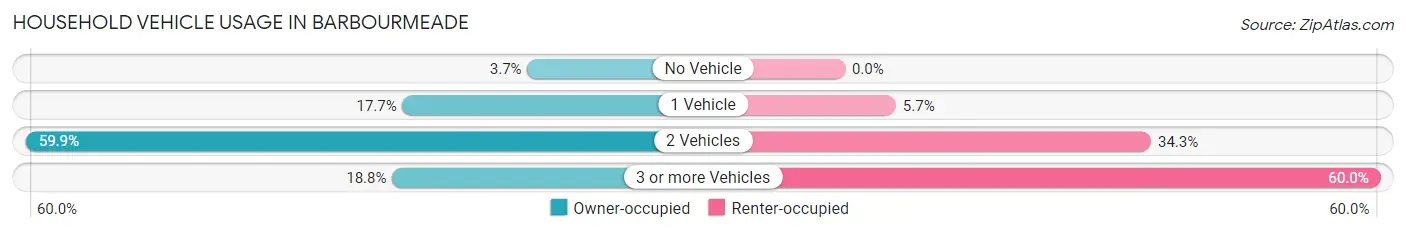
| Vehicles per Household | Owner-occupied | Renter-occupied |
| No Vehicle | 16 (3.7%) | 0 (0.0%) |
| 1 Vehicle | 77 (17.7%) | 2 (5.7%) |
| 2 Vehicles | 261 (59.9%) | 12 (34.3%) |
| 3 or more Vehicles | 82 (18.8%) | 21 (60.0%) |
| Total | 436 (100.0%) | 35 (100.0%) |
Real Estate & Mortgages in Barbourmeade
Real Estate and Mortgage Overview in Barbourmeade
| Characteristic | Without Mortgage | With Mortgage |
| Housing Units | 186 | 250 |
| Median Property Value | $337,400 | $344,500 |
| Median Household Income | $81,765 | $113 |
| Monthly Housing Costs | $638 | $14 |
| Real Estate Taxes | $2,638 | $4 |
Property Value by Mortgage Status in Barbourmeade
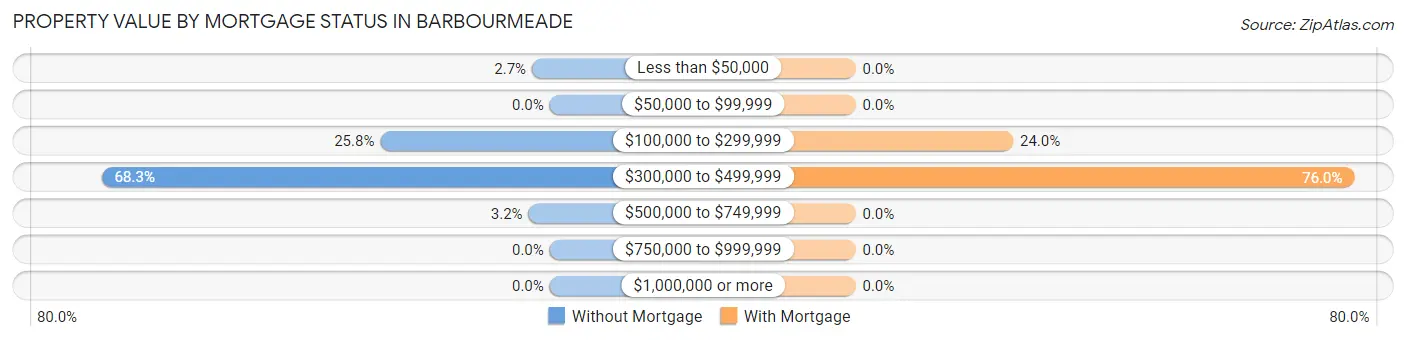
| Property Value | Without Mortgage | With Mortgage |
| Less than $50,000 | 5 (2.7%) | 0 (0.0%) |
| $50,000 to $99,999 | 0 (0.0%) | 0 (0.0%) |
| $100,000 to $299,999 | 48 (25.8%) | 60 (24.0%) |
| $300,000 to $499,999 | 127 (68.3%) | 190 (76.0%) |
| $500,000 to $749,999 | 6 (3.2%) | 0 (0.0%) |
| $750,000 to $999,999 | 0 (0.0%) | 0 (0.0%) |
| $1,000,000 or more | 0 (0.0%) | 0 (0.0%) |
| Total | 186 (100.0%) | 250 (100.0%) |
Household Income by Mortgage Status in Barbourmeade
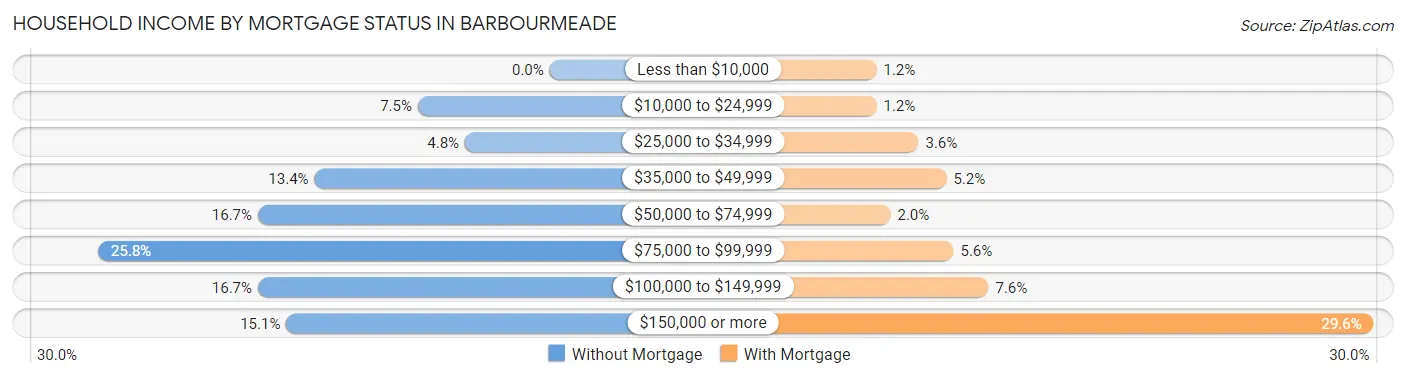
| Household Income | Without Mortgage | With Mortgage |
| Less than $10,000 | 0 (0.0%) | 3 (1.2%) |
| $10,000 to $24,999 | 14 (7.5%) | 3 (1.2%) |
| $25,000 to $34,999 | 9 (4.8%) | 9 (3.6%) |
| $35,000 to $49,999 | 25 (13.4%) | 13 (5.2%) |
| $50,000 to $74,999 | 31 (16.7%) | 5 (2.0%) |
| $75,000 to $99,999 | 48 (25.8%) | 14 (5.6%) |
| $100,000 to $149,999 | 31 (16.7%) | 19 (7.6%) |
| $150,000 or more | 28 (15.0%) | 74 (29.6%) |
| Total | 186 (100.0%) | 250 (100.0%) |
Property Value to Household Income Ratio in Barbourmeade
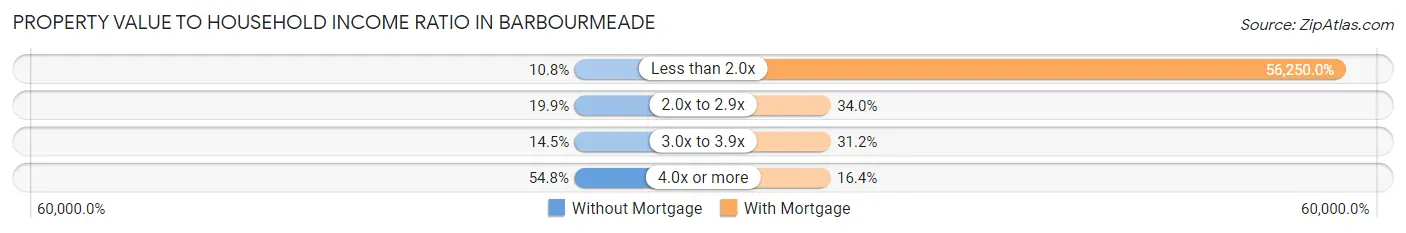
| Value-to-Income Ratio | Without Mortgage | With Mortgage |
| Less than 2.0x | 20 (10.7%) | 140,625 (56,250.0%) |
| 2.0x to 2.9x | 37 (19.9%) | 85 (34.0%) |
| 3.0x to 3.9x | 27 (14.5%) | 78 (31.2%) |
| 4.0x or more | 102 (54.8%) | 41 (16.4%) |
| Total | 186 (100.0%) | 250 (100.0%) |
Real Estate Taxes by Mortgage Status in Barbourmeade
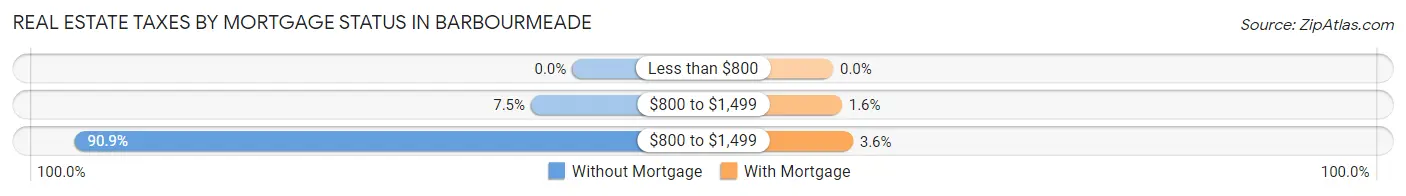
| Property Taxes | Without Mortgage | With Mortgage |
| Less than $800 | 0 (0.0%) | 0 (0.0%) |
| $800 to $1,499 | 14 (7.5%) | 4 (1.6%) |
| $800 to $1,499 | 169 (90.9%) | 9 (3.6%) |
| Total | 186 (100.0%) | 250 (100.0%) |
Health & Disability in Barbourmeade
Health Insurance Coverage by Age in Barbourmeade
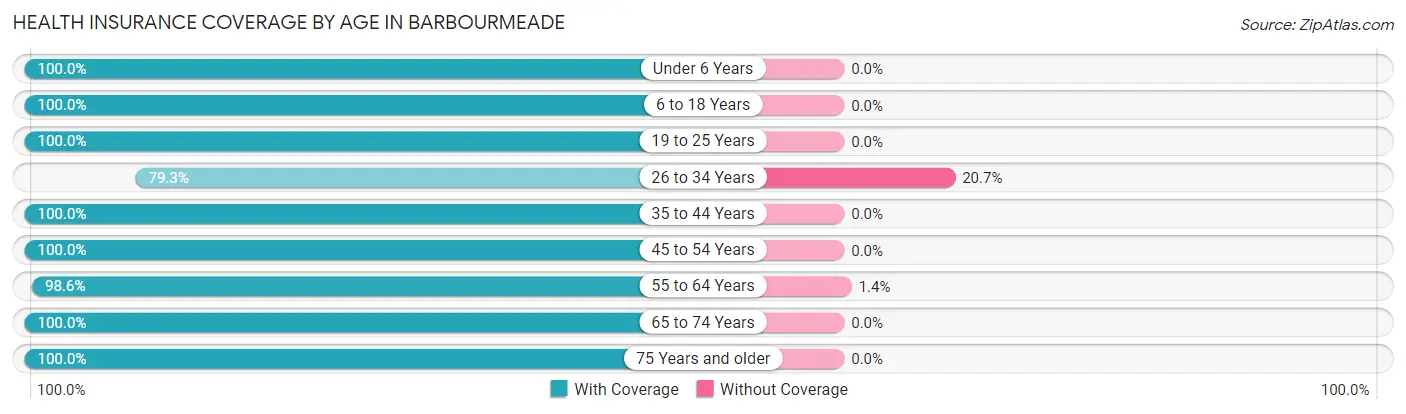
| Age Bracket | With Coverage | Without Coverage |
| Under 6 Years | 84 (100.0%) | 0 (0.0%) |
| 6 to 18 Years | 200 (100.0%) | 0 (0.0%) |
| 19 to 25 Years | 42 (100.0%) | 0 (0.0%) |
| 26 to 34 Years | 92 (79.3%) | 24 (20.7%) |
| 35 to 44 Years | 145 (100.0%) | 0 (0.0%) |
| 45 to 54 Years | 136 (100.0%) | 0 (0.0%) |
| 55 to 64 Years | 142 (98.6%) | 2 (1.4%) |
| 65 to 74 Years | 181 (100.0%) | 0 (0.0%) |
| 75 Years and older | 165 (100.0%) | 0 (0.0%) |
| Total | 1,187 (97.9%) | 26 (2.1%) |
Health Insurance Coverage by Citizenship Status in Barbourmeade
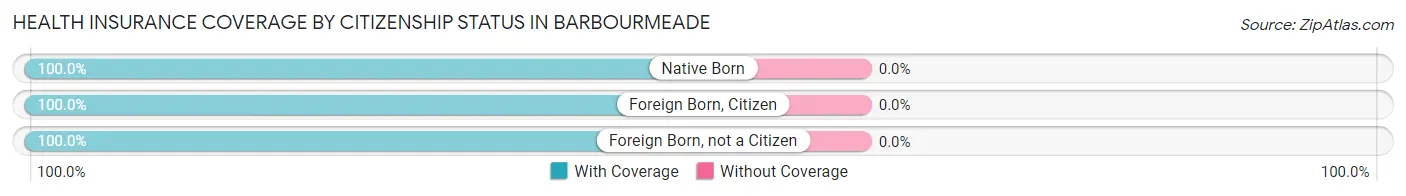
| Citizenship Status | With Coverage | Without Coverage |
| Native Born | 84 (100.0%) | 0 (0.0%) |
| Foreign Born, Citizen | 200 (100.0%) | 0 (0.0%) |
| Foreign Born, not a Citizen | 42 (100.0%) | 0 (0.0%) |
Health Insurance Coverage by Household Income in Barbourmeade
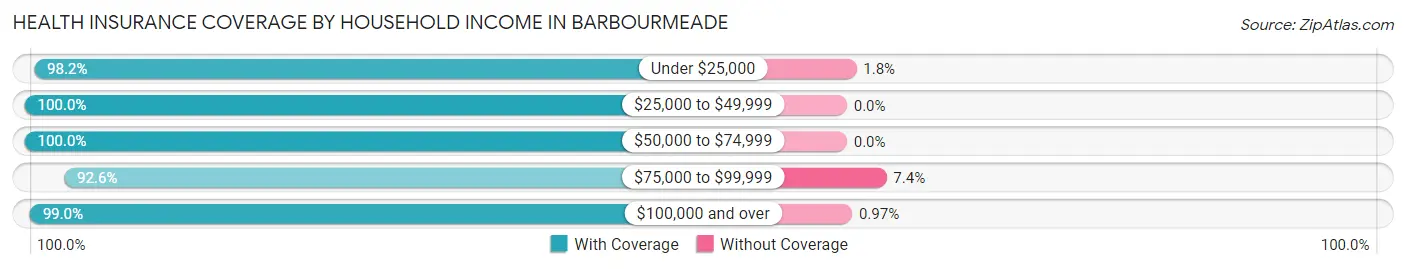
| Household Income | With Coverage | Without Coverage |
| Under $25,000 | 110 (98.2%) | 2 (1.8%) |
| $25,000 to $49,999 | 70 (100.0%) | 0 (0.0%) |
| $50,000 to $74,999 | 79 (100.0%) | 0 (0.0%) |
| $75,000 to $99,999 | 212 (92.6%) | 17 (7.4%) |
| $100,000 and over | 716 (99.0%) | 7 (1.0%) |
Public vs Private Health Insurance Coverage by Age in Barbourmeade
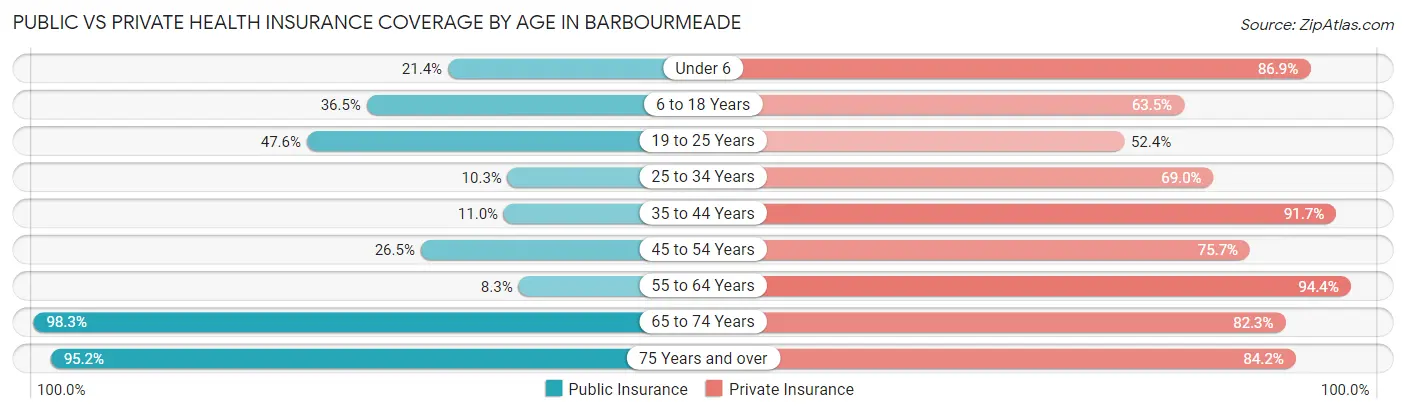
| Age Bracket | Public Insurance | Private Insurance |
| Under 6 | 18 (21.4%) | 73 (86.9%) |
| 6 to 18 Years | 73 (36.5%) | 127 (63.5%) |
| 19 to 25 Years | 20 (47.6%) | 22 (52.4%) |
| 25 to 34 Years | 12 (10.3%) | 80 (69.0%) |
| 35 to 44 Years | 16 (11.0%) | 133 (91.7%) |
| 45 to 54 Years | 36 (26.5%) | 103 (75.7%) |
| 55 to 64 Years | 12 (8.3%) | 136 (94.4%) |
| 65 to 74 Years | 178 (98.3%) | 149 (82.3%) |
| 75 Years and over | 157 (95.2%) | 139 (84.2%) |
| Total | 522 (43.0%) | 962 (79.3%) |
Disability Status by Sex by Age in Barbourmeade
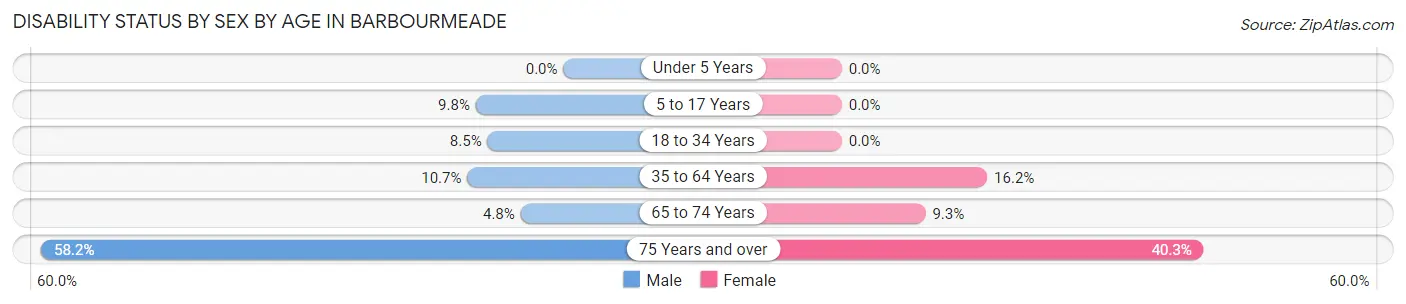
| Age Bracket | Male | Female |
| Under 5 Years | 0 (0.0%) | 0 (0.0%) |
| 5 to 17 Years | 8 (9.8%) | 0 (0.0%) |
| 18 to 34 Years | 6 (8.5%) | 0 (0.0%) |
| 35 to 64 Years | 23 (10.7%) | 34 (16.2%) |
| 65 to 74 Years | 3 (4.8%) | 11 (9.3%) |
| 75 Years and over | 57 (58.2%) | 27 (40.3%) |
Disability Class by Sex by Age in Barbourmeade
Disability Class: Hearing Difficulty
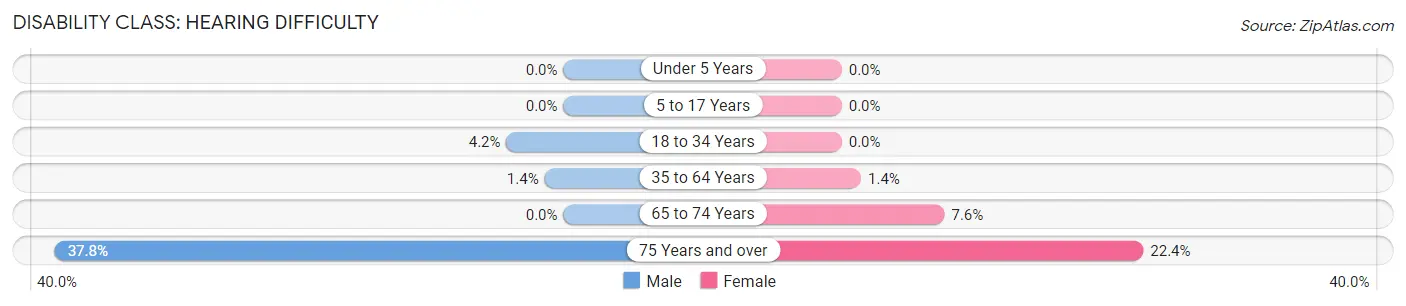
| Age Bracket | Male | Female |
| Under 5 Years | 0 (0.0%) | 0 (0.0%) |
| 5 to 17 Years | 0 (0.0%) | 0 (0.0%) |
| 18 to 34 Years | 3 (4.2%) | 0 (0.0%) |
| 35 to 64 Years | 3 (1.4%) | 3 (1.4%) |
| 65 to 74 Years | 0 (0.0%) | 9 (7.6%) |
| 75 Years and over | 37 (37.8%) | 15 (22.4%) |
Disability Class: Vision Difficulty
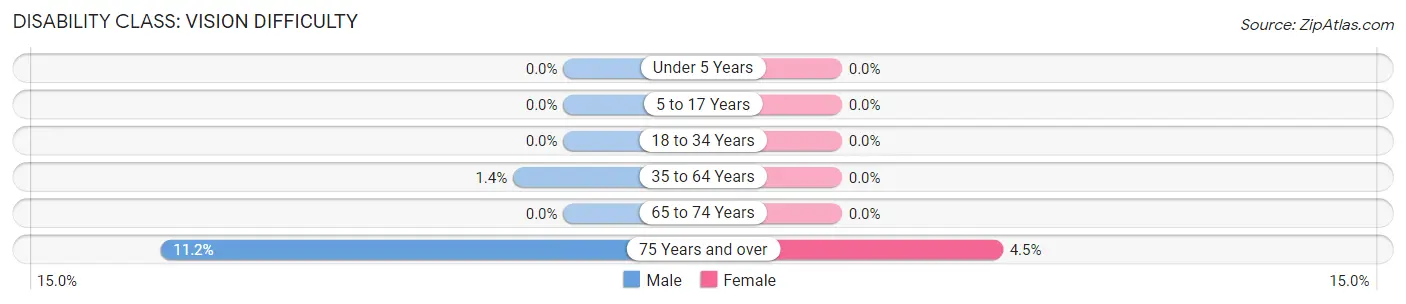
| Age Bracket | Male | Female |
| Under 5 Years | 0 (0.0%) | 0 (0.0%) |
| 5 to 17 Years | 0 (0.0%) | 0 (0.0%) |
| 18 to 34 Years | 0 (0.0%) | 0 (0.0%) |
| 35 to 64 Years | 3 (1.4%) | 0 (0.0%) |
| 65 to 74 Years | 0 (0.0%) | 0 (0.0%) |
| 75 Years and over | 11 (11.2%) | 3 (4.5%) |
Disability Class: Cognitive Difficulty
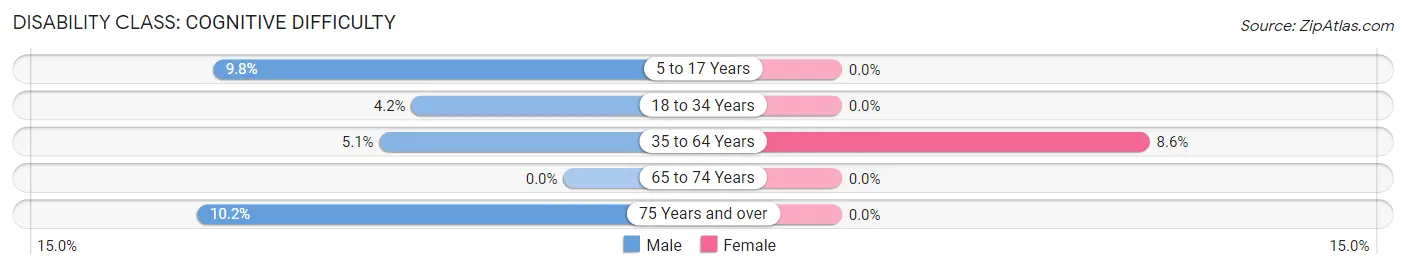
| Age Bracket | Male | Female |
| 5 to 17 Years | 8 (9.8%) | 0 (0.0%) |
| 18 to 34 Years | 3 (4.2%) | 0 (0.0%) |
| 35 to 64 Years | 11 (5.1%) | 18 (8.6%) |
| 65 to 74 Years | 0 (0.0%) | 0 (0.0%) |
| 75 Years and over | 10 (10.2%) | 0 (0.0%) |
Disability Class: Ambulatory Difficulty
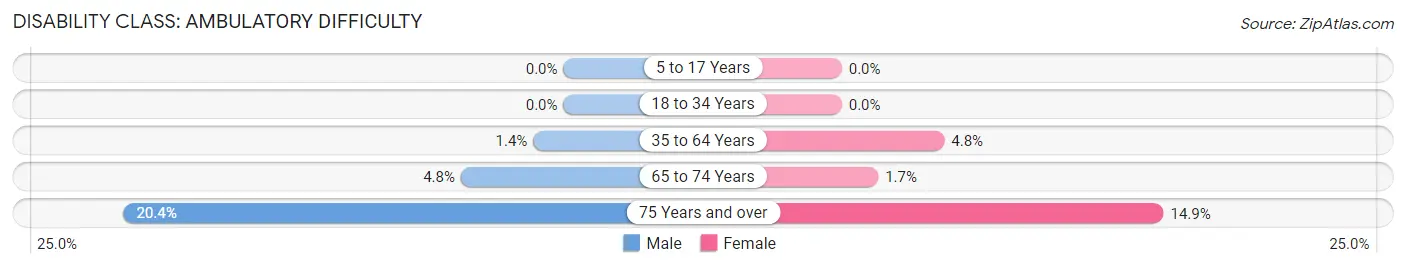
| Age Bracket | Male | Female |
| 5 to 17 Years | 0 (0.0%) | 0 (0.0%) |
| 18 to 34 Years | 0 (0.0%) | 0 (0.0%) |
| 35 to 64 Years | 3 (1.4%) | 10 (4.8%) |
| 65 to 74 Years | 3 (4.8%) | 2 (1.7%) |
| 75 Years and over | 20 (20.4%) | 10 (14.9%) |
Disability Class: Self-Care Difficulty
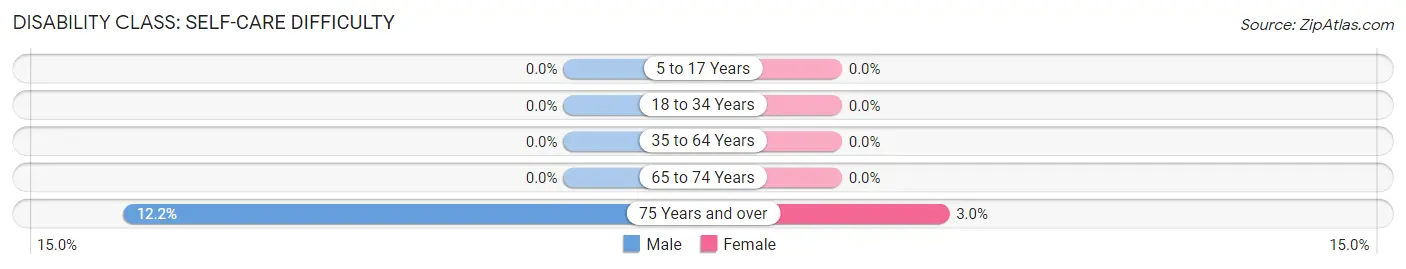
| Age Bracket | Male | Female |
| 5 to 17 Years | 0 (0.0%) | 0 (0.0%) |
| 18 to 34 Years | 0 (0.0%) | 0 (0.0%) |
| 35 to 64 Years | 0 (0.0%) | 0 (0.0%) |
| 65 to 74 Years | 0 (0.0%) | 0 (0.0%) |
| 75 Years and over | 12 (12.2%) | 2 (3.0%) |
Technology Access in Barbourmeade
Computing Device Access in Barbourmeade
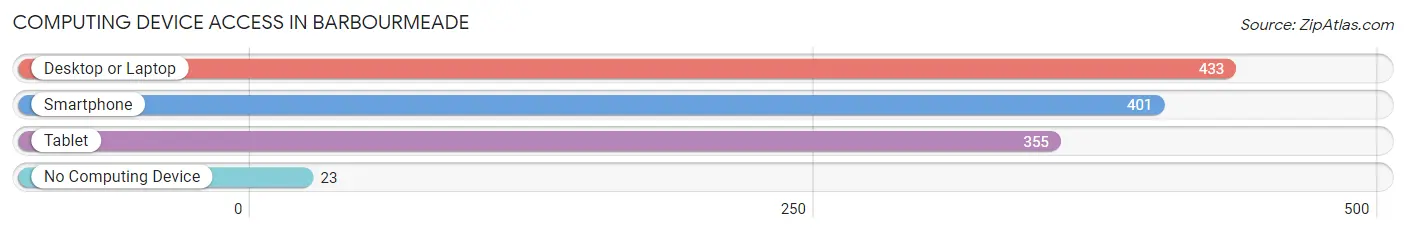
| Device Type | # Households | % Households |
| Desktop or Laptop | 433 | 91.9% |
| Smartphone | 401 | 85.1% |
| Tablet | 355 | 75.4% |
| No Computing Device | 23 | 4.9% |
| Total | 471 | 100.0% |
Internet Access in Barbourmeade
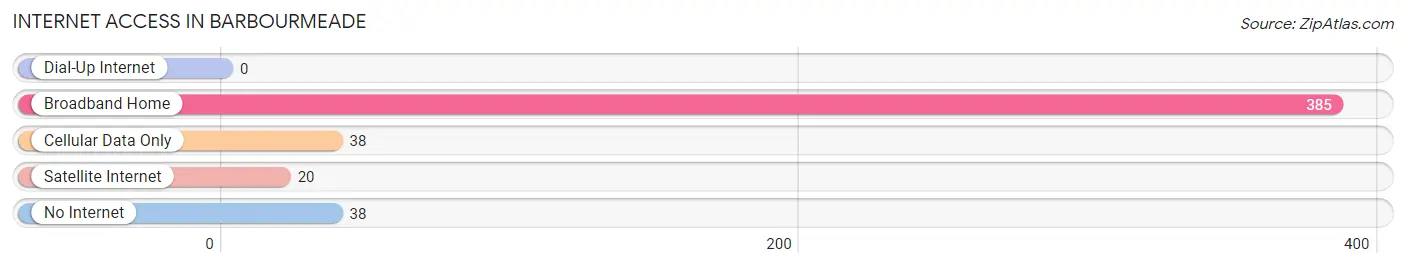
| Internet Type | # Households | % Households |
| Dial-Up Internet | 0 | 0.0% |
| Broadband Home | 385 | 81.7% |
| Cellular Data Only | 38 | 8.1% |
| Satellite Internet | 20 | 4.3% |
| No Internet | 38 | 8.1% |
| Total | 471 | 100.0% |
Barbourmeade Summary
Barbourmeade is a small city located in Jefferson County, Kentucky. It is situated in the southeastern part of the state, just south of Louisville. The city has a population of approximately 2,000 people and is part of the Louisville metropolitan area.
History
Barbourmeade was founded in the late 1950s by the Barbour family. The family had purchased a large tract of land in the area and decided to develop it into a residential community. The city was named after the family and was incorporated in 1959.
The city grew rapidly in the 1960s and 1970s, as many people moved to the area to take advantage of the affordable housing and good schools. The city was also home to a number of businesses, including a grocery store, a gas station, and a few restaurants.
Geography
Barbourmeade is located in the southeastern part of Jefferson County, Kentucky. It is situated just south of Louisville and is part of the Louisville metropolitan area. The city is bordered by the cities of St. Matthews and Lyndon to the north, and by the cities of Jeffersontown and Middletown to the south.
The city is situated on a flat plain, with an elevation of approximately 500 feet above sea level. The city is located in a humid subtropical climate zone, with hot summers and mild winters.
Economy
The economy of Barbourmeade is largely based on the service industry. The city is home to a number of restaurants, retail stores, and other businesses. The city is also home to a number of medical facilities, including a hospital and several clinics.
The city is also home to a number of manufacturing companies, including a plastics manufacturer and a metal fabrication company. The city is also home to a number of technology companies, including a software development firm and a web design firm.
Demographics
As of the 2010 census, the population of Barbourmeade was 2,000 people. The racial makeup of the city was 94.2% White, 2.2% African American, 0.7% Asian, 0.3% Native American, and 2.6% from other races. The median household income was $50,000, and the median family income was $60,000.
The city is home to a number of churches, including Baptist, Methodist, and Presbyterian churches. The city is also home to a number of schools, including a public elementary school, a middle school, and a high school.
Conclusion
Barbourmeade is a small city located in Jefferson County, Kentucky. It is situated in the southeastern part of the state, just south of Louisville. The city has a population of approximately 2,000 people and is part of the Louisville metropolitan area. The economy of Barbourmeade is largely based on the service industry, and the city is home to a number of restaurants, retail stores, and other businesses. The racial makeup of the city is 94.2% White, 2.2% African American, 0.7% Asian, 0.3% Native American, and 2.6% from other races. The median household income was $50,000, and the median family income was $60,000. The city is home to a number of churches, schools, and other amenities.
Common Questions
What is Per Capita Income in Barbourmeade?
Per Capita income in Barbourmeade is $46,475.
What is the Median Family Income in Barbourmeade?
Median Family Income in Barbourmeade is $116,389.
What is the Median Household income in Barbourmeade?
Median Household Income in Barbourmeade is $105,074.
What is Income or Wage Gap in Barbourmeade?
Income or Wage Gap in Barbourmeade is 25.5%.
Women in Barbourmeade earn 74.5 cents for every dollar earned by a man.
What is Inequality or Gini Index in Barbourmeade?
Inequality or Gini Index in Barbourmeade is 0.34.
What is the Total Population of Barbourmeade?
Total Population of Barbourmeade is 1,213.
What is the Total Male Population of Barbourmeade?
Total Male Population of Barbourmeade is 581.
What is the Total Female Population of Barbourmeade?
Total Female Population of Barbourmeade is 632.
What is the Ratio of Males per 100 Females in Barbourmeade?
There are 91.93 Males per 100 Females in Barbourmeade.
What is the Ratio of Females per 100 Males in Barbourmeade?
There are 108.78 Females per 100 Males in Barbourmeade.
What is the Median Population Age in Barbourmeade?
Median Population Age in Barbourmeade is 46.9 Years.
What is the Average Family Size in Barbourmeade
Average Family Size in Barbourmeade is 2.9 People.
What is the Average Household Size in Barbourmeade
Average Household Size in Barbourmeade is 2.6 People.
How Large is the Labor Force in Barbourmeade?
There are 570 People in the Labor Forcein in Barbourmeade.
What is the Percentage of People in the Labor Force in Barbourmeade?
59.1% of People are in the Labor Force in Barbourmeade.
What is the Unemployment Rate in Barbourmeade?
Unemployment Rate in Barbourmeade is 6.5%.