Prestonsburg, KY Map & Demographics
Prestonsburg Map
Prestonsburg Overview
$19,724
PER CAPITA INCOME
$30,170
AVG FAMILY INCOME
$27,099
AVG HOUSEHOLD INCOME
0.55
INEQUALITY / GINI INDEX
3,868
TOTAL POPULATION
2,030
MALE POPULATION
1,838
FEMALE POPULATION
110.45
MALES / 100 FEMALES
90.54
FEMALES / 100 MALES
33.6
MEDIAN AGE
2.8
AVG FAMILY SIZE
2.4
AVG HOUSEHOLD SIZE
1,247
LABOR FORCE [ PEOPLE ]
42.1%
PERCENT IN LABOR FORCE
14.8%
UNEMPLOYMENT RATE
Prestonsburg Zip Codes
Prestonsburg Area Codes
Income in Prestonsburg
Income Overview in Prestonsburg
Per Capita Income in Prestonsburg is $19,724, while median incomes of families and households are $30,170 and $27,099 respectively.
| Characteristic | Number | Measure |
| Per Capita Income | 3,868 | $19,724 |
| Median Family Income | 915 | $30,170 |
| Mean Family Income | 915 | $58,471 |
| Median Household Income | 1,397 | $27,099 |
| Mean Household Income | 1,397 | $53,141 |
| Income Deficit | 915 | $0 |
| Wage / Income Gap (%) | 3,868 | 0.00% |
| Wage / Income Gap ($) | 3,868 | 100.00¢ per $1 |
| Gini / Inequality Index | 3,868 | 0.55 |
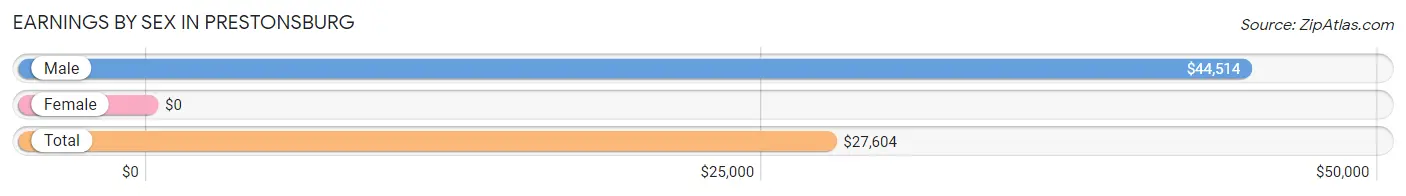
Earnings by Sex in Prestonsburg
| Sex | Number | Average Earnings |
| Male | 739 (55.5%) | $44,514 |
| Female | 592 (44.5%) | $0 |
| Total | 1,331 (100.0%) | $27,604 |
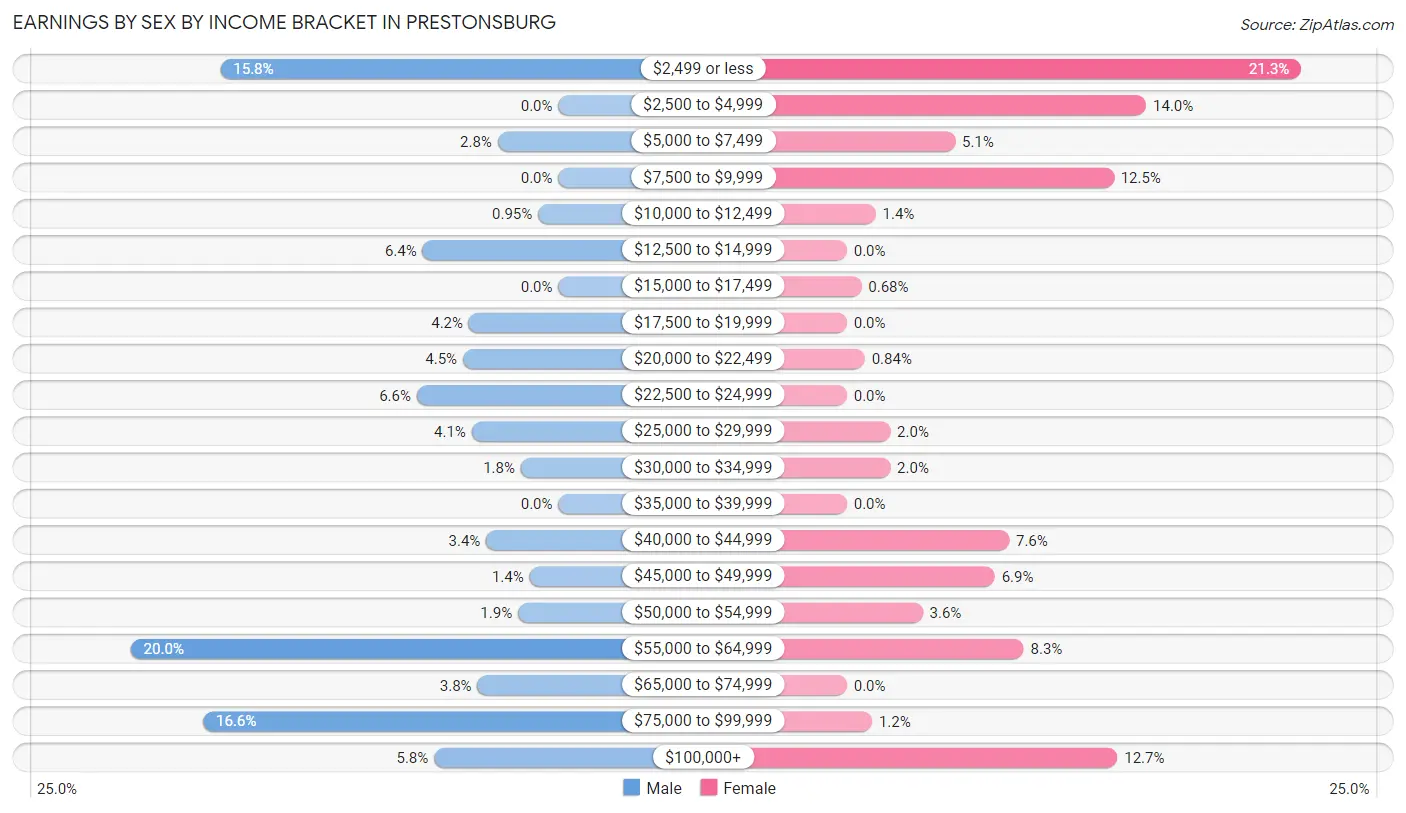
Earnings by Sex by Income Bracket in Prestonsburg
The most common earnings brackets in Prestonsburg are $55,000 to $64,999 for men (148 | 20.0%) and $2,499 or less for women (126 | 21.3%).
| Income | Male | Female |
| $2,499 or less | 117 (15.8%) | 126 (21.3%) |
| $2,500 to $4,999 | 0 (0.0%) | 83 (14.0%) |
| $5,000 to $7,499 | 21 (2.8%) | 30 (5.1%) |
| $7,500 to $9,999 | 0 (0.0%) | 74 (12.5%) |
| $10,000 to $12,499 | 7 (0.9%) | 8 (1.3%) |
| $12,500 to $14,999 | 47 (6.4%) | 0 (0.0%) |
| $15,000 to $17,499 | 0 (0.0%) | 4 (0.7%) |
| $17,500 to $19,999 | 31 (4.2%) | 0 (0.0%) |
| $20,000 to $22,499 | 33 (4.5%) | 5 (0.8%) |
| $22,500 to $24,999 | 49 (6.6%) | 0 (0.0%) |
| $25,000 to $29,999 | 30 (4.1%) | 12 (2.0%) |
| $30,000 to $34,999 | 13 (1.8%) | 12 (2.0%) |
| $35,000 to $39,999 | 0 (0.0%) | 0 (0.0%) |
| $40,000 to $44,999 | 25 (3.4%) | 45 (7.6%) |
| $45,000 to $49,999 | 10 (1.3%) | 41 (6.9%) |
| $50,000 to $54,999 | 14 (1.9%) | 21 (3.5%) |
| $55,000 to $64,999 | 148 (20.0%) | 49 (8.3%) |
| $65,000 to $74,999 | 28 (3.8%) | 0 (0.0%) |
| $75,000 to $99,999 | 123 (16.6%) | 7 (1.2%) |
| $100,000+ | 43 (5.8%) | 75 (12.7%) |
| Total | 739 (100.0%) | 592 (100.0%) |
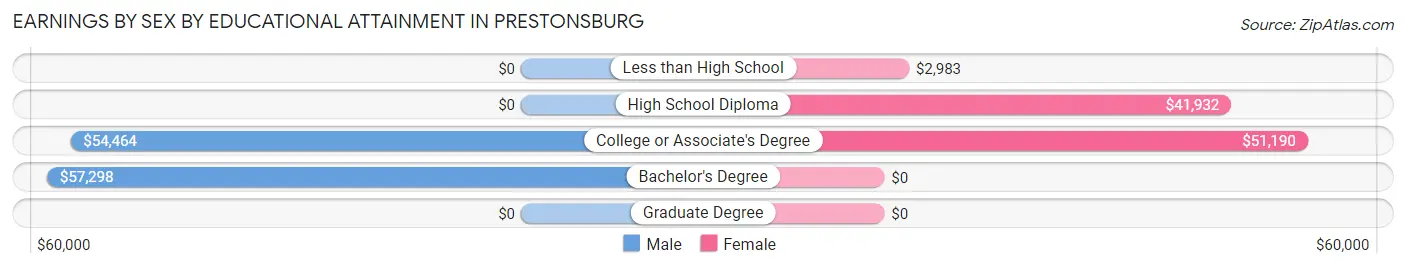
Earnings by Sex by Educational Attainment in Prestonsburg
Average earnings in Prestonsburg are $57,128 for men and $40,492 for women, a difference of 29.1%. Men with an educational attainment of bachelor's degree enjoy the highest average annual earnings of $57,298, while those with college or associate's degree education earn the least with $54,464. Women with an educational attainment of college or associate's degree earn the most with the average annual earnings of $51,190, while those with less than high school education have the smallest earnings of $2,983.
| Educational Attainment | Male Income | Female Income |
| Less than High School | - | - |
| High School Diploma | - | - |
| College or Associate's Degree | $54,464 | $51,190 |
| Bachelor's Degree | $57,298 | $0 |
| Graduate Degree | - | - |
| Total | $57,128 | $40,492 |
Family Income in Prestonsburg
Family Income Brackets in Prestonsburg
According to the Prestonsburg family income data, there are 224 families falling into the less than $10,000 income range, which is the most common income bracket and makes up 24.5% of all families. Conversely, the $200,000+ income bracket is the least frequent group with only 33 families (3.6%) belonging to this category.
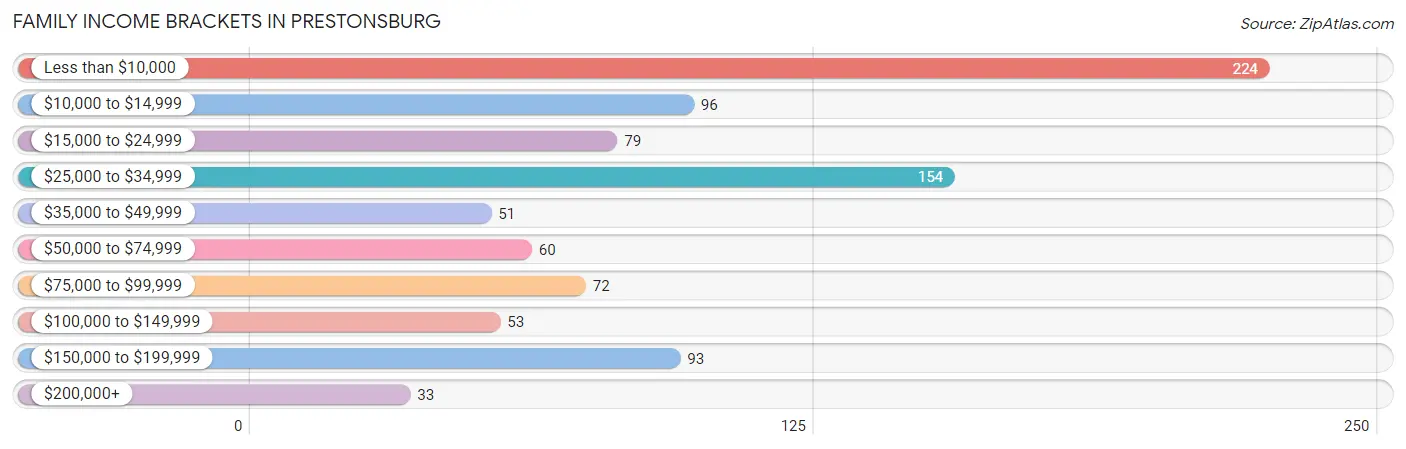
| Income Bracket | # Families | % Families |
| Less than $10,000 | 224 | 24.5% |
| $10,000 to $14,999 | 96 | 10.5% |
| $15,000 to $24,999 | 79 | 8.6% |
| $25,000 to $34,999 | 154 | 16.8% |
| $35,000 to $49,999 | 51 | 5.6% |
| $50,000 to $74,999 | 60 | 6.6% |
| $75,000 to $99,999 | 72 | 7.9% |
| $100,000 to $149,999 | 53 | 5.8% |
| $150,000 to $199,999 | 93 | 10.2% |
| $200,000+ | 33 | 3.6% |
Family Income by Famaliy Size in Prestonsburg
2-person families (482 | 52.7%) account for the highest median family income in Prestonsburg with $33,750 per family, while 2-person families (482 | 52.7%) have the highest median income of $16,875 per family member.
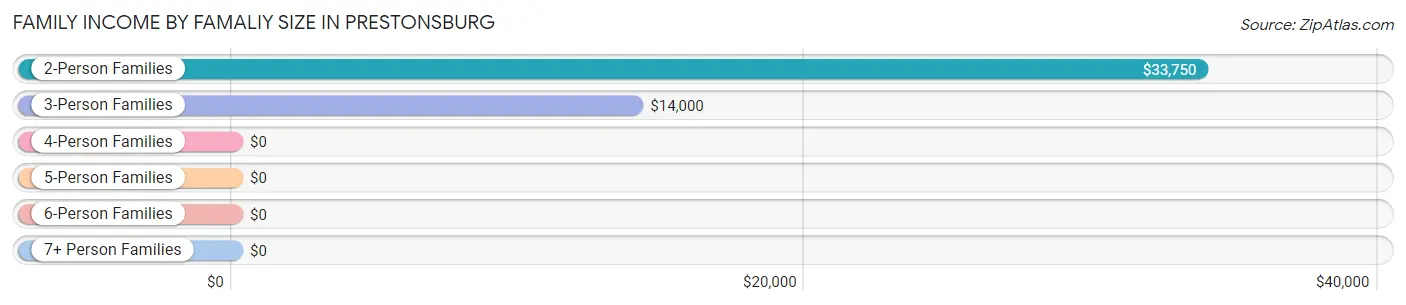
| Income Bracket | # Families | Median Income |
| 2-Person Families | 482 (52.7%) | $33,750 |
| 3-Person Families | 208 (22.7%) | $14,000 |
| 4-Person Families | 168 (18.4%) | $0 |
| 5-Person Families | 49 (5.4%) | $0 |
| 6-Person Families | 8 (0.9%) | $0 |
| 7+ Person Families | 0 (0.0%) | $0 |
| Total | 915 (100.0%) | $30,170 |
Family Income by Number of Earners in Prestonsburg
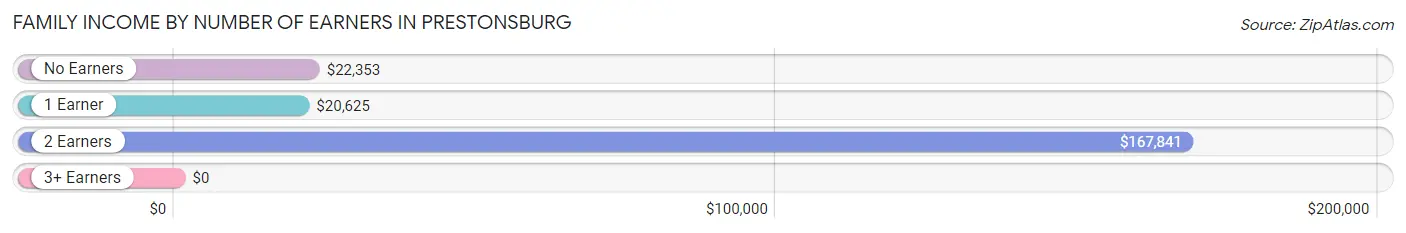
| Number of Earners | # Families | Median Income |
| No Earners | 262 (28.6%) | $22,353 |
| 1 Earner | 414 (45.3%) | $20,625 |
| 2 Earners | 209 (22.8%) | $167,841 |
| 3+ Earners | 30 (3.3%) | $0 |
| Total | 915 (100.0%) | $30,170 |
Household Income in Prestonsburg
Household Income Brackets in Prestonsburg
With 243 households falling in the category, the $25,000 to $34,999 income range is the most frequent in Prestonsburg, accounting for 17.4% of all households. In contrast, only 34 households (2.4%) fall into the $200,000+ income bracket, making it the least populous group.
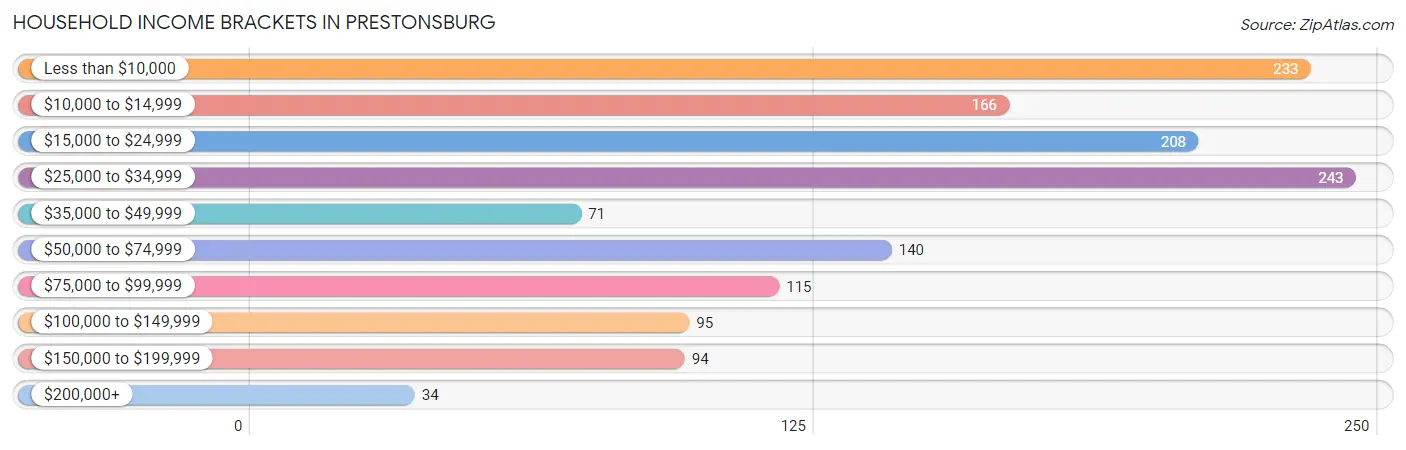
| Income Bracket | # Households | % Households |
| Less than $10,000 | 233 | 16.7% |
| $10,000 to $14,999 | 166 | 11.9% |
| $15,000 to $24,999 | 208 | 14.9% |
| $25,000 to $34,999 | 243 | 17.4% |
| $35,000 to $49,999 | 71 | 5.1% |
| $50,000 to $74,999 | 140 | 10.0% |
| $75,000 to $99,999 | 115 | 8.2% |
| $100,000 to $149,999 | 95 | 6.8% |
| $150,000 to $199,999 | 94 | 6.7% |
| $200,000+ | 34 | 2.4% |
Household Income by Householder Age in Prestonsburg
The median household income in Prestonsburg is $27,099, with the highest median household income of $32,168 found in the 65+ years age bracket for the primary householder. A total of 491 households (35.1%) fall into this category. Meanwhile, the 25 to 44 years age bracket for the primary householder has the lowest median household income of $0, with 377 households (27.0%) in this group.
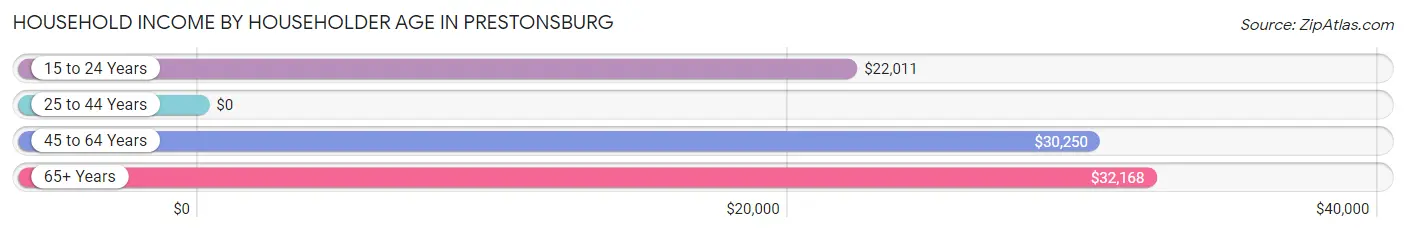
| Income Bracket | # Households | Median Income |
| 15 to 24 Years | 163 (11.7%) | $22,011 |
| 25 to 44 Years | 377 (27.0%) | $0 |
| 45 to 64 Years | 366 (26.2%) | $30,250 |
| 65+ Years | 491 (35.1%) | $32,168 |
| Total | 1,397 (100.0%) | $27,099 |
Poverty in Prestonsburg
Income Below Poverty by Sex and Age in Prestonsburg
With 44.8% poverty level for males and 48.9% for females among the residents of Prestonsburg, 5 year old males and 6 to 11 year old females are the most vulnerable to poverty, with 30 males (85.7%) and 256 females (94.5%) in their respective age groups living below the poverty level.
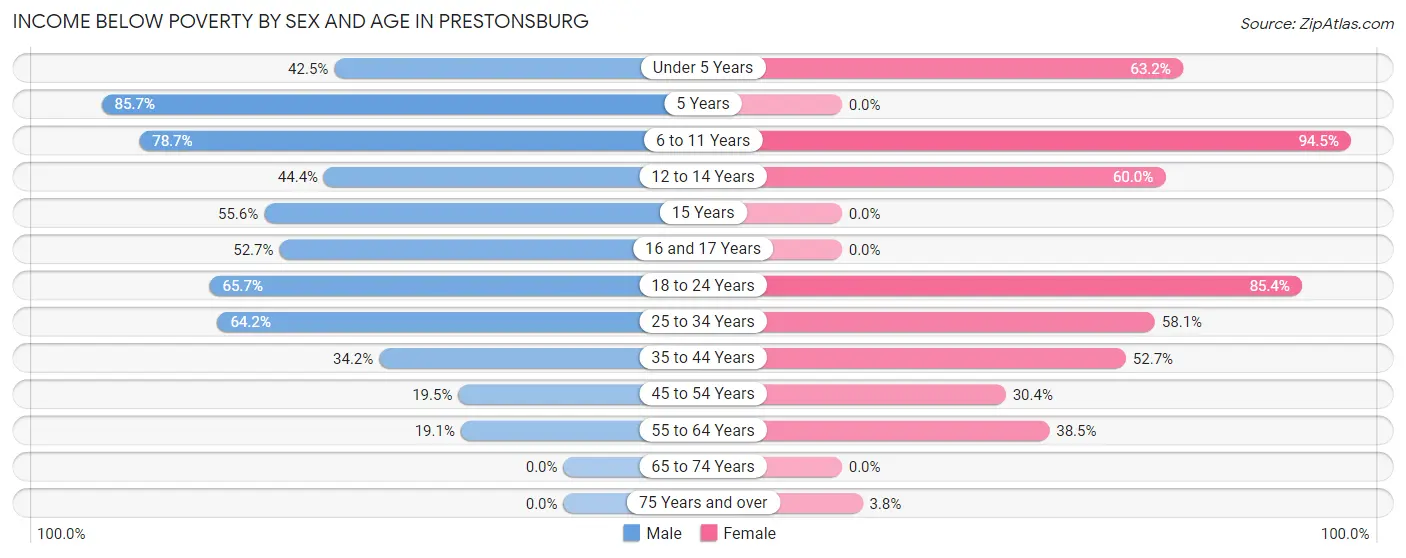
| Age Bracket | Male | Female |
| Under 5 Years | 77 (42.5%) | 43 (63.2%) |
| 5 Years | 30 (85.7%) | 0 (0.0%) |
| 6 to 11 Years | 159 (78.7%) | 256 (94.5%) |
| 12 to 14 Years | 16 (44.4%) | 36 (60.0%) |
| 15 Years | 25 (55.6%) | 0 (0.0%) |
| 16 and 17 Years | 29 (52.7%) | 0 (0.0%) |
| 18 to 24 Years | 241 (65.7%) | 204 (85.4%) |
| 25 to 34 Years | 138 (64.2%) | 111 (58.1%) |
| 35 to 44 Years | 79 (34.2%) | 87 (52.7%) |
| 45 to 54 Years | 32 (19.5%) | 42 (30.4%) |
| 55 to 64 Years | 16 (19.1%) | 52 (38.5%) |
| 65 to 74 Years | 0 (0.0%) | 0 (0.0%) |
| 75 Years and over | 0 (0.0%) | 8 (3.8%) |
| Total | 842 (44.8%) | 839 (48.9%) |
Income Above Poverty by Sex and Age in Prestonsburg
According to the poverty statistics in Prestonsburg, males aged 65 to 74 years and females aged 5 years are the age groups that are most secure financially, with 100.0% of males and 100.0% of females in these age groups living above the poverty line.
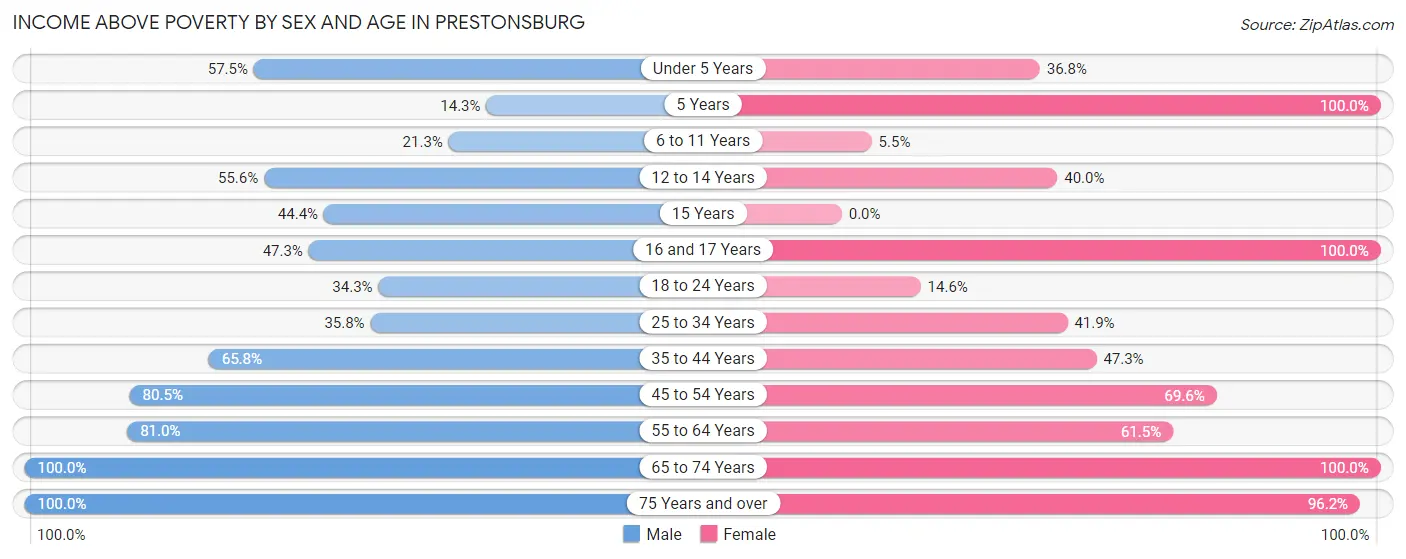
| Age Bracket | Male | Female |
| Under 5 Years | 104 (57.5%) | 25 (36.8%) |
| 5 Years | 5 (14.3%) | 8 (100.0%) |
| 6 to 11 Years | 43 (21.3%) | 15 (5.5%) |
| 12 to 14 Years | 20 (55.6%) | 24 (40.0%) |
| 15 Years | 20 (44.4%) | 0 (0.0%) |
| 16 and 17 Years | 26 (47.3%) | 16 (100.0%) |
| 18 to 24 Years | 126 (34.3%) | 35 (14.6%) |
| 25 to 34 Years | 77 (35.8%) | 80 (41.9%) |
| 35 to 44 Years | 152 (65.8%) | 78 (47.3%) |
| 45 to 54 Years | 132 (80.5%) | 96 (69.6%) |
| 55 to 64 Years | 68 (80.9%) | 83 (61.5%) |
| 65 to 74 Years | 224 (100.0%) | 217 (100.0%) |
| 75 Years and over | 41 (100.0%) | 201 (96.2%) |
| Total | 1,038 (55.2%) | 878 (51.1%) |
Income Below Poverty Among Married-Couple Families in Prestonsburg
The poverty statistics for married-couple families in Prestonsburg show that 20.8% or 118 of the total 568 families live below the poverty line. Families with 3 or 4 children have the highest poverty rate of 73.7%, comprising of 42 families. On the other hand, families with 1 or 2 children have the lowest poverty rate of 0.0%, which includes 0 families.
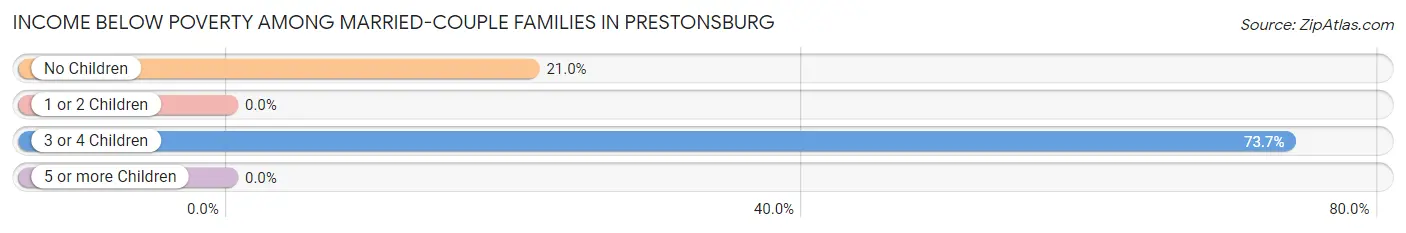
| Children | Above Poverty | Below Poverty |
| No Children | 286 (79.0%) | 76 (21.0%) |
| 1 or 2 Children | 149 (100.0%) | 0 (0.0%) |
| 3 or 4 Children | 15 (26.3%) | 42 (73.7%) |
| 5 or more Children | 0 (0.0%) | 0 (0.0%) |
| Total | 450 (79.2%) | 118 (20.8%) |
Income Below Poverty Among Single-Parent Households in Prestonsburg
According to the poverty data in Prestonsburg, 35.3% or 30 single-father households and 81.3% or 213 single-mother households are living below the poverty line. Among single-father households, those with 1 or 2 children have the highest poverty rate, with 30 households (40.0%) experiencing poverty. Likewise, among single-mother households, those with 3 or 4 children have the highest poverty rate, with 28 households (100.0%) falling below the poverty line.
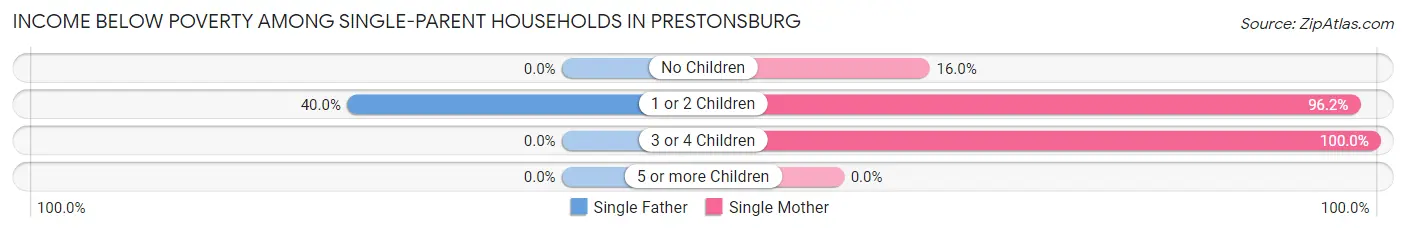
| Children | Single Father | Single Mother |
| No Children | 0 (0.0%) | 8 (16.0%) |
| 1 or 2 Children | 30 (40.0%) | 177 (96.2%) |
| 3 or 4 Children | 0 (0.0%) | 28 (100.0%) |
| 5 or more Children | 0 (0.0%) | 0 (0.0%) |
| Total | 30 (35.3%) | 213 (81.3%) |
Income Below Poverty Among Married-Couple vs Single-Parent Households in Prestonsburg
The poverty data for Prestonsburg shows that 118 of the married-couple family households (20.8%) and 243 of the single-parent households (70.0%) are living below the poverty level. Within the married-couple family households, those with 3 or 4 children have the highest poverty rate, with 42 households (73.7%) falling below the poverty line. Among the single-parent households, those with 3 or 4 children have the highest poverty rate, with 28 household (100.0%) living below poverty.
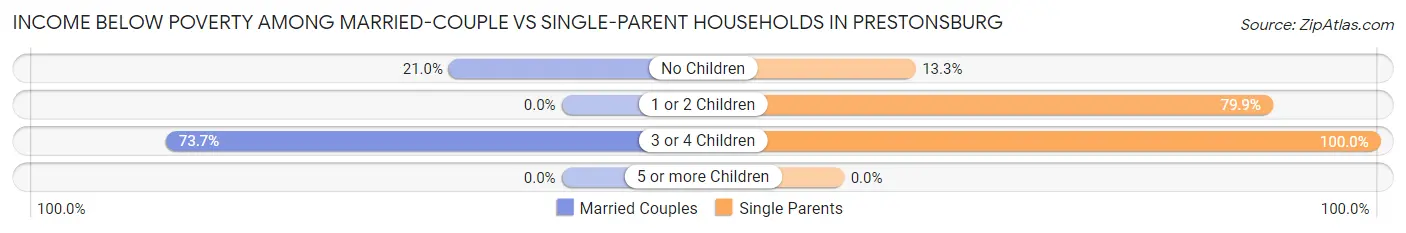
| Children | Married-Couple Families | Single-Parent Households |
| No Children | 76 (21.0%) | 8 (13.3%) |
| 1 or 2 Children | 0 (0.0%) | 207 (79.9%) |
| 3 or 4 Children | 42 (73.7%) | 28 (100.0%) |
| 5 or more Children | 0 (0.0%) | 0 (0.0%) |
| Total | 118 (20.8%) | 243 (70.0%) |
Race in Prestonsburg
The most populous races in Prestonsburg are White / Caucasian (3,521 | 91.0%), Two or more Races (198 | 5.1%), and Black / African American (117 | 3.0%).
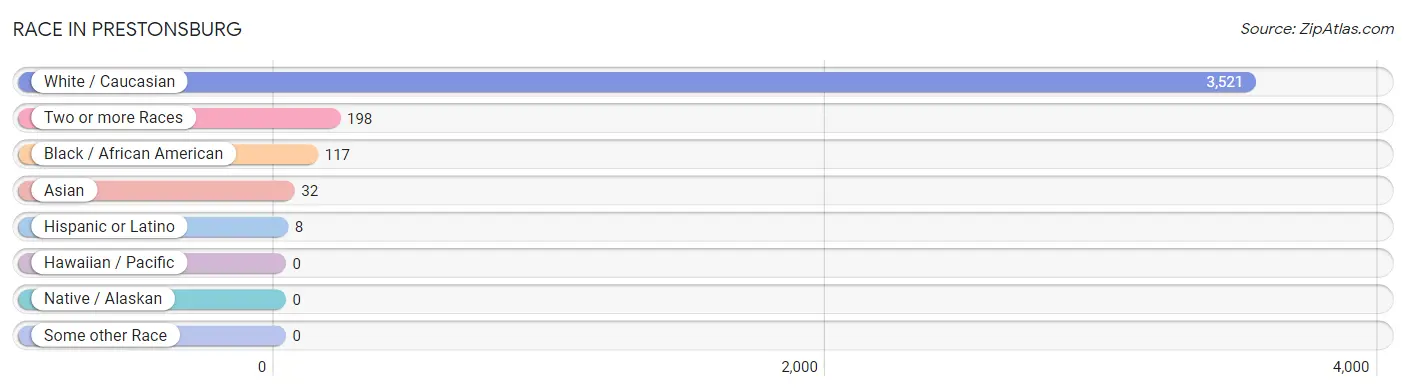
| Race | # Population | % Population |
| Asian | 32 | 0.8% |
| Black / African American | 117 | 3.0% |
| Hawaiian / Pacific | 0 | 0.0% |
| Hispanic or Latino | 8 | 0.2% |
| Native / Alaskan | 0 | 0.0% |
| White / Caucasian | 3,521 | 91.0% |
| Two or more Races | 198 | 5.1% |
| Some other Race | 0 | 0.0% |
| Total | 3,868 | 100.0% |
Ancestry in Prestonsburg
The most populous ancestries reported in Prestonsburg are American (689 | 17.8%), Irish (445 | 11.5%), English (427 | 11.0%), German (332 | 8.6%), and Scottish (97 | 2.5%), together accounting for 51.4% of all Prestonsburg residents.
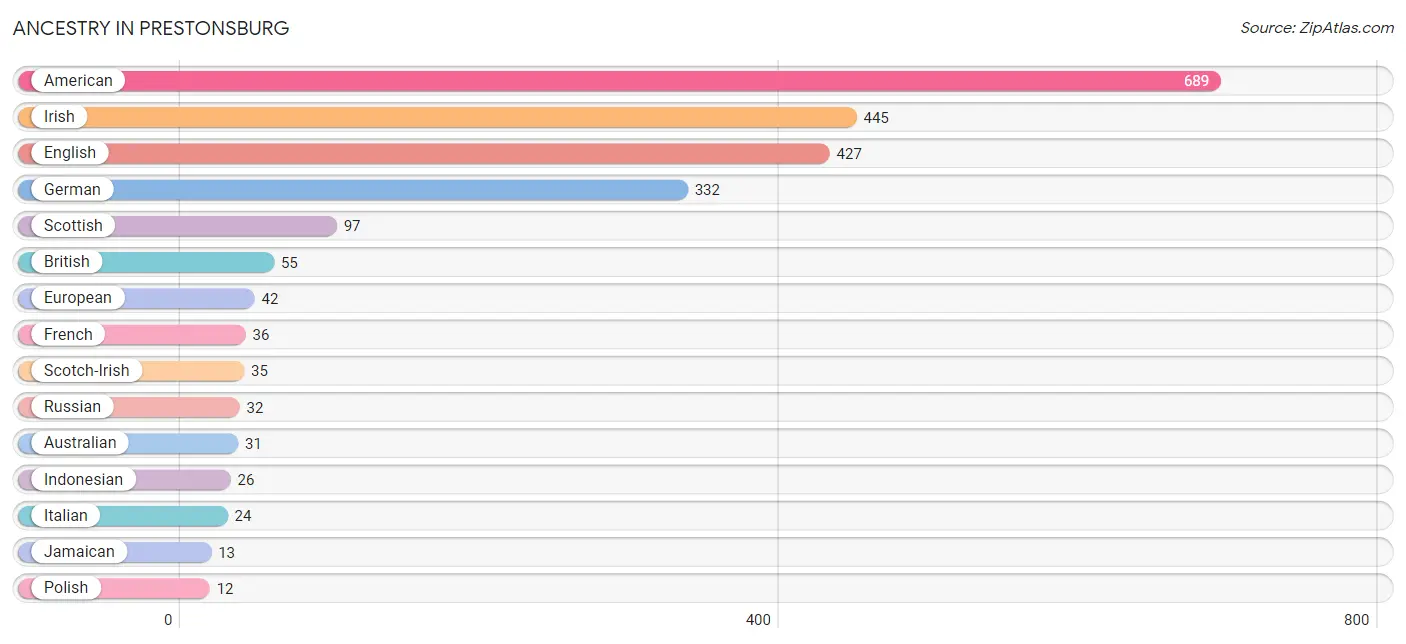
| Ancestry | # Population | % Population |
| American | 689 | 17.8% |
| Australian | 31 | 0.8% |
| British | 55 | 1.4% |
| Cherokee | 4 | 0.1% |
| English | 427 | 11.0% |
| European | 42 | 1.1% |
| French | 36 | 0.9% |
| German | 332 | 8.6% |
| Indian (Asian) | 6 | 0.2% |
| Indonesian | 26 | 0.7% |
| Irish | 445 | 11.5% |
| Italian | 24 | 0.6% |
| Jamaican | 13 | 0.3% |
| Polish | 12 | 0.3% |
| Puerto Rican | 8 | 0.2% |
| Russian | 32 | 0.8% |
| Scandinavian | 12 | 0.3% |
| Scotch-Irish | 35 | 0.9% |
| Scottish | 97 | 2.5% |
| Welsh | 10 | 0.3% | View All 20 Rows |
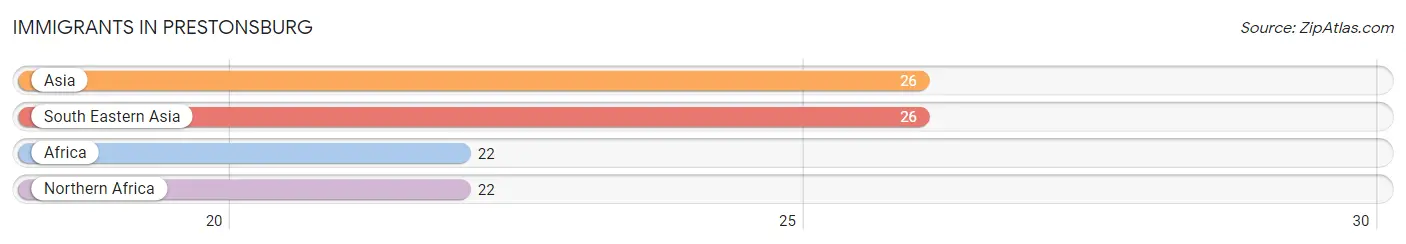
Immigrants in Prestonsburg
The most numerous immigrant groups reported in Prestonsburg came from Asia (26 | 0.7%), South Eastern Asia (26 | 0.7%), Africa (22 | 0.6%), and Northern Africa (22 | 0.6%), together accounting for 2.5% of all Prestonsburg residents.
| Immigration Origin | # Population | % Population |
| Africa | 22 | 0.6% |
| Asia | 26 | 0.7% |
| Northern Africa | 22 | 0.6% |
| South Eastern Asia | 26 | 0.7% | View All 4 Rows |
Sex and Age in Prestonsburg
Sex and Age in Prestonsburg
The most populous age groups in Prestonsburg are 15 to 19 Years (269 | 13.3%) for men and 5 to 9 Years (246 | 13.4%) for women.
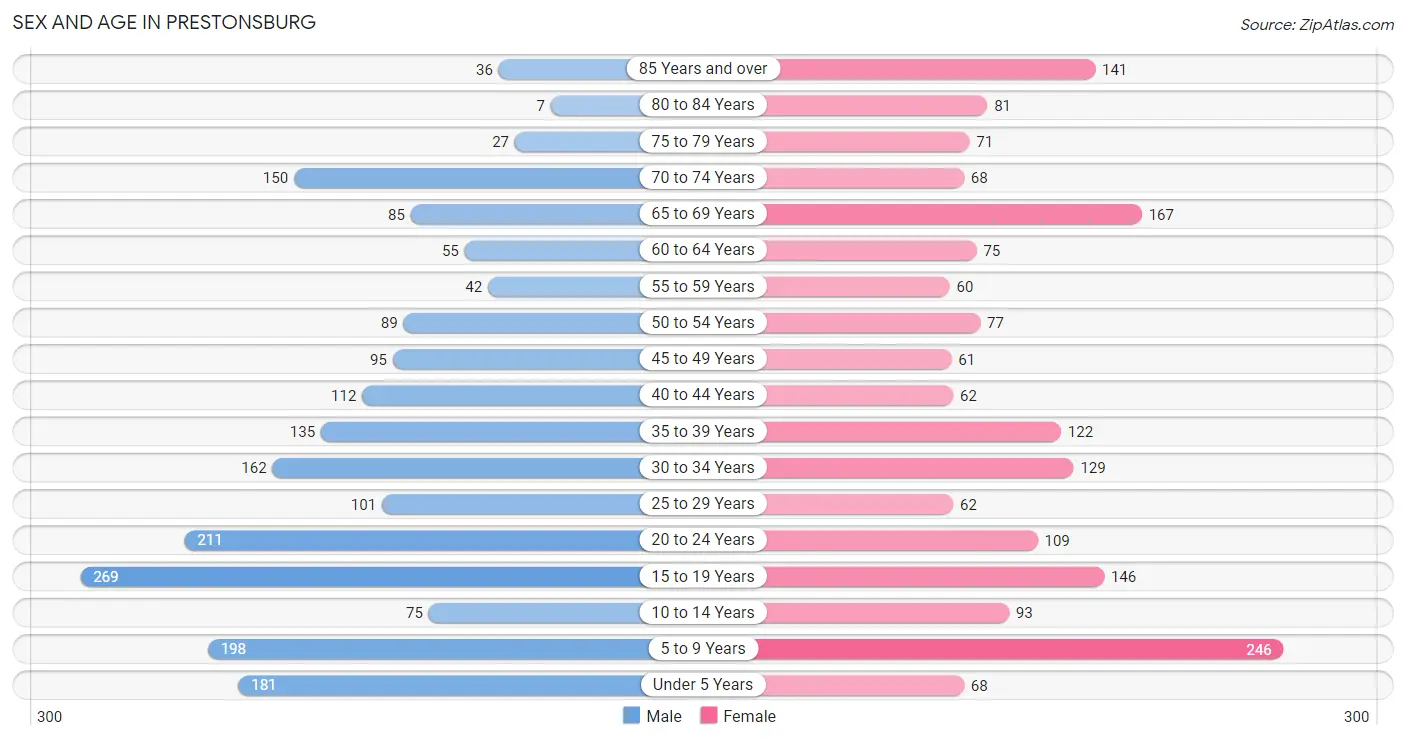
| Age Bracket | Male | Female |
| Under 5 Years | 181 (8.9%) | 68 (3.7%) |
| 5 to 9 Years | 198 (9.8%) | 246 (13.4%) |
| 10 to 14 Years | 75 (3.7%) | 93 (5.1%) |
| 15 to 19 Years | 269 (13.3%) | 146 (7.9%) |
| 20 to 24 Years | 211 (10.4%) | 109 (5.9%) |
| 25 to 29 Years | 101 (5.0%) | 62 (3.4%) |
| 30 to 34 Years | 162 (8.0%) | 129 (7.0%) |
| 35 to 39 Years | 135 (6.7%) | 122 (6.6%) |
| 40 to 44 Years | 112 (5.5%) | 62 (3.4%) |
| 45 to 49 Years | 95 (4.7%) | 61 (3.3%) |
| 50 to 54 Years | 89 (4.4%) | 77 (4.2%) |
| 55 to 59 Years | 42 (2.1%) | 60 (3.3%) |
| 60 to 64 Years | 55 (2.7%) | 75 (4.1%) |
| 65 to 69 Years | 85 (4.2%) | 167 (9.1%) |
| 70 to 74 Years | 150 (7.4%) | 68 (3.7%) |
| 75 to 79 Years | 27 (1.3%) | 71 (3.9%) |
| 80 to 84 Years | 7 (0.3%) | 81 (4.4%) |
| 85 Years and over | 36 (1.8%) | 141 (7.7%) |
| Total | 2,030 (100.0%) | 1,838 (100.0%) |
Families and Households in Prestonsburg
Median Family Size in Prestonsburg
The median family size in Prestonsburg is 2.82 persons per family, with single male/father families (85 | 9.3%) accounting for the largest median family size of 3.58 persons per family. On the other hand, married-couple families (568 | 62.1%) represent the smallest median family size with 2.71 persons per family.
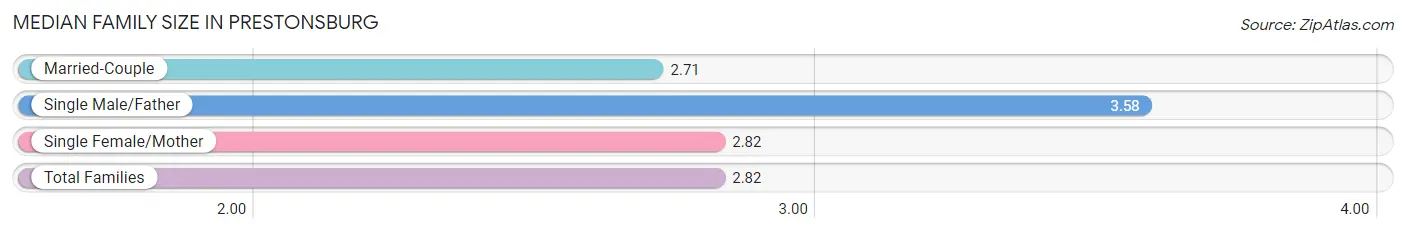
| Family Type | # Families | Family Size |
| Married-Couple | 568 (62.1%) | 2.71 |
| Single Male/Father | 85 (9.3%) | 3.58 |
| Single Female/Mother | 262 (28.6%) | 2.82 |
| Total Families | 915 (100.0%) | 2.82 |
Median Household Size in Prestonsburg
The median household size in Prestonsburg is 2.35 persons per household, with single male/father households (85 | 6.1%) accounting for the largest median household size of 4 persons per household. non-family households (482 | 34.5%) represent the smallest median household size with 1.06 persons per household.
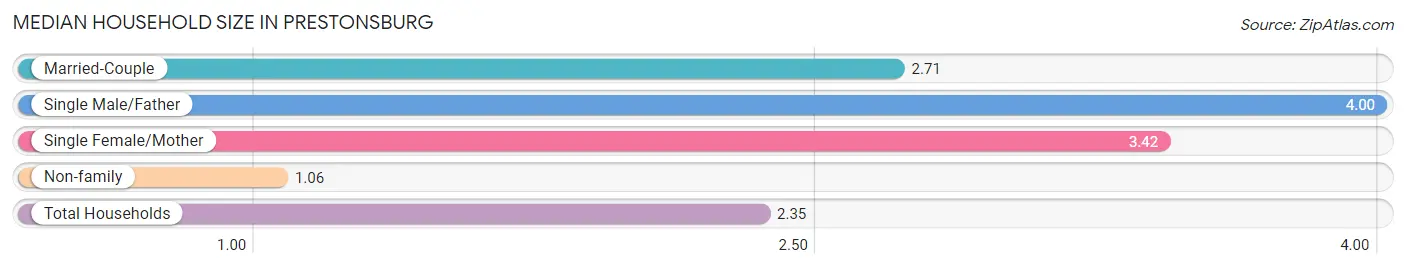
| Household Type | # Households | Household Size |
| Married-Couple | 568 (40.7%) | 2.71 |
| Single Male/Father | 85 (6.1%) | 4.00 |
| Single Female/Mother | 262 (18.8%) | 3.42 |
| Non-family | 482 (34.5%) | 1.06 |
| Total Households | 1,397 (100.0%) | 2.35 |
Household Size by Marriage Status in Prestonsburg
Out of a total of 1,397 households in Prestonsburg, 915 (65.5%) are family households, while 482 (34.5%) are nonfamily households. The most numerous type of family households are 2-person households, comprising 402, and the most common type of nonfamily households are 1-person households, comprising 449.
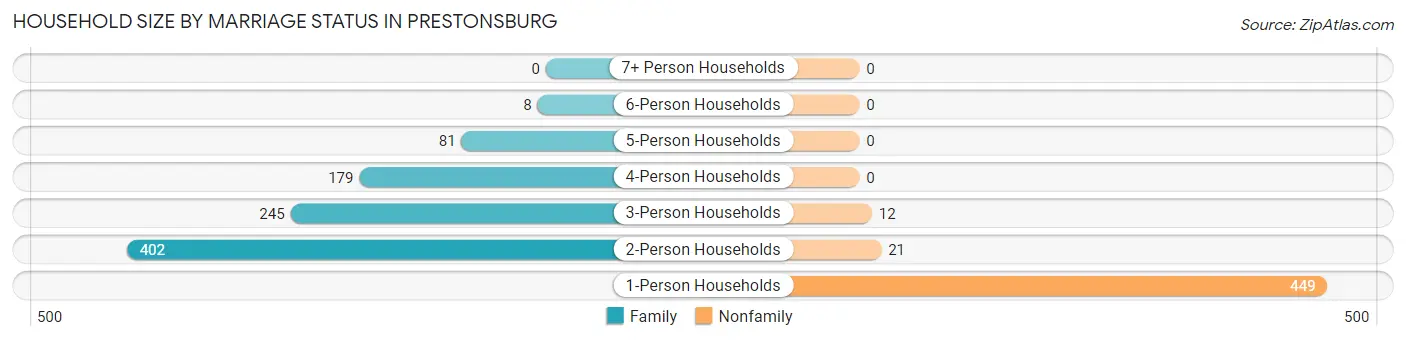
| Household Size | Family Households | Nonfamily Households |
| 1-Person Households | - | 449 (32.1%) |
| 2-Person Households | 402 (28.8%) | 21 (1.5%) |
| 3-Person Households | 245 (17.5%) | 12 (0.9%) |
| 4-Person Households | 179 (12.8%) | 0 (0.0%) |
| 5-Person Households | 81 (5.8%) | 0 (0.0%) |
| 6-Person Households | 8 (0.6%) | 0 (0.0%) |
| 7+ Person Households | 0 (0.0%) | 0 (0.0%) |
| Total | 915 (65.5%) | 482 (34.5%) |
Female Fertility in Prestonsburg
Fertility by Age in Prestonsburg
Average fertility rate in Prestonsburg is 72.0 births per 1,000 women. Women in the age bracket of 20 to 34 years have the highest fertility rate with 167.0 births per 1,000 women. Women in the age bracket of 20 to 34 years acount for 100.0% of all women with births.
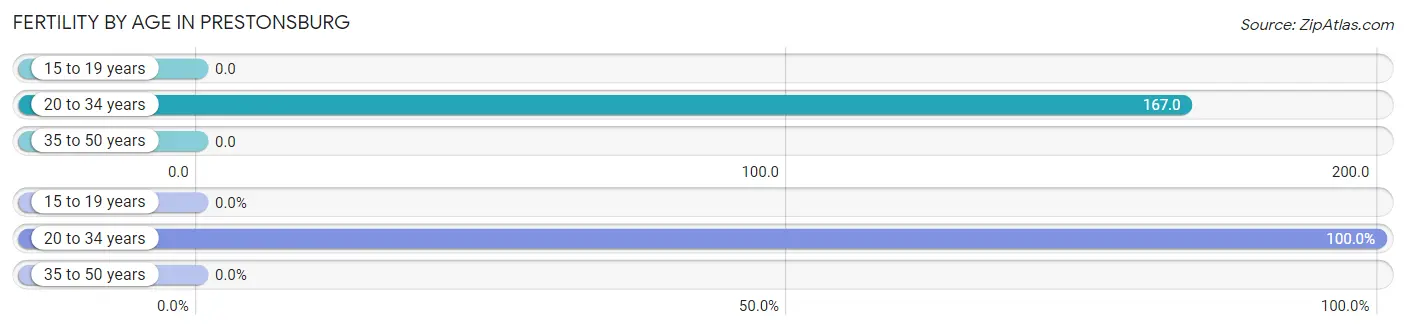
| Age Bracket | Women with Births | Births / 1,000 Women |
| 15 to 19 years | 0 (0.0%) | 0.0 |
| 20 to 34 years | 50 (100.0%) | 167.0 |
| 35 to 50 years | 0 (0.0%) | 0.0 |
| Total | 50 (100.0%) | 72.0 |
Fertility by Age by Marriage Status in Prestonsburg
16.0% of women with births (50) in Prestonsburg are married. The highest percentage of unmarried women with births falls into 20 to 34 years age bracket with 84.0% of them unmarried at the time of birth, while the lowest percentage of unmarried women with births belong to 20 to 34 years age bracket with 84.0% of them unmarried.
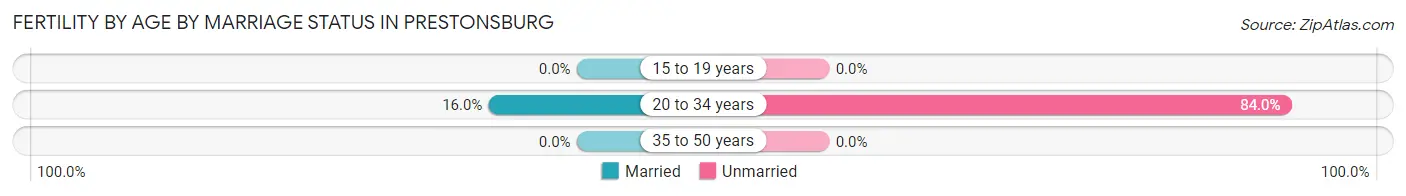
| Age Bracket | Married | Unmarried |
| 15 to 19 years | 0 (0.0%) | 0 (0.0%) |
| 20 to 34 years | 8 (16.0%) | 42 (84.0%) |
| 35 to 50 years | 0 (0.0%) | 0 (0.0%) |
| Total | 8 (16.0%) | 42 (84.0%) |
Fertility by Education in Prestonsburg
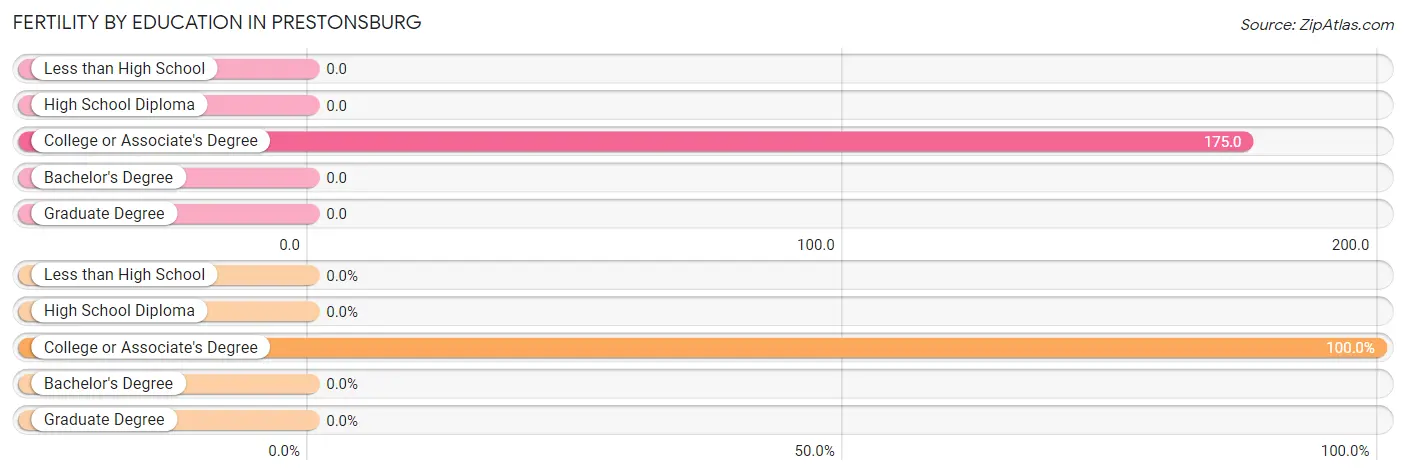
| Educational Attainment | Women with Births | Births / 1,000 Women |
| Less than High School | 0 (0.0%) | 0.0 |
| High School Diploma | 0 (0.0%) | 0.0 |
| College or Associate's Degree | 50 (100.0%) | 175.0 |
| Bachelor's Degree | 0 (0.0%) | 0.0 |
| Graduate Degree | 0 (0.0%) | 0.0 |
| Total | 50 (100.0%) | 72.0 |
Fertility by Education by Marriage Status in Prestonsburg
84.0% of women with births in Prestonsburg are unmarried. Women with the educational attainment of college or associate's degree are most likely to be married with 16.0% of them married at childbirth, while women with the educational attainment of college or associate's degree are least likely to be married with 84.0% of them unmarried at childbirth.
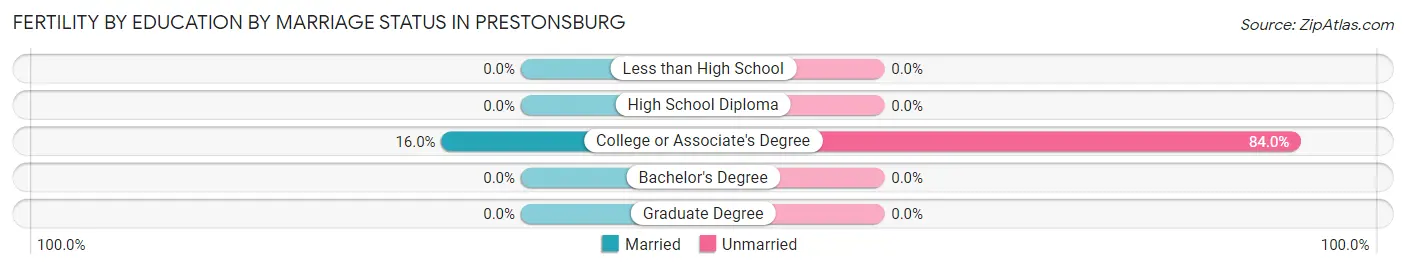
| Educational Attainment | Married | Unmarried |
| Less than High School | 0 (0.0%) | 0 (0.0%) |
| High School Diploma | 0 (0.0%) | 0 (0.0%) |
| College or Associate's Degree | 8 (16.0%) | 42 (84.0%) |
| Bachelor's Degree | 0 (0.0%) | 0 (0.0%) |
| Graduate Degree | 0 (0.0%) | 0 (0.0%) |
| Total | 8 (16.0%) | 42 (84.0%) |
Employment Characteristics in Prestonsburg
Employment by Class of Employer in Prestonsburg
Among the 1,034 employed individuals in Prestonsburg, private company employees (450 | 43.5%), not-for-profit organizations (192 | 18.6%), and self-employed (not incorporated) (101 | 9.8%) make up the most common classes of employment.
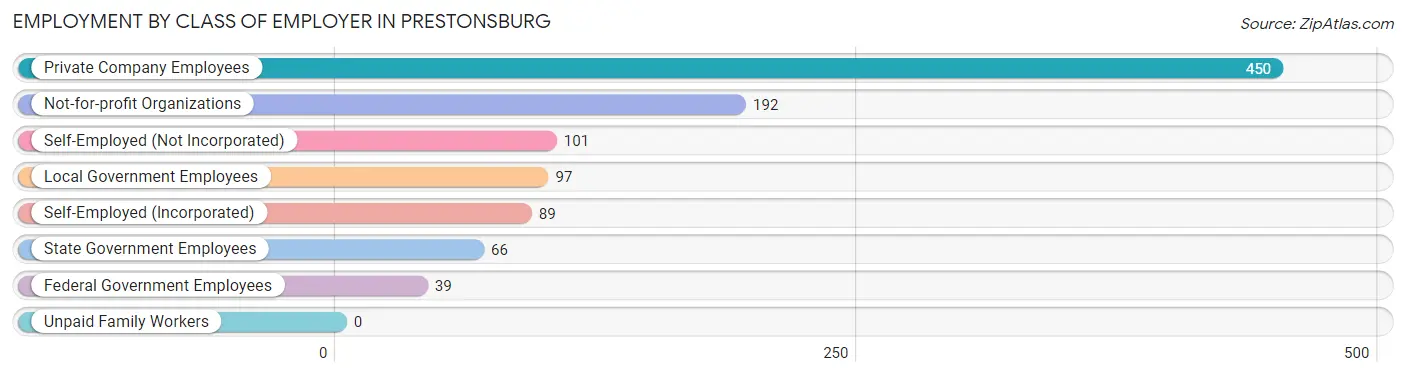
| Employer Class | # Employees | % Employees |
| Private Company Employees | 450 | 43.5% |
| Self-Employed (Incorporated) | 89 | 8.6% |
| Self-Employed (Not Incorporated) | 101 | 9.8% |
| Not-for-profit Organizations | 192 | 18.6% |
| Local Government Employees | 97 | 9.4% |
| State Government Employees | 66 | 6.4% |
| Federal Government Employees | 39 | 3.8% |
| Unpaid Family Workers | 0 | 0.0% |
| Total | 1,034 | 100.0% |
Employment Status by Age in Prestonsburg
According to the labor force statistics for Prestonsburg, out of the total population over 16 years of age (2,962), 42.1% or 1,247 individuals are in the labor force, with 14.8% or 185 of them unemployed. The age group with the highest labor force participation rate is 45 to 54 years, with 60.2% or 194 individuals in the labor force. Within the labor force, the 30 to 34 years age range has the highest percentage of unemployed individuals, with 51.0% or 80 of them being unemployed.
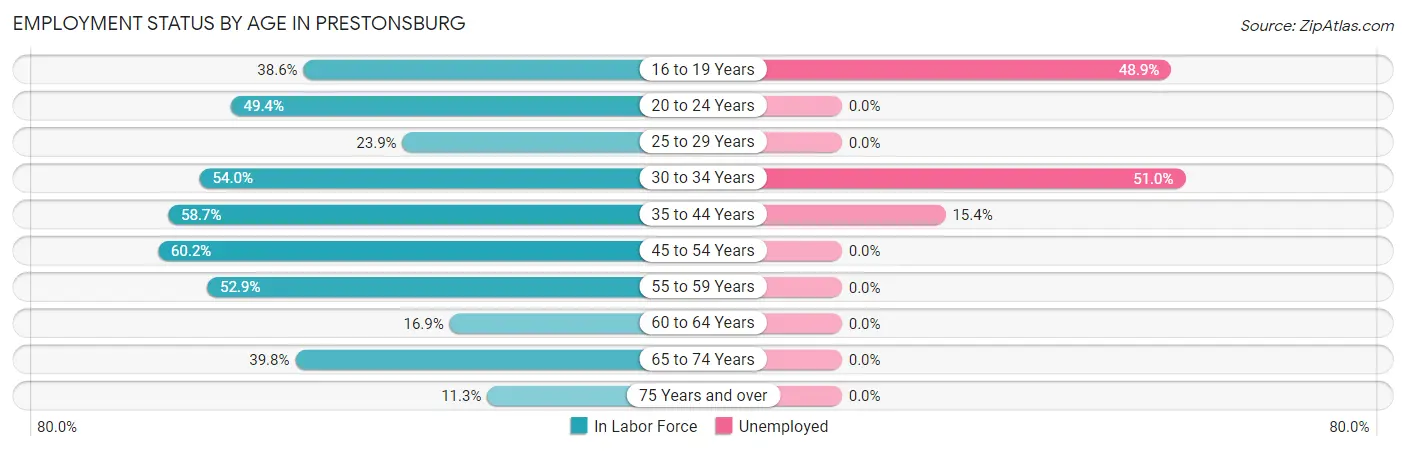
| Age Bracket | In Labor Force | Unemployed |
| 16 to 19 Years | 143 (38.6%) | 70 (48.9%) |
| 20 to 24 Years | 158 (49.4%) | 0 (0.0%) |
| 25 to 29 Years | 39 (23.9%) | 0 (0.0%) |
| 30 to 34 Years | 157 (54.0%) | 80 (51.0%) |
| 35 to 44 Years | 253 (58.7%) | 39 (15.4%) |
| 45 to 54 Years | 194 (60.2%) | 0 (0.0%) |
| 55 to 59 Years | 54 (52.9%) | 0 (0.0%) |
| 60 to 64 Years | 22 (16.9%) | 0 (0.0%) |
| 65 to 74 Years | 187 (39.8%) | 0 (0.0%) |
| 75 Years and over | 41 (11.3%) | 0 (0.0%) |
| Total | 1,247 (42.1%) | 185 (14.8%) |
Employment Status by Educational Attainment in Prestonsburg
According to labor force statistics for Prestonsburg, 50.0% of individuals (720) out of the total population between 25 and 64 years of age (1,439) are in the labor force, with 16.6% or 120 of them being unemployed. The group with the highest labor force participation rate are those with the educational attainment of bachelor's degree or higher, with 72.9% or 153 individuals in the labor force. Within the labor force, individuals with less than high school education have the highest percentage of unemployment, with 26.9% or 39 of them being unemployed.
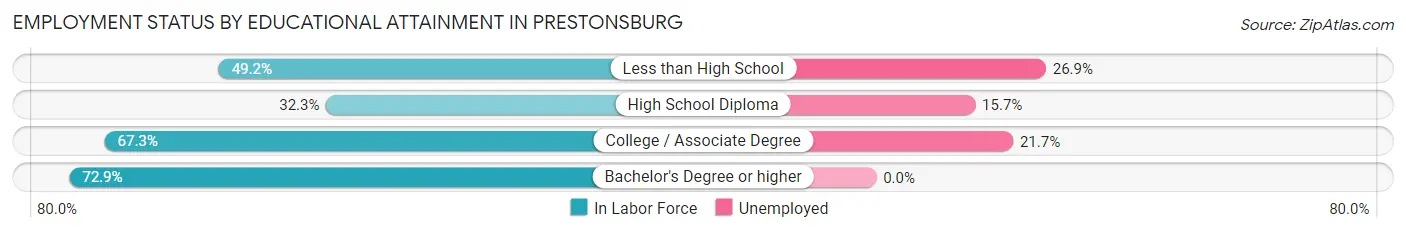
| Educational Attainment | In Labor Force | Unemployed |
| Less than High School | 145 (49.2%) | 79 (26.9%) |
| High School Diploma | 191 (32.3%) | 93 (15.7%) |
| College / Associate Degree | 230 (67.3%) | 74 (21.7%) |
| Bachelor's Degree or higher | 153 (72.9%) | 0 (0.0%) |
| Total | 720 (50.0%) | 239 (16.6%) |
Employment Occupations by Sex in Prestonsburg
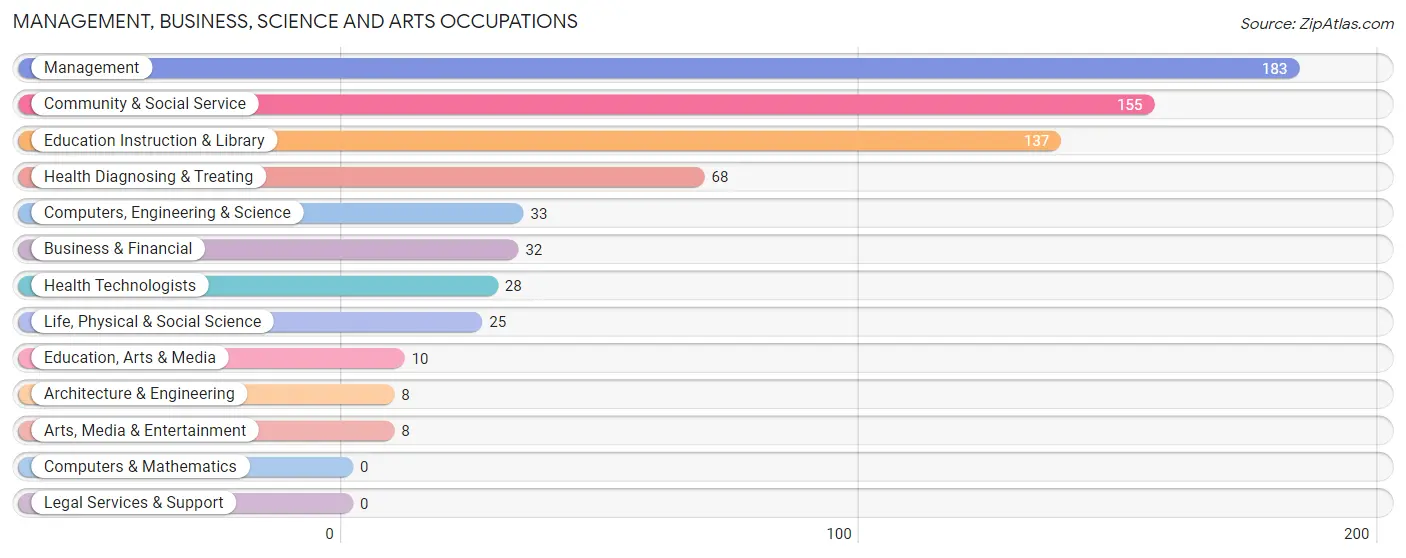
Management, Business, Science and Arts Occupations
The most common Management, Business, Science and Arts occupations in Prestonsburg are Management (183 | 17.4%), Community & Social Service (155 | 14.7%), Education Instruction & Library (137 | 13.0%), Health Diagnosing & Treating (68 | 6.5%), and Computers, Engineering & Science (33 | 3.1%).
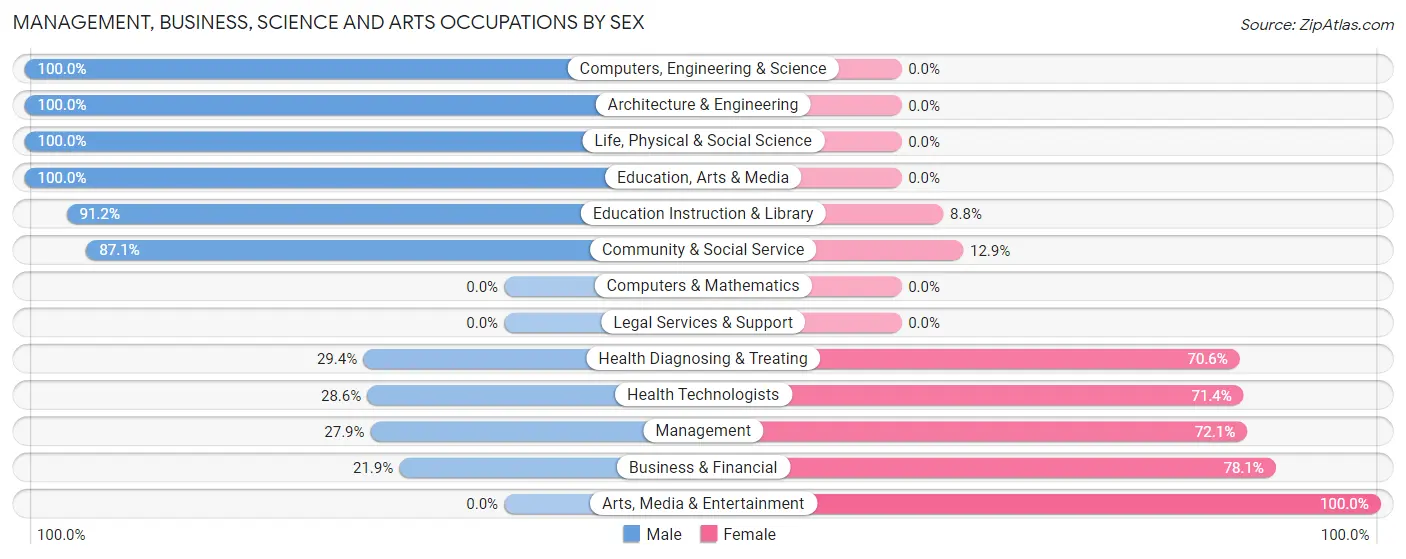
Management, Business, Science and Arts Occupations by Sex
Within the Management, Business, Science and Arts occupations in Prestonsburg, the most male-oriented occupations are Computers, Engineering & Science (100.0%), Architecture & Engineering (100.0%), and Life, Physical & Social Science (100.0%), while the most female-oriented occupations are Arts, Media & Entertainment (100.0%), Business & Financial (78.1%), and Management (72.1%).
| Occupation | Male | Female |
| Management | 51 (27.9%) | 132 (72.1%) |
| Business & Financial | 7 (21.9%) | 25 (78.1%) |
| Computers, Engineering & Science | 33 (100.0%) | 0 (0.0%) |
| Computers & Mathematics | 0 (0.0%) | 0 (0.0%) |
| Architecture & Engineering | 8 (100.0%) | 0 (0.0%) |
| Life, Physical & Social Science | 25 (100.0%) | 0 (0.0%) |
| Community & Social Service | 135 (87.1%) | 20 (12.9%) |
| Education, Arts & Media | 10 (100.0%) | 0 (0.0%) |
| Legal Services & Support | 0 (0.0%) | 0 (0.0%) |
| Education Instruction & Library | 125 (91.2%) | 12 (8.8%) |
| Arts, Media & Entertainment | 0 (0.0%) | 8 (100.0%) |
| Health Diagnosing & Treating | 20 (29.4%) | 48 (70.6%) |
| Health Technologists | 8 (28.6%) | 20 (71.4%) |
| Total (Category) | 246 (52.2%) | 225 (47.8%) |
| Total (Overall) | 590 (56.0%) | 463 (44.0%) |
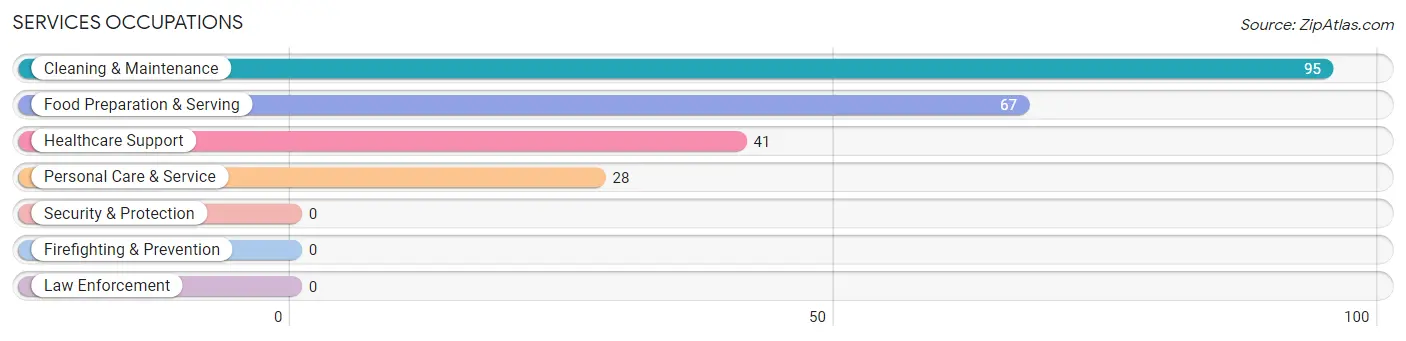
Services Occupations
The most common Services occupations in Prestonsburg are Cleaning & Maintenance (95 | 9.0%), Food Preparation & Serving (67 | 6.4%), Healthcare Support (41 | 3.9%), and Personal Care & Service (28 | 2.7%).
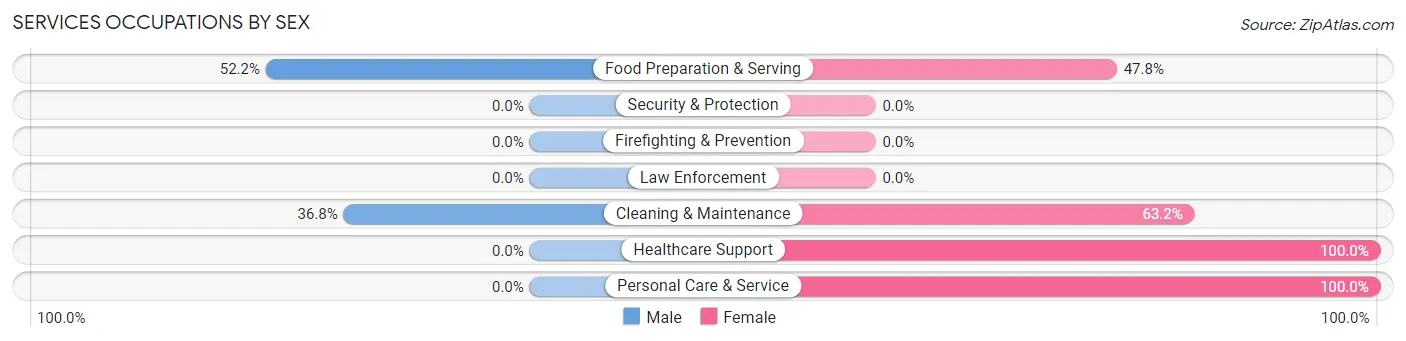
Services Occupations by Sex
Within the Services occupations in Prestonsburg, the most male-oriented occupations are Food Preparation & Serving (52.2%), and Cleaning & Maintenance (36.8%), while the most female-oriented occupations are Healthcare Support (100.0%), Personal Care & Service (100.0%), and Cleaning & Maintenance (63.2%).
| Occupation | Male | Female |
| Healthcare Support | 0 (0.0%) | 41 (100.0%) |
| Security & Protection | 0 (0.0%) | 0 (0.0%) |
| Firefighting & Prevention | 0 (0.0%) | 0 (0.0%) |
| Law Enforcement | 0 (0.0%) | 0 (0.0%) |
| Food Preparation & Serving | 35 (52.2%) | 32 (47.8%) |
| Cleaning & Maintenance | 35 (36.8%) | 60 (63.2%) |
| Personal Care & Service | 0 (0.0%) | 28 (100.0%) |
| Total (Category) | 70 (30.3%) | 161 (69.7%) |
| Total (Overall) | 590 (56.0%) | 463 (44.0%) |
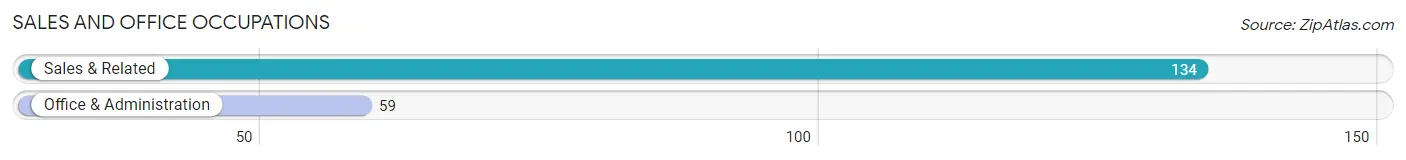
Sales and Office Occupations
The most common Sales and Office occupations in Prestonsburg are Sales & Related (134 | 12.7%), and Office & Administration (59 | 5.6%).
Sales and Office Occupations by Sex
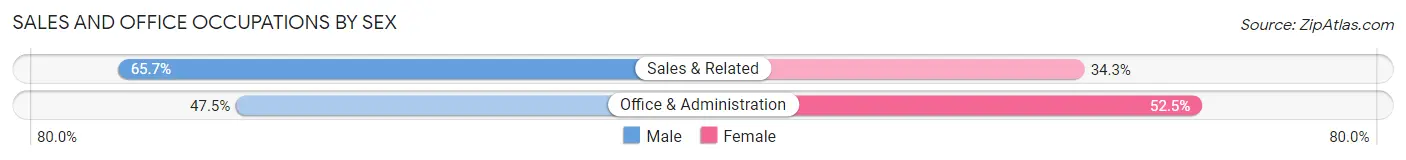
| Occupation | Male | Female |
| Sales & Related | 88 (65.7%) | 46 (34.3%) |
| Office & Administration | 28 (47.5%) | 31 (52.5%) |
| Total (Category) | 116 (60.1%) | 77 (39.9%) |
| Total (Overall) | 590 (56.0%) | 463 (44.0%) |
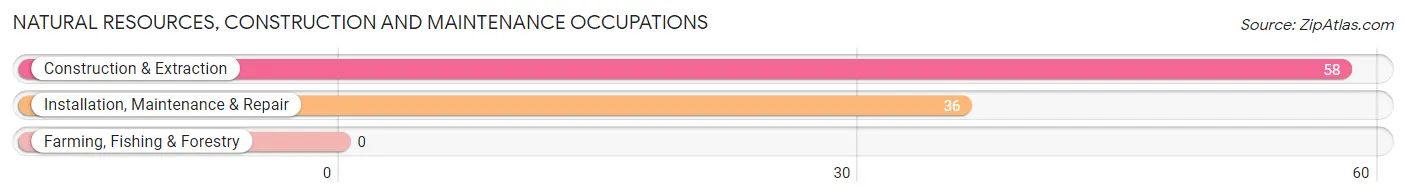
Natural Resources, Construction and Maintenance Occupations
The most common Natural Resources, Construction and Maintenance occupations in Prestonsburg are Construction & Extraction (58 | 5.5%), and Installation, Maintenance & Repair (36 | 3.4%).
Natural Resources, Construction and Maintenance Occupations by Sex
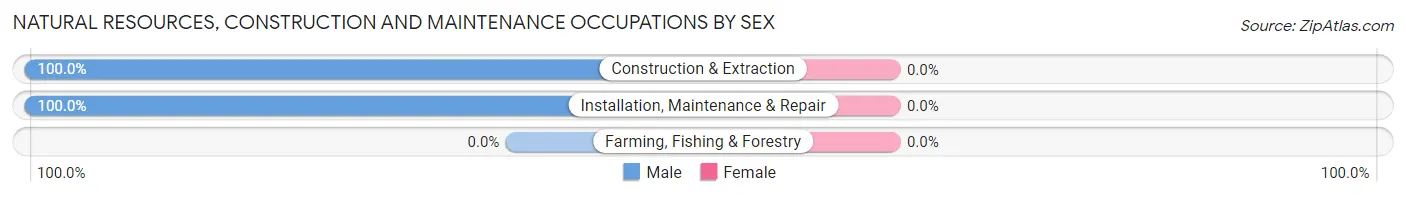
| Occupation | Male | Female |
| Farming, Fishing & Forestry | 0 (0.0%) | 0 (0.0%) |
| Construction & Extraction | 58 (100.0%) | 0 (0.0%) |
| Installation, Maintenance & Repair | 36 (100.0%) | 0 (0.0%) |
| Total (Category) | 94 (100.0%) | 0 (0.0%) |
| Total (Overall) | 590 (56.0%) | 463 (44.0%) |
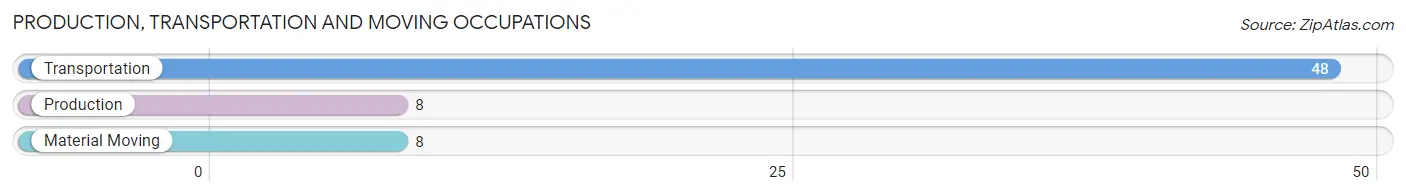
Production, Transportation and Moving Occupations
The most common Production, Transportation and Moving occupations in Prestonsburg are Transportation (48 | 4.6%), Production (8 | 0.8%), and Material Moving (8 | 0.8%).
Production, Transportation and Moving Occupations by Sex
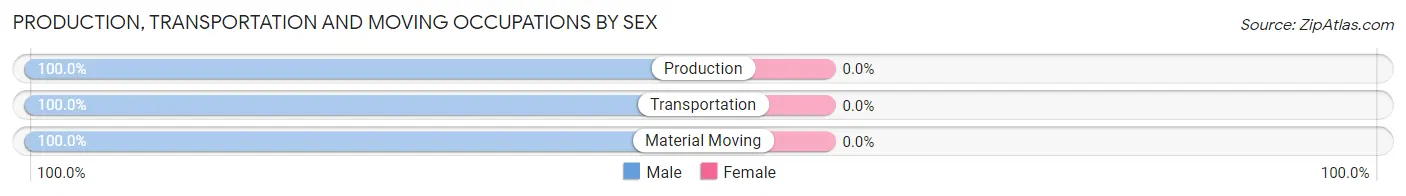
| Occupation | Male | Female |
| Production | 8 (100.0%) | 0 (0.0%) |
| Transportation | 48 (100.0%) | 0 (0.0%) |
| Material Moving | 8 (100.0%) | 0 (0.0%) |
| Total (Category) | 64 (100.0%) | 0 (0.0%) |
| Total (Overall) | 590 (56.0%) | 463 (44.0%) |
Employment Industries by Sex in Prestonsburg
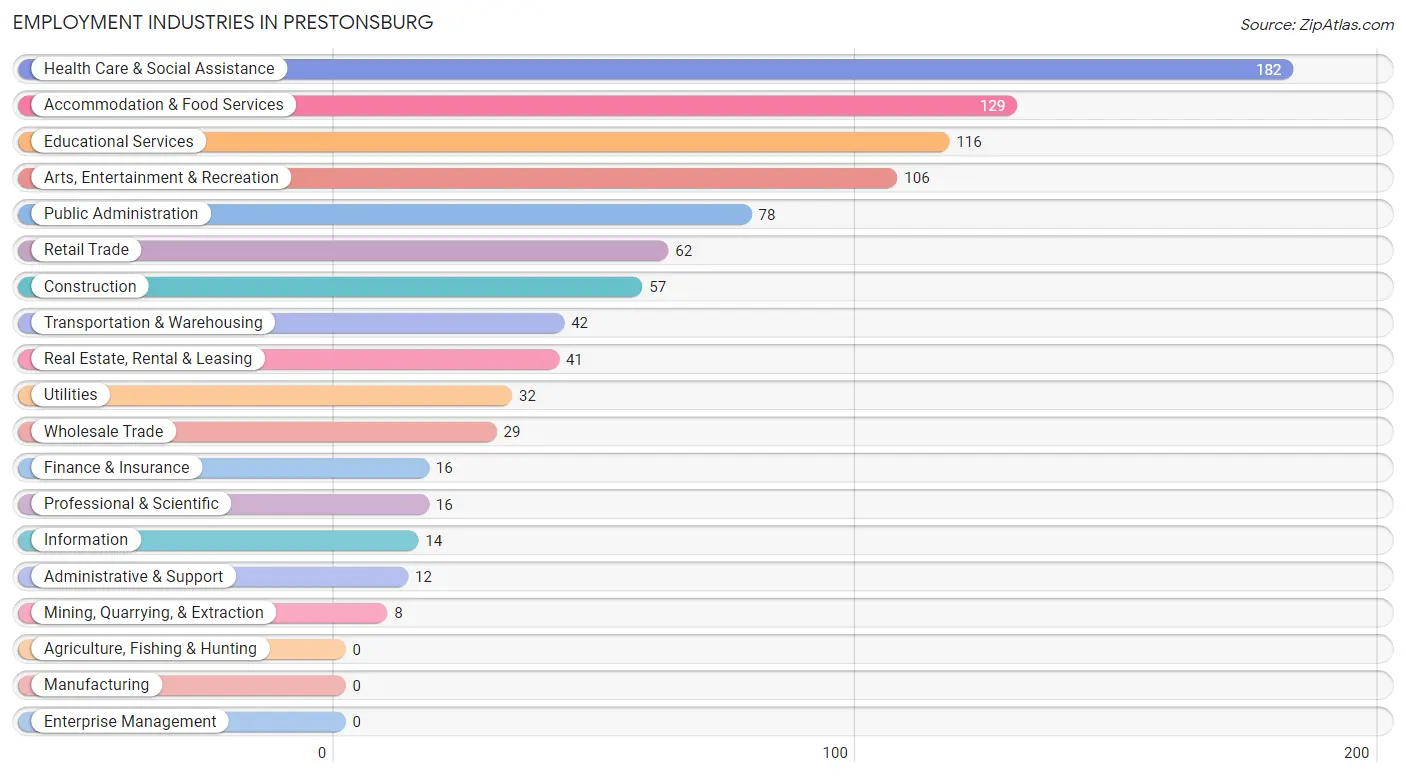
Employment Industries in Prestonsburg
The major employment industries in Prestonsburg include Health Care & Social Assistance (182 | 17.3%), Accommodation & Food Services (129 | 12.2%), Educational Services (116 | 11.0%), Arts, Entertainment & Recreation (106 | 10.1%), and Public Administration (78 | 7.4%).
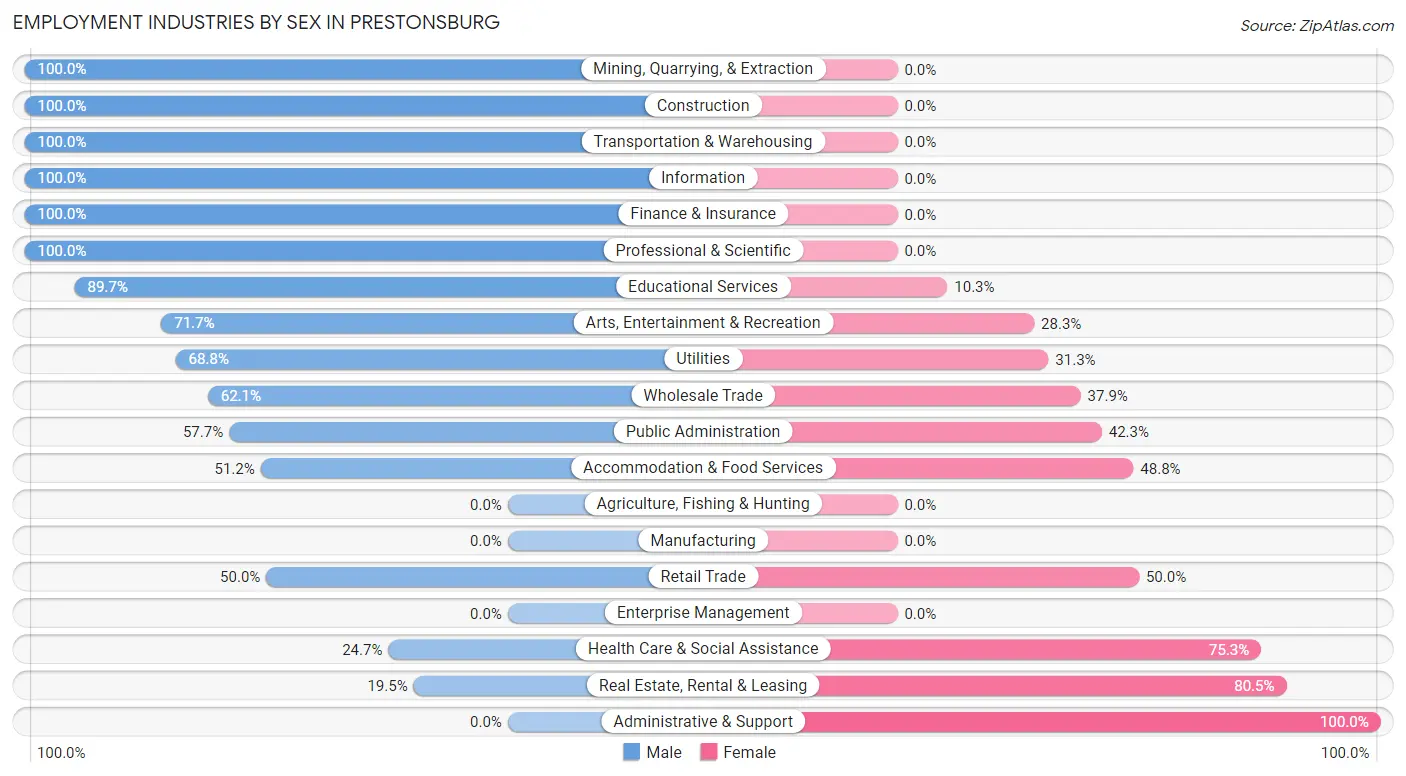
Employment Industries by Sex in Prestonsburg
The Prestonsburg industries that see more men than women are Mining, Quarrying, & Extraction (100.0%), Construction (100.0%), and Transportation & Warehousing (100.0%), whereas the industries that tend to have a higher number of women are Administrative & Support (100.0%), Real Estate, Rental & Leasing (80.5%), and Health Care & Social Assistance (75.3%).
| Industry | Male | Female |
| Agriculture, Fishing & Hunting | 0 (0.0%) | 0 (0.0%) |
| Mining, Quarrying, & Extraction | 8 (100.0%) | 0 (0.0%) |
| Construction | 57 (100.0%) | 0 (0.0%) |
| Manufacturing | 0 (0.0%) | 0 (0.0%) |
| Wholesale Trade | 18 (62.1%) | 11 (37.9%) |
| Retail Trade | 31 (50.0%) | 31 (50.0%) |
| Transportation & Warehousing | 42 (100.0%) | 0 (0.0%) |
| Utilities | 22 (68.8%) | 10 (31.2%) |
| Information | 14 (100.0%) | 0 (0.0%) |
| Finance & Insurance | 16 (100.0%) | 0 (0.0%) |
| Real Estate, Rental & Leasing | 8 (19.5%) | 33 (80.5%) |
| Professional & Scientific | 16 (100.0%) | 0 (0.0%) |
| Enterprise Management | 0 (0.0%) | 0 (0.0%) |
| Administrative & Support | 0 (0.0%) | 12 (100.0%) |
| Educational Services | 104 (89.7%) | 12 (10.3%) |
| Health Care & Social Assistance | 45 (24.7%) | 137 (75.3%) |
| Arts, Entertainment & Recreation | 76 (71.7%) | 30 (28.3%) |
| Accommodation & Food Services | 66 (51.2%) | 63 (48.8%) |
| Public Administration | 45 (57.7%) | 33 (42.3%) |
| Total | 590 (56.0%) | 463 (44.0%) |
Education in Prestonsburg
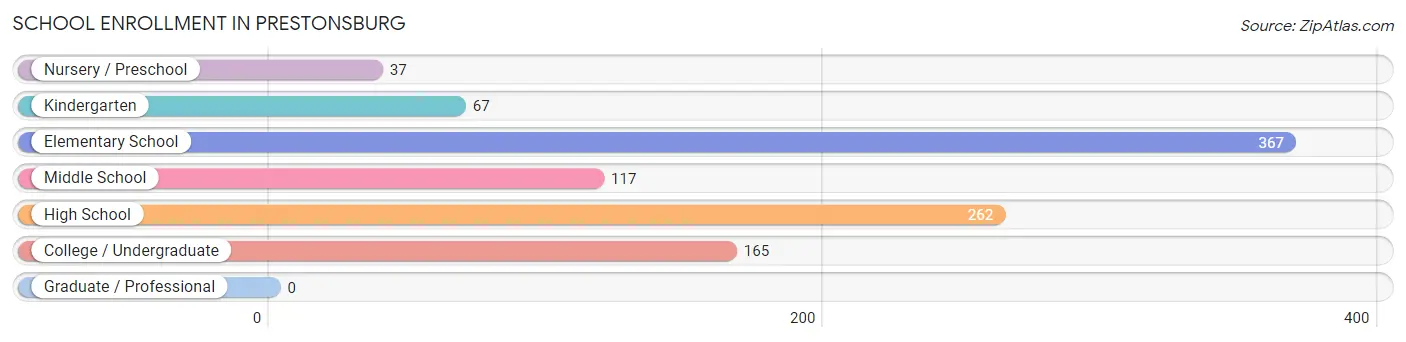
School Enrollment in Prestonsburg
The most common levels of schooling among the 1,015 students in Prestonsburg are elementary school (367 | 36.2%), high school (262 | 25.8%), and college / undergraduate (165 | 16.3%).
| School Level | # Students | % Students |
| Nursery / Preschool | 37 | 3.6% |
| Kindergarten | 67 | 6.6% |
| Elementary School | 367 | 36.2% |
| Middle School | 117 | 11.5% |
| High School | 262 | 25.8% |
| College / Undergraduate | 165 | 16.3% |
| Graduate / Professional | 0 | 0.0% |
| Total | 1,015 | 100.0% |
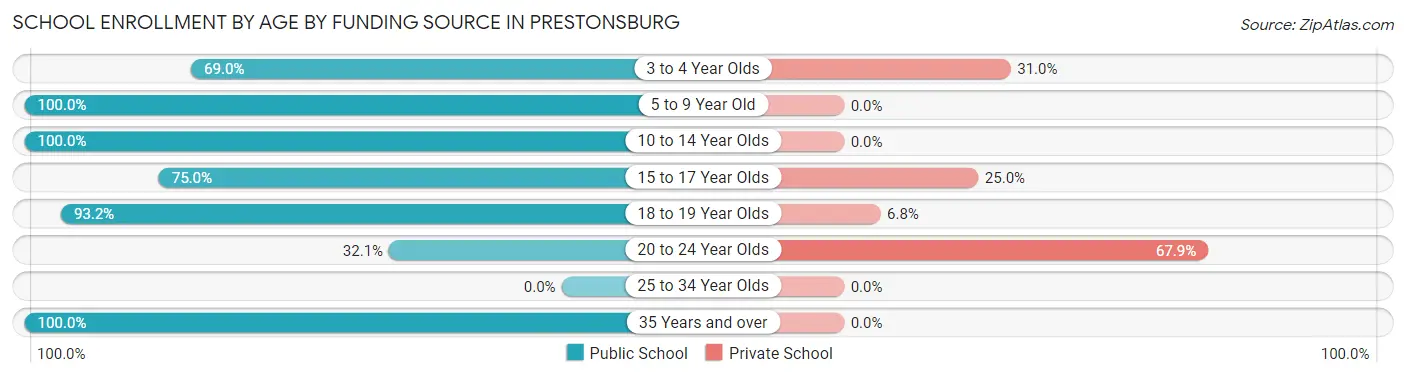
School Enrollment by Age by Funding Source in Prestonsburg
Out of a total of 1,015 students who are enrolled in schools in Prestonsburg, 107 (10.5%) attend a private institution, while the remaining 908 (89.5%) are enrolled in public schools. The age group of 20 to 24 year olds has the highest likelihood of being enrolled in private schools, with 57 (67.9% in the age bracket) enrolled. Conversely, the age group of 5 to 9 year old has the lowest likelihood of being enrolled in a private school, with 437 (100.0% in the age bracket) attending a public institution.
| Age Bracket | Public School | Private School |
| 3 to 4 Year Olds | 20 (69.0%) | 9 (31.0%) |
| 5 to 9 Year Old | 437 (100.0%) | 0 (0.0%) |
| 10 to 14 Year Olds | 162 (100.0%) | 0 (0.0%) |
| 15 to 17 Year Olds | 87 (75.0%) | 29 (25.0%) |
| 18 to 19 Year Olds | 165 (93.2%) | 12 (6.8%) |
| 20 to 24 Year Olds | 27 (32.1%) | 57 (67.9%) |
| 25 to 34 Year Olds | 0 (0.0%) | 0 (0.0%) |
| 35 Years and over | 10 (100.0%) | 0 (0.0%) |
| Total | 908 (89.5%) | 107 (10.5%) |
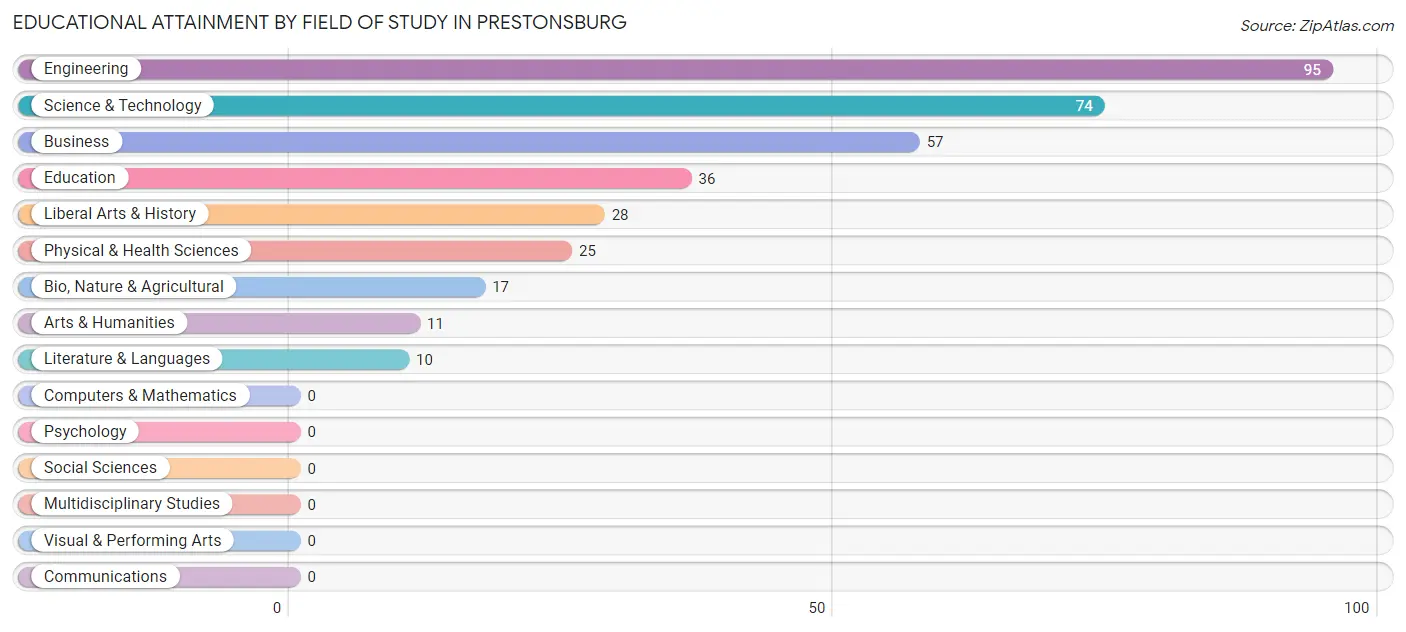
Educational Attainment by Field of Study in Prestonsburg
Engineering (95 | 26.9%), science & technology (74 | 21.0%), business (57 | 16.2%), education (36 | 10.2%), and liberal arts & history (28 | 7.9%) are the most common fields of study among 353 individuals in Prestonsburg who have obtained a bachelor's degree or higher.
| Field of Study | # Graduates | % Graduates |
| Computers & Mathematics | 0 | 0.0% |
| Bio, Nature & Agricultural | 17 | 4.8% |
| Physical & Health Sciences | 25 | 7.1% |
| Psychology | 0 | 0.0% |
| Social Sciences | 0 | 0.0% |
| Engineering | 95 | 26.9% |
| Multidisciplinary Studies | 0 | 0.0% |
| Science & Technology | 74 | 21.0% |
| Business | 57 | 16.2% |
| Education | 36 | 10.2% |
| Literature & Languages | 10 | 2.8% |
| Liberal Arts & History | 28 | 7.9% |
| Visual & Performing Arts | 0 | 0.0% |
| Communications | 0 | 0.0% |
| Arts & Humanities | 11 | 3.1% |
| Total | 353 | 100.0% |
Transportation & Commute in Prestonsburg
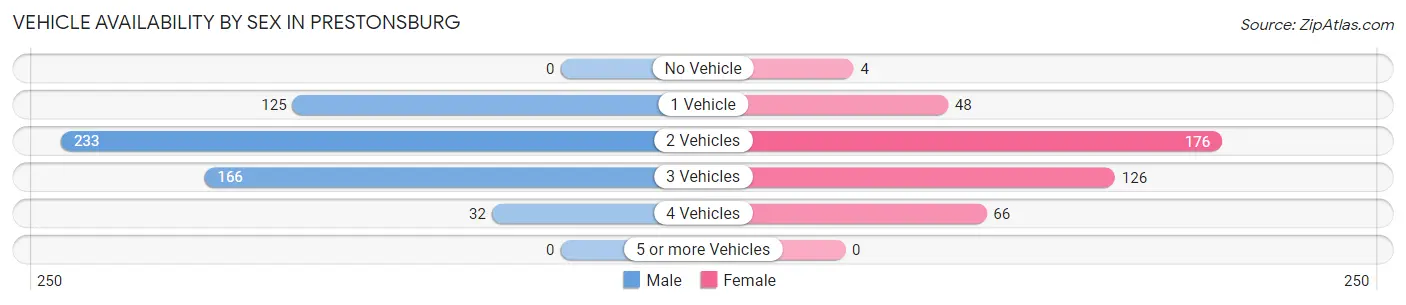
Vehicle Availability by Sex in Prestonsburg
The most prevalent vehicle ownership categories in Prestonsburg are males with 2 vehicles (233, accounting for 41.9%) and females with 2 vehicles (176, making up 55.5%).
| Vehicles Available | Male | Female |
| No Vehicle | 0 (0.0%) | 4 (0.9%) |
| 1 Vehicle | 125 (22.5%) | 48 (11.4%) |
| 2 Vehicles | 233 (41.9%) | 176 (41.9%) |
| 3 Vehicles | 166 (29.9%) | 126 (30.0%) |
| 4 Vehicles | 32 (5.8%) | 66 (15.7%) |
| 5 or more Vehicles | 0 (0.0%) | 0 (0.0%) |
| Total | 556 (100.0%) | 420 (100.0%) |
Commute Time in Prestonsburg
The most frequently occuring commute durations in Prestonsburg are 10 to 14 minutes (212 commuters, 21.6%), 5 to 9 minutes (202 commuters, 20.6%), and 15 to 19 minutes (127 commuters, 12.9%).
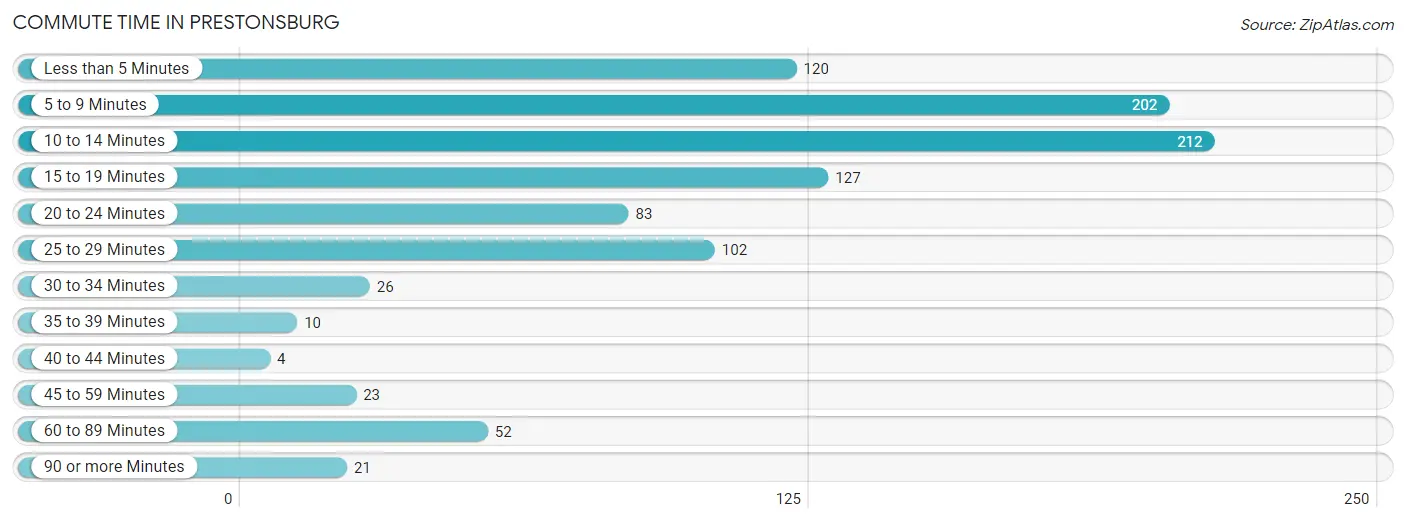
| Commute Time | # Commuters | % Commuters |
| Less than 5 Minutes | 120 | 12.2% |
| 5 to 9 Minutes | 202 | 20.6% |
| 10 to 14 Minutes | 212 | 21.6% |
| 15 to 19 Minutes | 127 | 12.9% |
| 20 to 24 Minutes | 83 | 8.5% |
| 25 to 29 Minutes | 102 | 10.4% |
| 30 to 34 Minutes | 26 | 2.6% |
| 35 to 39 Minutes | 10 | 1.0% |
| 40 to 44 Minutes | 4 | 0.4% |
| 45 to 59 Minutes | 23 | 2.3% |
| 60 to 89 Minutes | 52 | 5.3% |
| 90 or more Minutes | 21 | 2.1% |
Commute Time by Sex in Prestonsburg
The most common commute times in Prestonsburg are 10 to 14 minutes (88 commuters, 15.1%) for males and 5 to 9 minutes (126 commuters, 31.6%) for females.
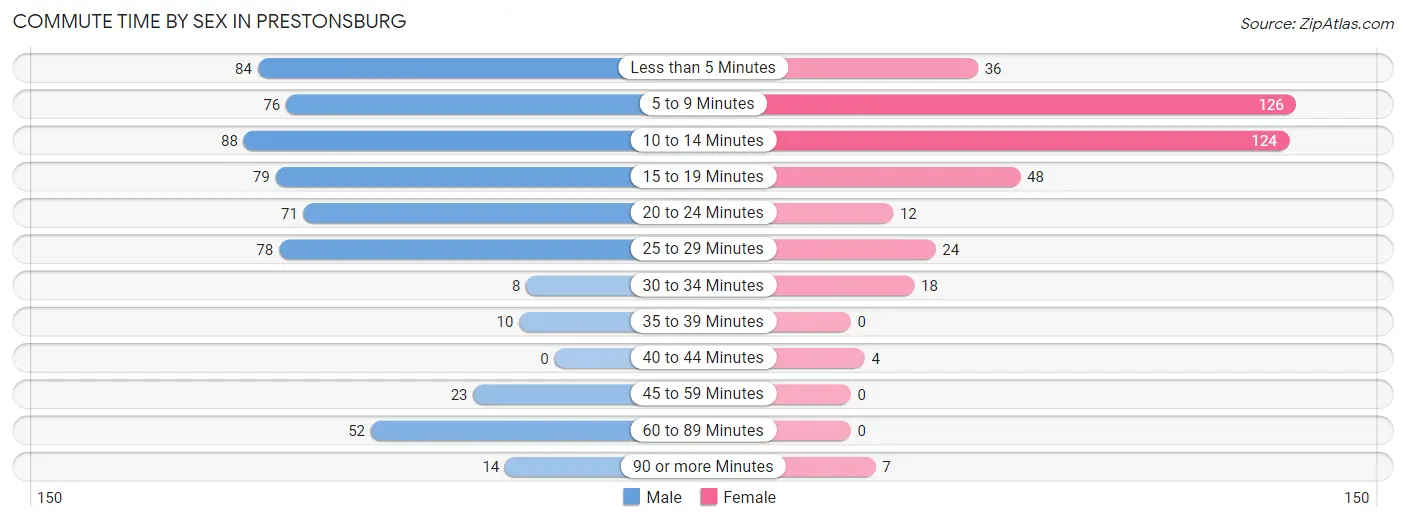
| Commute Time | Male | Female |
| Less than 5 Minutes | 84 (14.4%) | 36 (9.0%) |
| 5 to 9 Minutes | 76 (13.0%) | 126 (31.6%) |
| 10 to 14 Minutes | 88 (15.1%) | 124 (31.1%) |
| 15 to 19 Minutes | 79 (13.6%) | 48 (12.0%) |
| 20 to 24 Minutes | 71 (12.2%) | 12 (3.0%) |
| 25 to 29 Minutes | 78 (13.4%) | 24 (6.0%) |
| 30 to 34 Minutes | 8 (1.4%) | 18 (4.5%) |
| 35 to 39 Minutes | 10 (1.7%) | 0 (0.0%) |
| 40 to 44 Minutes | 0 (0.0%) | 4 (1.0%) |
| 45 to 59 Minutes | 23 (4.0%) | 0 (0.0%) |
| 60 to 89 Minutes | 52 (8.9%) | 0 (0.0%) |
| 90 or more Minutes | 14 (2.4%) | 7 (1.8%) |
Time of Departure to Work by Sex in Prestonsburg
The most frequent times of departure to work in Prestonsburg are 8:00 AM to 8:29 AM (141, 24.2%) for males and 8:00 AM to 8:29 AM (127, 31.8%) for females.
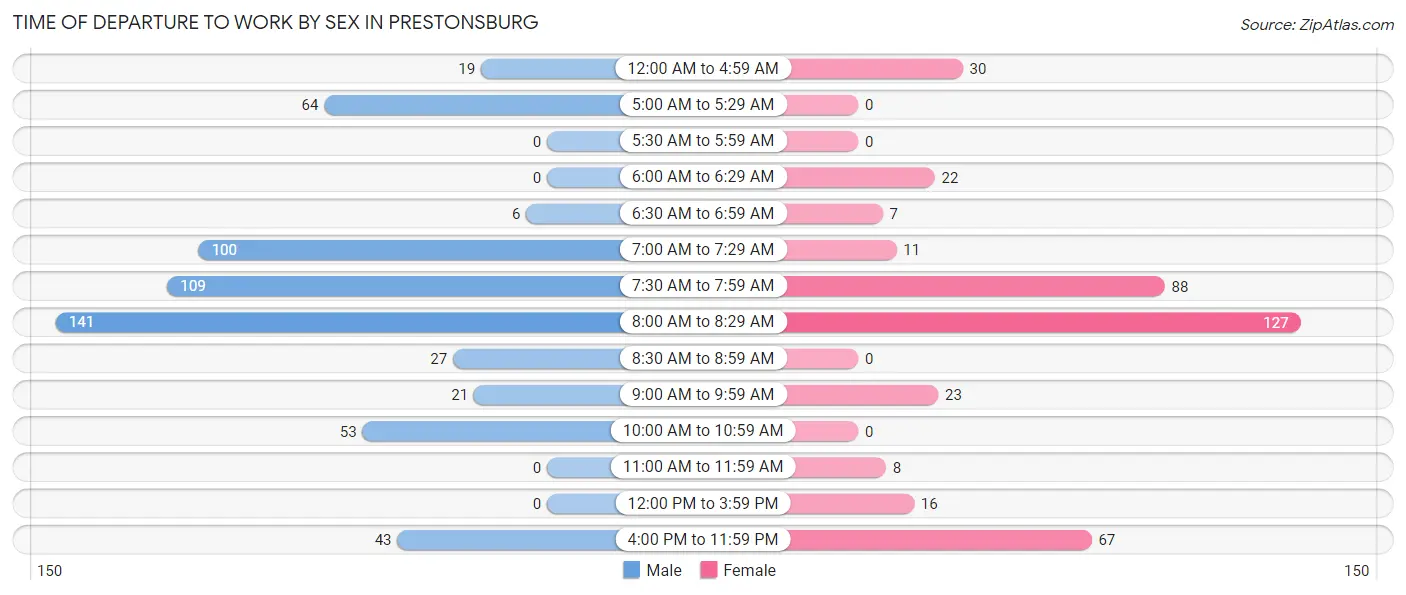
| Time of Departure | Male | Female |
| 12:00 AM to 4:59 AM | 19 (3.3%) | 30 (7.5%) |
| 5:00 AM to 5:29 AM | 64 (11.0%) | 0 (0.0%) |
| 5:30 AM to 5:59 AM | 0 (0.0%) | 0 (0.0%) |
| 6:00 AM to 6:29 AM | 0 (0.0%) | 22 (5.5%) |
| 6:30 AM to 6:59 AM | 6 (1.0%) | 7 (1.8%) |
| 7:00 AM to 7:29 AM | 100 (17.2%) | 11 (2.8%) |
| 7:30 AM to 7:59 AM | 109 (18.7%) | 88 (22.1%) |
| 8:00 AM to 8:29 AM | 141 (24.2%) | 127 (31.8%) |
| 8:30 AM to 8:59 AM | 27 (4.6%) | 0 (0.0%) |
| 9:00 AM to 9:59 AM | 21 (3.6%) | 23 (5.8%) |
| 10:00 AM to 10:59 AM | 53 (9.1%) | 0 (0.0%) |
| 11:00 AM to 11:59 AM | 0 (0.0%) | 8 (2.0%) |
| 12:00 PM to 3:59 PM | 0 (0.0%) | 16 (4.0%) |
| 4:00 PM to 11:59 PM | 43 (7.4%) | 67 (16.8%) |
| Total | 583 (100.0%) | 399 (100.0%) |
Housing Occupancy in Prestonsburg
Occupancy by Ownership in Prestonsburg
Of the total 1,397 dwellings in Prestonsburg, owner-occupied units account for 693 (49.6%), while renter-occupied units make up 704 (50.4%).
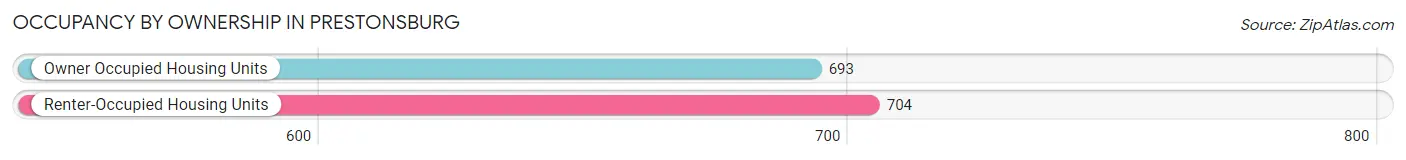
| Occupancy | # Housing Units | % Housing Units |
| Owner Occupied Housing Units | 693 | 49.6% |
| Renter-Occupied Housing Units | 704 | 50.4% |
| Total Occupied Housing Units | 1,397 | 100.0% |
Occupancy by Household Size in Prestonsburg
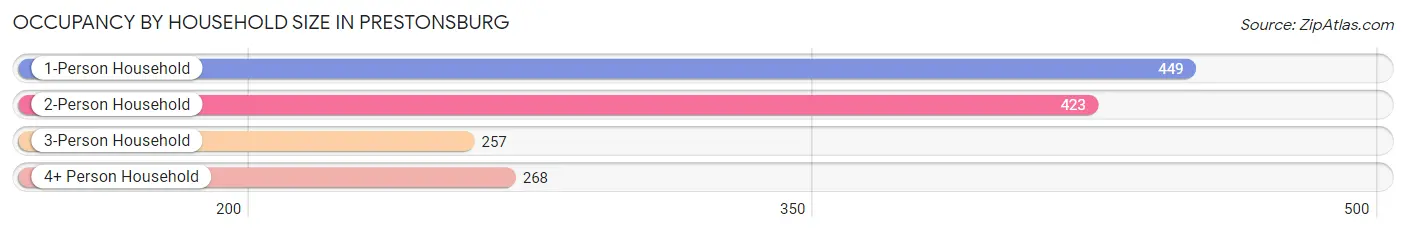
| Household Size | # Housing Units | % Housing Units |
| 1-Person Household | 449 | 32.1% |
| 2-Person Household | 423 | 30.3% |
| 3-Person Household | 257 | 18.4% |
| 4+ Person Household | 268 | 19.2% |
| Total Housing Units | 1,397 | 100.0% |
Occupancy by Ownership by Household Size in Prestonsburg
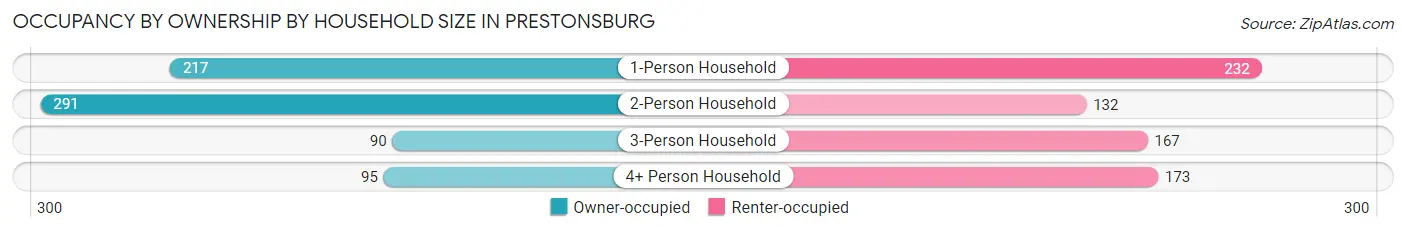
| Household Size | Owner-occupied | Renter-occupied |
| 1-Person Household | 217 (48.3%) | 232 (51.7%) |
| 2-Person Household | 291 (68.8%) | 132 (31.2%) |
| 3-Person Household | 90 (35.0%) | 167 (65.0%) |
| 4+ Person Household | 95 (35.4%) | 173 (64.5%) |
| Total Housing Units | 693 (49.6%) | 704 (50.4%) |
Occupancy by Educational Attainment in Prestonsburg
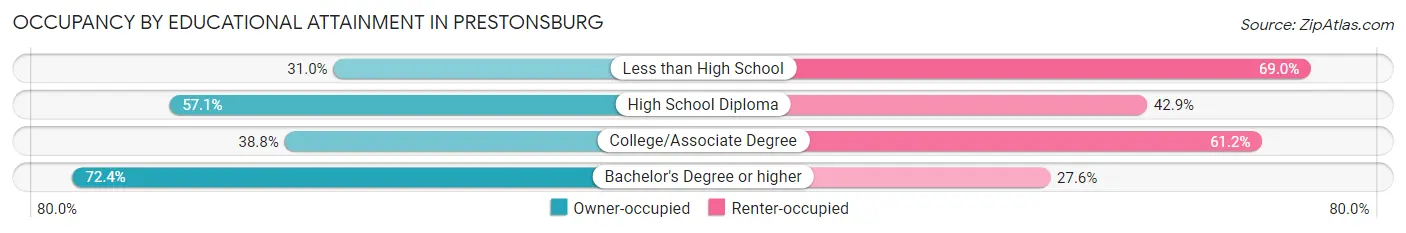
| Household Size | Owner-occupied | Renter-occupied |
| Less than High School | 85 (31.0%) | 189 (69.0%) |
| High School Diploma | 295 (57.1%) | 222 (42.9%) |
| College/Associate Degree | 145 (38.8%) | 229 (61.2%) |
| Bachelor's Degree or higher | 168 (72.4%) | 64 (27.6%) |
Occupancy by Age of Householder in Prestonsburg
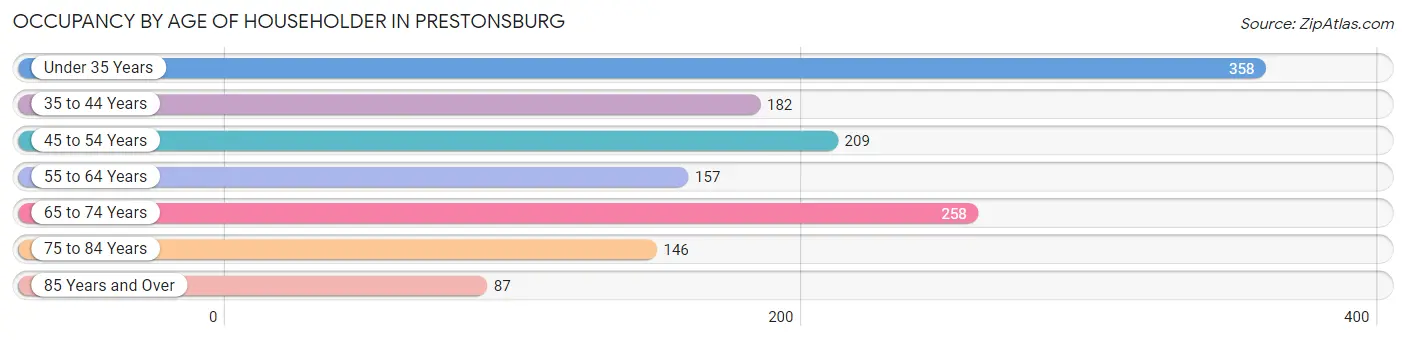
| Age Bracket | # Households | % Households |
| Under 35 Years | 358 | 25.6% |
| 35 to 44 Years | 182 | 13.0% |
| 45 to 54 Years | 209 | 15.0% |
| 55 to 64 Years | 157 | 11.2% |
| 65 to 74 Years | 258 | 18.5% |
| 75 to 84 Years | 146 | 10.4% |
| 85 Years and Over | 87 | 6.2% |
| Total | 1,397 | 100.0% |
Housing Finances in Prestonsburg
Median Income by Occupancy in Prestonsburg
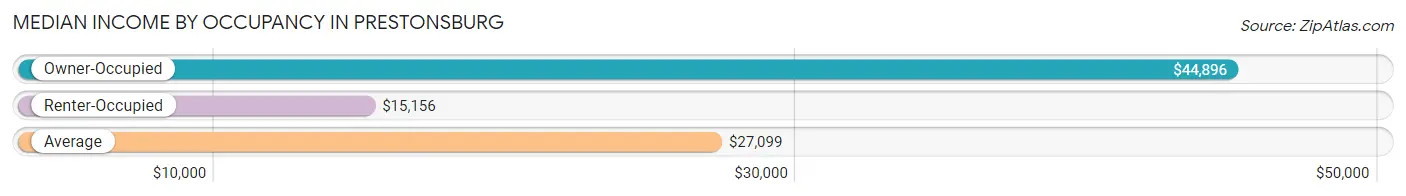
| Occupancy Type | # Households | Median Income |
| Owner-Occupied | 693 (49.6%) | $44,896 |
| Renter-Occupied | 704 (50.4%) | $15,156 |
| Average | 1,397 (100.0%) | $27,099 |
Occupancy by Householder Income Bracket in Prestonsburg
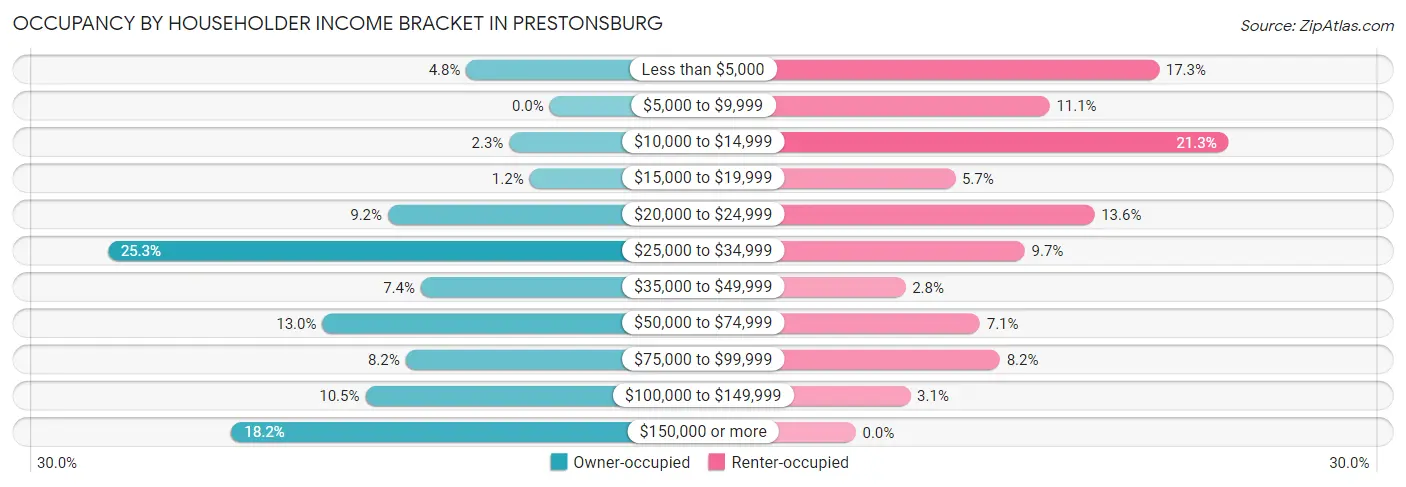
| Income Bracket | Owner-occupied | Renter-occupied |
| Less than $5,000 | 33 (4.8%) | 122 (17.3%) |
| $5,000 to $9,999 | 0 (0.0%) | 78 (11.1%) |
| $10,000 to $14,999 | 16 (2.3%) | 150 (21.3%) |
| $15,000 to $19,999 | 8 (1.1%) | 40 (5.7%) |
| $20,000 to $24,999 | 64 (9.2%) | 96 (13.6%) |
| $25,000 to $34,999 | 175 (25.3%) | 68 (9.7%) |
| $35,000 to $49,999 | 51 (7.4%) | 20 (2.8%) |
| $50,000 to $74,999 | 90 (13.0%) | 50 (7.1%) |
| $75,000 to $99,999 | 57 (8.2%) | 58 (8.2%) |
| $100,000 to $149,999 | 73 (10.5%) | 22 (3.1%) |
| $150,000 or more | 126 (18.2%) | 0 (0.0%) |
| Total | 693 (100.0%) | 704 (100.0%) |
Monthly Housing Cost Tiers in Prestonsburg
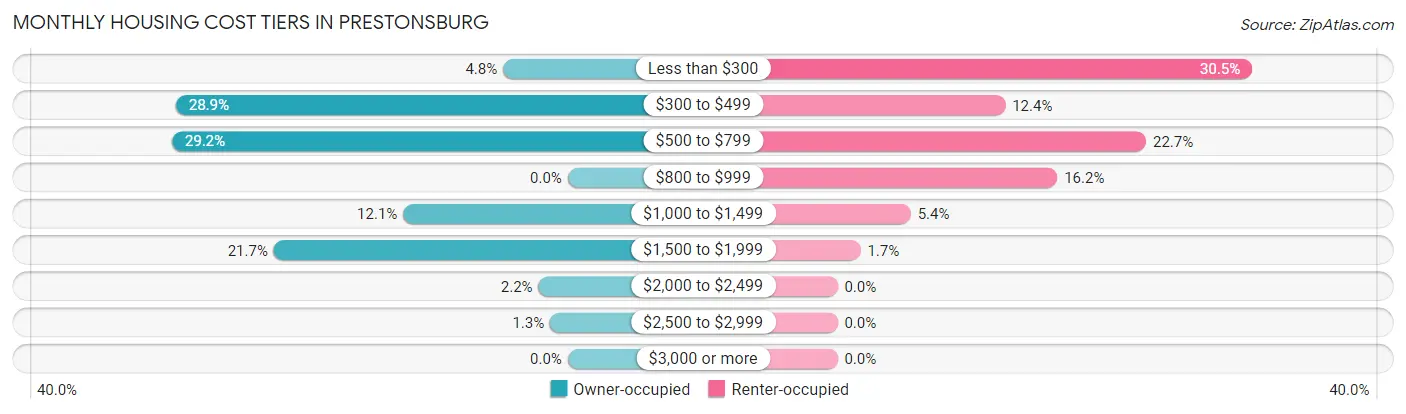
| Monthly Cost | Owner-occupied | Renter-occupied |
| Less than $300 | 33 (4.8%) | 215 (30.5%) |
| $300 to $499 | 200 (28.9%) | 87 (12.4%) |
| $500 to $799 | 202 (29.1%) | 160 (22.7%) |
| $800 to $999 | 0 (0.0%) | 114 (16.2%) |
| $1,000 to $1,499 | 84 (12.1%) | 38 (5.4%) |
| $1,500 to $1,999 | 150 (21.6%) | 12 (1.7%) |
| $2,000 to $2,499 | 15 (2.2%) | 0 (0.0%) |
| $2,500 to $2,999 | 9 (1.3%) | 0 (0.0%) |
| $3,000 or more | 0 (0.0%) | 0 (0.0%) |
| Total | 693 (100.0%) | 704 (100.0%) |
Physical Housing Characteristics in Prestonsburg
Housing Structures in Prestonsburg
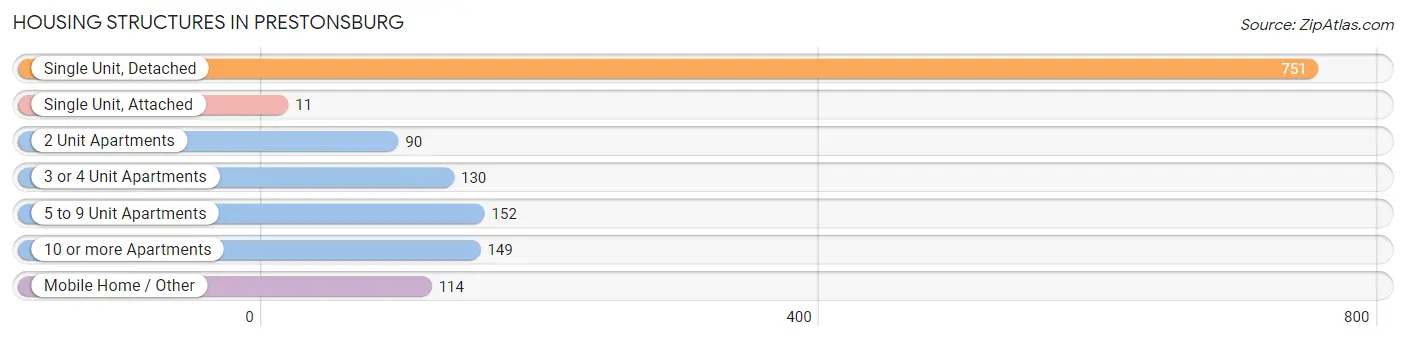
| Structure Type | # Housing Units | % Housing Units |
| Single Unit, Detached | 751 | 53.8% |
| Single Unit, Attached | 11 | 0.8% |
| 2 Unit Apartments | 90 | 6.4% |
| 3 or 4 Unit Apartments | 130 | 9.3% |
| 5 to 9 Unit Apartments | 152 | 10.9% |
| 10 or more Apartments | 149 | 10.7% |
| Mobile Home / Other | 114 | 8.2% |
| Total | 1,397 | 100.0% |
Housing Structures by Occupancy in Prestonsburg
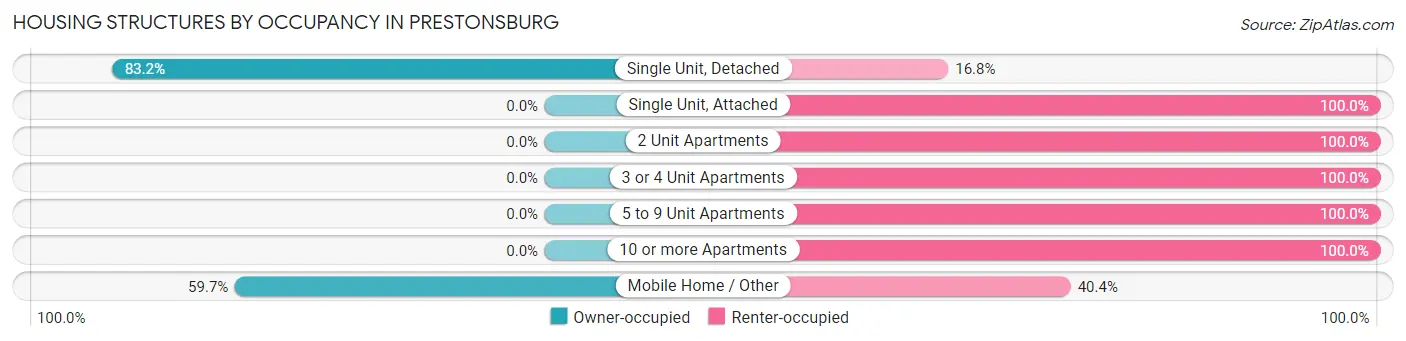
| Structure Type | Owner-occupied | Renter-occupied |
| Single Unit, Detached | 625 (83.2%) | 126 (16.8%) |
| Single Unit, Attached | 0 (0.0%) | 11 (100.0%) |
| 2 Unit Apartments | 0 (0.0%) | 90 (100.0%) |
| 3 or 4 Unit Apartments | 0 (0.0%) | 130 (100.0%) |
| 5 to 9 Unit Apartments | 0 (0.0%) | 152 (100.0%) |
| 10 or more Apartments | 0 (0.0%) | 149 (100.0%) |
| Mobile Home / Other | 68 (59.7%) | 46 (40.4%) |
| Total | 693 (49.6%) | 704 (50.4%) |
Housing Structures by Number of Rooms in Prestonsburg
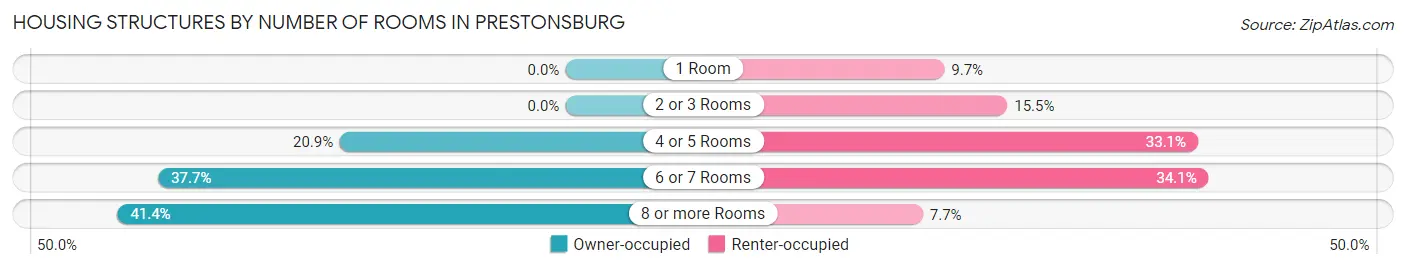
| Number of Rooms | Owner-occupied | Renter-occupied |
| 1 Room | 0 (0.0%) | 68 (9.7%) |
| 2 or 3 Rooms | 0 (0.0%) | 109 (15.5%) |
| 4 or 5 Rooms | 145 (20.9%) | 233 (33.1%) |
| 6 or 7 Rooms | 261 (37.7%) | 240 (34.1%) |
| 8 or more Rooms | 287 (41.4%) | 54 (7.7%) |
| Total | 693 (100.0%) | 704 (100.0%) |
Housing Structure by Heating Type in Prestonsburg
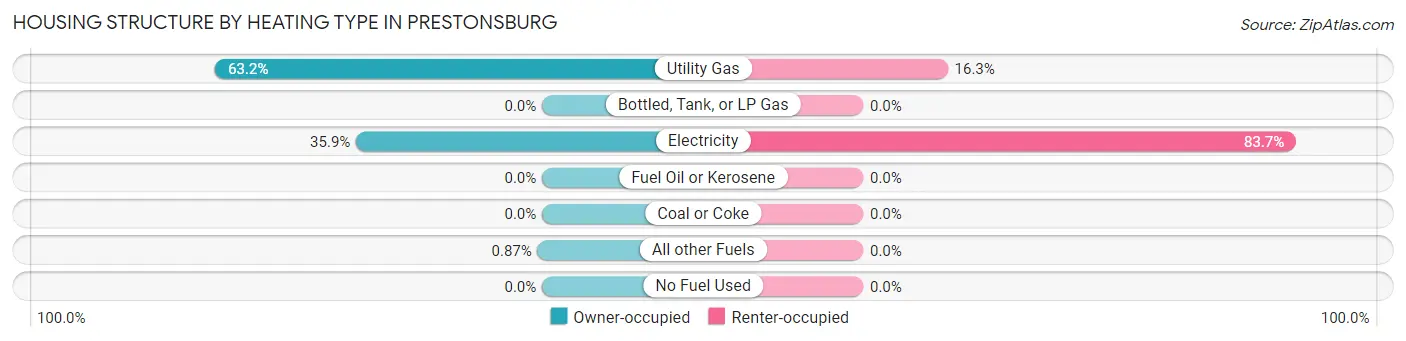
| Heating Type | Owner-occupied | Renter-occupied |
| Utility Gas | 438 (63.2%) | 115 (16.3%) |
| Bottled, Tank, or LP Gas | 0 (0.0%) | 0 (0.0%) |
| Electricity | 249 (35.9%) | 589 (83.7%) |
| Fuel Oil or Kerosene | 0 (0.0%) | 0 (0.0%) |
| Coal or Coke | 0 (0.0%) | 0 (0.0%) |
| All other Fuels | 6 (0.9%) | 0 (0.0%) |
| No Fuel Used | 0 (0.0%) | 0 (0.0%) |
| Total | 693 (100.0%) | 704 (100.0%) |
Household Vehicle Usage in Prestonsburg
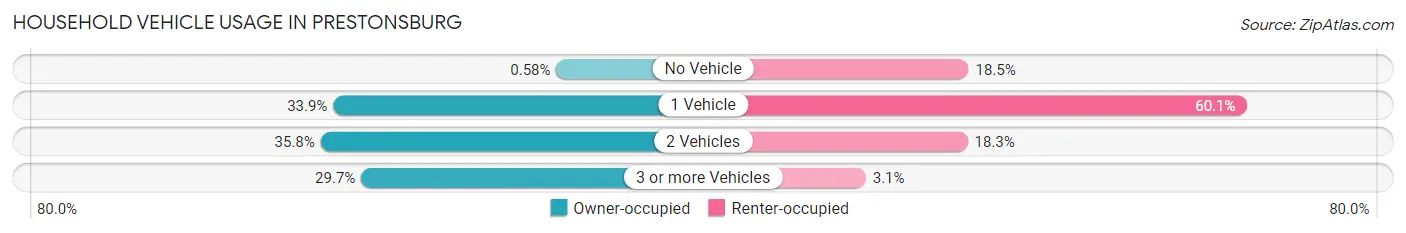
| Vehicles per Household | Owner-occupied | Renter-occupied |
| No Vehicle | 4 (0.6%) | 130 (18.5%) |
| 1 Vehicle | 235 (33.9%) | 423 (60.1%) |
| 2 Vehicles | 248 (35.8%) | 129 (18.3%) |
| 3 or more Vehicles | 206 (29.7%) | 22 (3.1%) |
| Total | 693 (100.0%) | 704 (100.0%) |
Real Estate & Mortgages in Prestonsburg
Real Estate and Mortgage Overview in Prestonsburg
| Characteristic | Without Mortgage | With Mortgage |
| Housing Units | 431 | 262 |
| Median Property Value | $114,400 | $171,400 |
| Median Household Income | $33,633 | $93 |
| Monthly Housing Costs | $488 | $0 |
| Real Estate Taxes | $1,074 | $13 |
Property Value by Mortgage Status in Prestonsburg
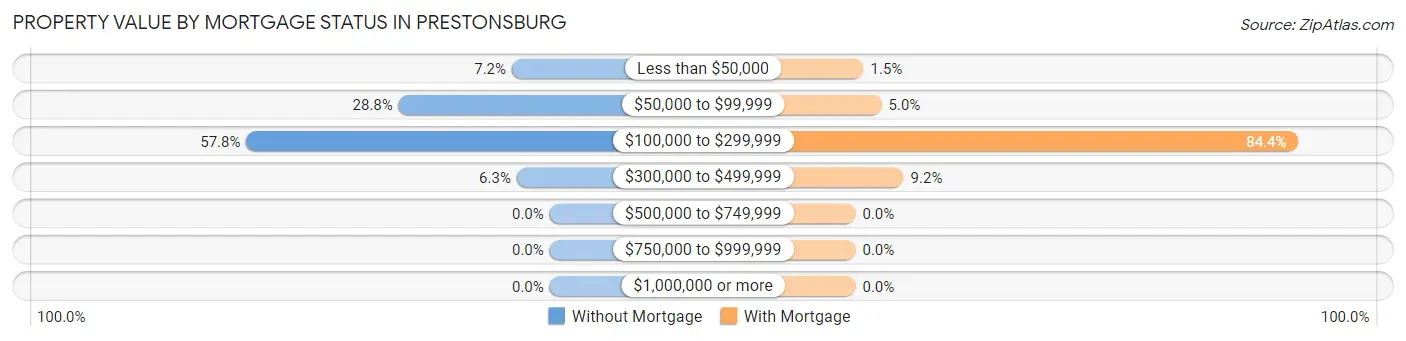
| Property Value | Without Mortgage | With Mortgage |
| Less than $50,000 | 31 (7.2%) | 4 (1.5%) |
| $50,000 to $99,999 | 124 (28.8%) | 13 (5.0%) |
| $100,000 to $299,999 | 249 (57.8%) | 221 (84.4%) |
| $300,000 to $499,999 | 27 (6.3%) | 24 (9.2%) |
| $500,000 to $749,999 | 0 (0.0%) | 0 (0.0%) |
| $750,000 to $999,999 | 0 (0.0%) | 0 (0.0%) |
| $1,000,000 or more | 0 (0.0%) | 0 (0.0%) |
| Total | 431 (100.0%) | 262 (100.0%) |
Household Income by Mortgage Status in Prestonsburg
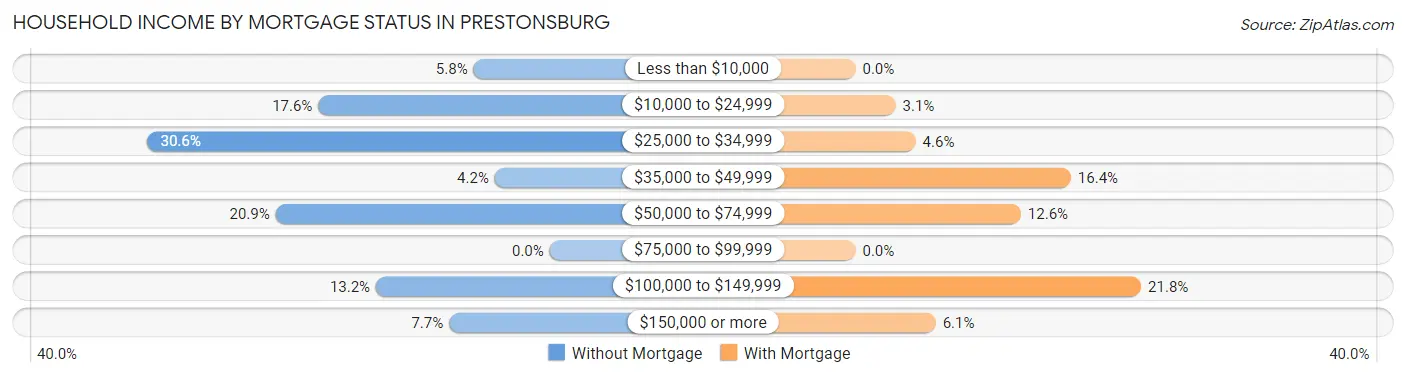
| Household Income | Without Mortgage | With Mortgage |
| Less than $10,000 | 25 (5.8%) | 0 (0.0%) |
| $10,000 to $24,999 | 76 (17.6%) | 8 (3.0%) |
| $25,000 to $34,999 | 132 (30.6%) | 12 (4.6%) |
| $35,000 to $49,999 | 18 (4.2%) | 43 (16.4%) |
| $50,000 to $74,999 | 90 (20.9%) | 33 (12.6%) |
| $75,000 to $99,999 | 0 (0.0%) | 0 (0.0%) |
| $100,000 to $149,999 | 57 (13.2%) | 57 (21.8%) |
| $150,000 or more | 33 (7.7%) | 16 (6.1%) |
| Total | 431 (100.0%) | 262 (100.0%) |
Property Value to Household Income Ratio in Prestonsburg
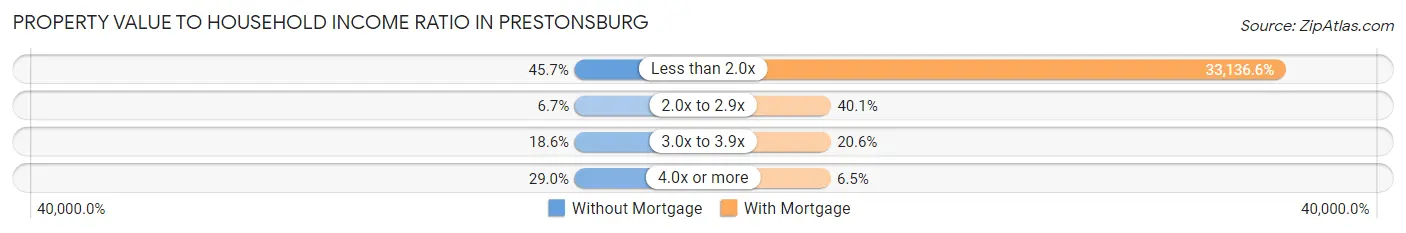
| Value-to-Income Ratio | Without Mortgage | With Mortgage |
| Less than 2.0x | 197 (45.7%) | 86,818 (33,136.6%) |
| 2.0x to 2.9x | 29 (6.7%) | 105 (40.1%) |
| 3.0x to 3.9x | 80 (18.6%) | 54 (20.6%) |
| 4.0x or more | 125 (29.0%) | 17 (6.5%) |
| Total | 431 (100.0%) | 262 (100.0%) |
Real Estate Taxes by Mortgage Status in Prestonsburg
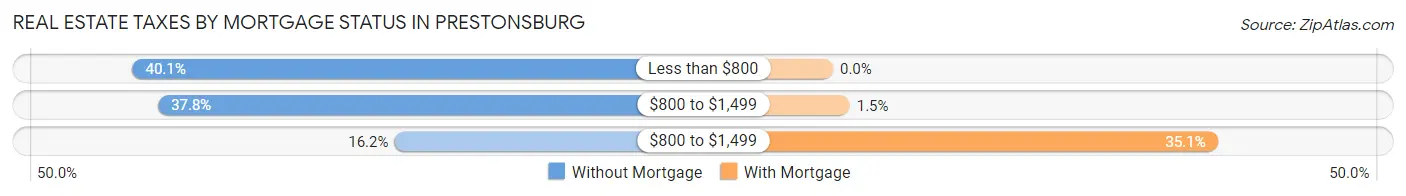
| Property Taxes | Without Mortgage | With Mortgage |
| Less than $800 | 173 (40.1%) | 0 (0.0%) |
| $800 to $1,499 | 163 (37.8%) | 4 (1.5%) |
| $800 to $1,499 | 70 (16.2%) | 92 (35.1%) |
| Total | 431 (100.0%) | 262 (100.0%) |
Health & Disability in Prestonsburg
Health Insurance Coverage by Age in Prestonsburg
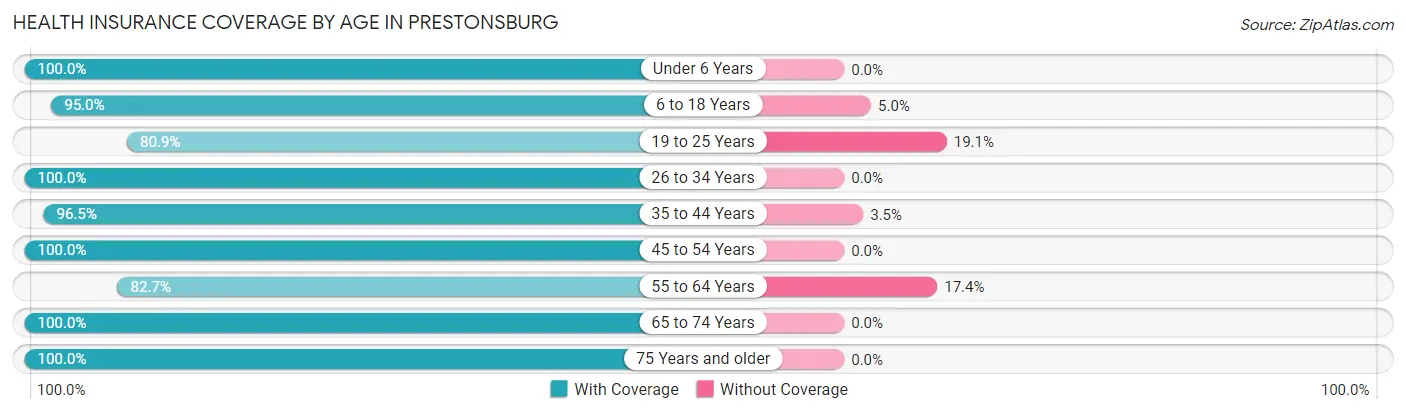
| Age Bracket | With Coverage | Without Coverage |
| Under 6 Years | 292 (100.0%) | 0 (0.0%) |
| 6 to 18 Years | 761 (95.0%) | 40 (5.0%) |
| 19 to 25 Years | 419 (80.9%) | 99 (19.1%) |
| 26 to 34 Years | 366 (100.0%) | 0 (0.0%) |
| 35 to 44 Years | 382 (96.5%) | 14 (3.5%) |
| 45 to 54 Years | 302 (100.0%) | 0 (0.0%) |
| 55 to 64 Years | 181 (82.7%) | 38 (17.3%) |
| 65 to 74 Years | 441 (100.0%) | 0 (0.0%) |
| 75 Years and older | 250 (100.0%) | 0 (0.0%) |
| Total | 3,394 (94.7%) | 191 (5.3%) |
Health Insurance Coverage by Citizenship Status in Prestonsburg
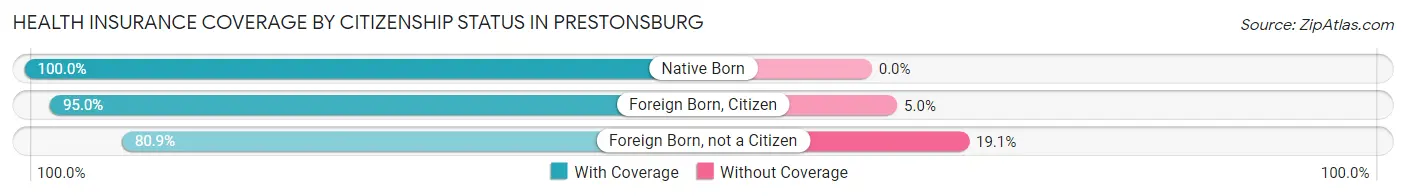
| Citizenship Status | With Coverage | Without Coverage |
| Native Born | 292 (100.0%) | 0 (0.0%) |
| Foreign Born, Citizen | 761 (95.0%) | 40 (5.0%) |
| Foreign Born, not a Citizen | 419 (80.9%) | 99 (19.1%) |
Health Insurance Coverage by Household Income in Prestonsburg
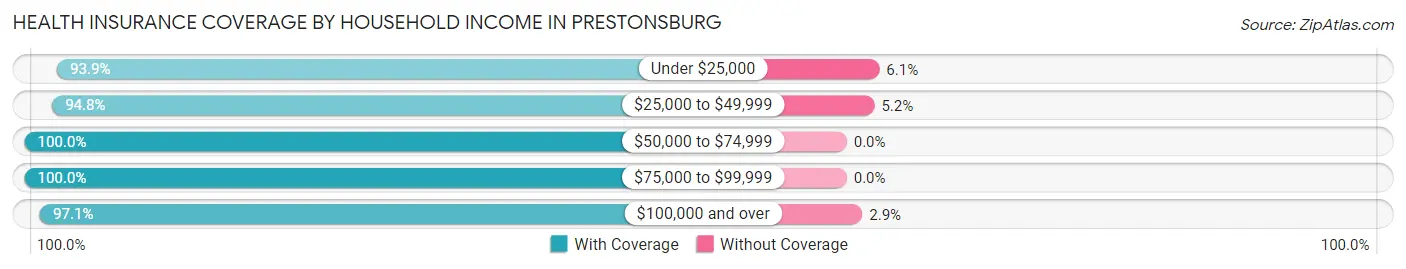
| Household Income | With Coverage | Without Coverage |
| Under $25,000 | 1,367 (93.9%) | 89 (6.1%) |
| $25,000 to $49,999 | 696 (94.8%) | 38 (5.2%) |
| $50,000 to $74,999 | 220 (100.0%) | 0 (0.0%) |
| $75,000 to $99,999 | 395 (100.0%) | 0 (0.0%) |
| $100,000 and over | 466 (97.1%) | 14 (2.9%) |
Public vs Private Health Insurance Coverage by Age in Prestonsburg
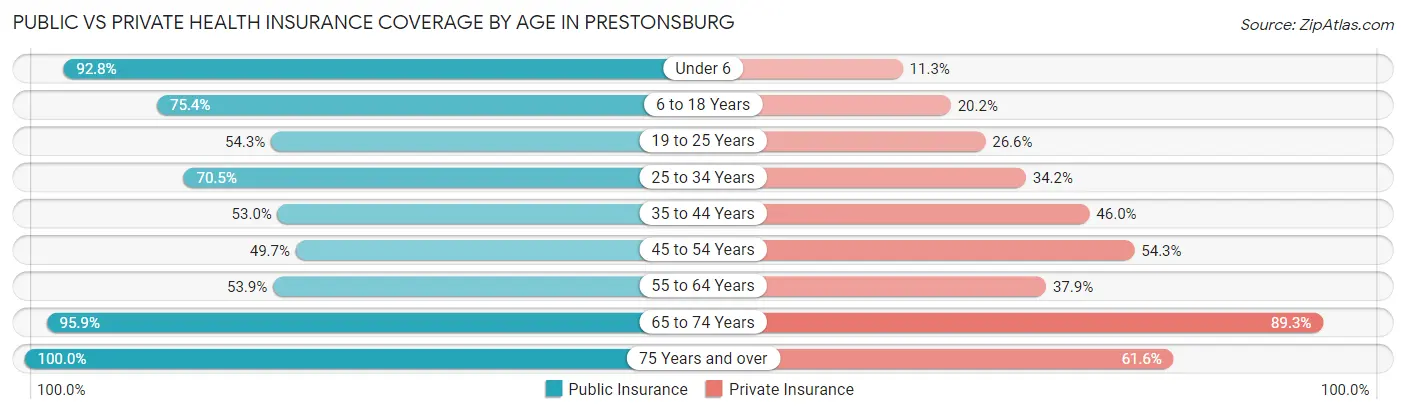
| Age Bracket | Public Insurance | Private Insurance |
| Under 6 | 271 (92.8%) | 33 (11.3%) |
| 6 to 18 Years | 604 (75.4%) | 162 (20.2%) |
| 19 to 25 Years | 281 (54.2%) | 138 (26.6%) |
| 25 to 34 Years | 258 (70.5%) | 125 (34.2%) |
| 35 to 44 Years | 210 (53.0%) | 182 (46.0%) |
| 45 to 54 Years | 150 (49.7%) | 164 (54.3%) |
| 55 to 64 Years | 118 (53.9%) | 83 (37.9%) |
| 65 to 74 Years | 423 (95.9%) | 394 (89.3%) |
| 75 Years and over | 250 (100.0%) | 154 (61.6%) |
| Total | 2,565 (71.6%) | 1,435 (40.0%) |
Disability Status by Sex by Age in Prestonsburg
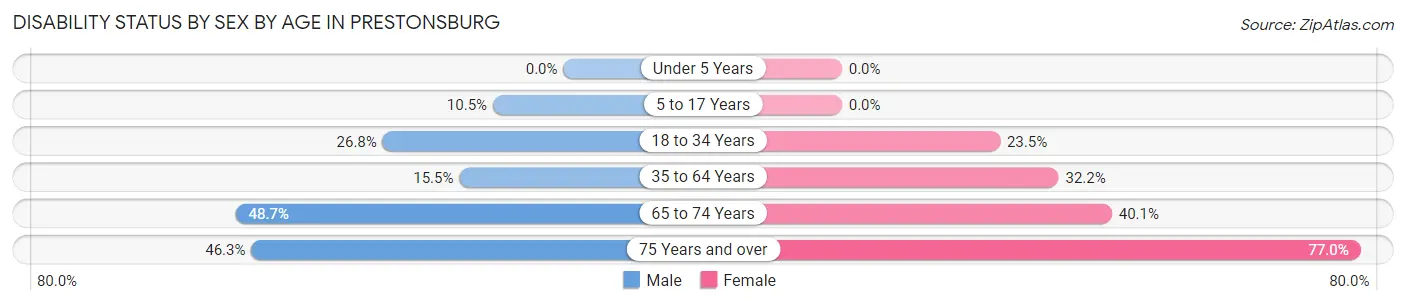
| Age Bracket | Male | Female |
| Under 5 Years | 0 (0.0%) | 0 (0.0%) |
| 5 to 17 Years | 39 (10.5%) | 0 (0.0%) |
| 18 to 34 Years | 153 (26.8%) | 101 (23.5%) |
| 35 to 64 Years | 74 (15.4%) | 141 (32.2%) |
| 65 to 74 Years | 109 (48.7%) | 87 (40.1%) |
| 75 Years and over | 19 (46.3%) | 161 (77.0%) |
Disability Class by Sex by Age in Prestonsburg
Disability Class: Hearing Difficulty
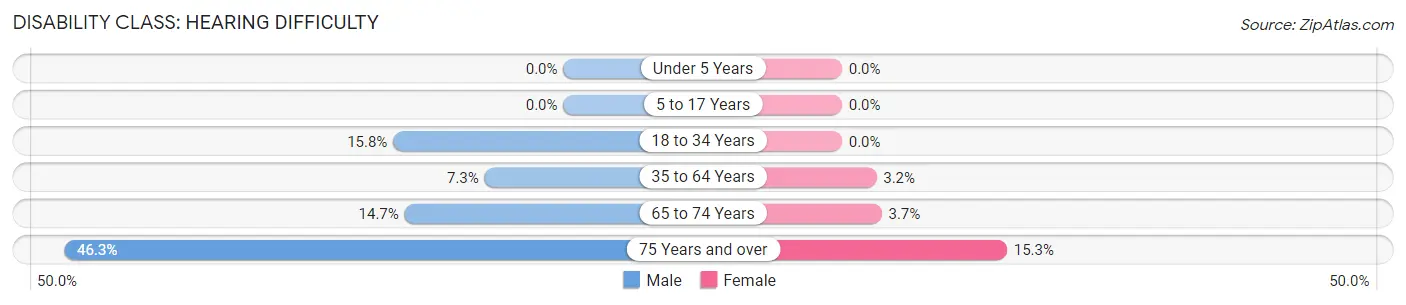
| Age Bracket | Male | Female |
| Under 5 Years | 0 (0.0%) | 0 (0.0%) |
| 5 to 17 Years | 0 (0.0%) | 0 (0.0%) |
| 18 to 34 Years | 90 (15.8%) | 0 (0.0%) |
| 35 to 64 Years | 35 (7.3%) | 14 (3.2%) |
| 65 to 74 Years | 33 (14.7%) | 8 (3.7%) |
| 75 Years and over | 19 (46.3%) | 32 (15.3%) |
Disability Class: Vision Difficulty
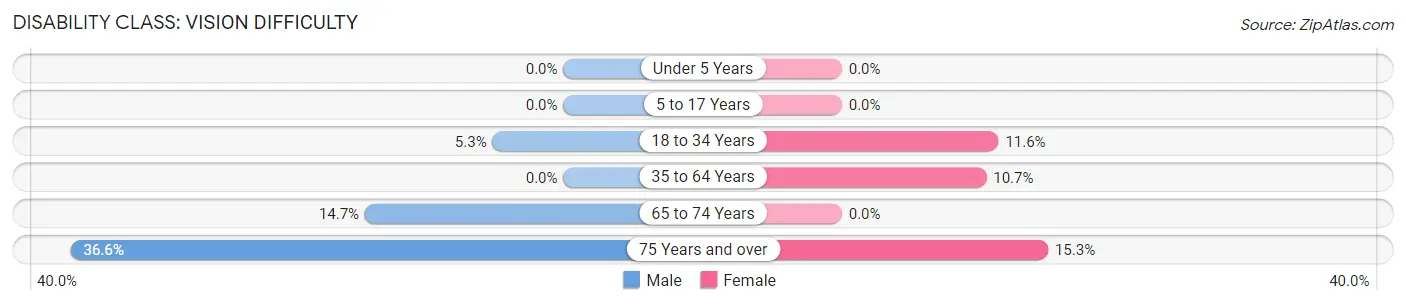
| Age Bracket | Male | Female |
| Under 5 Years | 0 (0.0%) | 0 (0.0%) |
| 5 to 17 Years | 0 (0.0%) | 0 (0.0%) |
| 18 to 34 Years | 30 (5.3%) | 50 (11.6%) |
| 35 to 64 Years | 0 (0.0%) | 47 (10.7%) |
| 65 to 74 Years | 33 (14.7%) | 0 (0.0%) |
| 75 Years and over | 15 (36.6%) | 32 (15.3%) |
Disability Class: Cognitive Difficulty
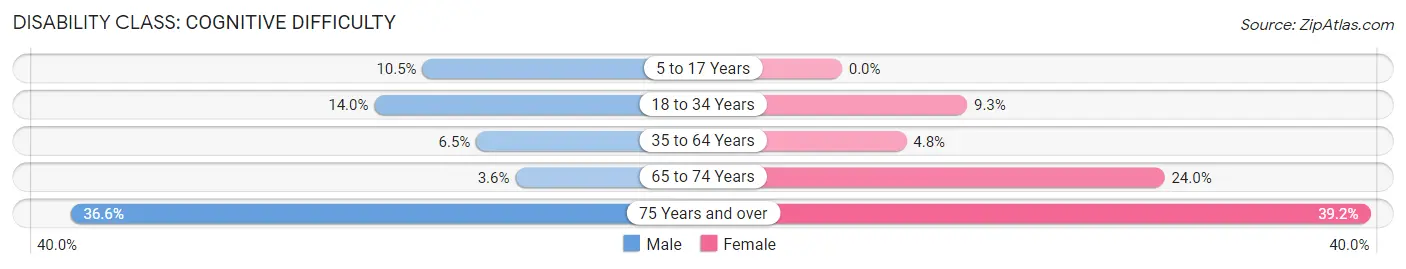
| Age Bracket | Male | Female |
| 5 to 17 Years | 39 (10.5%) | 0 (0.0%) |
| 18 to 34 Years | 80 (14.0%) | 40 (9.3%) |
| 35 to 64 Years | 31 (6.5%) | 21 (4.8%) |
| 65 to 74 Years | 8 (3.6%) | 52 (24.0%) |
| 75 Years and over | 15 (36.6%) | 82 (39.2%) |
Disability Class: Ambulatory Difficulty
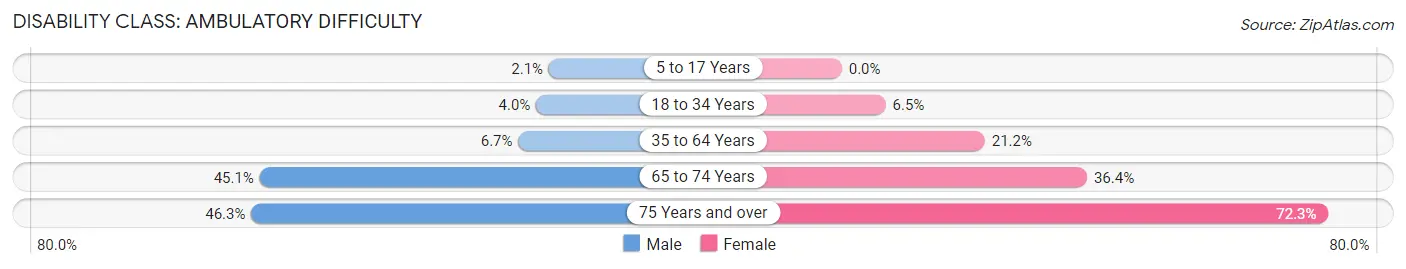
| Age Bracket | Male | Female |
| 5 to 17 Years | 8 (2.1%) | 0 (0.0%) |
| 18 to 34 Years | 23 (4.0%) | 28 (6.5%) |
| 35 to 64 Years | 32 (6.7%) | 93 (21.2%) |
| 65 to 74 Years | 101 (45.1%) | 79 (36.4%) |
| 75 Years and over | 19 (46.3%) | 151 (72.3%) |
Disability Class: Self-Care Difficulty
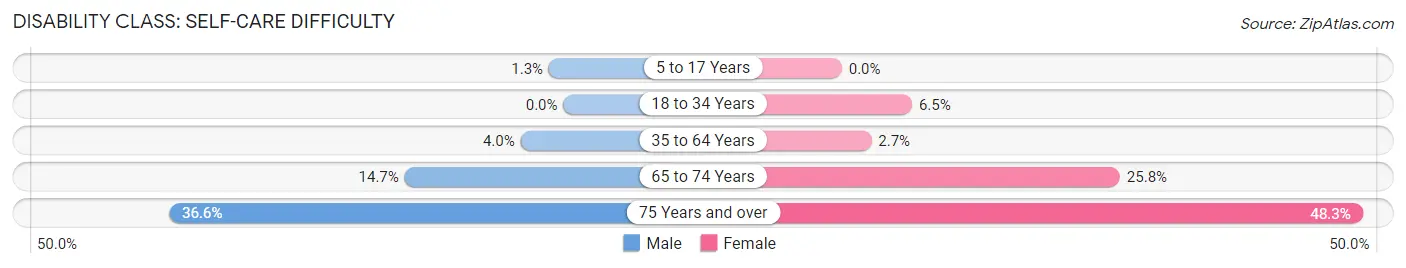
| Age Bracket | Male | Female |
| 5 to 17 Years | 5 (1.3%) | 0 (0.0%) |
| 18 to 34 Years | 0 (0.0%) | 28 (6.5%) |
| 35 to 64 Years | 19 (4.0%) | 12 (2.7%) |
| 65 to 74 Years | 33 (14.7%) | 56 (25.8%) |
| 75 Years and over | 15 (36.6%) | 101 (48.3%) |
Technology Access in Prestonsburg
Computing Device Access in Prestonsburg
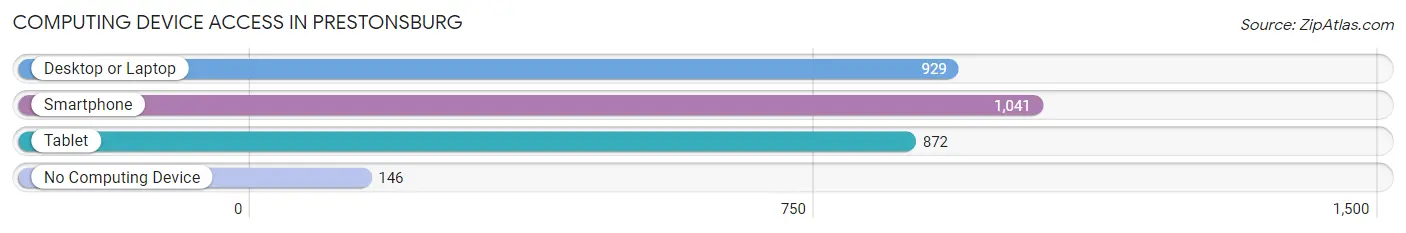
| Device Type | # Households | % Households |
| Desktop or Laptop | 929 | 66.5% |
| Smartphone | 1,041 | 74.5% |
| Tablet | 872 | 62.4% |
| No Computing Device | 146 | 10.4% |
| Total | 1,397 | 100.0% |
Internet Access in Prestonsburg
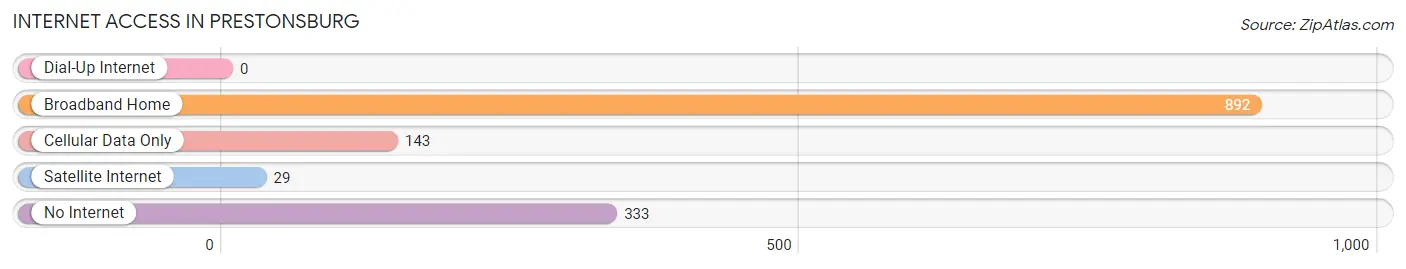
| Internet Type | # Households | % Households |
| Dial-Up Internet | 0 | 0.0% |
| Broadband Home | 892 | 63.8% |
| Cellular Data Only | 143 | 10.2% |
| Satellite Internet | 29 | 2.1% |
| No Internet | 333 | 23.8% |
| Total | 1,397 | 100.0% |
Prestonsburg Summary
Prestonsburg is a city located in Floyd County, Kentucky, United States. It is the county seat of Floyd County and the largest city in the county. The population was 3,255 at the 2010 census.
History
Prestonsburg was founded in 1797 by Colonel John Preston, a Revolutionary War veteran. The city was named after him. The city was incorporated in 1818 and was the first city in Floyd County.
The city was a major center of the Civil War in eastern Kentucky. In 1861, the city was the site of the Battle of Middle Creek, which was a Confederate victory. The city was also the site of the Battle of Ivy Mountain in 1862, which was a Union victory.
In the late 19th century, Prestonsburg was a major center of the timber industry. The city was also a major center of the coal mining industry. The city was home to several coal mines, including the Big Sandy Coal Company, which operated from 1891 to 1931.
Geography
Prestonsburg is located at the confluence of the Levisa Fork and the Big Sandy River in eastern Kentucky. The city is situated in the foothills of the Appalachian Mountains. The city has a total area of 4.2 square miles, all of which is land.
The climate in Prestonsburg is humid subtropical, with hot, humid summers and mild winters. The average annual temperature is 57.2°F. The average annual precipitation is 45.2 inches.
Economy
The economy of Prestonsburg is largely based on tourism and retail. The city is home to several tourist attractions, including the Mountain Arts Center, the Kentucky Music Hall of Fame, and the Kentucky Opry. The city is also home to several retail stores, including Walmart, Kmart, and Dollar General.
The city is also home to several manufacturing companies, including the Prestonsburg Manufacturing Company, which produces furniture, and the Prestonsburg Tool and Die Company, which produces tools and dies.
Demographics
As of the 2010 census, the population of Prestonsburg was 3,255. The racial makeup of the city was 95.3% White, 2.2% African American, 0.3% Native American, 0.2% Asian, 0.1% Pacific Islander, 0.7% from other races, and 1.3% from two or more races. Hispanic or Latino of any race were 1.7% of the population.
The median income for a household in Prestonsburg was $25,972, and the median income for a family was $31,964. The per capita income for the city was $14,945. About 17.2% of families and 20.2% of the population were below the poverty line, including 28.2% of those under age 18 and 16.2% of those age 65 or over.
Common Questions
What is Per Capita Income in Prestonsburg?
Per Capita income in Prestonsburg is $19,724.
What is the Median Family Income in Prestonsburg?
Median Family Income in Prestonsburg is $30,170.
What is the Median Household income in Prestonsburg?
Median Household Income in Prestonsburg is $27,099.
What is Inequality or Gini Index in Prestonsburg?
Inequality or Gini Index in Prestonsburg is 0.55.
What is the Total Population of Prestonsburg?
Total Population of Prestonsburg is 3,868.
What is the Total Male Population of Prestonsburg?
Total Male Population of Prestonsburg is 2,030.
What is the Total Female Population of Prestonsburg?
Total Female Population of Prestonsburg is 1,838.
What is the Ratio of Males per 100 Females in Prestonsburg?
There are 110.45 Males per 100 Females in Prestonsburg.
What is the Ratio of Females per 100 Males in Prestonsburg?
There are 90.54 Females per 100 Males in Prestonsburg.
What is the Median Population Age in Prestonsburg?
Median Population Age in Prestonsburg is 33.6 Years.
What is the Average Family Size in Prestonsburg
Average Family Size in Prestonsburg is 2.8 People.
What is the Average Household Size in Prestonsburg
Average Household Size in Prestonsburg is 2.4 People.
How Large is the Labor Force in Prestonsburg?
There are 1,247 People in the Labor Forcein in Prestonsburg.
What is the Percentage of People in the Labor Force in Prestonsburg?
42.1% of People are in the Labor Force in Prestonsburg.
What is the Unemployment Rate in Prestonsburg?
Unemployment Rate in Prestonsburg is 14.8%.