Russell, KY Map & Demographics
Russell Map
Russell Overview
$41,106
PER CAPITA INCOME
$104,239
AVG FAMILY INCOME
$80,750
AVG HOUSEHOLD INCOME
69.8%
WAGE / INCOME GAP [ % ]
30.2¢/ $1
WAGE / INCOME GAP [ $ ]
0.44
INEQUALITY / GINI INDEX
3,704
TOTAL POPULATION
1,783
MALE POPULATION
1,921
FEMALE POPULATION
92.82
MALES / 100 FEMALES
107.74
FEMALES / 100 MALES
39.5
MEDIAN AGE
3.1
AVG FAMILY SIZE
2.5
AVG HOUSEHOLD SIZE
1,473
LABOR FORCE [ PEOPLE ]
51.1%
PERCENT IN LABOR FORCE
6.2%
UNEMPLOYMENT RATE
Russell Zip Codes
Russell Area Codes
Income in Russell
Income Overview in Russell
Per Capita Income in Russell is $41,106, while median incomes of families and households are $104,239 and $80,750 respectively.
| Characteristic | Number | Measure |
| Per Capita Income | 3,704 | $41,106 |
| Median Family Income | 1,012 | $104,239 |
| Mean Family Income | 1,012 | $128,648 |
| Median Household Income | 1,501 | $80,750 |
| Mean Household Income | 1,501 | $103,895 |
| Income Deficit | 1,012 | $0 |
| Wage / Income Gap (%) | 3,704 | 69.77% |
| Wage / Income Gap ($) | 3,704 | 30.23¢ per $1 |
| Gini / Inequality Index | 3,704 | 0.44 |
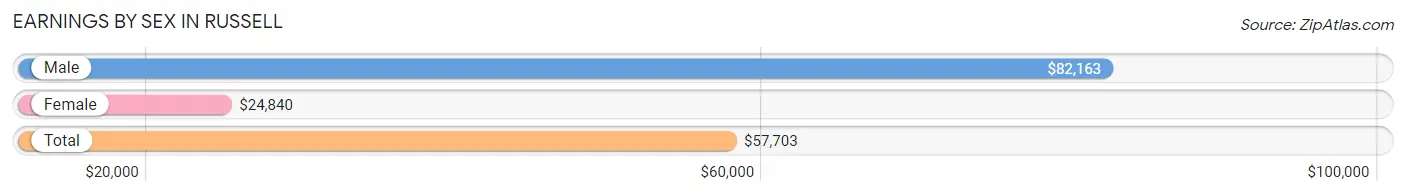
Earnings by Sex in Russell
Average Earnings in Russell are $57,703, $82,163 for men and $24,840 for women, a difference of 69.8%.
| Sex | Number | Average Earnings |
| Male | 900 (56.2%) | $82,163 |
| Female | 701 (43.8%) | $24,840 |
| Total | 1,601 (100.0%) | $57,703 |
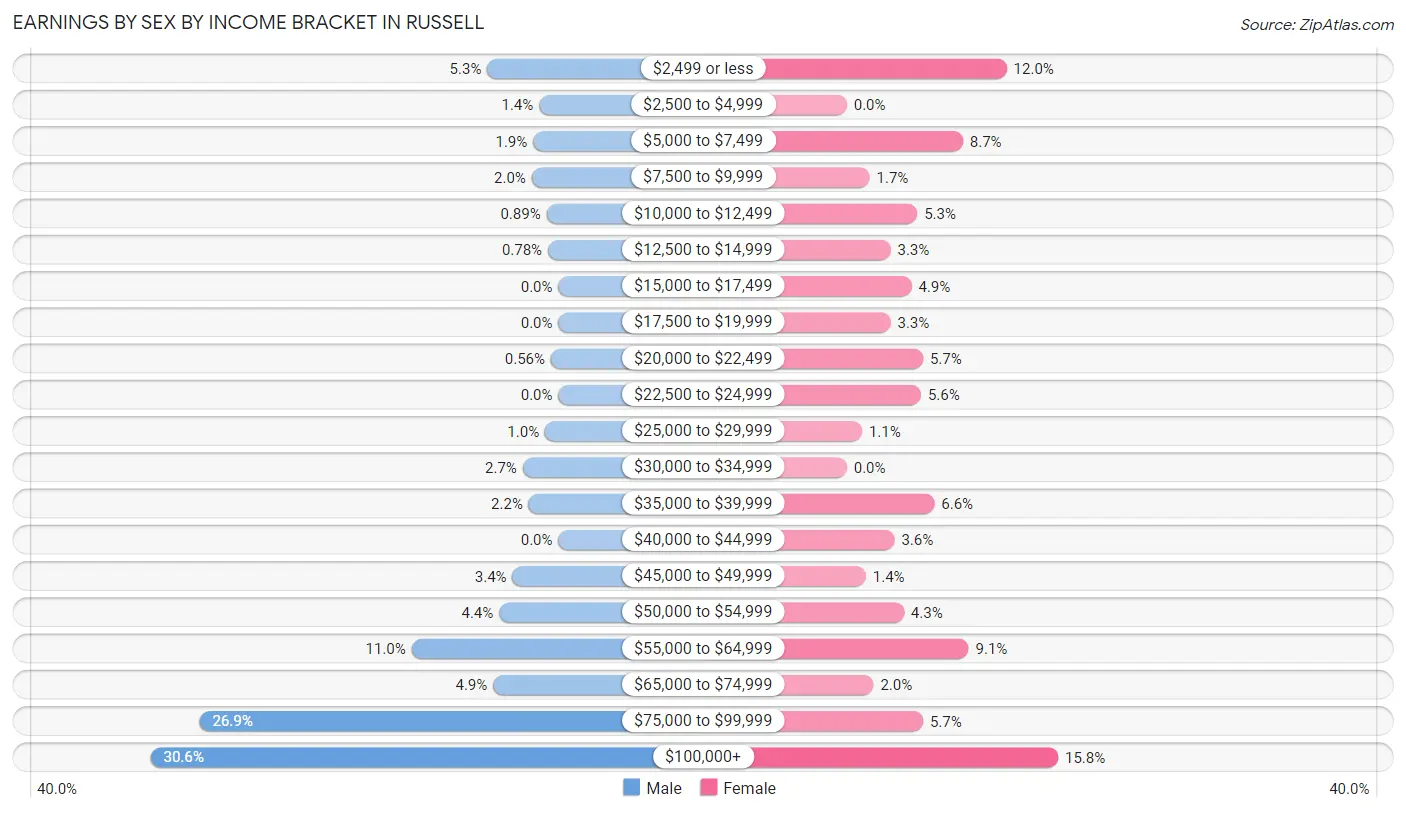
Earnings by Sex by Income Bracket in Russell
The most common earnings brackets in Russell are $100,000+ for men (275 | 30.6%) and $100,000+ for women (111 | 15.8%).
| Income | Male | Female |
| $2,499 or less | 48 (5.3%) | 84 (12.0%) |
| $2,500 to $4,999 | 13 (1.4%) | 0 (0.0%) |
| $5,000 to $7,499 | 17 (1.9%) | 61 (8.7%) |
| $7,500 to $9,999 | 18 (2.0%) | 12 (1.7%) |
| $10,000 to $12,499 | 8 (0.9%) | 37 (5.3%) |
| $12,500 to $14,999 | 7 (0.8%) | 23 (3.3%) |
| $15,000 to $17,499 | 0 (0.0%) | 34 (4.9%) |
| $17,500 to $19,999 | 0 (0.0%) | 23 (3.3%) |
| $20,000 to $22,499 | 5 (0.6%) | 40 (5.7%) |
| $22,500 to $24,999 | 0 (0.0%) | 39 (5.6%) |
| $25,000 to $29,999 | 9 (1.0%) | 8 (1.1%) |
| $30,000 to $34,999 | 24 (2.7%) | 0 (0.0%) |
| $35,000 to $39,999 | 20 (2.2%) | 46 (6.6%) |
| $40,000 to $44,999 | 0 (0.0%) | 25 (3.6%) |
| $45,000 to $49,999 | 31 (3.4%) | 10 (1.4%) |
| $50,000 to $54,999 | 40 (4.4%) | 30 (4.3%) |
| $55,000 to $64,999 | 99 (11.0%) | 64 (9.1%) |
| $65,000 to $74,999 | 44 (4.9%) | 14 (2.0%) |
| $75,000 to $99,999 | 242 (26.9%) | 40 (5.7%) |
| $100,000+ | 275 (30.6%) | 111 (15.8%) |
| Total | 900 (100.0%) | 701 (100.0%) |
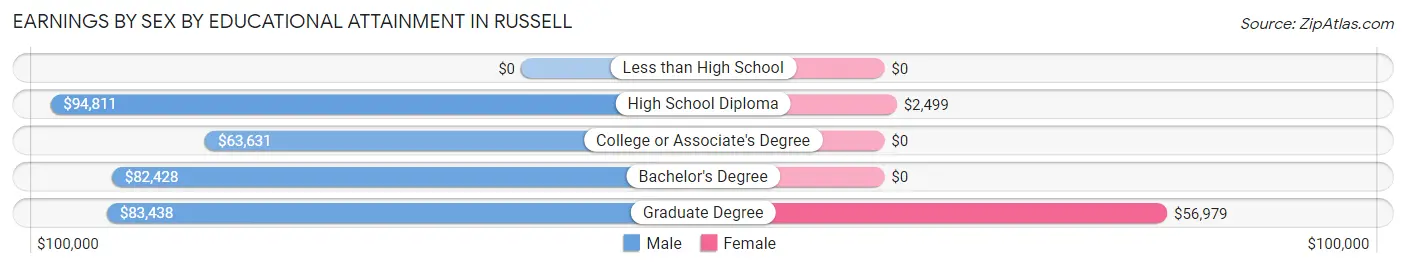
Earnings by Sex by Educational Attainment in Russell
Average earnings in Russell are $82,428 for men and $48,875 for women, a difference of 40.7%. Men with an educational attainment of high school diploma enjoy the highest average annual earnings of $94,811, while those with college or associate's degree education earn the least with $63,631. Women with an educational attainment of graduate degree earn the most with the average annual earnings of $56,979, while those with high school diploma education have the smallest earnings of $2,499.
| Educational Attainment | Male Income | Female Income |
| Less than High School | - | - |
| High School Diploma | $94,811 | $2,499 |
| College or Associate's Degree | $63,631 | $0 |
| Bachelor's Degree | $82,428 | $0 |
| Graduate Degree | $83,438 | $56,979 |
| Total | $82,428 | $48,875 |
Family Income in Russell
Family Income Brackets in Russell
According to the Russell family income data, there are 238 families falling into the $100,000 to $149,999 income range, which is the most common income bracket and makes up 23.5% of all families.
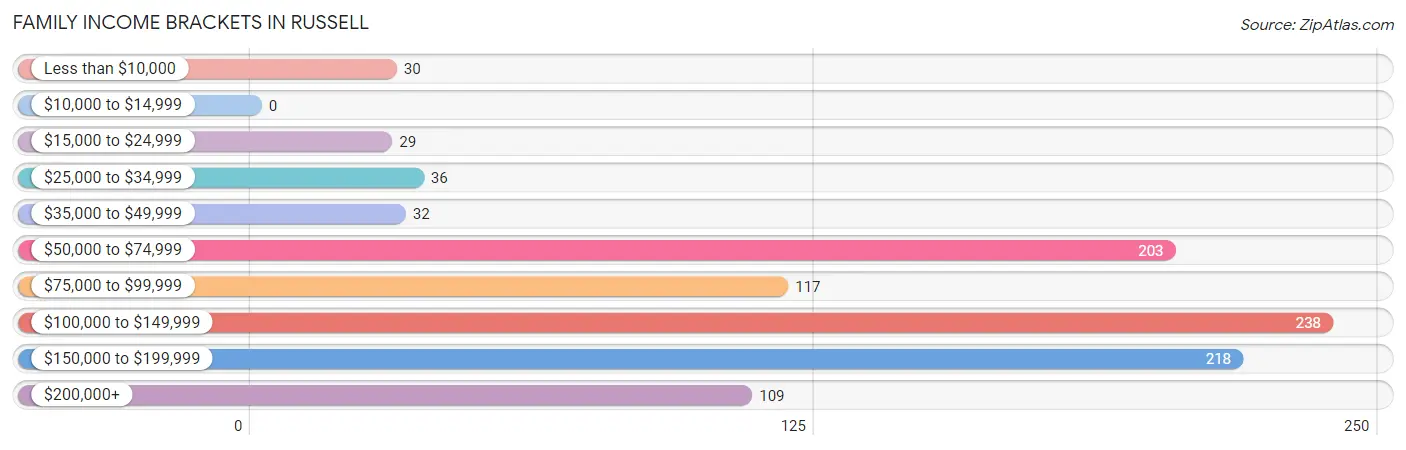
| Income Bracket | # Families | % Families |
| Less than $10,000 | 30 | 3.0% |
| $10,000 to $14,999 | 0 | 0.0% |
| $15,000 to $24,999 | 29 | 2.9% |
| $25,000 to $34,999 | 36 | 3.6% |
| $35,000 to $49,999 | 32 | 3.2% |
| $50,000 to $74,999 | 203 | 20.1% |
| $75,000 to $99,999 | 117 | 11.6% |
| $100,000 to $149,999 | 238 | 23.5% |
| $150,000 to $199,999 | 218 | 21.5% |
| $200,000+ | 109 | 10.8% |
Family Income by Famaliy Size in Russell
5-person families (153 | 15.1%) account for the highest median family income in Russell with $157,154 per family, while 3-person families (225 | 22.2%) have the highest median income of $41,369 per family member.
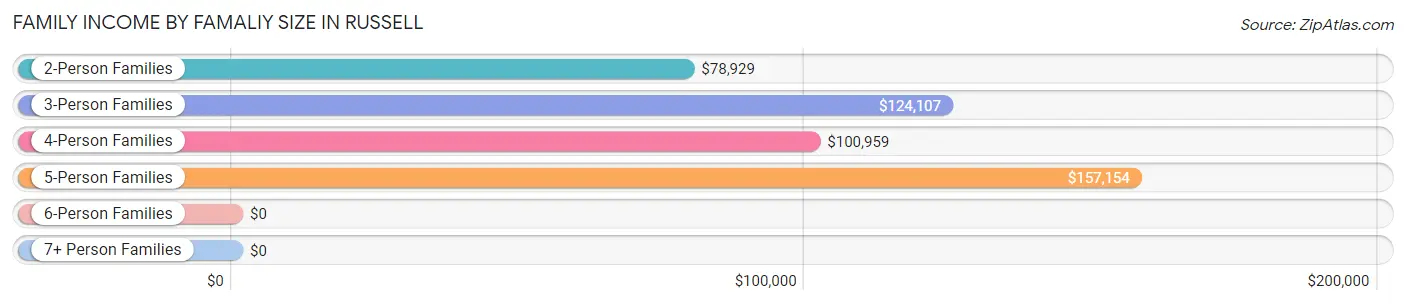
| Income Bracket | # Families | Median Income |
| 2-Person Families | 322 (31.8%) | $78,929 |
| 3-Person Families | 225 (22.2%) | $124,107 |
| 4-Person Families | 285 (28.2%) | $100,959 |
| 5-Person Families | 153 (15.1%) | $157,154 |
| 6-Person Families | 17 (1.7%) | $0 |
| 7+ Person Families | 10 (1.0%) | $0 |
| Total | 1,012 (100.0%) | $104,239 |
Family Income by Number of Earners in Russell
The median family income in Russell is $104,239, with families comprising 3+ earners (72) having the highest median family income of $156,543, while families with no earners (186) have the lowest median family income of $64,167, accounting for 7.1% and 18.4% of families, respectively.
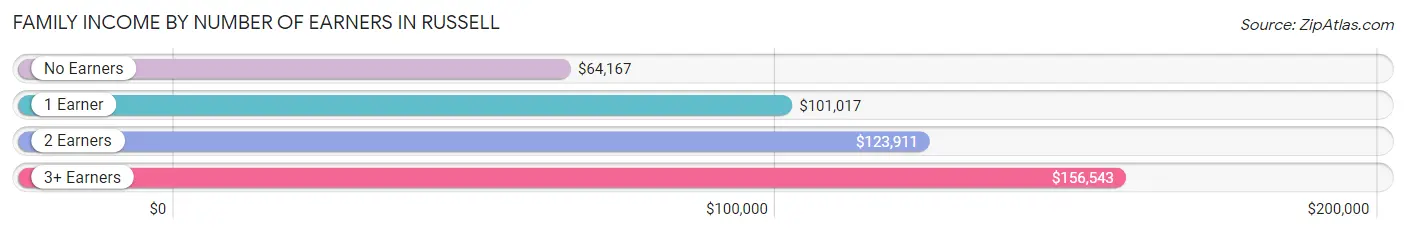
| Number of Earners | # Families | Median Income |
| No Earners | 186 (18.4%) | $64,167 |
| 1 Earner | 335 (33.1%) | $101,017 |
| 2 Earners | 419 (41.4%) | $123,911 |
| 3+ Earners | 72 (7.1%) | $156,543 |
| Total | 1,012 (100.0%) | $104,239 |
Household Income in Russell
Household Income Brackets in Russell
With 299 households falling in the category, the $50,000 to $74,999 income range is the most frequent in Russell, accounting for 19.9% of all households. In contrast, only 11 households (0.7%) fall into the $10,000 to $14,999 income bracket, making it the least populous group.
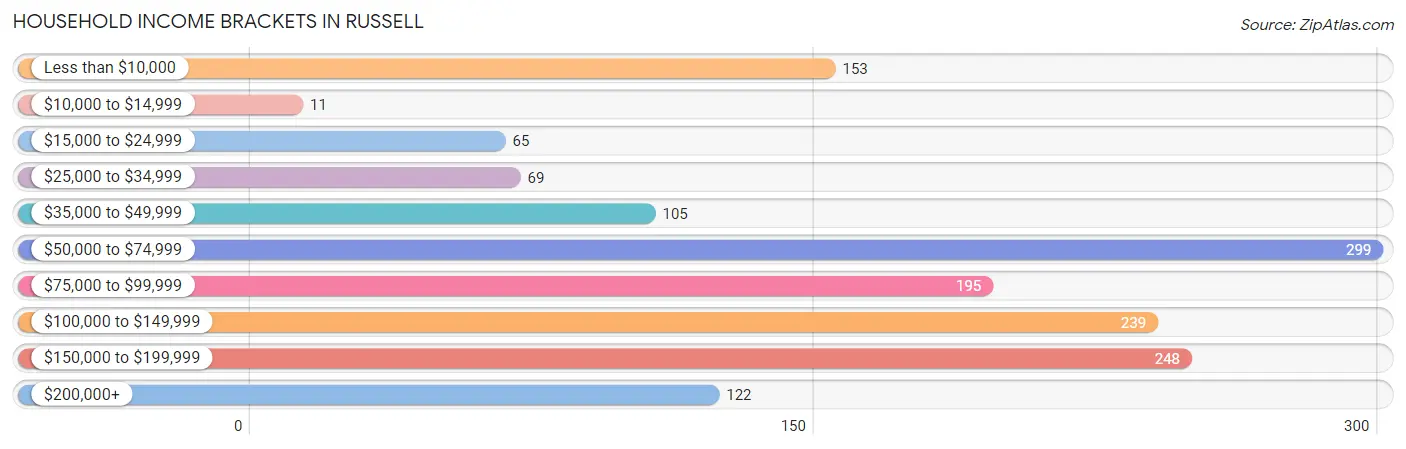
| Income Bracket | # Households | % Households |
| Less than $10,000 | 153 | 10.2% |
| $10,000 to $14,999 | 11 | 0.7% |
| $15,000 to $24,999 | 65 | 4.3% |
| $25,000 to $34,999 | 69 | 4.6% |
| $35,000 to $49,999 | 105 | 7.0% |
| $50,000 to $74,999 | 299 | 19.9% |
| $75,000 to $99,999 | 195 | 13.0% |
| $100,000 to $149,999 | 239 | 15.9% |
| $150,000 to $199,999 | 248 | 16.5% |
| $200,000+ | 122 | 8.1% |
Household Income by Householder Age in Russell
The median household income in Russell is $80,750, with the highest median household income of $113,257 found in the 25 to 44 years age bracket for the primary householder. A total of 429 households (28.6%) fall into this category. Meanwhile, the 15 to 24 years age bracket for the primary householder has the lowest median household income of $0, with 88 households (5.9%) in this group.
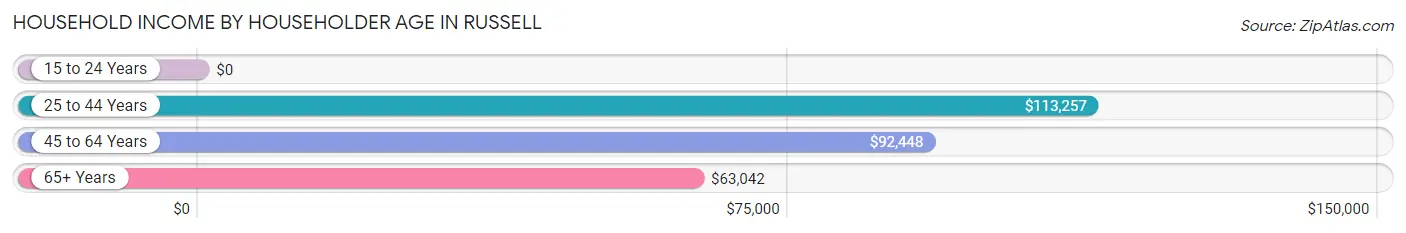
| Income Bracket | # Households | Median Income |
| 15 to 24 Years | 88 (5.9%) | $0 |
| 25 to 44 Years | 429 (28.6%) | $113,257 |
| 45 to 64 Years | 541 (36.0%) | $92,448 |
| 65+ Years | 443 (29.5%) | $63,042 |
| Total | 1,501 (100.0%) | $80,750 |
Poverty in Russell
Income Below Poverty by Sex and Age in Russell
With 6.6% poverty level for males and 9.3% for females among the residents of Russell, 6 to 11 year old males and under 5 year old females are the most vulnerable to poverty, with 28 males (17.5%) and 40 females (36.7%) in their respective age groups living below the poverty level.
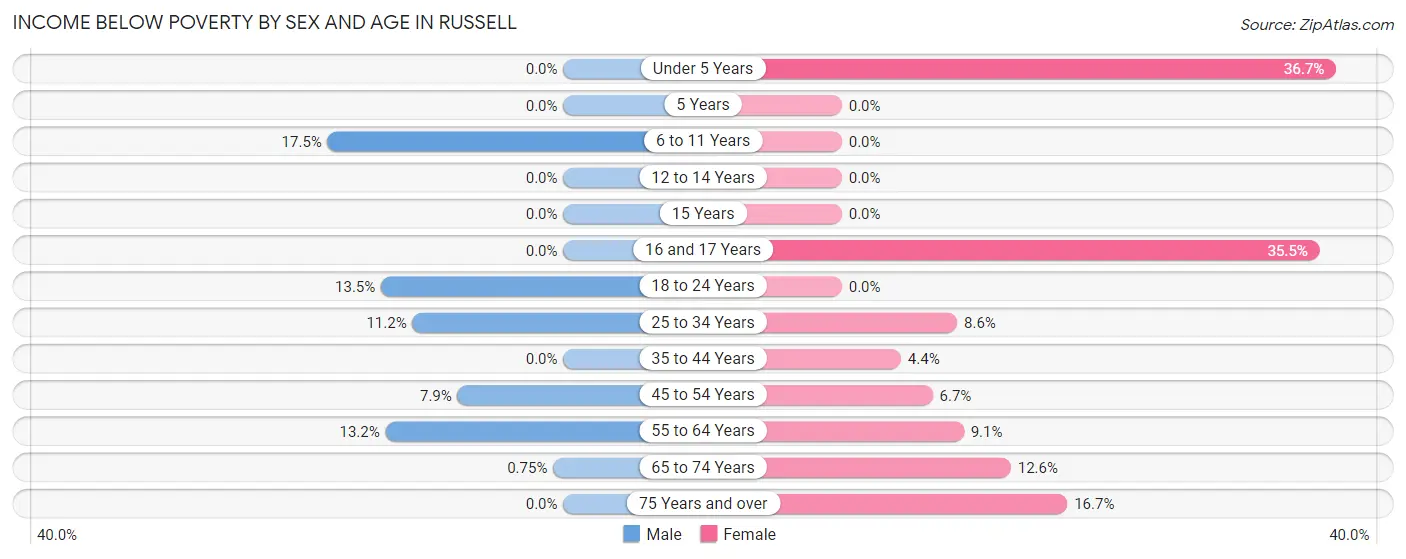
| Age Bracket | Male | Female |
| Under 5 Years | 0 (0.0%) | 40 (36.7%) |
| 5 Years | 0 (0.0%) | 0 (0.0%) |
| 6 to 11 Years | 28 (17.5%) | 0 (0.0%) |
| 12 to 14 Years | 0 (0.0%) | 0 (0.0%) |
| 15 Years | 0 (0.0%) | 0 (0.0%) |
| 16 and 17 Years | 0 (0.0%) | 11 (35.5%) |
| 18 to 24 Years | 23 (13.5%) | 0 (0.0%) |
| 25 to 34 Years | 14 (11.2%) | 22 (8.6%) |
| 35 to 44 Years | 0 (0.0%) | 10 (4.4%) |
| 45 to 54 Years | 19 (7.9%) | 12 (6.7%) |
| 55 to 64 Years | 33 (13.2%) | 18 (9.0%) |
| 65 to 74 Years | 1 (0.7%) | 30 (12.6%) |
| 75 Years and over | 0 (0.0%) | 36 (16.7%) |
| Total | 118 (6.6%) | 179 (9.3%) |
Income Above Poverty by Sex and Age in Russell
According to the poverty statistics in Russell, males aged under 5 years and females aged 5 years are the age groups that are most secure financially, with 100.0% of males and 100.0% of females in these age groups living above the poverty line.
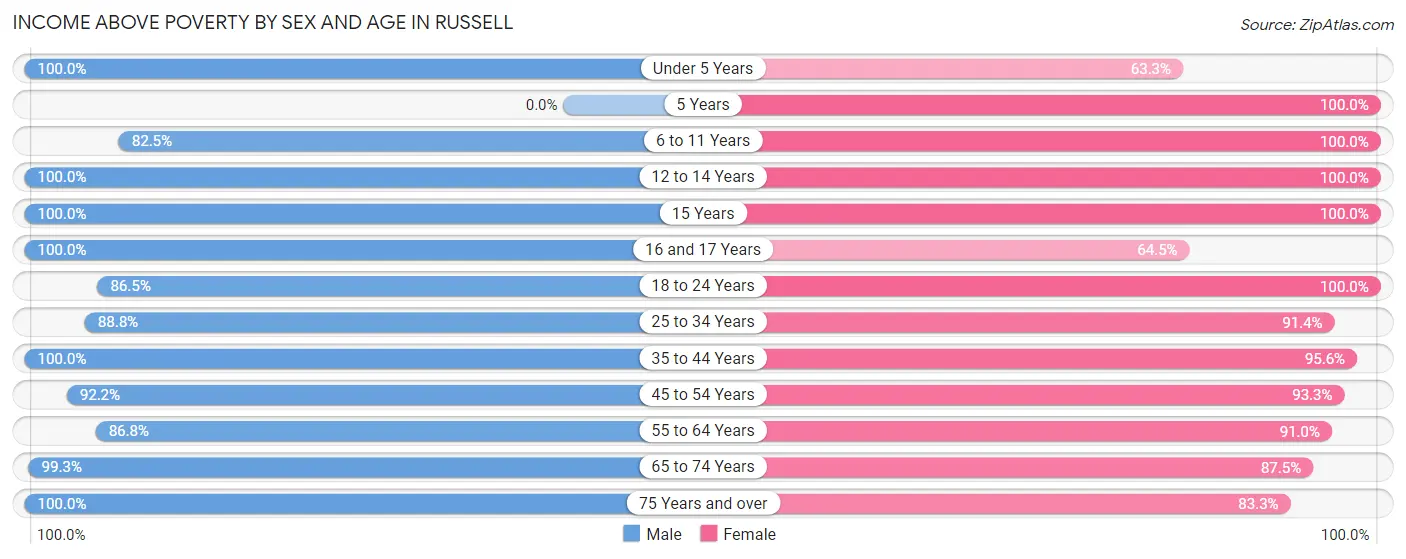
| Age Bracket | Male | Female |
| Under 5 Years | 135 (100.0%) | 69 (63.3%) |
| 5 Years | 0 (0.0%) | 45 (100.0%) |
| 6 to 11 Years | 132 (82.5%) | 210 (100.0%) |
| 12 to 14 Years | 58 (100.0%) | 27 (100.0%) |
| 15 Years | 54 (100.0%) | 24 (100.0%) |
| 16 and 17 Years | 87 (100.0%) | 20 (64.5%) |
| 18 to 24 Years | 147 (86.5%) | 154 (100.0%) |
| 25 to 34 Years | 111 (88.8%) | 235 (91.4%) |
| 35 to 44 Years | 283 (100.0%) | 218 (95.6%) |
| 45 to 54 Years | 223 (92.1%) | 166 (93.3%) |
| 55 to 64 Years | 217 (86.8%) | 181 (90.9%) |
| 65 to 74 Years | 132 (99.3%) | 209 (87.5%) |
| 75 Years and over | 86 (100.0%) | 179 (83.3%) |
| Total | 1,665 (93.4%) | 1,737 (90.7%) |
Income Below Poverty Among Married-Couple Families in Russell
The poverty statistics for married-couple families in Russell show that 0.9% or 8 of the total 848 families live below the poverty line. Families with no children have the highest poverty rate of 2.1%, comprising of 8 families. On the other hand, families with 1 or 2 children have the lowest poverty rate of 0.0%, which includes 0 families.
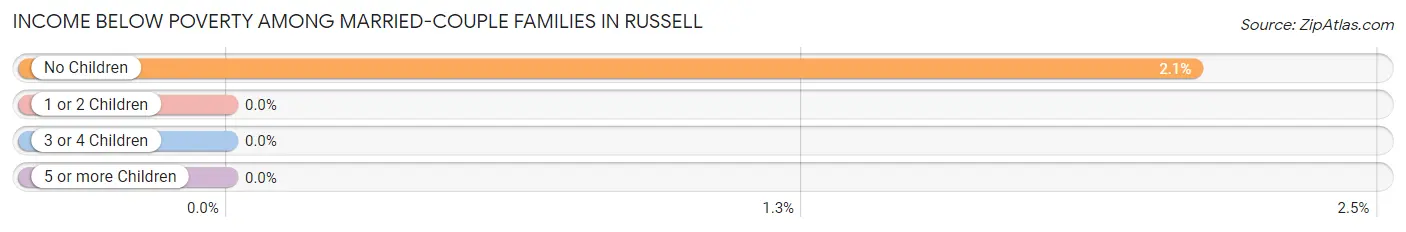
| Children | Above Poverty | Below Poverty |
| No Children | 373 (97.9%) | 8 (2.1%) |
| 1 or 2 Children | 366 (100.0%) | 0 (0.0%) |
| 3 or 4 Children | 91 (100.0%) | 0 (0.0%) |
| 5 or more Children | 10 (100.0%) | 0 (0.0%) |
| Total | 840 (99.1%) | 8 (0.9%) |
Income Below Poverty Among Single-Parent Households in Russell
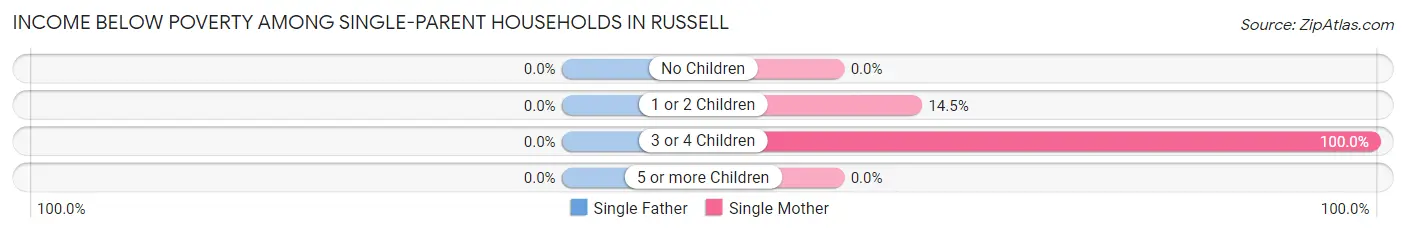
| Children | Single Father | Single Mother |
| No Children | 0 (0.0%) | 0 (0.0%) |
| 1 or 2 Children | 0 (0.0%) | 10 (14.5%) |
| 3 or 4 Children | 0 (0.0%) | 22 (100.0%) |
| 5 or more Children | 0 (0.0%) | 0 (0.0%) |
| Total | 0 (0.0%) | 32 (25.2%) |
Income Below Poverty Among Married-Couple vs Single-Parent Households in Russell
The poverty data for Russell shows that 8 of the married-couple family households (0.9%) and 32 of the single-parent households (19.5%) are living below the poverty level. Within the married-couple family households, those with no children have the highest poverty rate, with 8 households (2.1%) falling below the poverty line. Among the single-parent households, those with 3 or 4 children have the highest poverty rate, with 22 household (100.0%) living below poverty.
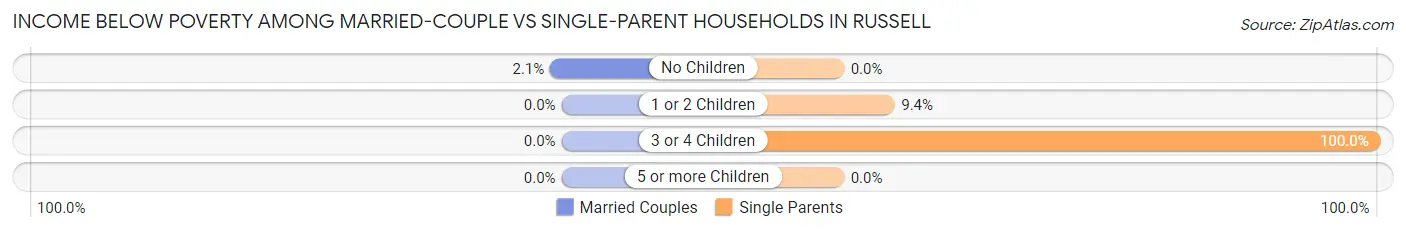
| Children | Married-Couple Families | Single-Parent Households |
| No Children | 8 (2.1%) | 0 (0.0%) |
| 1 or 2 Children | 0 (0.0%) | 10 (9.4%) |
| 3 or 4 Children | 0 (0.0%) | 22 (100.0%) |
| 5 or more Children | 0 (0.0%) | 0 (0.0%) |
| Total | 8 (0.9%) | 32 (19.5%) |
Race in Russell
The most populous races in Russell are White / Caucasian (3,397 | 91.7%), Two or more Races (196 | 5.3%), and Asian (106 | 2.9%).
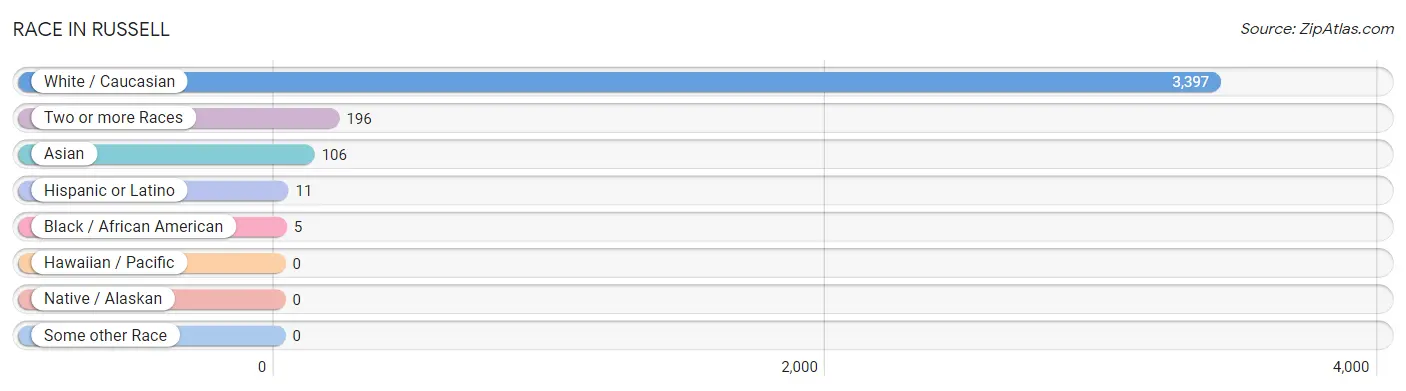
| Race | # Population | % Population |
| Asian | 106 | 2.9% |
| Black / African American | 5 | 0.1% |
| Hawaiian / Pacific | 0 | 0.0% |
| Hispanic or Latino | 11 | 0.3% |
| Native / Alaskan | 0 | 0.0% |
| White / Caucasian | 3,397 | 91.7% |
| Two or more Races | 196 | 5.3% |
| Some other Race | 0 | 0.0% |
| Total | 3,704 | 100.0% |
Ancestry in Russell
The most populous ancestries reported in Russell are American (609 | 16.4%), English (598 | 16.1%), Irish (463 | 12.5%), German (344 | 9.3%), and European (90 | 2.4%), together accounting for 56.8% of all Russell residents.
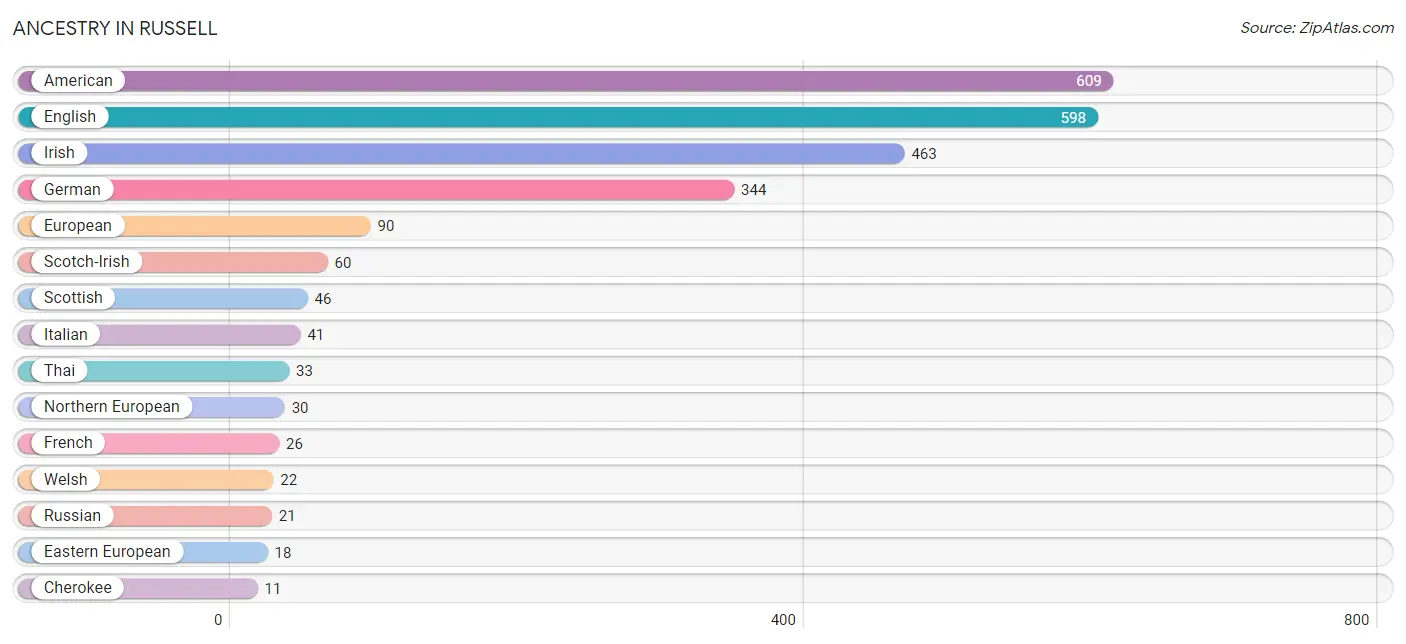
| Ancestry | # Population | % Population |
| American | 609 | 16.4% |
| British | 6 | 0.2% |
| Cherokee | 11 | 0.3% |
| Eastern European | 18 | 0.5% |
| Ecuadorian | 11 | 0.3% |
| English | 598 | 16.1% |
| European | 90 | 2.4% |
| French | 26 | 0.7% |
| German | 344 | 9.3% |
| Irish | 463 | 12.5% |
| Italian | 41 | 1.1% |
| Northern European | 30 | 0.8% |
| Russian | 21 | 0.6% |
| Scotch-Irish | 60 | 1.6% |
| Scottish | 46 | 1.2% |
| South American | 11 | 0.3% |
| Swiss | 6 | 0.2% |
| Thai | 33 | 0.9% |
| Ukrainian | 8 | 0.2% |
| Welsh | 22 | 0.6% | View All 20 Rows |
Immigrants in Russell
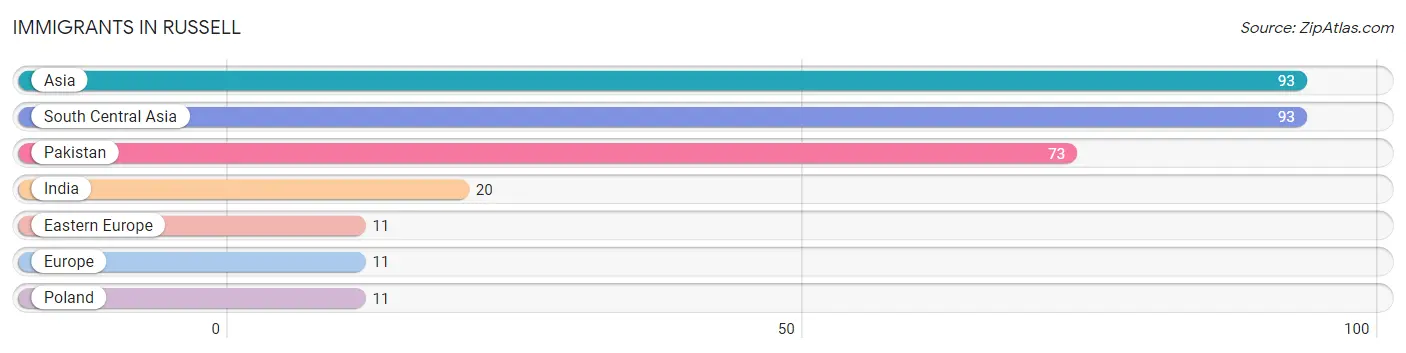
The most numerous immigrant groups reported in Russell came from Asia (93 | 2.5%), South Central Asia (93 | 2.5%), Pakistan (73 | 2.0%), India (20 | 0.5%), and Eastern Europe (11 | 0.3%), together accounting for 7.8% of all Russell residents.
| Immigration Origin | # Population | % Population |
| Asia | 93 | 2.5% |
| Eastern Europe | 11 | 0.3% |
| Europe | 11 | 0.3% |
| India | 20 | 0.5% |
| Pakistan | 73 | 2.0% |
| Poland | 11 | 0.3% |
| South Central Asia | 93 | 2.5% | View All 7 Rows |
Sex and Age in Russell
Sex and Age in Russell
The most populous age groups in Russell are 15 to 19 Years (221 | 12.4%) for men and 30 to 34 Years (173 | 9.0%) for women.
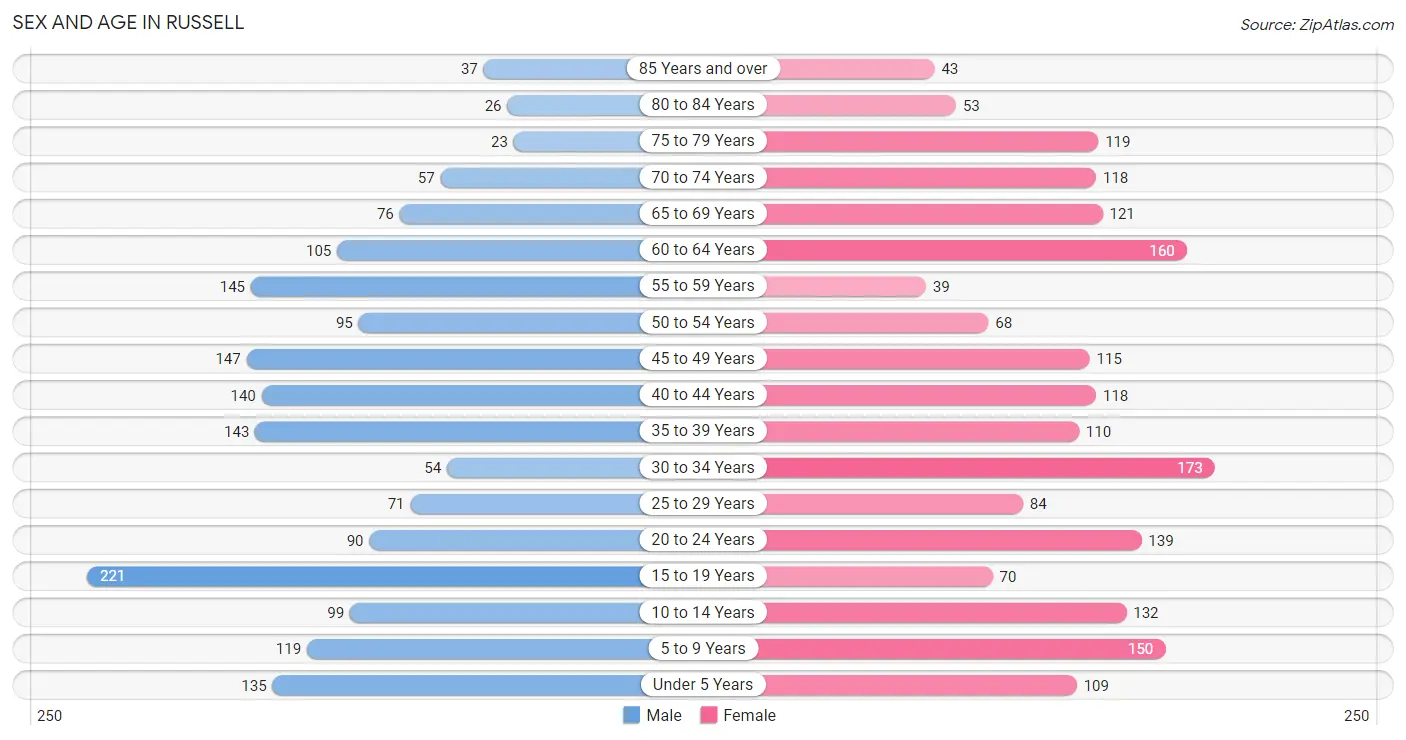
| Age Bracket | Male | Female |
| Under 5 Years | 135 (7.6%) | 109 (5.7%) |
| 5 to 9 Years | 119 (6.7%) | 150 (7.8%) |
| 10 to 14 Years | 99 (5.6%) | 132 (6.9%) |
| 15 to 19 Years | 221 (12.4%) | 70 (3.6%) |
| 20 to 24 Years | 90 (5.1%) | 139 (7.2%) |
| 25 to 29 Years | 71 (4.0%) | 84 (4.4%) |
| 30 to 34 Years | 54 (3.0%) | 173 (9.0%) |
| 35 to 39 Years | 143 (8.0%) | 110 (5.7%) |
| 40 to 44 Years | 140 (7.9%) | 118 (6.1%) |
| 45 to 49 Years | 147 (8.2%) | 115 (6.0%) |
| 50 to 54 Years | 95 (5.3%) | 68 (3.5%) |
| 55 to 59 Years | 145 (8.1%) | 39 (2.0%) |
| 60 to 64 Years | 105 (5.9%) | 160 (8.3%) |
| 65 to 69 Years | 76 (4.3%) | 121 (6.3%) |
| 70 to 74 Years | 57 (3.2%) | 118 (6.1%) |
| 75 to 79 Years | 23 (1.3%) | 119 (6.2%) |
| 80 to 84 Years | 26 (1.5%) | 53 (2.8%) |
| 85 Years and over | 37 (2.1%) | 43 (2.2%) |
| Total | 1,783 (100.0%) | 1,921 (100.0%) |
Families and Households in Russell
Median Family Size in Russell
The median family size in Russell is 3.12 persons per family, with married-couple families (848 | 83.8%) accounting for the largest median family size of 3.22 persons per family. On the other hand, single male/father families (37 | 3.7%) represent the smallest median family size with 1.97 persons per family.
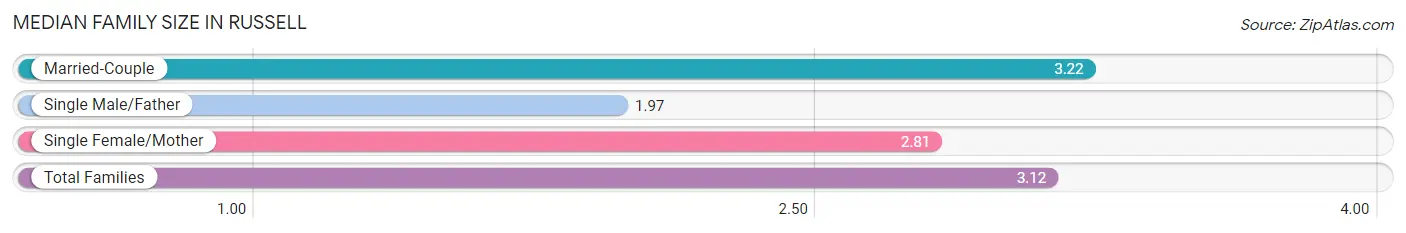
| Family Type | # Families | Family Size |
| Married-Couple | 848 (83.8%) | 3.22 |
| Single Male/Father | 37 (3.7%) | 1.97 |
| Single Female/Mother | 127 (12.6%) | 2.81 |
| Total Families | 1,012 (100.0%) | 3.12 |
Median Household Size in Russell
The median household size in Russell is 2.46 persons per household, with married-couple households (848 | 56.5%) accounting for the largest median household size of 3.22 persons per household. non-family households (489 | 32.6%) represent the smallest median household size with 1.08 persons per household.
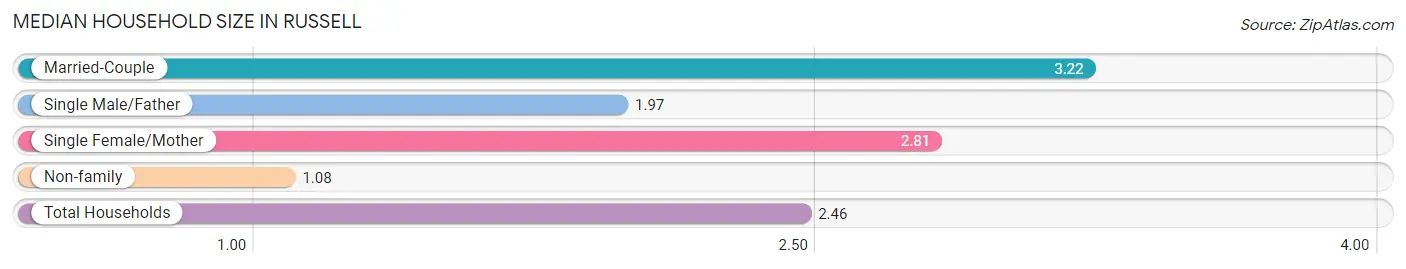
| Household Type | # Households | Household Size |
| Married-Couple | 848 (56.5%) | 3.22 |
| Single Male/Father | 37 (2.5%) | 1.97 |
| Single Female/Mother | 127 (8.5%) | 2.81 |
| Non-family | 489 (32.6%) | 1.08 |
| Total Households | 1,501 (100.0%) | 2.46 |
Household Size by Marriage Status in Russell
Out of a total of 1,501 households in Russell, 1,012 (67.4%) are family households, while 489 (32.6%) are nonfamily households. The most numerous type of family households are 2-person households, comprising 322, and the most common type of nonfamily households are 1-person households, comprising 452.
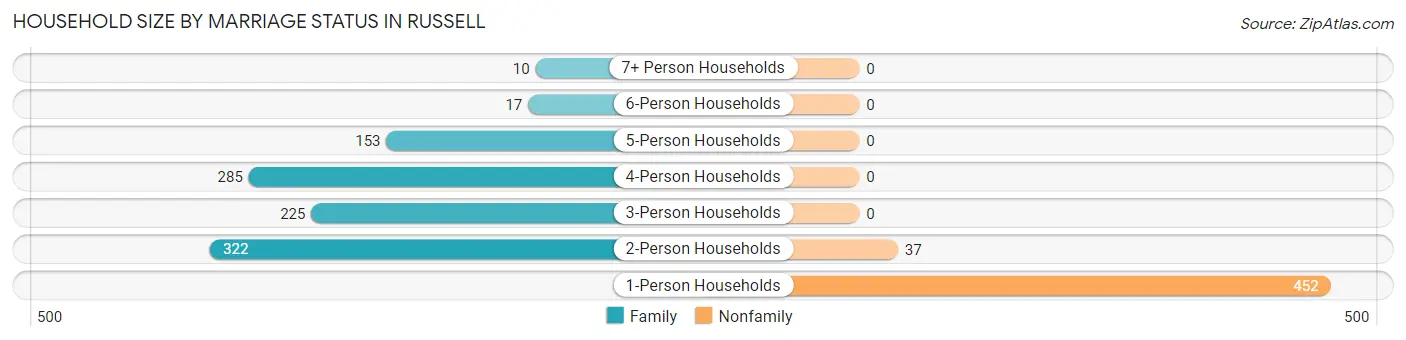
| Household Size | Family Households | Nonfamily Households |
| 1-Person Households | - | 452 (30.1%) |
| 2-Person Households | 322 (21.4%) | 37 (2.5%) |
| 3-Person Households | 225 (15.0%) | 0 (0.0%) |
| 4-Person Households | 285 (19.0%) | 0 (0.0%) |
| 5-Person Households | 153 (10.2%) | 0 (0.0%) |
| 6-Person Households | 17 (1.1%) | 0 (0.0%) |
| 7+ Person Households | 10 (0.7%) | 0 (0.0%) |
| Total | 1,012 (67.4%) | 489 (32.6%) |
Female Fertility in Russell
Fertility by Age in Russell
Average fertility rate in Russell is 58.0 births per 1,000 women. Women in the age bracket of 20 to 34 years have the highest fertility rate with 119.0 births per 1,000 women. Women in the age bracket of 20 to 34 years acount for 100.0% of all women with births.
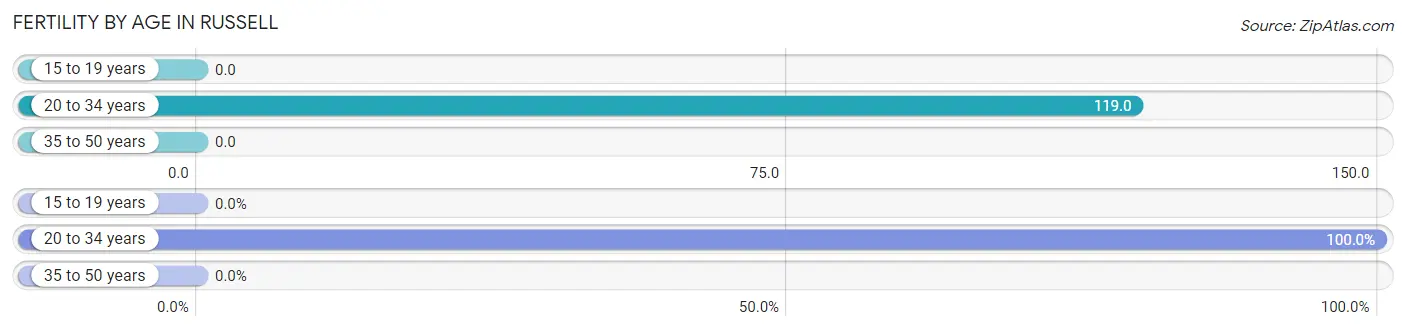
| Age Bracket | Women with Births | Births / 1,000 Women |
| 15 to 19 years | 0 (0.0%) | 0.0 |
| 20 to 34 years | 47 (100.0%) | 119.0 |
| 35 to 50 years | 0 (0.0%) | 0.0 |
| Total | 47 (100.0%) | 58.0 |
Fertility by Age by Marriage Status in Russell
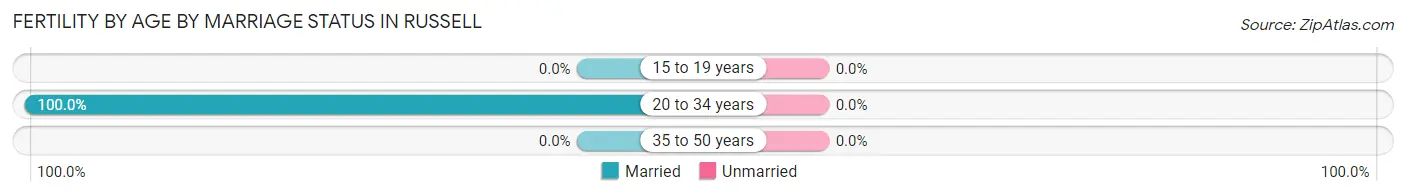
| Age Bracket | Married | Unmarried |
| 15 to 19 years | 0 (0.0%) | 0 (0.0%) |
| 20 to 34 years | 47 (100.0%) | 0 (0.0%) |
| 35 to 50 years | 0 (0.0%) | 0 (0.0%) |
| Total | 47 (100.0%) | 0 (0.0%) |
Fertility by Education in Russell
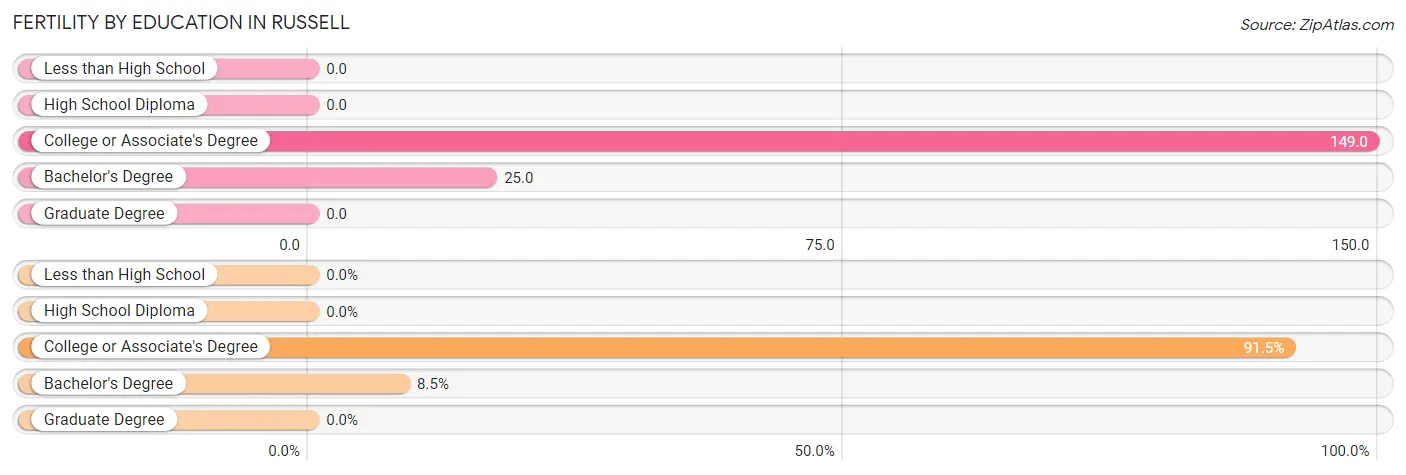
| Educational Attainment | Women with Births | Births / 1,000 Women |
| Less than High School | 0 (0.0%) | 0.0 |
| High School Diploma | 0 (0.0%) | 0.0 |
| College or Associate's Degree | 43 (91.5%) | 149.0 |
| Bachelor's Degree | 4 (8.5%) | 25.0 |
| Graduate Degree | 0 (0.0%) | 0.0 |
| Total | 47 (100.0%) | 58.0 |
Fertility by Education by Marriage Status in Russell
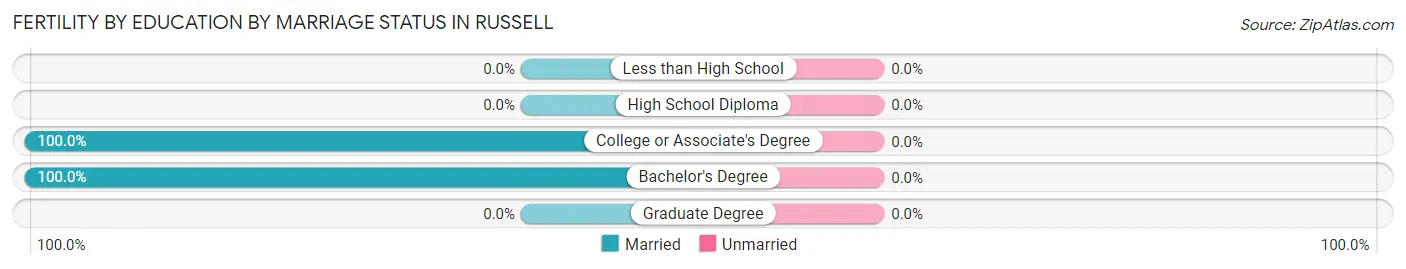
| Educational Attainment | Married | Unmarried |
| Less than High School | 0 (0.0%) | 0 (0.0%) |
| High School Diploma | 0 (0.0%) | 0 (0.0%) |
| College or Associate's Degree | 43 (100.0%) | 0 (0.0%) |
| Bachelor's Degree | 4 (100.0%) | 0 (0.0%) |
| Graduate Degree | 0 (0.0%) | 0 (0.0%) |
| Total | 47 (100.0%) | 0 (0.0%) |
Employment Characteristics in Russell
Employment by Class of Employer in Russell
Among the 1,372 employed individuals in Russell, private company employees (964 | 70.3%), not-for-profit organizations (160 | 11.7%), and federal government employees (75 | 5.5%) make up the most common classes of employment.
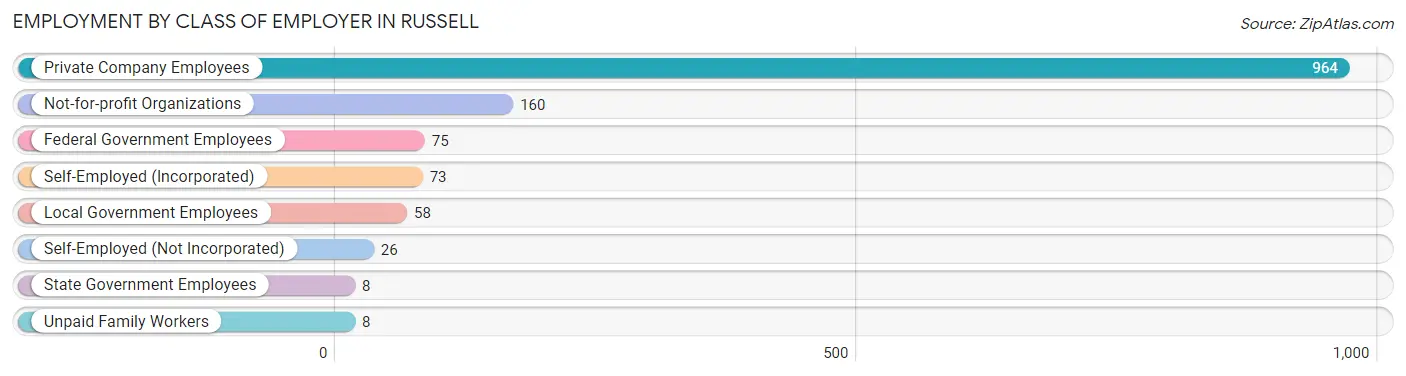
| Employer Class | # Employees | % Employees |
| Private Company Employees | 964 | 70.3% |
| Self-Employed (Incorporated) | 73 | 5.3% |
| Self-Employed (Not Incorporated) | 26 | 1.9% |
| Not-for-profit Organizations | 160 | 11.7% |
| Local Government Employees | 58 | 4.2% |
| State Government Employees | 8 | 0.6% |
| Federal Government Employees | 75 | 5.5% |
| Unpaid Family Workers | 8 | 0.6% |
| Total | 1,372 | 100.0% |
Employment Status by Age in Russell
According to the labor force statistics for Russell, out of the total population over 16 years of age (2,882), 51.1% or 1,473 individuals are in the labor force, with 6.2% or 91 of them unemployed. The age group with the highest labor force participation rate is 35 to 44 years, with 85.1% or 435 individuals in the labor force. Within the labor force, the 16 to 19 years age range has the highest percentage of unemployed individuals, with 32.4% or 11 of them being unemployed.
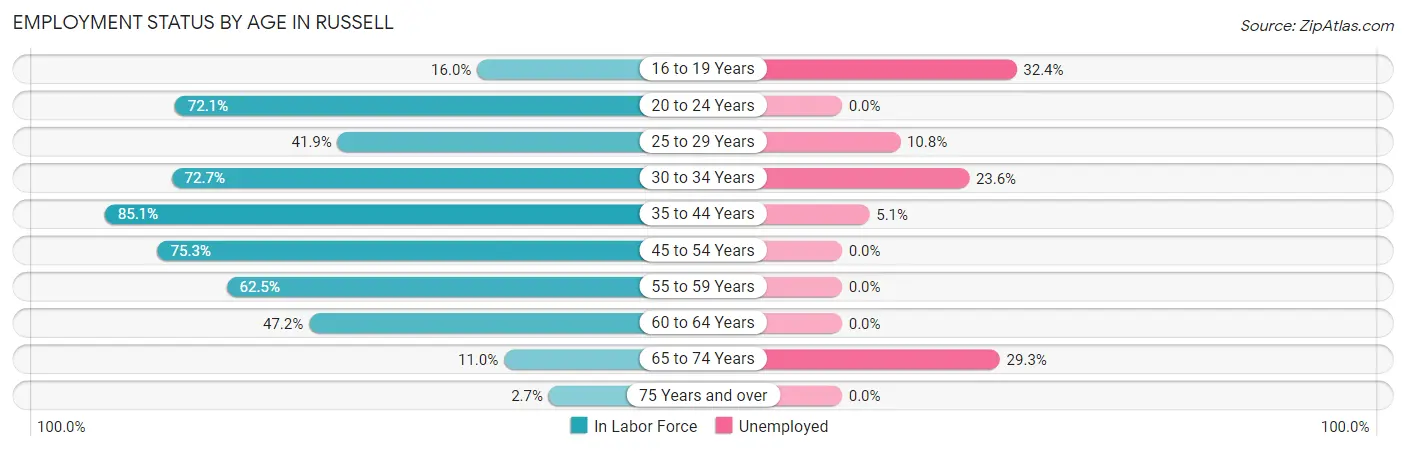
| Age Bracket | In Labor Force | Unemployed |
| 16 to 19 Years | 34 (16.0%) | 11 (32.4%) |
| 20 to 24 Years | 165 (72.1%) | 0 (0.0%) |
| 25 to 29 Years | 65 (41.9%) | 7 (10.8%) |
| 30 to 34 Years | 165 (72.7%) | 39 (23.6%) |
| 35 to 44 Years | 435 (85.1%) | 22 (5.1%) |
| 45 to 54 Years | 320 (75.3%) | 0 (0.0%) |
| 55 to 59 Years | 115 (62.5%) | 0 (0.0%) |
| 60 to 64 Years | 125 (47.2%) | 0 (0.0%) |
| 65 to 74 Years | 41 (11.0%) | 12 (29.3%) |
| 75 Years and over | 8 (2.7%) | 0 (0.0%) |
| Total | 1,473 (51.1%) | 91 (6.2%) |
Employment Status by Educational Attainment in Russell
According to labor force statistics for Russell, 69.3% of individuals (1,225) out of the total population between 25 and 64 years of age (1,767) are in the labor force, with 5.6% or 69 of them being unemployed. The group with the highest labor force participation rate are those with the educational attainment of high school diploma, with 77.7% or 265 individuals in the labor force. Within the labor force, individuals with bachelor's degree or higher education have the highest percentage of unemployment, with 7.3% or 39 of them being unemployed.
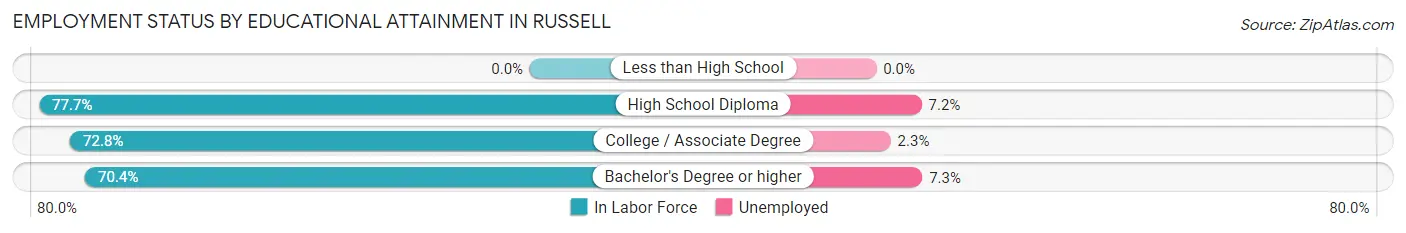
| Educational Attainment | In Labor Force | Unemployed |
| Less than High School | 0 (0.0%) | 0 (0.0%) |
| High School Diploma | 265 (77.7%) | 25 (7.2%) |
| College / Associate Degree | 429 (72.8%) | 14 (2.3%) |
| Bachelor's Degree or higher | 531 (70.4%) | 55 (7.3%) |
| Total | 1,225 (69.3%) | 99 (5.6%) |
Employment Occupations by Sex in Russell
Management, Business, Science and Arts Occupations
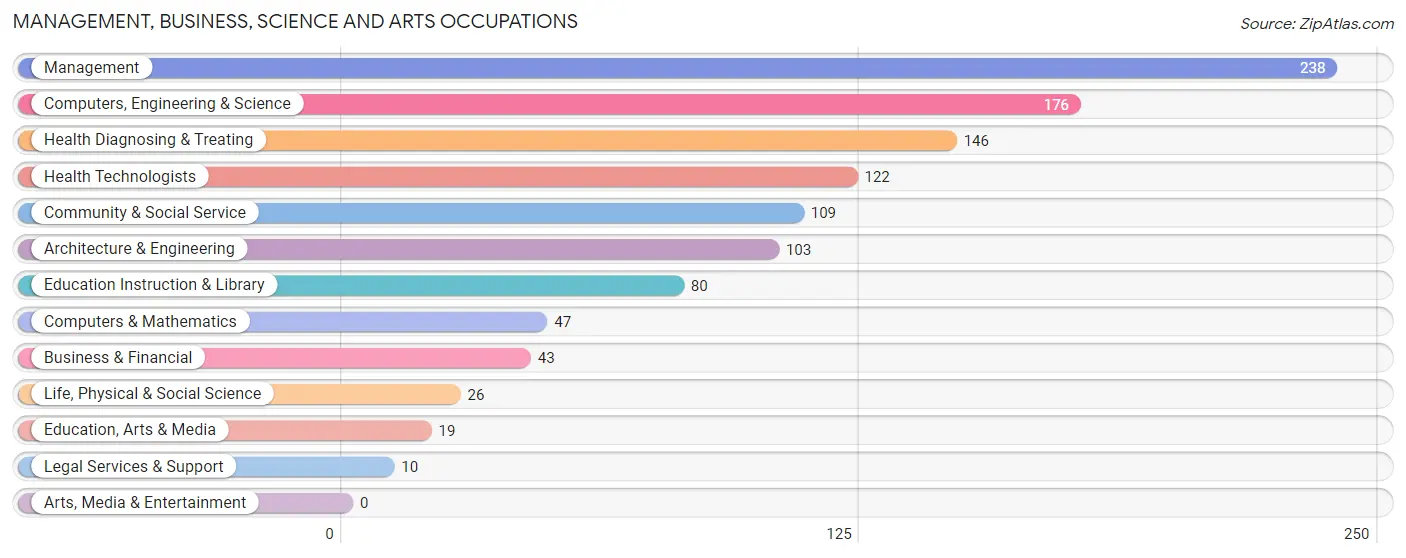
The most common Management, Business, Science and Arts occupations in Russell are Management (238 | 17.2%), Computers, Engineering & Science (176 | 12.7%), Health Diagnosing & Treating (146 | 10.6%), Health Technologists (122 | 8.8%), and Community & Social Service (109 | 7.9%).
Management, Business, Science and Arts Occupations by Sex
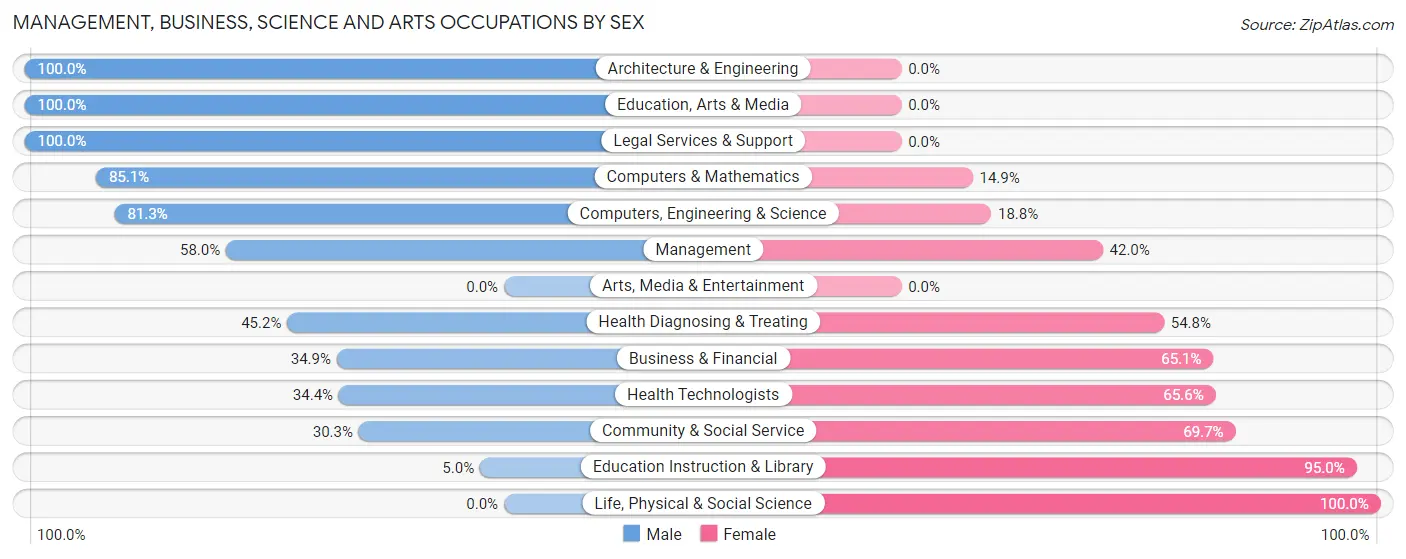
Within the Management, Business, Science and Arts occupations in Russell, the most male-oriented occupations are Architecture & Engineering (100.0%), Education, Arts & Media (100.0%), and Legal Services & Support (100.0%), while the most female-oriented occupations are Life, Physical & Social Science (100.0%), Education Instruction & Library (95.0%), and Community & Social Service (69.7%).
| Occupation | Male | Female |
| Management | 138 (58.0%) | 100 (42.0%) |
| Business & Financial | 15 (34.9%) | 28 (65.1%) |
| Computers, Engineering & Science | 143 (81.2%) | 33 (18.8%) |
| Computers & Mathematics | 40 (85.1%) | 7 (14.9%) |
| Architecture & Engineering | 103 (100.0%) | 0 (0.0%) |
| Life, Physical & Social Science | 0 (0.0%) | 26 (100.0%) |
| Community & Social Service | 33 (30.3%) | 76 (69.7%) |
| Education, Arts & Media | 19 (100.0%) | 0 (0.0%) |
| Legal Services & Support | 10 (100.0%) | 0 (0.0%) |
| Education Instruction & Library | 4 (5.0%) | 76 (95.0%) |
| Arts, Media & Entertainment | 0 (0.0%) | 0 (0.0%) |
| Health Diagnosing & Treating | 66 (45.2%) | 80 (54.8%) |
| Health Technologists | 42 (34.4%) | 80 (65.6%) |
| Total (Category) | 395 (55.5%) | 317 (44.5%) |
| Total (Overall) | 821 (59.4%) | 561 (40.6%) |
Services Occupations
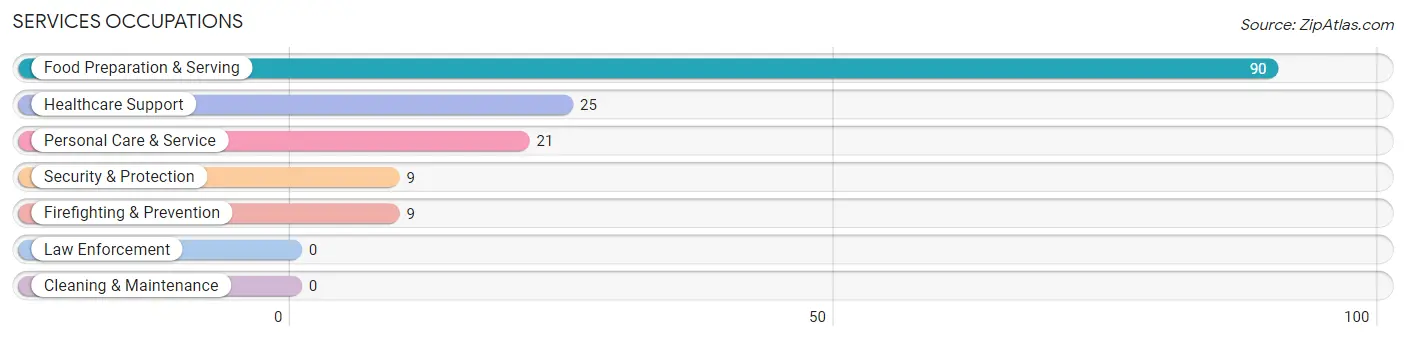
The most common Services occupations in Russell are Food Preparation & Serving (90 | 6.5%), Healthcare Support (25 | 1.8%), Personal Care & Service (21 | 1.5%), Security & Protection (9 | 0.6%), and Firefighting & Prevention (9 | 0.6%).
Services Occupations by Sex
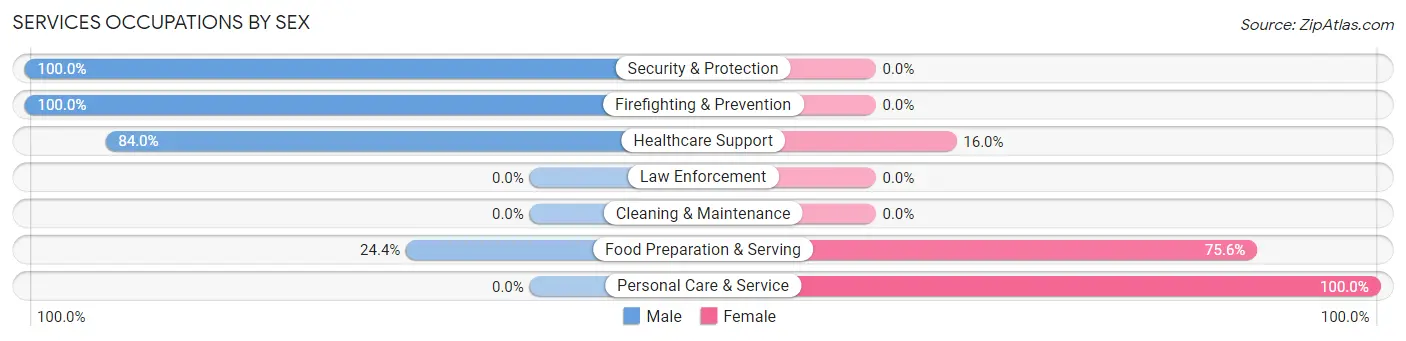
Within the Services occupations in Russell, the most male-oriented occupations are Security & Protection (100.0%), Firefighting & Prevention (100.0%), and Healthcare Support (84.0%), while the most female-oriented occupations are Personal Care & Service (100.0%), Food Preparation & Serving (75.6%), and Healthcare Support (16.0%).
| Occupation | Male | Female |
| Healthcare Support | 21 (84.0%) | 4 (16.0%) |
| Security & Protection | 9 (100.0%) | 0 (0.0%) |
| Firefighting & Prevention | 9 (100.0%) | 0 (0.0%) |
| Law Enforcement | 0 (0.0%) | 0 (0.0%) |
| Food Preparation & Serving | 22 (24.4%) | 68 (75.6%) |
| Cleaning & Maintenance | 0 (0.0%) | 0 (0.0%) |
| Personal Care & Service | 0 (0.0%) | 21 (100.0%) |
| Total (Category) | 52 (35.9%) | 93 (64.1%) |
| Total (Overall) | 821 (59.4%) | 561 (40.6%) |
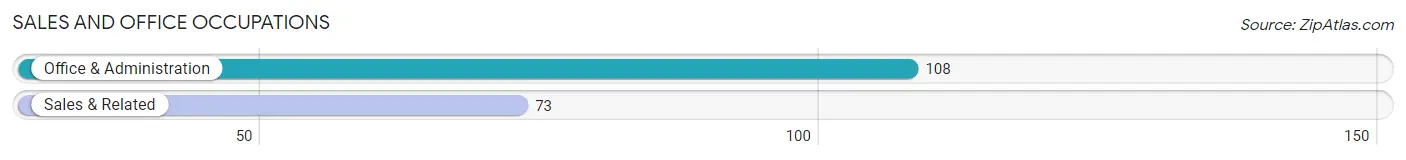
Sales and Office Occupations
The most common Sales and Office occupations in Russell are Office & Administration (108 | 7.8%), and Sales & Related (73 | 5.3%).
Sales and Office Occupations by Sex
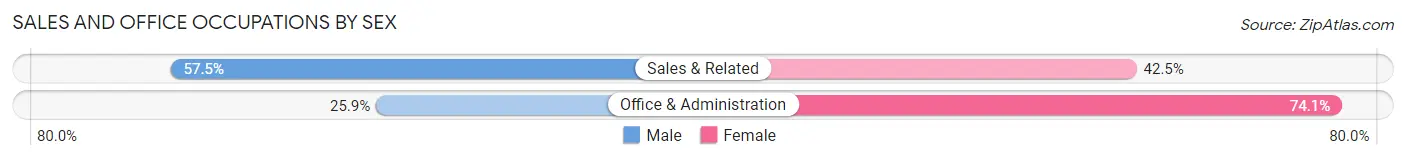
| Occupation | Male | Female |
| Sales & Related | 42 (57.5%) | 31 (42.5%) |
| Office & Administration | 28 (25.9%) | 80 (74.1%) |
| Total (Category) | 70 (38.7%) | 111 (61.3%) |
| Total (Overall) | 821 (59.4%) | 561 (40.6%) |
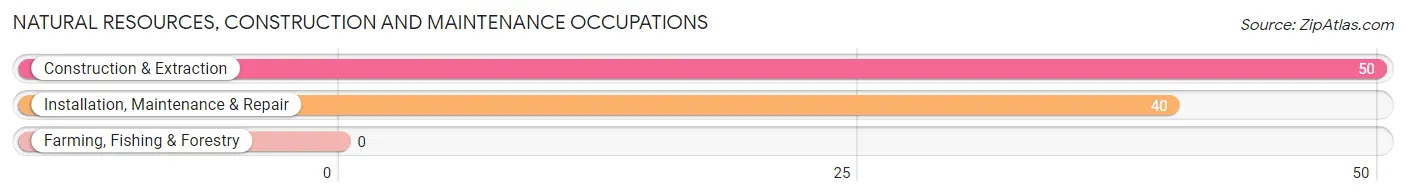
Natural Resources, Construction and Maintenance Occupations
The most common Natural Resources, Construction and Maintenance occupations in Russell are Construction & Extraction (50 | 3.6%), and Installation, Maintenance & Repair (40 | 2.9%).
Natural Resources, Construction and Maintenance Occupations by Sex
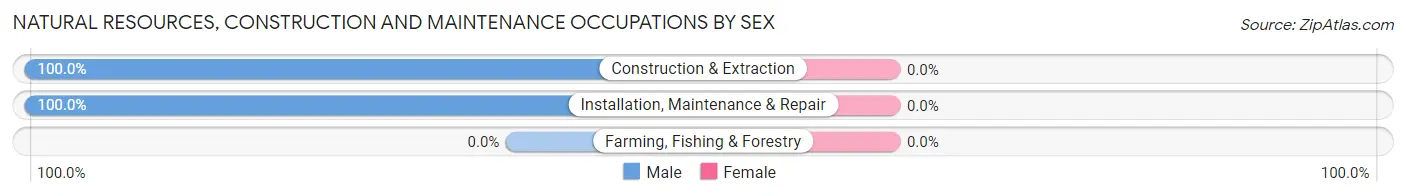
| Occupation | Male | Female |
| Farming, Fishing & Forestry | 0 (0.0%) | 0 (0.0%) |
| Construction & Extraction | 50 (100.0%) | 0 (0.0%) |
| Installation, Maintenance & Repair | 40 (100.0%) | 0 (0.0%) |
| Total (Category) | 90 (100.0%) | 0 (0.0%) |
| Total (Overall) | 821 (59.4%) | 561 (40.6%) |
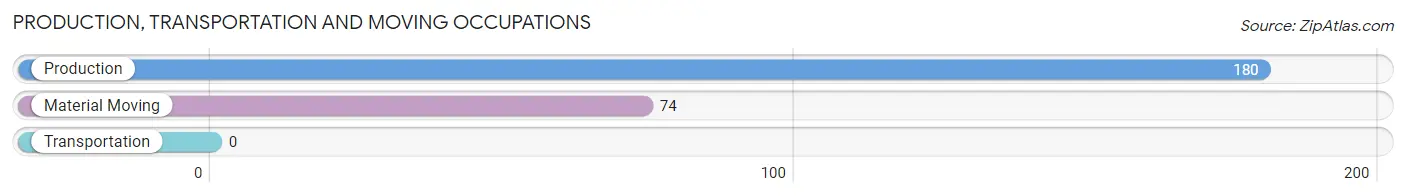
Production, Transportation and Moving Occupations
The most common Production, Transportation and Moving occupations in Russell are Production (180 | 13.0%), and Material Moving (74 | 5.3%).
Production, Transportation and Moving Occupations by Sex
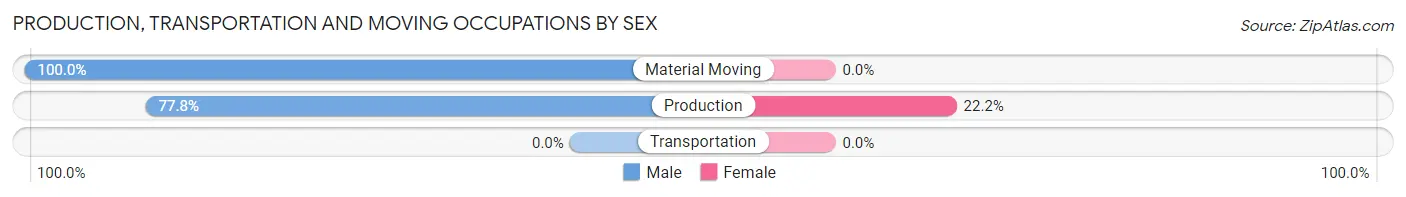
| Occupation | Male | Female |
| Production | 140 (77.8%) | 40 (22.2%) |
| Transportation | 0 (0.0%) | 0 (0.0%) |
| Material Moving | 74 (100.0%) | 0 (0.0%) |
| Total (Category) | 214 (84.3%) | 40 (15.8%) |
| Total (Overall) | 821 (59.4%) | 561 (40.6%) |
Employment Industries by Sex in Russell
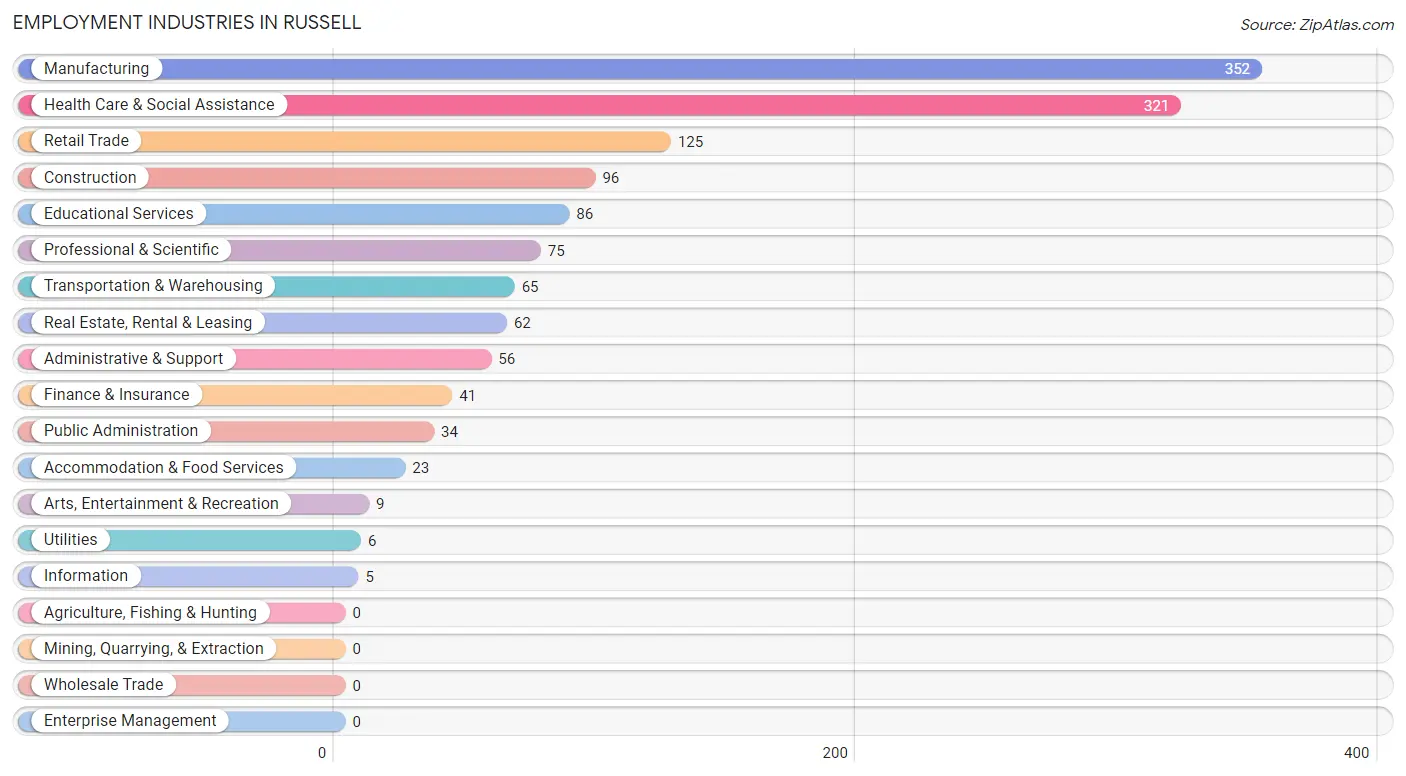
Employment Industries in Russell
The major employment industries in Russell include Manufacturing (352 | 25.5%), Health Care & Social Assistance (321 | 23.2%), Retail Trade (125 | 9.0%), Construction (96 | 7.0%), and Educational Services (86 | 6.2%).
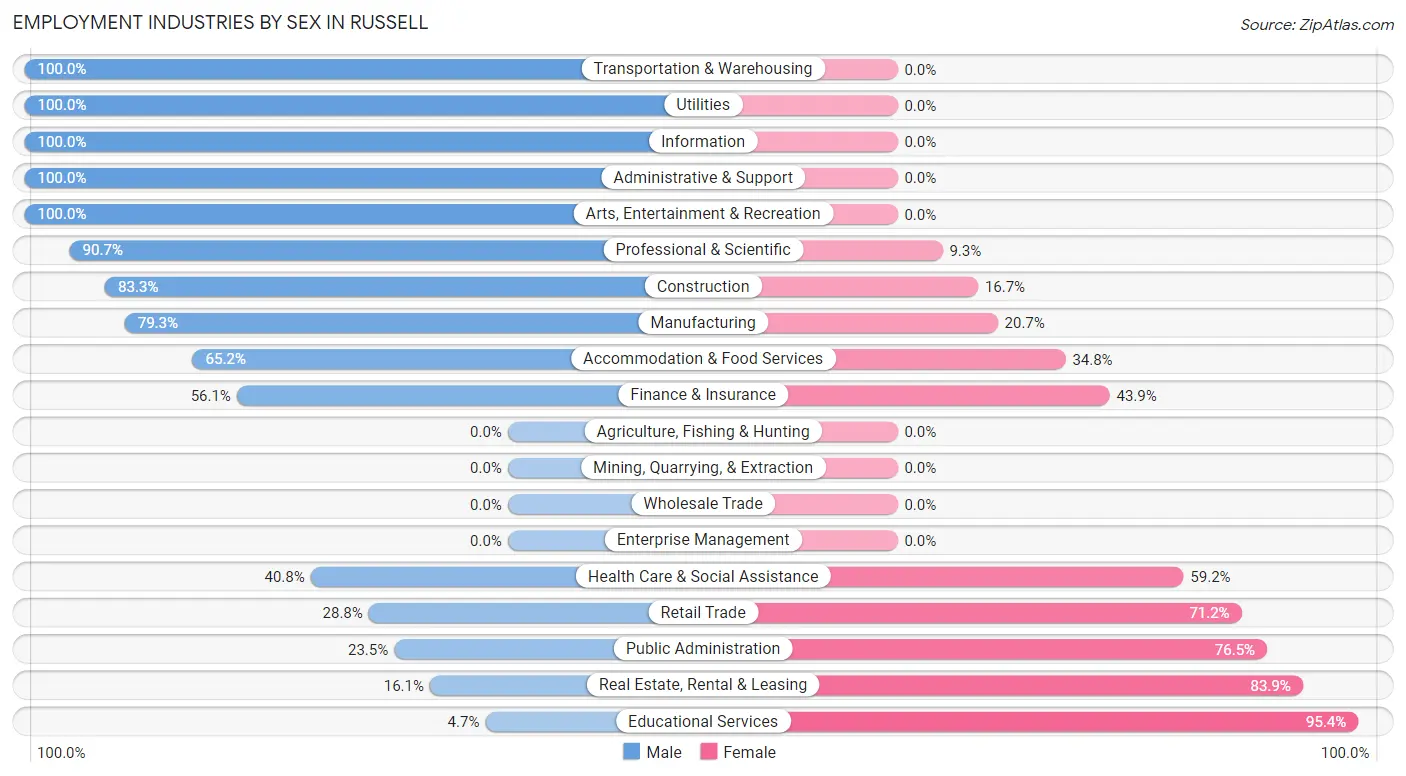
Employment Industries by Sex in Russell
The Russell industries that see more men than women are Transportation & Warehousing (100.0%), Utilities (100.0%), and Information (100.0%), whereas the industries that tend to have a higher number of women are Educational Services (95.4%), Real Estate, Rental & Leasing (83.9%), and Public Administration (76.5%).
| Industry | Male | Female |
| Agriculture, Fishing & Hunting | 0 (0.0%) | 0 (0.0%) |
| Mining, Quarrying, & Extraction | 0 (0.0%) | 0 (0.0%) |
| Construction | 80 (83.3%) | 16 (16.7%) |
| Manufacturing | 279 (79.3%) | 73 (20.7%) |
| Wholesale Trade | 0 (0.0%) | 0 (0.0%) |
| Retail Trade | 36 (28.8%) | 89 (71.2%) |
| Transportation & Warehousing | 65 (100.0%) | 0 (0.0%) |
| Utilities | 6 (100.0%) | 0 (0.0%) |
| Information | 5 (100.0%) | 0 (0.0%) |
| Finance & Insurance | 23 (56.1%) | 18 (43.9%) |
| Real Estate, Rental & Leasing | 10 (16.1%) | 52 (83.9%) |
| Professional & Scientific | 68 (90.7%) | 7 (9.3%) |
| Enterprise Management | 0 (0.0%) | 0 (0.0%) |
| Administrative & Support | 56 (100.0%) | 0 (0.0%) |
| Educational Services | 4 (4.6%) | 82 (95.4%) |
| Health Care & Social Assistance | 131 (40.8%) | 190 (59.2%) |
| Arts, Entertainment & Recreation | 9 (100.0%) | 0 (0.0%) |
| Accommodation & Food Services | 15 (65.2%) | 8 (34.8%) |
| Public Administration | 8 (23.5%) | 26 (76.5%) |
| Total | 821 (59.4%) | 561 (40.6%) |
Education in Russell
School Enrollment in Russell
The most common levels of schooling among the 845 students in Russell are high school (259 | 30.6%), elementary school (224 | 26.5%), and nursery / preschool (91 | 10.8%).
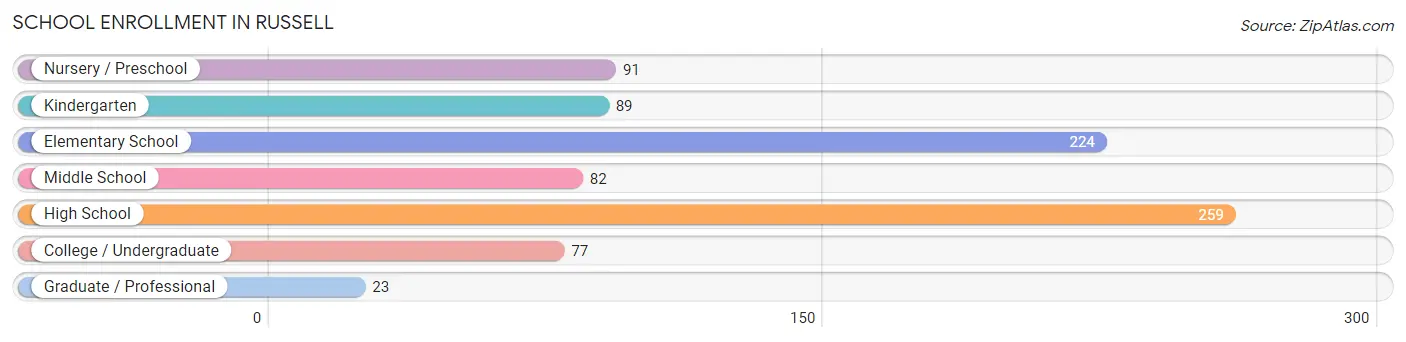
| School Level | # Students | % Students |
| Nursery / Preschool | 91 | 10.8% |
| Kindergarten | 89 | 10.5% |
| Elementary School | 224 | 26.5% |
| Middle School | 82 | 9.7% |
| High School | 259 | 30.6% |
| College / Undergraduate | 77 | 9.1% |
| Graduate / Professional | 23 | 2.7% |
| Total | 845 | 100.0% |
School Enrollment by Age by Funding Source in Russell
Out of a total of 845 students who are enrolled in schools in Russell, 119 (14.1%) attend a private institution, while the remaining 726 (85.9%) are enrolled in public schools. The age group of 20 to 24 year olds has the highest likelihood of being enrolled in private schools, with 11 (57.9% in the age bracket) enrolled. Conversely, the age group of 3 to 4 year olds has the lowest likelihood of being enrolled in a private school, with 83 (100.0% in the age bracket) attending a public institution.
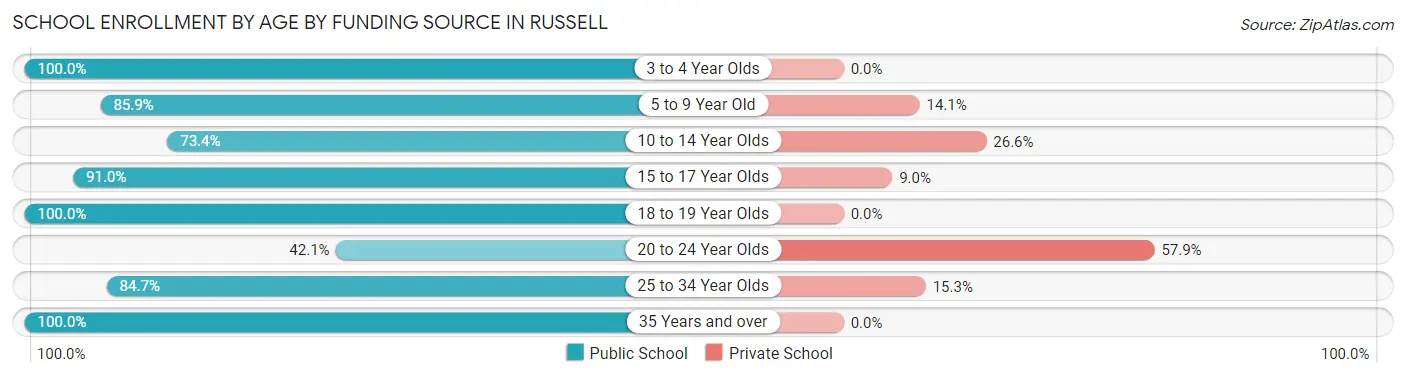
| Age Bracket | Public School | Private School |
| 3 to 4 Year Olds | 83 (100.0%) | 0 (0.0%) |
| 5 to 9 Year Old | 231 (85.9%) | 38 (14.1%) |
| 10 to 14 Year Olds | 116 (73.4%) | 42 (26.6%) |
| 15 to 17 Year Olds | 151 (91.0%) | 15 (9.0%) |
| 18 to 19 Year Olds | 55 (100.0%) | 0 (0.0%) |
| 20 to 24 Year Olds | 8 (42.1%) | 11 (57.9%) |
| 25 to 34 Year Olds | 72 (84.7%) | 13 (15.3%) |
| 35 Years and over | 10 (100.0%) | 0 (0.0%) |
| Total | 726 (85.9%) | 119 (14.1%) |
Educational Attainment by Field of Study in Russell
Education (171 | 18.1%), business (162 | 17.1%), science & technology (118 | 12.5%), engineering (116 | 12.3%), and arts & humanities (80 | 8.5%) are the most common fields of study among 945 individuals in Russell who have obtained a bachelor's degree or higher.
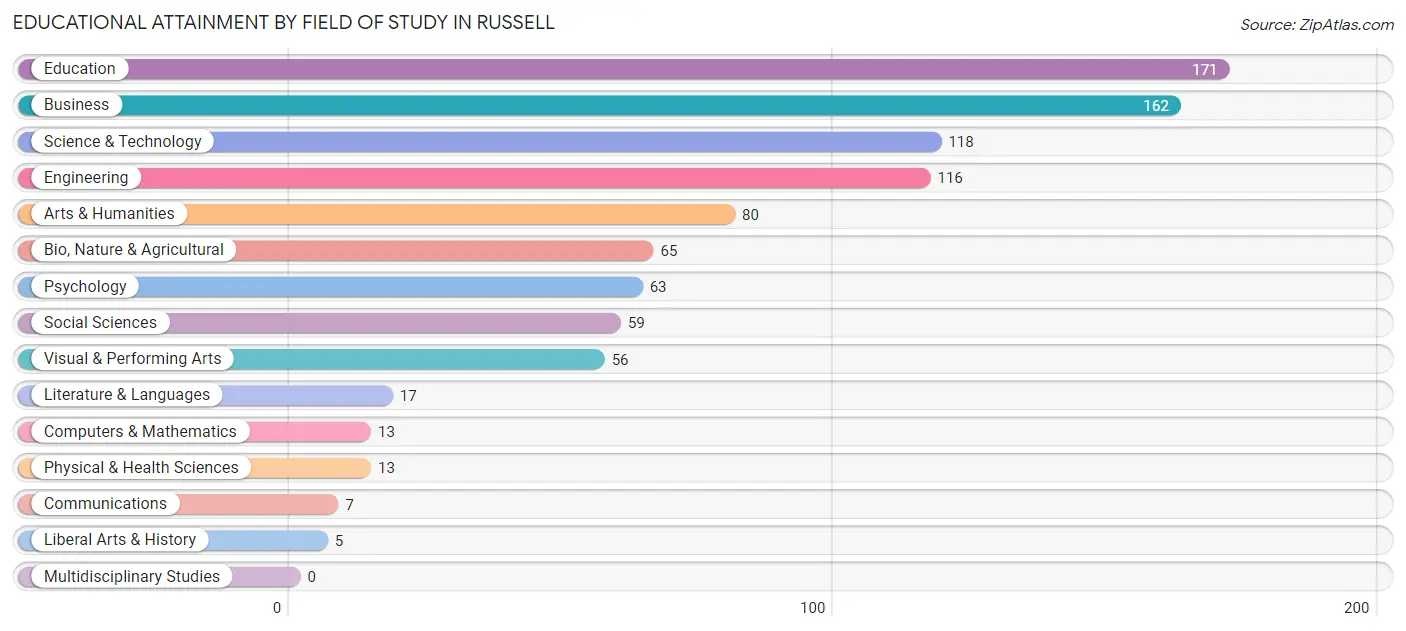
| Field of Study | # Graduates | % Graduates |
| Computers & Mathematics | 13 | 1.4% |
| Bio, Nature & Agricultural | 65 | 6.9% |
| Physical & Health Sciences | 13 | 1.4% |
| Psychology | 63 | 6.7% |
| Social Sciences | 59 | 6.2% |
| Engineering | 116 | 12.3% |
| Multidisciplinary Studies | 0 | 0.0% |
| Science & Technology | 118 | 12.5% |
| Business | 162 | 17.1% |
| Education | 171 | 18.1% |
| Literature & Languages | 17 | 1.8% |
| Liberal Arts & History | 5 | 0.5% |
| Visual & Performing Arts | 56 | 5.9% |
| Communications | 7 | 0.7% |
| Arts & Humanities | 80 | 8.5% |
| Total | 945 | 100.0% |
Transportation & Commute in Russell
Vehicle Availability by Sex in Russell
The most prevalent vehicle ownership categories in Russell are males with 2 vehicles (314, accounting for 38.7%) and females with 2 vehicles (179, making up 56.0%).
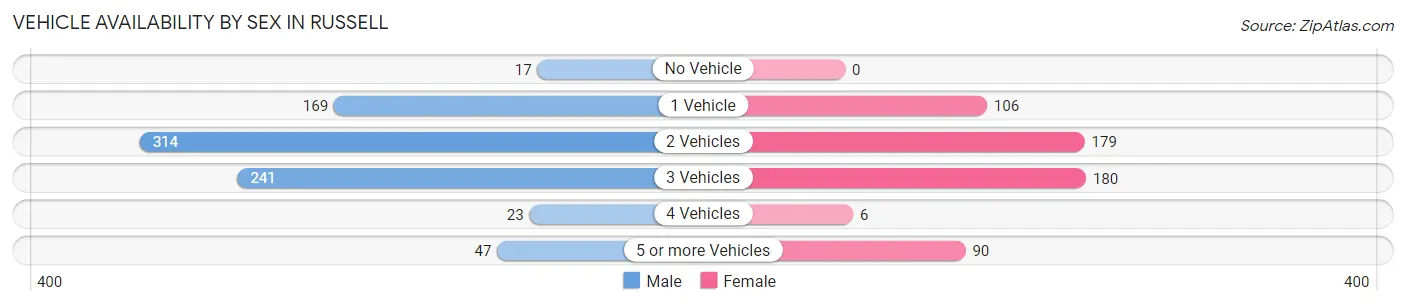
| Vehicles Available | Male | Female |
| No Vehicle | 17 (2.1%) | 0 (0.0%) |
| 1 Vehicle | 169 (20.8%) | 106 (18.9%) |
| 2 Vehicles | 314 (38.7%) | 179 (31.9%) |
| 3 Vehicles | 241 (29.7%) | 180 (32.1%) |
| 4 Vehicles | 23 (2.8%) | 6 (1.1%) |
| 5 or more Vehicles | 47 (5.8%) | 90 (16.0%) |
| Total | 811 (100.0%) | 561 (100.0%) |
Commute Time in Russell
The most frequently occuring commute durations in Russell are 15 to 19 minutes (259 commuters, 19.4%), 5 to 9 minutes (220 commuters, 16.5%), and 20 to 24 minutes (190 commuters, 14.2%).
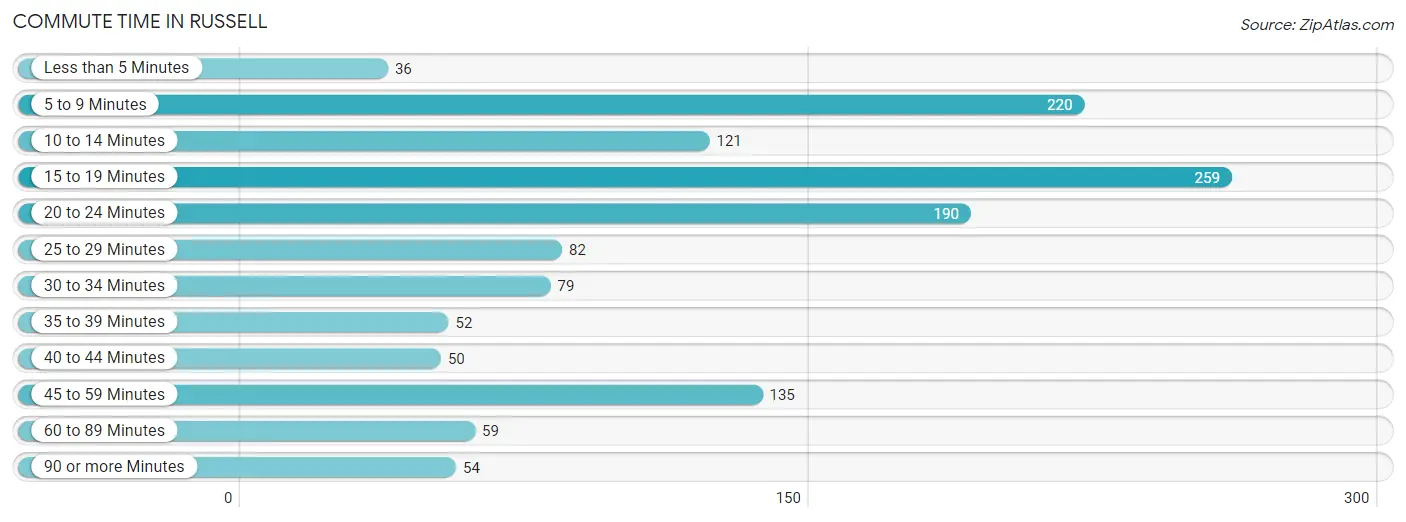
| Commute Time | # Commuters | % Commuters |
| Less than 5 Minutes | 36 | 2.7% |
| 5 to 9 Minutes | 220 | 16.5% |
| 10 to 14 Minutes | 121 | 9.0% |
| 15 to 19 Minutes | 259 | 19.4% |
| 20 to 24 Minutes | 190 | 14.2% |
| 25 to 29 Minutes | 82 | 6.1% |
| 30 to 34 Minutes | 79 | 5.9% |
| 35 to 39 Minutes | 52 | 3.9% |
| 40 to 44 Minutes | 50 | 3.7% |
| 45 to 59 Minutes | 135 | 10.1% |
| 60 to 89 Minutes | 59 | 4.4% |
| 90 or more Minutes | 54 | 4.0% |
Commute Time by Sex in Russell
The most common commute times in Russell are 15 to 19 minutes (141 commuters, 17.5%) for males and 15 to 19 minutes (118 commuters, 22.1%) for females.
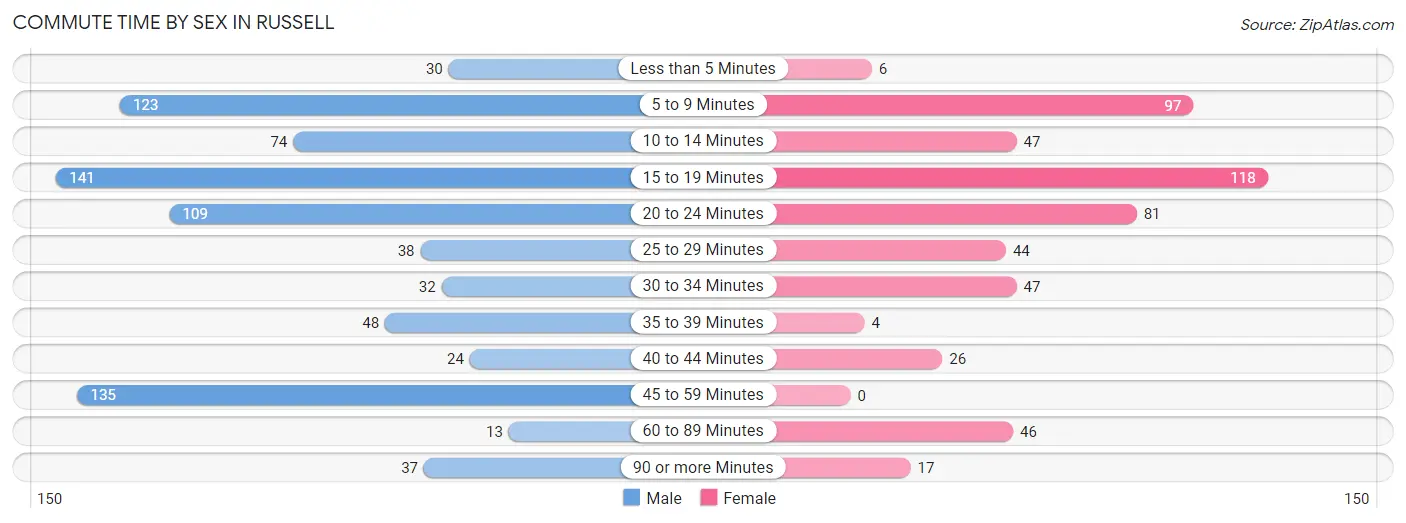
| Commute Time | Male | Female |
| Less than 5 Minutes | 30 (3.7%) | 6 (1.1%) |
| 5 to 9 Minutes | 123 (15.3%) | 97 (18.2%) |
| 10 to 14 Minutes | 74 (9.2%) | 47 (8.8%) |
| 15 to 19 Minutes | 141 (17.5%) | 118 (22.1%) |
| 20 to 24 Minutes | 109 (13.6%) | 81 (15.2%) |
| 25 to 29 Minutes | 38 (4.7%) | 44 (8.3%) |
| 30 to 34 Minutes | 32 (4.0%) | 47 (8.8%) |
| 35 to 39 Minutes | 48 (6.0%) | 4 (0.7%) |
| 40 to 44 Minutes | 24 (3.0%) | 26 (4.9%) |
| 45 to 59 Minutes | 135 (16.8%) | 0 (0.0%) |
| 60 to 89 Minutes | 13 (1.6%) | 46 (8.6%) |
| 90 or more Minutes | 37 (4.6%) | 17 (3.2%) |
Time of Departure to Work by Sex in Russell
The most frequent times of departure to work in Russell are 6:00 AM to 6:29 AM (168, 20.9%) for males and 7:30 AM to 7:59 AM (104, 19.5%) for females.
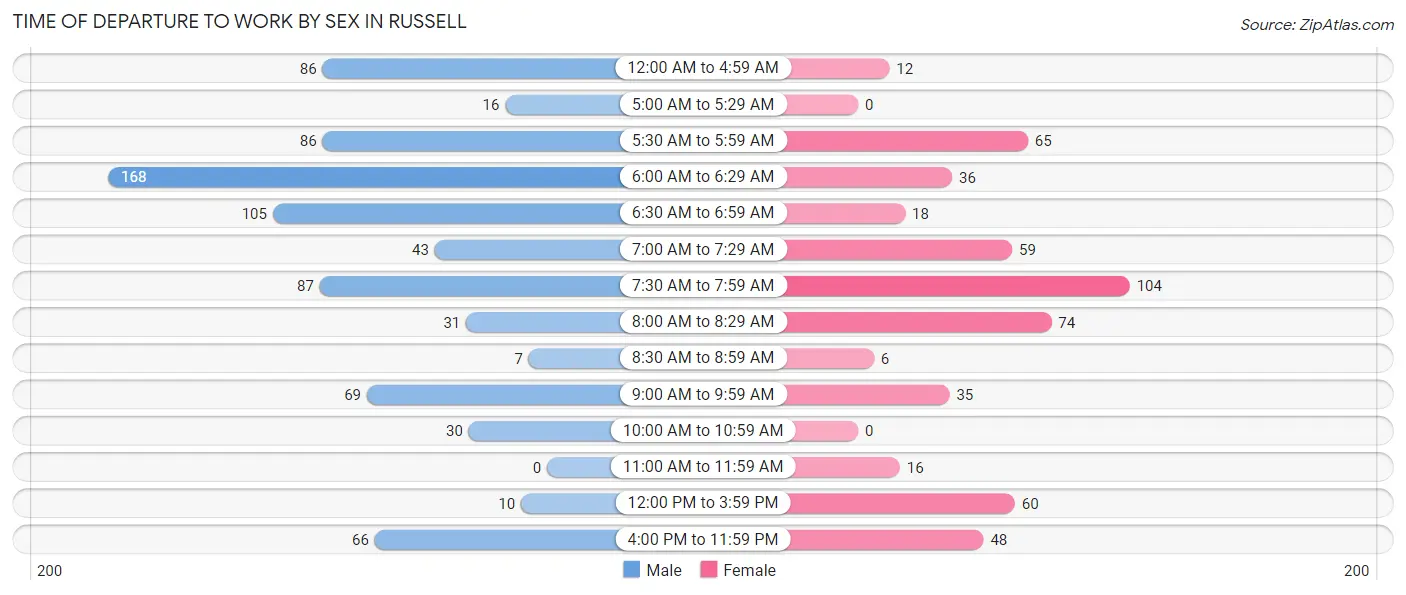
| Time of Departure | Male | Female |
| 12:00 AM to 4:59 AM | 86 (10.7%) | 12 (2.2%) |
| 5:00 AM to 5:29 AM | 16 (2.0%) | 0 (0.0%) |
| 5:30 AM to 5:59 AM | 86 (10.7%) | 65 (12.2%) |
| 6:00 AM to 6:29 AM | 168 (20.9%) | 36 (6.8%) |
| 6:30 AM to 6:59 AM | 105 (13.1%) | 18 (3.4%) |
| 7:00 AM to 7:29 AM | 43 (5.3%) | 59 (11.1%) |
| 7:30 AM to 7:59 AM | 87 (10.8%) | 104 (19.5%) |
| 8:00 AM to 8:29 AM | 31 (3.9%) | 74 (13.9%) |
| 8:30 AM to 8:59 AM | 7 (0.9%) | 6 (1.1%) |
| 9:00 AM to 9:59 AM | 69 (8.6%) | 35 (6.6%) |
| 10:00 AM to 10:59 AM | 30 (3.7%) | 0 (0.0%) |
| 11:00 AM to 11:59 AM | 0 (0.0%) | 16 (3.0%) |
| 12:00 PM to 3:59 PM | 10 (1.2%) | 60 (11.3%) |
| 4:00 PM to 11:59 PM | 66 (8.2%) | 48 (9.0%) |
| Total | 804 (100.0%) | 533 (100.0%) |
Housing Occupancy in Russell
Occupancy by Ownership in Russell
Of the total 1,501 dwellings in Russell, owner-occupied units account for 1,193 (79.5%), while renter-occupied units make up 308 (20.5%).
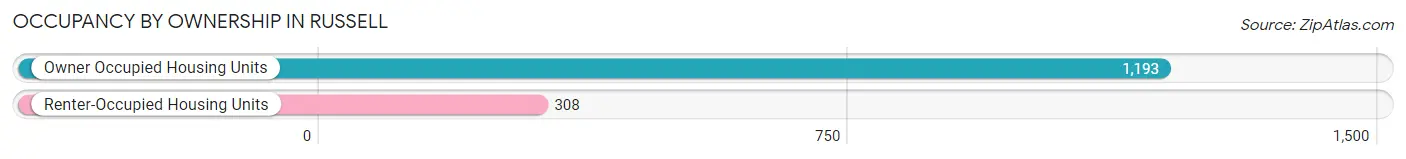
| Occupancy | # Housing Units | % Housing Units |
| Owner Occupied Housing Units | 1,193 | 79.5% |
| Renter-Occupied Housing Units | 308 | 20.5% |
| Total Occupied Housing Units | 1,501 | 100.0% |
Occupancy by Household Size in Russell
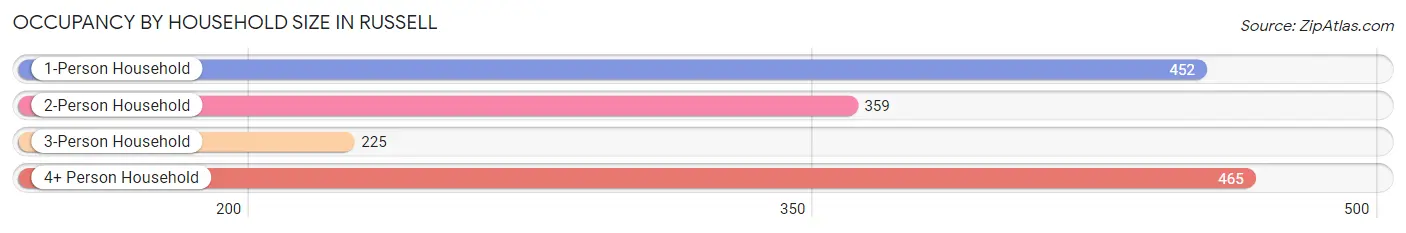
| Household Size | # Housing Units | % Housing Units |
| 1-Person Household | 452 | 30.1% |
| 2-Person Household | 359 | 23.9% |
| 3-Person Household | 225 | 15.0% |
| 4+ Person Household | 465 | 31.0% |
| Total Housing Units | 1,501 | 100.0% |
Occupancy by Ownership by Household Size in Russell
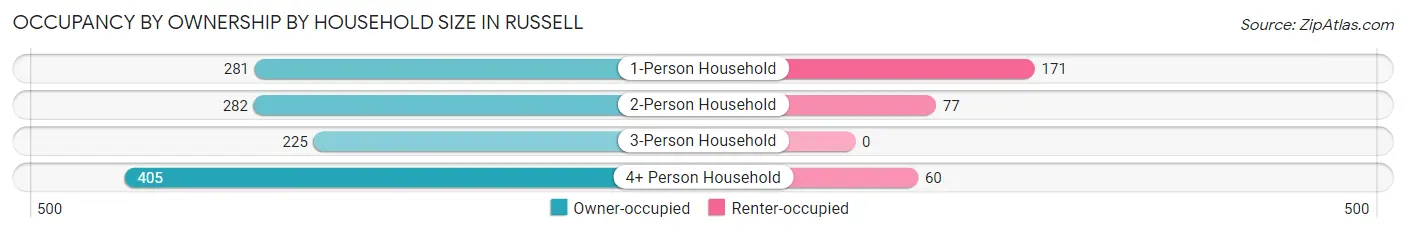
| Household Size | Owner-occupied | Renter-occupied |
| 1-Person Household | 281 (62.2%) | 171 (37.8%) |
| 2-Person Household | 282 (78.5%) | 77 (21.4%) |
| 3-Person Household | 225 (100.0%) | 0 (0.0%) |
| 4+ Person Household | 405 (87.1%) | 60 (12.9%) |
| Total Housing Units | 1,193 (79.5%) | 308 (20.5%) |
Occupancy by Educational Attainment in Russell
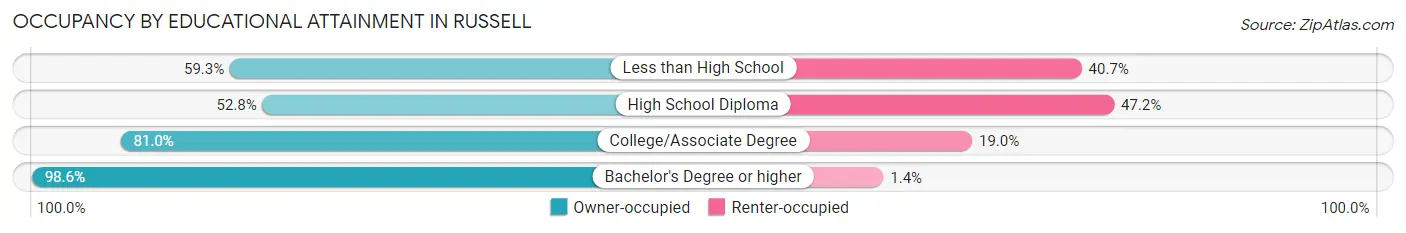
| Household Size | Owner-occupied | Renter-occupied |
| Less than High School | 48 (59.3%) | 33 (40.7%) |
| High School Diploma | 196 (52.8%) | 175 (47.2%) |
| College/Associate Degree | 392 (81.0%) | 92 (19.0%) |
| Bachelor's Degree or higher | 557 (98.6%) | 8 (1.4%) |
Occupancy by Age of Householder in Russell
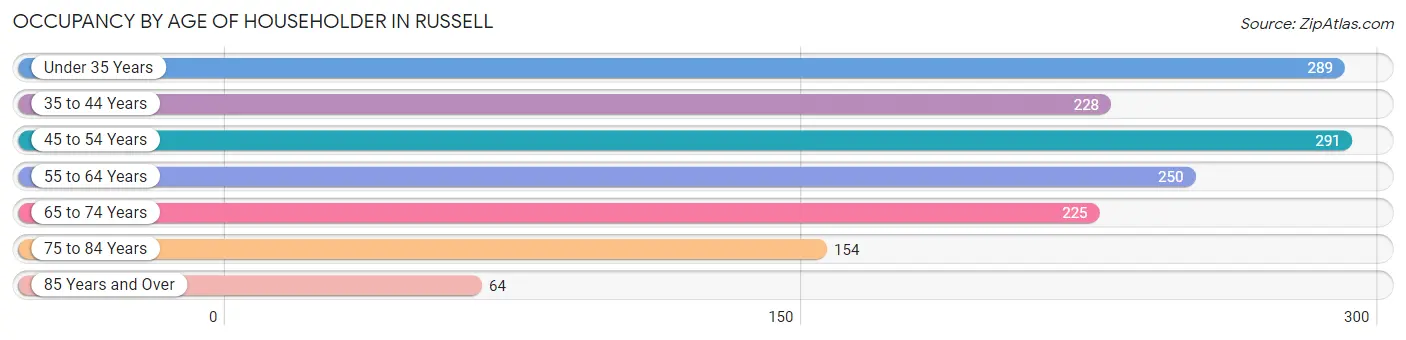
| Age Bracket | # Households | % Households |
| Under 35 Years | 289 | 19.3% |
| 35 to 44 Years | 228 | 15.2% |
| 45 to 54 Years | 291 | 19.4% |
| 55 to 64 Years | 250 | 16.7% |
| 65 to 74 Years | 225 | 15.0% |
| 75 to 84 Years | 154 | 10.3% |
| 85 Years and Over | 64 | 4.3% |
| Total | 1,501 | 100.0% |
Housing Finances in Russell
Median Income by Occupancy in Russell
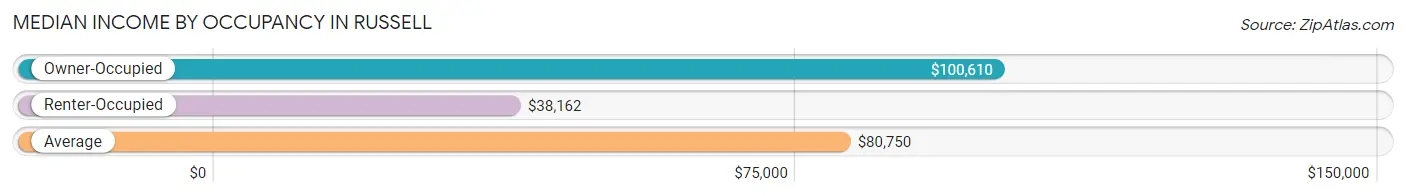
| Occupancy Type | # Households | Median Income |
| Owner-Occupied | 1,193 (79.5%) | $100,610 |
| Renter-Occupied | 308 (20.5%) | $38,162 |
| Average | 1,501 (100.0%) | $80,750 |
Occupancy by Householder Income Bracket in Russell
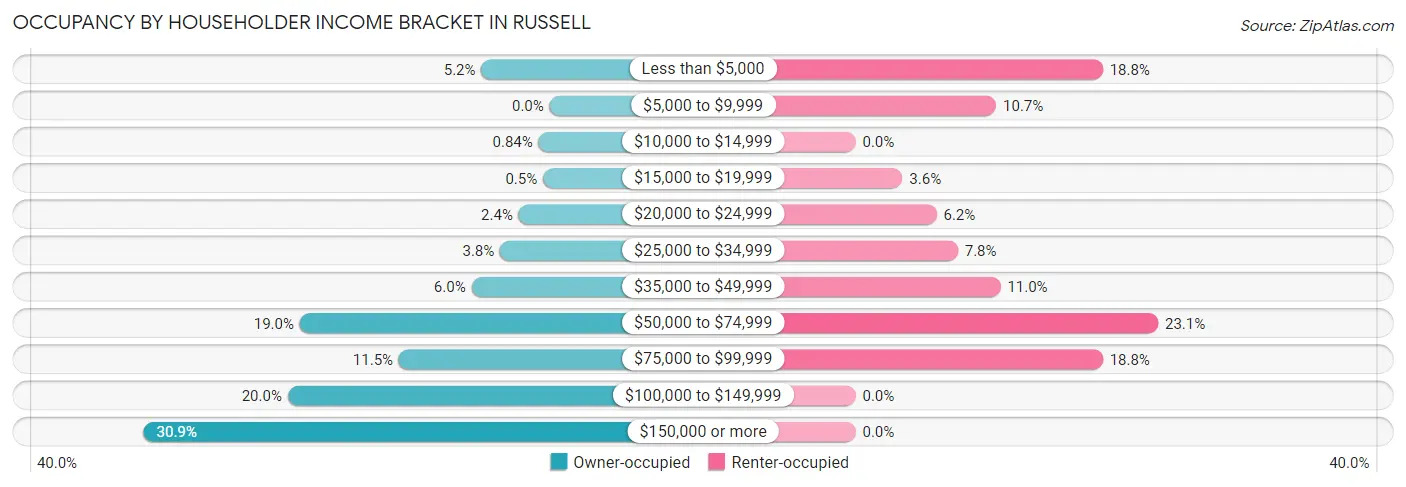
| Income Bracket | Owner-occupied | Renter-occupied |
| Less than $5,000 | 62 (5.2%) | 58 (18.8%) |
| $5,000 to $9,999 | 0 (0.0%) | 33 (10.7%) |
| $10,000 to $14,999 | 10 (0.8%) | 0 (0.0%) |
| $15,000 to $19,999 | 6 (0.5%) | 11 (3.6%) |
| $20,000 to $24,999 | 28 (2.4%) | 19 (6.2%) |
| $25,000 to $34,999 | 45 (3.8%) | 24 (7.8%) |
| $35,000 to $49,999 | 71 (5.9%) | 34 (11.0%) |
| $50,000 to $74,999 | 227 (19.0%) | 71 (23.1%) |
| $75,000 to $99,999 | 137 (11.5%) | 58 (18.8%) |
| $100,000 to $149,999 | 238 (20.0%) | 0 (0.0%) |
| $150,000 or more | 369 (30.9%) | 0 (0.0%) |
| Total | 1,193 (100.0%) | 308 (100.0%) |
Monthly Housing Cost Tiers in Russell
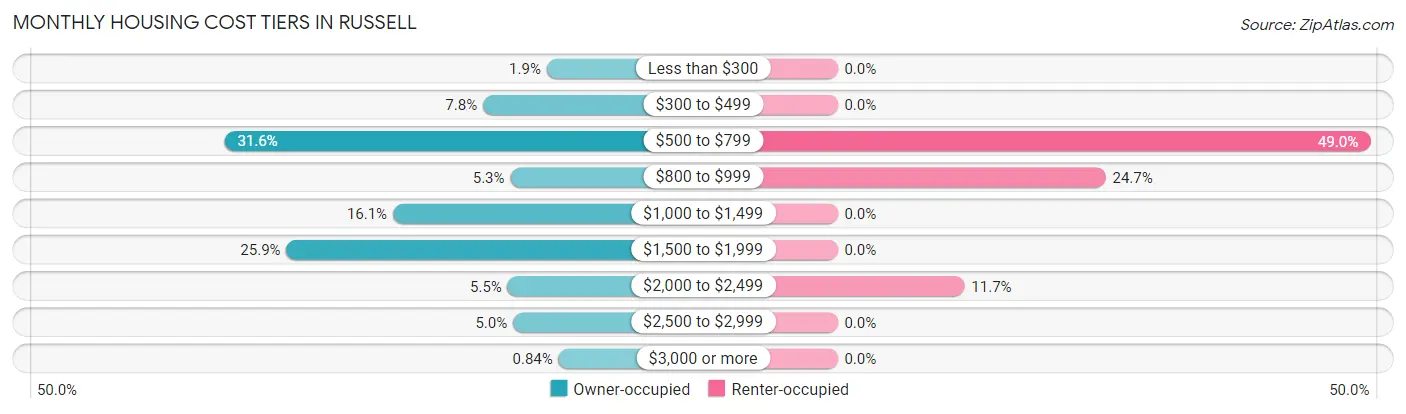
| Monthly Cost | Owner-occupied | Renter-occupied |
| Less than $300 | 23 (1.9%) | 0 (0.0%) |
| $300 to $499 | 93 (7.8%) | 0 (0.0%) |
| $500 to $799 | 377 (31.6%) | 151 (49.0%) |
| $800 to $999 | 63 (5.3%) | 76 (24.7%) |
| $1,000 to $1,499 | 192 (16.1%) | 0 (0.0%) |
| $1,500 to $1,999 | 309 (25.9%) | 0 (0.0%) |
| $2,000 to $2,499 | 66 (5.5%) | 36 (11.7%) |
| $2,500 to $2,999 | 60 (5.0%) | 0 (0.0%) |
| $3,000 or more | 10 (0.8%) | 0 (0.0%) |
| Total | 1,193 (100.0%) | 308 (100.0%) |
Physical Housing Characteristics in Russell
Housing Structures in Russell
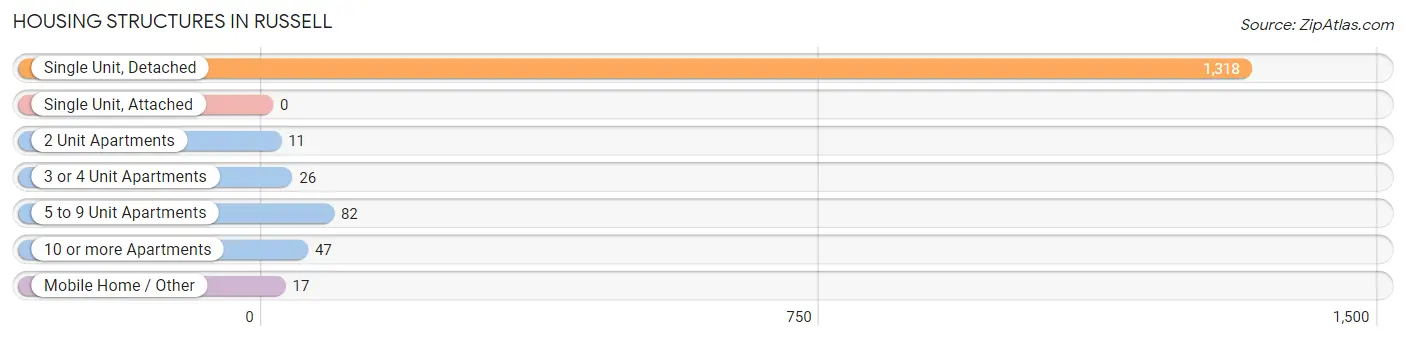
| Structure Type | # Housing Units | % Housing Units |
| Single Unit, Detached | 1,318 | 87.8% |
| Single Unit, Attached | 0 | 0.0% |
| 2 Unit Apartments | 11 | 0.7% |
| 3 or 4 Unit Apartments | 26 | 1.7% |
| 5 to 9 Unit Apartments | 82 | 5.5% |
| 10 or more Apartments | 47 | 3.1% |
| Mobile Home / Other | 17 | 1.1% |
| Total | 1,501 | 100.0% |
Housing Structures by Occupancy in Russell
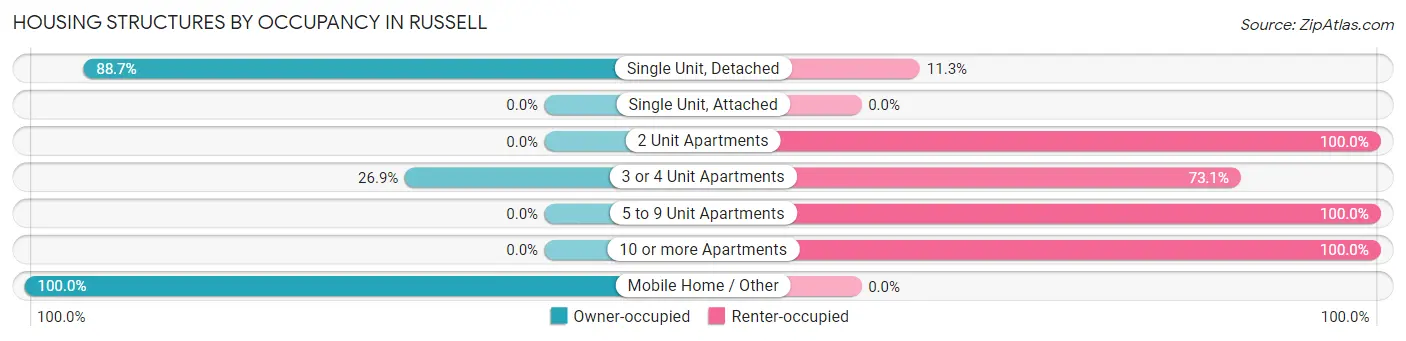
| Structure Type | Owner-occupied | Renter-occupied |
| Single Unit, Detached | 1,169 (88.7%) | 149 (11.3%) |
| Single Unit, Attached | 0 (0.0%) | 0 (0.0%) |
| 2 Unit Apartments | 0 (0.0%) | 11 (100.0%) |
| 3 or 4 Unit Apartments | 7 (26.9%) | 19 (73.1%) |
| 5 to 9 Unit Apartments | 0 (0.0%) | 82 (100.0%) |
| 10 or more Apartments | 0 (0.0%) | 47 (100.0%) |
| Mobile Home / Other | 17 (100.0%) | 0 (0.0%) |
| Total | 1,193 (79.5%) | 308 (20.5%) |
Housing Structures by Number of Rooms in Russell
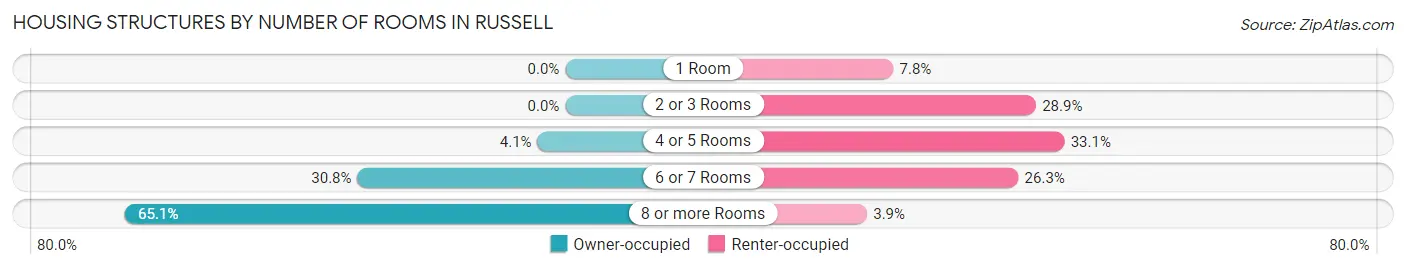
| Number of Rooms | Owner-occupied | Renter-occupied |
| 1 Room | 0 (0.0%) | 24 (7.8%) |
| 2 or 3 Rooms | 0 (0.0%) | 89 (28.9%) |
| 4 or 5 Rooms | 49 (4.1%) | 102 (33.1%) |
| 6 or 7 Rooms | 367 (30.8%) | 81 (26.3%) |
| 8 or more Rooms | 777 (65.1%) | 12 (3.9%) |
| Total | 1,193 (100.0%) | 308 (100.0%) |
Housing Structure by Heating Type in Russell
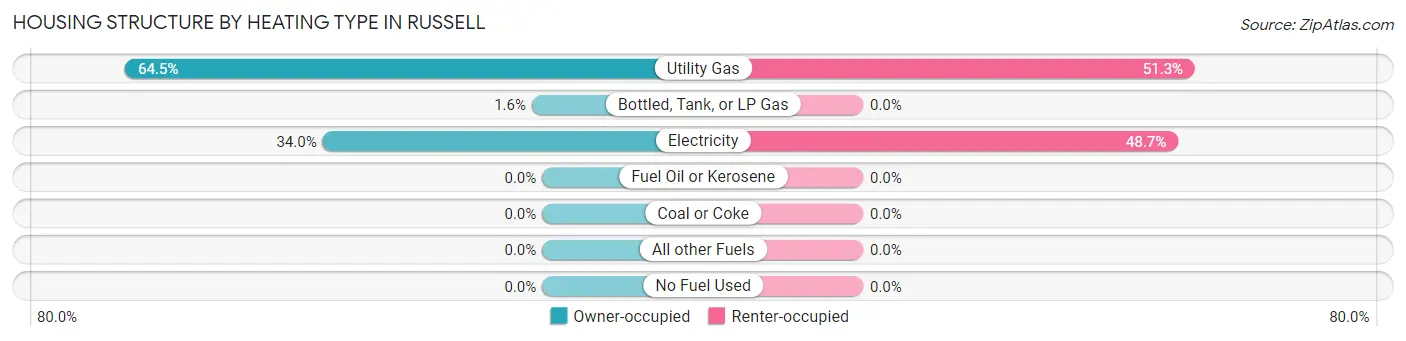
| Heating Type | Owner-occupied | Renter-occupied |
| Utility Gas | 769 (64.5%) | 158 (51.3%) |
| Bottled, Tank, or LP Gas | 19 (1.6%) | 0 (0.0%) |
| Electricity | 405 (34.0%) | 150 (48.7%) |
| Fuel Oil or Kerosene | 0 (0.0%) | 0 (0.0%) |
| Coal or Coke | 0 (0.0%) | 0 (0.0%) |
| All other Fuels | 0 (0.0%) | 0 (0.0%) |
| No Fuel Used | 0 (0.0%) | 0 (0.0%) |
| Total | 1,193 (100.0%) | 308 (100.0%) |
Household Vehicle Usage in Russell
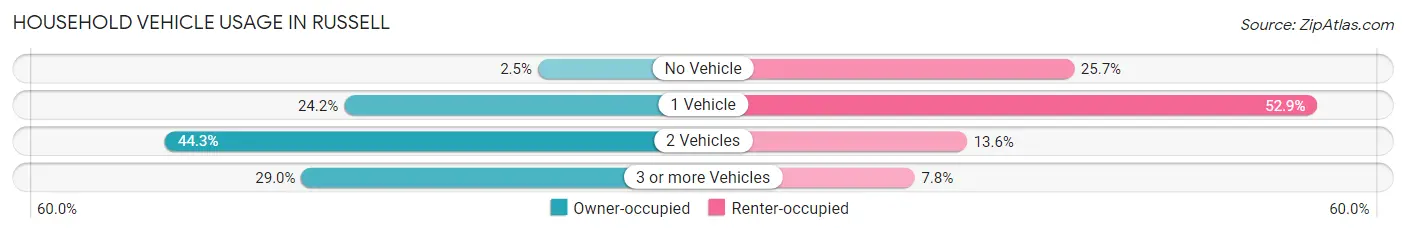
| Vehicles per Household | Owner-occupied | Renter-occupied |
| No Vehicle | 30 (2.5%) | 79 (25.7%) |
| 1 Vehicle | 289 (24.2%) | 163 (52.9%) |
| 2 Vehicles | 528 (44.3%) | 42 (13.6%) |
| 3 or more Vehicles | 346 (29.0%) | 24 (7.8%) |
| Total | 1,193 (100.0%) | 308 (100.0%) |
Real Estate & Mortgages in Russell
Real Estate and Mortgage Overview in Russell
| Characteristic | Without Mortgage | With Mortgage |
| Housing Units | 474 | 719 |
| Median Property Value | $182,800 | $219,200 |
| Median Household Income | $88,000 | $197 |
| Monthly Housing Costs | $568 | $10 |
| Real Estate Taxes | $1,909 | $0 |
Property Value by Mortgage Status in Russell
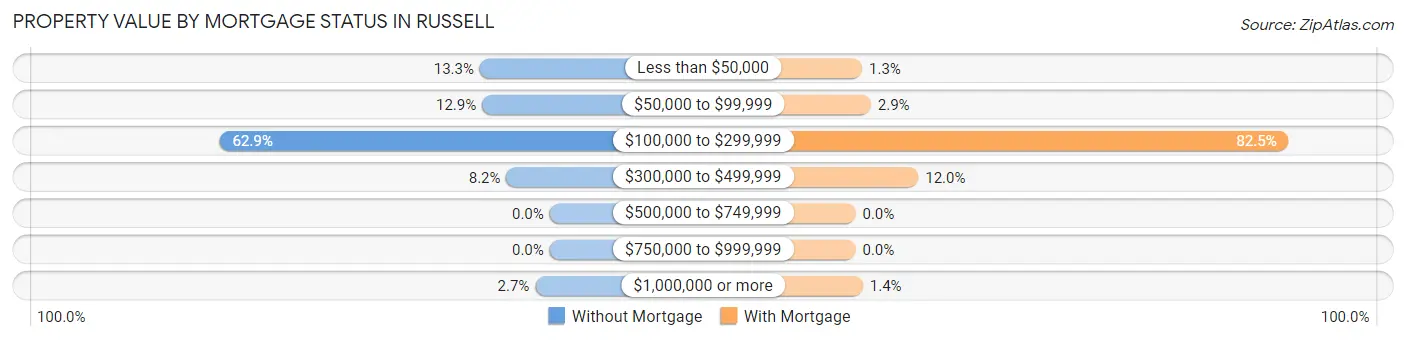
| Property Value | Without Mortgage | With Mortgage |
| Less than $50,000 | 63 (13.3%) | 9 (1.3%) |
| $50,000 to $99,999 | 61 (12.9%) | 21 (2.9%) |
| $100,000 to $299,999 | 298 (62.9%) | 593 (82.5%) |
| $300,000 to $499,999 | 39 (8.2%) | 86 (12.0%) |
| $500,000 to $749,999 | 0 (0.0%) | 0 (0.0%) |
| $750,000 to $999,999 | 0 (0.0%) | 0 (0.0%) |
| $1,000,000 or more | 13 (2.7%) | 10 (1.4%) |
| Total | 474 (100.0%) | 719 (100.0%) |
Household Income by Mortgage Status in Russell
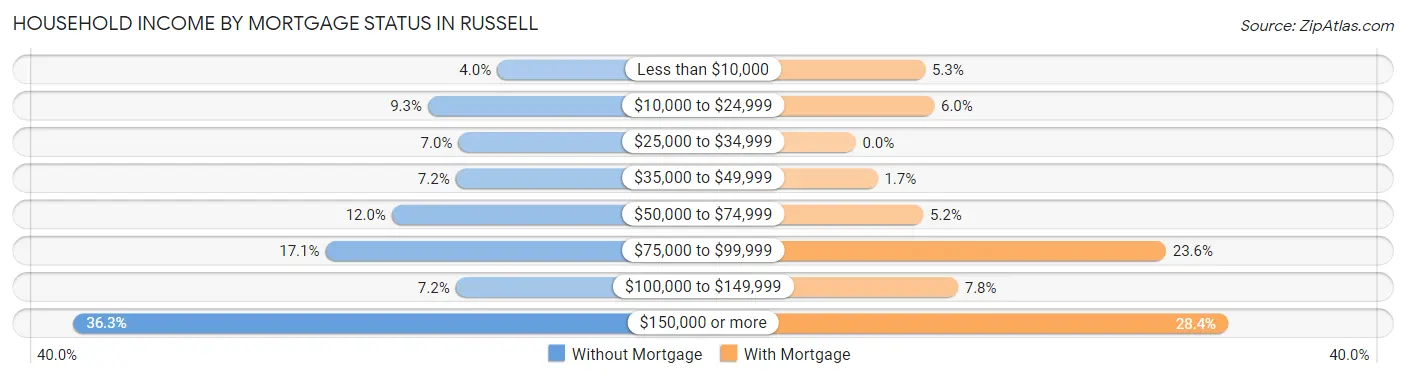
| Household Income | Without Mortgage | With Mortgage |
| Less than $10,000 | 19 (4.0%) | 38 (5.3%) |
| $10,000 to $24,999 | 44 (9.3%) | 43 (6.0%) |
| $25,000 to $34,999 | 33 (7.0%) | 0 (0.0%) |
| $35,000 to $49,999 | 34 (7.2%) | 12 (1.7%) |
| $50,000 to $74,999 | 57 (12.0%) | 37 (5.1%) |
| $75,000 to $99,999 | 81 (17.1%) | 170 (23.6%) |
| $100,000 to $149,999 | 34 (7.2%) | 56 (7.8%) |
| $150,000 or more | 172 (36.3%) | 204 (28.4%) |
| Total | 474 (100.0%) | 719 (100.0%) |
Property Value to Household Income Ratio in Russell
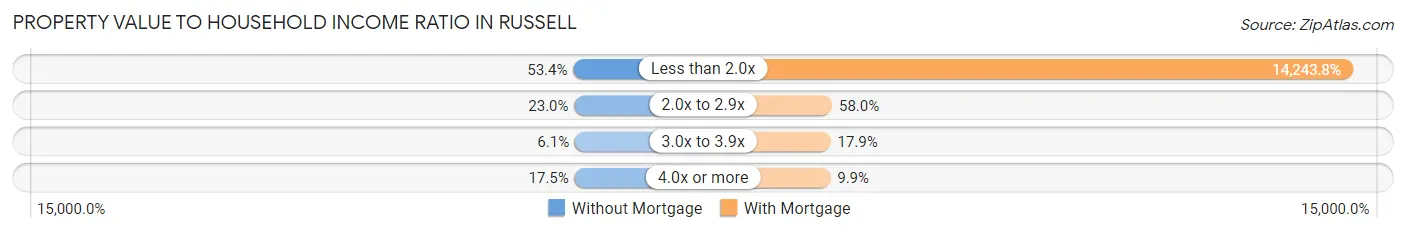
| Value-to-Income Ratio | Without Mortgage | With Mortgage |
| Less than 2.0x | 253 (53.4%) | 102,413 (14,243.8%) |
| 2.0x to 2.9x | 109 (23.0%) | 417 (58.0%) |
| 3.0x to 3.9x | 29 (6.1%) | 129 (17.9%) |
| 4.0x or more | 83 (17.5%) | 71 (9.9%) |
| Total | 474 (100.0%) | 719 (100.0%) |
Real Estate Taxes by Mortgage Status in Russell
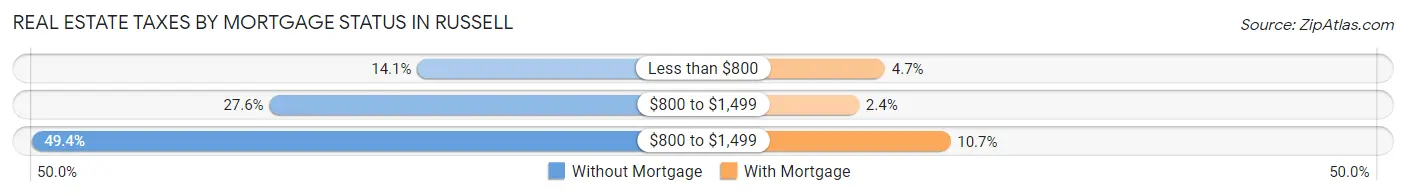
| Property Taxes | Without Mortgage | With Mortgage |
| Less than $800 | 67 (14.1%) | 34 (4.7%) |
| $800 to $1,499 | 131 (27.6%) | 17 (2.4%) |
| $800 to $1,499 | 234 (49.4%) | 77 (10.7%) |
| Total | 474 (100.0%) | 719 (100.0%) |
Health & Disability in Russell
Health Insurance Coverage by Age in Russell
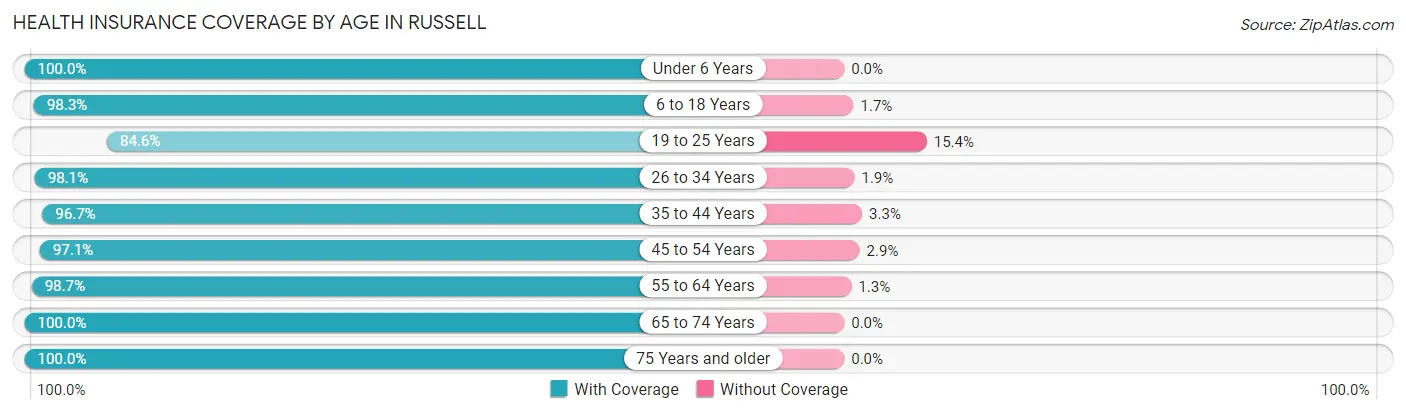
| Age Bracket | With Coverage | Without Coverage |
| Under 6 Years | 289 (100.0%) | 0 (0.0%) |
| 6 to 18 Years | 679 (98.3%) | 12 (1.7%) |
| 19 to 25 Years | 253 (84.6%) | 46 (15.4%) |
| 26 to 34 Years | 360 (98.1%) | 7 (1.9%) |
| 35 to 44 Years | 494 (96.7%) | 17 (3.3%) |
| 45 to 54 Years | 408 (97.1%) | 12 (2.9%) |
| 55 to 64 Years | 443 (98.7%) | 6 (1.3%) |
| 65 to 74 Years | 372 (100.0%) | 0 (0.0%) |
| 75 Years and older | 301 (100.0%) | 0 (0.0%) |
| Total | 3,599 (97.3%) | 100 (2.7%) |
Health Insurance Coverage by Citizenship Status in Russell
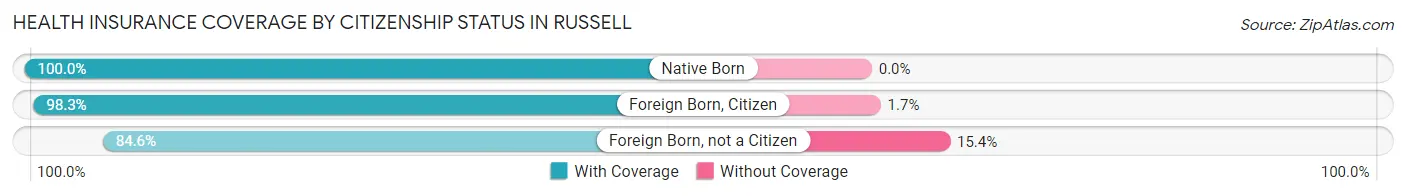
| Citizenship Status | With Coverage | Without Coverage |
| Native Born | 289 (100.0%) | 0 (0.0%) |
| Foreign Born, Citizen | 679 (98.3%) | 12 (1.7%) |
| Foreign Born, not a Citizen | 253 (84.6%) | 46 (15.4%) |
Health Insurance Coverage by Household Income in Russell
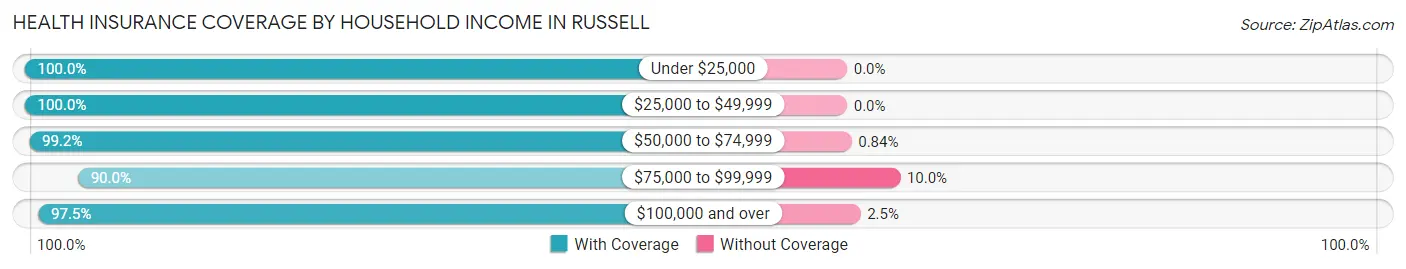
| Household Income | With Coverage | Without Coverage |
| Under $25,000 | 366 (100.0%) | 0 (0.0%) |
| $25,000 to $49,999 | 294 (100.0%) | 0 (0.0%) |
| $50,000 to $74,999 | 711 (99.2%) | 6 (0.8%) |
| $75,000 to $99,999 | 434 (90.0%) | 48 (10.0%) |
| $100,000 and over | 1,783 (97.5%) | 46 (2.5%) |
Public vs Private Health Insurance Coverage by Age in Russell
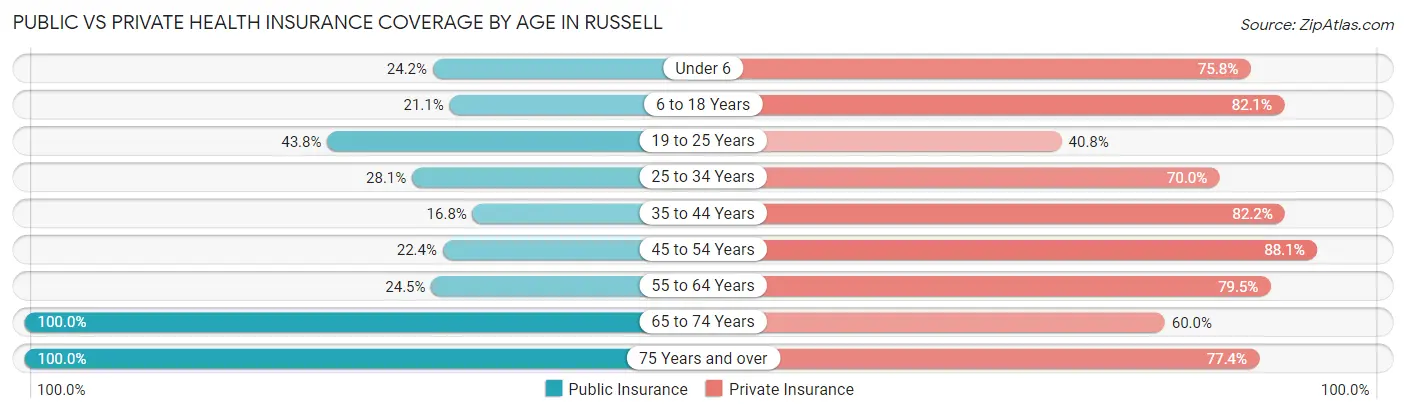
| Age Bracket | Public Insurance | Private Insurance |
| Under 6 | 70 (24.2%) | 219 (75.8%) |
| 6 to 18 Years | 146 (21.1%) | 567 (82.1%) |
| 19 to 25 Years | 131 (43.8%) | 122 (40.8%) |
| 25 to 34 Years | 103 (28.1%) | 257 (70.0%) |
| 35 to 44 Years | 86 (16.8%) | 420 (82.2%) |
| 45 to 54 Years | 94 (22.4%) | 370 (88.1%) |
| 55 to 64 Years | 110 (24.5%) | 357 (79.5%) |
| 65 to 74 Years | 372 (100.0%) | 223 (60.0%) |
| 75 Years and over | 301 (100.0%) | 233 (77.4%) |
| Total | 1,413 (38.2%) | 2,768 (74.8%) |
Disability Status by Sex by Age in Russell
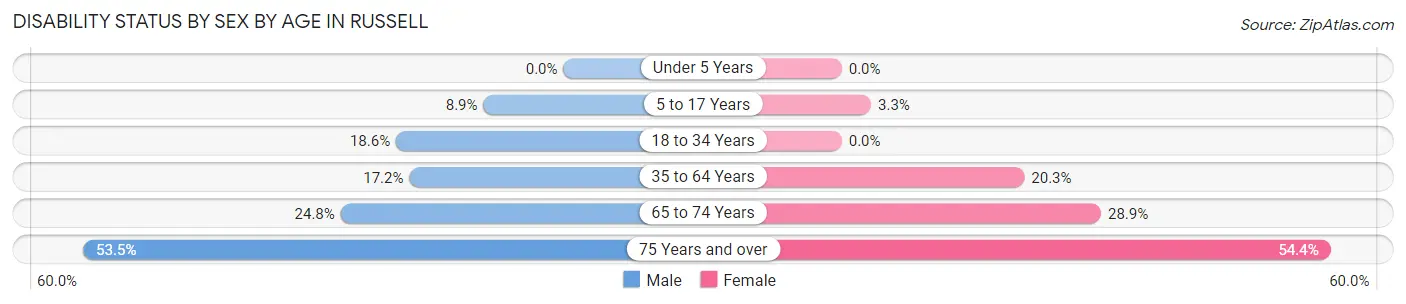
| Age Bracket | Male | Female |
| Under 5 Years | 0 (0.0%) | 0 (0.0%) |
| 5 to 17 Years | 32 (8.9%) | 11 (3.3%) |
| 18 to 34 Years | 55 (18.6%) | 0 (0.0%) |
| 35 to 64 Years | 133 (17.2%) | 123 (20.3%) |
| 65 to 74 Years | 33 (24.8%) | 69 (28.9%) |
| 75 Years and over | 46 (53.5%) | 117 (54.4%) |
Disability Class by Sex by Age in Russell
Disability Class: Hearing Difficulty
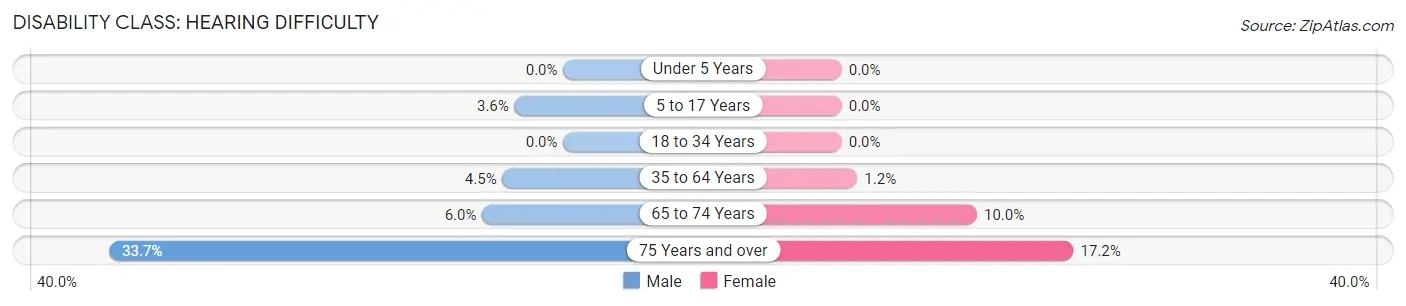
| Age Bracket | Male | Female |
| Under 5 Years | 0 (0.0%) | 0 (0.0%) |
| 5 to 17 Years | 13 (3.6%) | 0 (0.0%) |
| 18 to 34 Years | 0 (0.0%) | 0 (0.0%) |
| 35 to 64 Years | 35 (4.5%) | 7 (1.2%) |
| 65 to 74 Years | 8 (6.0%) | 24 (10.0%) |
| 75 Years and over | 29 (33.7%) | 37 (17.2%) |
Disability Class: Vision Difficulty
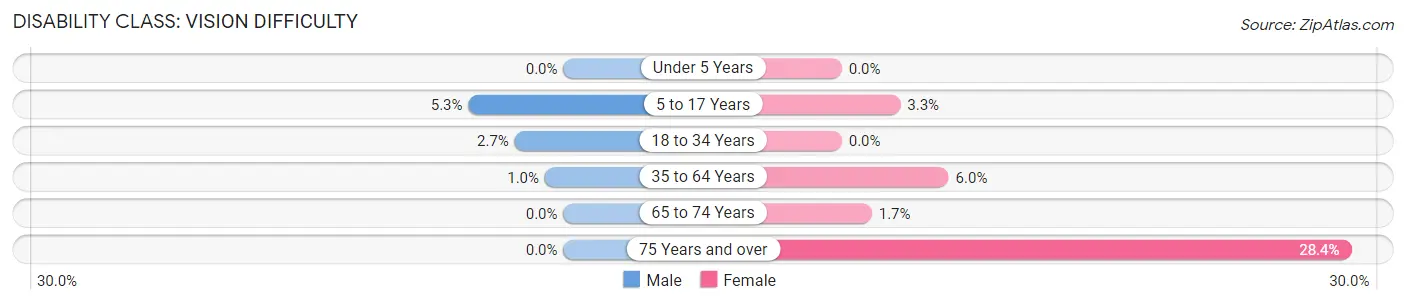
| Age Bracket | Male | Female |
| Under 5 Years | 0 (0.0%) | 0 (0.0%) |
| 5 to 17 Years | 19 (5.3%) | 11 (3.3%) |
| 18 to 34 Years | 8 (2.7%) | 0 (0.0%) |
| 35 to 64 Years | 8 (1.0%) | 36 (5.9%) |
| 65 to 74 Years | 0 (0.0%) | 4 (1.7%) |
| 75 Years and over | 0 (0.0%) | 61 (28.4%) |
Disability Class: Cognitive Difficulty
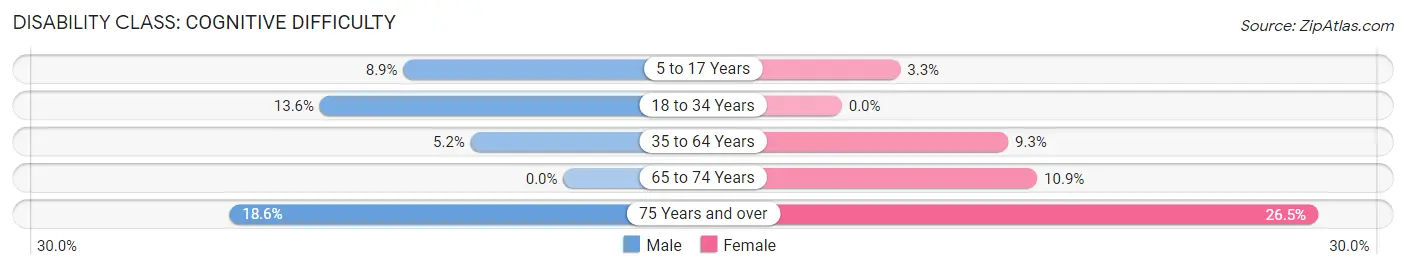
| Age Bracket | Male | Female |
| 5 to 17 Years | 32 (8.9%) | 11 (3.3%) |
| 18 to 34 Years | 40 (13.6%) | 0 (0.0%) |
| 35 to 64 Years | 40 (5.2%) | 56 (9.3%) |
| 65 to 74 Years | 0 (0.0%) | 26 (10.9%) |
| 75 Years and over | 16 (18.6%) | 57 (26.5%) |
Disability Class: Ambulatory Difficulty
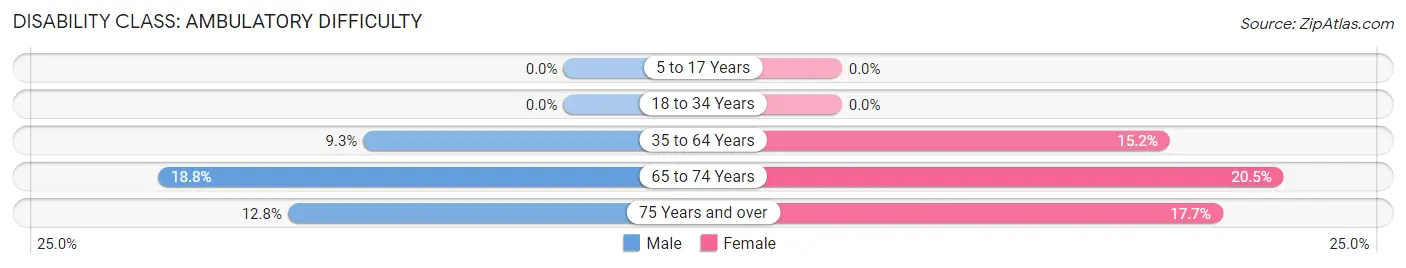
| Age Bracket | Male | Female |
| 5 to 17 Years | 0 (0.0%) | 0 (0.0%) |
| 18 to 34 Years | 0 (0.0%) | 0 (0.0%) |
| 35 to 64 Years | 72 (9.3%) | 92 (15.2%) |
| 65 to 74 Years | 25 (18.8%) | 49 (20.5%) |
| 75 Years and over | 11 (12.8%) | 38 (17.7%) |
Disability Class: Self-Care Difficulty
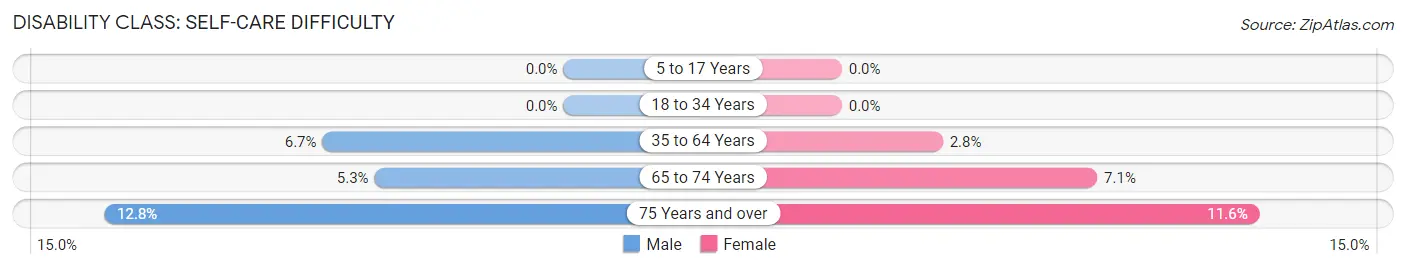
| Age Bracket | Male | Female |
| 5 to 17 Years | 0 (0.0%) | 0 (0.0%) |
| 18 to 34 Years | 0 (0.0%) | 0 (0.0%) |
| 35 to 64 Years | 52 (6.7%) | 17 (2.8%) |
| 65 to 74 Years | 7 (5.3%) | 17 (7.1%) |
| 75 Years and over | 11 (12.8%) | 25 (11.6%) |
Technology Access in Russell
Computing Device Access in Russell
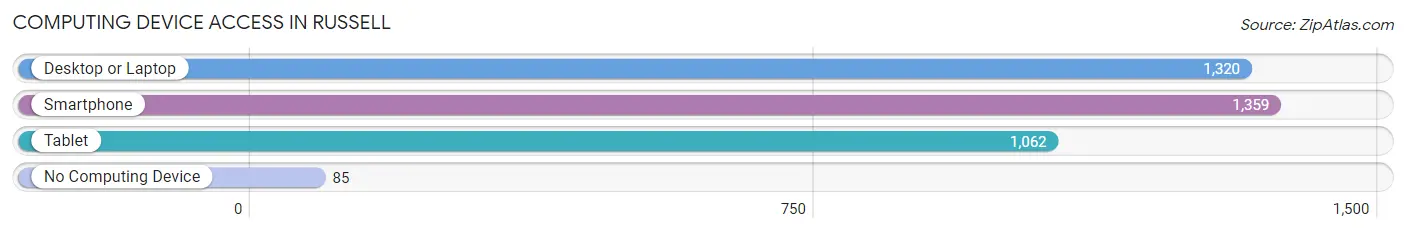
| Device Type | # Households | % Households |
| Desktop or Laptop | 1,320 | 87.9% |
| Smartphone | 1,359 | 90.5% |
| Tablet | 1,062 | 70.8% |
| No Computing Device | 85 | 5.7% |
| Total | 1,501 | 100.0% |
Internet Access in Russell
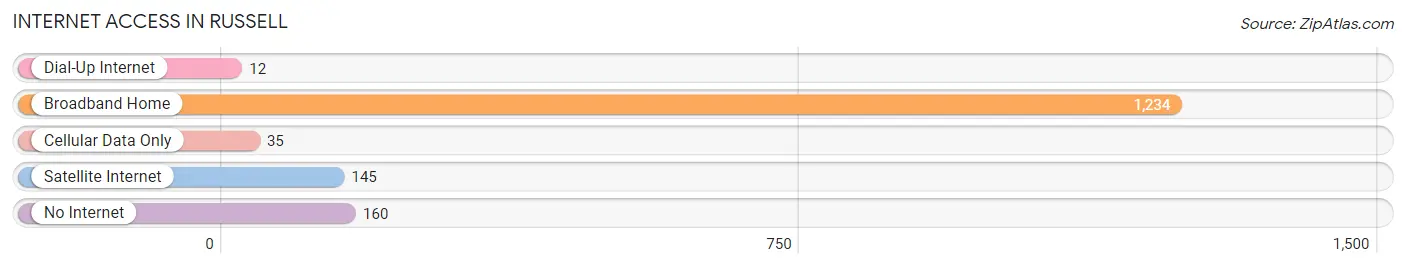
| Internet Type | # Households | % Households |
| Dial-Up Internet | 12 | 0.8% |
| Broadband Home | 1,234 | 82.2% |
| Cellular Data Only | 35 | 2.3% |
| Satellite Internet | 145 | 9.7% |
| No Internet | 160 | 10.7% |
| Total | 1,501 | 100.0% |
Russell Summary
Russell, Kentucky is a small city located in Greenup County in the northeastern part of the state. It is situated on the Ohio River, just across from the city of Portsmouth, Ohio. The city has a population of approximately 5,000 people and is the county seat of Greenup County.
Russell is a part of the Huntington-Ashland metropolitan area, which is the largest metropolitan area in the state of Kentucky. The city is located in the foothills of the Appalachian Mountains and is surrounded by rolling hills and lush forests. The city is home to several parks and recreational areas, including the Russell-Greenup County Park, which offers a variety of outdoor activities such as hiking, biking, and fishing.
The economy of Russell is largely based on manufacturing and agriculture. The city is home to several manufacturing plants, including a steel mill, a paper mill, and a chemical plant. The city also has a large agricultural sector, with many farms located in the surrounding area. The city is also home to several small businesses, including restaurants, retail stores, and service providers.
The demographics of Russell are largely white, with a small African American population. The median household income in the city is around $35,000, and the median home value is around $90,000. The city has a high rate of poverty, with around 25% of the population living below the poverty line.
The city of Russell is served by the Greenup County School District, which includes several elementary, middle, and high schools. The city is also home to several higher education institutions, including the University of Kentucky, Morehead State University, and Ashland Community and Technical College.
Russell is a small city with a rich history and a vibrant economy. The city is home to a diverse population and offers a variety of recreational activities and educational opportunities. The city is a great place to live and work, and is a great place to visit for those looking to explore the beauty of the Appalachian Mountains.
Common Questions
What is Per Capita Income in Russell?
Per Capita income in Russell is $41,106.
What is the Median Family Income in Russell?
Median Family Income in Russell is $104,239.
What is the Median Household income in Russell?
Median Household Income in Russell is $80,750.
What is Income or Wage Gap in Russell?
Income or Wage Gap in Russell is 69.8%.
Women in Russell earn 30.2 cents for every dollar earned by a man.
What is Inequality or Gini Index in Russell?
Inequality or Gini Index in Russell is 0.44.
What is the Total Population of Russell?
Total Population of Russell is 3,704.
What is the Total Male Population of Russell?
Total Male Population of Russell is 1,783.
What is the Total Female Population of Russell?
Total Female Population of Russell is 1,921.
What is the Ratio of Males per 100 Females in Russell?
There are 92.82 Males per 100 Females in Russell.
What is the Ratio of Females per 100 Males in Russell?
There are 107.74 Females per 100 Males in Russell.
What is the Median Population Age in Russell?
Median Population Age in Russell is 39.5 Years.
What is the Average Family Size in Russell
Average Family Size in Russell is 3.1 People.
What is the Average Household Size in Russell
Average Household Size in Russell is 2.5 People.
How Large is the Labor Force in Russell?
There are 1,473 People in the Labor Forcein in Russell.
What is the Percentage of People in the Labor Force in Russell?
51.1% of People are in the Labor Force in Russell.
What is the Unemployment Rate in Russell?
Unemployment Rate in Russell is 6.2%.