Brandenburg, KY Map & Demographics
Brandenburg Map
Brandenburg Overview
$27,150
PER CAPITA INCOME
$69,821
AVG FAMILY INCOME
$51,964
AVG HOUSEHOLD INCOME
22.1%
WAGE / INCOME GAP [ % ]
77.9¢/ $1
WAGE / INCOME GAP [ $ ]
0.46
INEQUALITY / GINI INDEX
2,896
TOTAL POPULATION
1,422
MALE POPULATION
1,474
FEMALE POPULATION
96.47
MALES / 100 FEMALES
103.66
FEMALES / 100 MALES
41.0
MEDIAN AGE
3.4
AVG FAMILY SIZE
2.7
AVG HOUSEHOLD SIZE
1,238
LABOR FORCE [ PEOPLE ]
51.8%
PERCENT IN LABOR FORCE
3.0%
UNEMPLOYMENT RATE
Brandenburg Zip Codes
Brandenburg Area Codes
Income in Brandenburg
Income Overview in Brandenburg
Per Capita Income in Brandenburg is $27,150, while median incomes of families and households are $69,821 and $51,964 respectively.
| Characteristic | Number | Measure |
| Per Capita Income | 2,896 | $27,150 |
| Median Family Income | 615 | $69,821 |
| Mean Family Income | 615 | $88,559 |
| Median Household Income | 968 | $51,964 |
| Mean Household Income | 968 | $71,571 |
| Income Deficit | 615 | $0 |
| Wage / Income Gap (%) | 2,896 | 22.10% |
| Wage / Income Gap ($) | 2,896 | 77.90¢ per $1 |
| Gini / Inequality Index | 2,896 | 0.46 |
Earnings by Sex in Brandenburg
Average Earnings in Brandenburg are $27,237, $30,320 for men and $23,620 for women, a difference of 22.1%.
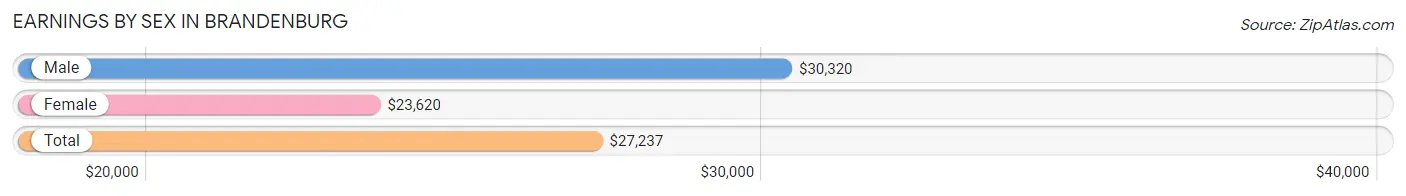
| Sex | Number | Average Earnings |
| Male | 715 (50.2%) | $30,320 |
| Female | 709 (49.8%) | $23,620 |
| Total | 1,424 (100.0%) | $27,237 |
Earnings by Sex by Income Bracket in Brandenburg
The most common earnings brackets in Brandenburg are $30,000 to $34,999 for men (98 | 13.7%) and $35,000 to $39,999 for women (75 | 10.6%).
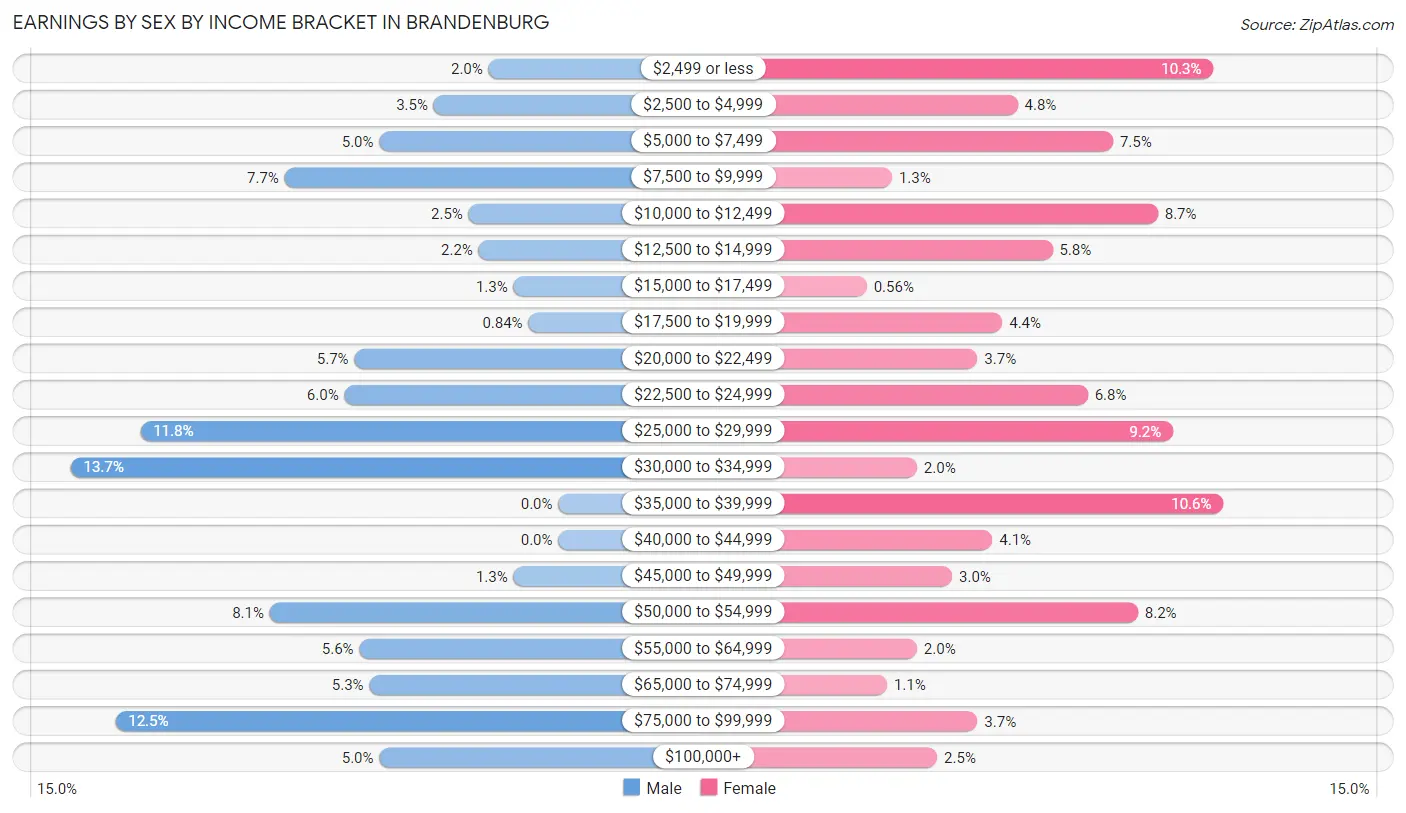
| Income | Male | Female |
| $2,499 or less | 14 (2.0%) | 73 (10.3%) |
| $2,500 to $4,999 | 25 (3.5%) | 34 (4.8%) |
| $5,000 to $7,499 | 36 (5.0%) | 53 (7.5%) |
| $7,500 to $9,999 | 55 (7.7%) | 9 (1.3%) |
| $10,000 to $12,499 | 18 (2.5%) | 62 (8.7%) |
| $12,500 to $14,999 | 16 (2.2%) | 41 (5.8%) |
| $15,000 to $17,499 | 9 (1.3%) | 4 (0.6%) |
| $17,500 to $19,999 | 6 (0.8%) | 31 (4.4%) |
| $20,000 to $22,499 | 41 (5.7%) | 26 (3.7%) |
| $22,500 to $24,999 | 43 (6.0%) | 48 (6.8%) |
| $25,000 to $29,999 | 84 (11.7%) | 65 (9.2%) |
| $30,000 to $34,999 | 98 (13.7%) | 14 (2.0%) |
| $35,000 to $39,999 | 0 (0.0%) | 75 (10.6%) |
| $40,000 to $44,999 | 0 (0.0%) | 29 (4.1%) |
| $45,000 to $49,999 | 9 (1.3%) | 21 (3.0%) |
| $50,000 to $54,999 | 58 (8.1%) | 58 (8.2%) |
| $55,000 to $64,999 | 40 (5.6%) | 14 (2.0%) |
| $65,000 to $74,999 | 38 (5.3%) | 8 (1.1%) |
| $75,000 to $99,999 | 89 (12.4%) | 26 (3.7%) |
| $100,000+ | 36 (5.0%) | 18 (2.5%) |
| Total | 715 (100.0%) | 709 (100.0%) |
Earnings by Sex by Educational Attainment in Brandenburg
Average earnings in Brandenburg are $30,771 for men and $26,118 for women, a difference of 15.1%. Men with an educational attainment of bachelor's degree enjoy the highest average annual earnings of $92,500, while those with high school diploma education earn the least with $28,100. Women with an educational attainment of graduate degree earn the most with the average annual earnings of $53,750, while those with high school diploma education have the smallest earnings of $23,594.
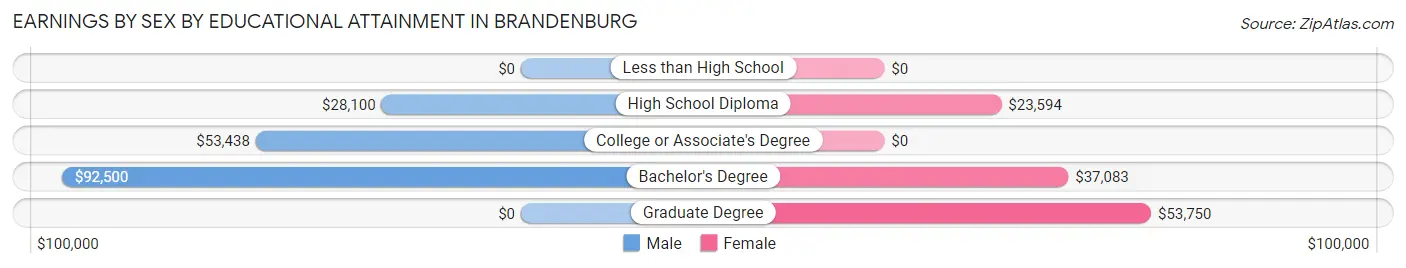
| Educational Attainment | Male Income | Female Income |
| Less than High School | - | - |
| High School Diploma | $28,100 | $23,594 |
| College or Associate's Degree | $53,438 | $0 |
| Bachelor's Degree | $92,500 | $37,083 |
| Graduate Degree | - | - |
| Total | $30,771 | $26,118 |
Family Income in Brandenburg
Family Income Brackets in Brandenburg
According to the Brandenburg family income data, there are 164 families falling into the $100,000 to $149,999 income range, which is the most common income bracket and makes up 26.7% of all families. Conversely, the $10,000 to $14,999 income bracket is the least frequent group with only 9 families (1.5%) belonging to this category.
| Income Bracket | # Families | % Families |
| Less than $10,000 | 49 | 8.0% |
| $10,000 to $14,999 | 9 | 1.5% |
| $15,000 to $24,999 | 40 | 6.5% |
| $25,000 to $34,999 | 40 | 6.5% |
| $35,000 to $49,999 | 79 | 12.8% |
| $50,000 to $74,999 | 136 | 22.1% |
| $75,000 to $99,999 | 31 | 5.0% |
| $100,000 to $149,999 | 164 | 26.7% |
| $150,000 to $199,999 | 21 | 3.4% |
| $200,000+ | 46 | 7.5% |
Family Income by Famaliy Size in Brandenburg
4-person families (80 | 13.0%) account for the highest median family income in Brandenburg with $122,593 per family, while 2-person families (313 | 50.9%) have the highest median income of $35,062 per family member.
| Income Bracket | # Families | Median Income |
| 2-Person Families | 313 (50.9%) | $70,125 |
| 3-Person Families | 158 (25.7%) | $60,375 |
| 4-Person Families | 80 (13.0%) | $122,593 |
| 5-Person Families | 18 (2.9%) | $102,813 |
| 6-Person Families | 17 (2.8%) | $0 |
| 7+ Person Families | 29 (4.7%) | $0 |
| Total | 615 (100.0%) | $69,821 |
Family Income by Number of Earners in Brandenburg
The median family income in Brandenburg is $69,821, with families comprising 3+ earners (64) having the highest median family income of $121,548, while families with 1 earner (185) have the lowest median family income of $38,750, accounting for 10.4% and 30.1% of families, respectively.
| Number of Earners | # Families | Median Income |
| No Earners | 147 (23.9%) | $54,375 |
| 1 Earner | 185 (30.1%) | $38,750 |
| 2 Earners | 219 (35.6%) | $103,005 |
| 3+ Earners | 64 (10.4%) | $121,548 |
| Total | 615 (100.0%) | $69,821 |
Household Income in Brandenburg
Household Income Brackets in Brandenburg
With 213 households falling in the category, the $50,000 to $74,999 income range is the most frequent in Brandenburg, accounting for 22.0% of all households. In contrast, only 21 households (2.2%) fall into the $150,000 to $199,999 income bracket, making it the least populous group.
| Income Bracket | # Households | % Households |
| Less than $10,000 | 71 | 7.3% |
| $10,000 to $14,999 | 54 | 5.6% |
| $15,000 to $24,999 | 84 | 8.7% |
| $25,000 to $34,999 | 104 | 10.7% |
| $35,000 to $49,999 | 149 | 15.4% |
| $50,000 to $74,999 | 213 | 22.0% |
| $75,000 to $99,999 | 43 | 4.4% |
| $100,000 to $149,999 | 180 | 18.6% |
| $150,000 to $199,999 | 21 | 2.2% |
| $200,000+ | 49 | 5.1% |
Household Income by Householder Age in Brandenburg
The median household income in Brandenburg is $51,964, with the highest median household income of $70,156 found in the 45 to 64 years age bracket for the primary householder. A total of 305 households (31.5%) fall into this category. Meanwhile, the 15 to 24 years age bracket for the primary householder has the lowest median household income of $0, with 47 households (4.9%) in this group.
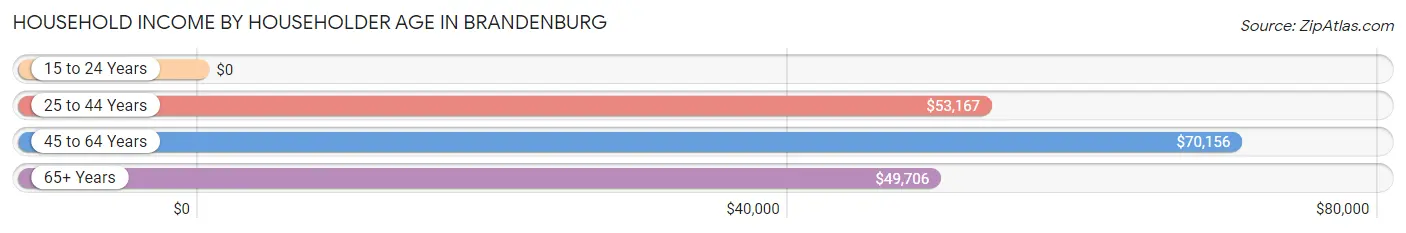
| Income Bracket | # Households | Median Income |
| 15 to 24 Years | 47 (4.9%) | $0 |
| 25 to 44 Years | 326 (33.7%) | $53,167 |
| 45 to 64 Years | 305 (31.5%) | $70,156 |
| 65+ Years | 290 (30.0%) | $49,706 |
| Total | 968 (100.0%) | $51,964 |
Poverty in Brandenburg
Income Below Poverty by Sex and Age in Brandenburg
With 17.1% poverty level for males and 20.3% for females among the residents of Brandenburg, 16 and 17 year old males and 55 to 64 year old females are the most vulnerable to poverty, with 13 males (68.4%) and 57 females (44.2%) in their respective age groups living below the poverty level.
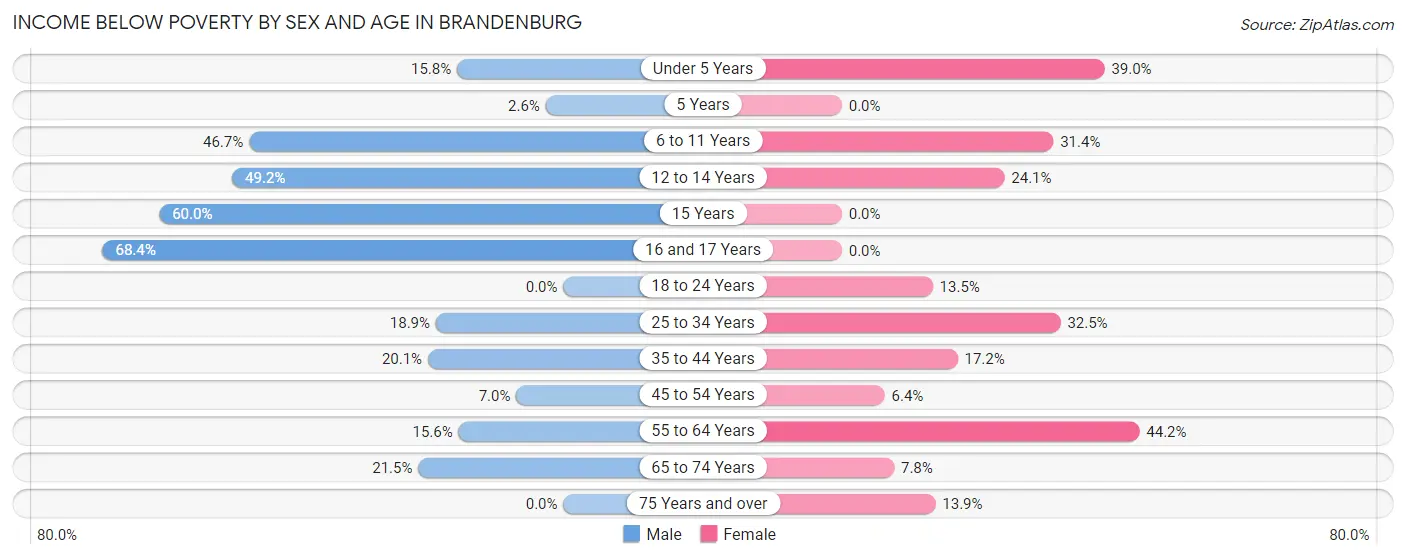
| Age Bracket | Male | Female |
| Under 5 Years | 9 (15.8%) | 39 (39.0%) |
| 5 Years | 1 (2.6%) | 0 (0.0%) |
| 6 to 11 Years | 28 (46.7%) | 27 (31.4%) |
| 12 to 14 Years | 30 (49.2%) | 7 (24.1%) |
| 15 Years | 6 (60.0%) | 0 (0.0%) |
| 16 and 17 Years | 13 (68.4%) | 0 (0.0%) |
| 18 to 24 Years | 0 (0.0%) | 29 (13.5%) |
| 25 to 34 Years | 32 (18.9%) | 50 (32.5%) |
| 35 to 44 Years | 36 (20.1%) | 38 (17.2%) |
| 45 to 54 Years | 10 (7.0%) | 7 (6.4%) |
| 55 to 64 Years | 28 (15.6%) | 57 (44.2%) |
| 65 to 74 Years | 14 (21.5%) | 9 (7.8%) |
| 75 Years and over | 0 (0.0%) | 25 (13.9%) |
| Total | 207 (17.1%) | 288 (20.3%) |
Income Above Poverty by Sex and Age in Brandenburg
According to the poverty statistics in Brandenburg, males aged 18 to 24 years and females aged 5 years are the age groups that are most secure financially, with 100.0% of males and 100.0% of females in these age groups living above the poverty line.
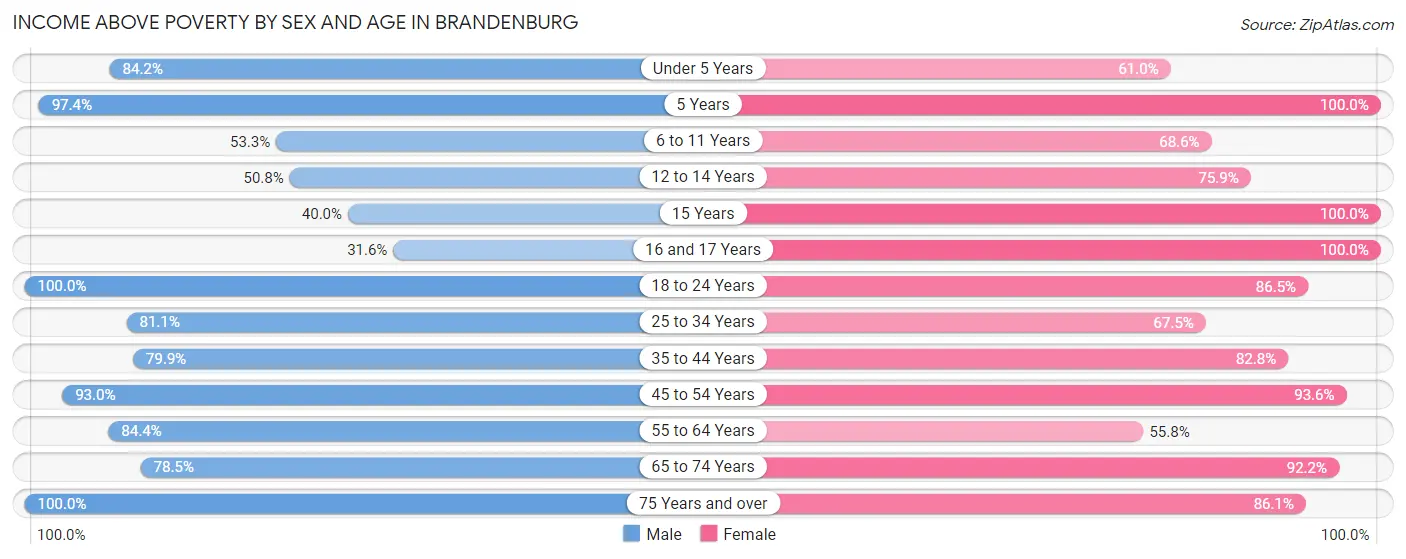
| Age Bracket | Male | Female |
| Under 5 Years | 48 (84.2%) | 61 (61.0%) |
| 5 Years | 37 (97.4%) | 23 (100.0%) |
| 6 to 11 Years | 32 (53.3%) | 59 (68.6%) |
| 12 to 14 Years | 31 (50.8%) | 22 (75.9%) |
| 15 Years | 4 (40.0%) | 15 (100.0%) |
| 16 and 17 Years | 6 (31.6%) | 44 (100.0%) |
| 18 to 24 Years | 99 (100.0%) | 186 (86.5%) |
| 25 to 34 Years | 137 (81.1%) | 104 (67.5%) |
| 35 to 44 Years | 143 (79.9%) | 183 (82.8%) |
| 45 to 54 Years | 133 (93.0%) | 103 (93.6%) |
| 55 to 64 Years | 152 (84.4%) | 72 (55.8%) |
| 65 to 74 Years | 51 (78.5%) | 107 (92.2%) |
| 75 Years and over | 128 (100.0%) | 155 (86.1%) |
| Total | 1,001 (82.9%) | 1,134 (79.7%) |
Income Below Poverty Among Married-Couple Families in Brandenburg
The poverty statistics for married-couple families in Brandenburg show that 5.7% or 26 of the total 453 families live below the poverty line. Families with 3 or 4 children have the highest poverty rate of 28.9%, comprising of 11 families. On the other hand, families with 1 or 2 children have the lowest poverty rate of 3.4%, which includes 5 families.
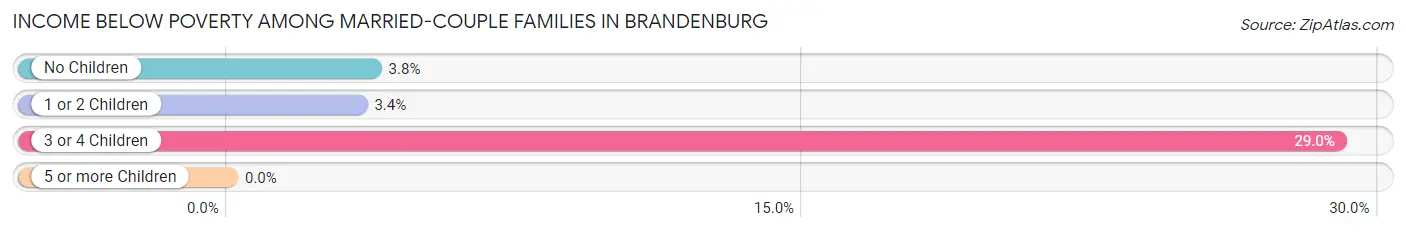
| Children | Above Poverty | Below Poverty |
| No Children | 257 (96.3%) | 10 (3.7%) |
| 1 or 2 Children | 143 (96.6%) | 5 (3.4%) |
| 3 or 4 Children | 27 (71.1%) | 11 (28.9%) |
| 5 or more Children | 0 (0.0%) | 0 (0.0%) |
| Total | 427 (94.3%) | 26 (5.7%) |
Income Below Poverty Among Single-Parent Households in Brandenburg
According to the poverty data in Brandenburg, 15.6% or 7 single-father households and 56.4% or 66 single-mother households are living below the poverty line. Among single-father households, those with 1 or 2 children have the highest poverty rate, with 7 households (24.1%) experiencing poverty. Likewise, among single-mother households, those with 3 or 4 children have the highest poverty rate, with 6 households (75.0%) falling below the poverty line.
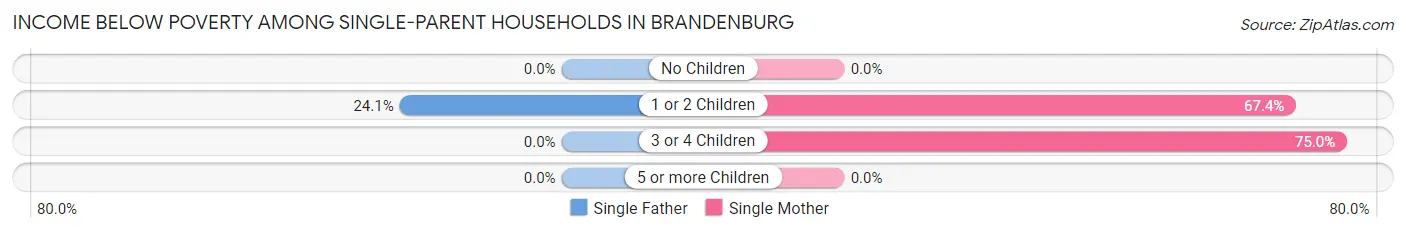
| Children | Single Father | Single Mother |
| No Children | 0 (0.0%) | 0 (0.0%) |
| 1 or 2 Children | 7 (24.1%) | 60 (67.4%) |
| 3 or 4 Children | 0 (0.0%) | 6 (75.0%) |
| 5 or more Children | 0 (0.0%) | 0 (0.0%) |
| Total | 7 (15.6%) | 66 (56.4%) |
Income Below Poverty Among Married-Couple vs Single-Parent Households in Brandenburg
The poverty data for Brandenburg shows that 26 of the married-couple family households (5.7%) and 73 of the single-parent households (45.1%) are living below the poverty level. Within the married-couple family households, those with 3 or 4 children have the highest poverty rate, with 11 households (28.9%) falling below the poverty line. Among the single-parent households, those with 3 or 4 children have the highest poverty rate, with 6 household (75.0%) living below poverty.
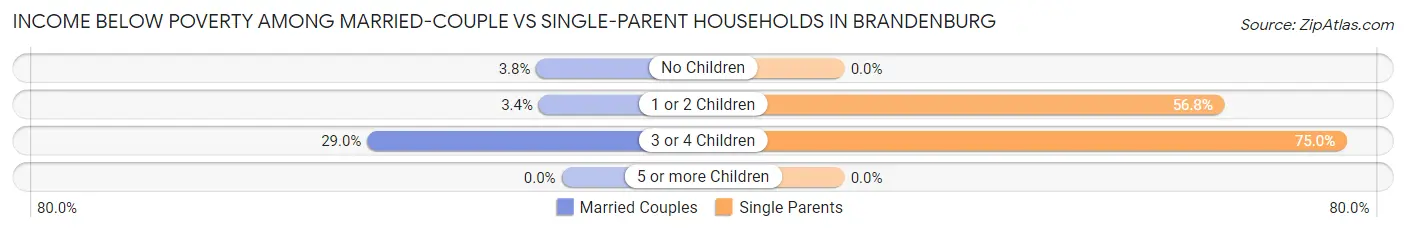
| Children | Married-Couple Families | Single-Parent Households |
| No Children | 10 (3.7%) | 0 (0.0%) |
| 1 or 2 Children | 5 (3.4%) | 67 (56.8%) |
| 3 or 4 Children | 11 (28.9%) | 6 (75.0%) |
| 5 or more Children | 0 (0.0%) | 0 (0.0%) |
| Total | 26 (5.7%) | 73 (45.1%) |
Race in Brandenburg
The most populous races in Brandenburg are White / Caucasian (2,383 | 82.3%), Two or more Races (257 | 8.9%), and Hispanic or Latino (140 | 4.8%).

| Race | # Population | % Population |
| Asian | 112 | 3.9% |
| Black / African American | 116 | 4.0% |
| Hawaiian / Pacific | 0 | 0.0% |
| Hispanic or Latino | 140 | 4.8% |
| Native / Alaskan | 0 | 0.0% |
| White / Caucasian | 2,383 | 82.3% |
| Two or more Races | 257 | 8.9% |
| Some other Race | 28 | 1.0% |
| Total | 2,896 | 100.0% |
Ancestry in Brandenburg
The most populous ancestries reported in Brandenburg are Irish (690 | 23.8%), German (348 | 12.0%), English (276 | 9.5%), American (275 | 9.5%), and Cherokee (89 | 3.1%), together accounting for 58.0% of all Brandenburg residents.
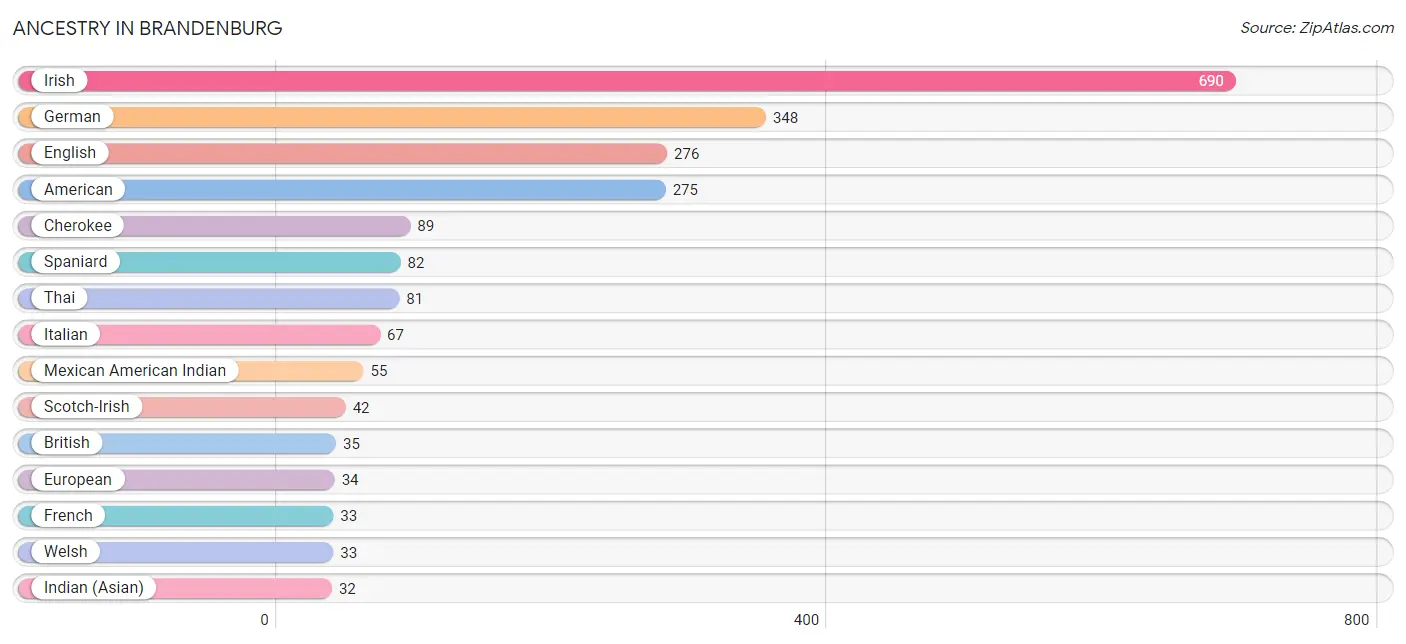
| Ancestry | # Population | % Population |
| African | 11 | 0.4% |
| American | 275 | 9.5% |
| British | 35 | 1.2% |
| Cherokee | 89 | 3.1% |
| Cheyenne | 2 | 0.1% |
| Czech | 9 | 0.3% |
| Dominican | 20 | 0.7% |
| Dutch | 4 | 0.1% |
| English | 276 | 9.5% |
| European | 34 | 1.2% |
| French | 33 | 1.1% |
| French American Indian | 1 | 0.0% |
| German | 348 | 12.0% |
| Hungarian | 25 | 0.9% |
| Indian (Asian) | 32 | 1.1% |
| Irish | 690 | 23.8% |
| Italian | 67 | 2.3% |
| Korean | 18 | 0.6% |
| Malaysian | 16 | 0.5% |
| Mexican | 30 | 1.0% |
| Mexican American Indian | 55 | 1.9% |
| Ottawa | 2 | 0.1% |
| Polish | 25 | 0.9% |
| Scandinavian | 6 | 0.2% |
| Scotch-Irish | 42 | 1.5% |
| Scottish | 28 | 1.0% |
| Sioux | 2 | 0.1% |
| Spaniard | 82 | 2.8% |
| Spanish | 2 | 0.1% |
| Subsaharan African | 11 | 0.4% |
| Swedish | 5 | 0.2% |
| Thai | 81 | 2.8% |
| Welsh | 33 | 1.1% | View All 33 Rows |
Immigrants in Brandenburg
The most numerous immigrant groups reported in Brandenburg came from Asia (96 | 3.3%), India (65 | 2.2%), South Central Asia (65 | 2.2%), China (23 | 0.8%), and Eastern Asia (23 | 0.8%), together accounting for 9.4% of all Brandenburg residents.
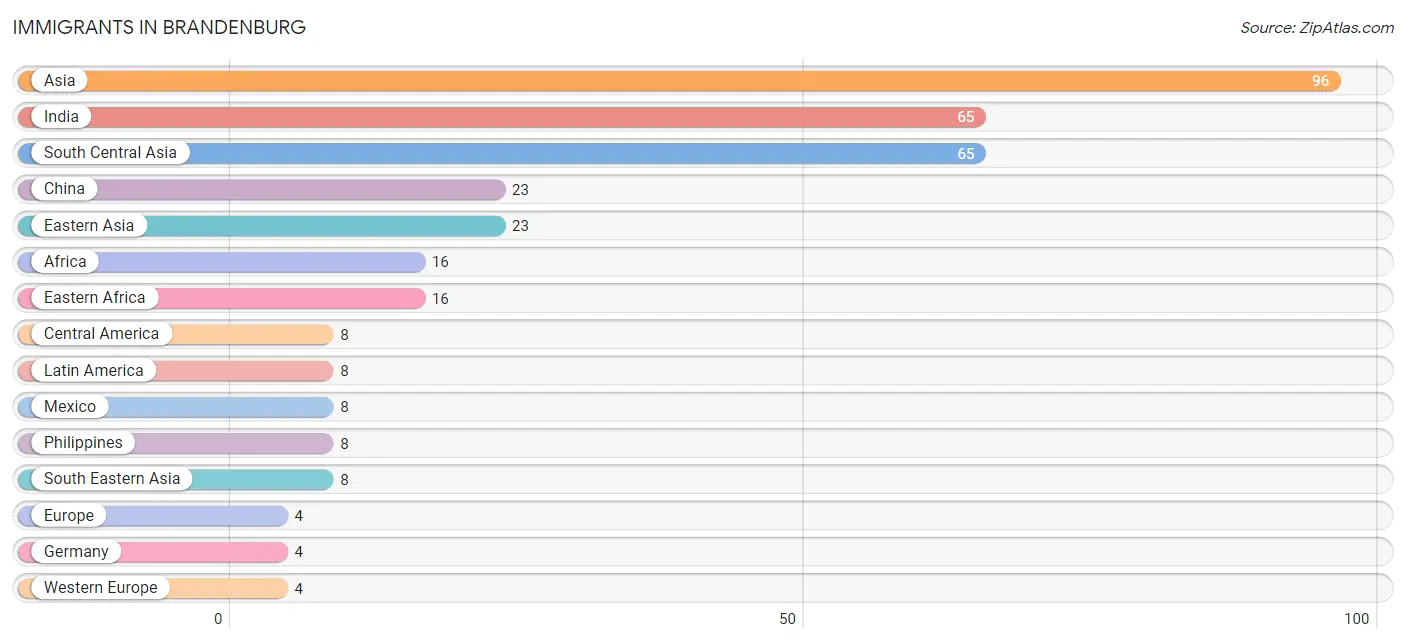
| Immigration Origin | # Population | % Population |
| Africa | 16 | 0.5% |
| Asia | 96 | 3.3% |
| Central America | 8 | 0.3% |
| China | 23 | 0.8% |
| Eastern Africa | 16 | 0.5% |
| Eastern Asia | 23 | 0.8% |
| Europe | 4 | 0.1% |
| Germany | 4 | 0.1% |
| India | 65 | 2.2% |
| Latin America | 8 | 0.3% |
| Mexico | 8 | 0.3% |
| Philippines | 8 | 0.3% |
| South Central Asia | 65 | 2.2% |
| South Eastern Asia | 8 | 0.3% |
| Western Europe | 4 | 0.1% | View All 15 Rows |
Sex and Age in Brandenburg
Sex and Age in Brandenburg
The most populous age groups in Brandenburg are 40 to 44 Years (141 | 9.9%) for men and 20 to 24 Years (195 | 13.2%) for women.
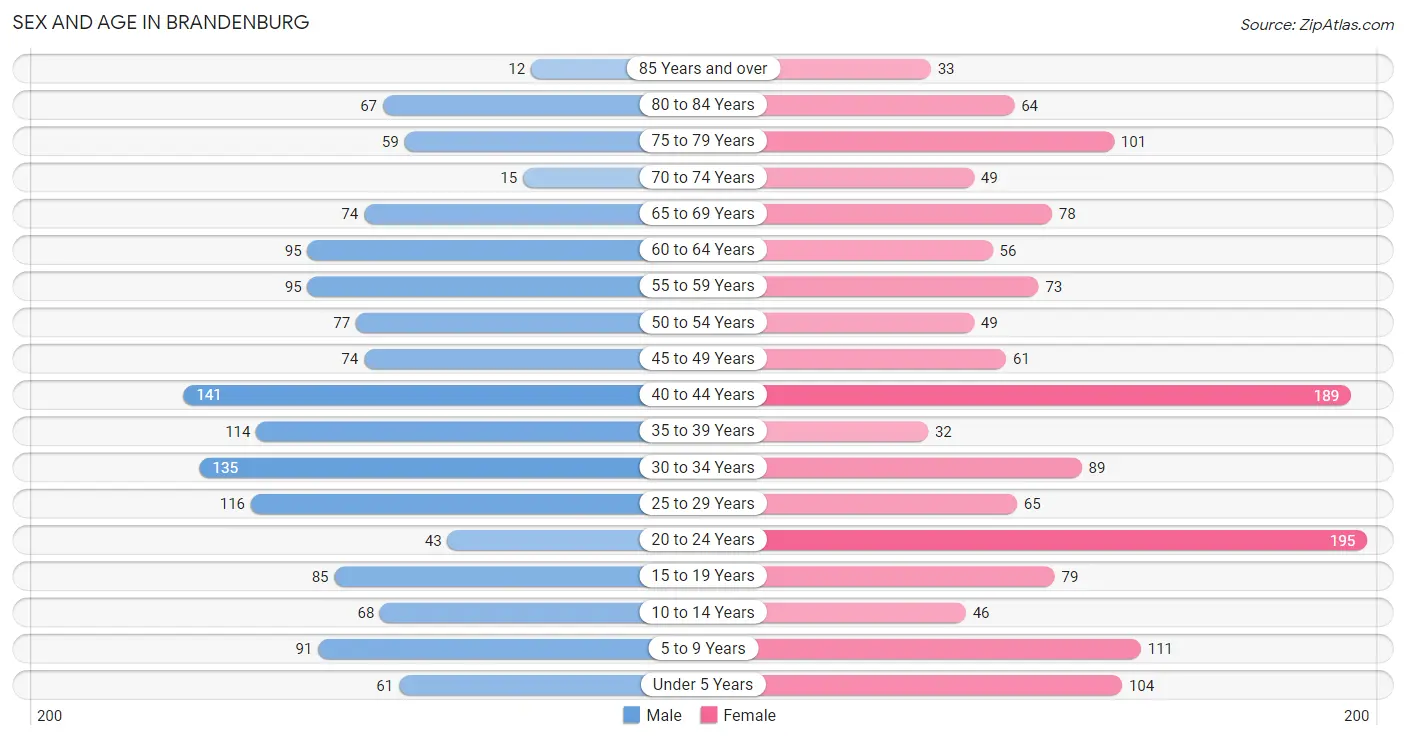
| Age Bracket | Male | Female |
| Under 5 Years | 61 (4.3%) | 104 (7.1%) |
| 5 to 9 Years | 91 (6.4%) | 111 (7.5%) |
| 10 to 14 Years | 68 (4.8%) | 46 (3.1%) |
| 15 to 19 Years | 85 (6.0%) | 79 (5.4%) |
| 20 to 24 Years | 43 (3.0%) | 195 (13.2%) |
| 25 to 29 Years | 116 (8.2%) | 65 (4.4%) |
| 30 to 34 Years | 135 (9.5%) | 89 (6.0%) |
| 35 to 39 Years | 114 (8.0%) | 32 (2.2%) |
| 40 to 44 Years | 141 (9.9%) | 189 (12.8%) |
| 45 to 49 Years | 74 (5.2%) | 61 (4.1%) |
| 50 to 54 Years | 77 (5.4%) | 49 (3.3%) |
| 55 to 59 Years | 95 (6.7%) | 73 (5.0%) |
| 60 to 64 Years | 95 (6.7%) | 56 (3.8%) |
| 65 to 69 Years | 74 (5.2%) | 78 (5.3%) |
| 70 to 74 Years | 15 (1.1%) | 49 (3.3%) |
| 75 to 79 Years | 59 (4.2%) | 101 (6.9%) |
| 80 to 84 Years | 67 (4.7%) | 64 (4.3%) |
| 85 Years and over | 12 (0.8%) | 33 (2.2%) |
| Total | 1,422 (100.0%) | 1,474 (100.0%) |
Families and Households in Brandenburg
Median Family Size in Brandenburg
The median family size in Brandenburg is 3.39 persons per family, with single male/father families (45 | 7.3%) accounting for the largest median family size of 4.16 persons per family. On the other hand, single female/mother families (117 | 19.0%) represent the smallest median family size with 3.21 persons per family.
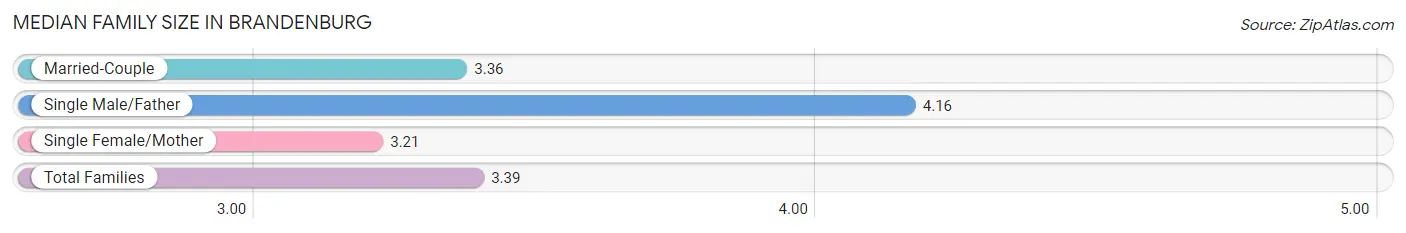
| Family Type | # Families | Family Size |
| Married-Couple | 453 (73.7%) | 3.36 |
| Single Male/Father | 45 (7.3%) | 4.16 |
| Single Female/Mother | 117 (19.0%) | 3.21 |
| Total Families | 615 (100.0%) | 3.39 |
Median Household Size in Brandenburg
The median household size in Brandenburg is 2.74 persons per household, with single female/mother households (117 | 12.1%) accounting for the largest median household size of 4.38 persons per household. non-family households (353 | 36.5%) represent the smallest median household size with 1.13 persons per household.
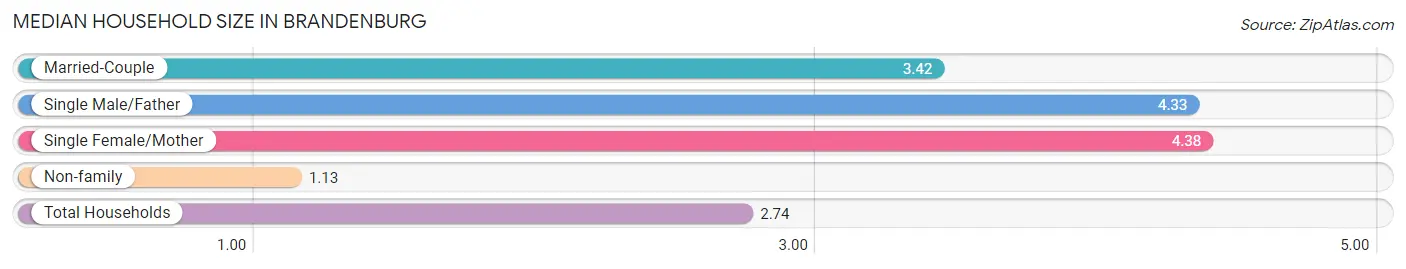
| Household Type | # Households | Household Size |
| Married-Couple | 453 (46.8%) | 3.42 |
| Single Male/Father | 45 (4.6%) | 4.33 |
| Single Female/Mother | 117 (12.1%) | 4.38 |
| Non-family | 353 (36.5%) | 1.13 |
| Total Households | 968 (100.0%) | 2.74 |
Household Size by Marriage Status in Brandenburg
Out of a total of 968 households in Brandenburg, 615 (63.5%) are family households, while 353 (36.5%) are nonfamily households. The most numerous type of family households are 2-person households, comprising 274, and the most common type of nonfamily households are 1-person households, comprising 310.
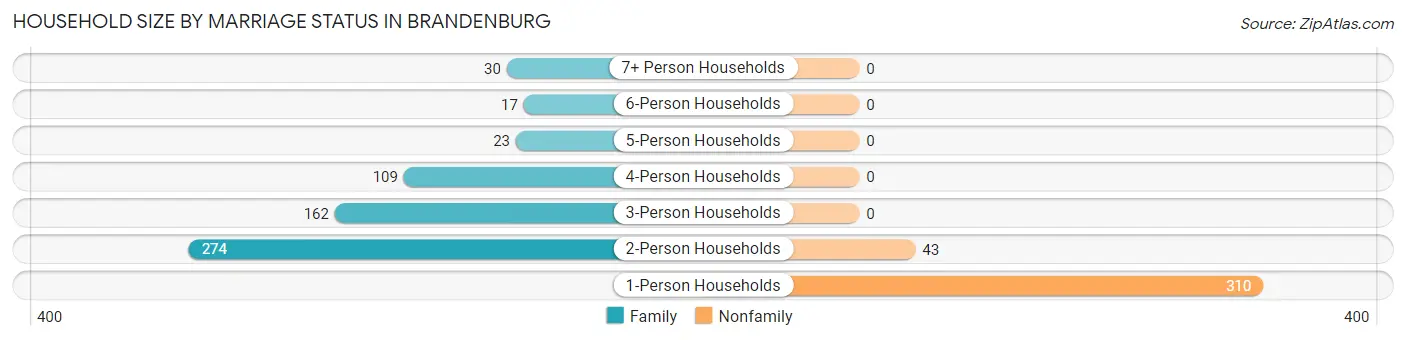
| Household Size | Family Households | Nonfamily Households |
| 1-Person Households | - | 310 (32.0%) |
| 2-Person Households | 274 (28.3%) | 43 (4.4%) |
| 3-Person Households | 162 (16.7%) | 0 (0.0%) |
| 4-Person Households | 109 (11.3%) | 0 (0.0%) |
| 5-Person Households | 23 (2.4%) | 0 (0.0%) |
| 6-Person Households | 17 (1.8%) | 0 (0.0%) |
| 7+ Person Households | 30 (3.1%) | 0 (0.0%) |
| Total | 615 (63.5%) | 353 (36.5%) |
Female Fertility in Brandenburg
Fertility by Age in Brandenburg
Average fertility rate in Brandenburg is 51.0 births per 1,000 women. Women in the age bracket of 20 to 34 years have the highest fertility rate with 89.0 births per 1,000 women. Women in the age bracket of 20 to 34 years acount for 86.1% of all women with births.
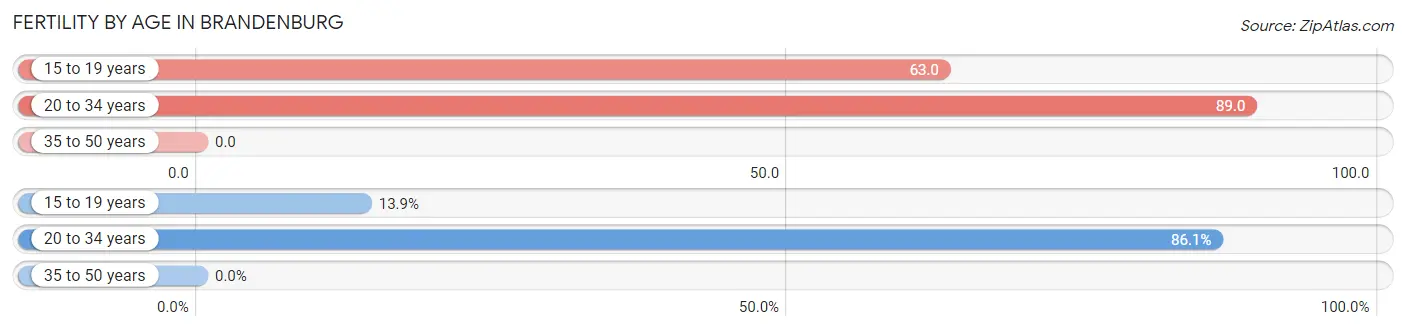
| Age Bracket | Women with Births | Births / 1,000 Women |
| 15 to 19 years | 5 (13.9%) | 63.0 |
| 20 to 34 years | 31 (86.1%) | 89.0 |
| 35 to 50 years | 0 (0.0%) | 0.0 |
| Total | 36 (100.0%) | 51.0 |
Fertility by Age by Marriage Status in Brandenburg
27.8% of women with births (36) in Brandenburg are married. The highest percentage of unmarried women with births falls into 15 to 19 years age bracket with 100.0% of them unmarried at the time of birth, while the lowest percentage of unmarried women with births belong to 20 to 34 years age bracket with 67.7% of them unmarried.
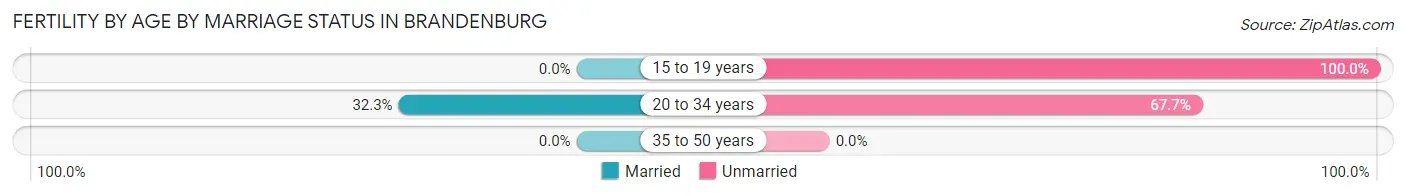
| Age Bracket | Married | Unmarried |
| 15 to 19 years | 0 (0.0%) | 5 (100.0%) |
| 20 to 34 years | 10 (32.3%) | 21 (67.7%) |
| 35 to 50 years | 0 (0.0%) | 0 (0.0%) |
| Total | 10 (27.8%) | 26 (72.2%) |
Fertility by Education in Brandenburg
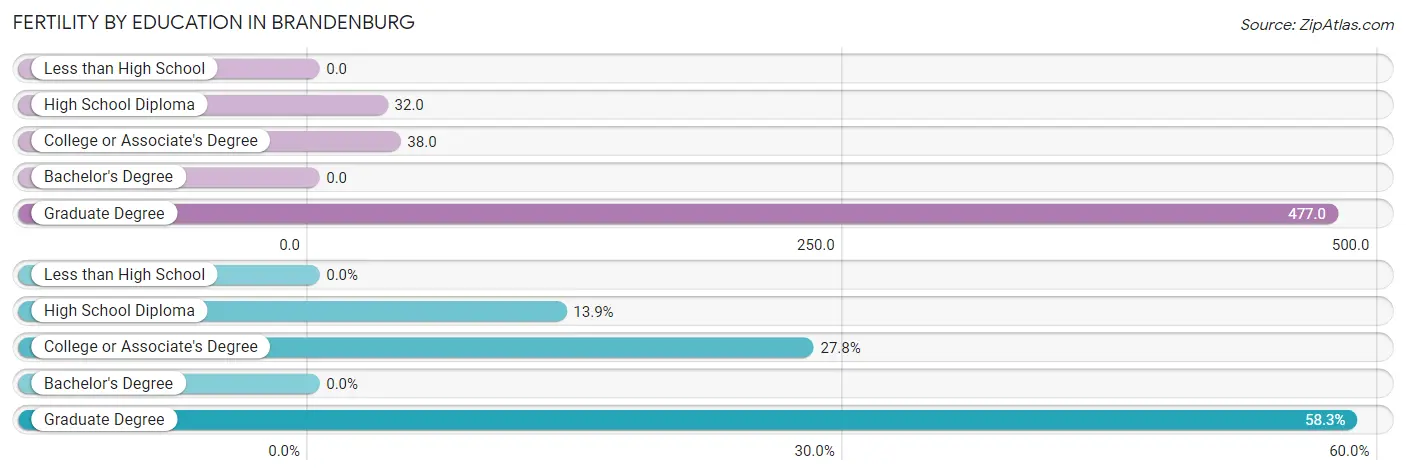
| Educational Attainment | Women with Births | Births / 1,000 Women |
| Less than High School | 0 (0.0%) | 0.0 |
| High School Diploma | 5 (13.9%) | 32.0 |
| College or Associate's Degree | 10 (27.8%) | 38.0 |
| Bachelor's Degree | 0 (0.0%) | 0.0 |
| Graduate Degree | 21 (58.3%) | 477.0 |
| Total | 36 (100.0%) | 51.0 |
Fertility by Education by Marriage Status in Brandenburg
72.2% of women with births in Brandenburg are unmarried. Women with the educational attainment of college or associate's degree are most likely to be married with 50.0% of them married at childbirth, while women with the educational attainment of high school diploma are least likely to be married with 100.0% of them unmarried at childbirth.
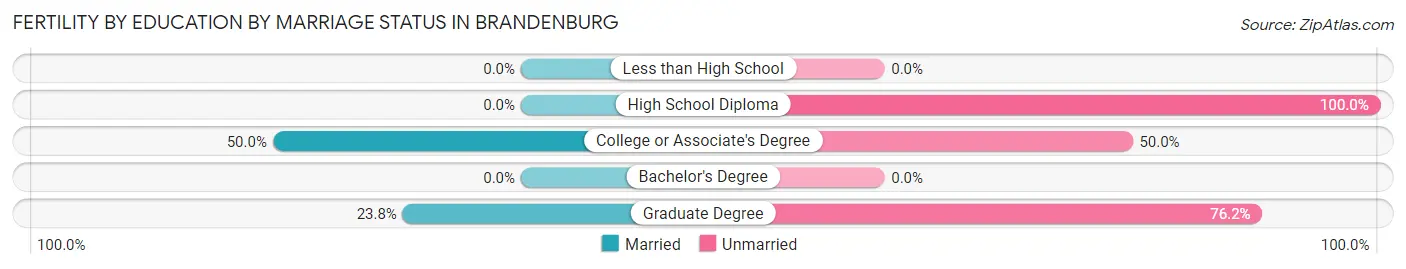
| Educational Attainment | Married | Unmarried |
| Less than High School | 0 (0.0%) | 0 (0.0%) |
| High School Diploma | 0 (0.0%) | 5 (100.0%) |
| College or Associate's Degree | 5 (50.0%) | 5 (50.0%) |
| Bachelor's Degree | 0 (0.0%) | 0 (0.0%) |
| Graduate Degree | 5 (23.8%) | 16 (76.2%) |
| Total | 10 (27.8%) | 26 (72.2%) |
Employment Characteristics in Brandenburg
Employment by Class of Employer in Brandenburg
Among the 1,194 employed individuals in Brandenburg, private company employees (976 | 81.7%), self-employed (incorporated) (62 | 5.2%), and not-for-profit organizations (41 | 3.4%) make up the most common classes of employment.
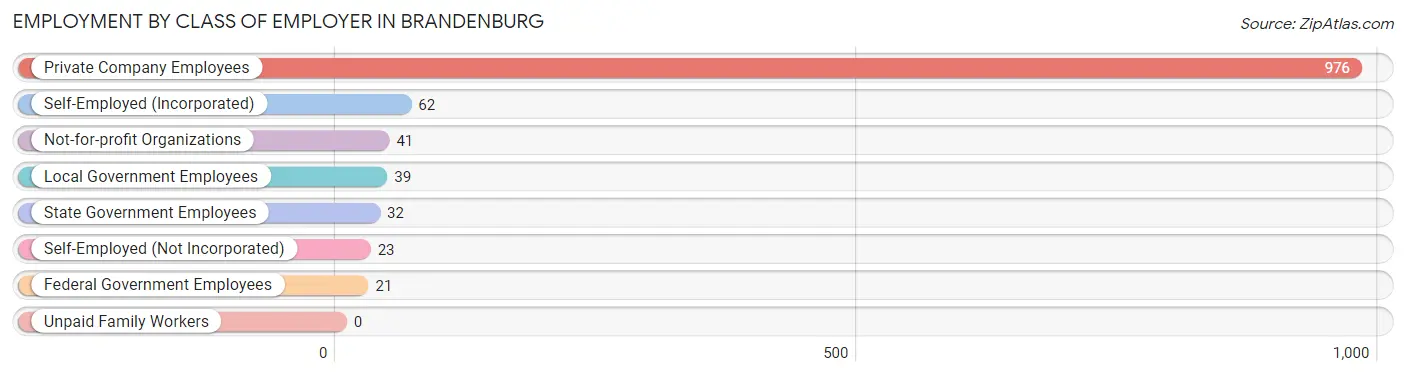
| Employer Class | # Employees | % Employees |
| Private Company Employees | 976 | 81.7% |
| Self-Employed (Incorporated) | 62 | 5.2% |
| Self-Employed (Not Incorporated) | 23 | 1.9% |
| Not-for-profit Organizations | 41 | 3.4% |
| Local Government Employees | 39 | 3.3% |
| State Government Employees | 32 | 2.7% |
| Federal Government Employees | 21 | 1.8% |
| Unpaid Family Workers | 0 | 0.0% |
| Total | 1,194 | 100.0% |
Employment Status by Age in Brandenburg
According to the labor force statistics for Brandenburg, out of the total population over 16 years of age (2,390), 51.8% or 1,238 individuals are in the labor force, with 3.0% or 37 of them unemployed. The age group with the highest labor force participation rate is 25 to 29 years, with 77.9% or 141 individuals in the labor force. Within the labor force, the 30 to 34 years age range has the highest percentage of unemployed individuals, with 12.9% or 17 of them being unemployed.
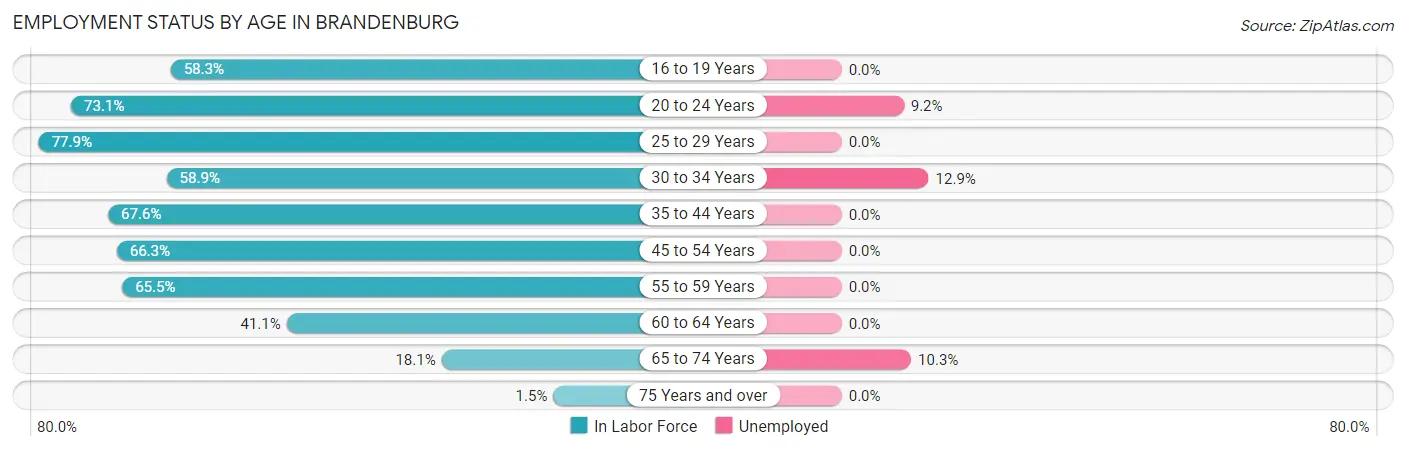
| Age Bracket | In Labor Force | Unemployed |
| 16 to 19 Years | 81 (58.3%) | 0 (0.0%) |
| 20 to 24 Years | 174 (73.1%) | 16 (9.2%) |
| 25 to 29 Years | 141 (77.9%) | 0 (0.0%) |
| 30 to 34 Years | 132 (58.9%) | 17 (12.9%) |
| 35 to 44 Years | 322 (67.6%) | 0 (0.0%) |
| 45 to 54 Years | 173 (66.3%) | 0 (0.0%) |
| 55 to 59 Years | 110 (65.5%) | 0 (0.0%) |
| 60 to 64 Years | 62 (41.1%) | 0 (0.0%) |
| 65 to 74 Years | 39 (18.1%) | 4 (10.3%) |
| 75 Years and over | 5 (1.5%) | 0 (0.0%) |
| Total | 1,238 (51.8%) | 37 (3.0%) |
Employment Status by Educational Attainment in Brandenburg
According to labor force statistics for Brandenburg, 64.3% of individuals (939) out of the total population between 25 and 64 years of age (1,461) are in the labor force, with 1.8% or 17 of them being unemployed. The group with the highest labor force participation rate are those with the educational attainment of bachelor's degree or higher, with 78.3% or 177 individuals in the labor force. Within the labor force, individuals with college / associate degree education have the highest percentage of unemployment, with 4.6% or 17 of them being unemployed.
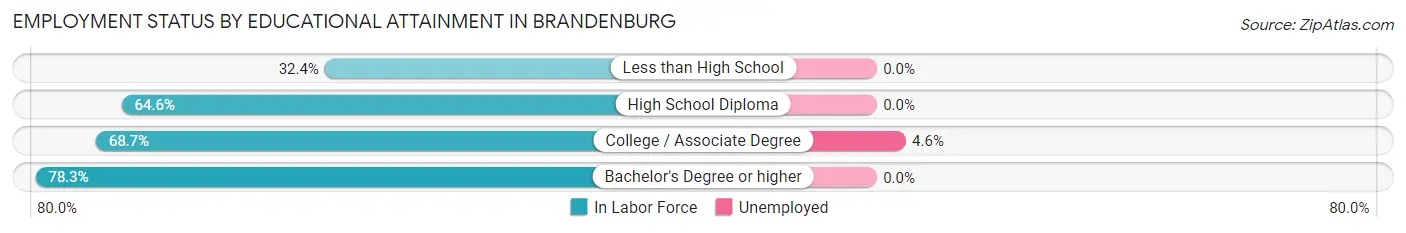
| Educational Attainment | In Labor Force | Unemployed |
| Less than High School | 57 (32.4%) | 0 (0.0%) |
| High School Diploma | 339 (64.6%) | 0 (0.0%) |
| College / Associate Degree | 367 (68.7%) | 25 (4.6%) |
| Bachelor's Degree or higher | 177 (78.3%) | 0 (0.0%) |
| Total | 939 (64.3%) | 26 (1.8%) |
Employment Occupations by Sex in Brandenburg
Management, Business, Science and Arts Occupations
The most common Management, Business, Science and Arts occupations in Brandenburg are Management (101 | 8.4%), Community & Social Service (62 | 5.2%), Health Diagnosing & Treating (60 | 5.0%), Computers, Engineering & Science (39 | 3.3%), and Education Instruction & Library (39 | 3.3%).
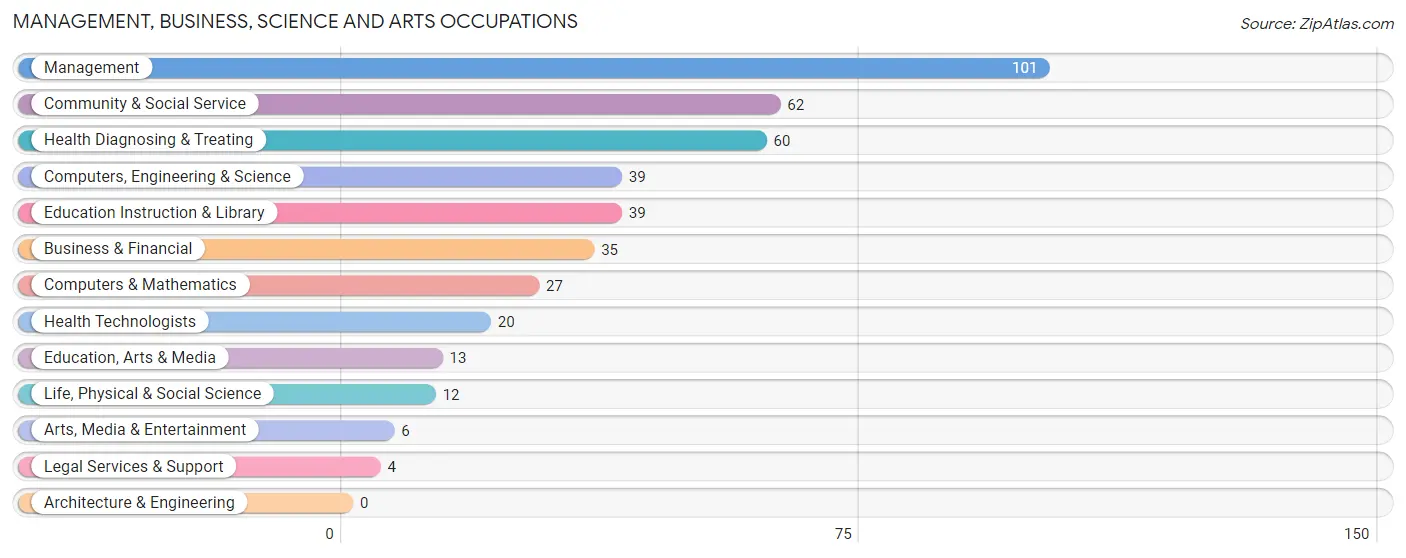
Management, Business, Science and Arts Occupations by Sex
Within the Management, Business, Science and Arts occupations in Brandenburg, the most male-oriented occupations are Computers & Mathematics (100.0%), Computers, Engineering & Science (84.6%), and Management (62.4%), while the most female-oriented occupations are Education, Arts & Media (100.0%), Education Instruction & Library (94.9%), and Health Diagnosing & Treating (91.7%).
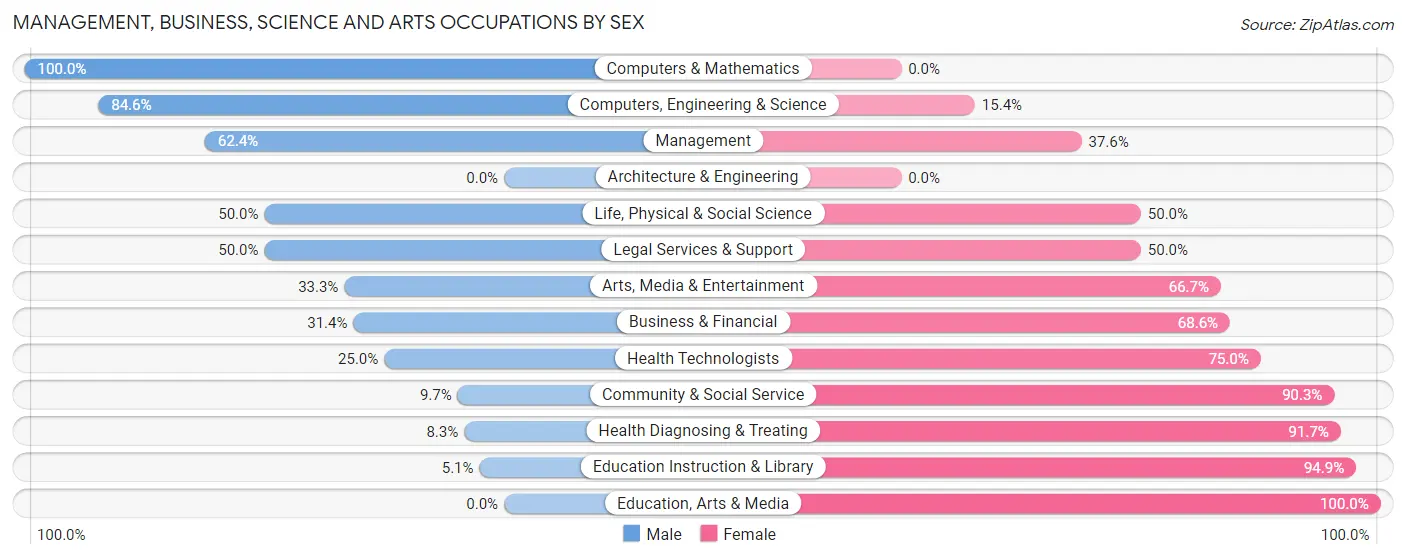
| Occupation | Male | Female |
| Management | 63 (62.4%) | 38 (37.6%) |
| Business & Financial | 11 (31.4%) | 24 (68.6%) |
| Computers, Engineering & Science | 33 (84.6%) | 6 (15.4%) |
| Computers & Mathematics | 27 (100.0%) | 0 (0.0%) |
| Architecture & Engineering | 0 (0.0%) | 0 (0.0%) |
| Life, Physical & Social Science | 6 (50.0%) | 6 (50.0%) |
| Community & Social Service | 6 (9.7%) | 56 (90.3%) |
| Education, Arts & Media | 0 (0.0%) | 13 (100.0%) |
| Legal Services & Support | 2 (50.0%) | 2 (50.0%) |
| Education Instruction & Library | 2 (5.1%) | 37 (94.9%) |
| Arts, Media & Entertainment | 2 (33.3%) | 4 (66.7%) |
| Health Diagnosing & Treating | 5 (8.3%) | 55 (91.7%) |
| Health Technologists | 5 (25.0%) | 15 (75.0%) |
| Total (Category) | 118 (39.7%) | 179 (60.3%) |
| Total (Overall) | 580 (48.4%) | 619 (51.6%) |
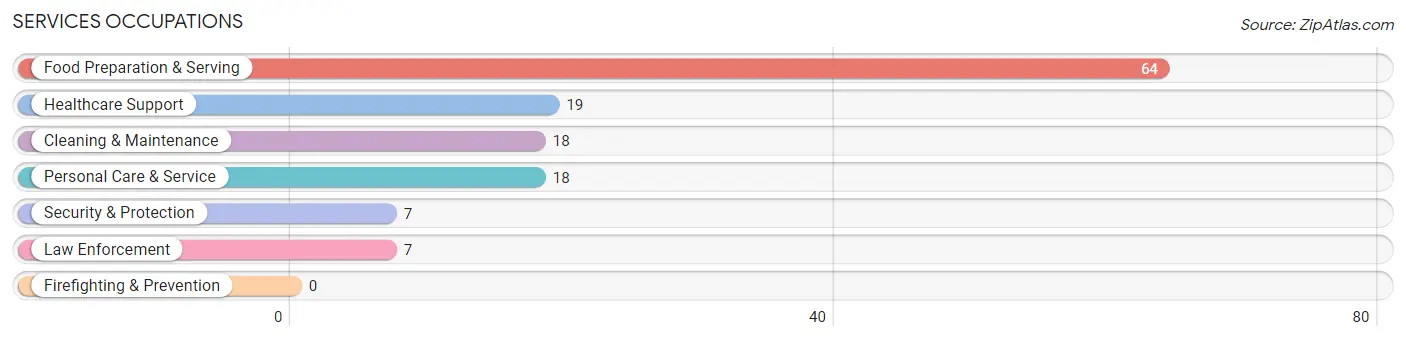
Services Occupations
The most common Services occupations in Brandenburg are Food Preparation & Serving (64 | 5.3%), Healthcare Support (19 | 1.6%), Cleaning & Maintenance (18 | 1.5%), Personal Care & Service (18 | 1.5%), and Security & Protection (7 | 0.6%).
Services Occupations by Sex
Within the Services occupations in Brandenburg, the most male-oriented occupations are Security & Protection (100.0%), Law Enforcement (100.0%), and Cleaning & Maintenance (50.0%), while the most female-oriented occupations are Healthcare Support (100.0%), Personal Care & Service (100.0%), and Food Preparation & Serving (57.8%).
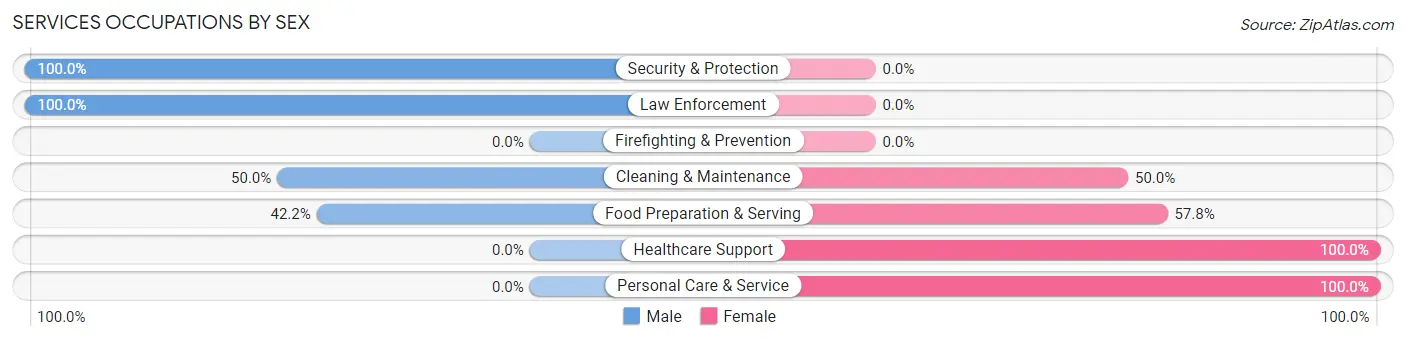
| Occupation | Male | Female |
| Healthcare Support | 0 (0.0%) | 19 (100.0%) |
| Security & Protection | 7 (100.0%) | 0 (0.0%) |
| Firefighting & Prevention | 0 (0.0%) | 0 (0.0%) |
| Law Enforcement | 7 (100.0%) | 0 (0.0%) |
| Food Preparation & Serving | 27 (42.2%) | 37 (57.8%) |
| Cleaning & Maintenance | 9 (50.0%) | 9 (50.0%) |
| Personal Care & Service | 0 (0.0%) | 18 (100.0%) |
| Total (Category) | 43 (34.1%) | 83 (65.9%) |
| Total (Overall) | 580 (48.4%) | 619 (51.6%) |
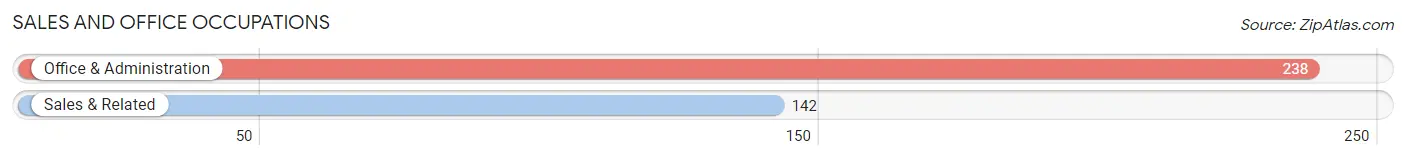
Sales and Office Occupations
The most common Sales and Office occupations in Brandenburg are Office & Administration (238 | 19.9%), and Sales & Related (142 | 11.8%).
Sales and Office Occupations by Sex
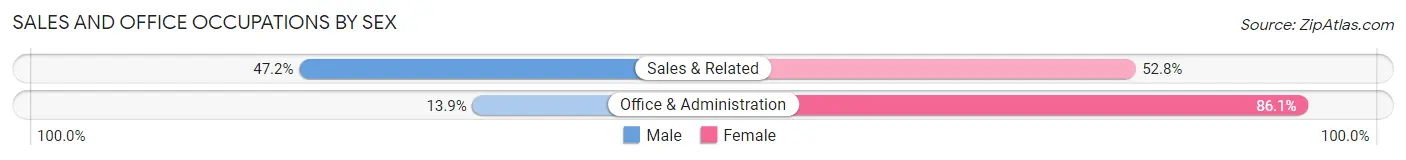
| Occupation | Male | Female |
| Sales & Related | 67 (47.2%) | 75 (52.8%) |
| Office & Administration | 33 (13.9%) | 205 (86.1%) |
| Total (Category) | 100 (26.3%) | 280 (73.7%) |
| Total (Overall) | 580 (48.4%) | 619 (51.6%) |
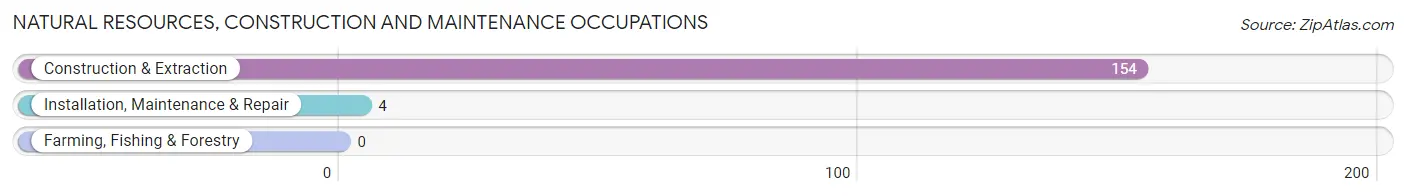
Natural Resources, Construction and Maintenance Occupations
The most common Natural Resources, Construction and Maintenance occupations in Brandenburg are Construction & Extraction (154 | 12.8%), and Installation, Maintenance & Repair (4 | 0.3%).
Natural Resources, Construction and Maintenance Occupations by Sex
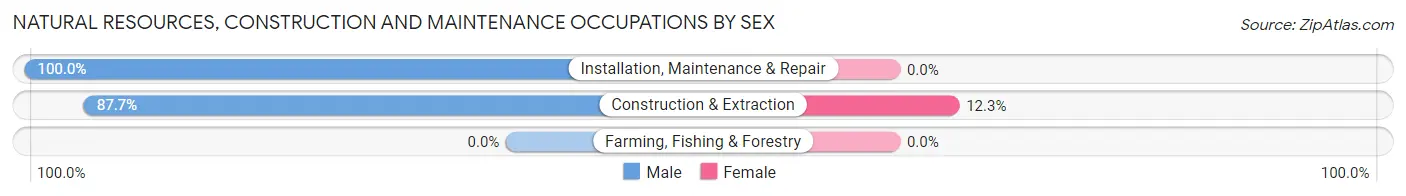
| Occupation | Male | Female |
| Farming, Fishing & Forestry | 0 (0.0%) | 0 (0.0%) |
| Construction & Extraction | 135 (87.7%) | 19 (12.3%) |
| Installation, Maintenance & Repair | 4 (100.0%) | 0 (0.0%) |
| Total (Category) | 139 (88.0%) | 19 (12.0%) |
| Total (Overall) | 580 (48.4%) | 619 (51.6%) |
Production, Transportation and Moving Occupations
The most common Production, Transportation and Moving occupations in Brandenburg are Production (149 | 12.4%), Transportation (46 | 3.8%), and Material Moving (43 | 3.6%).
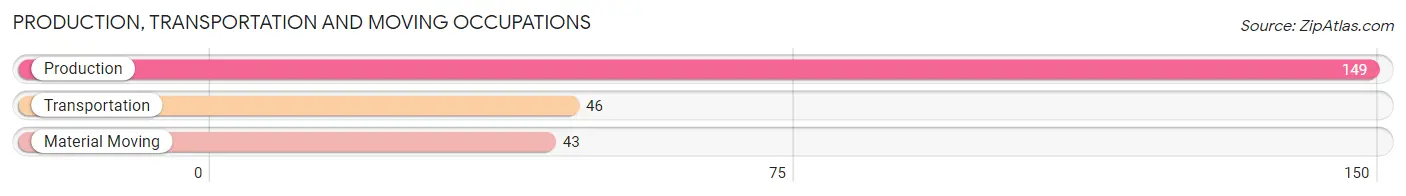
Production, Transportation and Moving Occupations by Sex
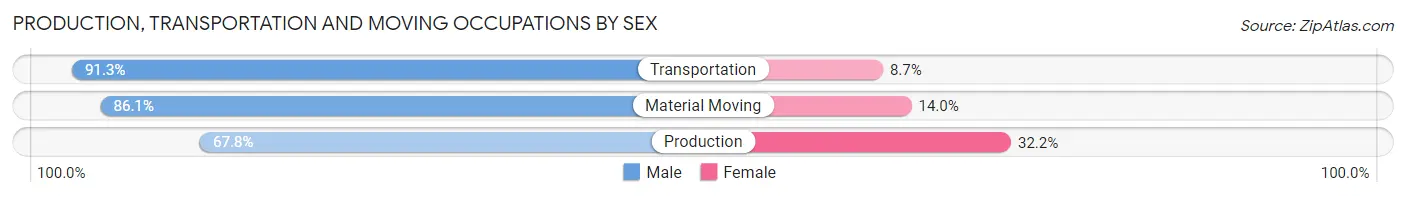
| Occupation | Male | Female |
| Production | 101 (67.8%) | 48 (32.2%) |
| Transportation | 42 (91.3%) | 4 (8.7%) |
| Material Moving | 37 (86.1%) | 6 (14.0%) |
| Total (Category) | 180 (75.6%) | 58 (24.4%) |
| Total (Overall) | 580 (48.4%) | 619 (51.6%) |
Employment Industries by Sex in Brandenburg
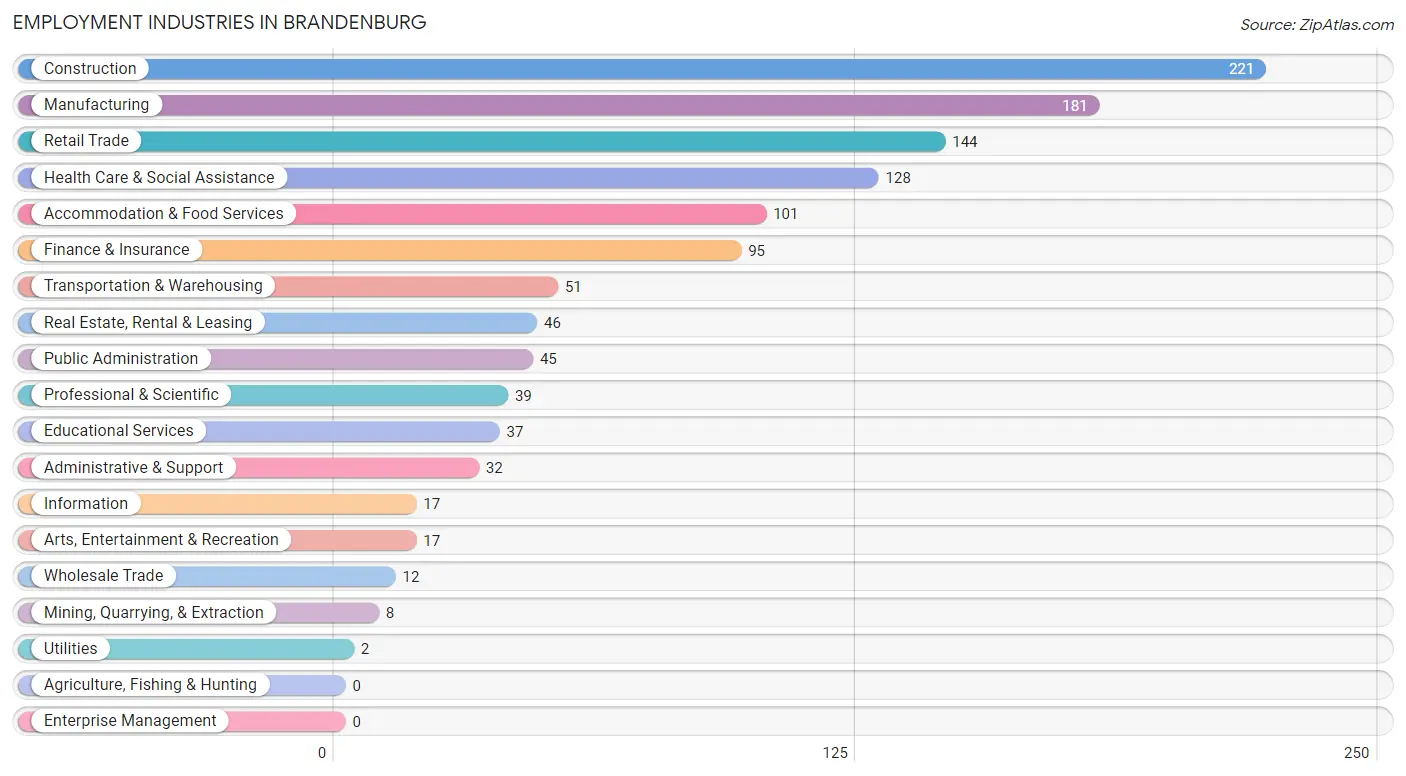
Employment Industries in Brandenburg
The major employment industries in Brandenburg include Construction (221 | 18.4%), Manufacturing (181 | 15.1%), Retail Trade (144 | 12.0%), Health Care & Social Assistance (128 | 10.7%), and Accommodation & Food Services (101 | 8.4%).
Employment Industries by Sex in Brandenburg
The Brandenburg industries that see more men than women are Mining, Quarrying, & Extraction (100.0%), Utilities (100.0%), and Transportation & Warehousing (80.4%), whereas the industries that tend to have a higher number of women are Wholesale Trade (100.0%), Real Estate, Rental & Leasing (100.0%), and Educational Services (100.0%).
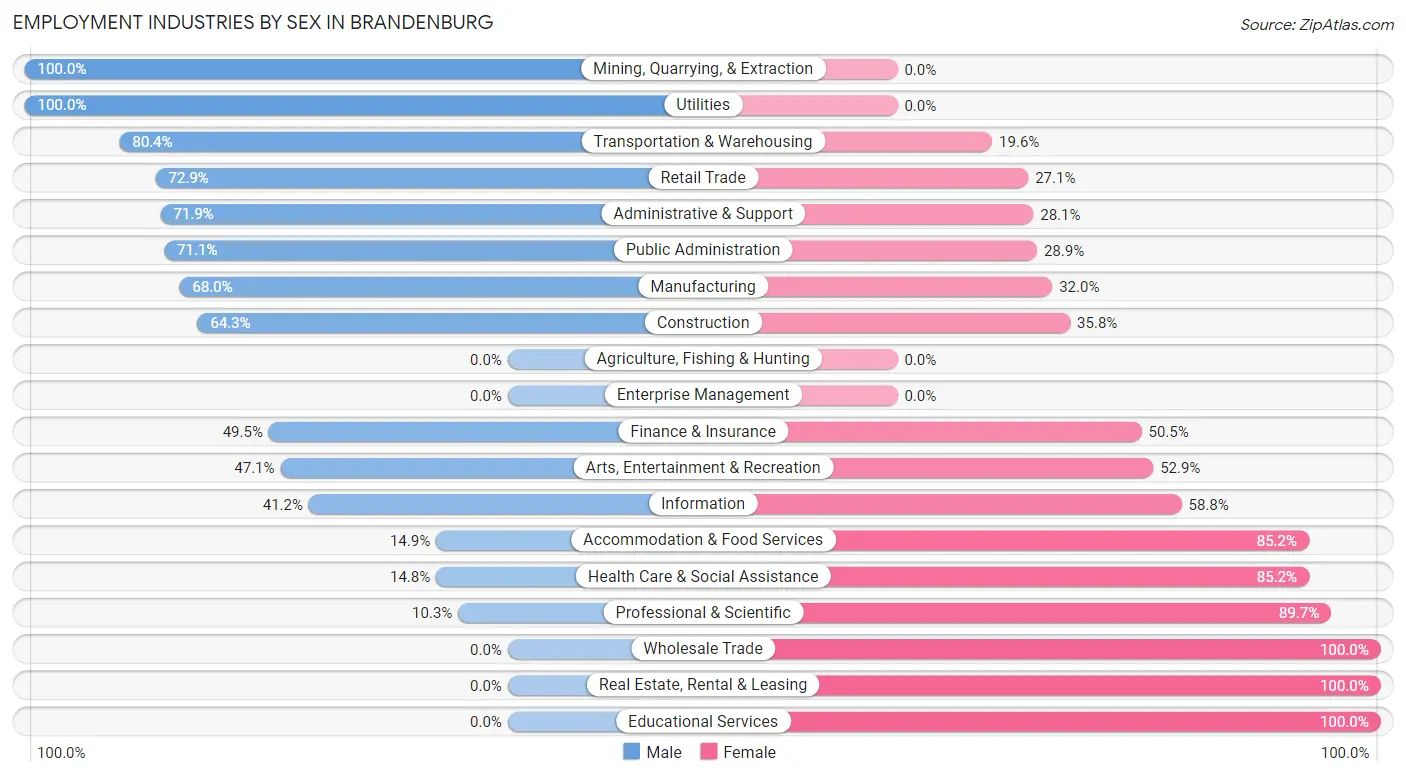
| Industry | Male | Female |
| Agriculture, Fishing & Hunting | 0 (0.0%) | 0 (0.0%) |
| Mining, Quarrying, & Extraction | 8 (100.0%) | 0 (0.0%) |
| Construction | 142 (64.2%) | 79 (35.7%) |
| Manufacturing | 123 (68.0%) | 58 (32.0%) |
| Wholesale Trade | 0 (0.0%) | 12 (100.0%) |
| Retail Trade | 105 (72.9%) | 39 (27.1%) |
| Transportation & Warehousing | 41 (80.4%) | 10 (19.6%) |
| Utilities | 2 (100.0%) | 0 (0.0%) |
| Information | 7 (41.2%) | 10 (58.8%) |
| Finance & Insurance | 47 (49.5%) | 48 (50.5%) |
| Real Estate, Rental & Leasing | 0 (0.0%) | 46 (100.0%) |
| Professional & Scientific | 4 (10.3%) | 35 (89.7%) |
| Enterprise Management | 0 (0.0%) | 0 (0.0%) |
| Administrative & Support | 23 (71.9%) | 9 (28.1%) |
| Educational Services | 0 (0.0%) | 37 (100.0%) |
| Health Care & Social Assistance | 19 (14.8%) | 109 (85.2%) |
| Arts, Entertainment & Recreation | 8 (47.1%) | 9 (52.9%) |
| Accommodation & Food Services | 15 (14.8%) | 86 (85.2%) |
| Public Administration | 32 (71.1%) | 13 (28.9%) |
| Total | 580 (48.4%) | 619 (51.6%) |
Education in Brandenburg
School Enrollment in Brandenburg
The most common levels of schooling among the 547 students in Brandenburg are college / undergraduate (144 | 26.3%), high school (138 | 25.2%), and elementary school (121 | 22.1%).
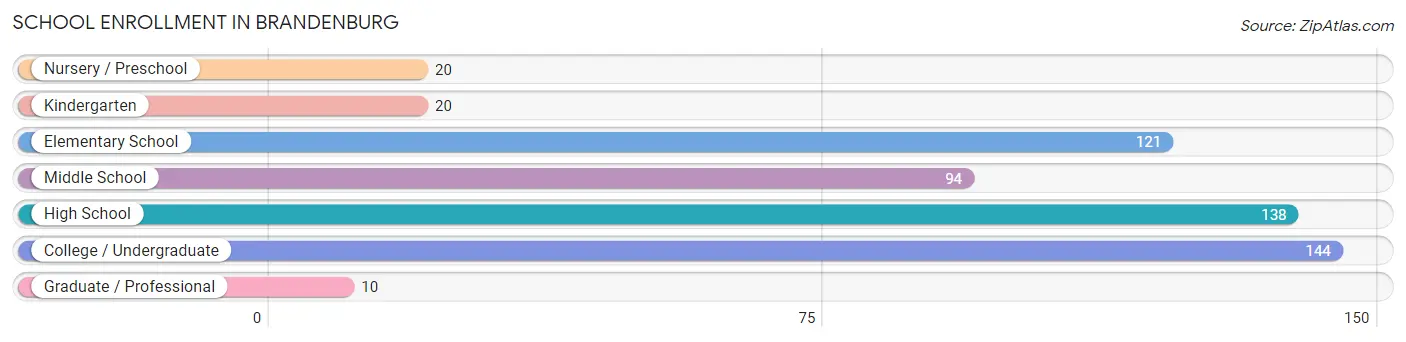
| School Level | # Students | % Students |
| Nursery / Preschool | 20 | 3.7% |
| Kindergarten | 20 | 3.7% |
| Elementary School | 121 | 22.1% |
| Middle School | 94 | 17.2% |
| High School | 138 | 25.2% |
| College / Undergraduate | 144 | 26.3% |
| Graduate / Professional | 10 | 1.8% |
| Total | 547 | 100.0% |
School Enrollment by Age by Funding Source in Brandenburg
Out of a total of 547 students who are enrolled in schools in Brandenburg, 84 (15.4%) attend a private institution, while the remaining 463 (84.6%) are enrolled in public schools. The age group of 25 to 34 year olds has the highest likelihood of being enrolled in private schools, with 11 (47.8% in the age bracket) enrolled. Conversely, the age group of 18 to 19 year olds has the lowest likelihood of being enrolled in a private school, with 24 (100.0% in the age bracket) attending a public institution.
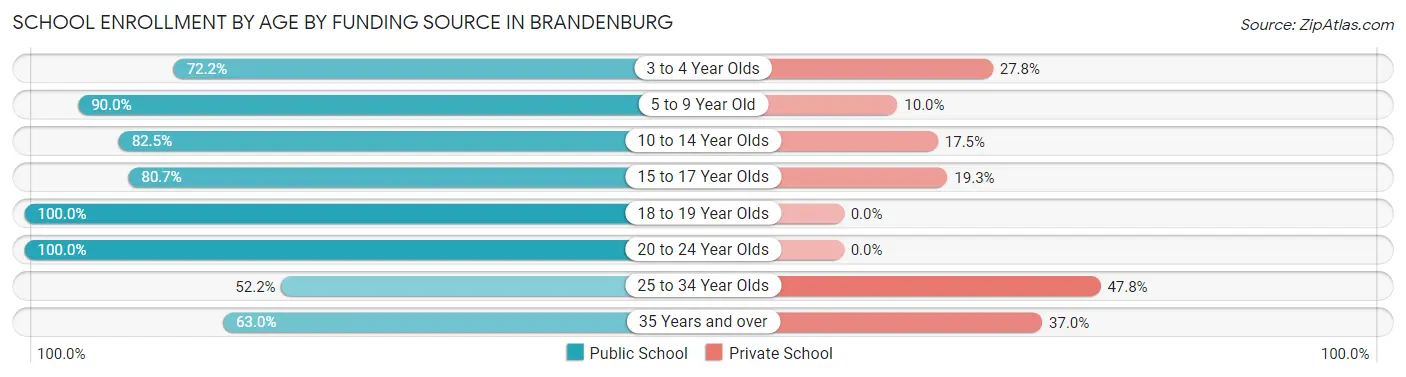
| Age Bracket | Public School | Private School |
| 3 to 4 Year Olds | 13 (72.2%) | 5 (27.8%) |
| 5 to 9 Year Old | 126 (90.0%) | 14 (10.0%) |
| 10 to 14 Year Olds | 94 (82.5%) | 20 (17.5%) |
| 15 to 17 Year Olds | 71 (80.7%) | 17 (19.3%) |
| 18 to 19 Year Olds | 24 (100.0%) | 0 (0.0%) |
| 20 to 24 Year Olds | 94 (100.0%) | 0 (0.0%) |
| 25 to 34 Year Olds | 12 (52.2%) | 11 (47.8%) |
| 35 Years and over | 29 (63.0%) | 17 (37.0%) |
| Total | 463 (84.6%) | 84 (15.4%) |
Educational Attainment by Field of Study in Brandenburg
Education (63 | 20.9%), science & technology (49 | 16.3%), business (33 | 11.0%), engineering (28 | 9.3%), and liberal arts & history (28 | 9.3%) are the most common fields of study among 301 individuals in Brandenburg who have obtained a bachelor's degree or higher.
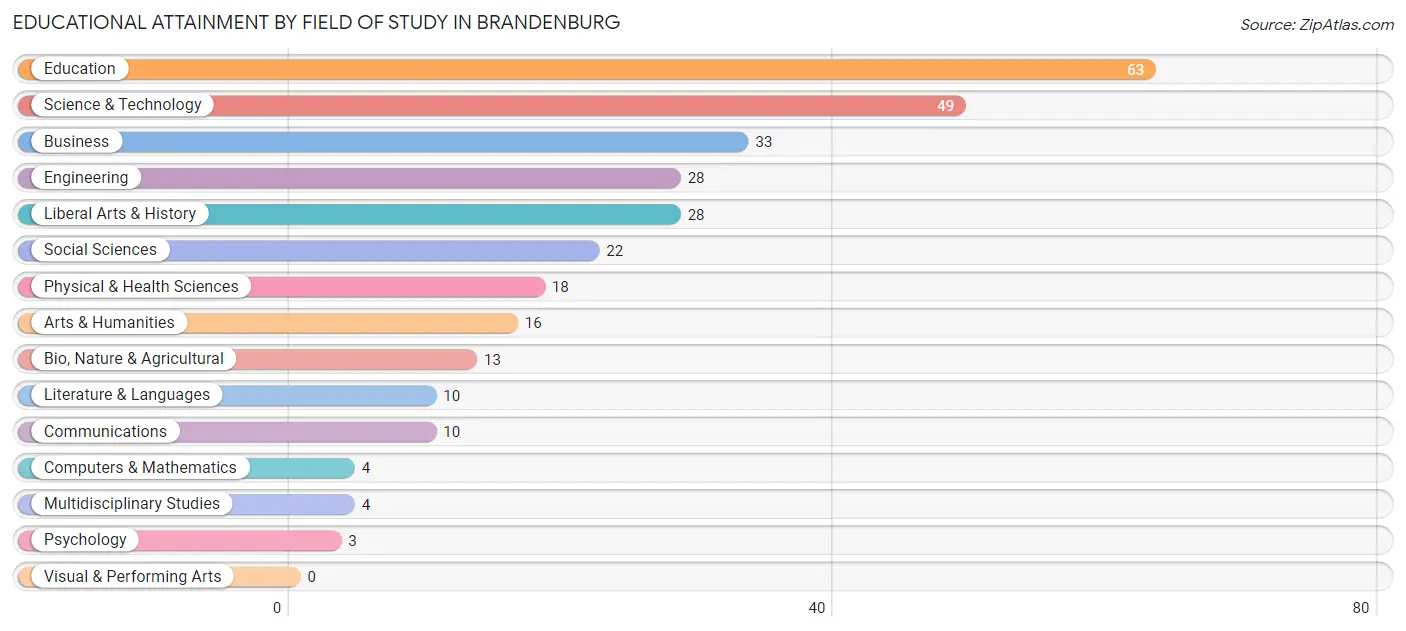
| Field of Study | # Graduates | % Graduates |
| Computers & Mathematics | 4 | 1.3% |
| Bio, Nature & Agricultural | 13 | 4.3% |
| Physical & Health Sciences | 18 | 6.0% |
| Psychology | 3 | 1.0% |
| Social Sciences | 22 | 7.3% |
| Engineering | 28 | 9.3% |
| Multidisciplinary Studies | 4 | 1.3% |
| Science & Technology | 49 | 16.3% |
| Business | 33 | 11.0% |
| Education | 63 | 20.9% |
| Literature & Languages | 10 | 3.3% |
| Liberal Arts & History | 28 | 9.3% |
| Visual & Performing Arts | 0 | 0.0% |
| Communications | 10 | 3.3% |
| Arts & Humanities | 16 | 5.3% |
| Total | 301 | 100.0% |
Transportation & Commute in Brandenburg
Vehicle Availability by Sex in Brandenburg
The most prevalent vehicle ownership categories in Brandenburg are males with 2 vehicles (214, accounting for 37.2%) and females with 2 vehicles (170, making up 34.6%).
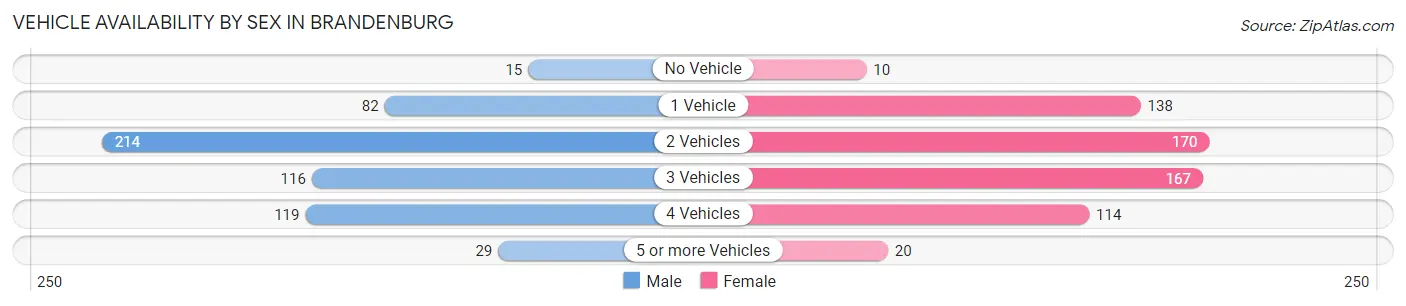
| Vehicles Available | Male | Female |
| No Vehicle | 15 (2.6%) | 10 (1.6%) |
| 1 Vehicle | 82 (14.3%) | 138 (22.3%) |
| 2 Vehicles | 214 (37.2%) | 170 (27.5%) |
| 3 Vehicles | 116 (20.2%) | 167 (27.0%) |
| 4 Vehicles | 119 (20.7%) | 114 (18.4%) |
| 5 or more Vehicles | 29 (5.0%) | 20 (3.2%) |
| Total | 575 (100.0%) | 619 (100.0%) |
Commute Time in Brandenburg
The most frequently occuring commute durations in Brandenburg are 45 to 59 minutes (277 commuters, 25.1%), 5 to 9 minutes (218 commuters, 19.8%), and 30 to 34 minutes (155 commuters, 14.1%).
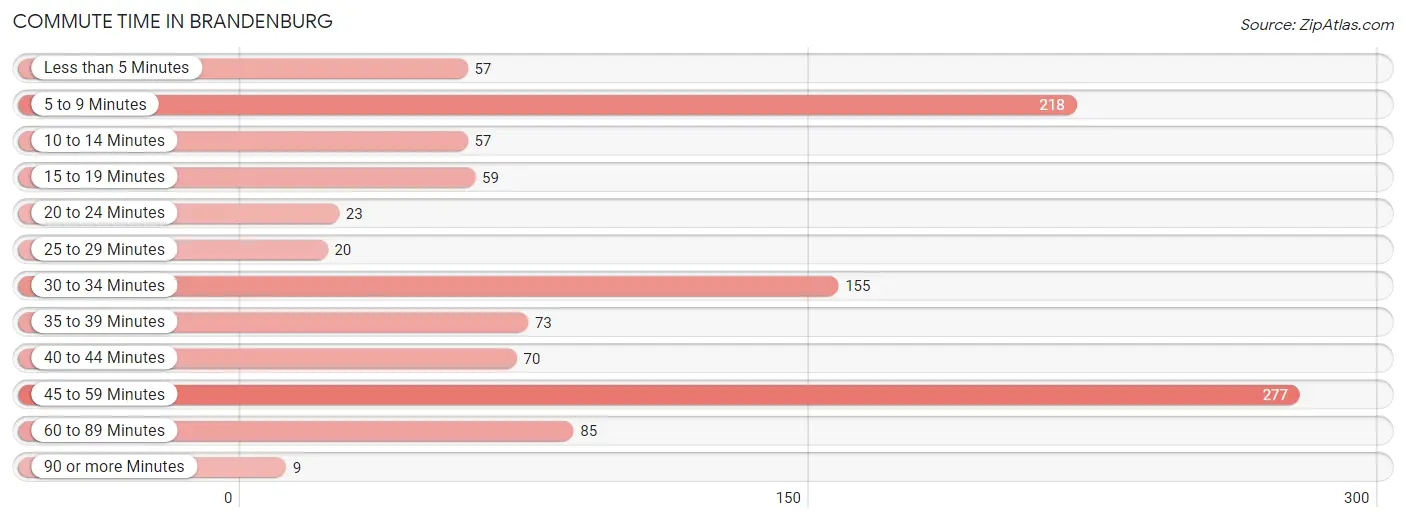
| Commute Time | # Commuters | % Commuters |
| Less than 5 Minutes | 57 | 5.2% |
| 5 to 9 Minutes | 218 | 19.8% |
| 10 to 14 Minutes | 57 | 5.2% |
| 15 to 19 Minutes | 59 | 5.3% |
| 20 to 24 Minutes | 23 | 2.1% |
| 25 to 29 Minutes | 20 | 1.8% |
| 30 to 34 Minutes | 155 | 14.1% |
| 35 to 39 Minutes | 73 | 6.6% |
| 40 to 44 Minutes | 70 | 6.4% |
| 45 to 59 Minutes | 277 | 25.1% |
| 60 to 89 Minutes | 85 | 7.7% |
| 90 or more Minutes | 9 | 0.8% |
Commute Time by Sex in Brandenburg
The most common commute times in Brandenburg are 45 to 59 minutes (133 commuters, 26.8%) for males and 5 to 9 minutes (145 commuters, 23.9%) for females.
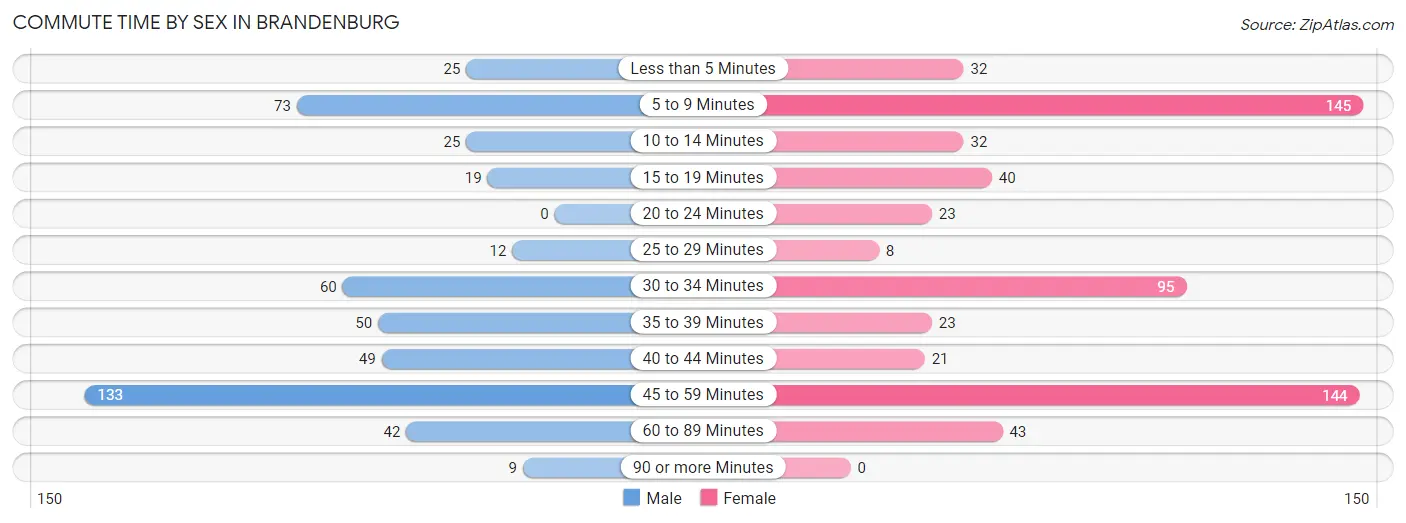
| Commute Time | Male | Female |
| Less than 5 Minutes | 25 (5.0%) | 32 (5.3%) |
| 5 to 9 Minutes | 73 (14.7%) | 145 (23.9%) |
| 10 to 14 Minutes | 25 (5.0%) | 32 (5.3%) |
| 15 to 19 Minutes | 19 (3.8%) | 40 (6.6%) |
| 20 to 24 Minutes | 0 (0.0%) | 23 (3.8%) |
| 25 to 29 Minutes | 12 (2.4%) | 8 (1.3%) |
| 30 to 34 Minutes | 60 (12.1%) | 95 (15.7%) |
| 35 to 39 Minutes | 50 (10.1%) | 23 (3.8%) |
| 40 to 44 Minutes | 49 (9.9%) | 21 (3.5%) |
| 45 to 59 Minutes | 133 (26.8%) | 144 (23.8%) |
| 60 to 89 Minutes | 42 (8.5%) | 43 (7.1%) |
| 90 or more Minutes | 9 (1.8%) | 0 (0.0%) |
Time of Departure to Work by Sex in Brandenburg
The most frequent times of departure to work in Brandenburg are 9:00 AM to 9:59 AM (92, 18.5%) for males and 7:00 AM to 7:29 AM (87, 14.4%) for females.
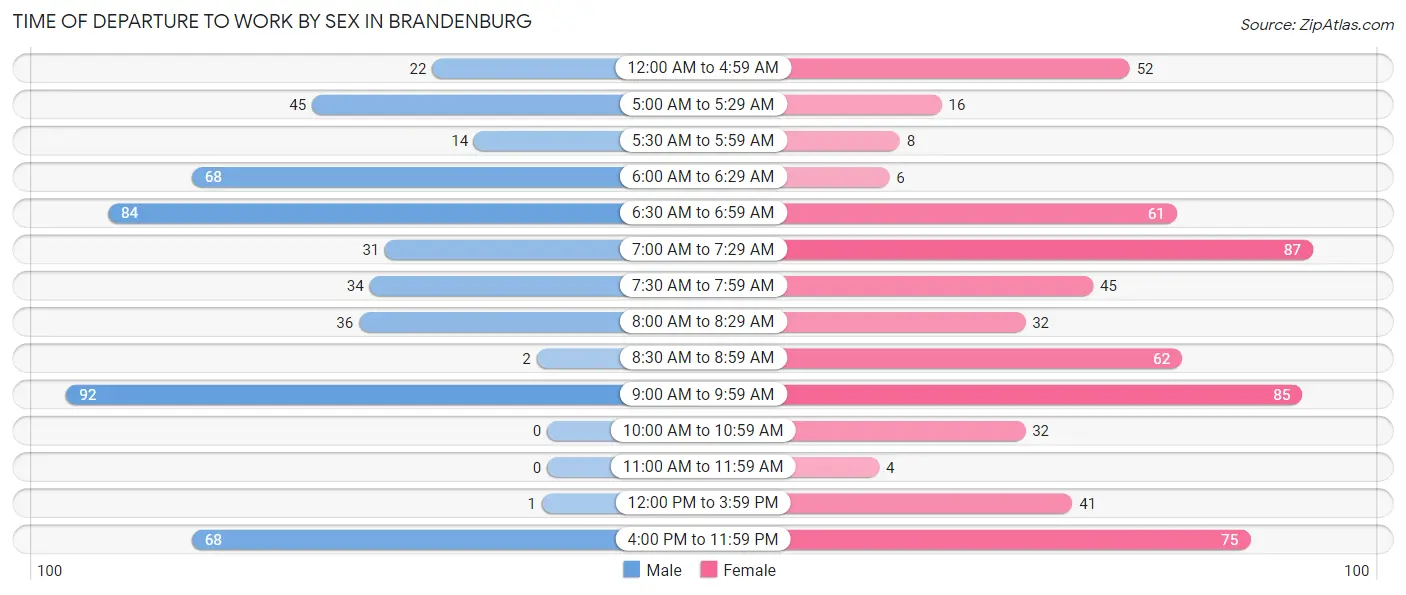
| Time of Departure | Male | Female |
| 12:00 AM to 4:59 AM | 22 (4.4%) | 52 (8.6%) |
| 5:00 AM to 5:29 AM | 45 (9.0%) | 16 (2.6%) |
| 5:30 AM to 5:59 AM | 14 (2.8%) | 8 (1.3%) |
| 6:00 AM to 6:29 AM | 68 (13.7%) | 6 (1.0%) |
| 6:30 AM to 6:59 AM | 84 (16.9%) | 61 (10.1%) |
| 7:00 AM to 7:29 AM | 31 (6.2%) | 87 (14.4%) |
| 7:30 AM to 7:59 AM | 34 (6.8%) | 45 (7.4%) |
| 8:00 AM to 8:29 AM | 36 (7.2%) | 32 (5.3%) |
| 8:30 AM to 8:59 AM | 2 (0.4%) | 62 (10.2%) |
| 9:00 AM to 9:59 AM | 92 (18.5%) | 85 (14.0%) |
| 10:00 AM to 10:59 AM | 0 (0.0%) | 32 (5.3%) |
| 11:00 AM to 11:59 AM | 0 (0.0%) | 4 (0.7%) |
| 12:00 PM to 3:59 PM | 1 (0.2%) | 41 (6.8%) |
| 4:00 PM to 11:59 PM | 68 (13.7%) | 75 (12.4%) |
| Total | 497 (100.0%) | 606 (100.0%) |
Housing Occupancy in Brandenburg
Occupancy by Ownership in Brandenburg
Of the total 968 dwellings in Brandenburg, owner-occupied units account for 528 (54.5%), while renter-occupied units make up 440 (45.5%).
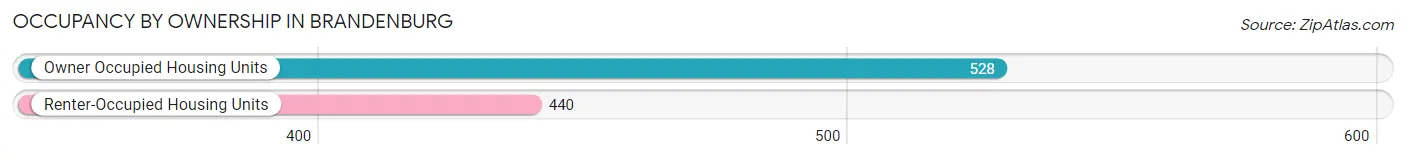
| Occupancy | # Housing Units | % Housing Units |
| Owner Occupied Housing Units | 528 | 54.5% |
| Renter-Occupied Housing Units | 440 | 45.5% |
| Total Occupied Housing Units | 968 | 100.0% |
Occupancy by Household Size in Brandenburg
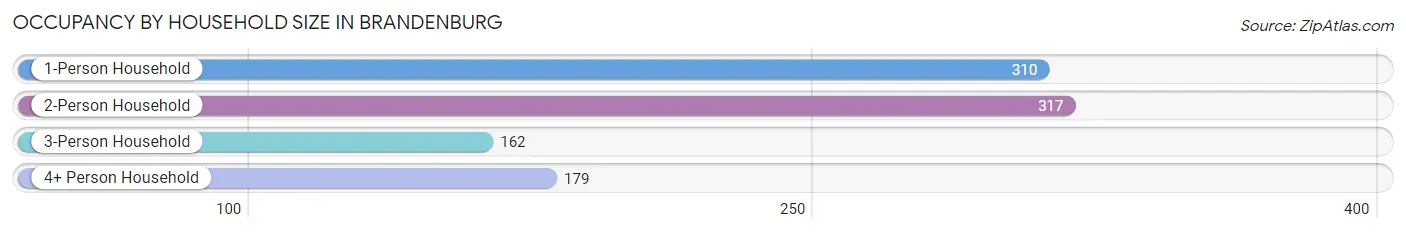
| Household Size | # Housing Units | % Housing Units |
| 1-Person Household | 310 | 32.0% |
| 2-Person Household | 317 | 32.8% |
| 3-Person Household | 162 | 16.7% |
| 4+ Person Household | 179 | 18.5% |
| Total Housing Units | 968 | 100.0% |
Occupancy by Ownership by Household Size in Brandenburg
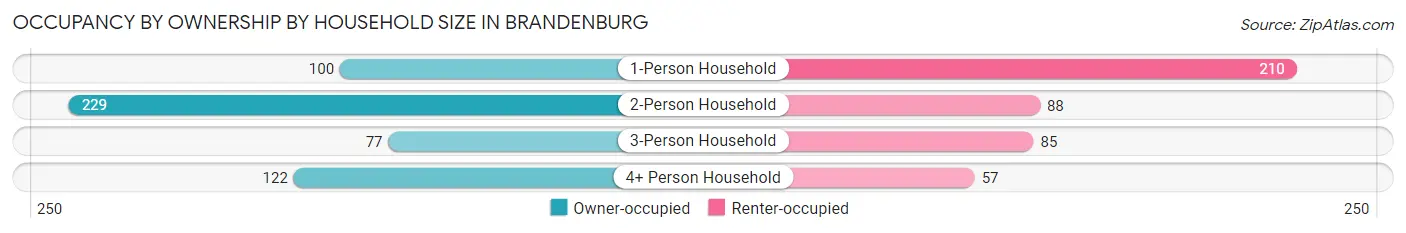
| Household Size | Owner-occupied | Renter-occupied |
| 1-Person Household | 100 (32.3%) | 210 (67.7%) |
| 2-Person Household | 229 (72.2%) | 88 (27.8%) |
| 3-Person Household | 77 (47.5%) | 85 (52.5%) |
| 4+ Person Household | 122 (68.2%) | 57 (31.8%) |
| Total Housing Units | 528 (54.5%) | 440 (45.5%) |
Occupancy by Educational Attainment in Brandenburg
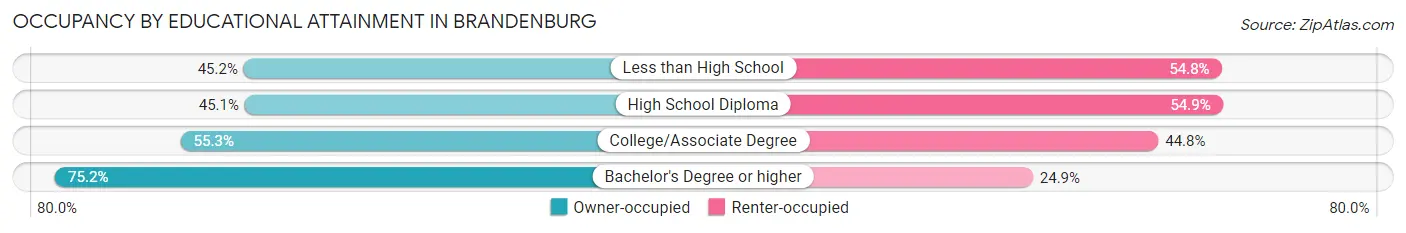
| Household Size | Owner-occupied | Renter-occupied |
| Less than High School | 38 (45.2%) | 46 (54.8%) |
| High School Diploma | 142 (45.1%) | 173 (54.9%) |
| College/Associate Degree | 221 (55.2%) | 179 (44.8%) |
| Bachelor's Degree or higher | 127 (75.1%) | 42 (24.8%) |
Occupancy by Age of Householder in Brandenburg
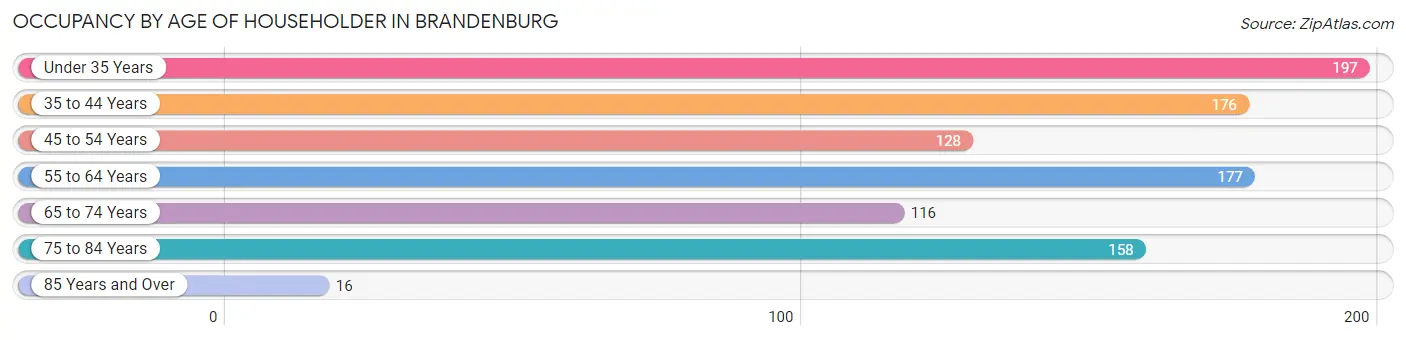
| Age Bracket | # Households | % Households |
| Under 35 Years | 197 | 20.3% |
| 35 to 44 Years | 176 | 18.2% |
| 45 to 54 Years | 128 | 13.2% |
| 55 to 64 Years | 177 | 18.3% |
| 65 to 74 Years | 116 | 12.0% |
| 75 to 84 Years | 158 | 16.3% |
| 85 Years and Over | 16 | 1.7% |
| Total | 968 | 100.0% |
Housing Finances in Brandenburg
Median Income by Occupancy in Brandenburg
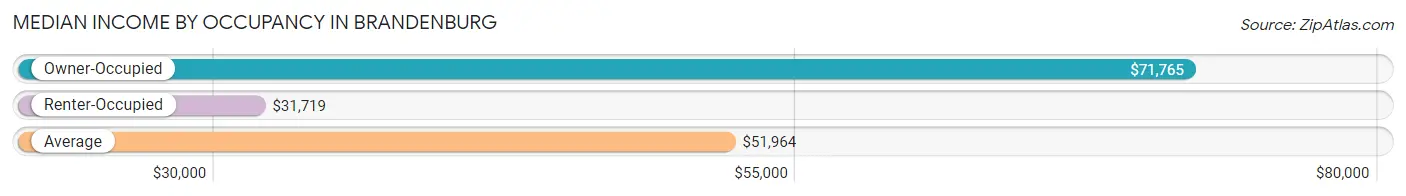
| Occupancy Type | # Households | Median Income |
| Owner-Occupied | 528 (54.5%) | $71,765 |
| Renter-Occupied | 440 (45.5%) | $31,719 |
| Average | 968 (100.0%) | $51,964 |
Occupancy by Householder Income Bracket in Brandenburg
| Income Bracket | Owner-occupied | Renter-occupied |
| Less than $5,000 | 10 (1.9%) | 21 (4.8%) |
| $5,000 to $9,999 | 8 (1.5%) | 32 (7.3%) |
| $10,000 to $14,999 | 14 (2.6%) | 40 (9.1%) |
| $15,000 to $19,999 | 0 (0.0%) | 29 (6.6%) |
| $20,000 to $24,999 | 4 (0.8%) | 51 (11.6%) |
| $25,000 to $34,999 | 47 (8.9%) | 57 (13.0%) |
| $35,000 to $49,999 | 74 (14.0%) | 75 (17.1%) |
| $50,000 to $74,999 | 120 (22.7%) | 93 (21.1%) |
| $75,000 to $99,999 | 32 (6.1%) | 11 (2.5%) |
| $100,000 to $149,999 | 155 (29.4%) | 25 (5.7%) |
| $150,000 or more | 64 (12.1%) | 6 (1.4%) |
| Total | 528 (100.0%) | 440 (100.0%) |
Monthly Housing Cost Tiers in Brandenburg
| Monthly Cost | Owner-occupied | Renter-occupied |
| Less than $300 | 26 (4.9%) | 13 (2.9%) |
| $300 to $499 | 104 (19.7%) | 84 (19.1%) |
| $500 to $799 | 69 (13.1%) | 183 (41.6%) |
| $800 to $999 | 61 (11.6%) | 89 (20.2%) |
| $1,000 to $1,499 | 167 (31.6%) | 58 (13.2%) |
| $1,500 to $1,999 | 81 (15.3%) | 4 (0.9%) |
| $2,000 to $2,499 | 8 (1.5%) | 6 (1.4%) |
| $2,500 to $2,999 | 8 (1.5%) | 0 (0.0%) |
| $3,000 or more | 4 (0.8%) | 0 (0.0%) |
| Total | 528 (100.0%) | 440 (100.0%) |
Physical Housing Characteristics in Brandenburg
Housing Structures in Brandenburg
| Structure Type | # Housing Units | % Housing Units |
| Single Unit, Detached | 571 | 59.0% |
| Single Unit, Attached | 9 | 0.9% |
| 2 Unit Apartments | 139 | 14.4% |
| 3 or 4 Unit Apartments | 64 | 6.6% |
| 5 to 9 Unit Apartments | 63 | 6.5% |
| 10 or more Apartments | 88 | 9.1% |
| Mobile Home / Other | 34 | 3.5% |
| Total | 968 | 100.0% |
Housing Structures by Occupancy in Brandenburg
| Structure Type | Owner-occupied | Renter-occupied |
| Single Unit, Detached | 480 (84.1%) | 91 (15.9%) |
| Single Unit, Attached | 9 (100.0%) | 0 (0.0%) |
| 2 Unit Apartments | 21 (15.1%) | 118 (84.9%) |
| 3 or 4 Unit Apartments | 0 (0.0%) | 64 (100.0%) |
| 5 to 9 Unit Apartments | 0 (0.0%) | 63 (100.0%) |
| 10 or more Apartments | 0 (0.0%) | 88 (100.0%) |
| Mobile Home / Other | 18 (52.9%) | 16 (47.1%) |
| Total | 528 (54.5%) | 440 (45.5%) |
Housing Structures by Number of Rooms in Brandenburg
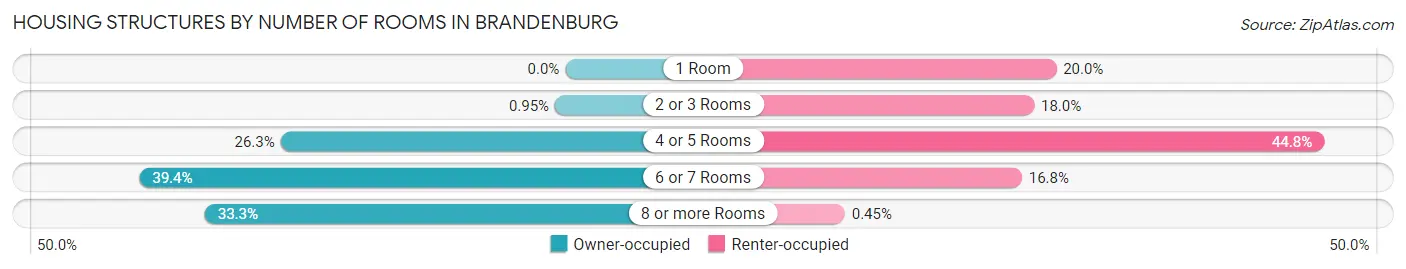
| Number of Rooms | Owner-occupied | Renter-occupied |
| 1 Room | 0 (0.0%) | 88 (20.0%) |
| 2 or 3 Rooms | 5 (0.9%) | 79 (17.9%) |
| 4 or 5 Rooms | 139 (26.3%) | 197 (44.8%) |
| 6 or 7 Rooms | 208 (39.4%) | 74 (16.8%) |
| 8 or more Rooms | 176 (33.3%) | 2 (0.4%) |
| Total | 528 (100.0%) | 440 (100.0%) |
Housing Structure by Heating Type in Brandenburg
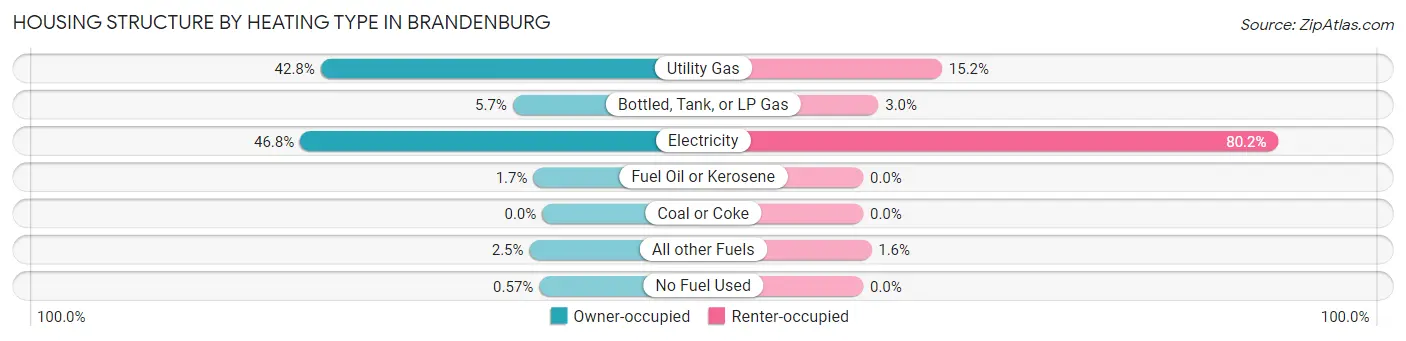
| Heating Type | Owner-occupied | Renter-occupied |
| Utility Gas | 226 (42.8%) | 67 (15.2%) |
| Bottled, Tank, or LP Gas | 30 (5.7%) | 13 (2.9%) |
| Electricity | 247 (46.8%) | 353 (80.2%) |
| Fuel Oil or Kerosene | 9 (1.7%) | 0 (0.0%) |
| Coal or Coke | 0 (0.0%) | 0 (0.0%) |
| All other Fuels | 13 (2.5%) | 7 (1.6%) |
| No Fuel Used | 3 (0.6%) | 0 (0.0%) |
| Total | 528 (100.0%) | 440 (100.0%) |
Household Vehicle Usage in Brandenburg
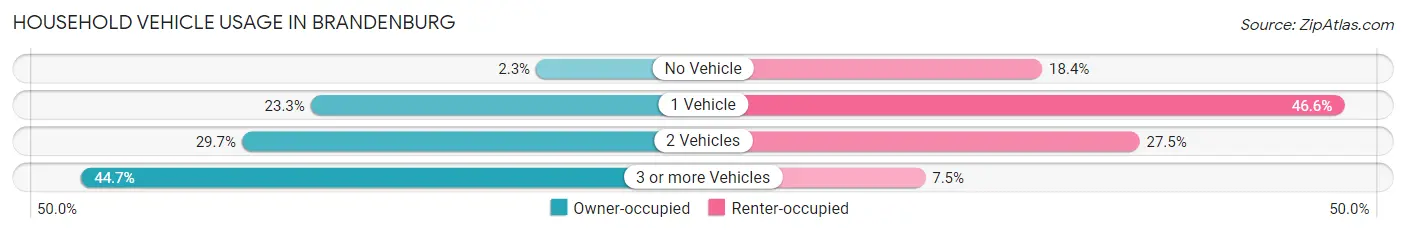
| Vehicles per Household | Owner-occupied | Renter-occupied |
| No Vehicle | 12 (2.3%) | 81 (18.4%) |
| 1 Vehicle | 123 (23.3%) | 205 (46.6%) |
| 2 Vehicles | 157 (29.7%) | 121 (27.5%) |
| 3 or more Vehicles | 236 (44.7%) | 33 (7.5%) |
| Total | 528 (100.0%) | 440 (100.0%) |
Real Estate & Mortgages in Brandenburg
Real Estate and Mortgage Overview in Brandenburg
| Characteristic | Without Mortgage | With Mortgage |
| Housing Units | 178 | 350 |
| Median Property Value | $169,300 | $177,800 |
| Median Household Income | $51,750 | $55 |
| Monthly Housing Costs | $467 | $4 |
| Real Estate Taxes | $1,532 | $2 |
Property Value by Mortgage Status in Brandenburg
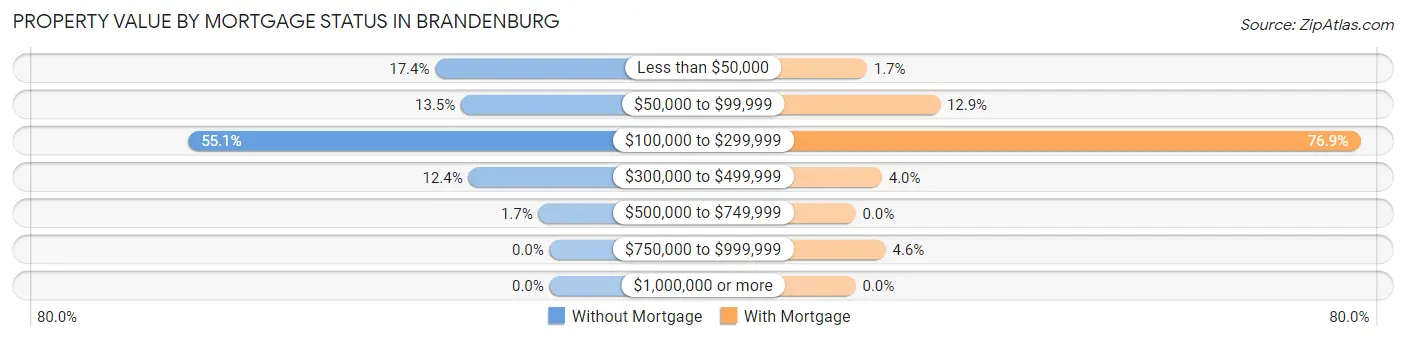
| Property Value | Without Mortgage | With Mortgage |
| Less than $50,000 | 31 (17.4%) | 6 (1.7%) |
| $50,000 to $99,999 | 24 (13.5%) | 45 (12.9%) |
| $100,000 to $299,999 | 98 (55.1%) | 269 (76.9%) |
| $300,000 to $499,999 | 22 (12.4%) | 14 (4.0%) |
| $500,000 to $749,999 | 3 (1.7%) | 0 (0.0%) |
| $750,000 to $999,999 | 0 (0.0%) | 16 (4.6%) |
| $1,000,000 or more | 0 (0.0%) | 0 (0.0%) |
| Total | 178 (100.0%) | 350 (100.0%) |
Household Income by Mortgage Status in Brandenburg
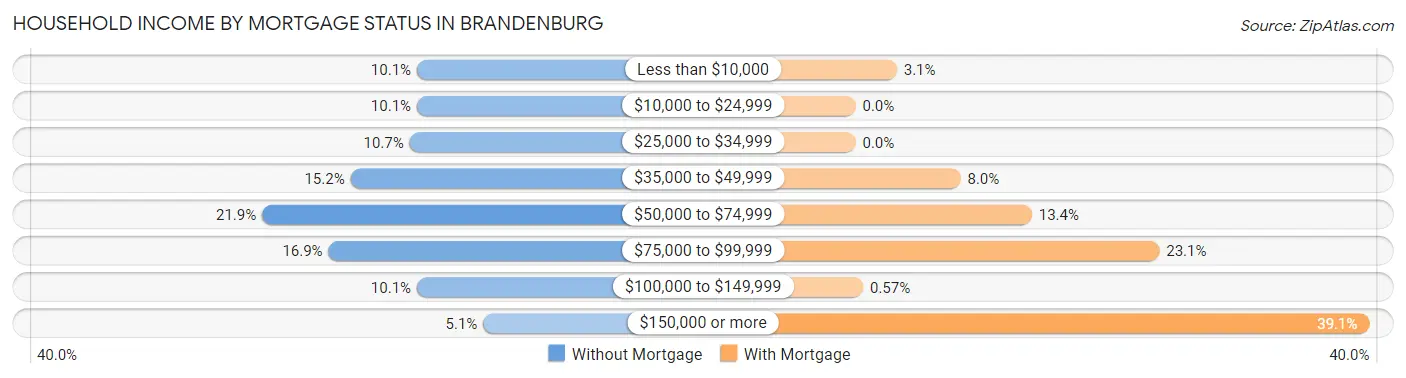
| Household Income | Without Mortgage | With Mortgage |
| Less than $10,000 | 18 (10.1%) | 11 (3.1%) |
| $10,000 to $24,999 | 18 (10.1%) | 0 (0.0%) |
| $25,000 to $34,999 | 19 (10.7%) | 0 (0.0%) |
| $35,000 to $49,999 | 27 (15.2%) | 28 (8.0%) |
| $50,000 to $74,999 | 39 (21.9%) | 47 (13.4%) |
| $75,000 to $99,999 | 30 (16.9%) | 81 (23.1%) |
| $100,000 to $149,999 | 18 (10.1%) | 2 (0.6%) |
| $150,000 or more | 9 (5.1%) | 137 (39.1%) |
| Total | 178 (100.0%) | 350 (100.0%) |
Property Value to Household Income Ratio in Brandenburg
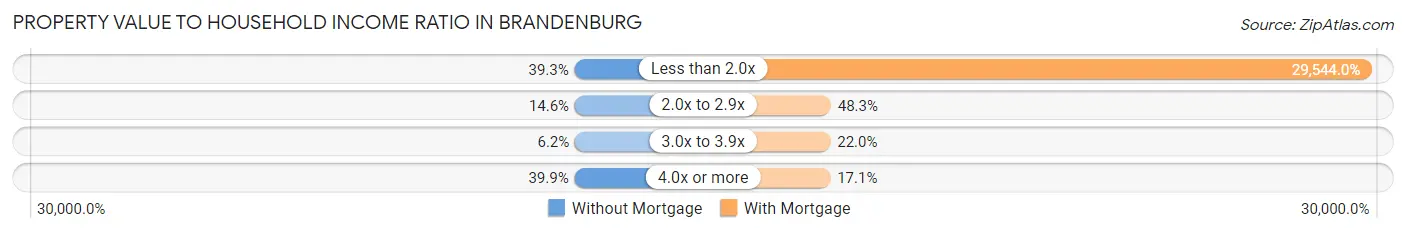
| Value-to-Income Ratio | Without Mortgage | With Mortgage |
| Less than 2.0x | 70 (39.3%) | 103,404 (29,544.0%) |
| 2.0x to 2.9x | 26 (14.6%) | 169 (48.3%) |
| 3.0x to 3.9x | 11 (6.2%) | 77 (22.0%) |
| 4.0x or more | 71 (39.9%) | 60 (17.1%) |
| Total | 178 (100.0%) | 350 (100.0%) |
Real Estate Taxes by Mortgage Status in Brandenburg
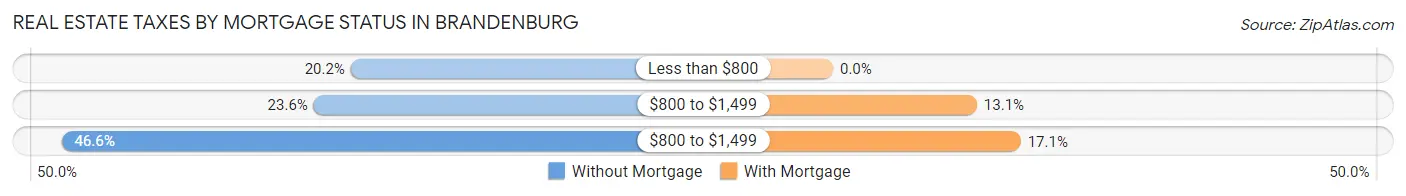
| Property Taxes | Without Mortgage | With Mortgage |
| Less than $800 | 36 (20.2%) | 0 (0.0%) |
| $800 to $1,499 | 42 (23.6%) | 46 (13.1%) |
| $800 to $1,499 | 83 (46.6%) | 60 (17.1%) |
| Total | 178 (100.0%) | 350 (100.0%) |
Health & Disability in Brandenburg
Health Insurance Coverage by Age in Brandenburg
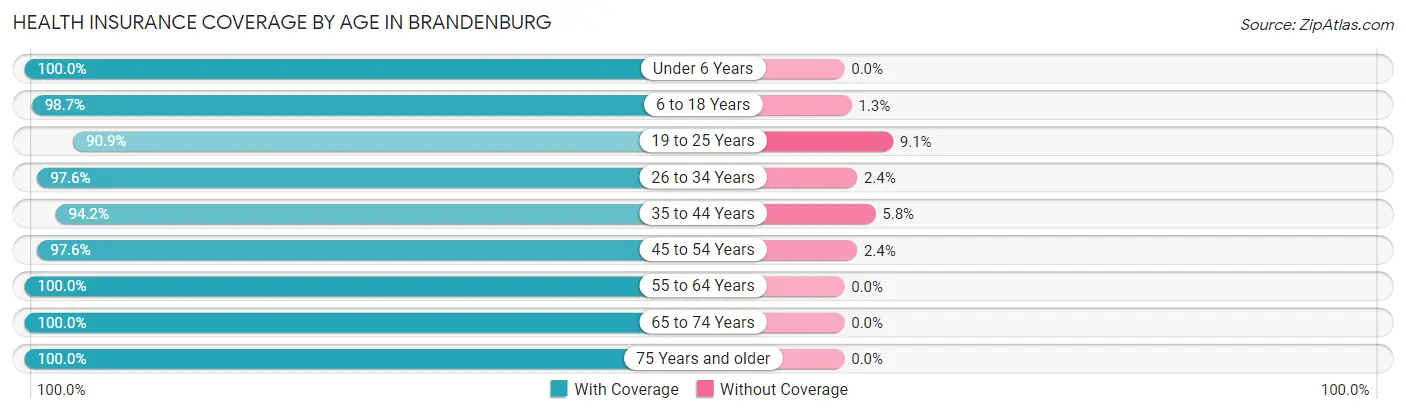
| Age Bracket | With Coverage | Without Coverage |
| Under 6 Years | 226 (100.0%) | 0 (0.0%) |
| 6 to 18 Years | 370 (98.7%) | 5 (1.3%) |
| 19 to 25 Years | 281 (90.9%) | 28 (9.1%) |
| 26 to 34 Years | 289 (97.6%) | 7 (2.4%) |
| 35 to 44 Years | 374 (94.2%) | 23 (5.8%) |
| 45 to 54 Years | 247 (97.6%) | 6 (2.4%) |
| 55 to 64 Years | 309 (100.0%) | 0 (0.0%) |
| 65 to 74 Years | 181 (100.0%) | 0 (0.0%) |
| 75 Years and older | 308 (100.0%) | 0 (0.0%) |
| Total | 2,585 (97.4%) | 69 (2.6%) |
Health Insurance Coverage by Citizenship Status in Brandenburg
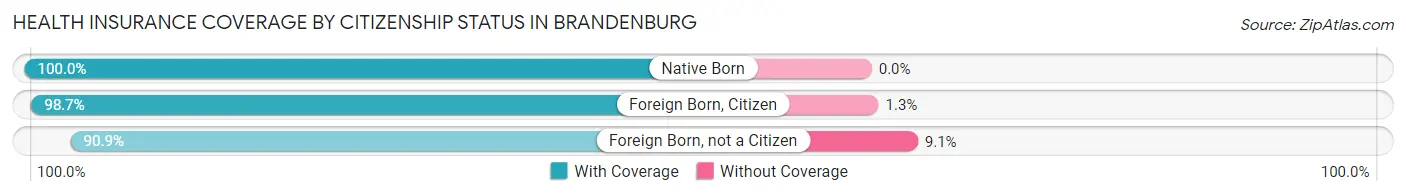
| Citizenship Status | With Coverage | Without Coverage |
| Native Born | 226 (100.0%) | 0 (0.0%) |
| Foreign Born, Citizen | 370 (98.7%) | 5 (1.3%) |
| Foreign Born, not a Citizen | 281 (90.9%) | 28 (9.1%) |
Health Insurance Coverage by Household Income in Brandenburg
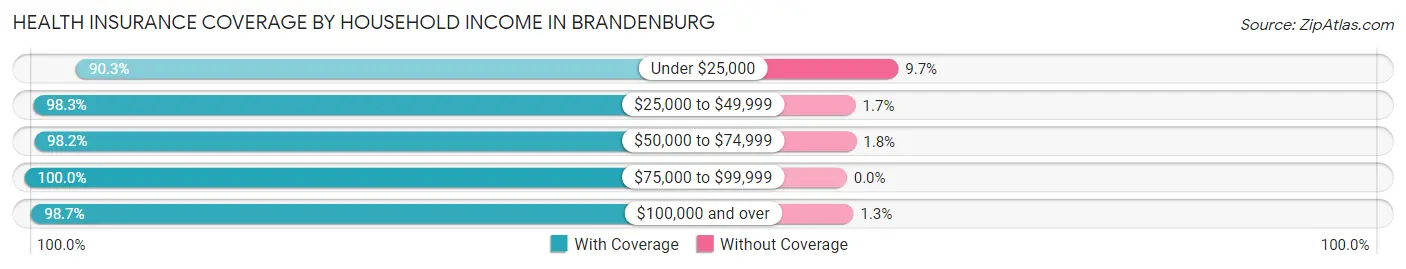
| Household Income | With Coverage | Without Coverage |
| Under $25,000 | 346 (90.3%) | 37 (9.7%) |
| $25,000 to $49,999 | 650 (98.3%) | 11 (1.7%) |
| $50,000 to $74,999 | 548 (98.2%) | 10 (1.8%) |
| $75,000 to $99,999 | 180 (100.0%) | 0 (0.0%) |
| $100,000 and over | 859 (98.7%) | 11 (1.3%) |
Public vs Private Health Insurance Coverage by Age in Brandenburg
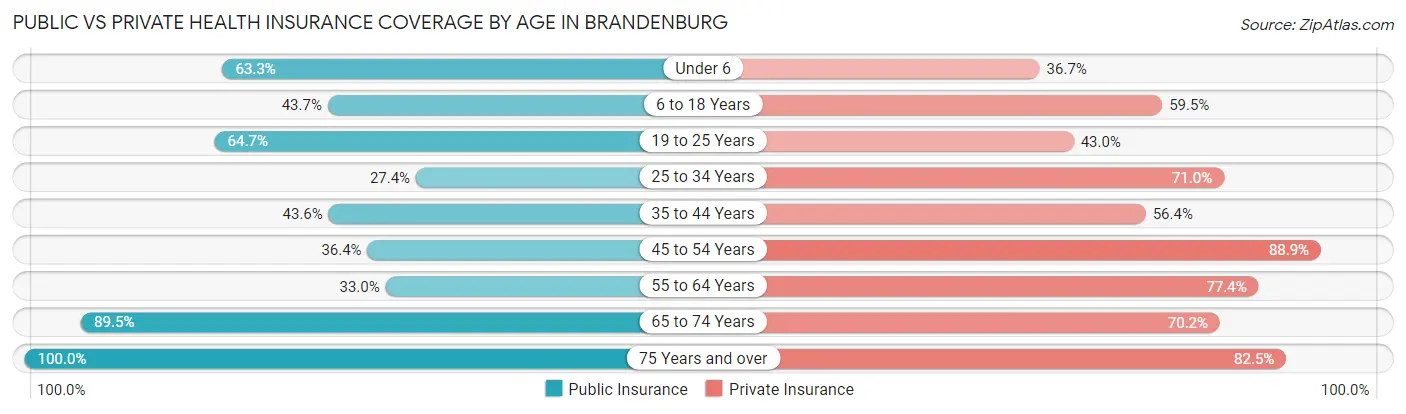
| Age Bracket | Public Insurance | Private Insurance |
| Under 6 | 143 (63.3%) | 83 (36.7%) |
| 6 to 18 Years | 164 (43.7%) | 223 (59.5%) |
| 19 to 25 Years | 200 (64.7%) | 133 (43.0%) |
| 25 to 34 Years | 81 (27.4%) | 210 (71.0%) |
| 35 to 44 Years | 173 (43.6%) | 224 (56.4%) |
| 45 to 54 Years | 92 (36.4%) | 225 (88.9%) |
| 55 to 64 Years | 102 (33.0%) | 239 (77.3%) |
| 65 to 74 Years | 162 (89.5%) | 127 (70.2%) |
| 75 Years and over | 308 (100.0%) | 254 (82.5%) |
| Total | 1,425 (53.7%) | 1,718 (64.7%) |
Disability Status by Sex by Age in Brandenburg
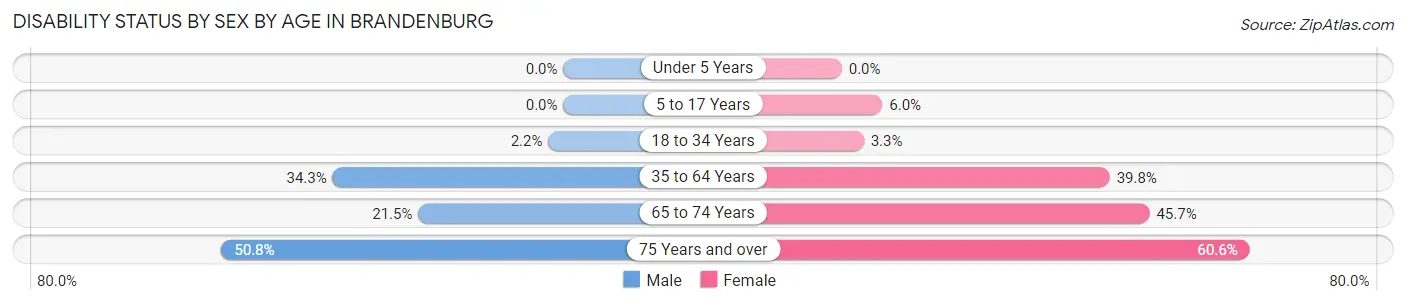
| Age Bracket | Male | Female |
| Under 5 Years | 0 (0.0%) | 0 (0.0%) |
| 5 to 17 Years | 0 (0.0%) | 13 (6.0%) |
| 18 to 34 Years | 6 (2.2%) | 12 (3.3%) |
| 35 to 64 Years | 171 (34.3%) | 183 (39.8%) |
| 65 to 74 Years | 14 (21.5%) | 53 (45.7%) |
| 75 Years and over | 65 (50.8%) | 109 (60.6%) |
Disability Class by Sex by Age in Brandenburg
Disability Class: Hearing Difficulty
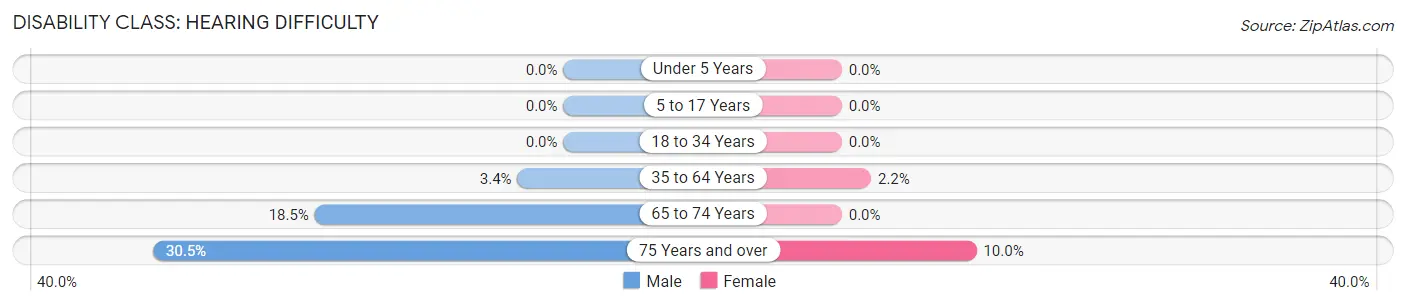
| Age Bracket | Male | Female |
| Under 5 Years | 0 (0.0%) | 0 (0.0%) |
| 5 to 17 Years | 0 (0.0%) | 0 (0.0%) |
| 18 to 34 Years | 0 (0.0%) | 0 (0.0%) |
| 35 to 64 Years | 17 (3.4%) | 10 (2.2%) |
| 65 to 74 Years | 12 (18.5%) | 0 (0.0%) |
| 75 Years and over | 39 (30.5%) | 18 (10.0%) |
Disability Class: Vision Difficulty
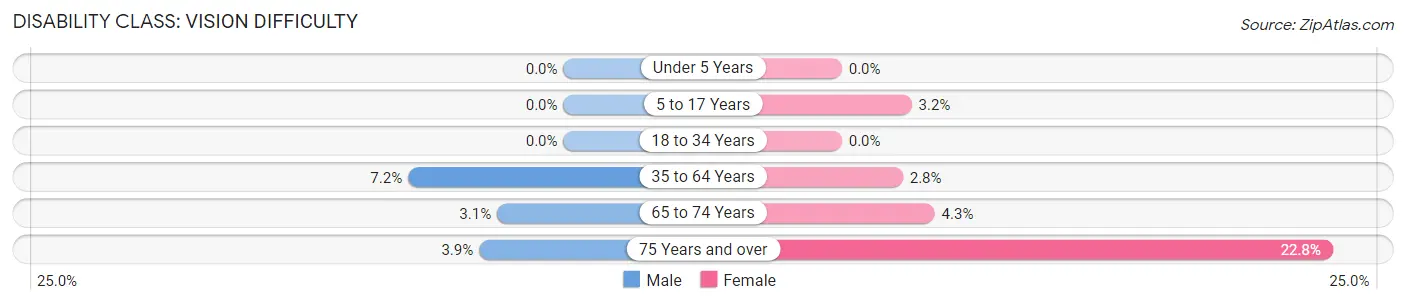
| Age Bracket | Male | Female |
| Under 5 Years | 0 (0.0%) | 0 (0.0%) |
| 5 to 17 Years | 0 (0.0%) | 7 (3.2%) |
| 18 to 34 Years | 0 (0.0%) | 0 (0.0%) |
| 35 to 64 Years | 36 (7.2%) | 13 (2.8%) |
| 65 to 74 Years | 2 (3.1%) | 5 (4.3%) |
| 75 Years and over | 5 (3.9%) | 41 (22.8%) |
Disability Class: Cognitive Difficulty
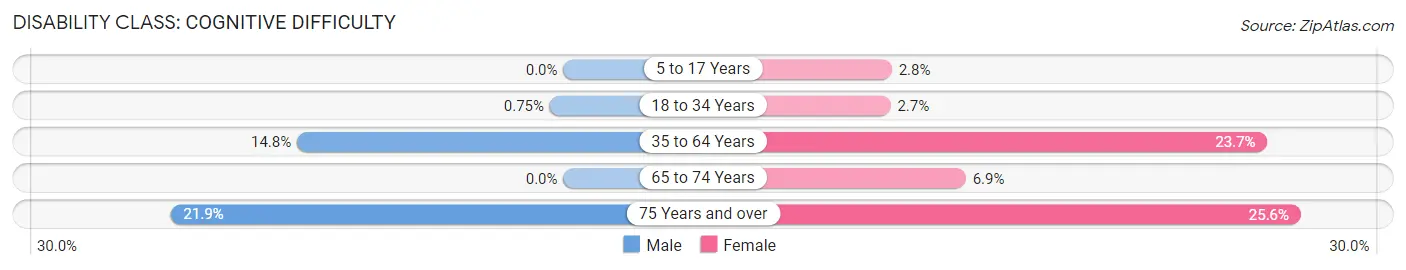
| Age Bracket | Male | Female |
| 5 to 17 Years | 0 (0.0%) | 6 (2.8%) |
| 18 to 34 Years | 2 (0.7%) | 10 (2.7%) |
| 35 to 64 Years | 74 (14.8%) | 109 (23.7%) |
| 65 to 74 Years | 0 (0.0%) | 8 (6.9%) |
| 75 Years and over | 28 (21.9%) | 46 (25.6%) |
Disability Class: Ambulatory Difficulty
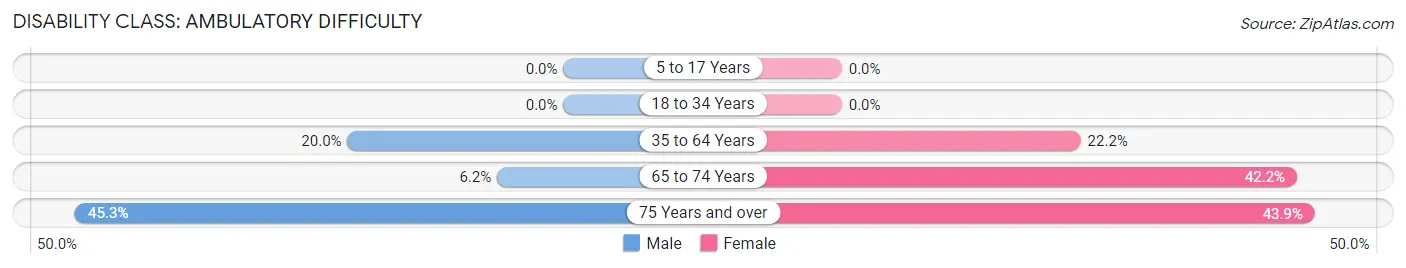
| Age Bracket | Male | Female |
| 5 to 17 Years | 0 (0.0%) | 0 (0.0%) |
| 18 to 34 Years | 0 (0.0%) | 0 (0.0%) |
| 35 to 64 Years | 100 (20.0%) | 102 (22.2%) |
| 65 to 74 Years | 4 (6.1%) | 49 (42.2%) |
| 75 Years and over | 58 (45.3%) | 79 (43.9%) |
Disability Class: Self-Care Difficulty
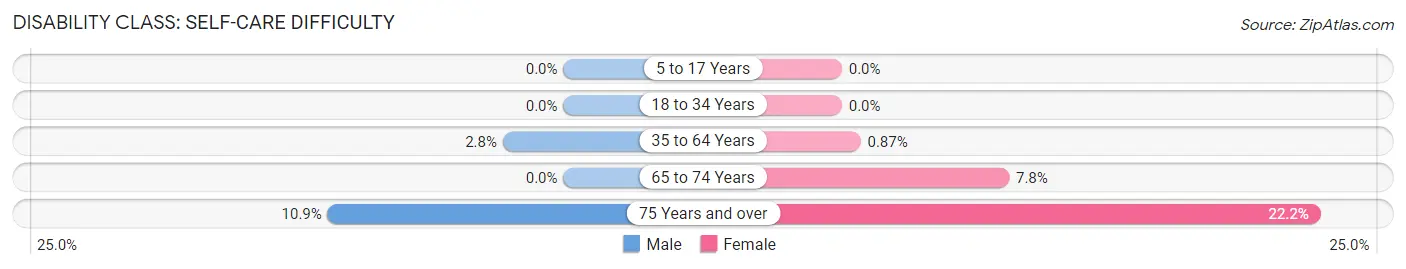
| Age Bracket | Male | Female |
| 5 to 17 Years | 0 (0.0%) | 0 (0.0%) |
| 18 to 34 Years | 0 (0.0%) | 0 (0.0%) |
| 35 to 64 Years | 14 (2.8%) | 4 (0.9%) |
| 65 to 74 Years | 0 (0.0%) | 9 (7.8%) |
| 75 Years and over | 14 (10.9%) | 40 (22.2%) |
Technology Access in Brandenburg
Computing Device Access in Brandenburg
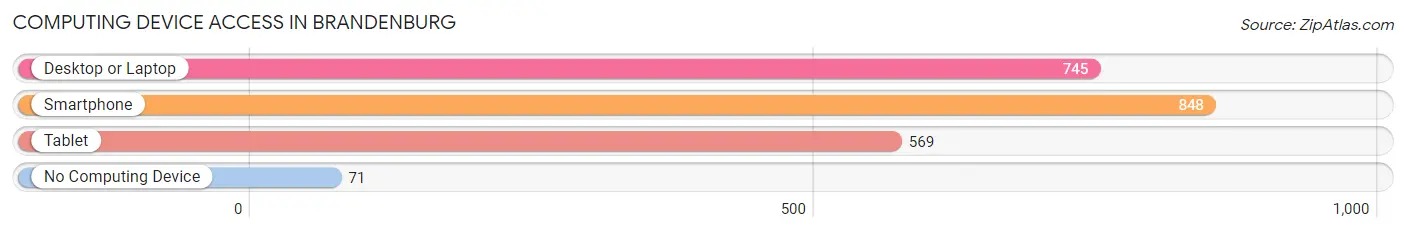
| Device Type | # Households | % Households |
| Desktop or Laptop | 745 | 77.0% |
| Smartphone | 848 | 87.6% |
| Tablet | 569 | 58.8% |
| No Computing Device | 71 | 7.3% |
| Total | 968 | 100.0% |
Internet Access in Brandenburg
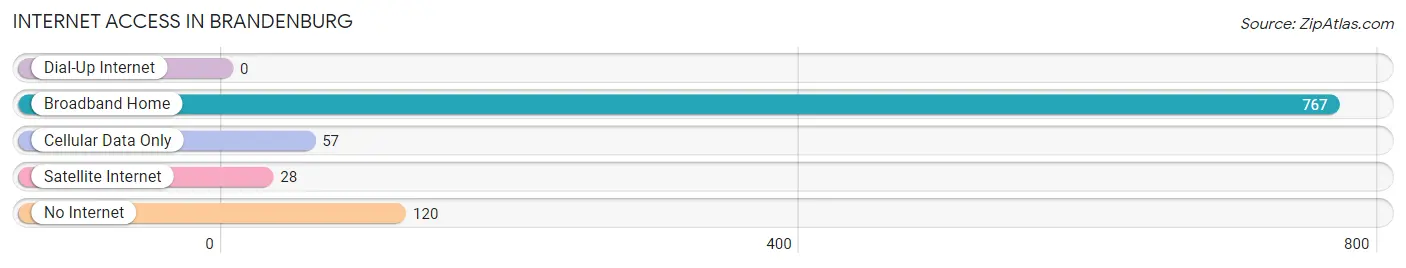
| Internet Type | # Households | % Households |
| Dial-Up Internet | 0 | 0.0% |
| Broadband Home | 767 | 79.2% |
| Cellular Data Only | 57 | 5.9% |
| Satellite Internet | 28 | 2.9% |
| No Internet | 120 | 12.4% |
| Total | 968 | 100.0% |
Brandenburg Summary
History
The small town of Brandenburg, Kentucky is located in Meade County, Kentucky, and is situated on the banks of the Ohio River. The town was founded in 1812 by a group of settlers from Pennsylvania, and was originally known as “Brandenburg Station”. The town was named after the Brandenburg family, who were among the first settlers in the area.
The town was originally a trading post and ferry crossing, and was an important stop on the Louisville and Nashville Railroad. The railroad was a major factor in the growth of the town, and it was incorporated in 1867.
The town was a major center of commerce and industry in the late 19th and early 20th centuries. It was home to several factories, including a flour mill, a tobacco warehouse, and a brickyard. The town also had a number of stores, including a general store, a hardware store, and a drug store.
The town was also home to a number of churches, including the First Baptist Church, the First Presbyterian Church, and the First Methodist Church. The town also had a number of schools, including a high school, a middle school, and an elementary school.
The town was also home to a number of fraternal organizations, including the Masons, the Odd Fellows, and the Knights of Pythias.
Geography
Brandenburg is located in Meade County, Kentucky, and is situated on the banks of the Ohio River. The town is located about 25 miles south of Louisville, and is about 40 miles north of Nashville, Tennessee.
The town is located in a hilly region, and is surrounded by rolling hills and forests. The town is located in a temperate climate, with hot summers and cold winters.
The town is located near several major highways, including Interstate 65, Interstate 64, and US Highway 60. The town is also served by the Louisville and Nashville Railroad.
Economy
The economy of Brandenburg is largely based on agriculture and tourism. The town is home to several farms, and is a popular destination for tourists.
The town is also home to several small businesses, including restaurants, retail stores, and service businesses. The town is also home to a number of manufacturing companies, including a furniture factory and a plastics factory.
Demographics
As of the 2010 census, the population of Brandenburg was 2,845. The town has a population that is predominantly white, with a small African American population. The town also has a small Hispanic population.
The median household income in Brandenburg is $37,000, and the median home value is $125,000. The town has a poverty rate of 17.3%, and the unemployment rate is 5.2%.
Conclusion
Brandenburg, Kentucky is a small town located in Meade County, Kentucky. The town was founded in 1812, and was an important stop on the Louisville and Nashville Railroad. The town is home to several farms, and is a popular destination for tourists. The town has a predominantly white population, with a small African American and Hispanic population. The town has a median household income of $37,000, and a median home value of $125,000. The town has a poverty rate of 17.3%, and an unemployment rate of 5.2%.
Common Questions
What is Per Capita Income in Brandenburg?
Per Capita income in Brandenburg is $27,150.
What is the Median Family Income in Brandenburg?
Median Family Income in Brandenburg is $69,821.
What is the Median Household income in Brandenburg?
Median Household Income in Brandenburg is $51,964.
What is Income or Wage Gap in Brandenburg?
Income or Wage Gap in Brandenburg is 22.1%.
Women in Brandenburg earn 77.9 cents for every dollar earned by a man.
What is Inequality or Gini Index in Brandenburg?
Inequality or Gini Index in Brandenburg is 0.46.
What is the Total Population of Brandenburg?
Total Population of Brandenburg is 2,896.
What is the Total Male Population of Brandenburg?
Total Male Population of Brandenburg is 1,422.
What is the Total Female Population of Brandenburg?
Total Female Population of Brandenburg is 1,474.
What is the Ratio of Males per 100 Females in Brandenburg?
There are 96.47 Males per 100 Females in Brandenburg.
What is the Ratio of Females per 100 Males in Brandenburg?
There are 103.66 Females per 100 Males in Brandenburg.
What is the Median Population Age in Brandenburg?
Median Population Age in Brandenburg is 41.0 Years.
What is the Average Family Size in Brandenburg
Average Family Size in Brandenburg is 3.4 People.
What is the Average Household Size in Brandenburg
Average Household Size in Brandenburg is 2.7 People.
How Large is the Labor Force in Brandenburg?
There are 1,238 People in the Labor Forcein in Brandenburg.
What is the Percentage of People in the Labor Force in Brandenburg?
51.8% of People are in the Labor Force in Brandenburg.
What is the Unemployment Rate in Brandenburg?
Unemployment Rate in Brandenburg is 3.0%.