Simpsonville, KY Map & Demographics
Simpsonville Map
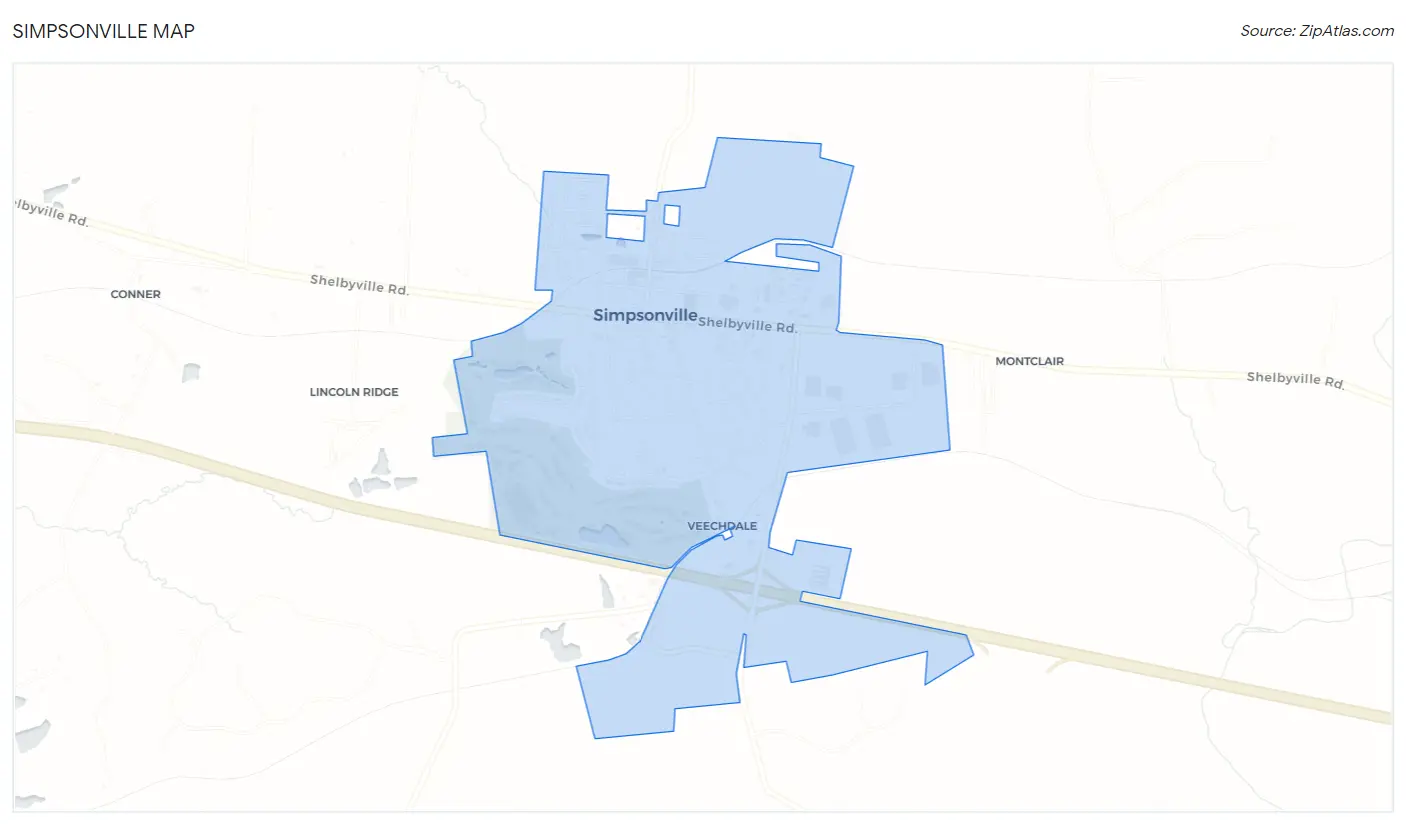
Simpsonville Overview
$43,824
PER CAPITA INCOME
$103,319
AVG FAMILY INCOME
$89,813
AVG HOUSEHOLD INCOME
19.2%
WAGE / INCOME GAP [ % ]
80.8¢/ $1
WAGE / INCOME GAP [ $ ]
$9,721
FAMILY INCOME DEFICIT
0.40
INEQUALITY / GINI INDEX
2,976
TOTAL POPULATION
1,480
MALE POPULATION
1,496
FEMALE POPULATION
98.93
MALES / 100 FEMALES
101.08
FEMALES / 100 MALES
36.2
MEDIAN AGE
3.1
AVG FAMILY SIZE
2.5
AVG HOUSEHOLD SIZE
1,561
LABOR FORCE [ PEOPLE ]
68.0%
PERCENT IN LABOR FORCE
0.8%
UNEMPLOYMENT RATE
Simpsonville Zip Codes
Simpsonville Area Codes
Income in Simpsonville
Income Overview in Simpsonville
Per Capita Income in Simpsonville is $43,824, while median incomes of families and households are $103,319 and $89,813 respectively.
| Characteristic | Number | Measure |
| Per Capita Income | 2,976 | $43,824 |
| Median Family Income | 795 | $103,319 |
| Mean Family Income | 795 | $113,781 |
| Median Household Income | 1,182 | $89,813 |
| Mean Household Income | 1,182 | $107,162 |
| Income Deficit | 795 | $9,721 |
| Wage / Income Gap (%) | 2,976 | 19.24% |
| Wage / Income Gap ($) | 2,976 | 80.76¢ per $1 |
| Gini / Inequality Index | 2,976 | 0.40 |
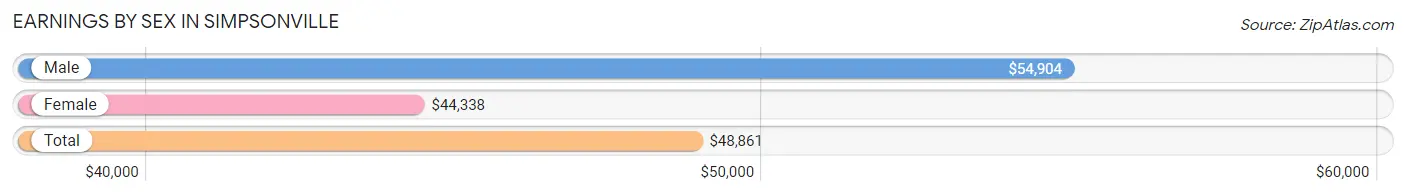
Earnings by Sex in Simpsonville
Average Earnings in Simpsonville are $48,861, $54,904 for men and $44,338 for women, a difference of 19.2%.
| Sex | Number | Average Earnings |
| Male | 862 (51.1%) | $54,904 |
| Female | 826 (48.9%) | $44,338 |
| Total | 1,688 (100.0%) | $48,861 |
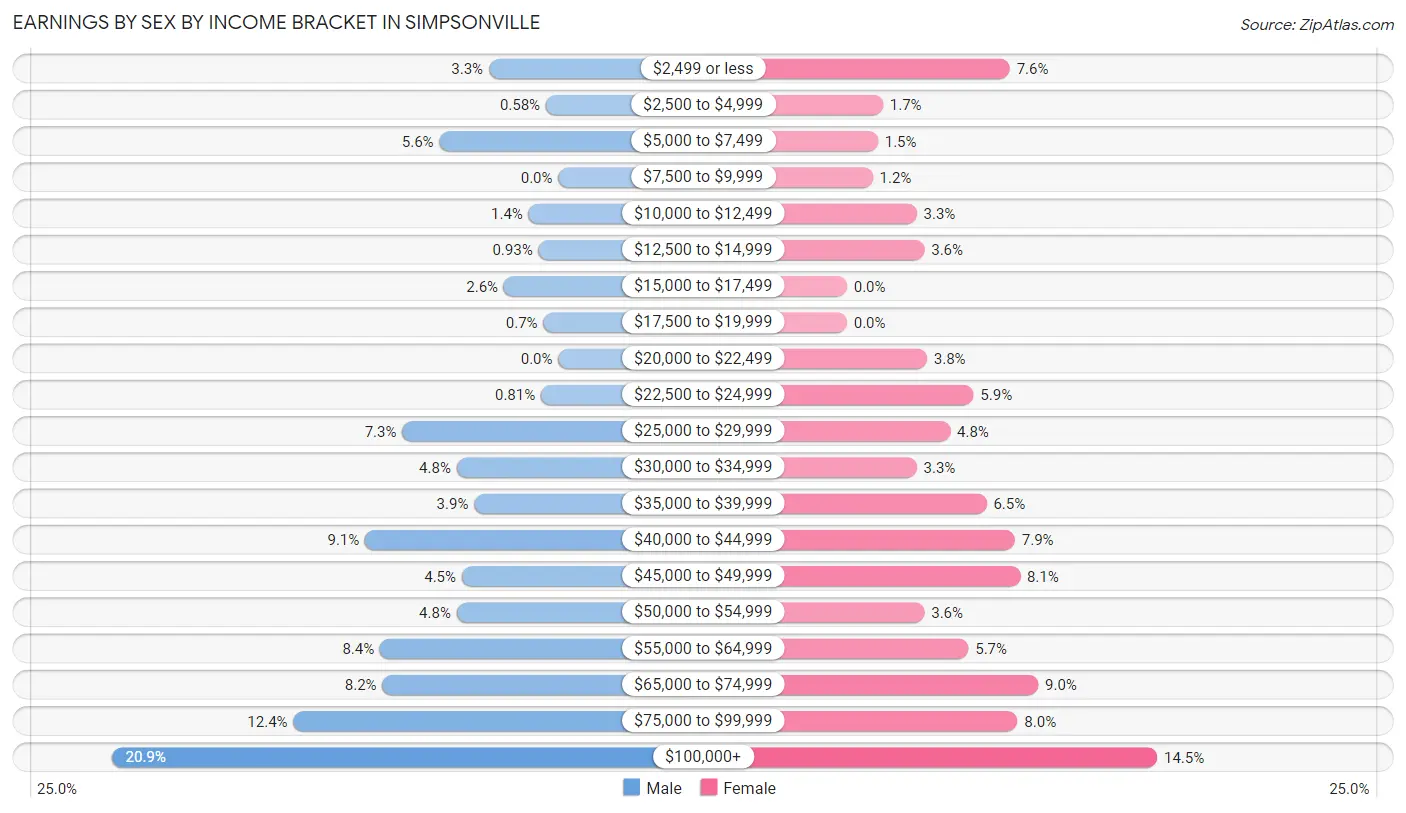
Earnings by Sex by Income Bracket in Simpsonville
The most common earnings brackets in Simpsonville are $100,000+ for men (180 | 20.9%) and $100,000+ for women (120 | 14.5%).
| Income | Male | Female |
| $2,499 or less | 28 (3.3%) | 63 (7.6%) |
| $2,500 to $4,999 | 5 (0.6%) | 14 (1.7%) |
| $5,000 to $7,499 | 48 (5.6%) | 12 (1.5%) |
| $7,500 to $9,999 | 0 (0.0%) | 10 (1.2%) |
| $10,000 to $12,499 | 12 (1.4%) | 27 (3.3%) |
| $12,500 to $14,999 | 8 (0.9%) | 30 (3.6%) |
| $15,000 to $17,499 | 22 (2.5%) | 0 (0.0%) |
| $17,500 to $19,999 | 6 (0.7%) | 0 (0.0%) |
| $20,000 to $22,499 | 0 (0.0%) | 31 (3.7%) |
| $22,500 to $24,999 | 7 (0.8%) | 49 (5.9%) |
| $25,000 to $29,999 | 63 (7.3%) | 40 (4.8%) |
| $30,000 to $34,999 | 41 (4.8%) | 27 (3.3%) |
| $35,000 to $39,999 | 34 (3.9%) | 54 (6.5%) |
| $40,000 to $44,999 | 78 (9.0%) | 65 (7.9%) |
| $45,000 to $49,999 | 39 (4.5%) | 67 (8.1%) |
| $50,000 to $54,999 | 41 (4.8%) | 30 (3.6%) |
| $55,000 to $64,999 | 72 (8.4%) | 47 (5.7%) |
| $65,000 to $74,999 | 71 (8.2%) | 74 (9.0%) |
| $75,000 to $99,999 | 107 (12.4%) | 66 (8.0%) |
| $100,000+ | 180 (20.9%) | 120 (14.5%) |
| Total | 862 (100.0%) | 826 (100.0%) |
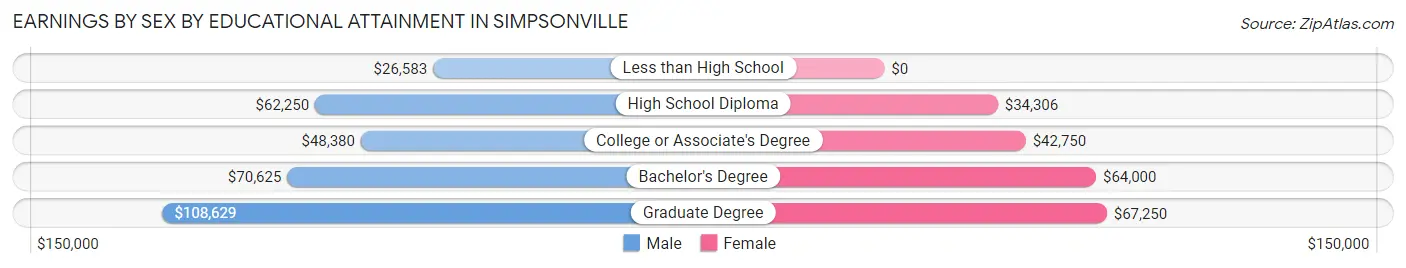
Earnings by Sex by Educational Attainment in Simpsonville
Average earnings in Simpsonville are $57,500 for men and $48,694 for women, a difference of 15.3%. Men with an educational attainment of graduate degree enjoy the highest average annual earnings of $108,629, while those with less than high school education earn the least with $26,583. Women with an educational attainment of graduate degree earn the most with the average annual earnings of $67,250, while those with high school diploma education have the smallest earnings of $34,306.
| Educational Attainment | Male Income | Female Income |
| Less than High School | $26,583 | $0 |
| High School Diploma | $62,250 | $34,306 |
| College or Associate's Degree | $48,380 | $42,750 |
| Bachelor's Degree | $70,625 | $64,000 |
| Graduate Degree | $108,629 | $67,250 |
| Total | $57,500 | $48,694 |
Family Income in Simpsonville
Family Income Brackets in Simpsonville
According to the Simpsonville family income data, there are 254 families falling into the $100,000 to $149,999 income range, which is the most common income bracket and makes up 32.0% of all families. Conversely, the $15,000 to $24,999 income bracket is the least frequent group with only 10 families (1.3%) belonging to this category.
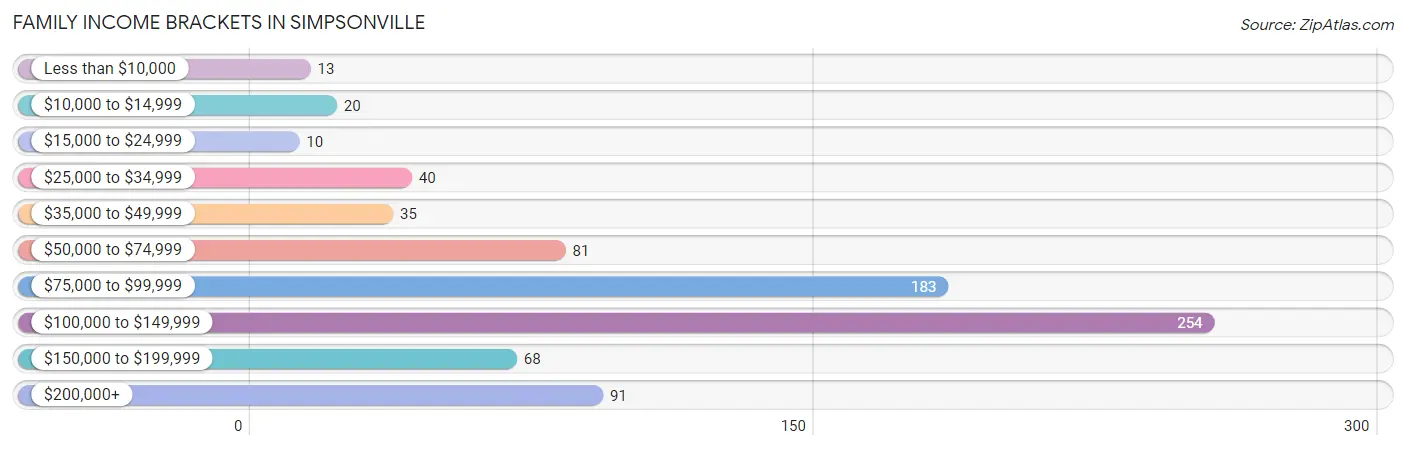
| Income Bracket | # Families | % Families |
| Less than $10,000 | 13 | 1.6% |
| $10,000 to $14,999 | 20 | 2.5% |
| $15,000 to $24,999 | 10 | 1.3% |
| $25,000 to $34,999 | 40 | 5.0% |
| $35,000 to $49,999 | 35 | 4.4% |
| $50,000 to $74,999 | 81 | 10.2% |
| $75,000 to $99,999 | 183 | 23.0% |
| $100,000 to $149,999 | 254 | 31.9% |
| $150,000 to $199,999 | 68 | 8.6% |
| $200,000+ | 91 | 11.4% |
Family Income by Famaliy Size in Simpsonville
4-person families (155 | 19.5%) account for the highest median family income in Simpsonville with $112,991 per family, while 2-person families (334 | 42.0%) have the highest median income of $45,875 per family member.
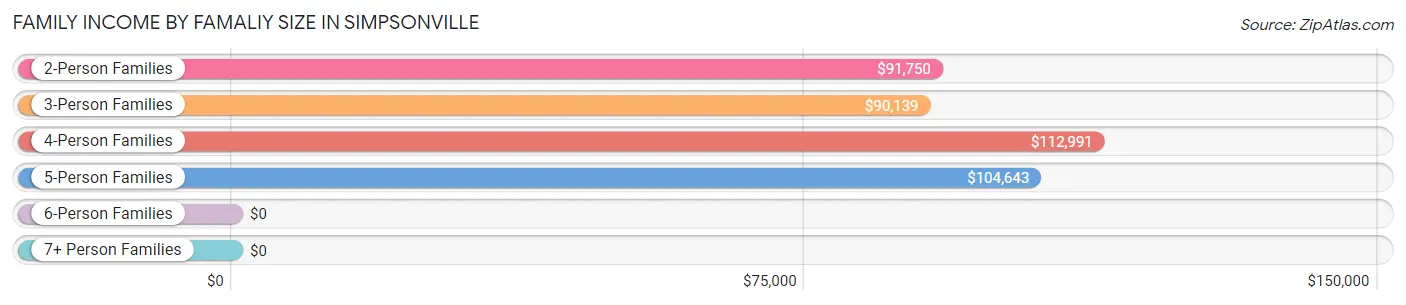
| Income Bracket | # Families | Median Income |
| 2-Person Families | 334 (42.0%) | $91,750 |
| 3-Person Families | 209 (26.3%) | $90,139 |
| 4-Person Families | 155 (19.5%) | $112,991 |
| 5-Person Families | 74 (9.3%) | $104,643 |
| 6-Person Families | 6 (0.7%) | $0 |
| 7+ Person Families | 17 (2.1%) | $0 |
| Total | 795 (100.0%) | $103,319 |
Family Income by Number of Earners in Simpsonville
The median family income in Simpsonville is $103,319, with families comprising 3+ earners (132) having the highest median family income of $193,500, while families with 1 earner (182) have the lowest median family income of $72,024, accounting for 16.6% and 22.9% of families, respectively.
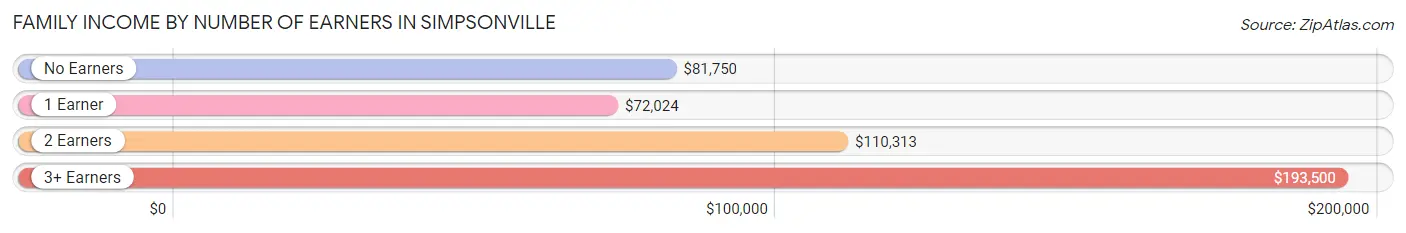
| Number of Earners | # Families | Median Income |
| No Earners | 97 (12.2%) | $81,750 |
| 1 Earner | 182 (22.9%) | $72,024 |
| 2 Earners | 384 (48.3%) | $110,313 |
| 3+ Earners | 132 (16.6%) | $193,500 |
| Total | 795 (100.0%) | $103,319 |
Household Income in Simpsonville
Household Income Brackets in Simpsonville
With 337 households falling in the category, the $100,000 to $149,999 income range is the most frequent in Simpsonville, accounting for 28.5% of all households. In contrast, only 13 households (1.1%) fall into the less than $10,000 income bracket, making it the least populous group.
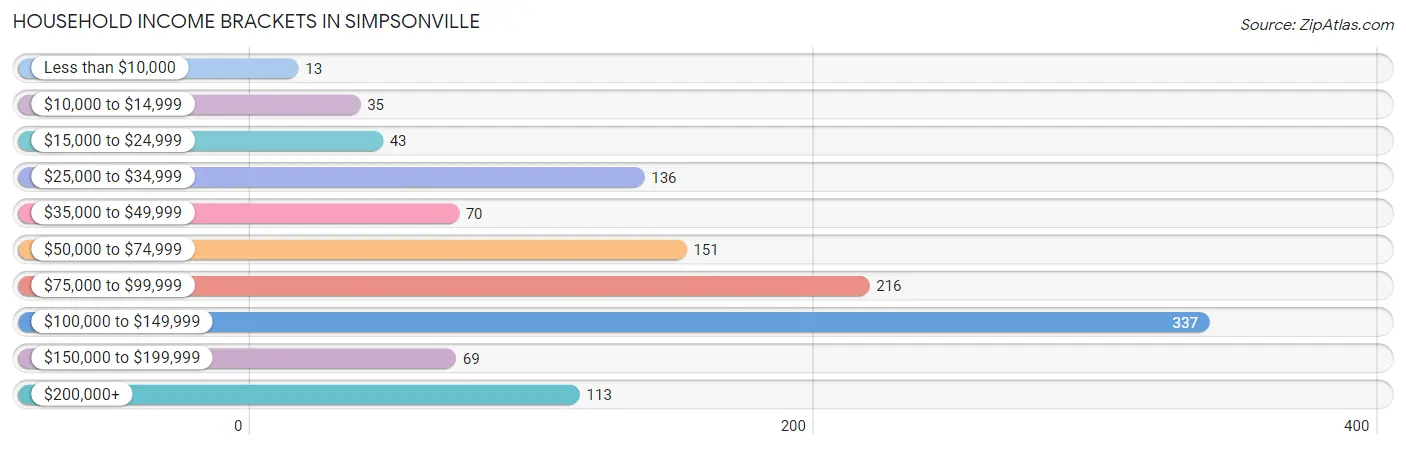
| Income Bracket | # Households | % Households |
| Less than $10,000 | 13 | 1.1% |
| $10,000 to $14,999 | 35 | 3.0% |
| $15,000 to $24,999 | 43 | 3.6% |
| $25,000 to $34,999 | 136 | 11.5% |
| $35,000 to $49,999 | 70 | 5.9% |
| $50,000 to $74,999 | 151 | 12.8% |
| $75,000 to $99,999 | 216 | 18.3% |
| $100,000 to $149,999 | 337 | 28.5% |
| $150,000 to $199,999 | 69 | 5.8% |
| $200,000+ | 113 | 9.6% |
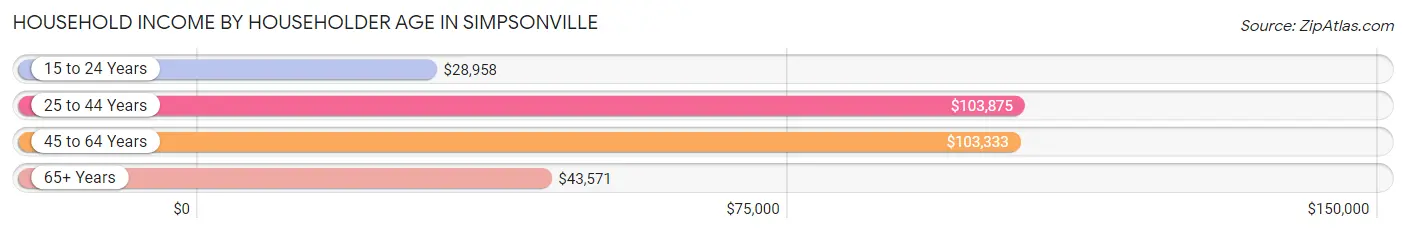
Household Income by Householder Age in Simpsonville
The median household income in Simpsonville is $89,813, with the highest median household income of $103,875 found in the 25 to 44 years age bracket for the primary householder. A total of 404 households (34.2%) fall into this category. Meanwhile, the 15 to 24 years age bracket for the primary householder has the lowest median household income of $28,958, with 54 households (4.6%) in this group.
| Income Bracket | # Households | Median Income |
| 15 to 24 Years | 54 (4.6%) | $28,958 |
| 25 to 44 Years | 404 (34.2%) | $103,875 |
| 45 to 64 Years | 414 (35.0%) | $103,333 |
| 65+ Years | 310 (26.2%) | $43,571 |
| Total | 1,182 (100.0%) | $89,813 |
Poverty in Simpsonville
Income Below Poverty by Sex and Age in Simpsonville
With 5.2% poverty level for males and 5.9% for females among the residents of Simpsonville, 12 to 14 year old males and 12 to 14 year old females are the most vulnerable to poverty, with 16 males (20.5%) and 25 females (35.7%) in their respective age groups living below the poverty level.
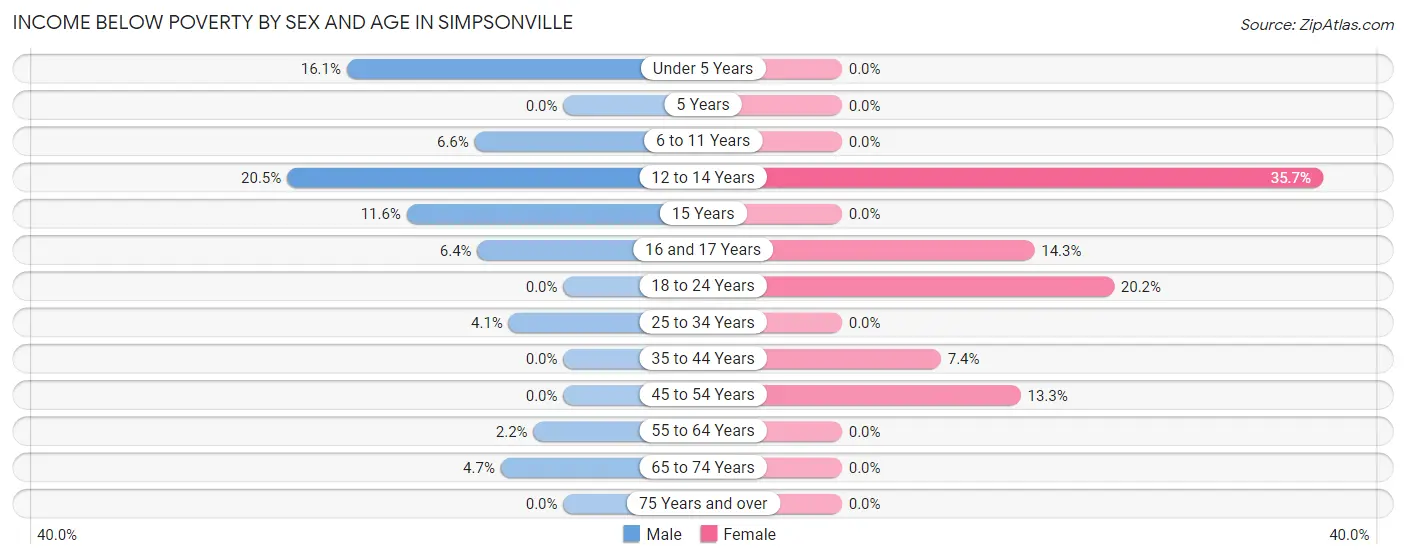
| Age Bracket | Male | Female |
| Under 5 Years | 23 (16.1%) | 0 (0.0%) |
| 5 Years | 0 (0.0%) | 0 (0.0%) |
| 6 to 11 Years | 6 (6.6%) | 0 (0.0%) |
| 12 to 14 Years | 16 (20.5%) | 25 (35.7%) |
| 15 Years | 5 (11.6%) | 0 (0.0%) |
| 16 and 17 Years | 3 (6.4%) | 5 (14.3%) |
| 18 to 24 Years | 0 (0.0%) | 20 (20.2%) |
| 25 to 34 Years | 13 (4.1%) | 0 (0.0%) |
| 35 to 44 Years | 0 (0.0%) | 10 (7.3%) |
| 45 to 54 Years | 0 (0.0%) | 28 (13.3%) |
| 55 to 64 Years | 5 (2.2%) | 0 (0.0%) |
| 65 to 74 Years | 6 (4.6%) | 0 (0.0%) |
| 75 Years and over | 0 (0.0%) | 0 (0.0%) |
| Total | 77 (5.2%) | 88 (5.9%) |
Income Above Poverty by Sex and Age in Simpsonville
According to the poverty statistics in Simpsonville, males aged 5 years and females aged under 5 years are the age groups that are most secure financially, with 100.0% of males and 100.0% of females in these age groups living above the poverty line.
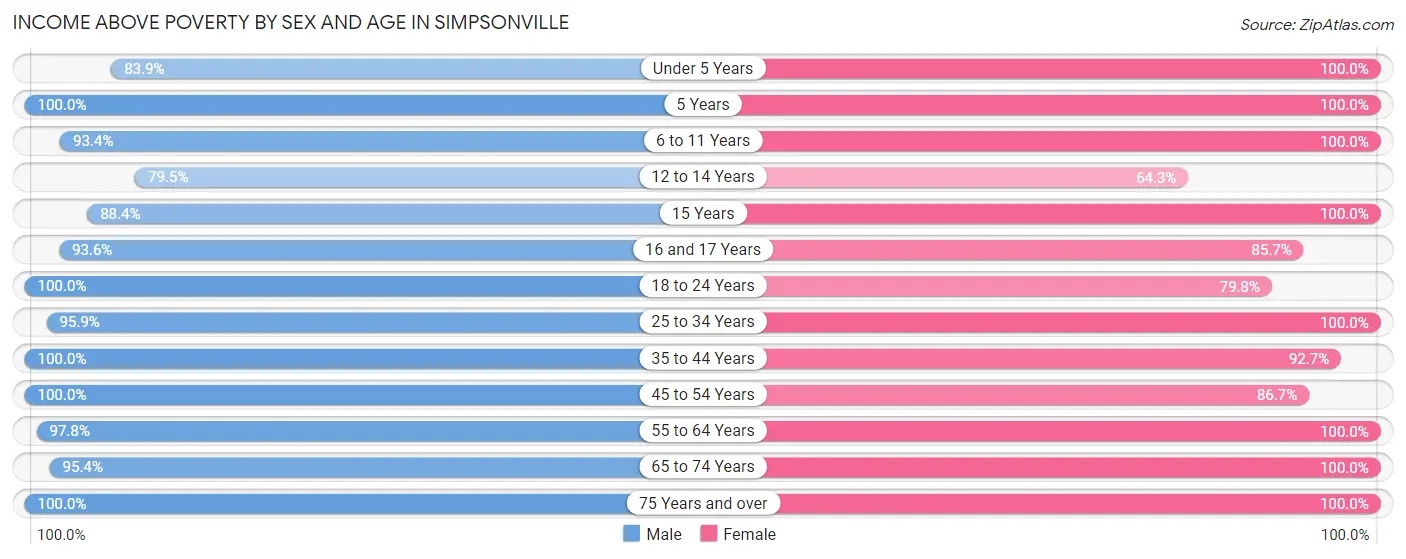
| Age Bracket | Male | Female |
| Under 5 Years | 120 (83.9%) | 54 (100.0%) |
| 5 Years | 30 (100.0%) | 43 (100.0%) |
| 6 to 11 Years | 85 (93.4%) | 96 (100.0%) |
| 12 to 14 Years | 62 (79.5%) | 45 (64.3%) |
| 15 Years | 38 (88.4%) | 27 (100.0%) |
| 16 and 17 Years | 44 (93.6%) | 30 (85.7%) |
| 18 to 24 Years | 57 (100.0%) | 79 (79.8%) |
| 25 to 34 Years | 307 (95.9%) | 243 (100.0%) |
| 35 to 44 Years | 142 (100.0%) | 126 (92.6%) |
| 45 to 54 Years | 138 (100.0%) | 183 (86.7%) |
| 55 to 64 Years | 220 (97.8%) | 193 (100.0%) |
| 65 to 74 Years | 123 (95.4%) | 173 (100.0%) |
| 75 Years and over | 32 (100.0%) | 116 (100.0%) |
| Total | 1,398 (94.8%) | 1,408 (94.1%) |
Income Below Poverty Among Married-Couple Families in Simpsonville
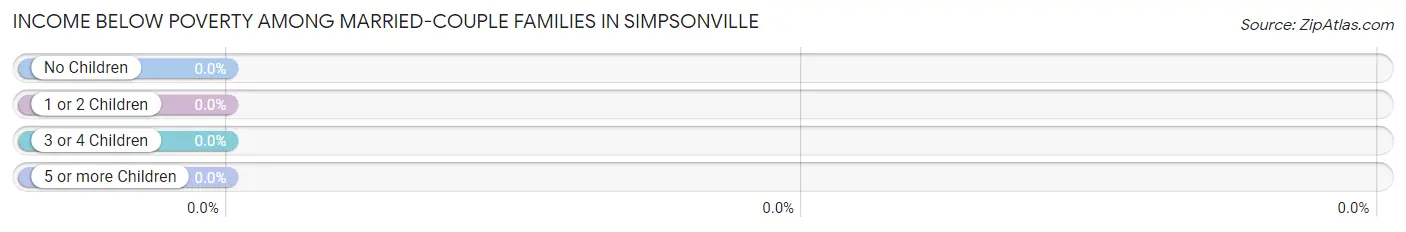
| Children | Above Poverty | Below Poverty |
| No Children | 373 (100.0%) | 0 (0.0%) |
| 1 or 2 Children | 214 (100.0%) | 0 (0.0%) |
| 3 or 4 Children | 60 (100.0%) | 0 (0.0%) |
| 5 or more Children | 17 (100.0%) | 0 (0.0%) |
| Total | 664 (100.0%) | 0 (0.0%) |
Income Below Poverty Among Single-Parent Households in Simpsonville
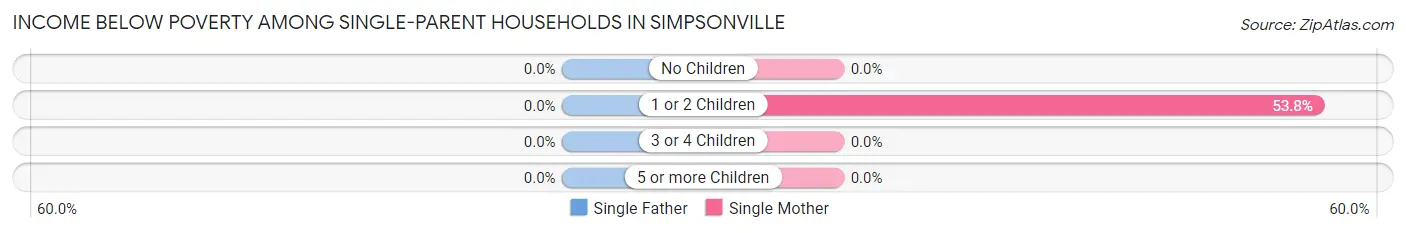
| Children | Single Father | Single Mother |
| No Children | 0 (0.0%) | 0 (0.0%) |
| 1 or 2 Children | 0 (0.0%) | 43 (53.7%) |
| 3 or 4 Children | 0 (0.0%) | 0 (0.0%) |
| 5 or more Children | 0 (0.0%) | 0 (0.0%) |
| Total | 0 (0.0%) | 43 (47.2%) |
Income Below Poverty Among Married-Couple vs Single-Parent Households in Simpsonville
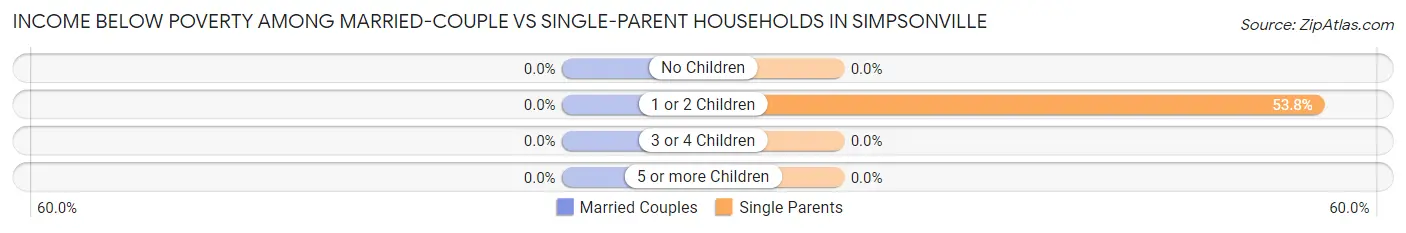
| Children | Married-Couple Families | Single-Parent Households |
| No Children | 0 (0.0%) | 0 (0.0%) |
| 1 or 2 Children | 0 (0.0%) | 43 (53.7%) |
| 3 or 4 Children | 0 (0.0%) | 0 (0.0%) |
| 5 or more Children | 0 (0.0%) | 0 (0.0%) |
| Total | 0 (0.0%) | 43 (32.8%) |
Race in Simpsonville
The most populous races in Simpsonville are White / Caucasian (2,694 | 90.5%), Hispanic or Latino (314 | 10.5%), and Two or more Races (185 | 6.2%).
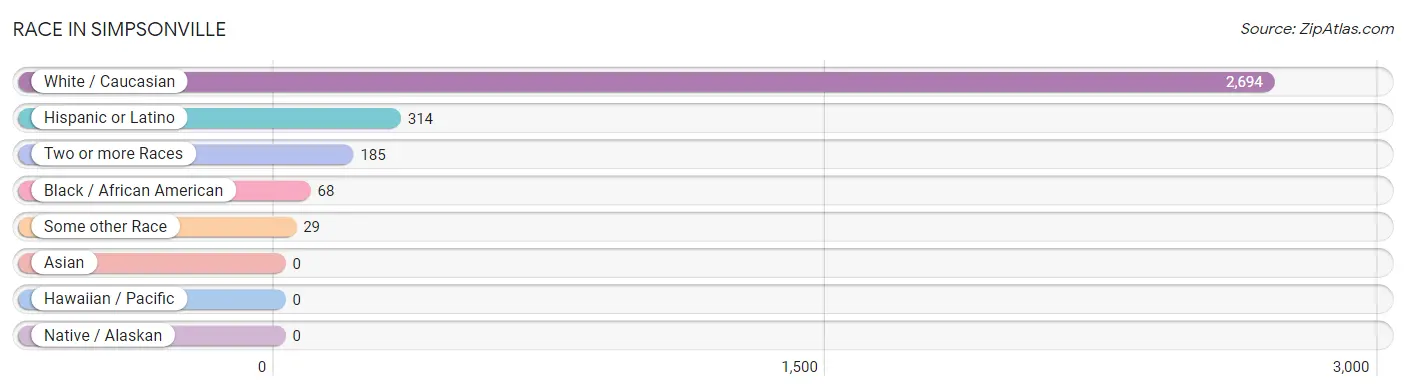
| Race | # Population | % Population |
| Asian | 0 | 0.0% |
| Black / African American | 68 | 2.3% |
| Hawaiian / Pacific | 0 | 0.0% |
| Hispanic or Latino | 314 | 10.5% |
| Native / Alaskan | 0 | 0.0% |
| White / Caucasian | 2,694 | 90.5% |
| Two or more Races | 185 | 6.2% |
| Some other Race | 29 | 1.0% |
| Total | 2,976 | 100.0% |
Ancestry in Simpsonville
The most populous ancestries reported in Simpsonville are English (663 | 22.3%), German (630 | 21.2%), Irish (420 | 14.1%), American (324 | 10.9%), and Mexican (230 | 7.7%), together accounting for 76.2% of all Simpsonville residents.
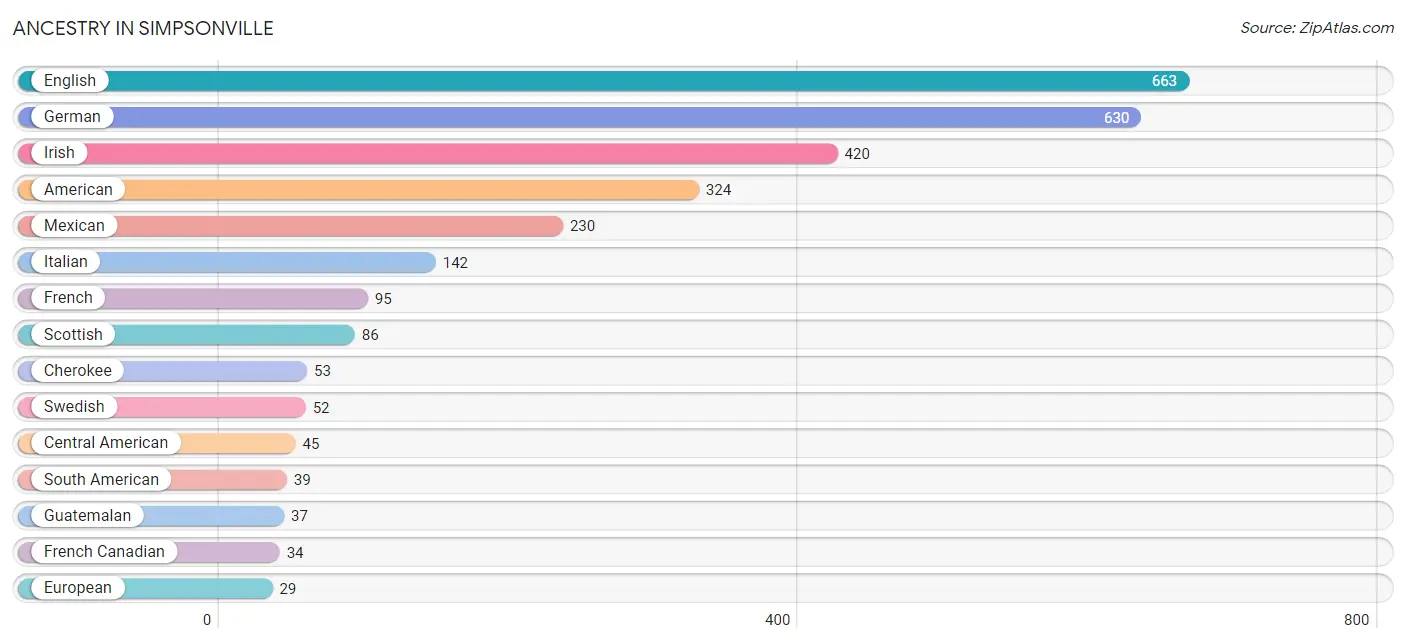
| Ancestry | # Population | % Population |
| American | 324 | 10.9% |
| Arab | 7 | 0.2% |
| Bermudan | 5 | 0.2% |
| British | 19 | 0.6% |
| Burmese | 3 | 0.1% |
| Canadian | 18 | 0.6% |
| Central American | 45 | 1.5% |
| Cherokee | 53 | 1.8% |
| Dutch | 5 | 0.2% |
| English | 663 | 22.3% |
| European | 29 | 1.0% |
| French | 95 | 3.2% |
| French Canadian | 34 | 1.1% |
| German | 630 | 21.2% |
| Guatemalan | 37 | 1.2% |
| Indian (Asian) | 10 | 0.3% |
| Irish | 420 | 14.1% |
| Iroquois | 6 | 0.2% |
| Italian | 142 | 4.8% |
| Jamaican | 7 | 0.2% |
| Lebanese | 7 | 0.2% |
| Mexican | 230 | 7.7% |
| Native Hawaiian | 10 | 0.3% |
| Norwegian | 12 | 0.4% |
| Polish | 6 | 0.2% |
| Portuguese | 23 | 0.8% |
| Scandinavian | 5 | 0.2% |
| Scotch-Irish | 4 | 0.1% |
| Scottish | 86 | 2.9% |
| Slovene | 4 | 0.1% |
| South American | 39 | 1.3% |
| Swedish | 52 | 1.8% |
| Swiss | 13 | 0.4% |
| Ukrainian | 4 | 0.1% |
| Uruguayan | 14 | 0.5% |
| Venezuelan | 25 | 0.8% |
| Welsh | 5 | 0.2% | View All 37 Rows |
Immigrants in Simpsonville
The most numerous immigrant groups reported in Simpsonville came from Latin America (173 | 5.8%), Central America (149 | 5.0%), Mexico (114 | 3.8%), Guatemala (27 | 0.9%), and South America (17 | 0.6%), together accounting for 16.1% of all Simpsonville residents.
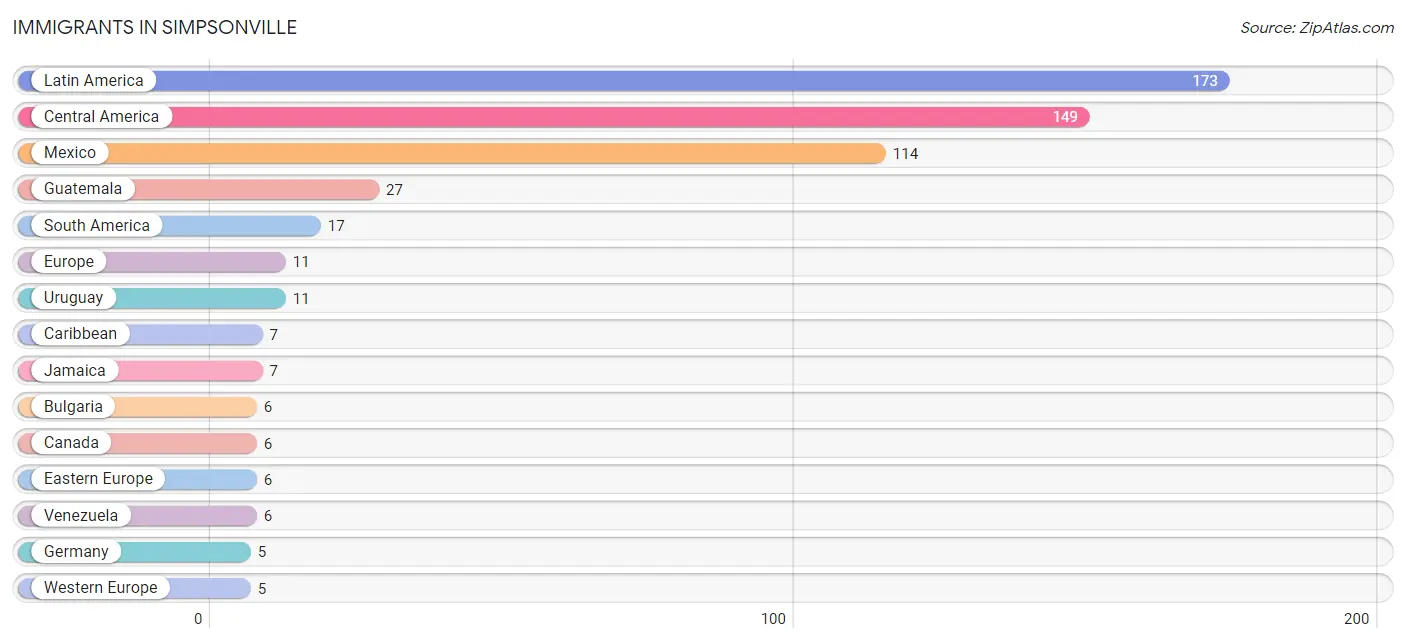
| Immigration Origin | # Population | % Population |
| Bulgaria | 6 | 0.2% |
| Canada | 6 | 0.2% |
| Caribbean | 7 | 0.2% |
| Central America | 149 | 5.0% |
| Eastern Europe | 6 | 0.2% |
| Europe | 11 | 0.4% |
| Germany | 5 | 0.2% |
| Guatemala | 27 | 0.9% |
| Jamaica | 7 | 0.2% |
| Latin America | 173 | 5.8% |
| Mexico | 114 | 3.8% |
| South America | 17 | 0.6% |
| Uruguay | 11 | 0.4% |
| Venezuela | 6 | 0.2% |
| Western Europe | 5 | 0.2% | View All 15 Rows |
Sex and Age in Simpsonville
Sex and Age in Simpsonville
The most populous age groups in Simpsonville are 25 to 29 Years (189 | 12.8%) for men and 25 to 29 Years (142 | 9.5%) for women.
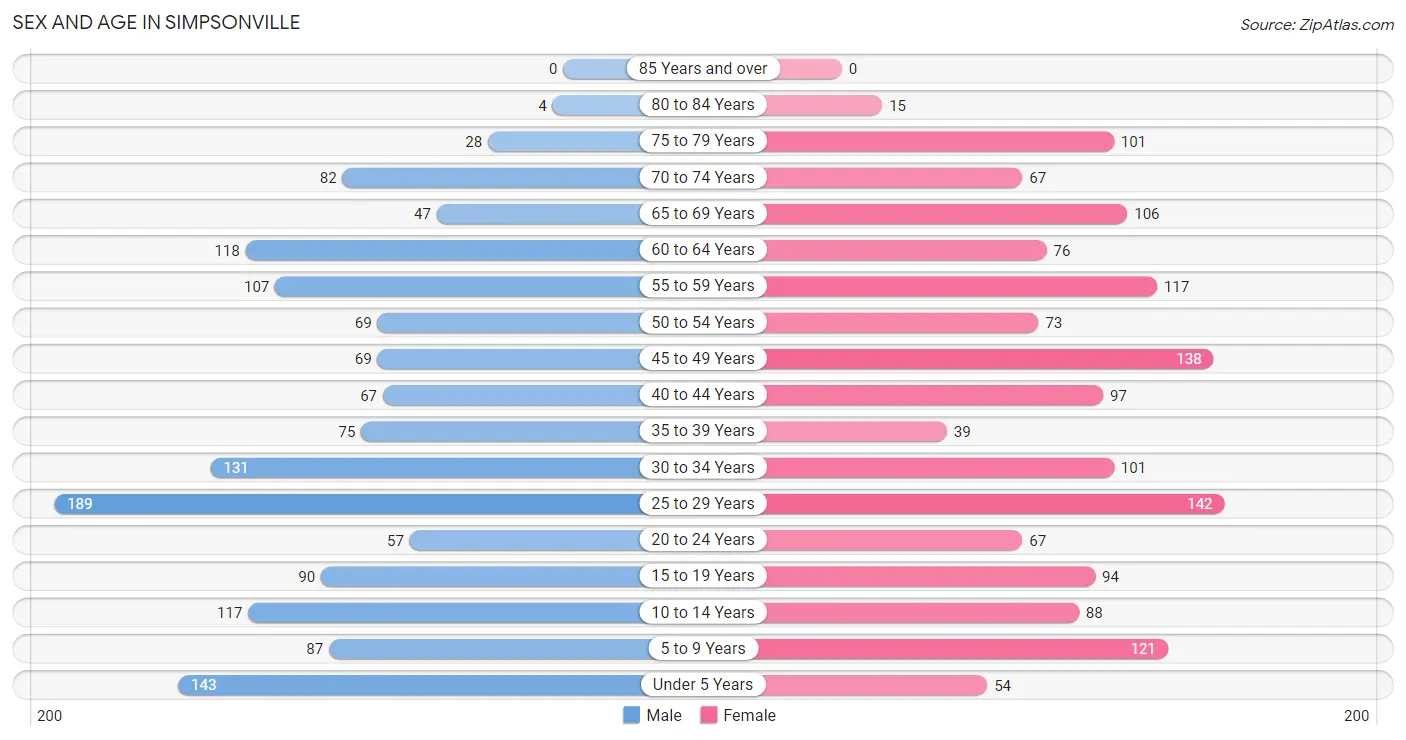
| Age Bracket | Male | Female |
| Under 5 Years | 143 (9.7%) | 54 (3.6%) |
| 5 to 9 Years | 87 (5.9%) | 121 (8.1%) |
| 10 to 14 Years | 117 (7.9%) | 88 (5.9%) |
| 15 to 19 Years | 90 (6.1%) | 94 (6.3%) |
| 20 to 24 Years | 57 (3.8%) | 67 (4.5%) |
| 25 to 29 Years | 189 (12.8%) | 142 (9.5%) |
| 30 to 34 Years | 131 (8.8%) | 101 (6.8%) |
| 35 to 39 Years | 75 (5.1%) | 39 (2.6%) |
| 40 to 44 Years | 67 (4.5%) | 97 (6.5%) |
| 45 to 49 Years | 69 (4.7%) | 138 (9.2%) |
| 50 to 54 Years | 69 (4.7%) | 73 (4.9%) |
| 55 to 59 Years | 107 (7.2%) | 117 (7.8%) |
| 60 to 64 Years | 118 (8.0%) | 76 (5.1%) |
| 65 to 69 Years | 47 (3.2%) | 106 (7.1%) |
| 70 to 74 Years | 82 (5.5%) | 67 (4.5%) |
| 75 to 79 Years | 28 (1.9%) | 101 (6.8%) |
| 80 to 84 Years | 4 (0.3%) | 15 (1.0%) |
| 85 Years and over | 0 (0.0%) | 0 (0.0%) |
| Total | 1,480 (100.0%) | 1,496 (100.0%) |
Families and Households in Simpsonville
Median Family Size in Simpsonville
The median family size in Simpsonville is 3.14 persons per family, with married-couple families (664 | 83.5%) accounting for the largest median family size of 3.22 persons per family. On the other hand, single male/father families (40 | 5.0%) represent the smallest median family size with 2.68 persons per family.
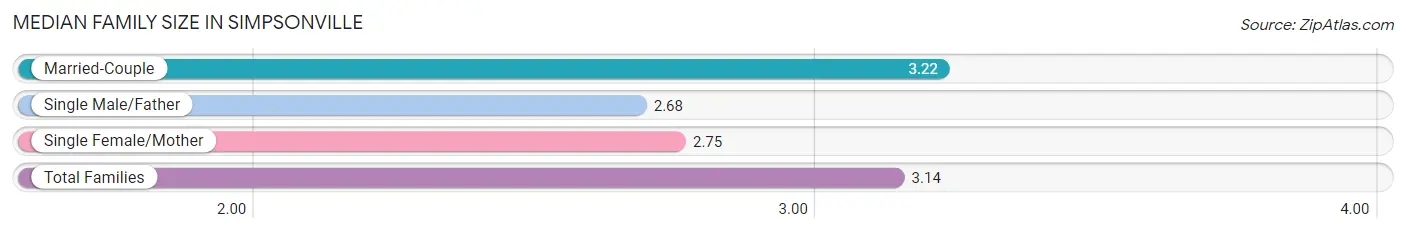
| Family Type | # Families | Family Size |
| Married-Couple | 664 (83.5%) | 3.22 |
| Single Male/Father | 40 (5.0%) | 2.68 |
| Single Female/Mother | 91 (11.5%) | 2.75 |
| Total Families | 795 (100.0%) | 3.14 |
Median Household Size in Simpsonville
The median household size in Simpsonville is 2.52 persons per household, with married-couple households (664 | 56.2%) accounting for the largest median household size of 3.22 persons per household. non-family households (387 | 32.7%) represent the smallest median household size with 1.17 persons per household.
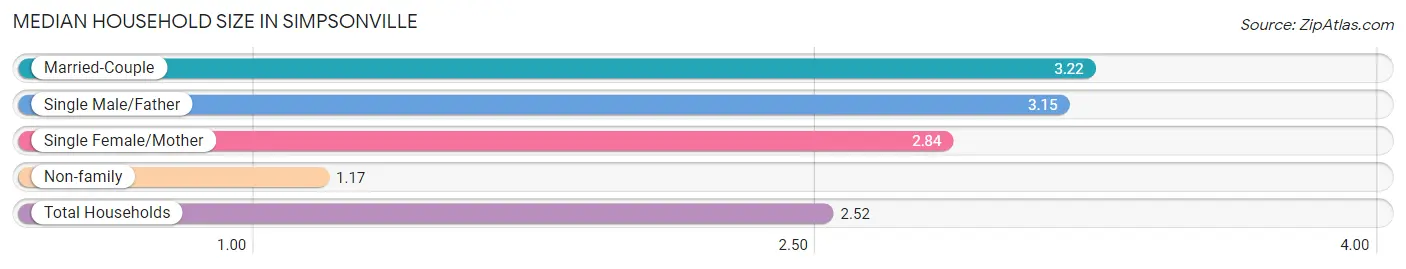
| Household Type | # Households | Household Size |
| Married-Couple | 664 (56.2%) | 3.22 |
| Single Male/Father | 40 (3.4%) | 3.15 |
| Single Female/Mother | 91 (7.7%) | 2.84 |
| Non-family | 387 (32.7%) | 1.17 |
| Total Households | 1,182 (100.0%) | 2.52 |
Household Size by Marriage Status in Simpsonville
Out of a total of 1,182 households in Simpsonville, 795 (67.3%) are family households, while 387 (32.7%) are nonfamily households. The most numerous type of family households are 2-person households, comprising 315, and the most common type of nonfamily households are 1-person households, comprising 340.
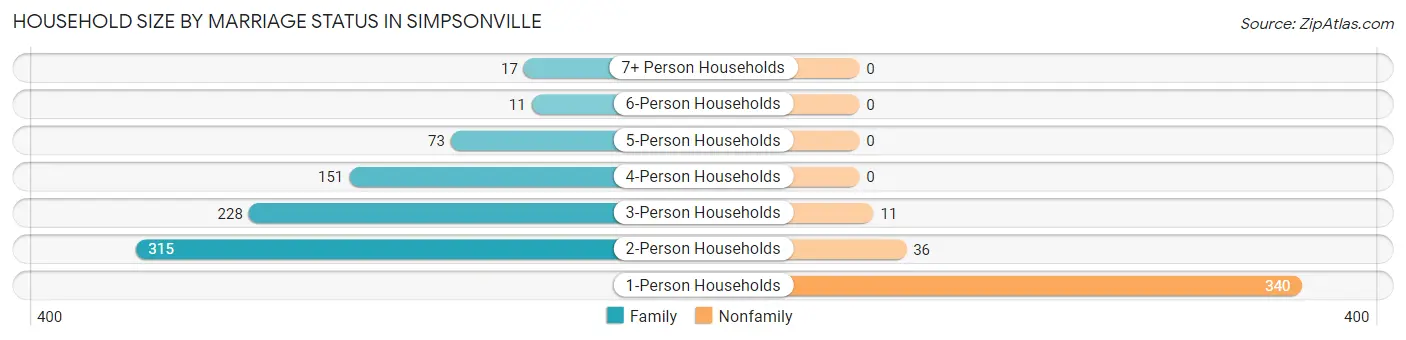
| Household Size | Family Households | Nonfamily Households |
| 1-Person Households | - | 340 (28.8%) |
| 2-Person Households | 315 (26.7%) | 36 (3.0%) |
| 3-Person Households | 228 (19.3%) | 11 (0.9%) |
| 4-Person Households | 151 (12.8%) | 0 (0.0%) |
| 5-Person Households | 73 (6.2%) | 0 (0.0%) |
| 6-Person Households | 11 (0.9%) | 0 (0.0%) |
| 7+ Person Households | 17 (1.4%) | 0 (0.0%) |
| Total | 795 (67.3%) | 387 (32.7%) |
Female Fertility in Simpsonville
Fertility by Age in Simpsonville
Average fertility rate in Simpsonville is 30.0 births per 1,000 women. Women in the age bracket of 20 to 34 years have the highest fertility rate with 68.0 births per 1,000 women. Women in the age bracket of 20 to 34 years acount for 100.0% of all women with births.
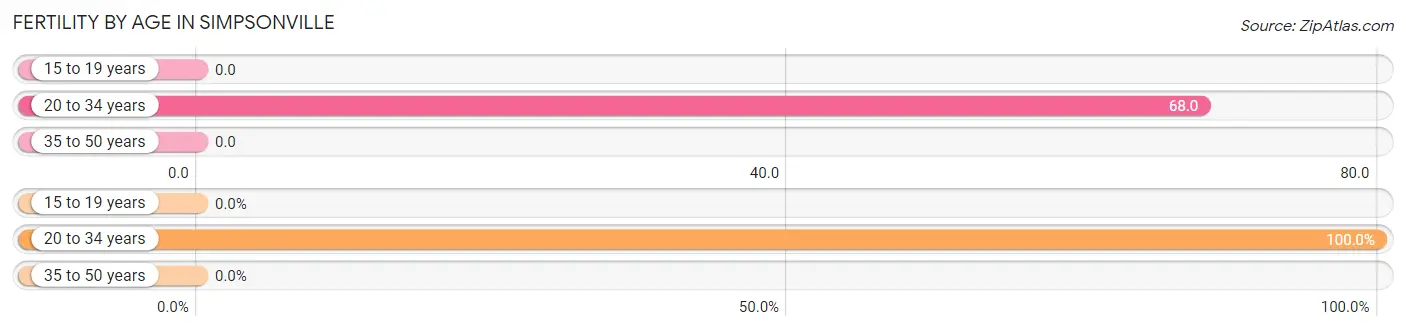
| Age Bracket | Women with Births | Births / 1,000 Women |
| 15 to 19 years | 0 (0.0%) | 0.0 |
| 20 to 34 years | 21 (100.0%) | 68.0 |
| 35 to 50 years | 0 (0.0%) | 0.0 |
| Total | 21 (100.0%) | 30.0 |
Fertility by Age by Marriage Status in Simpsonville
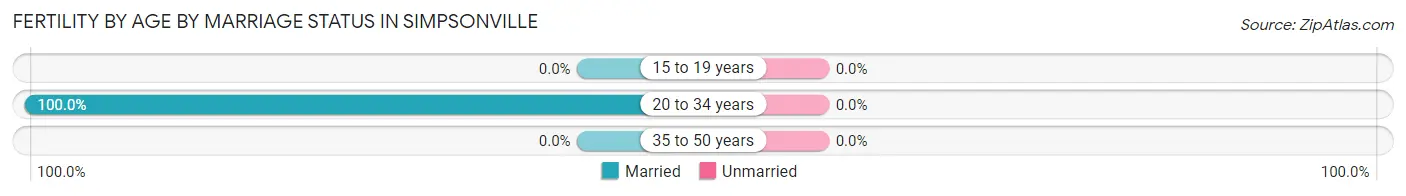
| Age Bracket | Married | Unmarried |
| 15 to 19 years | 0 (0.0%) | 0 (0.0%) |
| 20 to 34 years | 21 (100.0%) | 0 (0.0%) |
| 35 to 50 years | 0 (0.0%) | 0 (0.0%) |
| Total | 21 (100.0%) | 0 (0.0%) |
Fertility by Education in Simpsonville
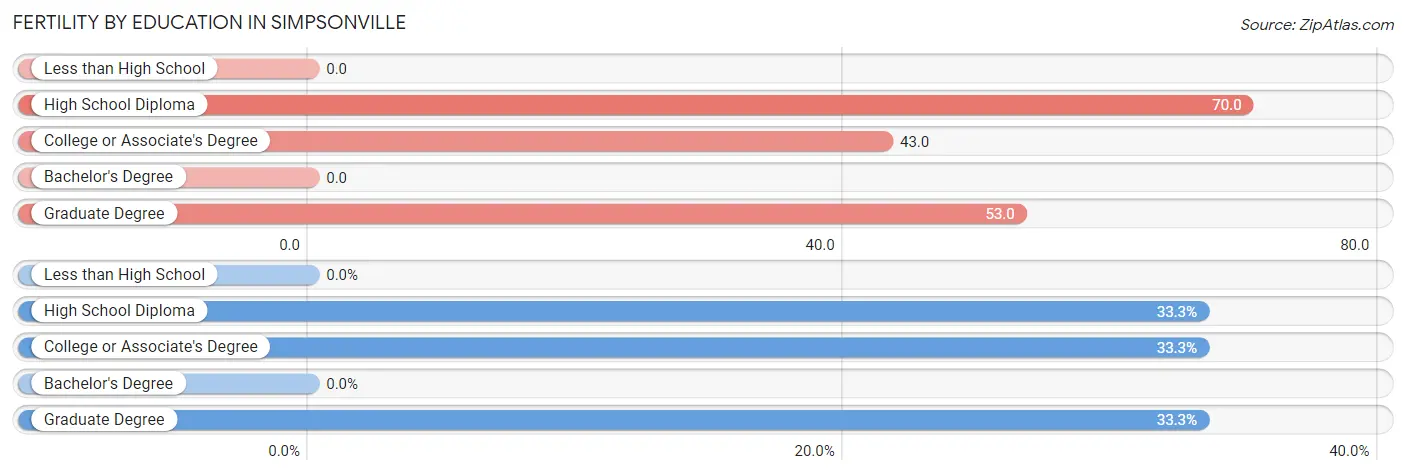
| Educational Attainment | Women with Births | Births / 1,000 Women |
| Less than High School | 0 (0.0%) | 0.0 |
| High School Diploma | 7 (33.3%) | 70.0 |
| College or Associate's Degree | 7 (33.3%) | 43.0 |
| Bachelor's Degree | 0 (0.0%) | 0.0 |
| Graduate Degree | 7 (33.3%) | 53.0 |
| Total | 21 (100.0%) | 30.0 |
Fertility by Education by Marriage Status in Simpsonville
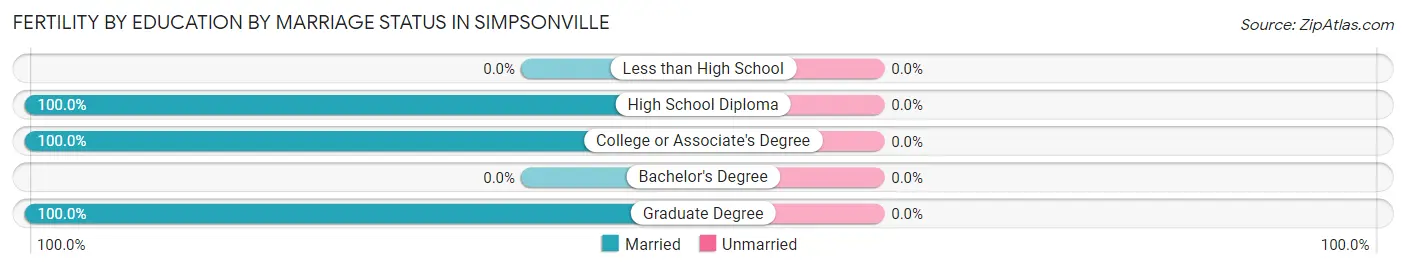
| Educational Attainment | Married | Unmarried |
| Less than High School | 0 (0.0%) | 0 (0.0%) |
| High School Diploma | 7 (100.0%) | 0 (0.0%) |
| College or Associate's Degree | 7 (100.0%) | 0 (0.0%) |
| Bachelor's Degree | 0 (0.0%) | 0 (0.0%) |
| Graduate Degree | 7 (100.0%) | 0 (0.0%) |
| Total | 21 (100.0%) | 0 (0.0%) |
Employment Characteristics in Simpsonville
Employment by Class of Employer in Simpsonville
Among the 1,516 employed individuals in Simpsonville, private company employees (1,068 | 70.5%), not-for-profit organizations (179 | 11.8%), and local government employees (91 | 6.0%) make up the most common classes of employment.
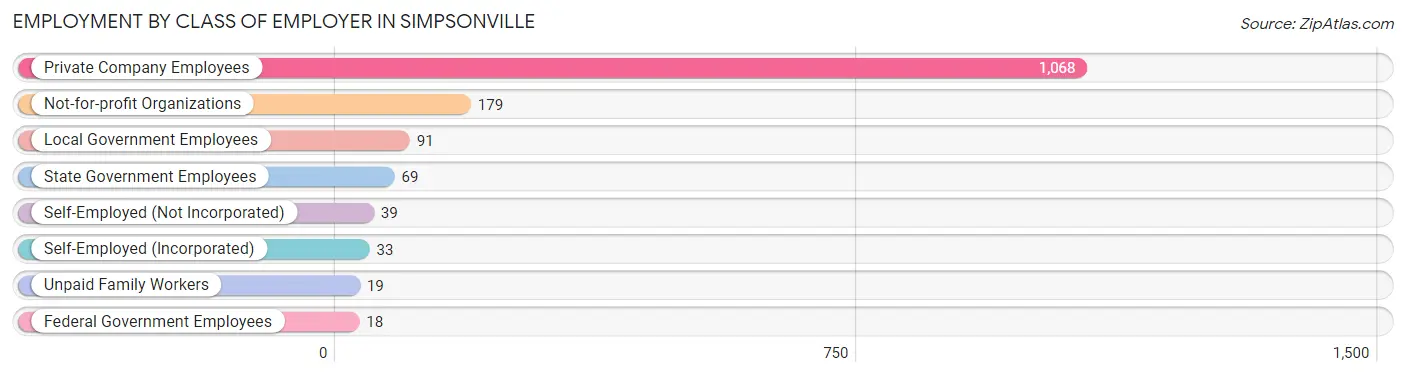
| Employer Class | # Employees | % Employees |
| Private Company Employees | 1,068 | 70.5% |
| Self-Employed (Incorporated) | 33 | 2.2% |
| Self-Employed (Not Incorporated) | 39 | 2.6% |
| Not-for-profit Organizations | 179 | 11.8% |
| Local Government Employees | 91 | 6.0% |
| State Government Employees | 69 | 4.5% |
| Federal Government Employees | 18 | 1.2% |
| Unpaid Family Workers | 19 | 1.3% |
| Total | 1,516 | 100.0% |
Employment Status by Age in Simpsonville
According to the labor force statistics for Simpsonville, out of the total population over 16 years of age (2,296), 68.0% or 1,561 individuals are in the labor force, with 0.8% or 12 of them unemployed. The age group with the highest labor force participation rate is 25 to 29 years, with 97.9% or 324 individuals in the labor force. Within the labor force, the 55 to 59 years age range has the highest percentage of unemployed individuals, with 3.3% or 6 of them being unemployed.
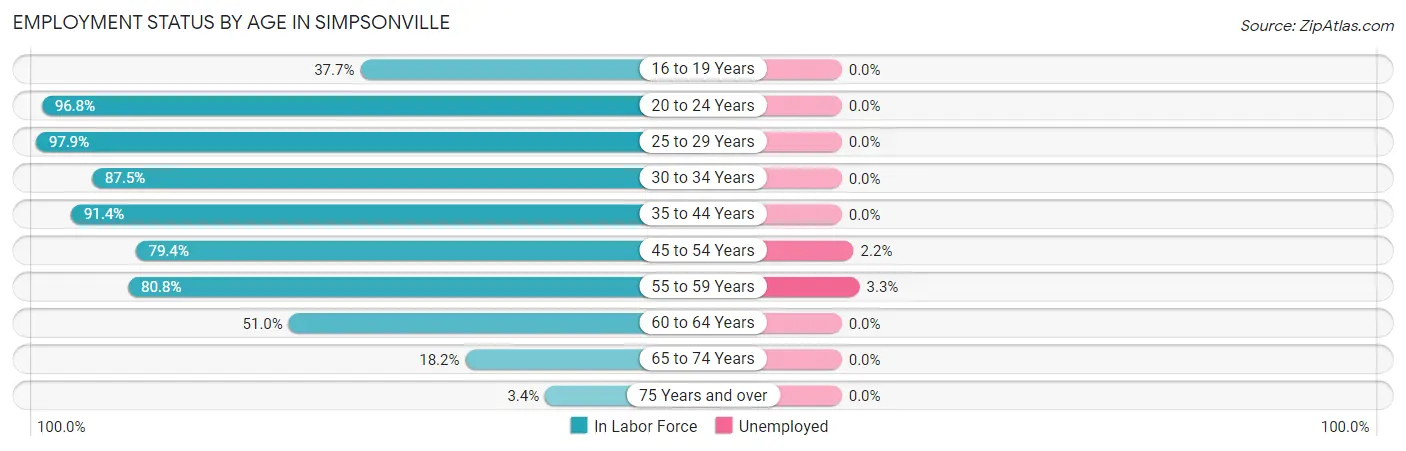
| Age Bracket | In Labor Force | Unemployed |
| 16 to 19 Years | 43 (37.7%) | 0 (0.0%) |
| 20 to 24 Years | 120 (96.8%) | 0 (0.0%) |
| 25 to 29 Years | 324 (97.9%) | 0 (0.0%) |
| 30 to 34 Years | 203 (87.5%) | 0 (0.0%) |
| 35 to 44 Years | 254 (91.4%) | 0 (0.0%) |
| 45 to 54 Years | 277 (79.4%) | 6 (2.2%) |
| 55 to 59 Years | 181 (80.8%) | 6 (3.3%) |
| 60 to 64 Years | 99 (51.0%) | 0 (0.0%) |
| 65 to 74 Years | 55 (18.2%) | 0 (0.0%) |
| 75 Years and over | 5 (3.4%) | 0 (0.0%) |
| Total | 1,561 (68.0%) | 12 (0.8%) |
Employment Status by Educational Attainment in Simpsonville
According to labor force statistics for Simpsonville, 83.2% of individuals (1,338) out of the total population between 25 and 64 years of age (1,608) are in the labor force, with 0.9% or 12 of them being unemployed. The group with the highest labor force participation rate are those with the educational attainment of high school diploma, with 91.3% or 294 individuals in the labor force. Within the labor force, individuals with bachelor's degree or higher education have the highest percentage of unemployment, with 1.8% or 12 of them being unemployed.
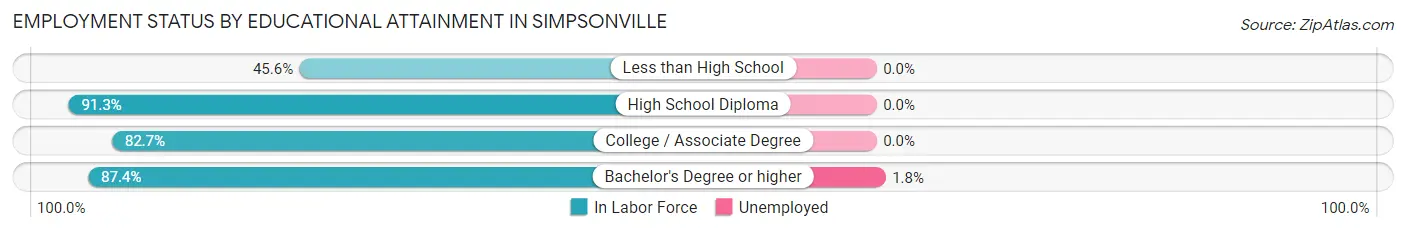
| Educational Attainment | In Labor Force | Unemployed |
| Less than High School | 67 (45.6%) | 0 (0.0%) |
| High School Diploma | 294 (91.3%) | 0 (0.0%) |
| College / Associate Degree | 325 (82.7%) | 0 (0.0%) |
| Bachelor's Degree or higher | 652 (87.4%) | 13 (1.8%) |
| Total | 1,338 (83.2%) | 14 (0.9%) |
Employment Occupations by Sex in Simpsonville
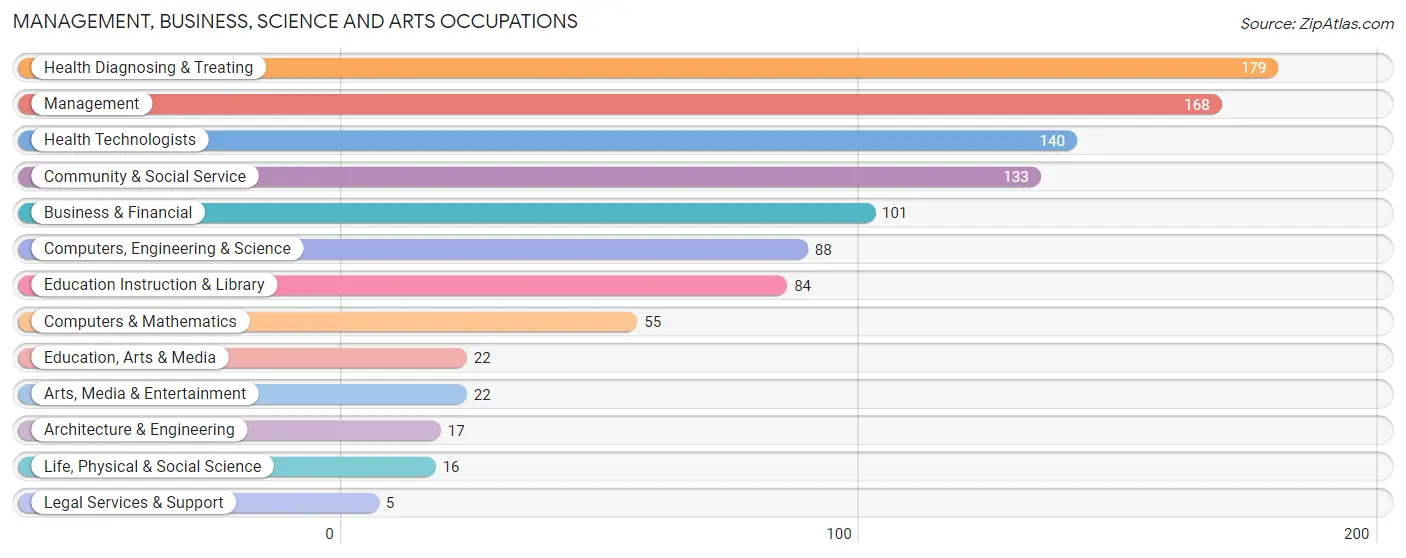
Management, Business, Science and Arts Occupations
The most common Management, Business, Science and Arts occupations in Simpsonville are Health Diagnosing & Treating (179 | 11.6%), Management (168 | 10.9%), Health Technologists (140 | 9.1%), Community & Social Service (133 | 8.6%), and Business & Financial (101 | 6.5%).
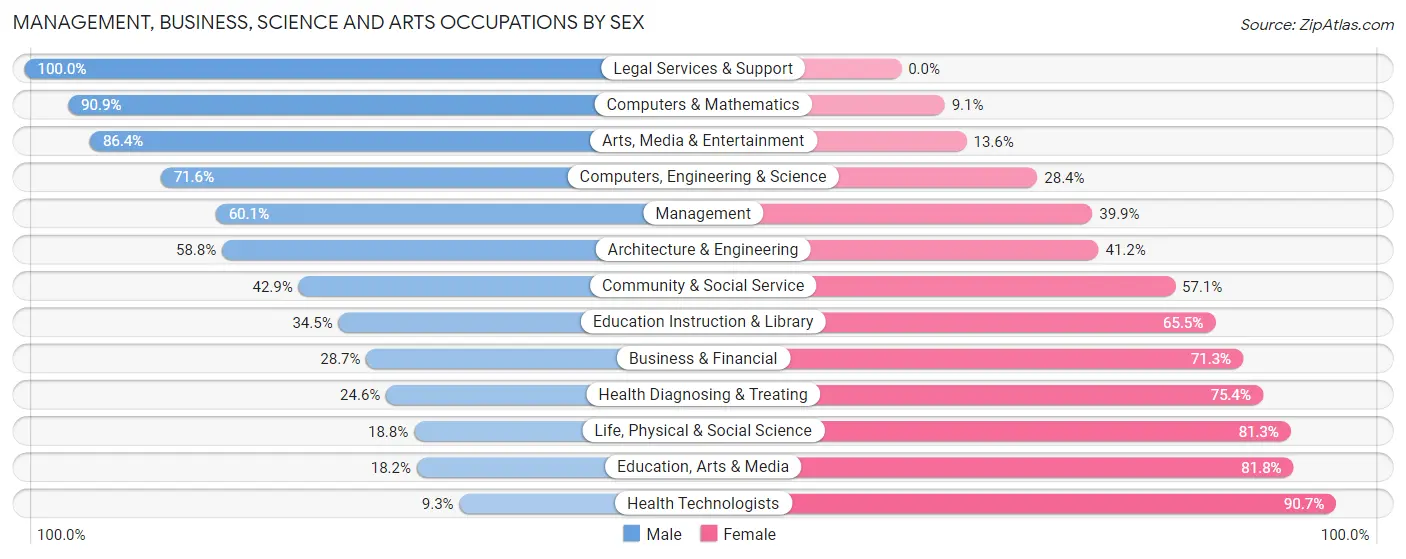
Management, Business, Science and Arts Occupations by Sex
Within the Management, Business, Science and Arts occupations in Simpsonville, the most male-oriented occupations are Legal Services & Support (100.0%), Computers & Mathematics (90.9%), and Arts, Media & Entertainment (86.4%), while the most female-oriented occupations are Health Technologists (90.7%), Education, Arts & Media (81.8%), and Life, Physical & Social Science (81.2%).
| Occupation | Male | Female |
| Management | 101 (60.1%) | 67 (39.9%) |
| Business & Financial | 29 (28.7%) | 72 (71.3%) |
| Computers, Engineering & Science | 63 (71.6%) | 25 (28.4%) |
| Computers & Mathematics | 50 (90.9%) | 5 (9.1%) |
| Architecture & Engineering | 10 (58.8%) | 7 (41.2%) |
| Life, Physical & Social Science | 3 (18.8%) | 13 (81.2%) |
| Community & Social Service | 57 (42.9%) | 76 (57.1%) |
| Education, Arts & Media | 4 (18.2%) | 18 (81.8%) |
| Legal Services & Support | 5 (100.0%) | 0 (0.0%) |
| Education Instruction & Library | 29 (34.5%) | 55 (65.5%) |
| Arts, Media & Entertainment | 19 (86.4%) | 3 (13.6%) |
| Health Diagnosing & Treating | 44 (24.6%) | 135 (75.4%) |
| Health Technologists | 13 (9.3%) | 127 (90.7%) |
| Total (Category) | 294 (44.0%) | 375 (56.0%) |
| Total (Overall) | 774 (50.1%) | 771 (49.9%) |
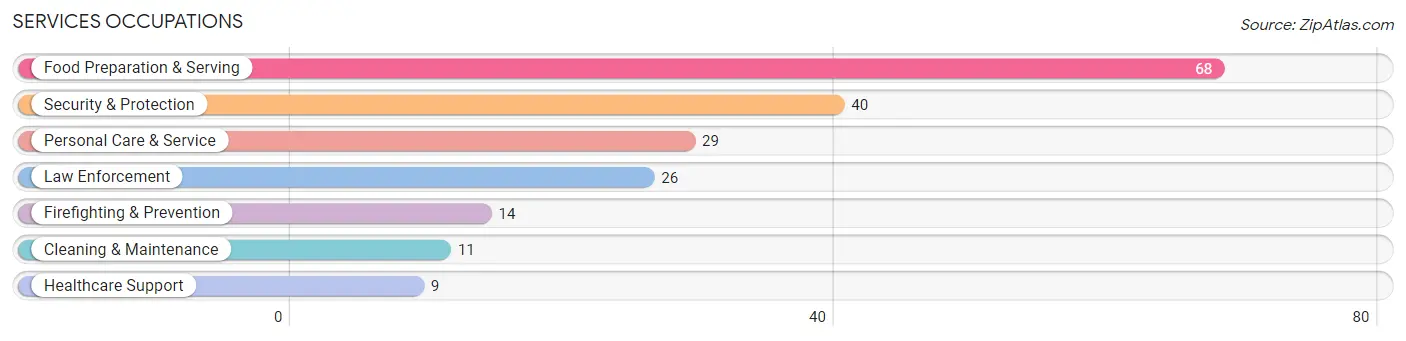
Services Occupations
The most common Services occupations in Simpsonville are Food Preparation & Serving (68 | 4.4%), Security & Protection (40 | 2.6%), Personal Care & Service (29 | 1.9%), Law Enforcement (26 | 1.7%), and Firefighting & Prevention (14 | 0.9%).
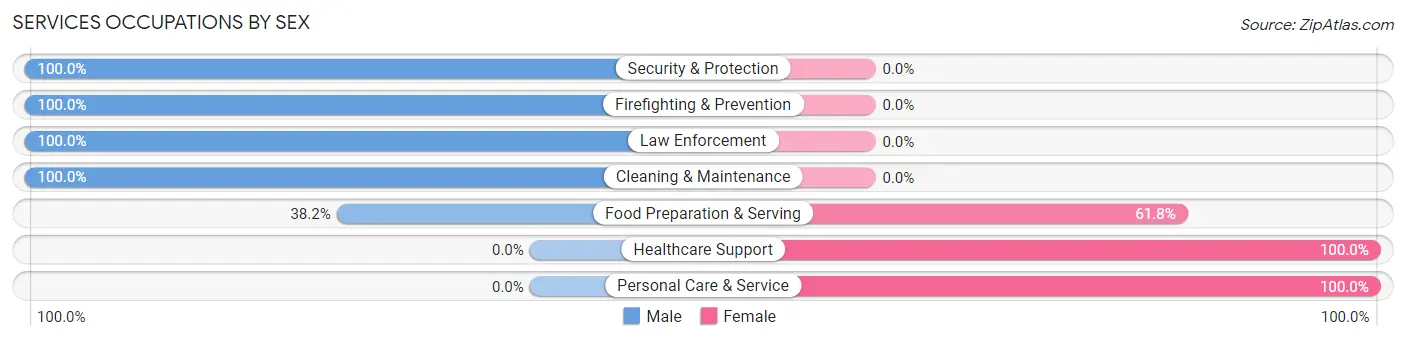
Services Occupations by Sex
Within the Services occupations in Simpsonville, the most male-oriented occupations are Security & Protection (100.0%), Firefighting & Prevention (100.0%), and Law Enforcement (100.0%), while the most female-oriented occupations are Healthcare Support (100.0%), Personal Care & Service (100.0%), and Food Preparation & Serving (61.8%).
| Occupation | Male | Female |
| Healthcare Support | 0 (0.0%) | 9 (100.0%) |
| Security & Protection | 40 (100.0%) | 0 (0.0%) |
| Firefighting & Prevention | 14 (100.0%) | 0 (0.0%) |
| Law Enforcement | 26 (100.0%) | 0 (0.0%) |
| Food Preparation & Serving | 26 (38.2%) | 42 (61.8%) |
| Cleaning & Maintenance | 11 (100.0%) | 0 (0.0%) |
| Personal Care & Service | 0 (0.0%) | 29 (100.0%) |
| Total (Category) | 77 (49.0%) | 80 (51.0%) |
| Total (Overall) | 774 (50.1%) | 771 (49.9%) |
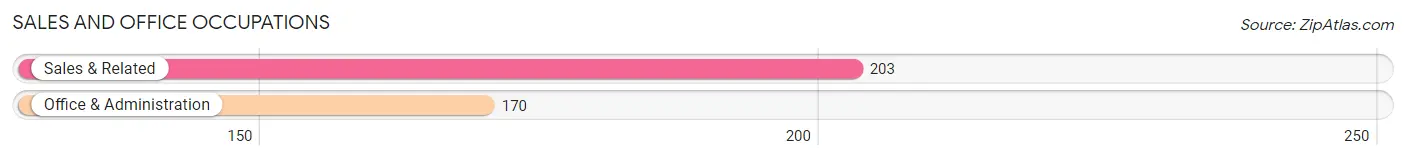
Sales and Office Occupations
The most common Sales and Office occupations in Simpsonville are Sales & Related (203 | 13.1%), and Office & Administration (170 | 11.0%).
Sales and Office Occupations by Sex
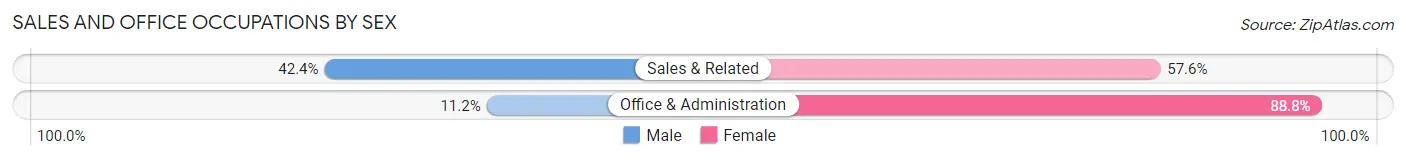
| Occupation | Male | Female |
| Sales & Related | 86 (42.4%) | 117 (57.6%) |
| Office & Administration | 19 (11.2%) | 151 (88.8%) |
| Total (Category) | 105 (28.1%) | 268 (71.9%) |
| Total (Overall) | 774 (50.1%) | 771 (49.9%) |
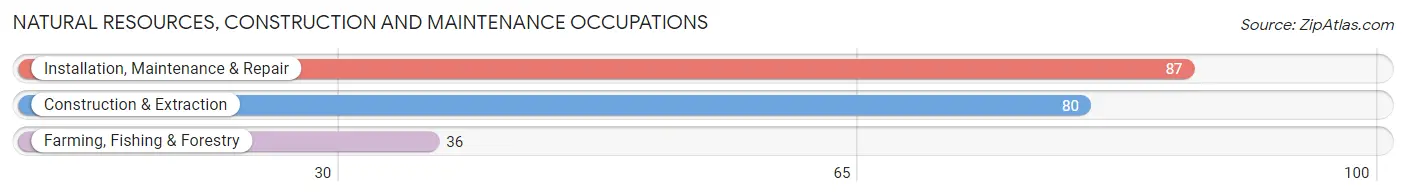
Natural Resources, Construction and Maintenance Occupations
The most common Natural Resources, Construction and Maintenance occupations in Simpsonville are Installation, Maintenance & Repair (87 | 5.6%), Construction & Extraction (80 | 5.2%), and Farming, Fishing & Forestry (36 | 2.3%).
Natural Resources, Construction and Maintenance Occupations by Sex
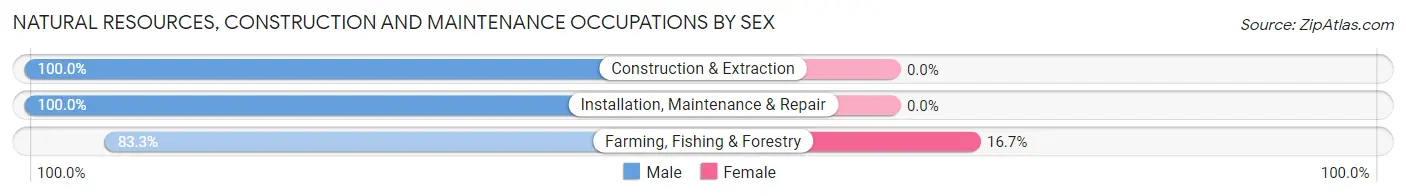
| Occupation | Male | Female |
| Farming, Fishing & Forestry | 30 (83.3%) | 6 (16.7%) |
| Construction & Extraction | 80 (100.0%) | 0 (0.0%) |
| Installation, Maintenance & Repair | 87 (100.0%) | 0 (0.0%) |
| Total (Category) | 197 (97.0%) | 6 (3.0%) |
| Total (Overall) | 774 (50.1%) | 771 (49.9%) |
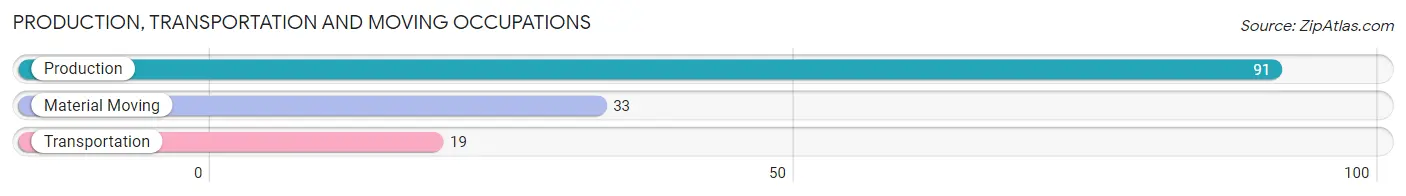
Production, Transportation and Moving Occupations
The most common Production, Transportation and Moving occupations in Simpsonville are Production (91 | 5.9%), Material Moving (33 | 2.1%), and Transportation (19 | 1.2%).
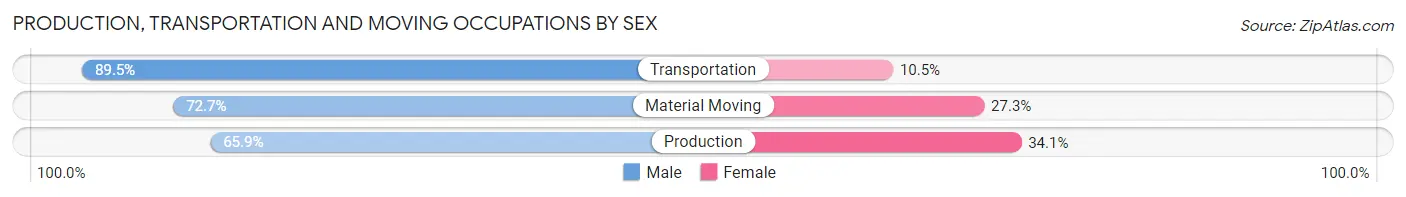
Production, Transportation and Moving Occupations by Sex
| Occupation | Male | Female |
| Production | 60 (65.9%) | 31 (34.1%) |
| Transportation | 17 (89.5%) | 2 (10.5%) |
| Material Moving | 24 (72.7%) | 9 (27.3%) |
| Total (Category) | 101 (70.6%) | 42 (29.4%) |
| Total (Overall) | 774 (50.1%) | 771 (49.9%) |
Employment Industries by Sex in Simpsonville
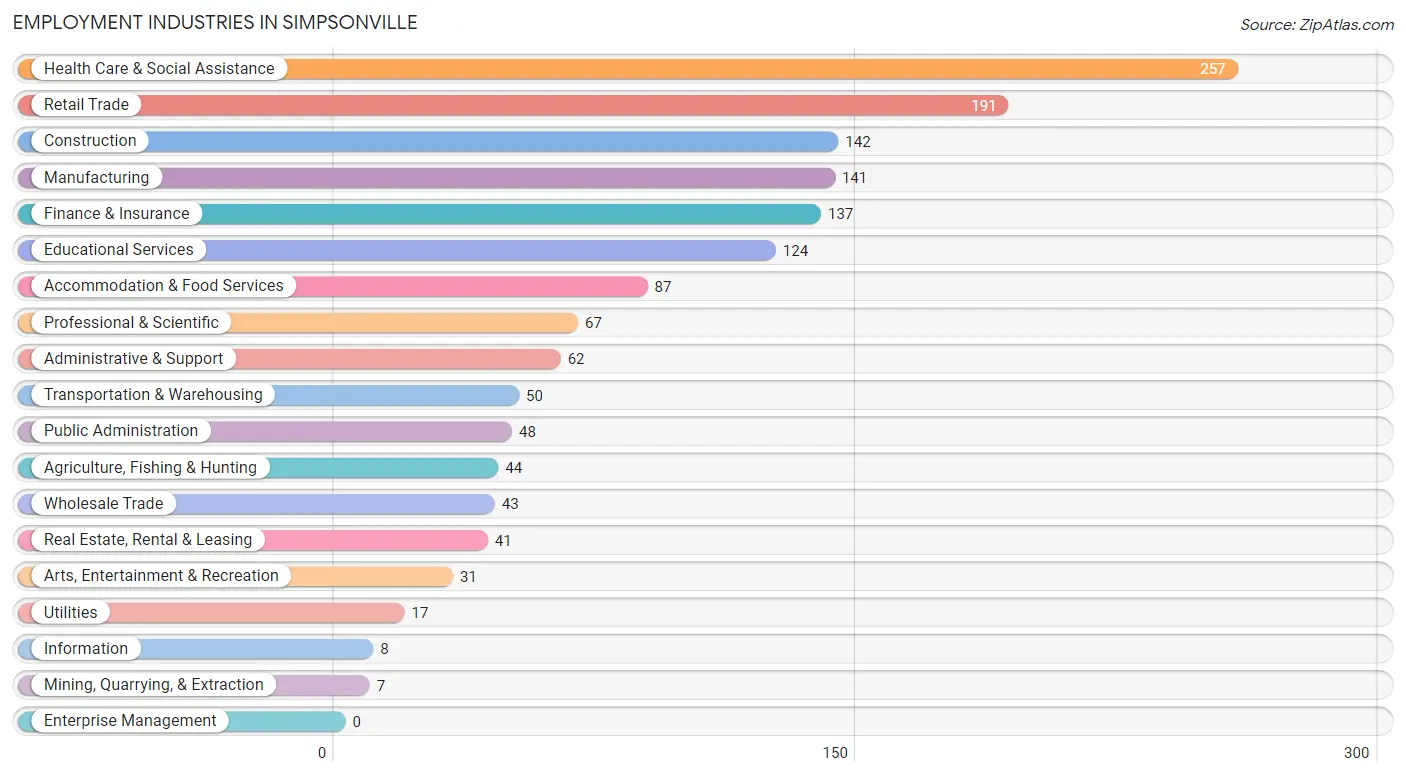
Employment Industries in Simpsonville
The major employment industries in Simpsonville include Health Care & Social Assistance (257 | 16.6%), Retail Trade (191 | 12.4%), Construction (142 | 9.2%), Manufacturing (141 | 9.1%), and Finance & Insurance (137 | 8.9%).
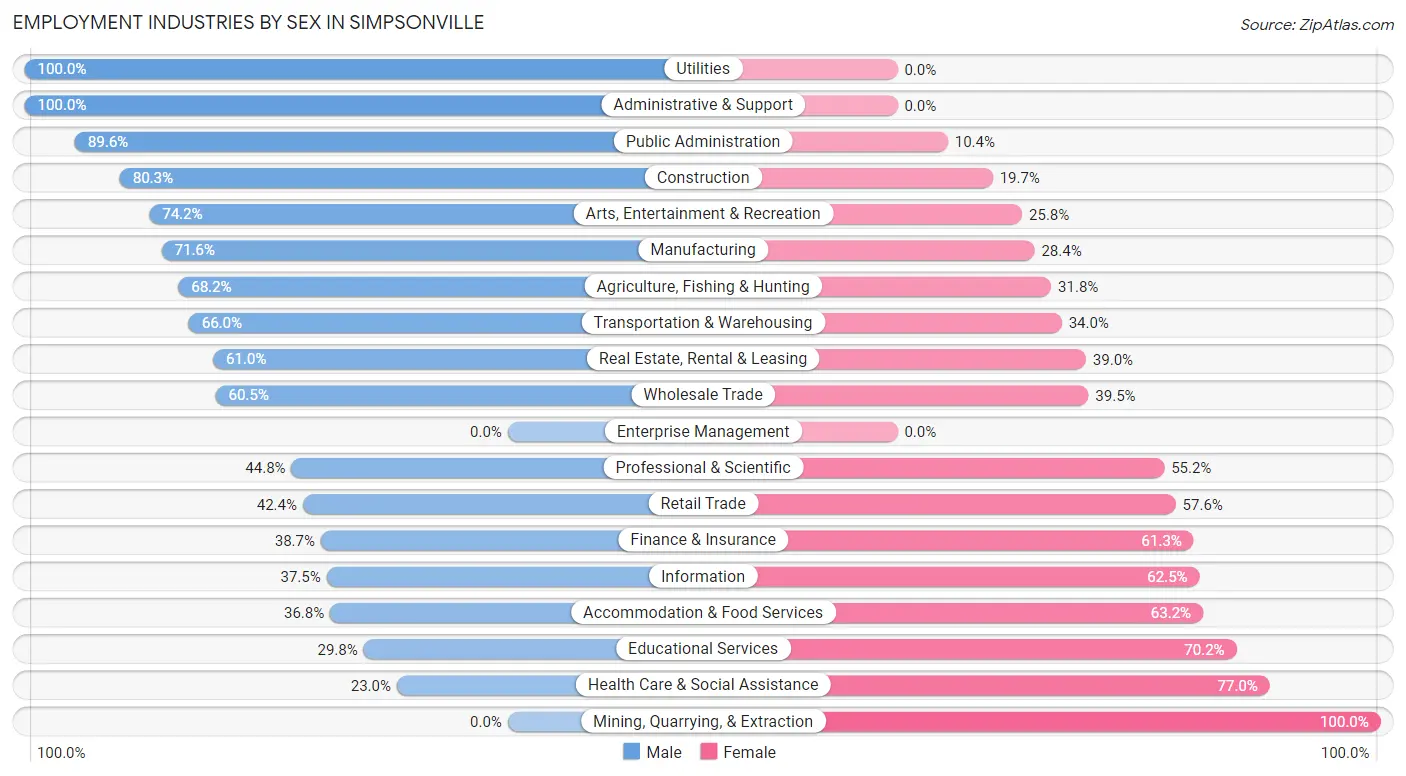
Employment Industries by Sex in Simpsonville
The Simpsonville industries that see more men than women are Utilities (100.0%), Administrative & Support (100.0%), and Public Administration (89.6%), whereas the industries that tend to have a higher number of women are Mining, Quarrying, & Extraction (100.0%), Health Care & Social Assistance (77.0%), and Educational Services (70.2%).
| Industry | Male | Female |
| Agriculture, Fishing & Hunting | 30 (68.2%) | 14 (31.8%) |
| Mining, Quarrying, & Extraction | 0 (0.0%) | 7 (100.0%) |
| Construction | 114 (80.3%) | 28 (19.7%) |
| Manufacturing | 101 (71.6%) | 40 (28.4%) |
| Wholesale Trade | 26 (60.5%) | 17 (39.5%) |
| Retail Trade | 81 (42.4%) | 110 (57.6%) |
| Transportation & Warehousing | 33 (66.0%) | 17 (34.0%) |
| Utilities | 17 (100.0%) | 0 (0.0%) |
| Information | 3 (37.5%) | 5 (62.5%) |
| Finance & Insurance | 53 (38.7%) | 84 (61.3%) |
| Real Estate, Rental & Leasing | 25 (61.0%) | 16 (39.0%) |
| Professional & Scientific | 30 (44.8%) | 37 (55.2%) |
| Enterprise Management | 0 (0.0%) | 0 (0.0%) |
| Administrative & Support | 62 (100.0%) | 0 (0.0%) |
| Educational Services | 37 (29.8%) | 87 (70.2%) |
| Health Care & Social Assistance | 59 (23.0%) | 198 (77.0%) |
| Arts, Entertainment & Recreation | 23 (74.2%) | 8 (25.8%) |
| Accommodation & Food Services | 32 (36.8%) | 55 (63.2%) |
| Public Administration | 43 (89.6%) | 5 (10.4%) |
| Total | 774 (50.1%) | 771 (49.9%) |
Education in Simpsonville
School Enrollment in Simpsonville
The most common levels of schooling among the 723 students in Simpsonville are high school (188 | 26.0%), middle school (142 | 19.6%), and elementary school (105 | 14.5%).
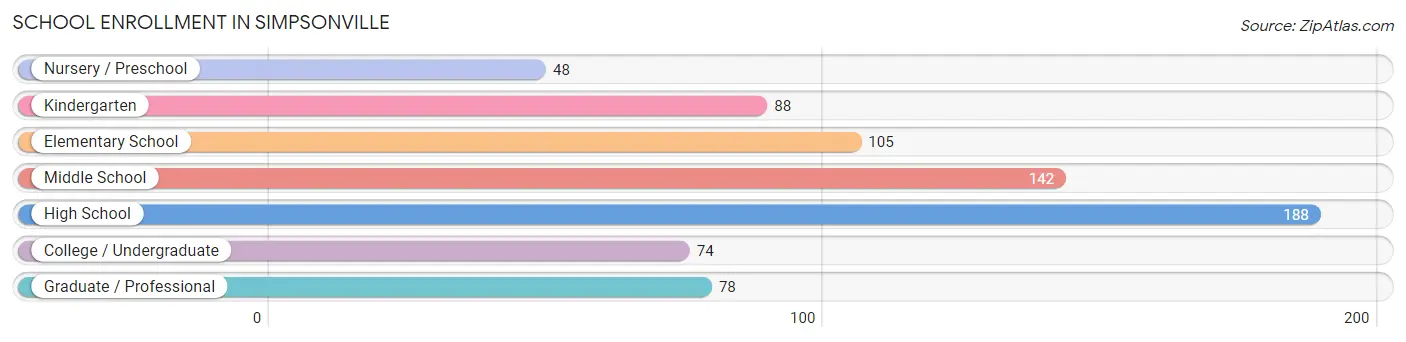
| School Level | # Students | % Students |
| Nursery / Preschool | 48 | 6.6% |
| Kindergarten | 88 | 12.2% |
| Elementary School | 105 | 14.5% |
| Middle School | 142 | 19.6% |
| High School | 188 | 26.0% |
| College / Undergraduate | 74 | 10.2% |
| Graduate / Professional | 78 | 10.8% |
| Total | 723 | 100.0% |
School Enrollment by Age by Funding Source in Simpsonville
Out of a total of 723 students who are enrolled in schools in Simpsonville, 91 (12.6%) attend a private institution, while the remaining 632 (87.4%) are enrolled in public schools. The age group of 3 to 4 year olds has the highest likelihood of being enrolled in private schools, with 16 (39.0% in the age bracket) enrolled. Conversely, the age group of 20 to 24 year olds has the lowest likelihood of being enrolled in a private school, with 17 (100.0% in the age bracket) attending a public institution.
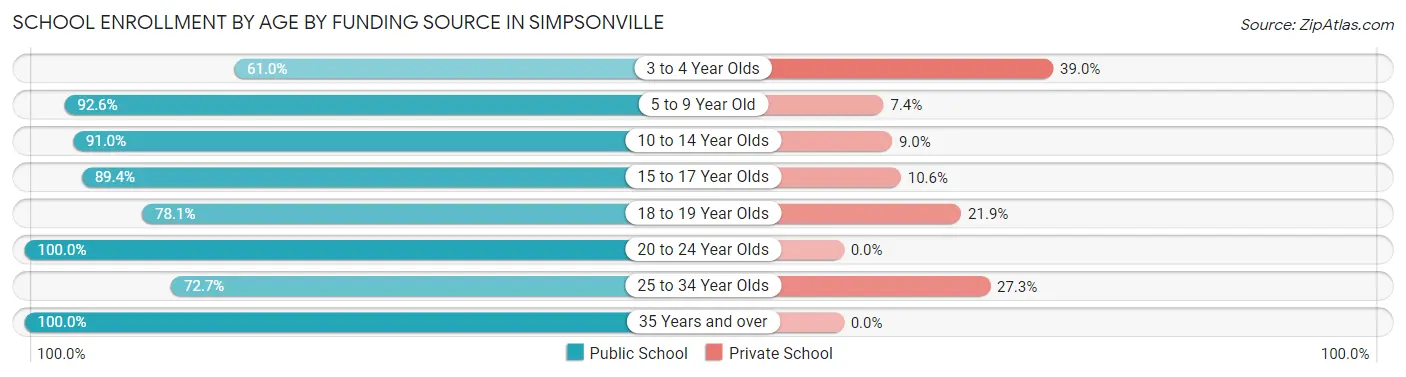
| Age Bracket | Public School | Private School |
| 3 to 4 Year Olds | 25 (61.0%) | 16 (39.0%) |
| 5 to 9 Year Old | 175 (92.6%) | 14 (7.4%) |
| 10 to 14 Year Olds | 182 (91.0%) | 18 (9.0%) |
| 15 to 17 Year Olds | 126 (89.4%) | 15 (10.6%) |
| 18 to 19 Year Olds | 25 (78.1%) | 7 (21.9%) |
| 20 to 24 Year Olds | 17 (100.0%) | 0 (0.0%) |
| 25 to 34 Year Olds | 56 (72.7%) | 21 (27.3%) |
| 35 Years and over | 26 (100.0%) | 0 (0.0%) |
| Total | 632 (87.4%) | 91 (12.6%) |
Educational Attainment by Field of Study in Simpsonville
Business (212 | 21.0%), science & technology (153 | 15.1%), education (131 | 13.0%), bio, nature & agricultural (82 | 8.1%), and arts & humanities (61 | 6.0%) are the most common fields of study among 1,010 individuals in Simpsonville who have obtained a bachelor's degree or higher.
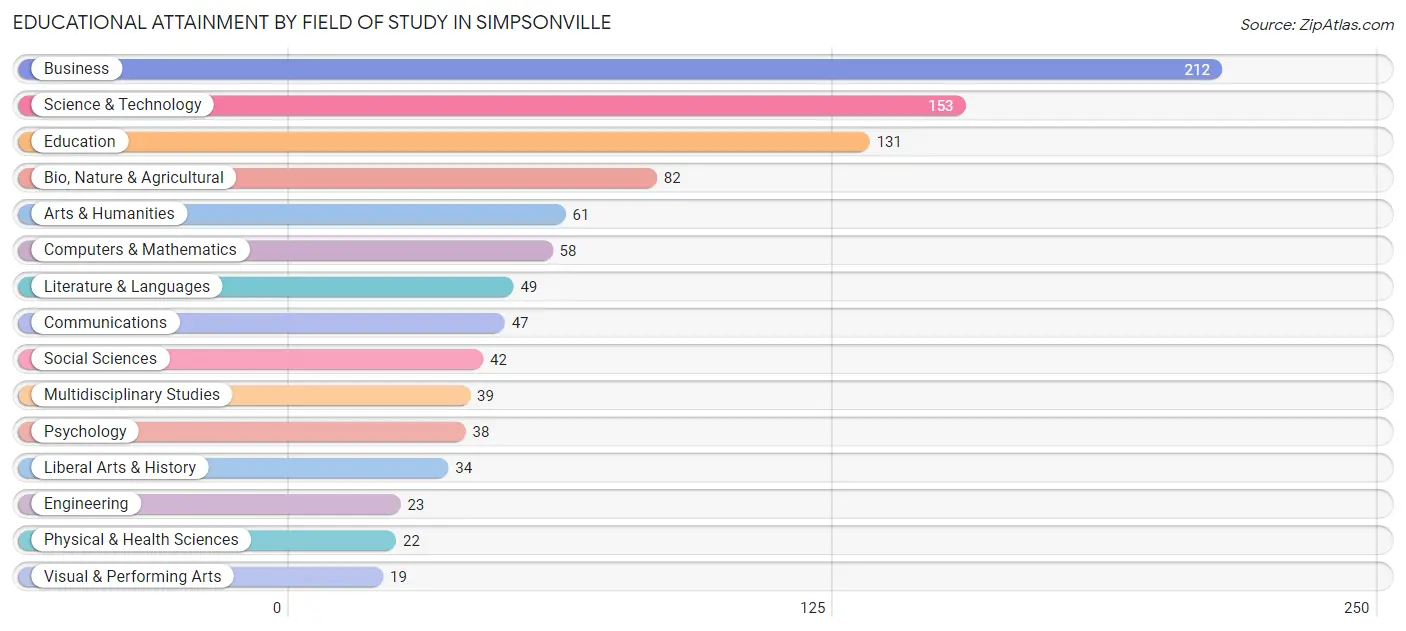
| Field of Study | # Graduates | % Graduates |
| Computers & Mathematics | 58 | 5.7% |
| Bio, Nature & Agricultural | 82 | 8.1% |
| Physical & Health Sciences | 22 | 2.2% |
| Psychology | 38 | 3.8% |
| Social Sciences | 42 | 4.2% |
| Engineering | 23 | 2.3% |
| Multidisciplinary Studies | 39 | 3.9% |
| Science & Technology | 153 | 15.1% |
| Business | 212 | 21.0% |
| Education | 131 | 13.0% |
| Literature & Languages | 49 | 4.9% |
| Liberal Arts & History | 34 | 3.4% |
| Visual & Performing Arts | 19 | 1.9% |
| Communications | 47 | 4.6% |
| Arts & Humanities | 61 | 6.0% |
| Total | 1,010 | 100.0% |
Transportation & Commute in Simpsonville
Vehicle Availability by Sex in Simpsonville
The most prevalent vehicle ownership categories in Simpsonville are males with 2 vehicles (330, accounting for 43.1%) and females with 2 vehicles (322, making up 43.9%).
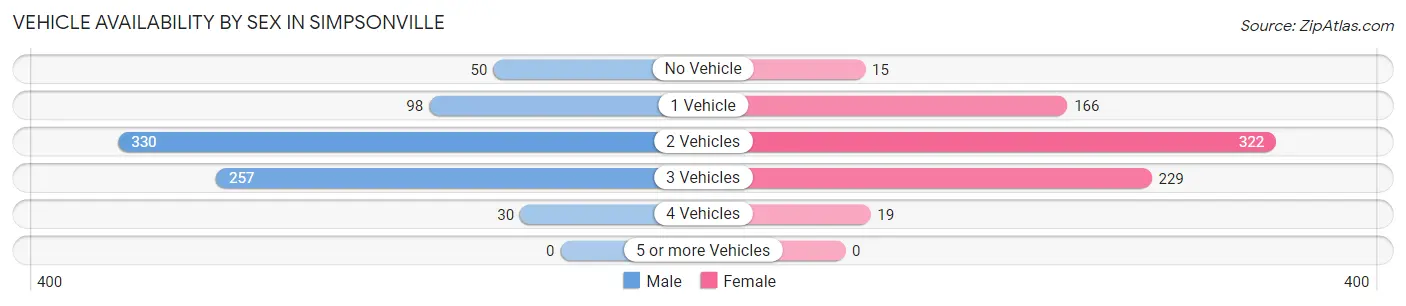
| Vehicles Available | Male | Female |
| No Vehicle | 50 (6.5%) | 15 (2.0%) |
| 1 Vehicle | 98 (12.8%) | 166 (22.1%) |
| 2 Vehicles | 330 (43.1%) | 322 (42.9%) |
| 3 Vehicles | 257 (33.6%) | 229 (30.5%) |
| 4 Vehicles | 30 (3.9%) | 19 (2.5%) |
| 5 or more Vehicles | 0 (0.0%) | 0 (0.0%) |
| Total | 765 (100.0%) | 751 (100.0%) |
Commute Time in Simpsonville
The most frequently occuring commute durations in Simpsonville are 30 to 34 minutes (294 commuters, 22.0%), 20 to 24 minutes (275 commuters, 20.6%), and 15 to 19 minutes (149 commuters, 11.2%).
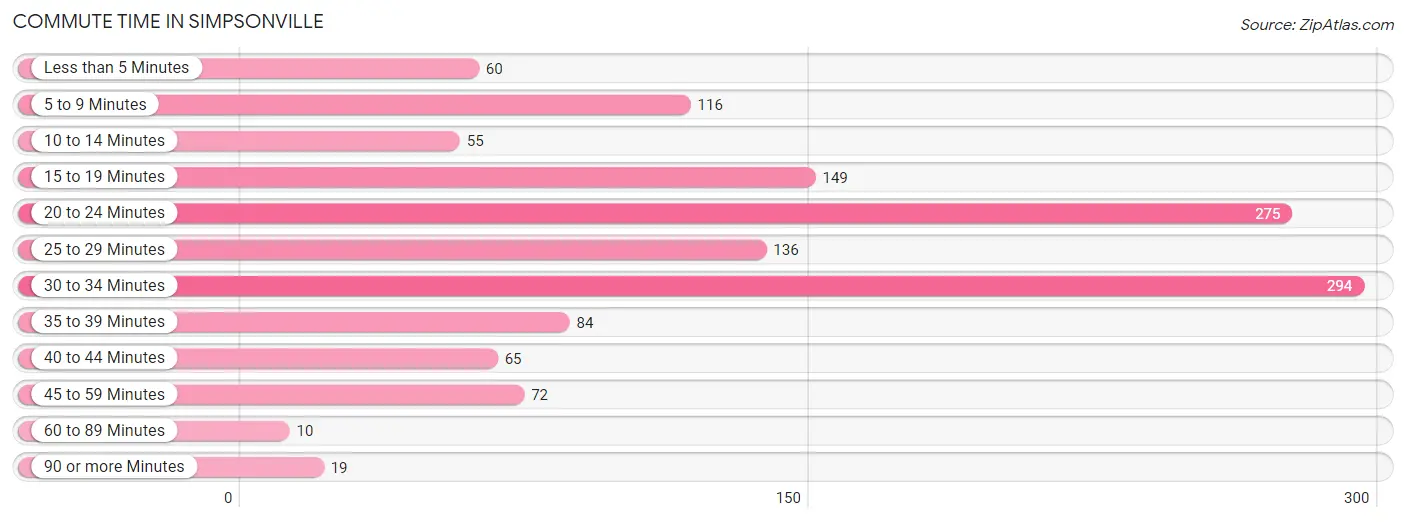
| Commute Time | # Commuters | % Commuters |
| Less than 5 Minutes | 60 | 4.5% |
| 5 to 9 Minutes | 116 | 8.7% |
| 10 to 14 Minutes | 55 | 4.1% |
| 15 to 19 Minutes | 149 | 11.2% |
| 20 to 24 Minutes | 275 | 20.6% |
| 25 to 29 Minutes | 136 | 10.2% |
| 30 to 34 Minutes | 294 | 22.0% |
| 35 to 39 Minutes | 84 | 6.3% |
| 40 to 44 Minutes | 65 | 4.9% |
| 45 to 59 Minutes | 72 | 5.4% |
| 60 to 89 Minutes | 10 | 0.7% |
| 90 or more Minutes | 19 | 1.4% |
Commute Time by Sex in Simpsonville
The most common commute times in Simpsonville are 30 to 34 minutes (182 commuters, 27.0%) for males and 20 to 24 minutes (144 commuters, 21.7%) for females.
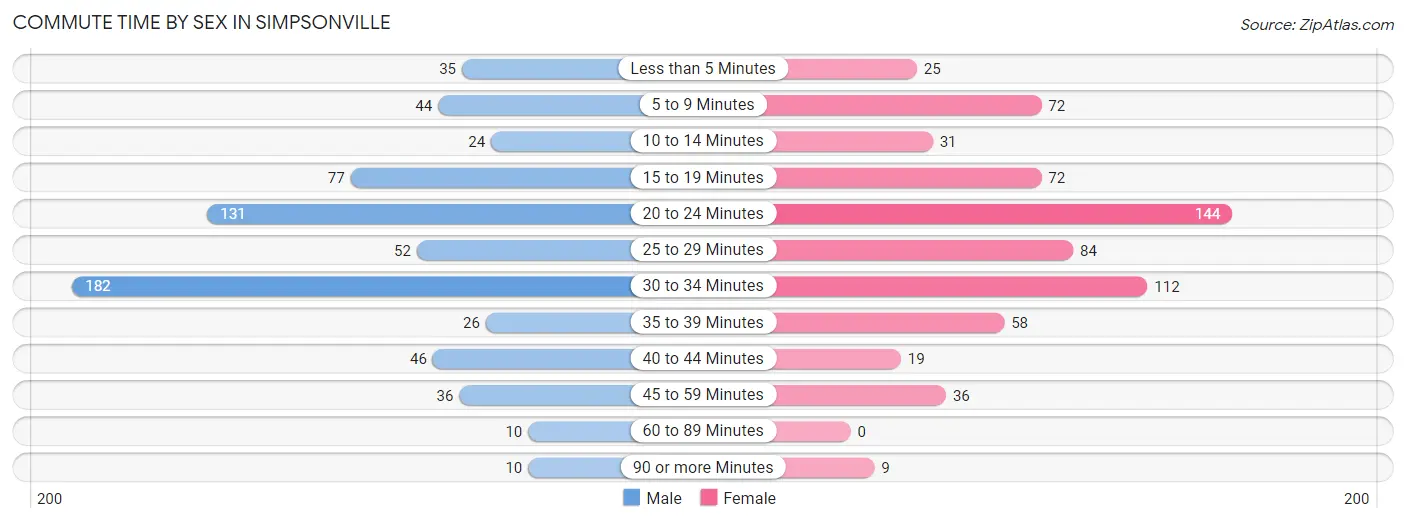
| Commute Time | Male | Female |
| Less than 5 Minutes | 35 (5.2%) | 25 (3.8%) |
| 5 to 9 Minutes | 44 (6.5%) | 72 (10.9%) |
| 10 to 14 Minutes | 24 (3.6%) | 31 (4.7%) |
| 15 to 19 Minutes | 77 (11.4%) | 72 (10.9%) |
| 20 to 24 Minutes | 131 (19.5%) | 144 (21.7%) |
| 25 to 29 Minutes | 52 (7.7%) | 84 (12.7%) |
| 30 to 34 Minutes | 182 (27.0%) | 112 (16.9%) |
| 35 to 39 Minutes | 26 (3.9%) | 58 (8.8%) |
| 40 to 44 Minutes | 46 (6.8%) | 19 (2.9%) |
| 45 to 59 Minutes | 36 (5.3%) | 36 (5.4%) |
| 60 to 89 Minutes | 10 (1.5%) | 0 (0.0%) |
| 90 or more Minutes | 10 (1.5%) | 9 (1.4%) |
Time of Departure to Work by Sex in Simpsonville
The most frequent times of departure to work in Simpsonville are 7:00 AM to 7:29 AM (165, 24.5%) for males and 7:30 AM to 7:59 AM (132, 19.9%) for females.
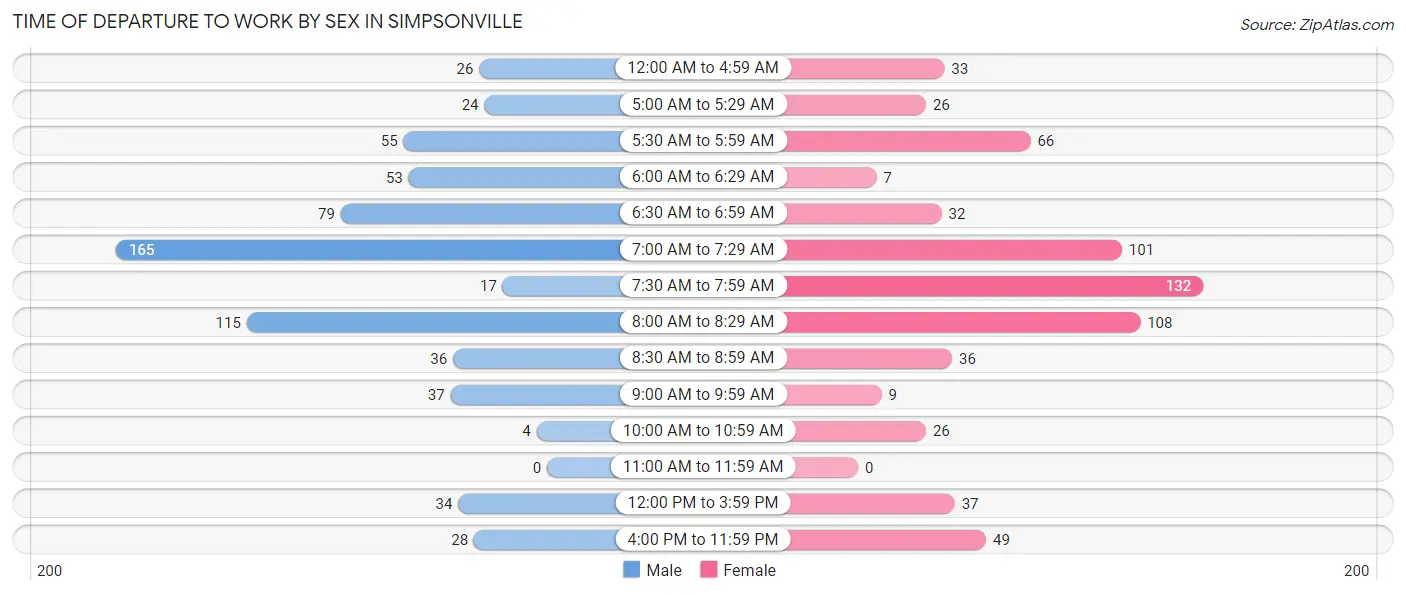
| Time of Departure | Male | Female |
| 12:00 AM to 4:59 AM | 26 (3.9%) | 33 (5.0%) |
| 5:00 AM to 5:29 AM | 24 (3.6%) | 26 (3.9%) |
| 5:30 AM to 5:59 AM | 55 (8.2%) | 66 (10.0%) |
| 6:00 AM to 6:29 AM | 53 (7.9%) | 7 (1.1%) |
| 6:30 AM to 6:59 AM | 79 (11.7%) | 32 (4.8%) |
| 7:00 AM to 7:29 AM | 165 (24.5%) | 101 (15.3%) |
| 7:30 AM to 7:59 AM | 17 (2.5%) | 132 (19.9%) |
| 8:00 AM to 8:29 AM | 115 (17.1%) | 108 (16.3%) |
| 8:30 AM to 8:59 AM | 36 (5.3%) | 36 (5.4%) |
| 9:00 AM to 9:59 AM | 37 (5.5%) | 9 (1.4%) |
| 10:00 AM to 10:59 AM | 4 (0.6%) | 26 (3.9%) |
| 11:00 AM to 11:59 AM | 0 (0.0%) | 0 (0.0%) |
| 12:00 PM to 3:59 PM | 34 (5.1%) | 37 (5.6%) |
| 4:00 PM to 11:59 PM | 28 (4.2%) | 49 (7.4%) |
| Total | 673 (100.0%) | 662 (100.0%) |
Housing Occupancy in Simpsonville
Occupancy by Ownership in Simpsonville
Of the total 1,182 dwellings in Simpsonville, owner-occupied units account for 980 (82.9%), while renter-occupied units make up 202 (17.1%).
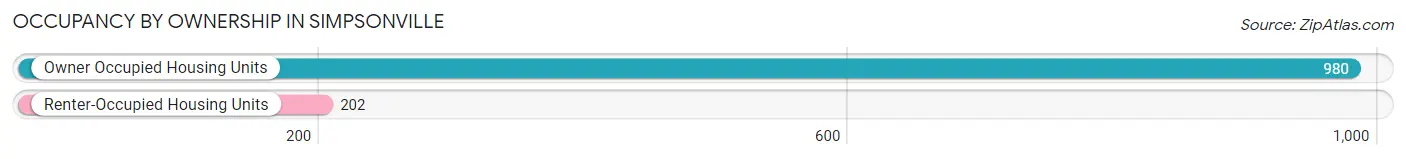
| Occupancy | # Housing Units | % Housing Units |
| Owner Occupied Housing Units | 980 | 82.9% |
| Renter-Occupied Housing Units | 202 | 17.1% |
| Total Occupied Housing Units | 1,182 | 100.0% |
Occupancy by Household Size in Simpsonville
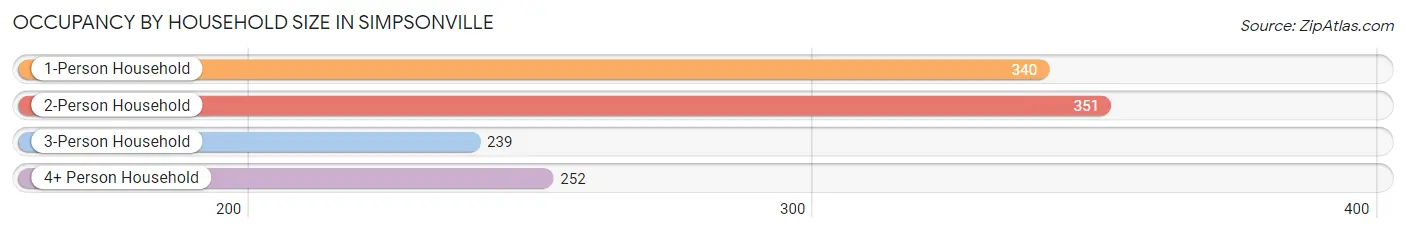
| Household Size | # Housing Units | % Housing Units |
| 1-Person Household | 340 | 28.8% |
| 2-Person Household | 351 | 29.7% |
| 3-Person Household | 239 | 20.2% |
| 4+ Person Household | 252 | 21.3% |
| Total Housing Units | 1,182 | 100.0% |
Occupancy by Ownership by Household Size in Simpsonville
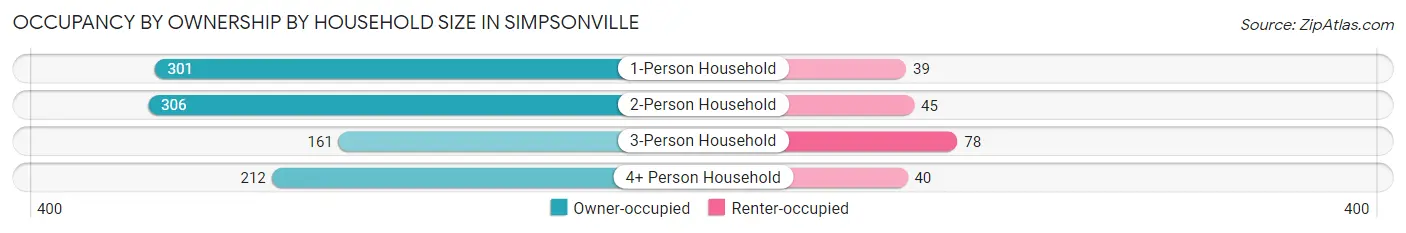
| Household Size | Owner-occupied | Renter-occupied |
| 1-Person Household | 301 (88.5%) | 39 (11.5%) |
| 2-Person Household | 306 (87.2%) | 45 (12.8%) |
| 3-Person Household | 161 (67.4%) | 78 (32.6%) |
| 4+ Person Household | 212 (84.1%) | 40 (15.9%) |
| Total Housing Units | 980 (82.9%) | 202 (17.1%) |
Occupancy by Educational Attainment in Simpsonville
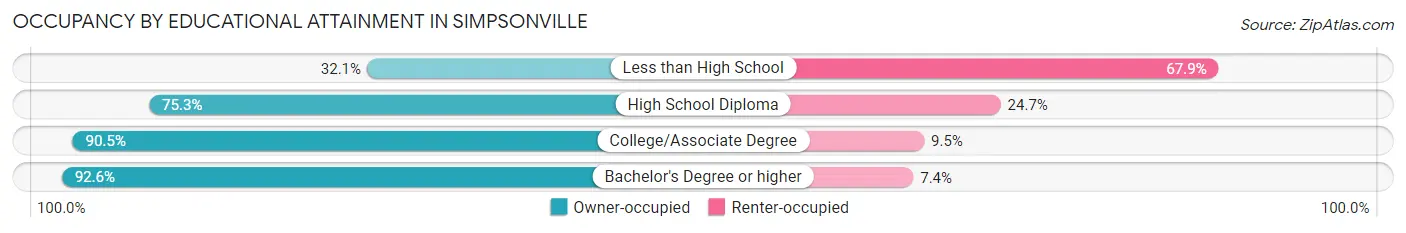
| Household Size | Owner-occupied | Renter-occupied |
| Less than High School | 36 (32.1%) | 76 (67.9%) |
| High School Diploma | 177 (75.3%) | 58 (24.7%) |
| College/Associate Degree | 276 (90.5%) | 29 (9.5%) |
| Bachelor's Degree or higher | 491 (92.6%) | 39 (7.4%) |
Occupancy by Age of Householder in Simpsonville
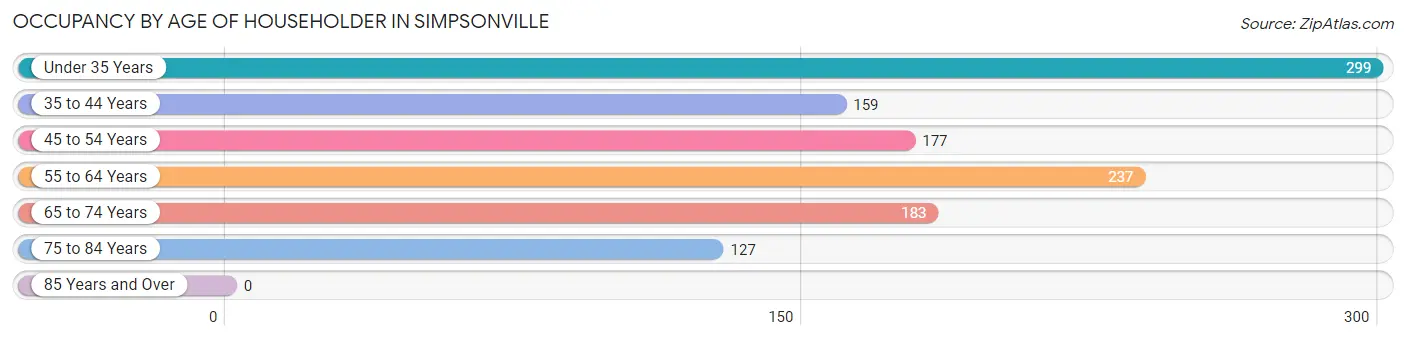
| Age Bracket | # Households | % Households |
| Under 35 Years | 299 | 25.3% |
| 35 to 44 Years | 159 | 13.5% |
| 45 to 54 Years | 177 | 15.0% |
| 55 to 64 Years | 237 | 20.1% |
| 65 to 74 Years | 183 | 15.5% |
| 75 to 84 Years | 127 | 10.7% |
| 85 Years and Over | 0 | 0.0% |
| Total | 1,182 | 100.0% |
Housing Finances in Simpsonville
Median Income by Occupancy in Simpsonville
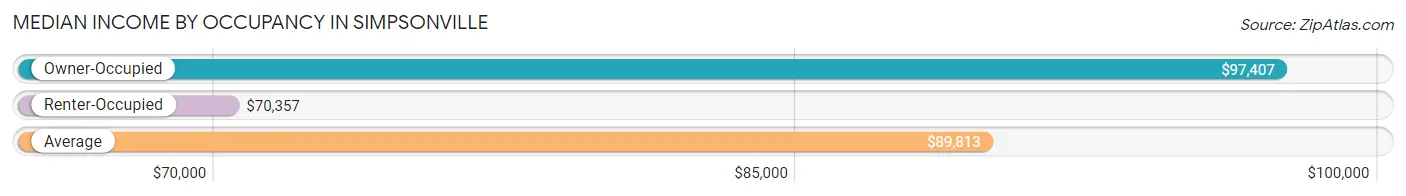
| Occupancy Type | # Households | Median Income |
| Owner-Occupied | 980 (82.9%) | $97,407 |
| Renter-Occupied | 202 (17.1%) | $70,357 |
| Average | 1,182 (100.0%) | $89,813 |
Occupancy by Householder Income Bracket in Simpsonville
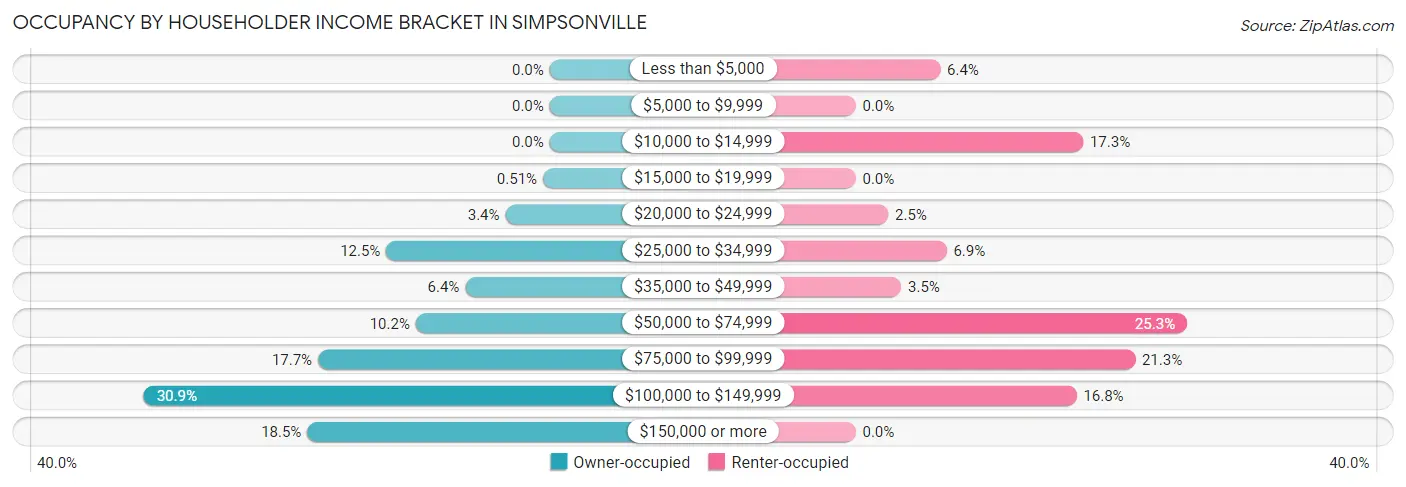
| Income Bracket | Owner-occupied | Renter-occupied |
| Less than $5,000 | 0 (0.0%) | 13 (6.4%) |
| $5,000 to $9,999 | 0 (0.0%) | 0 (0.0%) |
| $10,000 to $14,999 | 0 (0.0%) | 35 (17.3%) |
| $15,000 to $19,999 | 5 (0.5%) | 0 (0.0%) |
| $20,000 to $24,999 | 33 (3.4%) | 5 (2.5%) |
| $25,000 to $34,999 | 122 (12.4%) | 14 (6.9%) |
| $35,000 to $49,999 | 63 (6.4%) | 7 (3.5%) |
| $50,000 to $74,999 | 100 (10.2%) | 51 (25.3%) |
| $75,000 to $99,999 | 173 (17.6%) | 43 (21.3%) |
| $100,000 to $149,999 | 303 (30.9%) | 34 (16.8%) |
| $150,000 or more | 181 (18.5%) | 0 (0.0%) |
| Total | 980 (100.0%) | 202 (100.0%) |
Monthly Housing Cost Tiers in Simpsonville
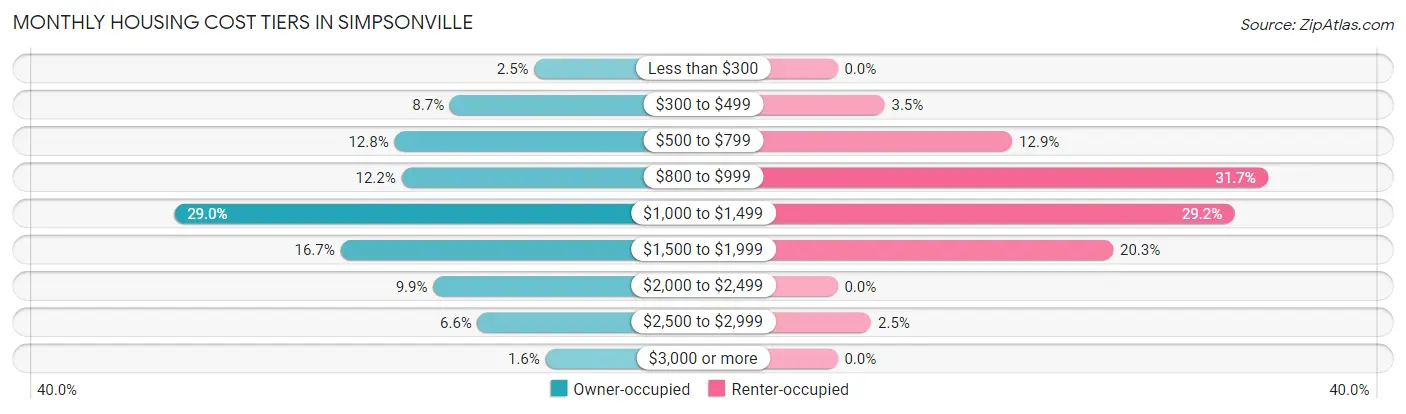
| Monthly Cost | Owner-occupied | Renter-occupied |
| Less than $300 | 24 (2.5%) | 0 (0.0%) |
| $300 to $499 | 85 (8.7%) | 7 (3.5%) |
| $500 to $799 | 125 (12.8%) | 26 (12.9%) |
| $800 to $999 | 120 (12.2%) | 64 (31.7%) |
| $1,000 to $1,499 | 284 (29.0%) | 59 (29.2%) |
| $1,500 to $1,999 | 164 (16.7%) | 41 (20.3%) |
| $2,000 to $2,499 | 97 (9.9%) | 0 (0.0%) |
| $2,500 to $2,999 | 65 (6.6%) | 5 (2.5%) |
| $3,000 or more | 16 (1.6%) | 0 (0.0%) |
| Total | 980 (100.0%) | 202 (100.0%) |
Physical Housing Characteristics in Simpsonville
Housing Structures in Simpsonville
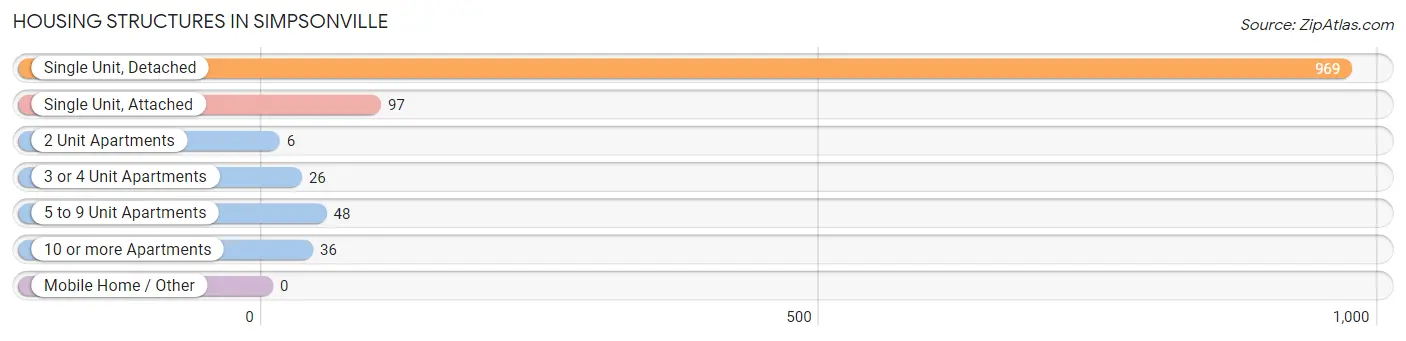
| Structure Type | # Housing Units | % Housing Units |
| Single Unit, Detached | 969 | 82.0% |
| Single Unit, Attached | 97 | 8.2% |
| 2 Unit Apartments | 6 | 0.5% |
| 3 or 4 Unit Apartments | 26 | 2.2% |
| 5 to 9 Unit Apartments | 48 | 4.1% |
| 10 or more Apartments | 36 | 3.0% |
| Mobile Home / Other | 0 | 0.0% |
| Total | 1,182 | 100.0% |
Housing Structures by Occupancy in Simpsonville
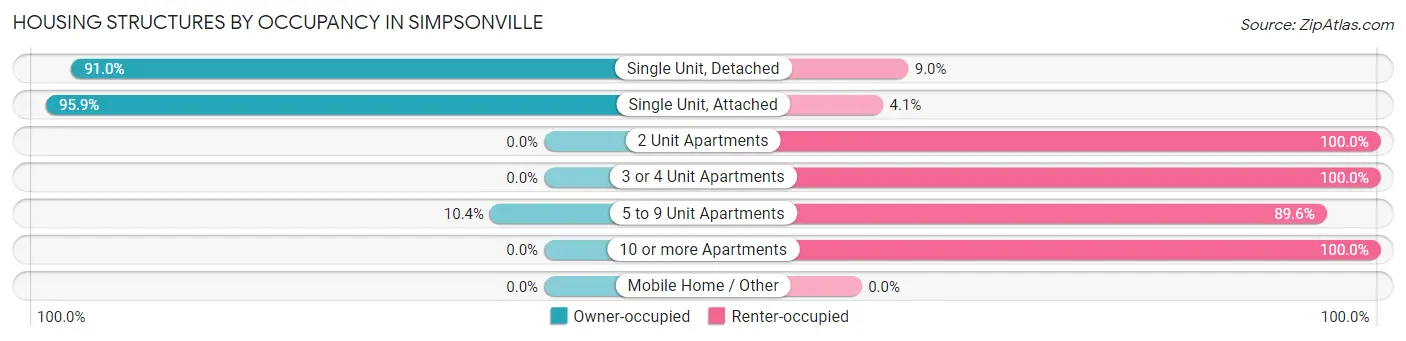
| Structure Type | Owner-occupied | Renter-occupied |
| Single Unit, Detached | 882 (91.0%) | 87 (9.0%) |
| Single Unit, Attached | 93 (95.9%) | 4 (4.1%) |
| 2 Unit Apartments | 0 (0.0%) | 6 (100.0%) |
| 3 or 4 Unit Apartments | 0 (0.0%) | 26 (100.0%) |
| 5 to 9 Unit Apartments | 5 (10.4%) | 43 (89.6%) |
| 10 or more Apartments | 0 (0.0%) | 36 (100.0%) |
| Mobile Home / Other | 0 (0.0%) | 0 (0.0%) |
| Total | 980 (82.9%) | 202 (17.1%) |
Housing Structures by Number of Rooms in Simpsonville
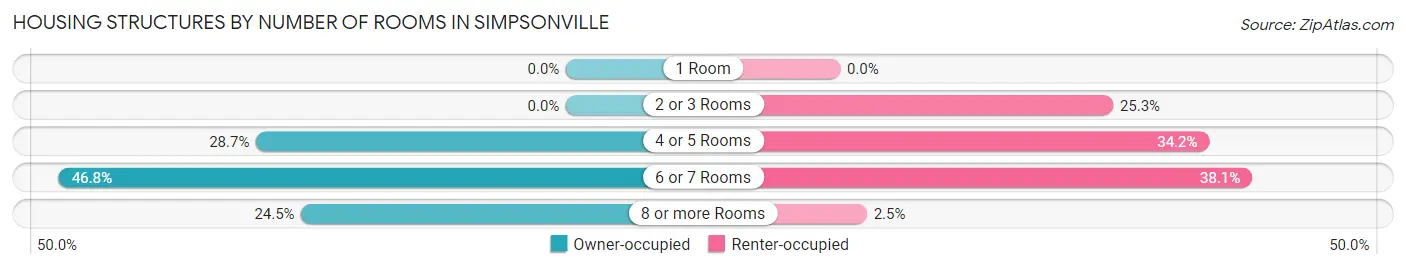
| Number of Rooms | Owner-occupied | Renter-occupied |
| 1 Room | 0 (0.0%) | 0 (0.0%) |
| 2 or 3 Rooms | 0 (0.0%) | 51 (25.3%) |
| 4 or 5 Rooms | 281 (28.7%) | 69 (34.2%) |
| 6 or 7 Rooms | 459 (46.8%) | 77 (38.1%) |
| 8 or more Rooms | 240 (24.5%) | 5 (2.5%) |
| Total | 980 (100.0%) | 202 (100.0%) |
Housing Structure by Heating Type in Simpsonville
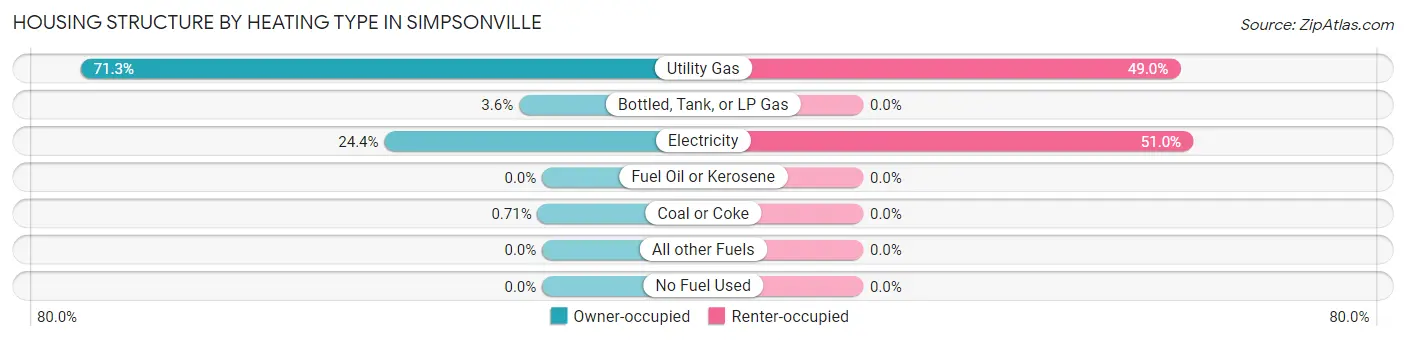
| Heating Type | Owner-occupied | Renter-occupied |
| Utility Gas | 699 (71.3%) | 99 (49.0%) |
| Bottled, Tank, or LP Gas | 35 (3.6%) | 0 (0.0%) |
| Electricity | 239 (24.4%) | 103 (51.0%) |
| Fuel Oil or Kerosene | 0 (0.0%) | 0 (0.0%) |
| Coal or Coke | 7 (0.7%) | 0 (0.0%) |
| All other Fuels | 0 (0.0%) | 0 (0.0%) |
| No Fuel Used | 0 (0.0%) | 0 (0.0%) |
| Total | 980 (100.0%) | 202 (100.0%) |
Household Vehicle Usage in Simpsonville
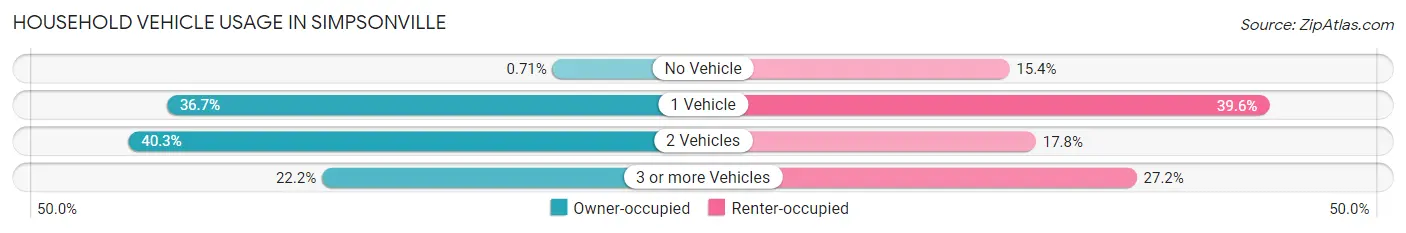
| Vehicles per Household | Owner-occupied | Renter-occupied |
| No Vehicle | 7 (0.7%) | 31 (15.3%) |
| 1 Vehicle | 360 (36.7%) | 80 (39.6%) |
| 2 Vehicles | 395 (40.3%) | 36 (17.8%) |
| 3 or more Vehicles | 218 (22.2%) | 55 (27.2%) |
| Total | 980 (100.0%) | 202 (100.0%) |
Real Estate & Mortgages in Simpsonville
Real Estate and Mortgage Overview in Simpsonville
| Characteristic | Without Mortgage | With Mortgage |
| Housing Units | 239 | 741 |
| Median Property Value | $229,400 | $260,500 |
| Median Household Income | $70,625 | $156 |
| Monthly Housing Costs | $524 | $16 |
| Real Estate Taxes | $2,280 | $7 |
Property Value by Mortgage Status in Simpsonville
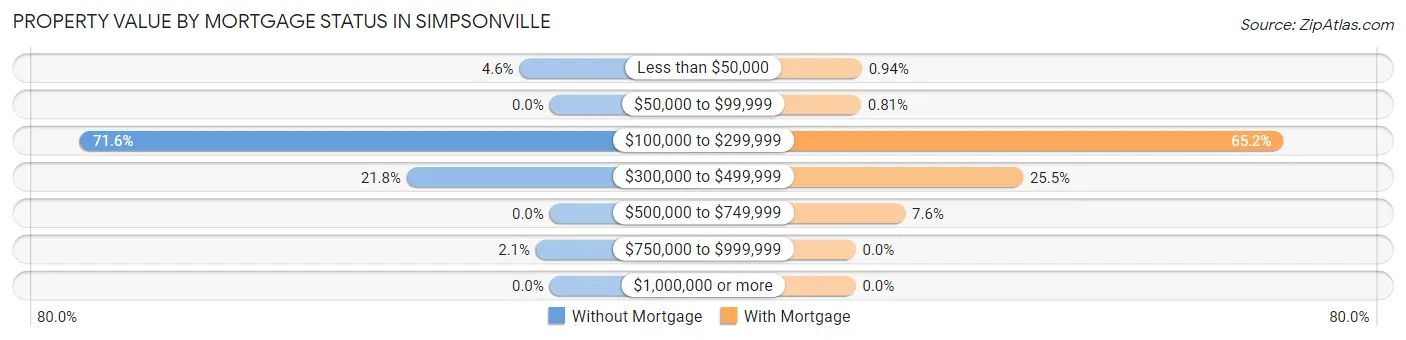
| Property Value | Without Mortgage | With Mortgage |
| Less than $50,000 | 11 (4.6%) | 7 (0.9%) |
| $50,000 to $99,999 | 0 (0.0%) | 6 (0.8%) |
| $100,000 to $299,999 | 171 (71.6%) | 483 (65.2%) |
| $300,000 to $499,999 | 52 (21.8%) | 189 (25.5%) |
| $500,000 to $749,999 | 0 (0.0%) | 56 (7.6%) |
| $750,000 to $999,999 | 5 (2.1%) | 0 (0.0%) |
| $1,000,000 or more | 0 (0.0%) | 0 (0.0%) |
| Total | 239 (100.0%) | 741 (100.0%) |
Household Income by Mortgage Status in Simpsonville
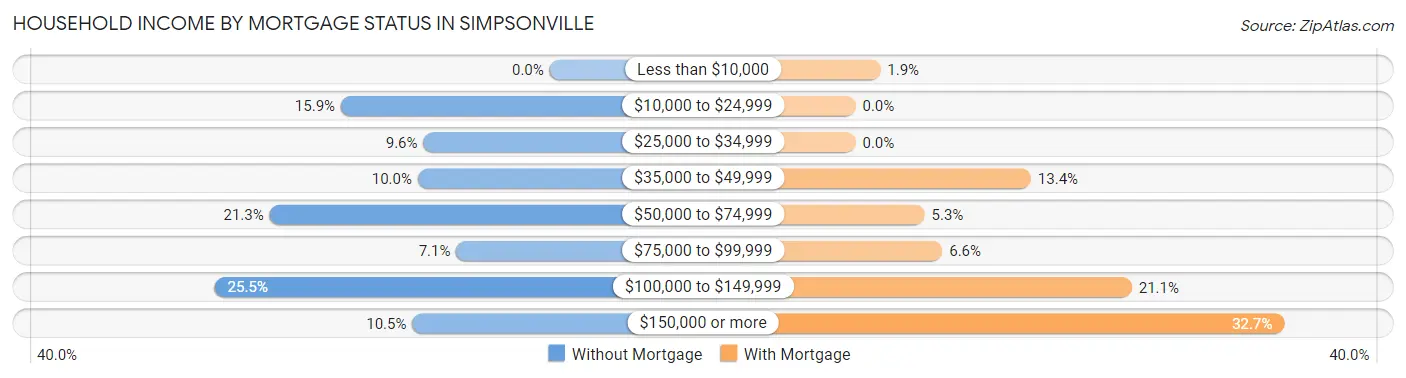
| Household Income | Without Mortgage | With Mortgage |
| Less than $10,000 | 0 (0.0%) | 14 (1.9%) |
| $10,000 to $24,999 | 38 (15.9%) | 0 (0.0%) |
| $25,000 to $34,999 | 23 (9.6%) | 0 (0.0%) |
| $35,000 to $49,999 | 24 (10.0%) | 99 (13.4%) |
| $50,000 to $74,999 | 51 (21.3%) | 39 (5.3%) |
| $75,000 to $99,999 | 17 (7.1%) | 49 (6.6%) |
| $100,000 to $149,999 | 61 (25.5%) | 156 (21.0%) |
| $150,000 or more | 25 (10.5%) | 242 (32.7%) |
| Total | 239 (100.0%) | 741 (100.0%) |
Property Value to Household Income Ratio in Simpsonville
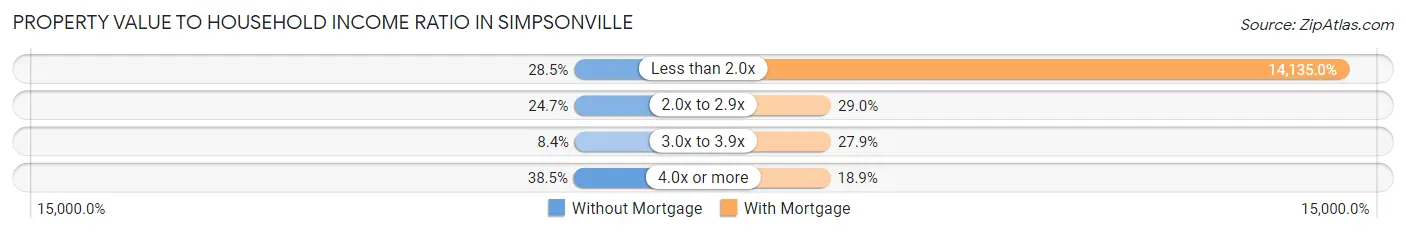
| Value-to-Income Ratio | Without Mortgage | With Mortgage |
| Less than 2.0x | 68 (28.4%) | 104,740 (14,135.0%) |
| 2.0x to 2.9x | 59 (24.7%) | 215 (29.0%) |
| 3.0x to 3.9x | 20 (8.4%) | 207 (27.9%) |
| 4.0x or more | 92 (38.5%) | 140 (18.9%) |
| Total | 239 (100.0%) | 741 (100.0%) |
Real Estate Taxes by Mortgage Status in Simpsonville
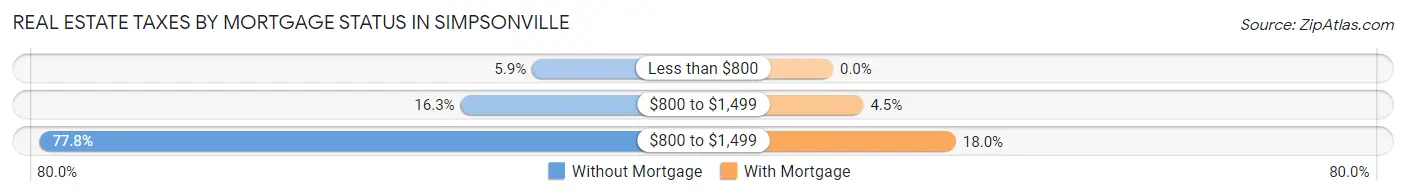
| Property Taxes | Without Mortgage | With Mortgage |
| Less than $800 | 14 (5.9%) | 0 (0.0%) |
| $800 to $1,499 | 39 (16.3%) | 33 (4.4%) |
| $800 to $1,499 | 186 (77.8%) | 133 (17.9%) |
| Total | 239 (100.0%) | 741 (100.0%) |
Health & Disability in Simpsonville
Health Insurance Coverage by Age in Simpsonville
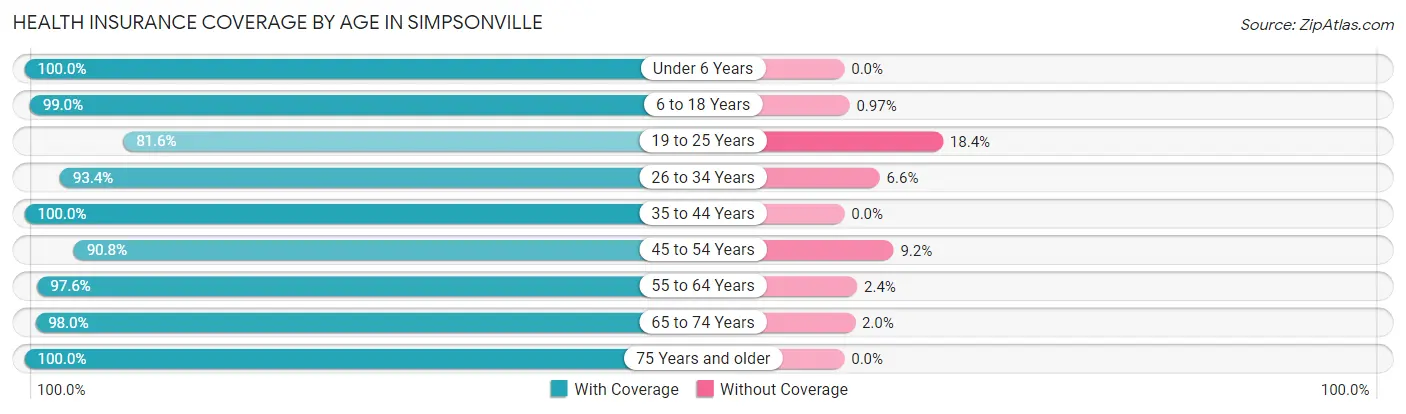
| Age Bracket | With Coverage | Without Coverage |
| Under 6 Years | 270 (100.0%) | 0 (0.0%) |
| 6 to 18 Years | 512 (99.0%) | 5 (1.0%) |
| 19 to 25 Years | 142 (81.6%) | 32 (18.4%) |
| 26 to 34 Years | 482 (93.4%) | 34 (6.6%) |
| 35 to 44 Years | 278 (100.0%) | 0 (0.0%) |
| 45 to 54 Years | 317 (90.8%) | 32 (9.2%) |
| 55 to 64 Years | 408 (97.6%) | 10 (2.4%) |
| 65 to 74 Years | 296 (98.0%) | 6 (2.0%) |
| 75 Years and older | 148 (100.0%) | 0 (0.0%) |
| Total | 2,853 (96.0%) | 119 (4.0%) |
Health Insurance Coverage by Citizenship Status in Simpsonville
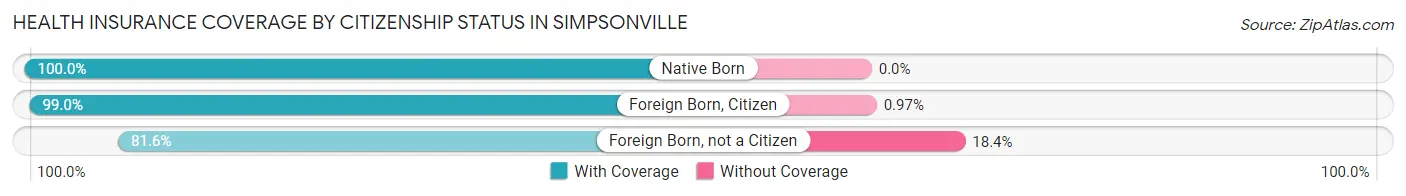
| Citizenship Status | With Coverage | Without Coverage |
| Native Born | 270 (100.0%) | 0 (0.0%) |
| Foreign Born, Citizen | 512 (99.0%) | 5 (1.0%) |
| Foreign Born, not a Citizen | 142 (81.6%) | 32 (18.4%) |
Health Insurance Coverage by Household Income in Simpsonville
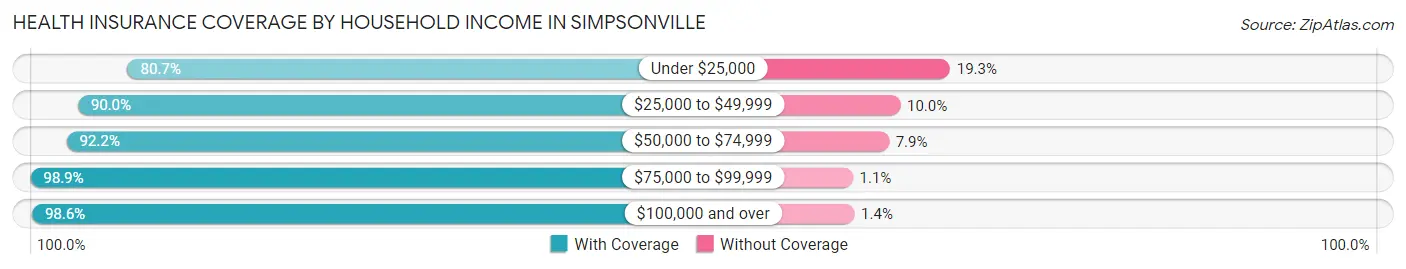
| Household Income | With Coverage | Without Coverage |
| Under $25,000 | 138 (80.7%) | 33 (19.3%) |
| $25,000 to $49,999 | 289 (90.0%) | 32 (10.0%) |
| $50,000 to $74,999 | 305 (92.1%) | 26 (7.9%) |
| $75,000 to $99,999 | 552 (98.9%) | 6 (1.1%) |
| $100,000 and over | 1,569 (98.6%) | 22 (1.4%) |
Public vs Private Health Insurance Coverage by Age in Simpsonville
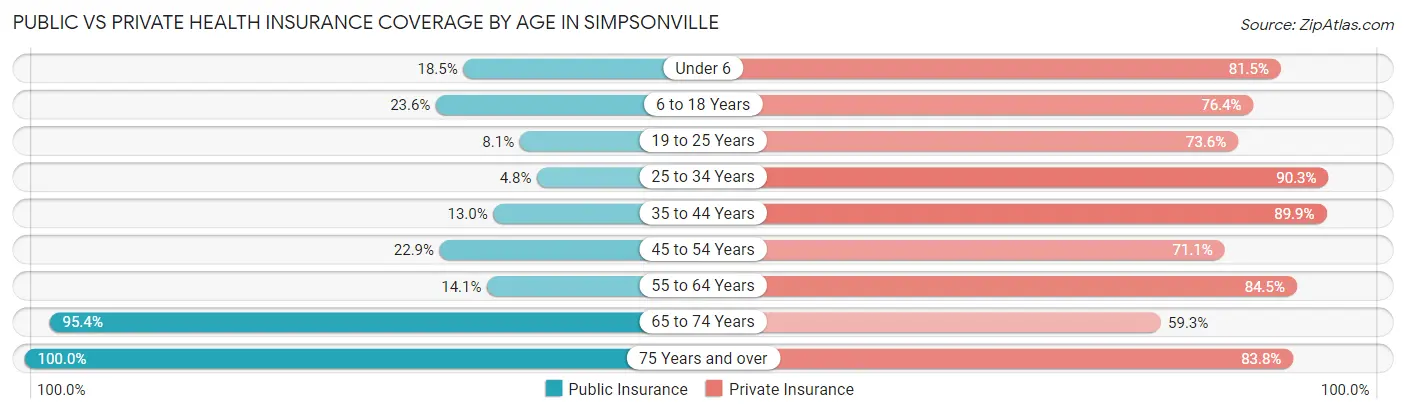
| Age Bracket | Public Insurance | Private Insurance |
| Under 6 | 50 (18.5%) | 220 (81.5%) |
| 6 to 18 Years | 122 (23.6%) | 395 (76.4%) |
| 19 to 25 Years | 14 (8.1%) | 128 (73.6%) |
| 25 to 34 Years | 25 (4.8%) | 466 (90.3%) |
| 35 to 44 Years | 36 (13.0%) | 250 (89.9%) |
| 45 to 54 Years | 80 (22.9%) | 248 (71.1%) |
| 55 to 64 Years | 59 (14.1%) | 353 (84.5%) |
| 65 to 74 Years | 288 (95.4%) | 179 (59.3%) |
| 75 Years and over | 148 (100.0%) | 124 (83.8%) |
| Total | 822 (27.7%) | 2,363 (79.5%) |
Disability Status by Sex by Age in Simpsonville
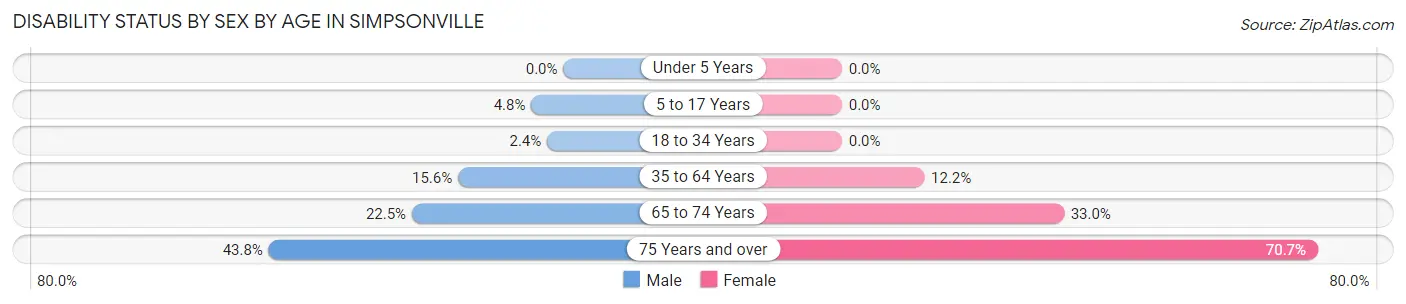
| Age Bracket | Male | Female |
| Under 5 Years | 0 (0.0%) | 0 (0.0%) |
| 5 to 17 Years | 14 (4.8%) | 0 (0.0%) |
| 18 to 34 Years | 9 (2.4%) | 0 (0.0%) |
| 35 to 64 Years | 79 (15.6%) | 66 (12.2%) |
| 65 to 74 Years | 29 (22.5%) | 57 (33.0%) |
| 75 Years and over | 14 (43.8%) | 82 (70.7%) |
Disability Class by Sex by Age in Simpsonville
Disability Class: Hearing Difficulty
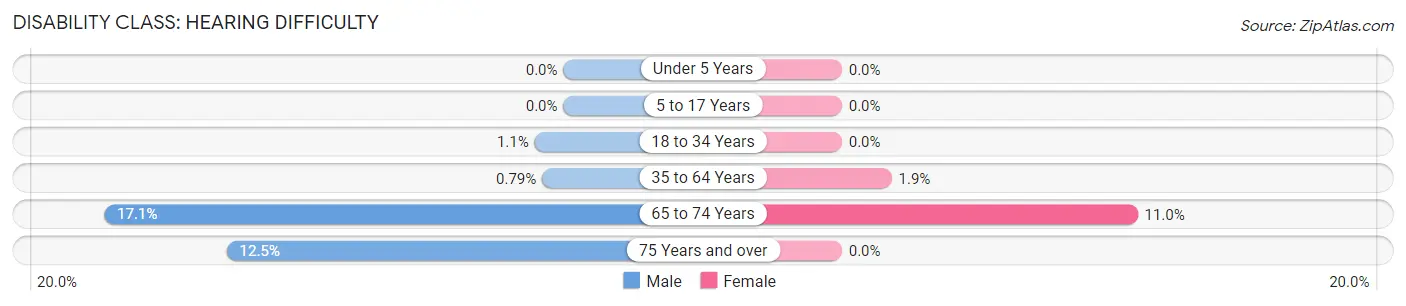
| Age Bracket | Male | Female |
| Under 5 Years | 0 (0.0%) | 0 (0.0%) |
| 5 to 17 Years | 0 (0.0%) | 0 (0.0%) |
| 18 to 34 Years | 4 (1.1%) | 0 (0.0%) |
| 35 to 64 Years | 4 (0.8%) | 10 (1.8%) |
| 65 to 74 Years | 22 (17.1%) | 19 (11.0%) |
| 75 Years and over | 4 (12.5%) | 0 (0.0%) |
Disability Class: Vision Difficulty
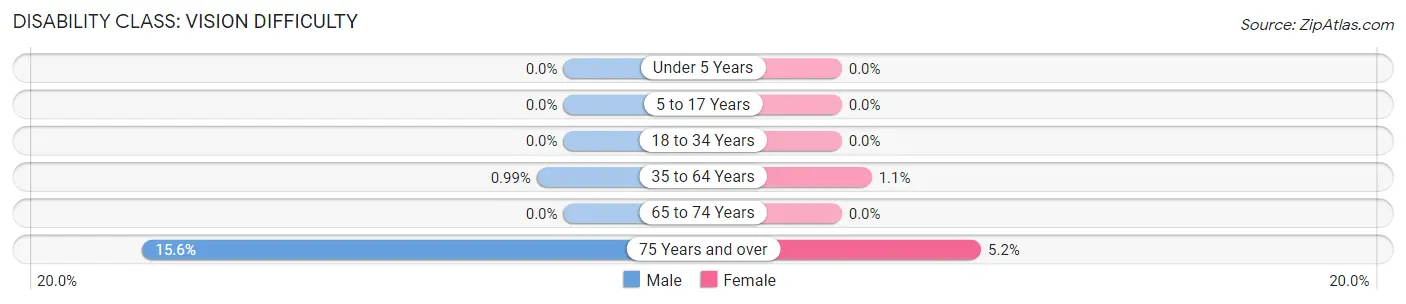
| Age Bracket | Male | Female |
| Under 5 Years | 0 (0.0%) | 0 (0.0%) |
| 5 to 17 Years | 0 (0.0%) | 0 (0.0%) |
| 18 to 34 Years | 0 (0.0%) | 0 (0.0%) |
| 35 to 64 Years | 5 (1.0%) | 6 (1.1%) |
| 65 to 74 Years | 0 (0.0%) | 0 (0.0%) |
| 75 Years and over | 5 (15.6%) | 6 (5.2%) |
Disability Class: Cognitive Difficulty
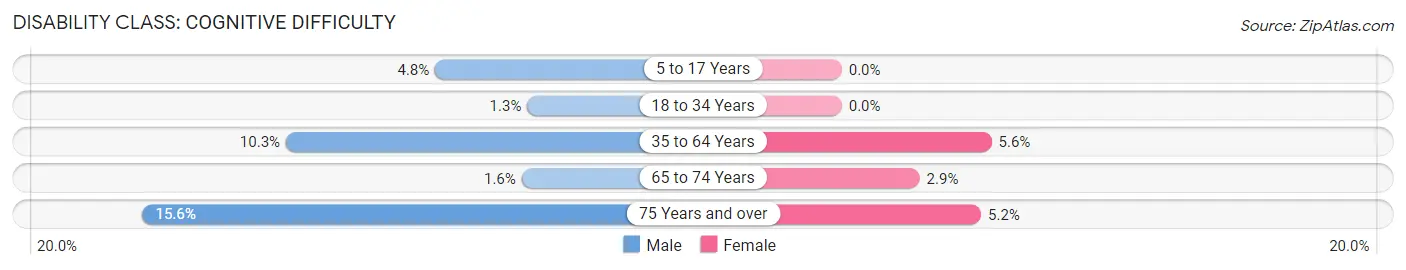
| Age Bracket | Male | Female |
| 5 to 17 Years | 14 (4.8%) | 0 (0.0%) |
| 18 to 34 Years | 5 (1.3%) | 0 (0.0%) |
| 35 to 64 Years | 52 (10.3%) | 30 (5.6%) |
| 65 to 74 Years | 2 (1.5%) | 5 (2.9%) |
| 75 Years and over | 5 (15.6%) | 6 (5.2%) |
Disability Class: Ambulatory Difficulty
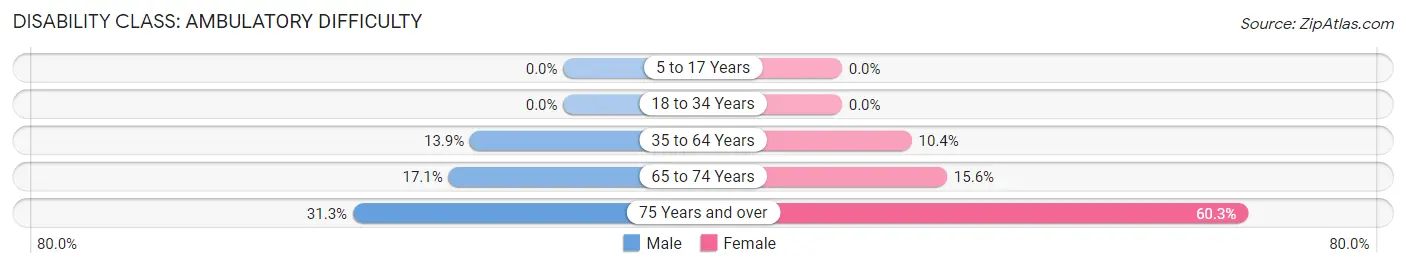
| Age Bracket | Male | Female |
| 5 to 17 Years | 0 (0.0%) | 0 (0.0%) |
| 18 to 34 Years | 0 (0.0%) | 0 (0.0%) |
| 35 to 64 Years | 70 (13.9%) | 56 (10.4%) |
| 65 to 74 Years | 22 (17.1%) | 27 (15.6%) |
| 75 Years and over | 10 (31.2%) | 70 (60.3%) |
Disability Class: Self-Care Difficulty
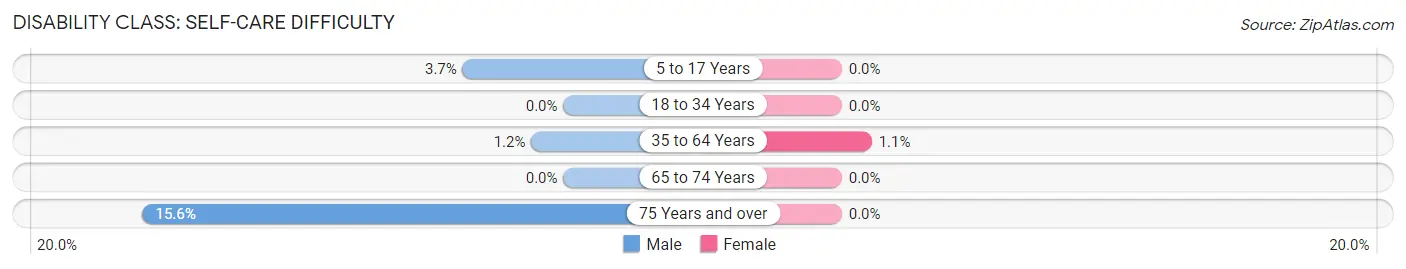
| Age Bracket | Male | Female |
| 5 to 17 Years | 11 (3.7%) | 0 (0.0%) |
| 18 to 34 Years | 0 (0.0%) | 0 (0.0%) |
| 35 to 64 Years | 6 (1.2%) | 6 (1.1%) |
| 65 to 74 Years | 0 (0.0%) | 0 (0.0%) |
| 75 Years and over | 5 (15.6%) | 0 (0.0%) |
Technology Access in Simpsonville
Computing Device Access in Simpsonville
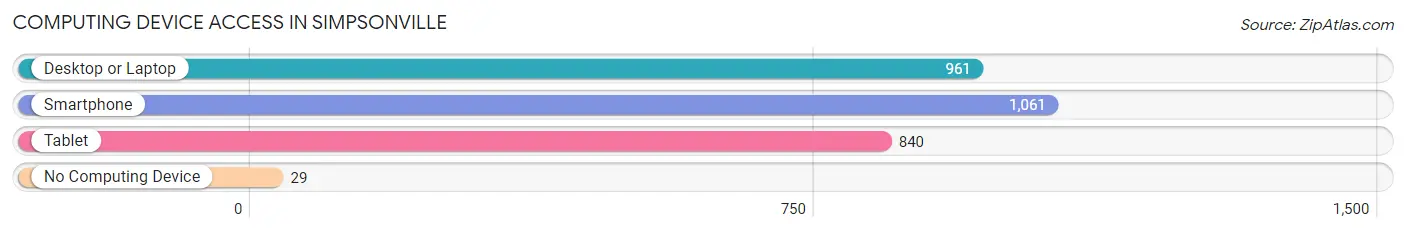
| Device Type | # Households | % Households |
| Desktop or Laptop | 961 | 81.3% |
| Smartphone | 1,061 | 89.8% |
| Tablet | 840 | 71.1% |
| No Computing Device | 29 | 2.5% |
| Total | 1,182 | 100.0% |
Internet Access in Simpsonville
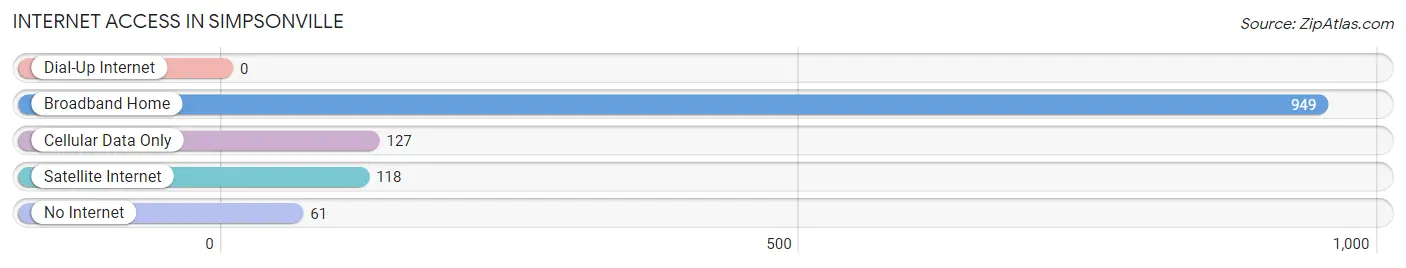
| Internet Type | # Households | % Households |
| Dial-Up Internet | 0 | 0.0% |
| Broadband Home | 949 | 80.3% |
| Cellular Data Only | 127 | 10.7% |
| Satellite Internet | 118 | 10.0% |
| No Internet | 61 | 5.2% |
| Total | 1,182 | 100.0% |
Simpsonville Summary
Simpsonville, Kentucky is a small city located in Shelby County, Kentucky. It is situated in the rolling hills of the Bluegrass region of the state, and is part of the Louisville metropolitan area. The city has a population of approximately 8,000 people, and is known for its small-town charm and friendly atmosphere.
History
Simpsonville was founded in 1817 by William Simpson, a Revolutionary War veteran. He named the town after himself, and it quickly grew into a thriving community. The town was incorporated in 1867, and the first post office was established in 1868.
In the late 19th century, Simpsonville was a major stop on the Louisville and Nashville Railroad. The railroad brought new businesses and industry to the area, and the town grew rapidly. By the early 20th century, Simpsonville had become a bustling small city.
Geography
Simpsonville is located in the rolling hills of the Bluegrass region of Kentucky. The city is situated in Shelby County, and is part of the Louisville metropolitan area. The city is located approximately 25 miles southeast of Louisville, and is bordered by Shelbyville to the north, Eminence to the east, and Simpsonville to the south.
The city has a total area of 4.2 square miles, all of which is land. The terrain is mostly flat, with some rolling hills. The climate is humid subtropical, with hot summers and mild winters.
Economy
Simpsonville’s economy is largely based on agriculture and manufacturing. The city is home to several large farms, as well as several small businesses. The city is also home to several manufacturing plants, including a paper mill and a furniture factory.
The city is also home to several retail stores, restaurants, and other businesses. The city is also home to several small medical facilities, including a hospital and several clinics.
Demographics
As of the 2010 census, the population of Simpsonville was 8,000. The racial makeup of the city was 95.3% White, 1.7% African American, 0.3% Native American, 0.7% Asian, 0.1% Pacific Islander, and 1.8% from other races. Hispanic or Latino of any race were 2.2% of the population.
The median household income in Simpsonville was $45,000, and the median family income was $50,000. The per capita income was $20,000. About 10.3% of the population was below the poverty line.
Simpsonville is a small city with a rich history and a friendly atmosphere. The city is home to several businesses and industries, and is a great place to live and work. The city is also home to several small medical facilities, and is a great place to raise a family.
Common Questions
What is Per Capita Income in Simpsonville?
Per Capita income in Simpsonville is $43,824.
What is the Median Family Income in Simpsonville?
Median Family Income in Simpsonville is $103,319.
What is the Median Household income in Simpsonville?
Median Household Income in Simpsonville is $89,813.
What is Income or Wage Gap in Simpsonville?
Income or Wage Gap in Simpsonville is 19.2%.
Women in Simpsonville earn 80.8 cents for every dollar earned by a man.
What is Family Income Deficit in Simpsonville?
Family Income Deficit in Simpsonville is $9,721.
Families that are below poverty line in Simpsonville earn $9,721 less on average than the poverty threshold level.
What is Inequality or Gini Index in Simpsonville?
Inequality or Gini Index in Simpsonville is 0.40.
What is the Total Population of Simpsonville?
Total Population of Simpsonville is 2,976.
What is the Total Male Population of Simpsonville?
Total Male Population of Simpsonville is 1,480.
What is the Total Female Population of Simpsonville?
Total Female Population of Simpsonville is 1,496.
What is the Ratio of Males per 100 Females in Simpsonville?
There are 98.93 Males per 100 Females in Simpsonville.
What is the Ratio of Females per 100 Males in Simpsonville?
There are 101.08 Females per 100 Males in Simpsonville.
What is the Median Population Age in Simpsonville?
Median Population Age in Simpsonville is 36.2 Years.
What is the Average Family Size in Simpsonville
Average Family Size in Simpsonville is 3.1 People.
What is the Average Household Size in Simpsonville
Average Household Size in Simpsonville is 2.5 People.
How Large is the Labor Force in Simpsonville?
There are 1,561 People in the Labor Forcein in Simpsonville.
What is the Percentage of People in the Labor Force in Simpsonville?
68.0% of People are in the Labor Force in Simpsonville.
What is the Unemployment Rate in Simpsonville?
Unemployment Rate in Simpsonville is 0.8%.