Slaughters, KY Map & Demographics
Slaughters Map
Slaughters Overview
$21,050
PER CAPITA INCOME
$34,583
AVG FAMILY INCOME
$39,375
AVG HOUSEHOLD INCOME
0.40
INEQUALITY / GINI INDEX
201
TOTAL POPULATION
85
MALE POPULATION
116
FEMALE POPULATION
73.28
MALES / 100 FEMALES
136.47
FEMALES / 100 MALES
39.8
MEDIAN AGE
3.0
AVG FAMILY SIZE
2.5
AVG HOUSEHOLD SIZE
84
LABOR FORCE [ PEOPLE ]
50.3%
PERCENT IN LABOR FORCE
7.1%
UNEMPLOYMENT RATE
Slaughters Zip Codes
Slaughters Area Codes
Income in Slaughters
Income Overview in Slaughters
Per Capita Income in Slaughters is $21,050, while median incomes of families and households are $34,583 and $39,375 respectively.
| Characteristic | Number | Measure |
| Per Capita Income | 201 | $21,050 |
| Median Family Income | 55 | $34,583 |
| Mean Family Income | 55 | $54,587 |
| Median Household Income | 79 | $39,375 |
| Mean Household Income | 79 | $50,586 |
| Income Deficit | 55 | $0 |
| Wage / Income Gap (%) | 201 | 0.00% |
| Wage / Income Gap ($) | 201 | 100.00¢ per $1 |
| Gini / Inequality Index | 201 | 0.40 |
Earnings by Sex in Slaughters
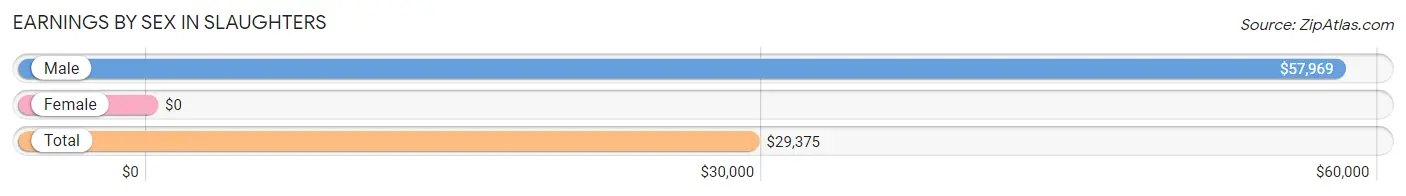
| Sex | Number | Average Earnings |
| Male | 39 (43.8%) | $57,969 |
| Female | 50 (56.2%) | $0 |
| Total | 89 (100.0%) | $29,375 |
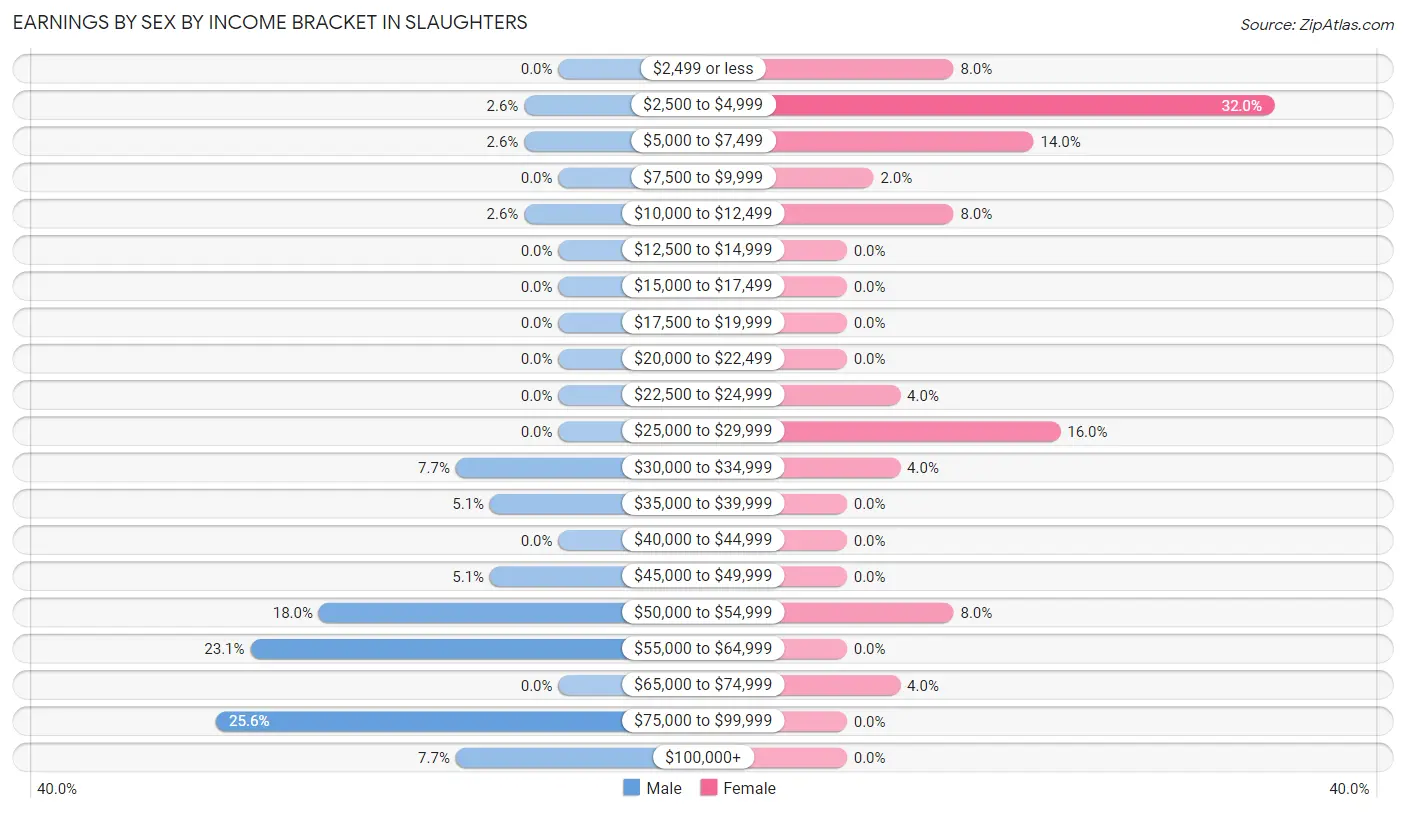
Earnings by Sex by Income Bracket in Slaughters
The most common earnings brackets in Slaughters are $75,000 to $99,999 for men (10 | 25.6%) and $2,500 to $4,999 for women (16 | 32.0%).
| Income | Male | Female |
| $2,499 or less | 0 (0.0%) | 4 (8.0%) |
| $2,500 to $4,999 | 1 (2.6%) | 16 (32.0%) |
| $5,000 to $7,499 | 1 (2.6%) | 7 (14.0%) |
| $7,500 to $9,999 | 0 (0.0%) | 1 (2.0%) |
| $10,000 to $12,499 | 1 (2.6%) | 4 (8.0%) |
| $12,500 to $14,999 | 0 (0.0%) | 0 (0.0%) |
| $15,000 to $17,499 | 0 (0.0%) | 0 (0.0%) |
| $17,500 to $19,999 | 0 (0.0%) | 0 (0.0%) |
| $20,000 to $22,499 | 0 (0.0%) | 0 (0.0%) |
| $22,500 to $24,999 | 0 (0.0%) | 2 (4.0%) |
| $25,000 to $29,999 | 0 (0.0%) | 8 (16.0%) |
| $30,000 to $34,999 | 3 (7.7%) | 2 (4.0%) |
| $35,000 to $39,999 | 2 (5.1%) | 0 (0.0%) |
| $40,000 to $44,999 | 0 (0.0%) | 0 (0.0%) |
| $45,000 to $49,999 | 2 (5.1%) | 0 (0.0%) |
| $50,000 to $54,999 | 7 (17.9%) | 4 (8.0%) |
| $55,000 to $64,999 | 9 (23.1%) | 0 (0.0%) |
| $65,000 to $74,999 | 0 (0.0%) | 2 (4.0%) |
| $75,000 to $99,999 | 10 (25.6%) | 0 (0.0%) |
| $100,000+ | 3 (7.7%) | 0 (0.0%) |
| Total | 39 (100.0%) | 50 (100.0%) |
Earnings by Sex by Educational Attainment in Slaughters
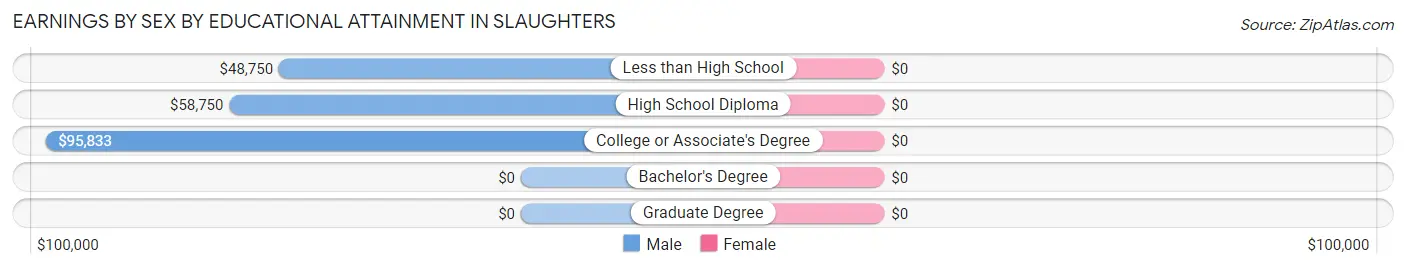
| Educational Attainment | Male Income | Female Income |
| Less than High School | $48,750 | $0 |
| High School Diploma | $58,750 | $0 |
| College or Associate's Degree | $95,833 | $0 |
| Bachelor's Degree | - | - |
| Graduate Degree | - | - |
| Total | $57,969 | $0 |
Family Income in Slaughters
Family Income Brackets in Slaughters
According to the Slaughters family income data, there are 18 families falling into the $15,000 to $24,999 income range, which is the most common income bracket and makes up 32.7% of all families.
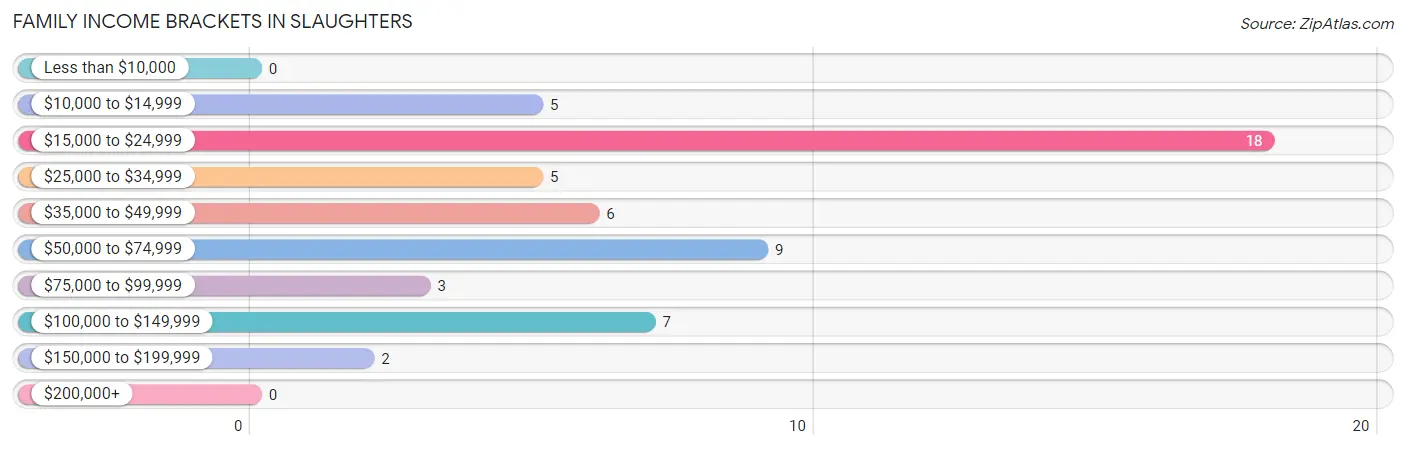
| Income Bracket | # Families | % Families |
| Less than $10,000 | 0 | 0.0% |
| $10,000 to $14,999 | 5 | 9.1% |
| $15,000 to $24,999 | 18 | 32.7% |
| $25,000 to $34,999 | 5 | 9.1% |
| $35,000 to $49,999 | 6 | 10.9% |
| $50,000 to $74,999 | 9 | 16.4% |
| $75,000 to $99,999 | 3 | 5.5% |
| $100,000 to $149,999 | 7 | 12.7% |
| $150,000 to $199,999 | 2 | 3.6% |
| $200,000+ | 0 | 0.0% |
Family Income by Famaliy Size in Slaughters
3-person families (6 | 10.9%) account for the highest median family income in Slaughters with $88,750 per family, while 3-person families (6 | 10.9%) have the highest median income of $29,583 per family member.
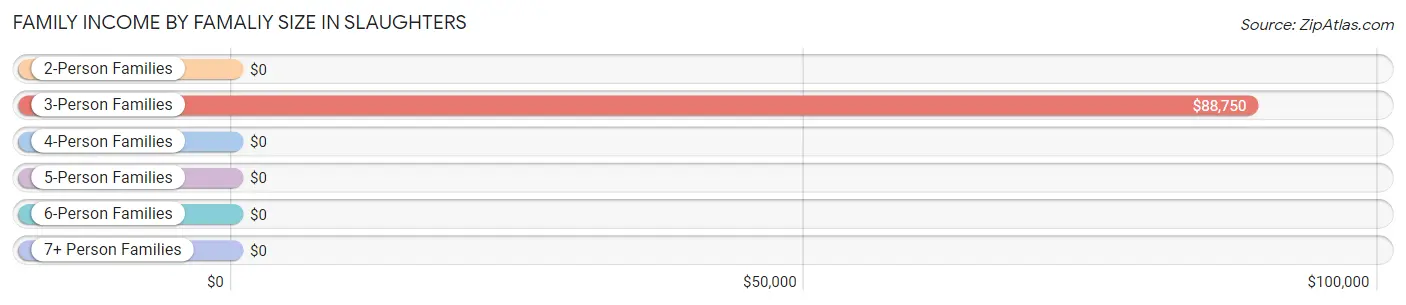
| Income Bracket | # Families | Median Income |
| 2-Person Families | 34 (61.8%) | $0 |
| 3-Person Families | 6 (10.9%) | $88,750 |
| 4-Person Families | 13 (23.6%) | $0 |
| 5-Person Families | 2 (3.6%) | $0 |
| 6-Person Families | 0 (0.0%) | $0 |
| 7+ Person Families | 0 (0.0%) | $0 |
| Total | 55 (100.0%) | $34,583 |
Family Income by Number of Earners in Slaughters
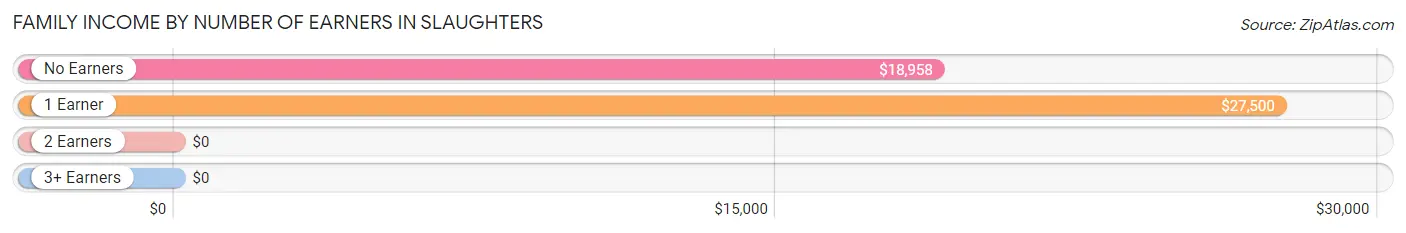
| Number of Earners | # Families | Median Income |
| No Earners | 17 (30.9%) | $18,958 |
| 1 Earner | 20 (36.4%) | $27,500 |
| 2 Earners | 13 (23.6%) | $0 |
| 3+ Earners | 5 (9.1%) | $0 |
| Total | 55 (100.0%) | $34,583 |
Household Income in Slaughters
Household Income Brackets in Slaughters
With 24 households falling in the category, the $50,000 to $74,999 income range is the most frequent in Slaughters, accounting for 30.4% of all households.
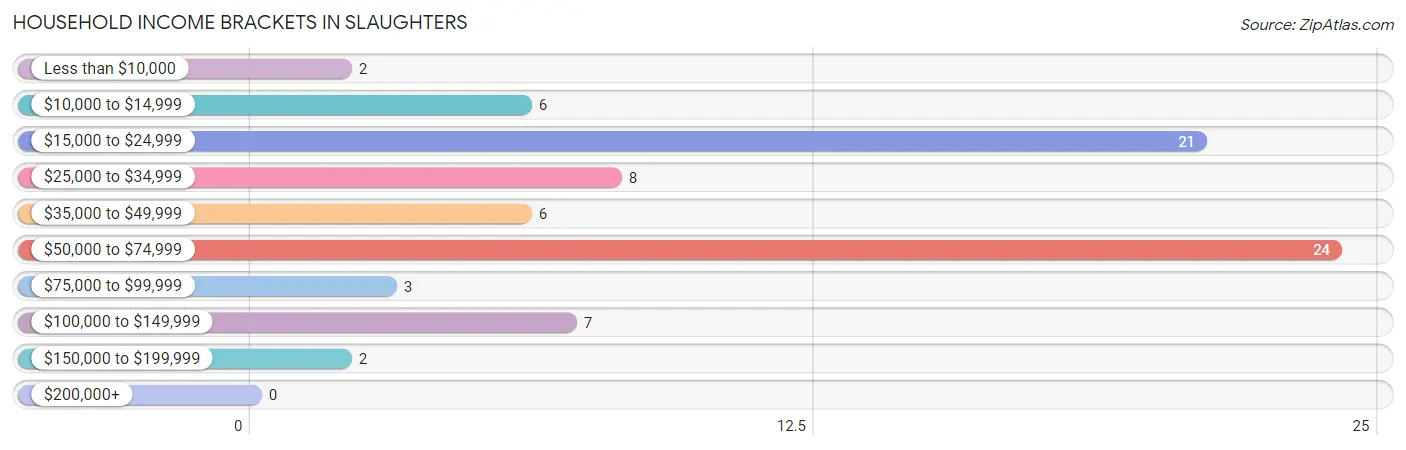
| Income Bracket | # Households | % Households |
| Less than $10,000 | 2 | 2.5% |
| $10,000 to $14,999 | 6 | 7.6% |
| $15,000 to $24,999 | 21 | 26.6% |
| $25,000 to $34,999 | 8 | 10.1% |
| $35,000 to $49,999 | 6 | 7.6% |
| $50,000 to $74,999 | 24 | 30.4% |
| $75,000 to $99,999 | 3 | 3.8% |
| $100,000 to $149,999 | 7 | 8.9% |
| $150,000 to $199,999 | 2 | 2.5% |
| $200,000+ | 0 | 0.0% |
Household Income by Householder Age in Slaughters
The median household income in Slaughters is $39,375, with the highest median household income of $33,333 found in the 45 to 64 years age bracket for the primary householder. A total of 44 households (55.7%) fall into this category. Meanwhile, the 15 to 24 years age bracket for the primary householder has the lowest median household income of $0, with 1 households (1.3%) in this group.
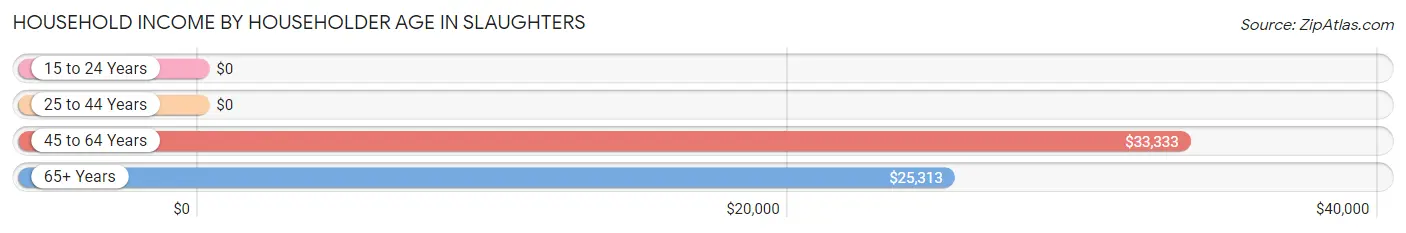
| Income Bracket | # Households | Median Income |
| 15 to 24 Years | 1 (1.3%) | $0 |
| 25 to 44 Years | 17 (21.5%) | $0 |
| 45 to 64 Years | 44 (55.7%) | $33,333 |
| 65+ Years | 17 (21.5%) | $25,313 |
| Total | 79 (100.0%) | $39,375 |
Poverty in Slaughters
Income Below Poverty by Sex and Age in Slaughters
With 22.4% poverty level for males and 13.8% for females among the residents of Slaughters, 18 to 24 year old males and 65 to 74 year old females are the most vulnerable to poverty, with 2 males (100.0%) and 3 females (42.9%) in their respective age groups living below the poverty level.
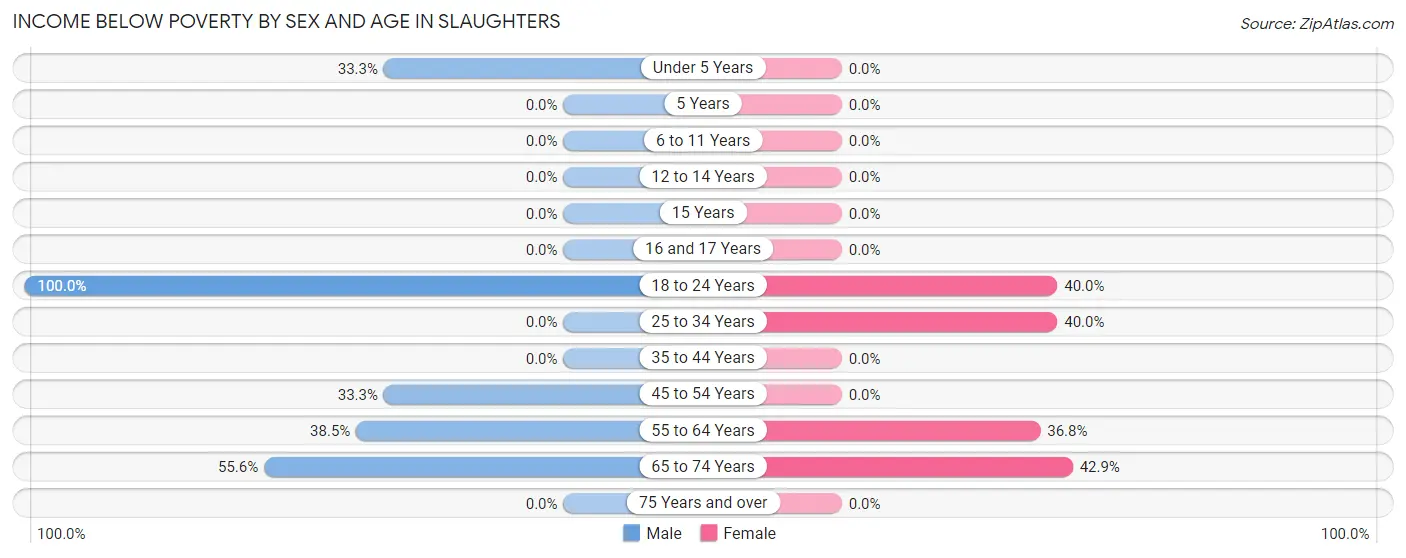
| Age Bracket | Male | Female |
| Under 5 Years | 2 (33.3%) | 0 (0.0%) |
| 5 Years | 0 (0.0%) | 0 (0.0%) |
| 6 to 11 Years | 0 (0.0%) | 0 (0.0%) |
| 12 to 14 Years | 0 (0.0%) | 0 (0.0%) |
| 15 Years | 0 (0.0%) | 0 (0.0%) |
| 16 and 17 Years | 0 (0.0%) | 0 (0.0%) |
| 18 to 24 Years | 2 (100.0%) | 2 (40.0%) |
| 25 to 34 Years | 0 (0.0%) | 4 (40.0%) |
| 35 to 44 Years | 0 (0.0%) | 0 (0.0%) |
| 45 to 54 Years | 5 (33.3%) | 0 (0.0%) |
| 55 to 64 Years | 5 (38.5%) | 7 (36.8%) |
| 65 to 74 Years | 5 (55.6%) | 3 (42.9%) |
| 75 Years and over | 0 (0.0%) | 0 (0.0%) |
| Total | 19 (22.4%) | 16 (13.8%) |
Income Above Poverty by Sex and Age in Slaughters
According to the poverty statistics in Slaughters, males aged 12 to 14 years and females aged under 5 years are the age groups that are most secure financially, with 100.0% of males and 100.0% of females in these age groups living above the poverty line.
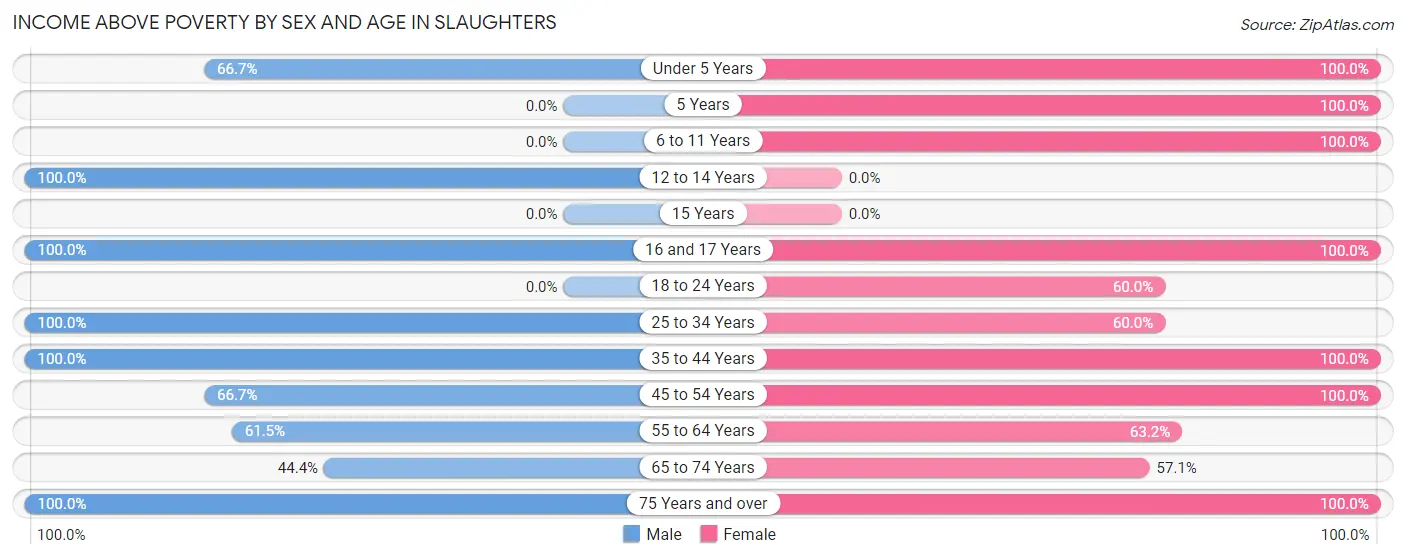
| Age Bracket | Male | Female |
| Under 5 Years | 4 (66.7%) | 1 (100.0%) |
| 5 Years | 0 (0.0%) | 3 (100.0%) |
| 6 to 11 Years | 0 (0.0%) | 21 (100.0%) |
| 12 to 14 Years | 3 (100.0%) | 0 (0.0%) |
| 15 Years | 0 (0.0%) | 0 (0.0%) |
| 16 and 17 Years | 2 (100.0%) | 7 (100.0%) |
| 18 to 24 Years | 0 (0.0%) | 3 (60.0%) |
| 25 to 34 Years | 11 (100.0%) | 6 (60.0%) |
| 35 to 44 Years | 21 (100.0%) | 22 (100.0%) |
| 45 to 54 Years | 10 (66.7%) | 18 (100.0%) |
| 55 to 64 Years | 8 (61.5%) | 12 (63.2%) |
| 65 to 74 Years | 4 (44.4%) | 4 (57.1%) |
| 75 Years and over | 3 (100.0%) | 3 (100.0%) |
| Total | 66 (77.6%) | 100 (86.2%) |
Income Below Poverty Among Married-Couple Families in Slaughters
The poverty statistics for married-couple families in Slaughters show that 14.7% or 5 of the total 34 families live below the poverty line. Families with 1 or 2 children have the highest poverty rate of 21.4%, comprising of 3 families. On the other hand, families with 3 or 4 children have the lowest poverty rate of 0.0%, which includes 0 families.
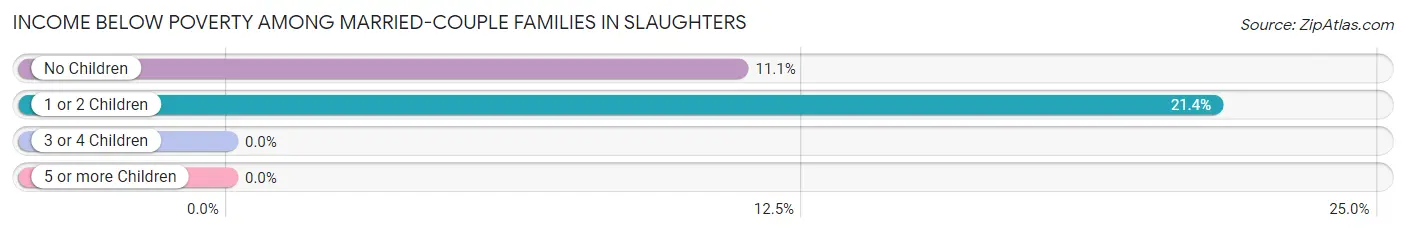
| Children | Above Poverty | Below Poverty |
| No Children | 16 (88.9%) | 2 (11.1%) |
| 1 or 2 Children | 11 (78.6%) | 3 (21.4%) |
| 3 or 4 Children | 2 (100.0%) | 0 (0.0%) |
| 5 or more Children | 0 (0.0%) | 0 (0.0%) |
| Total | 29 (85.3%) | 5 (14.7%) |
Income Below Poverty Among Single-Parent Households in Slaughters
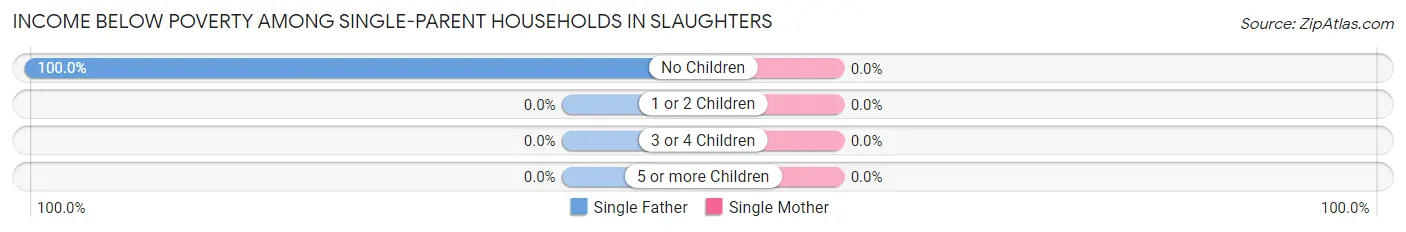
| Children | Single Father | Single Mother |
| No Children | 5 (100.0%) | 0 (0.0%) |
| 1 or 2 Children | 0 (0.0%) | 0 (0.0%) |
| 3 or 4 Children | 0 (0.0%) | 0 (0.0%) |
| 5 or more Children | 0 (0.0%) | 0 (0.0%) |
| Total | 5 (62.5%) | 0 (0.0%) |
Income Below Poverty Among Married-Couple vs Single-Parent Households in Slaughters
The poverty data for Slaughters shows that 5 of the married-couple family households (14.7%) and 5 of the single-parent households (23.8%) are living below the poverty level. Within the married-couple family households, those with 1 or 2 children have the highest poverty rate, with 3 households (21.4%) falling below the poverty line. Among the single-parent households, those with no children have the highest poverty rate, with 5 household (27.8%) living below poverty.
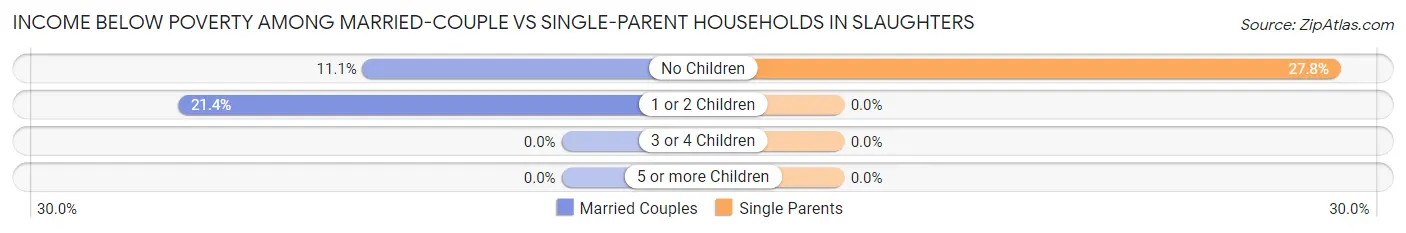
| Children | Married-Couple Families | Single-Parent Households |
| No Children | 2 (11.1%) | 5 (27.8%) |
| 1 or 2 Children | 3 (21.4%) | 0 (0.0%) |
| 3 or 4 Children | 0 (0.0%) | 0 (0.0%) |
| 5 or more Children | 0 (0.0%) | 0 (0.0%) |
| Total | 5 (14.7%) | 5 (23.8%) |
Race in Slaughters
The most populous races in Slaughters are White / Caucasian (194 | 96.5%), Black / African American (5 | 2.5%), and Hispanic or Latino (4 | 2.0%).
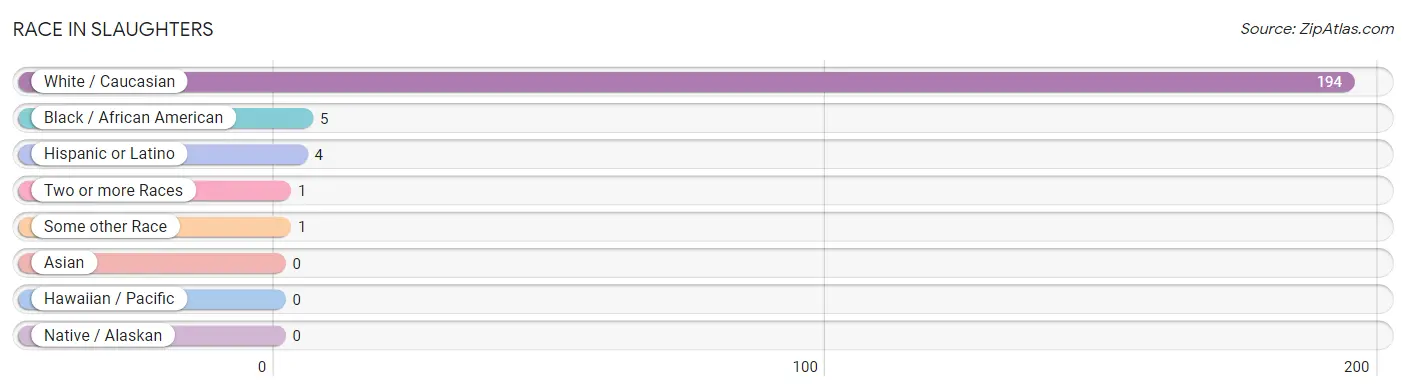
| Race | # Population | % Population |
| Asian | 0 | 0.0% |
| Black / African American | 5 | 2.5% |
| Hawaiian / Pacific | 0 | 0.0% |
| Hispanic or Latino | 4 | 2.0% |
| Native / Alaskan | 0 | 0.0% |
| White / Caucasian | 194 | 96.5% |
| Two or more Races | 1 | 0.5% |
| Some other Race | 1 | 0.5% |
| Total | 201 | 100.0% |
Ancestry in Slaughters
The most populous ancestries reported in Slaughters are American (49 | 24.4%), European (32 | 15.9%), English (31 | 15.4%), Irish (15 | 7.5%), and Scottish (9 | 4.5%), together accounting for 67.7% of all Slaughters residents.
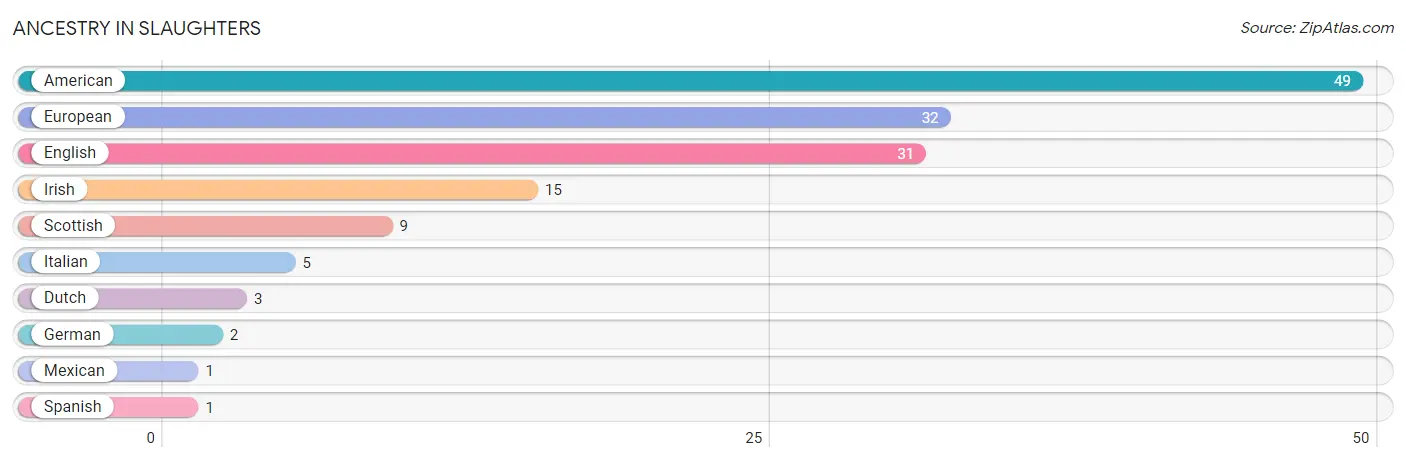
| Ancestry | # Population | % Population |
| American | 49 | 24.4% |
| Dutch | 3 | 1.5% |
| English | 31 | 15.4% |
| European | 32 | 15.9% |
| German | 2 | 1.0% |
| Irish | 15 | 7.5% |
| Italian | 5 | 2.5% |
| Mexican | 1 | 0.5% |
| Scottish | 9 | 4.5% |
| Spanish | 1 | 0.5% | View All 10 Rows |
Immigrants in Slaughters

| Immigration Origin | # Population | % Population | View All 0 Rows |
Sex and Age in Slaughters
Sex and Age in Slaughters
The most populous age groups in Slaughters are 35 to 39 Years (16 | 18.8%) for men and 35 to 39 Years (17 | 14.7%) for women.
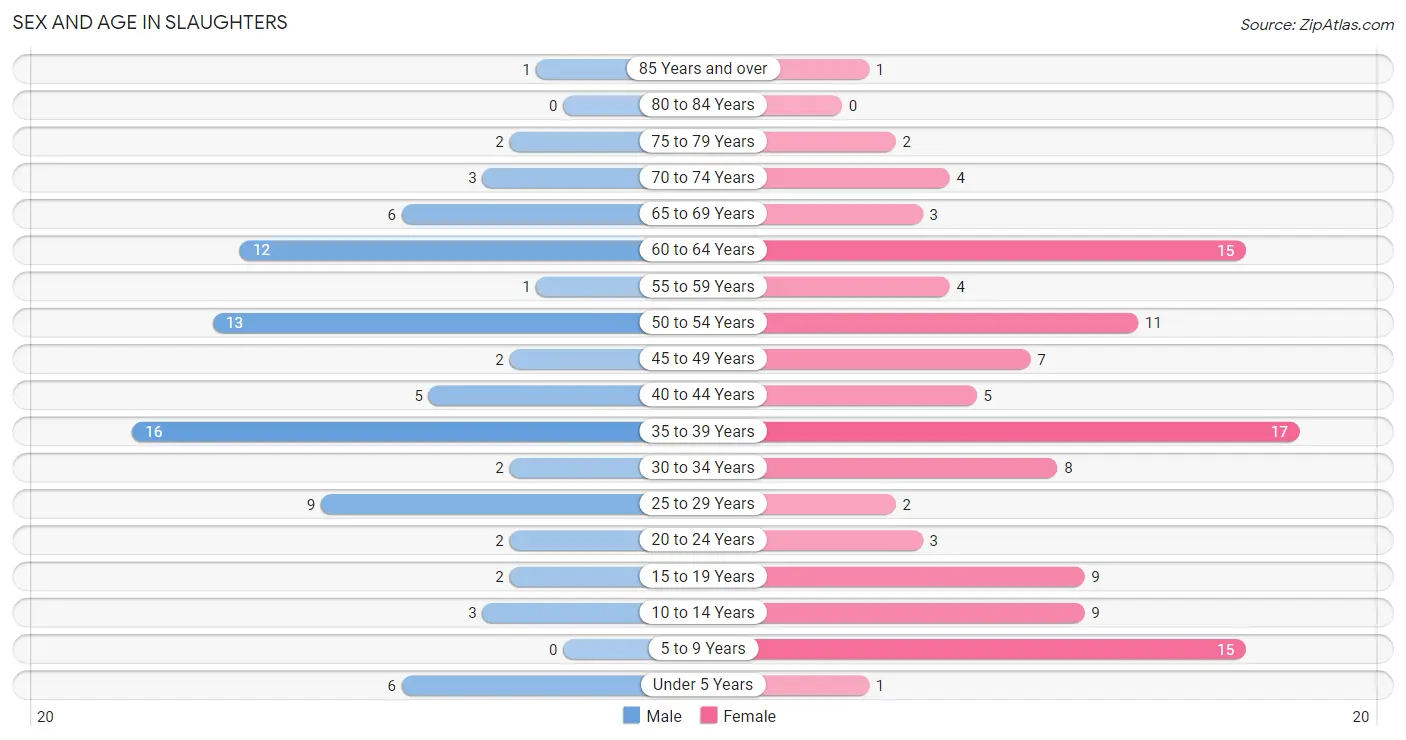
| Age Bracket | Male | Female |
| Under 5 Years | 6 (7.1%) | 1 (0.9%) |
| 5 to 9 Years | 0 (0.0%) | 15 (12.9%) |
| 10 to 14 Years | 3 (3.5%) | 9 (7.8%) |
| 15 to 19 Years | 2 (2.4%) | 9 (7.8%) |
| 20 to 24 Years | 2 (2.4%) | 3 (2.6%) |
| 25 to 29 Years | 9 (10.6%) | 2 (1.7%) |
| 30 to 34 Years | 2 (2.4%) | 8 (6.9%) |
| 35 to 39 Years | 16 (18.8%) | 17 (14.7%) |
| 40 to 44 Years | 5 (5.9%) | 5 (4.3%) |
| 45 to 49 Years | 2 (2.4%) | 7 (6.0%) |
| 50 to 54 Years | 13 (15.3%) | 11 (9.5%) |
| 55 to 59 Years | 1 (1.2%) | 4 (3.5%) |
| 60 to 64 Years | 12 (14.1%) | 15 (12.9%) |
| 65 to 69 Years | 6 (7.1%) | 3 (2.6%) |
| 70 to 74 Years | 3 (3.5%) | 4 (3.5%) |
| 75 to 79 Years | 2 (2.4%) | 2 (1.7%) |
| 80 to 84 Years | 0 (0.0%) | 0 (0.0%) |
| 85 Years and over | 1 (1.2%) | 1 (0.9%) |
| Total | 85 (100.0%) | 116 (100.0%) |
Families and Households in Slaughters
Median Family Size in Slaughters
The median family size in Slaughters is 3.04 persons per family, with married-couple families (34 | 61.8%) accounting for the largest median family size of 3.09 persons per family. On the other hand, single female/mother families (13 | 23.6%) represent the smallest median family size with 2.92 persons per family.
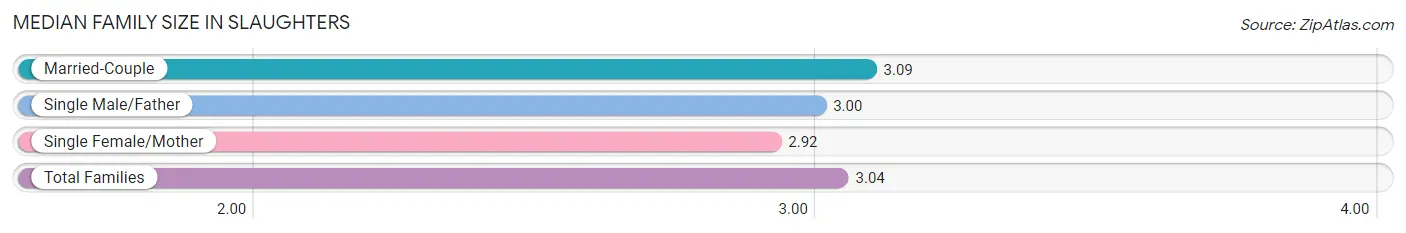
| Family Type | # Families | Family Size |
| Married-Couple | 34 (61.8%) | 3.09 |
| Single Male/Father | 8 (14.5%) | 3.00 |
| Single Female/Mother | 13 (23.6%) | 2.92 |
| Total Families | 55 (100.0%) | 3.04 |
Median Household Size in Slaughters
The median household size in Slaughters is 2.54 persons per household, with single male/father households (8 | 10.1%) accounting for the largest median household size of 3.38 persons per household. non-family households (24 | 30.4%) represent the smallest median household size with 1.29 persons per household.
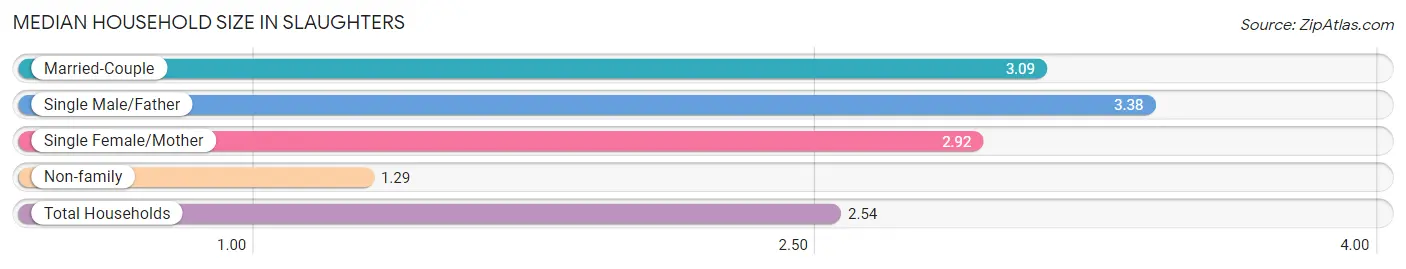
| Household Type | # Households | Household Size |
| Married-Couple | 34 (43.0%) | 3.09 |
| Single Male/Father | 8 (10.1%) | 3.38 |
| Single Female/Mother | 13 (16.5%) | 2.92 |
| Non-family | 24 (30.4%) | 1.29 |
| Total Households | 79 (100.0%) | 2.54 |
Household Size by Marriage Status in Slaughters
Out of a total of 79 households in Slaughters, 55 (69.6%) are family households, while 24 (30.4%) are nonfamily households. The most numerous type of family households are 2-person households, comprising 29, and the most common type of nonfamily households are 1-person households, comprising 20.
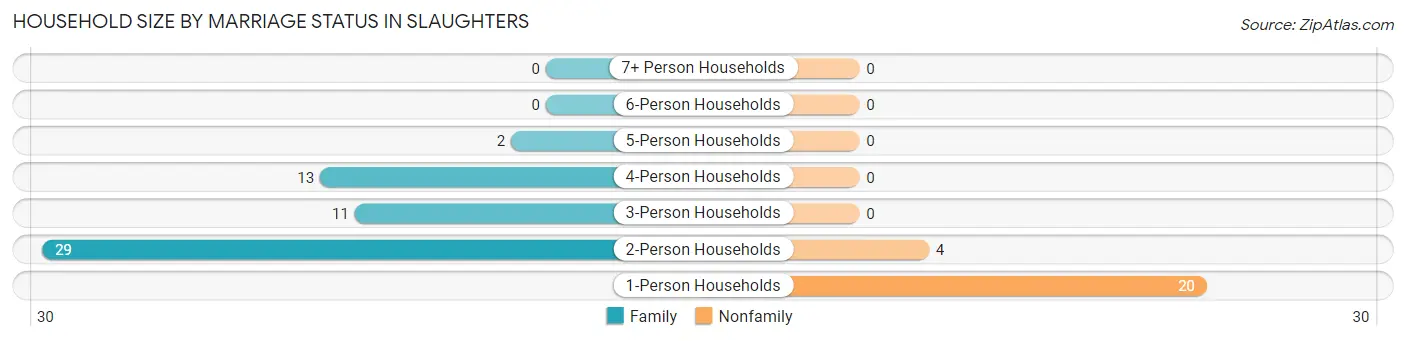
| Household Size | Family Households | Nonfamily Households |
| 1-Person Households | - | 20 (25.3%) |
| 2-Person Households | 29 (36.7%) | 4 (5.1%) |
| 3-Person Households | 11 (13.9%) | 0 (0.0%) |
| 4-Person Households | 13 (16.5%) | 0 (0.0%) |
| 5-Person Households | 2 (2.5%) | 0 (0.0%) |
| 6-Person Households | 0 (0.0%) | 0 (0.0%) |
| 7+ Person Households | 0 (0.0%) | 0 (0.0%) |
| Total | 55 (69.6%) | 24 (30.4%) |
Female Fertility in Slaughters
Fertility by Age in Slaughters
| Age Bracket | Women with Births | Births / 1,000 Women |
| 15 to 19 years | 0 (0.0%) | 0.0 |
| 20 to 34 years | 0 (0.0%) | 0.0 |
| 35 to 50 years | 0 (0.0%) | 0.0 |
| Total | 0 (0.0%) | 0.0 |
Fertility by Age by Marriage Status in Slaughters
| Age Bracket | Married | Unmarried |
| 15 to 19 years | 0 (0.0%) | 0 (0.0%) |
| 20 to 34 years | 0 (0.0%) | 0 (0.0%) |
| 35 to 50 years | 0 (0.0%) | 0 (0.0%) |
| Total | 0 (0.0%) | 0 (0.0%) |
Fertility by Education in Slaughters
| Educational Attainment | Women with Births | Births / 1,000 Women |
| Less than High School | 0 (0.0%) | 0.0 |
| High School Diploma | 0 (0.0%) | 0.0 |
| College or Associate's Degree | 0 (0.0%) | 0.0 |
| Bachelor's Degree | 0 (0.0%) | 0.0 |
| Graduate Degree | 0 (0.0%) | 0.0 |
| Total | 0 (0.0%) | 0.0 |
Fertility by Education by Marriage Status in Slaughters
| Educational Attainment | Married | Unmarried |
| Less than High School | 0 (0.0%) | 0 (0.0%) |
| High School Diploma | 0 (0.0%) | 0 (0.0%) |
| College or Associate's Degree | 0 (0.0%) | 0 (0.0%) |
| Bachelor's Degree | 0 (0.0%) | 0 (0.0%) |
| Graduate Degree | 0 (0.0%) | 0 (0.0%) |
| Total | 0 (0.0%) | 0 (0.0%) |
Employment Characteristics in Slaughters
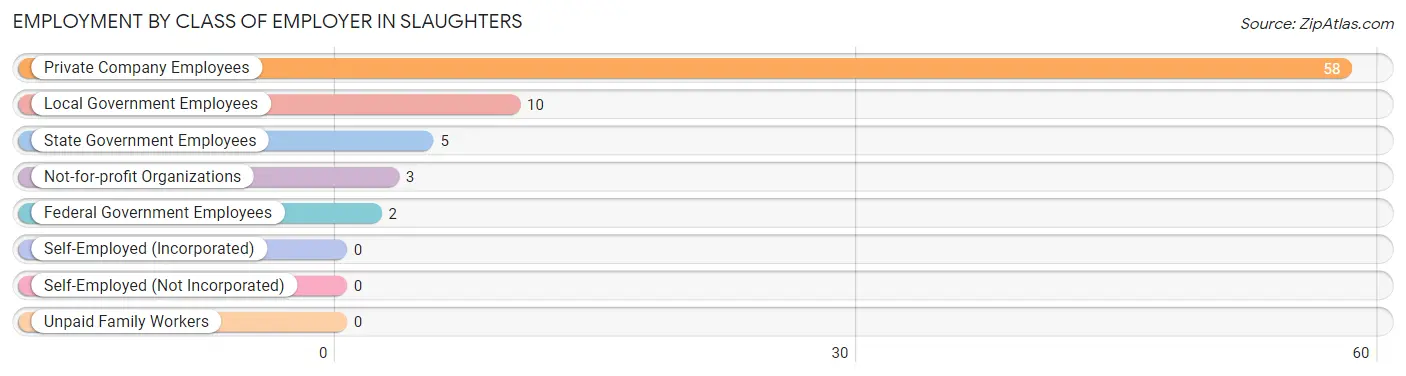
Employment by Class of Employer in Slaughters
Among the 78 employed individuals in Slaughters, private company employees (58 | 74.4%), local government employees (10 | 12.8%), and state government employees (5 | 6.4%) make up the most common classes of employment.
| Employer Class | # Employees | % Employees |
| Private Company Employees | 58 | 74.4% |
| Self-Employed (Incorporated) | 0 | 0.0% |
| Self-Employed (Not Incorporated) | 0 | 0.0% |
| Not-for-profit Organizations | 3 | 3.8% |
| Local Government Employees | 10 | 12.8% |
| State Government Employees | 5 | 6.4% |
| Federal Government Employees | 2 | 2.6% |
| Unpaid Family Workers | 0 | 0.0% |
| Total | 78 | 100.0% |
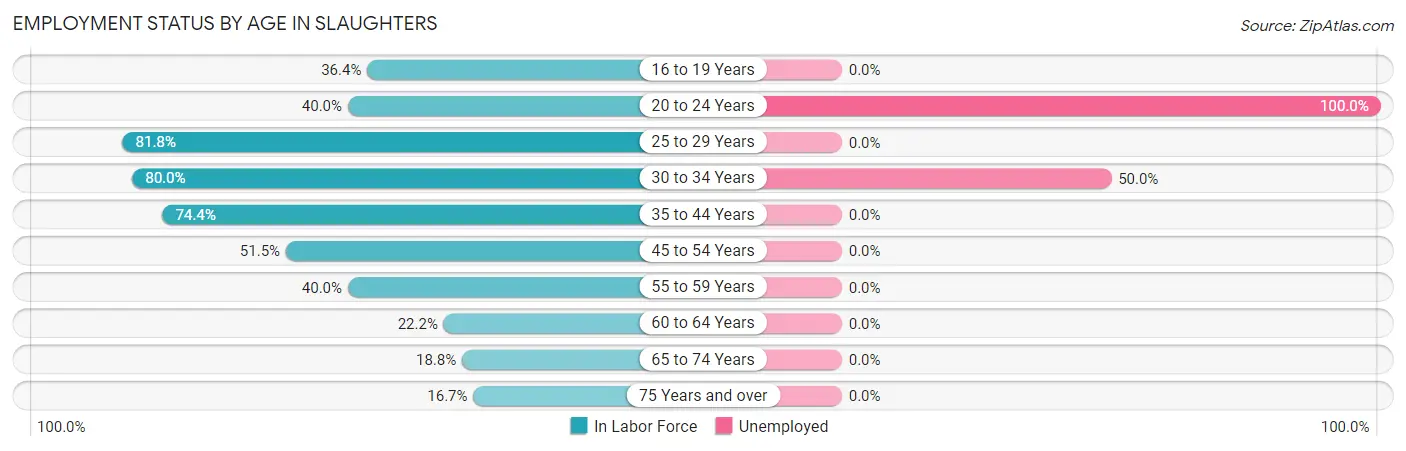
Employment Status by Age in Slaughters
According to the labor force statistics for Slaughters, out of the total population over 16 years of age (167), 50.3% or 84 individuals are in the labor force, with 7.1% or 6 of them unemployed. The age group with the highest labor force participation rate is 25 to 29 years, with 81.8% or 9 individuals in the labor force. Within the labor force, the 20 to 24 years age range has the highest percentage of unemployed individuals, with 100.0% or 2 of them being unemployed.
| Age Bracket | In Labor Force | Unemployed |
| 16 to 19 Years | 4 (36.4%) | 0 (0.0%) |
| 20 to 24 Years | 2 (40.0%) | 2 (100.0%) |
| 25 to 29 Years | 9 (81.8%) | 0 (0.0%) |
| 30 to 34 Years | 8 (80.0%) | 4 (50.0%) |
| 35 to 44 Years | 32 (74.4%) | 0 (0.0%) |
| 45 to 54 Years | 17 (51.5%) | 0 (0.0%) |
| 55 to 59 Years | 2 (40.0%) | 0 (0.0%) |
| 60 to 64 Years | 6 (22.2%) | 0 (0.0%) |
| 65 to 74 Years | 3 (18.8%) | 0 (0.0%) |
| 75 Years and over | 1 (16.7%) | 0 (0.0%) |
| Total | 84 (50.3%) | 6 (7.1%) |
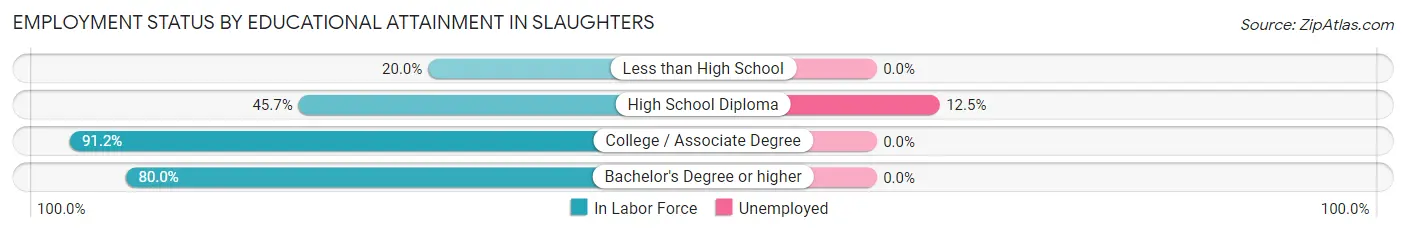
Employment Status by Educational Attainment in Slaughters
According to labor force statistics for Slaughters, 57.4% of individuals (74) out of the total population between 25 and 64 years of age (129) are in the labor force, with 5.4% or 4 of them being unemployed. The group with the highest labor force participation rate are those with the educational attainment of college / associate degree, with 91.2% or 31 individuals in the labor force. Within the labor force, individuals with high school diploma education have the highest percentage of unemployment, with 12.5% or 4 of them being unemployed.
| Educational Attainment | In Labor Force | Unemployed |
| Less than High School | 3 (20.0%) | 0 (0.0%) |
| High School Diploma | 32 (45.7%) | 9 (12.5%) |
| College / Associate Degree | 31 (91.2%) | 0 (0.0%) |
| Bachelor's Degree or higher | 8 (80.0%) | 0 (0.0%) |
| Total | 74 (57.4%) | 7 (5.4%) |
Employment Occupations by Sex in Slaughters
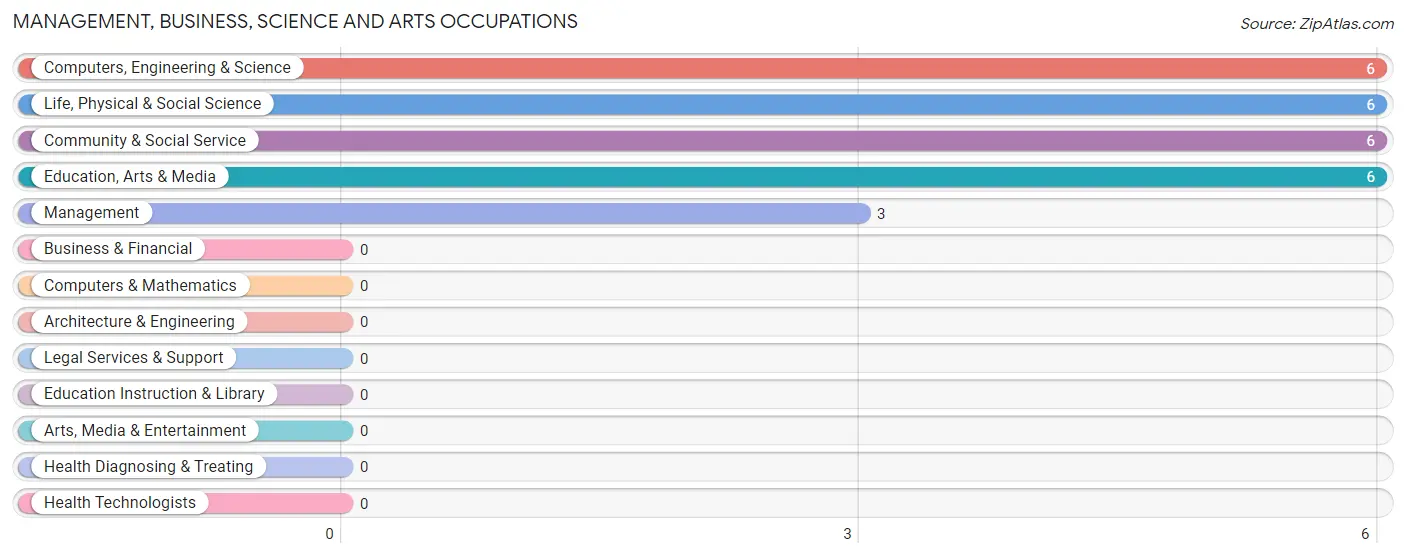
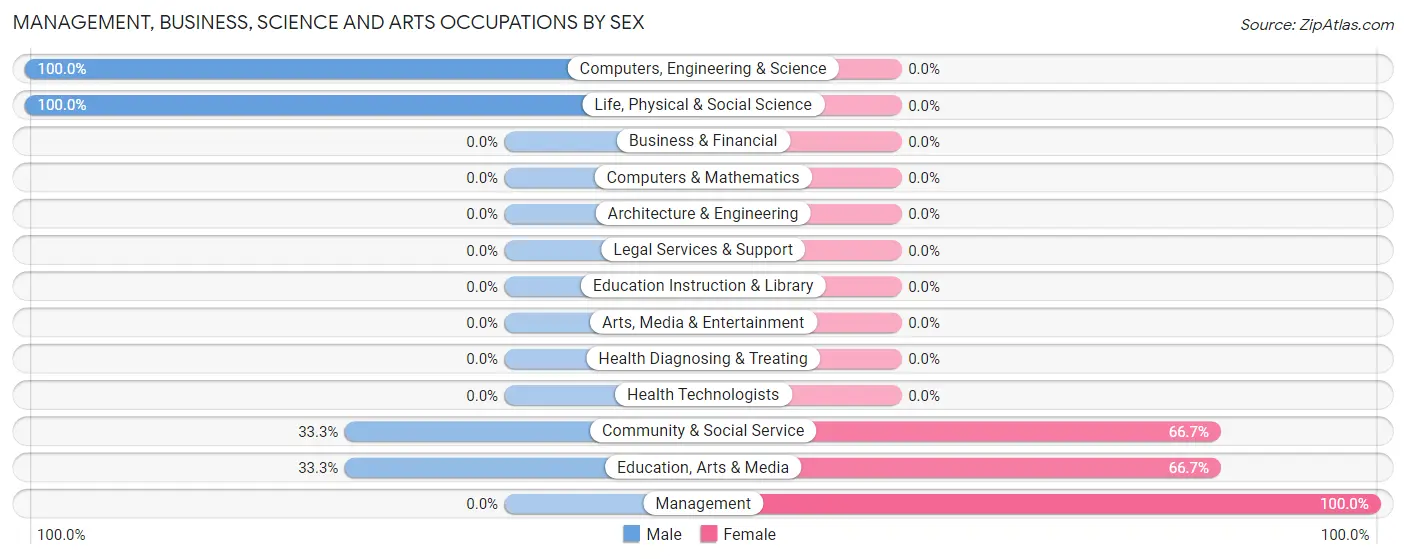
Management, Business, Science and Arts Occupations
The most common Management, Business, Science and Arts occupations in Slaughters are Computers, Engineering & Science (6 | 7.7%), Life, Physical & Social Science (6 | 7.7%), Community & Social Service (6 | 7.7%), Education, Arts & Media (6 | 7.7%), and Management (3 | 3.8%).
Management, Business, Science and Arts Occupations by Sex
Within the Management, Business, Science and Arts occupations in Slaughters, the most male-oriented occupations are Computers, Engineering & Science (100.0%), Life, Physical & Social Science (100.0%), and Community & Social Service (33.3%), while the most female-oriented occupations are Management (100.0%), Community & Social Service (66.7%), and Education, Arts & Media (66.7%).
| Occupation | Male | Female |
| Management | 0 (0.0%) | 3 (100.0%) |
| Business & Financial | 0 (0.0%) | 0 (0.0%) |
| Computers, Engineering & Science | 6 (100.0%) | 0 (0.0%) |
| Computers & Mathematics | 0 (0.0%) | 0 (0.0%) |
| Architecture & Engineering | 0 (0.0%) | 0 (0.0%) |
| Life, Physical & Social Science | 6 (100.0%) | 0 (0.0%) |
| Community & Social Service | 2 (33.3%) | 4 (66.7%) |
| Education, Arts & Media | 2 (33.3%) | 4 (66.7%) |
| Legal Services & Support | 0 (0.0%) | 0 (0.0%) |
| Education Instruction & Library | 0 (0.0%) | 0 (0.0%) |
| Arts, Media & Entertainment | 0 (0.0%) | 0 (0.0%) |
| Health Diagnosing & Treating | 0 (0.0%) | 0 (0.0%) |
| Health Technologists | 0 (0.0%) | 0 (0.0%) |
| Total (Category) | 8 (53.3%) | 7 (46.7%) |
| Total (Overall) | 38 (48.7%) | 40 (51.3%) |
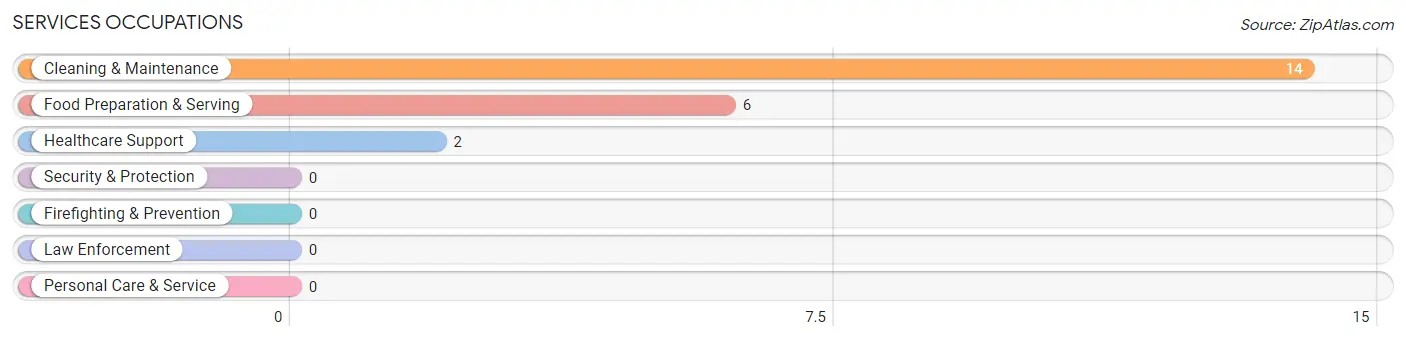
Services Occupations
The most common Services occupations in Slaughters are Cleaning & Maintenance (14 | 17.9%), Food Preparation & Serving (6 | 7.7%), and Healthcare Support (2 | 2.6%).
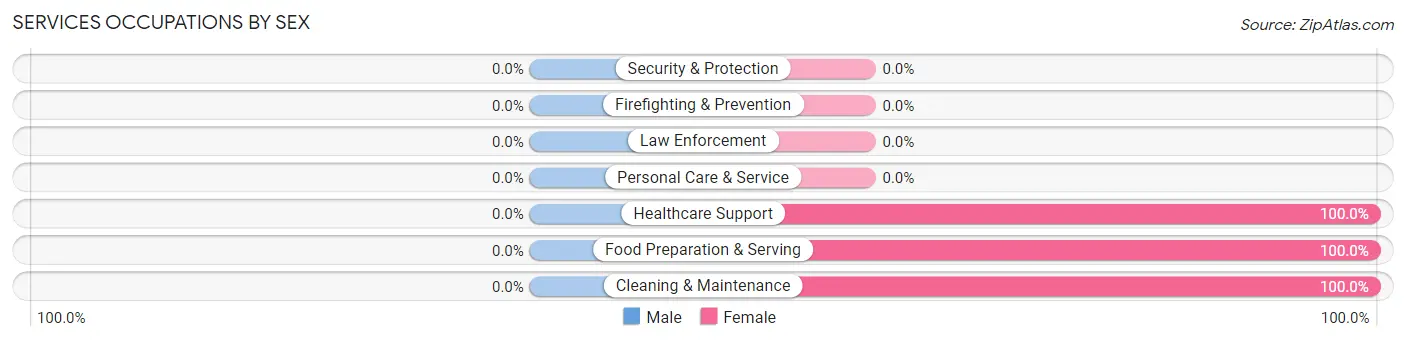
Services Occupations by Sex
| Occupation | Male | Female |
| Healthcare Support | 0 (0.0%) | 2 (100.0%) |
| Security & Protection | 0 (0.0%) | 0 (0.0%) |
| Firefighting & Prevention | 0 (0.0%) | 0 (0.0%) |
| Law Enforcement | 0 (0.0%) | 0 (0.0%) |
| Food Preparation & Serving | 0 (0.0%) | 6 (100.0%) |
| Cleaning & Maintenance | 0 (0.0%) | 14 (100.0%) |
| Personal Care & Service | 0 (0.0%) | 0 (0.0%) |
| Total (Category) | 0 (0.0%) | 22 (100.0%) |
| Total (Overall) | 38 (48.7%) | 40 (51.3%) |
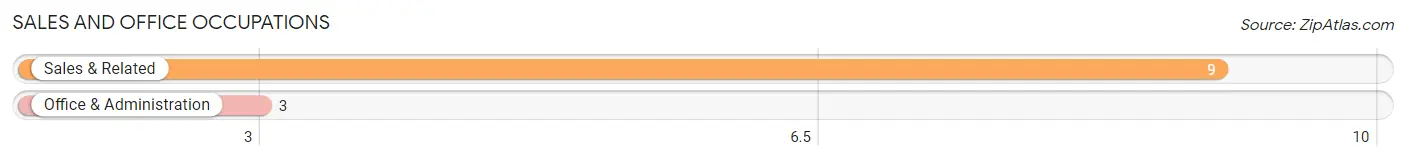
Sales and Office Occupations
The most common Sales and Office occupations in Slaughters are Sales & Related (9 | 11.5%), and Office & Administration (3 | 3.8%).
Sales and Office Occupations by Sex
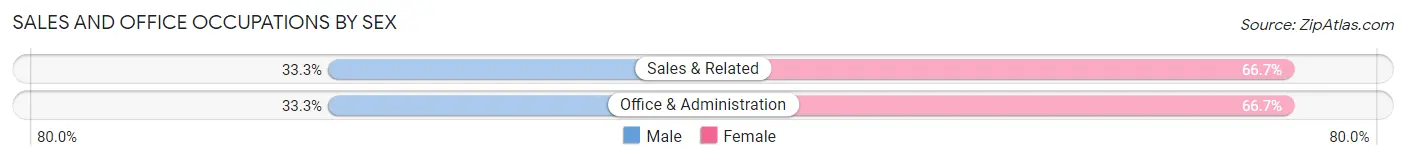
| Occupation | Male | Female |
| Sales & Related | 3 (33.3%) | 6 (66.7%) |
| Office & Administration | 1 (33.3%) | 2 (66.7%) |
| Total (Category) | 4 (33.3%) | 8 (66.7%) |
| Total (Overall) | 38 (48.7%) | 40 (51.3%) |
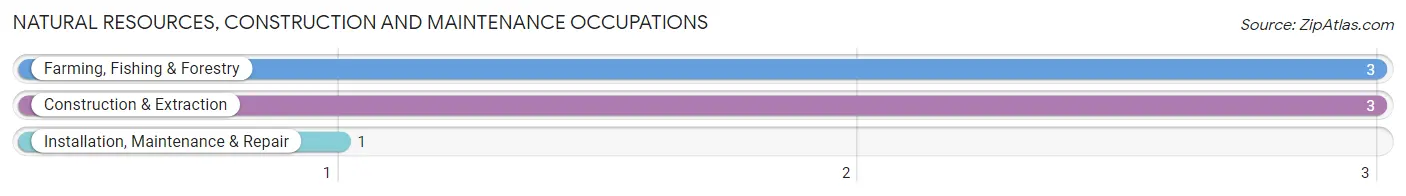
Natural Resources, Construction and Maintenance Occupations
The most common Natural Resources, Construction and Maintenance occupations in Slaughters are Farming, Fishing & Forestry (3 | 3.8%), Construction & Extraction (3 | 3.8%), and Installation, Maintenance & Repair (1 | 1.3%).
Natural Resources, Construction and Maintenance Occupations by Sex
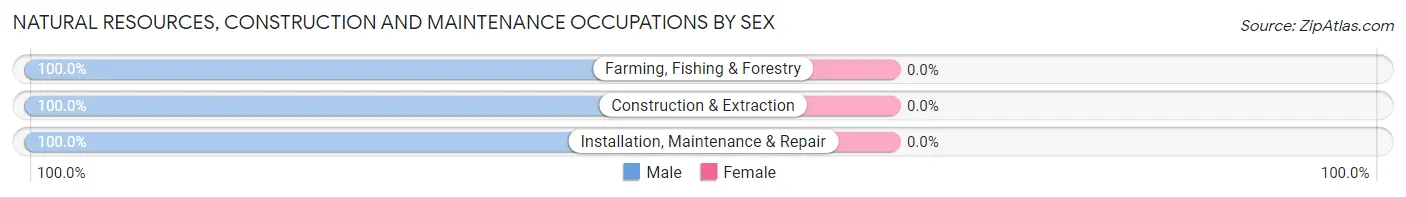
| Occupation | Male | Female |
| Farming, Fishing & Forestry | 3 (100.0%) | 0 (0.0%) |
| Construction & Extraction | 3 (100.0%) | 0 (0.0%) |
| Installation, Maintenance & Repair | 1 (100.0%) | 0 (0.0%) |
| Total (Category) | 7 (100.0%) | 0 (0.0%) |
| Total (Overall) | 38 (48.7%) | 40 (51.3%) |
Production, Transportation and Moving Occupations
The most common Production, Transportation and Moving occupations in Slaughters are Production (16 | 20.5%), Transportation (3 | 3.8%), and Material Moving (3 | 3.8%).
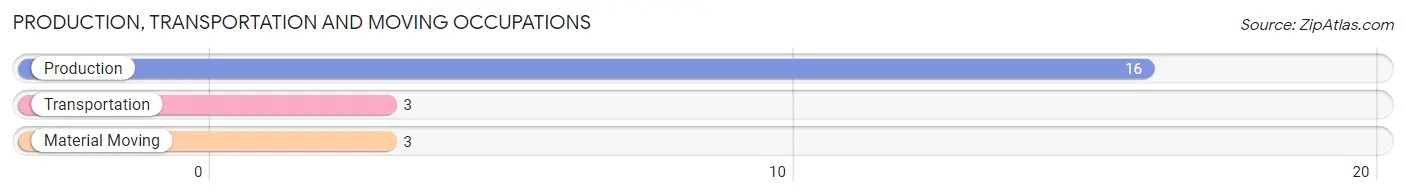
Production, Transportation and Moving Occupations by Sex
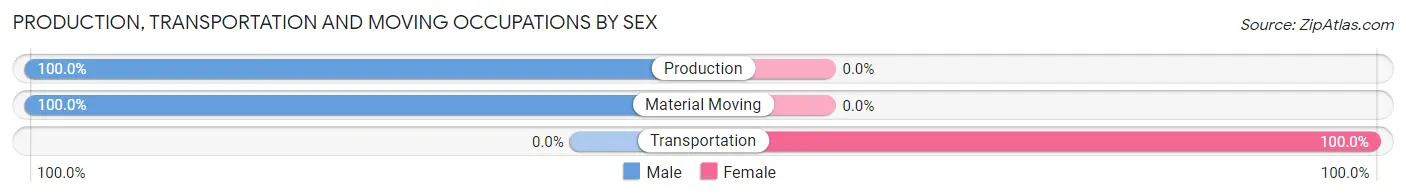
| Occupation | Male | Female |
| Production | 16 (100.0%) | 0 (0.0%) |
| Transportation | 0 (0.0%) | 3 (100.0%) |
| Material Moving | 3 (100.0%) | 0 (0.0%) |
| Total (Category) | 19 (86.4%) | 3 (13.6%) |
| Total (Overall) | 38 (48.7%) | 40 (51.3%) |
Employment Industries by Sex in Slaughters
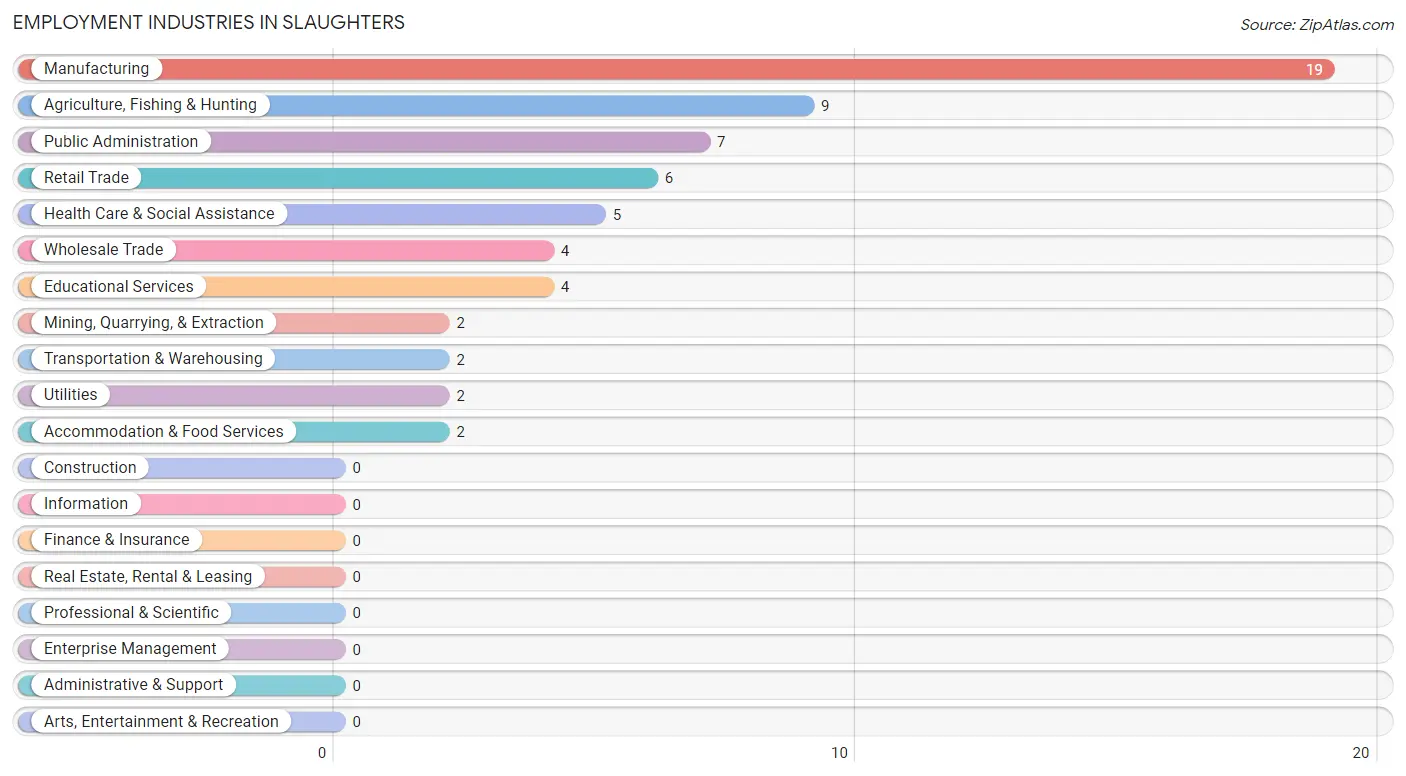
Employment Industries in Slaughters
The major employment industries in Slaughters include Manufacturing (19 | 24.4%), Agriculture, Fishing & Hunting (9 | 11.5%), Public Administration (7 | 9.0%), Retail Trade (6 | 7.7%), and Health Care & Social Assistance (5 | 6.4%).
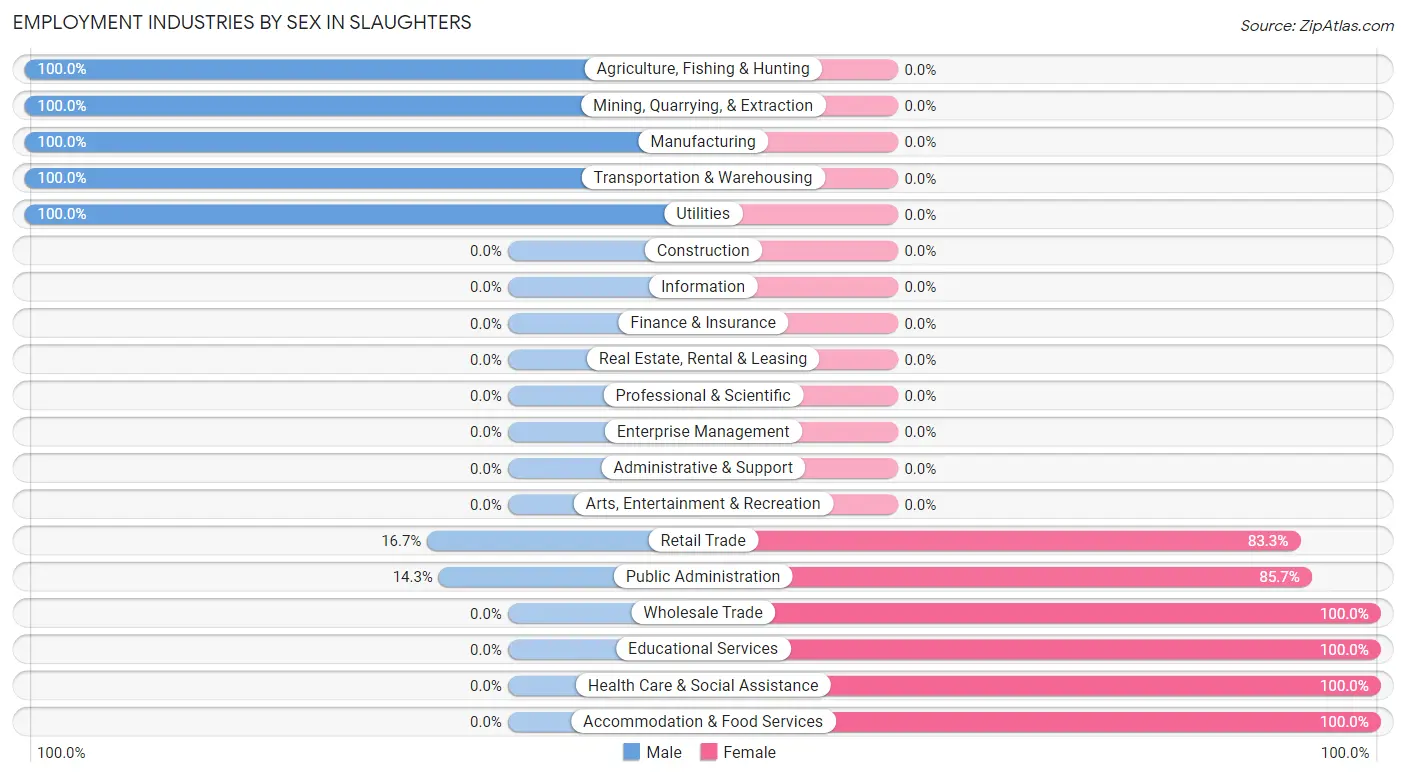
Employment Industries by Sex in Slaughters
The Slaughters industries that see more men than women are Agriculture, Fishing & Hunting (100.0%), Mining, Quarrying, & Extraction (100.0%), and Manufacturing (100.0%), whereas the industries that tend to have a higher number of women are Wholesale Trade (100.0%), Educational Services (100.0%), and Health Care & Social Assistance (100.0%).
| Industry | Male | Female |
| Agriculture, Fishing & Hunting | 9 (100.0%) | 0 (0.0%) |
| Mining, Quarrying, & Extraction | 2 (100.0%) | 0 (0.0%) |
| Construction | 0 (0.0%) | 0 (0.0%) |
| Manufacturing | 19 (100.0%) | 0 (0.0%) |
| Wholesale Trade | 0 (0.0%) | 4 (100.0%) |
| Retail Trade | 1 (16.7%) | 5 (83.3%) |
| Transportation & Warehousing | 2 (100.0%) | 0 (0.0%) |
| Utilities | 2 (100.0%) | 0 (0.0%) |
| Information | 0 (0.0%) | 0 (0.0%) |
| Finance & Insurance | 0 (0.0%) | 0 (0.0%) |
| Real Estate, Rental & Leasing | 0 (0.0%) | 0 (0.0%) |
| Professional & Scientific | 0 (0.0%) | 0 (0.0%) |
| Enterprise Management | 0 (0.0%) | 0 (0.0%) |
| Administrative & Support | 0 (0.0%) | 0 (0.0%) |
| Educational Services | 0 (0.0%) | 4 (100.0%) |
| Health Care & Social Assistance | 0 (0.0%) | 5 (100.0%) |
| Arts, Entertainment & Recreation | 0 (0.0%) | 0 (0.0%) |
| Accommodation & Food Services | 0 (0.0%) | 2 (100.0%) |
| Public Administration | 1 (14.3%) | 6 (85.7%) |
| Total | 38 (48.7%) | 40 (51.3%) |
Education in Slaughters
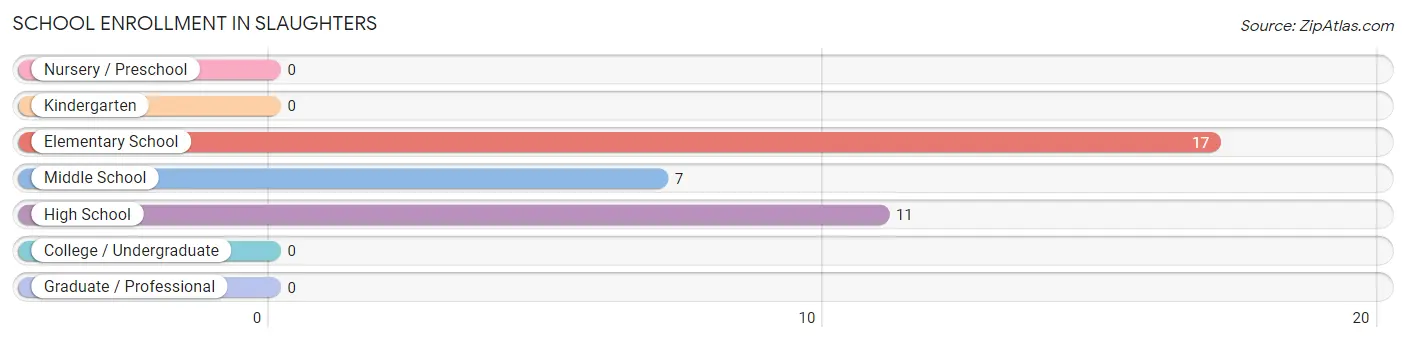
School Enrollment in Slaughters
The most common levels of schooling among the 35 students in Slaughters are elementary school (17 | 48.6%), high school (11 | 31.4%), and middle school (7 | 20.0%).
| School Level | # Students | % Students |
| Nursery / Preschool | 0 | 0.0% |
| Kindergarten | 0 | 0.0% |
| Elementary School | 17 | 48.6% |
| Middle School | 7 | 20.0% |
| High School | 11 | 31.4% |
| College / Undergraduate | 0 | 0.0% |
| Graduate / Professional | 0 | 0.0% |
| Total | 35 | 100.0% |
School Enrollment by Age by Funding Source in Slaughters
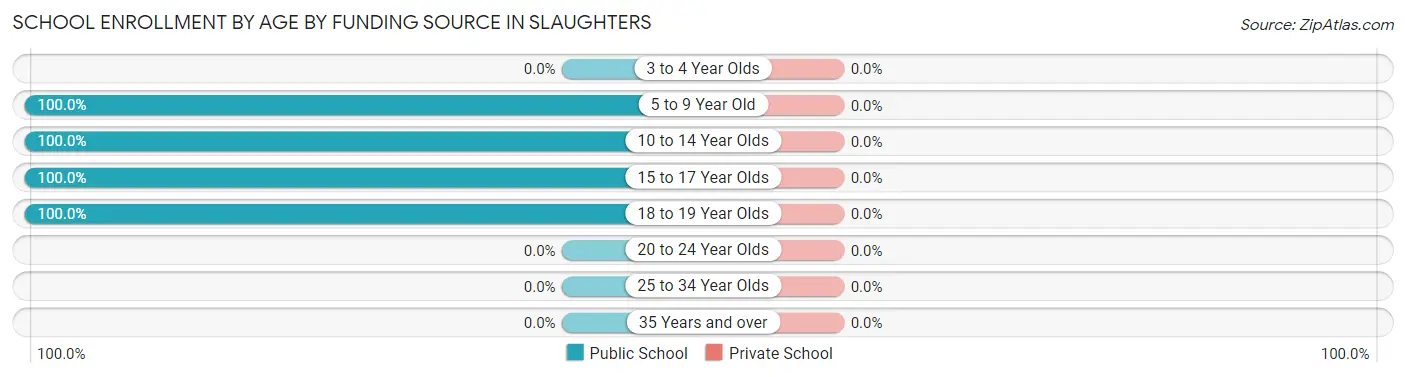
| Age Bracket | Public School | Private School |
| 3 to 4 Year Olds | 0 (0.0%) | 0 (0.0%) |
| 5 to 9 Year Old | 12 (100.0%) | 0 (0.0%) |
| 10 to 14 Year Olds | 12 (100.0%) | 0 (0.0%) |
| 15 to 17 Year Olds | 9 (100.0%) | 0 (0.0%) |
| 18 to 19 Year Olds | 2 (100.0%) | 0 (0.0%) |
| 20 to 24 Year Olds | 0 (0.0%) | 0 (0.0%) |
| 25 to 34 Year Olds | 0 (0.0%) | 0 (0.0%) |
| 35 Years and over | 0 (0.0%) | 0 (0.0%) |
| Total | 35 (100.0%) | 0 (0.0%) |
Educational Attainment by Field of Study in Slaughters
Bio, nature & agricultural (6 | 50.0%), computers & mathematics (2 | 16.7%), science & technology (2 | 16.7%), and education (2 | 16.7%) are the most common fields of study among 12 individuals in Slaughters who have obtained a bachelor's degree or higher.
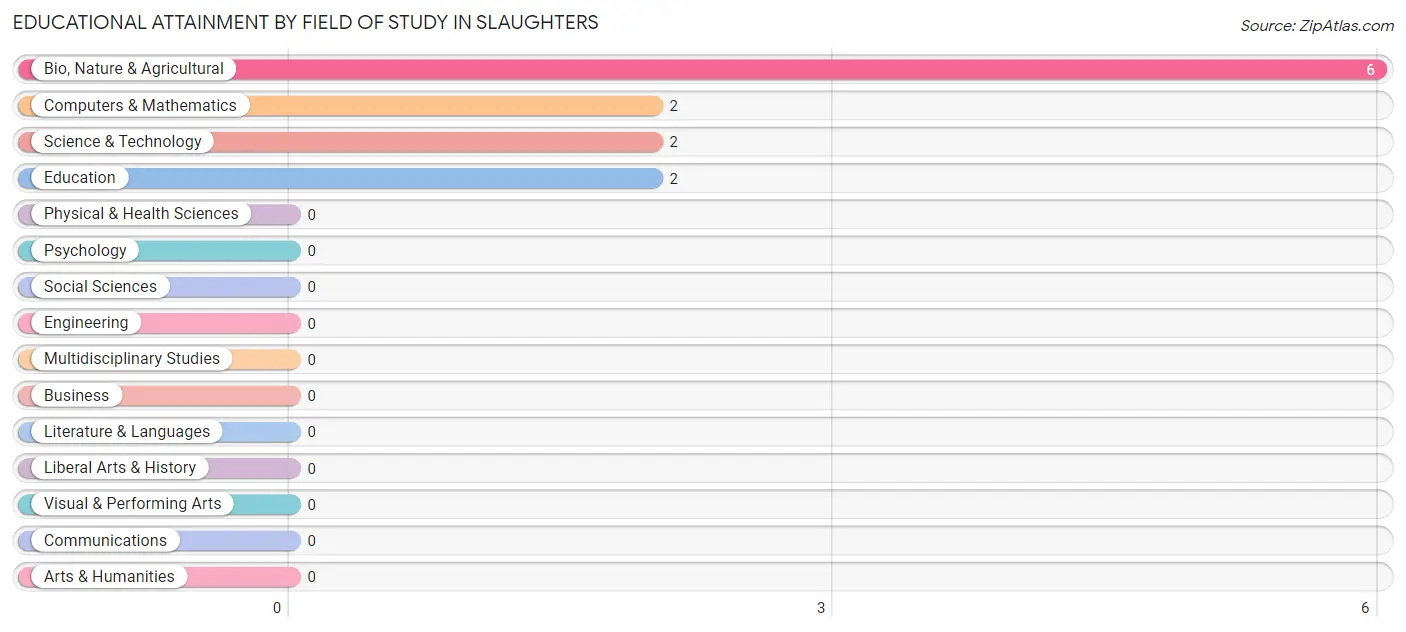
| Field of Study | # Graduates | % Graduates |
| Computers & Mathematics | 2 | 16.7% |
| Bio, Nature & Agricultural | 6 | 50.0% |
| Physical & Health Sciences | 0 | 0.0% |
| Psychology | 0 | 0.0% |
| Social Sciences | 0 | 0.0% |
| Engineering | 0 | 0.0% |
| Multidisciplinary Studies | 0 | 0.0% |
| Science & Technology | 2 | 16.7% |
| Business | 0 | 0.0% |
| Education | 2 | 16.7% |
| Literature & Languages | 0 | 0.0% |
| Liberal Arts & History | 0 | 0.0% |
| Visual & Performing Arts | 0 | 0.0% |
| Communications | 0 | 0.0% |
| Arts & Humanities | 0 | 0.0% |
| Total | 12 | 100.0% |
Transportation & Commute in Slaughters
Vehicle Availability by Sex in Slaughters
The most prevalent vehicle ownership categories in Slaughters are males with 3 vehicles (22, accounting for 57.9%) and females with 3 vehicles (13, making up 55.0%).
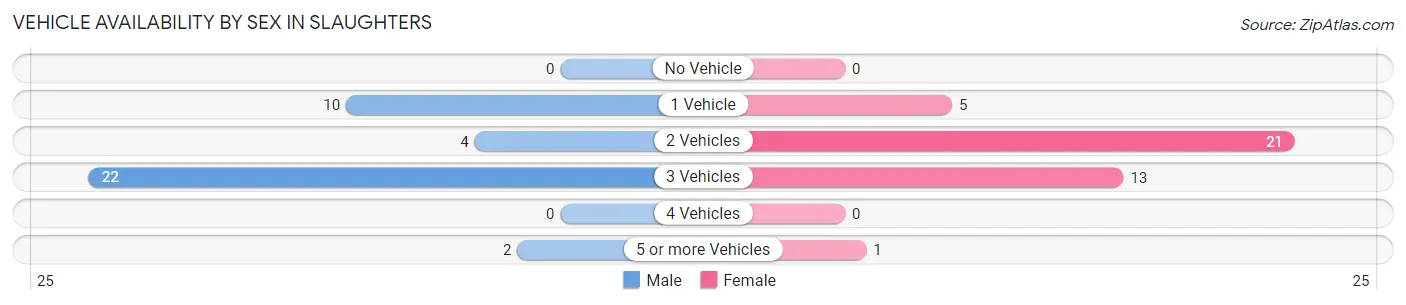
| Vehicles Available | Male | Female |
| No Vehicle | 0 (0.0%) | 0 (0.0%) |
| 1 Vehicle | 10 (26.3%) | 5 (12.5%) |
| 2 Vehicles | 4 (10.5%) | 21 (52.5%) |
| 3 Vehicles | 22 (57.9%) | 13 (32.5%) |
| 4 Vehicles | 0 (0.0%) | 0 (0.0%) |
| 5 or more Vehicles | 2 (5.3%) | 1 (2.5%) |
| Total | 38 (100.0%) | 40 (100.0%) |
Commute Time in Slaughters
The most frequently occuring commute durations in Slaughters are 10 to 14 minutes (25 commuters, 32.1%), less than 5 minutes (11 commuters, 14.1%), and 15 to 19 minutes (9 commuters, 11.5%).
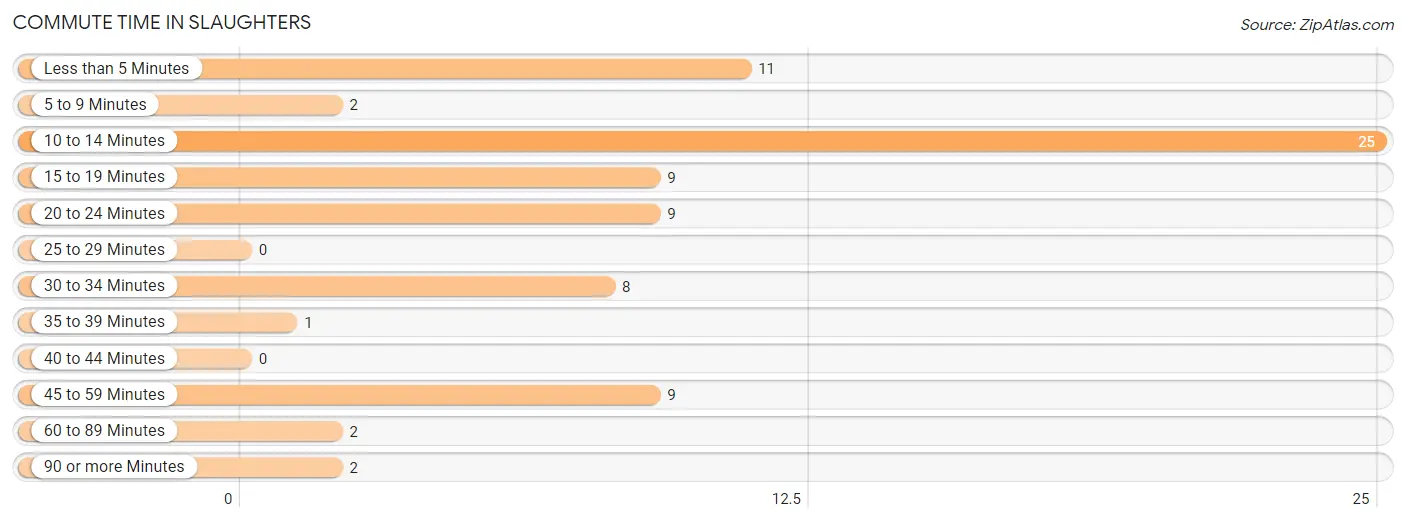
| Commute Time | # Commuters | % Commuters |
| Less than 5 Minutes | 11 | 14.1% |
| 5 to 9 Minutes | 2 | 2.6% |
| 10 to 14 Minutes | 25 | 32.1% |
| 15 to 19 Minutes | 9 | 11.5% |
| 20 to 24 Minutes | 9 | 11.5% |
| 25 to 29 Minutes | 0 | 0.0% |
| 30 to 34 Minutes | 8 | 10.3% |
| 35 to 39 Minutes | 1 | 1.3% |
| 40 to 44 Minutes | 0 | 0.0% |
| 45 to 59 Minutes | 9 | 11.5% |
| 60 to 89 Minutes | 2 | 2.6% |
| 90 or more Minutes | 2 | 2.6% |
Commute Time by Sex in Slaughters
The most common commute times in Slaughters are less than 5 minutes (11 commuters, 28.9%) for males and 10 to 14 minutes (23 commuters, 57.5%) for females.
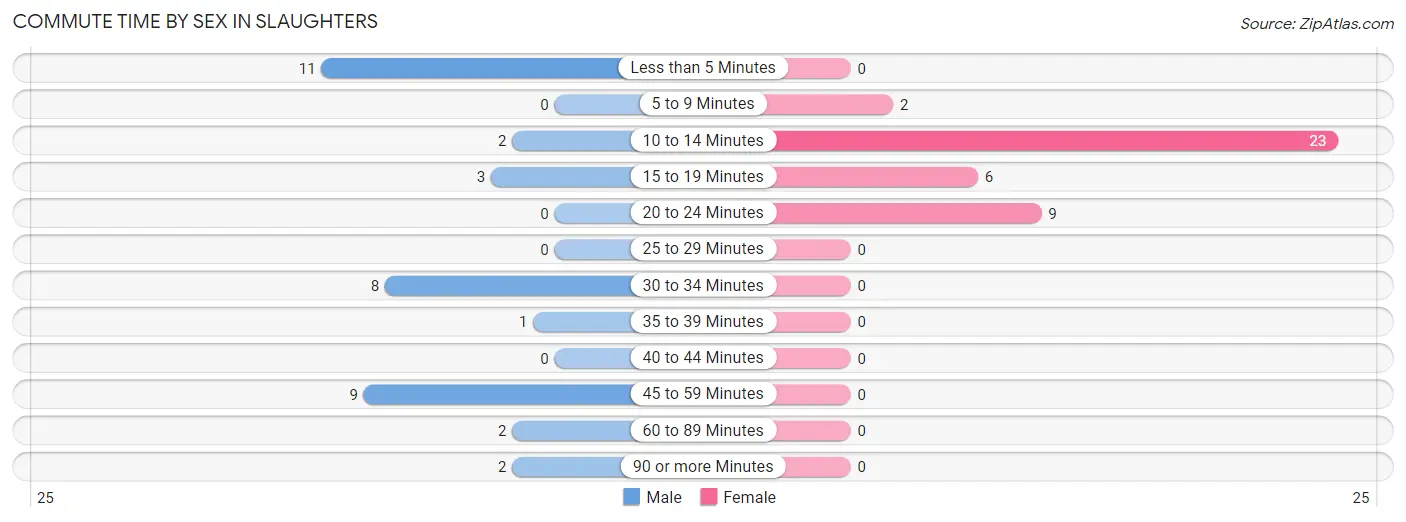
| Commute Time | Male | Female |
| Less than 5 Minutes | 11 (28.9%) | 0 (0.0%) |
| 5 to 9 Minutes | 0 (0.0%) | 2 (5.0%) |
| 10 to 14 Minutes | 2 (5.3%) | 23 (57.5%) |
| 15 to 19 Minutes | 3 (7.9%) | 6 (15.0%) |
| 20 to 24 Minutes | 0 (0.0%) | 9 (22.5%) |
| 25 to 29 Minutes | 0 (0.0%) | 0 (0.0%) |
| 30 to 34 Minutes | 8 (21.0%) | 0 (0.0%) |
| 35 to 39 Minutes | 1 (2.6%) | 0 (0.0%) |
| 40 to 44 Minutes | 0 (0.0%) | 0 (0.0%) |
| 45 to 59 Minutes | 9 (23.7%) | 0 (0.0%) |
| 60 to 89 Minutes | 2 (5.3%) | 0 (0.0%) |
| 90 or more Minutes | 2 (5.3%) | 0 (0.0%) |
Time of Departure to Work by Sex in Slaughters
The most frequent times of departure to work in Slaughters are 6:30 AM to 6:59 AM (8, 21.0%) for males and 8:30 AM to 8:59 AM (16, 40.0%) for females.
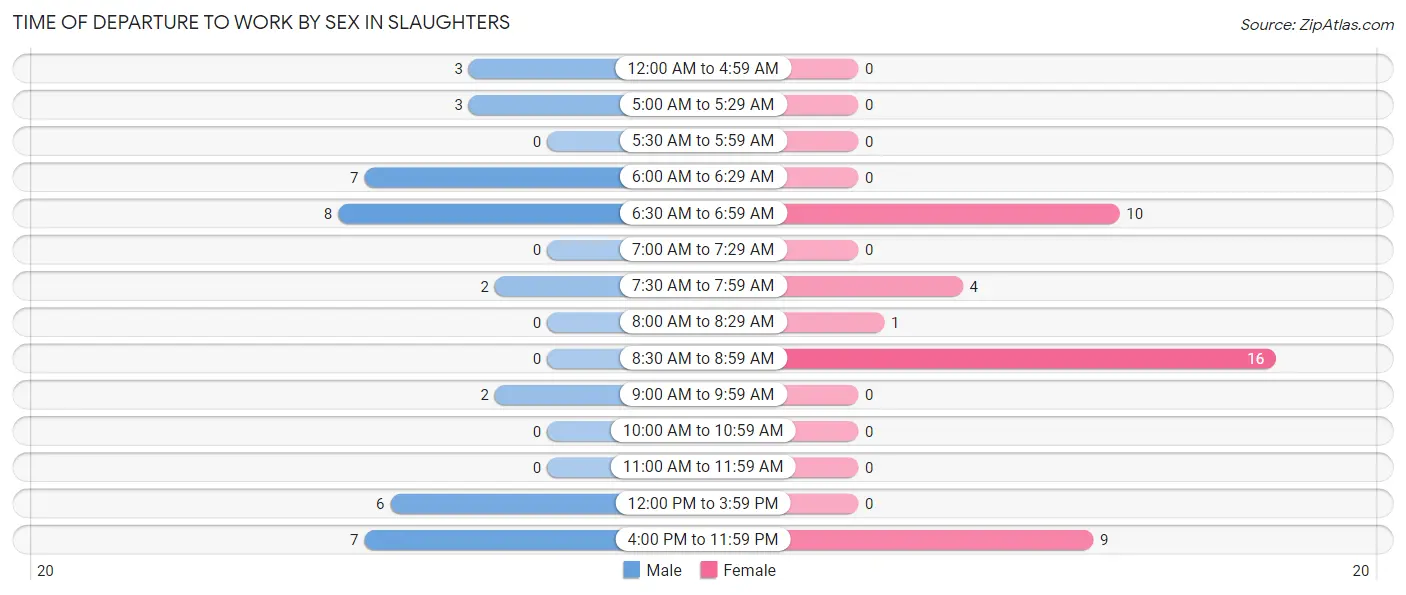
| Time of Departure | Male | Female |
| 12:00 AM to 4:59 AM | 3 (7.9%) | 0 (0.0%) |
| 5:00 AM to 5:29 AM | 3 (7.9%) | 0 (0.0%) |
| 5:30 AM to 5:59 AM | 0 (0.0%) | 0 (0.0%) |
| 6:00 AM to 6:29 AM | 7 (18.4%) | 0 (0.0%) |
| 6:30 AM to 6:59 AM | 8 (21.0%) | 10 (25.0%) |
| 7:00 AM to 7:29 AM | 0 (0.0%) | 0 (0.0%) |
| 7:30 AM to 7:59 AM | 2 (5.3%) | 4 (10.0%) |
| 8:00 AM to 8:29 AM | 0 (0.0%) | 1 (2.5%) |
| 8:30 AM to 8:59 AM | 0 (0.0%) | 16 (40.0%) |
| 9:00 AM to 9:59 AM | 2 (5.3%) | 0 (0.0%) |
| 10:00 AM to 10:59 AM | 0 (0.0%) | 0 (0.0%) |
| 11:00 AM to 11:59 AM | 0 (0.0%) | 0 (0.0%) |
| 12:00 PM to 3:59 PM | 6 (15.8%) | 0 (0.0%) |
| 4:00 PM to 11:59 PM | 7 (18.4%) | 9 (22.5%) |
| Total | 38 (100.0%) | 40 (100.0%) |
Housing Occupancy in Slaughters
Occupancy by Ownership in Slaughters
Of the total 79 dwellings in Slaughters, owner-occupied units account for 57 (72.2%), while renter-occupied units make up 22 (27.9%).
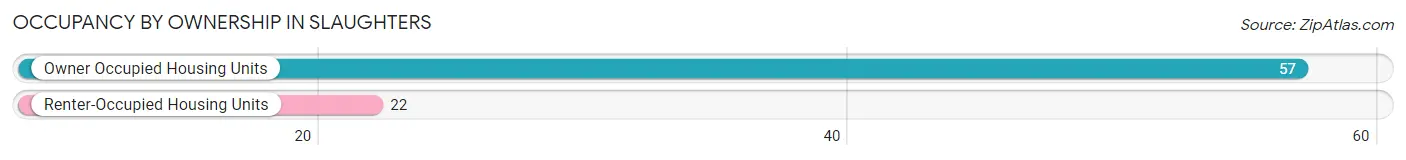
| Occupancy | # Housing Units | % Housing Units |
| Owner Occupied Housing Units | 57 | 72.2% |
| Renter-Occupied Housing Units | 22 | 27.9% |
| Total Occupied Housing Units | 79 | 100.0% |
Occupancy by Household Size in Slaughters
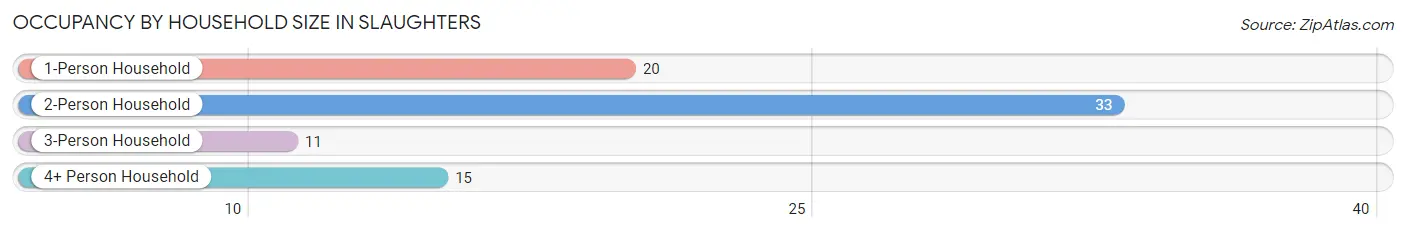
| Household Size | # Housing Units | % Housing Units |
| 1-Person Household | 20 | 25.3% |
| 2-Person Household | 33 | 41.8% |
| 3-Person Household | 11 | 13.9% |
| 4+ Person Household | 15 | 19.0% |
| Total Housing Units | 79 | 100.0% |
Occupancy by Ownership by Household Size in Slaughters
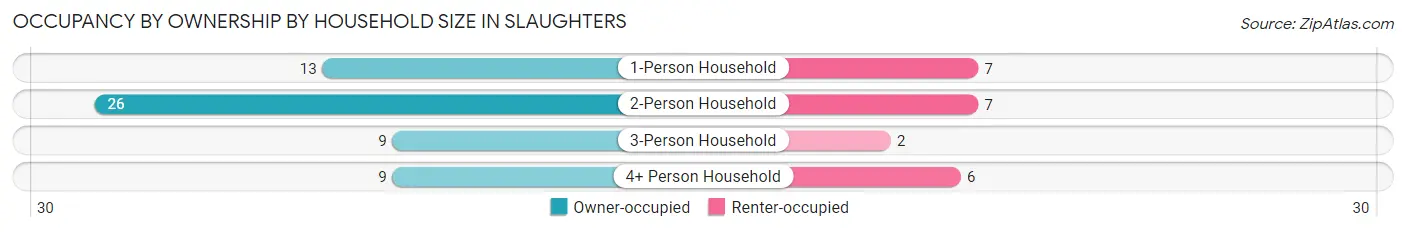
| Household Size | Owner-occupied | Renter-occupied |
| 1-Person Household | 13 (65.0%) | 7 (35.0%) |
| 2-Person Household | 26 (78.8%) | 7 (21.2%) |
| 3-Person Household | 9 (81.8%) | 2 (18.2%) |
| 4+ Person Household | 9 (60.0%) | 6 (40.0%) |
| Total Housing Units | 57 (72.2%) | 22 (27.9%) |
Occupancy by Educational Attainment in Slaughters
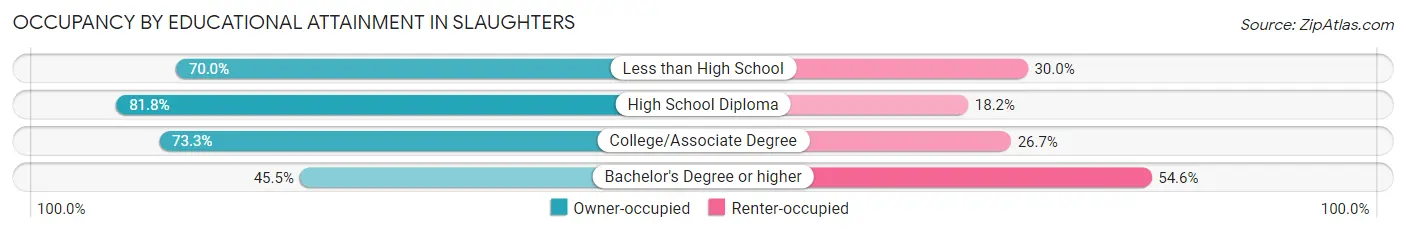
| Household Size | Owner-occupied | Renter-occupied |
| Less than High School | 14 (70.0%) | 6 (30.0%) |
| High School Diploma | 27 (81.8%) | 6 (18.2%) |
| College/Associate Degree | 11 (73.3%) | 4 (26.7%) |
| Bachelor's Degree or higher | 5 (45.5%) | 6 (54.5%) |
Occupancy by Age of Householder in Slaughters
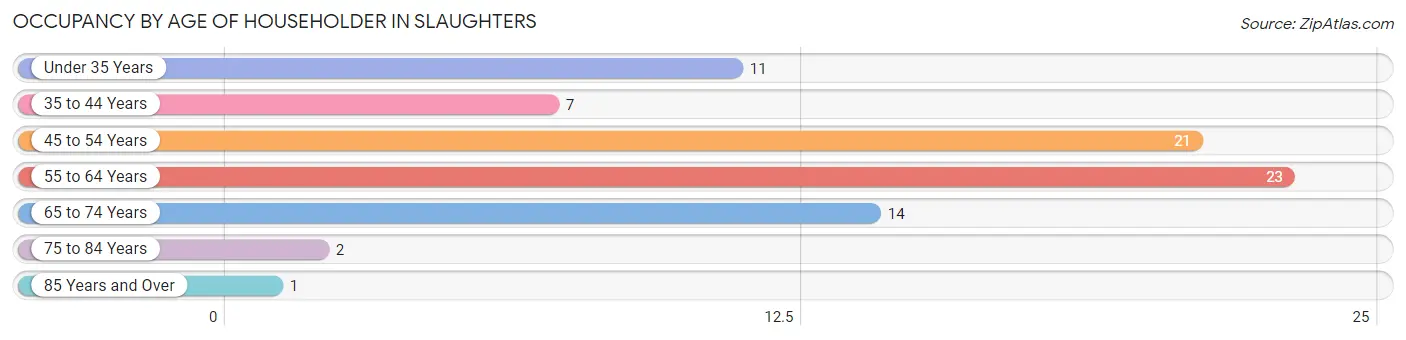
| Age Bracket | # Households | % Households |
| Under 35 Years | 11 | 13.9% |
| 35 to 44 Years | 7 | 8.9% |
| 45 to 54 Years | 21 | 26.6% |
| 55 to 64 Years | 23 | 29.1% |
| 65 to 74 Years | 14 | 17.7% |
| 75 to 84 Years | 2 | 2.5% |
| 85 Years and Over | 1 | 1.3% |
| Total | 79 | 100.0% |
Housing Finances in Slaughters
Median Income by Occupancy in Slaughters
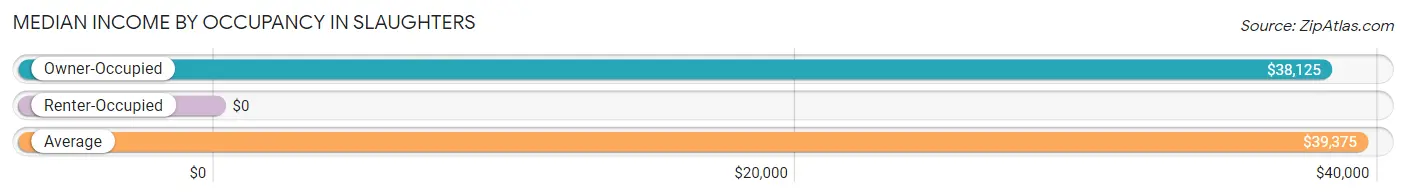
| Occupancy Type | # Households | Median Income |
| Owner-Occupied | 57 (72.2%) | $38,125 |
| Renter-Occupied | 22 (27.9%) | $0 |
| Average | 79 (100.0%) | $39,375 |
Occupancy by Householder Income Bracket in Slaughters
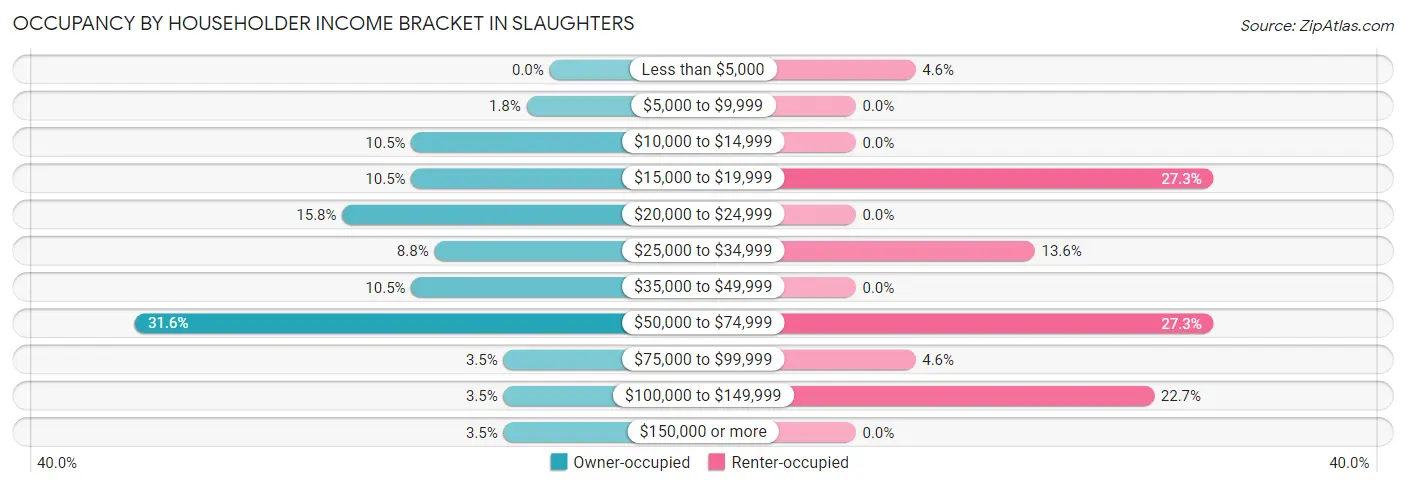
| Income Bracket | Owner-occupied | Renter-occupied |
| Less than $5,000 | 0 (0.0%) | 1 (4.5%) |
| $5,000 to $9,999 | 1 (1.8%) | 0 (0.0%) |
| $10,000 to $14,999 | 6 (10.5%) | 0 (0.0%) |
| $15,000 to $19,999 | 6 (10.5%) | 6 (27.3%) |
| $20,000 to $24,999 | 9 (15.8%) | 0 (0.0%) |
| $25,000 to $34,999 | 5 (8.8%) | 3 (13.6%) |
| $35,000 to $49,999 | 6 (10.5%) | 0 (0.0%) |
| $50,000 to $74,999 | 18 (31.6%) | 6 (27.3%) |
| $75,000 to $99,999 | 2 (3.5%) | 1 (4.5%) |
| $100,000 to $149,999 | 2 (3.5%) | 5 (22.7%) |
| $150,000 or more | 2 (3.5%) | 0 (0.0%) |
| Total | 57 (100.0%) | 22 (100.0%) |
Monthly Housing Cost Tiers in Slaughters
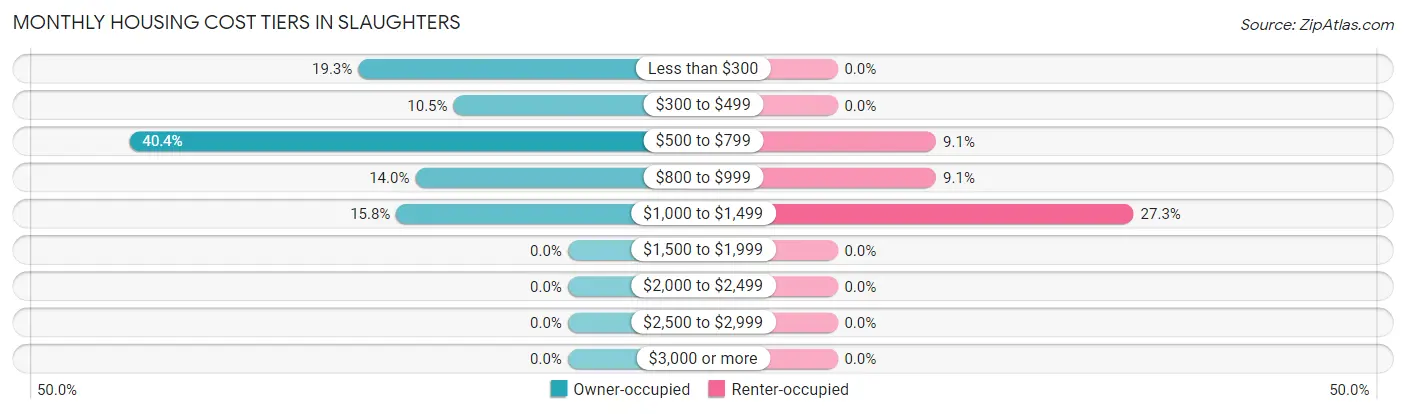
| Monthly Cost | Owner-occupied | Renter-occupied |
| Less than $300 | 11 (19.3%) | 0 (0.0%) |
| $300 to $499 | 6 (10.5%) | 0 (0.0%) |
| $500 to $799 | 23 (40.4%) | 2 (9.1%) |
| $800 to $999 | 8 (14.0%) | 2 (9.1%) |
| $1,000 to $1,499 | 9 (15.8%) | 6 (27.3%) |
| $1,500 to $1,999 | 0 (0.0%) | 0 (0.0%) |
| $2,000 to $2,499 | 0 (0.0%) | 0 (0.0%) |
| $2,500 to $2,999 | 0 (0.0%) | 0 (0.0%) |
| $3,000 or more | 0 (0.0%) | 0 (0.0%) |
| Total | 57 (100.0%) | 22 (100.0%) |
Physical Housing Characteristics in Slaughters
Housing Structures in Slaughters
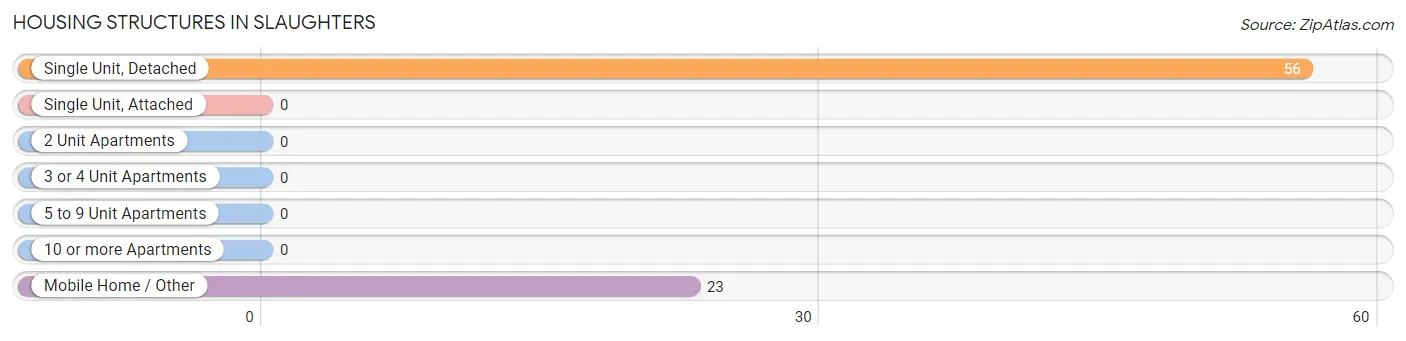
| Structure Type | # Housing Units | % Housing Units |
| Single Unit, Detached | 56 | 70.9% |
| Single Unit, Attached | 0 | 0.0% |
| 2 Unit Apartments | 0 | 0.0% |
| 3 or 4 Unit Apartments | 0 | 0.0% |
| 5 to 9 Unit Apartments | 0 | 0.0% |
| 10 or more Apartments | 0 | 0.0% |
| Mobile Home / Other | 23 | 29.1% |
| Total | 79 | 100.0% |
Housing Structures by Occupancy in Slaughters
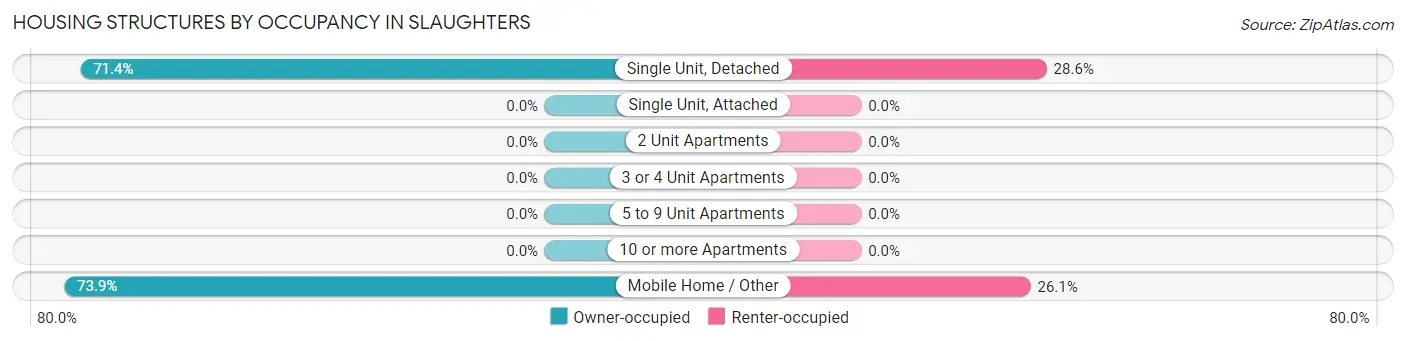
| Structure Type | Owner-occupied | Renter-occupied |
| Single Unit, Detached | 40 (71.4%) | 16 (28.6%) |
| Single Unit, Attached | 0 (0.0%) | 0 (0.0%) |
| 2 Unit Apartments | 0 (0.0%) | 0 (0.0%) |
| 3 or 4 Unit Apartments | 0 (0.0%) | 0 (0.0%) |
| 5 to 9 Unit Apartments | 0 (0.0%) | 0 (0.0%) |
| 10 or more Apartments | 0 (0.0%) | 0 (0.0%) |
| Mobile Home / Other | 17 (73.9%) | 6 (26.1%) |
| Total | 57 (72.2%) | 22 (27.9%) |
Housing Structures by Number of Rooms in Slaughters
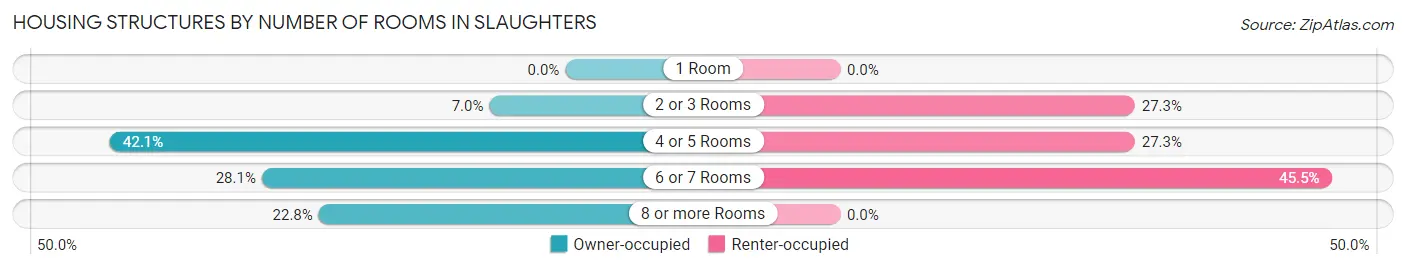
| Number of Rooms | Owner-occupied | Renter-occupied |
| 1 Room | 0 (0.0%) | 0 (0.0%) |
| 2 or 3 Rooms | 4 (7.0%) | 6 (27.3%) |
| 4 or 5 Rooms | 24 (42.1%) | 6 (27.3%) |
| 6 or 7 Rooms | 16 (28.1%) | 10 (45.5%) |
| 8 or more Rooms | 13 (22.8%) | 0 (0.0%) |
| Total | 57 (100.0%) | 22 (100.0%) |
Housing Structure by Heating Type in Slaughters
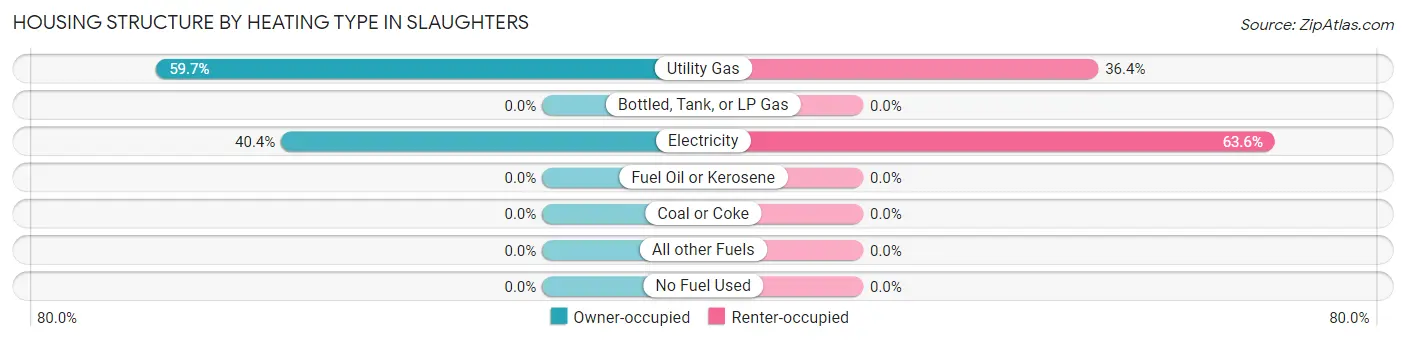
| Heating Type | Owner-occupied | Renter-occupied |
| Utility Gas | 34 (59.7%) | 8 (36.4%) |
| Bottled, Tank, or LP Gas | 0 (0.0%) | 0 (0.0%) |
| Electricity | 23 (40.4%) | 14 (63.6%) |
| Fuel Oil or Kerosene | 0 (0.0%) | 0 (0.0%) |
| Coal or Coke | 0 (0.0%) | 0 (0.0%) |
| All other Fuels | 0 (0.0%) | 0 (0.0%) |
| No Fuel Used | 0 (0.0%) | 0 (0.0%) |
| Total | 57 (100.0%) | 22 (100.0%) |
Household Vehicle Usage in Slaughters
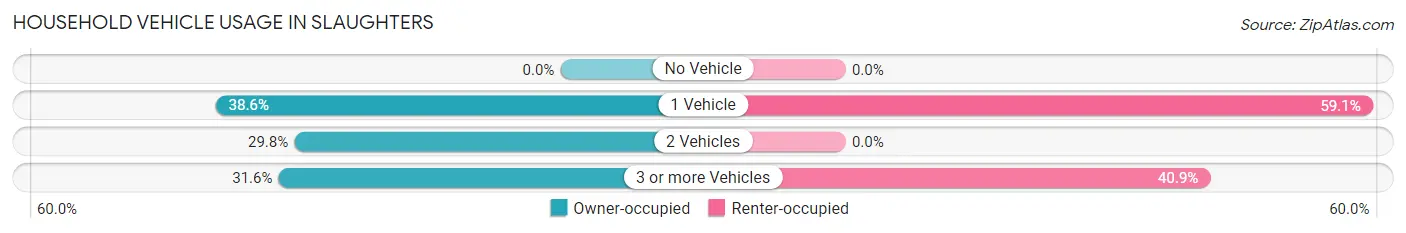
| Vehicles per Household | Owner-occupied | Renter-occupied |
| No Vehicle | 0 (0.0%) | 0 (0.0%) |
| 1 Vehicle | 22 (38.6%) | 13 (59.1%) |
| 2 Vehicles | 17 (29.8%) | 0 (0.0%) |
| 3 or more Vehicles | 18 (31.6%) | 9 (40.9%) |
| Total | 57 (100.0%) | 22 (100.0%) |
Real Estate & Mortgages in Slaughters
Real Estate and Mortgage Overview in Slaughters
| Characteristic | Without Mortgage | With Mortgage |
| Housing Units | 20 | 37 |
| Median Property Value | - | - |
| Median Household Income | $25,000 | $2 |
| Monthly Housing Costs | $275 | $0 |
| Real Estate Taxes | - | - |
Property Value by Mortgage Status in Slaughters
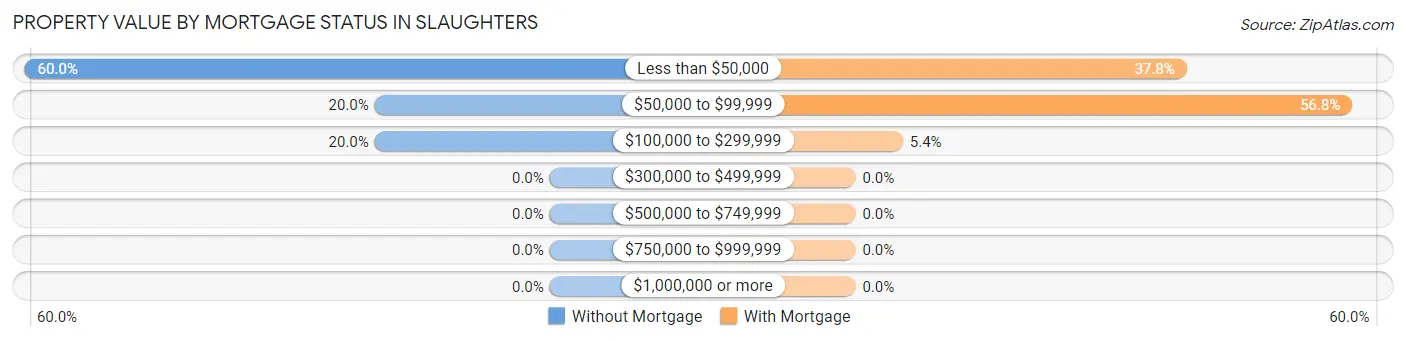
| Property Value | Without Mortgage | With Mortgage |
| Less than $50,000 | 12 (60.0%) | 14 (37.8%) |
| $50,000 to $99,999 | 4 (20.0%) | 21 (56.8%) |
| $100,000 to $299,999 | 4 (20.0%) | 2 (5.4%) |
| $300,000 to $499,999 | 0 (0.0%) | 0 (0.0%) |
| $500,000 to $749,999 | 0 (0.0%) | 0 (0.0%) |
| $750,000 to $999,999 | 0 (0.0%) | 0 (0.0%) |
| $1,000,000 or more | 0 (0.0%) | 0 (0.0%) |
| Total | 20 (100.0%) | 37 (100.0%) |
Household Income by Mortgage Status in Slaughters
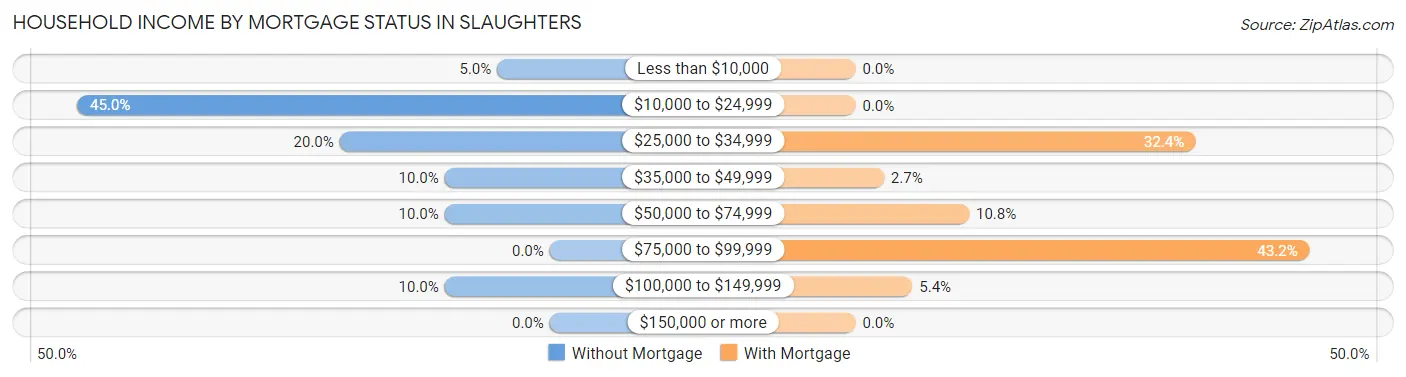
| Household Income | Without Mortgage | With Mortgage |
| Less than $10,000 | 1 (5.0%) | 0 (0.0%) |
| $10,000 to $24,999 | 9 (45.0%) | 0 (0.0%) |
| $25,000 to $34,999 | 4 (20.0%) | 12 (32.4%) |
| $35,000 to $49,999 | 2 (10.0%) | 1 (2.7%) |
| $50,000 to $74,999 | 2 (10.0%) | 4 (10.8%) |
| $75,000 to $99,999 | 0 (0.0%) | 16 (43.2%) |
| $100,000 to $149,999 | 2 (10.0%) | 2 (5.4%) |
| $150,000 or more | 0 (0.0%) | 0 (0.0%) |
| Total | 20 (100.0%) | 37 (100.0%) |
Property Value to Household Income Ratio in Slaughters
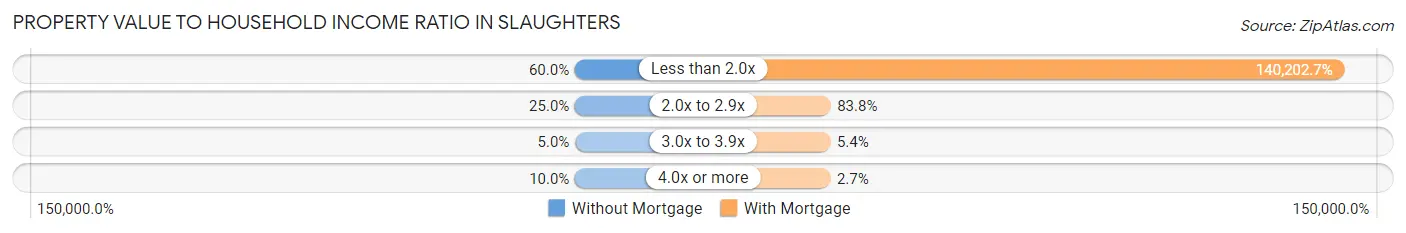
| Value-to-Income Ratio | Without Mortgage | With Mortgage |
| Less than 2.0x | 12 (60.0%) | 51,875 (140,202.7%) |
| 2.0x to 2.9x | 5 (25.0%) | 31 (83.8%) |
| 3.0x to 3.9x | 1 (5.0%) | 2 (5.4%) |
| 4.0x or more | 2 (10.0%) | 1 (2.7%) |
| Total | 20 (100.0%) | 37 (100.0%) |
Real Estate Taxes by Mortgage Status in Slaughters
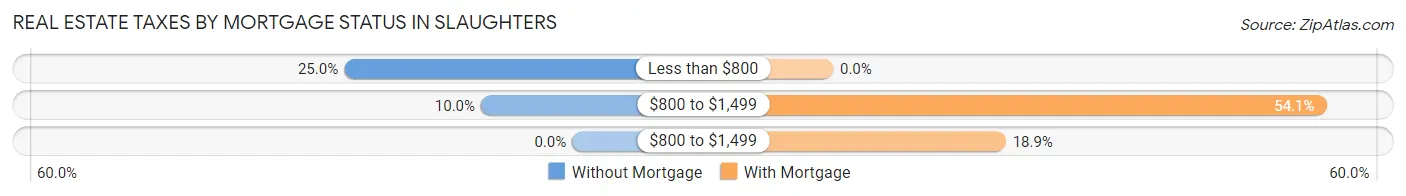
| Property Taxes | Without Mortgage | With Mortgage |
| Less than $800 | 5 (25.0%) | 0 (0.0%) |
| $800 to $1,499 | 2 (10.0%) | 20 (54.0%) |
| $800 to $1,499 | 0 (0.0%) | 7 (18.9%) |
| Total | 20 (100.0%) | 37 (100.0%) |
Health & Disability in Slaughters
Health Insurance Coverage by Age in Slaughters
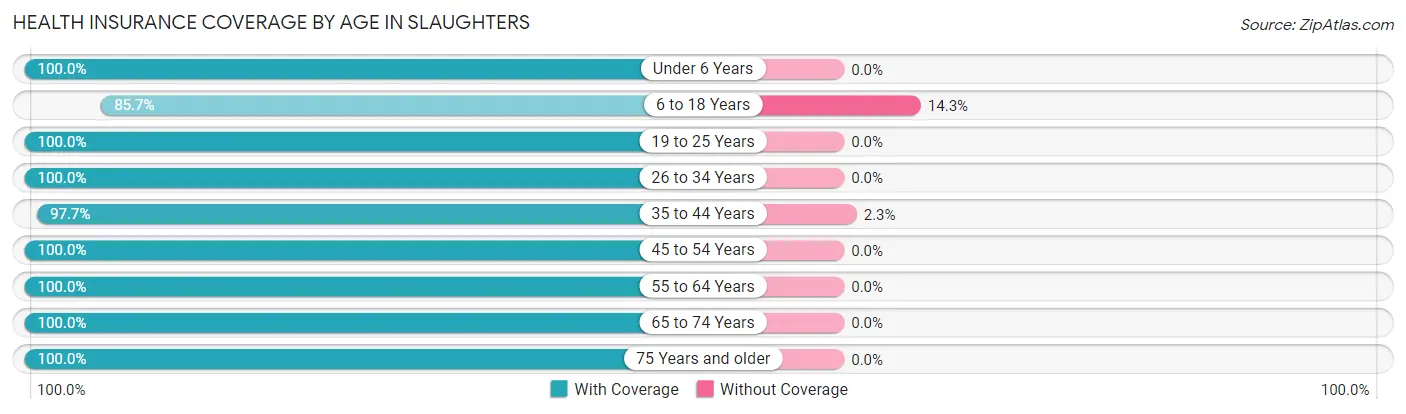
| Age Bracket | With Coverage | Without Coverage |
| Under 6 Years | 10 (100.0%) | 0 (0.0%) |
| 6 to 18 Years | 30 (85.7%) | 5 (14.3%) |
| 19 to 25 Years | 11 (100.0%) | 0 (0.0%) |
| 26 to 34 Years | 15 (100.0%) | 0 (0.0%) |
| 35 to 44 Years | 42 (97.7%) | 1 (2.3%) |
| 45 to 54 Years | 33 (100.0%) | 0 (0.0%) |
| 55 to 64 Years | 32 (100.0%) | 0 (0.0%) |
| 65 to 74 Years | 16 (100.0%) | 0 (0.0%) |
| 75 Years and older | 6 (100.0%) | 0 (0.0%) |
| Total | 195 (97.0%) | 6 (3.0%) |
Health Insurance Coverage by Citizenship Status in Slaughters
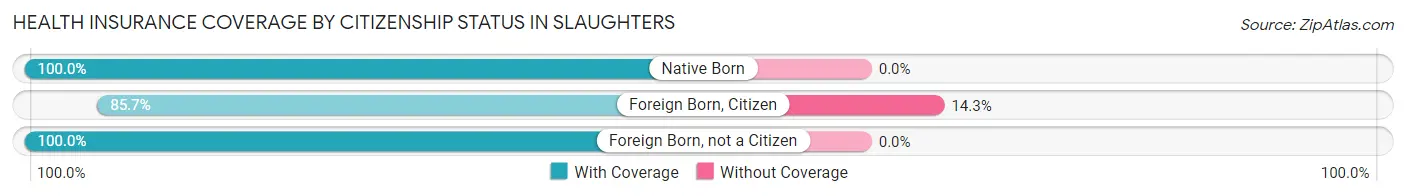
| Citizenship Status | With Coverage | Without Coverage |
| Native Born | 10 (100.0%) | 0 (0.0%) |
| Foreign Born, Citizen | 30 (85.7%) | 5 (14.3%) |
| Foreign Born, not a Citizen | 11 (100.0%) | 0 (0.0%) |
Health Insurance Coverage by Household Income in Slaughters
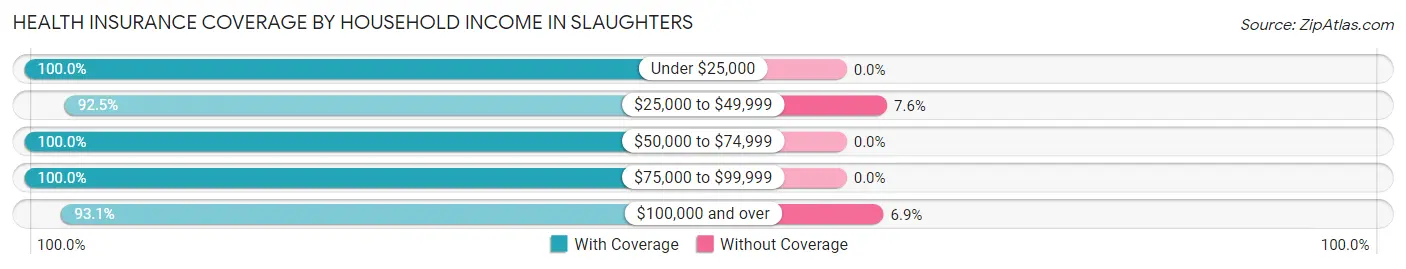
| Household Income | With Coverage | Without Coverage |
| Under $25,000 | 68 (100.0%) | 0 (0.0%) |
| $25,000 to $49,999 | 49 (92.4%) | 4 (7.5%) |
| $50,000 to $74,999 | 41 (100.0%) | 0 (0.0%) |
| $75,000 to $99,999 | 10 (100.0%) | 0 (0.0%) |
| $100,000 and over | 27 (93.1%) | 2 (6.9%) |
Public vs Private Health Insurance Coverage by Age in Slaughters
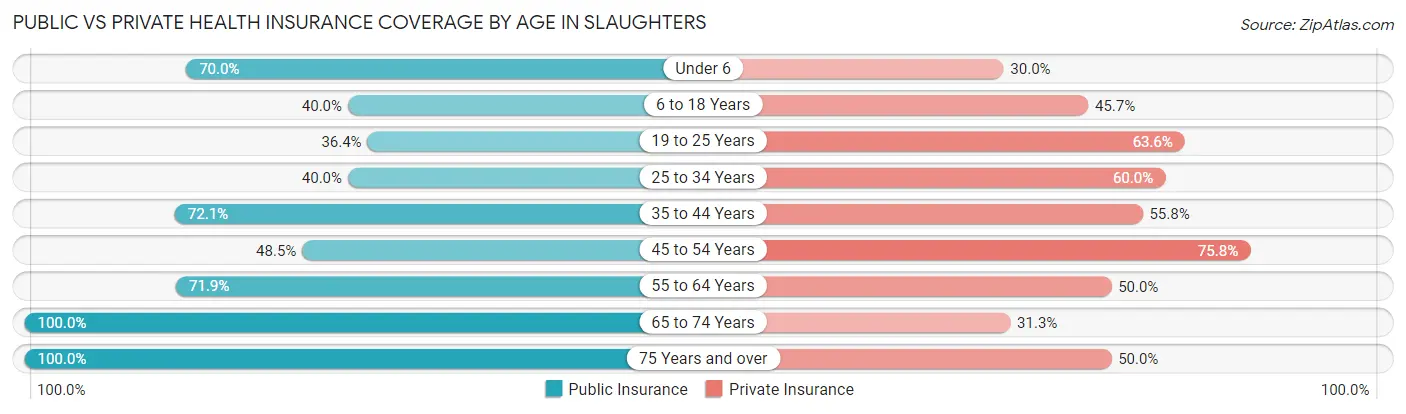
| Age Bracket | Public Insurance | Private Insurance |
| Under 6 | 7 (70.0%) | 3 (30.0%) |
| 6 to 18 Years | 14 (40.0%) | 16 (45.7%) |
| 19 to 25 Years | 4 (36.4%) | 7 (63.6%) |
| 25 to 34 Years | 6 (40.0%) | 9 (60.0%) |
| 35 to 44 Years | 31 (72.1%) | 24 (55.8%) |
| 45 to 54 Years | 16 (48.5%) | 25 (75.8%) |
| 55 to 64 Years | 23 (71.9%) | 16 (50.0%) |
| 65 to 74 Years | 16 (100.0%) | 5 (31.2%) |
| 75 Years and over | 6 (100.0%) | 3 (50.0%) |
| Total | 123 (61.2%) | 108 (53.7%) |
Disability Status by Sex by Age in Slaughters
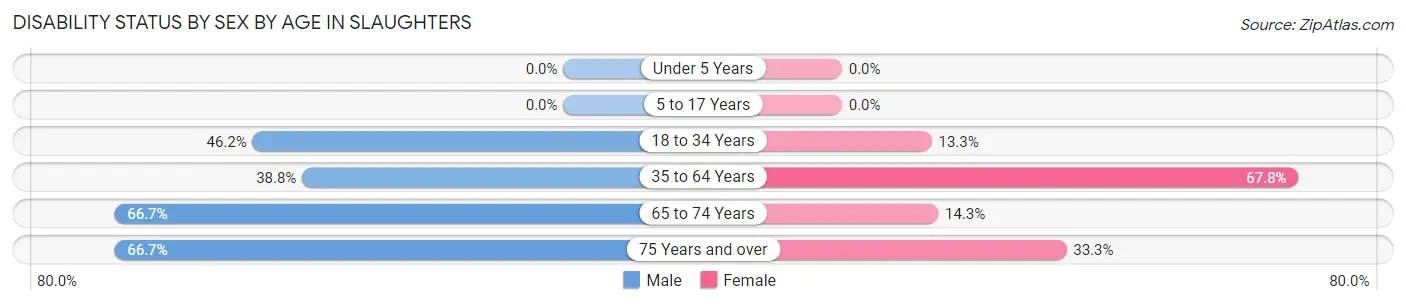
| Age Bracket | Male | Female |
| Under 5 Years | 0 (0.0%) | 0 (0.0%) |
| 5 to 17 Years | 0 (0.0%) | 0 (0.0%) |
| 18 to 34 Years | 6 (46.2%) | 2 (13.3%) |
| 35 to 64 Years | 19 (38.8%) | 40 (67.8%) |
| 65 to 74 Years | 6 (66.7%) | 1 (14.3%) |
| 75 Years and over | 2 (66.7%) | 1 (33.3%) |
Disability Class by Sex by Age in Slaughters
Disability Class: Hearing Difficulty
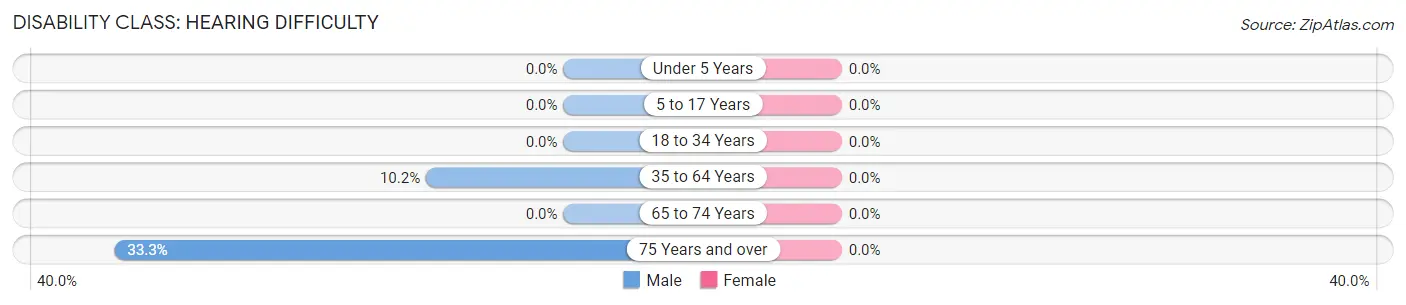
| Age Bracket | Male | Female |
| Under 5 Years | 0 (0.0%) | 0 (0.0%) |
| 5 to 17 Years | 0 (0.0%) | 0 (0.0%) |
| 18 to 34 Years | 0 (0.0%) | 0 (0.0%) |
| 35 to 64 Years | 5 (10.2%) | 0 (0.0%) |
| 65 to 74 Years | 0 (0.0%) | 0 (0.0%) |
| 75 Years and over | 1 (33.3%) | 0 (0.0%) |
Disability Class: Vision Difficulty
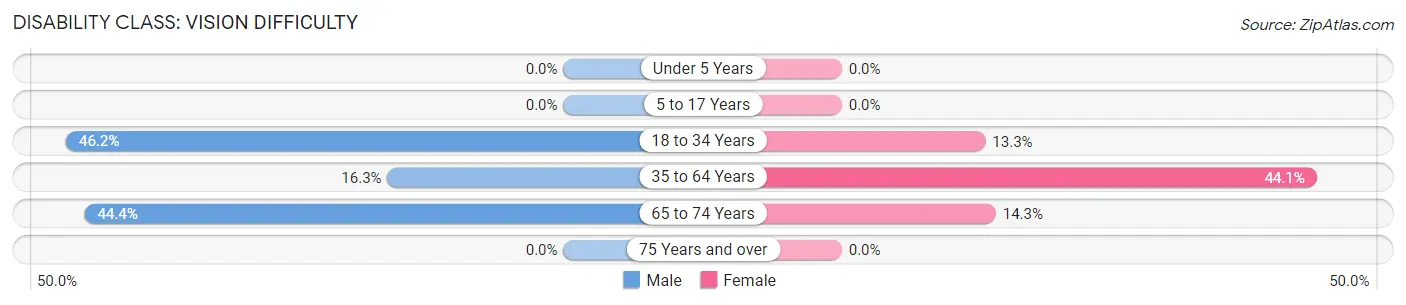
| Age Bracket | Male | Female |
| Under 5 Years | 0 (0.0%) | 0 (0.0%) |
| 5 to 17 Years | 0 (0.0%) | 0 (0.0%) |
| 18 to 34 Years | 6 (46.2%) | 2 (13.3%) |
| 35 to 64 Years | 8 (16.3%) | 26 (44.1%) |
| 65 to 74 Years | 4 (44.4%) | 1 (14.3%) |
| 75 Years and over | 0 (0.0%) | 0 (0.0%) |
Disability Class: Cognitive Difficulty
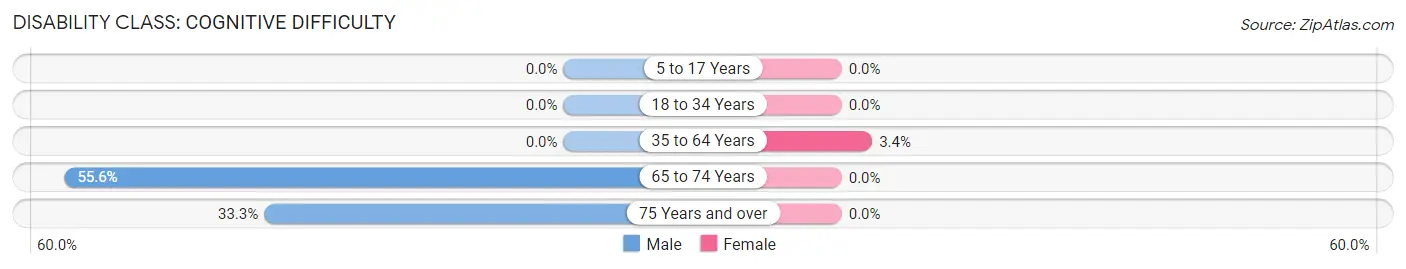
| Age Bracket | Male | Female |
| 5 to 17 Years | 0 (0.0%) | 0 (0.0%) |
| 18 to 34 Years | 0 (0.0%) | 0 (0.0%) |
| 35 to 64 Years | 0 (0.0%) | 2 (3.4%) |
| 65 to 74 Years | 5 (55.6%) | 0 (0.0%) |
| 75 Years and over | 1 (33.3%) | 0 (0.0%) |
Disability Class: Ambulatory Difficulty
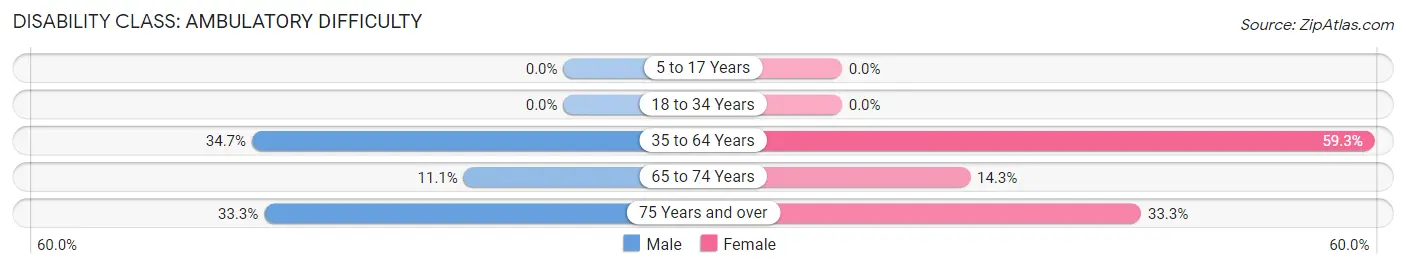
| Age Bracket | Male | Female |
| 5 to 17 Years | 0 (0.0%) | 0 (0.0%) |
| 18 to 34 Years | 0 (0.0%) | 0 (0.0%) |
| 35 to 64 Years | 17 (34.7%) | 35 (59.3%) |
| 65 to 74 Years | 1 (11.1%) | 1 (14.3%) |
| 75 Years and over | 1 (33.3%) | 1 (33.3%) |
Disability Class: Self-Care Difficulty
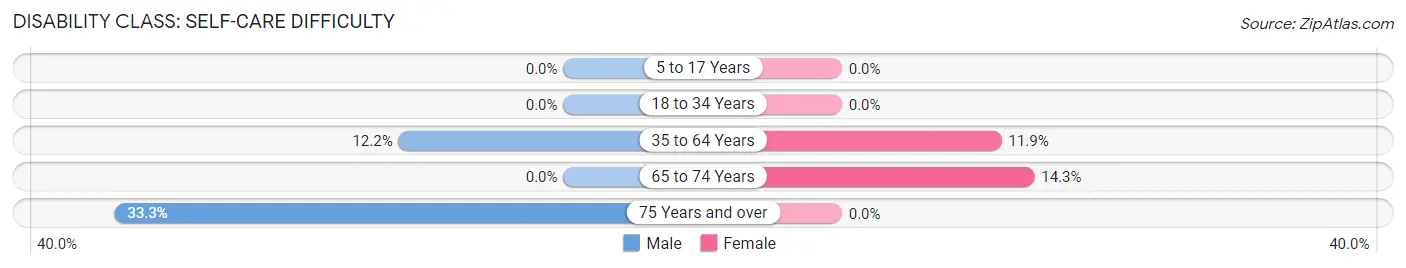
| Age Bracket | Male | Female |
| 5 to 17 Years | 0 (0.0%) | 0 (0.0%) |
| 18 to 34 Years | 0 (0.0%) | 0 (0.0%) |
| 35 to 64 Years | 6 (12.2%) | 7 (11.9%) |
| 65 to 74 Years | 0 (0.0%) | 1 (14.3%) |
| 75 Years and over | 1 (33.3%) | 0 (0.0%) |
Technology Access in Slaughters
Computing Device Access in Slaughters
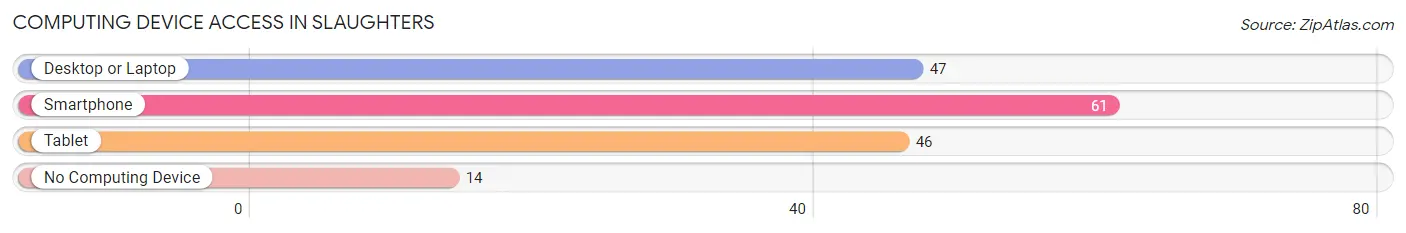
| Device Type | # Households | % Households |
| Desktop or Laptop | 47 | 59.5% |
| Smartphone | 61 | 77.2% |
| Tablet | 46 | 58.2% |
| No Computing Device | 14 | 17.7% |
| Total | 79 | 100.0% |
Internet Access in Slaughters
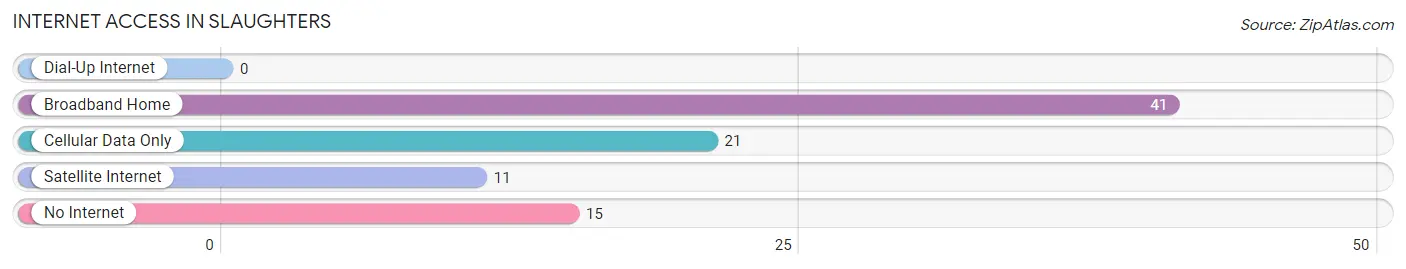
| Internet Type | # Households | % Households |
| Dial-Up Internet | 0 | 0.0% |
| Broadband Home | 41 | 51.9% |
| Cellular Data Only | 21 | 26.6% |
| Satellite Internet | 11 | 13.9% |
| No Internet | 15 | 19.0% |
| Total | 79 | 100.0% |
Slaughters Summary
Slaughters is a small unincorporated community located in the western part of Kentucky in the United States. It is situated in the county of Muhlenberg, and is part of the Owensboro metropolitan area. The population of Slaughters was estimated to be around 1,000 in 2020.
History
Slaughters was first settled in the early 1800s by a group of settlers from Virginia. The town was named after a local family, the Slaughters, who were among the first settlers. The town was officially established in 1820 and was incorporated in 1837.
The town was a major stop on the Louisville and Nashville Railroad, which ran through the area in the late 1800s. This allowed the town to become a major hub for the transportation of goods and services. The railroad also helped to bring in new businesses and industries to the area.
In the early 1900s, the town was home to several coal mines, which provided employment for many of the town's residents. The coal industry was a major part of the town's economy until the mid-1900s when the mines began to close.
Geography
Slaughters is located in western Kentucky, in the county of Muhlenberg. It is situated in the Owensboro metropolitan area, which is located in the western part of the state. The town is located on the banks of the Green River, which is a major tributary of the Ohio River.
The town is located in a rural area, with the nearest major city being Owensboro, which is located about 25 miles away. The town is surrounded by rolling hills and farmland, and is home to several small lakes and streams.
Economy
The economy of Slaughters is largely based on agriculture and tourism. The town is home to several farms, which produce a variety of crops, including corn, soybeans, and wheat. The town is also home to several small businesses, including restaurants, convenience stores, and gas stations.
The town is also home to several tourist attractions, including the Green River State Park, which is located just outside of town. The park offers a variety of outdoor activities, including camping, fishing, and hiking.
Demographics
The population of Slaughters was estimated to be around 1,000 in 2020. The town is predominantly white, with the majority of the population being of European descent. The town also has a small African American population, as well as a small Hispanic population. The median household income in the town is around $35,000, and the median home value is around $90,000.
Common Questions
What is Per Capita Income in Slaughters?
Per Capita income in Slaughters is $21,050.
What is the Median Family Income in Slaughters?
Median Family Income in Slaughters is $34,583.
What is the Median Household income in Slaughters?
Median Household Income in Slaughters is $39,375.
What is Inequality or Gini Index in Slaughters?
Inequality or Gini Index in Slaughters is 0.40.
What is the Total Population of Slaughters?
Total Population of Slaughters is 201.
What is the Total Male Population of Slaughters?
Total Male Population of Slaughters is 85.
What is the Total Female Population of Slaughters?
Total Female Population of Slaughters is 116.
What is the Ratio of Males per 100 Females in Slaughters?
There are 73.28 Males per 100 Females in Slaughters.
What is the Ratio of Females per 100 Males in Slaughters?
There are 136.47 Females per 100 Males in Slaughters.
What is the Median Population Age in Slaughters?
Median Population Age in Slaughters is 39.8 Years.
What is the Average Family Size in Slaughters
Average Family Size in Slaughters is 3.0 People.
What is the Average Household Size in Slaughters
Average Household Size in Slaughters is 2.5 People.
How Large is the Labor Force in Slaughters?
There are 84 People in the Labor Forcein in Slaughters.
What is the Percentage of People in the Labor Force in Slaughters?
50.3% of People are in the Labor Force in Slaughters.
What is the Unemployment Rate in Slaughters?
Unemployment Rate in Slaughters is 7.1%.