Zip Codes with the Highest Percentage of Population Employed in Life, Physical & Social Science in Bowling Green, KY
RELATED REPORTS & OPTIONS
Life, Physical & Social Science
Bowling Green
Compare Zip Codes
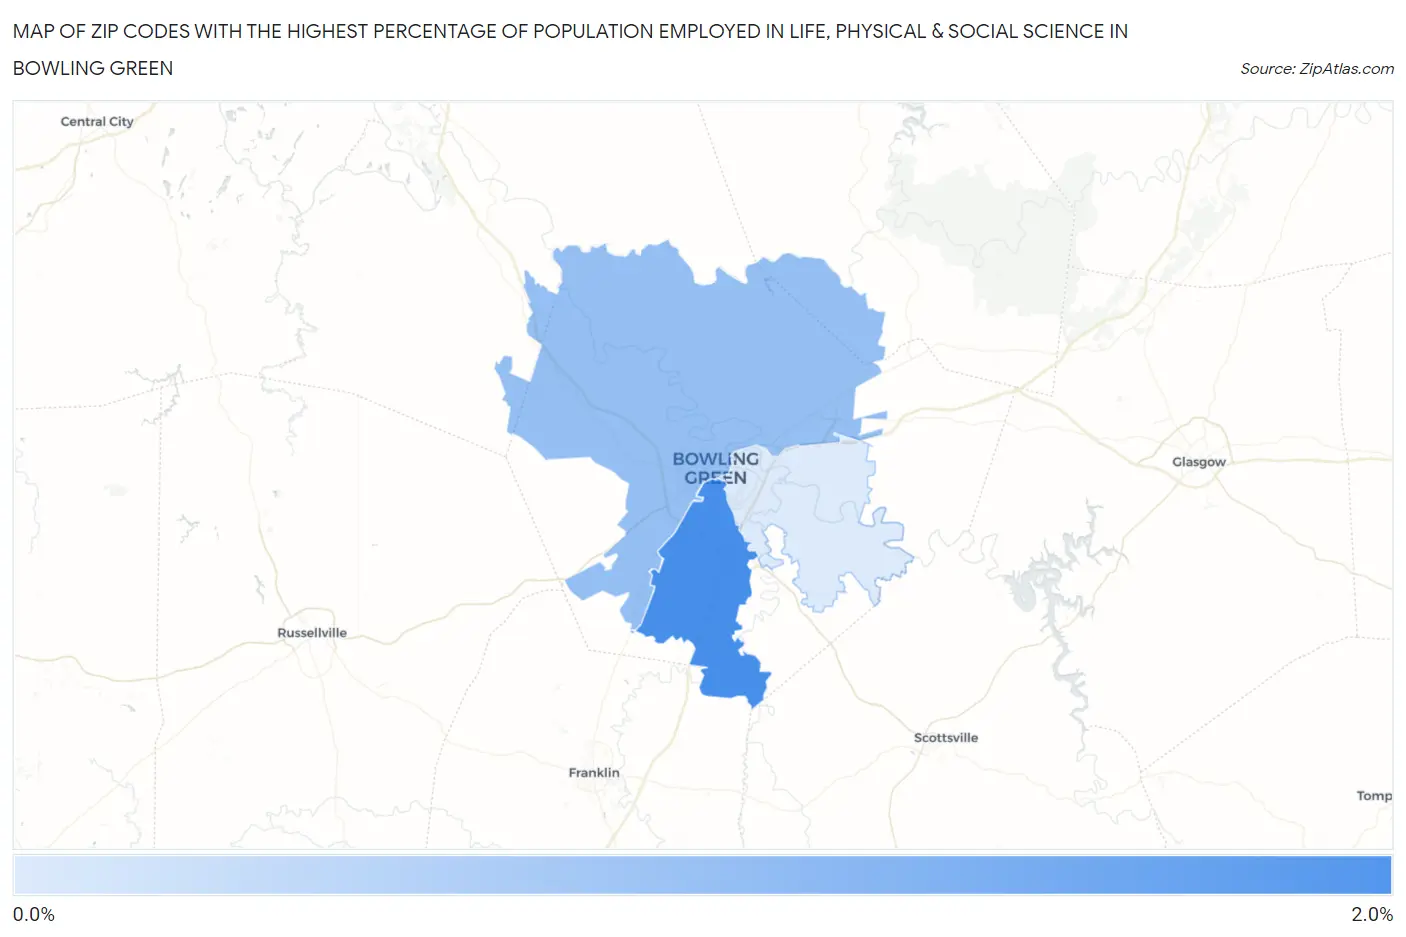
Map of Zip Codes with the Highest Percentage of Population Employed in Life, Physical & Social Science in Bowling Green
0.19%
1.7%
Zip Codes with the Highest Percentage of Population Employed in Life, Physical & Social Science in Bowling Green, KY
| Zip Code | % Employed | vs State | vs National | |
| 1. | 42104 | 1.7% | 0.77%(+0.962)#48 | 1.1%(+0.638)#4,596 |
| 2. | 42101 | 0.93% | 0.77%(+0.163)#120 | 1.1%(-0.161)#9,672 |
| 3. | 42103 | 0.19% | 0.77%(-0.578)#247 | 1.1%(-0.902)#18,318 |
1
Common Questions
What are the Top Zip Codes with the Highest Percentage of Population Employed in Life, Physical & Social Science in Bowling Green, KY?
Top Zip Codes with the Highest Percentage of Population Employed in Life, Physical & Social Science in Bowling Green, KY are:
What zip code has the Highest Percentage of Population Employed in Life, Physical & Social Science in Bowling Green, KY?
42104 has the Highest Percentage of Population Employed in Life, Physical & Social Science in Bowling Green, KY with 1.7%.
What is the Percentage of Population Employed in Life, Physical & Social Science in Bowling Green, KY?
Percentage of Population Employed in Life, Physical & Social Science in Bowling Green is 0.80%.
What is the Percentage of Population Employed in Life, Physical & Social Science in Kentucky?
Percentage of Population Employed in Life, Physical & Social Science in Kentucky is 0.77%.
What is the Percentage of Population Employed in Life, Physical & Social Science in the United States?
Percentage of Population Employed in Life, Physical & Social Science in the United States is 1.1%.