North Corbin, KY Map & Demographics
North Corbin Map
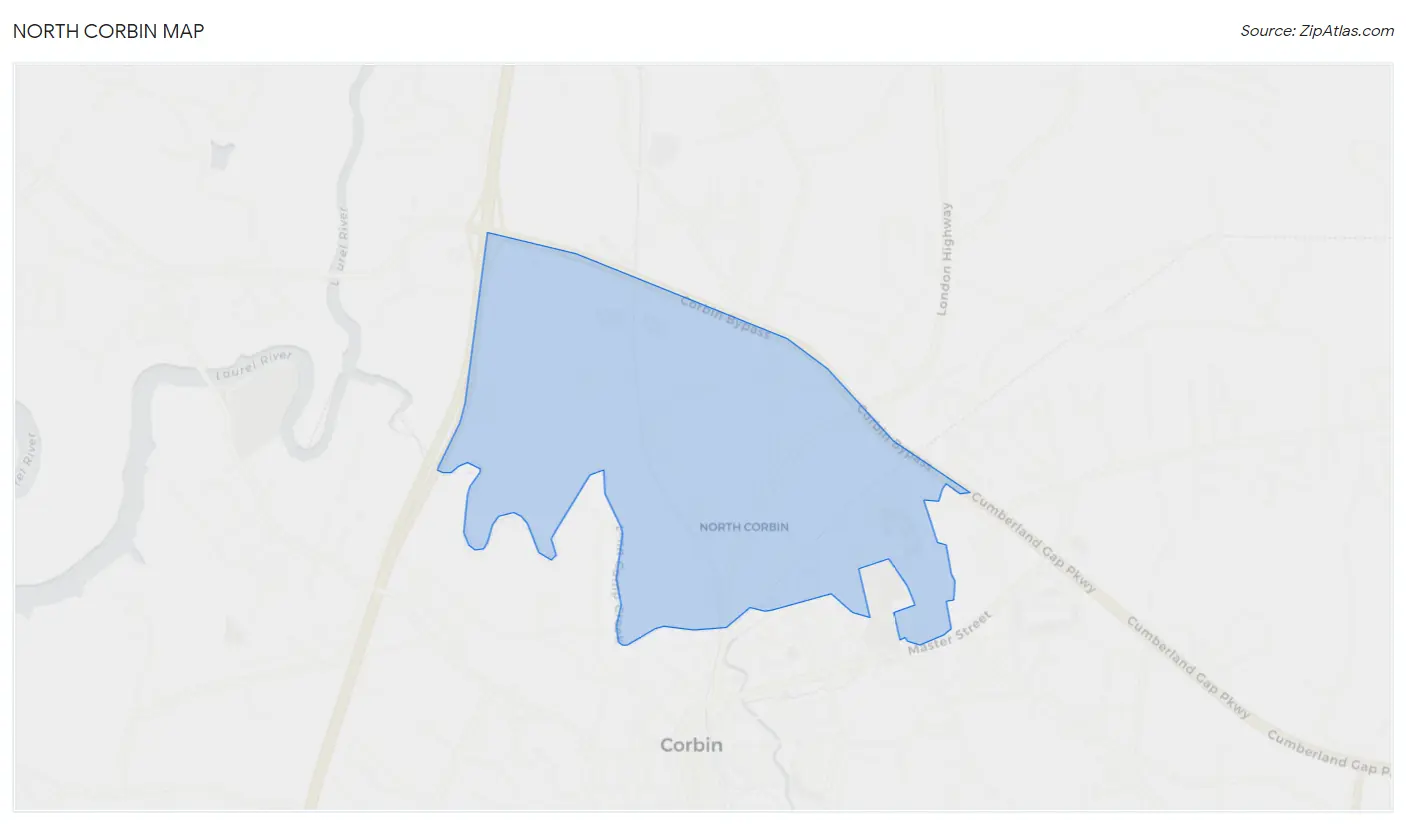
North Corbin Overview
$21,706
PER CAPITA INCOME
$48,555
AVG FAMILY INCOME
$59,306
AVG HOUSEHOLD INCOME
0.27
INEQUALITY / GINI INDEX
1,955
TOTAL POPULATION
1,036
MALE POPULATION
919
FEMALE POPULATION
112.73
MALES / 100 FEMALES
88.71
FEMALES / 100 MALES
31.9
MEDIAN AGE
3.7
AVG FAMILY SIZE
2.8
AVG HOUSEHOLD SIZE
901
LABOR FORCE [ PEOPLE ]
63.2%
PERCENT IN LABOR FORCE
9.9%
UNEMPLOYMENT RATE
Income in North Corbin
Income Overview in North Corbin
Per Capita Income in North Corbin is $21,706, while median incomes of families and households are $48,555 and $59,306 respectively.
| Characteristic | Number | Measure |
| Per Capita Income | 1,955 | $21,706 |
| Median Family Income | 443 | $48,555 |
| Mean Family Income | 443 | $51,481 |
| Median Household Income | 691 | $59,306 |
| Mean Household Income | 691 | $57,359 |
| Income Deficit | 443 | $0 |
| Wage / Income Gap (%) | 1,955 | 0.00% |
| Wage / Income Gap ($) | 1,955 | 100.00¢ per $1 |
| Gini / Inequality Index | 1,955 | 0.27 |
Earnings by Sex in North Corbin
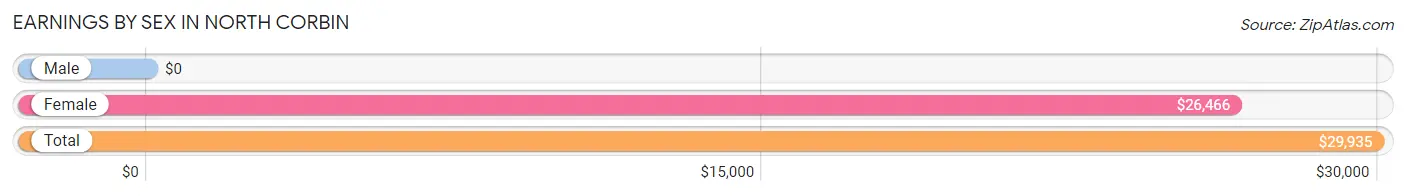
| Sex | Number | Average Earnings |
| Male | 514 (57.5%) | $0 |
| Female | 380 (42.5%) | $26,466 |
| Total | 894 (100.0%) | $29,935 |
Earnings by Sex by Income Bracket in North Corbin
The most common earnings brackets in North Corbin are $75,000 to $99,999 for men (141 | 27.4%) and $10,000 to $12,499 for women (66 | 17.4%).
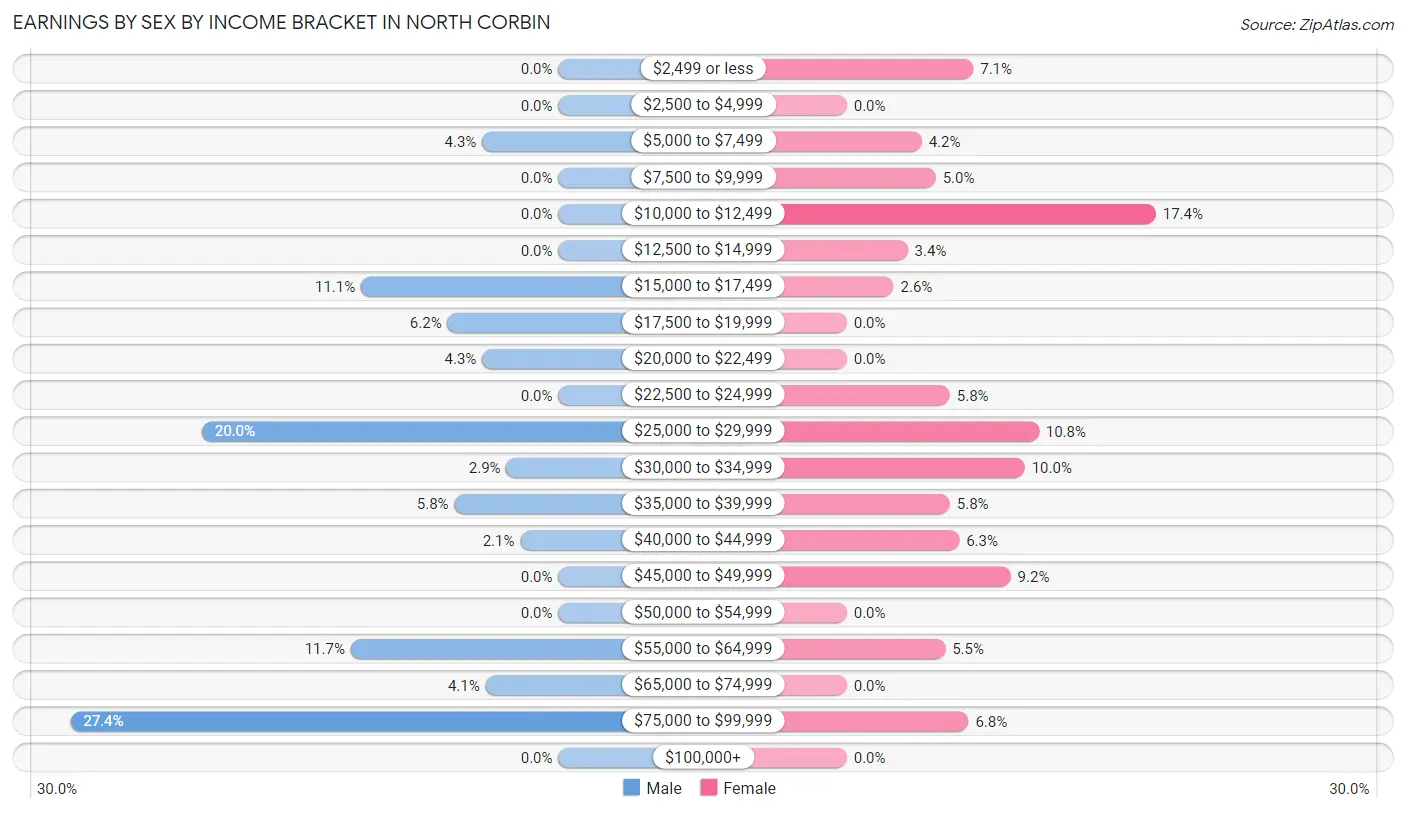
| Income | Male | Female |
| $2,499 or less | 0 (0.0%) | 27 (7.1%) |
| $2,500 to $4,999 | 0 (0.0%) | 0 (0.0%) |
| $5,000 to $7,499 | 22 (4.3%) | 16 (4.2%) |
| $7,500 to $9,999 | 0 (0.0%) | 19 (5.0%) |
| $10,000 to $12,499 | 0 (0.0%) | 66 (17.4%) |
| $12,500 to $14,999 | 0 (0.0%) | 13 (3.4%) |
| $15,000 to $17,499 | 57 (11.1%) | 10 (2.6%) |
| $17,500 to $19,999 | 32 (6.2%) | 0 (0.0%) |
| $20,000 to $22,499 | 22 (4.3%) | 0 (0.0%) |
| $22,500 to $24,999 | 0 (0.0%) | 22 (5.8%) |
| $25,000 to $29,999 | 103 (20.0%) | 41 (10.8%) |
| $30,000 to $34,999 | 15 (2.9%) | 38 (10.0%) |
| $35,000 to $39,999 | 30 (5.8%) | 22 (5.8%) |
| $40,000 to $44,999 | 11 (2.1%) | 24 (6.3%) |
| $45,000 to $49,999 | 0 (0.0%) | 35 (9.2%) |
| $50,000 to $54,999 | 0 (0.0%) | 0 (0.0%) |
| $55,000 to $64,999 | 60 (11.7%) | 21 (5.5%) |
| $65,000 to $74,999 | 21 (4.1%) | 0 (0.0%) |
| $75,000 to $99,999 | 141 (27.4%) | 26 (6.8%) |
| $100,000+ | 0 (0.0%) | 0 (0.0%) |
| Total | 514 (100.0%) | 380 (100.0%) |
Earnings by Sex by Educational Attainment in North Corbin
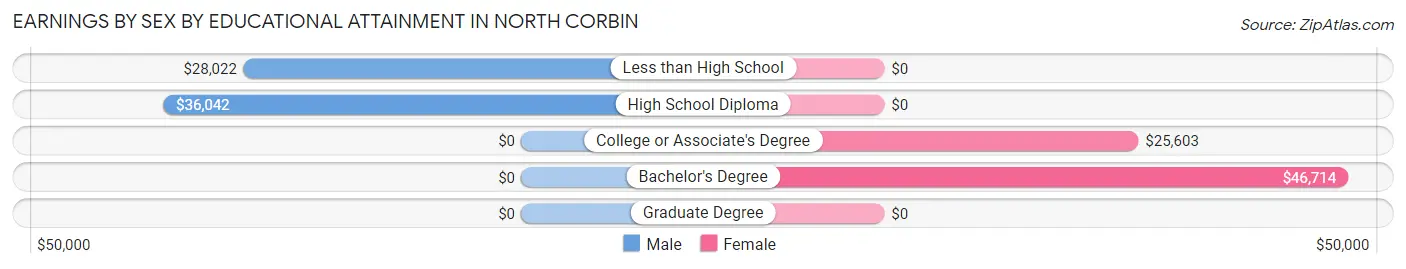
| Educational Attainment | Male Income | Female Income |
| Less than High School | $28,022 | $0 |
| High School Diploma | $36,042 | $0 |
| College or Associate's Degree | - | - |
| Bachelor's Degree | - | - |
| Graduate Degree | - | - |
| Total | - | - |
Family Income in North Corbin
Family Income Brackets in North Corbin
According to the North Corbin family income data, there are 138 families falling into the $50,000 to $74,999 income range, which is the most common income bracket and makes up 31.1% of all families.
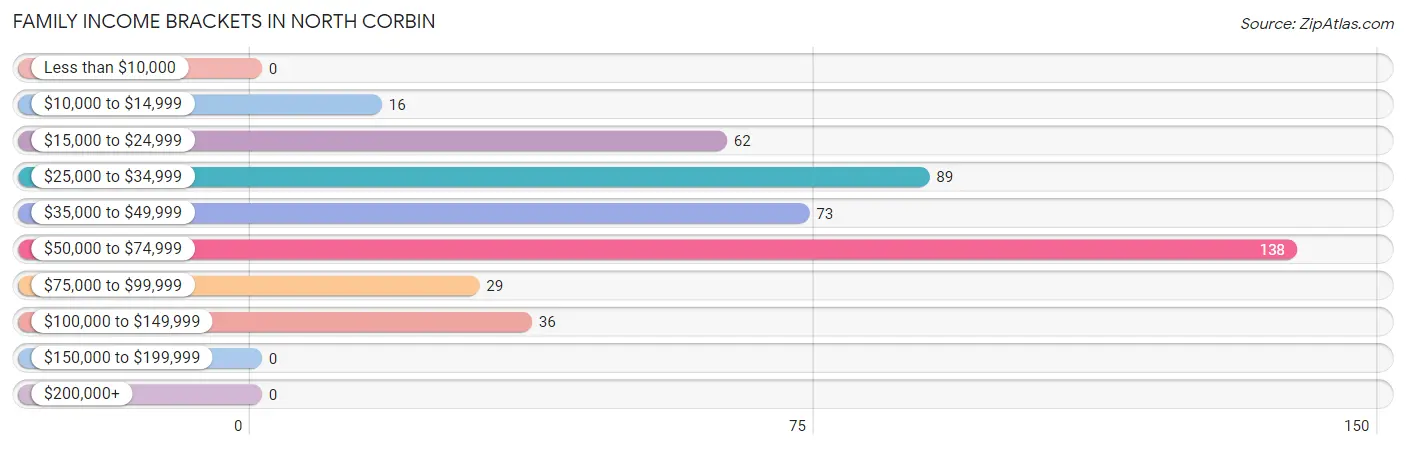
| Income Bracket | # Families | % Families |
| Less than $10,000 | 0 | 0.0% |
| $10,000 to $14,999 | 16 | 3.6% |
| $15,000 to $24,999 | 62 | 14.0% |
| $25,000 to $34,999 | 89 | 20.1% |
| $35,000 to $49,999 | 73 | 16.5% |
| $50,000 to $74,999 | 138 | 31.2% |
| $75,000 to $99,999 | 29 | 6.5% |
| $100,000 to $149,999 | 36 | 8.1% |
| $150,000 to $199,999 | 0 | 0.0% |
| $200,000+ | 0 | 0.0% |
Family Income by Famaliy Size in North Corbin
2-person families (178 | 40.2%) account for the highest median family income in North Corbin with $48,828 per family, while 2-person families (178 | 40.2%) have the highest median income of $24,414 per family member.
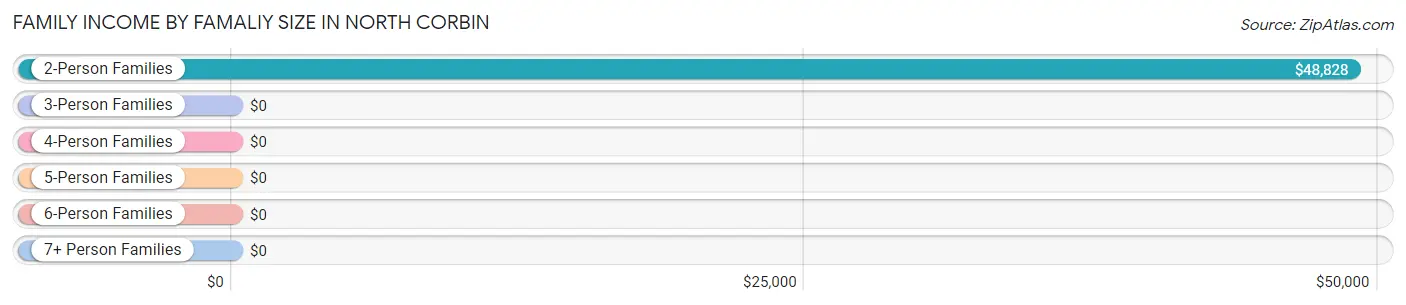
| Income Bracket | # Families | Median Income |
| 2-Person Families | 178 (40.2%) | $48,828 |
| 3-Person Families | 154 (34.8%) | $0 |
| 4-Person Families | 36 (8.1%) | $0 |
| 5-Person Families | 9 (2.0%) | $0 |
| 6-Person Families | 16 (3.6%) | $0 |
| 7+ Person Families | 50 (11.3%) | $0 |
| Total | 443 (100.0%) | $48,555 |
Family Income by Number of Earners in North Corbin
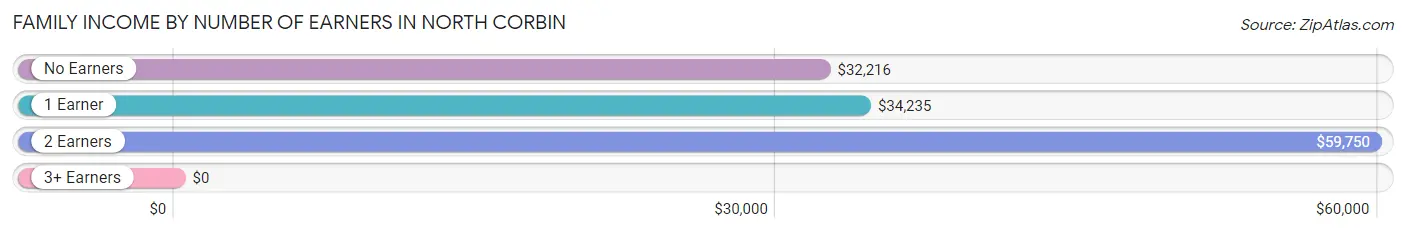
| Number of Earners | # Families | Median Income |
| No Earners | 57 (12.9%) | $32,216 |
| 1 Earner | 231 (52.1%) | $34,235 |
| 2 Earners | 129 (29.1%) | $59,750 |
| 3+ Earners | 26 (5.9%) | $0 |
| Total | 443 (100.0%) | $48,555 |
Household Income in North Corbin
Household Income Brackets in North Corbin
With 192 households falling in the category, the $75,000 to $99,999 income range is the most frequent in North Corbin, accounting for 27.8% of all households.
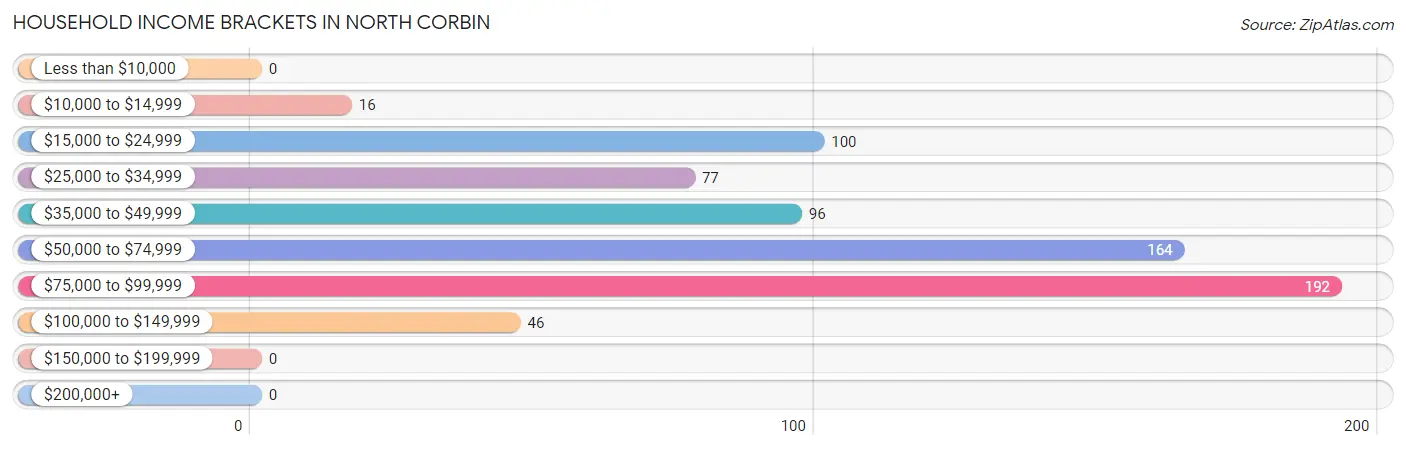
| Income Bracket | # Households | % Households |
| Less than $10,000 | 0 | 0.0% |
| $10,000 to $14,999 | 16 | 2.3% |
| $15,000 to $24,999 | 100 | 14.5% |
| $25,000 to $34,999 | 77 | 11.1% |
| $35,000 to $49,999 | 96 | 13.9% |
| $50,000 to $74,999 | 164 | 23.7% |
| $75,000 to $99,999 | 192 | 27.8% |
| $100,000 to $149,999 | 46 | 6.7% |
| $150,000 to $199,999 | 0 | 0.0% |
| $200,000+ | 0 | 0.0% |
Household Income by Householder Age in North Corbin
The median household income in North Corbin is $59,306, with the highest median household income of $63,450 found in the 25 to 44 years age bracket for the primary householder. A total of 386 households (55.9%) fall into this category. Meanwhile, the 15 to 24 years age bracket for the primary householder has the lowest median household income of $0, with 15 households (2.2%) in this group.
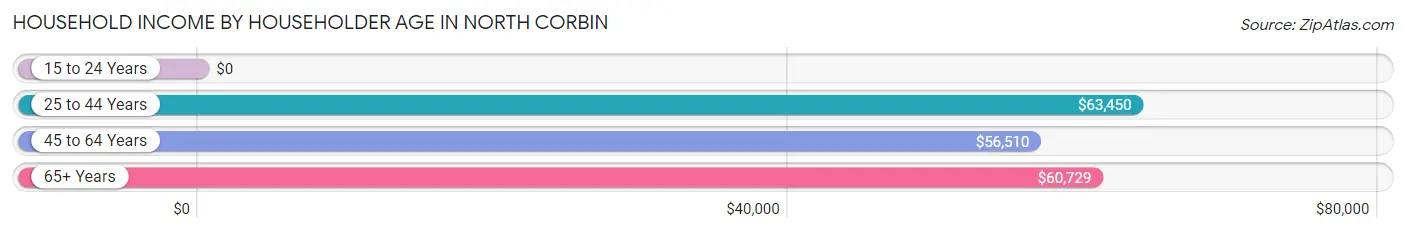
| Income Bracket | # Households | Median Income |
| 15 to 24 Years | 15 (2.2%) | $0 |
| 25 to 44 Years | 386 (55.9%) | $63,450 |
| 45 to 64 Years | 227 (32.9%) | $56,510 |
| 65+ Years | 63 (9.1%) | $60,729 |
| Total | 691 (100.0%) | $59,306 |
Poverty in North Corbin
Income Below Poverty by Sex and Age in North Corbin
With 16.4% poverty level for males and 24.6% for females among the residents of North Corbin, 6 to 11 year old males and 12 to 14 year old females are the most vulnerable to poverty, with 50 males (51.0%) and 18 females (64.3%) in their respective age groups living below the poverty level.
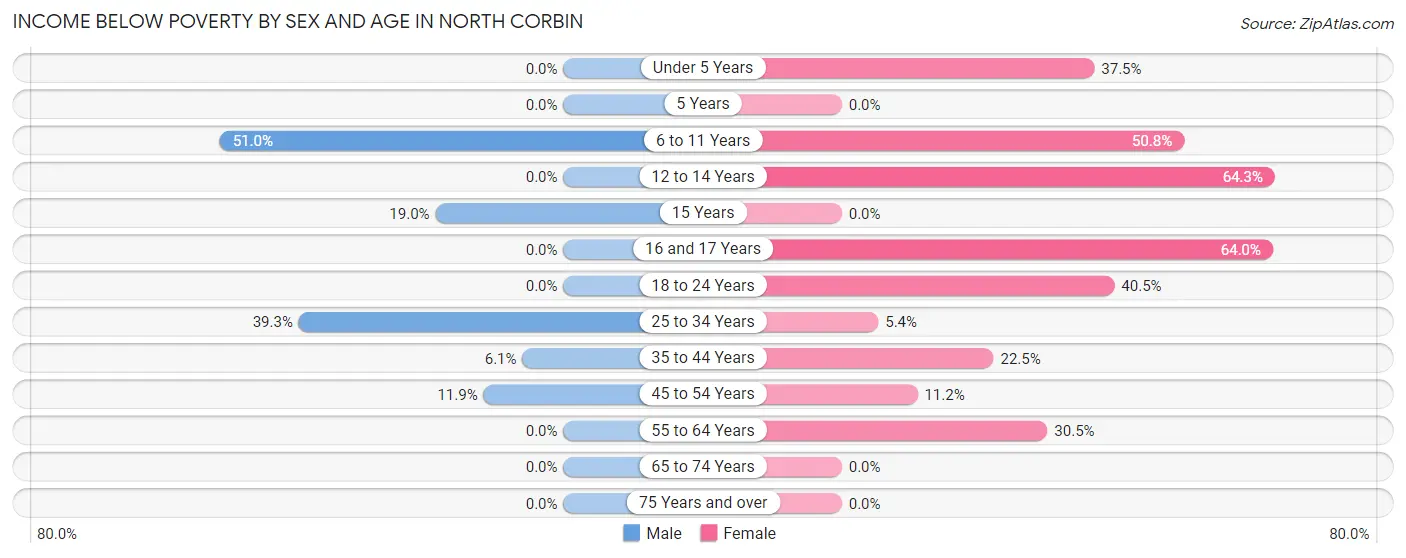
| Age Bracket | Male | Female |
| Under 5 Years | 0 (0.0%) | 21 (37.5%) |
| 5 Years | 0 (0.0%) | 0 (0.0%) |
| 6 to 11 Years | 50 (51.0%) | 63 (50.8%) |
| 12 to 14 Years | 0 (0.0%) | 18 (64.3%) |
| 15 Years | 19 (19.0%) | 0 (0.0%) |
| 16 and 17 Years | 0 (0.0%) | 16 (64.0%) |
| 18 to 24 Years | 0 (0.0%) | 17 (40.5%) |
| 25 to 34 Years | 77 (39.3%) | 9 (5.4%) |
| 35 to 44 Years | 17 (6.1%) | 32 (22.5%) |
| 45 to 54 Years | 7 (11.9%) | 10 (11.2%) |
| 55 to 64 Years | 0 (0.0%) | 40 (30.5%) |
| 65 to 74 Years | 0 (0.0%) | 0 (0.0%) |
| 75 Years and over | 0 (0.0%) | 0 (0.0%) |
| Total | 170 (16.4%) | 226 (24.6%) |
Income Above Poverty by Sex and Age in North Corbin
According to the poverty statistics in North Corbin, males aged under 5 years and females aged 15 years are the age groups that are most secure financially, with 100.0% of males and 100.0% of females in these age groups living above the poverty line.
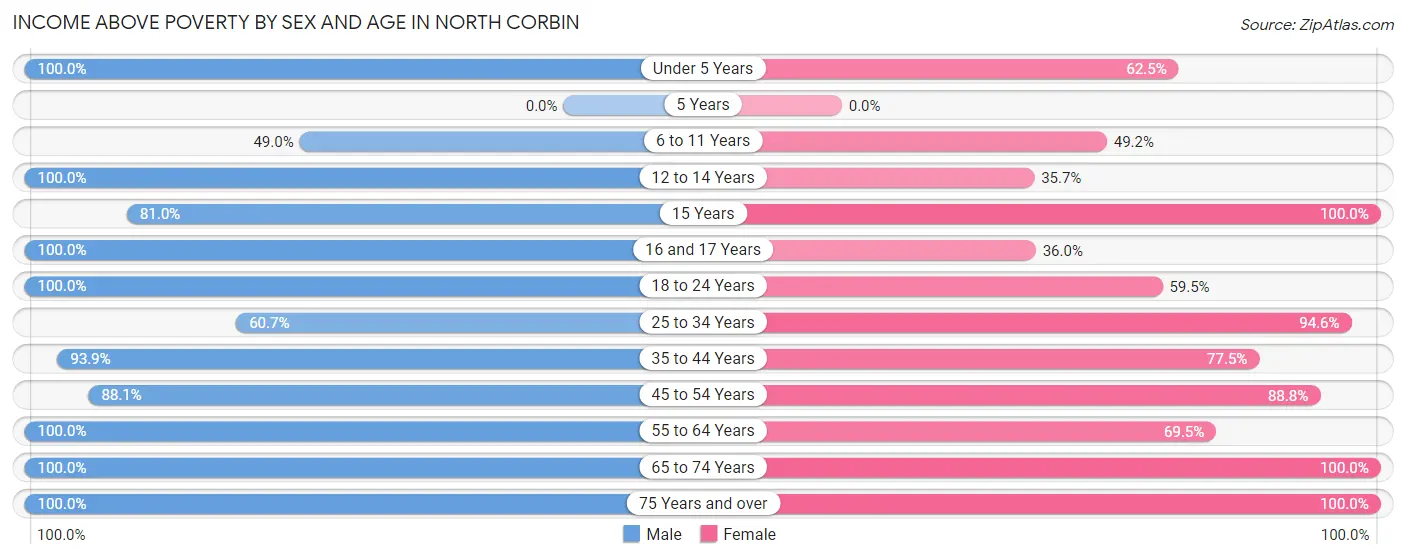
| Age Bracket | Male | Female |
| Under 5 Years | 78 (100.0%) | 35 (62.5%) |
| 5 Years | 0 (0.0%) | 0 (0.0%) |
| 6 to 11 Years | 48 (49.0%) | 61 (49.2%) |
| 12 to 14 Years | 37 (100.0%) | 10 (35.7%) |
| 15 Years | 81 (81.0%) | 9 (100.0%) |
| 16 and 17 Years | 51 (100.0%) | 9 (36.0%) |
| 18 to 24 Years | 15 (100.0%) | 25 (59.5%) |
| 25 to 34 Years | 119 (60.7%) | 157 (94.6%) |
| 35 to 44 Years | 262 (93.9%) | 110 (77.5%) |
| 45 to 54 Years | 52 (88.1%) | 79 (88.8%) |
| 55 to 64 Years | 58 (100.0%) | 91 (69.5%) |
| 65 to 74 Years | 37 (100.0%) | 82 (100.0%) |
| 75 Years and over | 28 (100.0%) | 25 (100.0%) |
| Total | 866 (83.6%) | 693 (75.4%) |
Income Below Poverty Among Married-Couple Families in North Corbin
The poverty statistics for married-couple families in North Corbin show that 10.9% or 33 of the total 302 families live below the poverty line. Families with 5 or more children have the highest poverty rate of 100.0%, comprising of 17 families. On the other hand, families with no children have the lowest poverty rate of 0.0%, which includes 0 families.
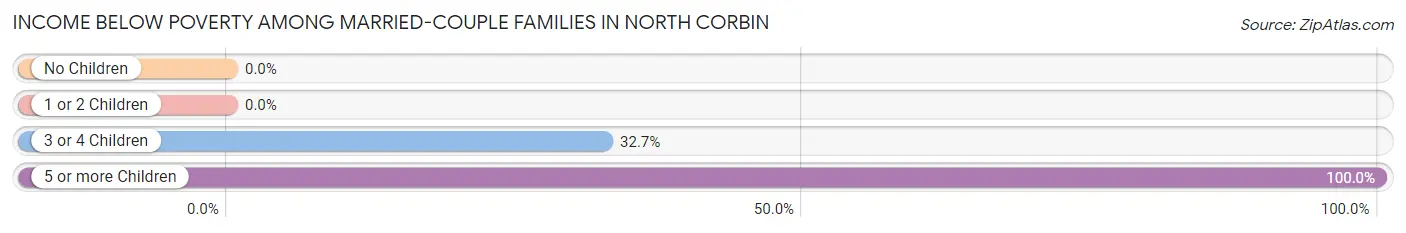
| Children | Above Poverty | Below Poverty |
| No Children | 107 (100.0%) | 0 (0.0%) |
| 1 or 2 Children | 129 (100.0%) | 0 (0.0%) |
| 3 or 4 Children | 33 (67.3%) | 16 (32.7%) |
| 5 or more Children | 0 (0.0%) | 17 (100.0%) |
| Total | 269 (89.1%) | 33 (10.9%) |
Income Below Poverty Among Single-Parent Households in North Corbin
| Children | Single Father | Single Mother |
| No Children | 0 (0.0%) | 40 (80.0%) |
| 1 or 2 Children | 0 (0.0%) | 0 (0.0%) |
| 3 or 4 Children | 0 (0.0%) | 0 (0.0%) |
| 5 or more Children | 0 (0.0%) | 0 (0.0%) |
| Total | 0 (0.0%) | 40 (48.2%) |
Income Below Poverty Among Married-Couple vs Single-Parent Households in North Corbin
The poverty data for North Corbin shows that 33 of the married-couple family households (10.9%) and 40 of the single-parent households (28.4%) are living below the poverty level. Within the married-couple family households, those with 5 or more children have the highest poverty rate, with 17 households (100.0%) falling below the poverty line. Among the single-parent households, those with no children have the highest poverty rate, with 40 household (46.5%) living below poverty.
| Children | Married-Couple Families | Single-Parent Households |
| No Children | 0 (0.0%) | 40 (46.5%) |
| 1 or 2 Children | 0 (0.0%) | 0 (0.0%) |
| 3 or 4 Children | 16 (32.7%) | 0 (0.0%) |
| 5 or more Children | 17 (100.0%) | 0 (0.0%) |
| Total | 33 (10.9%) | 40 (28.4%) |
Race in North Corbin
The most populous races in North Corbin are White / Caucasian (1,928 | 98.6%), and Two or more Races (27 | 1.4%).
| Race | # Population | % Population |
| Asian | 0 | 0.0% |
| Black / African American | 0 | 0.0% |
| Hawaiian / Pacific | 0 | 0.0% |
| Hispanic or Latino | 0 | 0.0% |
| Native / Alaskan | 0 | 0.0% |
| White / Caucasian | 1,928 | 98.6% |
| Two or more Races | 27 | 1.4% |
| Some other Race | 0 | 0.0% |
| Total | 1,955 | 100.0% |
Ancestry in North Corbin
The most populous ancestries reported in North Corbin are Irish (258 | 13.2%), American (252 | 12.9%), English (216 | 11.1%), German (96 | 4.9%), and French (38 | 1.9%), together accounting for 44.0% of all North Corbin residents.
| Ancestry | # Population | % Population |
| American | 252 | 12.9% |
| Blackfeet | 16 | 0.8% |
| British | 15 | 0.8% |
| Cherokee | 11 | 0.6% |
| Dutch | 21 | 1.1% |
| English | 216 | 11.1% |
| French | 38 | 1.9% |
| German | 96 | 4.9% |
| Irish | 258 | 13.2% |
| Slovak | 11 | 0.6% | View All 10 Rows |
Immigrants in North Corbin

| Immigration Origin | # Population | % Population | View All 0 Rows |
Sex and Age in North Corbin
Sex and Age in North Corbin
The most populous age groups in North Corbin are 40 to 44 Years (221 | 21.3%) for men and 55 to 59 Years (121 | 13.2%) for women.
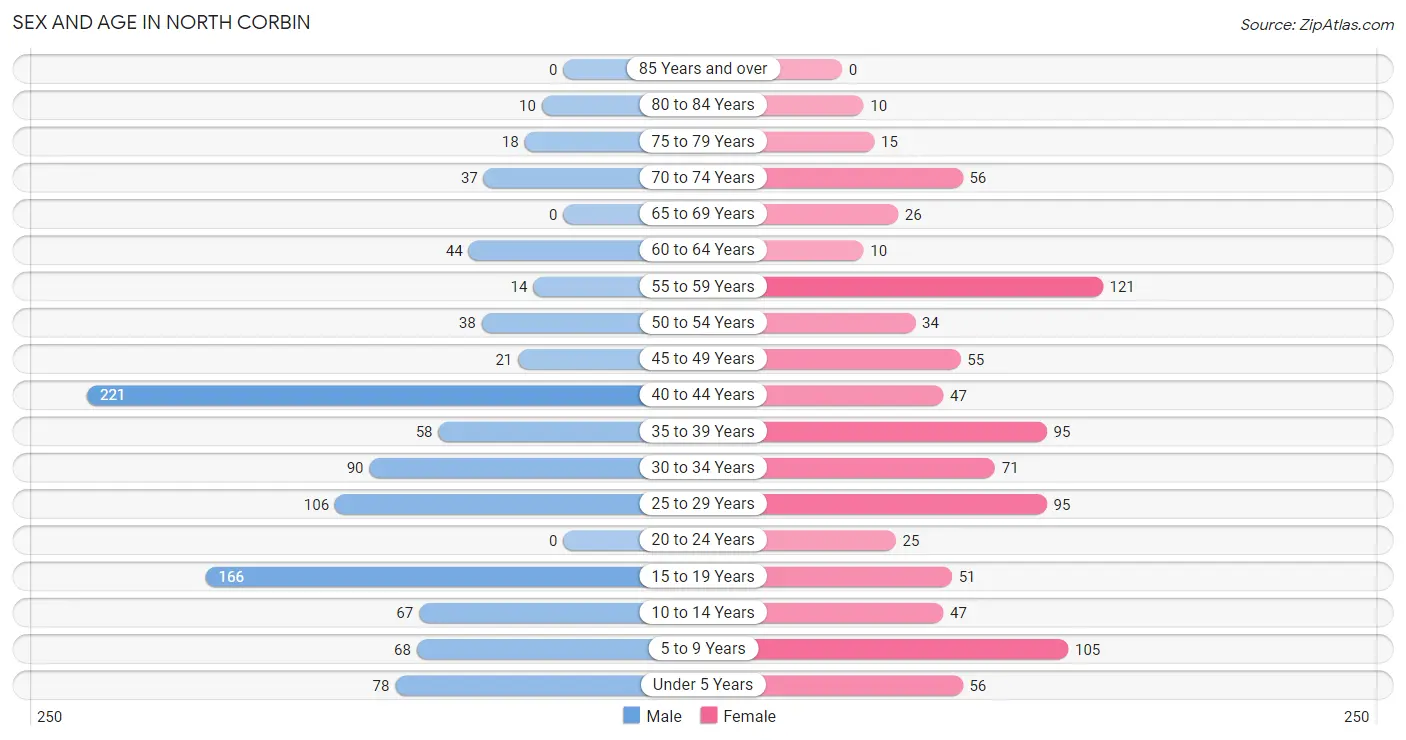
| Age Bracket | Male | Female |
| Under 5 Years | 78 (7.5%) | 56 (6.1%) |
| 5 to 9 Years | 68 (6.6%) | 105 (11.4%) |
| 10 to 14 Years | 67 (6.5%) | 47 (5.1%) |
| 15 to 19 Years | 166 (16.0%) | 51 (5.6%) |
| 20 to 24 Years | 0 (0.0%) | 25 (2.7%) |
| 25 to 29 Years | 106 (10.2%) | 95 (10.3%) |
| 30 to 34 Years | 90 (8.7%) | 71 (7.7%) |
| 35 to 39 Years | 58 (5.6%) | 95 (10.3%) |
| 40 to 44 Years | 221 (21.3%) | 47 (5.1%) |
| 45 to 49 Years | 21 (2.0%) | 55 (6.0%) |
| 50 to 54 Years | 38 (3.7%) | 34 (3.7%) |
| 55 to 59 Years | 14 (1.3%) | 121 (13.2%) |
| 60 to 64 Years | 44 (4.3%) | 10 (1.1%) |
| 65 to 69 Years | 0 (0.0%) | 26 (2.8%) |
| 70 to 74 Years | 37 (3.6%) | 56 (6.1%) |
| 75 to 79 Years | 18 (1.7%) | 15 (1.6%) |
| 80 to 84 Years | 10 (1.0%) | 10 (1.1%) |
| 85 Years and over | 0 (0.0%) | 0 (0.0%) |
| Total | 1,036 (100.0%) | 919 (100.0%) |
Families and Households in North Corbin
Median Family Size in North Corbin
The median family size in North Corbin is 3.68 persons per family, with married-couple families (302 | 68.2%) accounting for the largest median family size of 3.94 persons per family. On the other hand, single male/father families (58 | 13.1%) represent the smallest median family size with 3.00 persons per family.
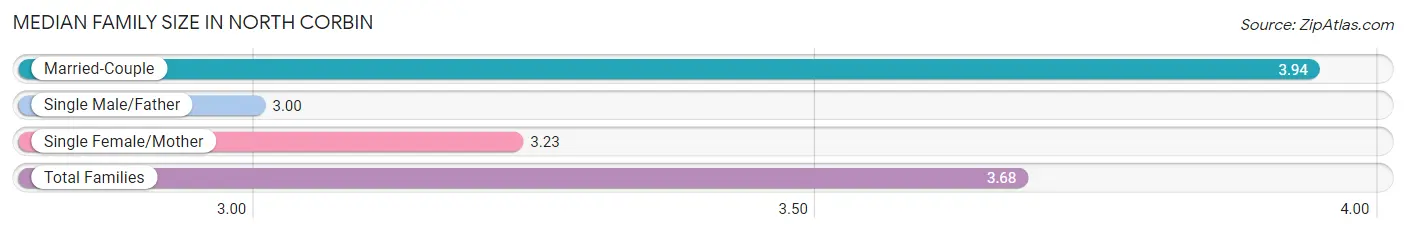
| Family Type | # Families | Family Size |
| Married-Couple | 302 (68.2%) | 3.94 |
| Single Male/Father | 58 (13.1%) | 3.00 |
| Single Female/Mother | 83 (18.7%) | 3.23 |
| Total Families | 443 (100.0%) | 3.68 |
Median Household Size in North Corbin
The median household size in North Corbin is 2.83 persons per household, with married-couple households (302 | 43.7%) accounting for the largest median household size of 3.94 persons per household. non-family households (248 | 35.9%) represent the smallest median household size with 1.16 persons per household.
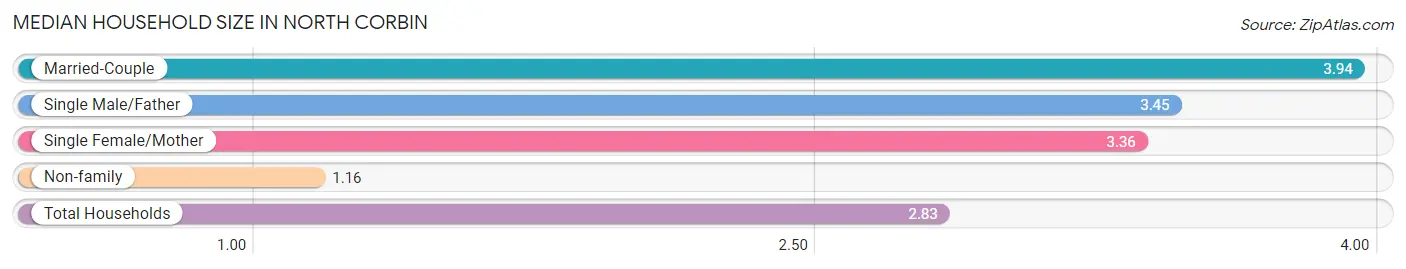
| Household Type | # Households | Household Size |
| Married-Couple | 302 (43.7%) | 3.94 |
| Single Male/Father | 58 (8.4%) | 3.45 |
| Single Female/Mother | 83 (12.0%) | 3.36 |
| Non-family | 248 (35.9%) | 1.16 |
| Total Households | 691 (100.0%) | 2.83 |
Household Size by Marriage Status in North Corbin
Out of a total of 691 households in North Corbin, 443 (64.1%) are family households, while 248 (35.9%) are nonfamily households. The most numerous type of family households are 2-person households, comprising 178, and the most common type of nonfamily households are 1-person households, comprising 227.
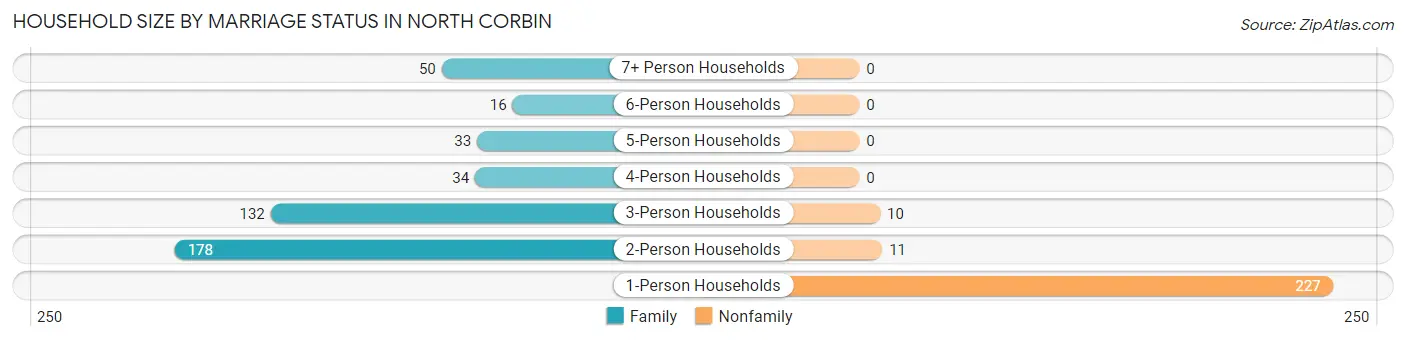
| Household Size | Family Households | Nonfamily Households |
| 1-Person Households | - | 227 (32.9%) |
| 2-Person Households | 178 (25.8%) | 11 (1.6%) |
| 3-Person Households | 132 (19.1%) | 10 (1.5%) |
| 4-Person Households | 34 (4.9%) | 0 (0.0%) |
| 5-Person Households | 33 (4.8%) | 0 (0.0%) |
| 6-Person Households | 16 (2.3%) | 0 (0.0%) |
| 7+ Person Households | 50 (7.2%) | 0 (0.0%) |
| Total | 443 (64.1%) | 248 (35.9%) |
Female Fertility in North Corbin
Fertility by Age in North Corbin
Average fertility rate in North Corbin is 50.0 births per 1,000 women. Women in the age bracket of 35 to 50 years have the highest fertility rate with 66.0 births per 1,000 women. Women in the age bracket of 35 to 50 years acount for 59.1% of all women with births.
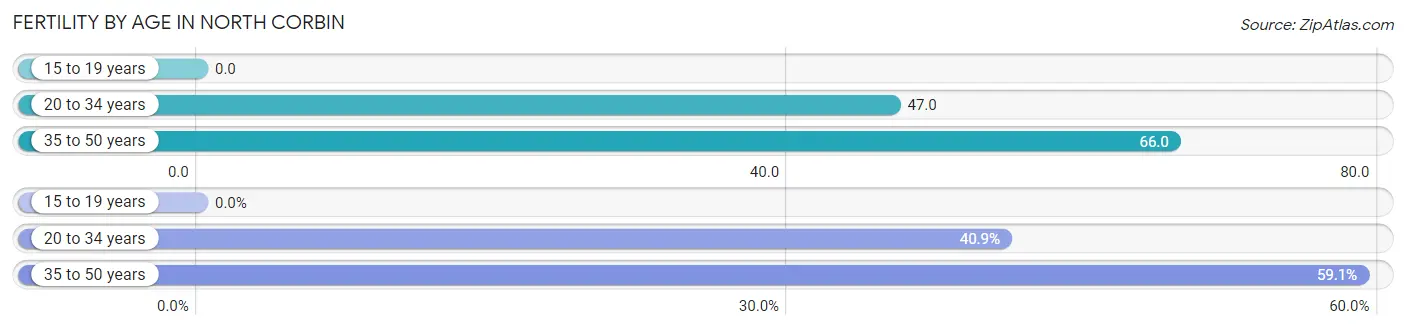
| Age Bracket | Women with Births | Births / 1,000 Women |
| 15 to 19 years | 0 (0.0%) | 0.0 |
| 20 to 34 years | 9 (40.9%) | 47.0 |
| 35 to 50 years | 13 (59.1%) | 66.0 |
| Total | 22 (100.0%) | 50.0 |
Fertility by Age by Marriage Status in North Corbin
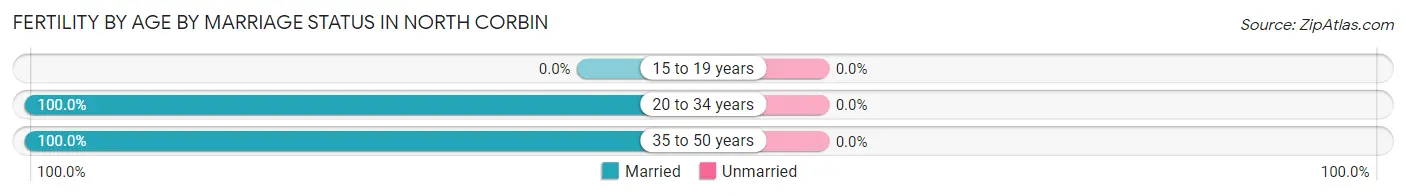
| Age Bracket | Married | Unmarried |
| 15 to 19 years | 0 (0.0%) | 0 (0.0%) |
| 20 to 34 years | 9 (100.0%) | 0 (0.0%) |
| 35 to 50 years | 13 (100.0%) | 0 (0.0%) |
| Total | 22 (100.0%) | 0 (0.0%) |
Fertility by Education in North Corbin
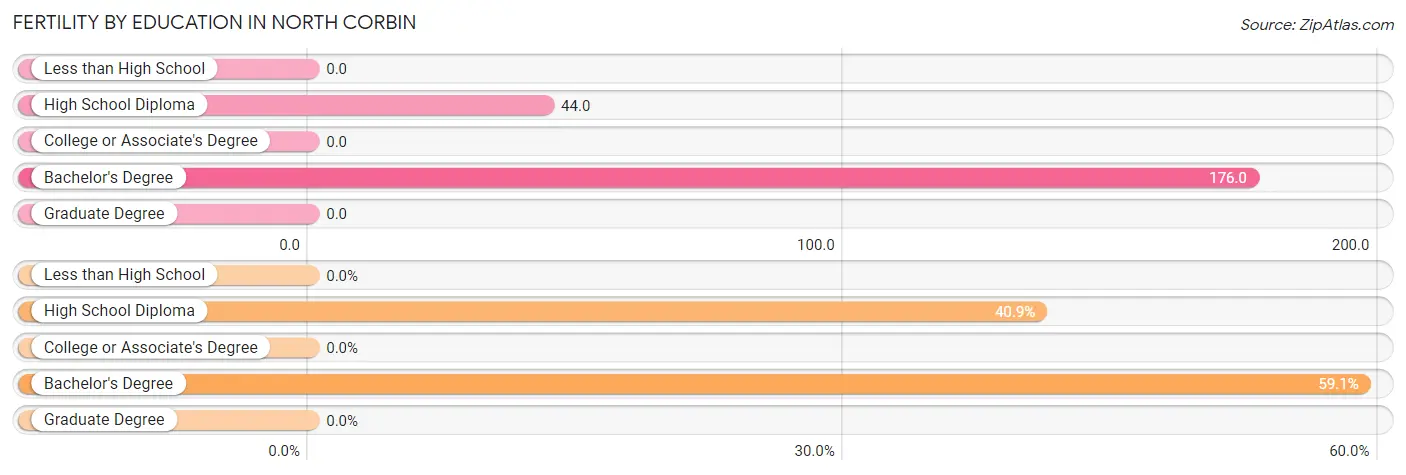
| Educational Attainment | Women with Births | Births / 1,000 Women |
| Less than High School | 0 (0.0%) | 0.0 |
| High School Diploma | 9 (40.9%) | 44.0 |
| College or Associate's Degree | 0 (0.0%) | 0.0 |
| Bachelor's Degree | 13 (59.1%) | 176.0 |
| Graduate Degree | 0 (0.0%) | 0.0 |
| Total | 22 (100.0%) | 50.0 |
Fertility by Education by Marriage Status in North Corbin
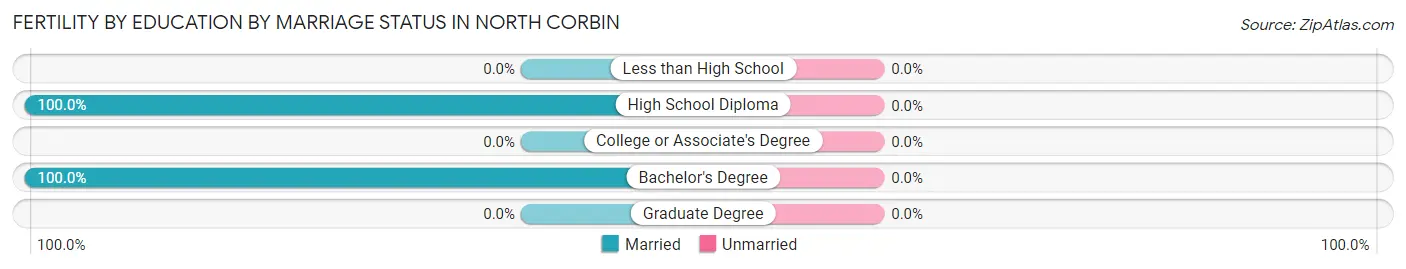
| Educational Attainment | Married | Unmarried |
| Less than High School | 0 (0.0%) | 0 (0.0%) |
| High School Diploma | 9 (100.0%) | 0 (0.0%) |
| College or Associate's Degree | 0 (0.0%) | 0 (0.0%) |
| Bachelor's Degree | 13 (100.0%) | 0 (0.0%) |
| Graduate Degree | 0 (0.0%) | 0 (0.0%) |
| Total | 22 (100.0%) | 0 (0.0%) |
Employment Characteristics in North Corbin
Employment by Class of Employer in North Corbin
Among the 799 employed individuals in North Corbin, private company employees (600 | 75.1%), not-for-profit organizations (86 | 10.8%), and state government employees (36 | 4.5%) make up the most common classes of employment.
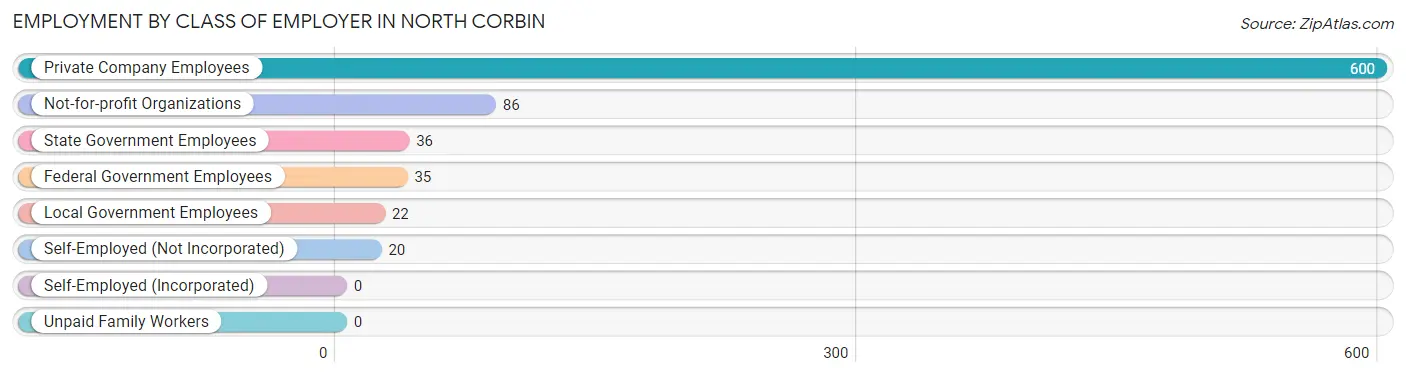
| Employer Class | # Employees | % Employees |
| Private Company Employees | 600 | 75.1% |
| Self-Employed (Incorporated) | 0 | 0.0% |
| Self-Employed (Not Incorporated) | 20 | 2.5% |
| Not-for-profit Organizations | 86 | 10.8% |
| Local Government Employees | 22 | 2.8% |
| State Government Employees | 36 | 4.5% |
| Federal Government Employees | 35 | 4.4% |
| Unpaid Family Workers | 0 | 0.0% |
| Total | 799 | 100.0% |
Employment Status by Age in North Corbin
According to the labor force statistics for North Corbin, out of the total population over 16 years of age (1,425), 63.2% or 901 individuals are in the labor force, with 9.9% or 89 of them unemployed. The age group with the highest labor force participation rate is 30 to 34 years, with 86.3% or 139 individuals in the labor force. Within the labor force, the 16 to 19 years age range has the highest percentage of unemployed individuals, with 43.5% or 40 of them being unemployed.
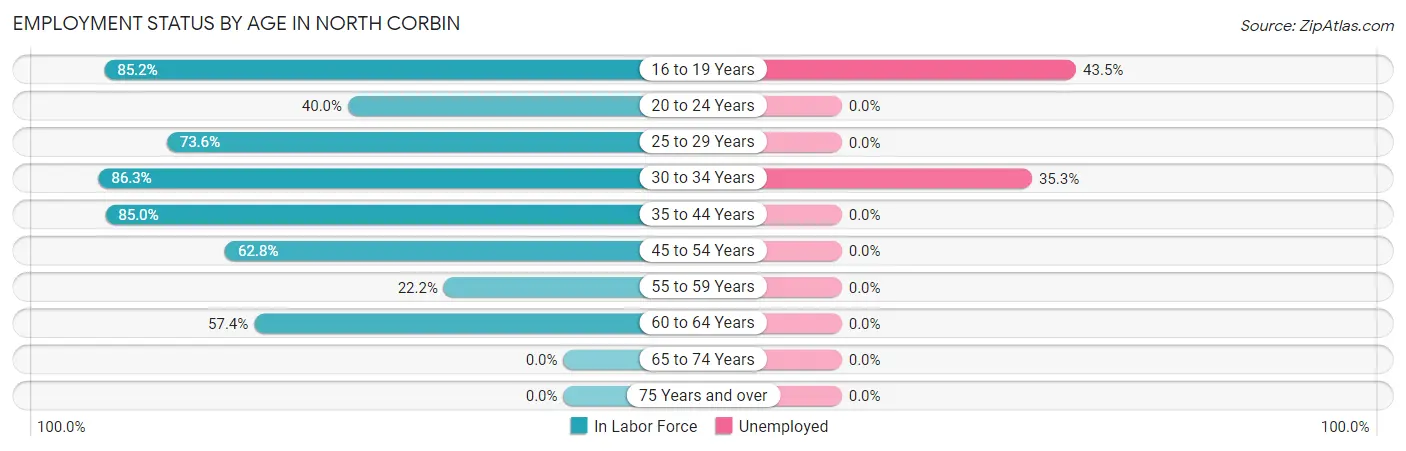
| Age Bracket | In Labor Force | Unemployed |
| 16 to 19 Years | 92 (85.2%) | 40 (43.5%) |
| 20 to 24 Years | 10 (40.0%) | 0 (0.0%) |
| 25 to 29 Years | 148 (73.6%) | 0 (0.0%) |
| 30 to 34 Years | 139 (86.3%) | 49 (35.3%) |
| 35 to 44 Years | 358 (85.0%) | 0 (0.0%) |
| 45 to 54 Years | 93 (62.8%) | 0 (0.0%) |
| 55 to 59 Years | 30 (22.2%) | 0 (0.0%) |
| 60 to 64 Years | 31 (57.4%) | 0 (0.0%) |
| 65 to 74 Years | 0 (0.0%) | 0 (0.0%) |
| 75 Years and over | 0 (0.0%) | 0 (0.0%) |
| Total | 901 (63.2%) | 89 (9.9%) |
Employment Status by Educational Attainment in North Corbin
According to labor force statistics for North Corbin, 71.3% of individuals (799) out of the total population between 25 and 64 years of age (1,120) are in the labor force, with 6.1% or 49 of them being unemployed. The group with the highest labor force participation rate are those with the educational attainment of bachelor's degree or higher, with 96.5% or 193 individuals in the labor force. Within the labor force, individuals with high school diploma education have the highest percentage of unemployment, with 25.7% or 49 of them being unemployed.
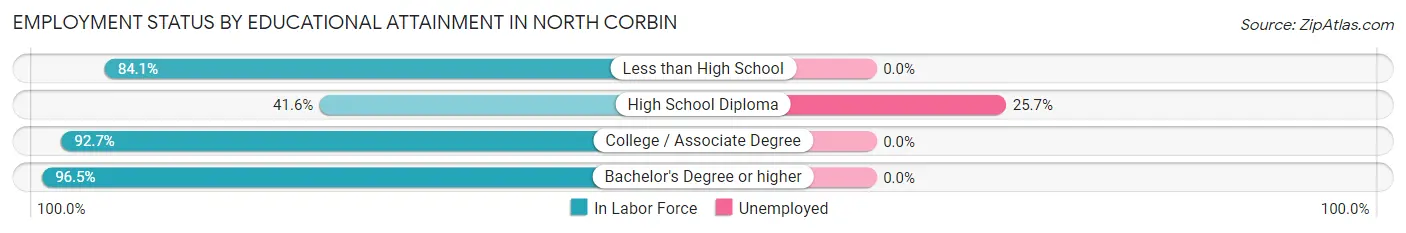
| Educational Attainment | In Labor Force | Unemployed |
| Less than High School | 122 (84.1%) | 0 (0.0%) |
| High School Diploma | 191 (41.6%) | 118 (25.7%) |
| College / Associate Degree | 293 (92.7%) | 0 (0.0%) |
| Bachelor's Degree or higher | 193 (96.5%) | 0 (0.0%) |
| Total | 799 (71.3%) | 68 (6.1%) |
Employment Occupations by Sex in North Corbin
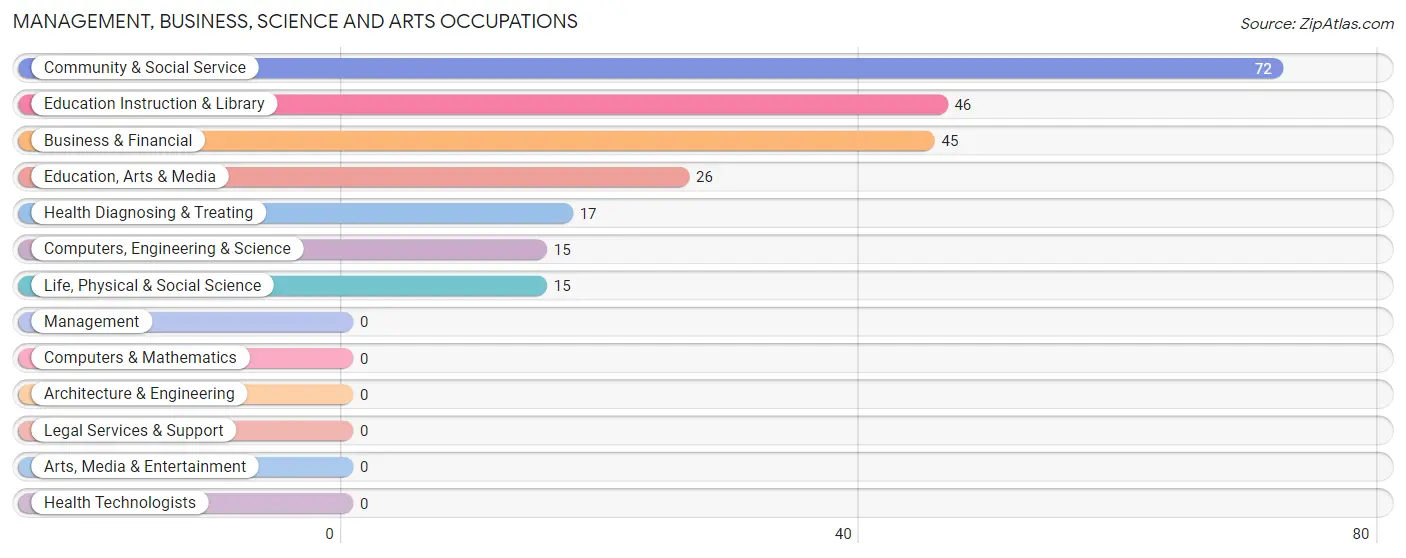
Management, Business, Science and Arts Occupations
The most common Management, Business, Science and Arts occupations in North Corbin are Community & Social Service (72 | 8.9%), Education Instruction & Library (46 | 5.7%), Business & Financial (45 | 5.5%), Education, Arts & Media (26 | 3.2%), and Health Diagnosing & Treating (17 | 2.1%).
Management, Business, Science and Arts Occupations by Sex
Within the Management, Business, Science and Arts occupations in North Corbin, the most male-oriented occupations are Computers, Engineering & Science (100.0%), and Life, Physical & Social Science (100.0%), while the most female-oriented occupations are Business & Financial (100.0%), Community & Social Service (100.0%), and Education, Arts & Media (100.0%).
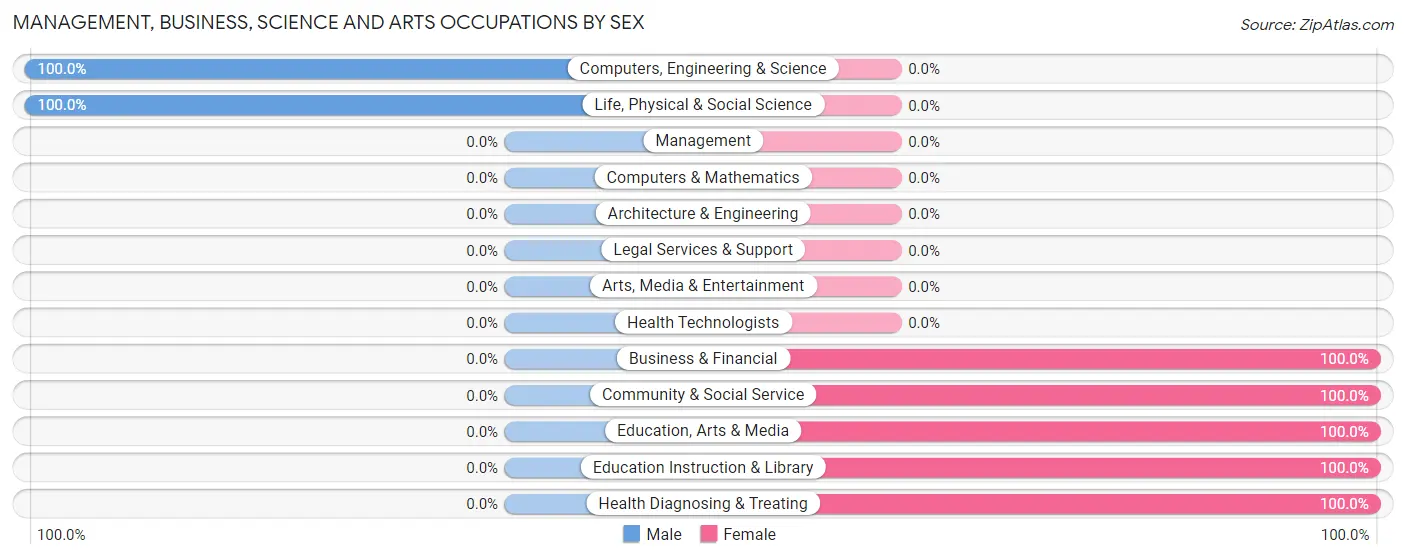
| Occupation | Male | Female |
| Management | 0 (0.0%) | 0 (0.0%) |
| Business & Financial | 0 (0.0%) | 45 (100.0%) |
| Computers, Engineering & Science | 15 (100.0%) | 0 (0.0%) |
| Computers & Mathematics | 0 (0.0%) | 0 (0.0%) |
| Architecture & Engineering | 0 (0.0%) | 0 (0.0%) |
| Life, Physical & Social Science | 15 (100.0%) | 0 (0.0%) |
| Community & Social Service | 0 (0.0%) | 72 (100.0%) |
| Education, Arts & Media | 0 (0.0%) | 26 (100.0%) |
| Legal Services & Support | 0 (0.0%) | 0 (0.0%) |
| Education Instruction & Library | 0 (0.0%) | 46 (100.0%) |
| Arts, Media & Entertainment | 0 (0.0%) | 0 (0.0%) |
| Health Diagnosing & Treating | 0 (0.0%) | 17 (100.0%) |
| Health Technologists | 0 (0.0%) | 0 (0.0%) |
| Total (Category) | 15 (10.1%) | 134 (89.9%) |
| Total (Overall) | 514 (63.3%) | 298 (36.7%) |
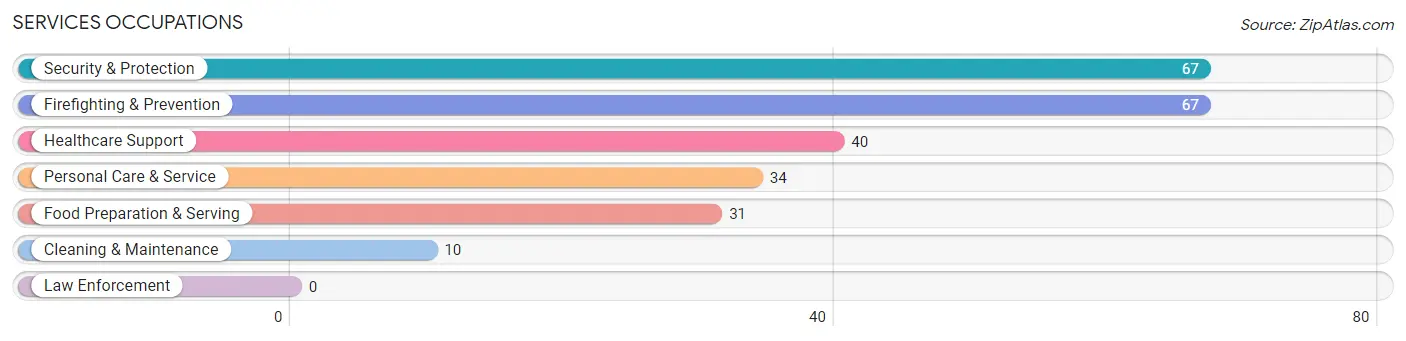
Services Occupations
The most common Services occupations in North Corbin are Security & Protection (67 | 8.3%), Firefighting & Prevention (67 | 8.3%), Healthcare Support (40 | 4.9%), Personal Care & Service (34 | 4.2%), and Food Preparation & Serving (31 | 3.8%).
Services Occupations by Sex
Within the Services occupations in North Corbin, the most male-oriented occupations are Security & Protection (100.0%), Firefighting & Prevention (100.0%), and Cleaning & Maintenance (100.0%), while the most female-oriented occupations are Healthcare Support (100.0%), Personal Care & Service (100.0%), and Food Preparation & Serving (29.0%).
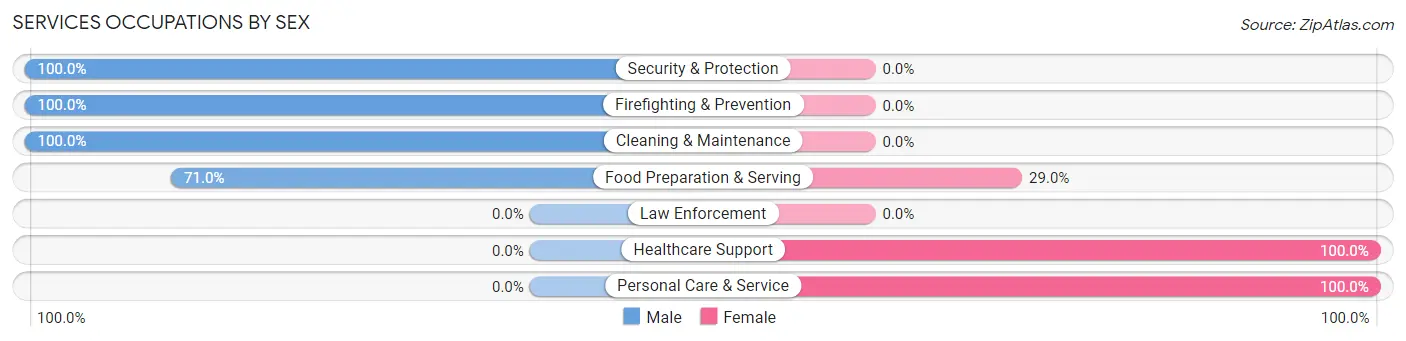
| Occupation | Male | Female |
| Healthcare Support | 0 (0.0%) | 40 (100.0%) |
| Security & Protection | 67 (100.0%) | 0 (0.0%) |
| Firefighting & Prevention | 67 (100.0%) | 0 (0.0%) |
| Law Enforcement | 0 (0.0%) | 0 (0.0%) |
| Food Preparation & Serving | 22 (71.0%) | 9 (29.0%) |
| Cleaning & Maintenance | 10 (100.0%) | 0 (0.0%) |
| Personal Care & Service | 0 (0.0%) | 34 (100.0%) |
| Total (Category) | 99 (54.4%) | 83 (45.6%) |
| Total (Overall) | 514 (63.3%) | 298 (36.7%) |
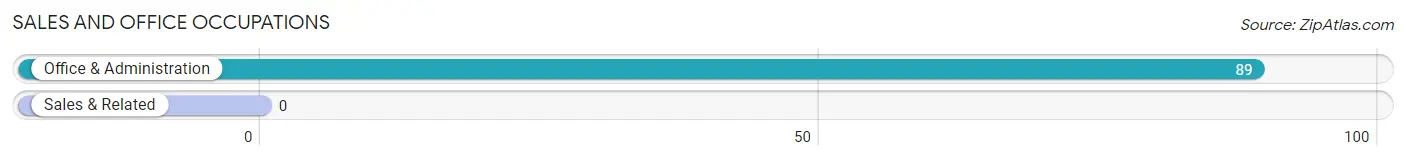
Sales and Office Occupations
The most common Sales and Office occupations in North Corbin are , and Office & Administration (89 | 11.0%).
Sales and Office Occupations by Sex
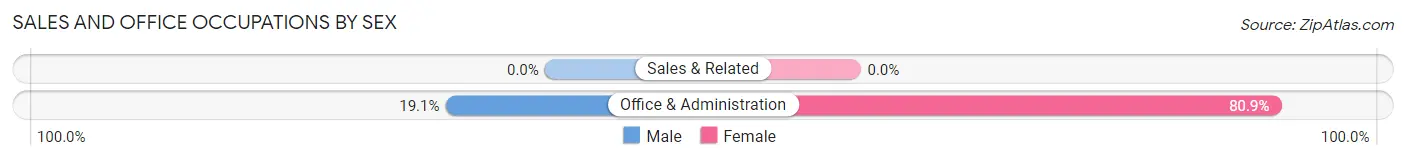
| Occupation | Male | Female |
| Sales & Related | 0 (0.0%) | 0 (0.0%) |
| Office & Administration | 17 (19.1%) | 72 (80.9%) |
| Total (Category) | 17 (19.1%) | 72 (80.9%) |
| Total (Overall) | 514 (63.3%) | 298 (36.7%) |
Natural Resources, Construction and Maintenance Occupations
The most common Natural Resources, Construction and Maintenance occupations in North Corbin are , and Installation, Maintenance & Repair (21 | 2.6%).
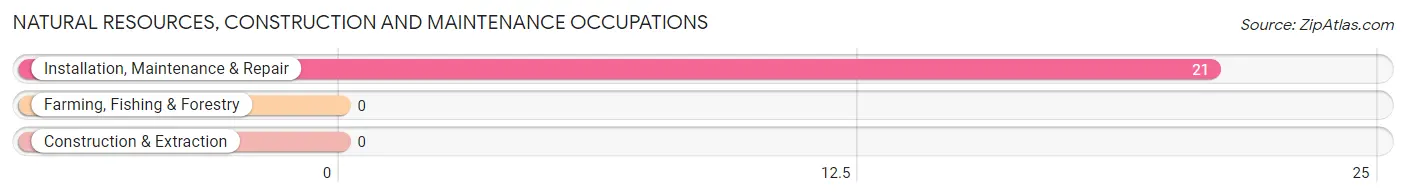
Natural Resources, Construction and Maintenance Occupations by Sex
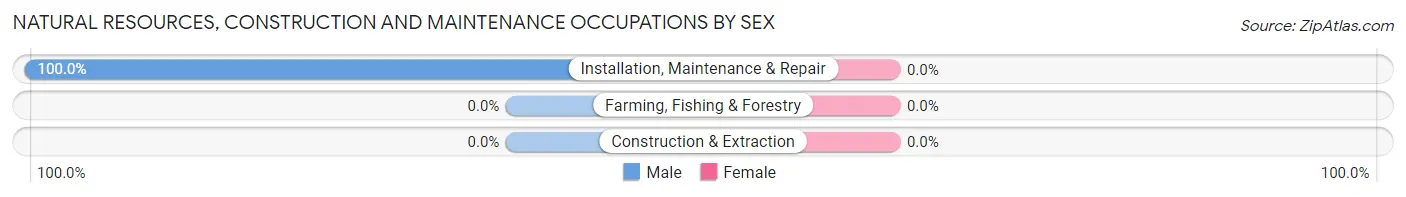
| Occupation | Male | Female |
| Farming, Fishing & Forestry | 0 (0.0%) | 0 (0.0%) |
| Construction & Extraction | 0 (0.0%) | 0 (0.0%) |
| Installation, Maintenance & Repair | 21 (100.0%) | 0 (0.0%) |
| Total (Category) | 21 (100.0%) | 0 (0.0%) |
| Total (Overall) | 514 (63.3%) | 298 (36.7%) |
Production, Transportation and Moving Occupations
The most common Production, Transportation and Moving occupations in North Corbin are Production (261 | 32.1%), Material Moving (82 | 10.1%), and Transportation (28 | 3.5%).
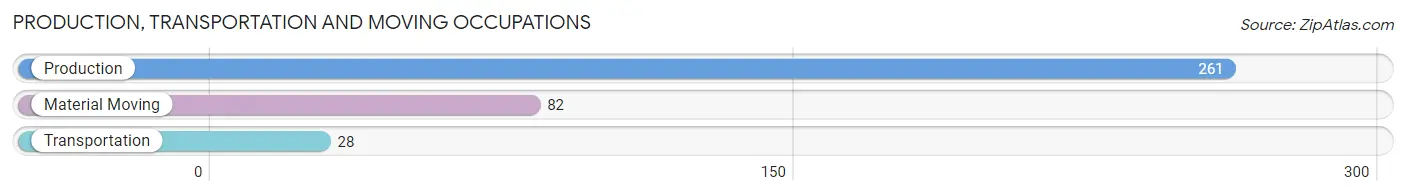
Production, Transportation and Moving Occupations by Sex
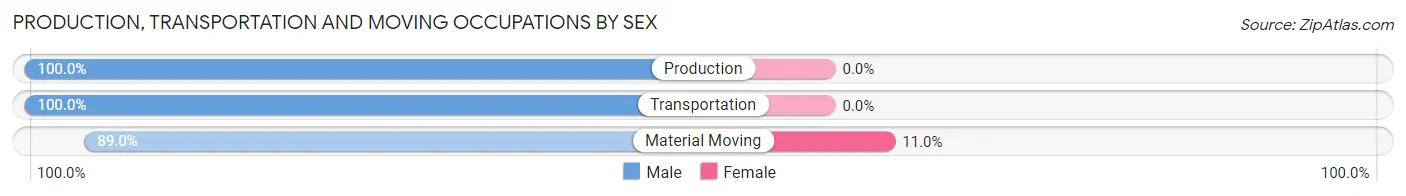
| Occupation | Male | Female |
| Production | 261 (100.0%) | 0 (0.0%) |
| Transportation | 28 (100.0%) | 0 (0.0%) |
| Material Moving | 73 (89.0%) | 9 (11.0%) |
| Total (Category) | 362 (97.6%) | 9 (2.4%) |
| Total (Overall) | 514 (63.3%) | 298 (36.7%) |
Employment Industries by Sex in North Corbin
Employment Industries in North Corbin
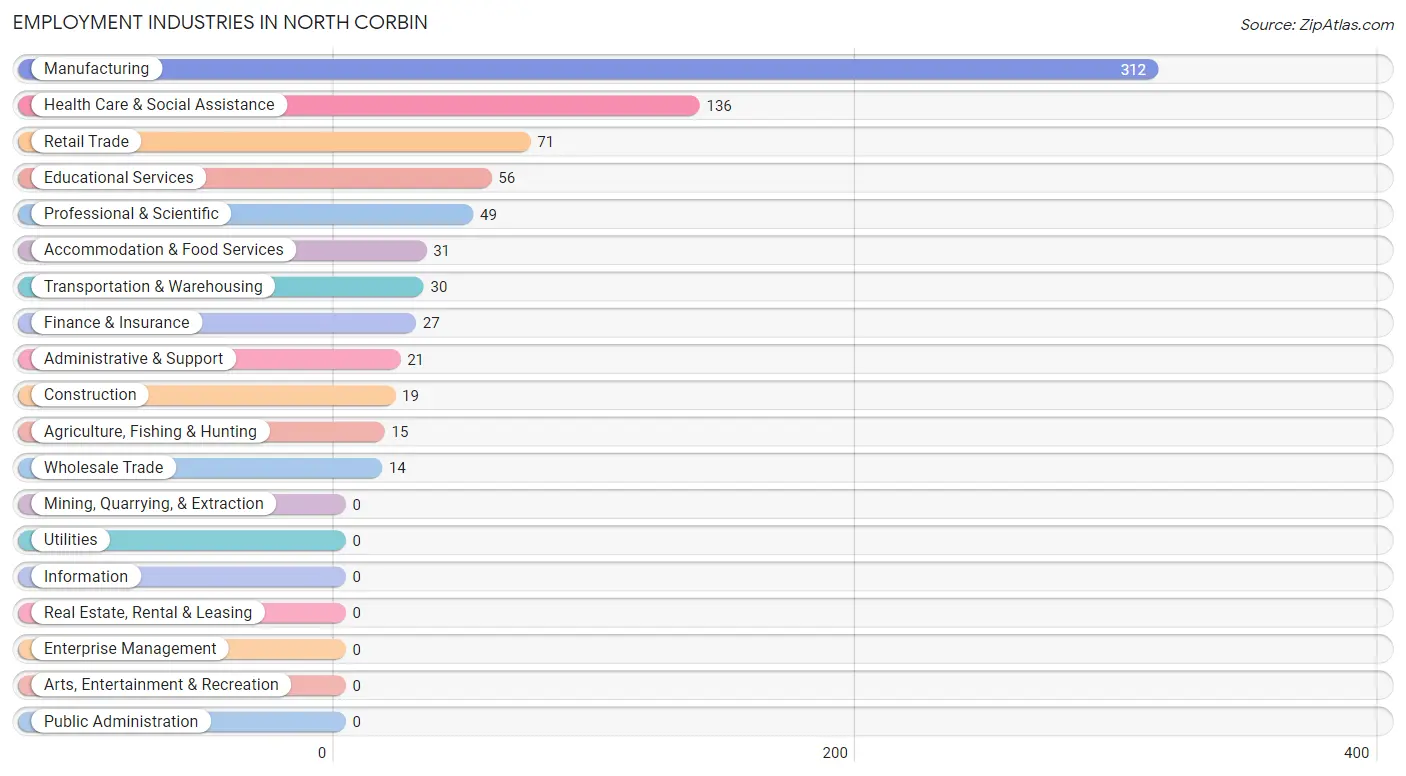
The major employment industries in North Corbin include Manufacturing (312 | 38.4%), Health Care & Social Assistance (136 | 16.8%), Retail Trade (71 | 8.7%), Educational Services (56 | 6.9%), and Professional & Scientific (49 | 6.0%).
Employment Industries by Sex in North Corbin
The North Corbin industries that see more men than women are Agriculture, Fishing & Hunting (100.0%), Manufacturing (100.0%), and Wholesale Trade (100.0%), whereas the industries that tend to have a higher number of women are Construction (100.0%), Professional & Scientific (100.0%), and Educational Services (100.0%).
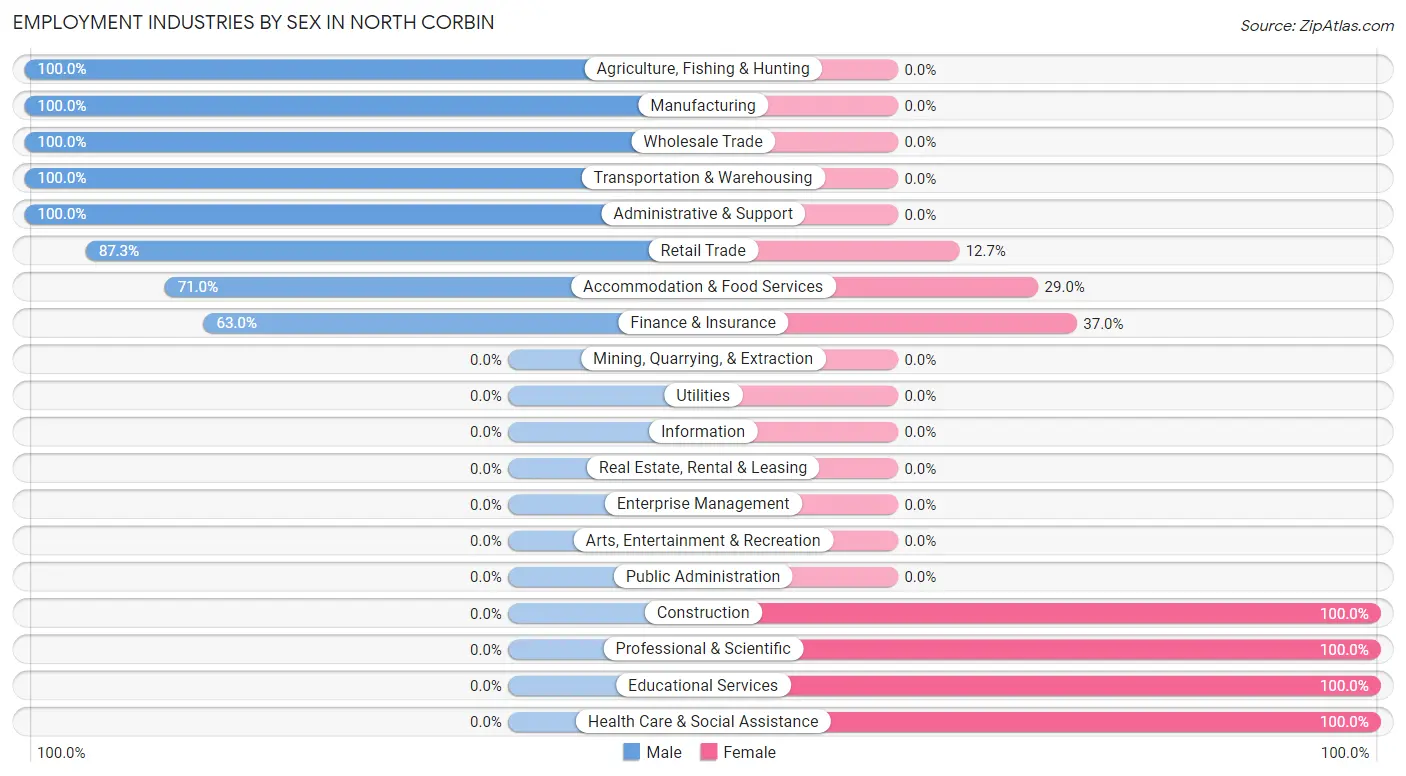
| Industry | Male | Female |
| Agriculture, Fishing & Hunting | 15 (100.0%) | 0 (0.0%) |
| Mining, Quarrying, & Extraction | 0 (0.0%) | 0 (0.0%) |
| Construction | 0 (0.0%) | 19 (100.0%) |
| Manufacturing | 312 (100.0%) | 0 (0.0%) |
| Wholesale Trade | 14 (100.0%) | 0 (0.0%) |
| Retail Trade | 62 (87.3%) | 9 (12.7%) |
| Transportation & Warehousing | 30 (100.0%) | 0 (0.0%) |
| Utilities | 0 (0.0%) | 0 (0.0%) |
| Information | 0 (0.0%) | 0 (0.0%) |
| Finance & Insurance | 17 (63.0%) | 10 (37.0%) |
| Real Estate, Rental & Leasing | 0 (0.0%) | 0 (0.0%) |
| Professional & Scientific | 0 (0.0%) | 49 (100.0%) |
| Enterprise Management | 0 (0.0%) | 0 (0.0%) |
| Administrative & Support | 21 (100.0%) | 0 (0.0%) |
| Educational Services | 0 (0.0%) | 56 (100.0%) |
| Health Care & Social Assistance | 0 (0.0%) | 136 (100.0%) |
| Arts, Entertainment & Recreation | 0 (0.0%) | 0 (0.0%) |
| Accommodation & Food Services | 22 (71.0%) | 9 (29.0%) |
| Public Administration | 0 (0.0%) | 0 (0.0%) |
| Total | 514 (63.3%) | 298 (36.7%) |
Education in North Corbin
School Enrollment in North Corbin
The most common levels of schooling among the 559 students in North Corbin are elementary school (203 | 36.3%), high school (200 | 35.8%), and college / undergraduate (83 | 14.8%).
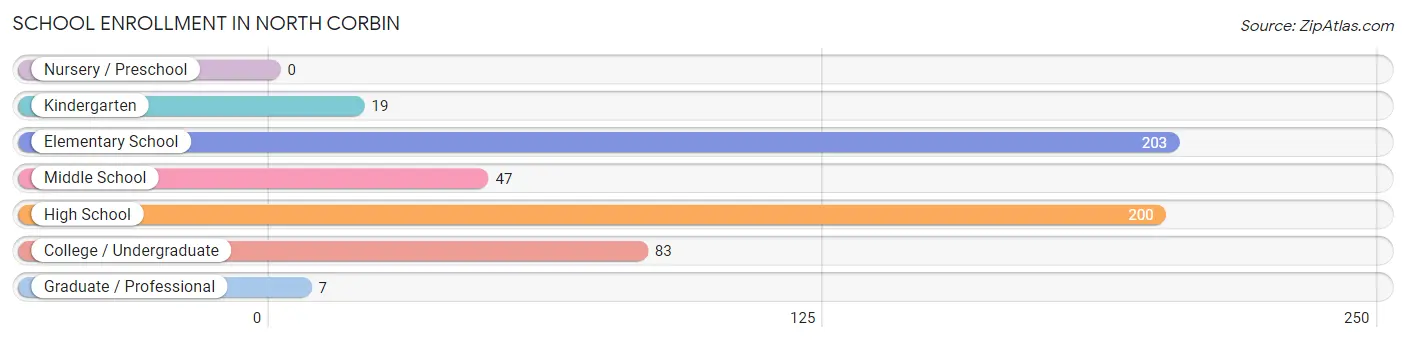
| School Level | # Students | % Students |
| Nursery / Preschool | 0 | 0.0% |
| Kindergarten | 19 | 3.4% |
| Elementary School | 203 | 36.3% |
| Middle School | 47 | 8.4% |
| High School | 200 | 35.8% |
| College / Undergraduate | 83 | 14.8% |
| Graduate / Professional | 7 | 1.3% |
| Total | 559 | 100.0% |
School Enrollment by Age by Funding Source in North Corbin
Out of a total of 559 students who are enrolled in schools in North Corbin, 26 (4.7%) attend a private institution, while the remaining 533 (95.3%) are enrolled in public schools. The age group of 35 years and over has the highest likelihood of being enrolled in private schools, with 26 (72.2% in the age bracket) enrolled. Conversely, the age group of 5 to 9 year old has the lowest likelihood of being enrolled in a private school, with 173 (100.0% in the age bracket) attending a public institution.
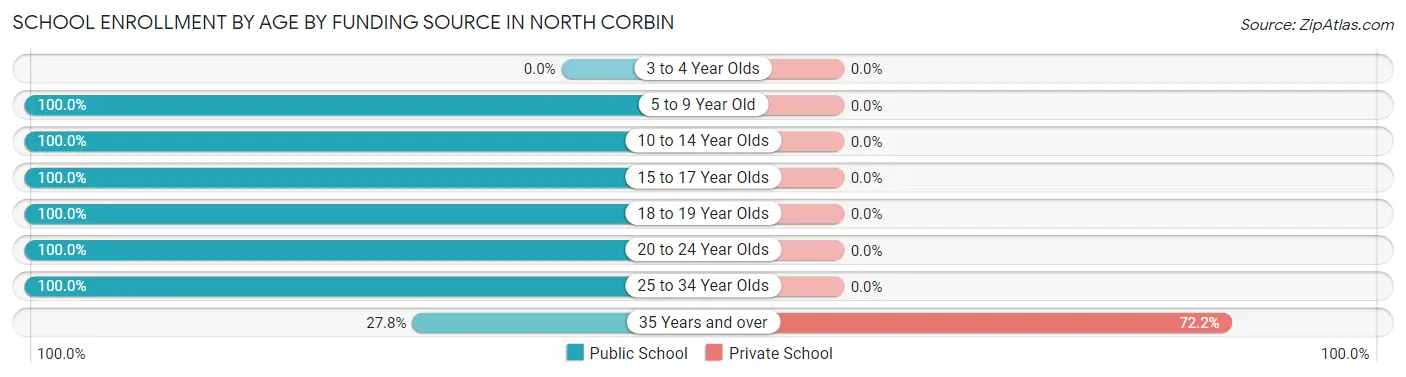
| Age Bracket | Public School | Private School |
| 3 to 4 Year Olds | 0 (0.0%) | 0 (0.0%) |
| 5 to 9 Year Old | 173 (100.0%) | 0 (0.0%) |
| 10 to 14 Year Olds | 96 (100.0%) | 0 (0.0%) |
| 15 to 17 Year Olds | 185 (100.0%) | 0 (0.0%) |
| 18 to 19 Year Olds | 32 (100.0%) | 0 (0.0%) |
| 20 to 24 Year Olds | 15 (100.0%) | 0 (0.0%) |
| 25 to 34 Year Olds | 22 (100.0%) | 0 (0.0%) |
| 35 Years and over | 10 (27.8%) | 26 (72.2%) |
| Total | 533 (95.3%) | 26 (4.7%) |
Educational Attainment by Field of Study in North Corbin
Psychology (96 | 41.2%), business (49 | 21.0%), education (36 | 15.4%), bio, nature & agricultural (22 | 9.4%), and social sciences (18 | 7.7%) are the most common fields of study among 233 individuals in North Corbin who have obtained a bachelor's degree or higher.
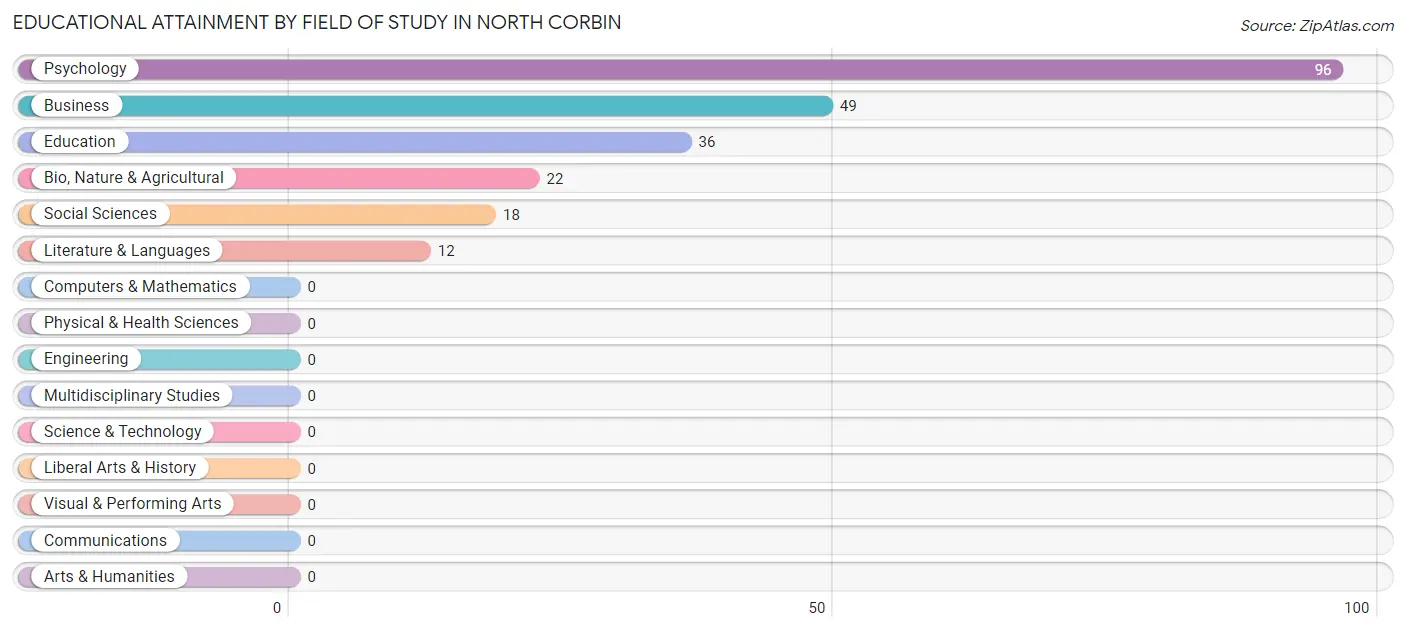
| Field of Study | # Graduates | % Graduates |
| Computers & Mathematics | 0 | 0.0% |
| Bio, Nature & Agricultural | 22 | 9.4% |
| Physical & Health Sciences | 0 | 0.0% |
| Psychology | 96 | 41.2% |
| Social Sciences | 18 | 7.7% |
| Engineering | 0 | 0.0% |
| Multidisciplinary Studies | 0 | 0.0% |
| Science & Technology | 0 | 0.0% |
| Business | 49 | 21.0% |
| Education | 36 | 15.4% |
| Literature & Languages | 12 | 5.1% |
| Liberal Arts & History | 0 | 0.0% |
| Visual & Performing Arts | 0 | 0.0% |
| Communications | 0 | 0.0% |
| Arts & Humanities | 0 | 0.0% |
| Total | 233 | 100.0% |
Transportation & Commute in North Corbin
Vehicle Availability by Sex in North Corbin
The most prevalent vehicle ownership categories in North Corbin are males with 1 vehicle (235, accounting for 45.7%) and females with 1 vehicle (62, making up 82.5%).
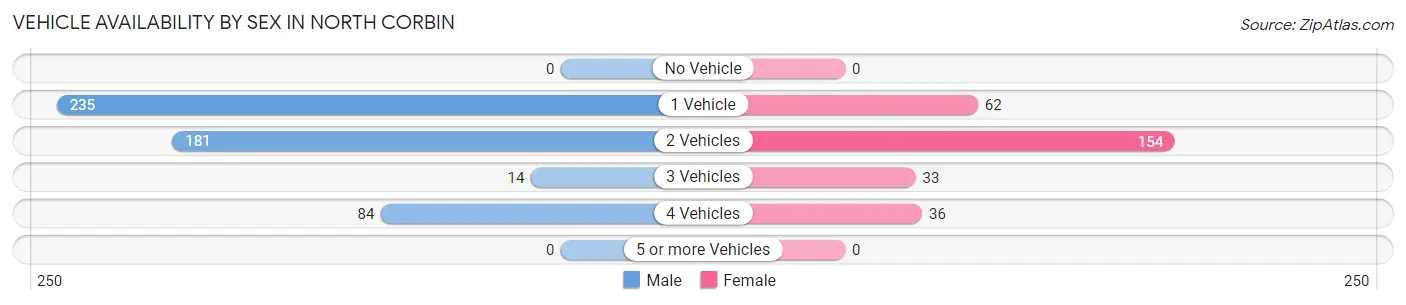
| Vehicles Available | Male | Female |
| No Vehicle | 0 (0.0%) | 0 (0.0%) |
| 1 Vehicle | 235 (45.7%) | 62 (21.7%) |
| 2 Vehicles | 181 (35.2%) | 154 (54.0%) |
| 3 Vehicles | 14 (2.7%) | 33 (11.6%) |
| 4 Vehicles | 84 (16.3%) | 36 (12.6%) |
| 5 or more Vehicles | 0 (0.0%) | 0 (0.0%) |
| Total | 514 (100.0%) | 285 (100.0%) |
Commute Time in North Corbin
The most frequently occuring commute durations in North Corbin are 20 to 24 minutes (194 commuters, 26.2%), 10 to 14 minutes (180 commuters, 24.3%), and 5 to 9 minutes (153 commuters, 20.7%).
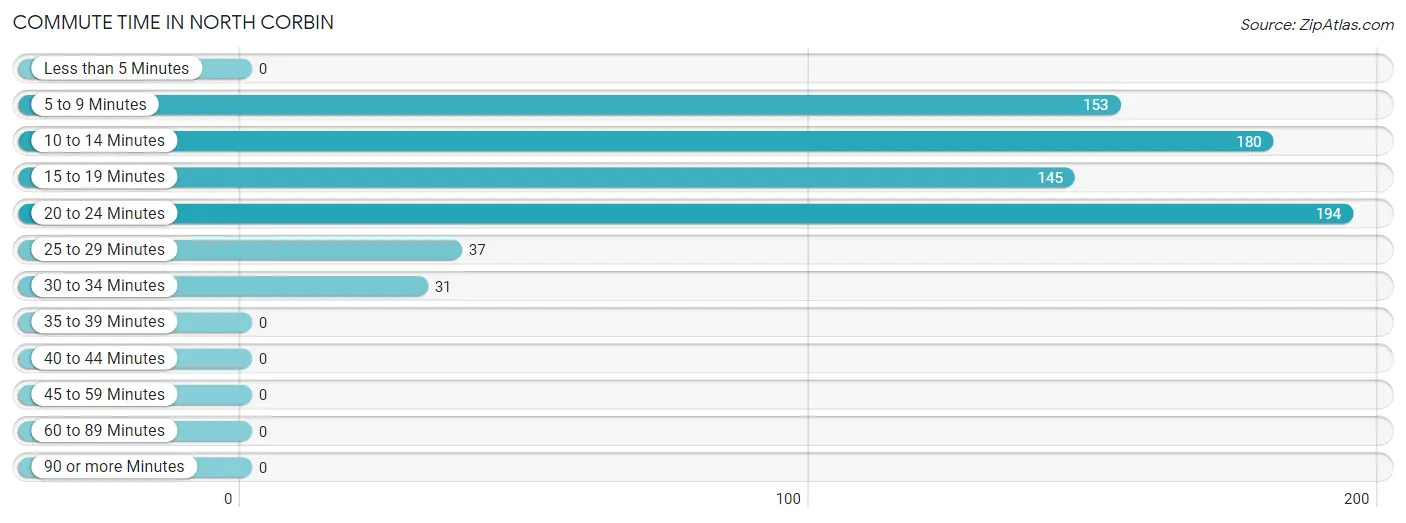
| Commute Time | # Commuters | % Commuters |
| Less than 5 Minutes | 0 | 0.0% |
| 5 to 9 Minutes | 153 | 20.7% |
| 10 to 14 Minutes | 180 | 24.3% |
| 15 to 19 Minutes | 145 | 19.6% |
| 20 to 24 Minutes | 194 | 26.2% |
| 25 to 29 Minutes | 37 | 5.0% |
| 30 to 34 Minutes | 31 | 4.2% |
| 35 to 39 Minutes | 0 | 0.0% |
| 40 to 44 Minutes | 0 | 0.0% |
| 45 to 59 Minutes | 0 | 0.0% |
| 60 to 89 Minutes | 0 | 0.0% |
| 90 or more Minutes | 0 | 0.0% |
Commute Time by Sex in North Corbin
The most common commute times in North Corbin are 20 to 24 minutes (153 commuters, 29.8%) for males and 10 to 14 minutes (69 commuters, 30.5%) for females.
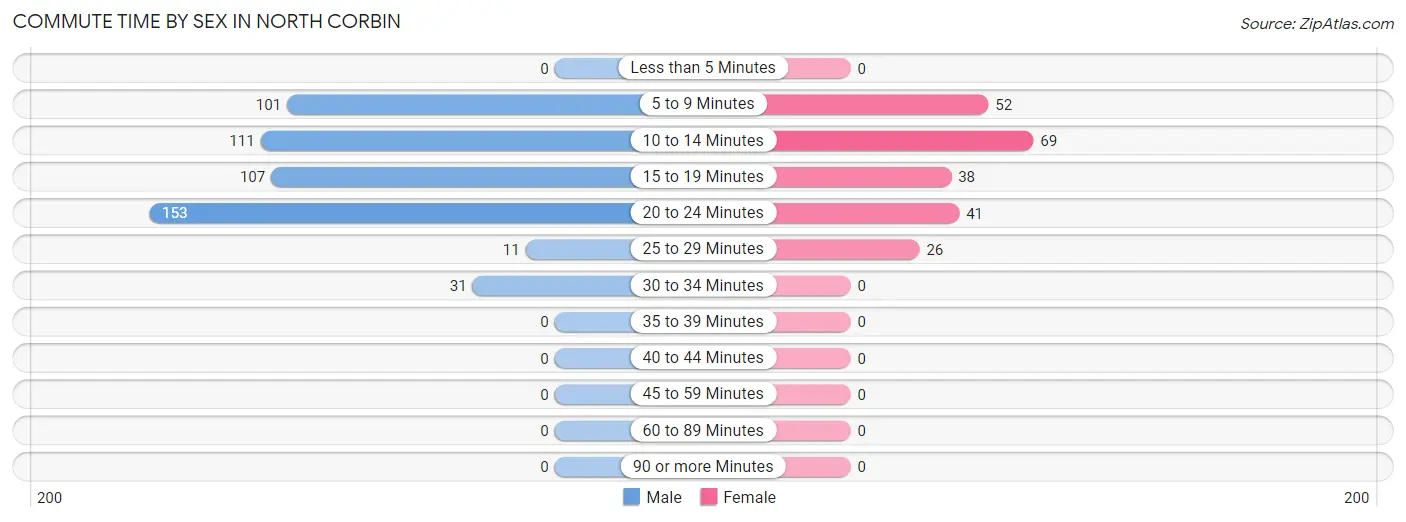
| Commute Time | Male | Female |
| Less than 5 Minutes | 0 (0.0%) | 0 (0.0%) |
| 5 to 9 Minutes | 101 (19.7%) | 52 (23.0%) |
| 10 to 14 Minutes | 111 (21.6%) | 69 (30.5%) |
| 15 to 19 Minutes | 107 (20.8%) | 38 (16.8%) |
| 20 to 24 Minutes | 153 (29.8%) | 41 (18.1%) |
| 25 to 29 Minutes | 11 (2.1%) | 26 (11.5%) |
| 30 to 34 Minutes | 31 (6.0%) | 0 (0.0%) |
| 35 to 39 Minutes | 0 (0.0%) | 0 (0.0%) |
| 40 to 44 Minutes | 0 (0.0%) | 0 (0.0%) |
| 45 to 59 Minutes | 0 (0.0%) | 0 (0.0%) |
| 60 to 89 Minutes | 0 (0.0%) | 0 (0.0%) |
| 90 or more Minutes | 0 (0.0%) | 0 (0.0%) |
Time of Departure to Work by Sex in North Corbin
The most frequent times of departure to work in North Corbin are 4:00 PM to 11:59 PM (139, 27.0%) for males and 7:30 AM to 7:59 AM (87, 38.5%) for females.
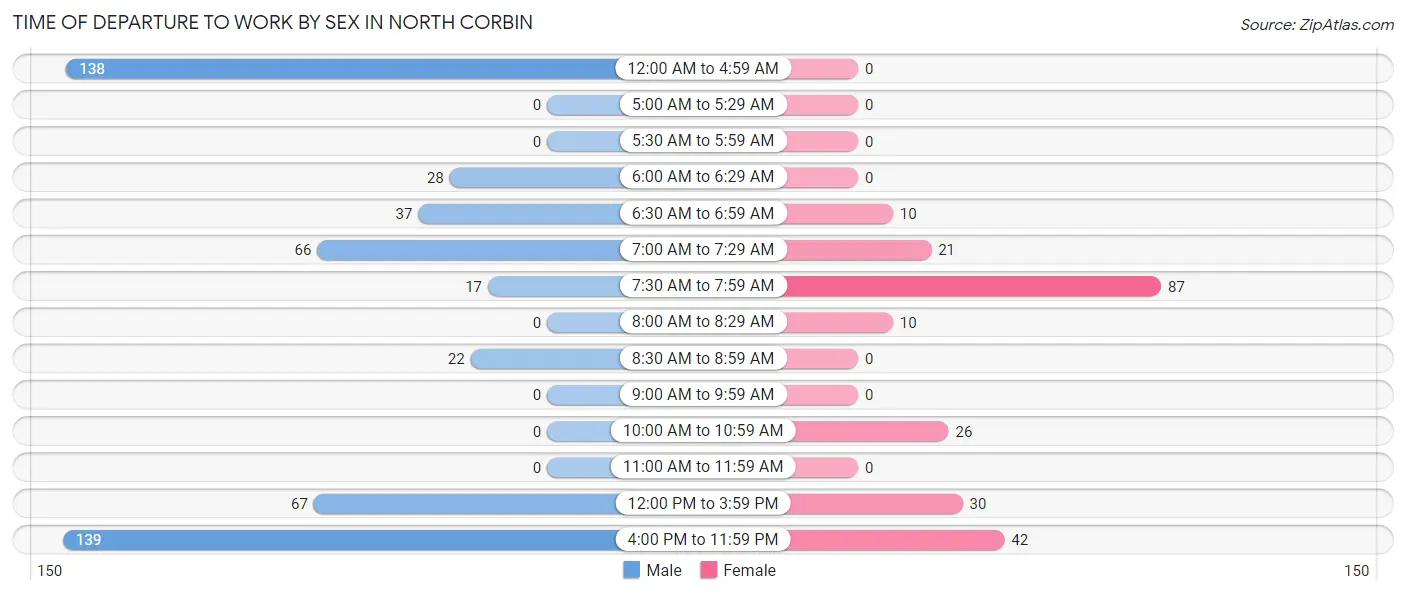
| Time of Departure | Male | Female |
| 12:00 AM to 4:59 AM | 138 (26.9%) | 0 (0.0%) |
| 5:00 AM to 5:29 AM | 0 (0.0%) | 0 (0.0%) |
| 5:30 AM to 5:59 AM | 0 (0.0%) | 0 (0.0%) |
| 6:00 AM to 6:29 AM | 28 (5.4%) | 0 (0.0%) |
| 6:30 AM to 6:59 AM | 37 (7.2%) | 10 (4.4%) |
| 7:00 AM to 7:29 AM | 66 (12.8%) | 21 (9.3%) |
| 7:30 AM to 7:59 AM | 17 (3.3%) | 87 (38.5%) |
| 8:00 AM to 8:29 AM | 0 (0.0%) | 10 (4.4%) |
| 8:30 AM to 8:59 AM | 22 (4.3%) | 0 (0.0%) |
| 9:00 AM to 9:59 AM | 0 (0.0%) | 0 (0.0%) |
| 10:00 AM to 10:59 AM | 0 (0.0%) | 26 (11.5%) |
| 11:00 AM to 11:59 AM | 0 (0.0%) | 0 (0.0%) |
| 12:00 PM to 3:59 PM | 67 (13.0%) | 30 (13.3%) |
| 4:00 PM to 11:59 PM | 139 (27.0%) | 42 (18.6%) |
| Total | 514 (100.0%) | 226 (100.0%) |
Housing Occupancy in North Corbin
Occupancy by Ownership in North Corbin
Of the total 691 dwellings in North Corbin, owner-occupied units account for 329 (47.6%), while renter-occupied units make up 362 (52.4%).
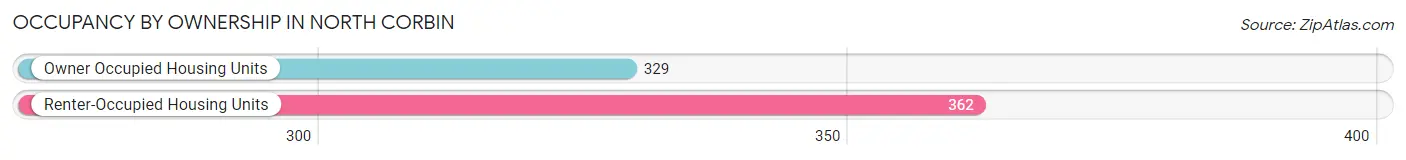
| Occupancy | # Housing Units | % Housing Units |
| Owner Occupied Housing Units | 329 | 47.6% |
| Renter-Occupied Housing Units | 362 | 52.4% |
| Total Occupied Housing Units | 691 | 100.0% |
Occupancy by Household Size in North Corbin
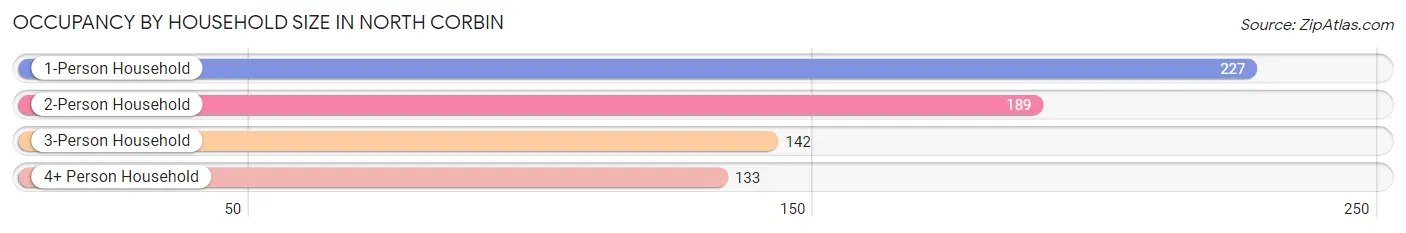
| Household Size | # Housing Units | % Housing Units |
| 1-Person Household | 227 | 32.9% |
| 2-Person Household | 189 | 27.4% |
| 3-Person Household | 142 | 20.5% |
| 4+ Person Household | 133 | 19.3% |
| Total Housing Units | 691 | 100.0% |
Occupancy by Ownership by Household Size in North Corbin
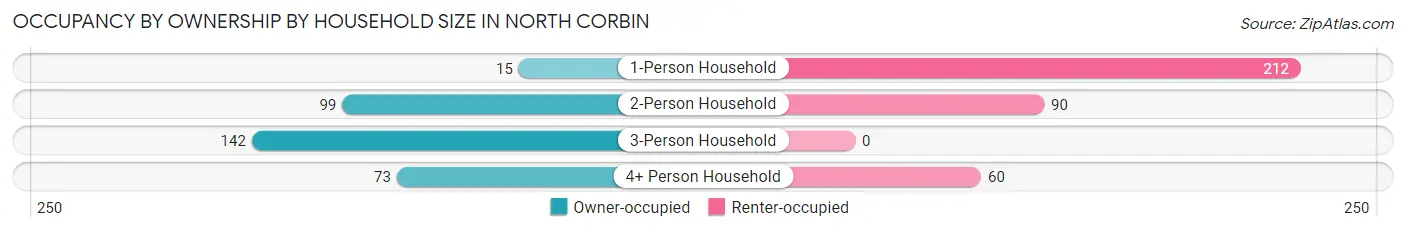
| Household Size | Owner-occupied | Renter-occupied |
| 1-Person Household | 15 (6.6%) | 212 (93.4%) |
| 2-Person Household | 99 (52.4%) | 90 (47.6%) |
| 3-Person Household | 142 (100.0%) | 0 (0.0%) |
| 4+ Person Household | 73 (54.9%) | 60 (45.1%) |
| Total Housing Units | 329 (47.6%) | 362 (52.4%) |
Occupancy by Educational Attainment in North Corbin
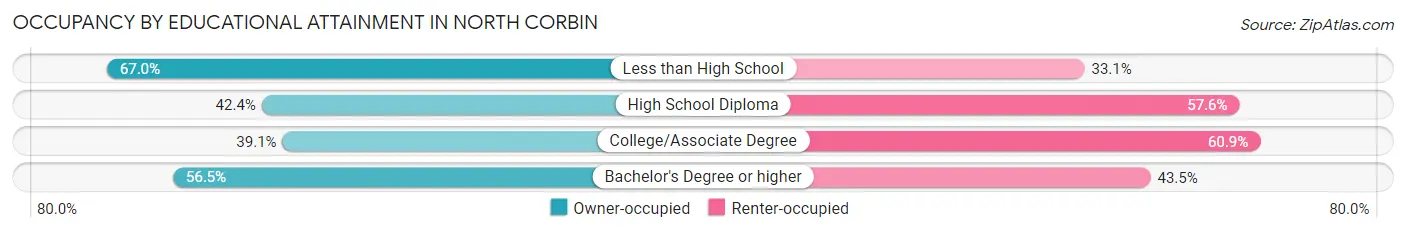
| Household Size | Owner-occupied | Renter-occupied |
| Less than High School | 79 (66.9%) | 39 (33.1%) |
| High School Diploma | 92 (42.4%) | 125 (57.6%) |
| College/Associate Degree | 97 (39.1%) | 151 (60.9%) |
| Bachelor's Degree or higher | 61 (56.5%) | 47 (43.5%) |
Occupancy by Age of Householder in North Corbin
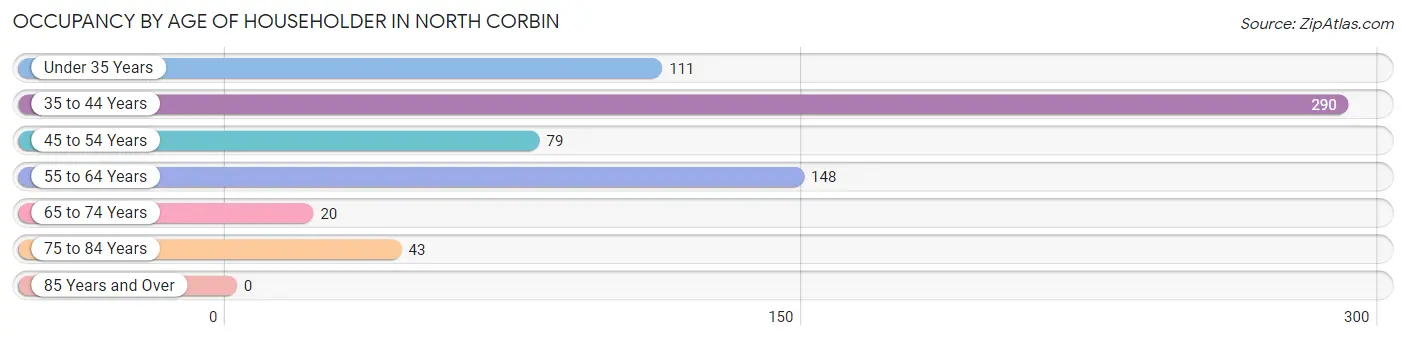
| Age Bracket | # Households | % Households |
| Under 35 Years | 111 | 16.1% |
| 35 to 44 Years | 290 | 42.0% |
| 45 to 54 Years | 79 | 11.4% |
| 55 to 64 Years | 148 | 21.4% |
| 65 to 74 Years | 20 | 2.9% |
| 75 to 84 Years | 43 | 6.2% |
| 85 Years and Over | 0 | 0.0% |
| Total | 691 | 100.0% |
Housing Finances in North Corbin
Median Income by Occupancy in North Corbin
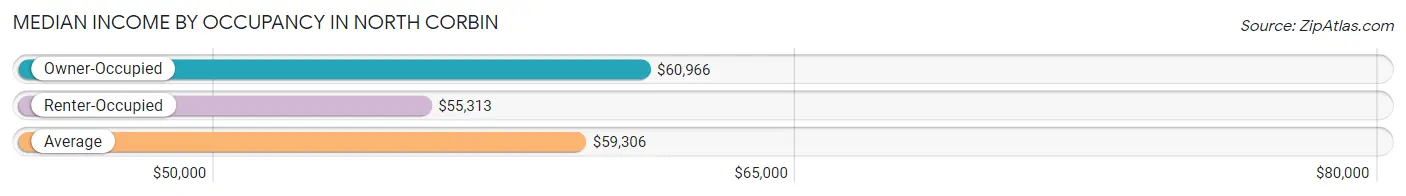
| Occupancy Type | # Households | Median Income |
| Owner-Occupied | 329 (47.6%) | $60,966 |
| Renter-Occupied | 362 (52.4%) | $55,313 |
| Average | 691 (100.0%) | $59,306 |
Occupancy by Householder Income Bracket in North Corbin
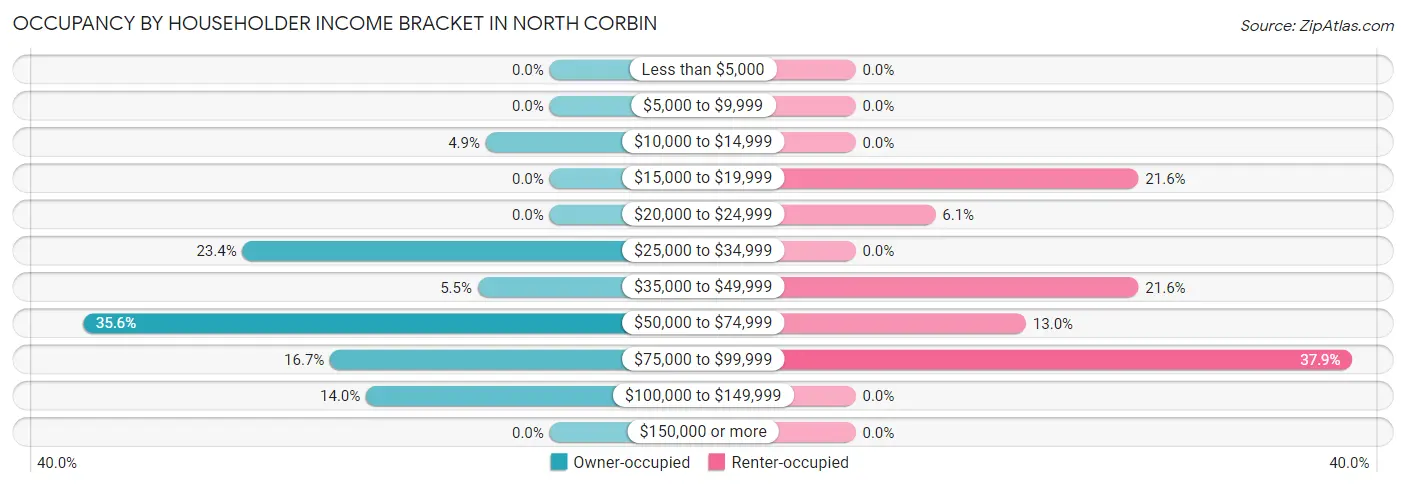
| Income Bracket | Owner-occupied | Renter-occupied |
| Less than $5,000 | 0 (0.0%) | 0 (0.0%) |
| $5,000 to $9,999 | 0 (0.0%) | 0 (0.0%) |
| $10,000 to $14,999 | 16 (4.9%) | 0 (0.0%) |
| $15,000 to $19,999 | 0 (0.0%) | 78 (21.5%) |
| $20,000 to $24,999 | 0 (0.0%) | 22 (6.1%) |
| $25,000 to $34,999 | 77 (23.4%) | 0 (0.0%) |
| $35,000 to $49,999 | 18 (5.5%) | 78 (21.5%) |
| $50,000 to $74,999 | 117 (35.6%) | 47 (13.0%) |
| $75,000 to $99,999 | 55 (16.7%) | 137 (37.9%) |
| $100,000 to $149,999 | 46 (14.0%) | 0 (0.0%) |
| $150,000 or more | 0 (0.0%) | 0 (0.0%) |
| Total | 329 (100.0%) | 362 (100.0%) |
Monthly Housing Cost Tiers in North Corbin
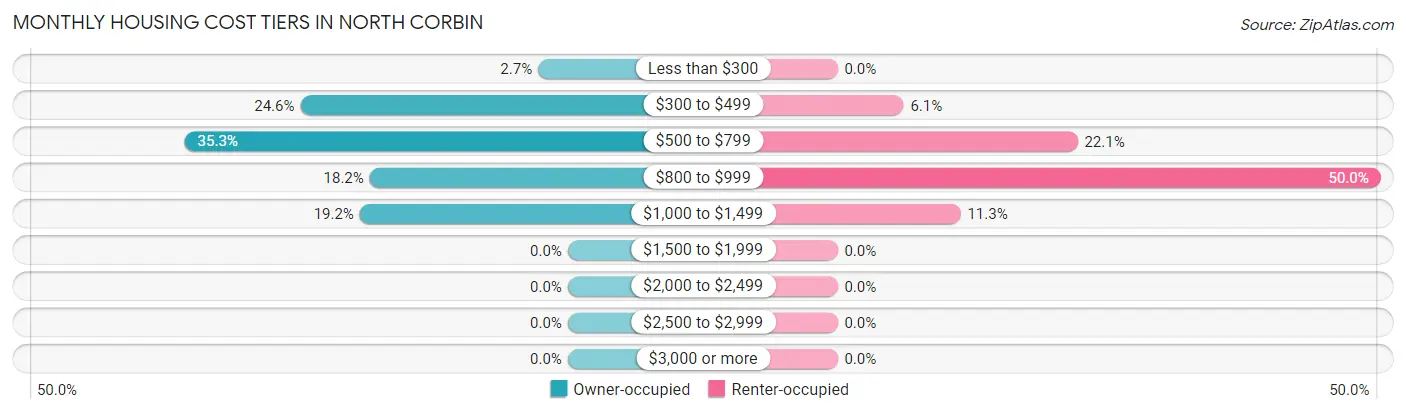
| Monthly Cost | Owner-occupied | Renter-occupied |
| Less than $300 | 9 (2.7%) | 0 (0.0%) |
| $300 to $499 | 81 (24.6%) | 22 (6.1%) |
| $500 to $799 | 116 (35.3%) | 80 (22.1%) |
| $800 to $999 | 60 (18.2%) | 181 (50.0%) |
| $1,000 to $1,499 | 63 (19.2%) | 41 (11.3%) |
| $1,500 to $1,999 | 0 (0.0%) | 0 (0.0%) |
| $2,000 to $2,499 | 0 (0.0%) | 0 (0.0%) |
| $2,500 to $2,999 | 0 (0.0%) | 0 (0.0%) |
| $3,000 or more | 0 (0.0%) | 0 (0.0%) |
| Total | 329 (100.0%) | 362 (100.0%) |
Physical Housing Characteristics in North Corbin
Housing Structures in North Corbin
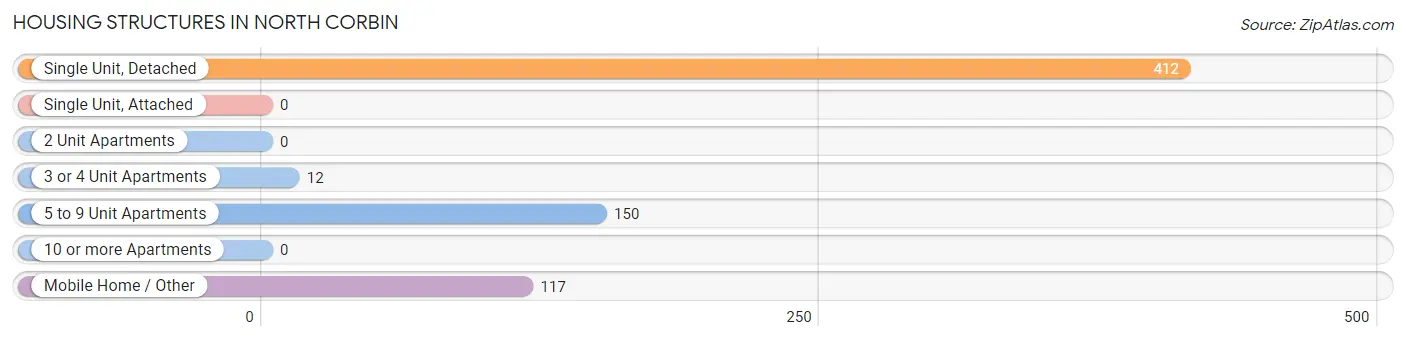
| Structure Type | # Housing Units | % Housing Units |
| Single Unit, Detached | 412 | 59.6% |
| Single Unit, Attached | 0 | 0.0% |
| 2 Unit Apartments | 0 | 0.0% |
| 3 or 4 Unit Apartments | 12 | 1.7% |
| 5 to 9 Unit Apartments | 150 | 21.7% |
| 10 or more Apartments | 0 | 0.0% |
| Mobile Home / Other | 117 | 16.9% |
| Total | 691 | 100.0% |
Housing Structures by Occupancy in North Corbin
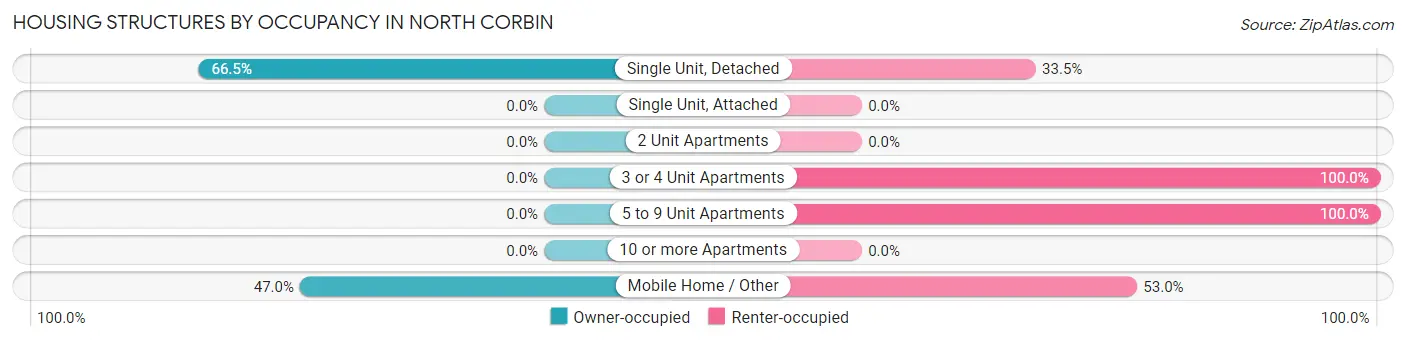
| Structure Type | Owner-occupied | Renter-occupied |
| Single Unit, Detached | 274 (66.5%) | 138 (33.5%) |
| Single Unit, Attached | 0 (0.0%) | 0 (0.0%) |
| 2 Unit Apartments | 0 (0.0%) | 0 (0.0%) |
| 3 or 4 Unit Apartments | 0 (0.0%) | 12 (100.0%) |
| 5 to 9 Unit Apartments | 0 (0.0%) | 150 (100.0%) |
| 10 or more Apartments | 0 (0.0%) | 0 (0.0%) |
| Mobile Home / Other | 55 (47.0%) | 62 (53.0%) |
| Total | 329 (47.6%) | 362 (52.4%) |
Housing Structures by Number of Rooms in North Corbin
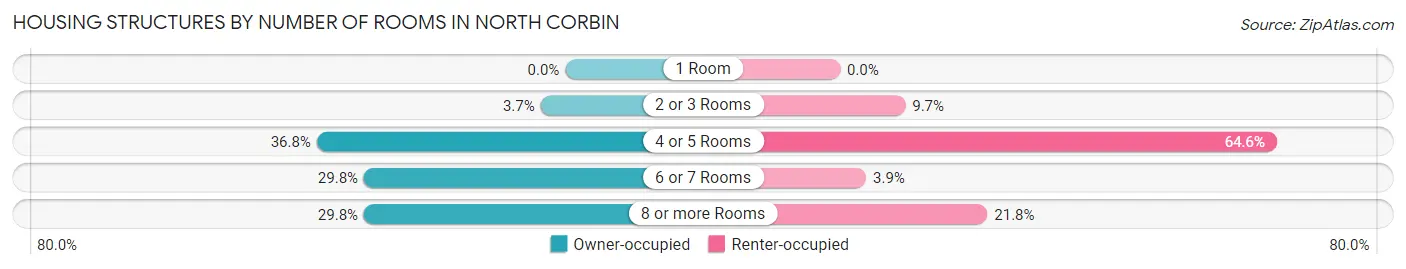
| Number of Rooms | Owner-occupied | Renter-occupied |
| 1 Room | 0 (0.0%) | 0 (0.0%) |
| 2 or 3 Rooms | 12 (3.6%) | 35 (9.7%) |
| 4 or 5 Rooms | 121 (36.8%) | 234 (64.6%) |
| 6 or 7 Rooms | 98 (29.8%) | 14 (3.9%) |
| 8 or more Rooms | 98 (29.8%) | 79 (21.8%) |
| Total | 329 (100.0%) | 362 (100.0%) |
Housing Structure by Heating Type in North Corbin
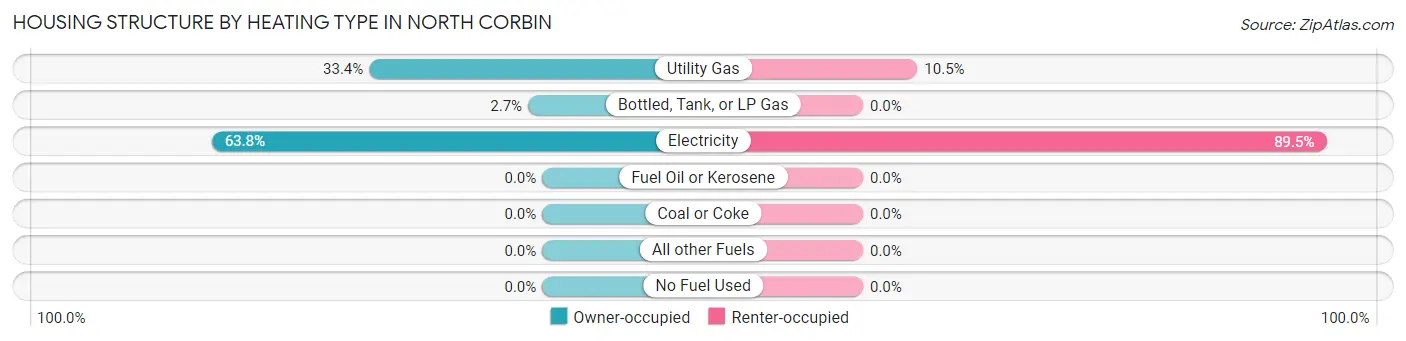
| Heating Type | Owner-occupied | Renter-occupied |
| Utility Gas | 110 (33.4%) | 38 (10.5%) |
| Bottled, Tank, or LP Gas | 9 (2.7%) | 0 (0.0%) |
| Electricity | 210 (63.8%) | 324 (89.5%) |
| Fuel Oil or Kerosene | 0 (0.0%) | 0 (0.0%) |
| Coal or Coke | 0 (0.0%) | 0 (0.0%) |
| All other Fuels | 0 (0.0%) | 0 (0.0%) |
| No Fuel Used | 0 (0.0%) | 0 (0.0%) |
| Total | 329 (100.0%) | 362 (100.0%) |
Household Vehicle Usage in North Corbin
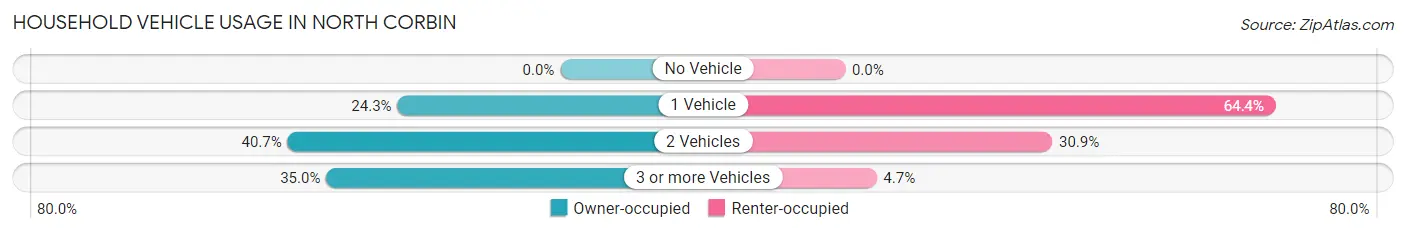
| Vehicles per Household | Owner-occupied | Renter-occupied |
| No Vehicle | 0 (0.0%) | 0 (0.0%) |
| 1 Vehicle | 80 (24.3%) | 233 (64.4%) |
| 2 Vehicles | 134 (40.7%) | 112 (30.9%) |
| 3 or more Vehicles | 115 (34.9%) | 17 (4.7%) |
| Total | 329 (100.0%) | 362 (100.0%) |
Real Estate & Mortgages in North Corbin
Real Estate and Mortgage Overview in North Corbin
| Characteristic | Without Mortgage | With Mortgage |
| Housing Units | 87 | 242 |
| Median Property Value | $112,500 | $98,000 |
| Median Household Income | $97,656 | $0 |
| Monthly Housing Costs | $399 | $0 |
| Real Estate Taxes | $645 | $9 |
Property Value by Mortgage Status in North Corbin
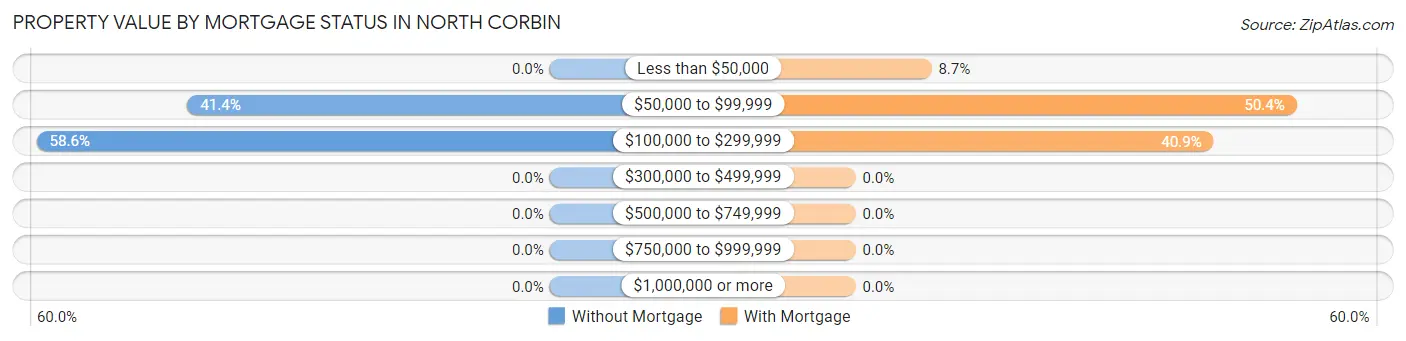
| Property Value | Without Mortgage | With Mortgage |
| Less than $50,000 | 0 (0.0%) | 21 (8.7%) |
| $50,000 to $99,999 | 36 (41.4%) | 122 (50.4%) |
| $100,000 to $299,999 | 51 (58.6%) | 99 (40.9%) |
| $300,000 to $499,999 | 0 (0.0%) | 0 (0.0%) |
| $500,000 to $749,999 | 0 (0.0%) | 0 (0.0%) |
| $750,000 to $999,999 | 0 (0.0%) | 0 (0.0%) |
| $1,000,000 or more | 0 (0.0%) | 0 (0.0%) |
| Total | 87 (100.0%) | 242 (100.0%) |
Household Income by Mortgage Status in North Corbin
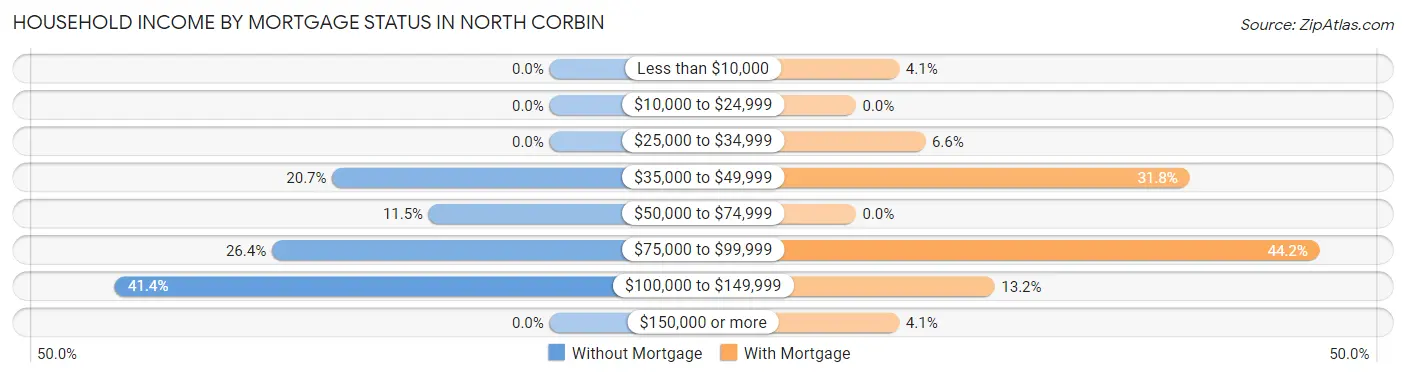
| Household Income | Without Mortgage | With Mortgage |
| Less than $10,000 | 0 (0.0%) | 10 (4.1%) |
| $10,000 to $24,999 | 0 (0.0%) | 0 (0.0%) |
| $25,000 to $34,999 | 0 (0.0%) | 16 (6.6%) |
| $35,000 to $49,999 | 18 (20.7%) | 77 (31.8%) |
| $50,000 to $74,999 | 10 (11.5%) | 0 (0.0%) |
| $75,000 to $99,999 | 23 (26.4%) | 107 (44.2%) |
| $100,000 to $149,999 | 36 (41.4%) | 32 (13.2%) |
| $150,000 or more | 0 (0.0%) | 10 (4.1%) |
| Total | 87 (100.0%) | 242 (100.0%) |
Property Value to Household Income Ratio in North Corbin
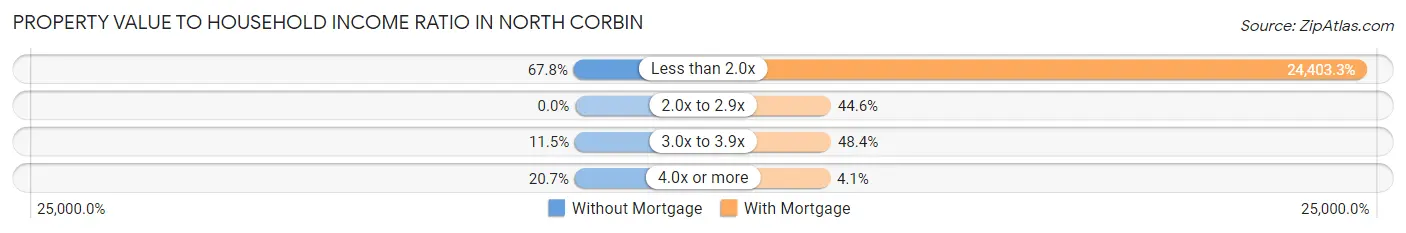
| Value-to-Income Ratio | Without Mortgage | With Mortgage |
| Less than 2.0x | 59 (67.8%) | 59,056 (24,403.3%) |
| 2.0x to 2.9x | 0 (0.0%) | 108 (44.6%) |
| 3.0x to 3.9x | 10 (11.5%) | 117 (48.3%) |
| 4.0x or more | 18 (20.7%) | 10 (4.1%) |
| Total | 87 (100.0%) | 242 (100.0%) |
Real Estate Taxes by Mortgage Status in North Corbin
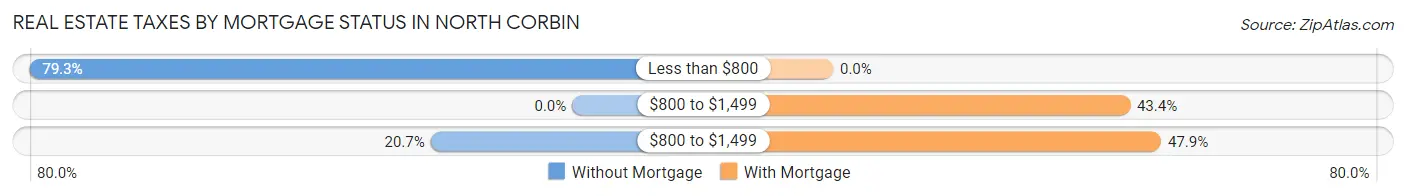
| Property Taxes | Without Mortgage | With Mortgage |
| Less than $800 | 69 (79.3%) | 0 (0.0%) |
| $800 to $1,499 | 0 (0.0%) | 105 (43.4%) |
| $800 to $1,499 | 18 (20.7%) | 116 (47.9%) |
| Total | 87 (100.0%) | 242 (100.0%) |
Health & Disability in North Corbin
Health Insurance Coverage by Age in North Corbin
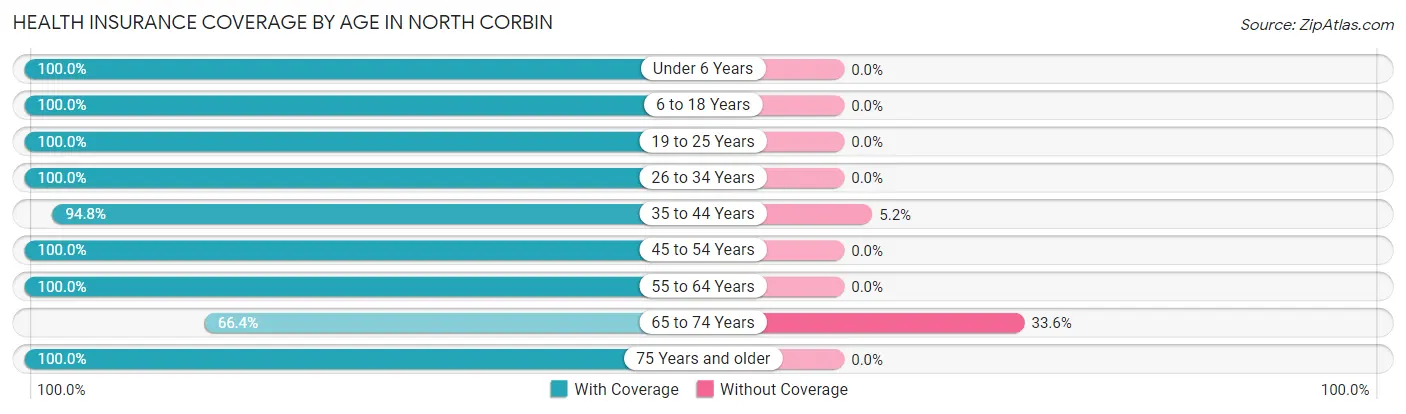
| Age Bracket | With Coverage | Without Coverage |
| Under 6 Years | 134 (100.0%) | 0 (0.0%) |
| 6 to 18 Years | 504 (100.0%) | 0 (0.0%) |
| 19 to 25 Years | 59 (100.0%) | 0 (0.0%) |
| 26 to 34 Years | 328 (100.0%) | 0 (0.0%) |
| 35 to 44 Years | 399 (94.8%) | 22 (5.2%) |
| 45 to 54 Years | 148 (100.0%) | 0 (0.0%) |
| 55 to 64 Years | 189 (100.0%) | 0 (0.0%) |
| 65 to 74 Years | 79 (66.4%) | 40 (33.6%) |
| 75 Years and older | 53 (100.0%) | 0 (0.0%) |
| Total | 1,893 (96.8%) | 62 (3.2%) |
Health Insurance Coverage by Citizenship Status in North Corbin
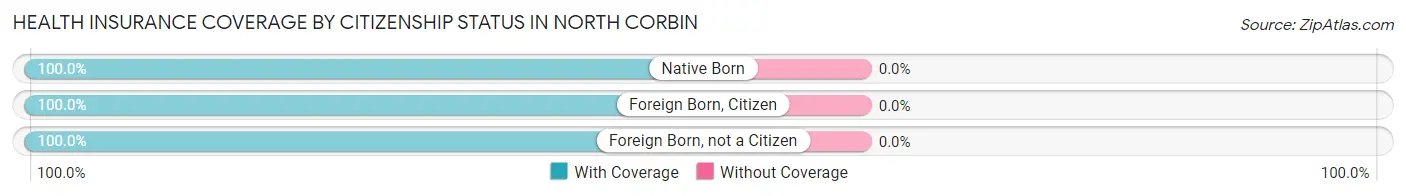
| Citizenship Status | With Coverage | Without Coverage |
| Native Born | 134 (100.0%) | 0 (0.0%) |
| Foreign Born, Citizen | 504 (100.0%) | 0 (0.0%) |
| Foreign Born, not a Citizen | 59 (100.0%) | 0 (0.0%) |
Health Insurance Coverage by Household Income in North Corbin
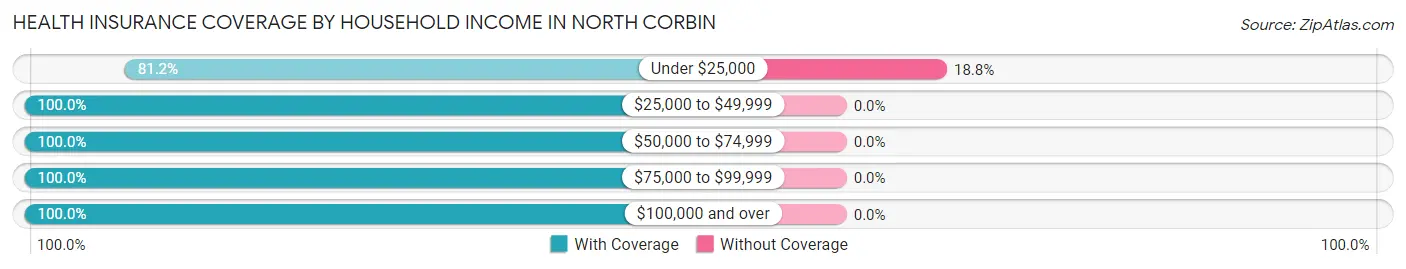
| Household Income | With Coverage | Without Coverage |
| Under $25,000 | 268 (81.2%) | 62 (18.8%) |
| $25,000 to $49,999 | 502 (100.0%) | 0 (0.0%) |
| $50,000 to $74,999 | 729 (100.0%) | 0 (0.0%) |
| $75,000 to $99,999 | 262 (100.0%) | 0 (0.0%) |
| $100,000 and over | 132 (100.0%) | 0 (0.0%) |
Public vs Private Health Insurance Coverage by Age in North Corbin
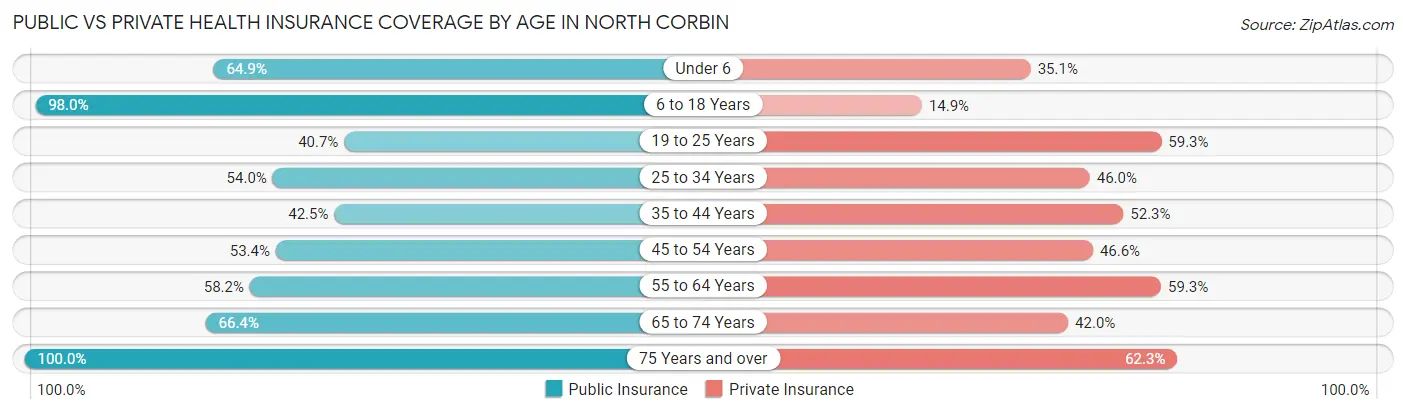
| Age Bracket | Public Insurance | Private Insurance |
| Under 6 | 87 (64.9%) | 47 (35.1%) |
| 6 to 18 Years | 494 (98.0%) | 75 (14.9%) |
| 19 to 25 Years | 24 (40.7%) | 35 (59.3%) |
| 25 to 34 Years | 177 (54.0%) | 151 (46.0%) |
| 35 to 44 Years | 179 (42.5%) | 220 (52.3%) |
| 45 to 54 Years | 79 (53.4%) | 69 (46.6%) |
| 55 to 64 Years | 110 (58.2%) | 112 (59.3%) |
| 65 to 74 Years | 79 (66.4%) | 50 (42.0%) |
| 75 Years and over | 53 (100.0%) | 33 (62.3%) |
| Total | 1,282 (65.6%) | 792 (40.5%) |
Disability Status by Sex by Age in North Corbin
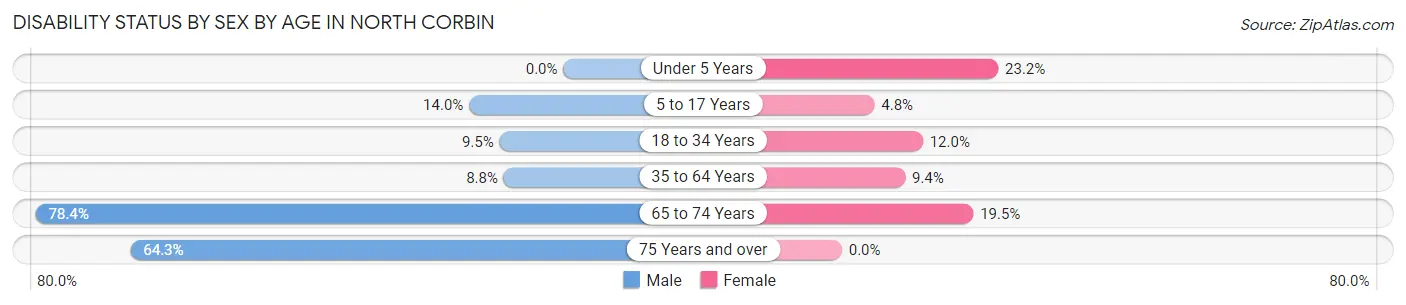
| Age Bracket | Male | Female |
| Under 5 Years | 0 (0.0%) | 13 (23.2%) |
| 5 to 17 Years | 40 (14.0%) | 9 (4.8%) |
| 18 to 34 Years | 20 (9.5%) | 25 (12.0%) |
| 35 to 64 Years | 35 (8.8%) | 34 (9.4%) |
| 65 to 74 Years | 29 (78.4%) | 16 (19.5%) |
| 75 Years and over | 18 (64.3%) | 0 (0.0%) |
Disability Class by Sex by Age in North Corbin
Disability Class: Hearing Difficulty
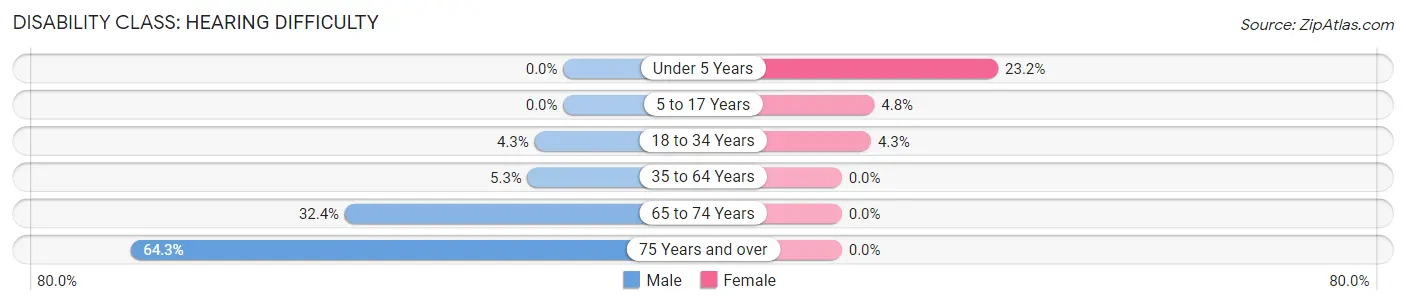
| Age Bracket | Male | Female |
| Under 5 Years | 0 (0.0%) | 13 (23.2%) |
| 5 to 17 Years | 0 (0.0%) | 9 (4.8%) |
| 18 to 34 Years | 9 (4.3%) | 9 (4.3%) |
| 35 to 64 Years | 21 (5.3%) | 0 (0.0%) |
| 65 to 74 Years | 12 (32.4%) | 0 (0.0%) |
| 75 Years and over | 18 (64.3%) | 0 (0.0%) |
Disability Class: Vision Difficulty
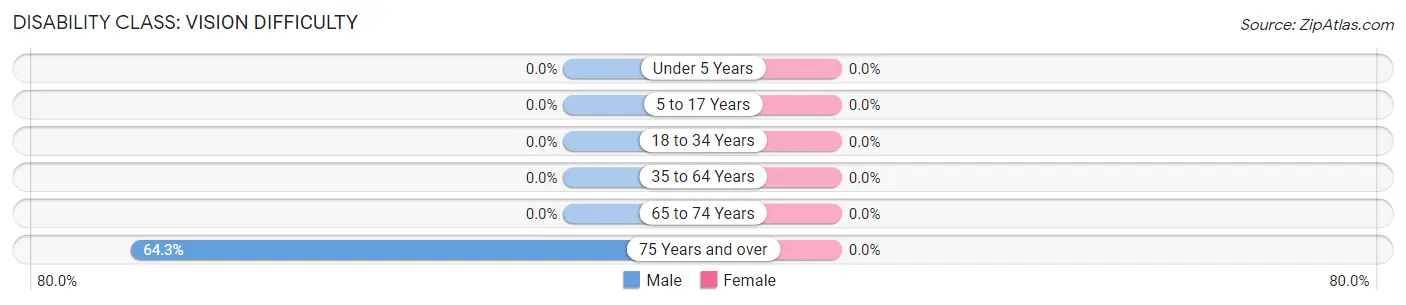
| Age Bracket | Male | Female |
| Under 5 Years | 0 (0.0%) | 0 (0.0%) |
| 5 to 17 Years | 0 (0.0%) | 0 (0.0%) |
| 18 to 34 Years | 0 (0.0%) | 0 (0.0%) |
| 35 to 64 Years | 0 (0.0%) | 0 (0.0%) |
| 65 to 74 Years | 0 (0.0%) | 0 (0.0%) |
| 75 Years and over | 18 (64.3%) | 0 (0.0%) |
Disability Class: Cognitive Difficulty
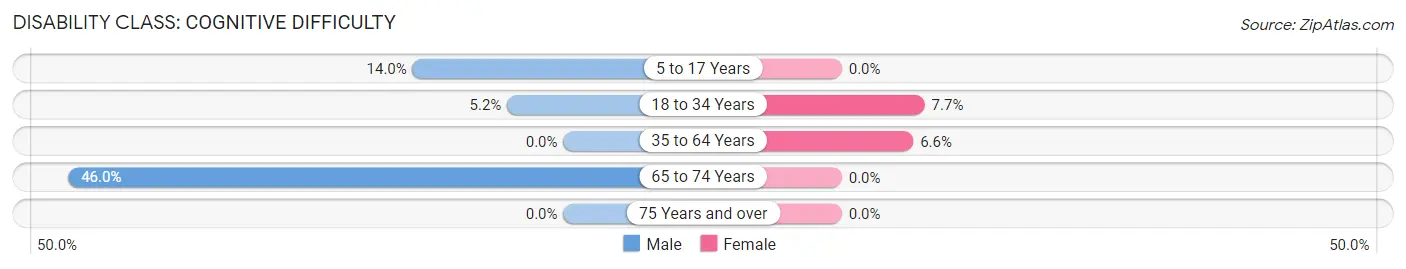
| Age Bracket | Male | Female |
| 5 to 17 Years | 40 (14.0%) | 0 (0.0%) |
| 18 to 34 Years | 11 (5.2%) | 16 (7.7%) |
| 35 to 64 Years | 0 (0.0%) | 24 (6.6%) |
| 65 to 74 Years | 17 (46.0%) | 0 (0.0%) |
| 75 Years and over | 0 (0.0%) | 0 (0.0%) |
Disability Class: Ambulatory Difficulty
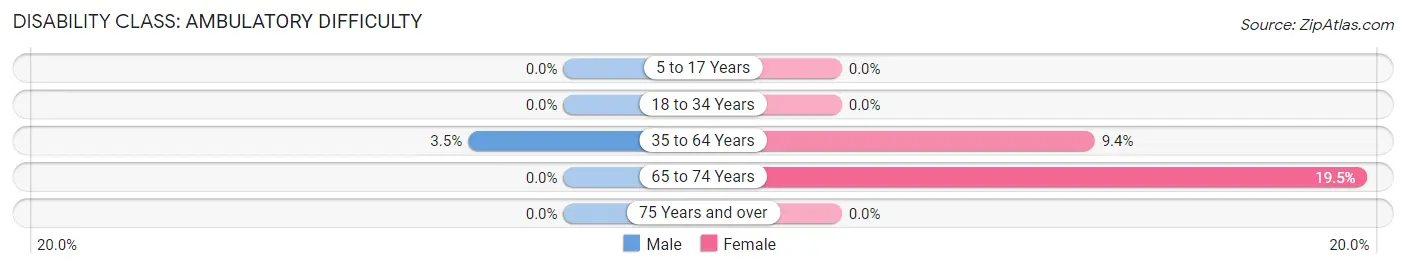
| Age Bracket | Male | Female |
| 5 to 17 Years | 0 (0.0%) | 0 (0.0%) |
| 18 to 34 Years | 0 (0.0%) | 0 (0.0%) |
| 35 to 64 Years | 14 (3.5%) | 34 (9.4%) |
| 65 to 74 Years | 0 (0.0%) | 16 (19.5%) |
| 75 Years and over | 0 (0.0%) | 0 (0.0%) |
Disability Class: Self-Care Difficulty
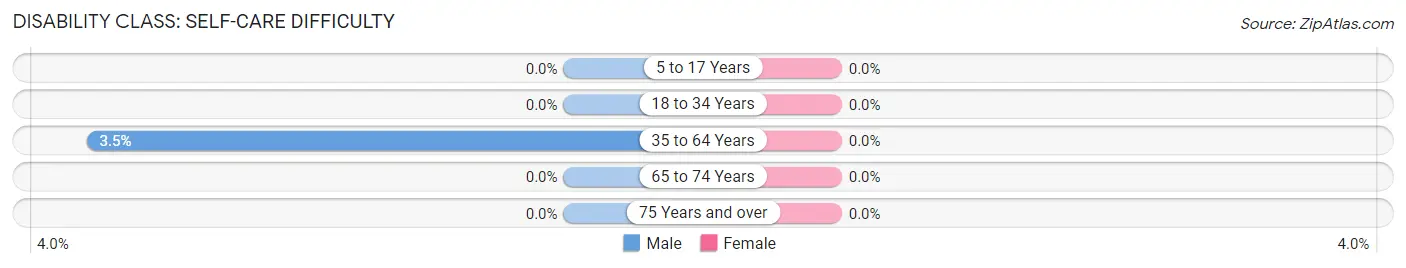
| Age Bracket | Male | Female |
| 5 to 17 Years | 0 (0.0%) | 0 (0.0%) |
| 18 to 34 Years | 0 (0.0%) | 0 (0.0%) |
| 35 to 64 Years | 14 (3.5%) | 0 (0.0%) |
| 65 to 74 Years | 0 (0.0%) | 0 (0.0%) |
| 75 Years and over | 0 (0.0%) | 0 (0.0%) |
Technology Access in North Corbin
Computing Device Access in North Corbin
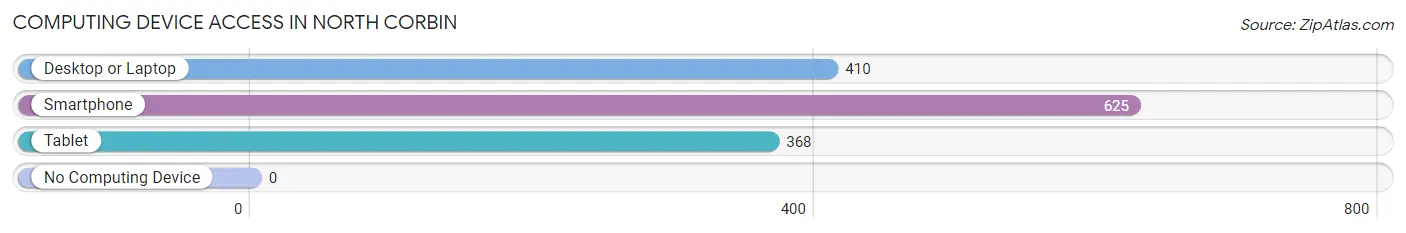
| Device Type | # Households | % Households |
| Desktop or Laptop | 410 | 59.3% |
| Smartphone | 625 | 90.4% |
| Tablet | 368 | 53.3% |
| No Computing Device | 0 | 0.0% |
| Total | 691 | 100.0% |
Internet Access in North Corbin
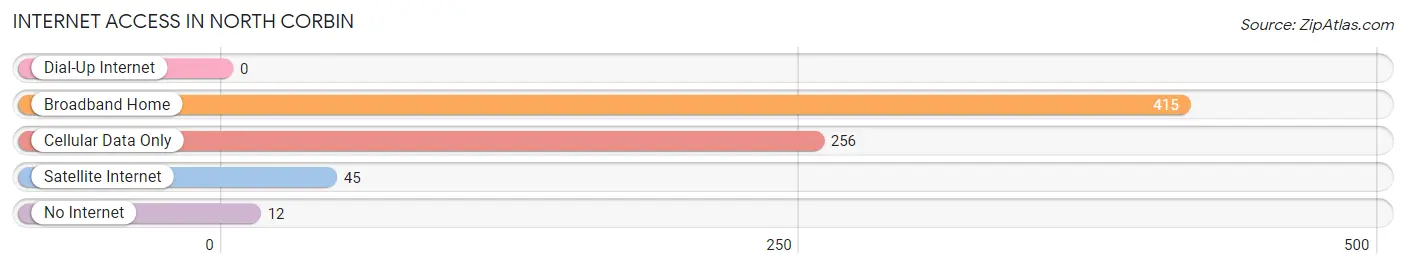
| Internet Type | # Households | % Households |
| Dial-Up Internet | 0 | 0.0% |
| Broadband Home | 415 | 60.1% |
| Cellular Data Only | 256 | 37.0% |
| Satellite Internet | 45 | 6.5% |
| No Internet | 12 | 1.7% |
| Total | 691 | 100.0% |
North Corbin Summary
North Corbin is a small city located in Whitley County, Kentucky. It is situated in the southeastern corner of the state, near the Tennessee border. The city has a population of approximately 5,000 people and is part of the larger Corbin-London metropolitan area.
History
North Corbin was founded in 1883 by the Corbin family, who had moved to the area from Virginia. The city was originally known as Corbin Station, and was a stop on the Louisville and Nashville Railroad. The city was officially incorporated in 1891, and the name was changed to North Corbin.
The city grew rapidly in the early 20th century, and by the 1920s it had become a major industrial center. The city was home to several factories, including a cotton mill, a tobacco warehouse, and a furniture factory. The city also had a thriving business district, with several stores and restaurants.
In the 1950s, the city began to decline as the factories closed and the population began to move away. The city was hit hard by the Great Recession of 2008, and many businesses closed. However, the city has since seen a resurgence, with new businesses opening and the population increasing.
Geography
North Corbin is located in southeastern Kentucky, near the Tennessee border. The city is situated in the Cumberland Plateau region of the state, and is surrounded by rolling hills and forests. The city is located near the Cumberland River, and is about 30 miles from the state capital of Frankfort.
The climate in North Corbin is humid subtropical, with hot summers and mild winters. The average annual temperature is around 60 degrees Fahrenheit, and the average annual precipitation is around 45 inches.
Economy
North Corbin’s economy is largely based on manufacturing and retail. The city is home to several factories, including a furniture factory, a tobacco warehouse, and a cotton mill. The city also has a thriving retail sector, with several stores and restaurants.
The city is also home to several educational institutions, including a community college and a technical school. The city is also home to a hospital and several medical centers.
Demographics
As of the 2010 census, the population of North Corbin was 5,000. The racial makeup of the city was 95.3% White, 1.7% African American, 0.7% Native American, 0.3% Asian, and 1.9% from other races. The median household income was $30,000, and the median age was 38.
North Corbin is a small city with a diverse population. The city is home to a variety of cultures and religions, and is a welcoming place for all. The city is also home to a vibrant arts and music scene, with several galleries and music venues.
Common Questions
What is Per Capita Income in North Corbin?
Per Capita income in North Corbin is $21,706.
What is the Median Family Income in North Corbin?
Median Family Income in North Corbin is $48,555.
What is the Median Household income in North Corbin?
Median Household Income in North Corbin is $59,306.
What is Inequality or Gini Index in North Corbin?
Inequality or Gini Index in North Corbin is 0.27.
What is the Total Population of North Corbin?
Total Population of North Corbin is 1,955.
What is the Total Male Population of North Corbin?
Total Male Population of North Corbin is 1,036.
What is the Total Female Population of North Corbin?
Total Female Population of North Corbin is 919.
What is the Ratio of Males per 100 Females in North Corbin?
There are 112.73 Males per 100 Females in North Corbin.
What is the Ratio of Females per 100 Males in North Corbin?
There are 88.71 Females per 100 Males in North Corbin.
What is the Median Population Age in North Corbin?
Median Population Age in North Corbin is 31.9 Years.
What is the Average Family Size in North Corbin
Average Family Size in North Corbin is 3.7 People.
What is the Average Household Size in North Corbin
Average Household Size in North Corbin is 2.8 People.
How Large is the Labor Force in North Corbin?
There are 901 People in the Labor Forcein in North Corbin.
What is the Percentage of People in the Labor Force in North Corbin?
63.2% of People are in the Labor Force in North Corbin.
What is the Unemployment Rate in North Corbin?
Unemployment Rate in North Corbin is 9.9%.