Reidland, KY Map & Demographics
Reidland Map
Reidland Overview
$35,257
PER CAPITA INCOME
$98,684
AVG FAMILY INCOME
$73,750
AVG HOUSEHOLD INCOME
10.9%
WAGE / INCOME GAP [ % ]
89.1¢/ $1
WAGE / INCOME GAP [ $ ]
0.40
INEQUALITY / GINI INDEX
4,647
TOTAL POPULATION
2,365
MALE POPULATION
2,282
FEMALE POPULATION
103.64
MALES / 100 FEMALES
96.49
FEMALES / 100 MALES
42.6
MEDIAN AGE
3.4
AVG FAMILY SIZE
2.7
AVG HOUSEHOLD SIZE
2,384
LABOR FORCE [ PEOPLE ]
63.5%
PERCENT IN LABOR FORCE
5.1%
UNEMPLOYMENT RATE
Income in Reidland
Income Overview in Reidland
Per Capita Income in Reidland is $35,257, while median incomes of families and households are $98,684 and $73,750 respectively.
| Characteristic | Number | Measure |
| Per Capita Income | 4,647 | $35,257 |
| Median Family Income | 1,206 | $98,684 |
| Mean Family Income | 1,206 | $108,097 |
| Median Household Income | 1,709 | $73,750 |
| Mean Household Income | 1,709 | $93,739 |
| Income Deficit | 1,206 | $0 |
| Wage / Income Gap (%) | 4,647 | 10.92% |
| Wage / Income Gap ($) | 4,647 | 89.08¢ per $1 |
| Gini / Inequality Index | 4,647 | 0.40 |
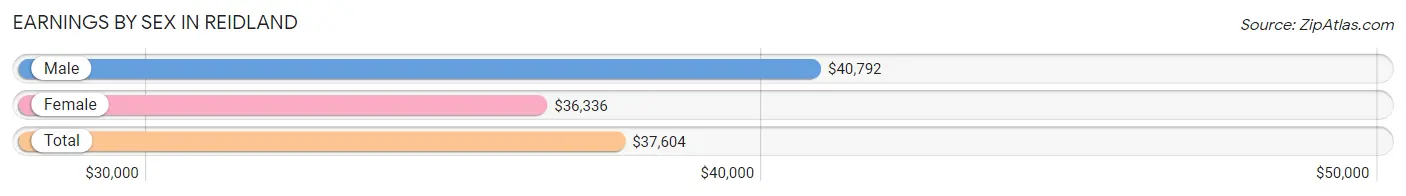
Earnings by Sex in Reidland
Average Earnings in Reidland are $37,604, $40,792 for men and $36,336 for women, a difference of 10.9%.
| Sex | Number | Average Earnings |
| Male | 1,325 (55.2%) | $40,792 |
| Female | 1,074 (44.8%) | $36,336 |
| Total | 2,399 (100.0%) | $37,604 |
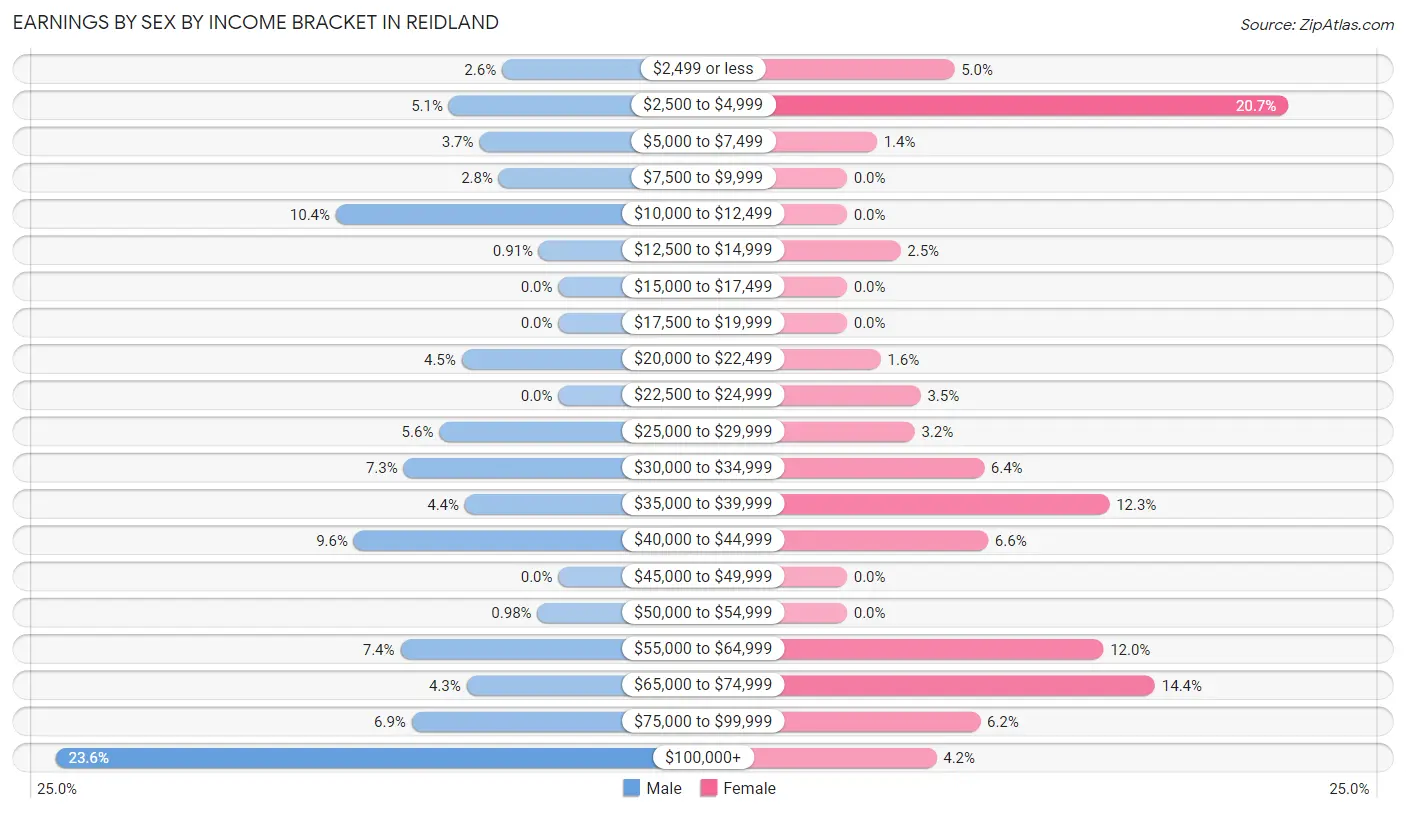
Earnings by Sex by Income Bracket in Reidland
The most common earnings brackets in Reidland are $100,000+ for men (312 | 23.5%) and $2,500 to $4,999 for women (222 | 20.7%).
| Income | Male | Female |
| $2,499 or less | 35 (2.6%) | 54 (5.0%) |
| $2,500 to $4,999 | 68 (5.1%) | 222 (20.7%) |
| $5,000 to $7,499 | 49 (3.7%) | 15 (1.4%) |
| $7,500 to $9,999 | 37 (2.8%) | 0 (0.0%) |
| $10,000 to $12,499 | 138 (10.4%) | 0 (0.0%) |
| $12,500 to $14,999 | 12 (0.9%) | 27 (2.5%) |
| $15,000 to $17,499 | 0 (0.0%) | 0 (0.0%) |
| $17,500 to $19,999 | 0 (0.0%) | 0 (0.0%) |
| $20,000 to $22,499 | 60 (4.5%) | 17 (1.6%) |
| $22,500 to $24,999 | 0 (0.0%) | 37 (3.5%) |
| $25,000 to $29,999 | 74 (5.6%) | 34 (3.2%) |
| $30,000 to $34,999 | 96 (7.2%) | 69 (6.4%) |
| $35,000 to $39,999 | 58 (4.4%) | 132 (12.3%) |
| $40,000 to $44,999 | 127 (9.6%) | 71 (6.6%) |
| $45,000 to $49,999 | 0 (0.0%) | 0 (0.0%) |
| $50,000 to $54,999 | 13 (1.0%) | 0 (0.0%) |
| $55,000 to $64,999 | 98 (7.4%) | 129 (12.0%) |
| $65,000 to $74,999 | 57 (4.3%) | 155 (14.4%) |
| $75,000 to $99,999 | 91 (6.9%) | 67 (6.2%) |
| $100,000+ | 312 (23.5%) | 45 (4.2%) |
| Total | 1,325 (100.0%) | 1,074 (100.0%) |
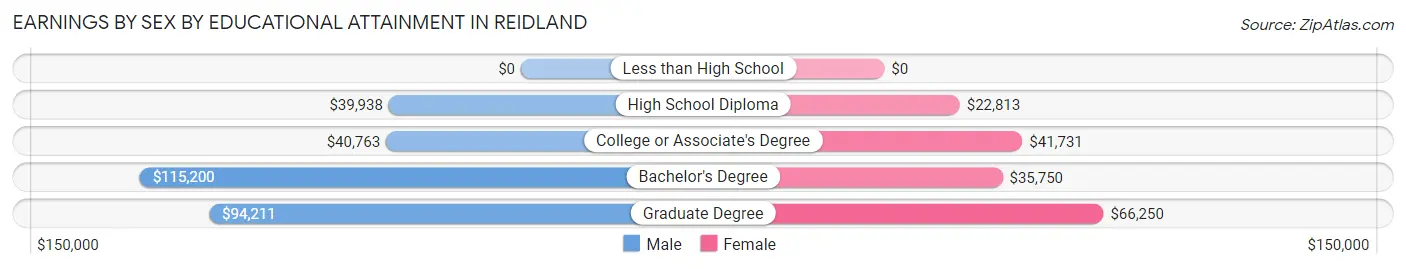
Earnings by Sex by Educational Attainment in Reidland
Average earnings in Reidland are $57,742 for men and $40,387 for women, a difference of 30.1%. Men with an educational attainment of bachelor's degree enjoy the highest average annual earnings of $115,200, while those with high school diploma education earn the least with $39,938. Women with an educational attainment of graduate degree earn the most with the average annual earnings of $66,250, while those with high school diploma education have the smallest earnings of $22,813.
| Educational Attainment | Male Income | Female Income |
| Less than High School | - | - |
| High School Diploma | $39,938 | $22,813 |
| College or Associate's Degree | $40,763 | $41,731 |
| Bachelor's Degree | $115,200 | $35,750 |
| Graduate Degree | $94,211 | $66,250 |
| Total | $57,742 | $40,387 |
Family Income in Reidland
Family Income Brackets in Reidland
According to the Reidland family income data, there are 259 families falling into the $100,000 to $149,999 income range, which is the most common income bracket and makes up 21.5% of all families.
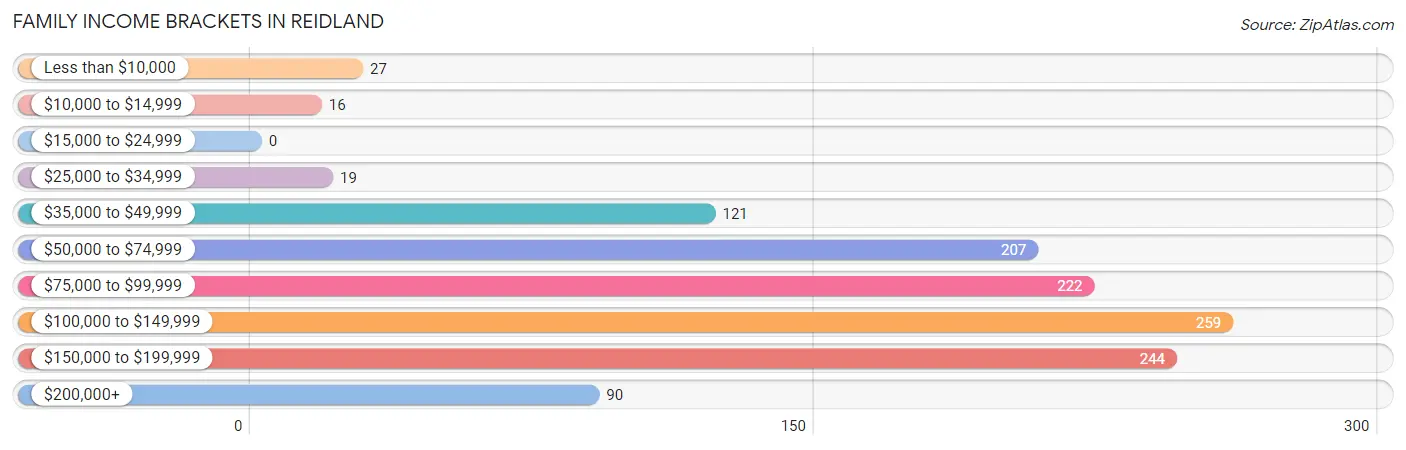
| Income Bracket | # Families | % Families |
| Less than $10,000 | 27 | 2.2% |
| $10,000 to $14,999 | 16 | 1.3% |
| $15,000 to $24,999 | 0 | 0.0% |
| $25,000 to $34,999 | 19 | 1.6% |
| $35,000 to $49,999 | 121 | 10.0% |
| $50,000 to $74,999 | 207 | 17.2% |
| $75,000 to $99,999 | 222 | 18.4% |
| $100,000 to $149,999 | 259 | 21.5% |
| $150,000 to $199,999 | 244 | 20.2% |
| $200,000+ | 90 | 7.5% |
Family Income by Famaliy Size in Reidland
4-person families (108 | 9.0%) account for the highest median family income in Reidland with $183,021 per family, while 2-person families (636 | 52.7%) have the highest median income of $53,500 per family member.
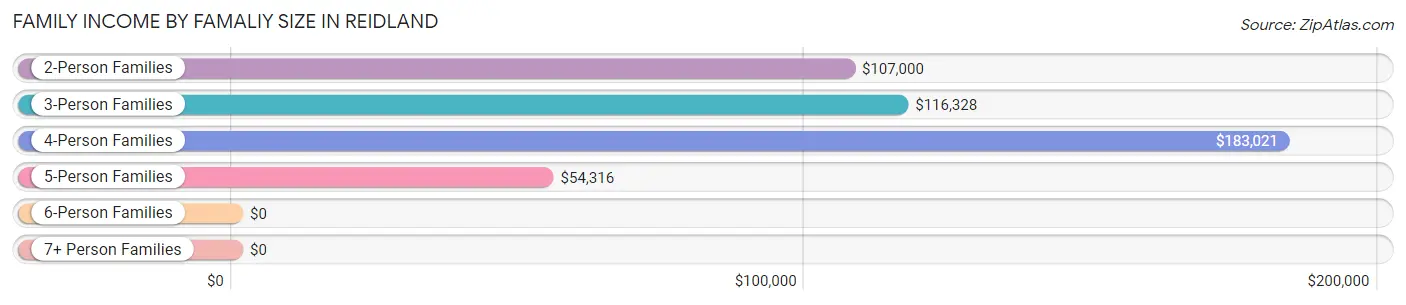
| Income Bracket | # Families | Median Income |
| 2-Person Families | 636 (52.7%) | $107,000 |
| 3-Person Families | 253 (21.0%) | $116,328 |
| 4-Person Families | 108 (9.0%) | $183,021 |
| 5-Person Families | 177 (14.7%) | $54,316 |
| 6-Person Families | 24 (2.0%) | $0 |
| 7+ Person Families | 8 (0.7%) | $0 |
| Total | 1,206 (100.0%) | $98,684 |
Family Income by Number of Earners in Reidland
The median family income in Reidland is $98,684, with families comprising 2 earners (545) having the highest median family income of $114,925, while families with no earners (215) have the lowest median family income of $51,007, accounting for 45.2% and 17.8% of families, respectively.
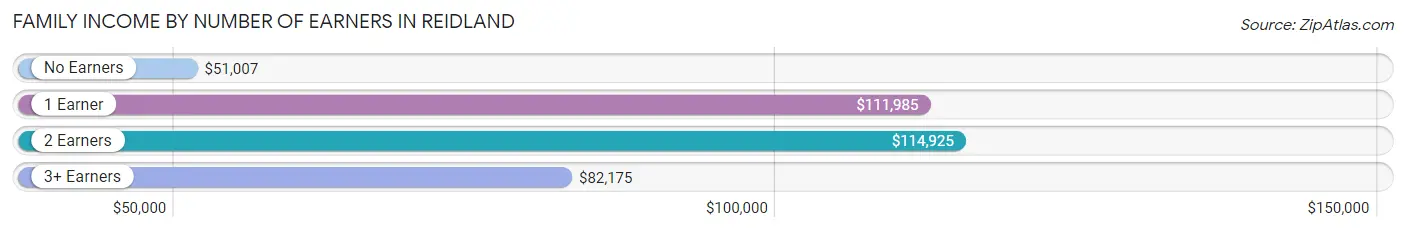
| Number of Earners | # Families | Median Income |
| No Earners | 215 (17.8%) | $51,007 |
| 1 Earner | 253 (21.0%) | $111,985 |
| 2 Earners | 545 (45.2%) | $114,925 |
| 3+ Earners | 193 (16.0%) | $82,175 |
| Total | 1,206 (100.0%) | $98,684 |
Household Income in Reidland
Household Income Brackets in Reidland
With 355 households falling in the category, the $50,000 to $74,999 income range is the most frequent in Reidland, accounting for 20.8% of all households.
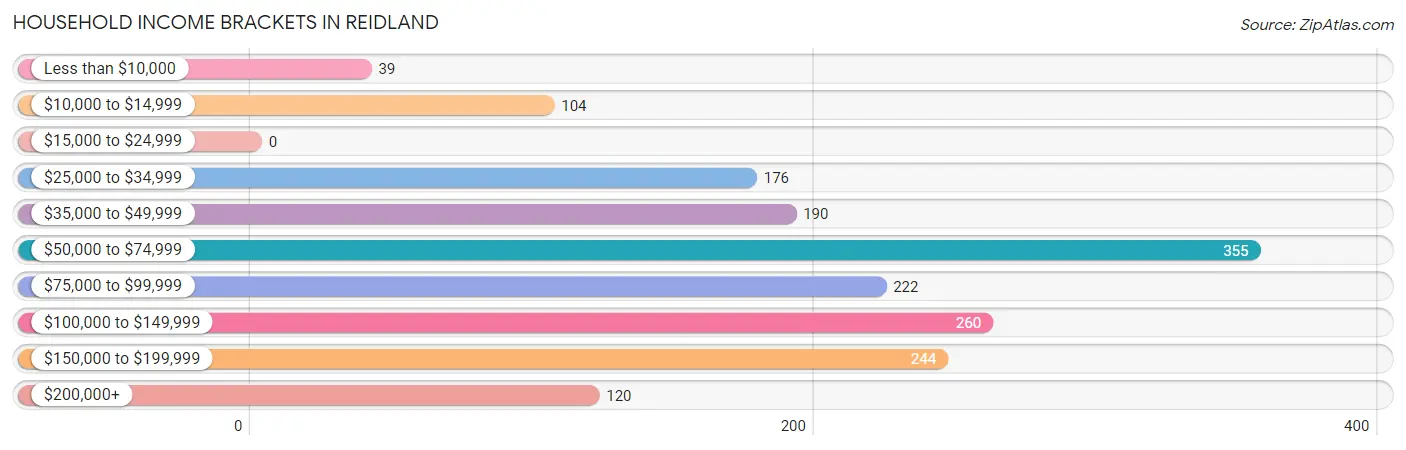
| Income Bracket | # Households | % Households |
| Less than $10,000 | 39 | 2.3% |
| $10,000 to $14,999 | 104 | 6.1% |
| $15,000 to $24,999 | 0 | 0.0% |
| $25,000 to $34,999 | 176 | 10.3% |
| $35,000 to $49,999 | 190 | 11.1% |
| $50,000 to $74,999 | 355 | 20.8% |
| $75,000 to $99,999 | 222 | 13.0% |
| $100,000 to $149,999 | 260 | 15.2% |
| $150,000 to $199,999 | 244 | 14.3% |
| $200,000+ | 120 | 7.0% |
Household Income by Householder Age in Reidland
The median household income in Reidland is $73,750, with the highest median household income of $111,680 found in the 45 to 64 years age bracket for the primary householder. A total of 639 households (37.4%) fall into this category. Meanwhile, the 15 to 24 years age bracket for the primary householder has the lowest median household income of $0, with 29 households (1.7%) in this group.
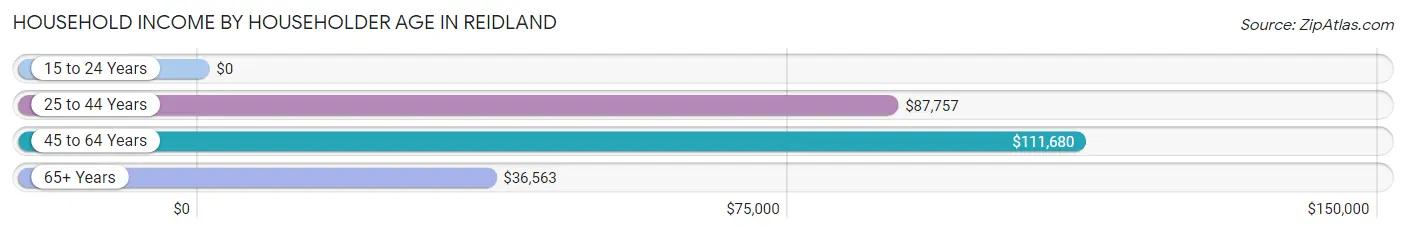
| Income Bracket | # Households | Median Income |
| 15 to 24 Years | 29 (1.7%) | $0 |
| 25 to 44 Years | 483 (28.3%) | $87,757 |
| 45 to 64 Years | 639 (37.4%) | $111,680 |
| 65+ Years | 558 (32.7%) | $36,563 |
| Total | 1,709 (100.0%) | $73,750 |
Poverty in Reidland
Income Below Poverty by Sex and Age in Reidland
With 2.6% poverty level for males and 3.8% for females among the residents of Reidland, 18 to 24 year old males and 75 year old and over females are the most vulnerable to poverty, with 35 males (13.3%) and 26 females (16.4%) in their respective age groups living below the poverty level.
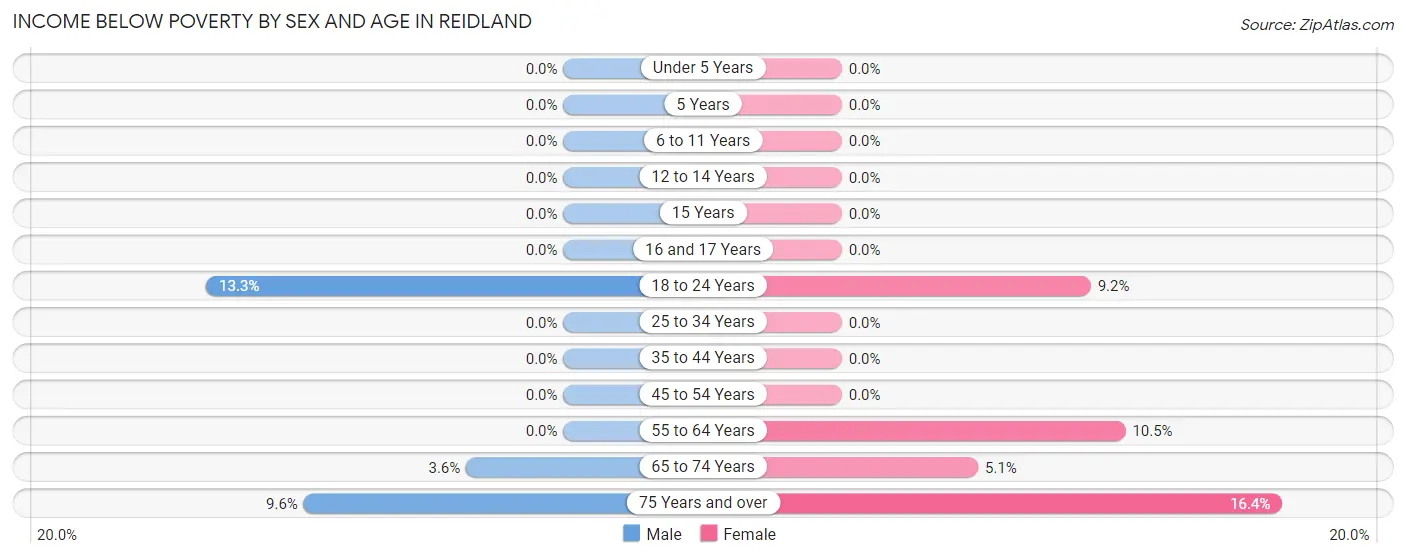
| Age Bracket | Male | Female |
| Under 5 Years | 0 (0.0%) | 0 (0.0%) |
| 5 Years | 0 (0.0%) | 0 (0.0%) |
| 6 to 11 Years | 0 (0.0%) | 0 (0.0%) |
| 12 to 14 Years | 0 (0.0%) | 0 (0.0%) |
| 15 Years | 0 (0.0%) | 0 (0.0%) |
| 16 and 17 Years | 0 (0.0%) | 0 (0.0%) |
| 18 to 24 Years | 35 (13.3%) | 17 (9.2%) |
| 25 to 34 Years | 0 (0.0%) | 0 (0.0%) |
| 35 to 44 Years | 0 (0.0%) | 0 (0.0%) |
| 45 to 54 Years | 0 (0.0%) | 0 (0.0%) |
| 55 to 64 Years | 0 (0.0%) | 30 (10.5%) |
| 65 to 74 Years | 11 (3.6%) | 13 (5.1%) |
| 75 Years and over | 16 (9.6%) | 26 (16.4%) |
| Total | 62 (2.6%) | 86 (3.8%) |
Income Above Poverty by Sex and Age in Reidland
According to the poverty statistics in Reidland, males aged under 5 years and females aged under 5 years are the age groups that are most secure financially, with 100.0% of males and 100.0% of females in these age groups living above the poverty line.
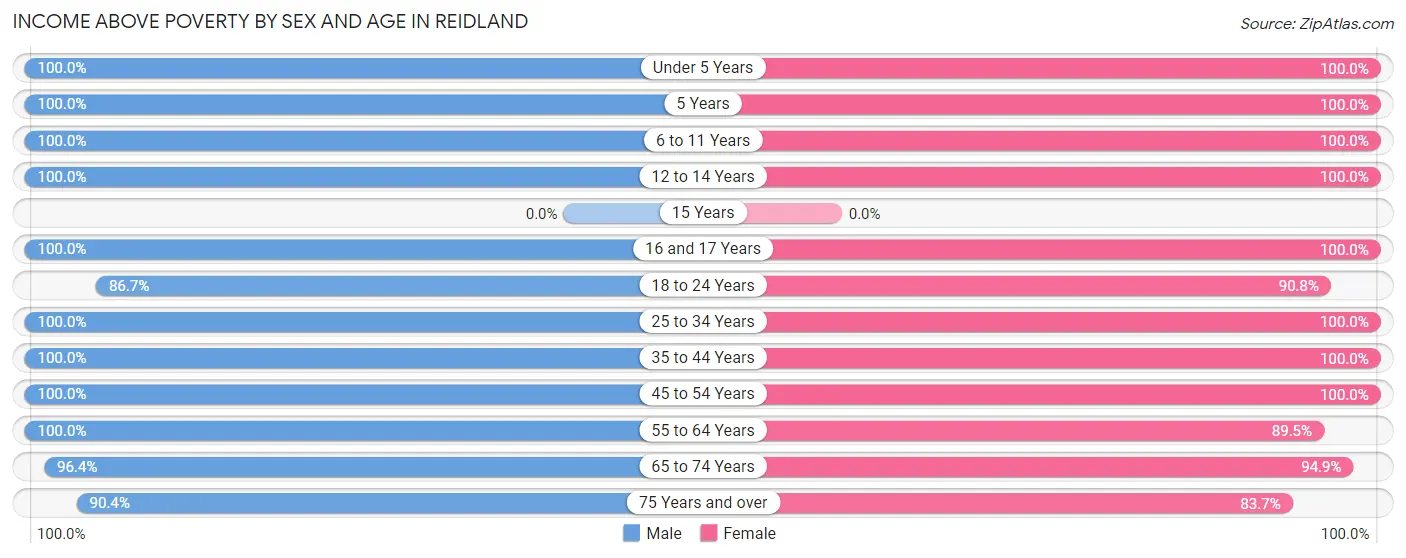
| Age Bracket | Male | Female |
| Under 5 Years | 29 (100.0%) | 156 (100.0%) |
| 5 Years | 40 (100.0%) | 69 (100.0%) |
| 6 to 11 Years | 299 (100.0%) | 153 (100.0%) |
| 12 to 14 Years | 55 (100.0%) | 89 (100.0%) |
| 15 Years | 0 (0.0%) | 0 (0.0%) |
| 16 and 17 Years | 128 (100.0%) | 63 (100.0%) |
| 18 to 24 Years | 229 (86.7%) | 167 (90.8%) |
| 25 to 34 Years | 111 (100.0%) | 212 (100.0%) |
| 35 to 44 Years | 304 (100.0%) | 405 (100.0%) |
| 45 to 54 Years | 267 (100.0%) | 245 (100.0%) |
| 55 to 64 Years | 397 (100.0%) | 255 (89.5%) |
| 65 to 74 Years | 294 (96.4%) | 244 (94.9%) |
| 75 Years and over | 150 (90.4%) | 133 (83.7%) |
| Total | 2,303 (97.4%) | 2,191 (96.2%) |
Income Below Poverty Among Married-Couple Families in Reidland
The poverty statistics for married-couple families in Reidland show that 2.5% or 27 of the total 1,057 families live below the poverty line. Families with no children have the highest poverty rate of 3.9%, comprising of 27 families. On the other hand, families with 1 or 2 children have the lowest poverty rate of 0.0%, which includes 0 families.
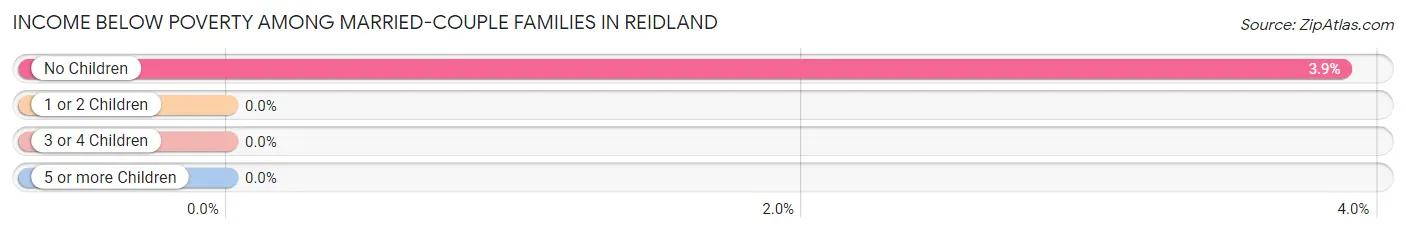
| Children | Above Poverty | Below Poverty |
| No Children | 669 (96.1%) | 27 (3.9%) |
| 1 or 2 Children | 280 (100.0%) | 0 (0.0%) |
| 3 or 4 Children | 81 (100.0%) | 0 (0.0%) |
| 5 or more Children | 0 (0.0%) | 0 (0.0%) |
| Total | 1,030 (97.5%) | 27 (2.5%) |
Income Below Poverty Among Single-Parent Households in Reidland
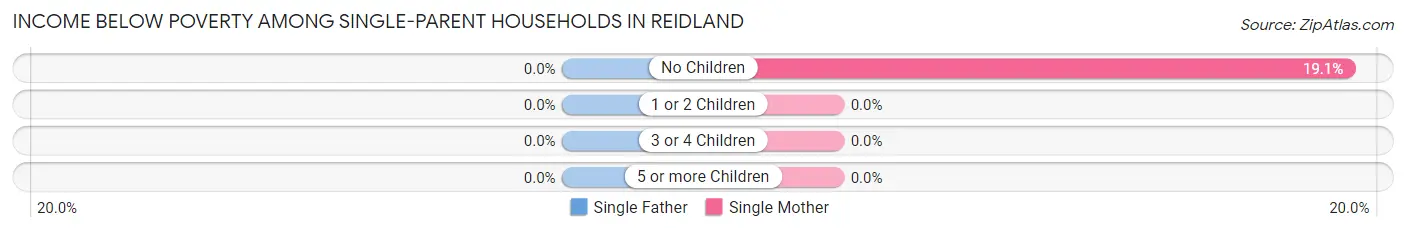
| Children | Single Father | Single Mother |
| No Children | 0 (0.0%) | 16 (19.1%) |
| 1 or 2 Children | 0 (0.0%) | 0 (0.0%) |
| 3 or 4 Children | 0 (0.0%) | 0 (0.0%) |
| 5 or more Children | 0 (0.0%) | 0 (0.0%) |
| Total | 0 (0.0%) | 16 (11.7%) |
Income Below Poverty Among Married-Couple vs Single-Parent Households in Reidland
The poverty data for Reidland shows that 27 of the married-couple family households (2.5%) and 16 of the single-parent households (10.7%) are living below the poverty level. Within the married-couple family households, those with no children have the highest poverty rate, with 27 households (3.9%) falling below the poverty line. Among the single-parent households, those with no children have the highest poverty rate, with 16 household (16.7%) living below poverty.
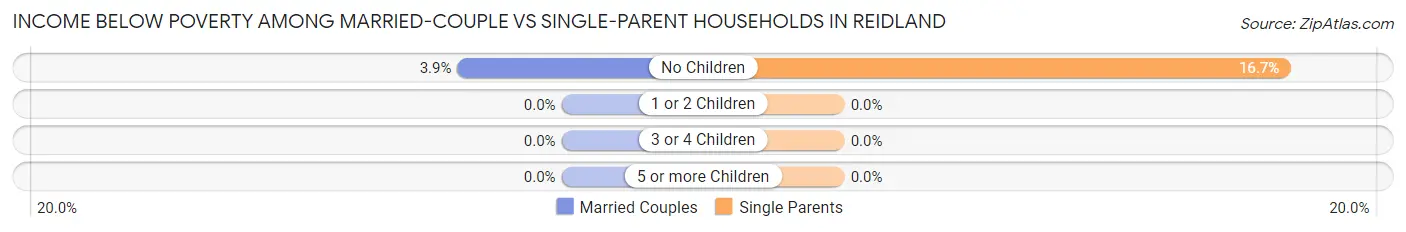
| Children | Married-Couple Families | Single-Parent Households |
| No Children | 27 (3.9%) | 16 (16.7%) |
| 1 or 2 Children | 0 (0.0%) | 0 (0.0%) |
| 3 or 4 Children | 0 (0.0%) | 0 (0.0%) |
| 5 or more Children | 0 (0.0%) | 0 (0.0%) |
| Total | 27 (2.5%) | 16 (10.7%) |
Race in Reidland
The most populous races in Reidland are White / Caucasian (4,548 | 97.9%), Hispanic or Latino (54 | 1.2%), and Some other Race (54 | 1.2%).
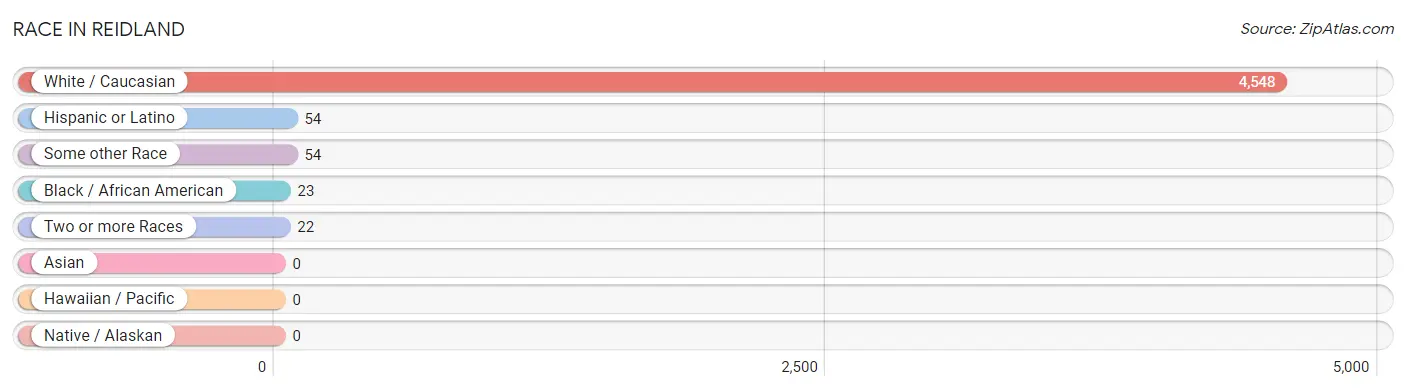
| Race | # Population | % Population |
| Asian | 0 | 0.0% |
| Black / African American | 23 | 0.5% |
| Hawaiian / Pacific | 0 | 0.0% |
| Hispanic or Latino | 54 | 1.2% |
| Native / Alaskan | 0 | 0.0% |
| White / Caucasian | 4,548 | 97.9% |
| Two or more Races | 22 | 0.5% |
| Some other Race | 54 | 1.2% |
| Total | 4,647 | 100.0% |
Ancestry in Reidland
The most populous ancestries reported in Reidland are English (1,249 | 26.9%), German (724 | 15.6%), American (577 | 12.4%), Irish (444 | 9.6%), and Scottish (127 | 2.7%), together accounting for 67.2% of all Reidland residents.
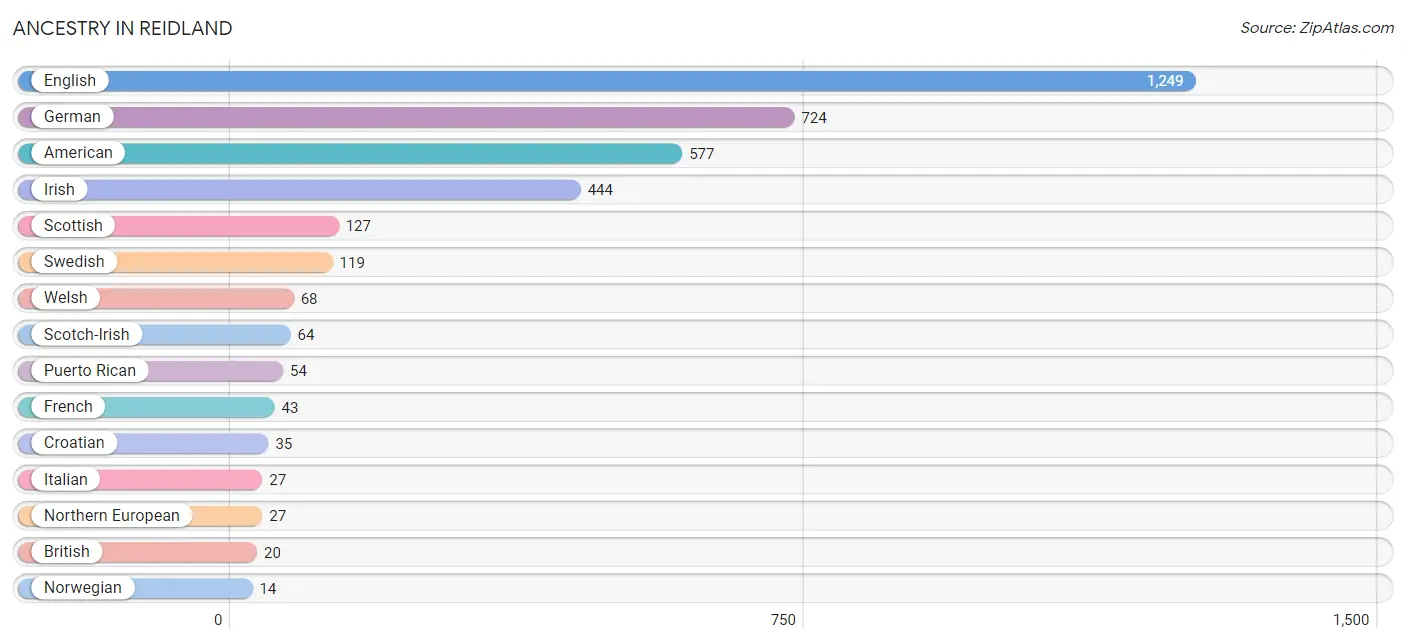
| Ancestry | # Population | % Population |
| American | 577 | 12.4% |
| British | 20 | 0.4% |
| Croatian | 35 | 0.7% |
| Dutch | 13 | 0.3% |
| English | 1,249 | 26.9% |
| French | 43 | 0.9% |
| French Canadian | 13 | 0.3% |
| German | 724 | 15.6% |
| Irish | 444 | 9.6% |
| Italian | 27 | 0.6% |
| Northern European | 27 | 0.6% |
| Norwegian | 14 | 0.3% |
| Polish | 10 | 0.2% |
| Puerto Rican | 54 | 1.2% |
| Scotch-Irish | 64 | 1.4% |
| Scottish | 127 | 2.7% |
| Swedish | 119 | 2.6% |
| Welsh | 68 | 1.5% | View All 18 Rows |
Immigrants in Reidland

| Immigration Origin | # Population | % Population | View All 0 Rows |
Sex and Age in Reidland
Sex and Age in Reidland
The most populous age groups in Reidland are 5 to 9 Years (293 | 12.4%) for men and 40 to 44 Years (257 | 11.3%) for women.
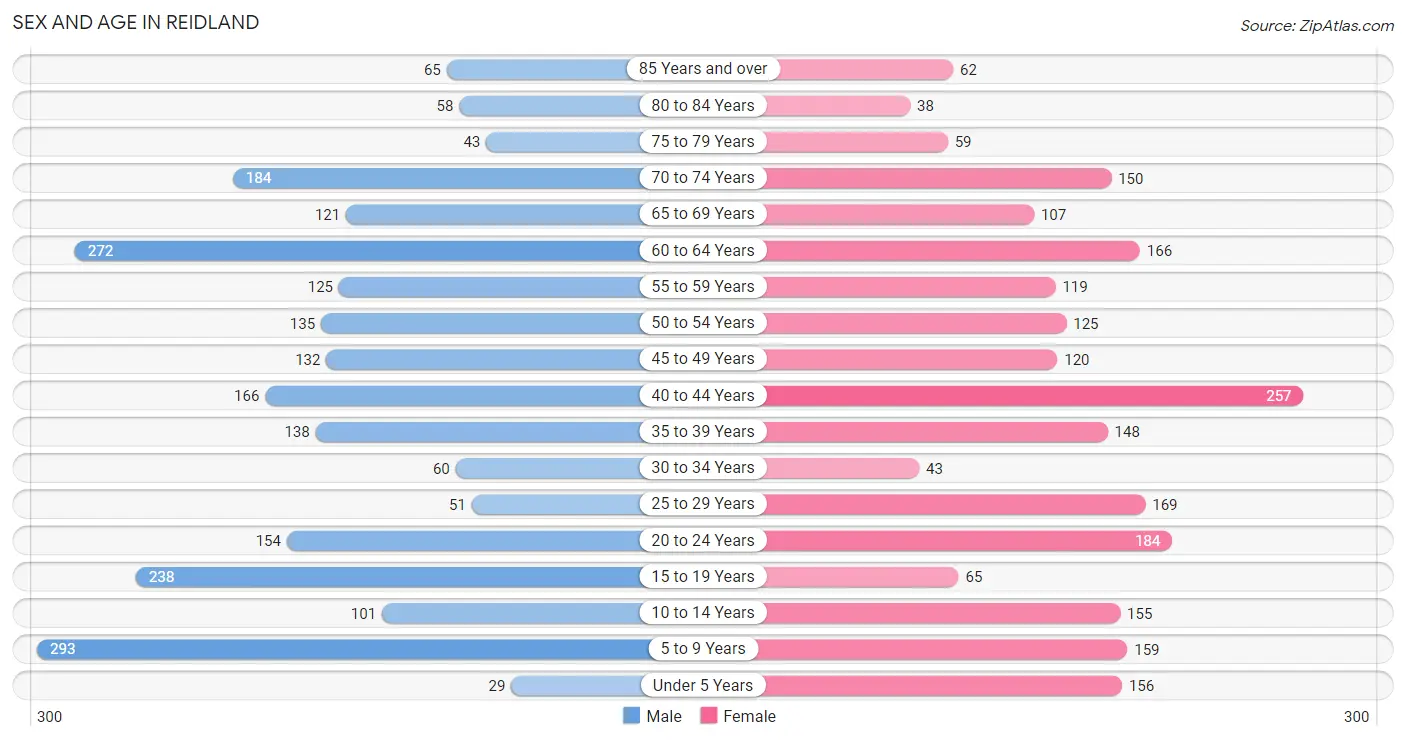
| Age Bracket | Male | Female |
| Under 5 Years | 29 (1.2%) | 156 (6.8%) |
| 5 to 9 Years | 293 (12.4%) | 159 (7.0%) |
| 10 to 14 Years | 101 (4.3%) | 155 (6.8%) |
| 15 to 19 Years | 238 (10.1%) | 65 (2.9%) |
| 20 to 24 Years | 154 (6.5%) | 184 (8.1%) |
| 25 to 29 Years | 51 (2.2%) | 169 (7.4%) |
| 30 to 34 Years | 60 (2.5%) | 43 (1.9%) |
| 35 to 39 Years | 138 (5.8%) | 148 (6.5%) |
| 40 to 44 Years | 166 (7.0%) | 257 (11.3%) |
| 45 to 49 Years | 132 (5.6%) | 120 (5.3%) |
| 50 to 54 Years | 135 (5.7%) | 125 (5.5%) |
| 55 to 59 Years | 125 (5.3%) | 119 (5.2%) |
| 60 to 64 Years | 272 (11.5%) | 166 (7.3%) |
| 65 to 69 Years | 121 (5.1%) | 107 (4.7%) |
| 70 to 74 Years | 184 (7.8%) | 150 (6.6%) |
| 75 to 79 Years | 43 (1.8%) | 59 (2.6%) |
| 80 to 84 Years | 58 (2.5%) | 38 (1.7%) |
| 85 Years and over | 65 (2.8%) | 62 (2.7%) |
| Total | 2,365 (100.0%) | 2,282 (100.0%) |
Families and Households in Reidland
Median Family Size in Reidland
The median family size in Reidland is 3.39 persons per family, with single female/mother families (137 | 11.4%) accounting for the largest median family size of 5.72 persons per family. On the other hand, single male/father families (12 | 1.0%) represent the smallest median family size with 2.83 persons per family.
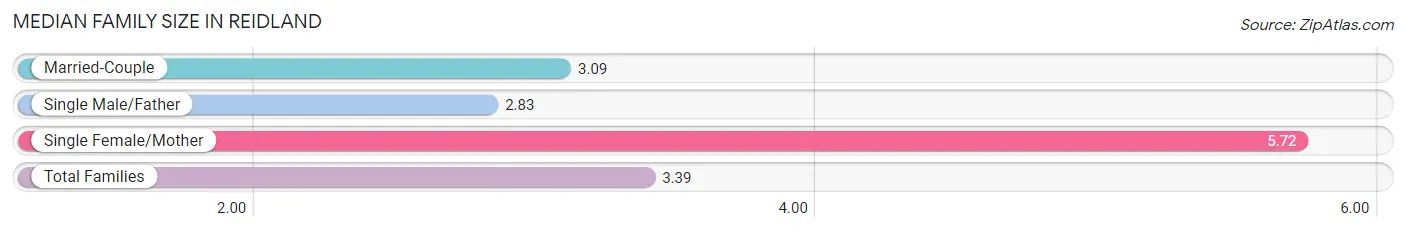
| Family Type | # Families | Family Size |
| Married-Couple | 1,057 (87.6%) | 3.09 |
| Single Male/Father | 12 (1.0%) | 2.83 |
| Single Female/Mother | 137 (11.4%) | 5.72 |
| Total Families | 1,206 (100.0%) | 3.39 |
Median Household Size in Reidland
The median household size in Reidland is 2.72 persons per household, with single female/mother households (137 | 8.0%) accounting for the largest median household size of 5.72 persons per household. non-family households (503 | 29.4%) represent the smallest median household size with 1.10 persons per household.
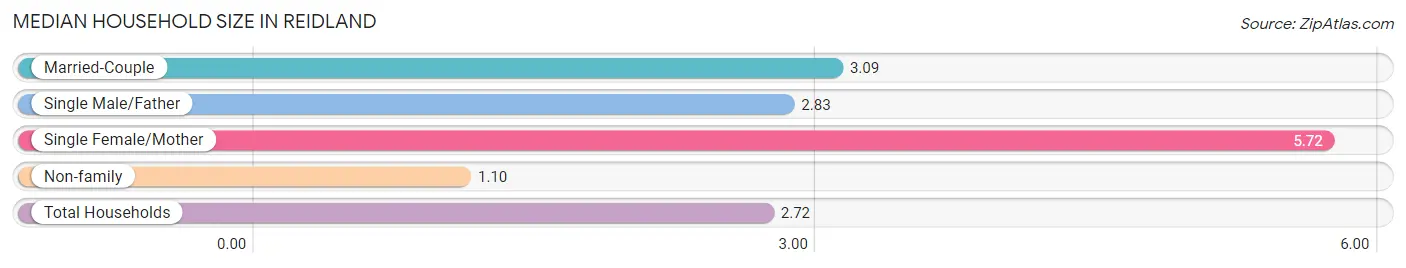
| Household Type | # Households | Household Size |
| Married-Couple | 1,057 (61.9%) | 3.09 |
| Single Male/Father | 12 (0.7%) | 2.83 |
| Single Female/Mother | 137 (8.0%) | 5.72 |
| Non-family | 503 (29.4%) | 1.10 |
| Total Households | 1,709 (100.0%) | 2.72 |
Household Size by Marriage Status in Reidland
Out of a total of 1,709 households in Reidland, 1,206 (70.6%) are family households, while 503 (29.4%) are nonfamily households. The most numerous type of family households are 2-person households, comprising 636, and the most common type of nonfamily households are 1-person households, comprising 473.
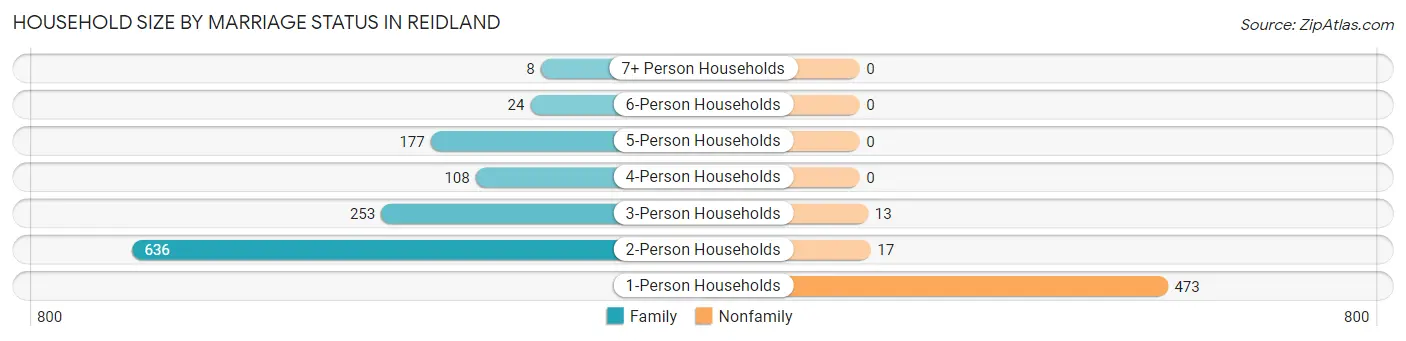
| Household Size | Family Households | Nonfamily Households |
| 1-Person Households | - | 473 (27.7%) |
| 2-Person Households | 636 (37.2%) | 17 (1.0%) |
| 3-Person Households | 253 (14.8%) | 13 (0.8%) |
| 4-Person Households | 108 (6.3%) | 0 (0.0%) |
| 5-Person Households | 177 (10.4%) | 0 (0.0%) |
| 6-Person Households | 24 (1.4%) | 0 (0.0%) |
| 7+ Person Households | 8 (0.5%) | 0 (0.0%) |
| Total | 1,206 (70.6%) | 503 (29.4%) |
Female Fertility in Reidland
Fertility by Age in Reidland
Average fertility rate in Reidland is 34.0 births per 1,000 women. Women in the age bracket of 20 to 34 years have the highest fertility rate with 86.0 births per 1,000 women. Women in the age bracket of 20 to 34 years acount for 100.0% of all women with births.
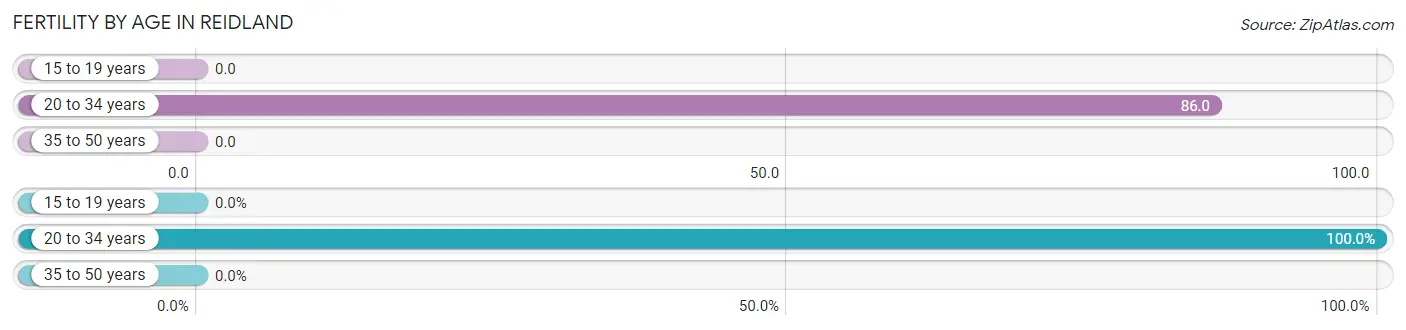
| Age Bracket | Women with Births | Births / 1,000 Women |
| 15 to 19 years | 0 (0.0%) | 0.0 |
| 20 to 34 years | 34 (100.0%) | 86.0 |
| 35 to 50 years | 0 (0.0%) | 0.0 |
| Total | 34 (100.0%) | 34.0 |
Fertility by Age by Marriage Status in Reidland
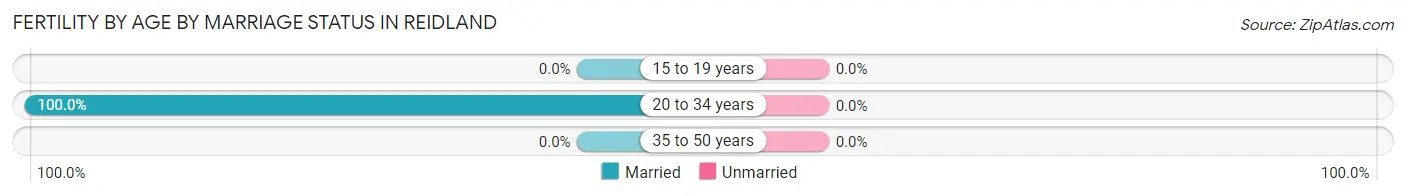
| Age Bracket | Married | Unmarried |
| 15 to 19 years | 0 (0.0%) | 0 (0.0%) |
| 20 to 34 years | 34 (100.0%) | 0 (0.0%) |
| 35 to 50 years | 0 (0.0%) | 0 (0.0%) |
| Total | 34 (100.0%) | 0 (0.0%) |
Fertility by Education in Reidland
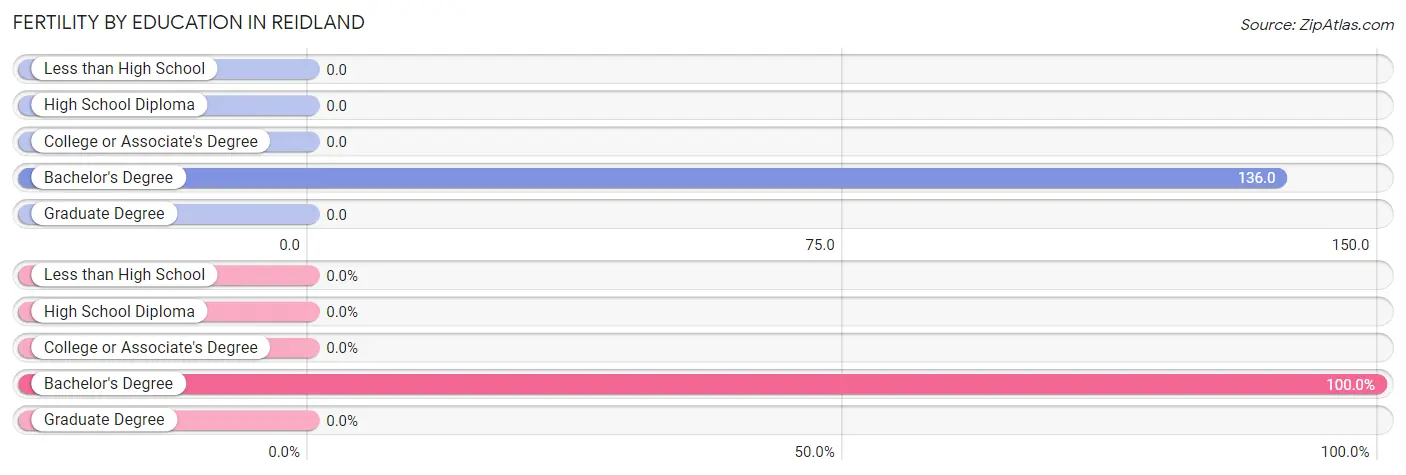
| Educational Attainment | Women with Births | Births / 1,000 Women |
| Less than High School | 0 (0.0%) | 0.0 |
| High School Diploma | 0 (0.0%) | 0.0 |
| College or Associate's Degree | 0 (0.0%) | 0.0 |
| Bachelor's Degree | 34 (100.0%) | 136.0 |
| Graduate Degree | 0 (0.0%) | 0.0 |
| Total | 34 (100.0%) | 34.0 |
Fertility by Education by Marriage Status in Reidland
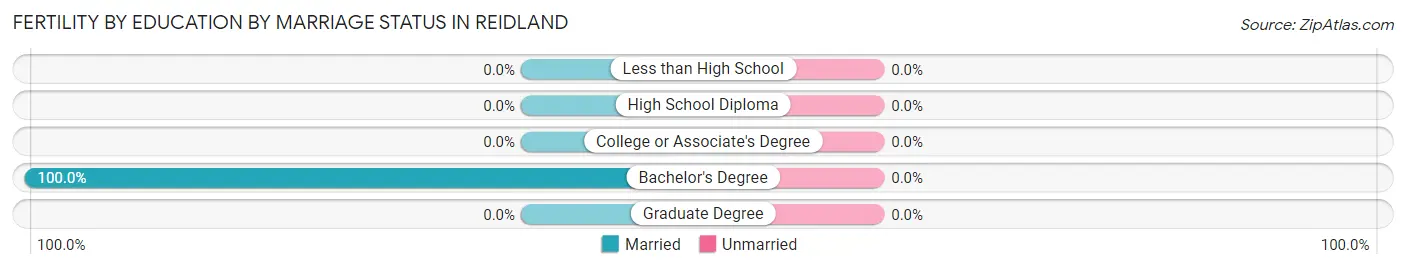
| Educational Attainment | Married | Unmarried |
| Less than High School | 0 (0.0%) | 0 (0.0%) |
| High School Diploma | 0 (0.0%) | 0 (0.0%) |
| College or Associate's Degree | 0 (0.0%) | 0 (0.0%) |
| Bachelor's Degree | 34 (100.0%) | 0 (0.0%) |
| Graduate Degree | 0 (0.0%) | 0 (0.0%) |
| Total | 34 (100.0%) | 0 (0.0%) |
Employment Characteristics in Reidland
Employment by Class of Employer in Reidland
Among the 2,215 employed individuals in Reidland, private company employees (1,637 | 73.9%), local government employees (186 | 8.4%), and federal government employees (135 | 6.1%) make up the most common classes of employment.
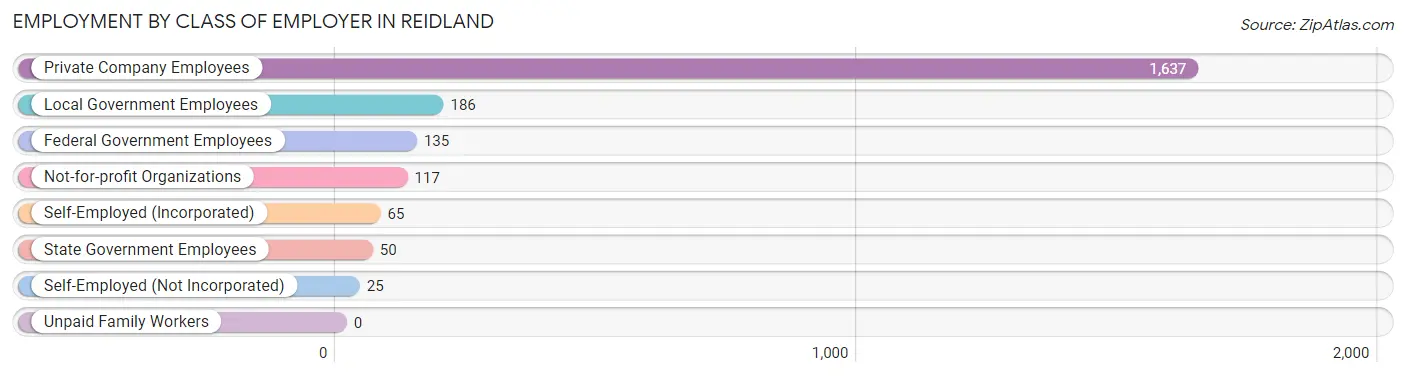
| Employer Class | # Employees | % Employees |
| Private Company Employees | 1,637 | 73.9% |
| Self-Employed (Incorporated) | 65 | 2.9% |
| Self-Employed (Not Incorporated) | 25 | 1.1% |
| Not-for-profit Organizations | 117 | 5.3% |
| Local Government Employees | 186 | 8.4% |
| State Government Employees | 50 | 2.3% |
| Federal Government Employees | 135 | 6.1% |
| Unpaid Family Workers | 0 | 0.0% |
| Total | 2,215 | 100.0% |
Employment Status by Age in Reidland
According to the labor force statistics for Reidland, out of the total population over 16 years of age (3,754), 63.5% or 2,384 individuals are in the labor force, with 5.1% or 122 of them unemployed. The age group with the highest labor force participation rate is 25 to 29 years, with 100.0% or 220 individuals in the labor force. Within the labor force, the 20 to 24 years age range has the highest percentage of unemployed individuals, with 24.9% or 72 of them being unemployed.
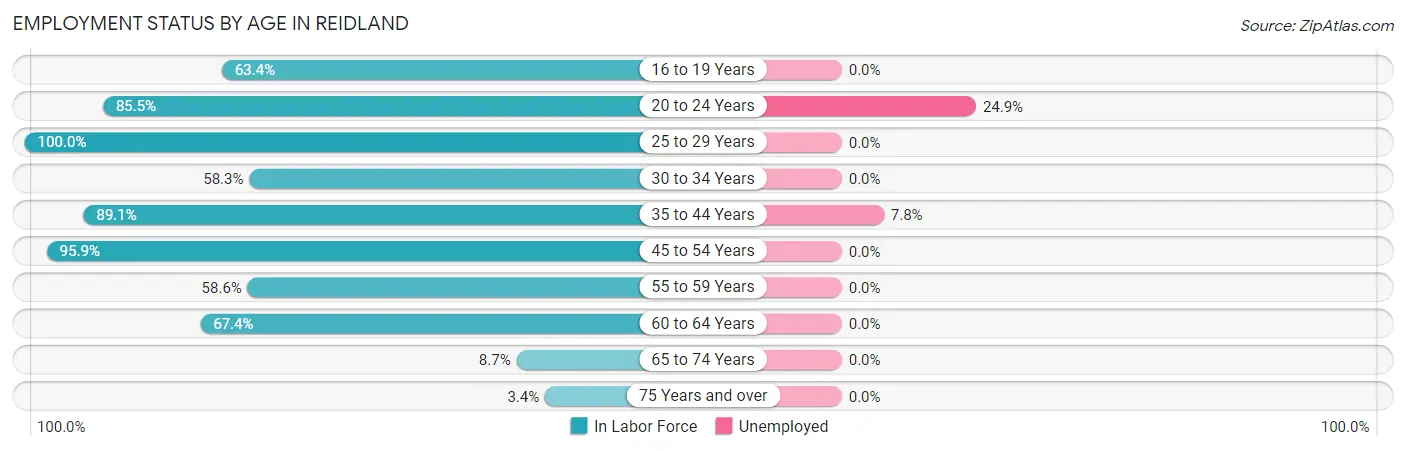
| Age Bracket | In Labor Force | Unemployed |
| 16 to 19 Years | 192 (63.4%) | 0 (0.0%) |
| 20 to 24 Years | 289 (85.5%) | 72 (24.9%) |
| 25 to 29 Years | 220 (100.0%) | 0 (0.0%) |
| 30 to 34 Years | 60 (58.3%) | 0 (0.0%) |
| 35 to 44 Years | 632 (89.1%) | 49 (7.8%) |
| 45 to 54 Years | 491 (95.9%) | 0 (0.0%) |
| 55 to 59 Years | 143 (58.6%) | 0 (0.0%) |
| 60 to 64 Years | 295 (67.4%) | 0 (0.0%) |
| 65 to 74 Years | 49 (8.7%) | 0 (0.0%) |
| 75 Years and over | 11 (3.4%) | 0 (0.0%) |
| Total | 2,384 (63.5%) | 122 (5.1%) |
Employment Status by Educational Attainment in Reidland
According to labor force statistics for Reidland, 82.7% of individuals (1,841) out of the total population between 25 and 64 years of age (2,226) are in the labor force, with 2.7% or 50 of them being unemployed. The group with the highest labor force participation rate are those with the educational attainment of high school diploma, with 85.1% or 336 individuals in the labor force. Within the labor force, individuals with less than high school education have the highest percentage of unemployment, with 61.5% or 32 of them being unemployed.
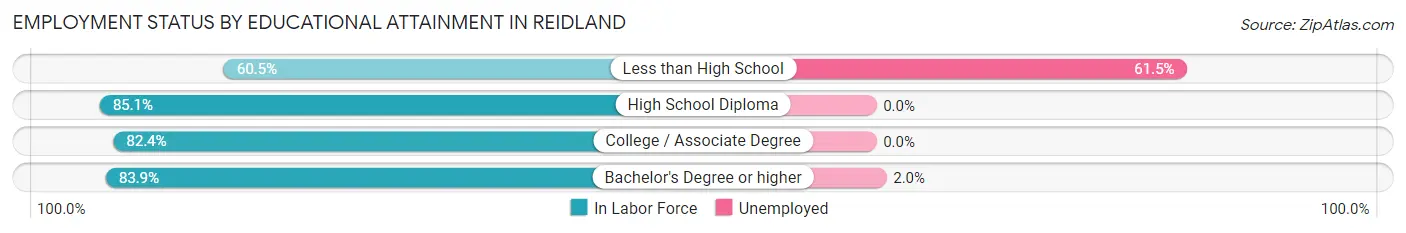
| Educational Attainment | In Labor Force | Unemployed |
| Less than High School | 52 (60.5%) | 53 (61.5%) |
| High School Diploma | 336 (85.1%) | 0 (0.0%) |
| College / Associate Degree | 615 (82.4%) | 0 (0.0%) |
| Bachelor's Degree or higher | 838 (83.9%) | 20 (2.0%) |
| Total | 1,841 (82.7%) | 60 (2.7%) |
Employment Occupations by Sex in Reidland
Management, Business, Science and Arts Occupations
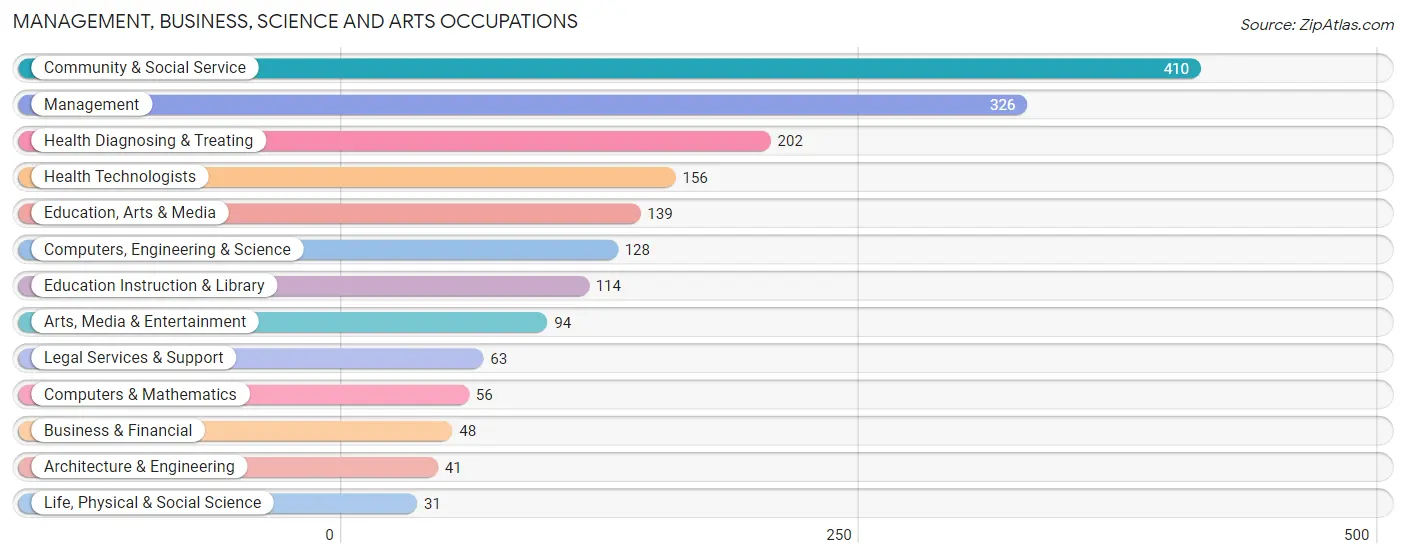
The most common Management, Business, Science and Arts occupations in Reidland are Community & Social Service (410 | 18.1%), Management (326 | 14.4%), Health Diagnosing & Treating (202 | 8.9%), Health Technologists (156 | 6.9%), and Education, Arts & Media (139 | 6.1%).
Management, Business, Science and Arts Occupations by Sex
Within the Management, Business, Science and Arts occupations in Reidland, the most male-oriented occupations are Architecture & Engineering (100.0%), Legal Services & Support (100.0%), and Computers & Mathematics (76.8%), while the most female-oriented occupations are Life, Physical & Social Science (100.0%), Education Instruction & Library (84.2%), and Health Diagnosing & Treating (68.8%).
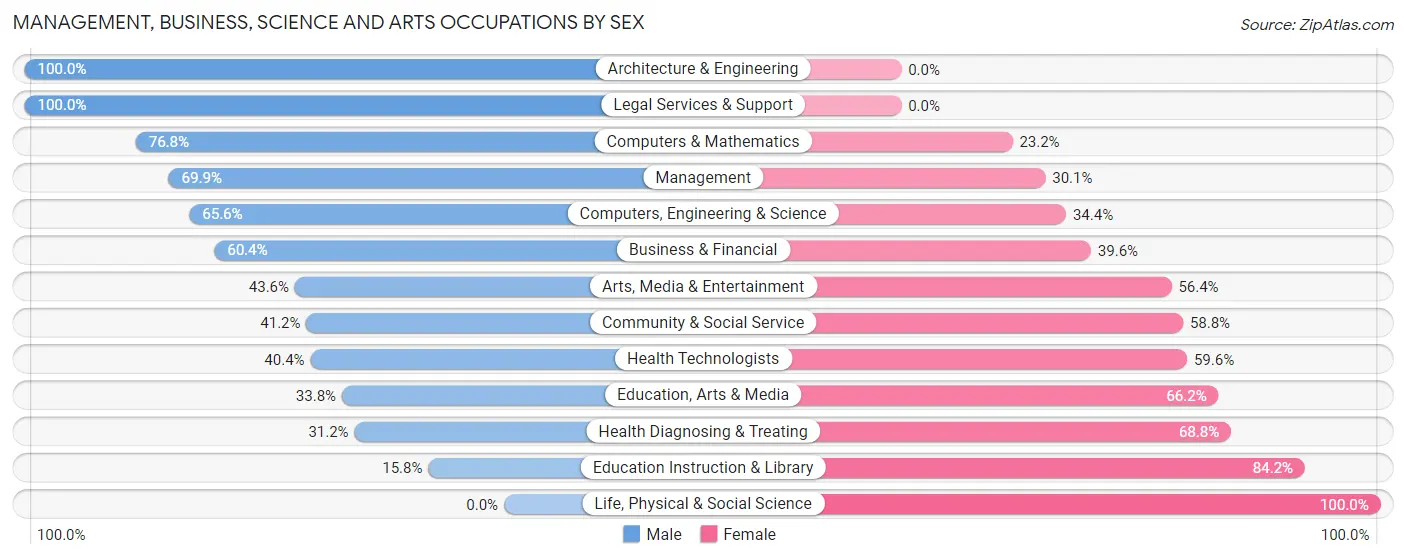
| Occupation | Male | Female |
| Management | 228 (69.9%) | 98 (30.1%) |
| Business & Financial | 29 (60.4%) | 19 (39.6%) |
| Computers, Engineering & Science | 84 (65.6%) | 44 (34.4%) |
| Computers & Mathematics | 43 (76.8%) | 13 (23.2%) |
| Architecture & Engineering | 41 (100.0%) | 0 (0.0%) |
| Life, Physical & Social Science | 0 (0.0%) | 31 (100.0%) |
| Community & Social Service | 169 (41.2%) | 241 (58.8%) |
| Education, Arts & Media | 47 (33.8%) | 92 (66.2%) |
| Legal Services & Support | 63 (100.0%) | 0 (0.0%) |
| Education Instruction & Library | 18 (15.8%) | 96 (84.2%) |
| Arts, Media & Entertainment | 41 (43.6%) | 53 (56.4%) |
| Health Diagnosing & Treating | 63 (31.2%) | 139 (68.8%) |
| Health Technologists | 63 (40.4%) | 93 (59.6%) |
| Total (Category) | 573 (51.4%) | 541 (48.6%) |
| Total (Overall) | 1,244 (55.0%) | 1,017 (45.0%) |
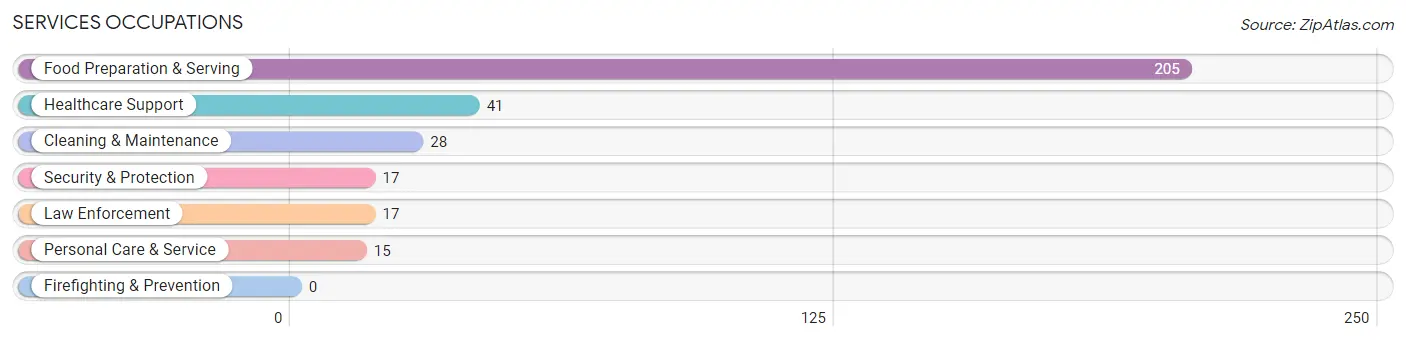
Services Occupations
The most common Services occupations in Reidland are Food Preparation & Serving (205 | 9.1%), Healthcare Support (41 | 1.8%), Cleaning & Maintenance (28 | 1.2%), Security & Protection (17 | 0.7%), and Law Enforcement (17 | 0.7%).
Services Occupations by Sex
Within the Services occupations in Reidland, the most male-oriented occupations are Security & Protection (100.0%), Law Enforcement (100.0%), and Cleaning & Maintenance (100.0%), while the most female-oriented occupations are Food Preparation & Serving (100.0%), Personal Care & Service (100.0%), and Healthcare Support (70.7%).
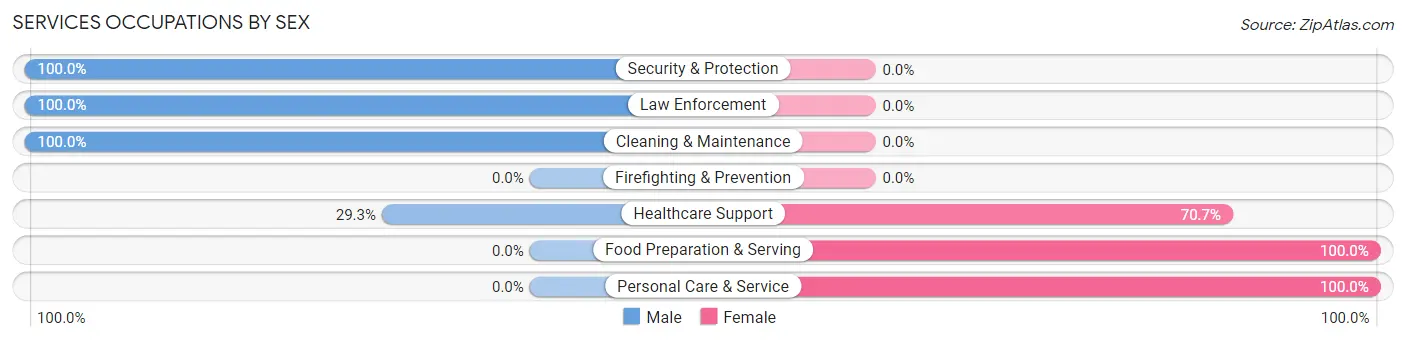
| Occupation | Male | Female |
| Healthcare Support | 12 (29.3%) | 29 (70.7%) |
| Security & Protection | 17 (100.0%) | 0 (0.0%) |
| Firefighting & Prevention | 0 (0.0%) | 0 (0.0%) |
| Law Enforcement | 17 (100.0%) | 0 (0.0%) |
| Food Preparation & Serving | 0 (0.0%) | 205 (100.0%) |
| Cleaning & Maintenance | 28 (100.0%) | 0 (0.0%) |
| Personal Care & Service | 0 (0.0%) | 15 (100.0%) |
| Total (Category) | 57 (18.6%) | 249 (81.4%) |
| Total (Overall) | 1,244 (55.0%) | 1,017 (45.0%) |
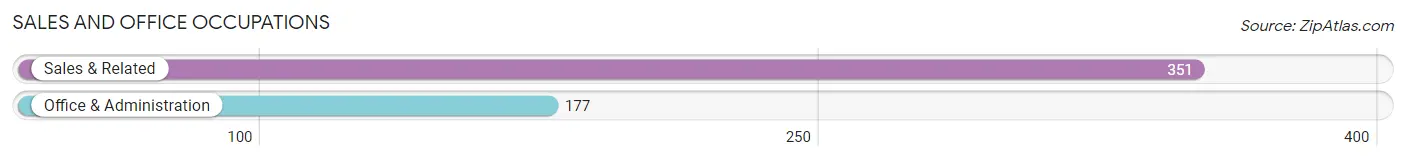
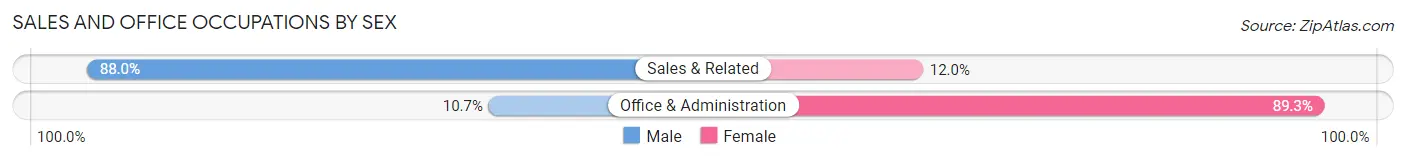
Sales and Office Occupations
The most common Sales and Office occupations in Reidland are Sales & Related (351 | 15.5%), and Office & Administration (177 | 7.8%).
Sales and Office Occupations by Sex
| Occupation | Male | Female |
| Sales & Related | 309 (88.0%) | 42 (12.0%) |
| Office & Administration | 19 (10.7%) | 158 (89.3%) |
| Total (Category) | 328 (62.1%) | 200 (37.9%) |
| Total (Overall) | 1,244 (55.0%) | 1,017 (45.0%) |
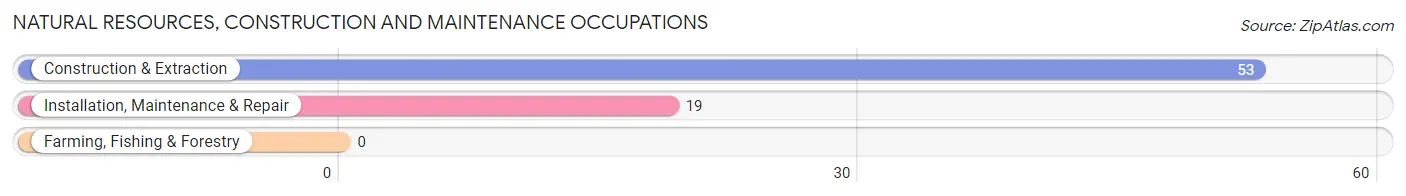
Natural Resources, Construction and Maintenance Occupations
The most common Natural Resources, Construction and Maintenance occupations in Reidland are Construction & Extraction (53 | 2.3%), and Installation, Maintenance & Repair (19 | 0.8%).
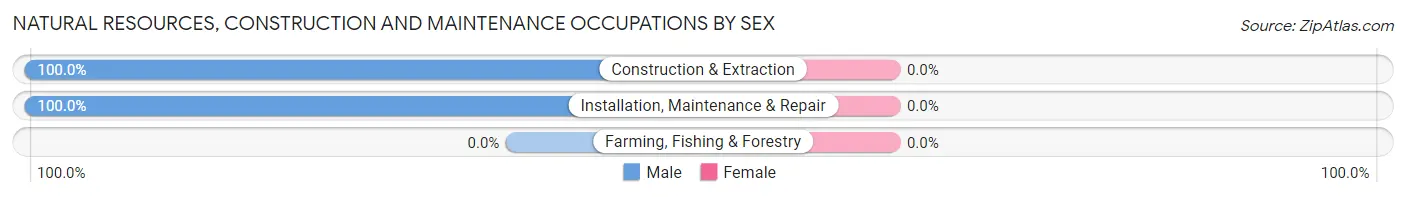
Natural Resources, Construction and Maintenance Occupations by Sex
| Occupation | Male | Female |
| Farming, Fishing & Forestry | 0 (0.0%) | 0 (0.0%) |
| Construction & Extraction | 53 (100.0%) | 0 (0.0%) |
| Installation, Maintenance & Repair | 19 (100.0%) | 0 (0.0%) |
| Total (Category) | 72 (100.0%) | 0 (0.0%) |
| Total (Overall) | 1,244 (55.0%) | 1,017 (45.0%) |
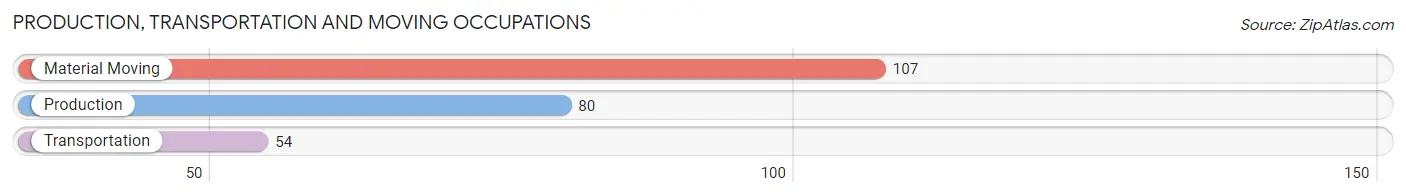
Production, Transportation and Moving Occupations
The most common Production, Transportation and Moving occupations in Reidland are Material Moving (107 | 4.7%), Production (80 | 3.5%), and Transportation (54 | 2.4%).
Production, Transportation and Moving Occupations by Sex
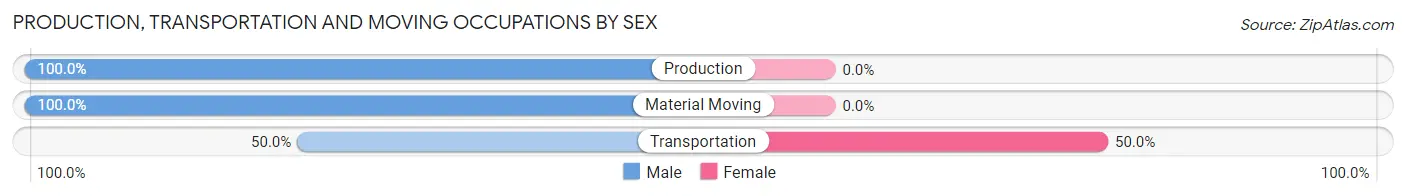
| Occupation | Male | Female |
| Production | 80 (100.0%) | 0 (0.0%) |
| Transportation | 27 (50.0%) | 27 (50.0%) |
| Material Moving | 107 (100.0%) | 0 (0.0%) |
| Total (Category) | 214 (88.8%) | 27 (11.2%) |
| Total (Overall) | 1,244 (55.0%) | 1,017 (45.0%) |
Employment Industries by Sex in Reidland
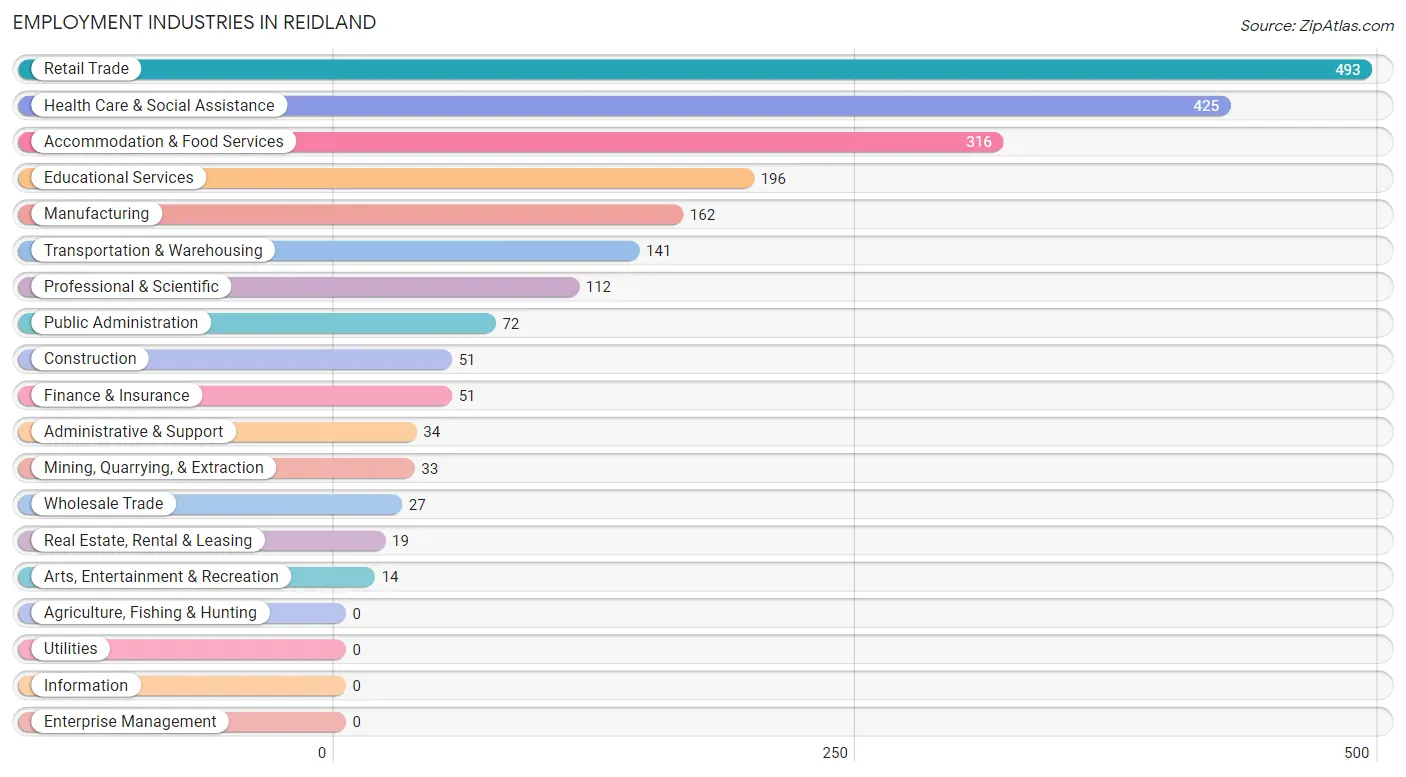
Employment Industries in Reidland
The major employment industries in Reidland include Retail Trade (493 | 21.8%), Health Care & Social Assistance (425 | 18.8%), Accommodation & Food Services (316 | 14.0%), Educational Services (196 | 8.7%), and Manufacturing (162 | 7.2%).
Employment Industries by Sex in Reidland
The Reidland industries that see more men than women are Mining, Quarrying, & Extraction (100.0%), Construction (100.0%), and Manufacturing (100.0%), whereas the industries that tend to have a higher number of women are Arts, Entertainment & Recreation (100.0%), Health Care & Social Assistance (90.1%), and Educational Services (76.5%).
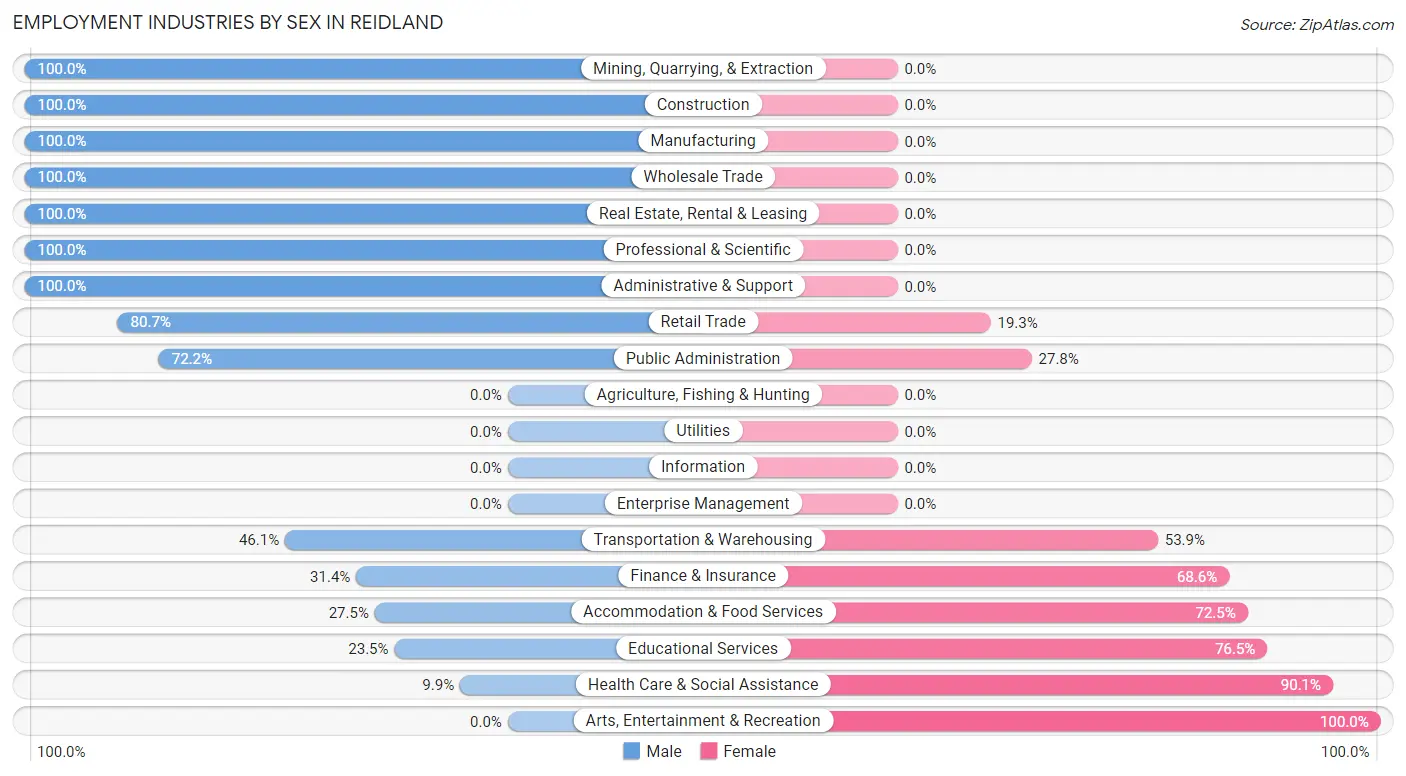
| Industry | Male | Female |
| Agriculture, Fishing & Hunting | 0 (0.0%) | 0 (0.0%) |
| Mining, Quarrying, & Extraction | 33 (100.0%) | 0 (0.0%) |
| Construction | 51 (100.0%) | 0 (0.0%) |
| Manufacturing | 162 (100.0%) | 0 (0.0%) |
| Wholesale Trade | 27 (100.0%) | 0 (0.0%) |
| Retail Trade | 398 (80.7%) | 95 (19.3%) |
| Transportation & Warehousing | 65 (46.1%) | 76 (53.9%) |
| Utilities | 0 (0.0%) | 0 (0.0%) |
| Information | 0 (0.0%) | 0 (0.0%) |
| Finance & Insurance | 16 (31.4%) | 35 (68.6%) |
| Real Estate, Rental & Leasing | 19 (100.0%) | 0 (0.0%) |
| Professional & Scientific | 112 (100.0%) | 0 (0.0%) |
| Enterprise Management | 0 (0.0%) | 0 (0.0%) |
| Administrative & Support | 34 (100.0%) | 0 (0.0%) |
| Educational Services | 46 (23.5%) | 150 (76.5%) |
| Health Care & Social Assistance | 42 (9.9%) | 383 (90.1%) |
| Arts, Entertainment & Recreation | 0 (0.0%) | 14 (100.0%) |
| Accommodation & Food Services | 87 (27.5%) | 229 (72.5%) |
| Public Administration | 52 (72.2%) | 20 (27.8%) |
| Total | 1,244 (55.0%) | 1,017 (45.0%) |
Education in Reidland
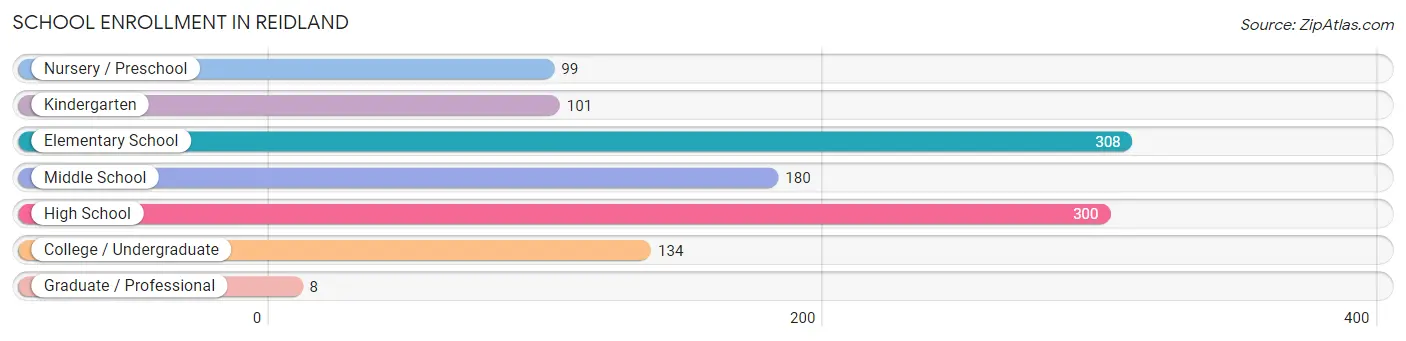
School Enrollment in Reidland
The most common levels of schooling among the 1,130 students in Reidland are elementary school (308 | 27.3%), high school (300 | 26.6%), and middle school (180 | 15.9%).
| School Level | # Students | % Students |
| Nursery / Preschool | 99 | 8.8% |
| Kindergarten | 101 | 8.9% |
| Elementary School | 308 | 27.3% |
| Middle School | 180 | 15.9% |
| High School | 300 | 26.6% |
| College / Undergraduate | 134 | 11.9% |
| Graduate / Professional | 8 | 0.7% |
| Total | 1,130 | 100.0% |
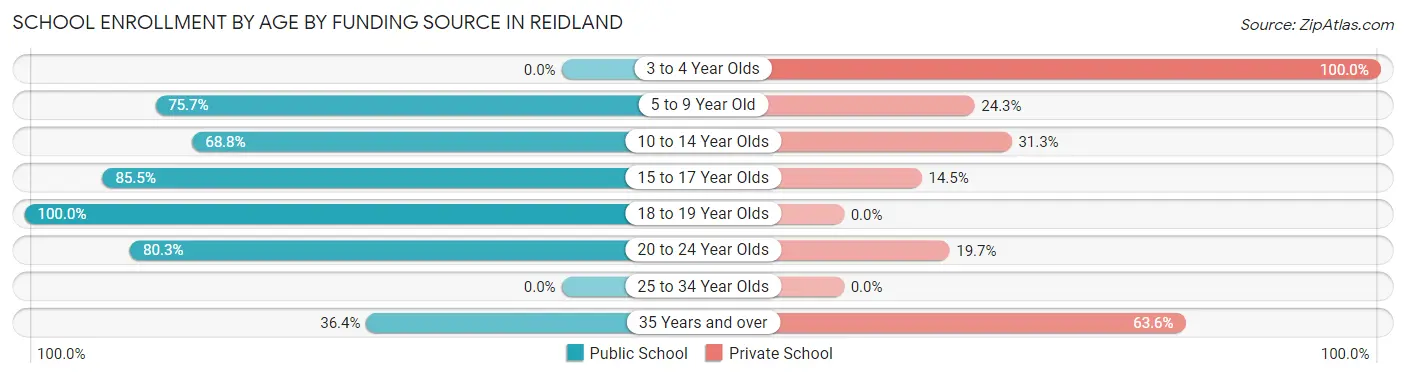
School Enrollment by Age by Funding Source in Reidland
Out of a total of 1,130 students who are enrolled in schools in Reidland, 305 (27.0%) attend a private institution, while the remaining 825 (73.0%) are enrolled in public schools. The age group of 3 to 4 year olds has the highest likelihood of being enrolled in private schools, with 69 (100.0% in the age bracket) enrolled. Conversely, the age group of 18 to 19 year olds has the lowest likelihood of being enrolled in a private school, with 110 (100.0% in the age bracket) attending a public institution.
| Age Bracket | Public School | Private School |
| 3 to 4 Year Olds | 0 (0.0%) | 69 (100.0%) |
| 5 to 9 Year Old | 317 (75.7%) | 102 (24.3%) |
| 10 to 14 Year Olds | 176 (68.8%) | 80 (31.2%) |
| 15 to 17 Year Olds | 165 (85.5%) | 28 (14.5%) |
| 18 to 19 Year Olds | 110 (100.0%) | 0 (0.0%) |
| 20 to 24 Year Olds | 49 (80.3%) | 12 (19.7%) |
| 25 to 34 Year Olds | 0 (0.0%) | 0 (0.0%) |
| 35 Years and over | 8 (36.4%) | 14 (63.6%) |
| Total | 825 (73.0%) | 305 (27.0%) |
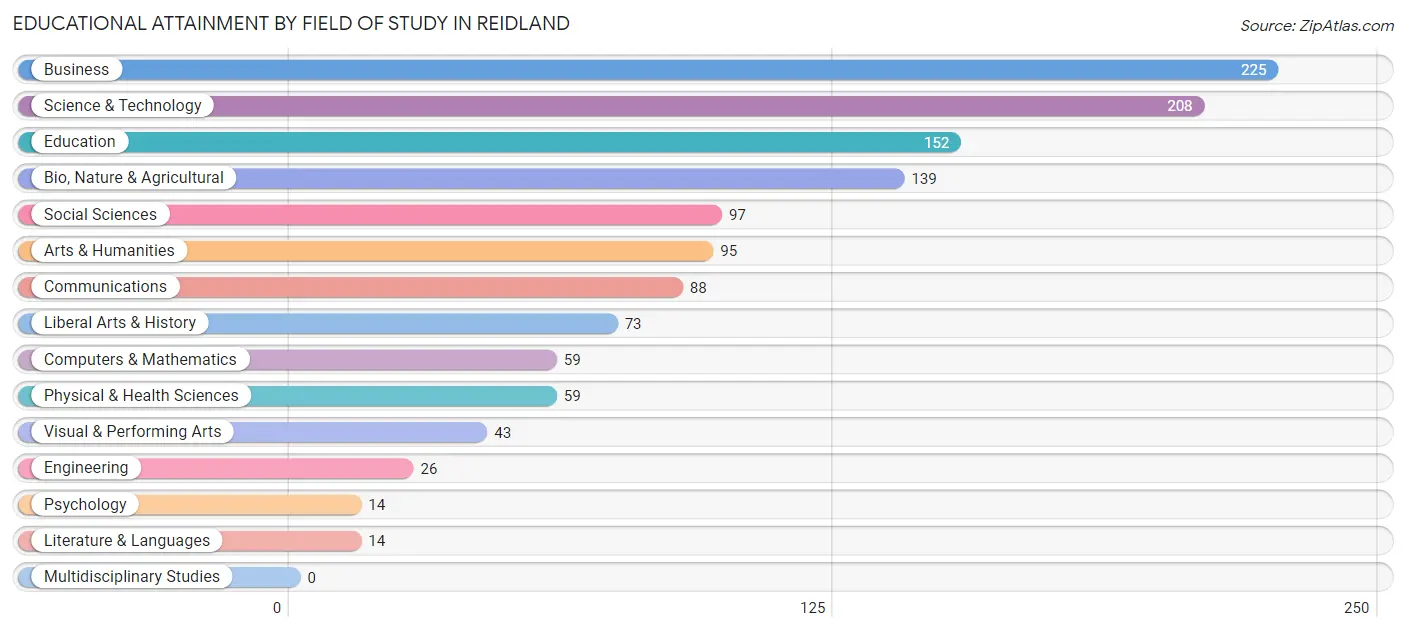
Educational Attainment by Field of Study in Reidland
Business (225 | 17.4%), science & technology (208 | 16.1%), education (152 | 11.8%), bio, nature & agricultural (139 | 10.8%), and social sciences (97 | 7.5%) are the most common fields of study among 1,292 individuals in Reidland who have obtained a bachelor's degree or higher.
| Field of Study | # Graduates | % Graduates |
| Computers & Mathematics | 59 | 4.6% |
| Bio, Nature & Agricultural | 139 | 10.8% |
| Physical & Health Sciences | 59 | 4.6% |
| Psychology | 14 | 1.1% |
| Social Sciences | 97 | 7.5% |
| Engineering | 26 | 2.0% |
| Multidisciplinary Studies | 0 | 0.0% |
| Science & Technology | 208 | 16.1% |
| Business | 225 | 17.4% |
| Education | 152 | 11.8% |
| Literature & Languages | 14 | 1.1% |
| Liberal Arts & History | 73 | 5.7% |
| Visual & Performing Arts | 43 | 3.3% |
| Communications | 88 | 6.8% |
| Arts & Humanities | 95 | 7.3% |
| Total | 1,292 | 100.0% |
Transportation & Commute in Reidland
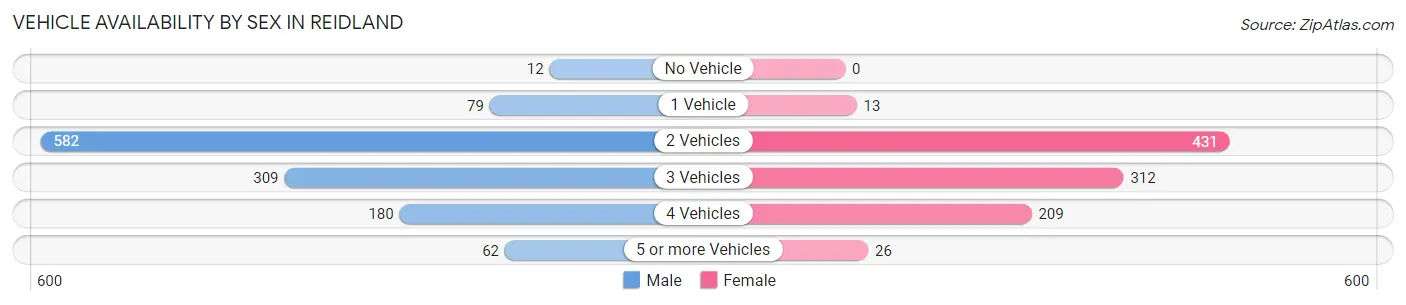
Vehicle Availability by Sex in Reidland
The most prevalent vehicle ownership categories in Reidland are males with 2 vehicles (582, accounting for 47.5%) and females with 2 vehicles (431, making up 58.7%).
| Vehicles Available | Male | Female |
| No Vehicle | 12 (1.0%) | 0 (0.0%) |
| 1 Vehicle | 79 (6.5%) | 13 (1.3%) |
| 2 Vehicles | 582 (47.5%) | 431 (43.5%) |
| 3 Vehicles | 309 (25.3%) | 312 (31.5%) |
| 4 Vehicles | 180 (14.7%) | 209 (21.1%) |
| 5 or more Vehicles | 62 (5.1%) | 26 (2.6%) |
| Total | 1,224 (100.0%) | 991 (100.0%) |
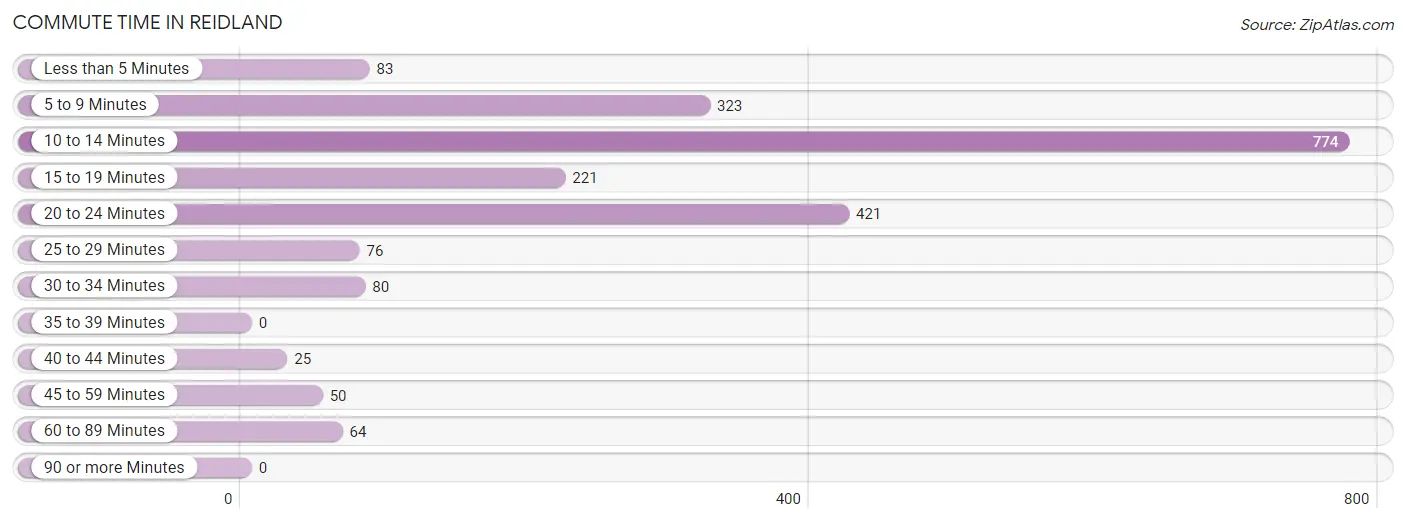
Commute Time in Reidland
The most frequently occuring commute durations in Reidland are 10 to 14 minutes (774 commuters, 36.6%), 20 to 24 minutes (421 commuters, 19.9%), and 5 to 9 minutes (323 commuters, 15.3%).
| Commute Time | # Commuters | % Commuters |
| Less than 5 Minutes | 83 | 3.9% |
| 5 to 9 Minutes | 323 | 15.3% |
| 10 to 14 Minutes | 774 | 36.6% |
| 15 to 19 Minutes | 221 | 10.4% |
| 20 to 24 Minutes | 421 | 19.9% |
| 25 to 29 Minutes | 76 | 3.6% |
| 30 to 34 Minutes | 80 | 3.8% |
| 35 to 39 Minutes | 0 | 0.0% |
| 40 to 44 Minutes | 25 | 1.2% |
| 45 to 59 Minutes | 50 | 2.4% |
| 60 to 89 Minutes | 64 | 3.0% |
| 90 or more Minutes | 0 | 0.0% |
Commute Time by Sex in Reidland
The most common commute times in Reidland are 10 to 14 minutes (543 commuters, 46.0%) for males and 10 to 14 minutes (231 commuters, 24.7%) for females.
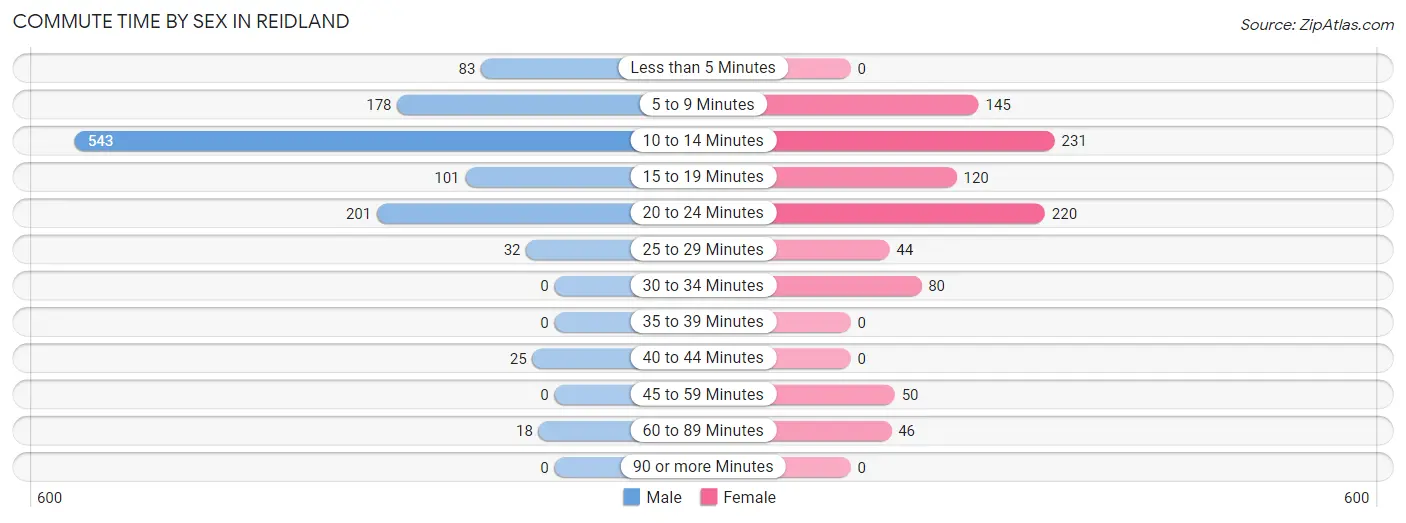
| Commute Time | Male | Female |
| Less than 5 Minutes | 83 (7.0%) | 0 (0.0%) |
| 5 to 9 Minutes | 178 (15.1%) | 145 (15.5%) |
| 10 to 14 Minutes | 543 (46.0%) | 231 (24.7%) |
| 15 to 19 Minutes | 101 (8.6%) | 120 (12.8%) |
| 20 to 24 Minutes | 201 (17.0%) | 220 (23.5%) |
| 25 to 29 Minutes | 32 (2.7%) | 44 (4.7%) |
| 30 to 34 Minutes | 0 (0.0%) | 80 (8.6%) |
| 35 to 39 Minutes | 0 (0.0%) | 0 (0.0%) |
| 40 to 44 Minutes | 25 (2.1%) | 0 (0.0%) |
| 45 to 59 Minutes | 0 (0.0%) | 50 (5.3%) |
| 60 to 89 Minutes | 18 (1.5%) | 46 (4.9%) |
| 90 or more Minutes | 0 (0.0%) | 0 (0.0%) |
Time of Departure to Work by Sex in Reidland
The most frequent times of departure to work in Reidland are 7:30 AM to 7:59 AM (190, 16.1%) for males and 7:00 AM to 7:29 AM (160, 17.1%) for females.
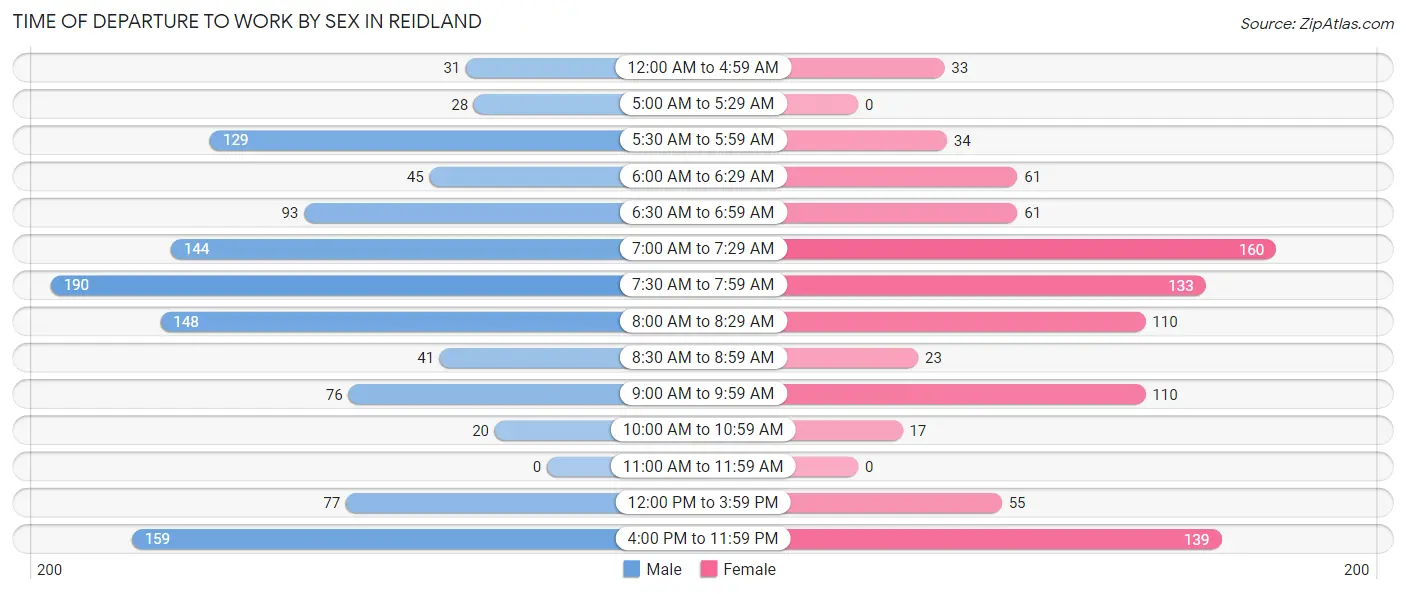
| Time of Departure | Male | Female |
| 12:00 AM to 4:59 AM | 31 (2.6%) | 33 (3.5%) |
| 5:00 AM to 5:29 AM | 28 (2.4%) | 0 (0.0%) |
| 5:30 AM to 5:59 AM | 129 (10.9%) | 34 (3.6%) |
| 6:00 AM to 6:29 AM | 45 (3.8%) | 61 (6.5%) |
| 6:30 AM to 6:59 AM | 93 (7.9%) | 61 (6.5%) |
| 7:00 AM to 7:29 AM | 144 (12.2%) | 160 (17.1%) |
| 7:30 AM to 7:59 AM | 190 (16.1%) | 133 (14.2%) |
| 8:00 AM to 8:29 AM | 148 (12.5%) | 110 (11.7%) |
| 8:30 AM to 8:59 AM | 41 (3.5%) | 23 (2.5%) |
| 9:00 AM to 9:59 AM | 76 (6.4%) | 110 (11.7%) |
| 10:00 AM to 10:59 AM | 20 (1.7%) | 17 (1.8%) |
| 11:00 AM to 11:59 AM | 0 (0.0%) | 0 (0.0%) |
| 12:00 PM to 3:59 PM | 77 (6.5%) | 55 (5.9%) |
| 4:00 PM to 11:59 PM | 159 (13.5%) | 139 (14.8%) |
| Total | 1,181 (100.0%) | 936 (100.0%) |
Housing Occupancy in Reidland
Occupancy by Ownership in Reidland
Of the total 1,709 dwellings in Reidland, owner-occupied units account for 1,468 (85.9%), while renter-occupied units make up 241 (14.1%).
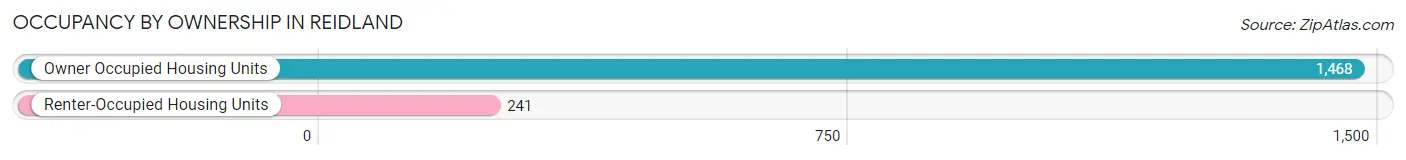
| Occupancy | # Housing Units | % Housing Units |
| Owner Occupied Housing Units | 1,468 | 85.9% |
| Renter-Occupied Housing Units | 241 | 14.1% |
| Total Occupied Housing Units | 1,709 | 100.0% |
Occupancy by Household Size in Reidland
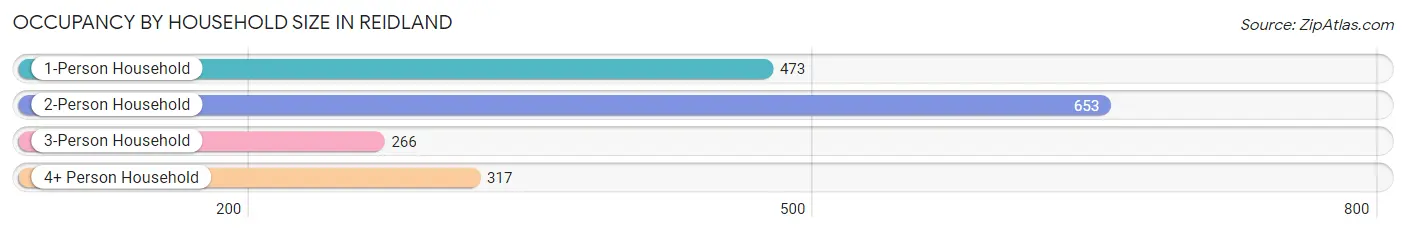
| Household Size | # Housing Units | % Housing Units |
| 1-Person Household | 473 | 27.7% |
| 2-Person Household | 653 | 38.2% |
| 3-Person Household | 266 | 15.6% |
| 4+ Person Household | 317 | 18.5% |
| Total Housing Units | 1,709 | 100.0% |
Occupancy by Ownership by Household Size in Reidland
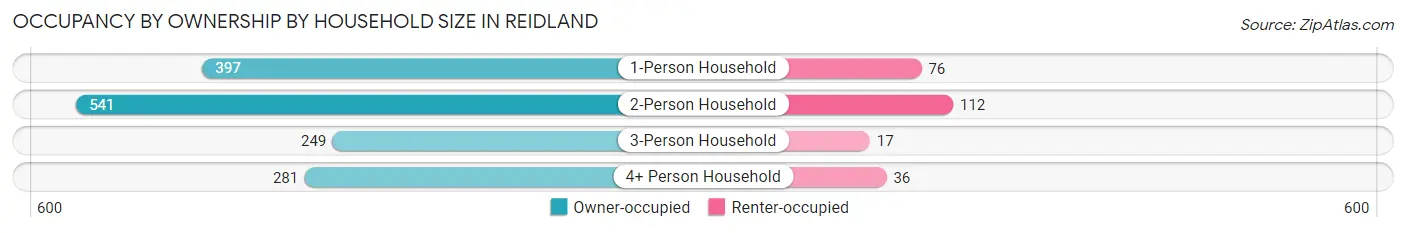
| Household Size | Owner-occupied | Renter-occupied |
| 1-Person Household | 397 (83.9%) | 76 (16.1%) |
| 2-Person Household | 541 (82.9%) | 112 (17.2%) |
| 3-Person Household | 249 (93.6%) | 17 (6.4%) |
| 4+ Person Household | 281 (88.6%) | 36 (11.4%) |
| Total Housing Units | 1,468 (85.9%) | 241 (14.1%) |
Occupancy by Educational Attainment in Reidland
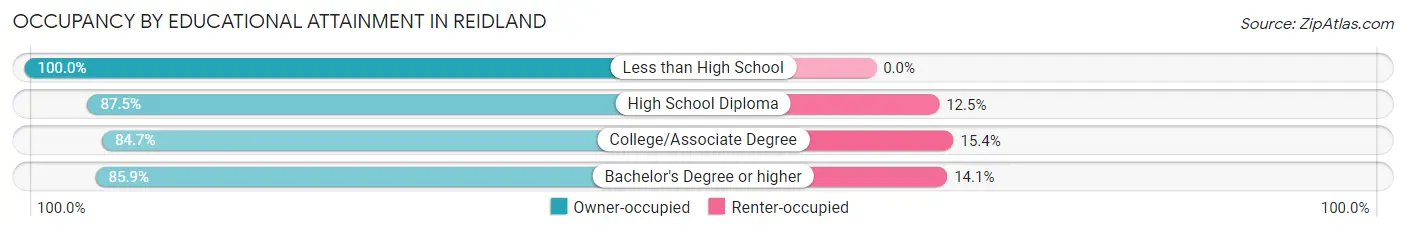
| Household Size | Owner-occupied | Renter-occupied |
| Less than High School | 12 (100.0%) | 0 (0.0%) |
| High School Diploma | 371 (87.5%) | 53 (12.5%) |
| College/Associate Degree | 579 (84.7%) | 105 (15.3%) |
| Bachelor's Degree or higher | 506 (85.9%) | 83 (14.1%) |
Occupancy by Age of Householder in Reidland
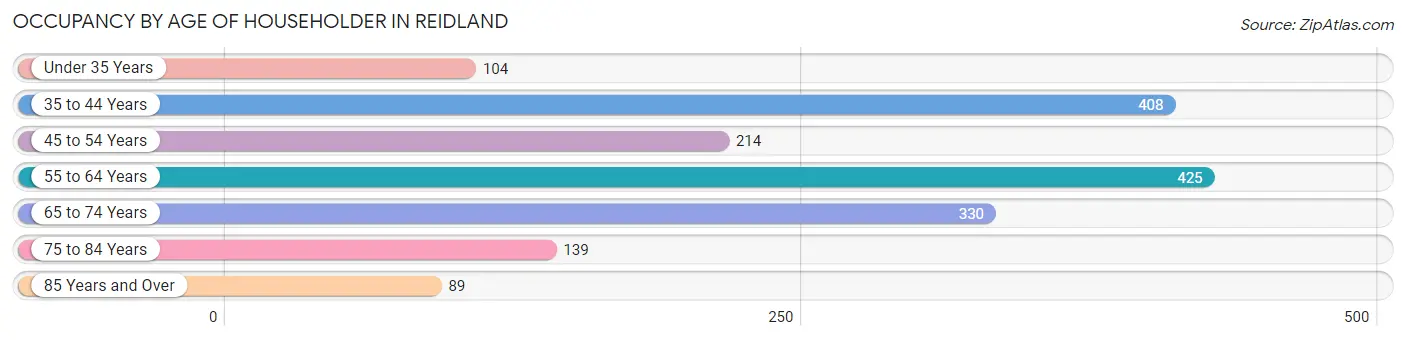
| Age Bracket | # Households | % Households |
| Under 35 Years | 104 | 6.1% |
| 35 to 44 Years | 408 | 23.9% |
| 45 to 54 Years | 214 | 12.5% |
| 55 to 64 Years | 425 | 24.9% |
| 65 to 74 Years | 330 | 19.3% |
| 75 to 84 Years | 139 | 8.1% |
| 85 Years and Over | 89 | 5.2% |
| Total | 1,709 | 100.0% |
Housing Finances in Reidland
Median Income by Occupancy in Reidland
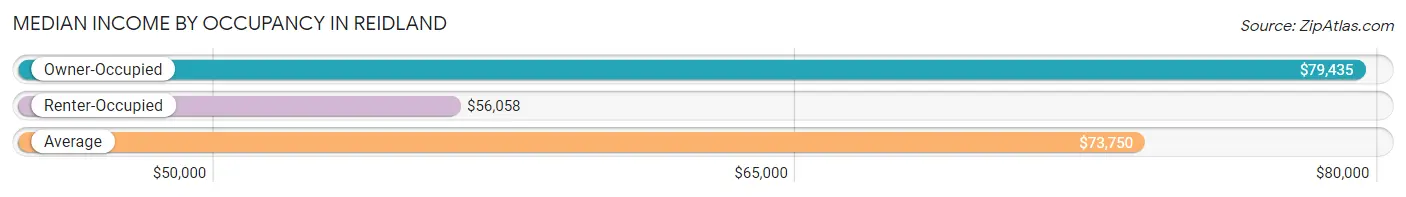
| Occupancy Type | # Households | Median Income |
| Owner-Occupied | 1,468 (85.9%) | $79,435 |
| Renter-Occupied | 241 (14.1%) | $56,058 |
| Average | 1,709 (100.0%) | $73,750 |
Occupancy by Householder Income Bracket in Reidland
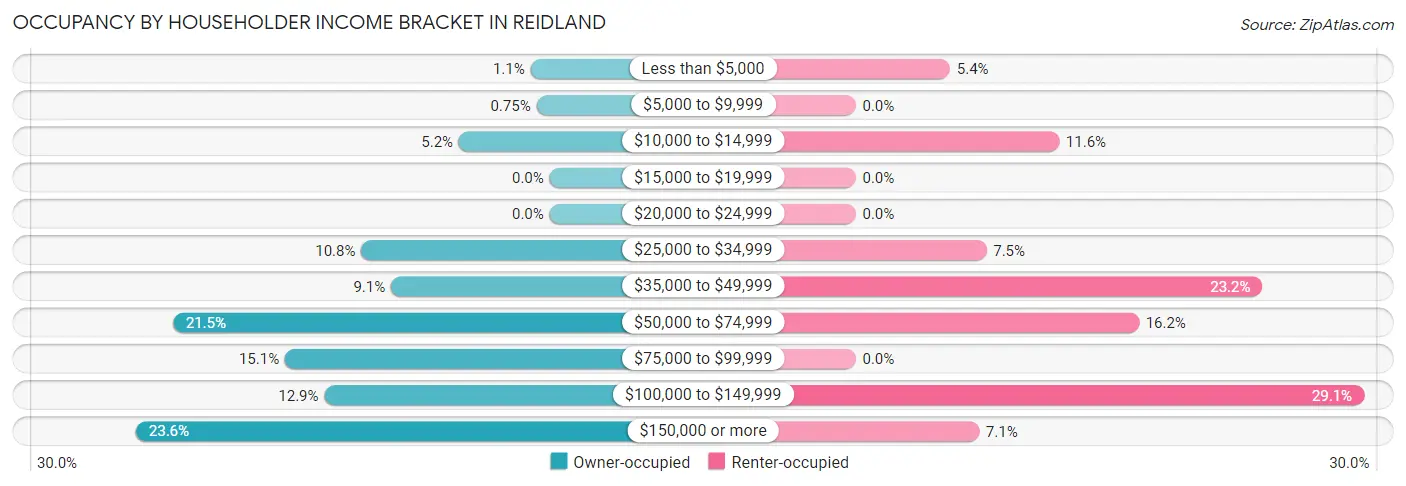
| Income Bracket | Owner-occupied | Renter-occupied |
| Less than $5,000 | 16 (1.1%) | 13 (5.4%) |
| $5,000 to $9,999 | 11 (0.7%) | 0 (0.0%) |
| $10,000 to $14,999 | 76 (5.2%) | 28 (11.6%) |
| $15,000 to $19,999 | 0 (0.0%) | 0 (0.0%) |
| $20,000 to $24,999 | 0 (0.0%) | 0 (0.0%) |
| $25,000 to $34,999 | 158 (10.8%) | 18 (7.5%) |
| $35,000 to $49,999 | 133 (9.1%) | 56 (23.2%) |
| $50,000 to $74,999 | 316 (21.5%) | 39 (16.2%) |
| $75,000 to $99,999 | 222 (15.1%) | 0 (0.0%) |
| $100,000 to $149,999 | 189 (12.9%) | 70 (29.0%) |
| $150,000 or more | 347 (23.6%) | 17 (7.0%) |
| Total | 1,468 (100.0%) | 241 (100.0%) |
Monthly Housing Cost Tiers in Reidland
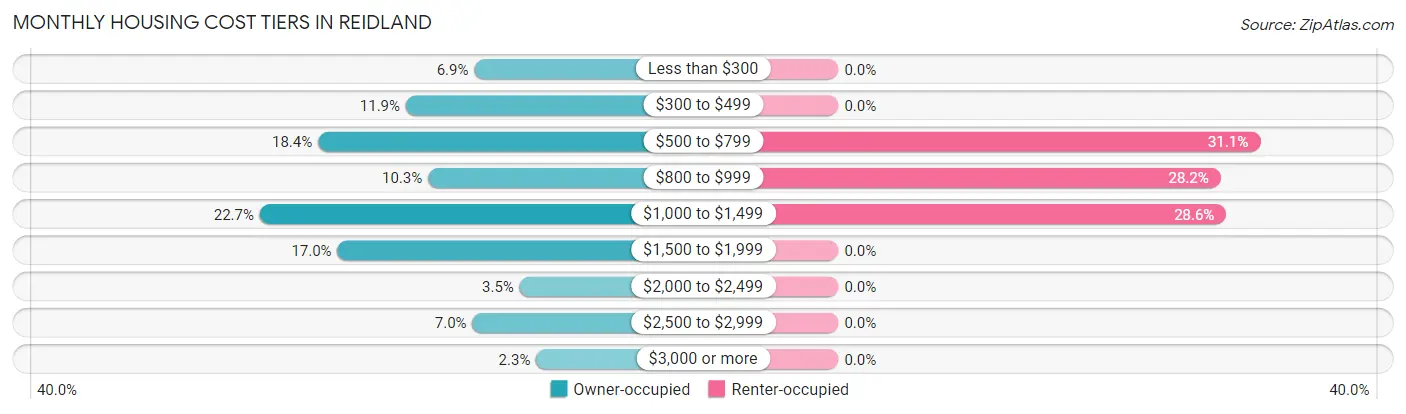
| Monthly Cost | Owner-occupied | Renter-occupied |
| Less than $300 | 101 (6.9%) | 0 (0.0%) |
| $300 to $499 | 175 (11.9%) | 0 (0.0%) |
| $500 to $799 | 270 (18.4%) | 75 (31.1%) |
| $800 to $999 | 151 (10.3%) | 68 (28.2%) |
| $1,000 to $1,499 | 333 (22.7%) | 69 (28.6%) |
| $1,500 to $1,999 | 249 (17.0%) | 0 (0.0%) |
| $2,000 to $2,499 | 52 (3.5%) | 0 (0.0%) |
| $2,500 to $2,999 | 103 (7.0%) | 0 (0.0%) |
| $3,000 or more | 34 (2.3%) | 0 (0.0%) |
| Total | 1,468 (100.0%) | 241 (100.0%) |
Physical Housing Characteristics in Reidland
Housing Structures in Reidland
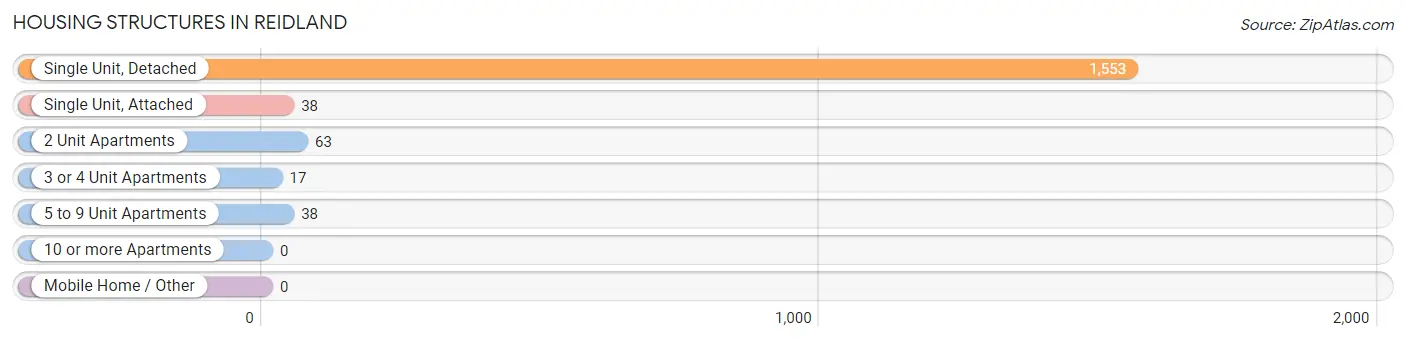
| Structure Type | # Housing Units | % Housing Units |
| Single Unit, Detached | 1,553 | 90.9% |
| Single Unit, Attached | 38 | 2.2% |
| 2 Unit Apartments | 63 | 3.7% |
| 3 or 4 Unit Apartments | 17 | 1.0% |
| 5 to 9 Unit Apartments | 38 | 2.2% |
| 10 or more Apartments | 0 | 0.0% |
| Mobile Home / Other | 0 | 0.0% |
| Total | 1,709 | 100.0% |
Housing Structures by Occupancy in Reidland
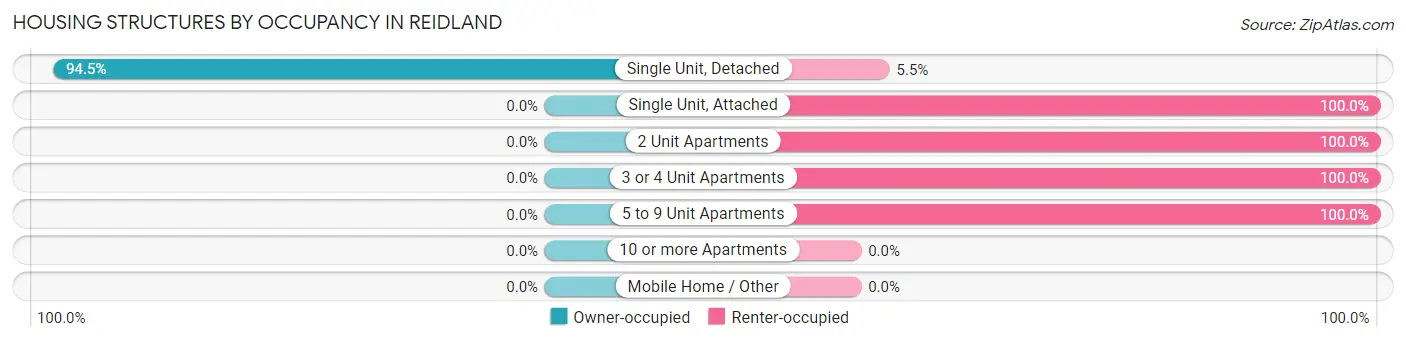
| Structure Type | Owner-occupied | Renter-occupied |
| Single Unit, Detached | 1,468 (94.5%) | 85 (5.5%) |
| Single Unit, Attached | 0 (0.0%) | 38 (100.0%) |
| 2 Unit Apartments | 0 (0.0%) | 63 (100.0%) |
| 3 or 4 Unit Apartments | 0 (0.0%) | 17 (100.0%) |
| 5 to 9 Unit Apartments | 0 (0.0%) | 38 (100.0%) |
| 10 or more Apartments | 0 (0.0%) | 0 (0.0%) |
| Mobile Home / Other | 0 (0.0%) | 0 (0.0%) |
| Total | 1,468 (85.9%) | 241 (14.1%) |
Housing Structures by Number of Rooms in Reidland
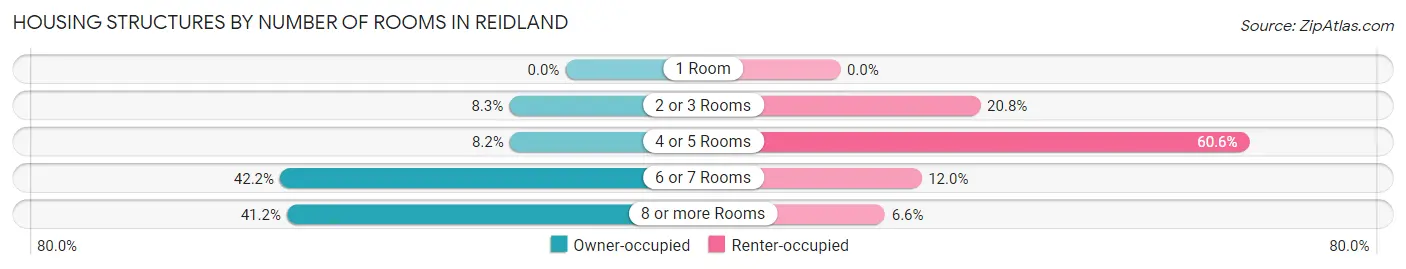
| Number of Rooms | Owner-occupied | Renter-occupied |
| 1 Room | 0 (0.0%) | 0 (0.0%) |
| 2 or 3 Rooms | 122 (8.3%) | 50 (20.7%) |
| 4 or 5 Rooms | 121 (8.2%) | 146 (60.6%) |
| 6 or 7 Rooms | 620 (42.2%) | 29 (12.0%) |
| 8 or more Rooms | 605 (41.2%) | 16 (6.6%) |
| Total | 1,468 (100.0%) | 241 (100.0%) |
Housing Structure by Heating Type in Reidland
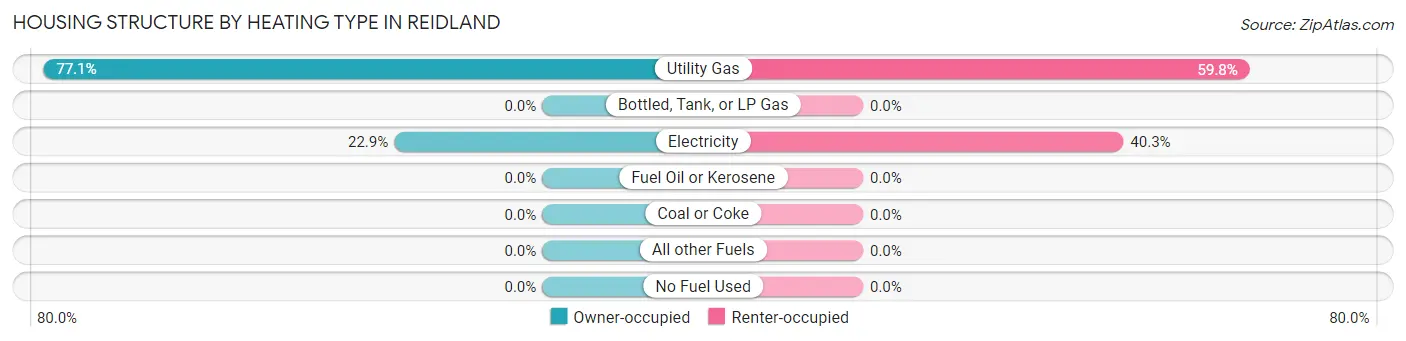
| Heating Type | Owner-occupied | Renter-occupied |
| Utility Gas | 1,132 (77.1%) | 144 (59.8%) |
| Bottled, Tank, or LP Gas | 0 (0.0%) | 0 (0.0%) |
| Electricity | 336 (22.9%) | 97 (40.3%) |
| Fuel Oil or Kerosene | 0 (0.0%) | 0 (0.0%) |
| Coal or Coke | 0 (0.0%) | 0 (0.0%) |
| All other Fuels | 0 (0.0%) | 0 (0.0%) |
| No Fuel Used | 0 (0.0%) | 0 (0.0%) |
| Total | 1,468 (100.0%) | 241 (100.0%) |
Household Vehicle Usage in Reidland
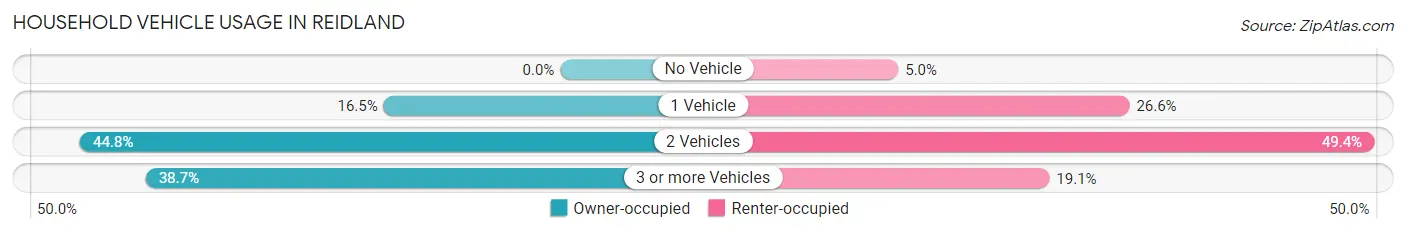
| Vehicles per Household | Owner-occupied | Renter-occupied |
| No Vehicle | 0 (0.0%) | 12 (5.0%) |
| 1 Vehicle | 242 (16.5%) | 64 (26.6%) |
| 2 Vehicles | 658 (44.8%) | 119 (49.4%) |
| 3 or more Vehicles | 568 (38.7%) | 46 (19.1%) |
| Total | 1,468 (100.0%) | 241 (100.0%) |
Real Estate & Mortgages in Reidland
Real Estate and Mortgage Overview in Reidland
| Characteristic | Without Mortgage | With Mortgage |
| Housing Units | 546 | 922 |
| Median Property Value | $201,600 | $201,200 |
| Median Household Income | $38,804 | $266 |
| Monthly Housing Costs | $515 | $34 |
| Real Estate Taxes | $1,255 | $27 |
Property Value by Mortgage Status in Reidland
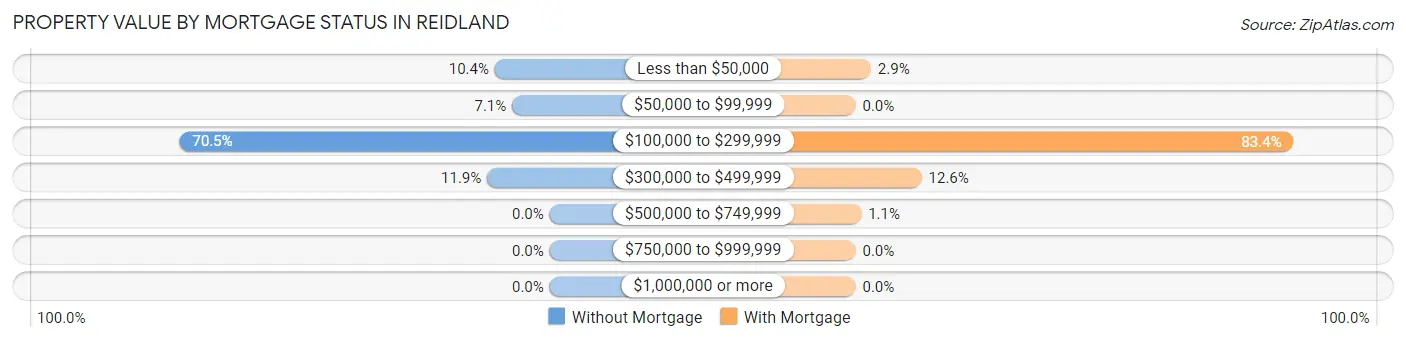
| Property Value | Without Mortgage | With Mortgage |
| Less than $50,000 | 57 (10.4%) | 27 (2.9%) |
| $50,000 to $99,999 | 39 (7.1%) | 0 (0.0%) |
| $100,000 to $299,999 | 385 (70.5%) | 769 (83.4%) |
| $300,000 to $499,999 | 65 (11.9%) | 116 (12.6%) |
| $500,000 to $749,999 | 0 (0.0%) | 10 (1.1%) |
| $750,000 to $999,999 | 0 (0.0%) | 0 (0.0%) |
| $1,000,000 or more | 0 (0.0%) | 0 (0.0%) |
| Total | 546 (100.0%) | 922 (100.0%) |
Household Income by Mortgage Status in Reidland
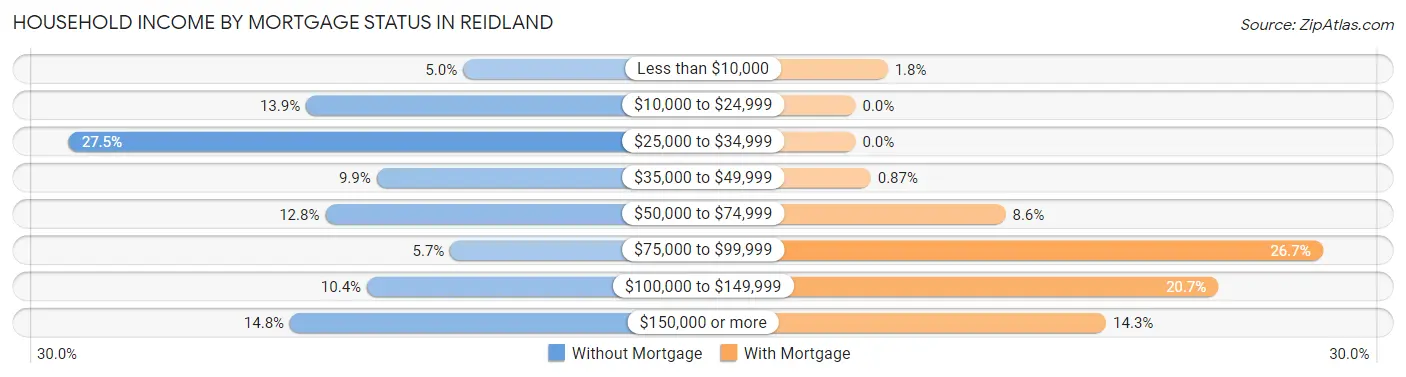
| Household Income | Without Mortgage | With Mortgage |
| Less than $10,000 | 27 (5.0%) | 17 (1.8%) |
| $10,000 to $24,999 | 76 (13.9%) | 0 (0.0%) |
| $25,000 to $34,999 | 150 (27.5%) | 0 (0.0%) |
| $35,000 to $49,999 | 54 (9.9%) | 8 (0.9%) |
| $50,000 to $74,999 | 70 (12.8%) | 79 (8.6%) |
| $75,000 to $99,999 | 31 (5.7%) | 246 (26.7%) |
| $100,000 to $149,999 | 57 (10.4%) | 191 (20.7%) |
| $150,000 or more | 81 (14.8%) | 132 (14.3%) |
| Total | 546 (100.0%) | 922 (100.0%) |
Property Value to Household Income Ratio in Reidland
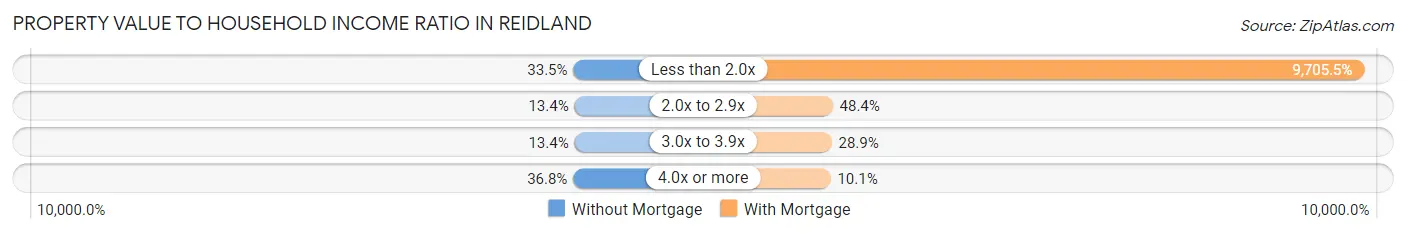
| Value-to-Income Ratio | Without Mortgage | With Mortgage |
| Less than 2.0x | 183 (33.5%) | 89,485 (9,705.5%) |
| 2.0x to 2.9x | 73 (13.4%) | 446 (48.4%) |
| 3.0x to 3.9x | 73 (13.4%) | 266 (28.8%) |
| 4.0x or more | 201 (36.8%) | 93 (10.1%) |
| Total | 546 (100.0%) | 922 (100.0%) |
Real Estate Taxes by Mortgage Status in Reidland
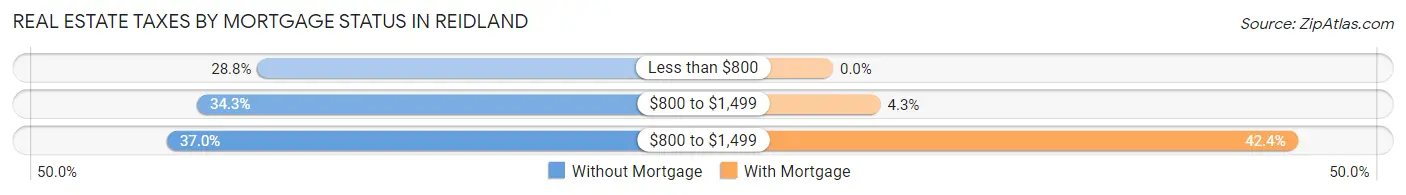
| Property Taxes | Without Mortgage | With Mortgage |
| Less than $800 | 157 (28.7%) | 0 (0.0%) |
| $800 to $1,499 | 187 (34.3%) | 40 (4.3%) |
| $800 to $1,499 | 202 (37.0%) | 391 (42.4%) |
| Total | 546 (100.0%) | 922 (100.0%) |
Health & Disability in Reidland
Health Insurance Coverage by Age in Reidland
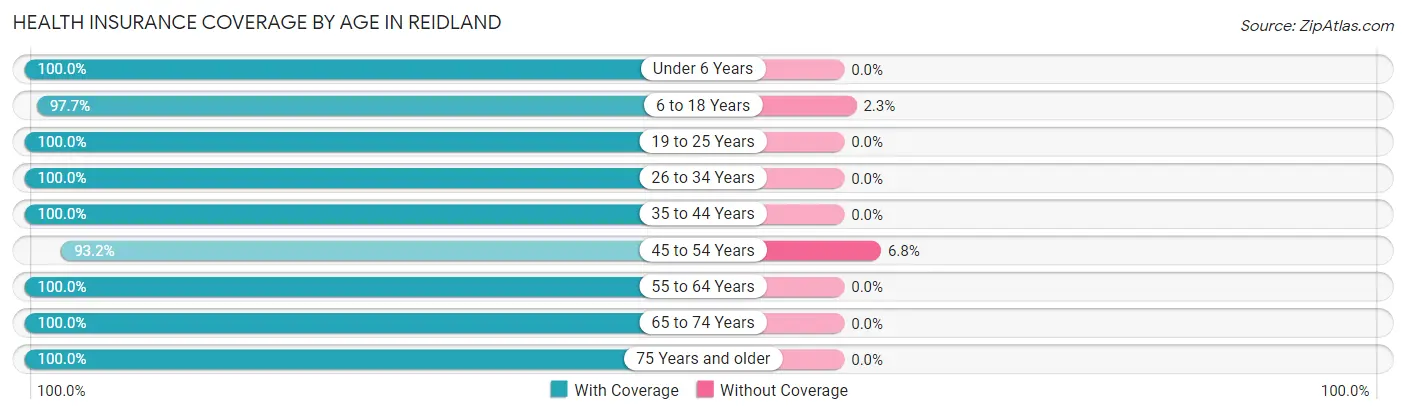
| Age Bracket | With Coverage | Without Coverage |
| Under 6 Years | 294 (100.0%) | 0 (0.0%) |
| 6 to 18 Years | 819 (97.7%) | 19 (2.3%) |
| 19 to 25 Years | 397 (100.0%) | 0 (0.0%) |
| 26 to 34 Years | 323 (100.0%) | 0 (0.0%) |
| 35 to 44 Years | 709 (100.0%) | 0 (0.0%) |
| 45 to 54 Years | 477 (93.2%) | 35 (6.8%) |
| 55 to 64 Years | 682 (100.0%) | 0 (0.0%) |
| 65 to 74 Years | 562 (100.0%) | 0 (0.0%) |
| 75 Years and older | 325 (100.0%) | 0 (0.0%) |
| Total | 4,588 (98.8%) | 54 (1.2%) |
Health Insurance Coverage by Citizenship Status in Reidland
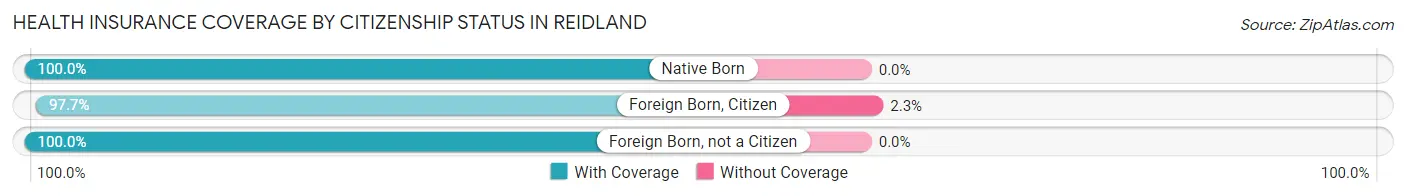
| Citizenship Status | With Coverage | Without Coverage |
| Native Born | 294 (100.0%) | 0 (0.0%) |
| Foreign Born, Citizen | 819 (97.7%) | 19 (2.3%) |
| Foreign Born, not a Citizen | 397 (100.0%) | 0 (0.0%) |
Health Insurance Coverage by Household Income in Reidland
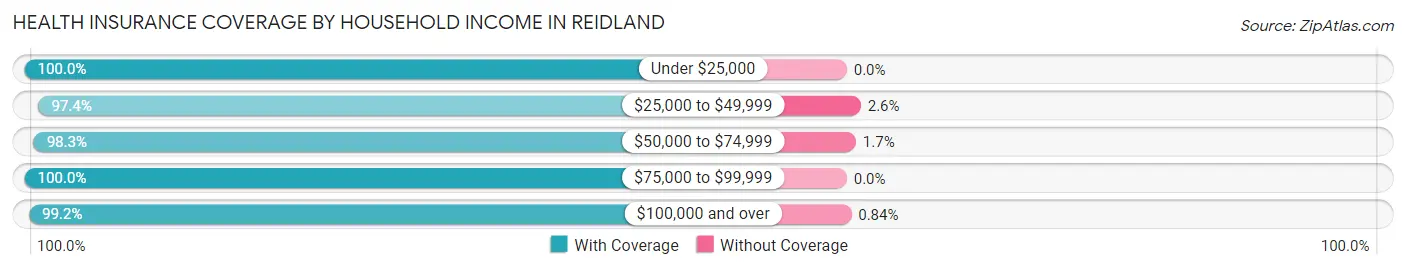
| Household Income | With Coverage | Without Coverage |
| Under $25,000 | 207 (100.0%) | 0 (0.0%) |
| $25,000 to $49,999 | 742 (97.4%) | 20 (2.6%) |
| $50,000 to $74,999 | 1,089 (98.3%) | 19 (1.7%) |
| $75,000 to $99,999 | 781 (100.0%) | 0 (0.0%) |
| $100,000 and over | 1,769 (99.2%) | 15 (0.8%) |
Public vs Private Health Insurance Coverage by Age in Reidland
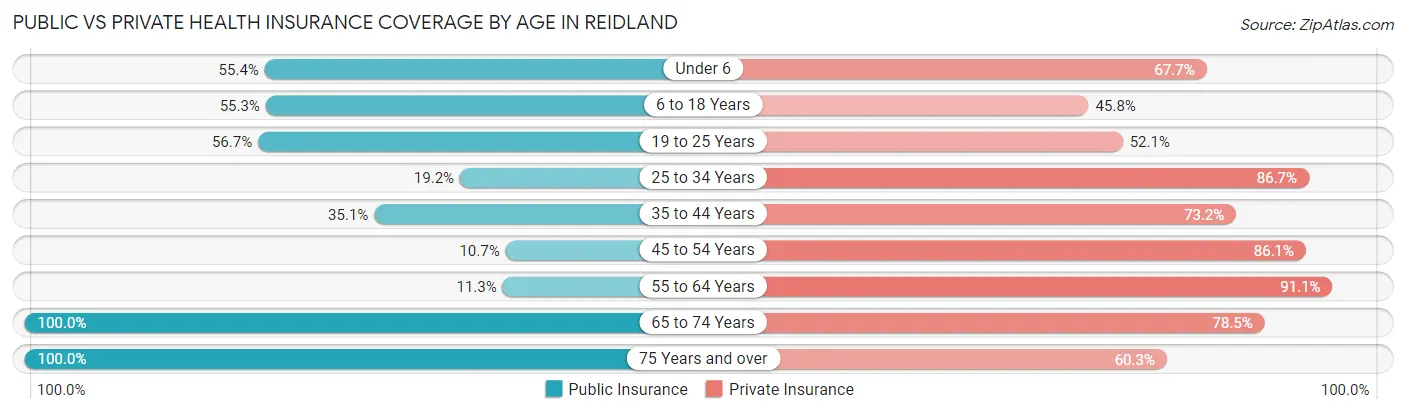
| Age Bracket | Public Insurance | Private Insurance |
| Under 6 | 163 (55.4%) | 199 (67.7%) |
| 6 to 18 Years | 463 (55.2%) | 384 (45.8%) |
| 19 to 25 Years | 225 (56.7%) | 207 (52.1%) |
| 25 to 34 Years | 62 (19.2%) | 280 (86.7%) |
| 35 to 44 Years | 249 (35.1%) | 519 (73.2%) |
| 45 to 54 Years | 55 (10.7%) | 441 (86.1%) |
| 55 to 64 Years | 77 (11.3%) | 621 (91.1%) |
| 65 to 74 Years | 562 (100.0%) | 441 (78.5%) |
| 75 Years and over | 325 (100.0%) | 196 (60.3%) |
| Total | 2,181 (47.0%) | 3,288 (70.8%) |
Disability Status by Sex by Age in Reidland
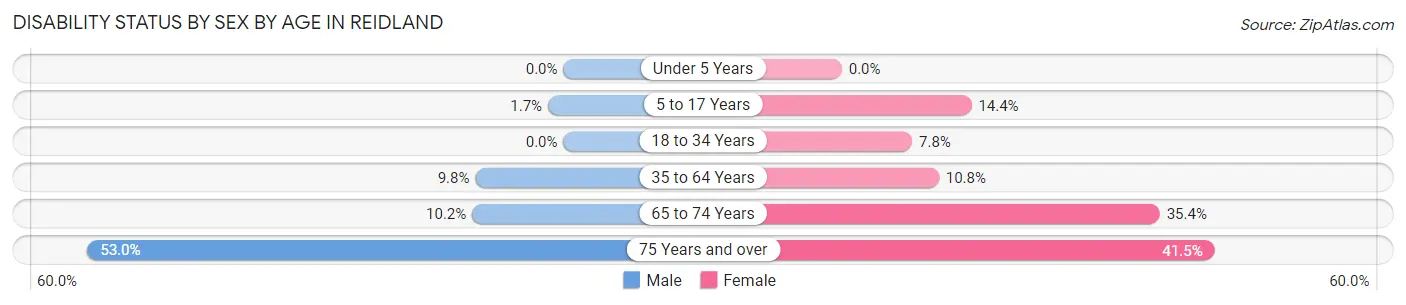
| Age Bracket | Male | Female |
| Under 5 Years | 0 (0.0%) | 0 (0.0%) |
| 5 to 17 Years | 9 (1.7%) | 54 (14.4%) |
| 18 to 34 Years | 0 (0.0%) | 31 (7.8%) |
| 35 to 64 Years | 95 (9.8%) | 101 (10.8%) |
| 65 to 74 Years | 31 (10.2%) | 91 (35.4%) |
| 75 Years and over | 88 (53.0%) | 66 (41.5%) |
Disability Class by Sex by Age in Reidland
Disability Class: Hearing Difficulty
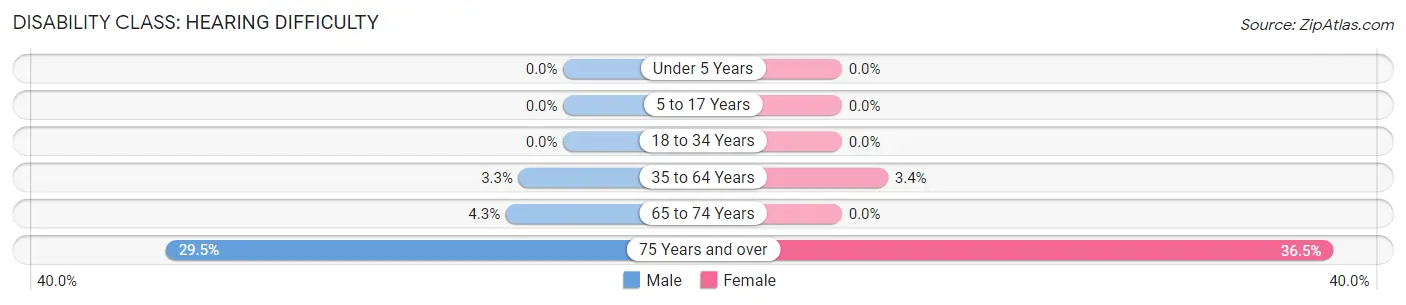
| Age Bracket | Male | Female |
| Under 5 Years | 0 (0.0%) | 0 (0.0%) |
| 5 to 17 Years | 0 (0.0%) | 0 (0.0%) |
| 18 to 34 Years | 0 (0.0%) | 0 (0.0%) |
| 35 to 64 Years | 32 (3.3%) | 32 (3.4%) |
| 65 to 74 Years | 13 (4.3%) | 0 (0.0%) |
| 75 Years and over | 49 (29.5%) | 58 (36.5%) |
Disability Class: Vision Difficulty
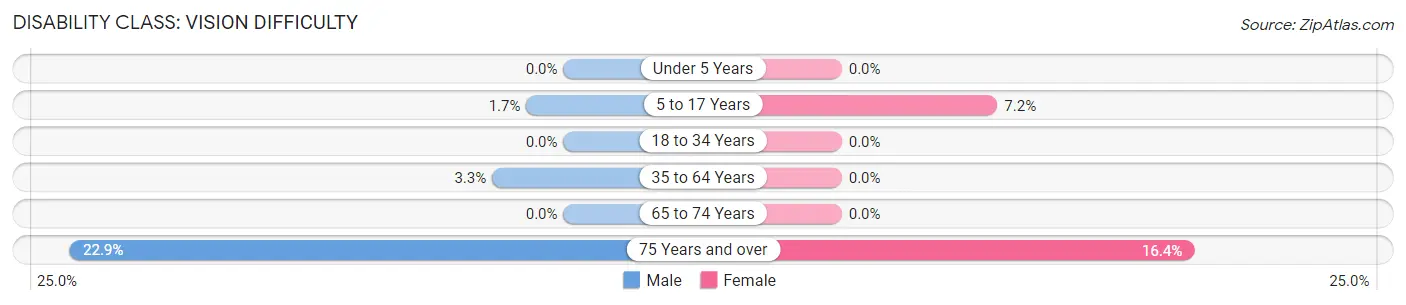
| Age Bracket | Male | Female |
| Under 5 Years | 0 (0.0%) | 0 (0.0%) |
| 5 to 17 Years | 9 (1.7%) | 27 (7.2%) |
| 18 to 34 Years | 0 (0.0%) | 0 (0.0%) |
| 35 to 64 Years | 32 (3.3%) | 0 (0.0%) |
| 65 to 74 Years | 0 (0.0%) | 0 (0.0%) |
| 75 Years and over | 38 (22.9%) | 26 (16.4%) |
Disability Class: Cognitive Difficulty
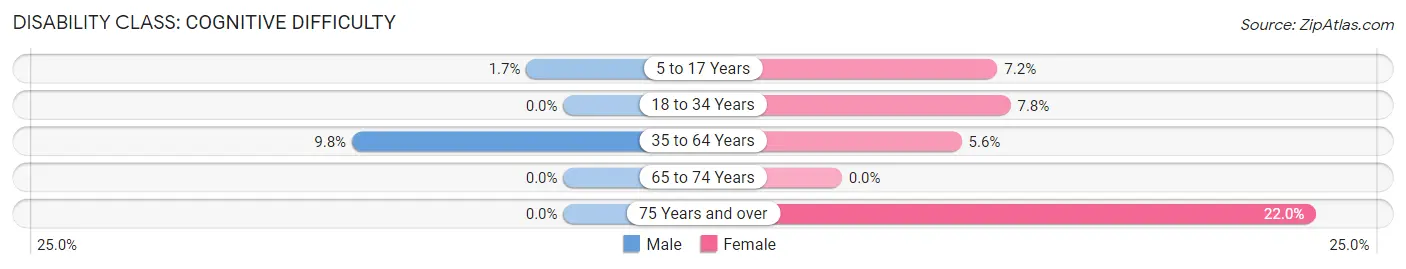
| Age Bracket | Male | Female |
| 5 to 17 Years | 9 (1.7%) | 27 (7.2%) |
| 18 to 34 Years | 0 (0.0%) | 31 (7.8%) |
| 35 to 64 Years | 95 (9.8%) | 52 (5.6%) |
| 65 to 74 Years | 0 (0.0%) | 0 (0.0%) |
| 75 Years and over | 0 (0.0%) | 35 (22.0%) |
Disability Class: Ambulatory Difficulty
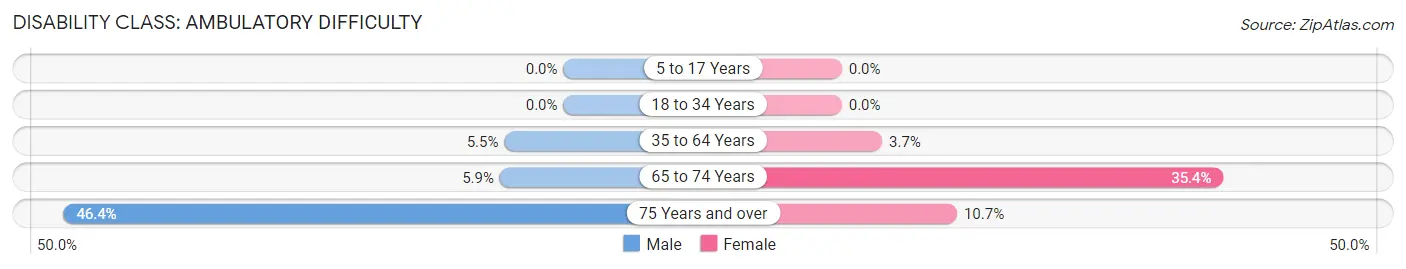
| Age Bracket | Male | Female |
| 5 to 17 Years | 0 (0.0%) | 0 (0.0%) |
| 18 to 34 Years | 0 (0.0%) | 0 (0.0%) |
| 35 to 64 Years | 53 (5.5%) | 35 (3.7%) |
| 65 to 74 Years | 18 (5.9%) | 91 (35.4%) |
| 75 Years and over | 77 (46.4%) | 17 (10.7%) |
Disability Class: Self-Care Difficulty
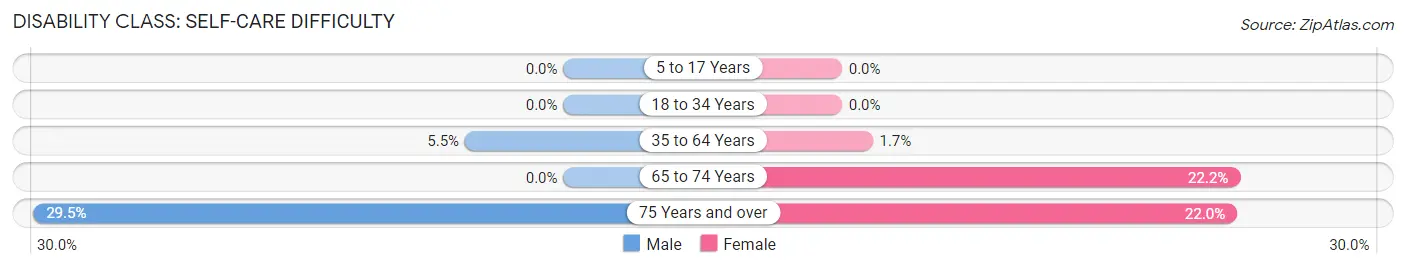
| Age Bracket | Male | Female |
| 5 to 17 Years | 0 (0.0%) | 0 (0.0%) |
| 18 to 34 Years | 0 (0.0%) | 0 (0.0%) |
| 35 to 64 Years | 53 (5.5%) | 16 (1.7%) |
| 65 to 74 Years | 0 (0.0%) | 57 (22.2%) |
| 75 Years and over | 49 (29.5%) | 35 (22.0%) |
Technology Access in Reidland
Computing Device Access in Reidland
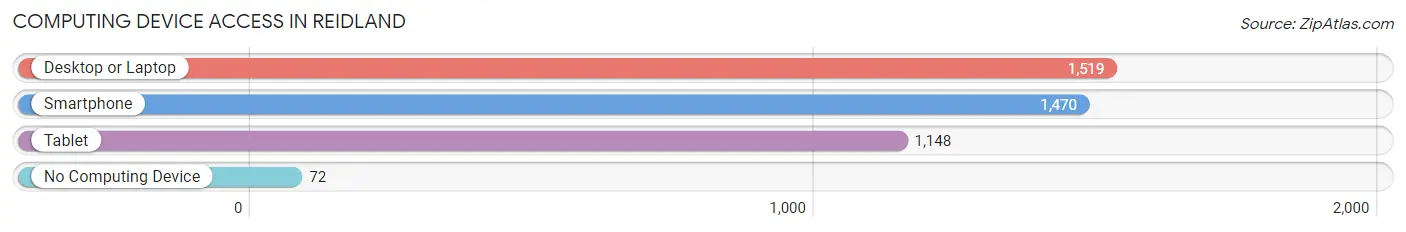
| Device Type | # Households | % Households |
| Desktop or Laptop | 1,519 | 88.9% |
| Smartphone | 1,470 | 86.0% |
| Tablet | 1,148 | 67.2% |
| No Computing Device | 72 | 4.2% |
| Total | 1,709 | 100.0% |
Internet Access in Reidland
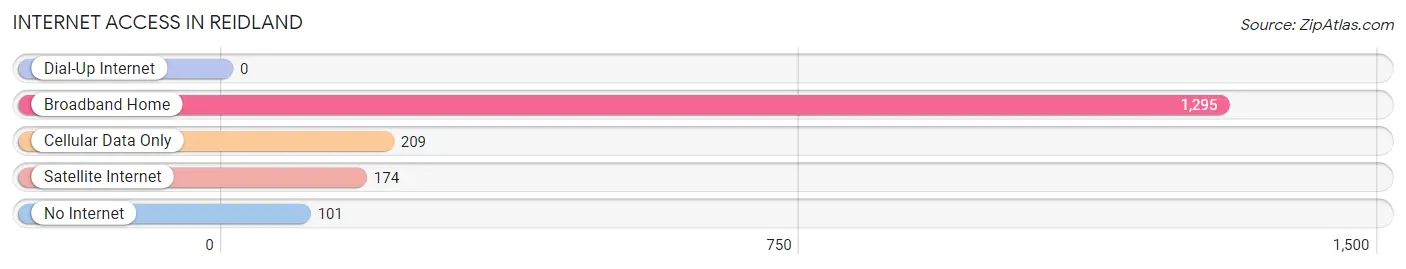
| Internet Type | # Households | % Households |
| Dial-Up Internet | 0 | 0.0% |
| Broadband Home | 1,295 | 75.8% |
| Cellular Data Only | 209 | 12.2% |
| Satellite Internet | 174 | 10.2% |
| No Internet | 101 | 5.9% |
| Total | 1,709 | 100.0% |
Reidland Summary
Reidland is a small unincorporated community located in McCracken County, Kentucky. It is situated along the banks of the Ohio River, just south of the city of Paducah. The community was founded in the late 19th century and has a population of approximately 1,000 people.
History
Reidland was founded in 1887 by William Reid, a former Confederate soldier. He purchased the land from the federal government and began to develop the area. He built a sawmill and a gristmill, and the community quickly grew. By the early 20th century, Reidland had become a thriving community with a post office, a general store, a school, and several churches.
In the 1920s, Reidland was a popular destination for tourists, who came to enjoy the area’s natural beauty and the nearby Ohio River. The community was also known for its annual Fourth of July celebration, which included a parade, fireworks, and a carnival.
In the 1950s, Reidland began to decline as the local economy shifted away from agriculture and manufacturing. The post office closed in the 1960s, and the school closed in the 1970s. Today, Reidland is a small, quiet community with a population of approximately 1,000 people.
Geography
Reidland is located in McCracken County, Kentucky, along the banks of the Ohio River. The community is situated just south of the city of Paducah, and is approximately 10 miles from the Kentucky-Illinois border.
The terrain in the area is mostly flat, with some rolling hills. The climate is humid subtropical, with hot, humid summers and mild winters. The average annual temperature is around 60 degrees Fahrenheit.
Economy
Reidland’s economy is largely based on agriculture and tourism. The area is home to several farms, which produce a variety of crops, including corn, soybeans, and wheat. The community is also a popular destination for tourists, who come to enjoy the area’s natural beauty and the nearby Ohio River.
In addition, Reidland is home to several small businesses, including a gas station, a convenience store, and a few restaurants. The community also has a few churches and a post office.
Demographics
As of the 2010 census, Reidland had a population of 1,000 people. The racial makeup of the community was 97.2% White, 0.7% African American, 0.3% Native American, 0.2% Asian, and 1.6% from other races.
The median household income in Reidland was $37,500, and the median family income was $41,250. The per capita income was $17,500. Approximately 10.3% of the population was below the poverty line.
Reidland is a small, quiet community with a rich history and a strong sense of community. The area is home to several farms and businesses, and is a popular destination for tourists. The community is also known for its annual Fourth of July celebration, which includes a parade, fireworks, and a carnival.
Common Questions
What is Per Capita Income in Reidland?
Per Capita income in Reidland is $35,257.
What is the Median Family Income in Reidland?
Median Family Income in Reidland is $98,684.
What is the Median Household income in Reidland?
Median Household Income in Reidland is $73,750.
What is Income or Wage Gap in Reidland?
Income or Wage Gap in Reidland is 10.9%.
Women in Reidland earn 89.1 cents for every dollar earned by a man.
What is Inequality or Gini Index in Reidland?
Inequality or Gini Index in Reidland is 0.40.
What is the Total Population of Reidland?
Total Population of Reidland is 4,647.
What is the Total Male Population of Reidland?
Total Male Population of Reidland is 2,365.
What is the Total Female Population of Reidland?
Total Female Population of Reidland is 2,282.
What is the Ratio of Males per 100 Females in Reidland?
There are 103.64 Males per 100 Females in Reidland.
What is the Ratio of Females per 100 Males in Reidland?
There are 96.49 Females per 100 Males in Reidland.
What is the Median Population Age in Reidland?
Median Population Age in Reidland is 42.6 Years.
What is the Average Family Size in Reidland
Average Family Size in Reidland is 3.4 People.
What is the Average Household Size in Reidland
Average Household Size in Reidland is 2.7 People.
How Large is the Labor Force in Reidland?
There are 2,384 People in the Labor Forcein in Reidland.
What is the Percentage of People in the Labor Force in Reidland?
63.5% of People are in the Labor Force in Reidland.
What is the Unemployment Rate in Reidland?
Unemployment Rate in Reidland is 5.1%.