Lakeview Heights, KY Map & Demographics
Lakeview Heights Map
Lakeview Heights Overview
$34,124
PER CAPITA INCOME
$83,000
AVG FAMILY INCOME
$76,964
AVG HOUSEHOLD INCOME
27.8%
WAGE / INCOME GAP [ % ]
72.2¢/ $1
WAGE / INCOME GAP [ $ ]
0.32
INEQUALITY / GINI INDEX
356
TOTAL POPULATION
140
MALE POPULATION
216
FEMALE POPULATION
64.81
MALES / 100 FEMALES
154.29
FEMALES / 100 MALES
52.7
MEDIAN AGE
3.2
AVG FAMILY SIZE
2.9
AVG HOUSEHOLD SIZE
140
LABOR FORCE [ PEOPLE ]
46.2%
PERCENT IN LABOR FORCE
2.9%
UNEMPLOYMENT RATE
Lakeview Heights Area Codes
Income in Lakeview Heights
Income Overview in Lakeview Heights
Per Capita Income in Lakeview Heights is $34,124, while median incomes of families and households are $83,000 and $76,964 respectively.
| Characteristic | Number | Measure |
| Per Capita Income | 356 | $34,124 |
| Median Family Income | 102 | $83,000 |
| Mean Family Income | 102 | $93,498 |
| Median Household Income | 123 | $76,964 |
| Mean Household Income | 123 | $90,098 |
| Income Deficit | 102 | $0 |
| Wage / Income Gap (%) | 356 | 27.78% |
| Wage / Income Gap ($) | 356 | 72.22¢ per $1 |
| Gini / Inequality Index | 356 | 0.32 |
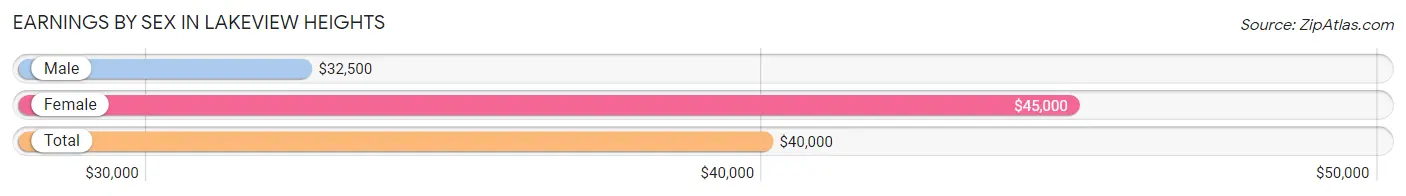
Earnings by Sex in Lakeview Heights
Average Earnings in Lakeview Heights are $40,000, $32,500 for men and $45,000 for women, a difference of 27.8%.
| Sex | Number | Average Earnings |
| Male | 74 (47.4%) | $32,500 |
| Female | 82 (52.6%) | $45,000 |
| Total | 156 (100.0%) | $40,000 |
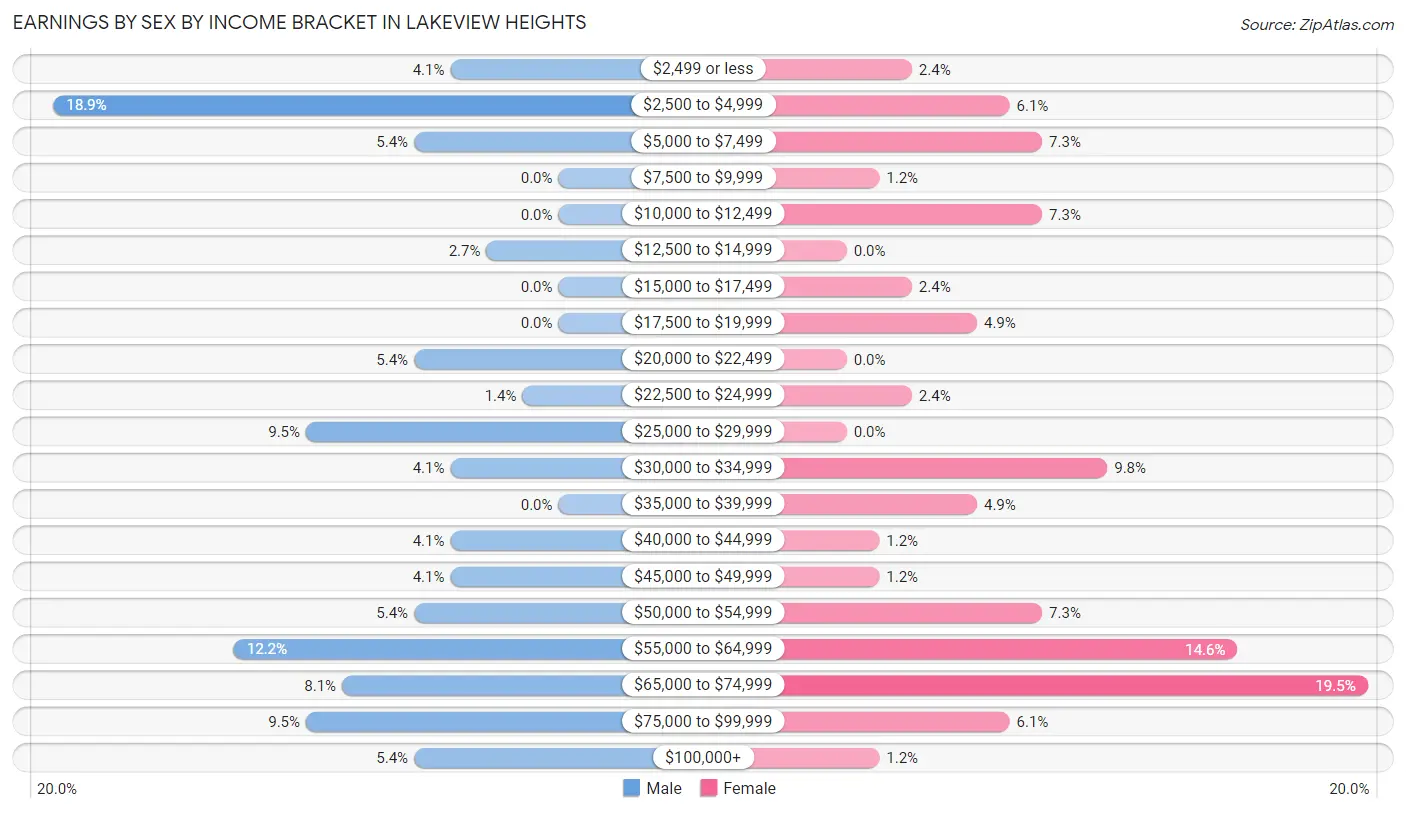
Earnings by Sex by Income Bracket in Lakeview Heights
The most common earnings brackets in Lakeview Heights are $2,500 to $4,999 for men (14 | 18.9%) and $65,000 to $74,999 for women (16 | 19.5%).
| Income | Male | Female |
| $2,499 or less | 3 (4.1%) | 2 (2.4%) |
| $2,500 to $4,999 | 14 (18.9%) | 5 (6.1%) |
| $5,000 to $7,499 | 4 (5.4%) | 6 (7.3%) |
| $7,500 to $9,999 | 0 (0.0%) | 1 (1.2%) |
| $10,000 to $12,499 | 0 (0.0%) | 6 (7.3%) |
| $12,500 to $14,999 | 2 (2.7%) | 0 (0.0%) |
| $15,000 to $17,499 | 0 (0.0%) | 2 (2.4%) |
| $17,500 to $19,999 | 0 (0.0%) | 4 (4.9%) |
| $20,000 to $22,499 | 4 (5.4%) | 0 (0.0%) |
| $22,500 to $24,999 | 1 (1.3%) | 2 (2.4%) |
| $25,000 to $29,999 | 7 (9.5%) | 0 (0.0%) |
| $30,000 to $34,999 | 3 (4.1%) | 8 (9.8%) |
| $35,000 to $39,999 | 0 (0.0%) | 4 (4.9%) |
| $40,000 to $44,999 | 3 (4.1%) | 1 (1.2%) |
| $45,000 to $49,999 | 3 (4.1%) | 1 (1.2%) |
| $50,000 to $54,999 | 4 (5.4%) | 6 (7.3%) |
| $55,000 to $64,999 | 9 (12.2%) | 12 (14.6%) |
| $65,000 to $74,999 | 6 (8.1%) | 16 (19.5%) |
| $75,000 to $99,999 | 7 (9.5%) | 5 (6.1%) |
| $100,000+ | 4 (5.4%) | 1 (1.2%) |
| Total | 74 (100.0%) | 82 (100.0%) |
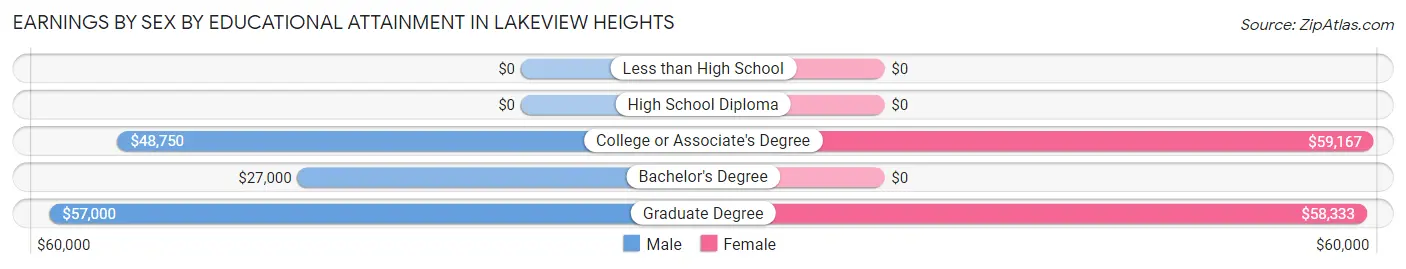
Earnings by Sex by Educational Attainment in Lakeview Heights
Average earnings in Lakeview Heights are $54,375 for men and $54,063 for women, a difference of 0.6%. Men with an educational attainment of graduate degree enjoy the highest average annual earnings of $57,000, while those with bachelor's degree education earn the least with $27,000. Women with an educational attainment of college or associate's degree earn the most with the average annual earnings of $59,167, while those with graduate degree education have the smallest earnings of $58,333.
| Educational Attainment | Male Income | Female Income |
| Less than High School | - | - |
| High School Diploma | - | - |
| College or Associate's Degree | $48,750 | $59,167 |
| Bachelor's Degree | $27,000 | $0 |
| Graduate Degree | $57,000 | $58,333 |
| Total | $54,375 | $54,063 |
Family Income in Lakeview Heights
Family Income Brackets in Lakeview Heights
According to the Lakeview Heights family income data, there are 30 families falling into the $35,000 to $49,999 income range, which is the most common income bracket and makes up 29.4% of all families.
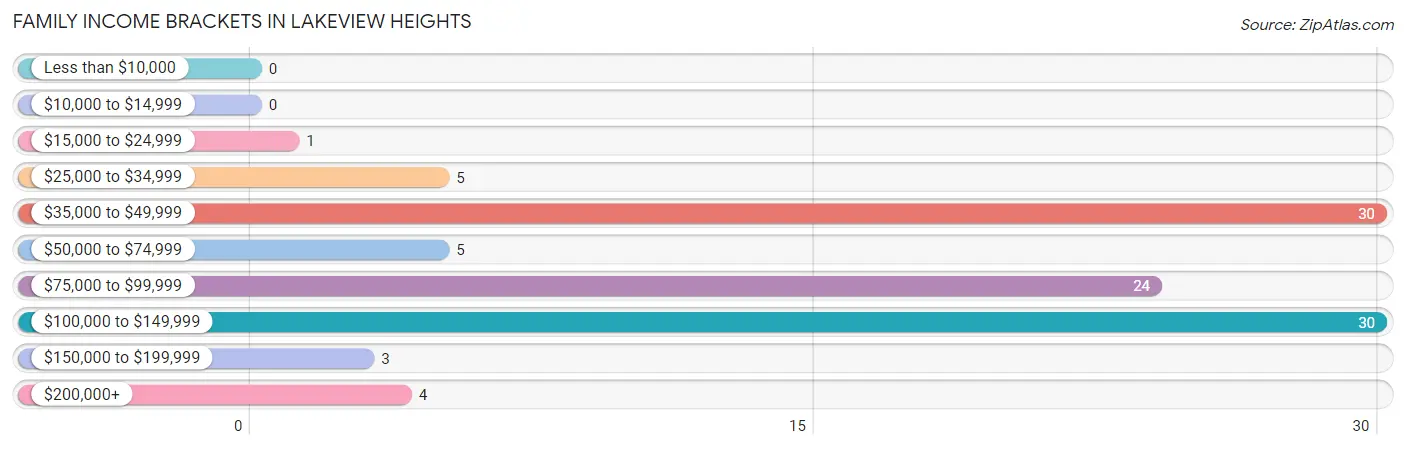
| Income Bracket | # Families | % Families |
| Less than $10,000 | 0 | 0.0% |
| $10,000 to $14,999 | 0 | 0.0% |
| $15,000 to $24,999 | 1 | 1.0% |
| $25,000 to $34,999 | 5 | 4.9% |
| $35,000 to $49,999 | 30 | 29.4% |
| $50,000 to $74,999 | 5 | 4.9% |
| $75,000 to $99,999 | 24 | 23.5% |
| $100,000 to $149,999 | 30 | 29.4% |
| $150,000 to $199,999 | 3 | 2.9% |
| $200,000+ | 4 | 3.9% |
Family Income by Famaliy Size in Lakeview Heights
4-person families (12 | 11.8%) account for the highest median family income in Lakeview Heights with $125,833 per family, while 2-person families (64 | 62.7%) have the highest median income of $38,125 per family member.
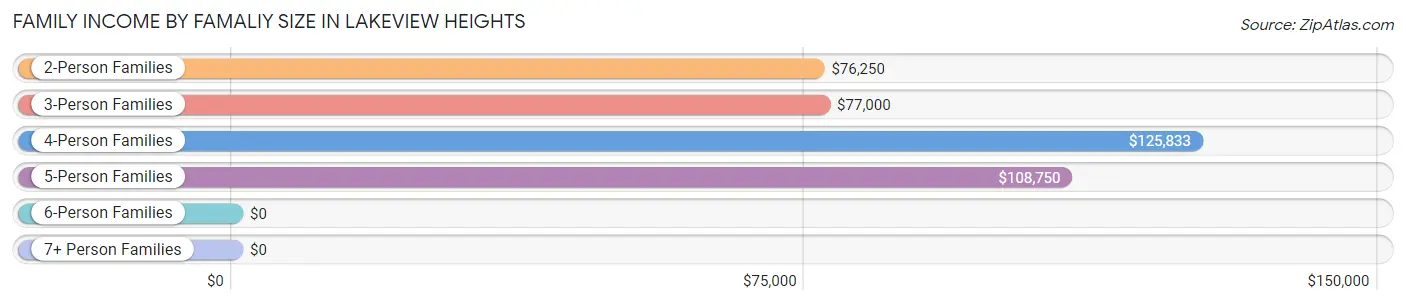
| Income Bracket | # Families | Median Income |
| 2-Person Families | 64 (62.7%) | $76,250 |
| 3-Person Families | 20 (19.6%) | $77,000 |
| 4-Person Families | 12 (11.8%) | $125,833 |
| 5-Person Families | 4 (3.9%) | $108,750 |
| 6-Person Families | 2 (2.0%) | $0 |
| 7+ Person Families | 0 (0.0%) | $0 |
| Total | 102 (100.0%) | $83,000 |
Family Income by Number of Earners in Lakeview Heights
The median family income in Lakeview Heights is $83,000, with families comprising 3+ earners (11) having the highest median family income of $178,750, while families with no earners (36) have the lowest median family income of $46,574, accounting for 10.8% and 35.3% of families, respectively.
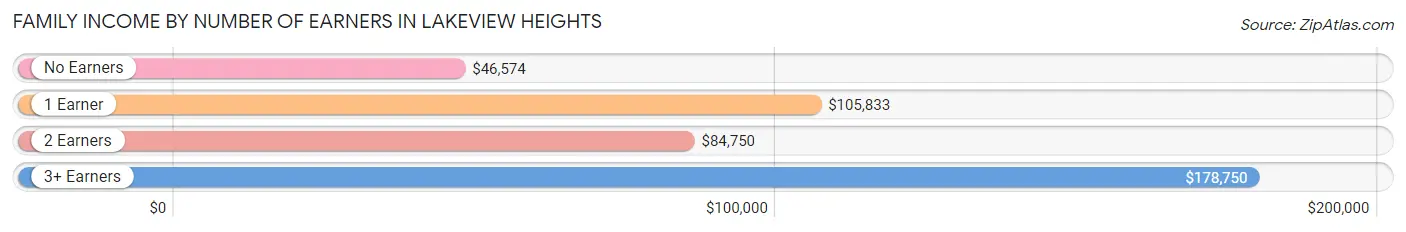
| Number of Earners | # Families | Median Income |
| No Earners | 36 (35.3%) | $46,574 |
| 1 Earner | 14 (13.7%) | $105,833 |
| 2 Earners | 41 (40.2%) | $84,750 |
| 3+ Earners | 11 (10.8%) | $178,750 |
| Total | 102 (100.0%) | $83,000 |
Household Income in Lakeview Heights
Household Income Brackets in Lakeview Heights
With 32 households falling in the category, the $35,000 to $49,999 income range is the most frequent in Lakeview Heights, accounting for 26.0% of all households.
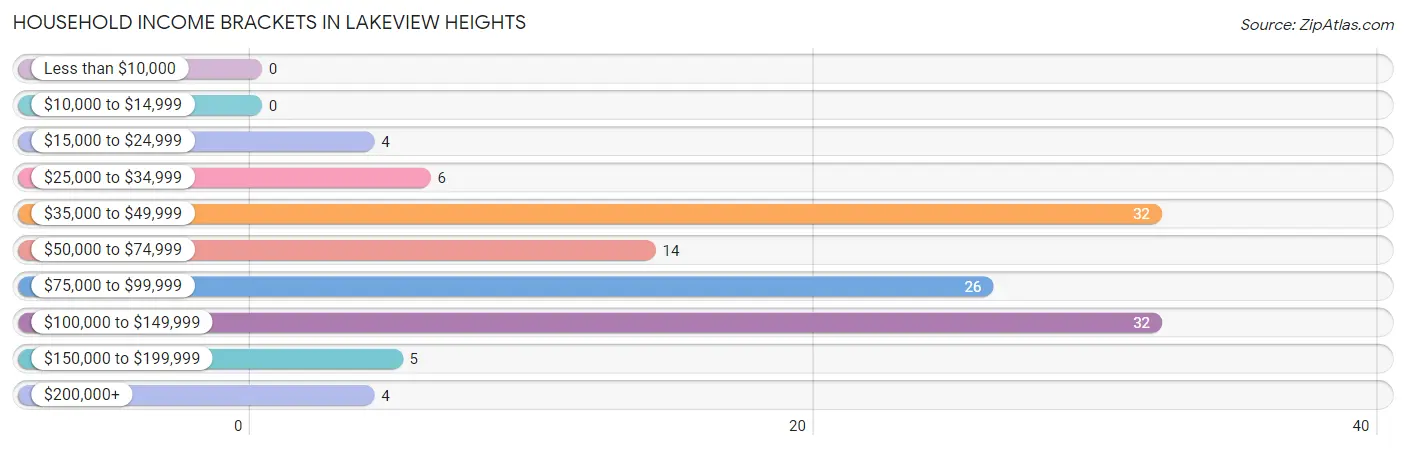
| Income Bracket | # Households | % Households |
| Less than $10,000 | 0 | 0.0% |
| $10,000 to $14,999 | 0 | 0.0% |
| $15,000 to $24,999 | 4 | 3.3% |
| $25,000 to $34,999 | 6 | 4.9% |
| $35,000 to $49,999 | 32 | 26.0% |
| $50,000 to $74,999 | 14 | 11.4% |
| $75,000 to $99,999 | 26 | 21.1% |
| $100,000 to $149,999 | 32 | 26.0% |
| $150,000 to $199,999 | 5 | 4.1% |
| $200,000+ | 4 | 3.3% |
Household Income by Householder Age in Lakeview Heights
The median household income in Lakeview Heights is $76,964, with the highest median household income of $94,688 found in the 45 to 64 years age bracket for the primary householder. A total of 37 households (30.1%) fall into this category. Meanwhile, the 15 to 24 years age bracket for the primary householder has the lowest median household income of $0, with 5 households (4.1%) in this group.
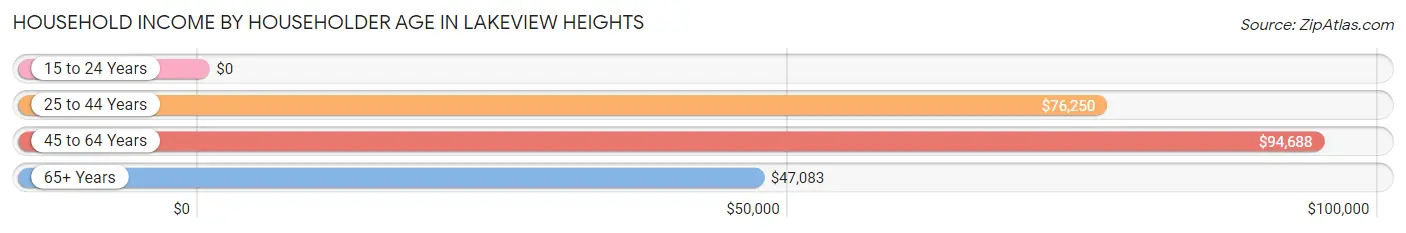
| Income Bracket | # Households | Median Income |
| 15 to 24 Years | 5 (4.1%) | $0 |
| 25 to 44 Years | 22 (17.9%) | $76,250 |
| 45 to 64 Years | 37 (30.1%) | $94,688 |
| 65+ Years | 59 (48.0%) | $47,083 |
| Total | 123 (100.0%) | $76,964 |
Poverty in Lakeview Heights
Income Below Poverty by Sex and Age in Lakeview Heights
With 0.7% poverty level for males and 2.3% for females among the residents of Lakeview Heights, 75 year old and over males and 55 to 64 year old females are the most vulnerable to poverty, with 1 males (14.3%) and 3 females (23.1%) in their respective age groups living below the poverty level.
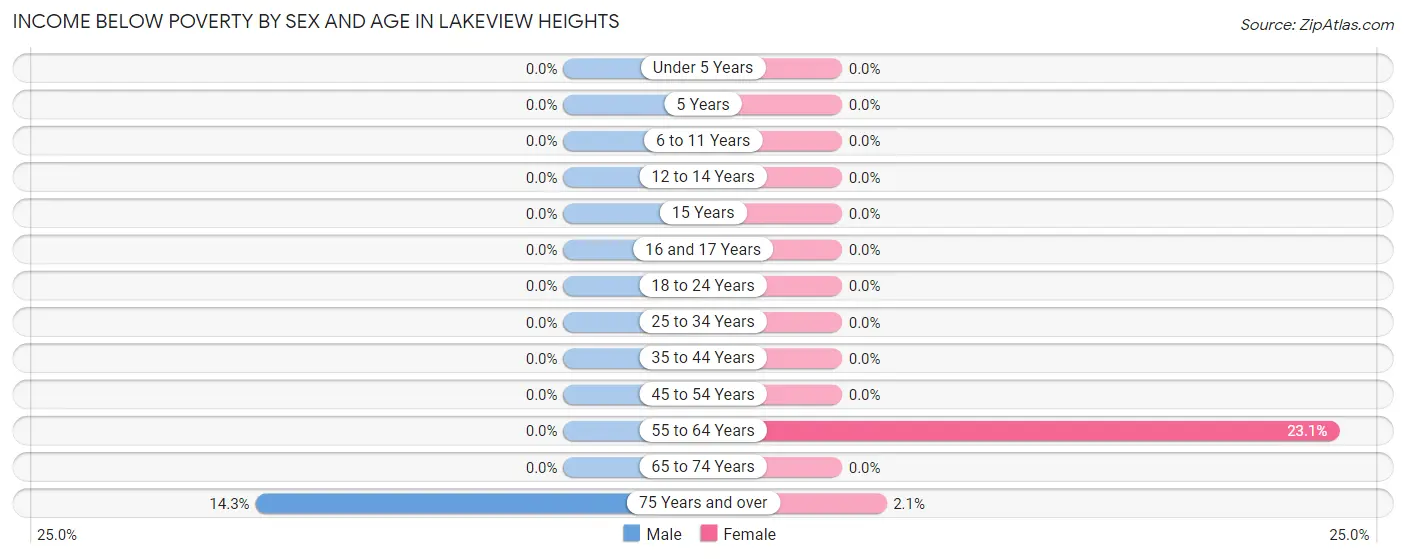
| Age Bracket | Male | Female |
| Under 5 Years | 0 (0.0%) | 0 (0.0%) |
| 5 Years | 0 (0.0%) | 0 (0.0%) |
| 6 to 11 Years | 0 (0.0%) | 0 (0.0%) |
| 12 to 14 Years | 0 (0.0%) | 0 (0.0%) |
| 15 Years | 0 (0.0%) | 0 (0.0%) |
| 16 and 17 Years | 0 (0.0%) | 0 (0.0%) |
| 18 to 24 Years | 0 (0.0%) | 0 (0.0%) |
| 25 to 34 Years | 0 (0.0%) | 0 (0.0%) |
| 35 to 44 Years | 0 (0.0%) | 0 (0.0%) |
| 45 to 54 Years | 0 (0.0%) | 0 (0.0%) |
| 55 to 64 Years | 0 (0.0%) | 3 (23.1%) |
| 65 to 74 Years | 0 (0.0%) | 0 (0.0%) |
| 75 Years and over | 1 (14.3%) | 2 (2.1%) |
| Total | 1 (0.7%) | 5 (2.3%) |
Income Above Poverty by Sex and Age in Lakeview Heights
According to the poverty statistics in Lakeview Heights, males aged under 5 years and females aged under 5 years are the age groups that are most secure financially, with 100.0% of males and 100.0% of females in these age groups living above the poverty line.
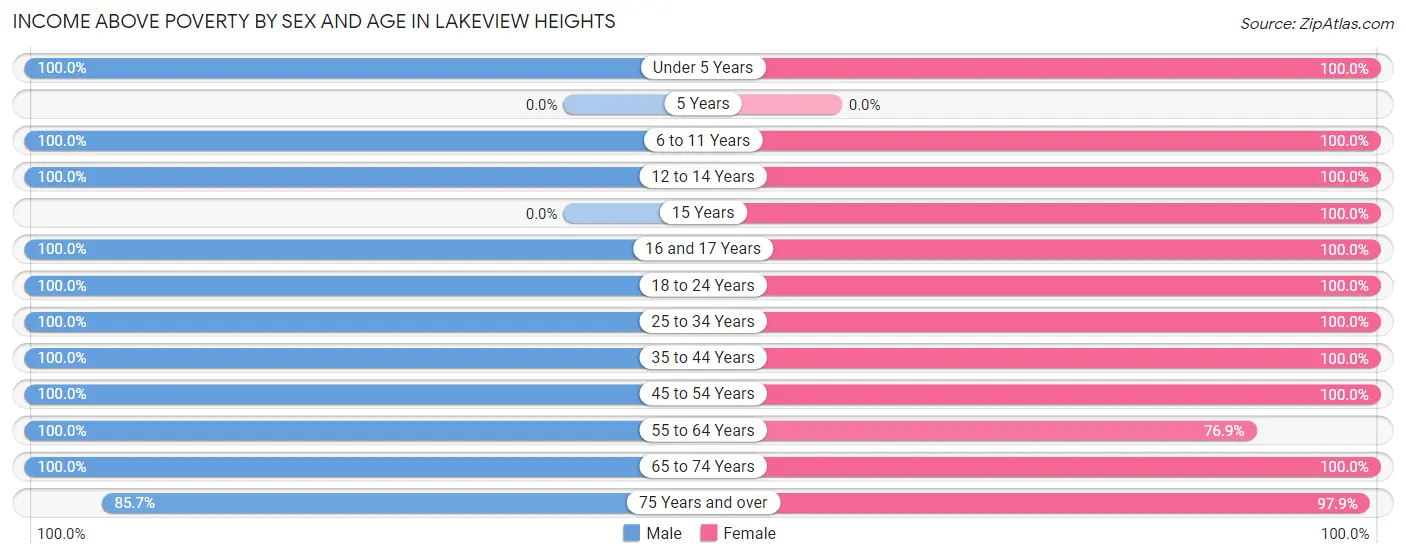
| Age Bracket | Male | Female |
| Under 5 Years | 9 (100.0%) | 5 (100.0%) |
| 5 Years | 0 (0.0%) | 0 (0.0%) |
| 6 to 11 Years | 23 (100.0%) | 2 (100.0%) |
| 12 to 14 Years | 8 (100.0%) | 4 (100.0%) |
| 15 Years | 0 (0.0%) | 2 (100.0%) |
| 16 and 17 Years | 5 (100.0%) | 9 (100.0%) |
| 18 to 24 Years | 18 (100.0%) | 19 (100.0%) |
| 25 to 34 Years | 13 (100.0%) | 9 (100.0%) |
| 35 to 44 Years | 8 (100.0%) | 15 (100.0%) |
| 45 to 54 Years | 12 (100.0%) | 24 (100.0%) |
| 55 to 64 Years | 19 (100.0%) | 10 (76.9%) |
| 65 to 74 Years | 18 (100.0%) | 17 (100.0%) |
| 75 Years and over | 6 (85.7%) | 95 (97.9%) |
| Total | 139 (99.3%) | 211 (97.7%) |
Income Below Poverty Among Married-Couple Families in Lakeview Heights
The poverty statistics for married-couple families in Lakeview Heights show that 1.5% or 1 of the total 66 families live below the poverty line. Families with no children have the highest poverty rate of 2.9%, comprising of 1 families. On the other hand, families with 1 or 2 children have the lowest poverty rate of 0.0%, which includes 0 families.
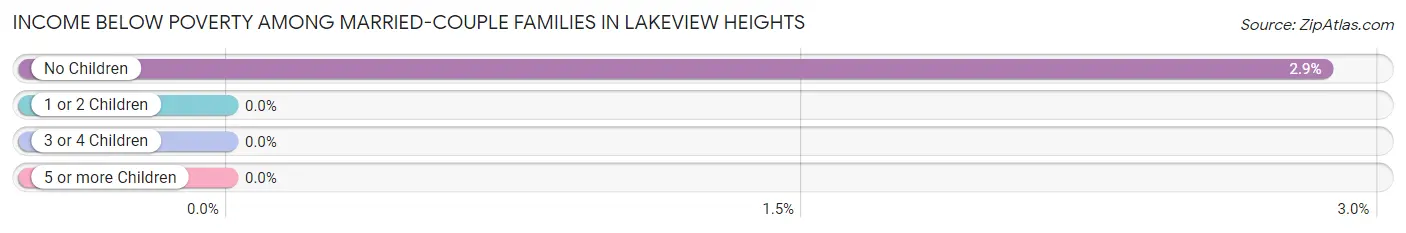
| Children | Above Poverty | Below Poverty |
| No Children | 34 (97.1%) | 1 (2.9%) |
| 1 or 2 Children | 30 (100.0%) | 0 (0.0%) |
| 3 or 4 Children | 1 (100.0%) | 0 (0.0%) |
| 5 or more Children | 0 (0.0%) | 0 (0.0%) |
| Total | 65 (98.5%) | 1 (1.5%) |
Income Below Poverty Among Single-Parent Households in Lakeview Heights
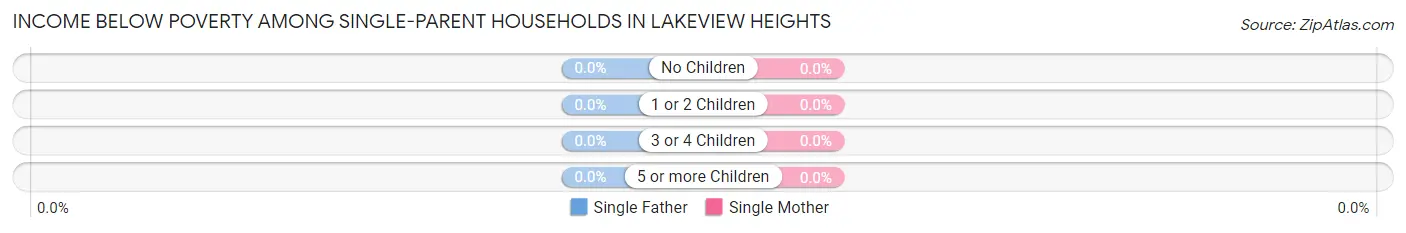
| Children | Single Father | Single Mother |
| No Children | 0 (0.0%) | 0 (0.0%) |
| 1 or 2 Children | 0 (0.0%) | 0 (0.0%) |
| 3 or 4 Children | 0 (0.0%) | 0 (0.0%) |
| 5 or more Children | 0 (0.0%) | 0 (0.0%) |
| Total | 0 (0.0%) | 0 (0.0%) |
Income Below Poverty Among Married-Couple vs Single-Parent Households in Lakeview Heights
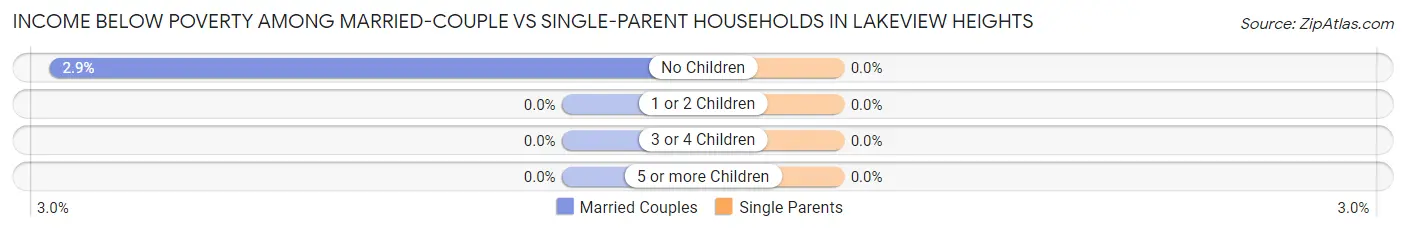
| Children | Married-Couple Families | Single-Parent Households |
| No Children | 1 (2.9%) | 0 (0.0%) |
| 1 or 2 Children | 0 (0.0%) | 0 (0.0%) |
| 3 or 4 Children | 0 (0.0%) | 0 (0.0%) |
| 5 or more Children | 0 (0.0%) | 0 (0.0%) |
| Total | 1 (1.5%) | 0 (0.0%) |
Race in Lakeview Heights
The most populous races in Lakeview Heights are White / Caucasian (336 | 94.4%), Two or more Races (16 | 4.5%), and Hispanic or Latino (5 | 1.4%).
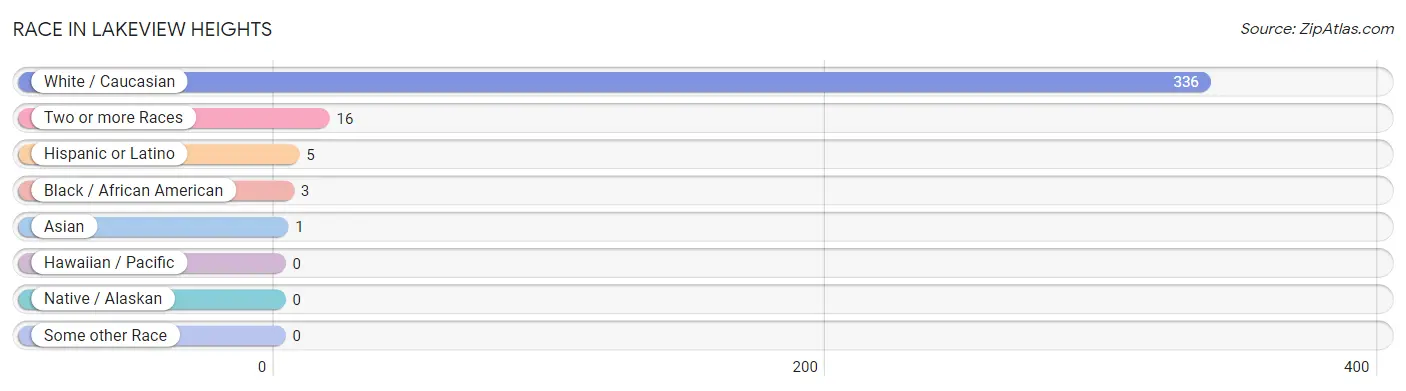
| Race | # Population | % Population |
| Asian | 1 | 0.3% |
| Black / African American | 3 | 0.8% |
| Hawaiian / Pacific | 0 | 0.0% |
| Hispanic or Latino | 5 | 1.4% |
| Native / Alaskan | 0 | 0.0% |
| White / Caucasian | 336 | 94.4% |
| Two or more Races | 16 | 4.5% |
| Some other Race | 0 | 0.0% |
| Total | 356 | 100.0% |
Ancestry in Lakeview Heights
The most populous ancestries reported in Lakeview Heights are American (116 | 32.6%), English (64 | 18.0%), Irish (51 | 14.3%), German (49 | 13.8%), and Scotch-Irish (16 | 4.5%), together accounting for 83.1% of all Lakeview Heights residents.
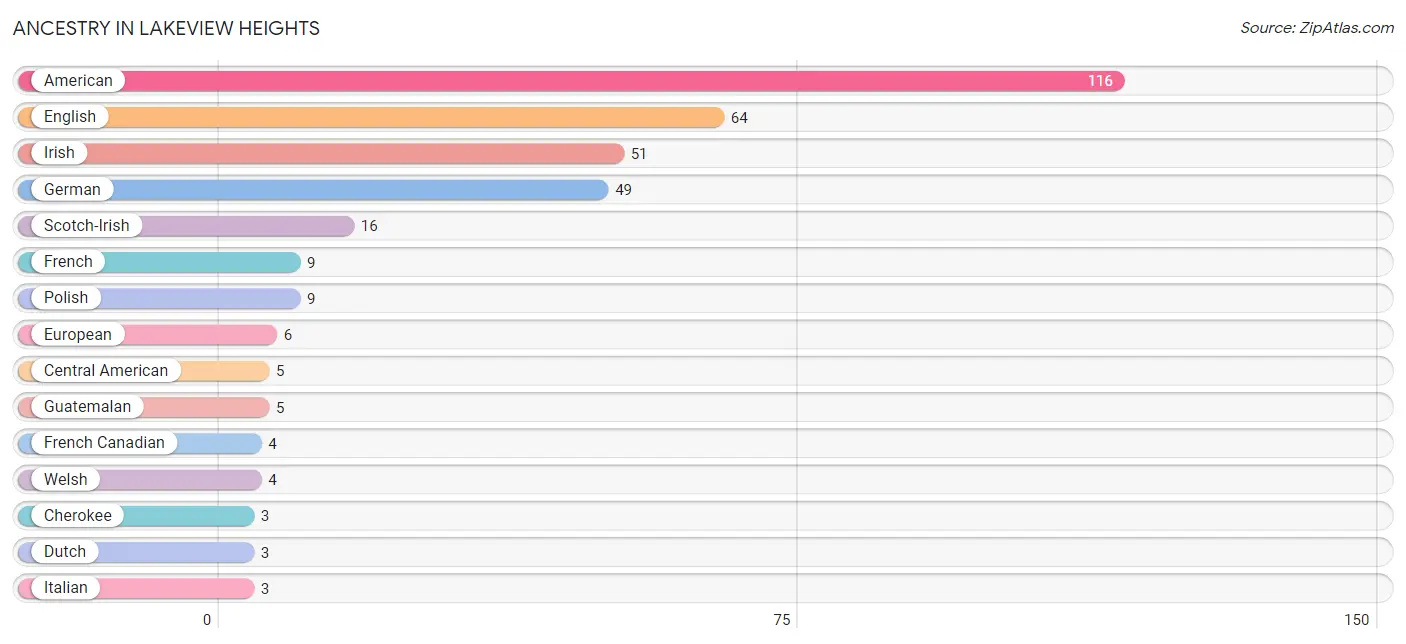
| Ancestry | # Population | % Population |
| American | 116 | 32.6% |
| Central American | 5 | 1.4% |
| Cherokee | 3 | 0.8% |
| Dutch | 3 | 0.8% |
| English | 64 | 18.0% |
| European | 6 | 1.7% |
| French | 9 | 2.5% |
| French Canadian | 4 | 1.1% |
| German | 49 | 13.8% |
| Guatemalan | 5 | 1.4% |
| Indian (Asian) | 1 | 0.3% |
| Irish | 51 | 14.3% |
| Italian | 3 | 0.8% |
| Norwegian | 1 | 0.3% |
| Polish | 9 | 2.5% |
| Portuguese | 2 | 0.6% |
| Scotch-Irish | 16 | 4.5% |
| Scottish | 2 | 0.6% |
| Swedish | 1 | 0.3% |
| Welsh | 4 | 1.1% | View All 20 Rows |
Immigrants in Lakeview Heights

| Immigration Origin | # Population | % Population | View All 0 Rows |
Sex and Age in Lakeview Heights
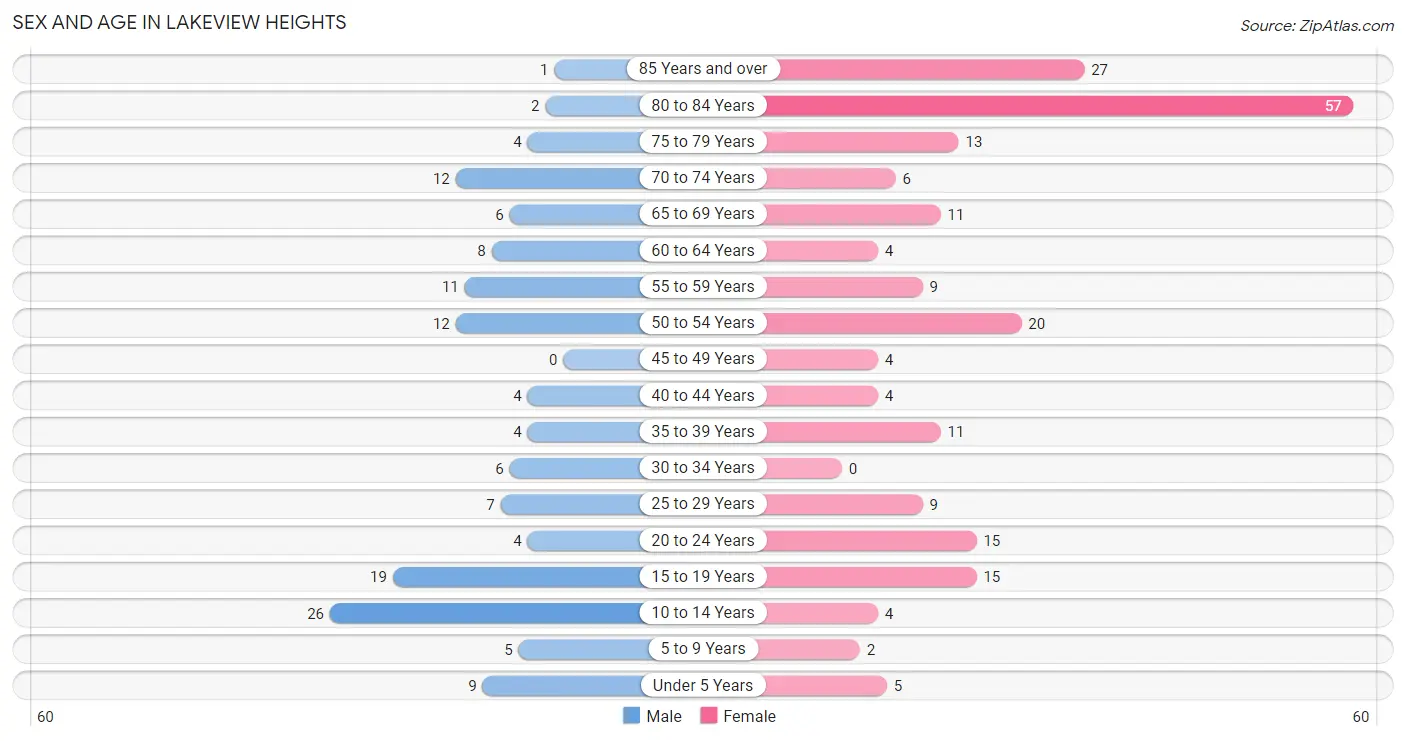
Sex and Age in Lakeview Heights
The most populous age groups in Lakeview Heights are 10 to 14 Years (26 | 18.6%) for men and 80 to 84 Years (57 | 26.4%) for women.
| Age Bracket | Male | Female |
| Under 5 Years | 9 (6.4%) | 5 (2.3%) |
| 5 to 9 Years | 5 (3.6%) | 2 (0.9%) |
| 10 to 14 Years | 26 (18.6%) | 4 (1.8%) |
| 15 to 19 Years | 19 (13.6%) | 15 (6.9%) |
| 20 to 24 Years | 4 (2.9%) | 15 (6.9%) |
| 25 to 29 Years | 7 (5.0%) | 9 (4.2%) |
| 30 to 34 Years | 6 (4.3%) | 0 (0.0%) |
| 35 to 39 Years | 4 (2.9%) | 11 (5.1%) |
| 40 to 44 Years | 4 (2.9%) | 4 (1.8%) |
| 45 to 49 Years | 0 (0.0%) | 4 (1.8%) |
| 50 to 54 Years | 12 (8.6%) | 20 (9.3%) |
| 55 to 59 Years | 11 (7.9%) | 9 (4.2%) |
| 60 to 64 Years | 8 (5.7%) | 4 (1.8%) |
| 65 to 69 Years | 6 (4.3%) | 11 (5.1%) |
| 70 to 74 Years | 12 (8.6%) | 6 (2.8%) |
| 75 to 79 Years | 4 (2.9%) | 13 (6.0%) |
| 80 to 84 Years | 2 (1.4%) | 57 (26.4%) |
| 85 Years and over | 1 (0.7%) | 27 (12.5%) |
| Total | 140 (100.0%) | 216 (100.0%) |
Families and Households in Lakeview Heights
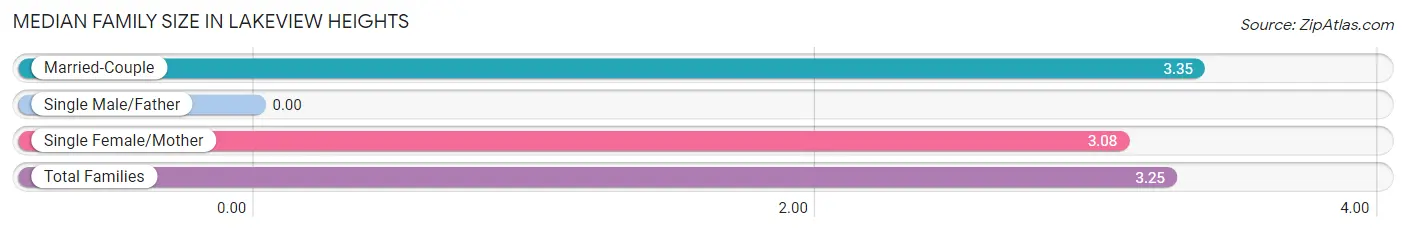
Median Family Size in Lakeview Heights
| Family Type | # Families | Family Size |
| Married-Couple | 66 (64.7%) | 3.35 |
| Single Male/Father | 0 (0.0%) | - |
| Single Female/Mother | 36 (35.3%) | 3.08 |
| Total Families | 102 (100.0%) | 3.25 |
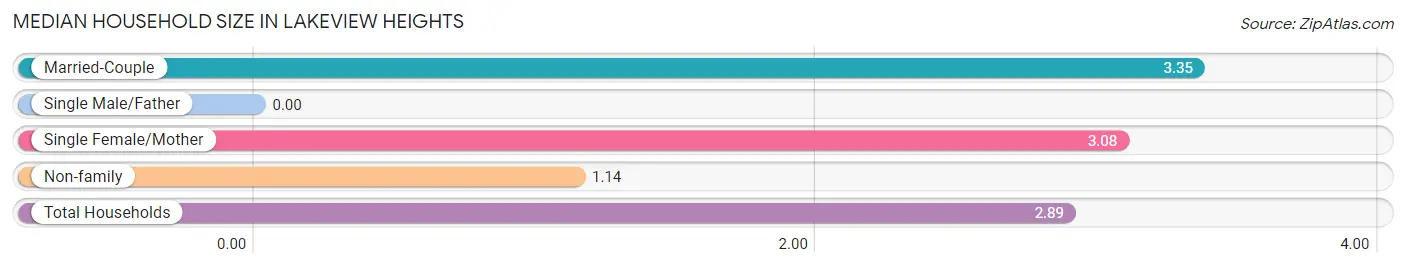
Median Household Size in Lakeview Heights
| Household Type | # Households | Household Size |
| Married-Couple | 66 (53.7%) | 3.35 |
| Single Male/Father | 0 (0.0%) | - |
| Single Female/Mother | 36 (29.3%) | 3.08 |
| Non-family | 21 (17.1%) | 1.14 |
| Total Households | 123 (100.0%) | 2.89 |
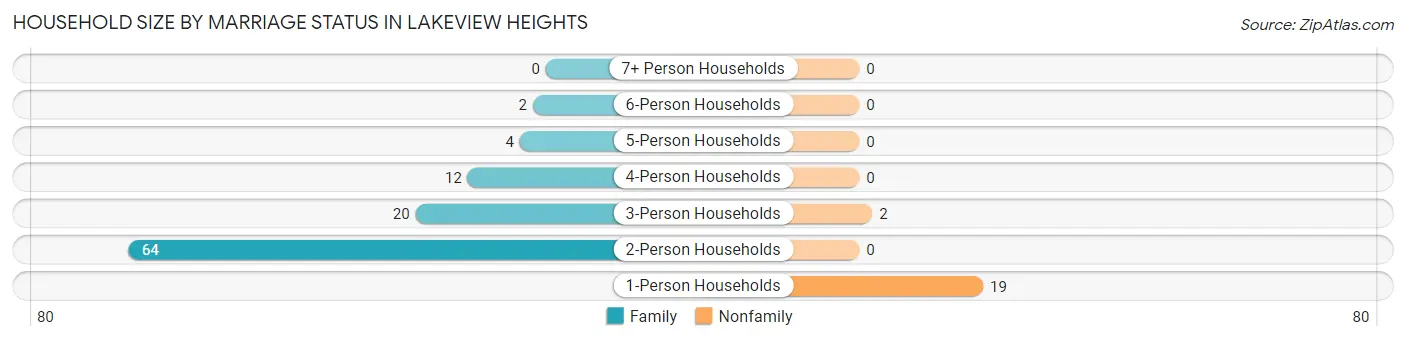
Household Size by Marriage Status in Lakeview Heights
Out of a total of 123 households in Lakeview Heights, 102 (82.9%) are family households, while 21 (17.1%) are nonfamily households. The most numerous type of family households are 2-person households, comprising 64, and the most common type of nonfamily households are 1-person households, comprising 19.
| Household Size | Family Households | Nonfamily Households |
| 1-Person Households | - | 19 (15.4%) |
| 2-Person Households | 64 (52.0%) | 0 (0.0%) |
| 3-Person Households | 20 (16.3%) | 2 (1.6%) |
| 4-Person Households | 12 (9.8%) | 0 (0.0%) |
| 5-Person Households | 4 (3.3%) | 0 (0.0%) |
| 6-Person Households | 2 (1.6%) | 0 (0.0%) |
| 7+ Person Households | 0 (0.0%) | 0 (0.0%) |
| Total | 102 (82.9%) | 21 (17.1%) |
Female Fertility in Lakeview Heights
Fertility by Age in Lakeview Heights
Average fertility rate in Lakeview Heights is 177.0 births per 1,000 women. Women in the age bracket of 20 to 34 years have the highest fertility rate with 417.0 births per 1,000 women. Women in the age bracket of 20 to 34 years acount for 90.9% of all women with births.
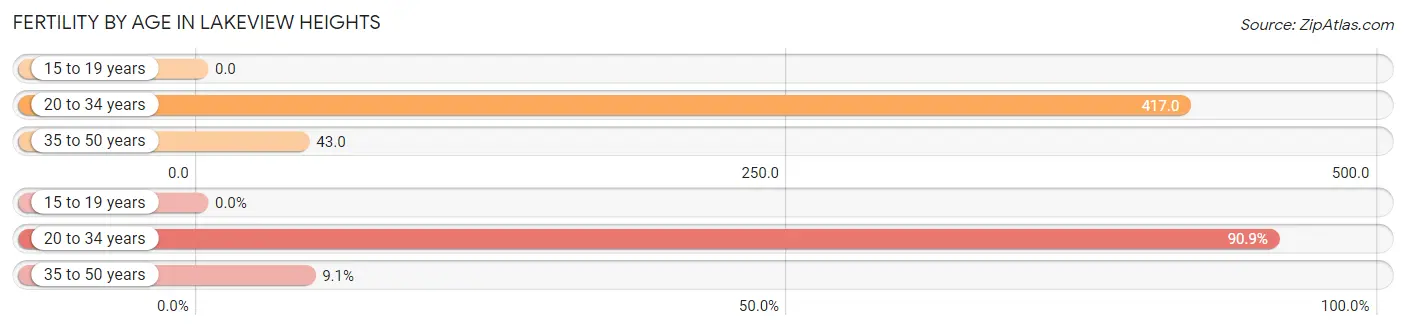
| Age Bracket | Women with Births | Births / 1,000 Women |
| 15 to 19 years | 0 (0.0%) | 0.0 |
| 20 to 34 years | 10 (90.9%) | 417.0 |
| 35 to 50 years | 1 (9.1%) | 43.0 |
| Total | 11 (100.0%) | 177.0 |
Fertility by Age by Marriage Status in Lakeview Heights
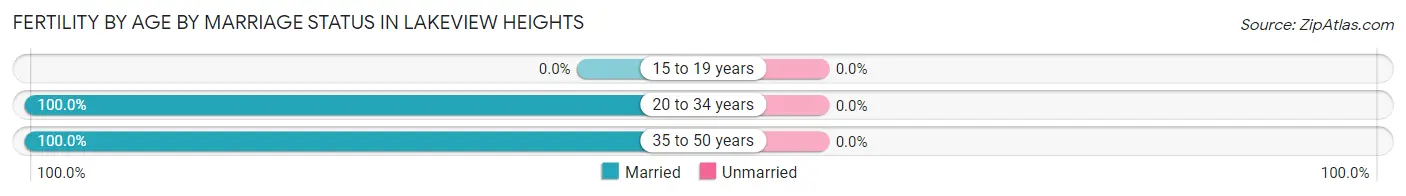
| Age Bracket | Married | Unmarried |
| 15 to 19 years | 0 (0.0%) | 0 (0.0%) |
| 20 to 34 years | 10 (100.0%) | 0 (0.0%) |
| 35 to 50 years | 1 (100.0%) | 0 (0.0%) |
| Total | 11 (100.0%) | 0 (0.0%) |
Fertility by Education in Lakeview Heights
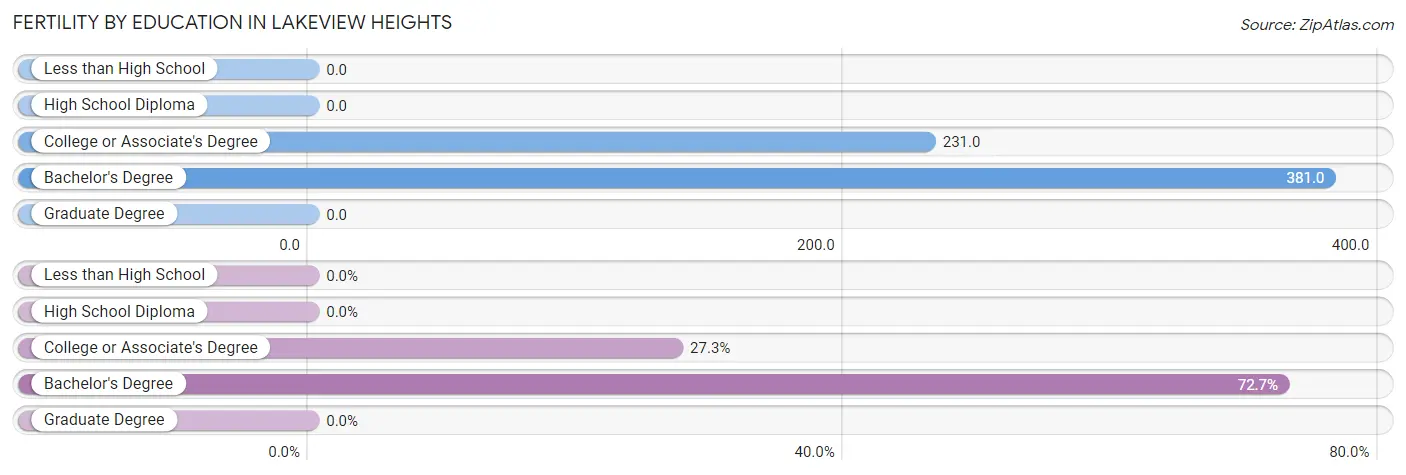
| Educational Attainment | Women with Births | Births / 1,000 Women |
| Less than High School | 0 (0.0%) | 0.0 |
| High School Diploma | 0 (0.0%) | 0.0 |
| College or Associate's Degree | 3 (27.3%) | 231.0 |
| Bachelor's Degree | 8 (72.7%) | 381.0 |
| Graduate Degree | 0 (0.0%) | 0.0 |
| Total | 11 (100.0%) | 177.0 |
Fertility by Education by Marriage Status in Lakeview Heights
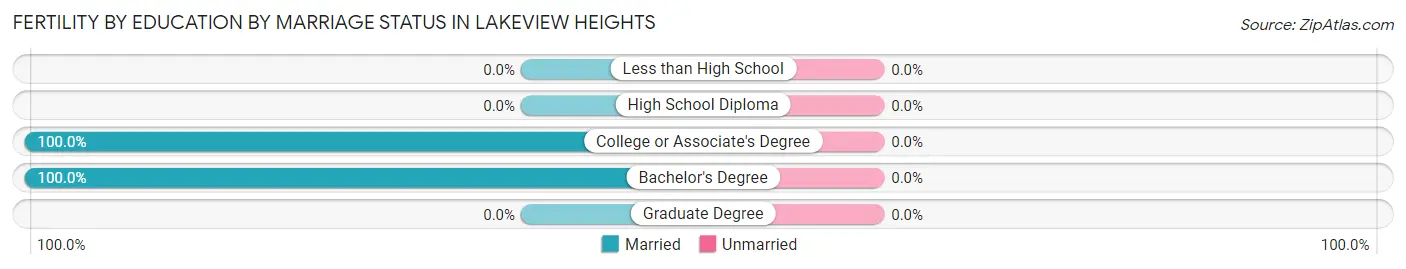
| Educational Attainment | Married | Unmarried |
| Less than High School | 0 (0.0%) | 0 (0.0%) |
| High School Diploma | 0 (0.0%) | 0 (0.0%) |
| College or Associate's Degree | 3 (100.0%) | 0 (0.0%) |
| Bachelor's Degree | 8 (100.0%) | 0 (0.0%) |
| Graduate Degree | 0 (0.0%) | 0 (0.0%) |
| Total | 11 (100.0%) | 0 (0.0%) |
Employment Characteristics in Lakeview Heights
Employment by Class of Employer in Lakeview Heights
Among the 135 employed individuals in Lakeview Heights, state government employees (42 | 31.1%), private company employees (41 | 30.4%), and not-for-profit organizations (26 | 19.3%) make up the most common classes of employment.
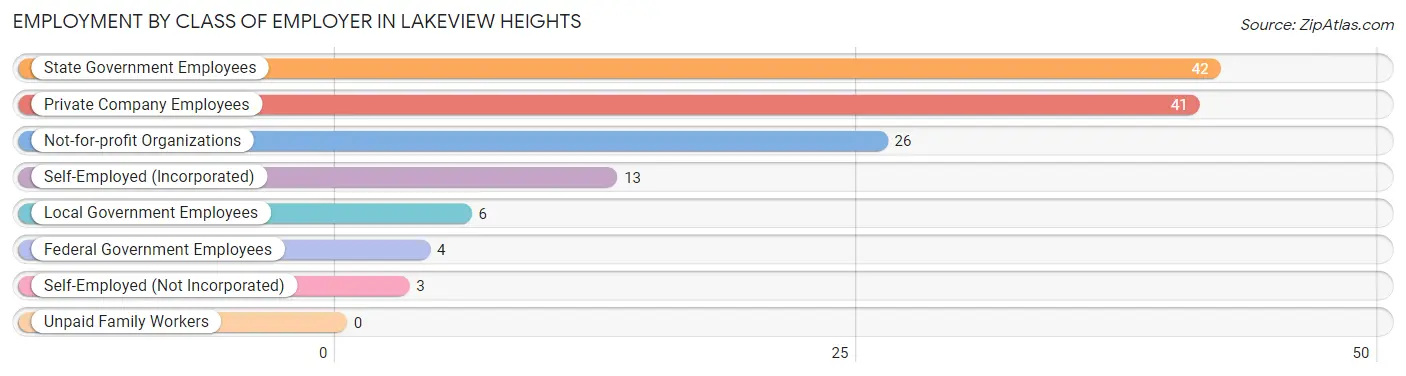
| Employer Class | # Employees | % Employees |
| Private Company Employees | 41 | 30.4% |
| Self-Employed (Incorporated) | 13 | 9.6% |
| Self-Employed (Not Incorporated) | 3 | 2.2% |
| Not-for-profit Organizations | 26 | 19.3% |
| Local Government Employees | 6 | 4.4% |
| State Government Employees | 42 | 31.1% |
| Federal Government Employees | 4 | 3.0% |
| Unpaid Family Workers | 0 | 0.0% |
| Total | 135 | 100.0% |
Employment Status by Age in Lakeview Heights
According to the labor force statistics for Lakeview Heights, out of the total population over 16 years of age (303), 46.2% or 140 individuals are in the labor force, with 2.9% or 4 of them unemployed. The age group with the highest labor force participation rate is 25 to 29 years, with 100.0% or 16 individuals in the labor force. Within the labor force, the 60 to 64 years age range has the highest percentage of unemployed individuals, with 40.0% or 2 of them being unemployed.
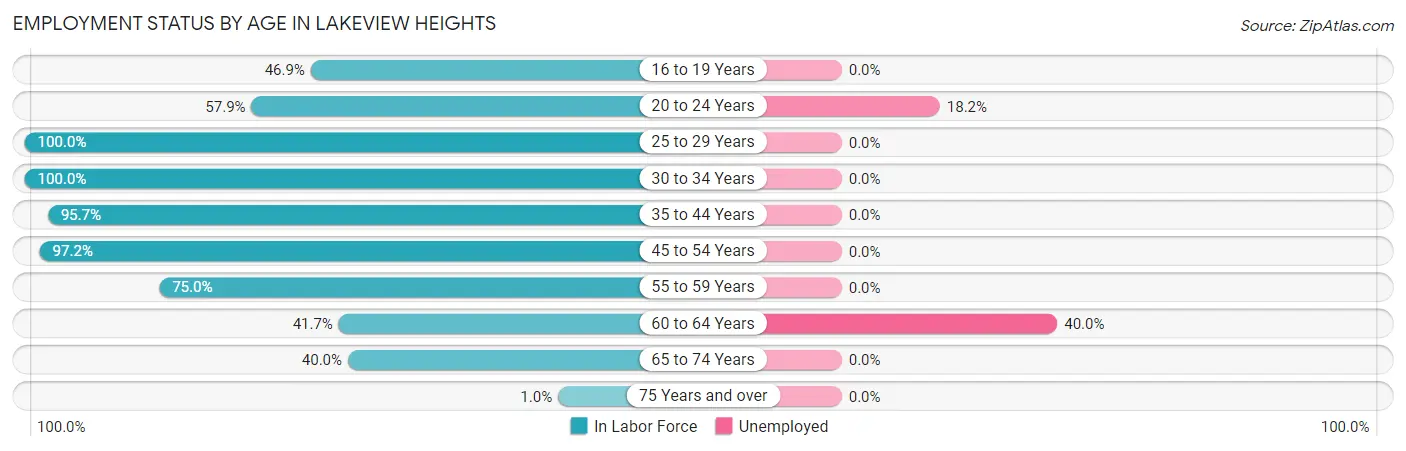
| Age Bracket | In Labor Force | Unemployed |
| 16 to 19 Years | 15 (46.9%) | 0 (0.0%) |
| 20 to 24 Years | 11 (57.9%) | 2 (18.2%) |
| 25 to 29 Years | 16 (100.0%) | 0 (0.0%) |
| 30 to 34 Years | 6 (100.0%) | 0 (0.0%) |
| 35 to 44 Years | 22 (95.7%) | 0 (0.0%) |
| 45 to 54 Years | 35 (97.2%) | 0 (0.0%) |
| 55 to 59 Years | 15 (75.0%) | 0 (0.0%) |
| 60 to 64 Years | 5 (41.7%) | 2 (40.0%) |
| 65 to 74 Years | 14 (40.0%) | 0 (0.0%) |
| 75 Years and over | 1 (1.0%) | 0 (0.0%) |
| Total | 140 (46.2%) | 4 (2.9%) |
Employment Status by Educational Attainment in Lakeview Heights
According to labor force statistics for Lakeview Heights, 87.6% of individuals (99) out of the total population between 25 and 64 years of age (113) are in the labor force, with 2.0% or 2 of them being unemployed. The group with the highest labor force participation rate are those with the educational attainment of less than high school, with 100.0% or 2 individuals in the labor force. Within the labor force, individuals with bachelor's degree or higher education have the highest percentage of unemployment, with 2.9% or 2 of them being unemployed.
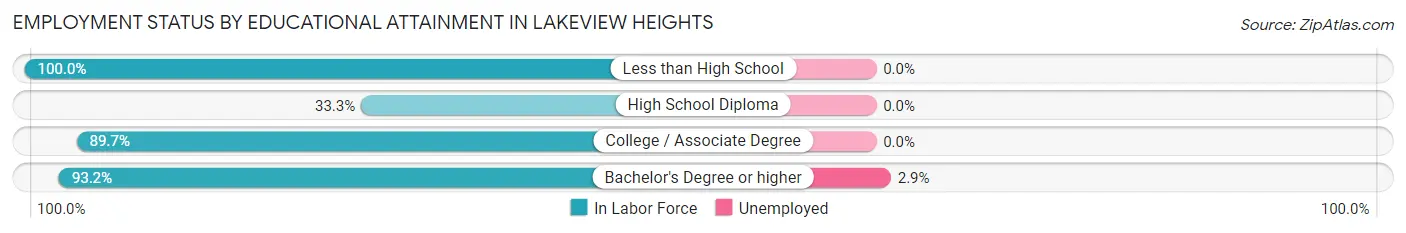
| Educational Attainment | In Labor Force | Unemployed |
| Less than High School | 2 (100.0%) | 0 (0.0%) |
| High School Diploma | 3 (33.3%) | 0 (0.0%) |
| College / Associate Degree | 26 (89.7%) | 0 (0.0%) |
| Bachelor's Degree or higher | 68 (93.2%) | 2 (2.9%) |
| Total | 99 (87.6%) | 2 (2.0%) |
Employment Occupations by Sex in Lakeview Heights
Management, Business, Science and Arts Occupations
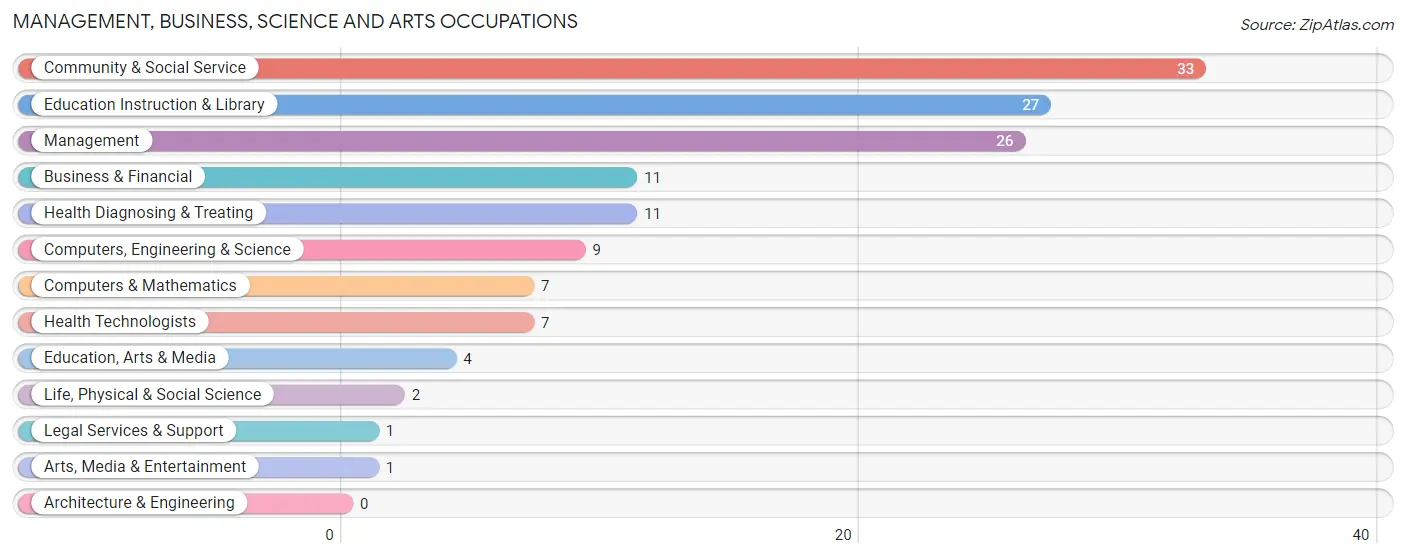
The most common Management, Business, Science and Arts occupations in Lakeview Heights are Community & Social Service (33 | 24.3%), Education Instruction & Library (27 | 19.9%), Management (26 | 19.1%), Business & Financial (11 | 8.1%), and Health Diagnosing & Treating (11 | 8.1%).
Management, Business, Science and Arts Occupations by Sex
Within the Management, Business, Science and Arts occupations in Lakeview Heights, the most male-oriented occupations are Legal Services & Support (100.0%), Health Technologists (71.4%), and Computers & Mathematics (57.1%), while the most female-oriented occupations are Life, Physical & Social Science (100.0%), Education, Arts & Media (100.0%), and Arts, Media & Entertainment (100.0%).
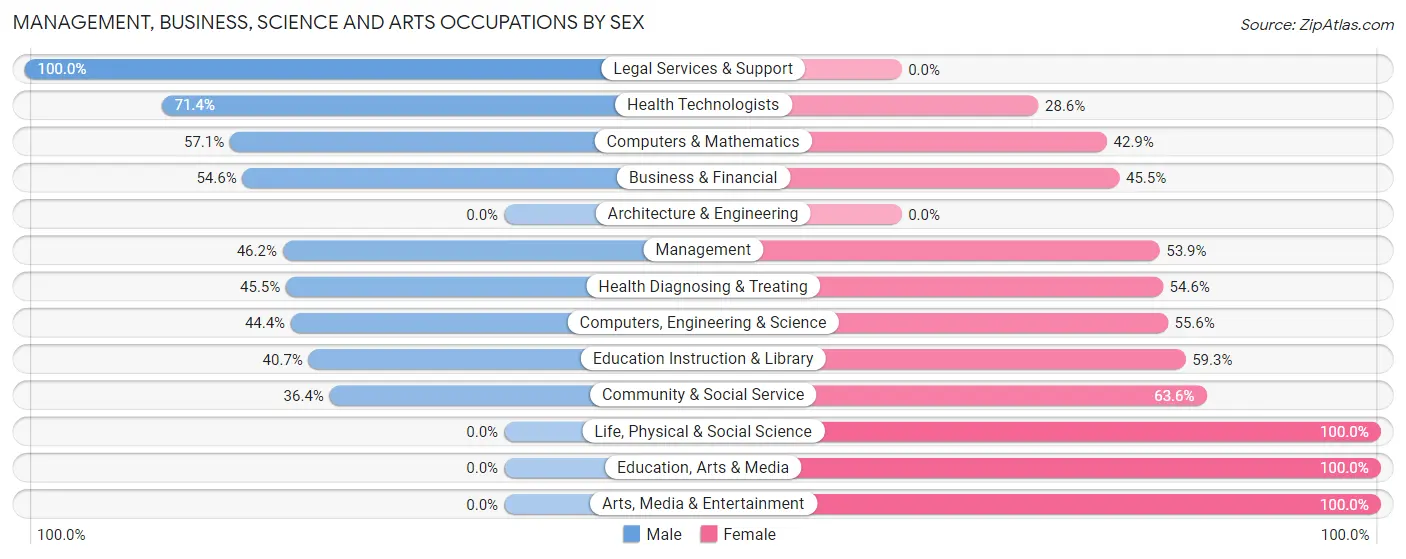
| Occupation | Male | Female |
| Management | 12 (46.2%) | 14 (53.8%) |
| Business & Financial | 6 (54.5%) | 5 (45.5%) |
| Computers, Engineering & Science | 4 (44.4%) | 5 (55.6%) |
| Computers & Mathematics | 4 (57.1%) | 3 (42.9%) |
| Architecture & Engineering | 0 (0.0%) | 0 (0.0%) |
| Life, Physical & Social Science | 0 (0.0%) | 2 (100.0%) |
| Community & Social Service | 12 (36.4%) | 21 (63.6%) |
| Education, Arts & Media | 0 (0.0%) | 4 (100.0%) |
| Legal Services & Support | 1 (100.0%) | 0 (0.0%) |
| Education Instruction & Library | 11 (40.7%) | 16 (59.3%) |
| Arts, Media & Entertainment | 0 (0.0%) | 1 (100.0%) |
| Health Diagnosing & Treating | 5 (45.5%) | 6 (54.5%) |
| Health Technologists | 5 (71.4%) | 2 (28.6%) |
| Total (Category) | 39 (43.3%) | 51 (56.7%) |
| Total (Overall) | 68 (50.0%) | 68 (50.0%) |
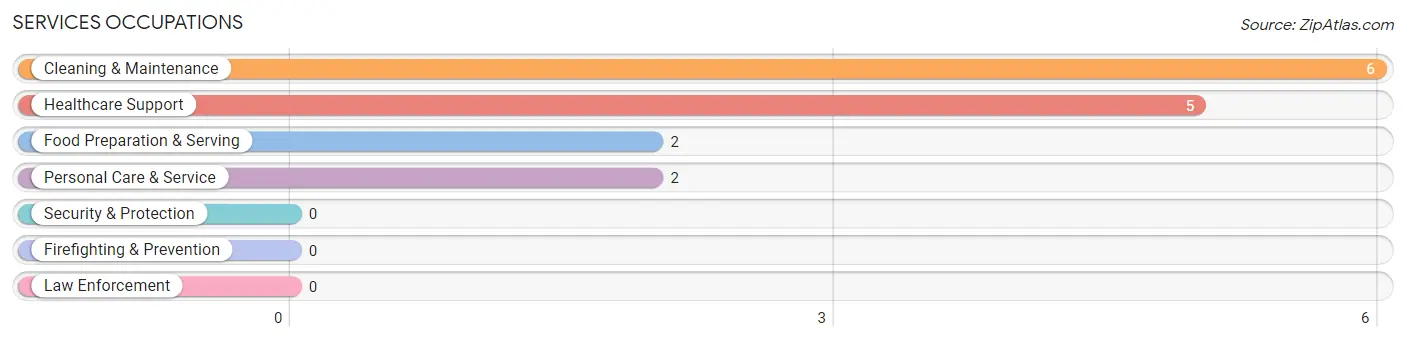
Services Occupations
The most common Services occupations in Lakeview Heights are Cleaning & Maintenance (6 | 4.4%), Healthcare Support (5 | 3.7%), Food Preparation & Serving (2 | 1.5%), and Personal Care & Service (2 | 1.5%).
Services Occupations by Sex
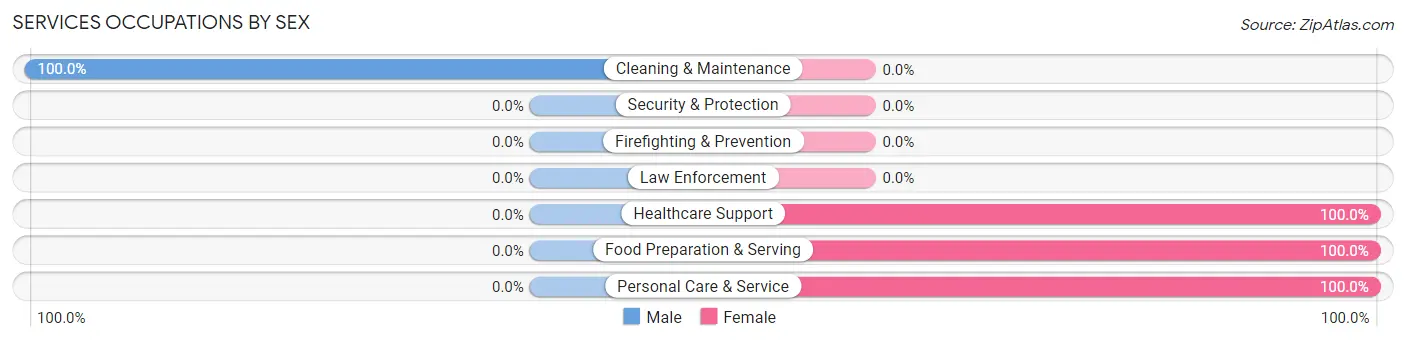
| Occupation | Male | Female |
| Healthcare Support | 0 (0.0%) | 5 (100.0%) |
| Security & Protection | 0 (0.0%) | 0 (0.0%) |
| Firefighting & Prevention | 0 (0.0%) | 0 (0.0%) |
| Law Enforcement | 0 (0.0%) | 0 (0.0%) |
| Food Preparation & Serving | 0 (0.0%) | 2 (100.0%) |
| Cleaning & Maintenance | 6 (100.0%) | 0 (0.0%) |
| Personal Care & Service | 0 (0.0%) | 2 (100.0%) |
| Total (Category) | 6 (40.0%) | 9 (60.0%) |
| Total (Overall) | 68 (50.0%) | 68 (50.0%) |
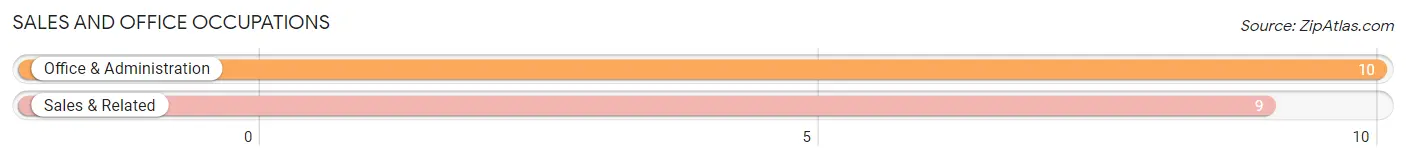
Sales and Office Occupations
The most common Sales and Office occupations in Lakeview Heights are Office & Administration (10 | 7.3%), and Sales & Related (9 | 6.6%).
Sales and Office Occupations by Sex

| Occupation | Male | Female |
| Sales & Related | 5 (55.6%) | 4 (44.4%) |
| Office & Administration | 8 (80.0%) | 2 (20.0%) |
| Total (Category) | 13 (68.4%) | 6 (31.6%) |
| Total (Overall) | 68 (50.0%) | 68 (50.0%) |
Natural Resources, Construction and Maintenance Occupations
The most common Natural Resources, Construction and Maintenance occupations in Lakeview Heights are Installation, Maintenance & Repair (4 | 2.9%), and Construction & Extraction (2 | 1.5%).
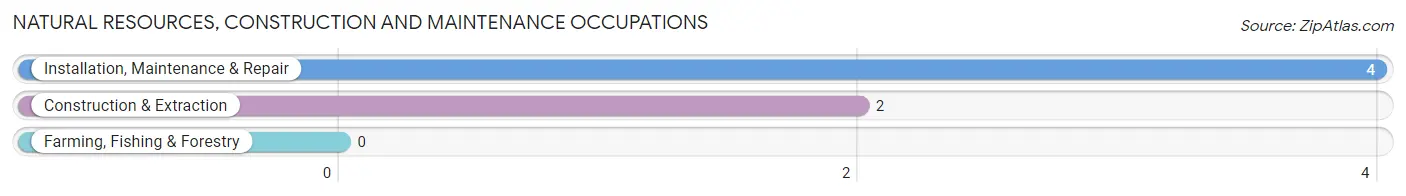
Natural Resources, Construction and Maintenance Occupations by Sex

| Occupation | Male | Female |
| Farming, Fishing & Forestry | 0 (0.0%) | 0 (0.0%) |
| Construction & Extraction | 2 (100.0%) | 0 (0.0%) |
| Installation, Maintenance & Repair | 4 (100.0%) | 0 (0.0%) |
| Total (Category) | 6 (100.0%) | 0 (0.0%) |
| Total (Overall) | 68 (50.0%) | 68 (50.0%) |
Production, Transportation and Moving Occupations
The most common Production, Transportation and Moving occupations in Lakeview Heights are Production (3 | 2.2%), Material Moving (2 | 1.5%), and Transportation (1 | 0.7%).
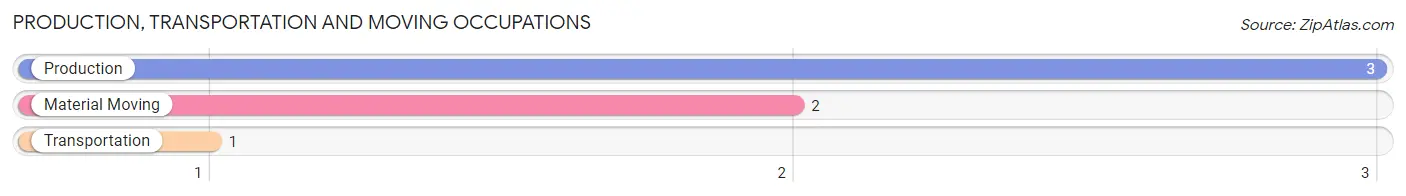
Production, Transportation and Moving Occupations by Sex
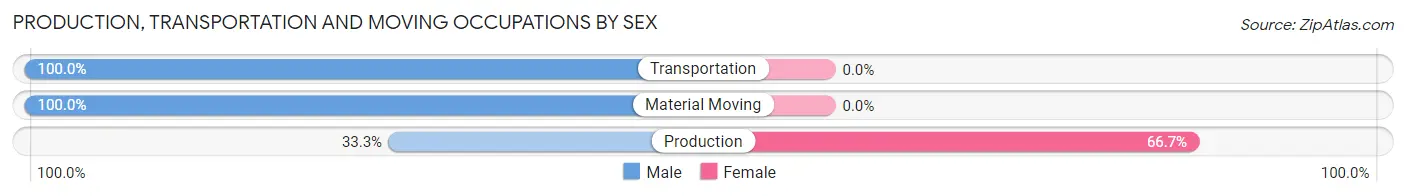
| Occupation | Male | Female |
| Production | 1 (33.3%) | 2 (66.7%) |
| Transportation | 1 (100.0%) | 0 (0.0%) |
| Material Moving | 2 (100.0%) | 0 (0.0%) |
| Total (Category) | 4 (66.7%) | 2 (33.3%) |
| Total (Overall) | 68 (50.0%) | 68 (50.0%) |
Employment Industries by Sex in Lakeview Heights
Employment Industries in Lakeview Heights
The major employment industries in Lakeview Heights include Educational Services (44 | 32.4%), Health Care & Social Assistance (25 | 18.4%), Retail Trade (13 | 9.6%), Administrative & Support (7 | 5.1%), and Finance & Insurance (6 | 4.4%).
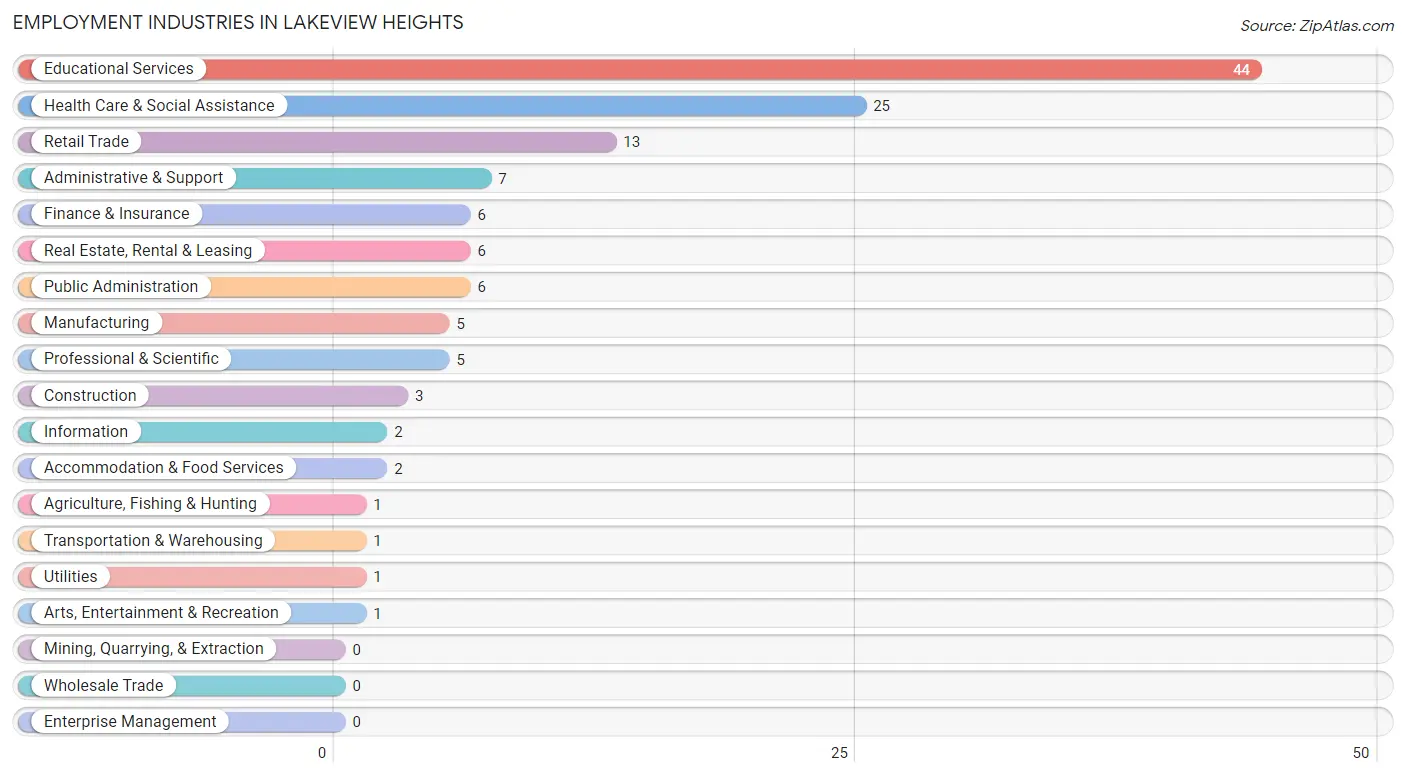
Employment Industries by Sex in Lakeview Heights
The Lakeview Heights industries that see more men than women are Agriculture, Fishing & Hunting (100.0%), Construction (100.0%), and Transportation & Warehousing (100.0%), whereas the industries that tend to have a higher number of women are Accommodation & Food Services (100.0%), Real Estate, Rental & Leasing (83.3%), and Finance & Insurance (66.7%).
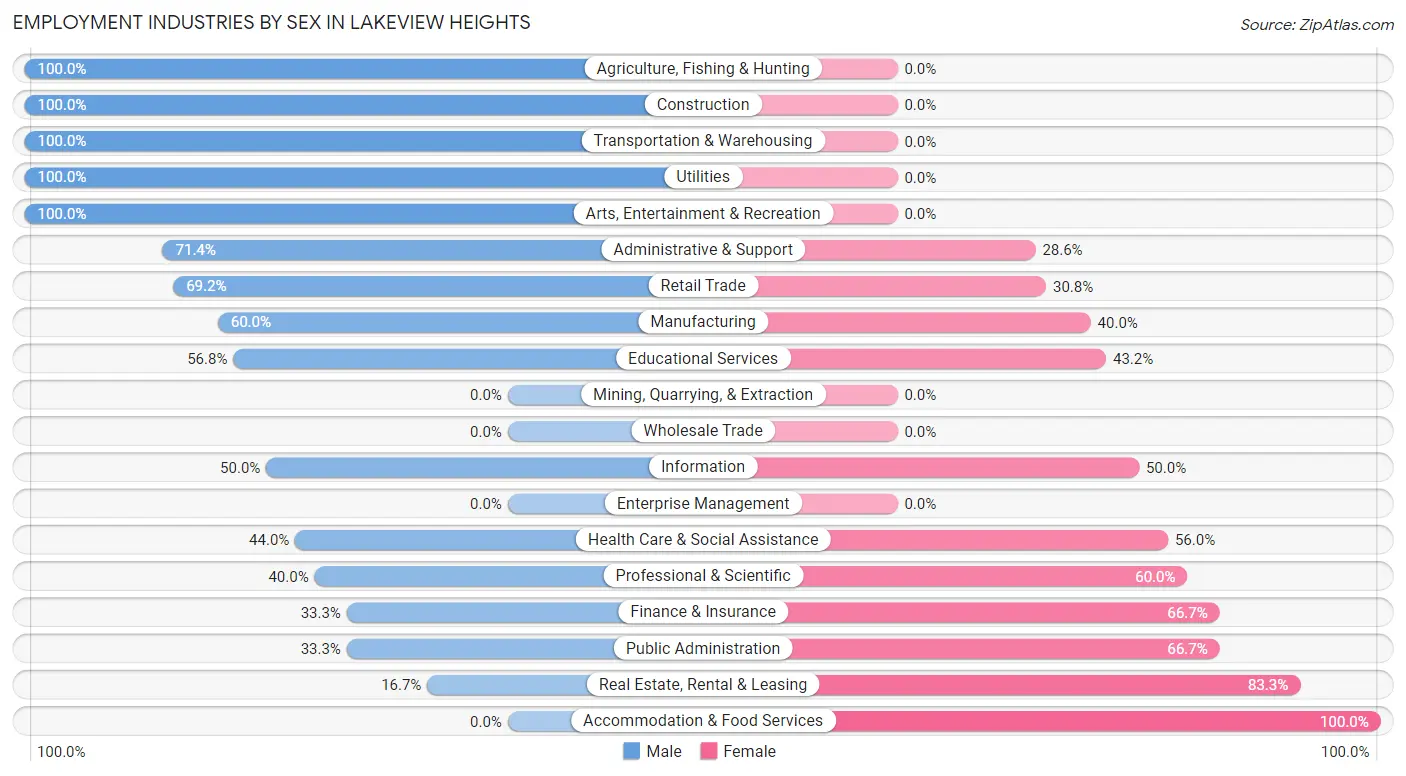
| Industry | Male | Female |
| Agriculture, Fishing & Hunting | 1 (100.0%) | 0 (0.0%) |
| Mining, Quarrying, & Extraction | 0 (0.0%) | 0 (0.0%) |
| Construction | 3 (100.0%) | 0 (0.0%) |
| Manufacturing | 3 (60.0%) | 2 (40.0%) |
| Wholesale Trade | 0 (0.0%) | 0 (0.0%) |
| Retail Trade | 9 (69.2%) | 4 (30.8%) |
| Transportation & Warehousing | 1 (100.0%) | 0 (0.0%) |
| Utilities | 1 (100.0%) | 0 (0.0%) |
| Information | 1 (50.0%) | 1 (50.0%) |
| Finance & Insurance | 2 (33.3%) | 4 (66.7%) |
| Real Estate, Rental & Leasing | 1 (16.7%) | 5 (83.3%) |
| Professional & Scientific | 2 (40.0%) | 3 (60.0%) |
| Enterprise Management | 0 (0.0%) | 0 (0.0%) |
| Administrative & Support | 5 (71.4%) | 2 (28.6%) |
| Educational Services | 25 (56.8%) | 19 (43.2%) |
| Health Care & Social Assistance | 11 (44.0%) | 14 (56.0%) |
| Arts, Entertainment & Recreation | 1 (100.0%) | 0 (0.0%) |
| Accommodation & Food Services | 0 (0.0%) | 2 (100.0%) |
| Public Administration | 2 (33.3%) | 4 (66.7%) |
| Total | 68 (50.0%) | 68 (50.0%) |
Education in Lakeview Heights
School Enrollment in Lakeview Heights
The most common levels of schooling among the 83 students in Lakeview Heights are middle school (30 | 36.1%), college / undergraduate (23 | 27.7%), and high school (19 | 22.9%).
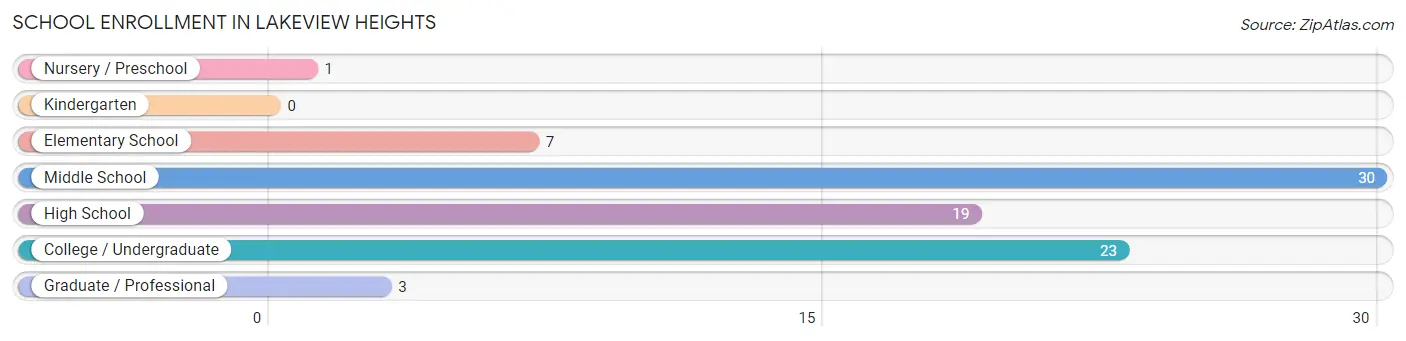
| School Level | # Students | % Students |
| Nursery / Preschool | 1 | 1.2% |
| Kindergarten | 0 | 0.0% |
| Elementary School | 7 | 8.4% |
| Middle School | 30 | 36.1% |
| High School | 19 | 22.9% |
| College / Undergraduate | 23 | 27.7% |
| Graduate / Professional | 3 | 3.6% |
| Total | 83 | 100.0% |
School Enrollment by Age by Funding Source in Lakeview Heights
Out of a total of 83 students who are enrolled in schools in Lakeview Heights, 3 (3.6%) attend a private institution, while the remaining 80 (96.4%) are enrolled in public schools. The age group of 5 to 9 year old has the highest likelihood of being enrolled in private schools, with 1 (14.3% in the age bracket) enrolled. Conversely, the age group of 3 to 4 year olds has the lowest likelihood of being enrolled in a private school, with 1 (100.0% in the age bracket) attending a public institution.
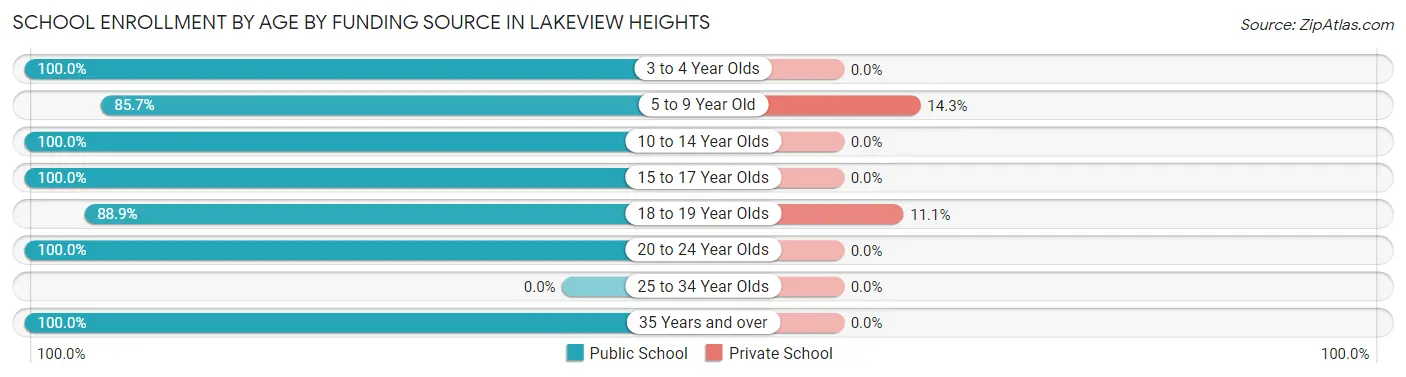
| Age Bracket | Public School | Private School |
| 3 to 4 Year Olds | 1 (100.0%) | 0 (0.0%) |
| 5 to 9 Year Old | 6 (85.7%) | 1 (14.3%) |
| 10 to 14 Year Olds | 30 (100.0%) | 0 (0.0%) |
| 15 to 17 Year Olds | 16 (100.0%) | 0 (0.0%) |
| 18 to 19 Year Olds | 16 (88.9%) | 2 (11.1%) |
| 20 to 24 Year Olds | 10 (100.0%) | 0 (0.0%) |
| 25 to 34 Year Olds | 0 (0.0%) | 0 (0.0%) |
| 35 Years and over | 1 (100.0%) | 0 (0.0%) |
| Total | 80 (96.4%) | 3 (3.6%) |
Educational Attainment by Field of Study in Lakeview Heights
Education (26 | 23.2%), business (21 | 18.8%), psychology (13 | 11.6%), bio, nature & agricultural (10 | 8.9%), and science & technology (9 | 8.0%) are the most common fields of study among 112 individuals in Lakeview Heights who have obtained a bachelor's degree or higher.
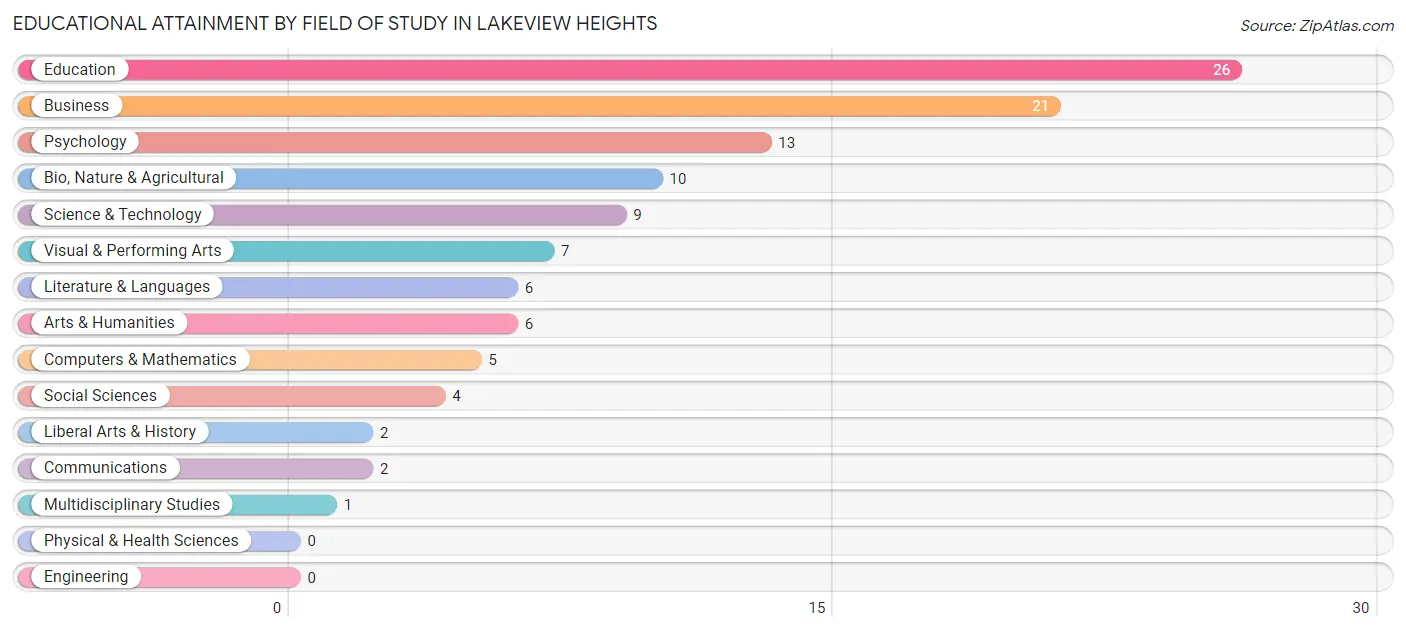
| Field of Study | # Graduates | % Graduates |
| Computers & Mathematics | 5 | 4.5% |
| Bio, Nature & Agricultural | 10 | 8.9% |
| Physical & Health Sciences | 0 | 0.0% |
| Psychology | 13 | 11.6% |
| Social Sciences | 4 | 3.6% |
| Engineering | 0 | 0.0% |
| Multidisciplinary Studies | 1 | 0.9% |
| Science & Technology | 9 | 8.0% |
| Business | 21 | 18.8% |
| Education | 26 | 23.2% |
| Literature & Languages | 6 | 5.4% |
| Liberal Arts & History | 2 | 1.8% |
| Visual & Performing Arts | 7 | 6.2% |
| Communications | 2 | 1.8% |
| Arts & Humanities | 6 | 5.4% |
| Total | 112 | 100.0% |
Transportation & Commute in Lakeview Heights
Vehicle Availability by Sex in Lakeview Heights
The most prevalent vehicle ownership categories in Lakeview Heights are males with 2 vehicles (31, accounting for 45.6%) and females with 2 vehicles (36, making up 46.3%).
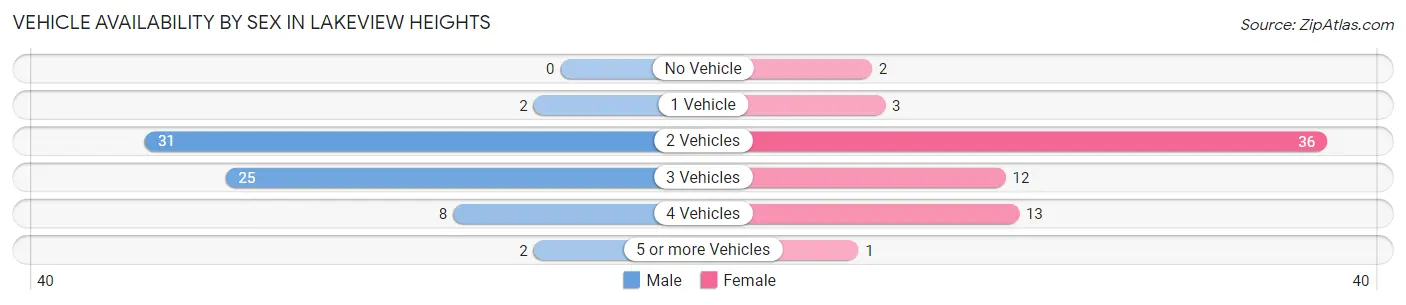
| Vehicles Available | Male | Female |
| No Vehicle | 0 (0.0%) | 2 (3.0%) |
| 1 Vehicle | 2 (2.9%) | 3 (4.5%) |
| 2 Vehicles | 31 (45.6%) | 36 (53.7%) |
| 3 Vehicles | 25 (36.8%) | 12 (17.9%) |
| 4 Vehicles | 8 (11.8%) | 13 (19.4%) |
| 5 or more Vehicles | 2 (2.9%) | 1 (1.5%) |
| Total | 68 (100.0%) | 67 (100.0%) |
Commute Time in Lakeview Heights
The most frequently occuring commute durations in Lakeview Heights are 10 to 14 minutes (52 commuters, 42.6%), 15 to 19 minutes (28 commuters, 23.0%), and 20 to 24 minutes (14 commuters, 11.5%).
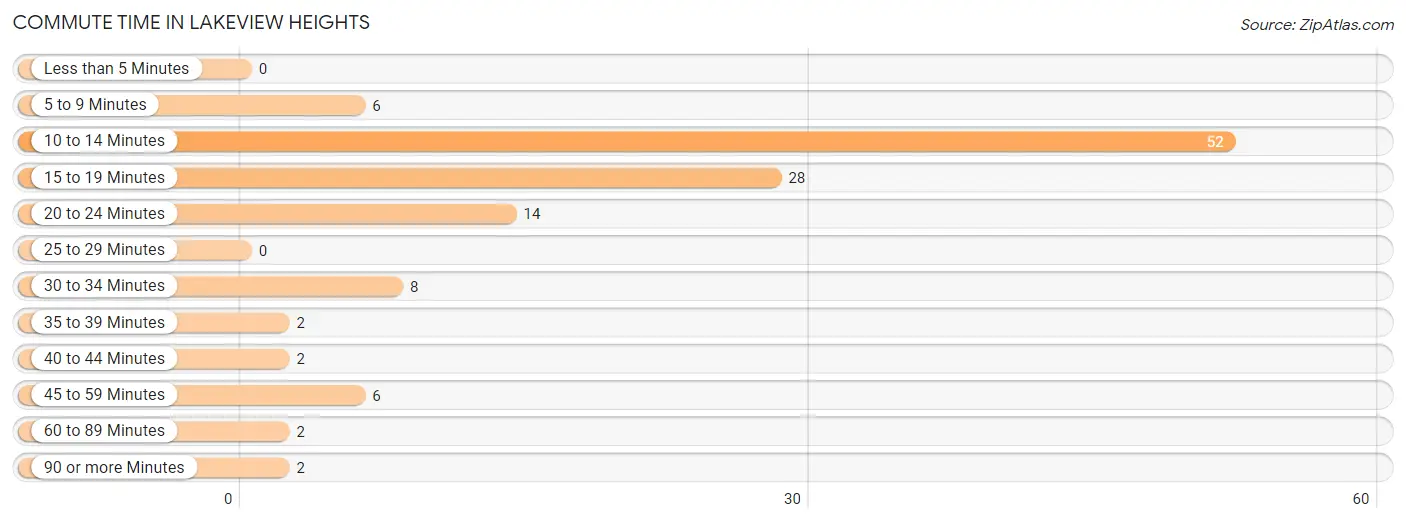
| Commute Time | # Commuters | % Commuters |
| Less than 5 Minutes | 0 | 0.0% |
| 5 to 9 Minutes | 6 | 4.9% |
| 10 to 14 Minutes | 52 | 42.6% |
| 15 to 19 Minutes | 28 | 23.0% |
| 20 to 24 Minutes | 14 | 11.5% |
| 25 to 29 Minutes | 0 | 0.0% |
| 30 to 34 Minutes | 8 | 6.6% |
| 35 to 39 Minutes | 2 | 1.6% |
| 40 to 44 Minutes | 2 | 1.6% |
| 45 to 59 Minutes | 6 | 4.9% |
| 60 to 89 Minutes | 2 | 1.6% |
| 90 or more Minutes | 2 | 1.6% |
Commute Time by Sex in Lakeview Heights
The most common commute times in Lakeview Heights are 10 to 14 minutes (31 commuters, 50.8%) for males and 10 to 14 minutes (21 commuters, 34.4%) for females.

| Commute Time | Male | Female |
| Less than 5 Minutes | 0 (0.0%) | 0 (0.0%) |
| 5 to 9 Minutes | 5 (8.2%) | 1 (1.6%) |
| 10 to 14 Minutes | 31 (50.8%) | 21 (34.4%) |
| 15 to 19 Minutes | 10 (16.4%) | 18 (29.5%) |
| 20 to 24 Minutes | 5 (8.2%) | 9 (14.7%) |
| 25 to 29 Minutes | 0 (0.0%) | 0 (0.0%) |
| 30 to 34 Minutes | 1 (1.6%) | 7 (11.5%) |
| 35 to 39 Minutes | 2 (3.3%) | 0 (0.0%) |
| 40 to 44 Minutes | 1 (1.6%) | 1 (1.6%) |
| 45 to 59 Minutes | 4 (6.6%) | 2 (3.3%) |
| 60 to 89 Minutes | 0 (0.0%) | 2 (3.3%) |
| 90 or more Minutes | 2 (3.3%) | 0 (0.0%) |
Time of Departure to Work by Sex in Lakeview Heights
The most frequent times of departure to work in Lakeview Heights are 7:30 AM to 7:59 AM (14, 23.0%) for males and 7:30 AM to 7:59 AM (15, 24.6%) for females.
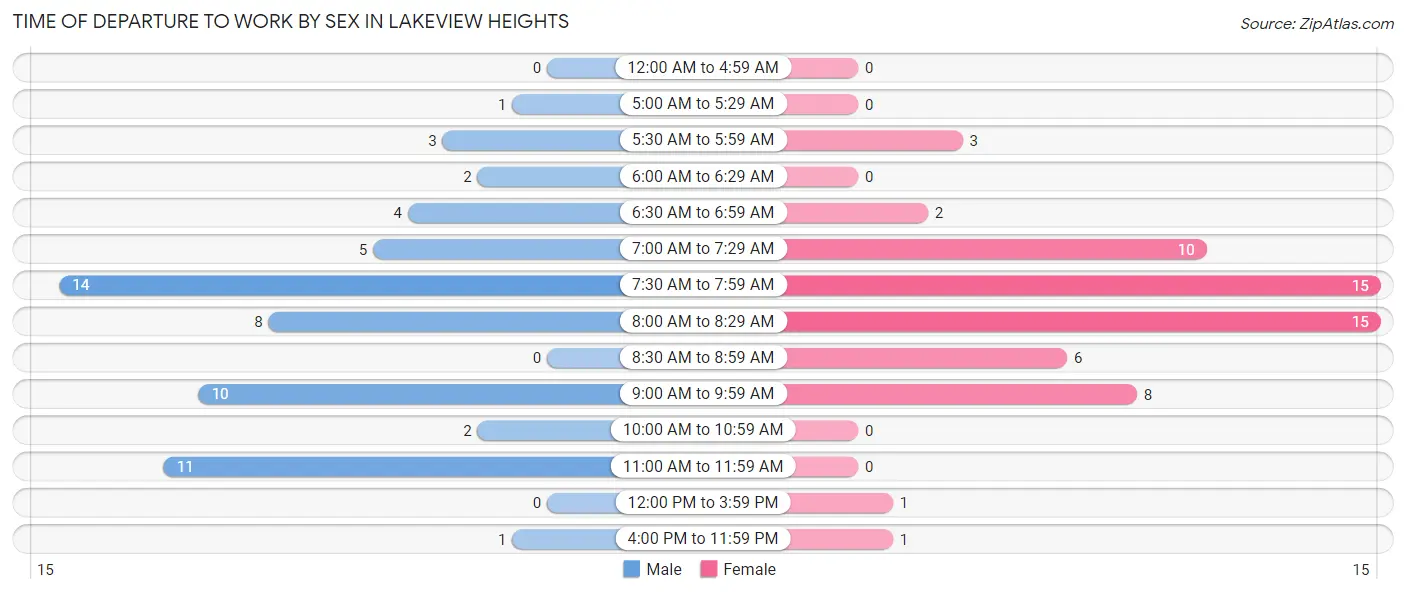
| Time of Departure | Male | Female |
| 12:00 AM to 4:59 AM | 0 (0.0%) | 0 (0.0%) |
| 5:00 AM to 5:29 AM | 1 (1.6%) | 0 (0.0%) |
| 5:30 AM to 5:59 AM | 3 (4.9%) | 3 (4.9%) |
| 6:00 AM to 6:29 AM | 2 (3.3%) | 0 (0.0%) |
| 6:30 AM to 6:59 AM | 4 (6.6%) | 2 (3.3%) |
| 7:00 AM to 7:29 AM | 5 (8.2%) | 10 (16.4%) |
| 7:30 AM to 7:59 AM | 14 (23.0%) | 15 (24.6%) |
| 8:00 AM to 8:29 AM | 8 (13.1%) | 15 (24.6%) |
| 8:30 AM to 8:59 AM | 0 (0.0%) | 6 (9.8%) |
| 9:00 AM to 9:59 AM | 10 (16.4%) | 8 (13.1%) |
| 10:00 AM to 10:59 AM | 2 (3.3%) | 0 (0.0%) |
| 11:00 AM to 11:59 AM | 11 (18.0%) | 0 (0.0%) |
| 12:00 PM to 3:59 PM | 0 (0.0%) | 1 (1.6%) |
| 4:00 PM to 11:59 PM | 1 (1.6%) | 1 (1.6%) |
| Total | 61 (100.0%) | 61 (100.0%) |
Housing Occupancy in Lakeview Heights
Occupancy by Ownership in Lakeview Heights
Of the total 123 dwellings in Lakeview Heights, owner-occupied units account for 111 (90.2%), while renter-occupied units make up 12 (9.8%).
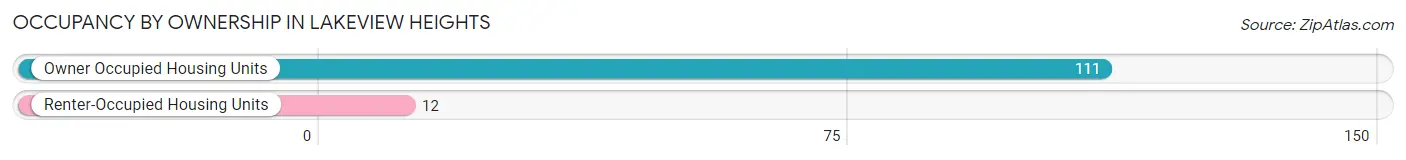
| Occupancy | # Housing Units | % Housing Units |
| Owner Occupied Housing Units | 111 | 90.2% |
| Renter-Occupied Housing Units | 12 | 9.8% |
| Total Occupied Housing Units | 123 | 100.0% |
Occupancy by Household Size in Lakeview Heights
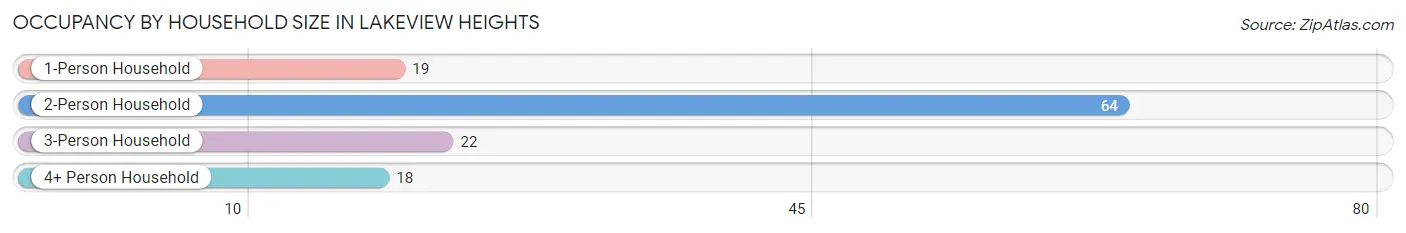
| Household Size | # Housing Units | % Housing Units |
| 1-Person Household | 19 | 15.4% |
| 2-Person Household | 64 | 52.0% |
| 3-Person Household | 22 | 17.9% |
| 4+ Person Household | 18 | 14.6% |
| Total Housing Units | 123 | 100.0% |
Occupancy by Ownership by Household Size in Lakeview Heights
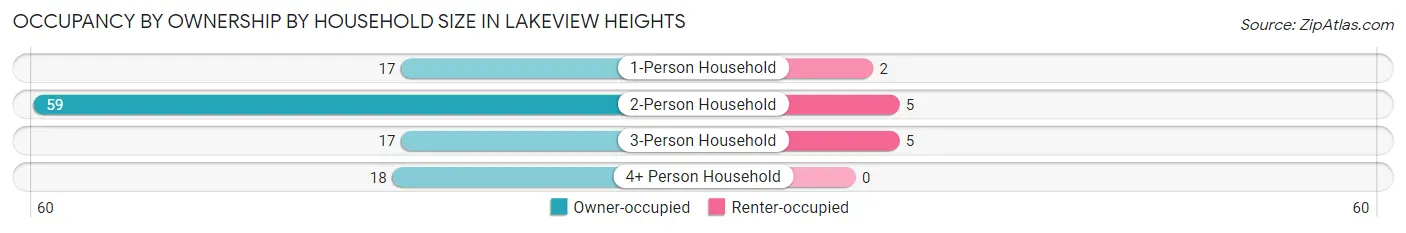
| Household Size | Owner-occupied | Renter-occupied |
| 1-Person Household | 17 (89.5%) | 2 (10.5%) |
| 2-Person Household | 59 (92.2%) | 5 (7.8%) |
| 3-Person Household | 17 (77.3%) | 5 (22.7%) |
| 4+ Person Household | 18 (100.0%) | 0 (0.0%) |
| Total Housing Units | 111 (90.2%) | 12 (9.8%) |
Occupancy by Educational Attainment in Lakeview Heights
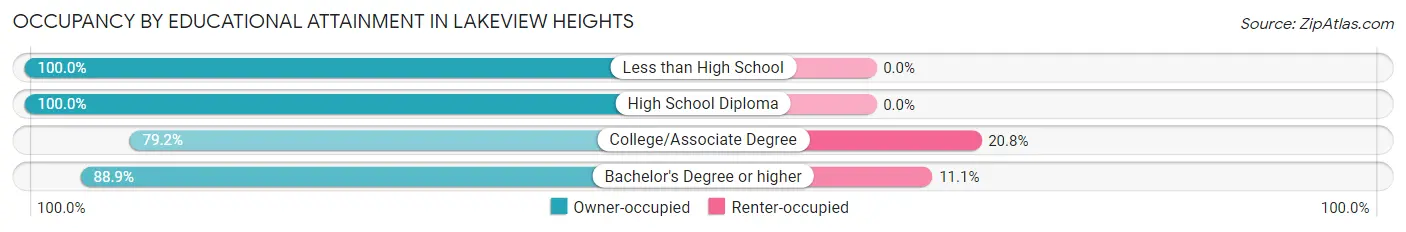
| Household Size | Owner-occupied | Renter-occupied |
| Less than High School | 1 (100.0%) | 0 (0.0%) |
| High School Diploma | 35 (100.0%) | 0 (0.0%) |
| College/Associate Degree | 19 (79.2%) | 5 (20.8%) |
| Bachelor's Degree or higher | 56 (88.9%) | 7 (11.1%) |
Occupancy by Age of Householder in Lakeview Heights
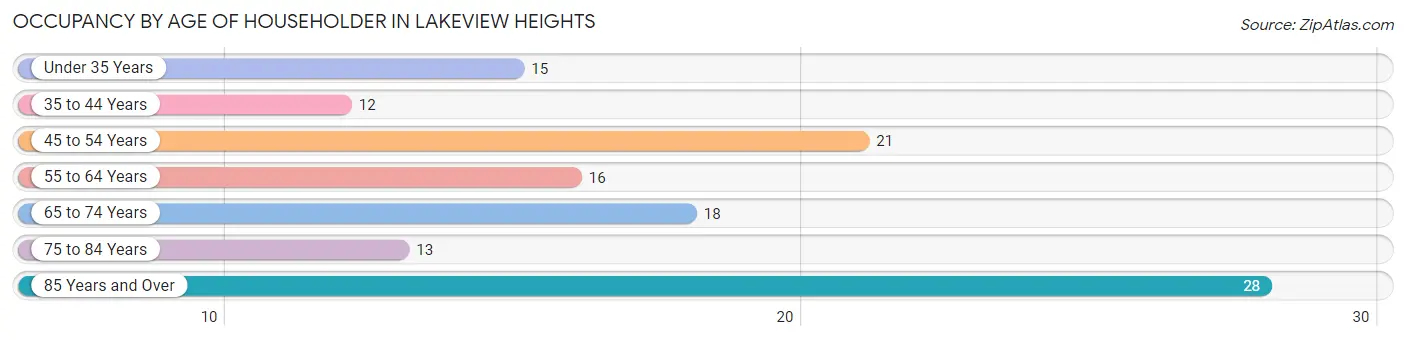
| Age Bracket | # Households | % Households |
| Under 35 Years | 15 | 12.2% |
| 35 to 44 Years | 12 | 9.8% |
| 45 to 54 Years | 21 | 17.1% |
| 55 to 64 Years | 16 | 13.0% |
| 65 to 74 Years | 18 | 14.6% |
| 75 to 84 Years | 13 | 10.6% |
| 85 Years and Over | 28 | 22.8% |
| Total | 123 | 100.0% |
Housing Finances in Lakeview Heights
Median Income by Occupancy in Lakeview Heights
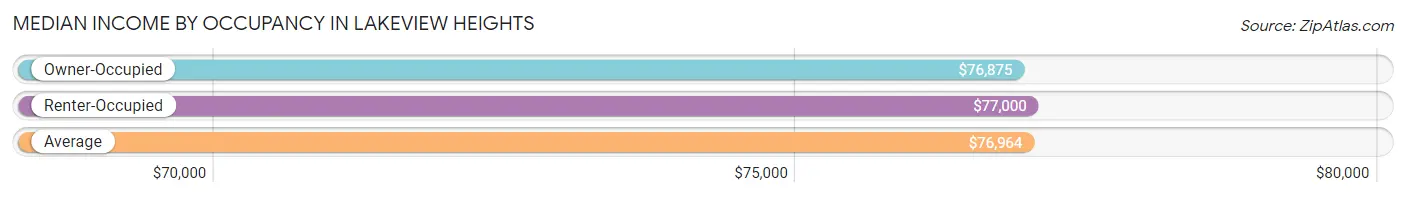
| Occupancy Type | # Households | Median Income |
| Owner-Occupied | 111 (90.2%) | $76,875 |
| Renter-Occupied | 12 (9.8%) | $77,000 |
| Average | 123 (100.0%) | $76,964 |
Occupancy by Householder Income Bracket in Lakeview Heights
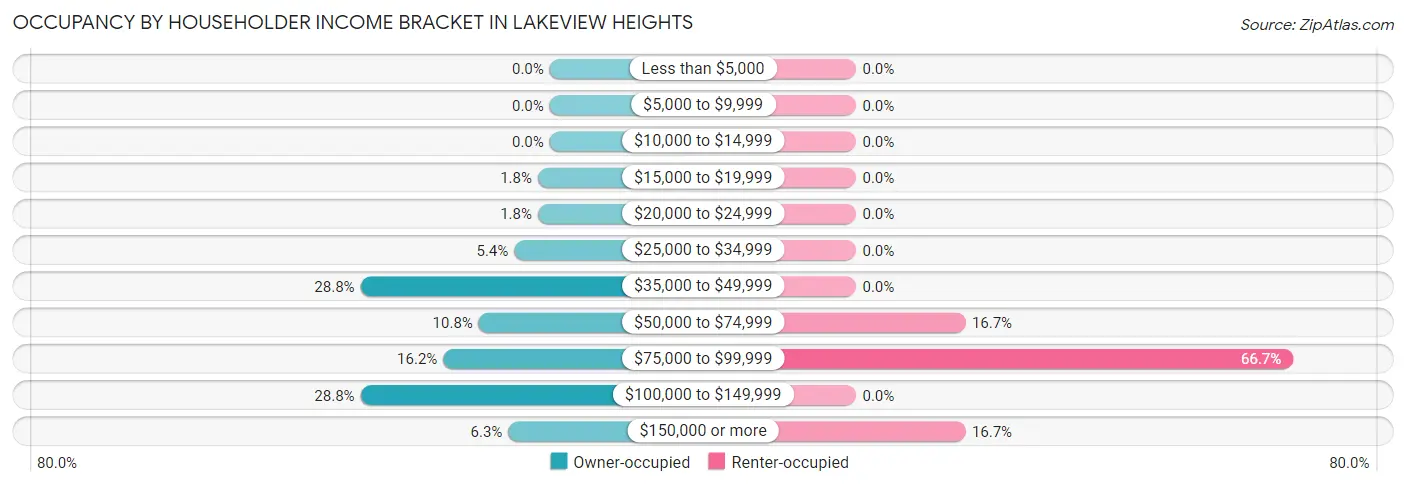
| Income Bracket | Owner-occupied | Renter-occupied |
| Less than $5,000 | 0 (0.0%) | 0 (0.0%) |
| $5,000 to $9,999 | 0 (0.0%) | 0 (0.0%) |
| $10,000 to $14,999 | 0 (0.0%) | 0 (0.0%) |
| $15,000 to $19,999 | 2 (1.8%) | 0 (0.0%) |
| $20,000 to $24,999 | 2 (1.8%) | 0 (0.0%) |
| $25,000 to $34,999 | 6 (5.4%) | 0 (0.0%) |
| $35,000 to $49,999 | 32 (28.8%) | 0 (0.0%) |
| $50,000 to $74,999 | 12 (10.8%) | 2 (16.7%) |
| $75,000 to $99,999 | 18 (16.2%) | 8 (66.7%) |
| $100,000 to $149,999 | 32 (28.8%) | 0 (0.0%) |
| $150,000 or more | 7 (6.3%) | 2 (16.7%) |
| Total | 111 (100.0%) | 12 (100.0%) |
Monthly Housing Cost Tiers in Lakeview Heights
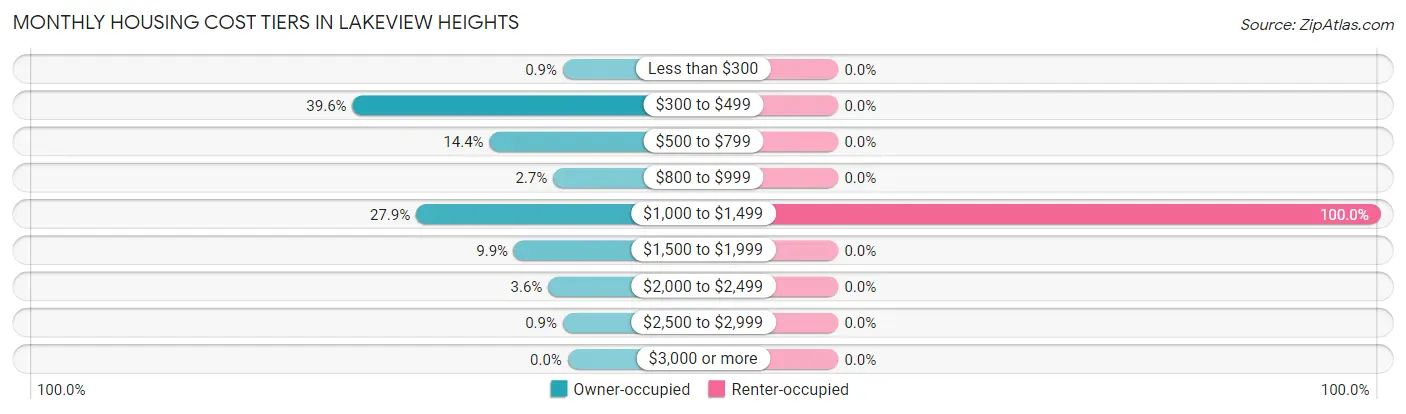
| Monthly Cost | Owner-occupied | Renter-occupied |
| Less than $300 | 1 (0.9%) | 0 (0.0%) |
| $300 to $499 | 44 (39.6%) | 0 (0.0%) |
| $500 to $799 | 16 (14.4%) | 0 (0.0%) |
| $800 to $999 | 3 (2.7%) | 0 (0.0%) |
| $1,000 to $1,499 | 31 (27.9%) | 12 (100.0%) |
| $1,500 to $1,999 | 11 (9.9%) | 0 (0.0%) |
| $2,000 to $2,499 | 4 (3.6%) | 0 (0.0%) |
| $2,500 to $2,999 | 1 (0.9%) | 0 (0.0%) |
| $3,000 or more | 0 (0.0%) | 0 (0.0%) |
| Total | 111 (100.0%) | 12 (100.0%) |
Physical Housing Characteristics in Lakeview Heights
Housing Structures in Lakeview Heights
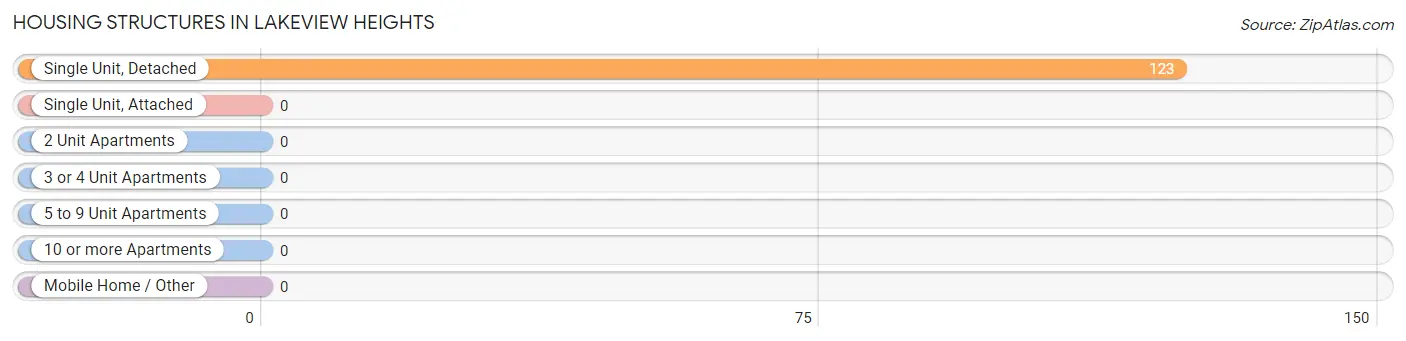
| Structure Type | # Housing Units | % Housing Units |
| Single Unit, Detached | 123 | 100.0% |
| Single Unit, Attached | 0 | 0.0% |
| 2 Unit Apartments | 0 | 0.0% |
| 3 or 4 Unit Apartments | 0 | 0.0% |
| 5 to 9 Unit Apartments | 0 | 0.0% |
| 10 or more Apartments | 0 | 0.0% |
| Mobile Home / Other | 0 | 0.0% |
| Total | 123 | 100.0% |
Housing Structures by Occupancy in Lakeview Heights
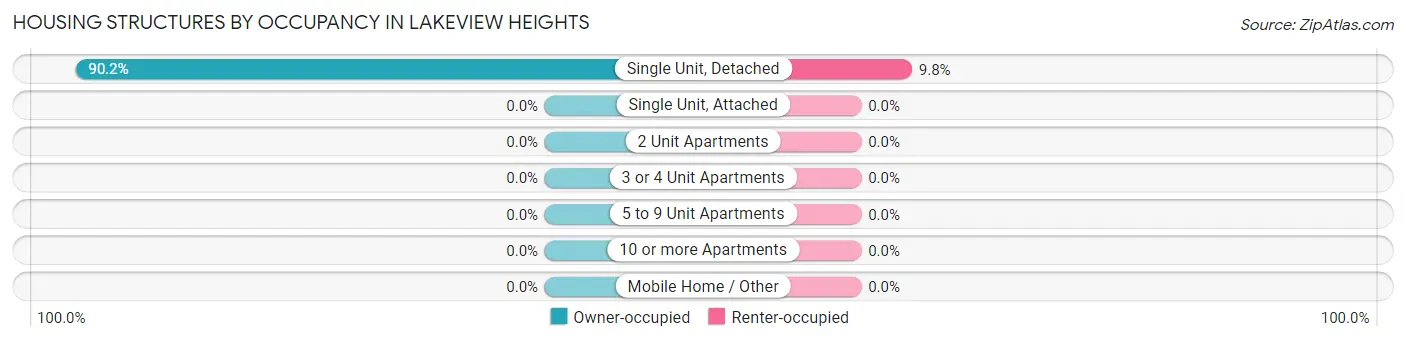
| Structure Type | Owner-occupied | Renter-occupied |
| Single Unit, Detached | 111 (90.2%) | 12 (9.8%) |
| Single Unit, Attached | 0 (0.0%) | 0 (0.0%) |
| 2 Unit Apartments | 0 (0.0%) | 0 (0.0%) |
| 3 or 4 Unit Apartments | 0 (0.0%) | 0 (0.0%) |
| 5 to 9 Unit Apartments | 0 (0.0%) | 0 (0.0%) |
| 10 or more Apartments | 0 (0.0%) | 0 (0.0%) |
| Mobile Home / Other | 0 (0.0%) | 0 (0.0%) |
| Total | 111 (90.2%) | 12 (9.8%) |
Housing Structures by Number of Rooms in Lakeview Heights
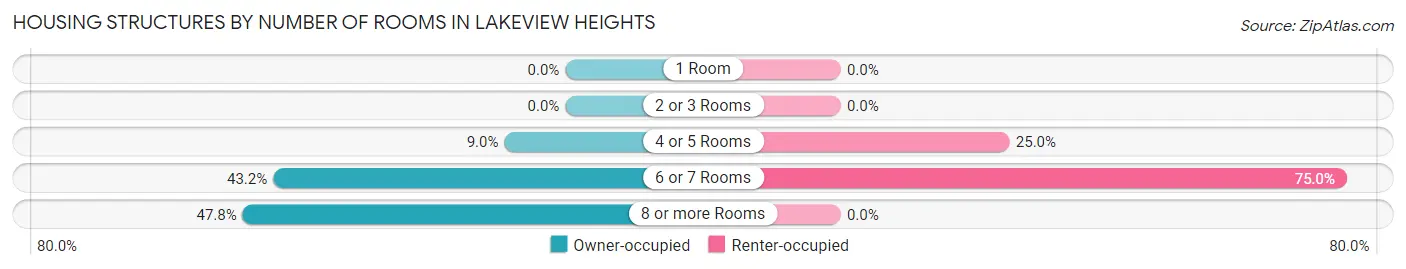
| Number of Rooms | Owner-occupied | Renter-occupied |
| 1 Room | 0 (0.0%) | 0 (0.0%) |
| 2 or 3 Rooms | 0 (0.0%) | 0 (0.0%) |
| 4 or 5 Rooms | 10 (9.0%) | 3 (25.0%) |
| 6 or 7 Rooms | 48 (43.2%) | 9 (75.0%) |
| 8 or more Rooms | 53 (47.7%) | 0 (0.0%) |
| Total | 111 (100.0%) | 12 (100.0%) |
Housing Structure by Heating Type in Lakeview Heights
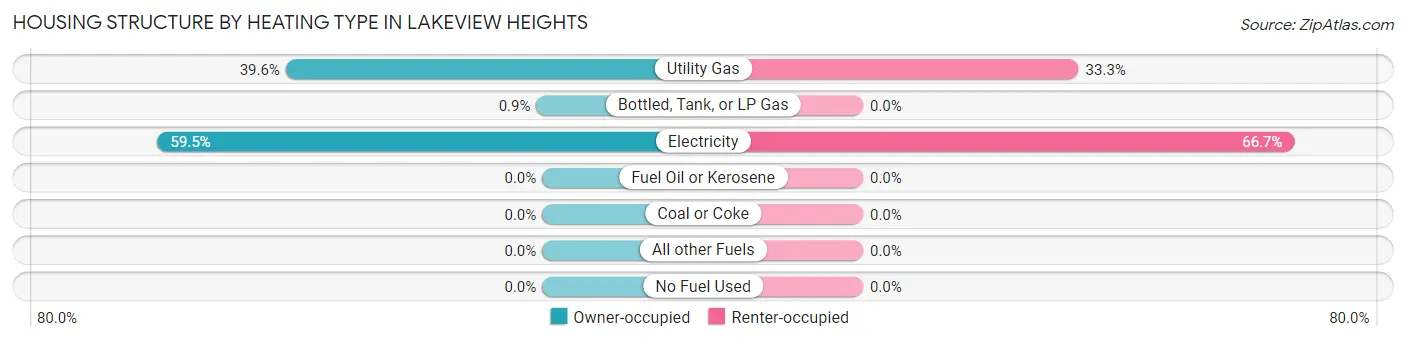
| Heating Type | Owner-occupied | Renter-occupied |
| Utility Gas | 44 (39.6%) | 4 (33.3%) |
| Bottled, Tank, or LP Gas | 1 (0.9%) | 0 (0.0%) |
| Electricity | 66 (59.5%) | 8 (66.7%) |
| Fuel Oil or Kerosene | 0 (0.0%) | 0 (0.0%) |
| Coal or Coke | 0 (0.0%) | 0 (0.0%) |
| All other Fuels | 0 (0.0%) | 0 (0.0%) |
| No Fuel Used | 0 (0.0%) | 0 (0.0%) |
| Total | 111 (100.0%) | 12 (100.0%) |
Household Vehicle Usage in Lakeview Heights
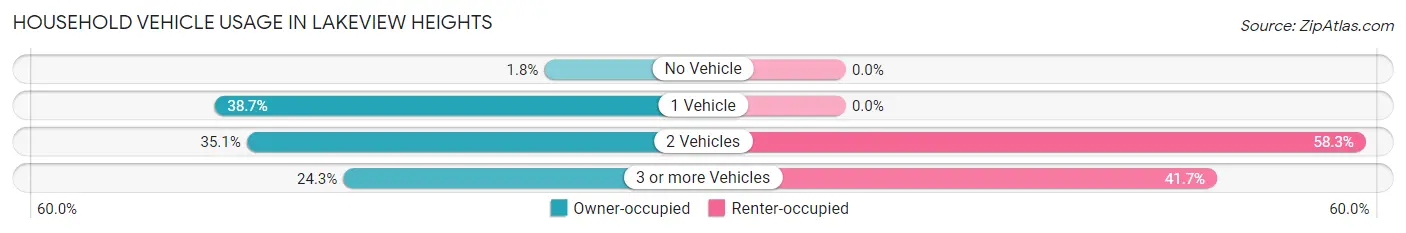
| Vehicles per Household | Owner-occupied | Renter-occupied |
| No Vehicle | 2 (1.8%) | 0 (0.0%) |
| 1 Vehicle | 43 (38.7%) | 0 (0.0%) |
| 2 Vehicles | 39 (35.1%) | 7 (58.3%) |
| 3 or more Vehicles | 27 (24.3%) | 5 (41.7%) |
| Total | 111 (100.0%) | 12 (100.0%) |
Real Estate & Mortgages in Lakeview Heights
Real Estate and Mortgage Overview in Lakeview Heights
| Characteristic | Without Mortgage | With Mortgage |
| Housing Units | 59 | 52 |
| Median Property Value | $148,700 | $186,500 |
| Median Household Income | - | - |
| Monthly Housing Costs | $369 | $0 |
| Real Estate Taxes | - | - |
Property Value by Mortgage Status in Lakeview Heights
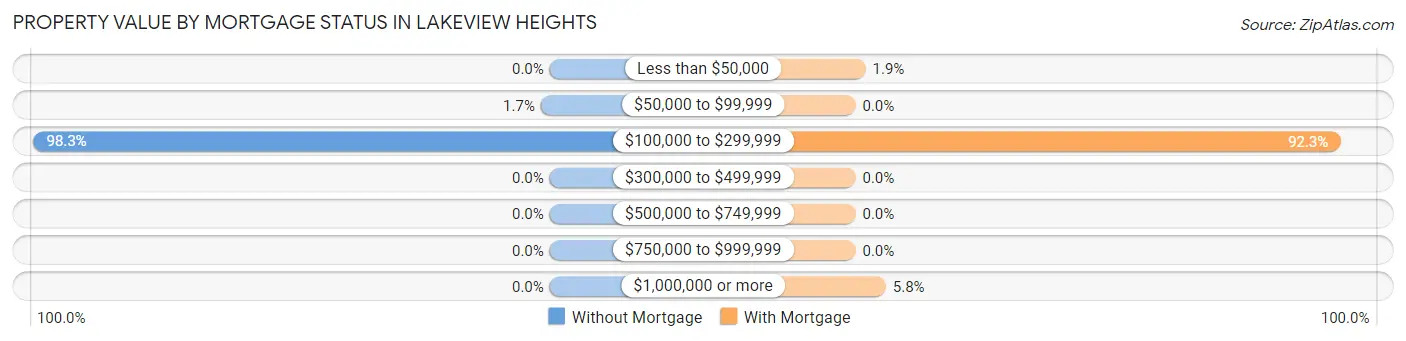
| Property Value | Without Mortgage | With Mortgage |
| Less than $50,000 | 0 (0.0%) | 1 (1.9%) |
| $50,000 to $99,999 | 1 (1.7%) | 0 (0.0%) |
| $100,000 to $299,999 | 58 (98.3%) | 48 (92.3%) |
| $300,000 to $499,999 | 0 (0.0%) | 0 (0.0%) |
| $500,000 to $749,999 | 0 (0.0%) | 0 (0.0%) |
| $750,000 to $999,999 | 0 (0.0%) | 0 (0.0%) |
| $1,000,000 or more | 0 (0.0%) | 3 (5.8%) |
| Total | 59 (100.0%) | 52 (100.0%) |
Household Income by Mortgage Status in Lakeview Heights
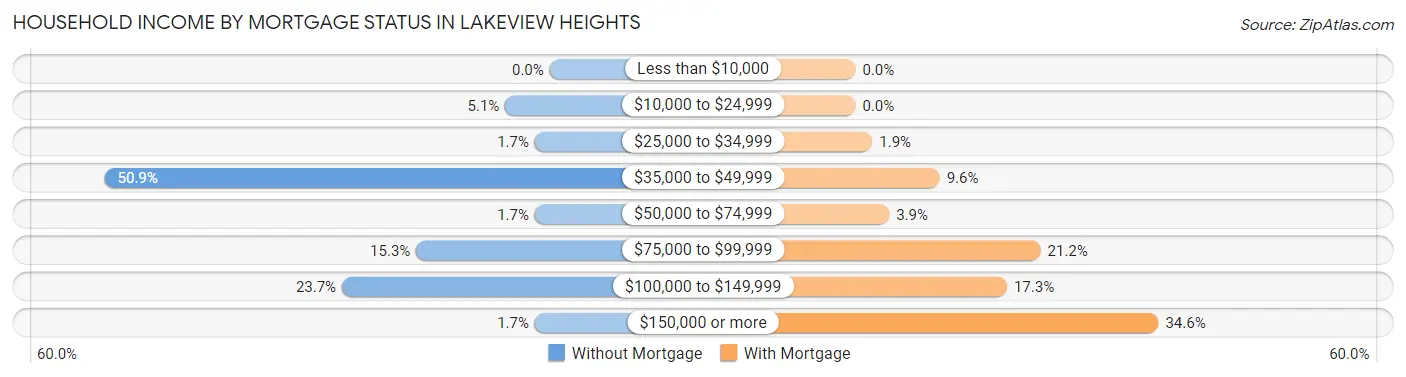
| Household Income | Without Mortgage | With Mortgage |
| Less than $10,000 | 0 (0.0%) | 0 (0.0%) |
| $10,000 to $24,999 | 3 (5.1%) | 0 (0.0%) |
| $25,000 to $34,999 | 1 (1.7%) | 1 (1.9%) |
| $35,000 to $49,999 | 30 (50.8%) | 5 (9.6%) |
| $50,000 to $74,999 | 1 (1.7%) | 2 (3.8%) |
| $75,000 to $99,999 | 9 (15.2%) | 11 (21.1%) |
| $100,000 to $149,999 | 14 (23.7%) | 9 (17.3%) |
| $150,000 or more | 1 (1.7%) | 18 (34.6%) |
| Total | 59 (100.0%) | 52 (100.0%) |
Property Value to Household Income Ratio in Lakeview Heights
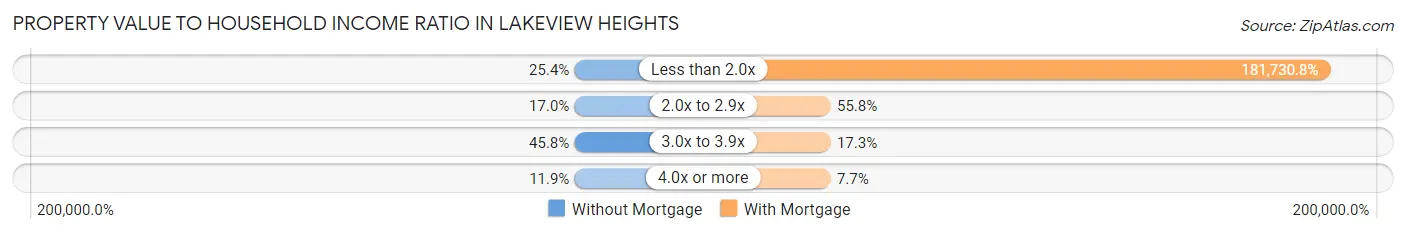
| Value-to-Income Ratio | Without Mortgage | With Mortgage |
| Less than 2.0x | 15 (25.4%) | 94,500 (181,730.8%) |
| 2.0x to 2.9x | 10 (17.0%) | 29 (55.8%) |
| 3.0x to 3.9x | 27 (45.8%) | 9 (17.3%) |
| 4.0x or more | 7 (11.9%) | 4 (7.7%) |
| Total | 59 (100.0%) | 52 (100.0%) |
Real Estate Taxes by Mortgage Status in Lakeview Heights
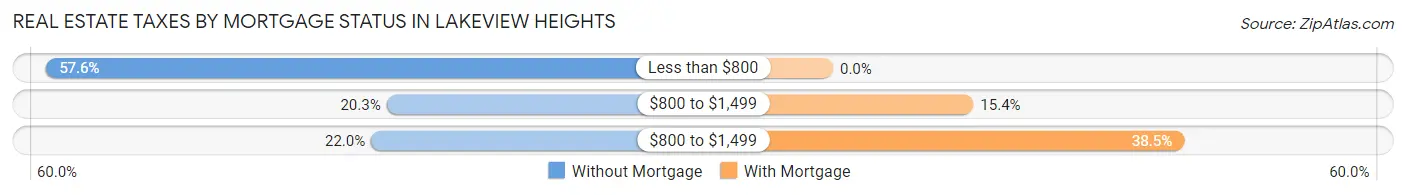
| Property Taxes | Without Mortgage | With Mortgage |
| Less than $800 | 34 (57.6%) | 0 (0.0%) |
| $800 to $1,499 | 12 (20.3%) | 8 (15.4%) |
| $800 to $1,499 | 13 (22.0%) | 20 (38.5%) |
| Total | 59 (100.0%) | 52 (100.0%) |
Health & Disability in Lakeview Heights
Health Insurance Coverage by Age in Lakeview Heights
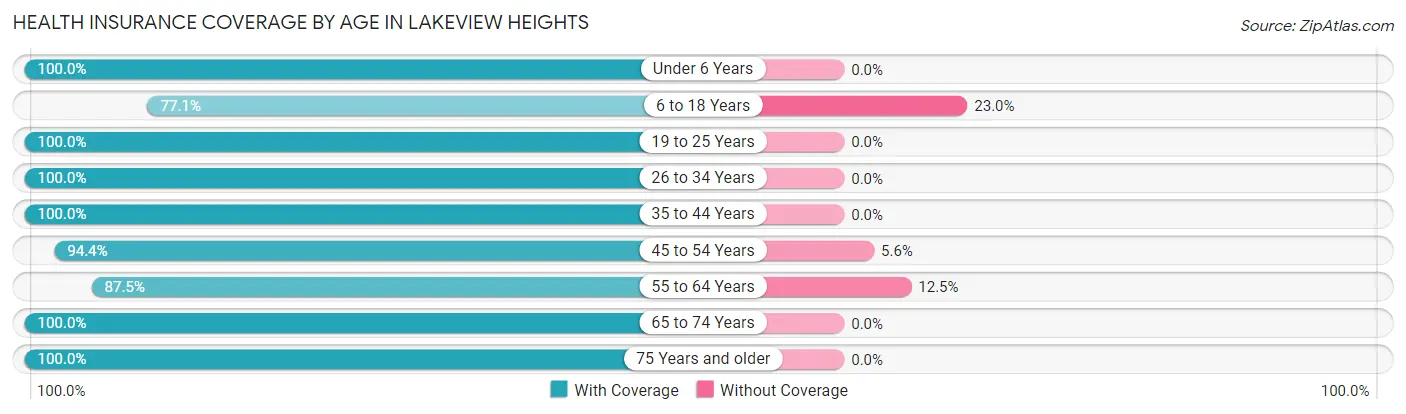
| Age Bracket | With Coverage | Without Coverage |
| Under 6 Years | 14 (100.0%) | 0 (0.0%) |
| 6 to 18 Years | 47 (77.0%) | 14 (23.0%) |
| 19 to 25 Years | 41 (100.0%) | 0 (0.0%) |
| 26 to 34 Years | 10 (100.0%) | 0 (0.0%) |
| 35 to 44 Years | 23 (100.0%) | 0 (0.0%) |
| 45 to 54 Years | 34 (94.4%) | 2 (5.6%) |
| 55 to 64 Years | 28 (87.5%) | 4 (12.5%) |
| 65 to 74 Years | 35 (100.0%) | 0 (0.0%) |
| 75 Years and older | 104 (100.0%) | 0 (0.0%) |
| Total | 336 (94.4%) | 20 (5.6%) |
Health Insurance Coverage by Citizenship Status in Lakeview Heights
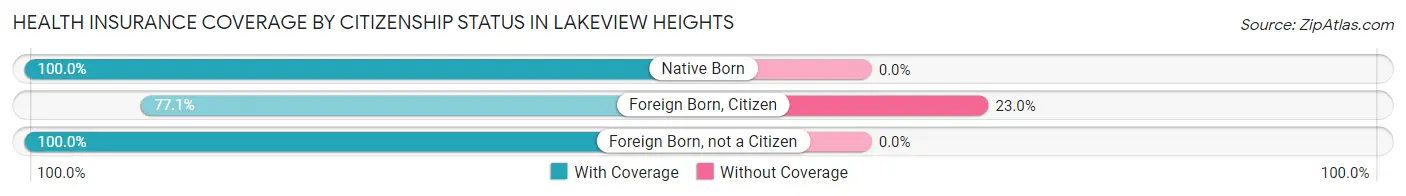
| Citizenship Status | With Coverage | Without Coverage |
| Native Born | 14 (100.0%) | 0 (0.0%) |
| Foreign Born, Citizen | 47 (77.0%) | 14 (23.0%) |
| Foreign Born, not a Citizen | 41 (100.0%) | 0 (0.0%) |
Health Insurance Coverage by Household Income in Lakeview Heights
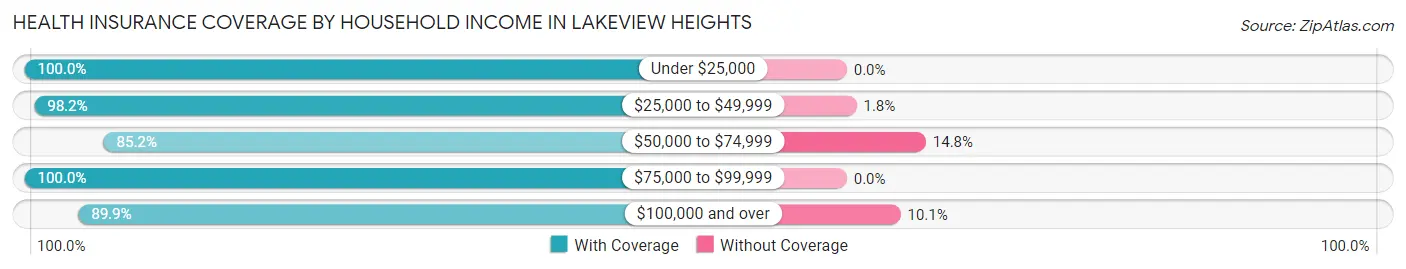
| Household Income | With Coverage | Without Coverage |
| Under $25,000 | 6 (100.0%) | 0 (0.0%) |
| $25,000 to $49,999 | 108 (98.2%) | 2 (1.8%) |
| $50,000 to $74,999 | 23 (85.2%) | 4 (14.8%) |
| $75,000 to $99,999 | 74 (100.0%) | 0 (0.0%) |
| $100,000 and over | 125 (89.9%) | 14 (10.1%) |
Public vs Private Health Insurance Coverage by Age in Lakeview Heights
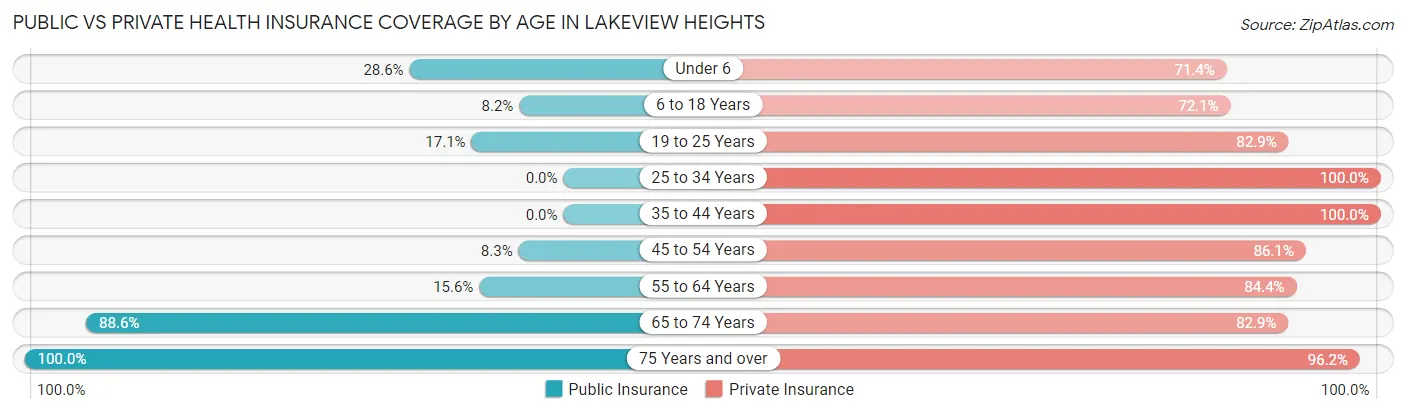
| Age Bracket | Public Insurance | Private Insurance |
| Under 6 | 4 (28.6%) | 10 (71.4%) |
| 6 to 18 Years | 5 (8.2%) | 44 (72.1%) |
| 19 to 25 Years | 7 (17.1%) | 34 (82.9%) |
| 25 to 34 Years | 0 (0.0%) | 10 (100.0%) |
| 35 to 44 Years | 0 (0.0%) | 23 (100.0%) |
| 45 to 54 Years | 3 (8.3%) | 31 (86.1%) |
| 55 to 64 Years | 5 (15.6%) | 27 (84.4%) |
| 65 to 74 Years | 31 (88.6%) | 29 (82.9%) |
| 75 Years and over | 104 (100.0%) | 100 (96.2%) |
| Total | 159 (44.7%) | 308 (86.5%) |
Disability Status by Sex by Age in Lakeview Heights
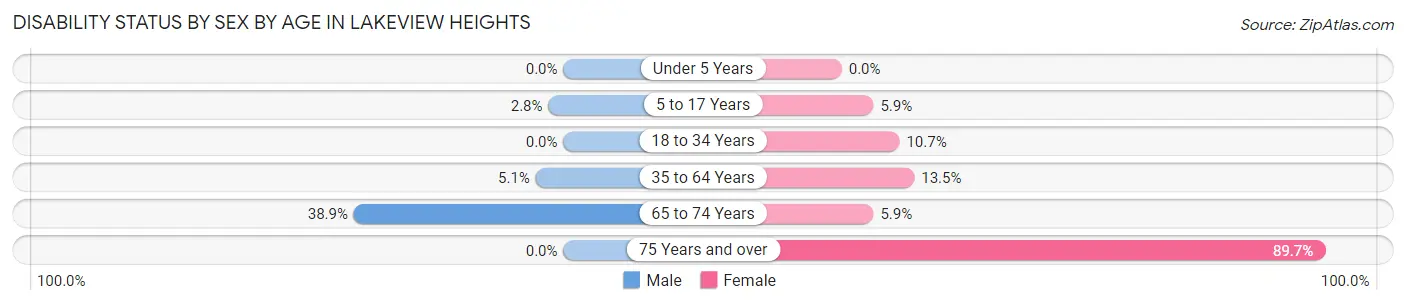
| Age Bracket | Male | Female |
| Under 5 Years | 0 (0.0%) | 0 (0.0%) |
| 5 to 17 Years | 1 (2.8%) | 1 (5.9%) |
| 18 to 34 Years | 0 (0.0%) | 3 (10.7%) |
| 35 to 64 Years | 2 (5.1%) | 7 (13.5%) |
| 65 to 74 Years | 7 (38.9%) | 1 (5.9%) |
| 75 Years and over | 0 (0.0%) | 87 (89.7%) |
Disability Class by Sex by Age in Lakeview Heights
Disability Class: Hearing Difficulty
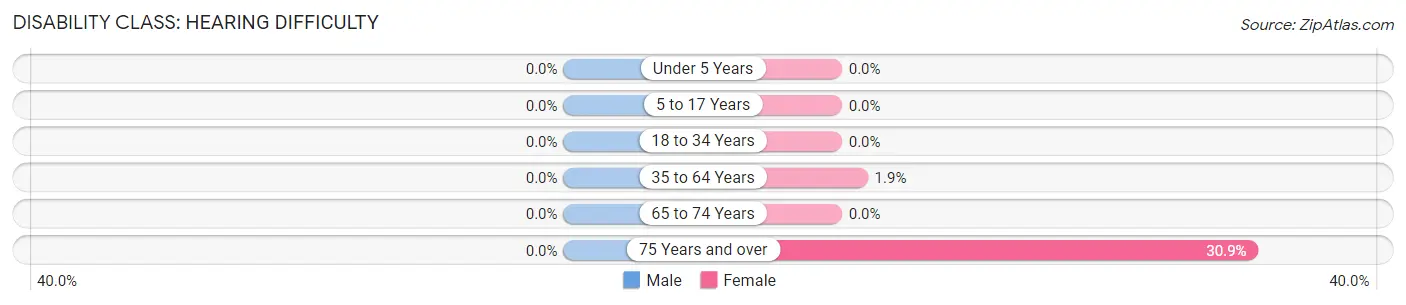
| Age Bracket | Male | Female |
| Under 5 Years | 0 (0.0%) | 0 (0.0%) |
| 5 to 17 Years | 0 (0.0%) | 0 (0.0%) |
| 18 to 34 Years | 0 (0.0%) | 0 (0.0%) |
| 35 to 64 Years | 0 (0.0%) | 1 (1.9%) |
| 65 to 74 Years | 0 (0.0%) | 0 (0.0%) |
| 75 Years and over | 0 (0.0%) | 30 (30.9%) |
Disability Class: Vision Difficulty
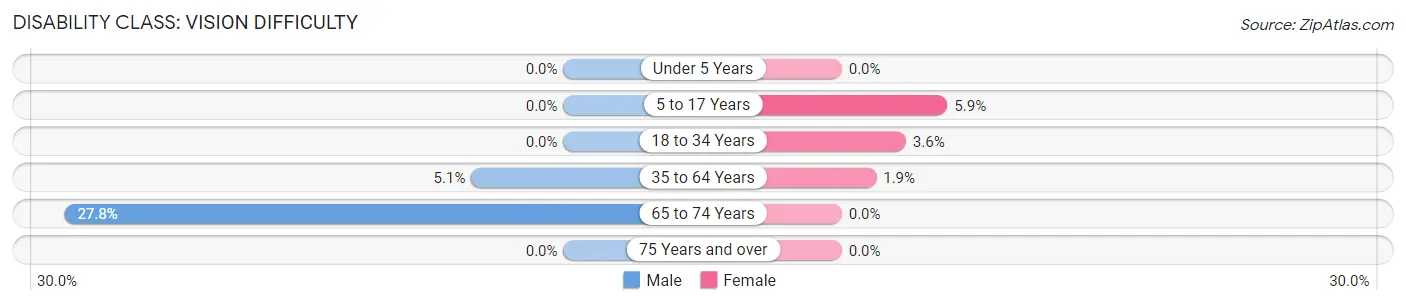
| Age Bracket | Male | Female |
| Under 5 Years | 0 (0.0%) | 0 (0.0%) |
| 5 to 17 Years | 0 (0.0%) | 1 (5.9%) |
| 18 to 34 Years | 0 (0.0%) | 1 (3.6%) |
| 35 to 64 Years | 2 (5.1%) | 1 (1.9%) |
| 65 to 74 Years | 5 (27.8%) | 0 (0.0%) |
| 75 Years and over | 0 (0.0%) | 0 (0.0%) |
Disability Class: Cognitive Difficulty
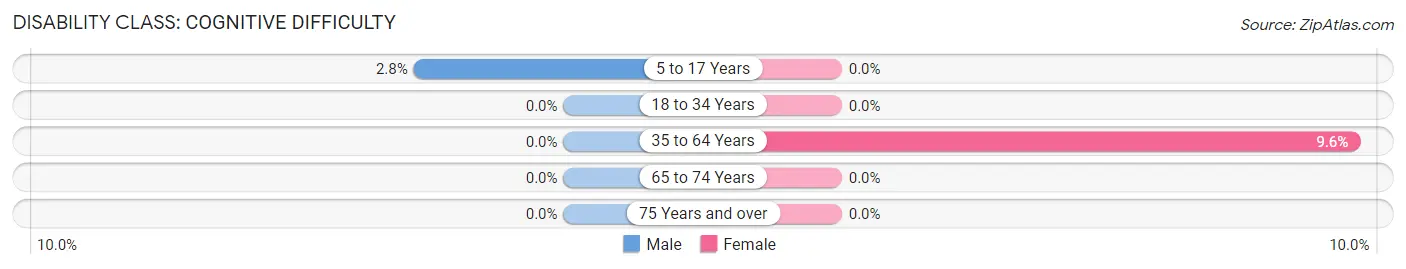
| Age Bracket | Male | Female |
| 5 to 17 Years | 1 (2.8%) | 0 (0.0%) |
| 18 to 34 Years | 0 (0.0%) | 0 (0.0%) |
| 35 to 64 Years | 0 (0.0%) | 5 (9.6%) |
| 65 to 74 Years | 0 (0.0%) | 0 (0.0%) |
| 75 Years and over | 0 (0.0%) | 0 (0.0%) |
Disability Class: Ambulatory Difficulty
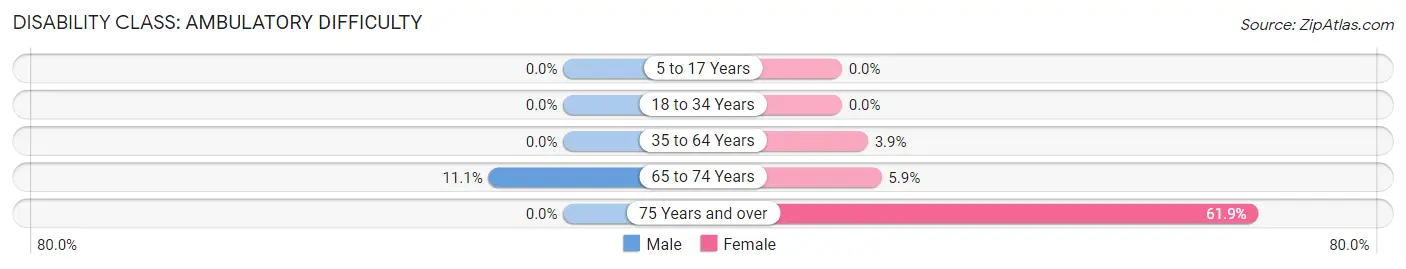
| Age Bracket | Male | Female |
| 5 to 17 Years | 0 (0.0%) | 0 (0.0%) |
| 18 to 34 Years | 0 (0.0%) | 0 (0.0%) |
| 35 to 64 Years | 0 (0.0%) | 2 (3.8%) |
| 65 to 74 Years | 2 (11.1%) | 1 (5.9%) |
| 75 Years and over | 0 (0.0%) | 60 (61.9%) |
Disability Class: Self-Care Difficulty
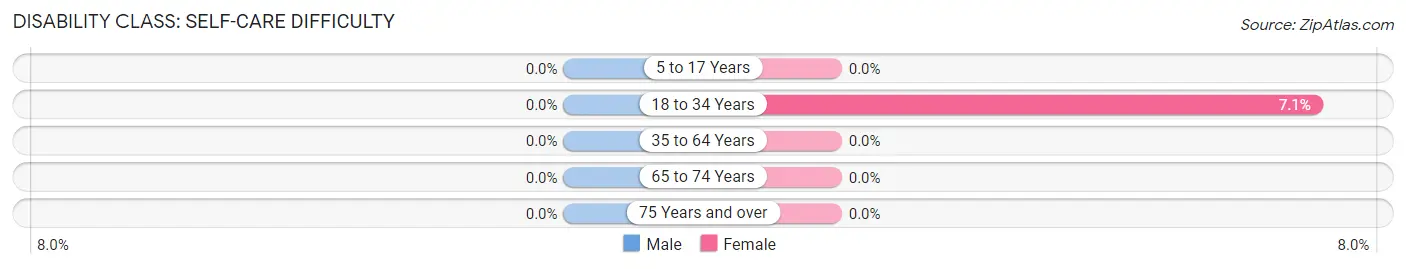
| Age Bracket | Male | Female |
| 5 to 17 Years | 0 (0.0%) | 0 (0.0%) |
| 18 to 34 Years | 0 (0.0%) | 2 (7.1%) |
| 35 to 64 Years | 0 (0.0%) | 0 (0.0%) |
| 65 to 74 Years | 0 (0.0%) | 0 (0.0%) |
| 75 Years and over | 0 (0.0%) | 0 (0.0%) |
Technology Access in Lakeview Heights
Computing Device Access in Lakeview Heights
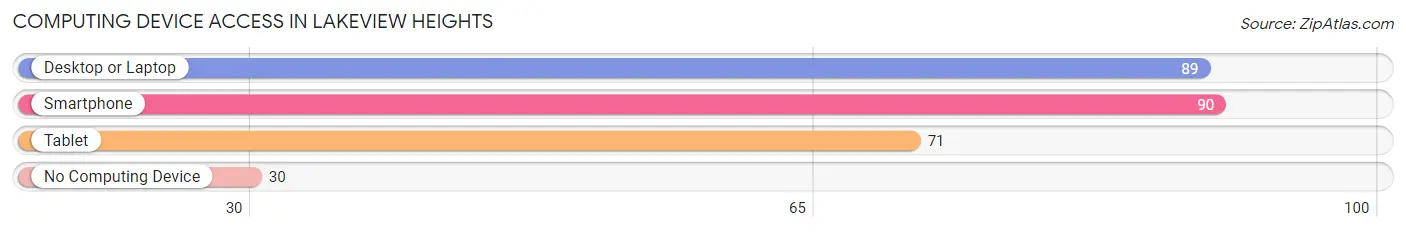
| Device Type | # Households | % Households |
| Desktop or Laptop | 89 | 72.4% |
| Smartphone | 90 | 73.2% |
| Tablet | 71 | 57.7% |
| No Computing Device | 30 | 24.4% |
| Total | 123 | 100.0% |
Internet Access in Lakeview Heights
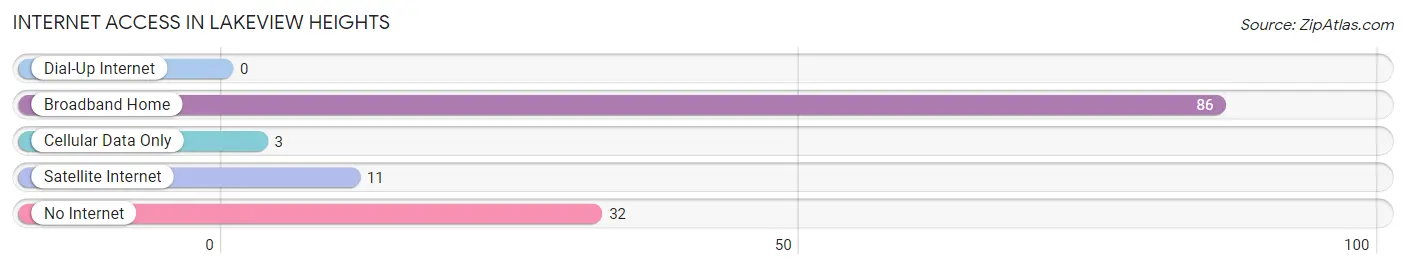
| Internet Type | # Households | % Households |
| Dial-Up Internet | 0 | 0.0% |
| Broadband Home | 86 | 69.9% |
| Cellular Data Only | 3 | 2.4% |
| Satellite Internet | 11 | 8.9% |
| No Internet | 32 | 26.0% |
| Total | 123 | 100.0% |
Lakeview Heights Summary
Introduction
Located in the heart of Kentucky, Lakeview Heights is a small rural community with a population of just over 1,000 people. The area is known for its rolling hills, lush forests, and picturesque lake. It is a popular destination for outdoor recreation, such as fishing, hunting, and camping. The area is also home to a variety of wildlife, including deer, turkey, and other small game.
History
The area now known as Lakeview Heights was first settled in the early 1800s by a group of settlers from Virginia. The settlers were attracted to the area due to its abundance of natural resources, such as timber and game. The area was originally known as “The Heights” due to its high elevation. In the late 1800s, the area was renamed “Lakeview Heights” due to its proximity to a nearby lake.
The area was primarily an agricultural community until the early 1900s, when the first coal mine was opened. This led to an influx of miners and their families, which helped to spur the growth of the area. The coal industry continued to be a major part of the local economy until the late 1970s, when the last mine closed.
Geography
Lakeview Heights is located in the western part of Kentucky, in the foothills of the Appalachian Mountains. The area is characterized by rolling hills, lush forests, and a variety of wildlife. The area is also home to a number of lakes, including Lakeview Lake, which is the largest in the area.
The climate in Lakeview Heights is generally mild, with temperatures ranging from the low 30s in the winter to the mid-80s in the summer. The area receives an average of 45 inches of rain per year, with most of it falling in the spring and summer months.
Economy
The economy of Lakeview Heights is primarily based on agriculture and tourism. The area is home to a number of farms, which produce a variety of crops, including corn, soybeans, and hay. The area is also home to a number of tourist attractions, such as the Lakeview Lake State Park, which offers a variety of outdoor activities, including fishing, camping, and hiking.
In addition to agriculture and tourism, the area is also home to a number of small businesses, such as restaurants, convenience stores, and gas stations. The area is also home to a number of manufacturing companies, which produce a variety of products, including furniture, clothing, and automotive parts.
Demographics
As of the 2010 census, the population of Lakeview Heights was 1,072. The population is primarily white (94.3%), with a small percentage of African Americans (2.7%) and Hispanics (1.7%). The median household income in the area is $37,000, and the median age is 44.
Conclusion
Lakeview Heights is a small rural community located in the western part of Kentucky. The area is known for its rolling hills, lush forests, and picturesque lake. The economy of the area is primarily based on agriculture and tourism, and the population is primarily white. The area is a popular destination for outdoor recreation, and is home to a variety of wildlife.
Common Questions
What is Per Capita Income in Lakeview Heights?
Per Capita income in Lakeview Heights is $34,124.
What is the Median Family Income in Lakeview Heights?
Median Family Income in Lakeview Heights is $83,000.
What is the Median Household income in Lakeview Heights?
Median Household Income in Lakeview Heights is $76,964.
What is Income or Wage Gap in Lakeview Heights?
Income or Wage Gap in Lakeview Heights is 27.8%.
Women in Lakeview Heights earn 72.2 cents for every dollar earned by a man.
What is Inequality or Gini Index in Lakeview Heights?
Inequality or Gini Index in Lakeview Heights is 0.32.
What is the Total Population of Lakeview Heights?
Total Population of Lakeview Heights is 356.
What is the Total Male Population of Lakeview Heights?
Total Male Population of Lakeview Heights is 140.
What is the Total Female Population of Lakeview Heights?
Total Female Population of Lakeview Heights is 216.
What is the Ratio of Males per 100 Females in Lakeview Heights?
There are 64.81 Males per 100 Females in Lakeview Heights.
What is the Ratio of Females per 100 Males in Lakeview Heights?
There are 154.29 Females per 100 Males in Lakeview Heights.
What is the Median Population Age in Lakeview Heights?
Median Population Age in Lakeview Heights is 52.7 Years.
What is the Average Family Size in Lakeview Heights
Average Family Size in Lakeview Heights is 3.2 People.
What is the Average Household Size in Lakeview Heights
Average Household Size in Lakeview Heights is 2.9 People.
How Large is the Labor Force in Lakeview Heights?
There are 140 People in the Labor Forcein in Lakeview Heights.
What is the Percentage of People in the Labor Force in Lakeview Heights?
46.2% of People are in the Labor Force in Lakeview Heights.
What is the Unemployment Rate in Lakeview Heights?
Unemployment Rate in Lakeview Heights is 2.9%.