Fort Thomas, KY Map & Demographics
Fort Thomas Map
Fort Thomas Overview
$49,691
PER CAPITA INCOME
$127,419
AVG FAMILY INCOME
$95,391
AVG HOUSEHOLD INCOME
30.7%
WAGE / INCOME GAP [ % ]
69.3¢/ $1
WAGE / INCOME GAP [ $ ]
$8,507
FAMILY INCOME DEFICIT
0.48
INEQUALITY / GINI INDEX
17,310
TOTAL POPULATION
8,744
MALE POPULATION
8,566
FEMALE POPULATION
102.08
MALES / 100 FEMALES
97.96
FEMALES / 100 MALES
37.9
MEDIAN AGE
3.2
AVG FAMILY SIZE
2.6
AVG HOUSEHOLD SIZE
9,063
LABOR FORCE [ PEOPLE ]
68.6%
PERCENT IN LABOR FORCE
3.8%
UNEMPLOYMENT RATE
Fort Thomas Zip Codes
Fort Thomas Area Codes
Income in Fort Thomas
Income Overview in Fort Thomas
Per Capita Income in Fort Thomas is $49,691, while median incomes of families and households are $127,419 and $95,391 respectively.
| Characteristic | Number | Measure |
| Per Capita Income | 17,310 | $49,691 |
| Median Family Income | 4,479 | $127,419 |
| Mean Family Income | 4,479 | $156,216 |
| Median Household Income | 6,512 | $95,391 |
| Mean Household Income | 6,512 | $128,825 |
| Income Deficit | 4,479 | $8,507 |
| Wage / Income Gap (%) | 17,310 | 30.67% |
| Wage / Income Gap ($) | 17,310 | 69.33¢ per $1 |
| Gini / Inequality Index | 17,310 | 0.48 |
Earnings by Sex in Fort Thomas
Average Earnings in Fort Thomas are $48,442, $57,979 for men and $40,195 for women, a difference of 30.7%.
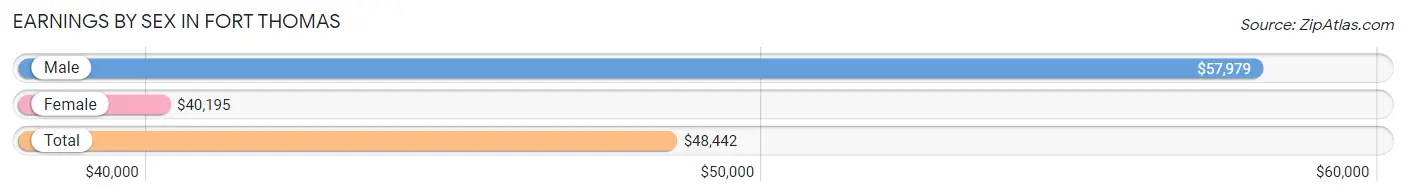
| Sex | Number | Average Earnings |
| Male | 5,221 (54.2%) | $57,979 |
| Female | 4,418 (45.8%) | $40,195 |
| Total | 9,639 (100.0%) | $48,442 |
Earnings by Sex by Income Bracket in Fort Thomas
The most common earnings brackets in Fort Thomas are $100,000+ for men (1,294 | 24.8%) and $100,000+ for women (588 | 13.3%).
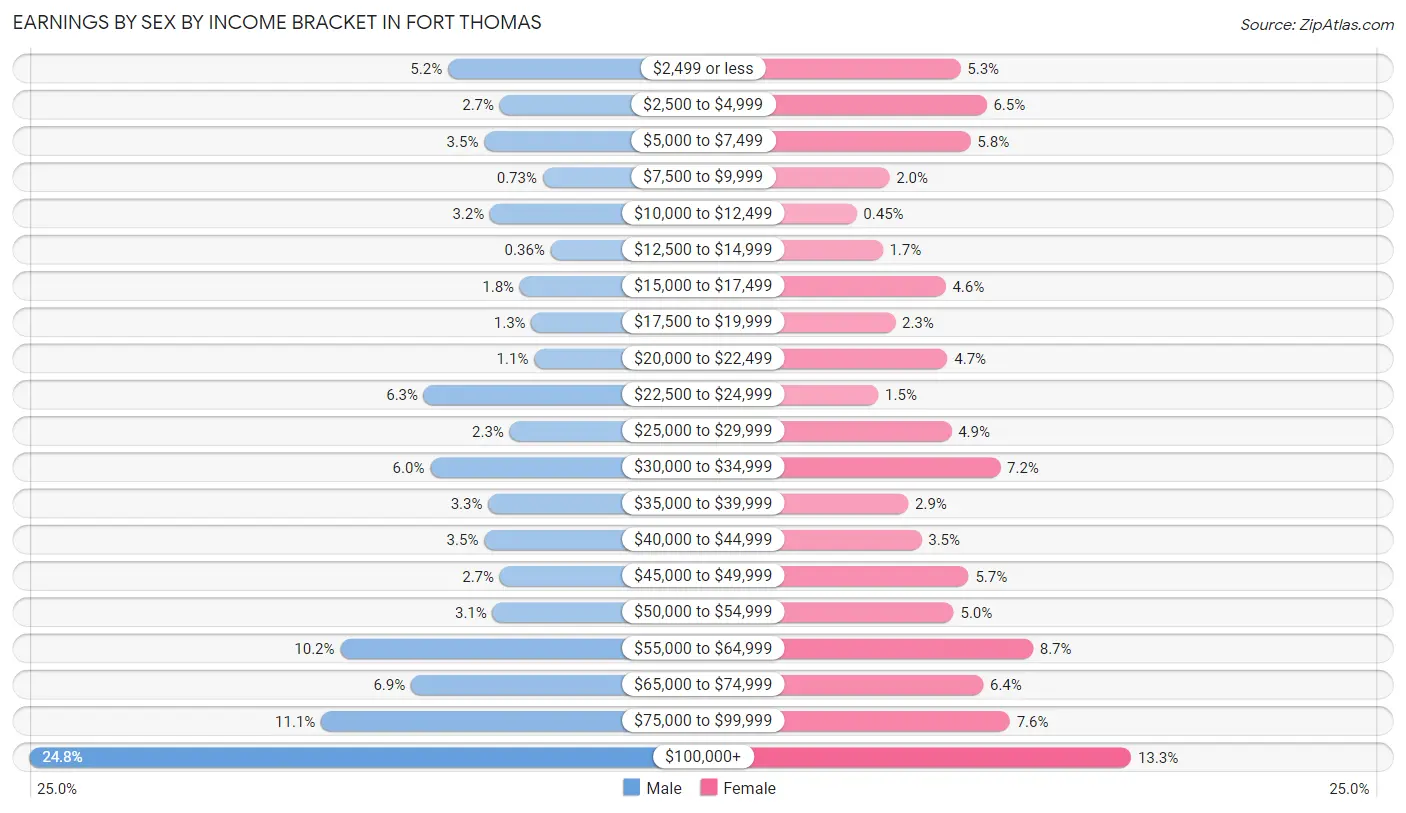
| Income | Male | Female |
| $2,499 or less | 270 (5.2%) | 235 (5.3%) |
| $2,500 to $4,999 | 143 (2.7%) | 289 (6.5%) |
| $5,000 to $7,499 | 181 (3.5%) | 256 (5.8%) |
| $7,500 to $9,999 | 38 (0.7%) | 88 (2.0%) |
| $10,000 to $12,499 | 167 (3.2%) | 20 (0.4%) |
| $12,500 to $14,999 | 19 (0.4%) | 74 (1.7%) |
| $15,000 to $17,499 | 94 (1.8%) | 204 (4.6%) |
| $17,500 to $19,999 | 66 (1.3%) | 100 (2.3%) |
| $20,000 to $22,499 | 59 (1.1%) | 208 (4.7%) |
| $22,500 to $24,999 | 329 (6.3%) | 65 (1.5%) |
| $25,000 to $29,999 | 119 (2.3%) | 216 (4.9%) |
| $30,000 to $34,999 | 313 (6.0%) | 317 (7.2%) |
| $35,000 to $39,999 | 171 (3.3%) | 127 (2.9%) |
| $40,000 to $44,999 | 181 (3.5%) | 154 (3.5%) |
| $45,000 to $49,999 | 143 (2.7%) | 252 (5.7%) |
| $50,000 to $54,999 | 161 (3.1%) | 221 (5.0%) |
| $55,000 to $64,999 | 533 (10.2%) | 385 (8.7%) |
| $65,000 to $74,999 | 360 (6.9%) | 282 (6.4%) |
| $75,000 to $99,999 | 580 (11.1%) | 337 (7.6%) |
| $100,000+ | 1,294 (24.8%) | 588 (13.3%) |
| Total | 5,221 (100.0%) | 4,418 (100.0%) |
Earnings by Sex by Educational Attainment in Fort Thomas
Average earnings in Fort Thomas are $62,810 for men and $46,687 for women, a difference of 25.7%. Men with an educational attainment of graduate degree enjoy the highest average annual earnings of $98,393, while those with less than high school education earn the least with $40,066. Women with an educational attainment of graduate degree earn the most with the average annual earnings of $67,708, while those with high school diploma education have the smallest earnings of $30,319.
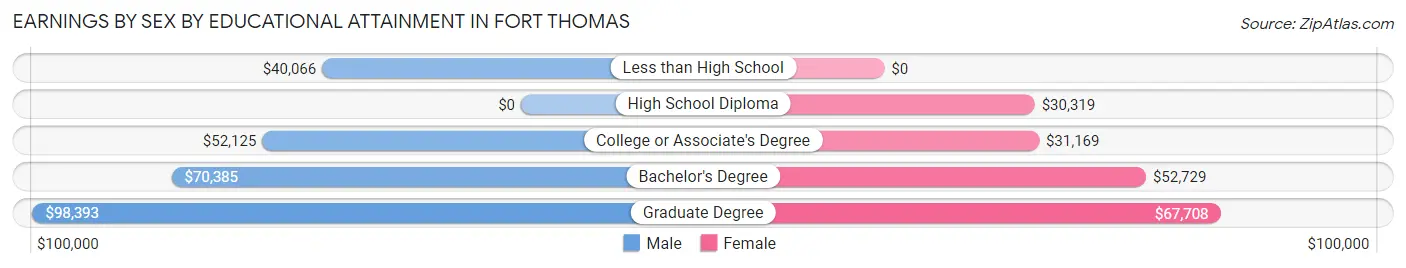
| Educational Attainment | Male Income | Female Income |
| Less than High School | $40,066 | $0 |
| High School Diploma | - | - |
| College or Associate's Degree | $52,125 | $31,169 |
| Bachelor's Degree | $70,385 | $52,729 |
| Graduate Degree | $98,393 | $67,708 |
| Total | $62,810 | $46,687 |
Family Income in Fort Thomas
Family Income Brackets in Fort Thomas
According to the Fort Thomas family income data, there are 1,285 families falling into the $100,000 to $149,999 income range, which is the most common income bracket and makes up 28.7% of all families. Conversely, the less than $10,000 income bracket is the least frequent group with only 36 families (0.8%) belonging to this category.
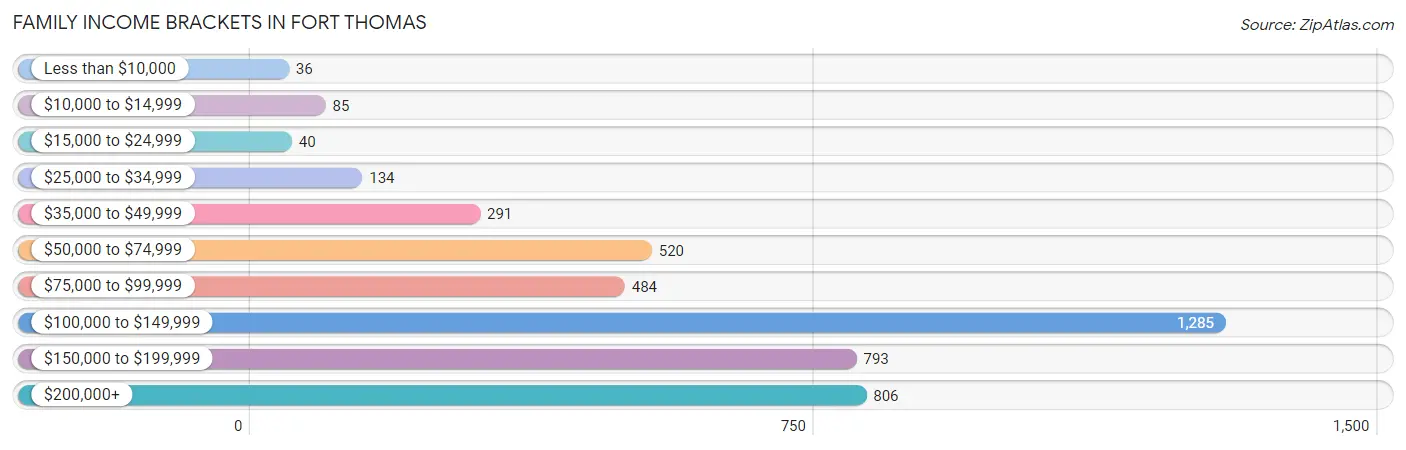
| Income Bracket | # Families | % Families |
| Less than $10,000 | 36 | 0.8% |
| $10,000 to $14,999 | 85 | 1.9% |
| $15,000 to $24,999 | 40 | 0.9% |
| $25,000 to $34,999 | 134 | 3.0% |
| $35,000 to $49,999 | 291 | 6.5% |
| $50,000 to $74,999 | 520 | 11.6% |
| $75,000 to $99,999 | 484 | 10.8% |
| $100,000 to $149,999 | 1,285 | 28.7% |
| $150,000 to $199,999 | 793 | 17.7% |
| $200,000+ | 806 | 18.0% |
Family Income by Famaliy Size in Fort Thomas
7+ person families (142 | 3.2%) account for the highest median family income in Fort Thomas with $189,741 per family, while 2-person families (1,918 | 42.8%) have the highest median income of $50,191 per family member.
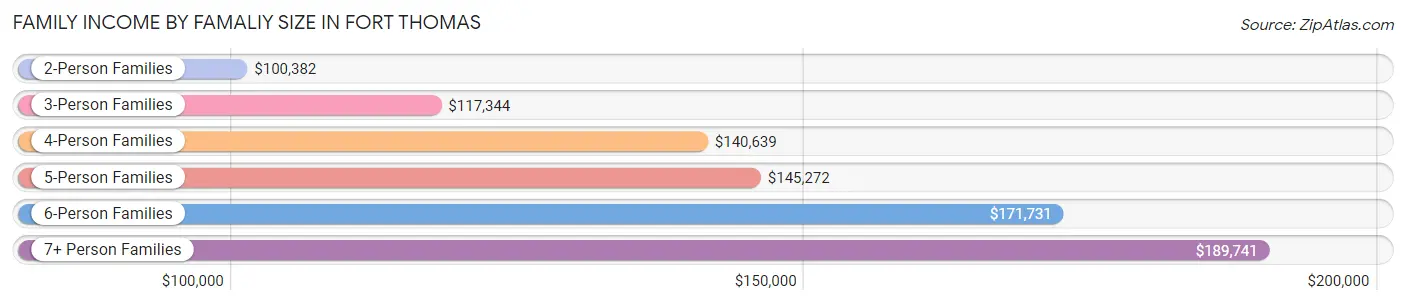
| Income Bracket | # Families | Median Income |
| 2-Person Families | 1,918 (42.8%) | $100,382 |
| 3-Person Families | 917 (20.5%) | $117,344 |
| 4-Person Families | 1,009 (22.5%) | $140,639 |
| 5-Person Families | 333 (7.4%) | $145,272 |
| 6-Person Families | 160 (3.6%) | $171,731 |
| 7+ Person Families | 142 (3.2%) | $189,741 |
| Total | 4,479 (100.0%) | $127,419 |
Family Income by Number of Earners in Fort Thomas
The median family income in Fort Thomas is $127,419, with families comprising 3+ earners (632) having the highest median family income of $165,000, while families with no earners (381) have the lowest median family income of $64,625, accounting for 14.1% and 8.5% of families, respectively.
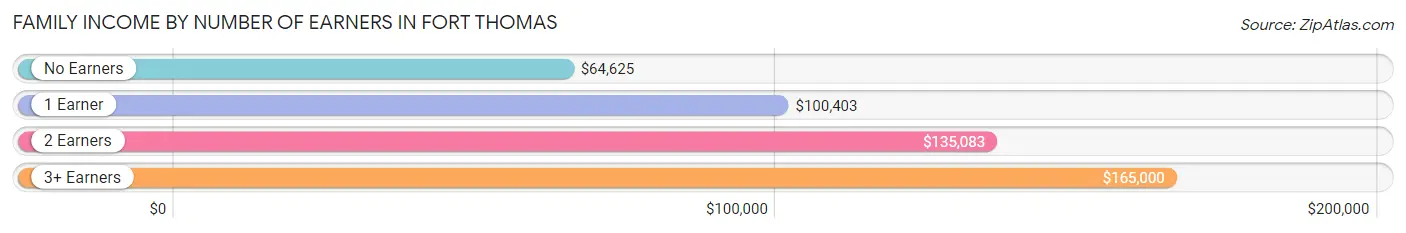
| Number of Earners | # Families | Median Income |
| No Earners | 381 (8.5%) | $64,625 |
| 1 Earner | 1,391 (31.1%) | $100,403 |
| 2 Earners | 2,075 (46.3%) | $135,083 |
| 3+ Earners | 632 (14.1%) | $165,000 |
| Total | 4,479 (100.0%) | $127,419 |
Household Income in Fort Thomas
Household Income Brackets in Fort Thomas
With 1,394 households falling in the category, the $100,000 to $149,999 income range is the most frequent in Fort Thomas, accounting for 21.4% of all households. In contrast, only 202 households (3.1%) fall into the $10,000 to $14,999 income bracket, making it the least populous group.
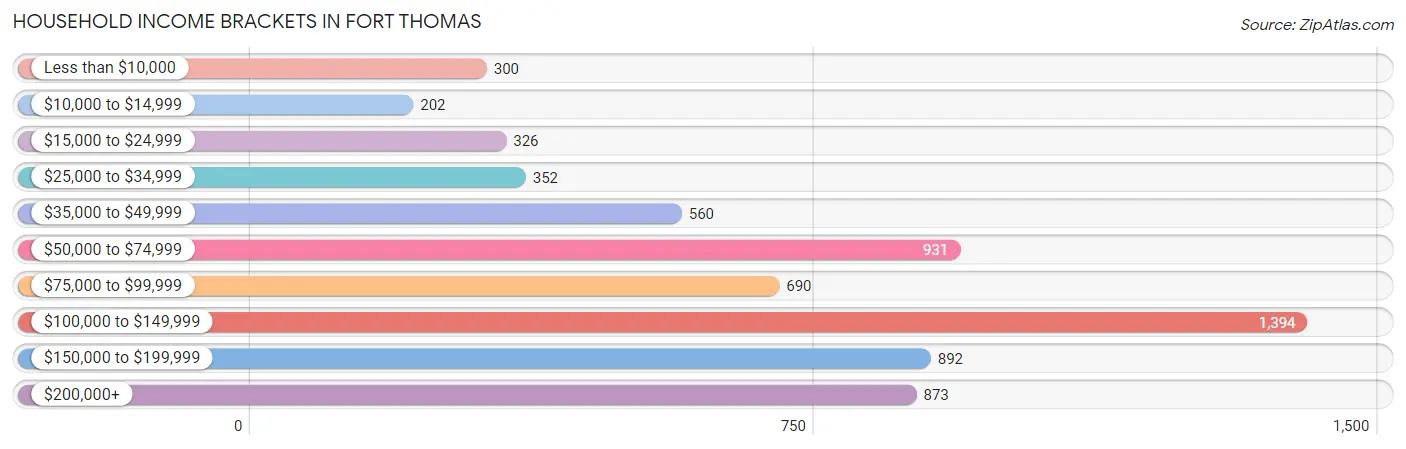
| Income Bracket | # Households | % Households |
| Less than $10,000 | 300 | 4.6% |
| $10,000 to $14,999 | 202 | 3.1% |
| $15,000 to $24,999 | 326 | 5.0% |
| $25,000 to $34,999 | 352 | 5.4% |
| $35,000 to $49,999 | 560 | 8.6% |
| $50,000 to $74,999 | 931 | 14.3% |
| $75,000 to $99,999 | 690 | 10.6% |
| $100,000 to $149,999 | 1,394 | 21.4% |
| $150,000 to $199,999 | 892 | 13.7% |
| $200,000+ | 873 | 13.4% |
Household Income by Householder Age in Fort Thomas
The median household income in Fort Thomas is $95,391, with the highest median household income of $118,325 found in the 45 to 64 years age bracket for the primary householder. A total of 2,427 households (37.3%) fall into this category. Meanwhile, the 15 to 24 years age bracket for the primary householder has the lowest median household income of $45,250, with 190 households (2.9%) in this group.
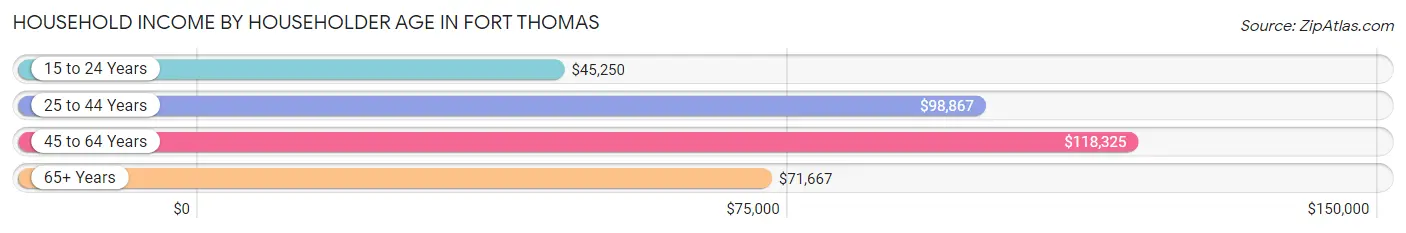
| Income Bracket | # Households | Median Income |
| 15 to 24 Years | 190 (2.9%) | $45,250 |
| 25 to 44 Years | 2,213 (34.0%) | $98,867 |
| 45 to 64 Years | 2,427 (37.3%) | $118,325 |
| 65+ Years | 1,682 (25.8%) | $71,667 |
| Total | 6,512 (100.0%) | $95,391 |
Poverty in Fort Thomas
Income Below Poverty by Sex and Age in Fort Thomas
With 5.5% poverty level for males and 6.4% for females among the residents of Fort Thomas, 15 year old males and 18 to 24 year old females are the most vulnerable to poverty, with 18 males (13.7%) and 108 females (24.9%) in their respective age groups living below the poverty level.
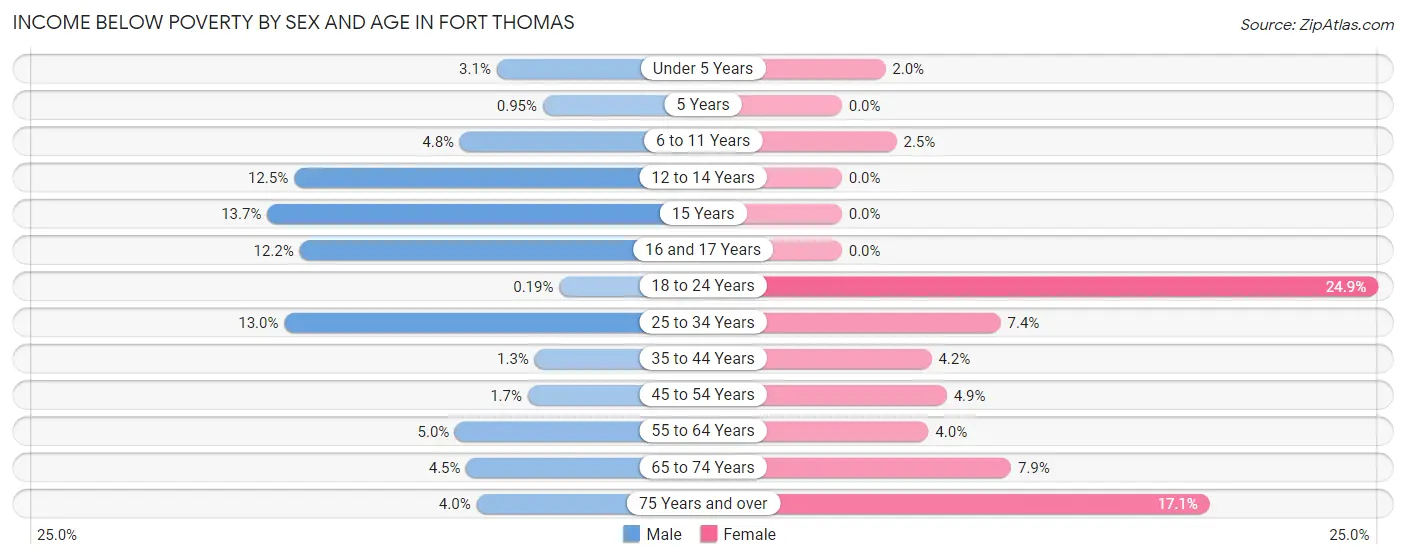
| Age Bracket | Male | Female |
| Under 5 Years | 14 (3.1%) | 10 (2.0%) |
| 5 Years | 1 (0.9%) | 0 (0.0%) |
| 6 to 11 Years | 54 (4.8%) | 23 (2.5%) |
| 12 to 14 Years | 43 (12.5%) | 0 (0.0%) |
| 15 Years | 18 (13.7%) | 0 (0.0%) |
| 16 and 17 Years | 36 (12.2%) | 0 (0.0%) |
| 18 to 24 Years | 1 (0.2%) | 108 (24.9%) |
| 25 to 34 Years | 167 (13.0%) | 82 (7.4%) |
| 35 to 44 Years | 13 (1.3%) | 40 (4.2%) |
| 45 to 54 Years | 19 (1.7%) | 63 (4.9%) |
| 55 to 64 Years | 56 (5.0%) | 41 (4.0%) |
| 65 to 74 Years | 37 (4.5%) | 59 (7.9%) |
| 75 Years and over | 11 (4.0%) | 106 (17.1%) |
| Total | 470 (5.5%) | 532 (6.4%) |
Income Above Poverty by Sex and Age in Fort Thomas
According to the poverty statistics in Fort Thomas, males aged 18 to 24 years and females aged 5 years are the age groups that are most secure financially, with 99.8% of males and 100.0% of females in these age groups living above the poverty line.
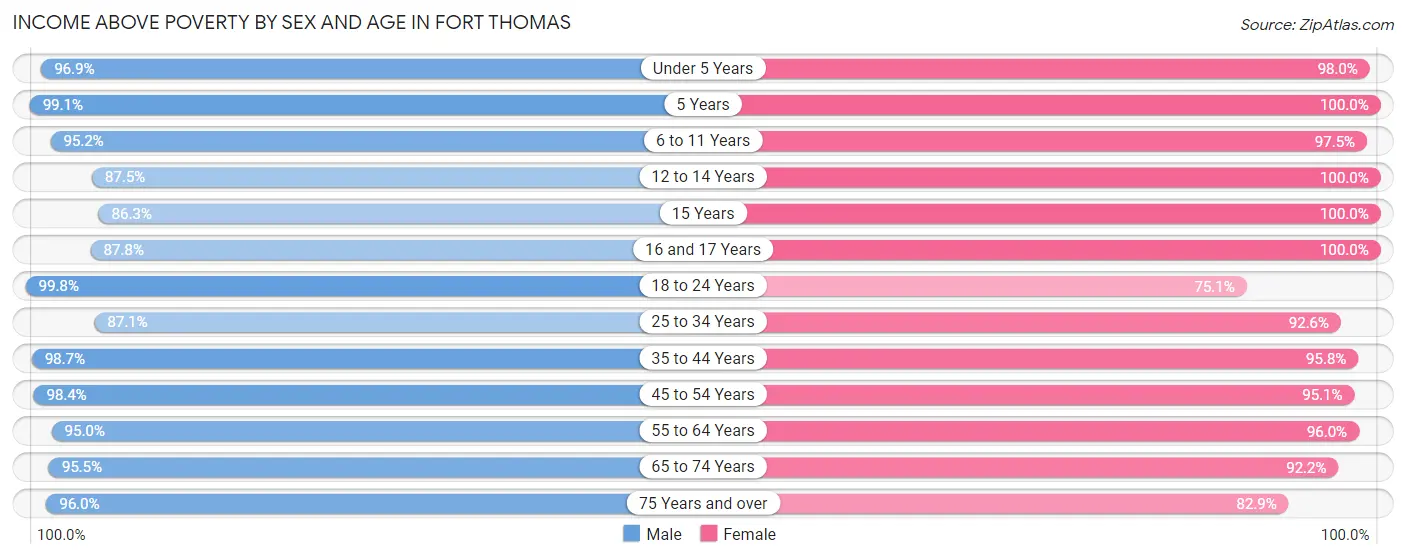
| Age Bracket | Male | Female |
| Under 5 Years | 439 (96.9%) | 486 (98.0%) |
| 5 Years | 104 (99.1%) | 117 (100.0%) |
| 6 to 11 Years | 1,071 (95.2%) | 882 (97.5%) |
| 12 to 14 Years | 301 (87.5%) | 237 (100.0%) |
| 15 Years | 113 (86.3%) | 140 (100.0%) |
| 16 and 17 Years | 258 (87.8%) | 279 (100.0%) |
| 18 to 24 Years | 527 (99.8%) | 326 (75.1%) |
| 25 to 34 Years | 1,123 (87.1%) | 1,031 (92.6%) |
| 35 to 44 Years | 966 (98.7%) | 922 (95.8%) |
| 45 to 54 Years | 1,136 (98.4%) | 1,230 (95.1%) |
| 55 to 64 Years | 1,060 (95.0%) | 978 (96.0%) |
| 65 to 74 Years | 785 (95.5%) | 693 (92.1%) |
| 75 Years and over | 262 (96.0%) | 515 (82.9%) |
| Total | 8,145 (94.5%) | 7,836 (93.6%) |
Income Below Poverty Among Married-Couple Families in Fort Thomas
The poverty statistics for married-couple families in Fort Thomas show that 1.8% or 66 of the total 3,650 families live below the poverty line. Families with 5 or more children have the highest poverty rate of 57.6%, comprising of 19 families. On the other hand, families with 1 or 2 children have the lowest poverty rate of 0.0%, which includes 0 families.
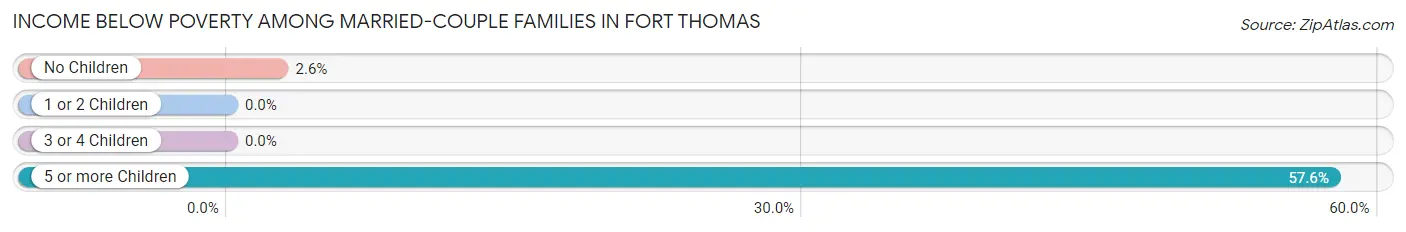
| Children | Above Poverty | Below Poverty |
| No Children | 1,736 (97.4%) | 47 (2.6%) |
| 1 or 2 Children | 1,475 (100.0%) | 0 (0.0%) |
| 3 or 4 Children | 359 (100.0%) | 0 (0.0%) |
| 5 or more Children | 14 (42.4%) | 19 (57.6%) |
| Total | 3,584 (98.2%) | 66 (1.8%) |
Income Below Poverty Among Single-Parent Households in Fort Thomas
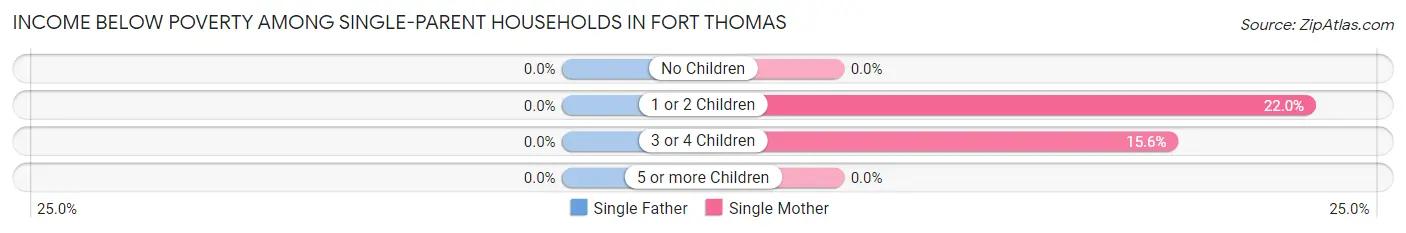
| Children | Single Father | Single Mother |
| No Children | 0 (0.0%) | 0 (0.0%) |
| 1 or 2 Children | 0 (0.0%) | 84 (22.0%) |
| 3 or 4 Children | 0 (0.0%) | 12 (15.6%) |
| 5 or more Children | 0 (0.0%) | 0 (0.0%) |
| Total | 0 (0.0%) | 96 (17.6%) |
Income Below Poverty Among Married-Couple vs Single-Parent Households in Fort Thomas
The poverty data for Fort Thomas shows that 66 of the married-couple family households (1.8%) and 96 of the single-parent households (11.6%) are living below the poverty level. Within the married-couple family households, those with 5 or more children have the highest poverty rate, with 19 households (57.6%) falling below the poverty line. Among the single-parent households, those with 3 or 4 children have the highest poverty rate, with 12 household (14.8%) living below poverty.
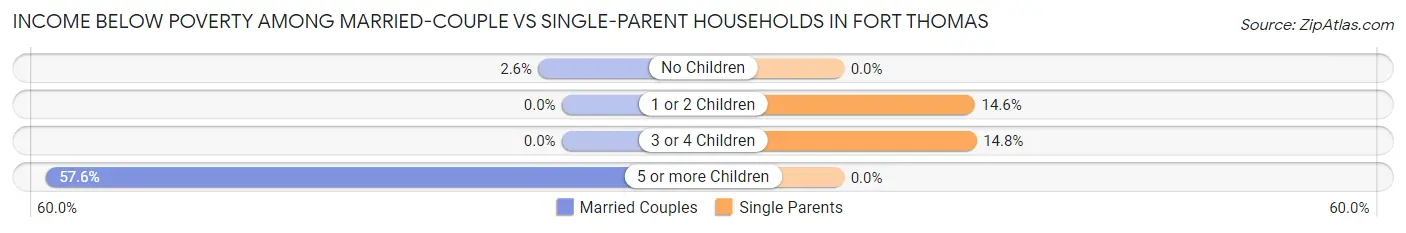
| Children | Married-Couple Families | Single-Parent Households |
| No Children | 47 (2.6%) | 0 (0.0%) |
| 1 or 2 Children | 0 (0.0%) | 84 (14.6%) |
| 3 or 4 Children | 0 (0.0%) | 12 (14.8%) |
| 5 or more Children | 19 (57.6%) | 0 (0.0%) |
| Total | 66 (1.8%) | 96 (11.6%) |
Race in Fort Thomas
The most populous races in Fort Thomas are White / Caucasian (15,954 | 92.2%), Two or more Races (762 | 4.4%), and Black / African American (261 | 1.5%).
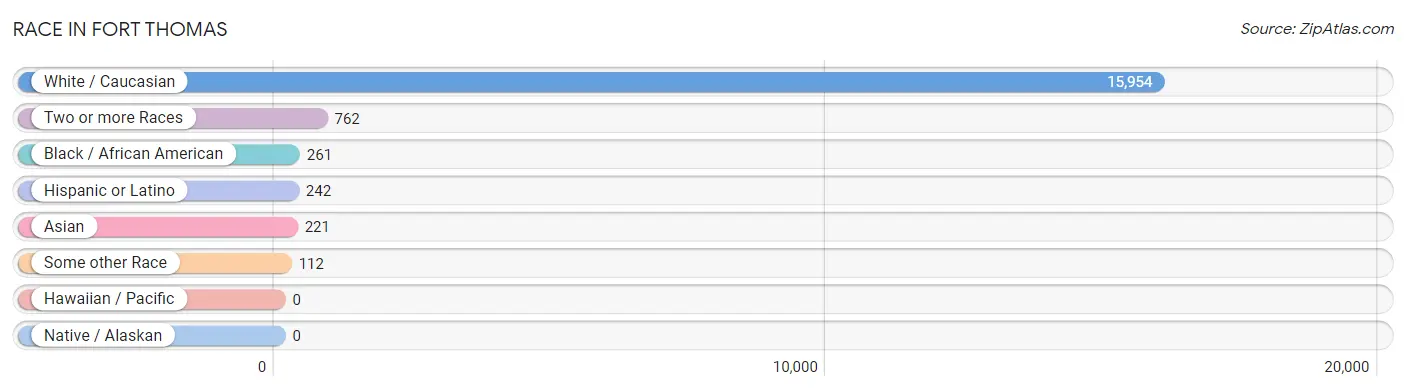
| Race | # Population | % Population |
| Asian | 221 | 1.3% |
| Black / African American | 261 | 1.5% |
| Hawaiian / Pacific | 0 | 0.0% |
| Hispanic or Latino | 242 | 1.4% |
| Native / Alaskan | 0 | 0.0% |
| White / Caucasian | 15,954 | 92.2% |
| Two or more Races | 762 | 4.4% |
| Some other Race | 112 | 0.6% |
| Total | 17,310 | 100.0% |
Ancestry in Fort Thomas
The most populous ancestries reported in Fort Thomas are German (6,249 | 36.1%), Irish (2,576 | 14.9%), English (2,503 | 14.5%), Italian (1,153 | 6.7%), and American (930 | 5.4%), together accounting for 77.5% of all Fort Thomas residents.
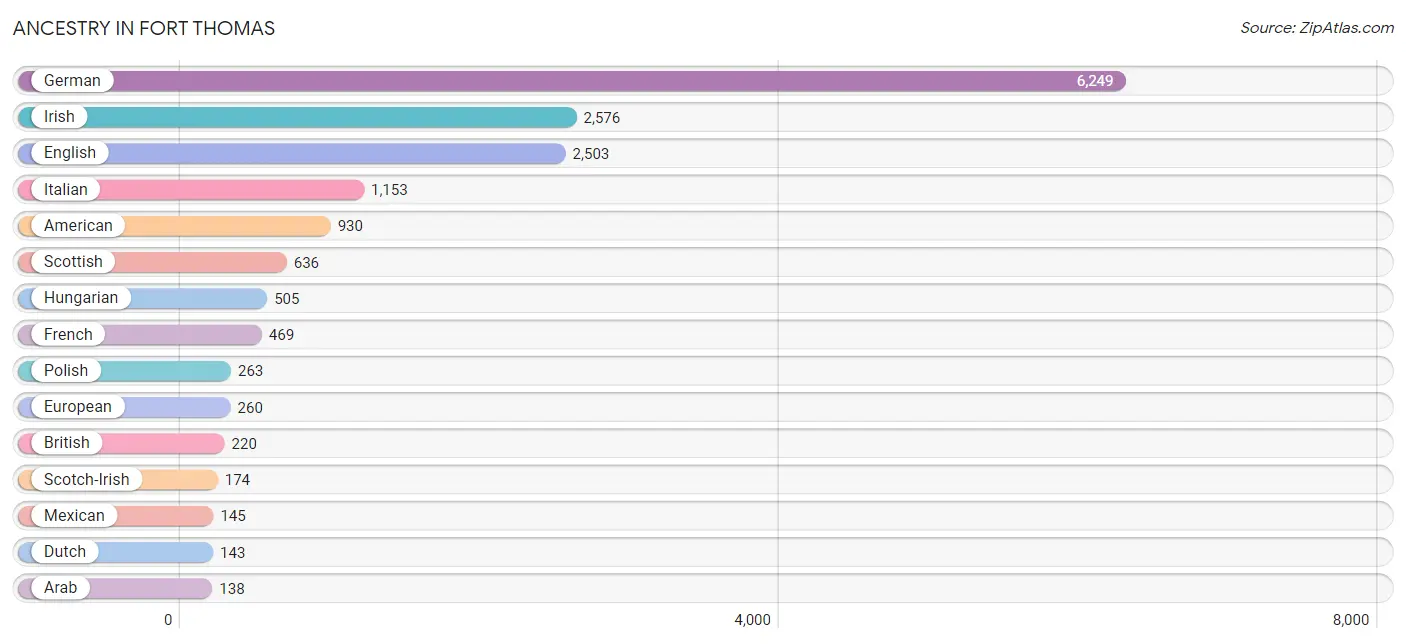
| Ancestry | # Population | % Population |
| African | 18 | 0.1% |
| American | 930 | 5.4% |
| Arab | 138 | 0.8% |
| Austrian | 8 | 0.1% |
| Bhutanese | 14 | 0.1% |
| Blackfeet | 3 | 0.0% |
| British | 220 | 1.3% |
| Burmese | 62 | 0.4% |
| Cajun | 11 | 0.1% |
| Canadian | 134 | 0.8% |
| Central American | 63 | 0.4% |
| Cherokee | 12 | 0.1% |
| Colombian | 34 | 0.2% |
| Costa Rican | 30 | 0.2% |
| Croatian | 9 | 0.1% |
| Czech | 75 | 0.4% |
| Czechoslovakian | 38 | 0.2% |
| Dutch | 143 | 0.8% |
| Eastern European | 12 | 0.1% |
| English | 2,503 | 14.5% |
| European | 260 | 1.5% |
| Finnish | 23 | 0.1% |
| French | 469 | 2.7% |
| French Canadian | 15 | 0.1% |
| German | 6,249 | 36.1% |
| Greek | 69 | 0.4% |
| Guatemalan | 12 | 0.1% |
| Honduran | 20 | 0.1% |
| Hungarian | 505 | 2.9% |
| Indian (Asian) | 98 | 0.6% |
| Irish | 2,576 | 14.9% |
| Italian | 1,153 | 6.7% |
| Jamaican | 22 | 0.1% |
| Korean | 121 | 0.7% |
| Laotian | 25 | 0.1% |
| Lebanese | 129 | 0.7% |
| Lithuanian | 10 | 0.1% |
| Mexican | 145 | 0.8% |
| Mongolian | 16 | 0.1% |
| Norwegian | 73 | 0.4% |
| Polish | 263 | 1.5% |
| Portuguese | 71 | 0.4% |
| Russian | 93 | 0.5% |
| Salvadoran | 1 | 0.0% |
| Scandinavian | 79 | 0.5% |
| Scotch-Irish | 174 | 1.0% |
| Scottish | 636 | 3.7% |
| Slovak | 5 | 0.0% |
| Slovene | 29 | 0.2% |
| South African | 22 | 0.1% |
| South American | 34 | 0.2% |
| Subsaharan African | 40 | 0.2% |
| Swedish | 31 | 0.2% |
| Swiss | 46 | 0.3% |
| Syrian | 9 | 0.1% |
| Thai | 35 | 0.2% |
| Ukrainian | 28 | 0.2% |
| Welsh | 67 | 0.4% | View All 58 Rows |
Immigrants in Fort Thomas
The most numerous immigrant groups reported in Fort Thomas came from Asia (216 | 1.3%), Eastern Asia (132 | 0.8%), Africa (106 | 0.6%), China (77 | 0.4%), and South Eastern Asia (63 | 0.4%), together accounting for 3.4% of all Fort Thomas residents.
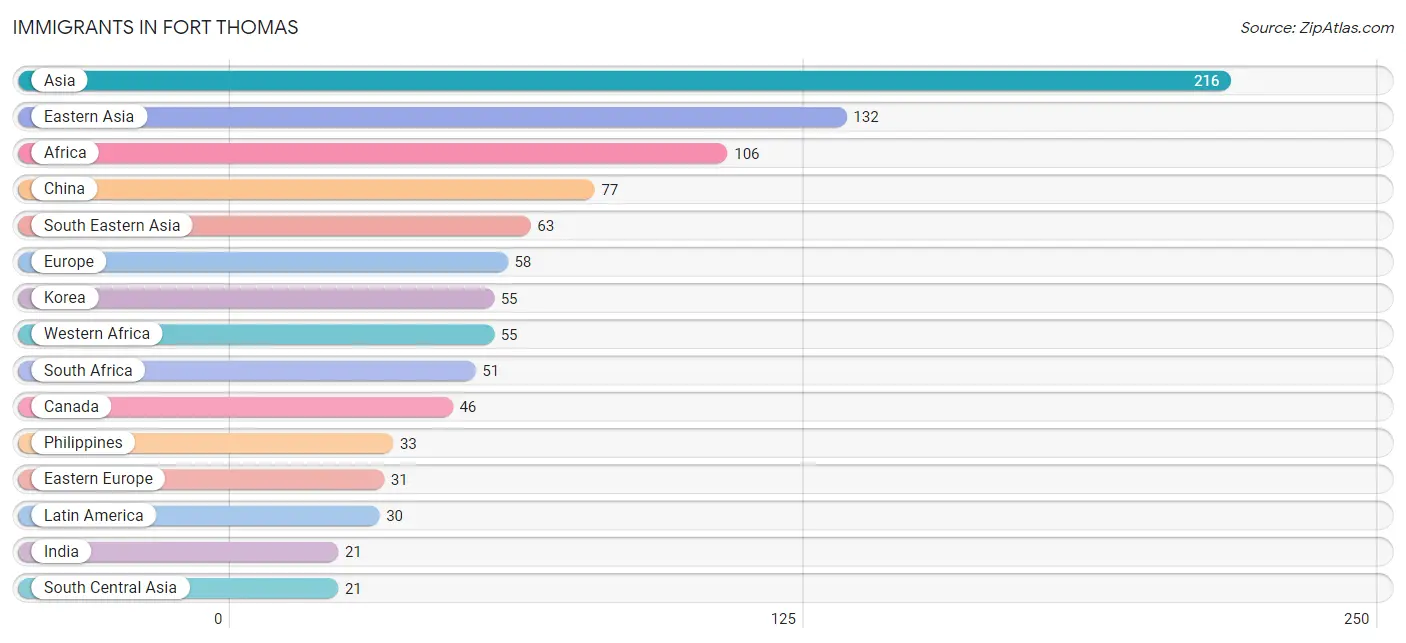
| Immigration Origin | # Population | % Population |
| Africa | 106 | 0.6% |
| Asia | 216 | 1.3% |
| Canada | 46 | 0.3% |
| Caribbean | 16 | 0.1% |
| Central America | 14 | 0.1% |
| China | 77 | 0.4% |
| Eastern Asia | 132 | 0.8% |
| Eastern Europe | 31 | 0.2% |
| El Salvador | 1 | 0.0% |
| Europe | 58 | 0.3% |
| Germany | 14 | 0.1% |
| Guatemala | 12 | 0.1% |
| Hungary | 10 | 0.1% |
| India | 21 | 0.1% |
| Indonesia | 14 | 0.1% |
| Italy | 13 | 0.1% |
| Jamaica | 16 | 0.1% |
| Korea | 55 | 0.3% |
| Latin America | 30 | 0.2% |
| Malaysia | 16 | 0.1% |
| Mexico | 1 | 0.0% |
| Philippines | 33 | 0.2% |
| Russia | 9 | 0.1% |
| South Africa | 51 | 0.3% |
| South Central Asia | 21 | 0.1% |
| South Eastern Asia | 63 | 0.4% |
| Southern Europe | 13 | 0.1% |
| Ukraine | 12 | 0.1% |
| Western Africa | 55 | 0.3% |
| Western Europe | 14 | 0.1% | View All 30 Rows |
Sex and Age in Fort Thomas
Sex and Age in Fort Thomas
The most populous age groups in Fort Thomas are 5 to 9 Years (980 | 11.2%) for men and 5 to 9 Years (846 | 9.9%) for women.
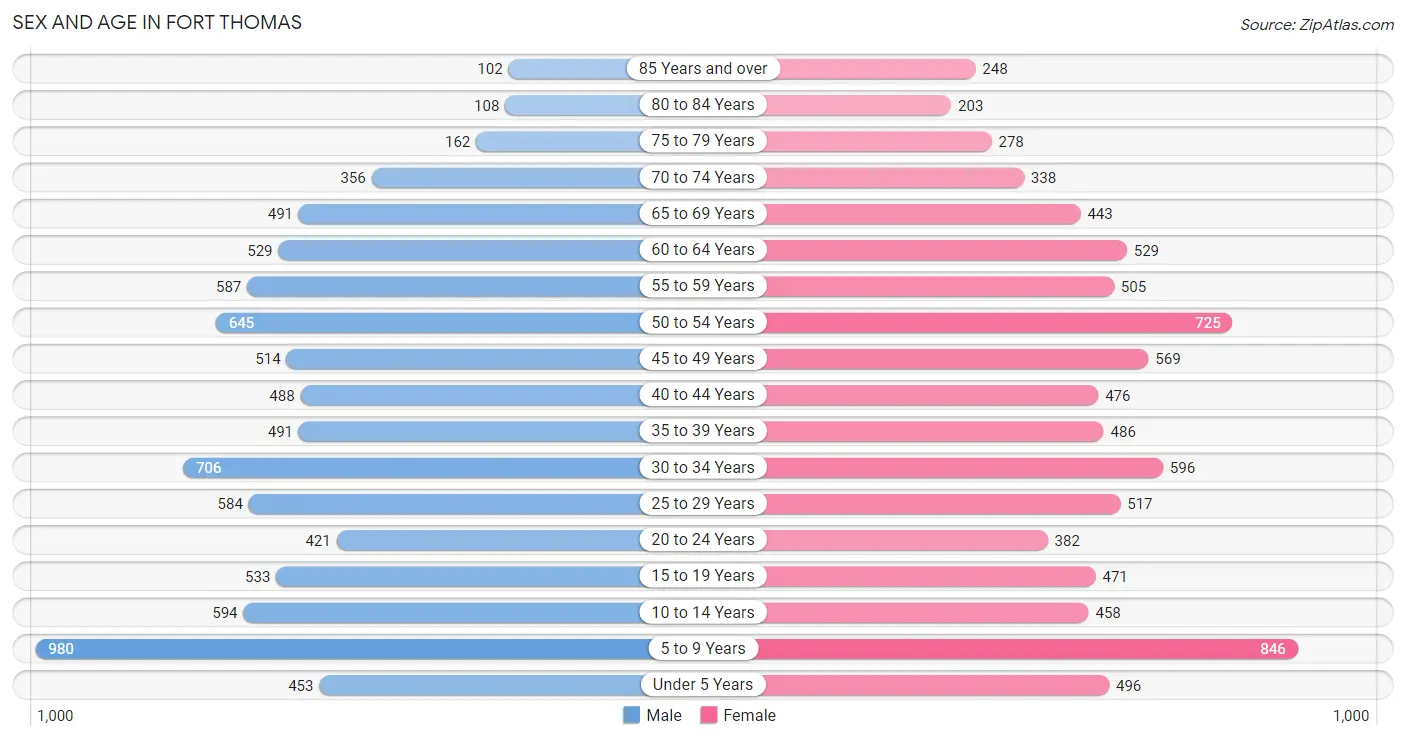
| Age Bracket | Male | Female |
| Under 5 Years | 453 (5.2%) | 496 (5.8%) |
| 5 to 9 Years | 980 (11.2%) | 846 (9.9%) |
| 10 to 14 Years | 594 (6.8%) | 458 (5.3%) |
| 15 to 19 Years | 533 (6.1%) | 471 (5.5%) |
| 20 to 24 Years | 421 (4.8%) | 382 (4.5%) |
| 25 to 29 Years | 584 (6.7%) | 517 (6.0%) |
| 30 to 34 Years | 706 (8.1%) | 596 (7.0%) |
| 35 to 39 Years | 491 (5.6%) | 486 (5.7%) |
| 40 to 44 Years | 488 (5.6%) | 476 (5.6%) |
| 45 to 49 Years | 514 (5.9%) | 569 (6.6%) |
| 50 to 54 Years | 645 (7.4%) | 725 (8.5%) |
| 55 to 59 Years | 587 (6.7%) | 505 (5.9%) |
| 60 to 64 Years | 529 (6.0%) | 529 (6.2%) |
| 65 to 69 Years | 491 (5.6%) | 443 (5.2%) |
| 70 to 74 Years | 356 (4.1%) | 338 (4.0%) |
| 75 to 79 Years | 162 (1.8%) | 278 (3.3%) |
| 80 to 84 Years | 108 (1.2%) | 203 (2.4%) |
| 85 Years and over | 102 (1.2%) | 248 (2.9%) |
| Total | 8,744 (100.0%) | 8,566 (100.0%) |
Families and Households in Fort Thomas
Median Family Size in Fort Thomas
The median family size in Fort Thomas is 3.21 persons per family, with married-couple families (3,650 | 81.5%) accounting for the largest median family size of 3.34 persons per family. On the other hand, single male/father families (285 | 6.4%) represent the smallest median family size with 2.06 persons per family.
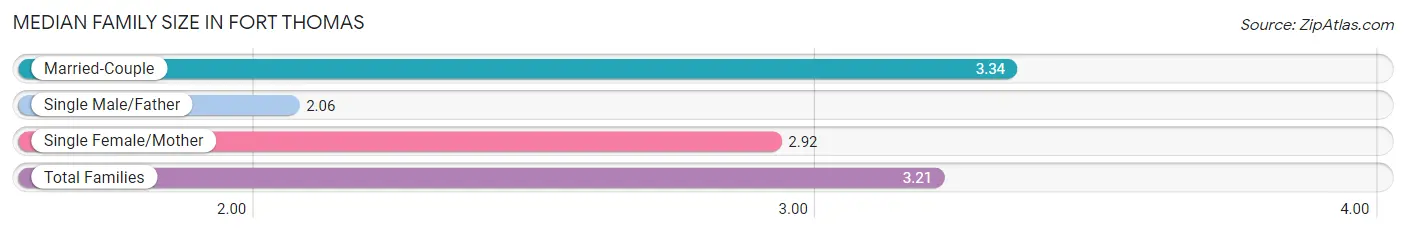
| Family Type | # Families | Family Size |
| Married-Couple | 3,650 (81.5%) | 3.34 |
| Single Male/Father | 285 (6.4%) | 2.06 |
| Single Female/Mother | 544 (12.1%) | 2.92 |
| Total Families | 4,479 (100.0%) | 3.21 |
Median Household Size in Fort Thomas
The median household size in Fort Thomas is 2.60 persons per household, with married-couple households (3,650 | 56.0%) accounting for the largest median household size of 3.35 persons per household. non-family households (2,033 | 31.2%) represent the smallest median household size with 1.11 persons per household.
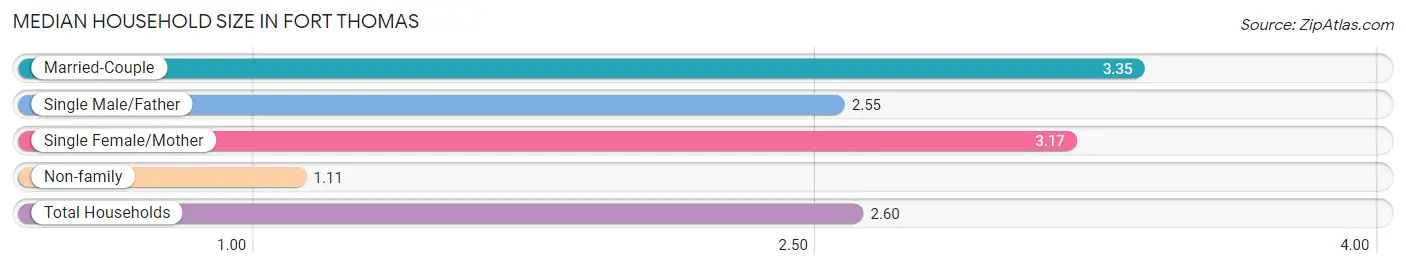
| Household Type | # Households | Household Size |
| Married-Couple | 3,650 (56.0%) | 3.35 |
| Single Male/Father | 285 (4.4%) | 2.55 |
| Single Female/Mother | 544 (8.4%) | 3.17 |
| Non-family | 2,033 (31.2%) | 1.11 |
| Total Households | 6,512 (100.0%) | 2.60 |
Household Size by Marriage Status in Fort Thomas
Out of a total of 6,512 households in Fort Thomas, 4,479 (68.8%) are family households, while 2,033 (31.2%) are nonfamily households. The most numerous type of family households are 2-person households, comprising 1,851, and the most common type of nonfamily households are 1-person households, comprising 1,827.
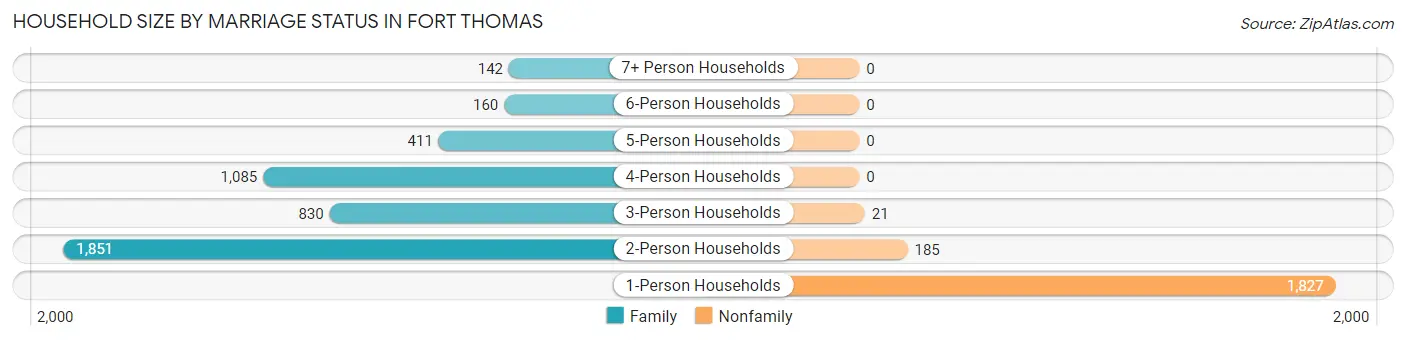
| Household Size | Family Households | Nonfamily Households |
| 1-Person Households | - | 1,827 (28.1%) |
| 2-Person Households | 1,851 (28.4%) | 185 (2.8%) |
| 3-Person Households | 830 (12.8%) | 21 (0.3%) |
| 4-Person Households | 1,085 (16.7%) | 0 (0.0%) |
| 5-Person Households | 411 (6.3%) | 0 (0.0%) |
| 6-Person Households | 160 (2.5%) | 0 (0.0%) |
| 7+ Person Households | 142 (2.2%) | 0 (0.0%) |
| Total | 4,479 (68.8%) | 2,033 (31.2%) |
Female Fertility in Fort Thomas
Fertility by Age in Fort Thomas
Average fertility rate in Fort Thomas is 72.0 births per 1,000 women. Women in the age bracket of 20 to 34 years have the highest fertility rate with 108.0 births per 1,000 women. Women in the age bracket of 20 to 34 years acount for 62.5% of all women with births.
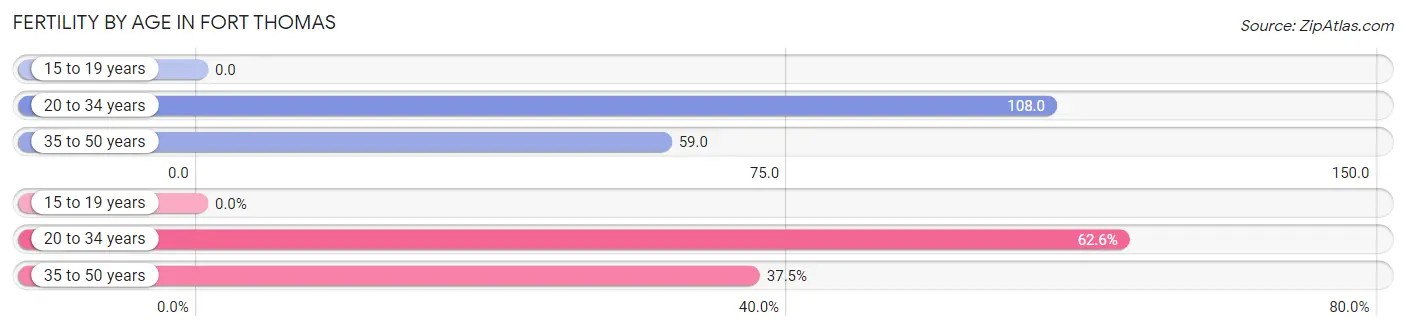
| Age Bracket | Women with Births | Births / 1,000 Women |
| 15 to 19 years | 0 (0.0%) | 0.0 |
| 20 to 34 years | 162 (62.5%) | 108.0 |
| 35 to 50 years | 97 (37.4%) | 59.0 |
| Total | 259 (100.0%) | 72.0 |
Fertility by Age by Marriage Status in Fort Thomas
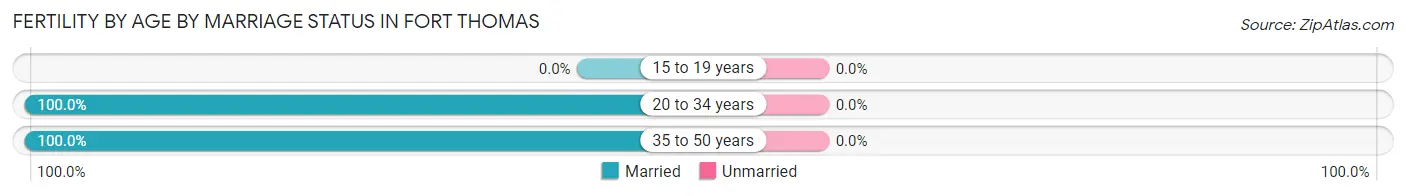
| Age Bracket | Married | Unmarried |
| 15 to 19 years | 0 (0.0%) | 0 (0.0%) |
| 20 to 34 years | 162 (100.0%) | 0 (0.0%) |
| 35 to 50 years | 97 (100.0%) | 0 (0.0%) |
| Total | 259 (100.0%) | 0 (0.0%) |
Fertility by Education in Fort Thomas
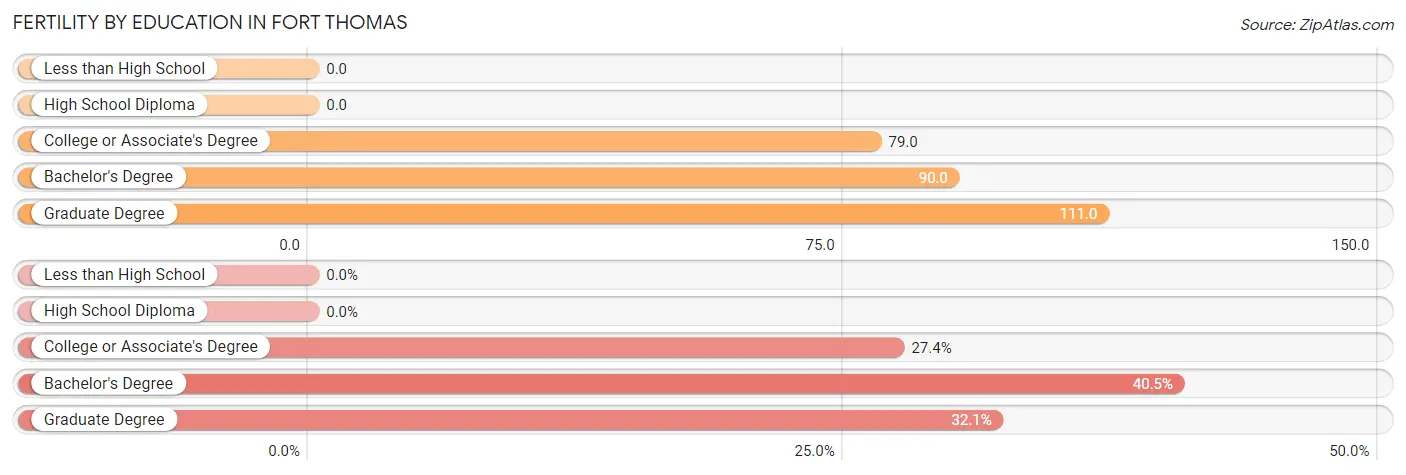
| Educational Attainment | Women with Births | Births / 1,000 Women |
| Less than High School | 0 (0.0%) | 0.0 |
| High School Diploma | 0 (0.0%) | 0.0 |
| College or Associate's Degree | 71 (27.4%) | 79.0 |
| Bachelor's Degree | 105 (40.5%) | 90.0 |
| Graduate Degree | 83 (32.1%) | 111.0 |
| Total | 259 (100.0%) | 72.0 |
Fertility by Education by Marriage Status in Fort Thomas
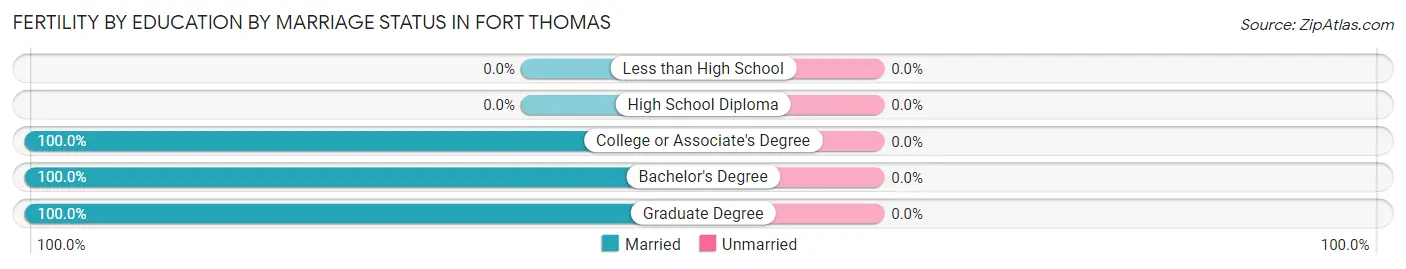
| Educational Attainment | Married | Unmarried |
| Less than High School | 0 (0.0%) | 0 (0.0%) |
| High School Diploma | 0 (0.0%) | 0 (0.0%) |
| College or Associate's Degree | 71 (100.0%) | 0 (0.0%) |
| Bachelor's Degree | 105 (100.0%) | 0 (0.0%) |
| Graduate Degree | 83 (100.0%) | 0 (0.0%) |
| Total | 259 (100.0%) | 0 (0.0%) |
Employment Characteristics in Fort Thomas
Employment by Class of Employer in Fort Thomas
Among the 8,623 employed individuals in Fort Thomas, private company employees (5,735 | 66.5%), not-for-profit organizations (1,010 | 11.7%), and self-employed (not incorporated) (494 | 5.7%) make up the most common classes of employment.
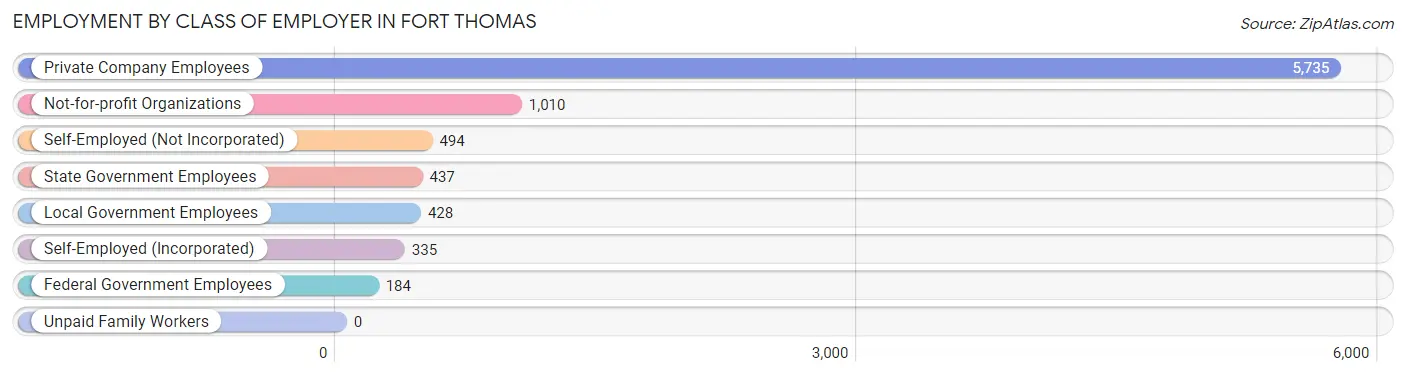
| Employer Class | # Employees | % Employees |
| Private Company Employees | 5,735 | 66.5% |
| Self-Employed (Incorporated) | 335 | 3.9% |
| Self-Employed (Not Incorporated) | 494 | 5.7% |
| Not-for-profit Organizations | 1,010 | 11.7% |
| Local Government Employees | 428 | 5.0% |
| State Government Employees | 437 | 5.1% |
| Federal Government Employees | 184 | 2.1% |
| Unpaid Family Workers | 0 | 0.0% |
| Total | 8,623 | 100.0% |
Employment Status by Age in Fort Thomas
According to the labor force statistics for Fort Thomas, out of the total population over 16 years of age (13,212), 68.6% or 9,063 individuals are in the labor force, with 3.8% or 344 of them unemployed. The age group with the highest labor force participation rate is 20 to 24 years, with 93.9% or 754 individuals in the labor force. Within the labor force, the 25 to 29 years age range has the highest percentage of unemployed individuals, with 16.3% or 148 of them being unemployed.
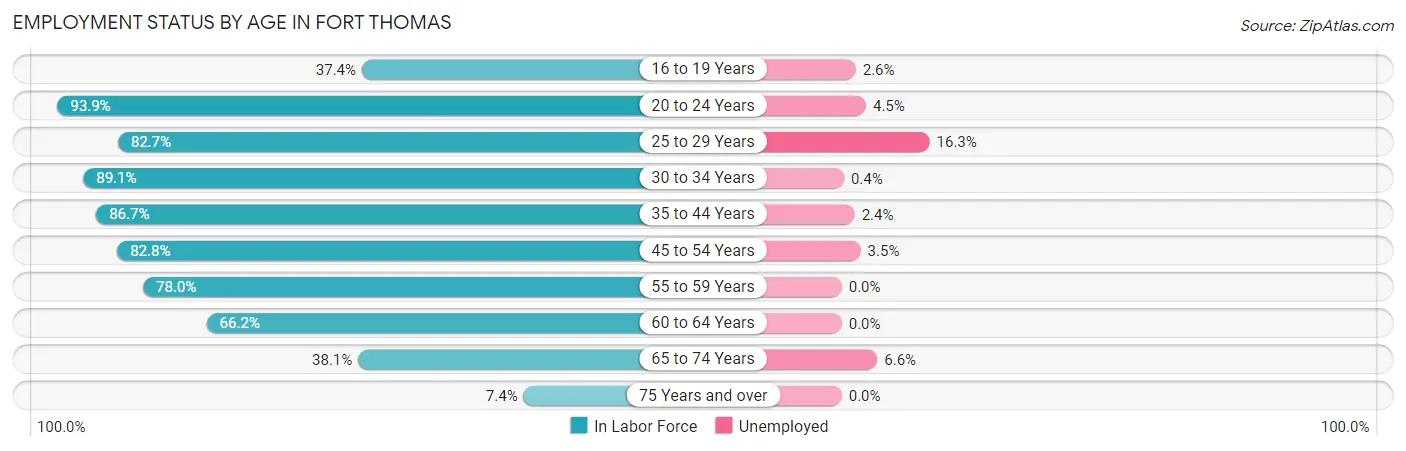
| Age Bracket | In Labor Force | Unemployed |
| 16 to 19 Years | 274 (37.4%) | 7 (2.6%) |
| 20 to 24 Years | 754 (93.9%) | 34 (4.5%) |
| 25 to 29 Years | 911 (82.7%) | 148 (16.3%) |
| 30 to 34 Years | 1,160 (89.1%) | 5 (0.4%) |
| 35 to 44 Years | 1,683 (86.7%) | 40 (2.4%) |
| 45 to 54 Years | 2,031 (82.8%) | 71 (3.5%) |
| 55 to 59 Years | 852 (78.0%) | 0 (0.0%) |
| 60 to 64 Years | 700 (66.2%) | 0 (0.0%) |
| 65 to 74 Years | 620 (38.1%) | 41 (6.6%) |
| 75 Years and over | 81 (7.4%) | 0 (0.0%) |
| Total | 9,063 (68.6%) | 344 (3.8%) |
Employment Status by Educational Attainment in Fort Thomas
According to labor force statistics for Fort Thomas, 82.0% of individuals (7,337) out of the total population between 25 and 64 years of age (8,947) are in the labor force, with 3.6% or 264 of them being unemployed. The group with the highest labor force participation rate are those with the educational attainment of bachelor's degree or higher, with 85.8% or 4,573 individuals in the labor force. Within the labor force, individuals with bachelor's degree or higher education have the highest percentage of unemployment, with 4.7% or 215 of them being unemployed.
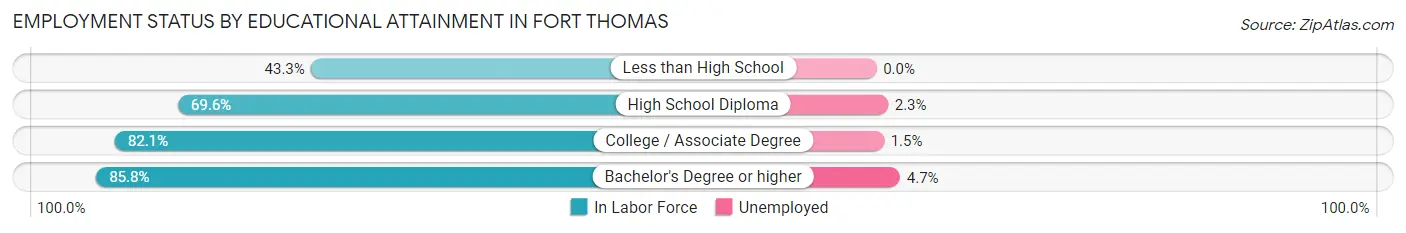
| Educational Attainment | In Labor Force | Unemployed |
| Less than High School | 74 (43.3%) | 0 (0.0%) |
| High School Diploma | 770 (69.6%) | 25 (2.3%) |
| College / Associate Degree | 1,921 (82.1%) | 35 (1.5%) |
| Bachelor's Degree or higher | 4,573 (85.8%) | 251 (4.7%) |
| Total | 7,337 (82.0%) | 322 (3.6%) |
Employment Occupations by Sex in Fort Thomas
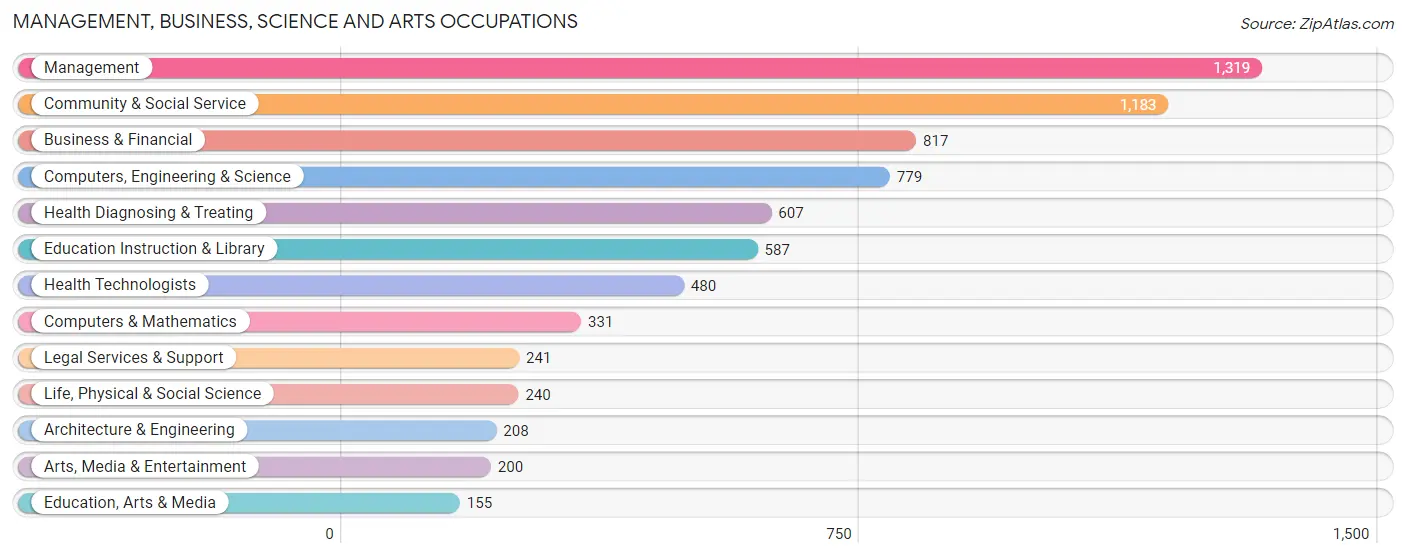
Management, Business, Science and Arts Occupations
The most common Management, Business, Science and Arts occupations in Fort Thomas are Management (1,319 | 15.1%), Community & Social Service (1,183 | 13.6%), Business & Financial (817 | 9.4%), Computers, Engineering & Science (779 | 8.9%), and Health Diagnosing & Treating (607 | 7.0%).
Management, Business, Science and Arts Occupations by Sex
Within the Management, Business, Science and Arts occupations in Fort Thomas, the most male-oriented occupations are Computers & Mathematics (88.8%), Arts, Media & Entertainment (73.5%), and Computers, Engineering & Science (68.9%), while the most female-oriented occupations are Education, Arts & Media (95.5%), Health Technologists (71.9%), and Health Diagnosing & Treating (69.7%).
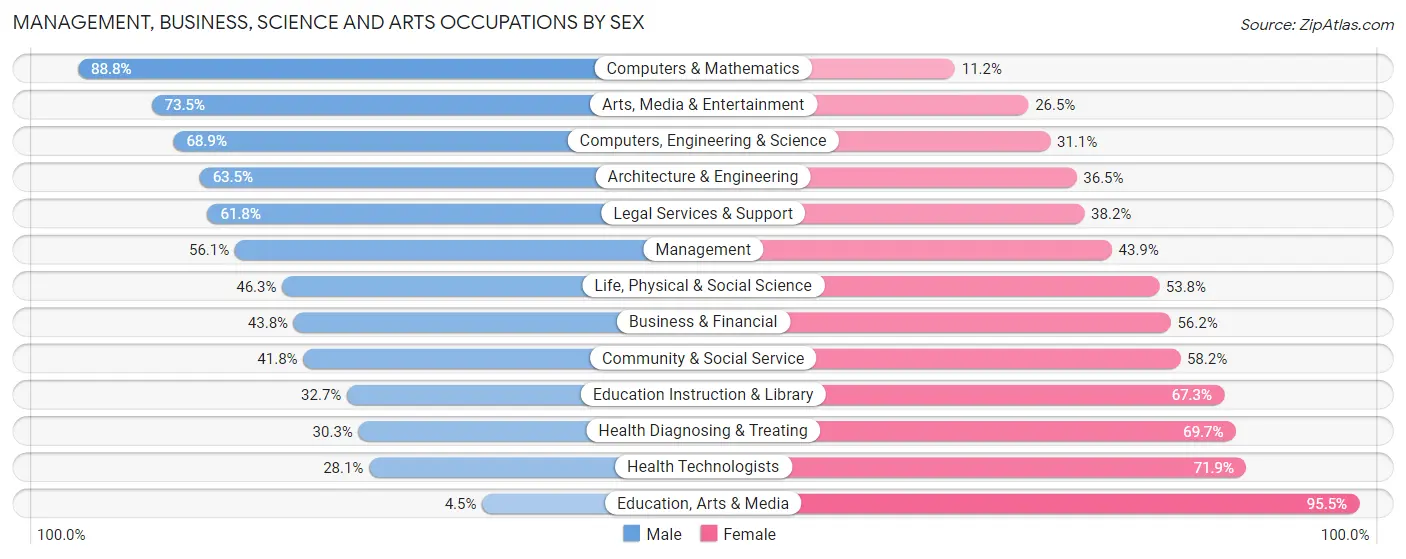
| Occupation | Male | Female |
| Management | 740 (56.1%) | 579 (43.9%) |
| Business & Financial | 358 (43.8%) | 459 (56.2%) |
| Computers, Engineering & Science | 537 (68.9%) | 242 (31.1%) |
| Computers & Mathematics | 294 (88.8%) | 37 (11.2%) |
| Architecture & Engineering | 132 (63.5%) | 76 (36.5%) |
| Life, Physical & Social Science | 111 (46.3%) | 129 (53.7%) |
| Community & Social Service | 495 (41.8%) | 688 (58.2%) |
| Education, Arts & Media | 7 (4.5%) | 148 (95.5%) |
| Legal Services & Support | 149 (61.8%) | 92 (38.2%) |
| Education Instruction & Library | 192 (32.7%) | 395 (67.3%) |
| Arts, Media & Entertainment | 147 (73.5%) | 53 (26.5%) |
| Health Diagnosing & Treating | 184 (30.3%) | 423 (69.7%) |
| Health Technologists | 135 (28.1%) | 345 (71.9%) |
| Total (Category) | 2,314 (49.2%) | 2,391 (50.8%) |
| Total (Overall) | 4,773 (54.7%) | 3,947 (45.3%) |
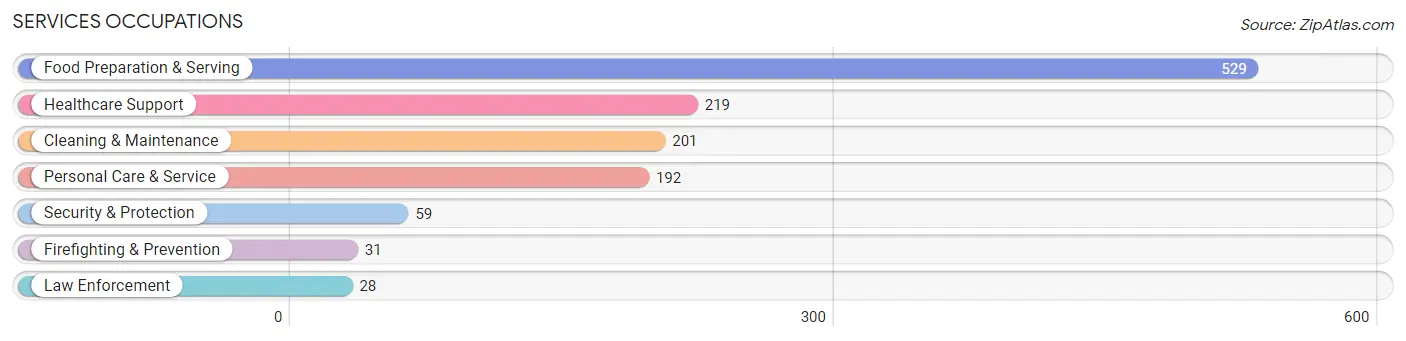
Services Occupations
The most common Services occupations in Fort Thomas are Food Preparation & Serving (529 | 6.1%), Healthcare Support (219 | 2.5%), Cleaning & Maintenance (201 | 2.3%), Personal Care & Service (192 | 2.2%), and Security & Protection (59 | 0.7%).
Services Occupations by Sex
Within the Services occupations in Fort Thomas, the most male-oriented occupations are Cleaning & Maintenance (94.5%), Food Preparation & Serving (71.5%), and Firefighting & Prevention (71.0%), while the most female-oriented occupations are Personal Care & Service (87.5%), Healthcare Support (84.9%), and Law Enforcement (50.0%).
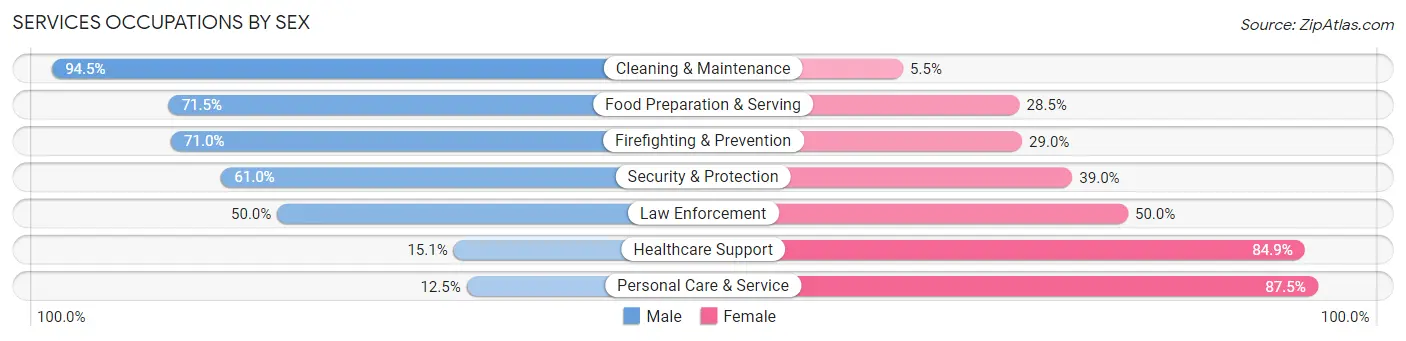
| Occupation | Male | Female |
| Healthcare Support | 33 (15.1%) | 186 (84.9%) |
| Security & Protection | 36 (61.0%) | 23 (39.0%) |
| Firefighting & Prevention | 22 (71.0%) | 9 (29.0%) |
| Law Enforcement | 14 (50.0%) | 14 (50.0%) |
| Food Preparation & Serving | 378 (71.5%) | 151 (28.5%) |
| Cleaning & Maintenance | 190 (94.5%) | 11 (5.5%) |
| Personal Care & Service | 24 (12.5%) | 168 (87.5%) |
| Total (Category) | 661 (55.1%) | 539 (44.9%) |
| Total (Overall) | 4,773 (54.7%) | 3,947 (45.3%) |
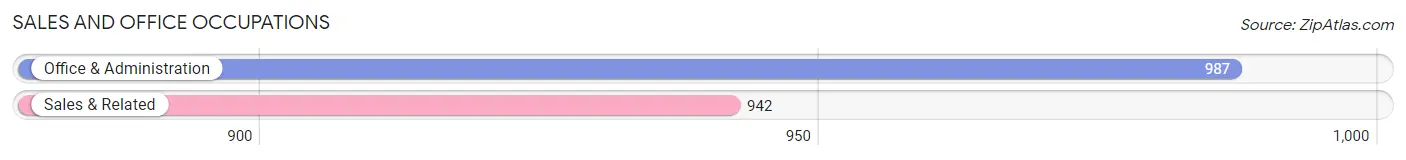
Sales and Office Occupations
The most common Sales and Office occupations in Fort Thomas are Office & Administration (987 | 11.3%), and Sales & Related (942 | 10.8%).
Sales and Office Occupations by Sex
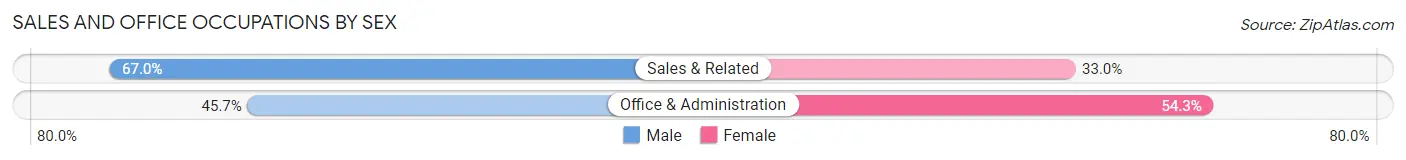
| Occupation | Male | Female |
| Sales & Related | 631 (67.0%) | 311 (33.0%) |
| Office & Administration | 451 (45.7%) | 536 (54.3%) |
| Total (Category) | 1,082 (56.1%) | 847 (43.9%) |
| Total (Overall) | 4,773 (54.7%) | 3,947 (45.3%) |
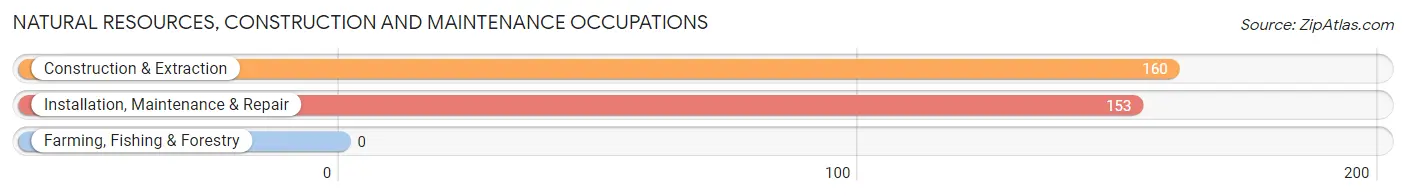
Natural Resources, Construction and Maintenance Occupations
The most common Natural Resources, Construction and Maintenance occupations in Fort Thomas are Construction & Extraction (160 | 1.8%), and Installation, Maintenance & Repair (153 | 1.8%).
Natural Resources, Construction and Maintenance Occupations by Sex
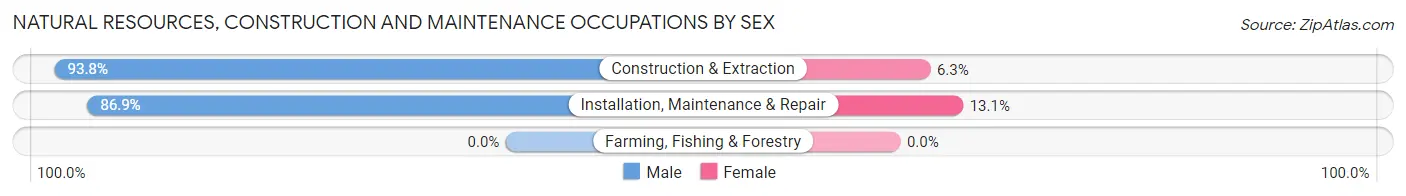
| Occupation | Male | Female |
| Farming, Fishing & Forestry | 0 (0.0%) | 0 (0.0%) |
| Construction & Extraction | 150 (93.8%) | 10 (6.2%) |
| Installation, Maintenance & Repair | 133 (86.9%) | 20 (13.1%) |
| Total (Category) | 283 (90.4%) | 30 (9.6%) |
| Total (Overall) | 4,773 (54.7%) | 3,947 (45.3%) |
Production, Transportation and Moving Occupations
The most common Production, Transportation and Moving occupations in Fort Thomas are Transportation (238 | 2.7%), Material Moving (198 | 2.3%), and Production (137 | 1.6%).
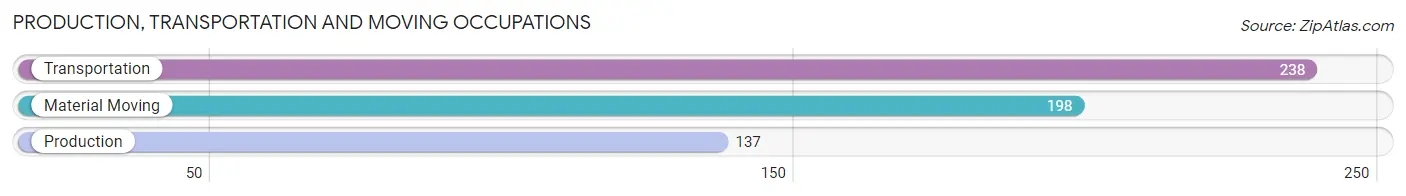
Production, Transportation and Moving Occupations by Sex
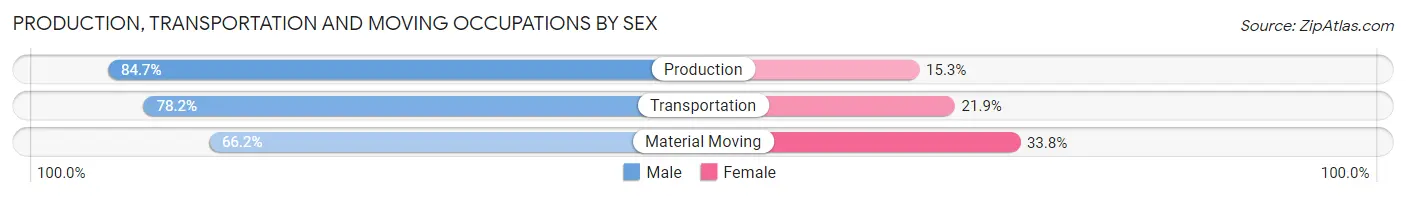
| Occupation | Male | Female |
| Production | 116 (84.7%) | 21 (15.3%) |
| Transportation | 186 (78.1%) | 52 (21.8%) |
| Material Moving | 131 (66.2%) | 67 (33.8%) |
| Total (Category) | 433 (75.6%) | 140 (24.4%) |
| Total (Overall) | 4,773 (54.7%) | 3,947 (45.3%) |
Employment Industries by Sex in Fort Thomas
Employment Industries in Fort Thomas
The major employment industries in Fort Thomas include Health Care & Social Assistance (1,253 | 14.4%), Professional & Scientific (949 | 10.9%), Finance & Insurance (904 | 10.4%), Educational Services (831 | 9.5%), and Manufacturing (807 | 9.2%).
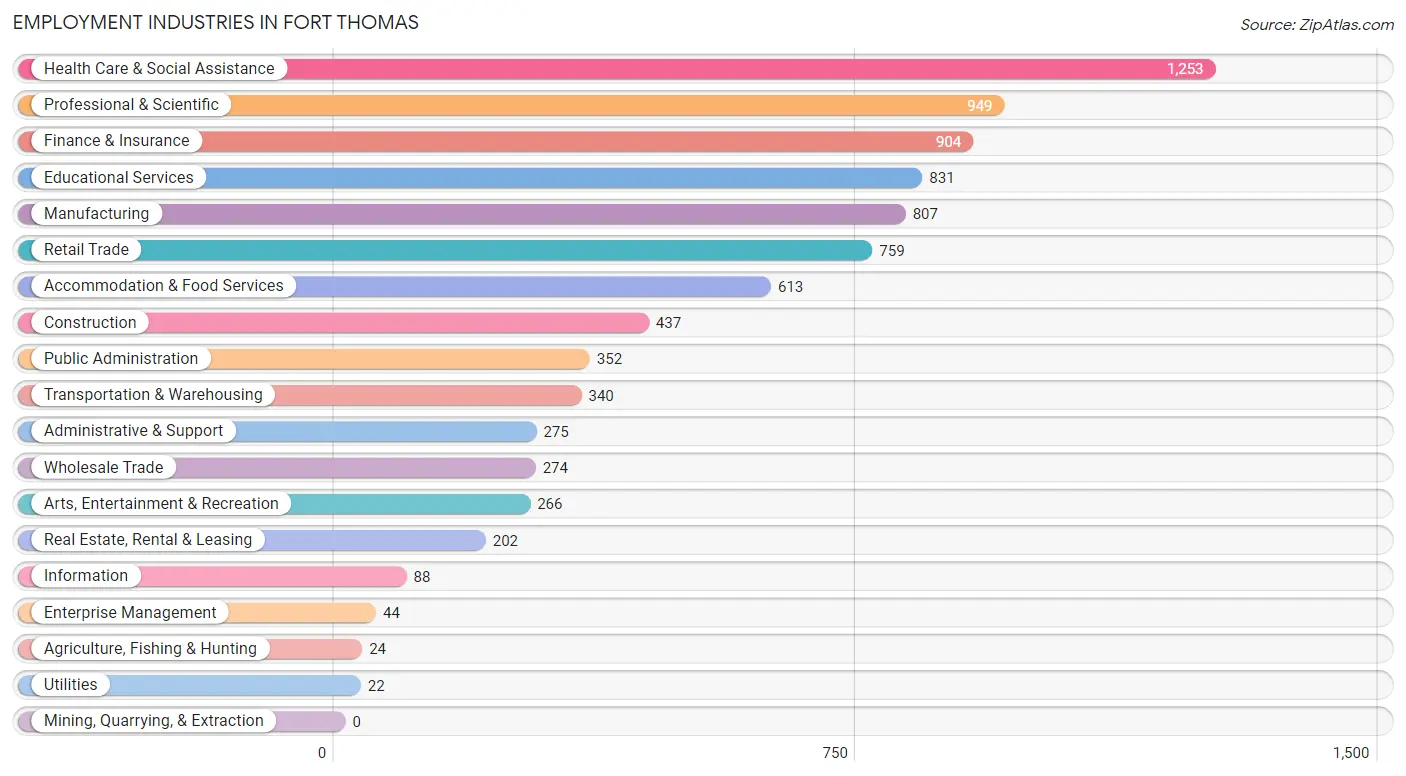
Employment Industries by Sex in Fort Thomas
The Fort Thomas industries that see more men than women are Enterprise Management (100.0%), Construction (90.2%), and Information (87.5%), whereas the industries that tend to have a higher number of women are Agriculture, Fishing & Hunting (100.0%), Health Care & Social Assistance (78.2%), and Utilities (72.7%).
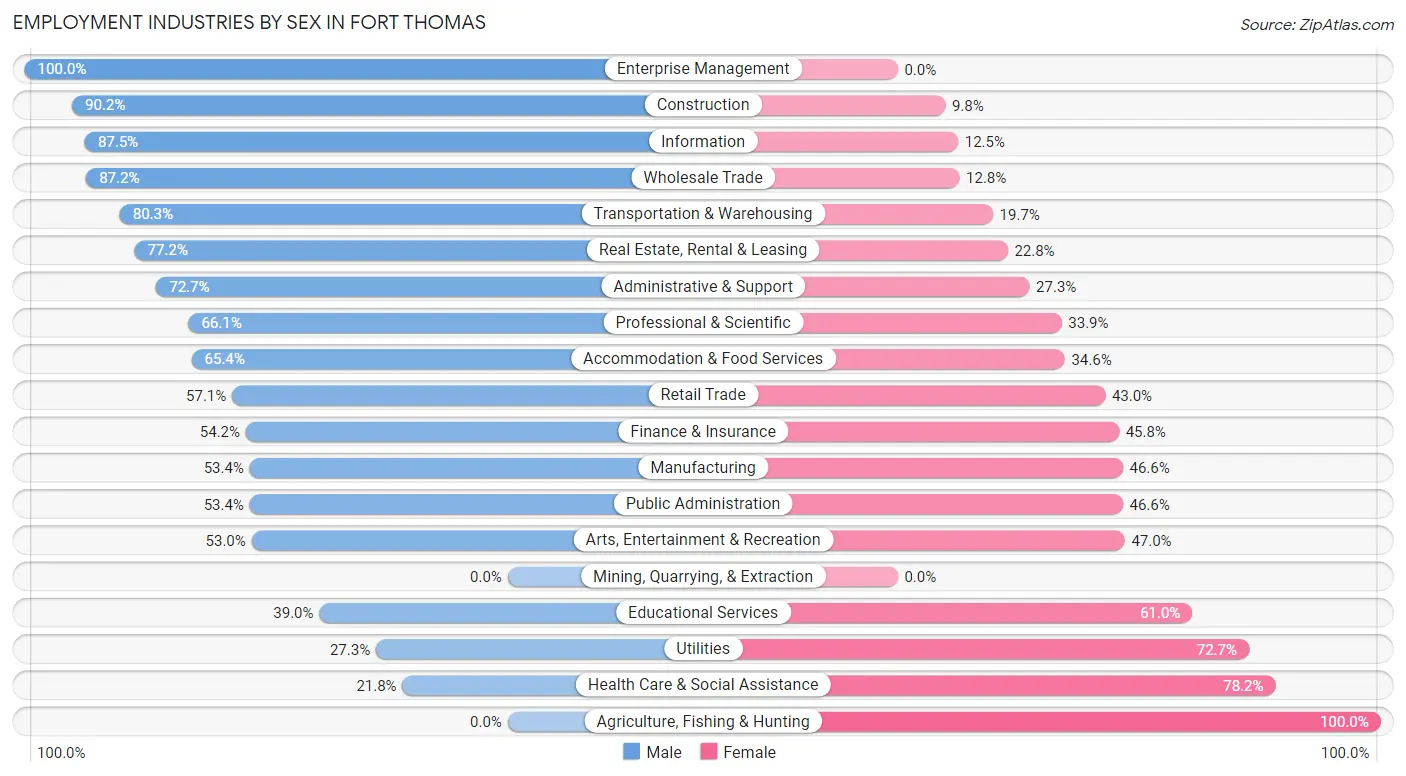
| Industry | Male | Female |
| Agriculture, Fishing & Hunting | 0 (0.0%) | 24 (100.0%) |
| Mining, Quarrying, & Extraction | 0 (0.0%) | 0 (0.0%) |
| Construction | 394 (90.2%) | 43 (9.8%) |
| Manufacturing | 431 (53.4%) | 376 (46.6%) |
| Wholesale Trade | 239 (87.2%) | 35 (12.8%) |
| Retail Trade | 433 (57.1%) | 326 (42.9%) |
| Transportation & Warehousing | 273 (80.3%) | 67 (19.7%) |
| Utilities | 6 (27.3%) | 16 (72.7%) |
| Information | 77 (87.5%) | 11 (12.5%) |
| Finance & Insurance | 490 (54.2%) | 414 (45.8%) |
| Real Estate, Rental & Leasing | 156 (77.2%) | 46 (22.8%) |
| Professional & Scientific | 627 (66.1%) | 322 (33.9%) |
| Enterprise Management | 44 (100.0%) | 0 (0.0%) |
| Administrative & Support | 200 (72.7%) | 75 (27.3%) |
| Educational Services | 324 (39.0%) | 507 (61.0%) |
| Health Care & Social Assistance | 273 (21.8%) | 980 (78.2%) |
| Arts, Entertainment & Recreation | 141 (53.0%) | 125 (47.0%) |
| Accommodation & Food Services | 401 (65.4%) | 212 (34.6%) |
| Public Administration | 188 (53.4%) | 164 (46.6%) |
| Total | 4,773 (54.7%) | 3,947 (45.3%) |
Education in Fort Thomas
School Enrollment in Fort Thomas
The most common levels of schooling among the 5,087 students in Fort Thomas are elementary school (1,362 | 26.8%), high school (1,084 | 21.3%), and middle school (955 | 18.8%).
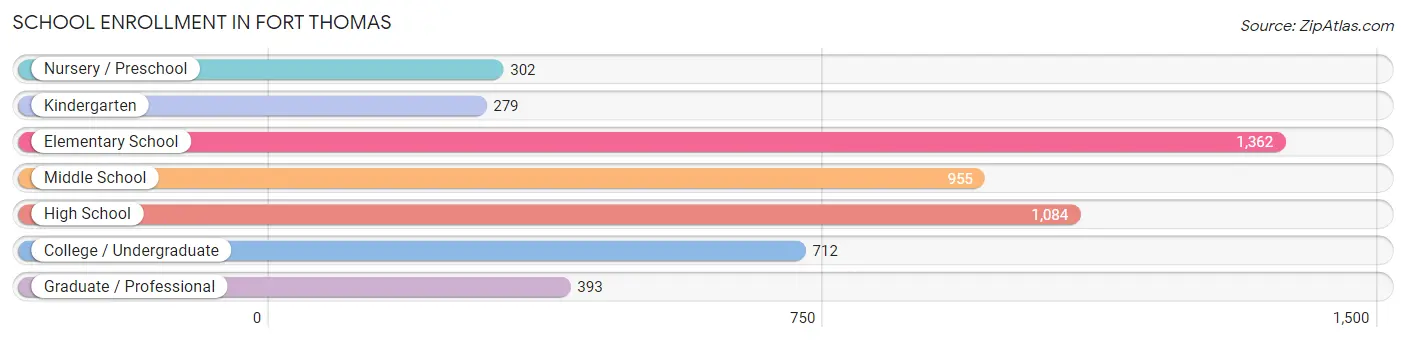
| School Level | # Students | % Students |
| Nursery / Preschool | 302 | 5.9% |
| Kindergarten | 279 | 5.5% |
| Elementary School | 1,362 | 26.8% |
| Middle School | 955 | 18.8% |
| High School | 1,084 | 21.3% |
| College / Undergraduate | 712 | 14.0% |
| Graduate / Professional | 393 | 7.7% |
| Total | 5,087 | 100.0% |
School Enrollment by Age by Funding Source in Fort Thomas
Out of a total of 5,087 students who are enrolled in schools in Fort Thomas, 727 (14.3%) attend a private institution, while the remaining 4,360 (85.7%) are enrolled in public schools. The age group of 3 to 4 year olds has the highest likelihood of being enrolled in private schools, with 153 (60.5% in the age bracket) enrolled. Conversely, the age group of 18 to 19 year olds has the lowest likelihood of being enrolled in a private school, with 152 (100.0% in the age bracket) attending a public institution.
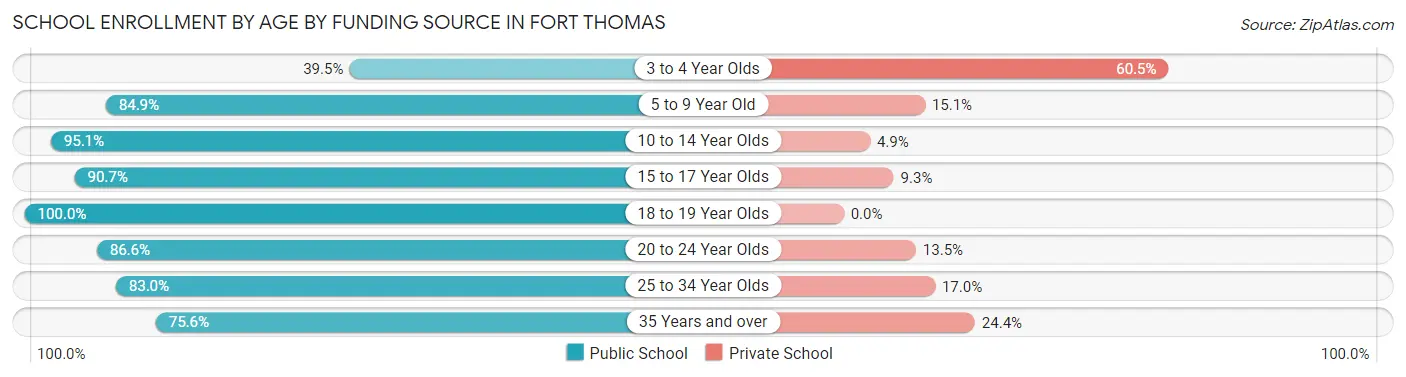
| Age Bracket | Public School | Private School |
| 3 to 4 Year Olds | 100 (39.5%) | 153 (60.5%) |
| 5 to 9 Year Old | 1,485 (84.9%) | 265 (15.1%) |
| 10 to 14 Year Olds | 989 (95.1%) | 51 (4.9%) |
| 15 to 17 Year Olds | 750 (90.7%) | 77 (9.3%) |
| 18 to 19 Year Olds | 152 (100.0%) | 0 (0.0%) |
| 20 to 24 Year Olds | 386 (86.6%) | 60 (13.5%) |
| 25 to 34 Year Olds | 327 (83.0%) | 67 (17.0%) |
| 35 Years and over | 170 (75.6%) | 55 (24.4%) |
| Total | 4,360 (85.7%) | 727 (14.3%) |
Educational Attainment by Field of Study in Fort Thomas
Business (1,401 | 20.3%), education (845 | 12.2%), bio, nature & agricultural (602 | 8.7%), science & technology (564 | 8.2%), and social sciences (527 | 7.6%) are the most common fields of study among 6,904 individuals in Fort Thomas who have obtained a bachelor's degree or higher.
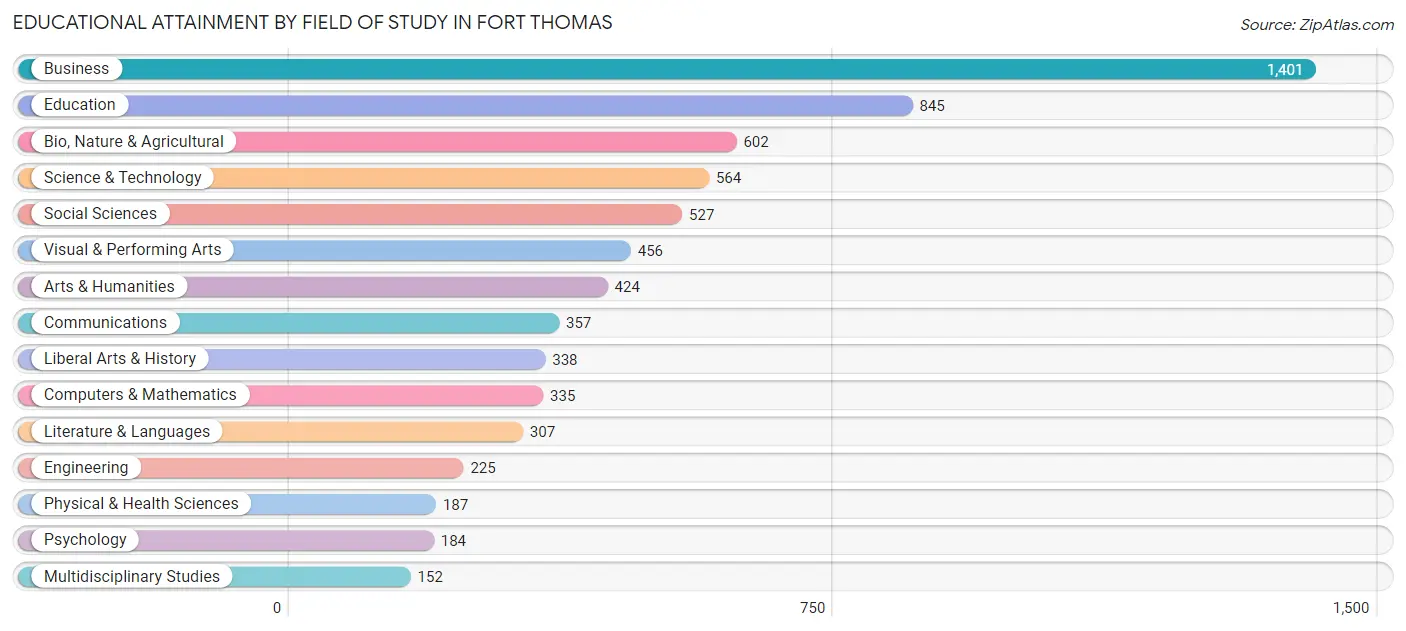
| Field of Study | # Graduates | % Graduates |
| Computers & Mathematics | 335 | 4.9% |
| Bio, Nature & Agricultural | 602 | 8.7% |
| Physical & Health Sciences | 187 | 2.7% |
| Psychology | 184 | 2.7% |
| Social Sciences | 527 | 7.6% |
| Engineering | 225 | 3.3% |
| Multidisciplinary Studies | 152 | 2.2% |
| Science & Technology | 564 | 8.2% |
| Business | 1,401 | 20.3% |
| Education | 845 | 12.2% |
| Literature & Languages | 307 | 4.4% |
| Liberal Arts & History | 338 | 4.9% |
| Visual & Performing Arts | 456 | 6.6% |
| Communications | 357 | 5.2% |
| Arts & Humanities | 424 | 6.1% |
| Total | 6,904 | 100.0% |
Transportation & Commute in Fort Thomas
Vehicle Availability by Sex in Fort Thomas
The most prevalent vehicle ownership categories in Fort Thomas are males with 2 vehicles (2,293, accounting for 48.3%) and females with 2 vehicles (1,674, making up 59.3%).
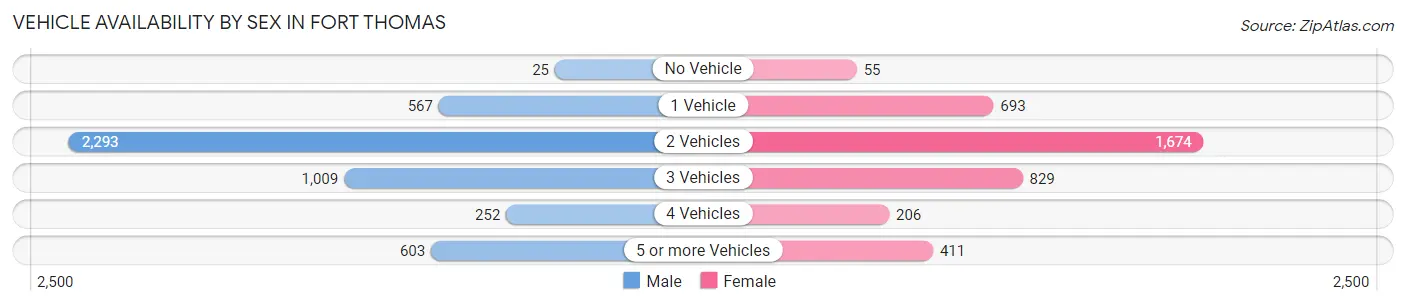
| Vehicles Available | Male | Female |
| No Vehicle | 25 (0.5%) | 55 (1.4%) |
| 1 Vehicle | 567 (11.9%) | 693 (17.9%) |
| 2 Vehicles | 2,293 (48.3%) | 1,674 (43.3%) |
| 3 Vehicles | 1,009 (21.2%) | 829 (21.4%) |
| 4 Vehicles | 252 (5.3%) | 206 (5.3%) |
| 5 or more Vehicles | 603 (12.7%) | 411 (10.6%) |
| Total | 4,749 (100.0%) | 3,868 (100.0%) |
Commute Time in Fort Thomas
The most frequently occuring commute durations in Fort Thomas are 15 to 19 minutes (1,510 commuters, 19.8%), 10 to 14 minutes (1,469 commuters, 19.3%), and 20 to 24 minutes (1,251 commuters, 16.4%).
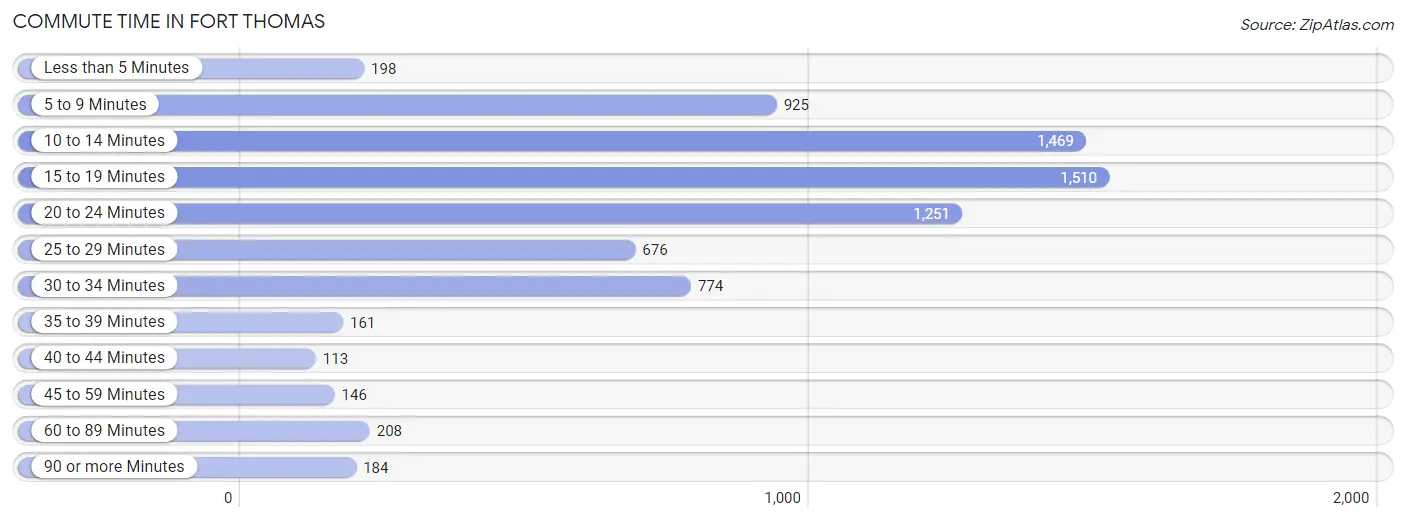
| Commute Time | # Commuters | % Commuters |
| Less than 5 Minutes | 198 | 2.6% |
| 5 to 9 Minutes | 925 | 12.1% |
| 10 to 14 Minutes | 1,469 | 19.3% |
| 15 to 19 Minutes | 1,510 | 19.8% |
| 20 to 24 Minutes | 1,251 | 16.4% |
| 25 to 29 Minutes | 676 | 8.9% |
| 30 to 34 Minutes | 774 | 10.2% |
| 35 to 39 Minutes | 161 | 2.1% |
| 40 to 44 Minutes | 113 | 1.5% |
| 45 to 59 Minutes | 146 | 1.9% |
| 60 to 89 Minutes | 208 | 2.7% |
| 90 or more Minutes | 184 | 2.4% |
Commute Time by Sex in Fort Thomas
The most common commute times in Fort Thomas are 10 to 14 minutes (760 commuters, 18.1%) for males and 15 to 19 minutes (826 commuters, 24.1%) for females.
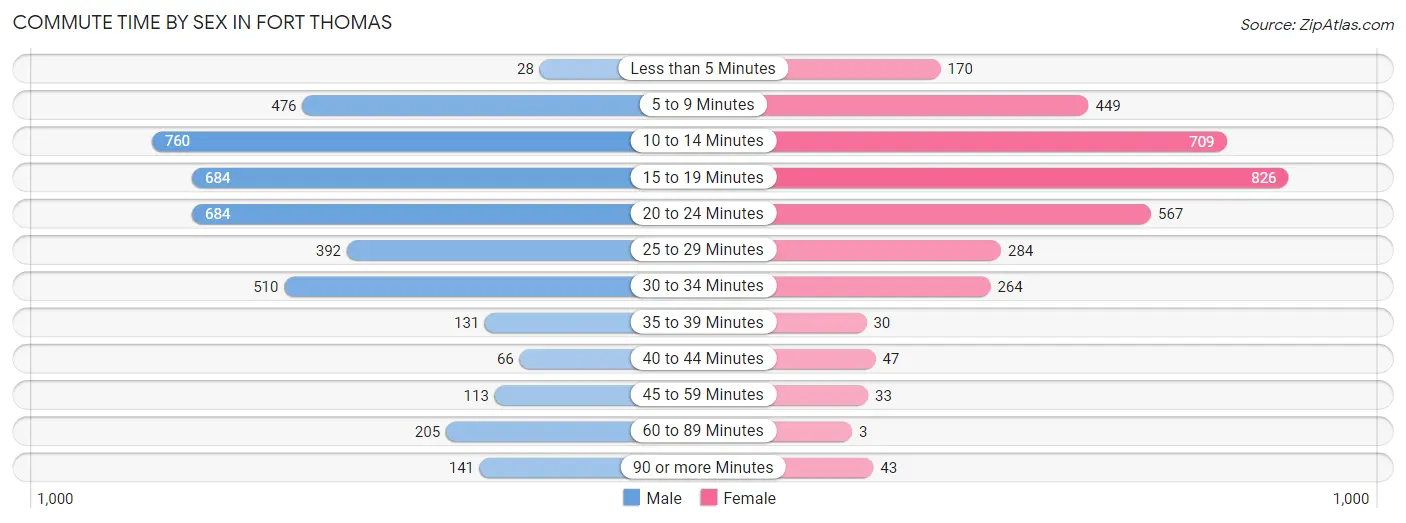
| Commute Time | Male | Female |
| Less than 5 Minutes | 28 (0.7%) | 170 (5.0%) |
| 5 to 9 Minutes | 476 (11.4%) | 449 (13.1%) |
| 10 to 14 Minutes | 760 (18.1%) | 709 (20.7%) |
| 15 to 19 Minutes | 684 (16.3%) | 826 (24.1%) |
| 20 to 24 Minutes | 684 (16.3%) | 567 (16.6%) |
| 25 to 29 Minutes | 392 (9.4%) | 284 (8.3%) |
| 30 to 34 Minutes | 510 (12.2%) | 264 (7.7%) |
| 35 to 39 Minutes | 131 (3.1%) | 30 (0.9%) |
| 40 to 44 Minutes | 66 (1.6%) | 47 (1.4%) |
| 45 to 59 Minutes | 113 (2.7%) | 33 (1.0%) |
| 60 to 89 Minutes | 205 (4.9%) | 3 (0.1%) |
| 90 or more Minutes | 141 (3.4%) | 43 (1.3%) |
Time of Departure to Work by Sex in Fort Thomas
The most frequent times of departure to work in Fort Thomas are 7:30 AM to 7:59 AM (601, 14.3%) for males and 7:30 AM to 7:59 AM (662, 19.3%) for females.
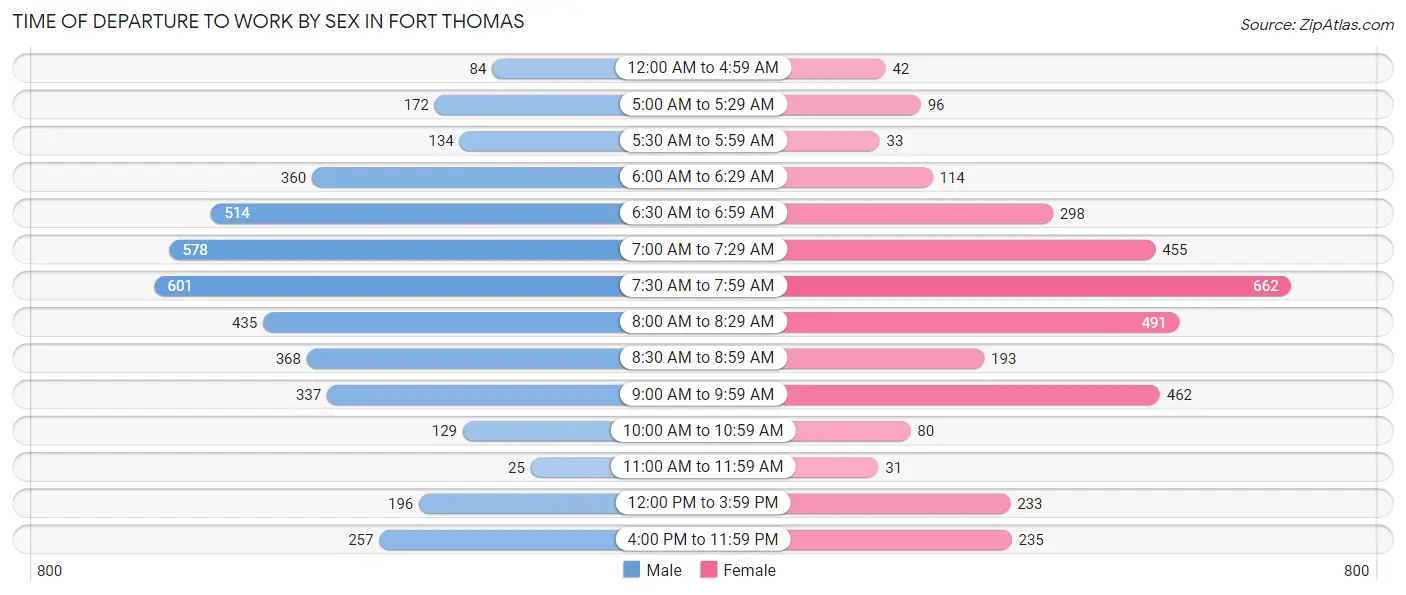
| Time of Departure | Male | Female |
| 12:00 AM to 4:59 AM | 84 (2.0%) | 42 (1.2%) |
| 5:00 AM to 5:29 AM | 172 (4.1%) | 96 (2.8%) |
| 5:30 AM to 5:59 AM | 134 (3.2%) | 33 (1.0%) |
| 6:00 AM to 6:29 AM | 360 (8.6%) | 114 (3.3%) |
| 6:30 AM to 6:59 AM | 514 (12.3%) | 298 (8.7%) |
| 7:00 AM to 7:29 AM | 578 (13.8%) | 455 (13.3%) |
| 7:30 AM to 7:59 AM | 601 (14.3%) | 662 (19.3%) |
| 8:00 AM to 8:29 AM | 435 (10.4%) | 491 (14.3%) |
| 8:30 AM to 8:59 AM | 368 (8.8%) | 193 (5.6%) |
| 9:00 AM to 9:59 AM | 337 (8.0%) | 462 (13.5%) |
| 10:00 AM to 10:59 AM | 129 (3.1%) | 80 (2.3%) |
| 11:00 AM to 11:59 AM | 25 (0.6%) | 31 (0.9%) |
| 12:00 PM to 3:59 PM | 196 (4.7%) | 233 (6.8%) |
| 4:00 PM to 11:59 PM | 257 (6.1%) | 235 (6.9%) |
| Total | 4,190 (100.0%) | 3,425 (100.0%) |
Housing Occupancy in Fort Thomas
Occupancy by Ownership in Fort Thomas
Of the total 6,512 dwellings in Fort Thomas, owner-occupied units account for 4,709 (72.3%), while renter-occupied units make up 1,803 (27.7%).
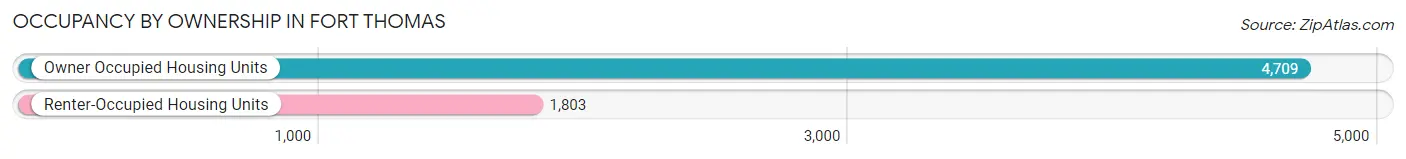
| Occupancy | # Housing Units | % Housing Units |
| Owner Occupied Housing Units | 4,709 | 72.3% |
| Renter-Occupied Housing Units | 1,803 | 27.7% |
| Total Occupied Housing Units | 6,512 | 100.0% |
Occupancy by Household Size in Fort Thomas
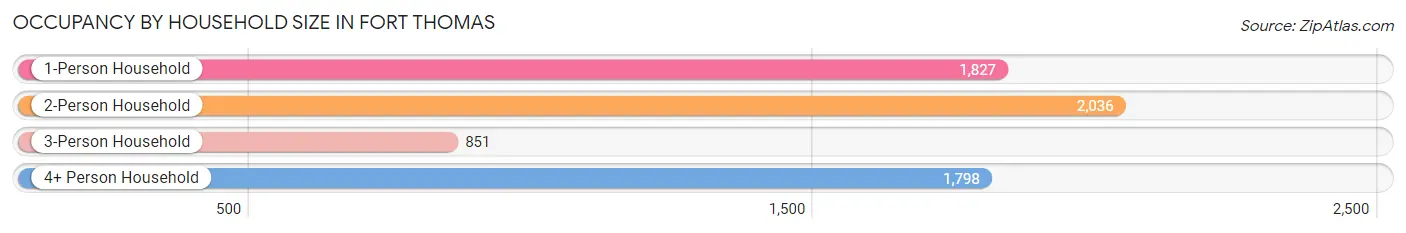
| Household Size | # Housing Units | % Housing Units |
| 1-Person Household | 1,827 | 28.1% |
| 2-Person Household | 2,036 | 31.3% |
| 3-Person Household | 851 | 13.1% |
| 4+ Person Household | 1,798 | 27.6% |
| Total Housing Units | 6,512 | 100.0% |
Occupancy by Ownership by Household Size in Fort Thomas
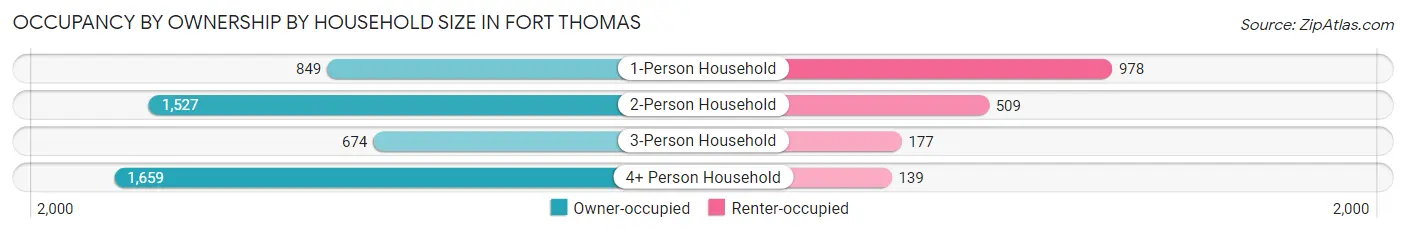
| Household Size | Owner-occupied | Renter-occupied |
| 1-Person Household | 849 (46.5%) | 978 (53.5%) |
| 2-Person Household | 1,527 (75.0%) | 509 (25.0%) |
| 3-Person Household | 674 (79.2%) | 177 (20.8%) |
| 4+ Person Household | 1,659 (92.3%) | 139 (7.7%) |
| Total Housing Units | 4,709 (72.3%) | 1,803 (27.7%) |
Occupancy by Educational Attainment in Fort Thomas
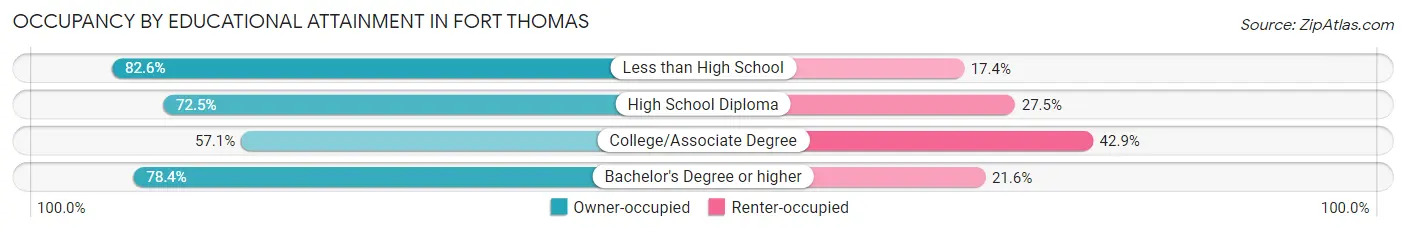
| Household Size | Owner-occupied | Renter-occupied |
| Less than High School | 100 (82.6%) | 21 (17.4%) |
| High School Diploma | 586 (72.5%) | 222 (27.5%) |
| College/Associate Degree | 951 (57.1%) | 715 (42.9%) |
| Bachelor's Degree or higher | 3,072 (78.4%) | 845 (21.6%) |
Occupancy by Age of Householder in Fort Thomas
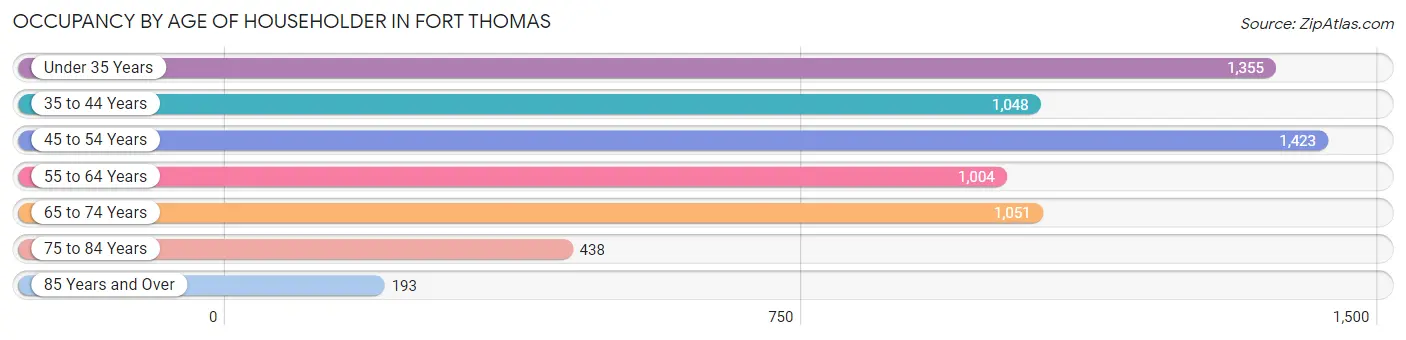
| Age Bracket | # Households | % Households |
| Under 35 Years | 1,355 | 20.8% |
| 35 to 44 Years | 1,048 | 16.1% |
| 45 to 54 Years | 1,423 | 21.8% |
| 55 to 64 Years | 1,004 | 15.4% |
| 65 to 74 Years | 1,051 | 16.1% |
| 75 to 84 Years | 438 | 6.7% |
| 85 Years and Over | 193 | 3.0% |
| Total | 6,512 | 100.0% |
Housing Finances in Fort Thomas
Median Income by Occupancy in Fort Thomas
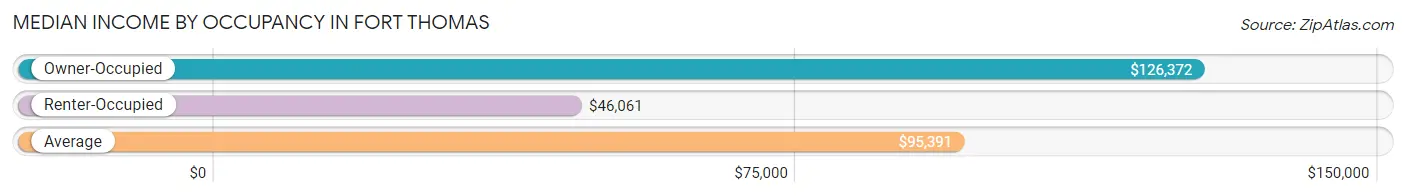
| Occupancy Type | # Households | Median Income |
| Owner-Occupied | 4,709 (72.3%) | $126,372 |
| Renter-Occupied | 1,803 (27.7%) | $46,061 |
| Average | 6,512 (100.0%) | $95,391 |
Occupancy by Householder Income Bracket in Fort Thomas
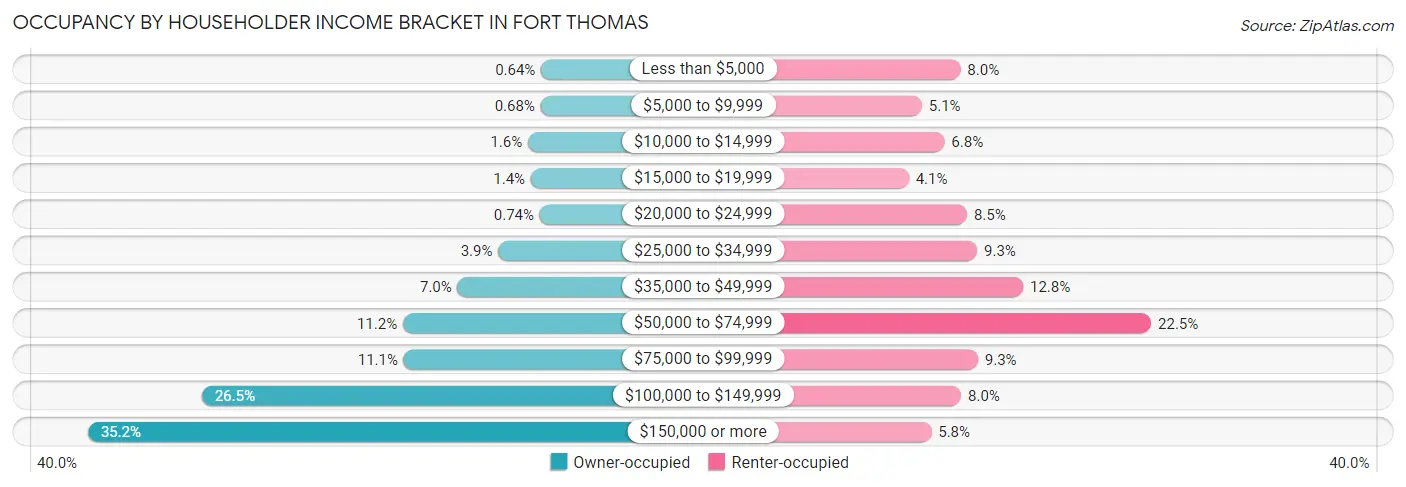
| Income Bracket | Owner-occupied | Renter-occupied |
| Less than $5,000 | 30 (0.6%) | 144 (8.0%) |
| $5,000 to $9,999 | 32 (0.7%) | 91 (5.1%) |
| $10,000 to $14,999 | 77 (1.6%) | 122 (6.8%) |
| $15,000 to $19,999 | 67 (1.4%) | 73 (4.1%) |
| $20,000 to $24,999 | 35 (0.7%) | 153 (8.5%) |
| $25,000 to $34,999 | 184 (3.9%) | 167 (9.3%) |
| $35,000 to $49,999 | 330 (7.0%) | 230 (12.8%) |
| $50,000 to $74,999 | 526 (11.2%) | 406 (22.5%) |
| $75,000 to $99,999 | 523 (11.1%) | 168 (9.3%) |
| $100,000 to $149,999 | 1,248 (26.5%) | 145 (8.0%) |
| $150,000 or more | 1,657 (35.2%) | 104 (5.8%) |
| Total | 4,709 (100.0%) | 1,803 (100.0%) |
Monthly Housing Cost Tiers in Fort Thomas
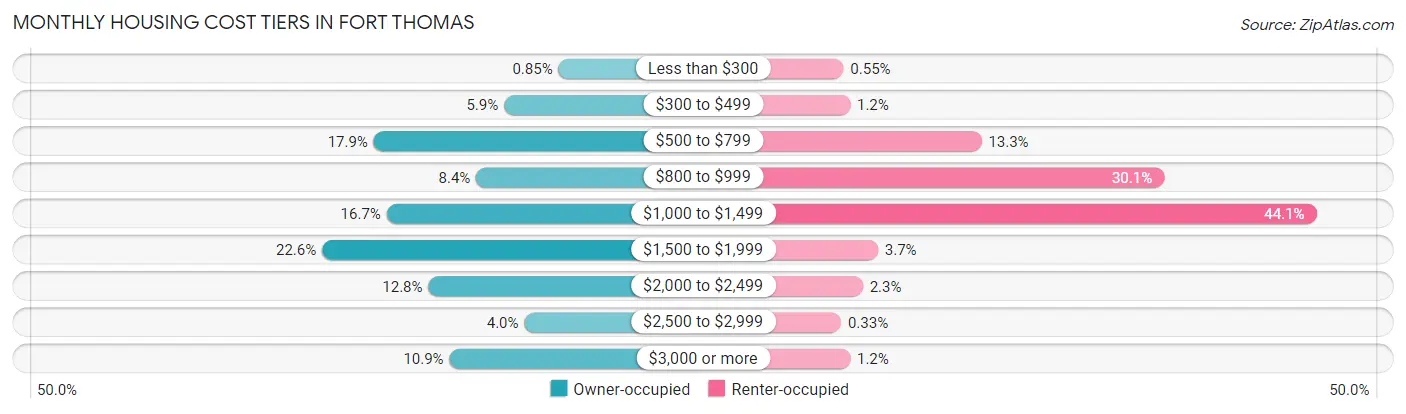
| Monthly Cost | Owner-occupied | Renter-occupied |
| Less than $300 | 40 (0.9%) | 10 (0.5%) |
| $300 to $499 | 276 (5.9%) | 21 (1.2%) |
| $500 to $799 | 841 (17.9%) | 239 (13.3%) |
| $800 to $999 | 397 (8.4%) | 542 (30.1%) |
| $1,000 to $1,499 | 785 (16.7%) | 795 (44.1%) |
| $1,500 to $1,999 | 1,065 (22.6%) | 67 (3.7%) |
| $2,000 to $2,499 | 604 (12.8%) | 42 (2.3%) |
| $2,500 to $2,999 | 188 (4.0%) | 6 (0.3%) |
| $3,000 or more | 513 (10.9%) | 21 (1.2%) |
| Total | 4,709 (100.0%) | 1,803 (100.0%) |
Physical Housing Characteristics in Fort Thomas
Housing Structures in Fort Thomas
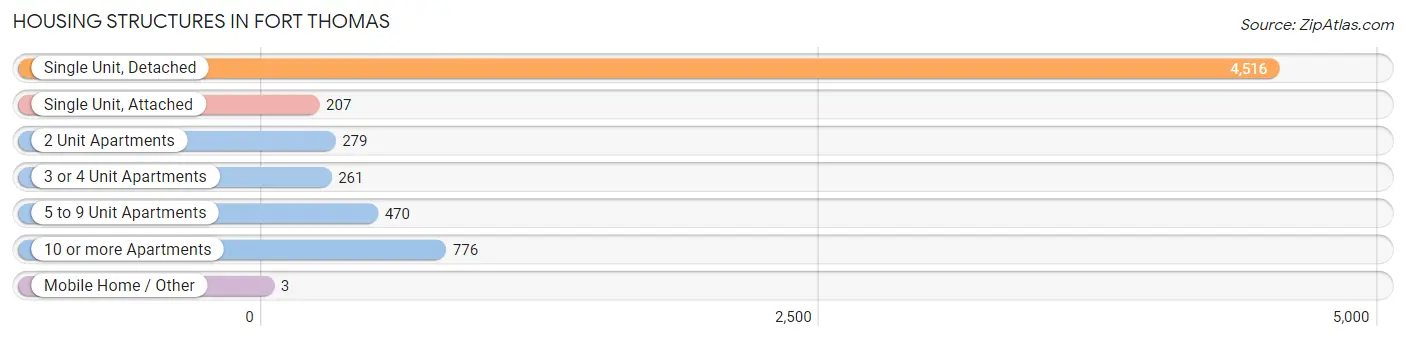
| Structure Type | # Housing Units | % Housing Units |
| Single Unit, Detached | 4,516 | 69.4% |
| Single Unit, Attached | 207 | 3.2% |
| 2 Unit Apartments | 279 | 4.3% |
| 3 or 4 Unit Apartments | 261 | 4.0% |
| 5 to 9 Unit Apartments | 470 | 7.2% |
| 10 or more Apartments | 776 | 11.9% |
| Mobile Home / Other | 3 | 0.1% |
| Total | 6,512 | 100.0% |
Housing Structures by Occupancy in Fort Thomas
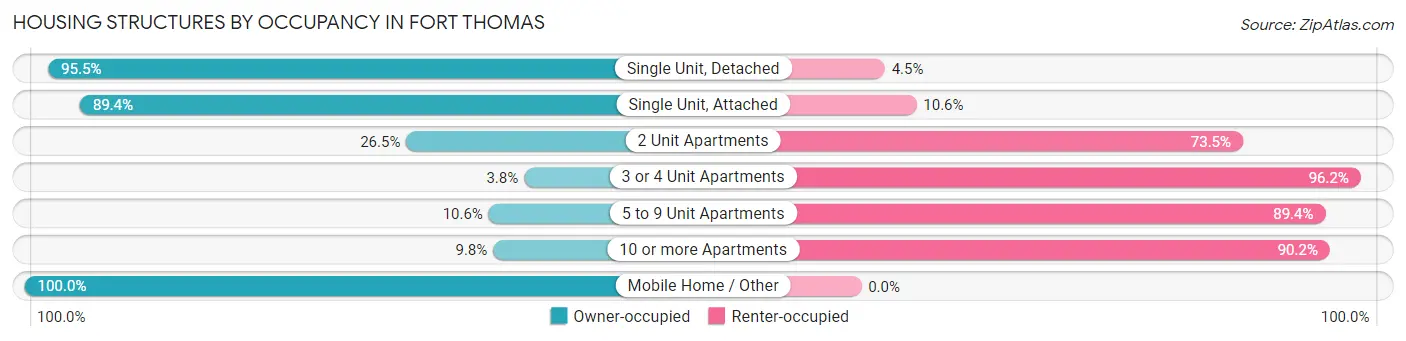
| Structure Type | Owner-occupied | Renter-occupied |
| Single Unit, Detached | 4,311 (95.5%) | 205 (4.5%) |
| Single Unit, Attached | 185 (89.4%) | 22 (10.6%) |
| 2 Unit Apartments | 74 (26.5%) | 205 (73.5%) |
| 3 or 4 Unit Apartments | 10 (3.8%) | 251 (96.2%) |
| 5 to 9 Unit Apartments | 50 (10.6%) | 420 (89.4%) |
| 10 or more Apartments | 76 (9.8%) | 700 (90.2%) |
| Mobile Home / Other | 3 (100.0%) | 0 (0.0%) |
| Total | 4,709 (72.3%) | 1,803 (27.7%) |
Housing Structures by Number of Rooms in Fort Thomas
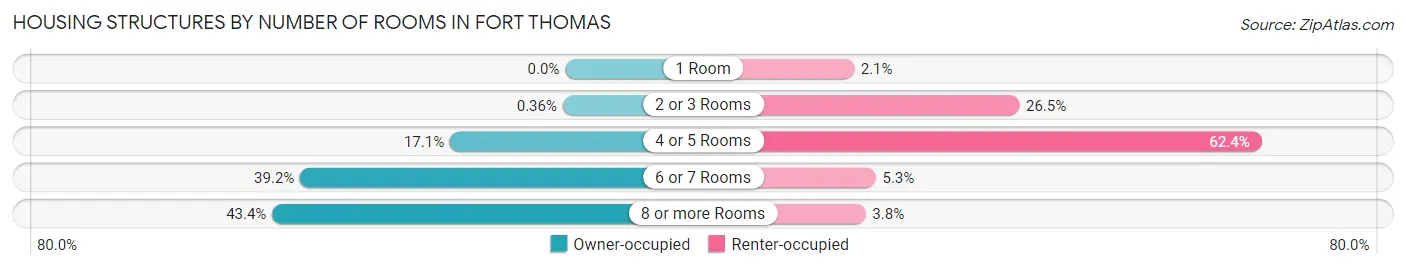
| Number of Rooms | Owner-occupied | Renter-occupied |
| 1 Room | 0 (0.0%) | 37 (2.1%) |
| 2 or 3 Rooms | 17 (0.4%) | 478 (26.5%) |
| 4 or 5 Rooms | 803 (17.1%) | 1,125 (62.4%) |
| 6 or 7 Rooms | 1,847 (39.2%) | 95 (5.3%) |
| 8 or more Rooms | 2,042 (43.4%) | 68 (3.8%) |
| Total | 4,709 (100.0%) | 1,803 (100.0%) |
Housing Structure by Heating Type in Fort Thomas
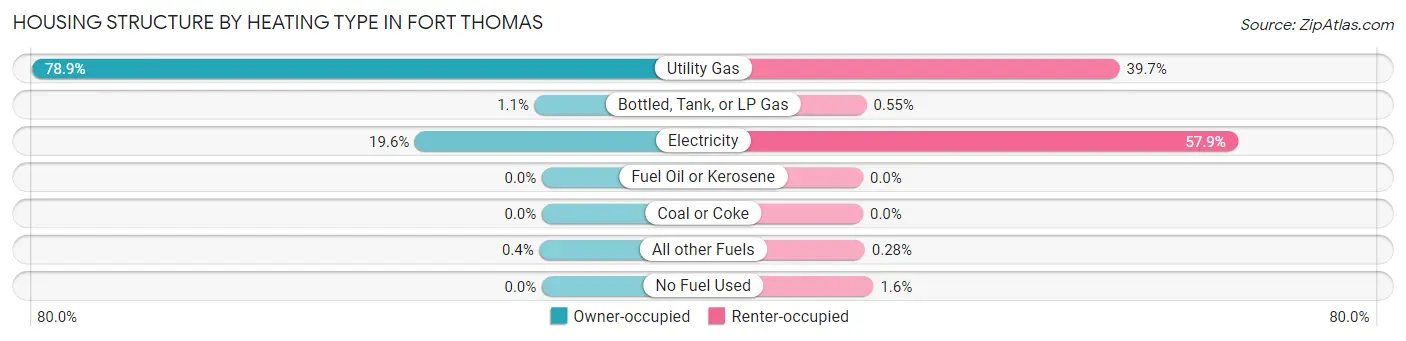
| Heating Type | Owner-occupied | Renter-occupied |
| Utility Gas | 3,713 (78.8%) | 715 (39.7%) |
| Bottled, Tank, or LP Gas | 53 (1.1%) | 10 (0.5%) |
| Electricity | 924 (19.6%) | 1,044 (57.9%) |
| Fuel Oil or Kerosene | 0 (0.0%) | 0 (0.0%) |
| Coal or Coke | 0 (0.0%) | 0 (0.0%) |
| All other Fuels | 19 (0.4%) | 5 (0.3%) |
| No Fuel Used | 0 (0.0%) | 29 (1.6%) |
| Total | 4,709 (100.0%) | 1,803 (100.0%) |
Household Vehicle Usage in Fort Thomas
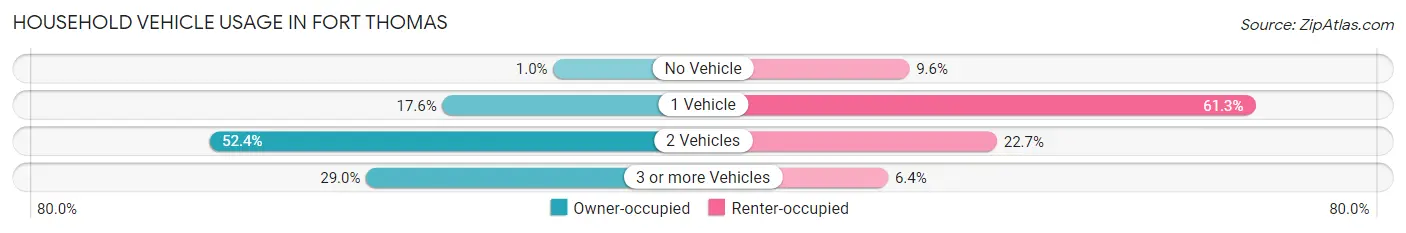
| Vehicles per Household | Owner-occupied | Renter-occupied |
| No Vehicle | 48 (1.0%) | 173 (9.6%) |
| 1 Vehicle | 828 (17.6%) | 1,105 (61.3%) |
| 2 Vehicles | 2,469 (52.4%) | 409 (22.7%) |
| 3 or more Vehicles | 1,364 (29.0%) | 116 (6.4%) |
| Total | 4,709 (100.0%) | 1,803 (100.0%) |
Real Estate & Mortgages in Fort Thomas
Real Estate and Mortgage Overview in Fort Thomas
| Characteristic | Without Mortgage | With Mortgage |
| Housing Units | 1,702 | 3,007 |
| Median Property Value | $234,600 | $286,800 |
| Median Household Income | $100,525 | $1,127 |
| Monthly Housing Costs | $666 | $513 |
| Real Estate Taxes | $3,361 | $42 |
Property Value by Mortgage Status in Fort Thomas
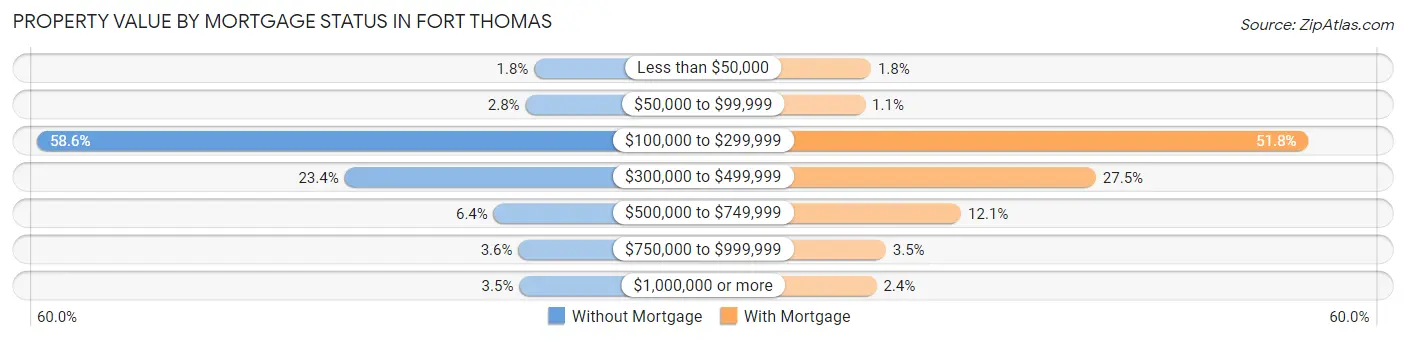
| Property Value | Without Mortgage | With Mortgage |
| Less than $50,000 | 30 (1.8%) | 53 (1.8%) |
| $50,000 to $99,999 | 47 (2.8%) | 33 (1.1%) |
| $100,000 to $299,999 | 997 (58.6%) | 1,556 (51.7%) |
| $300,000 to $499,999 | 399 (23.4%) | 826 (27.5%) |
| $500,000 to $749,999 | 109 (6.4%) | 363 (12.1%) |
| $750,000 to $999,999 | 61 (3.6%) | 104 (3.5%) |
| $1,000,000 or more | 59 (3.5%) | 72 (2.4%) |
| Total | 1,702 (100.0%) | 3,007 (100.0%) |
Household Income by Mortgage Status in Fort Thomas
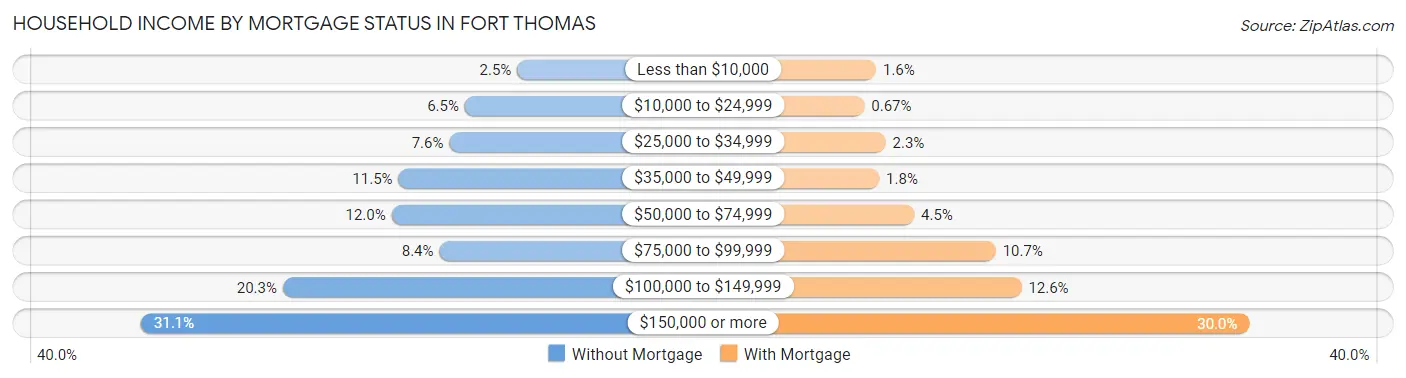
| Household Income | Without Mortgage | With Mortgage |
| Less than $10,000 | 42 (2.5%) | 47 (1.6%) |
| $10,000 to $24,999 | 110 (6.5%) | 20 (0.7%) |
| $25,000 to $34,999 | 130 (7.6%) | 69 (2.3%) |
| $35,000 to $49,999 | 196 (11.5%) | 54 (1.8%) |
| $50,000 to $74,999 | 205 (12.0%) | 134 (4.5%) |
| $75,000 to $99,999 | 143 (8.4%) | 321 (10.7%) |
| $100,000 to $149,999 | 346 (20.3%) | 380 (12.6%) |
| $150,000 or more | 530 (31.1%) | 902 (30.0%) |
| Total | 1,702 (100.0%) | 3,007 (100.0%) |
Property Value to Household Income Ratio in Fort Thomas
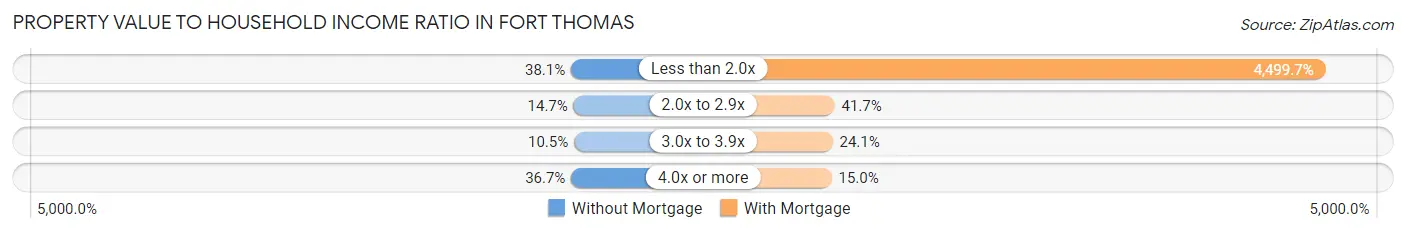
| Value-to-Income Ratio | Without Mortgage | With Mortgage |
| Less than 2.0x | 649 (38.1%) | 135,307 (4,499.7%) |
| 2.0x to 2.9x | 250 (14.7%) | 1,254 (41.7%) |
| 3.0x to 3.9x | 179 (10.5%) | 724 (24.1%) |
| 4.0x or more | 624 (36.7%) | 452 (15.0%) |
| Total | 1,702 (100.0%) | 3,007 (100.0%) |
Real Estate Taxes by Mortgage Status in Fort Thomas
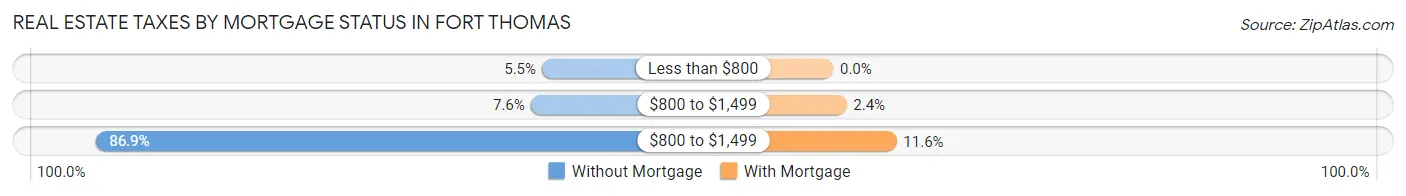
| Property Taxes | Without Mortgage | With Mortgage |
| Less than $800 | 94 (5.5%) | 0 (0.0%) |
| $800 to $1,499 | 129 (7.6%) | 73 (2.4%) |
| $800 to $1,499 | 1,479 (86.9%) | 348 (11.6%) |
| Total | 1,702 (100.0%) | 3,007 (100.0%) |
Health & Disability in Fort Thomas
Health Insurance Coverage by Age in Fort Thomas
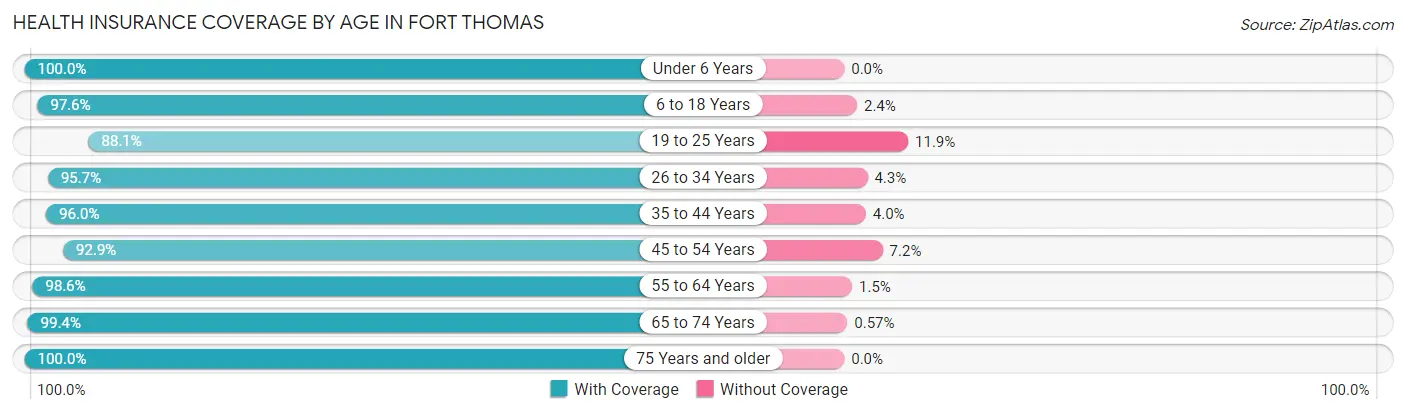
| Age Bracket | With Coverage | Without Coverage |
| Under 6 Years | 1,171 (100.0%) | 0 (0.0%) |
| 6 to 18 Years | 3,529 (97.6%) | 86 (2.4%) |
| 19 to 25 Years | 1,110 (88.1%) | 150 (11.9%) |
| 26 to 34 Years | 1,904 (95.7%) | 86 (4.3%) |
| 35 to 44 Years | 1,863 (96.0%) | 78 (4.0%) |
| 45 to 54 Years | 2,273 (92.8%) | 175 (7.1%) |
| 55 to 64 Years | 2,104 (98.6%) | 31 (1.5%) |
| 65 to 74 Years | 1,565 (99.4%) | 9 (0.6%) |
| 75 Years and older | 894 (100.0%) | 0 (0.0%) |
| Total | 16,413 (96.4%) | 615 (3.6%) |
Health Insurance Coverage by Citizenship Status in Fort Thomas
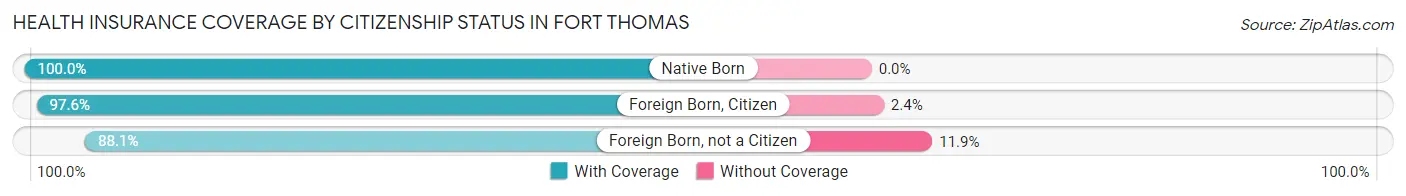
| Citizenship Status | With Coverage | Without Coverage |
| Native Born | 1,171 (100.0%) | 0 (0.0%) |
| Foreign Born, Citizen | 3,529 (97.6%) | 86 (2.4%) |
| Foreign Born, not a Citizen | 1,110 (88.1%) | 150 (11.9%) |
Health Insurance Coverage by Household Income in Fort Thomas
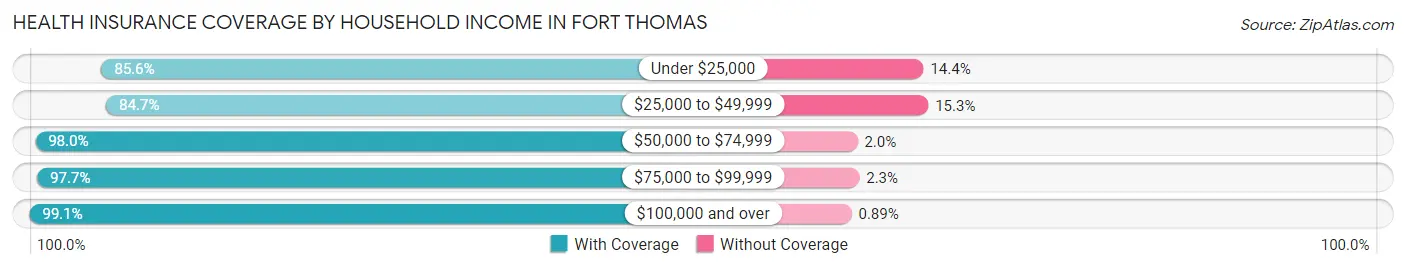
| Household Income | With Coverage | Without Coverage |
| Under $25,000 | 888 (85.6%) | 149 (14.4%) |
| $25,000 to $49,999 | 1,394 (84.7%) | 251 (15.3%) |
| $50,000 to $74,999 | 1,616 (98.0%) | 33 (2.0%) |
| $75,000 to $99,999 | 1,795 (97.7%) | 43 (2.3%) |
| $100,000 and over | 10,664 (99.1%) | 96 (0.9%) |
Public vs Private Health Insurance Coverage by Age in Fort Thomas
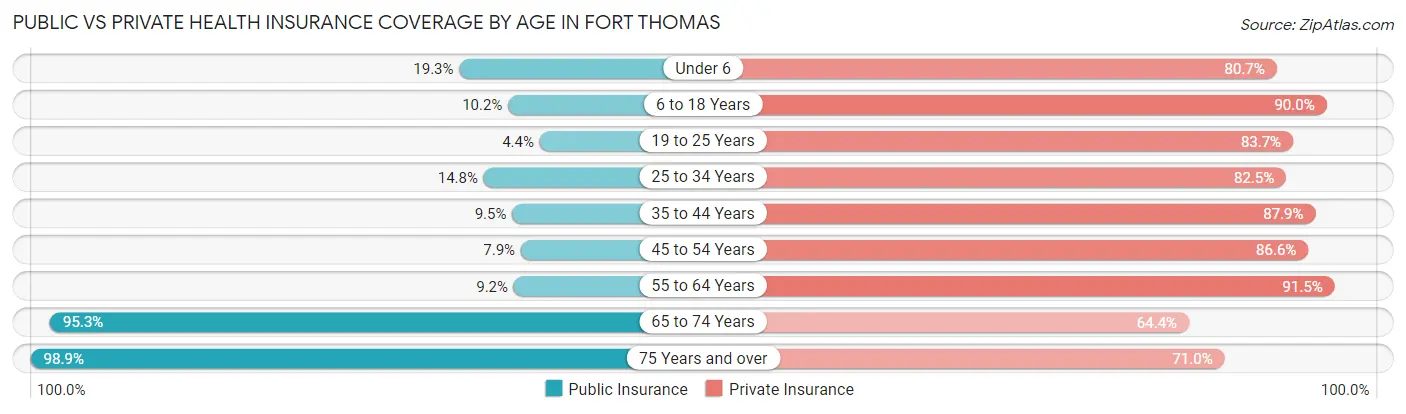
| Age Bracket | Public Insurance | Private Insurance |
| Under 6 | 226 (19.3%) | 945 (80.7%) |
| 6 to 18 Years | 370 (10.2%) | 3,252 (90.0%) |
| 19 to 25 Years | 55 (4.4%) | 1,055 (83.7%) |
| 25 to 34 Years | 294 (14.8%) | 1,641 (82.5%) |
| 35 to 44 Years | 184 (9.5%) | 1,706 (87.9%) |
| 45 to 54 Years | 193 (7.9%) | 2,119 (86.6%) |
| 55 to 64 Years | 196 (9.2%) | 1,953 (91.5%) |
| 65 to 74 Years | 1,500 (95.3%) | 1,014 (64.4%) |
| 75 Years and over | 884 (98.9%) | 635 (71.0%) |
| Total | 3,902 (22.9%) | 14,320 (84.1%) |
Disability Status by Sex by Age in Fort Thomas
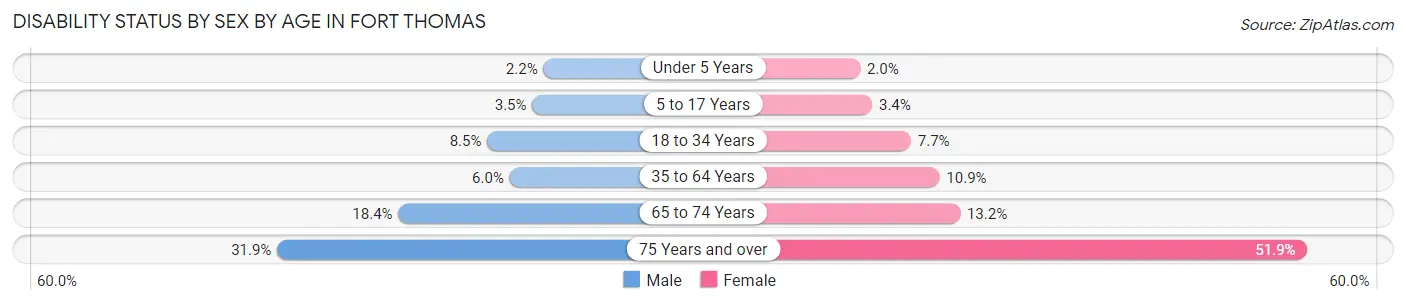
| Age Bracket | Male | Female |
| Under 5 Years | 10 (2.2%) | 10 (2.0%) |
| 5 to 17 Years | 69 (3.5%) | 58 (3.4%) |
| 18 to 34 Years | 154 (8.5%) | 119 (7.7%) |
| 35 to 64 Years | 194 (6.0%) | 356 (10.9%) |
| 65 to 74 Years | 151 (18.4%) | 99 (13.2%) |
| 75 Years and over | 87 (31.9%) | 322 (51.8%) |
Disability Class by Sex by Age in Fort Thomas
Disability Class: Hearing Difficulty
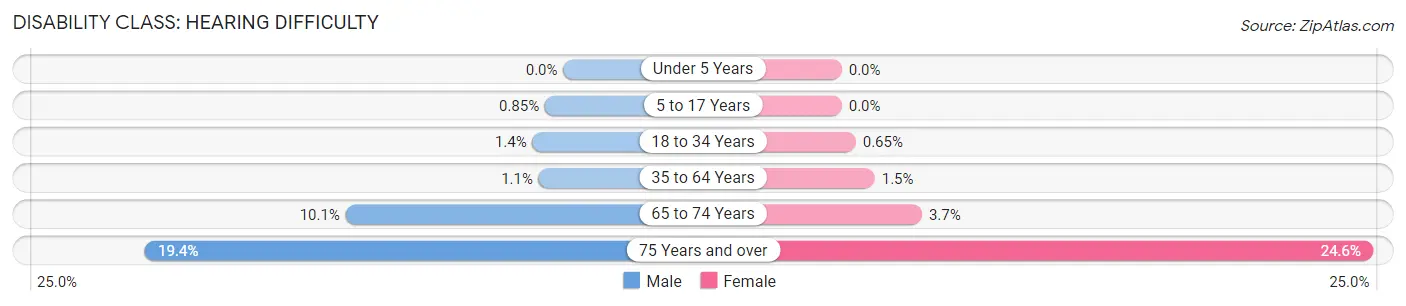
| Age Bracket | Male | Female |
| Under 5 Years | 0 (0.0%) | 0 (0.0%) |
| 5 to 17 Years | 17 (0.9%) | 0 (0.0%) |
| 18 to 34 Years | 26 (1.4%) | 10 (0.6%) |
| 35 to 64 Years | 37 (1.1%) | 50 (1.5%) |
| 65 to 74 Years | 83 (10.1%) | 28 (3.7%) |
| 75 Years and over | 53 (19.4%) | 153 (24.6%) |
Disability Class: Vision Difficulty
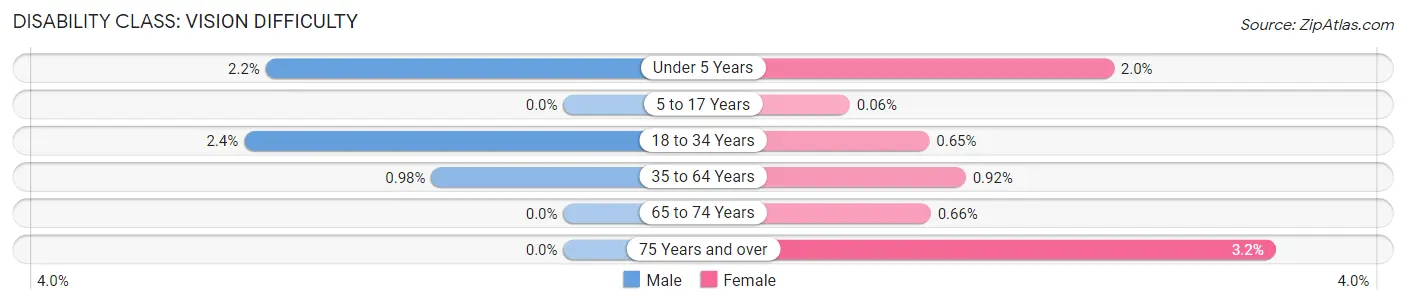
| Age Bracket | Male | Female |
| Under 5 Years | 10 (2.2%) | 10 (2.0%) |
| 5 to 17 Years | 0 (0.0%) | 1 (0.1%) |
| 18 to 34 Years | 43 (2.4%) | 10 (0.6%) |
| 35 to 64 Years | 32 (1.0%) | 30 (0.9%) |
| 65 to 74 Years | 0 (0.0%) | 5 (0.7%) |
| 75 Years and over | 0 (0.0%) | 20 (3.2%) |
Disability Class: Cognitive Difficulty
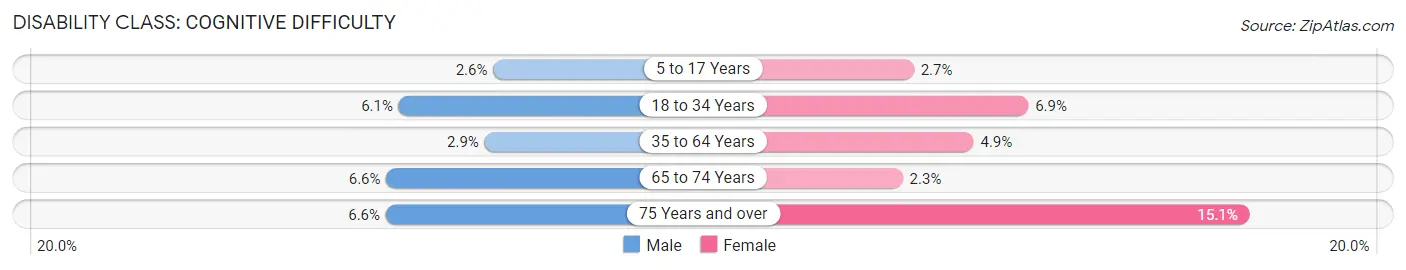
| Age Bracket | Male | Female |
| 5 to 17 Years | 52 (2.6%) | 46 (2.7%) |
| 18 to 34 Years | 111 (6.1%) | 107 (6.9%) |
| 35 to 64 Years | 95 (2.9%) | 160 (4.9%) |
| 65 to 74 Years | 54 (6.6%) | 17 (2.3%) |
| 75 Years and over | 18 (6.6%) | 94 (15.1%) |
Disability Class: Ambulatory Difficulty
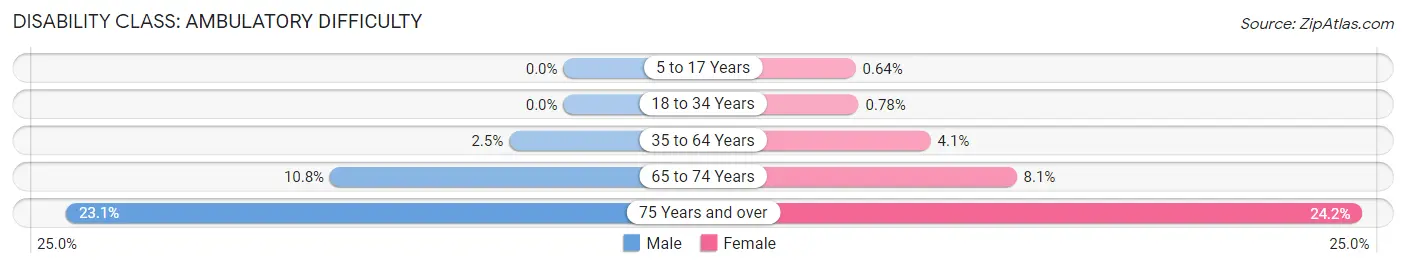
| Age Bracket | Male | Female |
| 5 to 17 Years | 0 (0.0%) | 11 (0.6%) |
| 18 to 34 Years | 0 (0.0%) | 12 (0.8%) |
| 35 to 64 Years | 82 (2.5%) | 135 (4.1%) |
| 65 to 74 Years | 89 (10.8%) | 61 (8.1%) |
| 75 Years and over | 63 (23.1%) | 150 (24.1%) |
Disability Class: Self-Care Difficulty
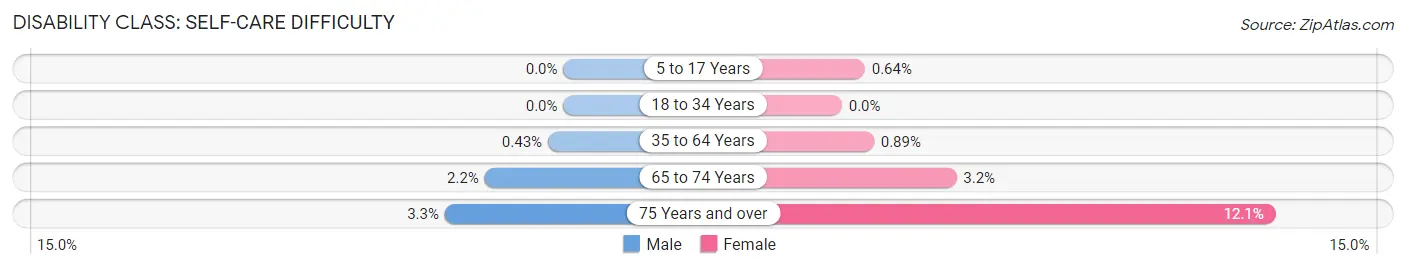
| Age Bracket | Male | Female |
| 5 to 17 Years | 0 (0.0%) | 11 (0.6%) |
| 18 to 34 Years | 0 (0.0%) | 0 (0.0%) |
| 35 to 64 Years | 14 (0.4%) | 29 (0.9%) |
| 65 to 74 Years | 18 (2.2%) | 24 (3.2%) |
| 75 Years and over | 9 (3.3%) | 75 (12.1%) |
Technology Access in Fort Thomas
Computing Device Access in Fort Thomas
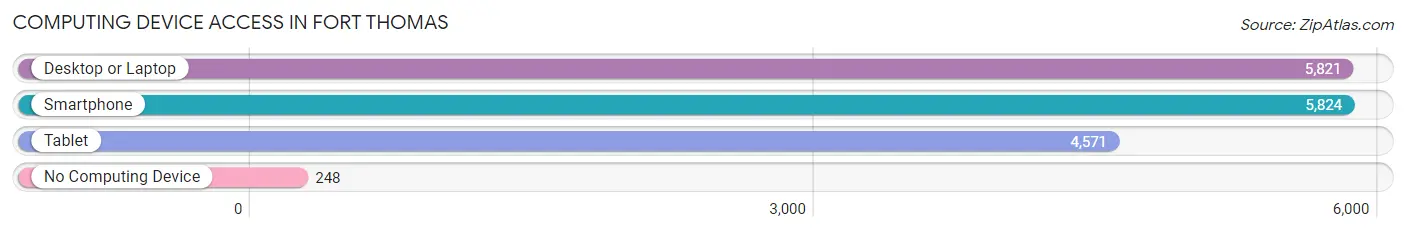
| Device Type | # Households | % Households |
| Desktop or Laptop | 5,821 | 89.4% |
| Smartphone | 5,824 | 89.4% |
| Tablet | 4,571 | 70.2% |
| No Computing Device | 248 | 3.8% |
| Total | 6,512 | 100.0% |
Internet Access in Fort Thomas
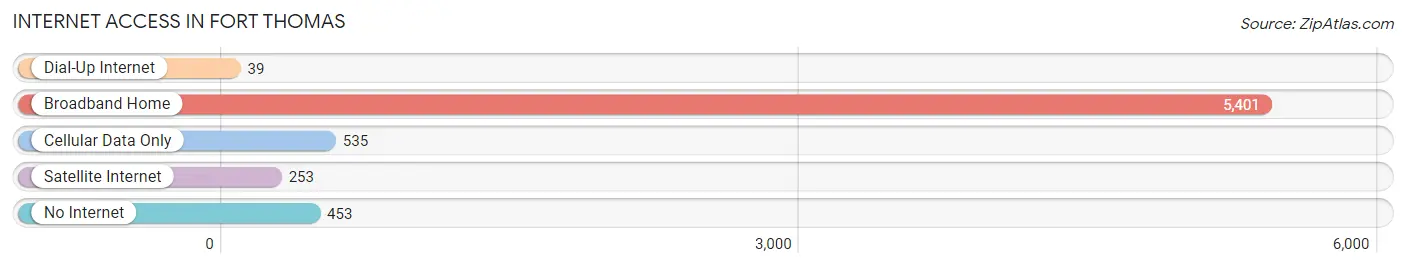
| Internet Type | # Households | % Households |
| Dial-Up Internet | 39 | 0.6% |
| Broadband Home | 5,401 | 82.9% |
| Cellular Data Only | 535 | 8.2% |
| Satellite Internet | 253 | 3.9% |
| No Internet | 453 | 7.0% |
| Total | 6,512 | 100.0% |
Fort Thomas Summary
Fort Thomas is a city located in Campbell County, Kentucky, United States. It is part of the Cincinnati metropolitan area. The population was 16,325 at the 2010 census. It is located on the southern bank of the Ohio River, across from Cincinnati, Ohio.
History
Fort Thomas was founded in 1867 by General William Nelson, a Civil War veteran. He named the city after his friend, General George H. Thomas. The city was incorporated in 1887.
Fort Thomas was originally a military post, established in 1862 to protect the area from Confederate forces. The fort was named after General Thomas, who was a Union general during the Civil War. The fort was decommissioned in 1865, but the city of Fort Thomas was established in 1867.
The city was a popular summer resort in the late 19th and early 20th centuries. It was known for its mineral springs, which were believed to have healing properties. The city was also home to a number of large estates, including the estate of William Procter, one of the founders of Procter & Gamble.
Geography
Fort Thomas is located at 39°3′25″N 84°27′17″W (39.056944, -84.454722). According to the United States Census Bureau, the city has a total area of 4.2 square miles (10.8 km2), of which 4.1 square miles (10.6 km2) is land and 0.1 square miles (0.2 km2) (2.44%) is water.
Economy
Fort Thomas is home to a number of businesses, including Procter & Gamble, which has a large manufacturing facility in the city. Other major employers include St. Elizabeth Healthcare, the Campbell County School District, and the City of Fort Thomas.
The city is also home to a number of small businesses, including restaurants, retail stores, and professional services.
Demographics
As of the census of 2010, there were 16,325 people, 6,845 households, and 4,717 families residing in the city. The population density was 3,945.3 people per square mile (1,521.7/km2). There were 7,093 housing units at an average density of 1,735.3 per square mile (669.7/km2). The racial makeup of the city was 94.2% White, 2.2% African American, 0.2% Native American, 1.3% Asian, 0.1% Pacific Islander, 0.7% from other races, and 1.4% from two or more races. Hispanic or Latino of any race were 2.2% of the population.
There were 6,845 households, out of which 28.2% had children under the age of 18 living with them, 51.2% were married couples living together, 11.2% had a female householder with no husband present, and 33.7% were non-families. 28.7% of all households were made up of individuals, and 11.2% had someone living alone who was 65 years of age or older. The average household size was 2.37 and the average family size was 2.93.
In the city, the population was spread out, with 22.7% under the age of 18, 6.2% from 18 to 24, 28.2% from 25 to 44, 25.7% from 45 to 64, and 17.2% who were 65 years of age or older. The median age was 40 years. For every 100 females, there were 91.2 males. For every 100 females age 18 and over, there were 87.7 males.
The median income for a household in the city was $50,945, and the median income for a family was $62,917. Males had a median income of $45,945 versus $31,917 for females. The per capita income for the city was $27,945. About 3.2% of families and 4.7% of the population were below the poverty line, including 5.3% of those under age 18 and 4.2% of those age 65 or over.
Common Questions
What is Per Capita Income in Fort Thomas?
Per Capita income in Fort Thomas is $49,691.
What is the Median Family Income in Fort Thomas?
Median Family Income in Fort Thomas is $127,419.
What is the Median Household income in Fort Thomas?
Median Household Income in Fort Thomas is $95,391.
What is Income or Wage Gap in Fort Thomas?
Income or Wage Gap in Fort Thomas is 30.7%.
Women in Fort Thomas earn 69.3 cents for every dollar earned by a man.
What is Family Income Deficit in Fort Thomas?
Family Income Deficit in Fort Thomas is $8,507.
Families that are below poverty line in Fort Thomas earn $8,507 less on average than the poverty threshold level.
What is Inequality or Gini Index in Fort Thomas?
Inequality or Gini Index in Fort Thomas is 0.48.
What is the Total Population of Fort Thomas?
Total Population of Fort Thomas is 17,310.
What is the Total Male Population of Fort Thomas?
Total Male Population of Fort Thomas is 8,744.
What is the Total Female Population of Fort Thomas?
Total Female Population of Fort Thomas is 8,566.
What is the Ratio of Males per 100 Females in Fort Thomas?
There are 102.08 Males per 100 Females in Fort Thomas.
What is the Ratio of Females per 100 Males in Fort Thomas?
There are 97.96 Females per 100 Males in Fort Thomas.
What is the Median Population Age in Fort Thomas?
Median Population Age in Fort Thomas is 37.9 Years.
What is the Average Family Size in Fort Thomas
Average Family Size in Fort Thomas is 3.2 People.
What is the Average Household Size in Fort Thomas
Average Household Size in Fort Thomas is 2.6 People.
How Large is the Labor Force in Fort Thomas?
There are 9,063 People in the Labor Forcein in Fort Thomas.
What is the Percentage of People in the Labor Force in Fort Thomas?
68.6% of People are in the Labor Force in Fort Thomas.
What is the Unemployment Rate in Fort Thomas?
Unemployment Rate in Fort Thomas is 3.8%.