Cambridge, KY Map & Demographics
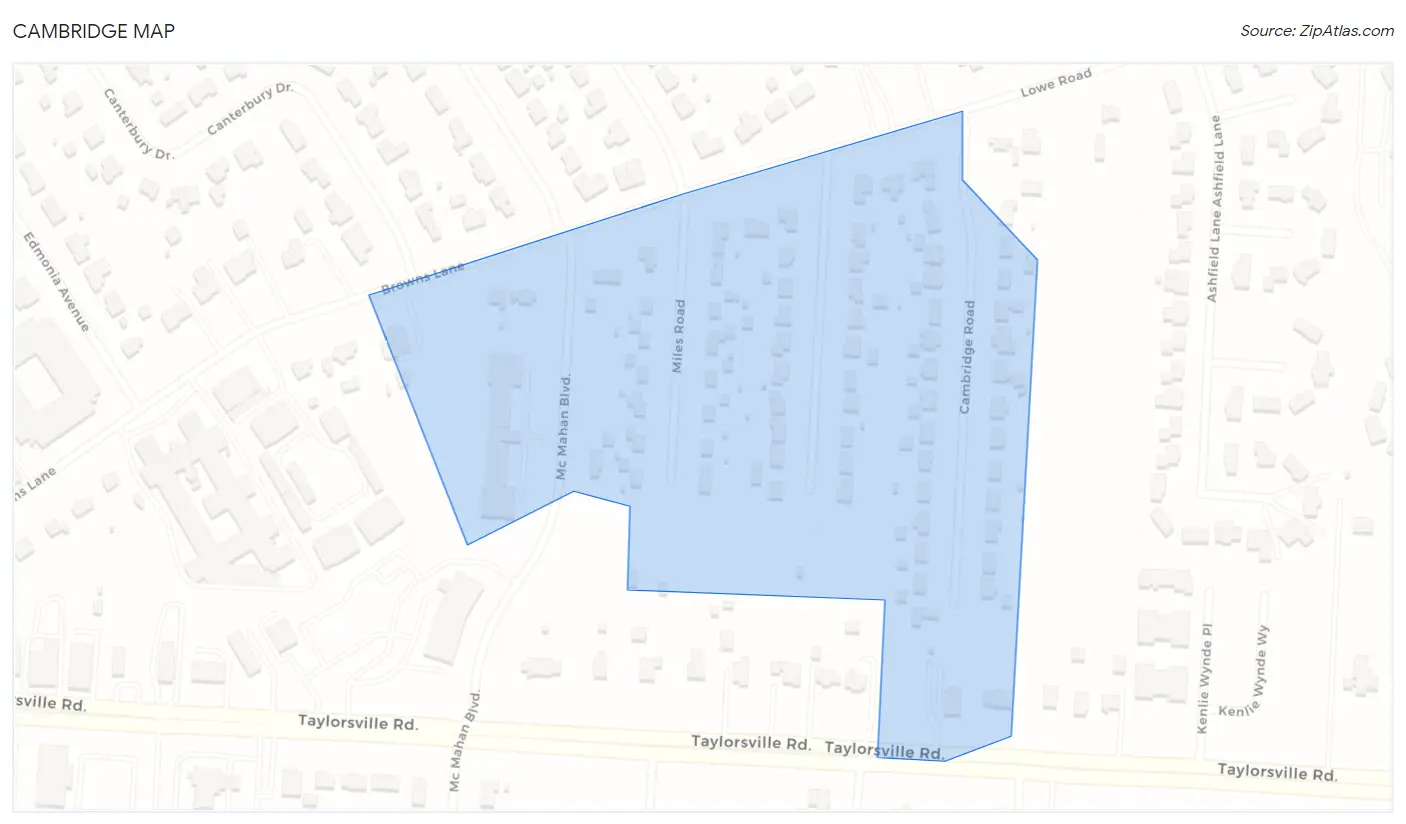
Cambridge Map
Cambridge Overview
$55,615
PER CAPITA INCOME
$142,708
AVG FAMILY INCOME
$88,958
AVG HOUSEHOLD INCOME
22.1%
WAGE / INCOME GAP [ % ]
77.9¢/ $1
WAGE / INCOME GAP [ $ ]
0.38
INEQUALITY / GINI INDEX
153
TOTAL POPULATION
69
MALE POPULATION
84
FEMALE POPULATION
82.14
MALES / 100 FEMALES
121.74
FEMALES / 100 MALES
46.2
MEDIAN AGE
2.7
AVG FAMILY SIZE
1.7
AVG HOUSEHOLD SIZE
118
LABOR FORCE [ PEOPLE ]
84.3%
PERCENT IN LABOR FORCE
5.9%
UNEMPLOYMENT RATE
Cambridge Area Codes
Income in Cambridge
Income Overview in Cambridge
Per Capita Income in Cambridge is $55,615, while median incomes of families and households are $142,708 and $88,958 respectively.
| Characteristic | Number | Measure |
| Per Capita Income | 153 | $55,615 |
| Median Family Income | 33 | $142,708 |
| Mean Family Income | 33 | $139,182 |
| Median Household Income | 89 | $88,958 |
| Mean Household Income | 89 | $94,763 |
| Income Deficit | 33 | $0 |
| Wage / Income Gap (%) | 153 | 22.11% |
| Wage / Income Gap ($) | 153 | 77.89¢ per $1 |
| Gini / Inequality Index | 153 | 0.38 |
Earnings by Sex in Cambridge
Average Earnings in Cambridge are $47,188, $59,375 for men and $46,250 for women, a difference of 22.1%.
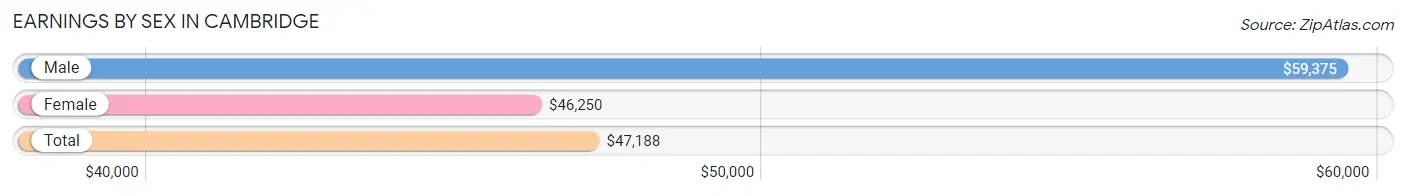
| Sex | Number | Average Earnings |
| Male | 53 (43.8%) | $59,375 |
| Female | 68 (56.2%) | $46,250 |
| Total | 121 (100.0%) | $47,188 |
Earnings by Sex by Income Bracket in Cambridge
The most common earnings brackets in Cambridge are $75,000 to $99,999 for men (13 | 24.5%) and $45,000 to $49,999 for women (11 | 16.2%).
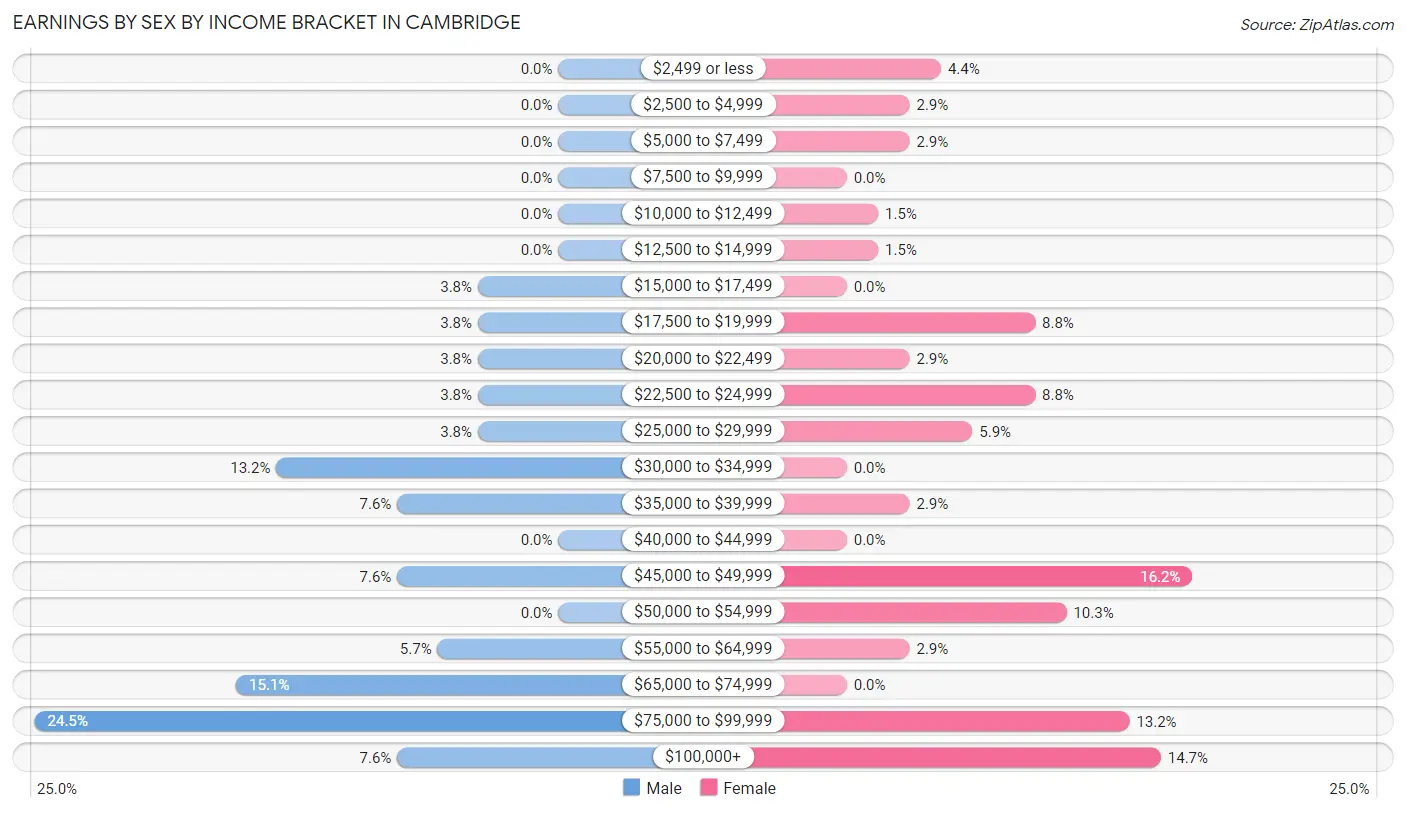
| Income | Male | Female |
| $2,499 or less | 0 (0.0%) | 3 (4.4%) |
| $2,500 to $4,999 | 0 (0.0%) | 2 (2.9%) |
| $5,000 to $7,499 | 0 (0.0%) | 2 (2.9%) |
| $7,500 to $9,999 | 0 (0.0%) | 0 (0.0%) |
| $10,000 to $12,499 | 0 (0.0%) | 1 (1.5%) |
| $12,500 to $14,999 | 0 (0.0%) | 1 (1.5%) |
| $15,000 to $17,499 | 2 (3.8%) | 0 (0.0%) |
| $17,500 to $19,999 | 2 (3.8%) | 6 (8.8%) |
| $20,000 to $22,499 | 2 (3.8%) | 2 (2.9%) |
| $22,500 to $24,999 | 2 (3.8%) | 6 (8.8%) |
| $25,000 to $29,999 | 2 (3.8%) | 4 (5.9%) |
| $30,000 to $34,999 | 7 (13.2%) | 0 (0.0%) |
| $35,000 to $39,999 | 4 (7.5%) | 2 (2.9%) |
| $40,000 to $44,999 | 0 (0.0%) | 0 (0.0%) |
| $45,000 to $49,999 | 4 (7.5%) | 11 (16.2%) |
| $50,000 to $54,999 | 0 (0.0%) | 7 (10.3%) |
| $55,000 to $64,999 | 3 (5.7%) | 2 (2.9%) |
| $65,000 to $74,999 | 8 (15.1%) | 0 (0.0%) |
| $75,000 to $99,999 | 13 (24.5%) | 9 (13.2%) |
| $100,000+ | 4 (7.5%) | 10 (14.7%) |
| Total | 53 (100.0%) | 68 (100.0%) |
Earnings by Sex by Educational Attainment in Cambridge
Average earnings in Cambridge are $70,625 for men and $50,179 for women, a difference of 28.9%. Men with an educational attainment of bachelor's degree enjoy the highest average annual earnings of $91,250, while those with college or associate's degree education earn the least with $58,750. Women with an educational attainment of bachelor's degree earn the most with the average annual earnings of $133,000, while those with high school diploma education have the smallest earnings of $38,750.
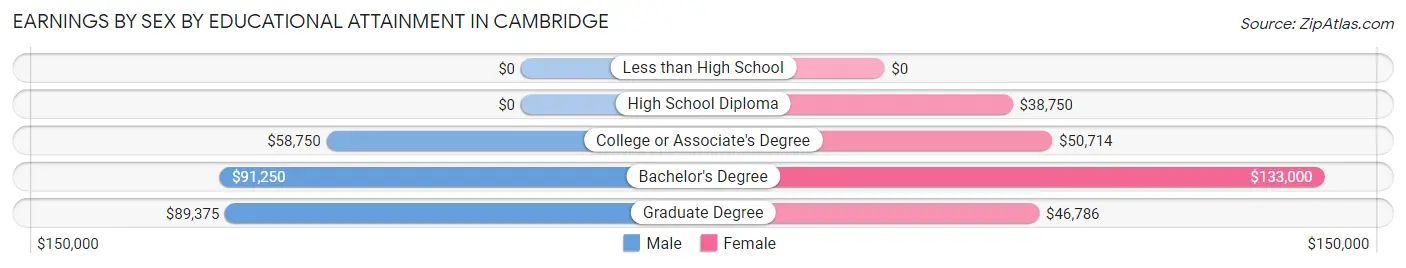
| Educational Attainment | Male Income | Female Income |
| Less than High School | - | - |
| High School Diploma | - | - |
| College or Associate's Degree | $58,750 | $50,714 |
| Bachelor's Degree | $91,250 | $133,000 |
| Graduate Degree | $89,375 | $46,786 |
| Total | $70,625 | $50,179 |
Family Income in Cambridge
Family Income Brackets in Cambridge
According to the Cambridge family income data, there are 10 families falling into the $100,000 to $149,999 income range, which is the most common income bracket and makes up 30.3% of all families.
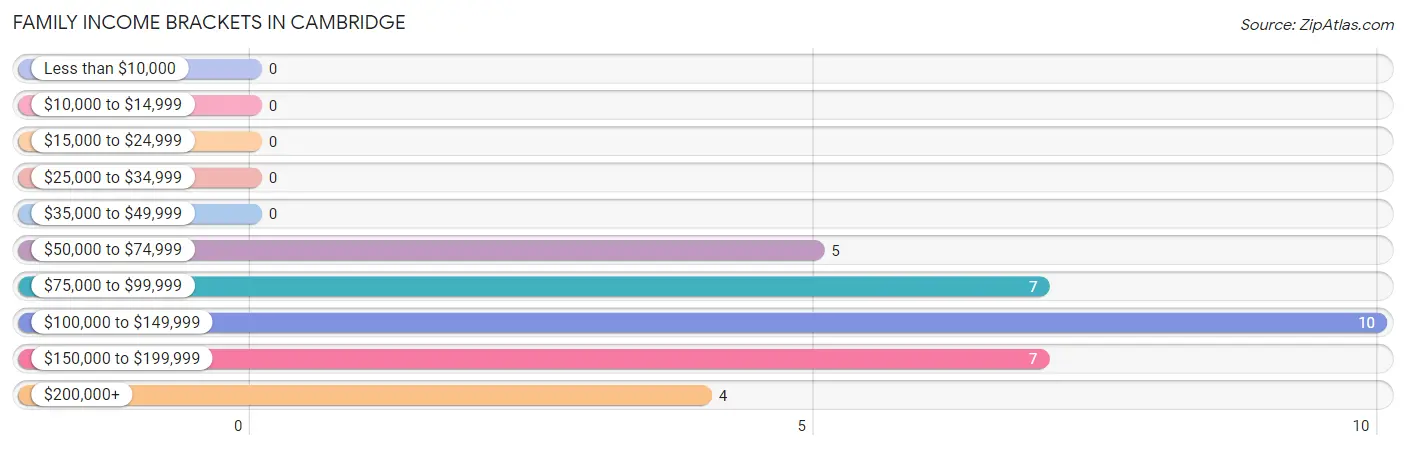
| Income Bracket | # Families | % Families |
| Less than $10,000 | 0 | 0.0% |
| $10,000 to $14,999 | 0 | 0.0% |
| $15,000 to $24,999 | 0 | 0.0% |
| $25,000 to $34,999 | 0 | 0.0% |
| $35,000 to $49,999 | 0 | 0.0% |
| $50,000 to $74,999 | 5 | 15.2% |
| $75,000 to $99,999 | 7 | 21.2% |
| $100,000 to $149,999 | 10 | 30.3% |
| $150,000 to $199,999 | 7 | 21.2% |
| $200,000+ | 4 | 12.1% |
Family Income by Famaliy Size in Cambridge
3-person families (5 | 15.1%) account for the highest median family income in Cambridge with $158,125 per family, while 2-person families (23 | 69.7%) have the highest median income of $71,562 per family member.
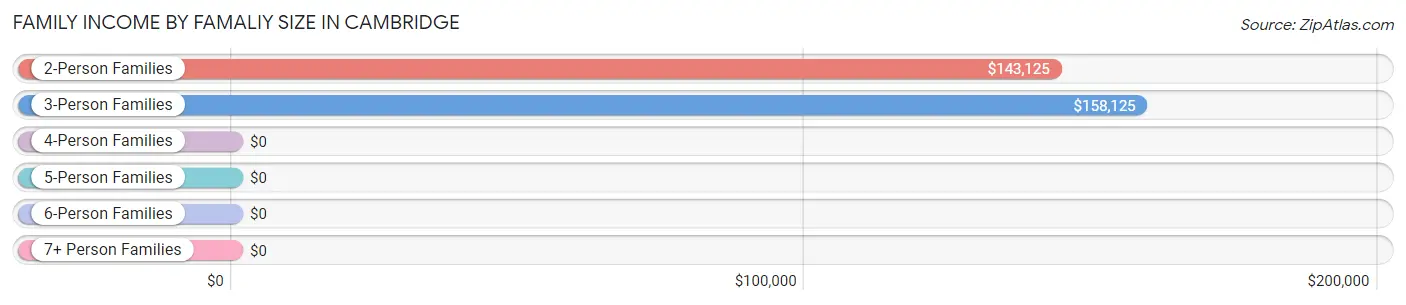
| Income Bracket | # Families | Median Income |
| 2-Person Families | 23 (69.7%) | $143,125 |
| 3-Person Families | 5 (15.1%) | $158,125 |
| 4-Person Families | 1 (3.0%) | $0 |
| 5-Person Families | 3 (9.1%) | $0 |
| 6-Person Families | 1 (3.0%) | $0 |
| 7+ Person Families | 0 (0.0%) | $0 |
| Total | 33 (100.0%) | $142,708 |
Family Income by Number of Earners in Cambridge
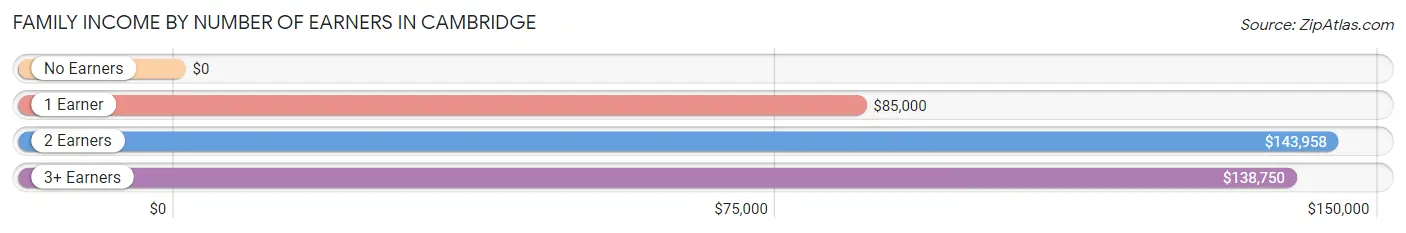
| Number of Earners | # Families | Median Income |
| No Earners | 2 (6.1%) | $0 |
| 1 Earner | 4 (12.1%) | $85,000 |
| 2 Earners | 23 (69.7%) | $143,958 |
| 3+ Earners | 4 (12.1%) | $138,750 |
| Total | 33 (100.0%) | $142,708 |
Household Income in Cambridge
Household Income Brackets in Cambridge
With 20 households falling in the category, the $75,000 to $99,999 income range is the most frequent in Cambridge, accounting for 22.5% of all households. In contrast, only 1 households (1.1%) fall into the less than $10,000 income bracket, making it the least populous group.
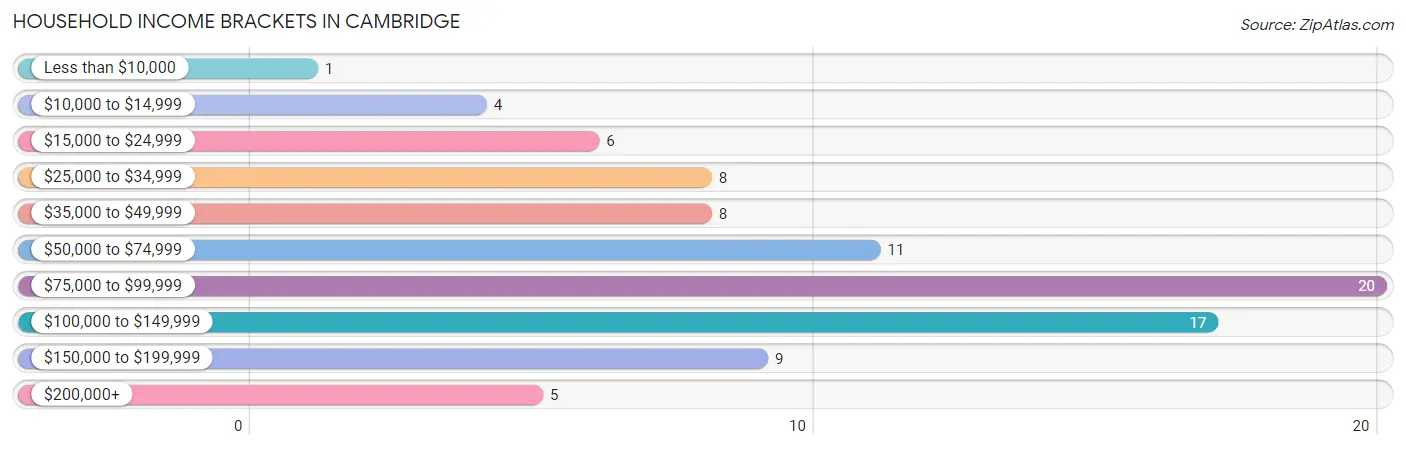
| Income Bracket | # Households | % Households |
| Less than $10,000 | 1 | 1.1% |
| $10,000 to $14,999 | 4 | 4.5% |
| $15,000 to $24,999 | 6 | 6.7% |
| $25,000 to $34,999 | 8 | 9.0% |
| $35,000 to $49,999 | 8 | 9.0% |
| $50,000 to $74,999 | 11 | 12.4% |
| $75,000 to $99,999 | 20 | 22.5% |
| $100,000 to $149,999 | 17 | 19.1% |
| $150,000 to $199,999 | 9 | 10.1% |
| $200,000+ | 5 | 5.6% |
Household Income by Householder Age in Cambridge
The median household income in Cambridge is $88,958, with the highest median household income of $89,792 found in the 45 to 64 years age bracket for the primary householder. A total of 41 households (46.1%) fall into this category. Meanwhile, the 15 to 24 years age bracket for the primary householder has the lowest median household income of $0, with 3 households (3.4%) in this group.
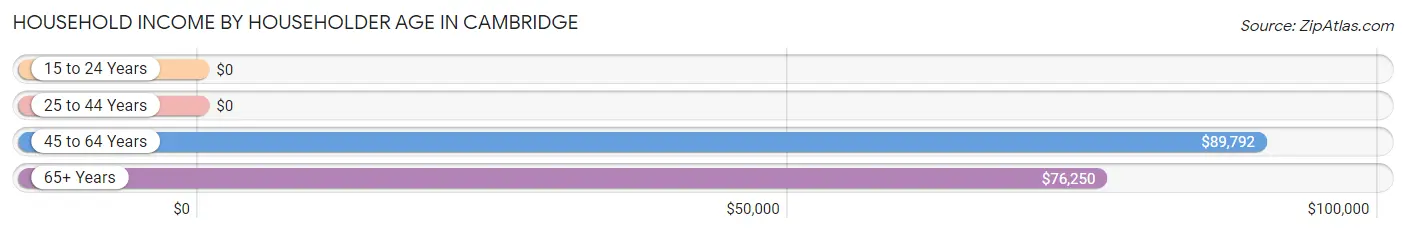
| Income Bracket | # Households | Median Income |
| 15 to 24 Years | 3 (3.4%) | $0 |
| 25 to 44 Years | 31 (34.8%) | $0 |
| 45 to 64 Years | 41 (46.1%) | $89,792 |
| 65+ Years | 14 (15.7%) | $76,250 |
| Total | 89 (100.0%) | $88,958 |
Poverty in Cambridge
Income Below Poverty by Sex and Age in Cambridge
With 4.3% poverty level for males and 2.4% for females among the residents of Cambridge, 55 to 64 year old males and 65 to 74 year old females are the most vulnerable to poverty, with 3 males (14.3%) and 1 females (14.3%) in their respective age groups living below the poverty level.
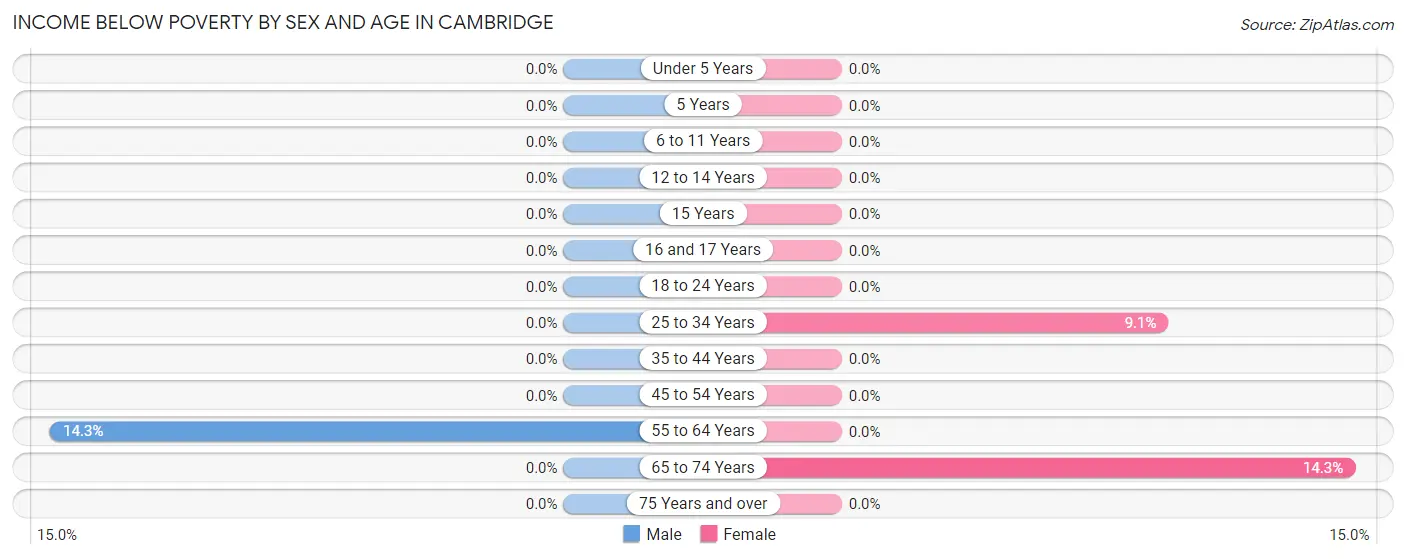
| Age Bracket | Male | Female |
| Under 5 Years | 0 (0.0%) | 0 (0.0%) |
| 5 Years | 0 (0.0%) | 0 (0.0%) |
| 6 to 11 Years | 0 (0.0%) | 0 (0.0%) |
| 12 to 14 Years | 0 (0.0%) | 0 (0.0%) |
| 15 Years | 0 (0.0%) | 0 (0.0%) |
| 16 and 17 Years | 0 (0.0%) | 0 (0.0%) |
| 18 to 24 Years | 0 (0.0%) | 0 (0.0%) |
| 25 to 34 Years | 0 (0.0%) | 1 (9.1%) |
| 35 to 44 Years | 0 (0.0%) | 0 (0.0%) |
| 45 to 54 Years | 0 (0.0%) | 0 (0.0%) |
| 55 to 64 Years | 3 (14.3%) | 0 (0.0%) |
| 65 to 74 Years | 0 (0.0%) | 1 (14.3%) |
| 75 Years and over | 0 (0.0%) | 0 (0.0%) |
| Total | 3 (4.3%) | 2 (2.4%) |
Income Above Poverty by Sex and Age in Cambridge
According to the poverty statistics in Cambridge, males aged 6 to 11 years and females aged 6 to 11 years are the age groups that are most secure financially, with 100.0% of males and 100.0% of females in these age groups living above the poverty line.
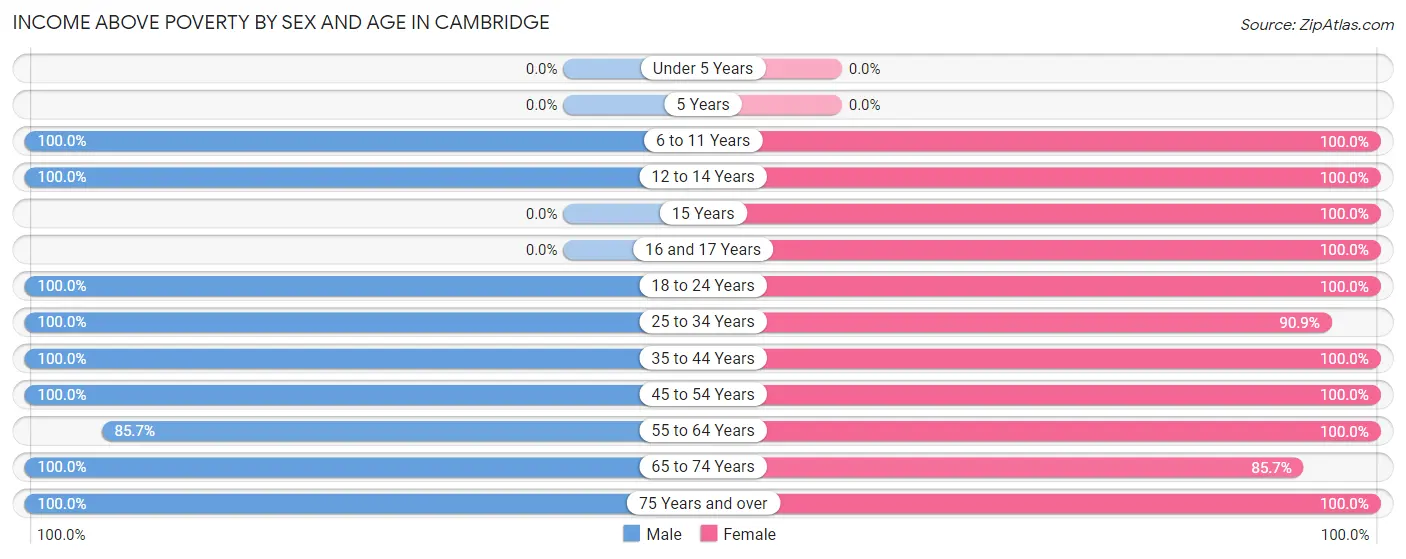
| Age Bracket | Male | Female |
| Under 5 Years | 0 (0.0%) | 0 (0.0%) |
| 5 Years | 0 (0.0%) | 0 (0.0%) |
| 6 to 11 Years | 2 (100.0%) | 3 (100.0%) |
| 12 to 14 Years | 5 (100.0%) | 2 (100.0%) |
| 15 Years | 0 (0.0%) | 1 (100.0%) |
| 16 and 17 Years | 0 (0.0%) | 2 (100.0%) |
| 18 to 24 Years | 6 (100.0%) | 11 (100.0%) |
| 25 to 34 Years | 11 (100.0%) | 10 (90.9%) |
| 35 to 44 Years | 8 (100.0%) | 14 (100.0%) |
| 45 to 54 Years | 8 (100.0%) | 12 (100.0%) |
| 55 to 64 Years | 18 (85.7%) | 15 (100.0%) |
| 65 to 74 Years | 7 (100.0%) | 6 (85.7%) |
| 75 Years and over | 1 (100.0%) | 6 (100.0%) |
| Total | 66 (95.7%) | 82 (97.6%) |
Income Below Poverty Among Married-Couple Families in Cambridge
| Children | Above Poverty | Below Poverty |
| No Children | 17 (100.0%) | 0 (0.0%) |
| 1 or 2 Children | 2 (100.0%) | 0 (0.0%) |
| 3 or 4 Children | 3 (100.0%) | 0 (0.0%) |
| 5 or more Children | 0 (0.0%) | 0 (0.0%) |
| Total | 22 (100.0%) | 0 (0.0%) |
Income Below Poverty Among Single-Parent Households in Cambridge
| Children | Single Father | Single Mother |
| No Children | 0 (0.0%) | 0 (0.0%) |
| 1 or 2 Children | 0 (0.0%) | 0 (0.0%) |
| 3 or 4 Children | 0 (0.0%) | 0 (0.0%) |
| 5 or more Children | 0 (0.0%) | 0 (0.0%) |
| Total | 0 (0.0%) | 0 (0.0%) |
Income Below Poverty Among Married-Couple vs Single-Parent Households in Cambridge
| Children | Married-Couple Families | Single-Parent Households |
| No Children | 0 (0.0%) | 0 (0.0%) |
| 1 or 2 Children | 0 (0.0%) | 0 (0.0%) |
| 3 or 4 Children | 0 (0.0%) | 0 (0.0%) |
| 5 or more Children | 0 (0.0%) | 0 (0.0%) |
| Total | 0 (0.0%) | 0 (0.0%) |
Race in Cambridge
The most populous races in Cambridge are White / Caucasian (142 | 92.8%), Two or more Races (9 | 5.9%), and Hispanic or Latino (4 | 2.6%).
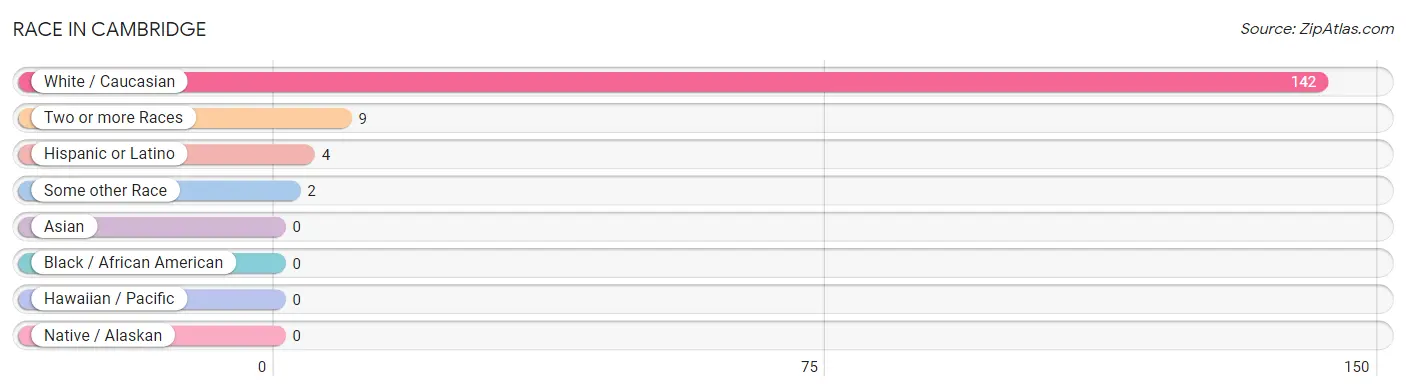
| Race | # Population | % Population |
| Asian | 0 | 0.0% |
| Black / African American | 0 | 0.0% |
| Hawaiian / Pacific | 0 | 0.0% |
| Hispanic or Latino | 4 | 2.6% |
| Native / Alaskan | 0 | 0.0% |
| White / Caucasian | 142 | 92.8% |
| Two or more Races | 9 | 5.9% |
| Some other Race | 2 | 1.3% |
| Total | 153 | 100.0% |
Ancestry in Cambridge
The most populous ancestries reported in Cambridge are German (54 | 35.3%), English (37 | 24.2%), American (14 | 9.1%), Dutch (14 | 9.1%), and Irish (12 | 7.8%), together accounting for 85.6% of all Cambridge residents.
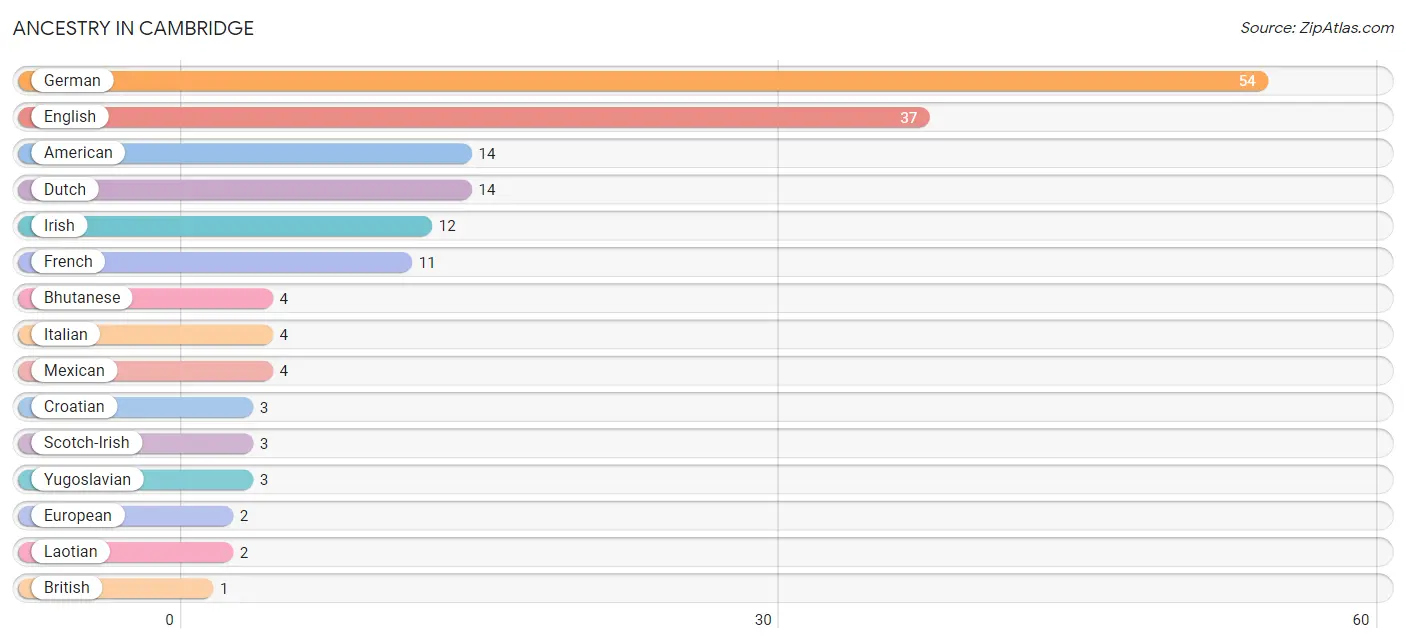
| Ancestry | # Population | % Population |
| American | 14 | 9.1% |
| Bhutanese | 4 | 2.6% |
| British | 1 | 0.6% |
| Croatian | 3 | 2.0% |
| Dutch | 14 | 9.1% |
| English | 37 | 24.2% |
| European | 2 | 1.3% |
| French | 11 | 7.2% |
| German | 54 | 35.3% |
| Irish | 12 | 7.8% |
| Italian | 4 | 2.6% |
| Laotian | 2 | 1.3% |
| Mexican | 4 | 2.6% |
| Scotch-Irish | 3 | 2.0% |
| Scottish | 1 | 0.6% |
| Swedish | 1 | 0.6% |
| Yugoslavian | 3 | 2.0% | View All 17 Rows |
Immigrants in Cambridge
The most numerous immigrant groups reported in Cambridge came from Europe (3 | 2.0%), Western Europe (3 | 2.0%), Caribbean (2 | 1.3%), Cuba (2 | 1.3%), and Germany (2 | 1.3%), together accounting for 7.9% of all Cambridge residents.
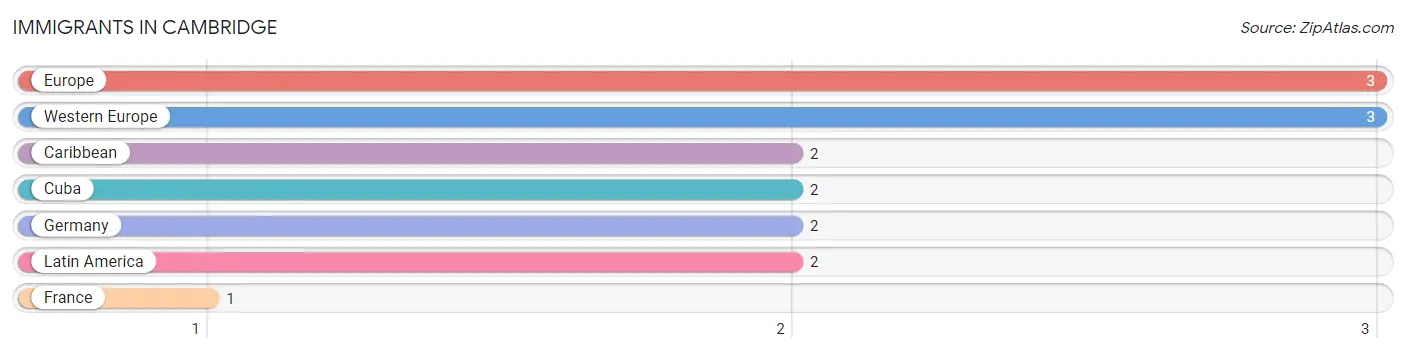
| Immigration Origin | # Population | % Population |
| Caribbean | 2 | 1.3% |
| Cuba | 2 | 1.3% |
| Europe | 3 | 2.0% |
| France | 1 | 0.6% |
| Germany | 2 | 1.3% |
| Latin America | 2 | 1.3% |
| Western Europe | 3 | 2.0% | View All 7 Rows |
Sex and Age in Cambridge
Sex and Age in Cambridge
The most populous age groups in Cambridge are 55 to 59 Years (20 | 29.0%) for men and 60 to 64 Years (13 | 15.5%) for women.
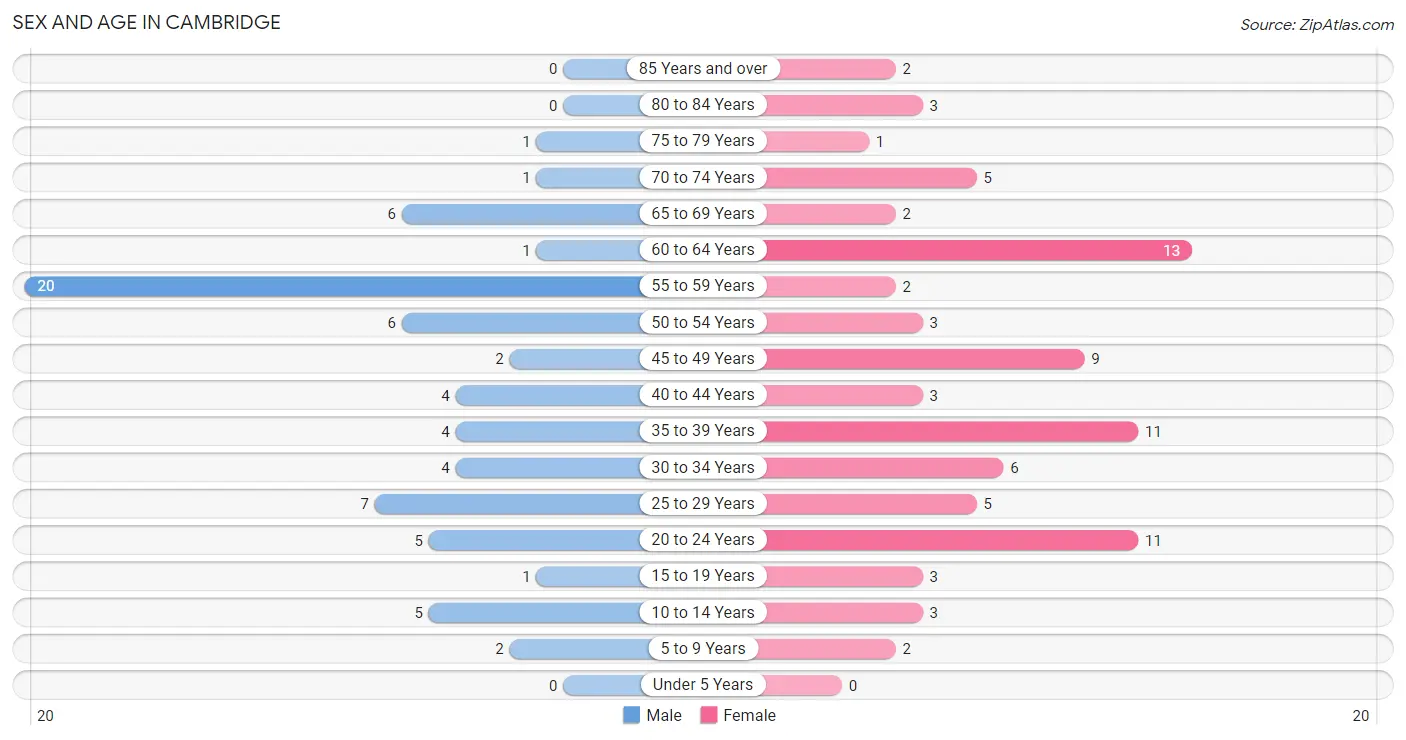
| Age Bracket | Male | Female |
| Under 5 Years | 0 (0.0%) | 0 (0.0%) |
| 5 to 9 Years | 2 (2.9%) | 2 (2.4%) |
| 10 to 14 Years | 5 (7.2%) | 3 (3.6%) |
| 15 to 19 Years | 1 (1.5%) | 3 (3.6%) |
| 20 to 24 Years | 5 (7.2%) | 11 (13.1%) |
| 25 to 29 Years | 7 (10.1%) | 5 (5.9%) |
| 30 to 34 Years | 4 (5.8%) | 6 (7.1%) |
| 35 to 39 Years | 4 (5.8%) | 11 (13.1%) |
| 40 to 44 Years | 4 (5.8%) | 3 (3.6%) |
| 45 to 49 Years | 2 (2.9%) | 9 (10.7%) |
| 50 to 54 Years | 6 (8.7%) | 3 (3.6%) |
| 55 to 59 Years | 20 (29.0%) | 2 (2.4%) |
| 60 to 64 Years | 1 (1.5%) | 13 (15.5%) |
| 65 to 69 Years | 6 (8.7%) | 2 (2.4%) |
| 70 to 74 Years | 1 (1.5%) | 5 (5.9%) |
| 75 to 79 Years | 1 (1.5%) | 1 (1.2%) |
| 80 to 84 Years | 0 (0.0%) | 3 (3.6%) |
| 85 Years and over | 0 (0.0%) | 2 (2.4%) |
| Total | 69 (100.0%) | 84 (100.0%) |
Families and Households in Cambridge
Median Family Size in Cambridge
The median family size in Cambridge is 2.67 persons per family, with single female/mother families (3 | 9.1%) accounting for the largest median family size of 5 persons per family. On the other hand, single male/father families (8 | 24.2%) represent the smallest median family size with 2.00 persons per family.
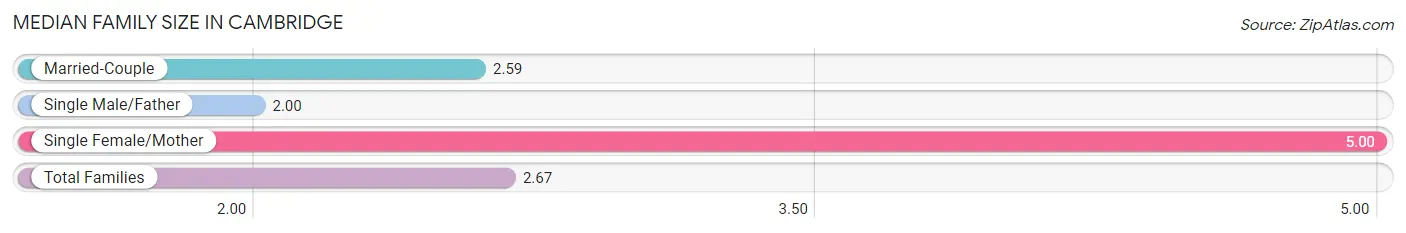
| Family Type | # Families | Family Size |
| Married-Couple | 22 (66.7%) | 2.59 |
| Single Male/Father | 8 (24.2%) | 2.00 |
| Single Female/Mother | 3 (9.1%) | 5.00 |
| Total Families | 33 (100.0%) | 2.67 |
Median Household Size in Cambridge
The median household size in Cambridge is 1.72 persons per household, with single female/mother households (3 | 3.4%) accounting for the largest median household size of 5 persons per household. non-family households (56 | 62.9%) represent the smallest median household size with 1.13 persons per household.
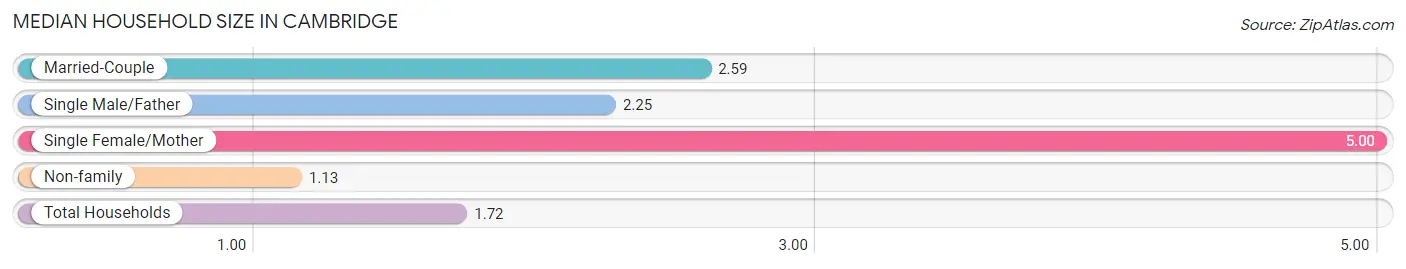
| Household Type | # Households | Household Size |
| Married-Couple | 22 (24.7%) | 2.59 |
| Single Male/Father | 8 (9.0%) | 2.25 |
| Single Female/Mother | 3 (3.4%) | 5.00 |
| Non-family | 56 (62.9%) | 1.13 |
| Total Households | 89 (100.0%) | 1.72 |
Household Size by Marriage Status in Cambridge
Out of a total of 89 households in Cambridge, 33 (37.1%) are family households, while 56 (62.9%) are nonfamily households. The most numerous type of family households are 2-person households, comprising 21, and the most common type of nonfamily households are 1-person households, comprising 51.
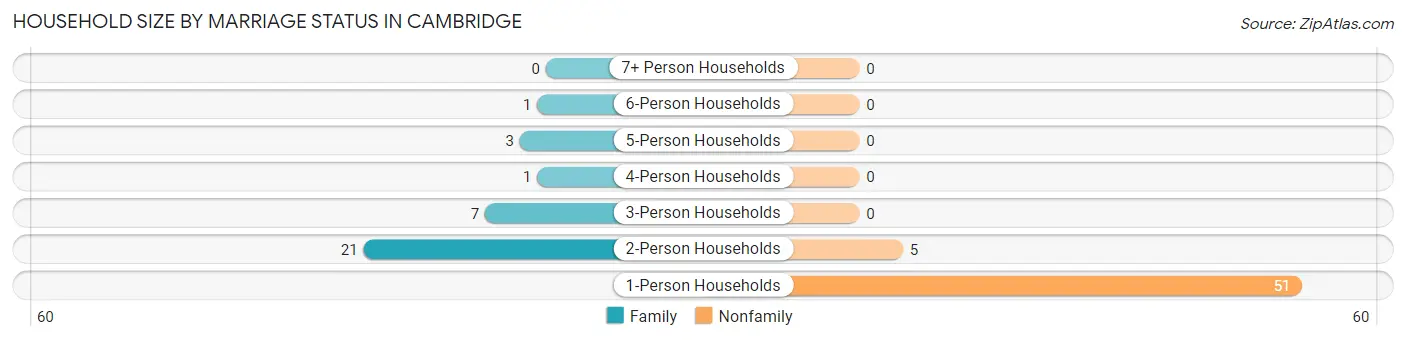
| Household Size | Family Households | Nonfamily Households |
| 1-Person Households | - | 51 (57.3%) |
| 2-Person Households | 21 (23.6%) | 5 (5.6%) |
| 3-Person Households | 7 (7.9%) | 0 (0.0%) |
| 4-Person Households | 1 (1.1%) | 0 (0.0%) |
| 5-Person Households | 3 (3.4%) | 0 (0.0%) |
| 6-Person Households | 1 (1.1%) | 0 (0.0%) |
| 7+ Person Households | 0 (0.0%) | 0 (0.0%) |
| Total | 33 (37.1%) | 56 (62.9%) |
Female Fertility in Cambridge
Fertility by Age in Cambridge
| Age Bracket | Women with Births | Births / 1,000 Women |
| 15 to 19 years | 0 (0.0%) | 0.0 |
| 20 to 34 years | 0 (0.0%) | 0.0 |
| 35 to 50 years | 0 (0.0%) | 0.0 |
| Total | 0 (0.0%) | 0.0 |
Fertility by Age by Marriage Status in Cambridge
| Age Bracket | Married | Unmarried |
| 15 to 19 years | 0 (0.0%) | 0 (0.0%) |
| 20 to 34 years | 0 (0.0%) | 0 (0.0%) |
| 35 to 50 years | 0 (0.0%) | 0 (0.0%) |
| Total | 0 (0.0%) | 0 (0.0%) |
Fertility by Education in Cambridge
| Educational Attainment | Women with Births | Births / 1,000 Women |
| Less than High School | 0 (0.0%) | 0.0 |
| High School Diploma | 0 (0.0%) | 0.0 |
| College or Associate's Degree | 0 (0.0%) | 0.0 |
| Bachelor's Degree | 0 (0.0%) | 0.0 |
| Graduate Degree | 0 (0.0%) | 0.0 |
| Total | 0 (0.0%) | 0.0 |
Fertility by Education by Marriage Status in Cambridge
| Educational Attainment | Married | Unmarried |
| Less than High School | 0 (0.0%) | 0 (0.0%) |
| High School Diploma | 0 (0.0%) | 0 (0.0%) |
| College or Associate's Degree | 0 (0.0%) | 0 (0.0%) |
| Bachelor's Degree | 0 (0.0%) | 0 (0.0%) |
| Graduate Degree | 0 (0.0%) | 0 (0.0%) |
| Total | 0 (0.0%) | 0 (0.0%) |
Employment Characteristics in Cambridge
Employment by Class of Employer in Cambridge
Among the 108 employed individuals in Cambridge, private company employees (56 | 51.8%), not-for-profit organizations (30 | 27.8%), and self-employed (not incorporated) (9 | 8.3%) make up the most common classes of employment.
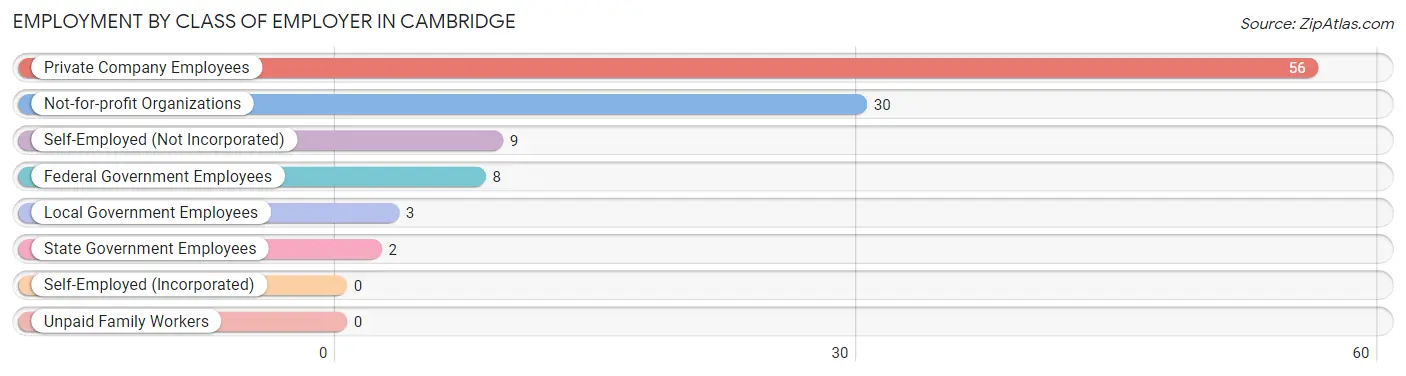
| Employer Class | # Employees | % Employees |
| Private Company Employees | 56 | 51.8% |
| Self-Employed (Incorporated) | 0 | 0.0% |
| Self-Employed (Not Incorporated) | 9 | 8.3% |
| Not-for-profit Organizations | 30 | 27.8% |
| Local Government Employees | 3 | 2.8% |
| State Government Employees | 2 | 1.8% |
| Federal Government Employees | 8 | 7.4% |
| Unpaid Family Workers | 0 | 0.0% |
| Total | 108 | 100.0% |
Employment Status by Age in Cambridge
According to the labor force statistics for Cambridge, out of the total population over 16 years of age (140), 84.3% or 118 individuals are in the labor force, with 5.9% or 7 of them unemployed. The age group with the highest labor force participation rate is 16 to 19 years, with 100.0% or 3 individuals in the labor force. Within the labor force, the 30 to 34 years age range has the highest percentage of unemployed individuals, with 20.0% or 2 of them being unemployed.
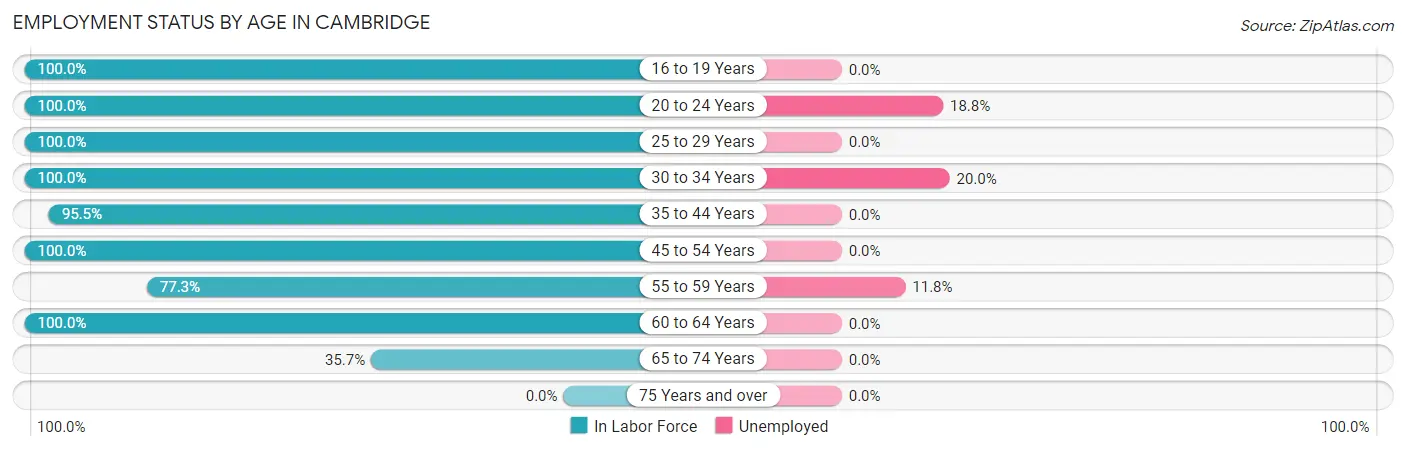
| Age Bracket | In Labor Force | Unemployed |
| 16 to 19 Years | 3 (100.0%) | 0 (0.0%) |
| 20 to 24 Years | 16 (100.0%) | 3 (18.8%) |
| 25 to 29 Years | 12 (100.0%) | 0 (0.0%) |
| 30 to 34 Years | 10 (100.0%) | 2 (20.0%) |
| 35 to 44 Years | 21 (95.5%) | 0 (0.0%) |
| 45 to 54 Years | 20 (100.0%) | 0 (0.0%) |
| 55 to 59 Years | 17 (77.3%) | 2 (11.8%) |
| 60 to 64 Years | 14 (100.0%) | 0 (0.0%) |
| 65 to 74 Years | 5 (35.7%) | 0 (0.0%) |
| 75 Years and over | 0 (0.0%) | 0 (0.0%) |
| Total | 118 (84.3%) | 7 (5.9%) |
Employment Status by Educational Attainment in Cambridge
According to labor force statistics for Cambridge, 94.0% of individuals (94) out of the total population between 25 and 64 years of age (100) are in the labor force, with 4.3% or 4 of them being unemployed. The group with the highest labor force participation rate are those with the educational attainment of less than high school, with 100.0% or 2 individuals in the labor force. Within the labor force, individuals with bachelor's degree or higher education have the highest percentage of unemployment, with 5.1% or 2 of them being unemployed.
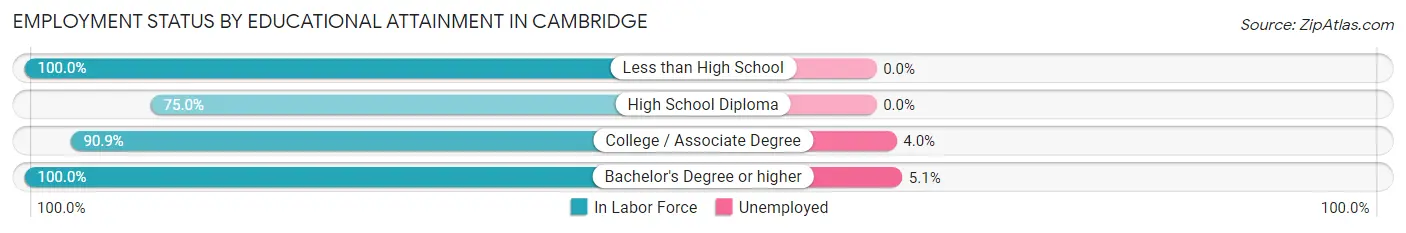
| Educational Attainment | In Labor Force | Unemployed |
| Less than High School | 2 (100.0%) | 0 (0.0%) |
| High School Diploma | 3 (75.0%) | 0 (0.0%) |
| College / Associate Degree | 50 (90.9%) | 2 (4.0%) |
| Bachelor's Degree or higher | 39 (100.0%) | 2 (5.1%) |
| Total | 94 (94.0%) | 4 (4.3%) |
Employment Occupations by Sex in Cambridge
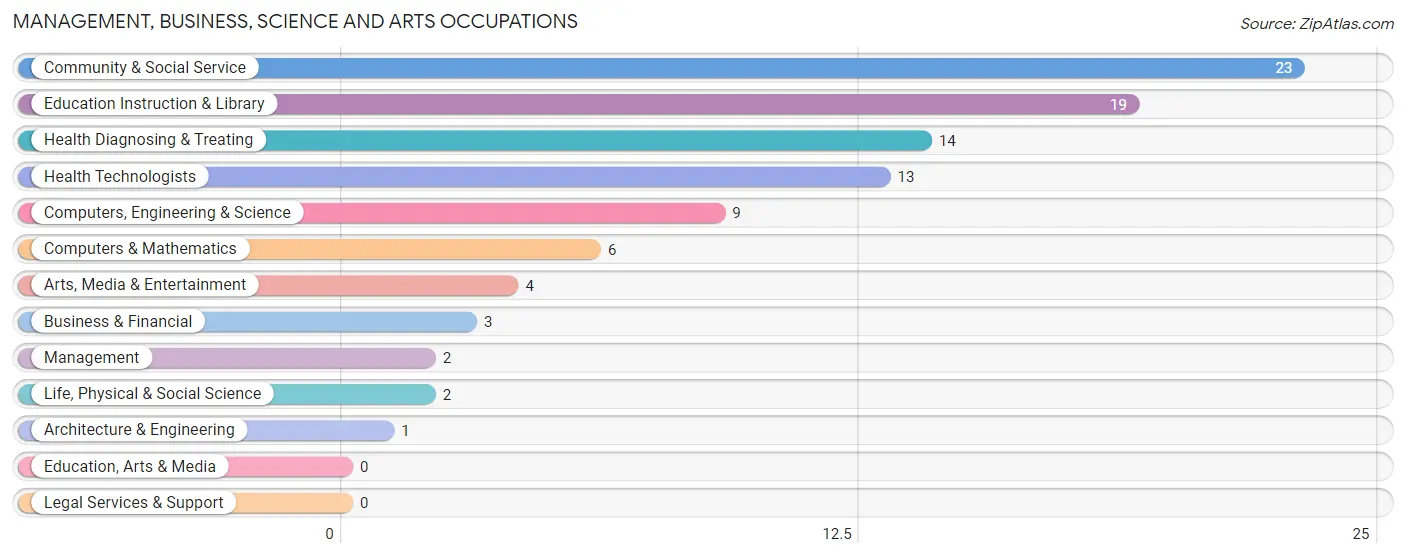
Management, Business, Science and Arts Occupations
The most common Management, Business, Science and Arts occupations in Cambridge are Community & Social Service (23 | 20.7%), Education Instruction & Library (19 | 17.1%), Health Diagnosing & Treating (14 | 12.6%), Health Technologists (13 | 11.7%), and Computers, Engineering & Science (9 | 8.1%).
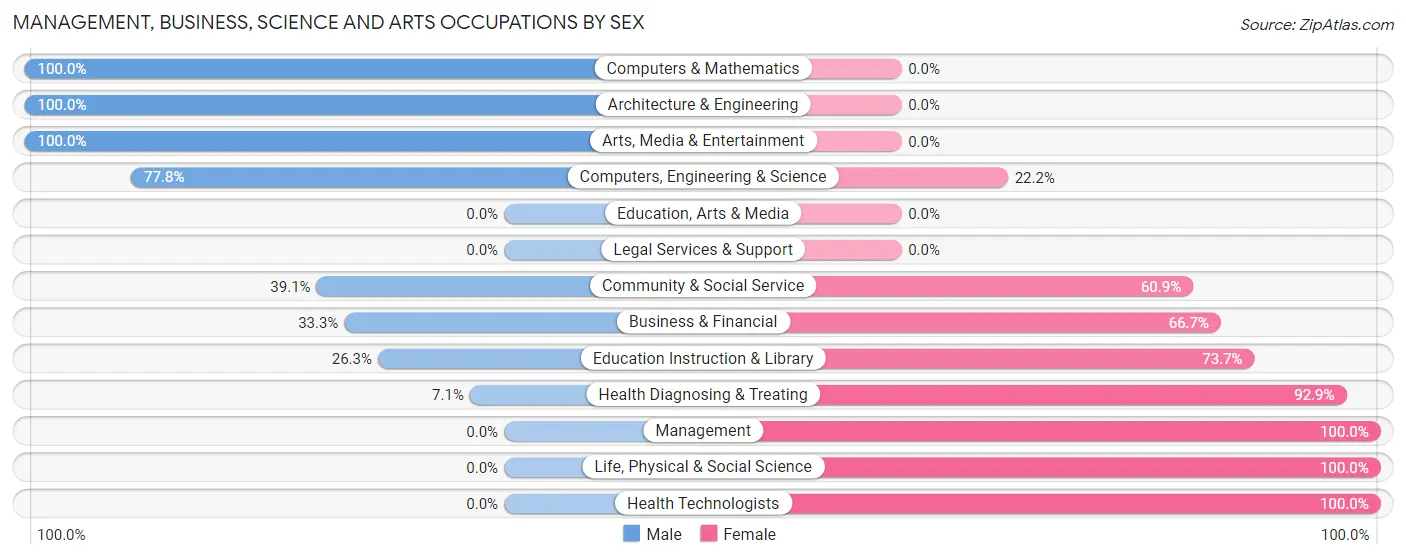
Management, Business, Science and Arts Occupations by Sex
Within the Management, Business, Science and Arts occupations in Cambridge, the most male-oriented occupations are Computers & Mathematics (100.0%), Architecture & Engineering (100.0%), and Arts, Media & Entertainment (100.0%), while the most female-oriented occupations are Management (100.0%), Life, Physical & Social Science (100.0%), and Health Technologists (100.0%).
| Occupation | Male | Female |
| Management | 0 (0.0%) | 2 (100.0%) |
| Business & Financial | 1 (33.3%) | 2 (66.7%) |
| Computers, Engineering & Science | 7 (77.8%) | 2 (22.2%) |
| Computers & Mathematics | 6 (100.0%) | 0 (0.0%) |
| Architecture & Engineering | 1 (100.0%) | 0 (0.0%) |
| Life, Physical & Social Science | 0 (0.0%) | 2 (100.0%) |
| Community & Social Service | 9 (39.1%) | 14 (60.9%) |
| Education, Arts & Media | 0 (0.0%) | 0 (0.0%) |
| Legal Services & Support | 0 (0.0%) | 0 (0.0%) |
| Education Instruction & Library | 5 (26.3%) | 14 (73.7%) |
| Arts, Media & Entertainment | 4 (100.0%) | 0 (0.0%) |
| Health Diagnosing & Treating | 1 (7.1%) | 13 (92.9%) |
| Health Technologists | 0 (0.0%) | 13 (100.0%) |
| Total (Category) | 18 (35.3%) | 33 (64.7%) |
| Total (Overall) | 48 (43.2%) | 63 (56.8%) |
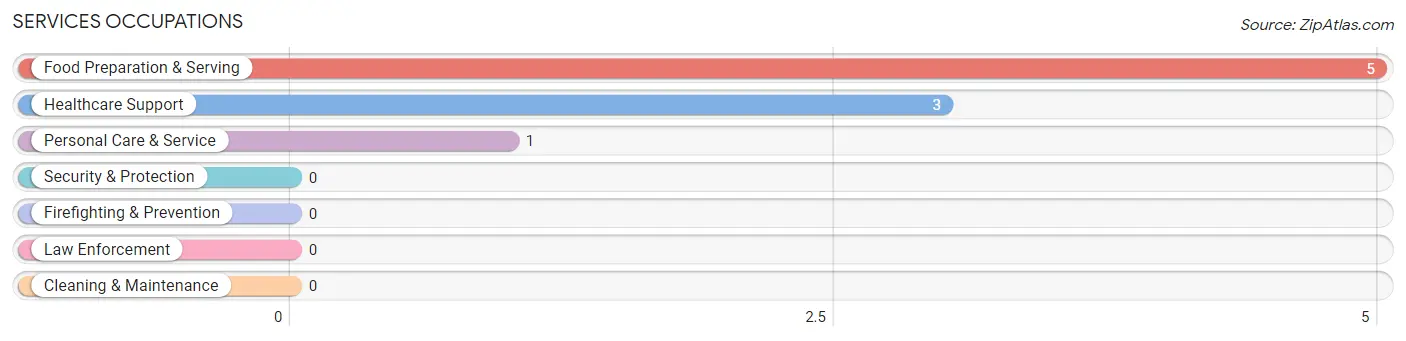
Services Occupations
The most common Services occupations in Cambridge are Food Preparation & Serving (5 | 4.5%), Healthcare Support (3 | 2.7%), and Personal Care & Service (1 | 0.9%).
Services Occupations by Sex
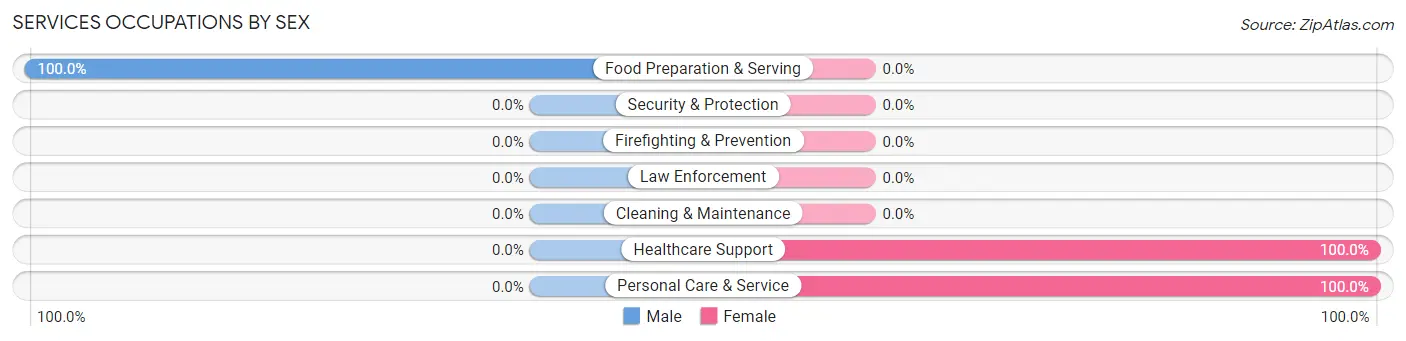
| Occupation | Male | Female |
| Healthcare Support | 0 (0.0%) | 3 (100.0%) |
| Security & Protection | 0 (0.0%) | 0 (0.0%) |
| Firefighting & Prevention | 0 (0.0%) | 0 (0.0%) |
| Law Enforcement | 0 (0.0%) | 0 (0.0%) |
| Food Preparation & Serving | 5 (100.0%) | 0 (0.0%) |
| Cleaning & Maintenance | 0 (0.0%) | 0 (0.0%) |
| Personal Care & Service | 0 (0.0%) | 1 (100.0%) |
| Total (Category) | 5 (55.6%) | 4 (44.4%) |
| Total (Overall) | 48 (43.2%) | 63 (56.8%) |
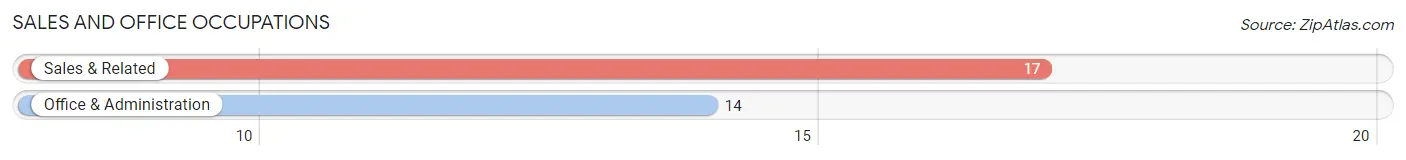
Sales and Office Occupations
The most common Sales and Office occupations in Cambridge are Sales & Related (17 | 15.3%), and Office & Administration (14 | 12.6%).
Sales and Office Occupations by Sex
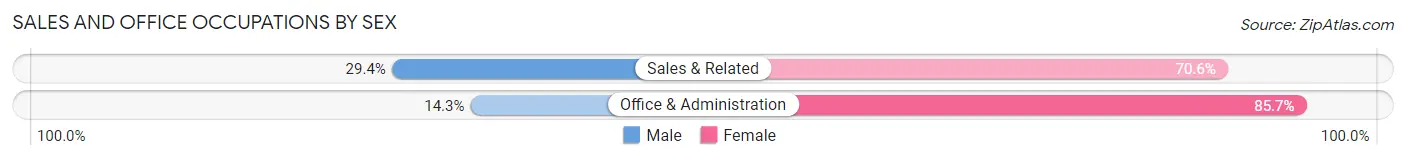
| Occupation | Male | Female |
| Sales & Related | 5 (29.4%) | 12 (70.6%) |
| Office & Administration | 2 (14.3%) | 12 (85.7%) |
| Total (Category) | 7 (22.6%) | 24 (77.4%) |
| Total (Overall) | 48 (43.2%) | 63 (56.8%) |
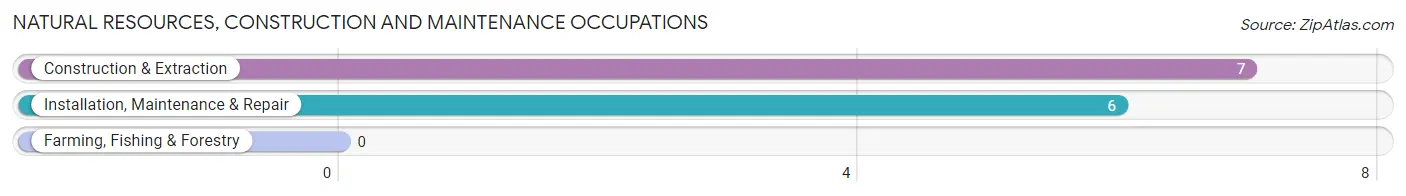
Natural Resources, Construction and Maintenance Occupations
The most common Natural Resources, Construction and Maintenance occupations in Cambridge are Construction & Extraction (7 | 6.3%), and Installation, Maintenance & Repair (6 | 5.4%).
Natural Resources, Construction and Maintenance Occupations by Sex
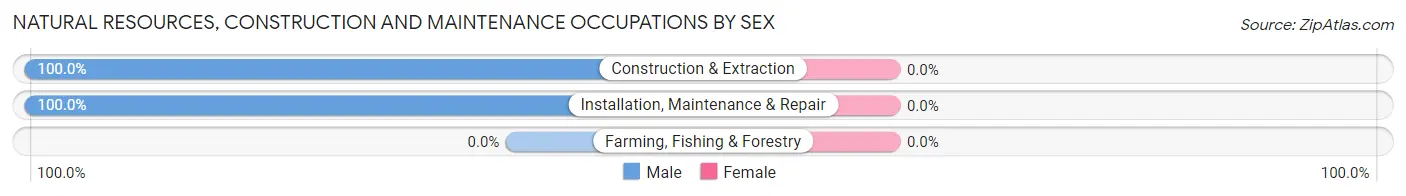
| Occupation | Male | Female |
| Farming, Fishing & Forestry | 0 (0.0%) | 0 (0.0%) |
| Construction & Extraction | 7 (100.0%) | 0 (0.0%) |
| Installation, Maintenance & Repair | 6 (100.0%) | 0 (0.0%) |
| Total (Category) | 13 (100.0%) | 0 (0.0%) |
| Total (Overall) | 48 (43.2%) | 63 (56.8%) |
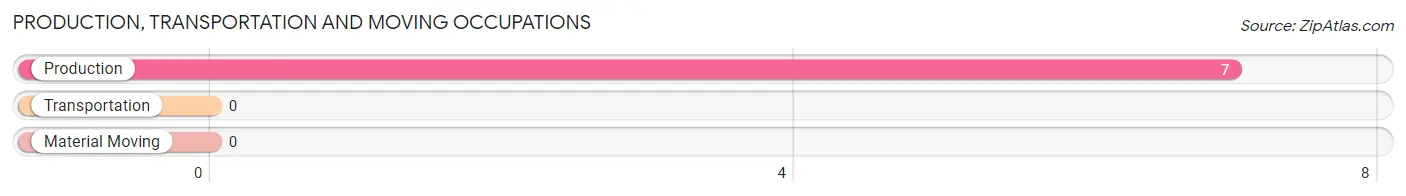
Production, Transportation and Moving Occupations
The most common Production, Transportation and Moving occupations in Cambridge are , and Production (7 | 6.3%).
Production, Transportation and Moving Occupations by Sex
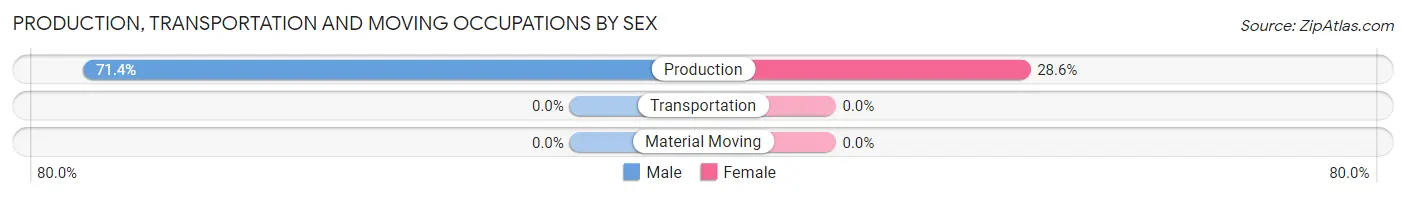
| Occupation | Male | Female |
| Production | 5 (71.4%) | 2 (28.6%) |
| Transportation | 0 (0.0%) | 0 (0.0%) |
| Material Moving | 0 (0.0%) | 0 (0.0%) |
| Total (Category) | 5 (71.4%) | 2 (28.6%) |
| Total (Overall) | 48 (43.2%) | 63 (56.8%) |
Employment Industries by Sex in Cambridge
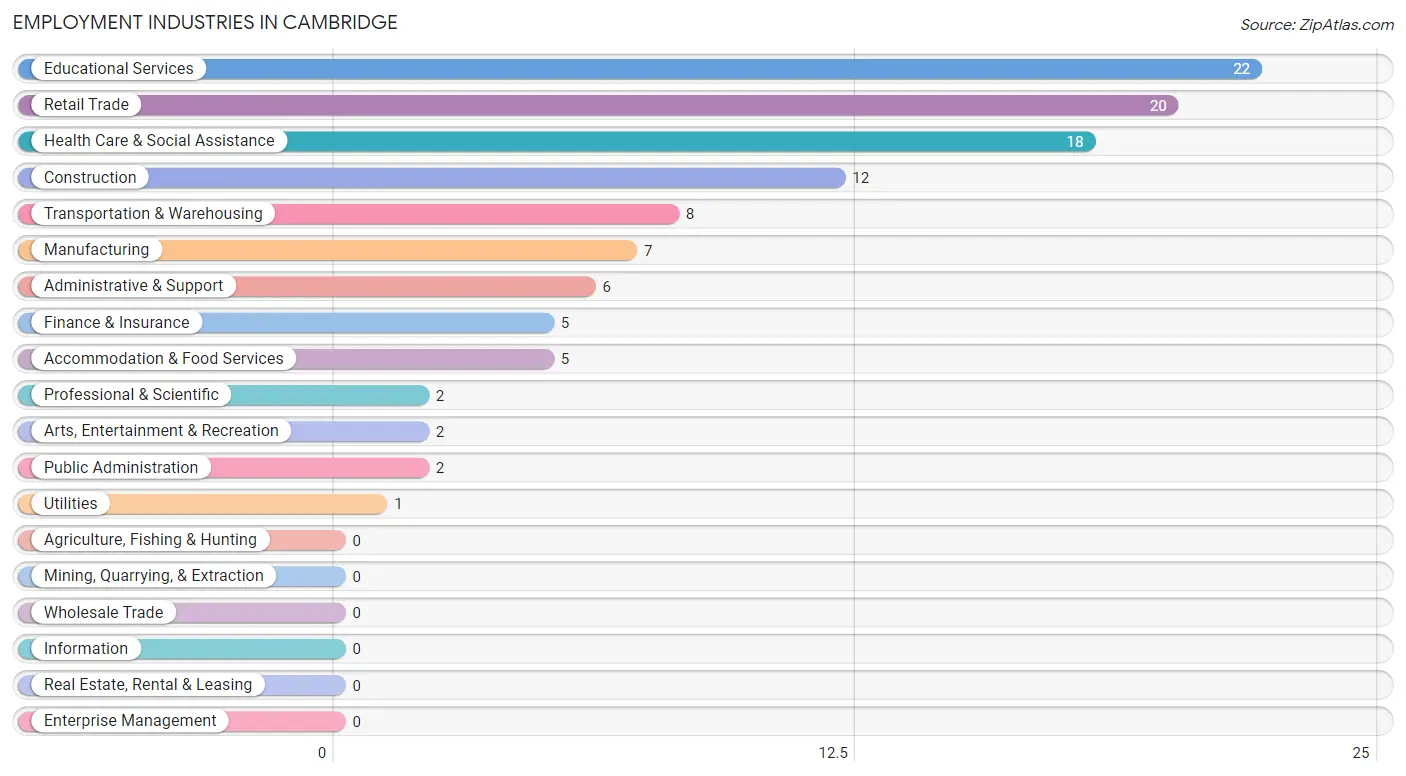
Employment Industries in Cambridge
The major employment industries in Cambridge include Educational Services (22 | 19.8%), Retail Trade (20 | 18.0%), Health Care & Social Assistance (18 | 16.2%), Construction (12 | 10.8%), and Transportation & Warehousing (8 | 7.2%).
Employment Industries by Sex in Cambridge
The Cambridge industries that see more men than women are Construction (100.0%), Utilities (100.0%), and Professional & Scientific (100.0%), whereas the industries that tend to have a higher number of women are Public Administration (100.0%), Health Care & Social Assistance (94.4%), and Finance & Insurance (80.0%).
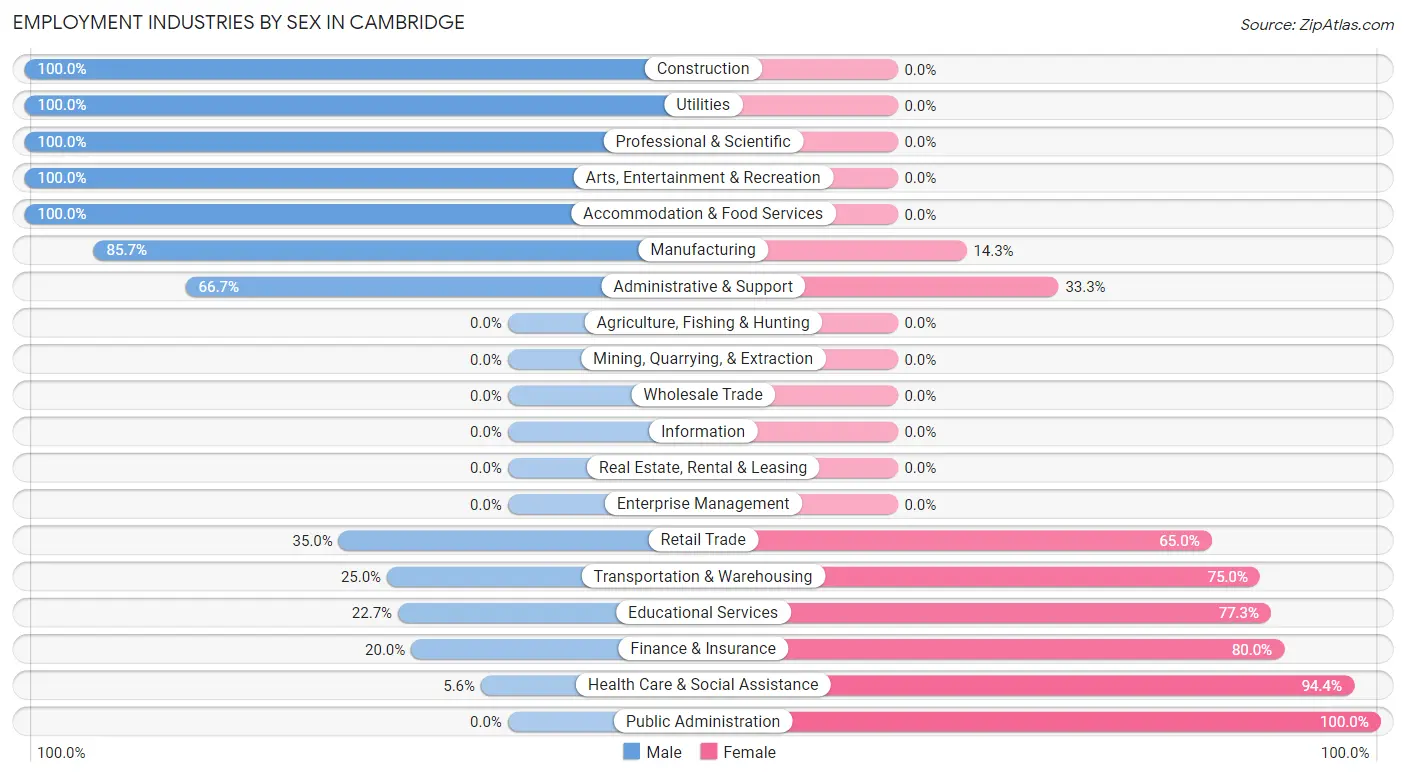
| Industry | Male | Female |
| Agriculture, Fishing & Hunting | 0 (0.0%) | 0 (0.0%) |
| Mining, Quarrying, & Extraction | 0 (0.0%) | 0 (0.0%) |
| Construction | 12 (100.0%) | 0 (0.0%) |
| Manufacturing | 6 (85.7%) | 1 (14.3%) |
| Wholesale Trade | 0 (0.0%) | 0 (0.0%) |
| Retail Trade | 7 (35.0%) | 13 (65.0%) |
| Transportation & Warehousing | 2 (25.0%) | 6 (75.0%) |
| Utilities | 1 (100.0%) | 0 (0.0%) |
| Information | 0 (0.0%) | 0 (0.0%) |
| Finance & Insurance | 1 (20.0%) | 4 (80.0%) |
| Real Estate, Rental & Leasing | 0 (0.0%) | 0 (0.0%) |
| Professional & Scientific | 2 (100.0%) | 0 (0.0%) |
| Enterprise Management | 0 (0.0%) | 0 (0.0%) |
| Administrative & Support | 4 (66.7%) | 2 (33.3%) |
| Educational Services | 5 (22.7%) | 17 (77.3%) |
| Health Care & Social Assistance | 1 (5.6%) | 17 (94.4%) |
| Arts, Entertainment & Recreation | 2 (100.0%) | 0 (0.0%) |
| Accommodation & Food Services | 5 (100.0%) | 0 (0.0%) |
| Public Administration | 0 (0.0%) | 2 (100.0%) |
| Total | 48 (43.2%) | 63 (56.8%) |
Education in Cambridge
School Enrollment in Cambridge
The most common levels of schooling among the 27 students in Cambridge are middle school (8 | 29.6%), graduate / professional (7 | 25.9%), and college / undergraduate (5 | 18.5%).
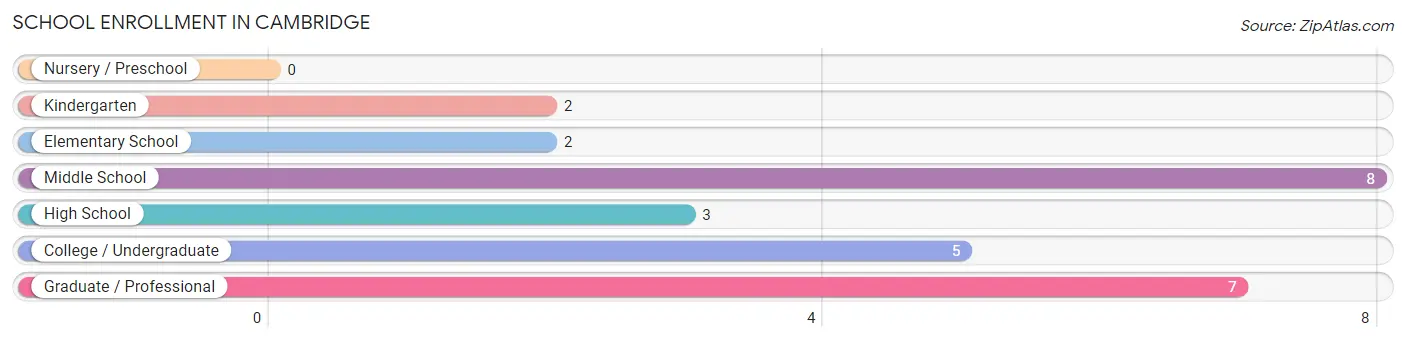
| School Level | # Students | % Students |
| Nursery / Preschool | 0 | 0.0% |
| Kindergarten | 2 | 7.4% |
| Elementary School | 2 | 7.4% |
| Middle School | 8 | 29.6% |
| High School | 3 | 11.1% |
| College / Undergraduate | 5 | 18.5% |
| Graduate / Professional | 7 | 25.9% |
| Total | 27 | 100.0% |
School Enrollment by Age by Funding Source in Cambridge
Out of a total of 27 students who are enrolled in schools in Cambridge, 11 (40.7%) attend a private institution, while the remaining 16 (59.3%) are enrolled in public schools. The age group of 18 to 19 year olds has the highest likelihood of being enrolled in private schools, with 1 (100.0% in the age bracket) enrolled. Conversely, the age group of 35 years and over has the lowest likelihood of being enrolled in a private school, with 2 (100.0% in the age bracket) attending a public institution.
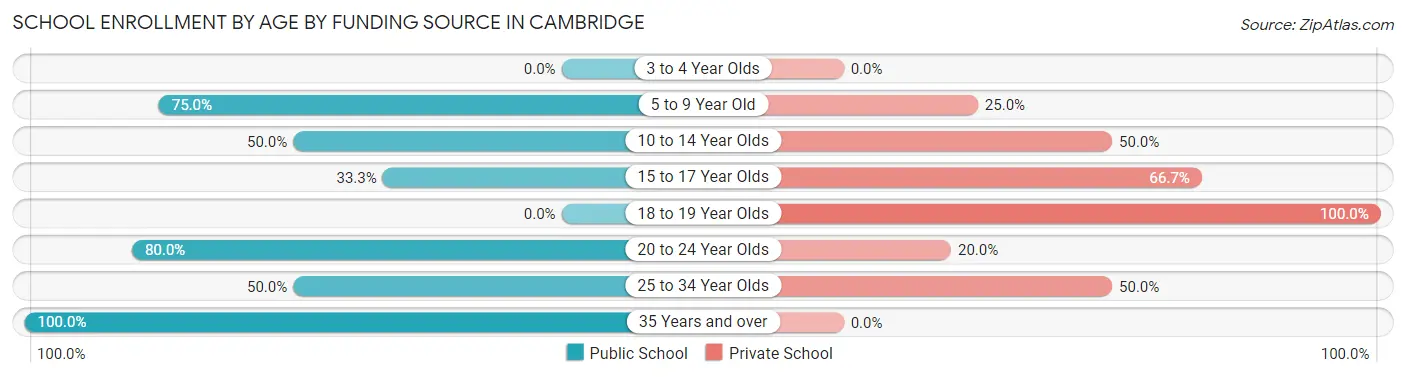
| Age Bracket | Public School | Private School |
| 3 to 4 Year Olds | 0 (0.0%) | 0 (0.0%) |
| 5 to 9 Year Old | 3 (75.0%) | 1 (25.0%) |
| 10 to 14 Year Olds | 4 (50.0%) | 4 (50.0%) |
| 15 to 17 Year Olds | 1 (33.3%) | 2 (66.7%) |
| 18 to 19 Year Olds | 0 (0.0%) | 1 (100.0%) |
| 20 to 24 Year Olds | 4 (80.0%) | 1 (20.0%) |
| 25 to 34 Year Olds | 2 (50.0%) | 2 (50.0%) |
| 35 Years and over | 2 (100.0%) | 0 (0.0%) |
| Total | 16 (59.3%) | 11 (40.7%) |
Educational Attainment by Field of Study in Cambridge
Education (12 | 20.3%), science & technology (9 | 15.2%), business (8 | 13.6%), bio, nature & agricultural (7 | 11.9%), and literature & languages (5 | 8.5%) are the most common fields of study among 59 individuals in Cambridge who have obtained a bachelor's degree or higher.
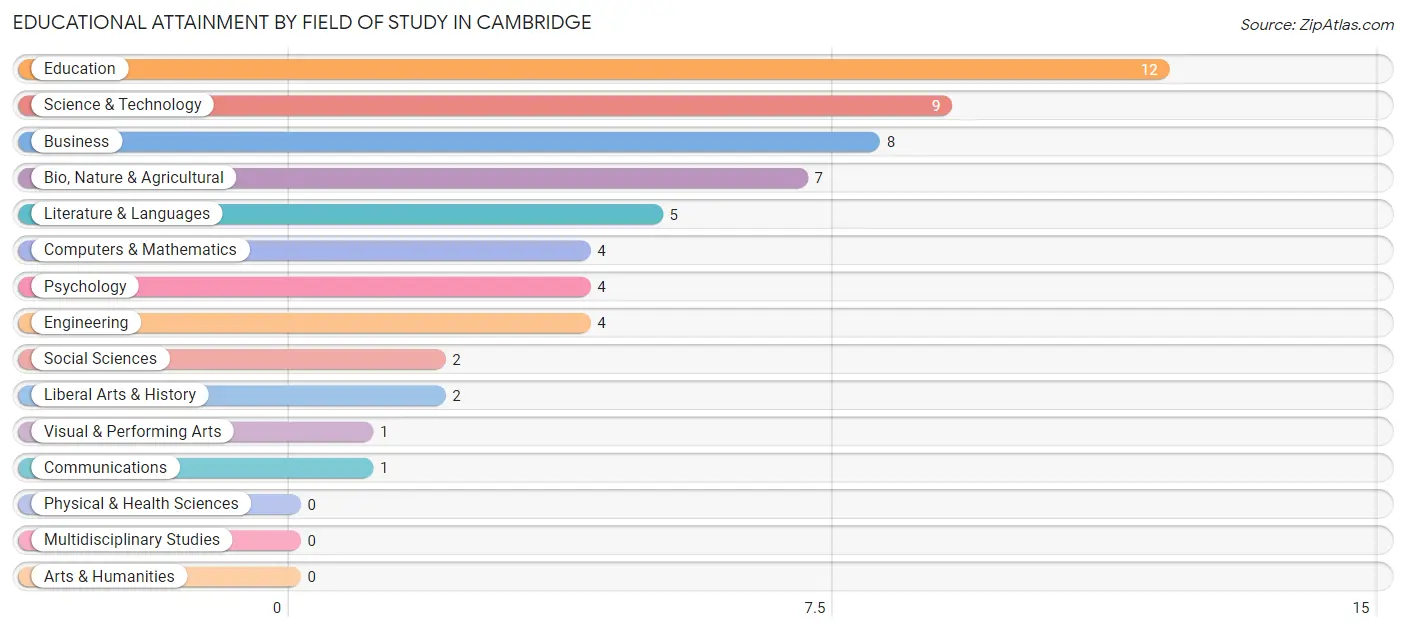
| Field of Study | # Graduates | % Graduates |
| Computers & Mathematics | 4 | 6.8% |
| Bio, Nature & Agricultural | 7 | 11.9% |
| Physical & Health Sciences | 0 | 0.0% |
| Psychology | 4 | 6.8% |
| Social Sciences | 2 | 3.4% |
| Engineering | 4 | 6.8% |
| Multidisciplinary Studies | 0 | 0.0% |
| Science & Technology | 9 | 15.2% |
| Business | 8 | 13.6% |
| Education | 12 | 20.3% |
| Literature & Languages | 5 | 8.5% |
| Liberal Arts & History | 2 | 3.4% |
| Visual & Performing Arts | 1 | 1.7% |
| Communications | 1 | 1.7% |
| Arts & Humanities | 0 | 0.0% |
| Total | 59 | 100.0% |
Transportation & Commute in Cambridge
Vehicle Availability by Sex in Cambridge
The most prevalent vehicle ownership categories in Cambridge are males with 3 vehicles (20, accounting for 41.7%) and females with 3 vehicles (19, making up 33.3%).
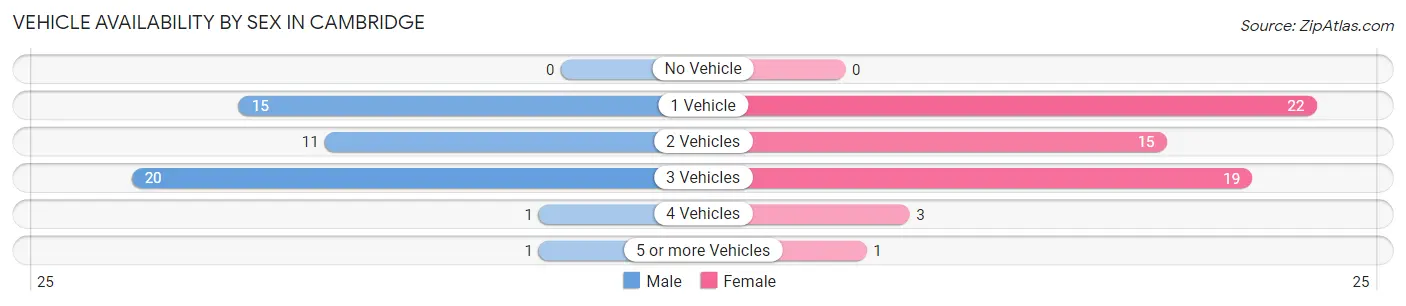
| Vehicles Available | Male | Female |
| No Vehicle | 0 (0.0%) | 0 (0.0%) |
| 1 Vehicle | 15 (31.2%) | 22 (36.7%) |
| 2 Vehicles | 11 (22.9%) | 15 (25.0%) |
| 3 Vehicles | 20 (41.7%) | 19 (31.7%) |
| 4 Vehicles | 1 (2.1%) | 3 (5.0%) |
| 5 or more Vehicles | 1 (2.1%) | 1 (1.7%) |
| Total | 48 (100.0%) | 60 (100.0%) |
Commute Time in Cambridge
The most frequently occuring commute durations in Cambridge are 20 to 24 minutes (19 commuters, 20.9%), 5 to 9 minutes (18 commuters, 19.8%), and 15 to 19 minutes (14 commuters, 15.4%).
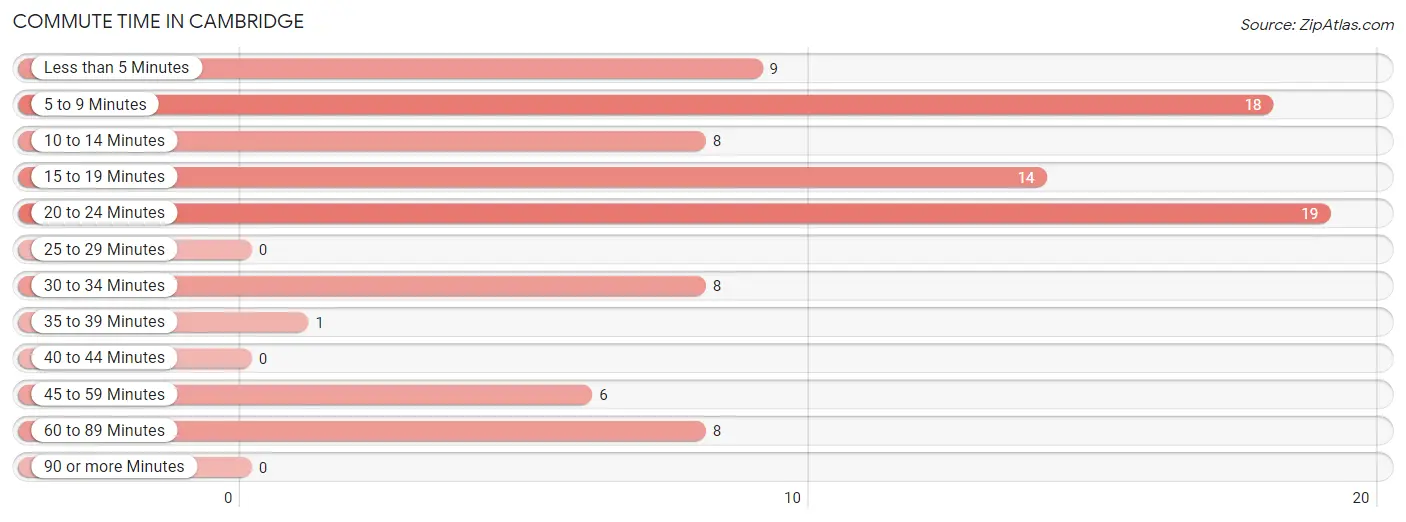
| Commute Time | # Commuters | % Commuters |
| Less than 5 Minutes | 9 | 9.9% |
| 5 to 9 Minutes | 18 | 19.8% |
| 10 to 14 Minutes | 8 | 8.8% |
| 15 to 19 Minutes | 14 | 15.4% |
| 20 to 24 Minutes | 19 | 20.9% |
| 25 to 29 Minutes | 0 | 0.0% |
| 30 to 34 Minutes | 8 | 8.8% |
| 35 to 39 Minutes | 1 | 1.1% |
| 40 to 44 Minutes | 0 | 0.0% |
| 45 to 59 Minutes | 6 | 6.6% |
| 60 to 89 Minutes | 8 | 8.8% |
| 90 or more Minutes | 0 | 0.0% |
Commute Time by Sex in Cambridge
The most common commute times in Cambridge are 20 to 24 minutes (13 commuters, 34.2%) for males and 5 to 9 minutes (18 commuters, 34.0%) for females.
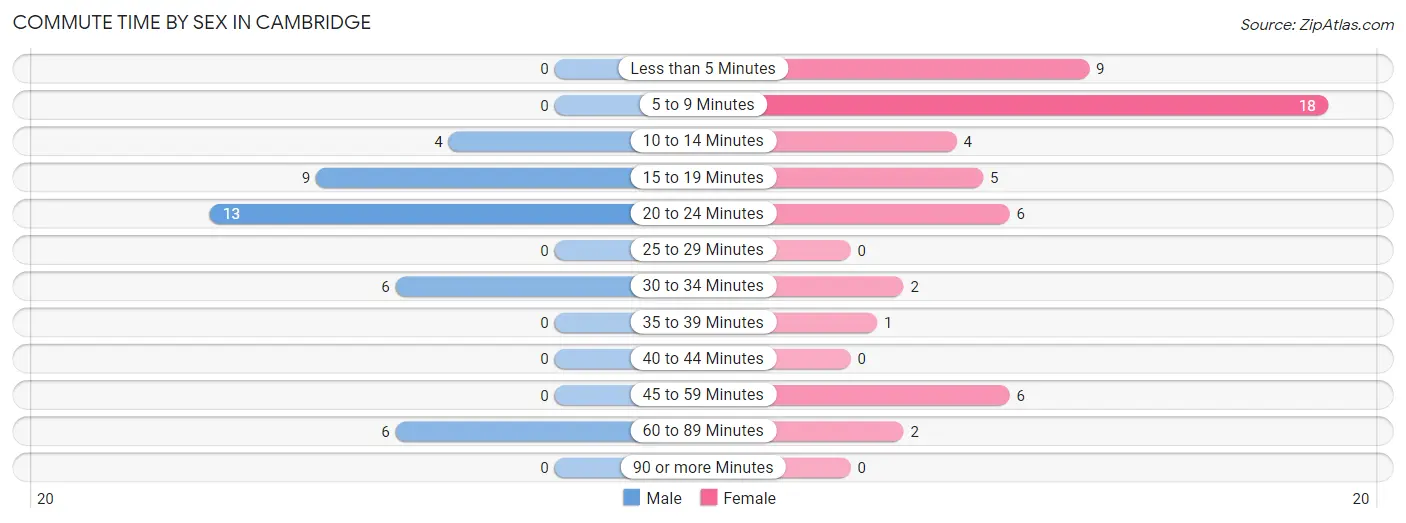
| Commute Time | Male | Female |
| Less than 5 Minutes | 0 (0.0%) | 9 (17.0%) |
| 5 to 9 Minutes | 0 (0.0%) | 18 (34.0%) |
| 10 to 14 Minutes | 4 (10.5%) | 4 (7.5%) |
| 15 to 19 Minutes | 9 (23.7%) | 5 (9.4%) |
| 20 to 24 Minutes | 13 (34.2%) | 6 (11.3%) |
| 25 to 29 Minutes | 0 (0.0%) | 0 (0.0%) |
| 30 to 34 Minutes | 6 (15.8%) | 2 (3.8%) |
| 35 to 39 Minutes | 0 (0.0%) | 1 (1.9%) |
| 40 to 44 Minutes | 0 (0.0%) | 0 (0.0%) |
| 45 to 59 Minutes | 0 (0.0%) | 6 (11.3%) |
| 60 to 89 Minutes | 6 (15.8%) | 2 (3.8%) |
| 90 or more Minutes | 0 (0.0%) | 0 (0.0%) |
Time of Departure to Work by Sex in Cambridge
The most frequent times of departure to work in Cambridge are 5:30 AM to 5:59 AM (11, 28.9%) for males and 7:00 AM to 7:29 AM (9, 17.0%) for females.
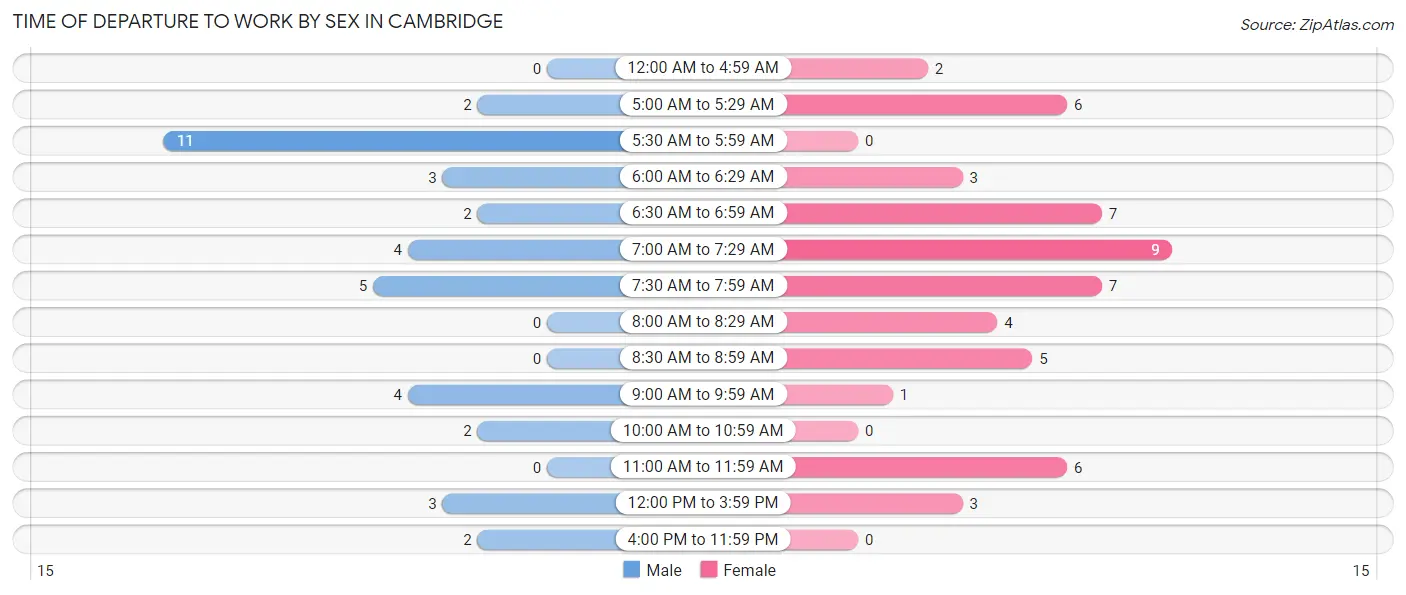
| Time of Departure | Male | Female |
| 12:00 AM to 4:59 AM | 0 (0.0%) | 2 (3.8%) |
| 5:00 AM to 5:29 AM | 2 (5.3%) | 6 (11.3%) |
| 5:30 AM to 5:59 AM | 11 (28.9%) | 0 (0.0%) |
| 6:00 AM to 6:29 AM | 3 (7.9%) | 3 (5.7%) |
| 6:30 AM to 6:59 AM | 2 (5.3%) | 7 (13.2%) |
| 7:00 AM to 7:29 AM | 4 (10.5%) | 9 (17.0%) |
| 7:30 AM to 7:59 AM | 5 (13.2%) | 7 (13.2%) |
| 8:00 AM to 8:29 AM | 0 (0.0%) | 4 (7.5%) |
| 8:30 AM to 8:59 AM | 0 (0.0%) | 5 (9.4%) |
| 9:00 AM to 9:59 AM | 4 (10.5%) | 1 (1.9%) |
| 10:00 AM to 10:59 AM | 2 (5.3%) | 0 (0.0%) |
| 11:00 AM to 11:59 AM | 0 (0.0%) | 6 (11.3%) |
| 12:00 PM to 3:59 PM | 3 (7.9%) | 3 (5.7%) |
| 4:00 PM to 11:59 PM | 2 (5.3%) | 0 (0.0%) |
| Total | 38 (100.0%) | 53 (100.0%) |
Housing Occupancy in Cambridge
Occupancy by Ownership in Cambridge
Of the total 89 dwellings in Cambridge, owner-occupied units account for 84 (94.4%), while renter-occupied units make up 5 (5.6%).
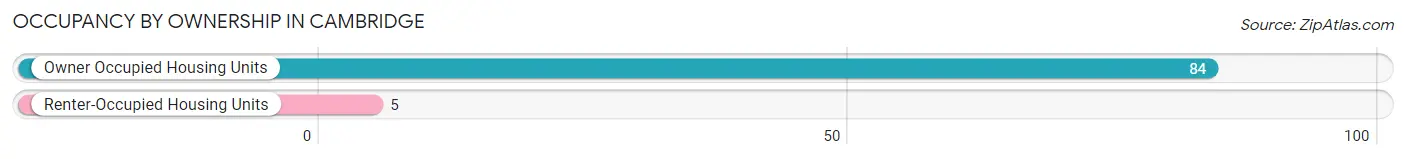
| Occupancy | # Housing Units | % Housing Units |
| Owner Occupied Housing Units | 84 | 94.4% |
| Renter-Occupied Housing Units | 5 | 5.6% |
| Total Occupied Housing Units | 89 | 100.0% |
Occupancy by Household Size in Cambridge
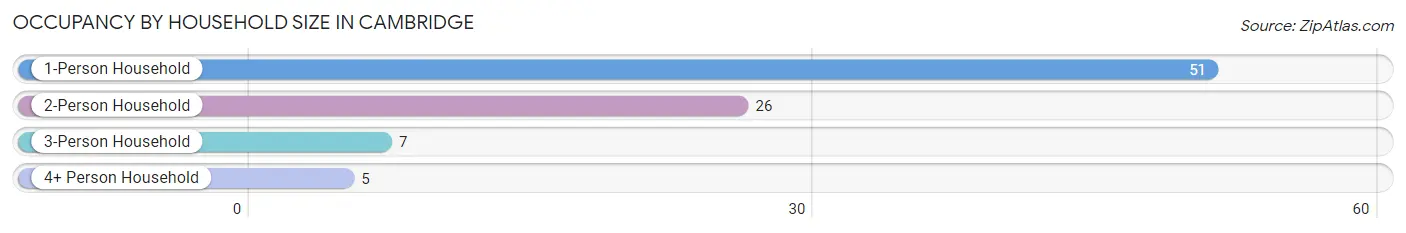
| Household Size | # Housing Units | % Housing Units |
| 1-Person Household | 51 | 57.3% |
| 2-Person Household | 26 | 29.2% |
| 3-Person Household | 7 | 7.9% |
| 4+ Person Household | 5 | 5.6% |
| Total Housing Units | 89 | 100.0% |
Occupancy by Ownership by Household Size in Cambridge
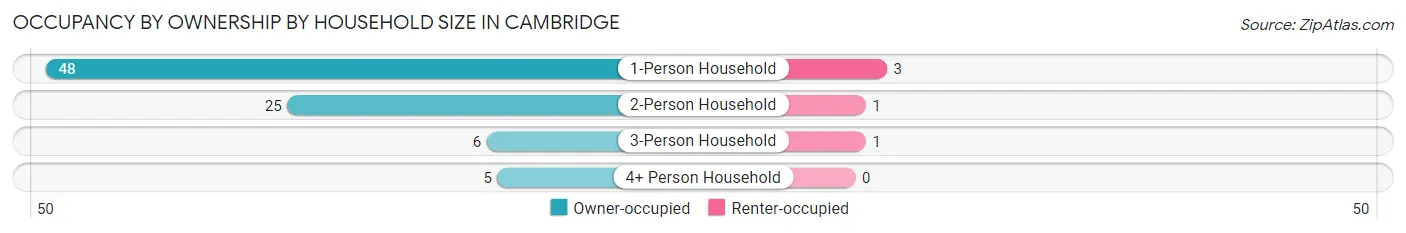
| Household Size | Owner-occupied | Renter-occupied |
| 1-Person Household | 48 (94.1%) | 3 (5.9%) |
| 2-Person Household | 25 (96.2%) | 1 (3.8%) |
| 3-Person Household | 6 (85.7%) | 1 (14.3%) |
| 4+ Person Household | 5 (100.0%) | 0 (0.0%) |
| Total Housing Units | 84 (94.4%) | 5 (5.6%) |
Occupancy by Educational Attainment in Cambridge
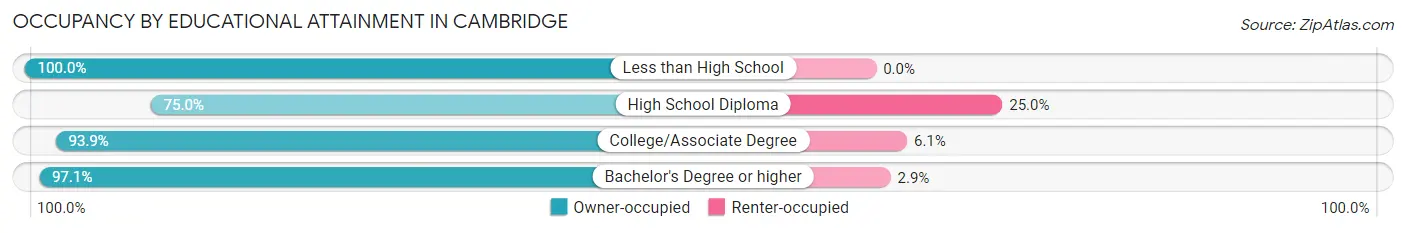
| Household Size | Owner-occupied | Renter-occupied |
| Less than High School | 1 (100.0%) | 0 (0.0%) |
| High School Diploma | 3 (75.0%) | 1 (25.0%) |
| College/Associate Degree | 46 (93.9%) | 3 (6.1%) |
| Bachelor's Degree or higher | 34 (97.1%) | 1 (2.9%) |
Occupancy by Age of Householder in Cambridge
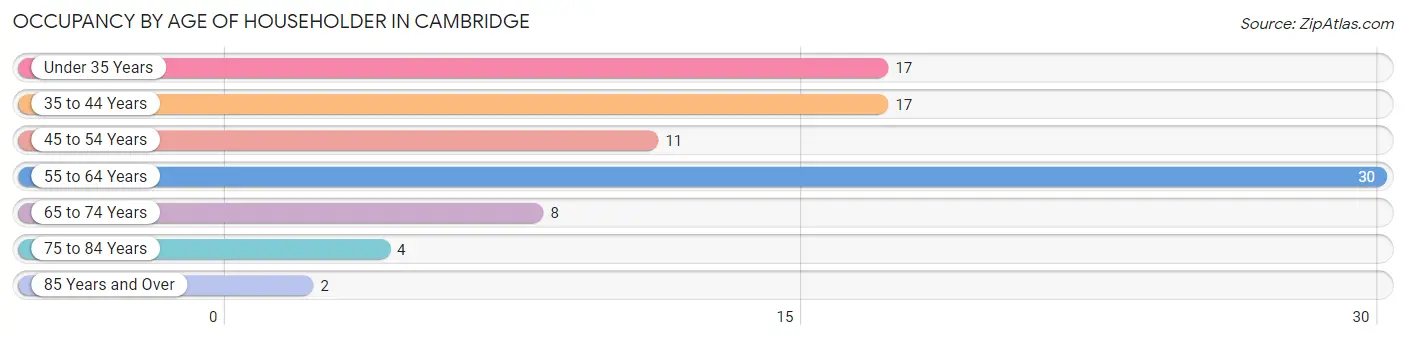
| Age Bracket | # Households | % Households |
| Under 35 Years | 17 | 19.1% |
| 35 to 44 Years | 17 | 19.1% |
| 45 to 54 Years | 11 | 12.4% |
| 55 to 64 Years | 30 | 33.7% |
| 65 to 74 Years | 8 | 9.0% |
| 75 to 84 Years | 4 | 4.5% |
| 85 Years and Over | 2 | 2.2% |
| Total | 89 | 100.0% |
Housing Finances in Cambridge
Median Income by Occupancy in Cambridge
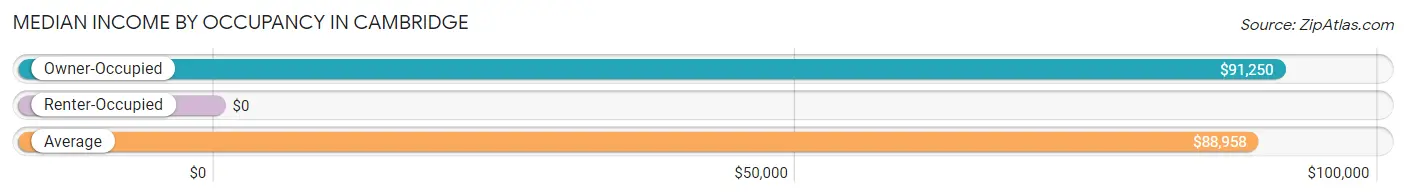
| Occupancy Type | # Households | Median Income |
| Owner-Occupied | 84 (94.4%) | $91,250 |
| Renter-Occupied | 5 (5.6%) | $0 |
| Average | 89 (100.0%) | $88,958 |
Occupancy by Householder Income Bracket in Cambridge
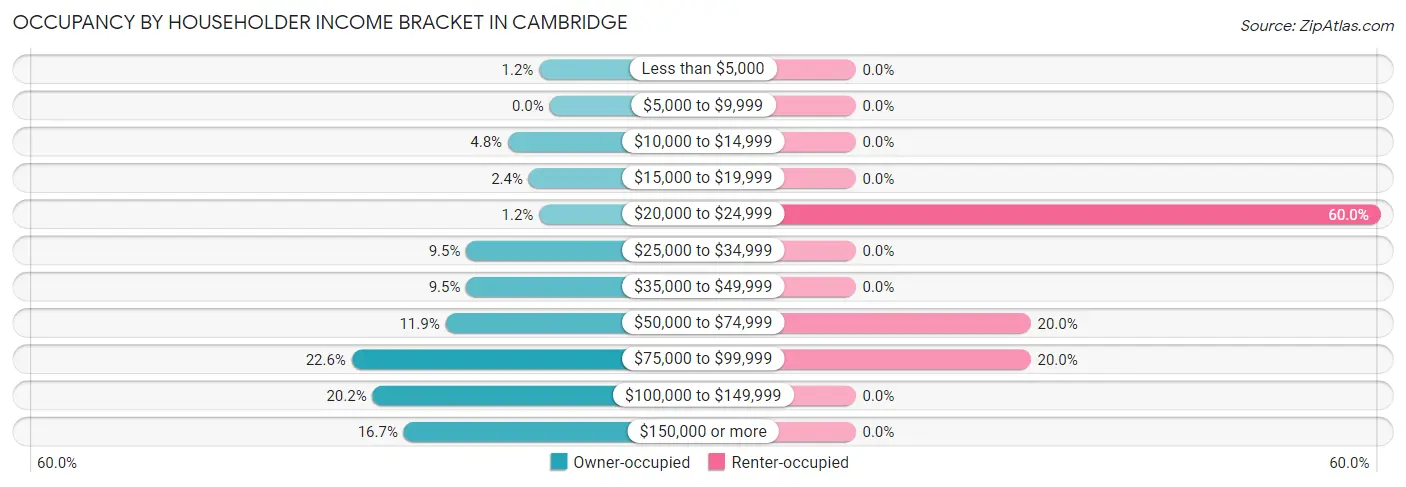
| Income Bracket | Owner-occupied | Renter-occupied |
| Less than $5,000 | 1 (1.2%) | 0 (0.0%) |
| $5,000 to $9,999 | 0 (0.0%) | 0 (0.0%) |
| $10,000 to $14,999 | 4 (4.8%) | 0 (0.0%) |
| $15,000 to $19,999 | 2 (2.4%) | 0 (0.0%) |
| $20,000 to $24,999 | 1 (1.2%) | 3 (60.0%) |
| $25,000 to $34,999 | 8 (9.5%) | 0 (0.0%) |
| $35,000 to $49,999 | 8 (9.5%) | 0 (0.0%) |
| $50,000 to $74,999 | 10 (11.9%) | 1 (20.0%) |
| $75,000 to $99,999 | 19 (22.6%) | 1 (20.0%) |
| $100,000 to $149,999 | 17 (20.2%) | 0 (0.0%) |
| $150,000 or more | 14 (16.7%) | 0 (0.0%) |
| Total | 84 (100.0%) | 5 (100.0%) |
Monthly Housing Cost Tiers in Cambridge
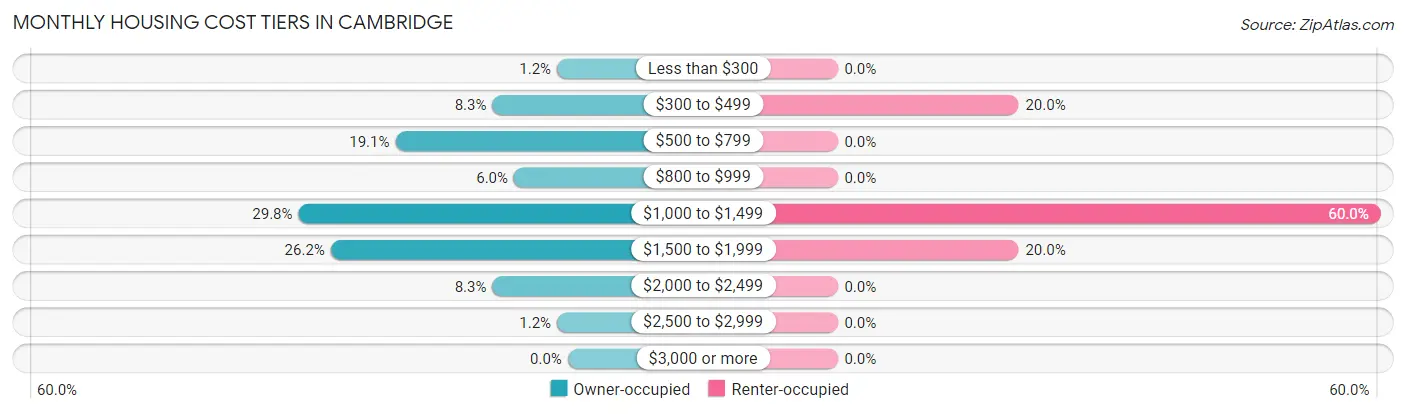
| Monthly Cost | Owner-occupied | Renter-occupied |
| Less than $300 | 1 (1.2%) | 0 (0.0%) |
| $300 to $499 | 7 (8.3%) | 1 (20.0%) |
| $500 to $799 | 16 (19.1%) | 0 (0.0%) |
| $800 to $999 | 5 (5.9%) | 0 (0.0%) |
| $1,000 to $1,499 | 25 (29.8%) | 3 (60.0%) |
| $1,500 to $1,999 | 22 (26.2%) | 1 (20.0%) |
| $2,000 to $2,499 | 7 (8.3%) | 0 (0.0%) |
| $2,500 to $2,999 | 1 (1.2%) | 0 (0.0%) |
| $3,000 or more | 0 (0.0%) | 0 (0.0%) |
| Total | 84 (100.0%) | 5 (100.0%) |
Physical Housing Characteristics in Cambridge
Housing Structures in Cambridge
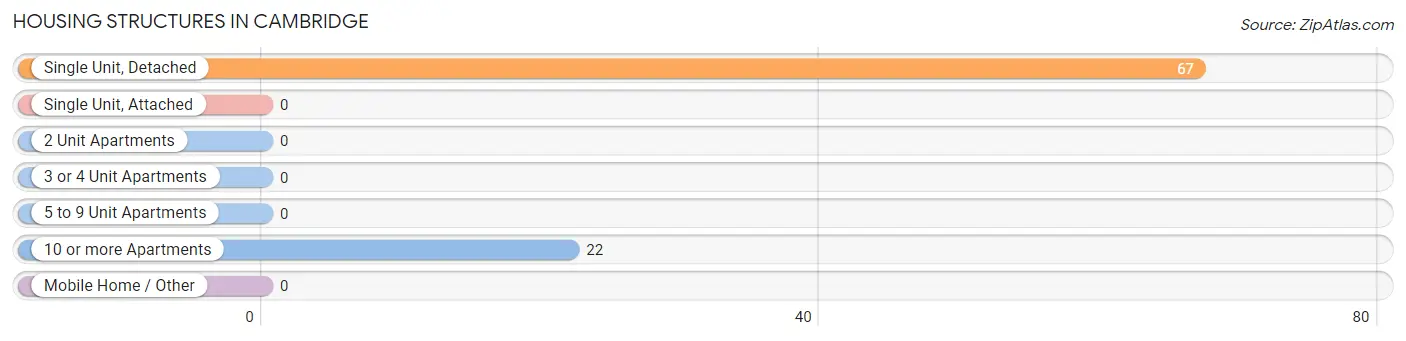
| Structure Type | # Housing Units | % Housing Units |
| Single Unit, Detached | 67 | 75.3% |
| Single Unit, Attached | 0 | 0.0% |
| 2 Unit Apartments | 0 | 0.0% |
| 3 or 4 Unit Apartments | 0 | 0.0% |
| 5 to 9 Unit Apartments | 0 | 0.0% |
| 10 or more Apartments | 22 | 24.7% |
| Mobile Home / Other | 0 | 0.0% |
| Total | 89 | 100.0% |
Housing Structures by Occupancy in Cambridge
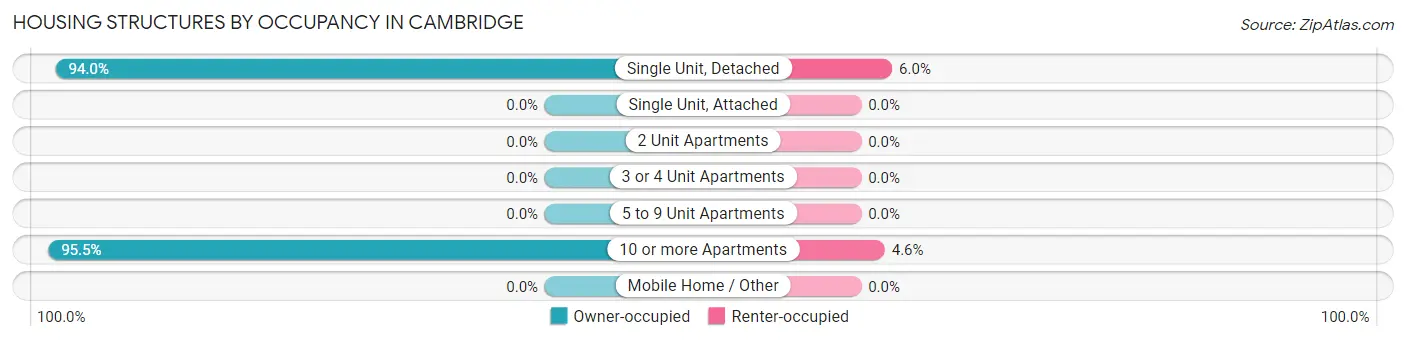
| Structure Type | Owner-occupied | Renter-occupied |
| Single Unit, Detached | 63 (94.0%) | 4 (6.0%) |
| Single Unit, Attached | 0 (0.0%) | 0 (0.0%) |
| 2 Unit Apartments | 0 (0.0%) | 0 (0.0%) |
| 3 or 4 Unit Apartments | 0 (0.0%) | 0 (0.0%) |
| 5 to 9 Unit Apartments | 0 (0.0%) | 0 (0.0%) |
| 10 or more Apartments | 21 (95.5%) | 1 (4.5%) |
| Mobile Home / Other | 0 (0.0%) | 0 (0.0%) |
| Total | 84 (94.4%) | 5 (5.6%) |
Housing Structures by Number of Rooms in Cambridge
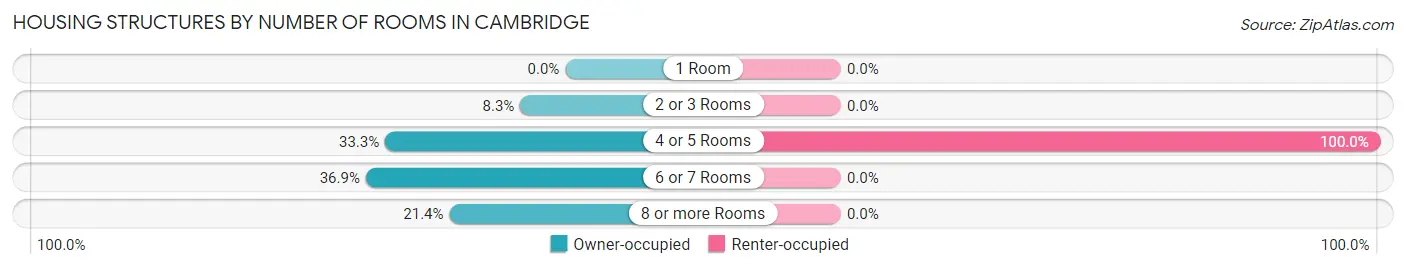
| Number of Rooms | Owner-occupied | Renter-occupied |
| 1 Room | 0 (0.0%) | 0 (0.0%) |
| 2 or 3 Rooms | 7 (8.3%) | 0 (0.0%) |
| 4 or 5 Rooms | 28 (33.3%) | 5 (100.0%) |
| 6 or 7 Rooms | 31 (36.9%) | 0 (0.0%) |
| 8 or more Rooms | 18 (21.4%) | 0 (0.0%) |
| Total | 84 (100.0%) | 5 (100.0%) |
Housing Structure by Heating Type in Cambridge
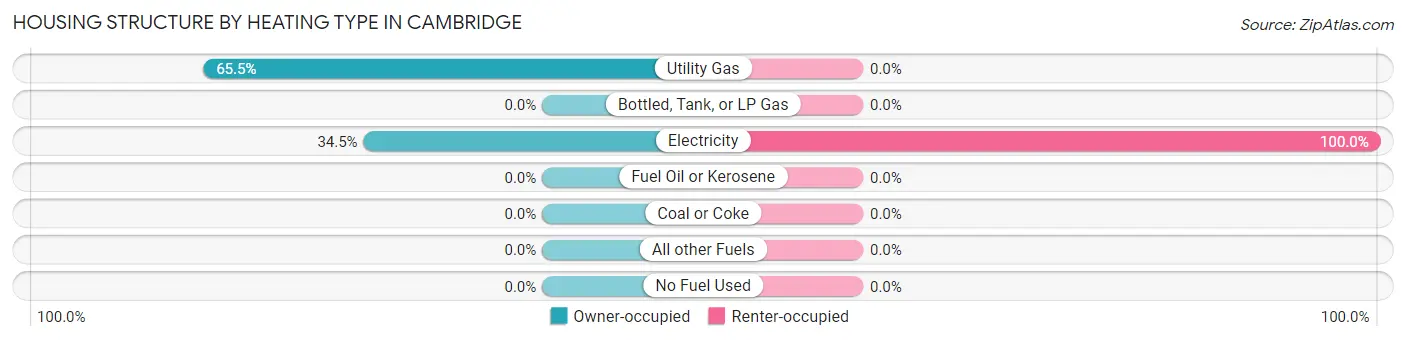
| Heating Type | Owner-occupied | Renter-occupied |
| Utility Gas | 55 (65.5%) | 0 (0.0%) |
| Bottled, Tank, or LP Gas | 0 (0.0%) | 0 (0.0%) |
| Electricity | 29 (34.5%) | 5 (100.0%) |
| Fuel Oil or Kerosene | 0 (0.0%) | 0 (0.0%) |
| Coal or Coke | 0 (0.0%) | 0 (0.0%) |
| All other Fuels | 0 (0.0%) | 0 (0.0%) |
| No Fuel Used | 0 (0.0%) | 0 (0.0%) |
| Total | 84 (100.0%) | 5 (100.0%) |
Household Vehicle Usage in Cambridge
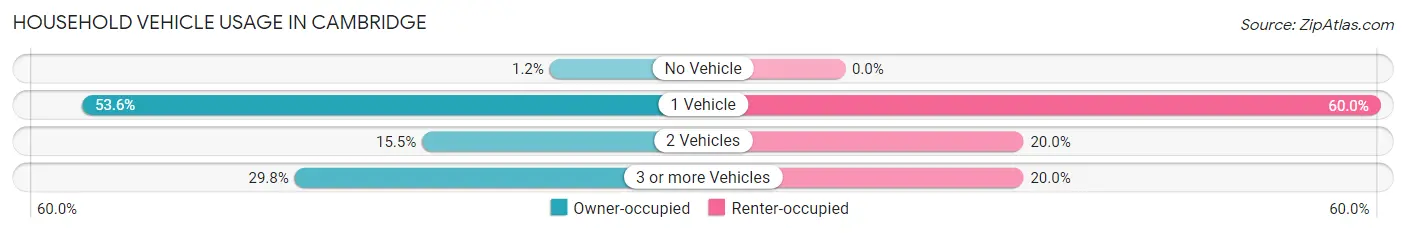
| Vehicles per Household | Owner-occupied | Renter-occupied |
| No Vehicle | 1 (1.2%) | 0 (0.0%) |
| 1 Vehicle | 45 (53.6%) | 3 (60.0%) |
| 2 Vehicles | 13 (15.5%) | 1 (20.0%) |
| 3 or more Vehicles | 25 (29.8%) | 1 (20.0%) |
| Total | 84 (100.0%) | 5 (100.0%) |
Real Estate & Mortgages in Cambridge
Real Estate and Mortgage Overview in Cambridge
| Characteristic | Without Mortgage | With Mortgage |
| Housing Units | 21 | 63 |
| Median Property Value | $213,900 | $215,500 |
| Median Household Income | $57,917 | $13 |
| Monthly Housing Costs | $550 | $0 |
| Real Estate Taxes | $1,750 | $0 |
Property Value by Mortgage Status in Cambridge
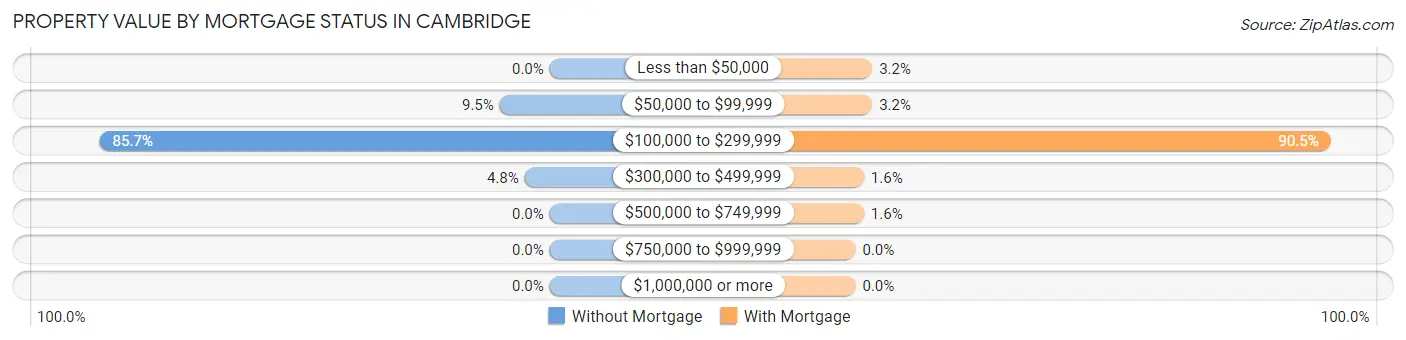
| Property Value | Without Mortgage | With Mortgage |
| Less than $50,000 | 0 (0.0%) | 2 (3.2%) |
| $50,000 to $99,999 | 2 (9.5%) | 2 (3.2%) |
| $100,000 to $299,999 | 18 (85.7%) | 57 (90.5%) |
| $300,000 to $499,999 | 1 (4.8%) | 1 (1.6%) |
| $500,000 to $749,999 | 0 (0.0%) | 1 (1.6%) |
| $750,000 to $999,999 | 0 (0.0%) | 0 (0.0%) |
| $1,000,000 or more | 0 (0.0%) | 0 (0.0%) |
| Total | 21 (100.0%) | 63 (100.0%) |
Household Income by Mortgage Status in Cambridge
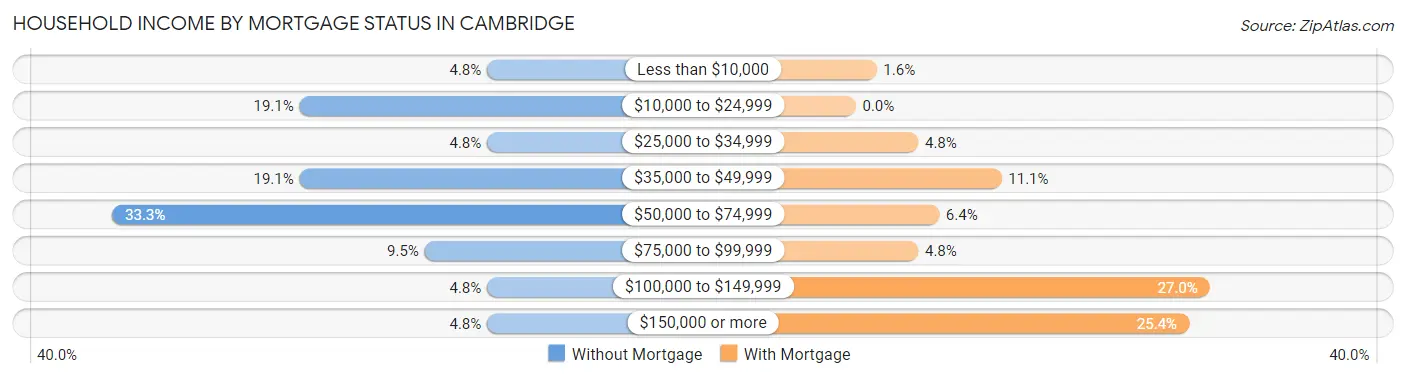
| Household Income | Without Mortgage | With Mortgage |
| Less than $10,000 | 1 (4.8%) | 1 (1.6%) |
| $10,000 to $24,999 | 4 (19.1%) | 0 (0.0%) |
| $25,000 to $34,999 | 1 (4.8%) | 3 (4.8%) |
| $35,000 to $49,999 | 4 (19.1%) | 7 (11.1%) |
| $50,000 to $74,999 | 7 (33.3%) | 4 (6.4%) |
| $75,000 to $99,999 | 2 (9.5%) | 3 (4.8%) |
| $100,000 to $149,999 | 1 (4.8%) | 17 (27.0%) |
| $150,000 or more | 1 (4.8%) | 16 (25.4%) |
| Total | 21 (100.0%) | 63 (100.0%) |
Property Value to Household Income Ratio in Cambridge
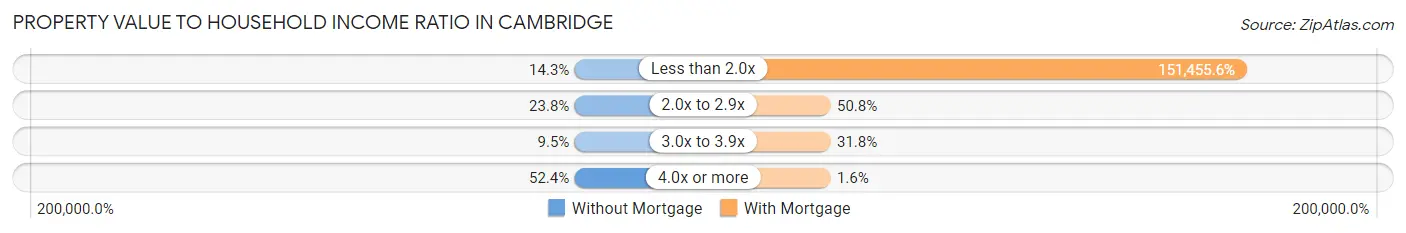
| Value-to-Income Ratio | Without Mortgage | With Mortgage |
| Less than 2.0x | 3 (14.3%) | 95,417 (151,455.6%) |
| 2.0x to 2.9x | 5 (23.8%) | 32 (50.8%) |
| 3.0x to 3.9x | 2 (9.5%) | 20 (31.8%) |
| 4.0x or more | 11 (52.4%) | 1 (1.6%) |
| Total | 21 (100.0%) | 63 (100.0%) |
Real Estate Taxes by Mortgage Status in Cambridge
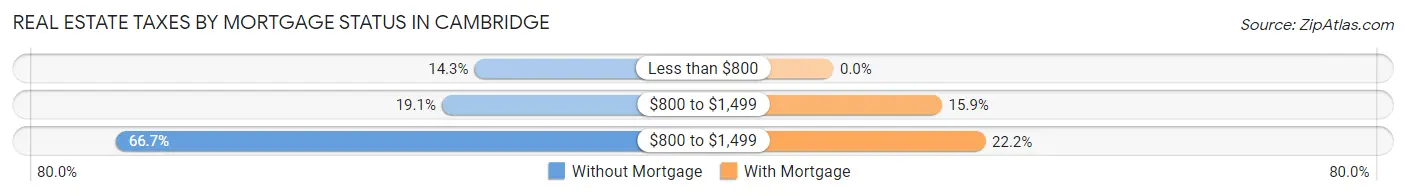
| Property Taxes | Without Mortgage | With Mortgage |
| Less than $800 | 3 (14.3%) | 0 (0.0%) |
| $800 to $1,499 | 4 (19.1%) | 10 (15.9%) |
| $800 to $1,499 | 14 (66.7%) | 14 (22.2%) |
| Total | 21 (100.0%) | 63 (100.0%) |
Health & Disability in Cambridge
Health Insurance Coverage by Age in Cambridge
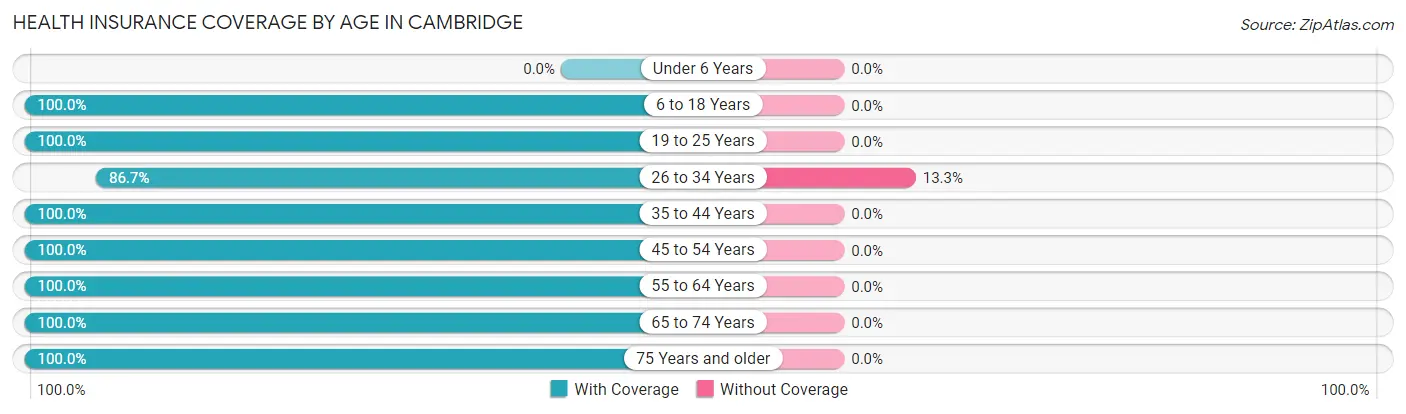
| Age Bracket | With Coverage | Without Coverage |
| Under 6 Years | 0 (0.0%) | 0 (0.0%) |
| 6 to 18 Years | 16 (100.0%) | 0 (0.0%) |
| 19 to 25 Years | 23 (100.0%) | 0 (0.0%) |
| 26 to 34 Years | 13 (86.7%) | 2 (13.3%) |
| 35 to 44 Years | 22 (100.0%) | 0 (0.0%) |
| 45 to 54 Years | 20 (100.0%) | 0 (0.0%) |
| 55 to 64 Years | 36 (100.0%) | 0 (0.0%) |
| 65 to 74 Years | 14 (100.0%) | 0 (0.0%) |
| 75 Years and older | 7 (100.0%) | 0 (0.0%) |
| Total | 151 (98.7%) | 2 (1.3%) |
Health Insurance Coverage by Citizenship Status in Cambridge
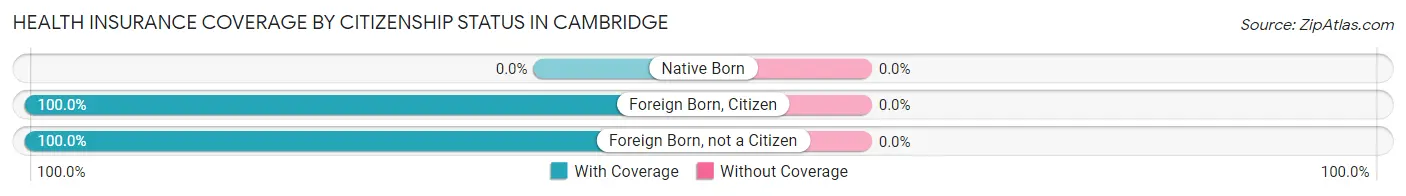
| Citizenship Status | With Coverage | Without Coverage |
| Native Born | 0 (0.0%) | 0 (0.0%) |
| Foreign Born, Citizen | 16 (100.0%) | 0 (0.0%) |
| Foreign Born, not a Citizen | 23 (100.0%) | 0 (0.0%) |
Health Insurance Coverage by Household Income in Cambridge
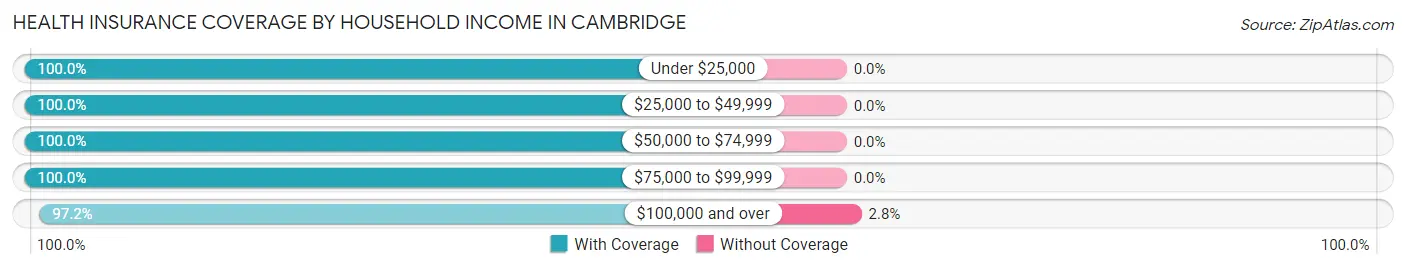
| Household Income | With Coverage | Without Coverage |
| Under $25,000 | 11 (100.0%) | 0 (0.0%) |
| $25,000 to $49,999 | 16 (100.0%) | 0 (0.0%) |
| $50,000 to $74,999 | 24 (100.0%) | 0 (0.0%) |
| $75,000 to $99,999 | 30 (100.0%) | 0 (0.0%) |
| $100,000 and over | 70 (97.2%) | 2 (2.8%) |
Public vs Private Health Insurance Coverage by Age in Cambridge
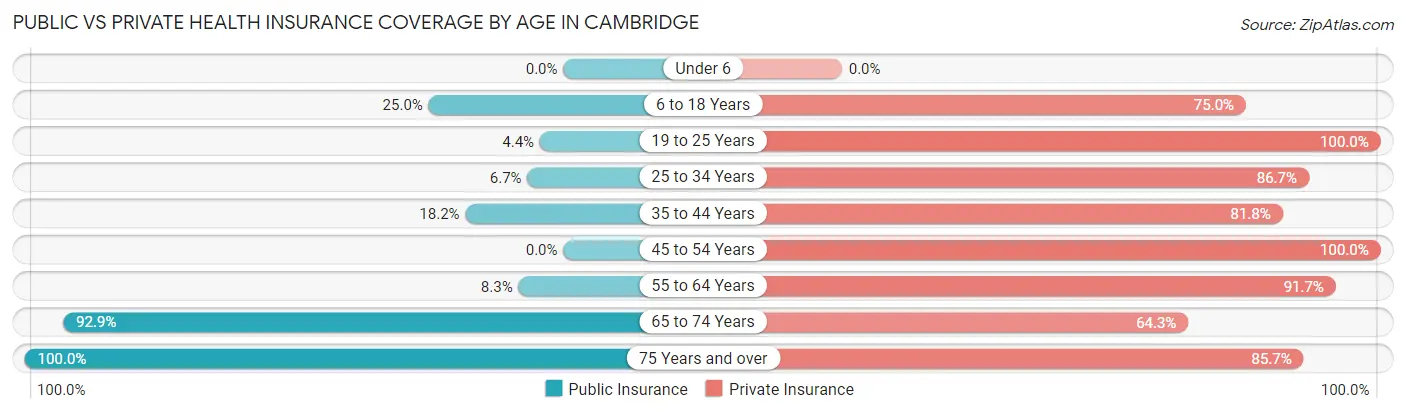
| Age Bracket | Public Insurance | Private Insurance |
| Under 6 | 0 (0.0%) | 0 (0.0%) |
| 6 to 18 Years | 4 (25.0%) | 12 (75.0%) |
| 19 to 25 Years | 1 (4.3%) | 23 (100.0%) |
| 25 to 34 Years | 1 (6.7%) | 13 (86.7%) |
| 35 to 44 Years | 4 (18.2%) | 18 (81.8%) |
| 45 to 54 Years | 0 (0.0%) | 20 (100.0%) |
| 55 to 64 Years | 3 (8.3%) | 33 (91.7%) |
| 65 to 74 Years | 13 (92.9%) | 9 (64.3%) |
| 75 Years and over | 7 (100.0%) | 6 (85.7%) |
| Total | 33 (21.6%) | 134 (87.6%) |
Disability Status by Sex by Age in Cambridge
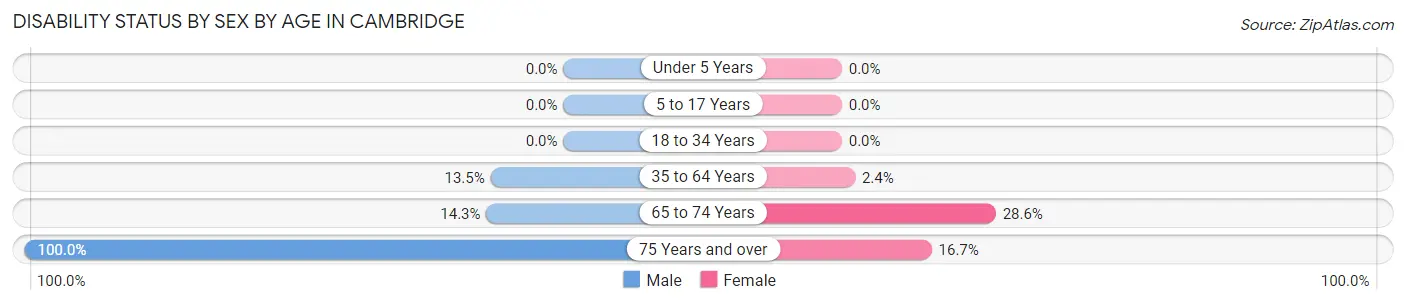
| Age Bracket | Male | Female |
| Under 5 Years | 0 (0.0%) | 0 (0.0%) |
| 5 to 17 Years | 0 (0.0%) | 0 (0.0%) |
| 18 to 34 Years | 0 (0.0%) | 0 (0.0%) |
| 35 to 64 Years | 5 (13.5%) | 1 (2.4%) |
| 65 to 74 Years | 1 (14.3%) | 2 (28.6%) |
| 75 Years and over | 1 (100.0%) | 1 (16.7%) |
Disability Class by Sex by Age in Cambridge
Disability Class: Hearing Difficulty
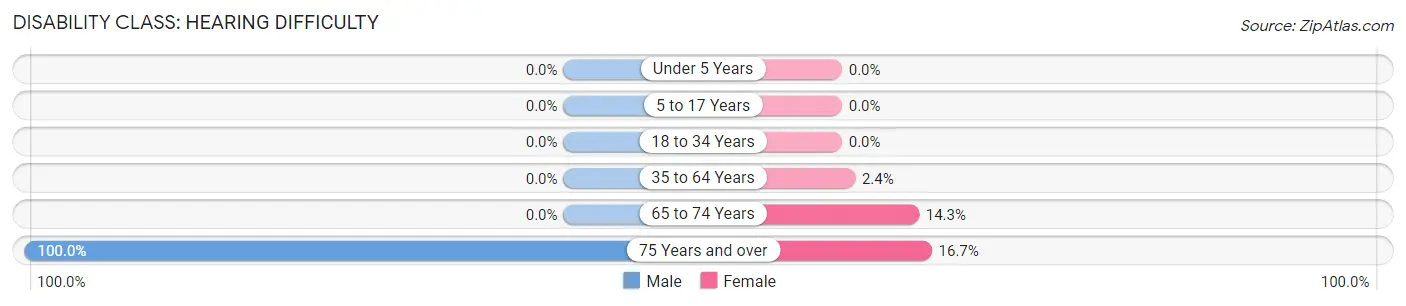
| Age Bracket | Male | Female |
| Under 5 Years | 0 (0.0%) | 0 (0.0%) |
| 5 to 17 Years | 0 (0.0%) | 0 (0.0%) |
| 18 to 34 Years | 0 (0.0%) | 0 (0.0%) |
| 35 to 64 Years | 0 (0.0%) | 1 (2.4%) |
| 65 to 74 Years | 0 (0.0%) | 1 (14.3%) |
| 75 Years and over | 1 (100.0%) | 1 (16.7%) |
Disability Class: Vision Difficulty
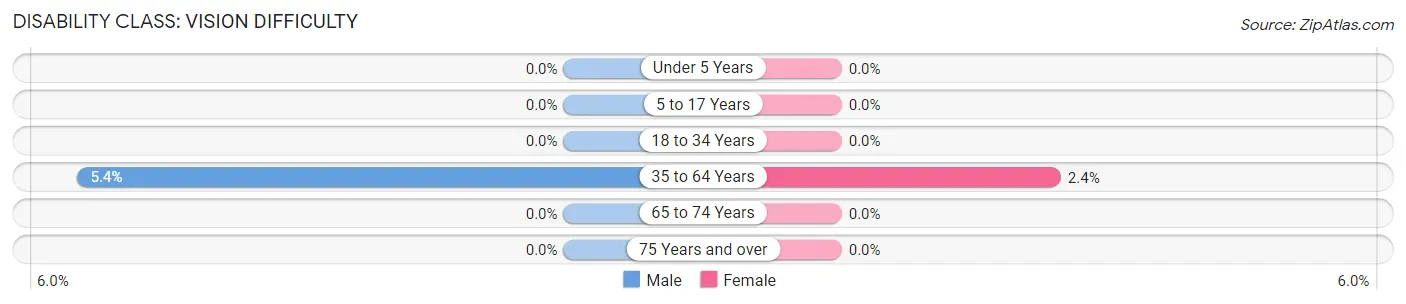
| Age Bracket | Male | Female |
| Under 5 Years | 0 (0.0%) | 0 (0.0%) |
| 5 to 17 Years | 0 (0.0%) | 0 (0.0%) |
| 18 to 34 Years | 0 (0.0%) | 0 (0.0%) |
| 35 to 64 Years | 2 (5.4%) | 1 (2.4%) |
| 65 to 74 Years | 0 (0.0%) | 0 (0.0%) |
| 75 Years and over | 0 (0.0%) | 0 (0.0%) |
Disability Class: Cognitive Difficulty
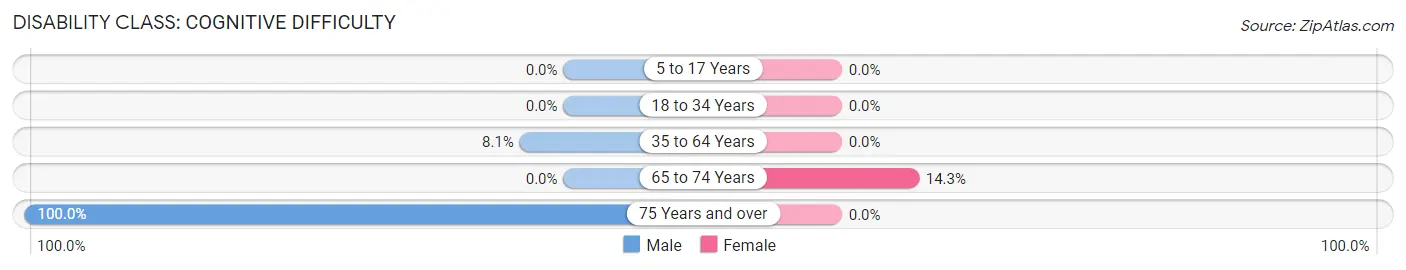
| Age Bracket | Male | Female |
| 5 to 17 Years | 0 (0.0%) | 0 (0.0%) |
| 18 to 34 Years | 0 (0.0%) | 0 (0.0%) |
| 35 to 64 Years | 3 (8.1%) | 0 (0.0%) |
| 65 to 74 Years | 0 (0.0%) | 1 (14.3%) |
| 75 Years and over | 1 (100.0%) | 0 (0.0%) |
Disability Class: Ambulatory Difficulty
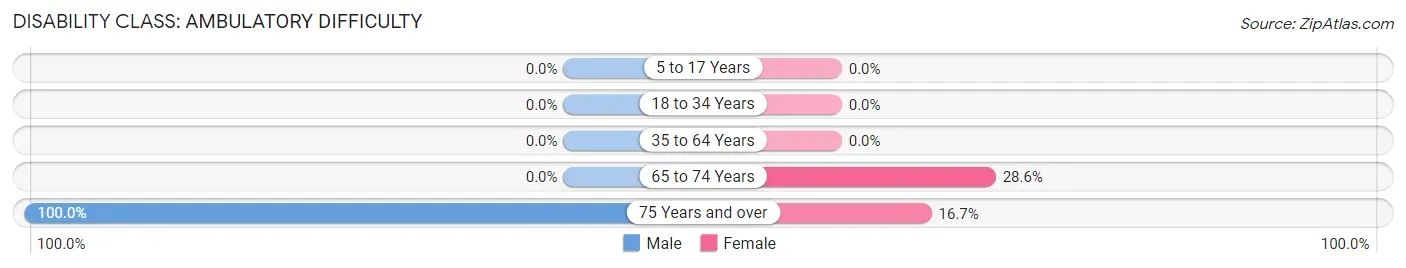
| Age Bracket | Male | Female |
| 5 to 17 Years | 0 (0.0%) | 0 (0.0%) |
| 18 to 34 Years | 0 (0.0%) | 0 (0.0%) |
| 35 to 64 Years | 0 (0.0%) | 0 (0.0%) |
| 65 to 74 Years | 0 (0.0%) | 2 (28.6%) |
| 75 Years and over | 1 (100.0%) | 1 (16.7%) |
Disability Class: Self-Care Difficulty
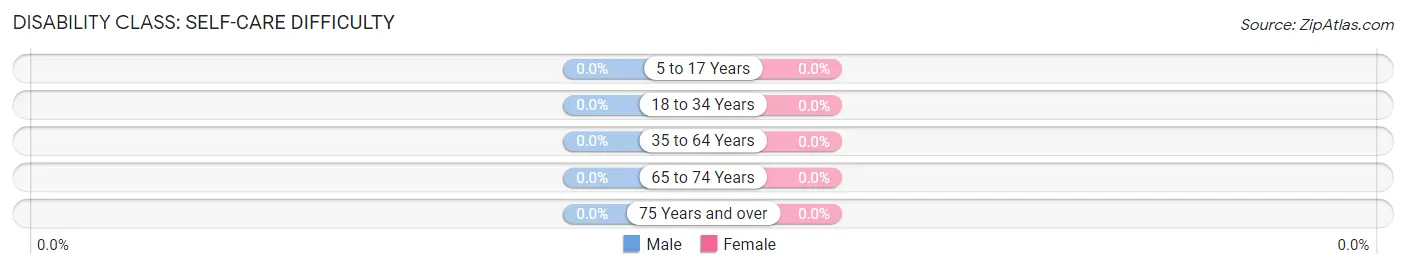
| Age Bracket | Male | Female |
| 5 to 17 Years | 0 (0.0%) | 0 (0.0%) |
| 18 to 34 Years | 0 (0.0%) | 0 (0.0%) |
| 35 to 64 Years | 0 (0.0%) | 0 (0.0%) |
| 65 to 74 Years | 0 (0.0%) | 0 (0.0%) |
| 75 Years and over | 0 (0.0%) | 0 (0.0%) |
Technology Access in Cambridge
Computing Device Access in Cambridge
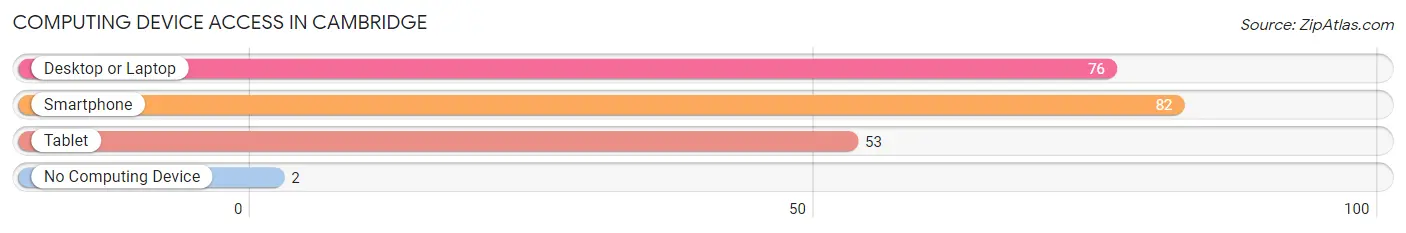
| Device Type | # Households | % Households |
| Desktop or Laptop | 76 | 85.4% |
| Smartphone | 82 | 92.1% |
| Tablet | 53 | 59.6% |
| No Computing Device | 2 | 2.2% |
| Total | 89 | 100.0% |
Internet Access in Cambridge
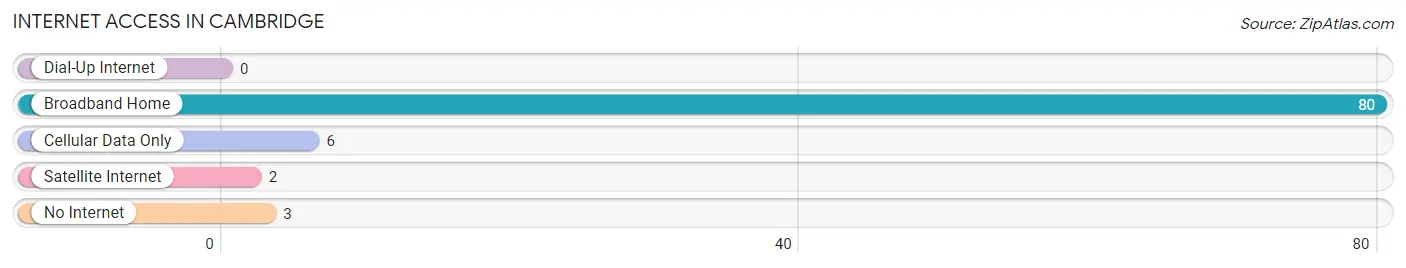
| Internet Type | # Households | % Households |
| Dial-Up Internet | 0 | 0.0% |
| Broadband Home | 80 | 89.9% |
| Cellular Data Only | 6 | 6.7% |
| Satellite Internet | 2 | 2.2% |
| No Internet | 3 | 3.4% |
| Total | 89 | 100.0% |
Cambridge Summary
Cambridge, Kentucky is a small city located in the northeastern corner of the state, in the foothills of the Appalachian Mountains. It is the county seat of Campbell County and is part of the Cincinnati metropolitan area. The city has a population of approximately 2,000 people and is known for its rural charm and small-town atmosphere.
History
The area that is now Cambridge was first settled in the late 1700s by a group of settlers from Pennsylvania. The town was originally known as Cross Plains, but was later renamed Cambridge in 1818. The name was chosen in honor of the city of Cambridge, Massachusetts.
The city was incorporated in 1820 and quickly became a center of commerce and industry. The city was home to several mills, including a woolen mill, a flour mill, and a sawmill. The city also had a large tobacco market, which was a major source of income for the city.
In the late 1800s, the city experienced a period of growth and prosperity. The city was home to several banks, a newspaper, and a variety of stores and businesses. The city also had a thriving cultural scene, with several theaters, churches, and schools.
Geography
Cambridge is located in the northeastern corner of Kentucky, in the foothills of the Appalachian Mountains. The city is situated on the banks of the Licking River, which flows through the city. The city is surrounded by rolling hills and farmland, and is located approximately 30 miles from Cincinnati, Ohio.
The climate in Cambridge is humid subtropical, with hot, humid summers and mild winters. The average annual temperature is around 60 degrees Fahrenheit, and the average annual precipitation is around 40 inches.
Economy
The economy of Cambridge is largely based on agriculture and manufacturing. The city is home to several large farms, which produce a variety of crops, including corn, soybeans, and tobacco. The city is also home to several manufacturing companies, which produce a variety of products, including furniture, clothing, and automotive parts.
The city is also home to several small businesses, including restaurants, shops, and services. The city is also home to several educational institutions, including a community college and a vocational school.
Demographics
As of the 2010 census, the population of Cambridge was 2,000 people. The racial makeup of the city was 95.2% White, 2.2% African American, 0.4% Native American, 0.4% Asian, 0.2% from other races, and 1.6% from two or more races. Hispanic or Latino of any race were 0.8% of the population.
The median household income in Cambridge was $37,500, and the median family income was $45,000. The per capita income in the city was $19,000. Approximately 16.2% of the population was below the poverty line.
Cambridge is a small city with a rich history and a unique culture. The city is home to a variety of businesses and industries, and is a great place to live and work. The city is also home to several educational institutions, making it a great place to raise a family.
Common Questions
What is Per Capita Income in Cambridge?
Per Capita income in Cambridge is $55,615.
What is the Median Family Income in Cambridge?
Median Family Income in Cambridge is $142,708.
What is the Median Household income in Cambridge?
Median Household Income in Cambridge is $88,958.
What is Income or Wage Gap in Cambridge?
Income or Wage Gap in Cambridge is 22.1%.
Women in Cambridge earn 77.9 cents for every dollar earned by a man.
What is Inequality or Gini Index in Cambridge?
Inequality or Gini Index in Cambridge is 0.38.
What is the Total Population of Cambridge?
Total Population of Cambridge is 153.
What is the Total Male Population of Cambridge?
Total Male Population of Cambridge is 69.
What is the Total Female Population of Cambridge?
Total Female Population of Cambridge is 84.
What is the Ratio of Males per 100 Females in Cambridge?
There are 82.14 Males per 100 Females in Cambridge.
What is the Ratio of Females per 100 Males in Cambridge?
There are 121.74 Females per 100 Males in Cambridge.
What is the Median Population Age in Cambridge?
Median Population Age in Cambridge is 46.2 Years.
What is the Average Family Size in Cambridge
Average Family Size in Cambridge is 2.7 People.
What is the Average Household Size in Cambridge
Average Household Size in Cambridge is 1.7 People.
How Large is the Labor Force in Cambridge?
There are 118 People in the Labor Forcein in Cambridge.
What is the Percentage of People in the Labor Force in Cambridge?
84.3% of People are in the Labor Force in Cambridge.
What is the Unemployment Rate in Cambridge?
Unemployment Rate in Cambridge is 5.9%.