Dry Ridge, KY Map & Demographics
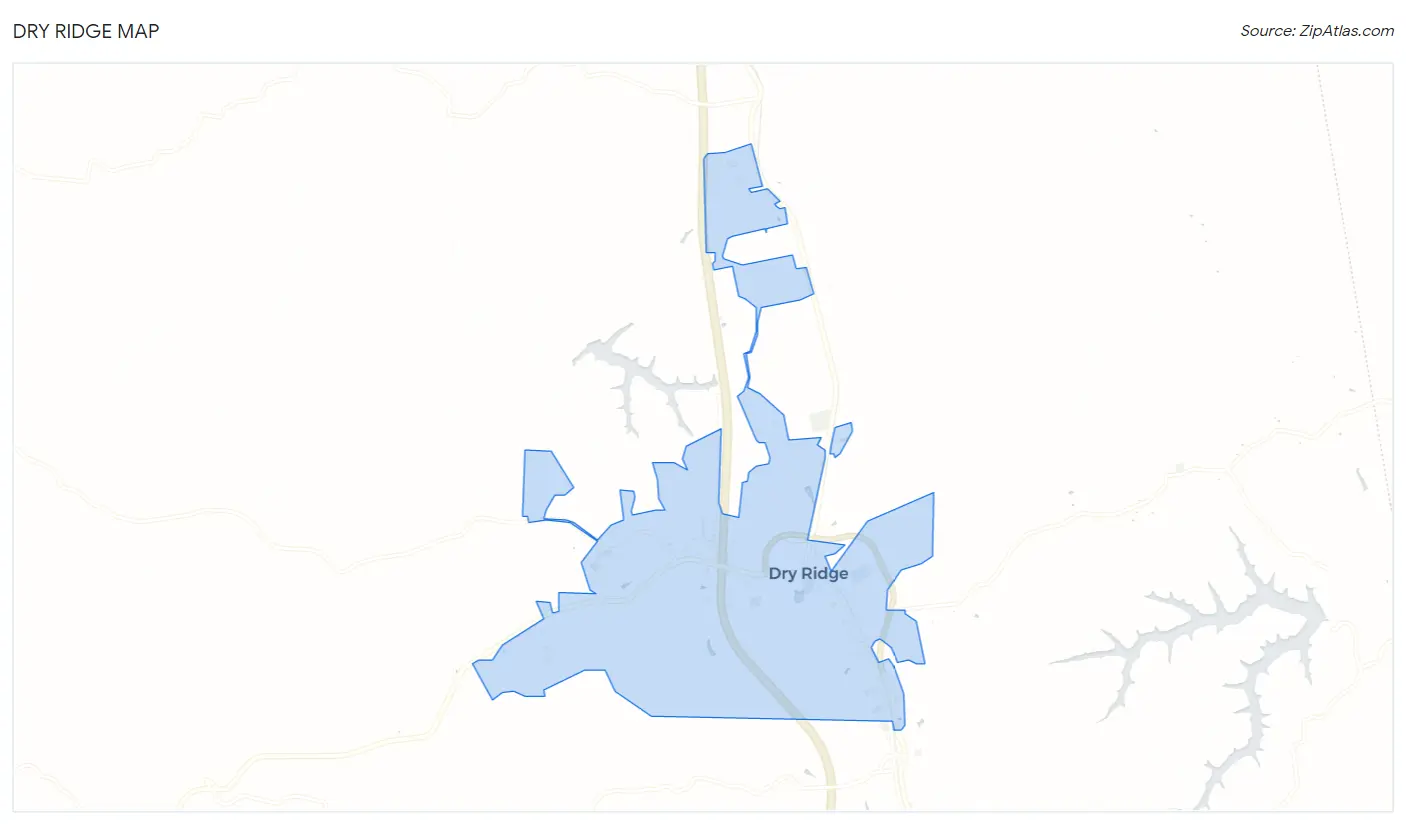
Dry Ridge Map
Dry Ridge Overview
$22,993
PER CAPITA INCOME
$51,250
AVG FAMILY INCOME
$46,000
AVG HOUSEHOLD INCOME
55.1%
WAGE / INCOME GAP [ % ]
44.9¢/ $1
WAGE / INCOME GAP [ $ ]
0.52
INEQUALITY / GINI INDEX
2,227
TOTAL POPULATION
938
MALE POPULATION
1,289
FEMALE POPULATION
72.77
MALES / 100 FEMALES
137.42
FEMALES / 100 MALES
28.3
MEDIAN AGE
3.1
AVG FAMILY SIZE
2.5
AVG HOUSEHOLD SIZE
916
LABOR FORCE [ PEOPLE ]
60.4%
PERCENT IN LABOR FORCE
5.8%
UNEMPLOYMENT RATE
Dry Ridge Zip Codes
Income in Dry Ridge
Income Overview in Dry Ridge
Per Capita Income in Dry Ridge is $22,993, while median incomes of families and households are $51,250 and $46,000 respectively.
| Characteristic | Number | Measure |
| Per Capita Income | 2,227 | $22,993 |
| Median Family Income | 582 | $51,250 |
| Mean Family Income | 582 | $58,824 |
| Median Household Income | 900 | $46,000 |
| Mean Household Income | 900 | $54,387 |
| Income Deficit | 582 | $0 |
| Wage / Income Gap (%) | 2,227 | 55.06% |
| Wage / Income Gap ($) | 2,227 | 44.94¢ per $1 |
| Gini / Inequality Index | 2,227 | 0.52 |
Earnings by Sex in Dry Ridge
Average Earnings in Dry Ridge are $45,078, $50,994 for men and $22,917 for women, a difference of 55.1%.
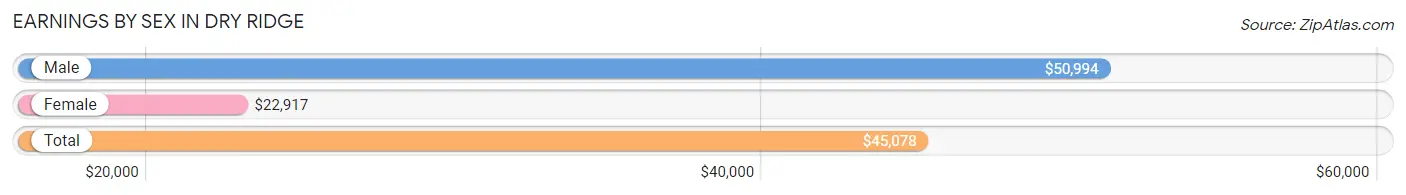
| Sex | Number | Average Earnings |
| Male | 500 (52.4%) | $50,994 |
| Female | 454 (47.6%) | $22,917 |
| Total | 954 (100.0%) | $45,078 |
Earnings by Sex by Income Bracket in Dry Ridge
The most common earnings brackets in Dry Ridge are $50,000 to $54,999 for men (102 | 20.4%) and $7,500 to $9,999 for women (57 | 12.6%).
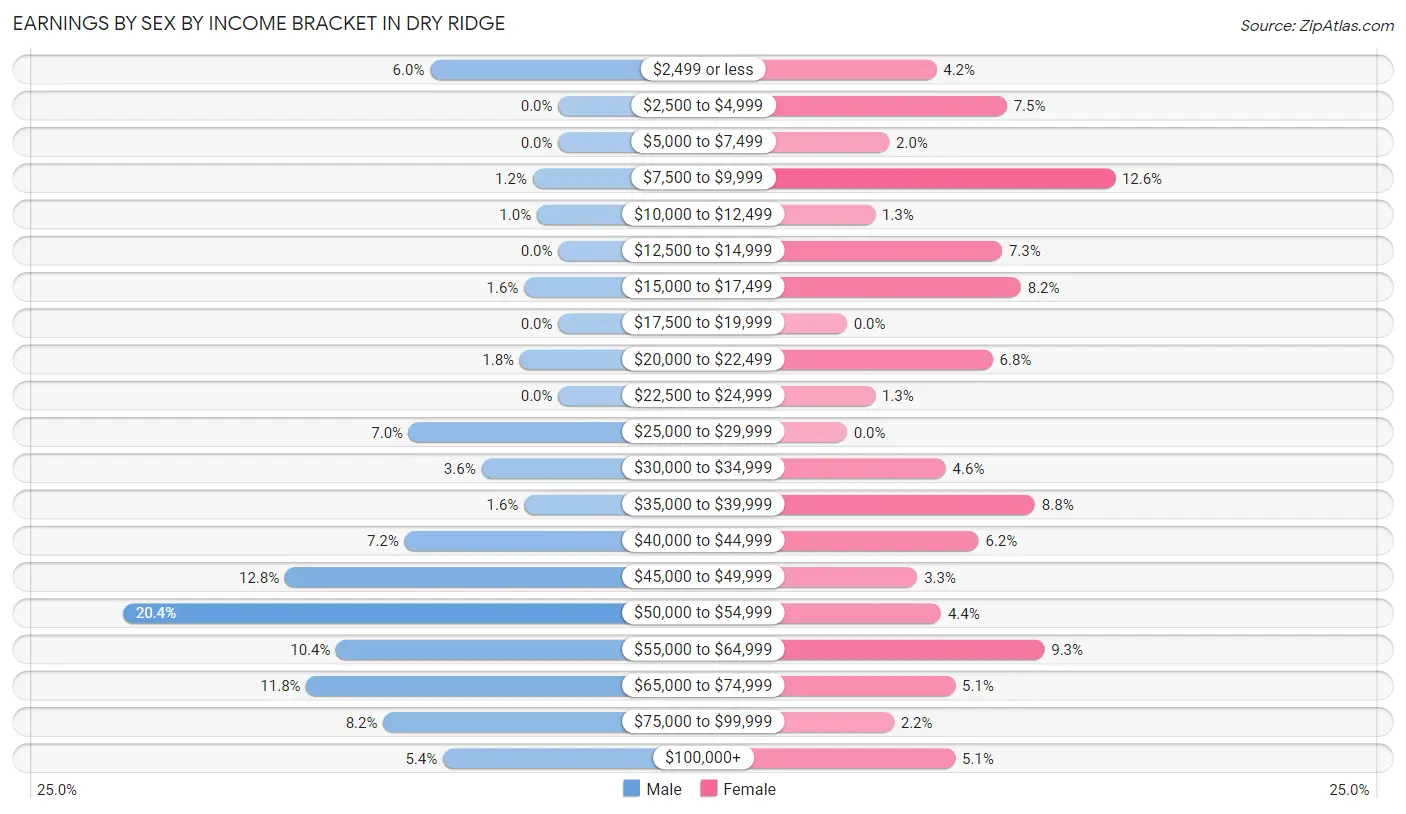
| Income | Male | Female |
| $2,499 or less | 30 (6.0%) | 19 (4.2%) |
| $2,500 to $4,999 | 0 (0.0%) | 34 (7.5%) |
| $5,000 to $7,499 | 0 (0.0%) | 9 (2.0%) |
| $7,500 to $9,999 | 6 (1.2%) | 57 (12.6%) |
| $10,000 to $12,499 | 5 (1.0%) | 6 (1.3%) |
| $12,500 to $14,999 | 0 (0.0%) | 33 (7.3%) |
| $15,000 to $17,499 | 8 (1.6%) | 37 (8.2%) |
| $17,500 to $19,999 | 0 (0.0%) | 0 (0.0%) |
| $20,000 to $22,499 | 9 (1.8%) | 31 (6.8%) |
| $22,500 to $24,999 | 0 (0.0%) | 6 (1.3%) |
| $25,000 to $29,999 | 35 (7.0%) | 0 (0.0%) |
| $30,000 to $34,999 | 18 (3.6%) | 21 (4.6%) |
| $35,000 to $39,999 | 8 (1.6%) | 40 (8.8%) |
| $40,000 to $44,999 | 36 (7.2%) | 28 (6.2%) |
| $45,000 to $49,999 | 64 (12.8%) | 15 (3.3%) |
| $50,000 to $54,999 | 102 (20.4%) | 20 (4.4%) |
| $55,000 to $64,999 | 52 (10.4%) | 42 (9.2%) |
| $65,000 to $74,999 | 59 (11.8%) | 23 (5.1%) |
| $75,000 to $99,999 | 41 (8.2%) | 10 (2.2%) |
| $100,000+ | 27 (5.4%) | 23 (5.1%) |
| Total | 500 (100.0%) | 454 (100.0%) |
Earnings by Sex by Educational Attainment in Dry Ridge
Average earnings in Dry Ridge are $51,587 for men and $36,875 for women, a difference of 28.5%. Men with an educational attainment of high school diploma enjoy the highest average annual earnings of $51,500, while those with college or associate's degree education earn the least with $48,527. Women with an educational attainment of bachelor's degree earn the most with the average annual earnings of $45,750, while those with college or associate's degree education have the smallest earnings of $35,592.
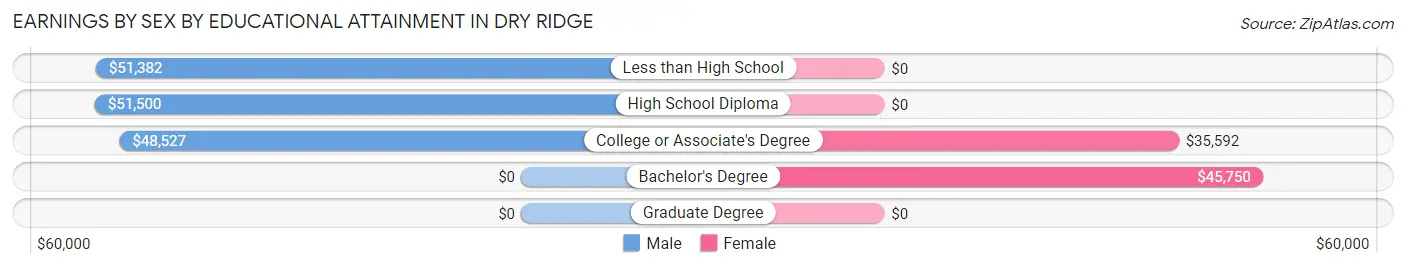
| Educational Attainment | Male Income | Female Income |
| Less than High School | $51,382 | $0 |
| High School Diploma | $51,500 | $0 |
| College or Associate's Degree | $48,527 | $35,592 |
| Bachelor's Degree | - | - |
| Graduate Degree | - | - |
| Total | $51,587 | $36,875 |
Family Income in Dry Ridge
Family Income Brackets in Dry Ridge
According to the Dry Ridge family income data, there are 123 families falling into the less than $10,000 income range, which is the most common income bracket and makes up 21.1% of all families. Conversely, the $200,000+ income bracket is the least frequent group with only 5 families (0.9%) belonging to this category.
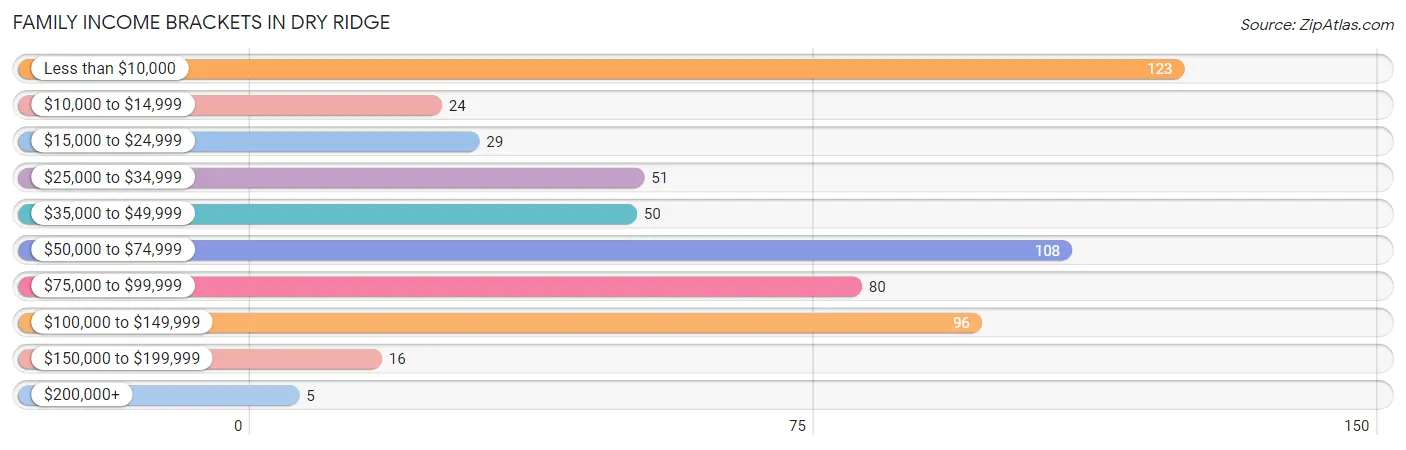
| Income Bracket | # Families | % Families |
| Less than $10,000 | 123 | 21.1% |
| $10,000 to $14,999 | 24 | 4.1% |
| $15,000 to $24,999 | 29 | 5.0% |
| $25,000 to $34,999 | 51 | 8.8% |
| $35,000 to $49,999 | 50 | 8.6% |
| $50,000 to $74,999 | 108 | 18.6% |
| $75,000 to $99,999 | 80 | 13.7% |
| $100,000 to $149,999 | 96 | 16.5% |
| $150,000 to $199,999 | 16 | 2.7% |
| $200,000+ | 5 | 0.9% |
Family Income by Famaliy Size in Dry Ridge
2-person families (216 | 37.1%) account for the highest median family income in Dry Ridge with $70,441 per family, while 2-person families (216 | 37.1%) have the highest median income of $35,220 per family member.
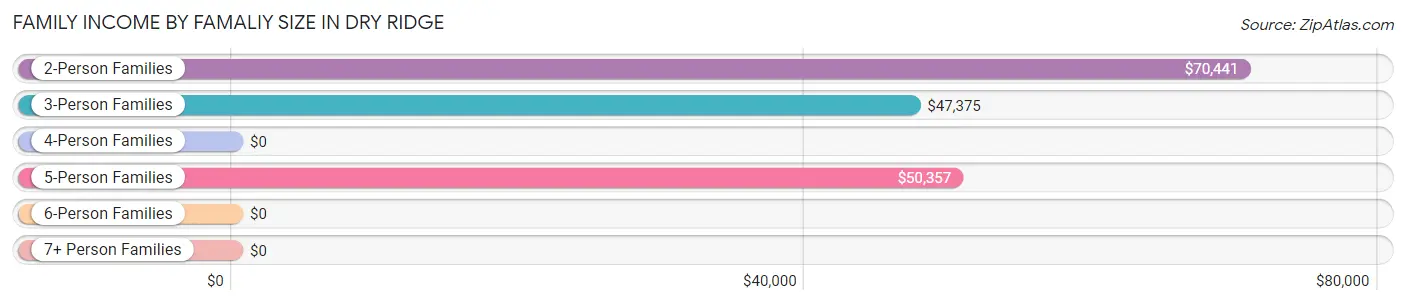
| Income Bracket | # Families | Median Income |
| 2-Person Families | 216 (37.1%) | $70,441 |
| 3-Person Families | 162 (27.8%) | $47,375 |
| 4-Person Families | 137 (23.5%) | $0 |
| 5-Person Families | 58 (10.0%) | $50,357 |
| 6-Person Families | 9 (1.5%) | $0 |
| 7+ Person Families | 0 (0.0%) | $0 |
| Total | 582 (100.0%) | $51,250 |
Family Income by Number of Earners in Dry Ridge
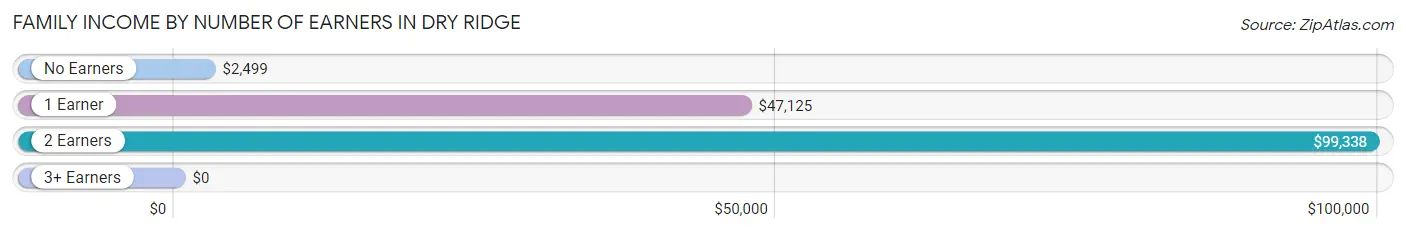
| Number of Earners | # Families | Median Income |
| No Earners | 178 (30.6%) | $2,499 |
| 1 Earner | 172 (29.5%) | $47,125 |
| 2 Earners | 215 (36.9%) | $99,338 |
| 3+ Earners | 17 (2.9%) | $0 |
| Total | 582 (100.0%) | $51,250 |
Household Income in Dry Ridge
Household Income Brackets in Dry Ridge
With 191 households falling in the category, the less than $10,000 income range is the most frequent in Dry Ridge, accounting for 21.2% of all households. In contrast, only 16 households (1.8%) fall into the $150,000 to $199,999 income bracket, making it the least populous group.
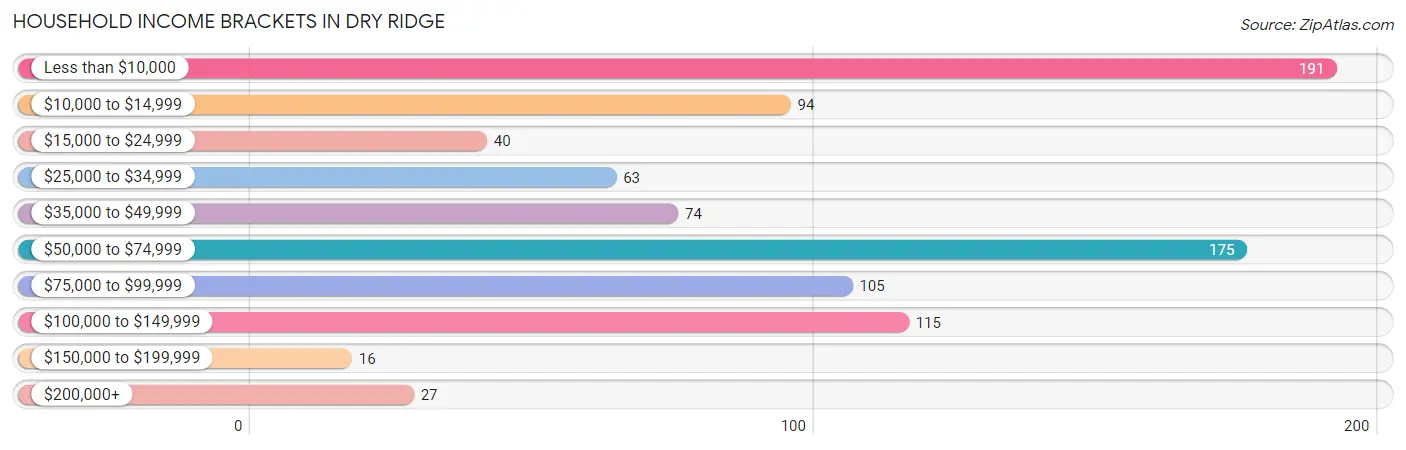
| Income Bracket | # Households | % Households |
| Less than $10,000 | 191 | 21.2% |
| $10,000 to $14,999 | 94 | 10.4% |
| $15,000 to $24,999 | 40 | 4.4% |
| $25,000 to $34,999 | 63 | 7.0% |
| $35,000 to $49,999 | 74 | 8.2% |
| $50,000 to $74,999 | 175 | 19.4% |
| $75,000 to $99,999 | 105 | 11.7% |
| $100,000 to $149,999 | 115 | 12.8% |
| $150,000 to $199,999 | 16 | 1.8% |
| $200,000+ | 27 | 3.0% |
Household Income by Householder Age in Dry Ridge
The median household income in Dry Ridge is $46,000, with the highest median household income of $52,149 found in the 45 to 64 years age bracket for the primary householder. A total of 282 households (31.3%) fall into this category. Meanwhile, the 15 to 24 years age bracket for the primary householder has the lowest median household income of $2,499, with 56 households (6.2%) in this group.
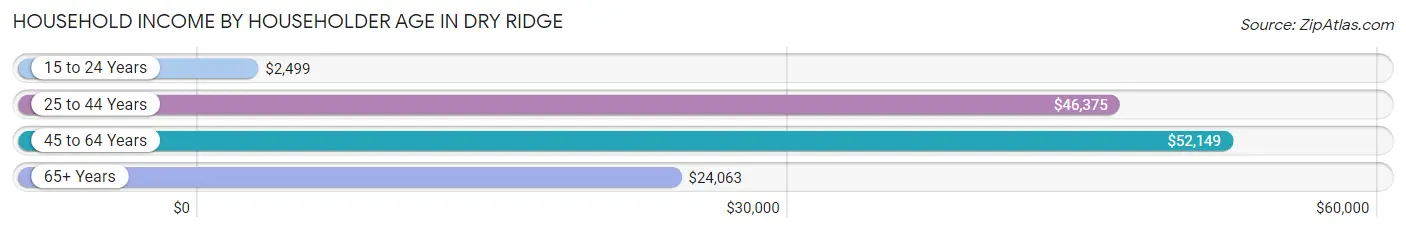
| Income Bracket | # Households | Median Income |
| 15 to 24 Years | 56 (6.2%) | $2,499 |
| 25 to 44 Years | 400 (44.4%) | $46,375 |
| 45 to 64 Years | 282 (31.3%) | $52,149 |
| 65+ Years | 162 (18.0%) | $24,063 |
| Total | 900 (100.0%) | $46,000 |
Poverty in Dry Ridge
Income Below Poverty by Sex and Age in Dry Ridge
With 24.2% poverty level for males and 41.6% for females among the residents of Dry Ridge, under 5 year old males and 5 year old females are the most vulnerable to poverty, with 72 males (69.2%) and 26 females (66.7%) in their respective age groups living below the poverty level.
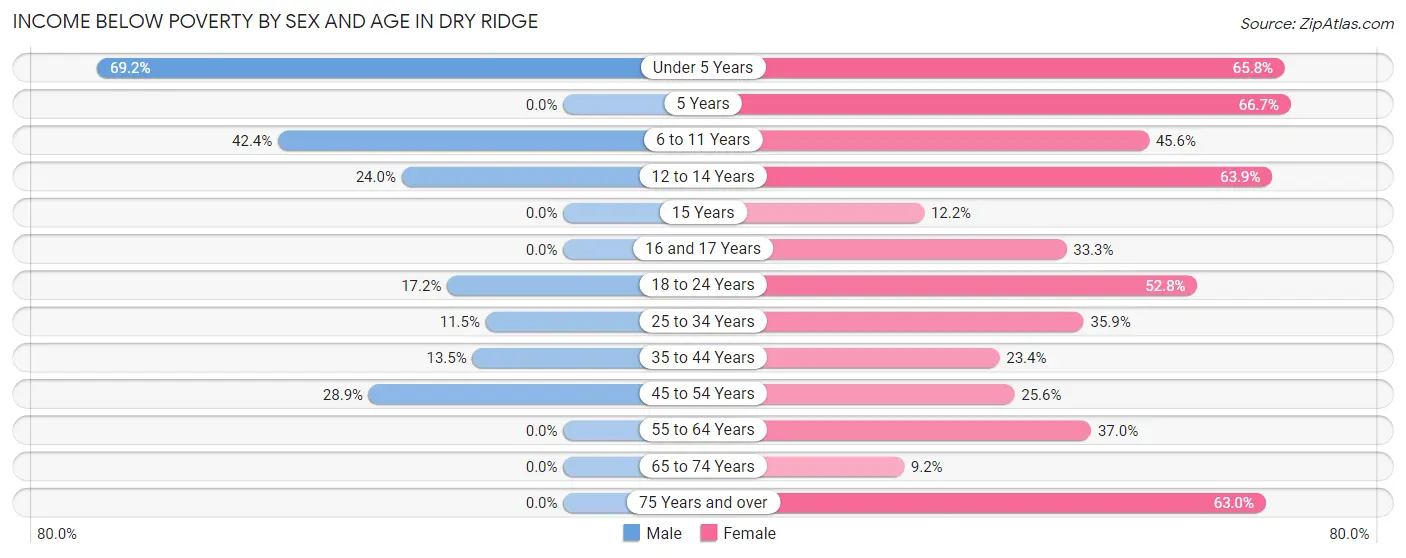
| Age Bracket | Male | Female |
| Under 5 Years | 72 (69.2%) | 75 (65.8%) |
| 5 Years | 0 (0.0%) | 26 (66.7%) |
| 6 to 11 Years | 61 (42.4%) | 67 (45.6%) |
| 12 to 14 Years | 6 (24.0%) | 39 (63.9%) |
| 15 Years | 0 (0.0%) | 5 (12.2%) |
| 16 and 17 Years | 0 (0.0%) | 5 (33.3%) |
| 18 to 24 Years | 5 (17.2%) | 85 (52.8%) |
| 25 to 34 Years | 25 (11.5%) | 84 (35.9%) |
| 35 to 44 Years | 12 (13.5%) | 29 (23.4%) |
| 45 to 54 Years | 41 (28.9%) | 21 (25.6%) |
| 55 to 64 Years | 0 (0.0%) | 37 (37.0%) |
| 65 to 74 Years | 0 (0.0%) | 7 (9.2%) |
| 75 Years and over | 0 (0.0%) | 51 (63.0%) |
| Total | 222 (24.2%) | 531 (41.6%) |
Income Above Poverty by Sex and Age in Dry Ridge
According to the poverty statistics in Dry Ridge, males aged 5 years and females aged 65 to 74 years are the age groups that are most secure financially, with 100.0% of males and 90.8% of females in these age groups living above the poverty line.
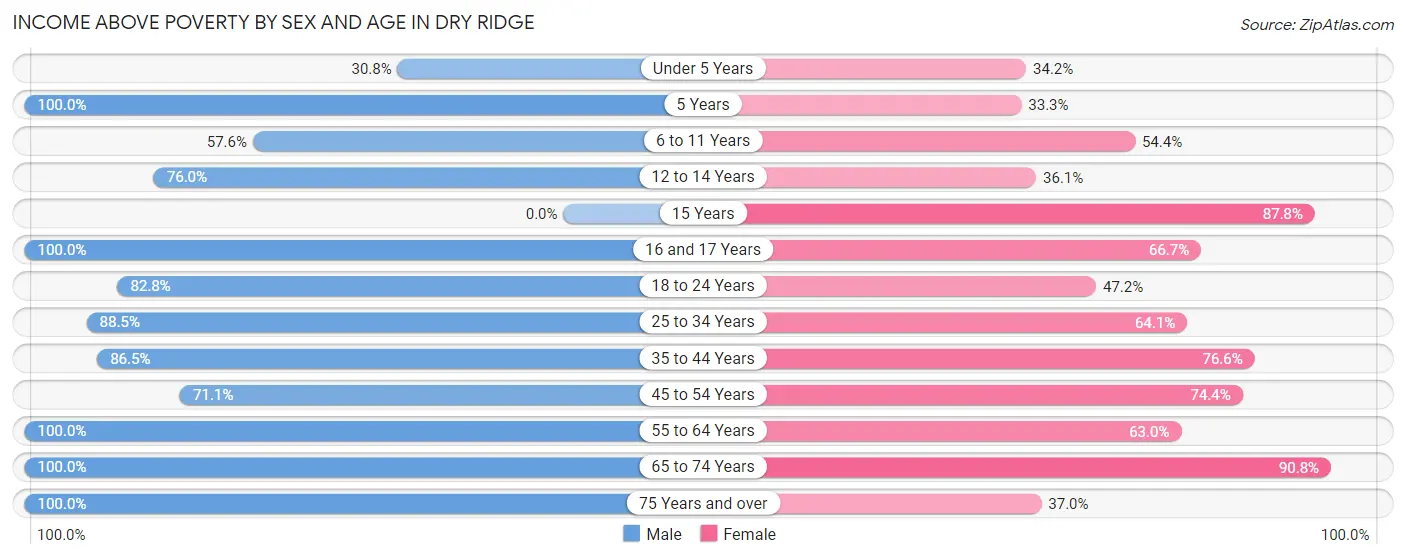
| Age Bracket | Male | Female |
| Under 5 Years | 32 (30.8%) | 39 (34.2%) |
| 5 Years | 3 (100.0%) | 13 (33.3%) |
| 6 to 11 Years | 83 (57.6%) | 80 (54.4%) |
| 12 to 14 Years | 19 (76.0%) | 22 (36.1%) |
| 15 Years | 0 (0.0%) | 36 (87.8%) |
| 16 and 17 Years | 23 (100.0%) | 10 (66.7%) |
| 18 to 24 Years | 24 (82.8%) | 76 (47.2%) |
| 25 to 34 Years | 192 (88.5%) | 150 (64.1%) |
| 35 to 44 Years | 77 (86.5%) | 95 (76.6%) |
| 45 to 54 Years | 101 (71.1%) | 61 (74.4%) |
| 55 to 64 Years | 63 (100.0%) | 63 (63.0%) |
| 65 to 74 Years | 32 (100.0%) | 69 (90.8%) |
| 75 Years and over | 48 (100.0%) | 30 (37.0%) |
| Total | 697 (75.8%) | 744 (58.4%) |
Income Below Poverty Among Married-Couple Families in Dry Ridge
The poverty statistics for married-couple families in Dry Ridge show that 8.3% or 26 of the total 314 families live below the poverty line. Families with 1 or 2 children have the highest poverty rate of 14.9%, comprising of 20 families. On the other hand, families with 3 or 4 children have the lowest poverty rate of 0.0%, which includes 0 families.
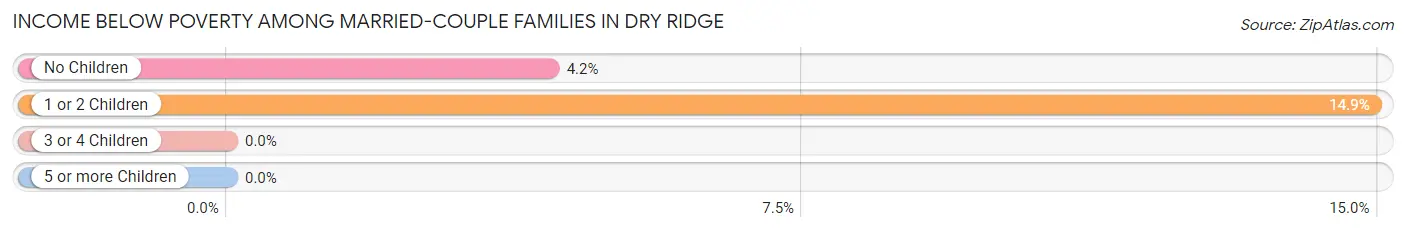
| Children | Above Poverty | Below Poverty |
| No Children | 137 (95.8%) | 6 (4.2%) |
| 1 or 2 Children | 114 (85.1%) | 20 (14.9%) |
| 3 or 4 Children | 37 (100.0%) | 0 (0.0%) |
| 5 or more Children | 0 (0.0%) | 0 (0.0%) |
| Total | 288 (91.7%) | 26 (8.3%) |
Income Below Poverty Among Single-Parent Households in Dry Ridge
According to the poverty data in Dry Ridge, 8.6% or 5 single-father households and 68.1% or 143 single-mother households are living below the poverty line. Among single-father households, those with 1 or 2 children have the highest poverty rate, with 5 households (10.6%) experiencing poverty. Likewise, among single-mother households, those with 3 or 4 children have the highest poverty rate, with 77 households (83.7%) falling below the poverty line.
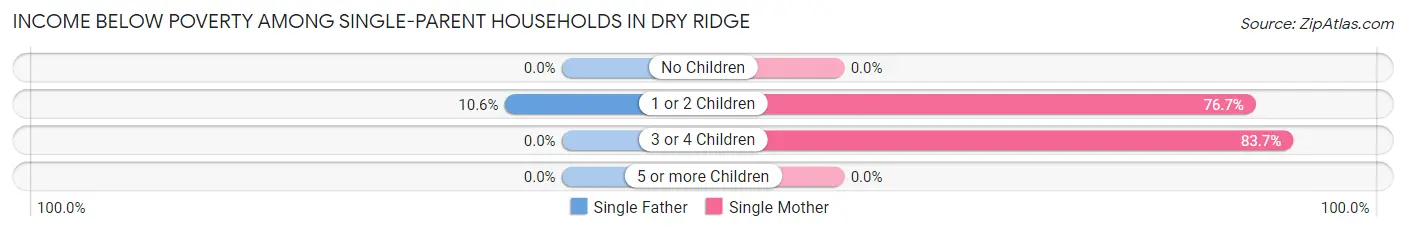
| Children | Single Father | Single Mother |
| No Children | 0 (0.0%) | 0 (0.0%) |
| 1 or 2 Children | 5 (10.6%) | 66 (76.7%) |
| 3 or 4 Children | 0 (0.0%) | 77 (83.7%) |
| 5 or more Children | 0 (0.0%) | 0 (0.0%) |
| Total | 5 (8.6%) | 143 (68.1%) |
Income Below Poverty Among Married-Couple vs Single-Parent Households in Dry Ridge
The poverty data for Dry Ridge shows that 26 of the married-couple family households (8.3%) and 148 of the single-parent households (55.2%) are living below the poverty level. Within the married-couple family households, those with 1 or 2 children have the highest poverty rate, with 20 households (14.9%) falling below the poverty line. Among the single-parent households, those with 3 or 4 children have the highest poverty rate, with 77 household (83.7%) living below poverty.
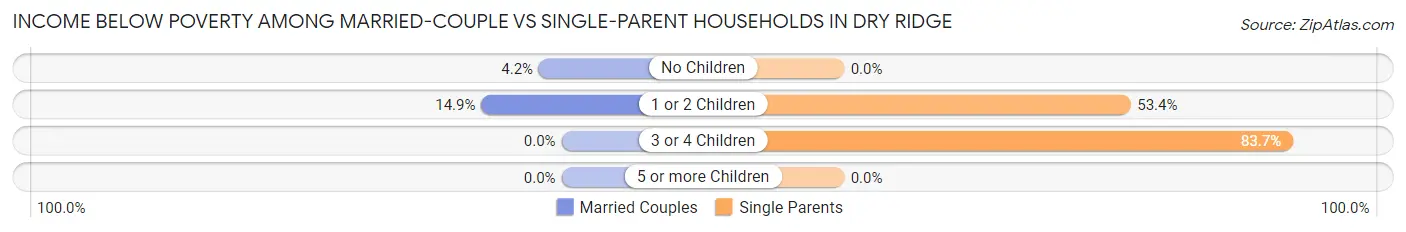
| Children | Married-Couple Families | Single-Parent Households |
| No Children | 6 (4.2%) | 0 (0.0%) |
| 1 or 2 Children | 20 (14.9%) | 71 (53.4%) |
| 3 or 4 Children | 0 (0.0%) | 77 (83.7%) |
| 5 or more Children | 0 (0.0%) | 0 (0.0%) |
| Total | 26 (8.3%) | 148 (55.2%) |
Race in Dry Ridge
The most populous races in Dry Ridge are White / Caucasian (2,183 | 98.0%), Asian (24 | 1.1%), and Two or more Races (14 | 0.6%).
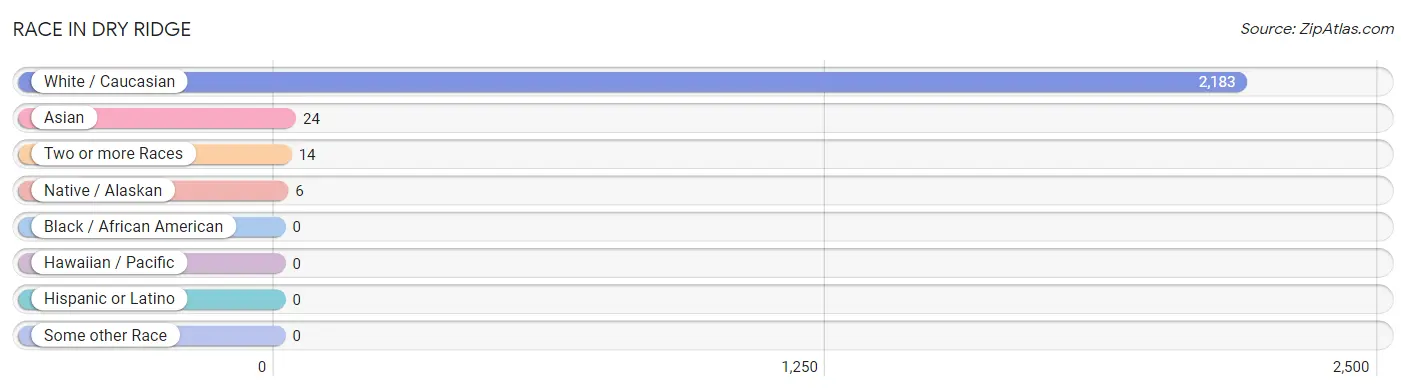
| Race | # Population | % Population |
| Asian | 24 | 1.1% |
| Black / African American | 0 | 0.0% |
| Hawaiian / Pacific | 0 | 0.0% |
| Hispanic or Latino | 0 | 0.0% |
| Native / Alaskan | 6 | 0.3% |
| White / Caucasian | 2,183 | 98.0% |
| Two or more Races | 14 | 0.6% |
| Some other Race | 0 | 0.0% |
| Total | 2,227 | 100.0% |
Ancestry in Dry Ridge
The most populous ancestries reported in Dry Ridge are German (649 | 29.1%), Irish (303 | 13.6%), English (139 | 6.2%), American (110 | 4.9%), and Scottish (87 | 3.9%), together accounting for 57.8% of all Dry Ridge residents.
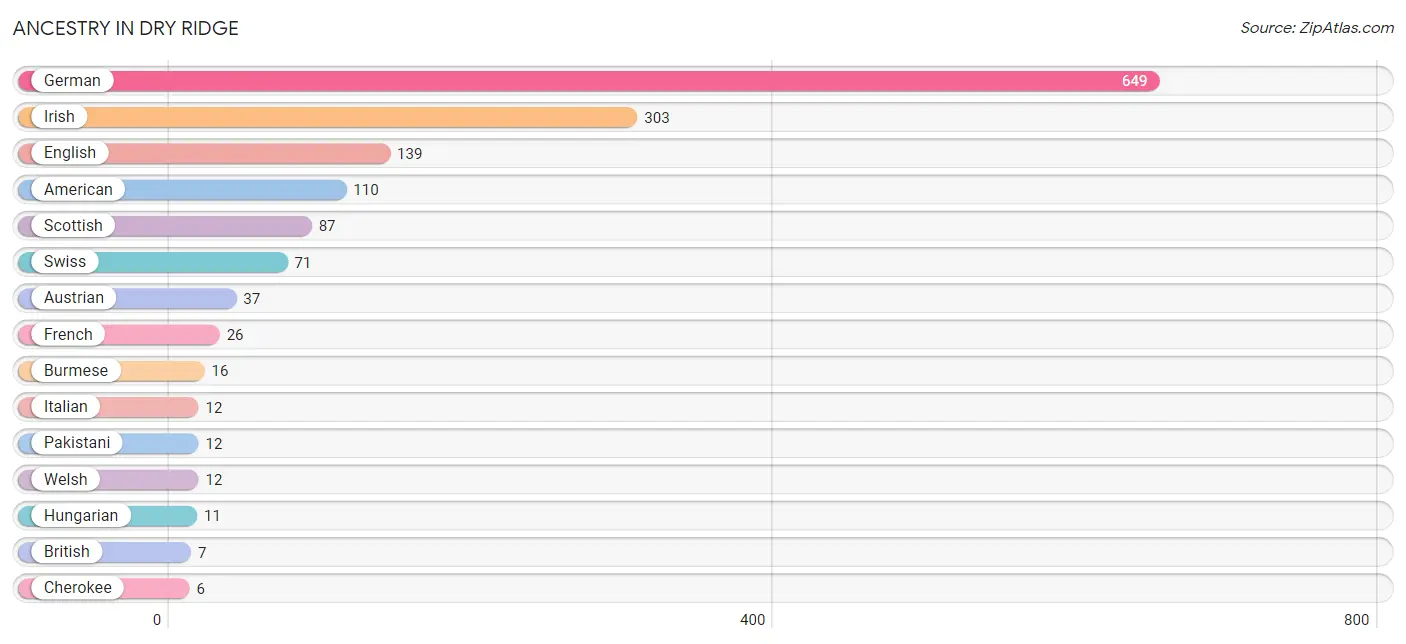
| Ancestry | # Population | % Population |
| American | 110 | 4.9% |
| Austrian | 37 | 1.7% |
| British | 7 | 0.3% |
| Burmese | 16 | 0.7% |
| Cherokee | 6 | 0.3% |
| English | 139 | 6.2% |
| French | 26 | 1.2% |
| German | 649 | 29.1% |
| Hungarian | 11 | 0.5% |
| Irish | 303 | 13.6% |
| Italian | 12 | 0.5% |
| Norwegian | 5 | 0.2% |
| Pakistani | 12 | 0.5% |
| Scottish | 87 | 3.9% |
| Swedish | 4 | 0.2% |
| Swiss | 71 | 3.2% |
| Welsh | 12 | 0.5% | View All 17 Rows |
Immigrants in Dry Ridge
The most numerous immigrant groups reported in Dry Ridge came from Asia (8 | 0.4%), South Eastern Asia (8 | 0.4%), and Thailand (8 | 0.4%), together accounting for 1.1% of all Dry Ridge residents.
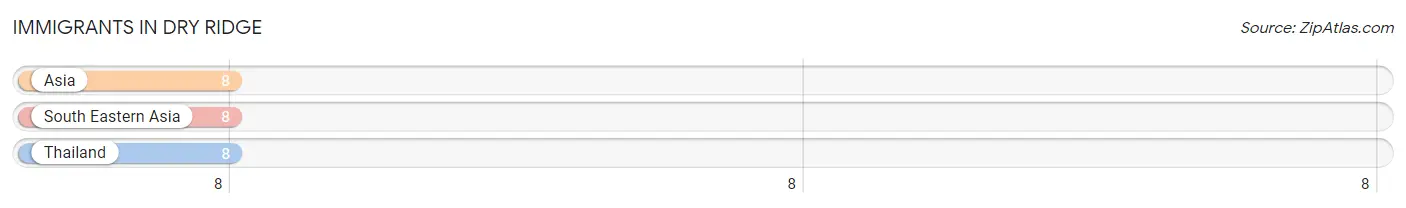
| Immigration Origin | # Population | % Population |
| Asia | 8 | 0.4% |
| South Eastern Asia | 8 | 0.4% |
| Thailand | 8 | 0.4% | View All 3 Rows |
Sex and Age in Dry Ridge
Sex and Age in Dry Ridge
The most populous age groups in Dry Ridge are Under 5 Years (114 | 12.1%) for men and 5 to 9 Years (153 | 11.9%) for women.
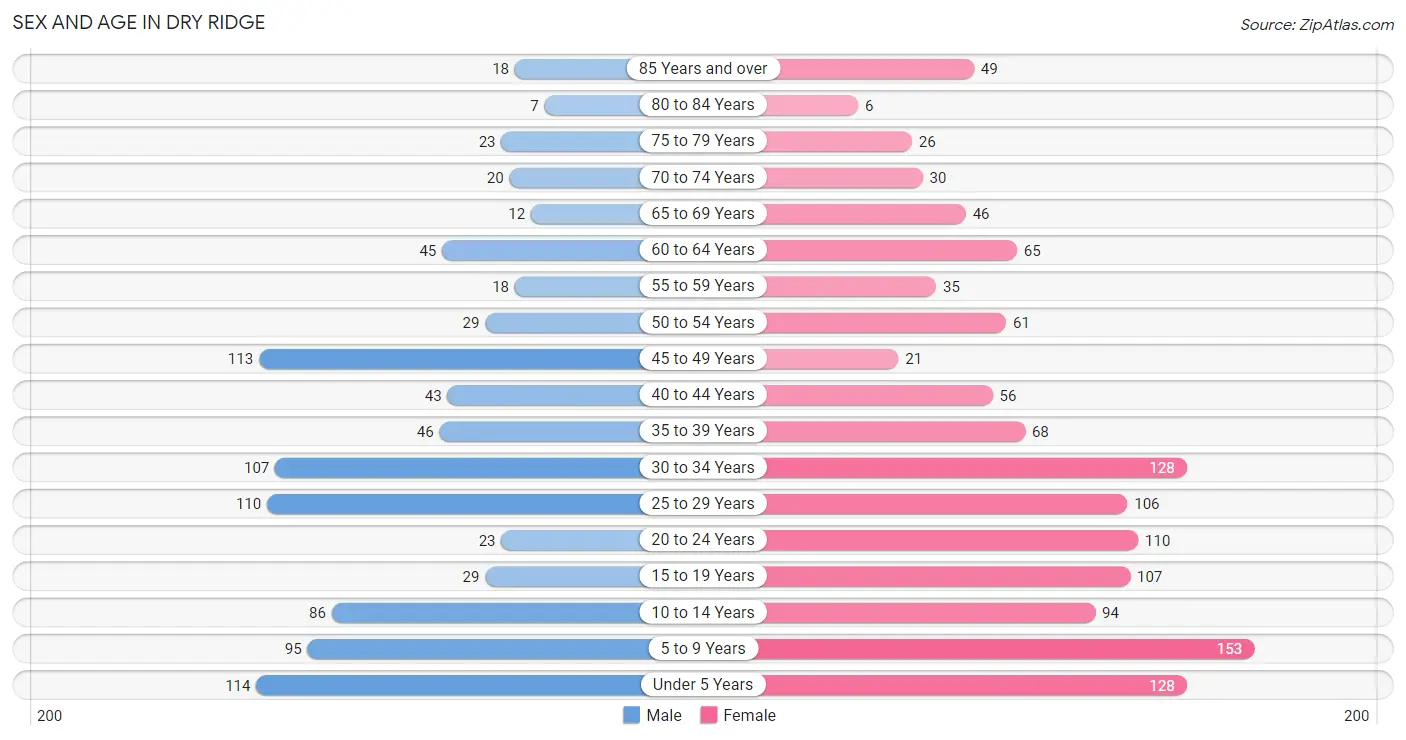
| Age Bracket | Male | Female |
| Under 5 Years | 114 (12.1%) | 128 (9.9%) |
| 5 to 9 Years | 95 (10.1%) | 153 (11.9%) |
| 10 to 14 Years | 86 (9.2%) | 94 (7.3%) |
| 15 to 19 Years | 29 (3.1%) | 107 (8.3%) |
| 20 to 24 Years | 23 (2.5%) | 110 (8.5%) |
| 25 to 29 Years | 110 (11.7%) | 106 (8.2%) |
| 30 to 34 Years | 107 (11.4%) | 128 (9.9%) |
| 35 to 39 Years | 46 (4.9%) | 68 (5.3%) |
| 40 to 44 Years | 43 (4.6%) | 56 (4.3%) |
| 45 to 49 Years | 113 (12.0%) | 21 (1.6%) |
| 50 to 54 Years | 29 (3.1%) | 61 (4.7%) |
| 55 to 59 Years | 18 (1.9%) | 35 (2.7%) |
| 60 to 64 Years | 45 (4.8%) | 65 (5.0%) |
| 65 to 69 Years | 12 (1.3%) | 46 (3.6%) |
| 70 to 74 Years | 20 (2.1%) | 30 (2.3%) |
| 75 to 79 Years | 23 (2.5%) | 26 (2.0%) |
| 80 to 84 Years | 7 (0.7%) | 6 (0.5%) |
| 85 Years and over | 18 (1.9%) | 49 (3.8%) |
| Total | 938 (100.0%) | 1,289 (100.0%) |
Families and Households in Dry Ridge
Median Family Size in Dry Ridge
The median family size in Dry Ridge is 3.10 persons per family, with single female/mother families (210 | 36.1%) accounting for the largest median family size of 3.3 persons per family. On the other hand, single male/father families (58 | 10.0%) represent the smallest median family size with 2.41 persons per family.
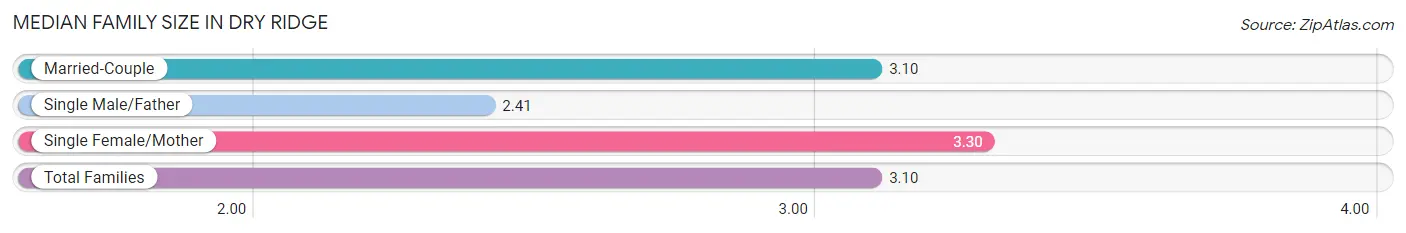
| Family Type | # Families | Family Size |
| Married-Couple | 314 (53.9%) | 3.10 |
| Single Male/Father | 58 (10.0%) | 2.41 |
| Single Female/Mother | 210 (36.1%) | 3.30 |
| Total Families | 582 (100.0%) | 3.10 |
Median Household Size in Dry Ridge
The median household size in Dry Ridge is 2.47 persons per household, with single female/mother households (210 | 23.3%) accounting for the largest median household size of 3.4 persons per household. non-family households (318 | 35.3%) represent the smallest median household size with 1.19 persons per household.
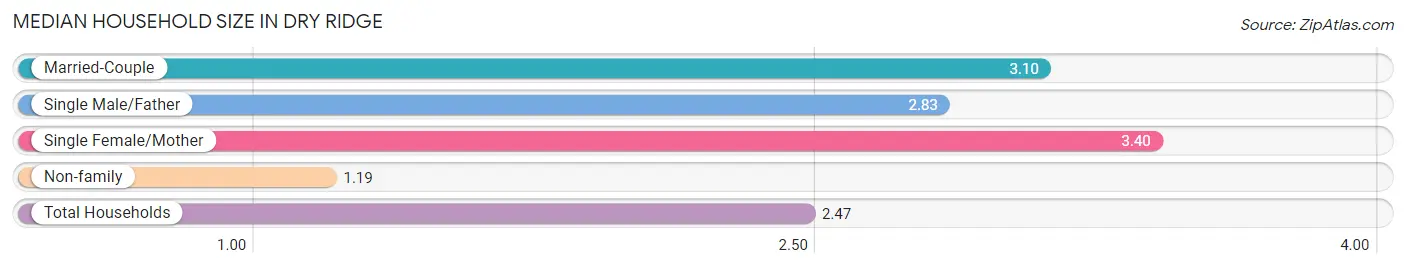
| Household Type | # Households | Household Size |
| Married-Couple | 314 (34.9%) | 3.10 |
| Single Male/Father | 58 (6.4%) | 2.83 |
| Single Female/Mother | 210 (23.3%) | 3.40 |
| Non-family | 318 (35.3%) | 1.19 |
| Total Households | 900 (100.0%) | 2.47 |
Household Size by Marriage Status in Dry Ridge
Out of a total of 900 households in Dry Ridge, 582 (64.7%) are family households, while 318 (35.3%) are nonfamily households. The most numerous type of family households are 2-person households, comprising 192, and the most common type of nonfamily households are 1-person households, comprising 295.
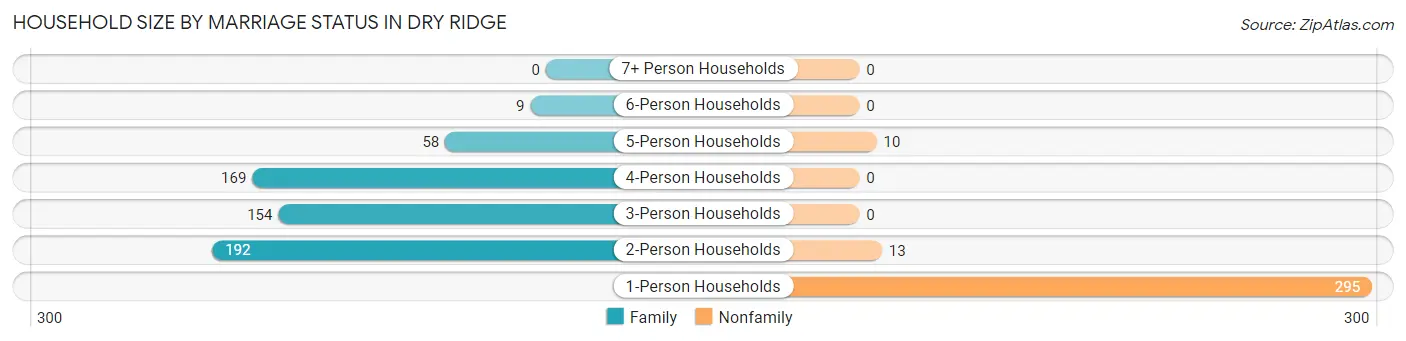
| Household Size | Family Households | Nonfamily Households |
| 1-Person Households | - | 295 (32.8%) |
| 2-Person Households | 192 (21.3%) | 13 (1.4%) |
| 3-Person Households | 154 (17.1%) | 0 (0.0%) |
| 4-Person Households | 169 (18.8%) | 0 (0.0%) |
| 5-Person Households | 58 (6.4%) | 10 (1.1%) |
| 6-Person Households | 9 (1.0%) | 0 (0.0%) |
| 7+ Person Households | 0 (0.0%) | 0 (0.0%) |
| Total | 582 (64.7%) | 318 (35.3%) |
Female Fertility in Dry Ridge
Fertility by Age in Dry Ridge
Average fertility rate in Dry Ridge is 20.0 births per 1,000 women. Women in the age bracket of 35 to 50 years have the highest fertility rate with 26.0 births per 1,000 women. Women in the age bracket of 20 to 34 years acount for 66.7% of all women with births.
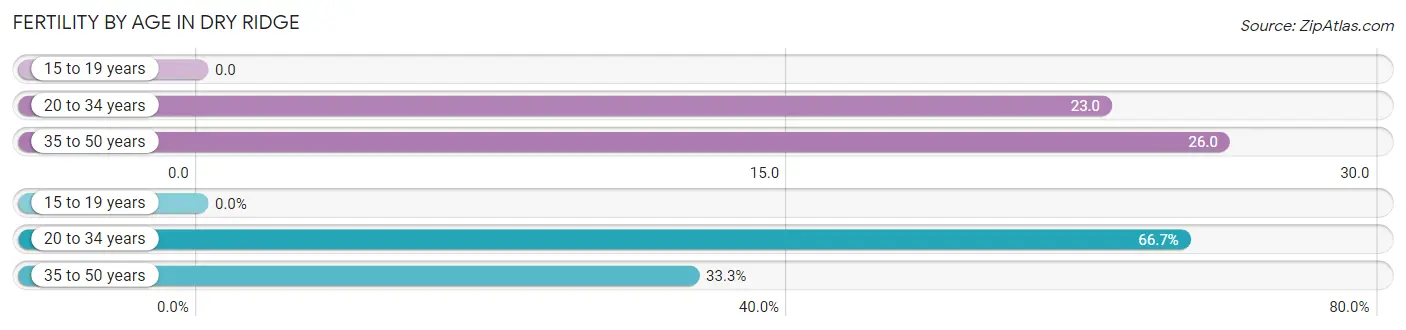
| Age Bracket | Women with Births | Births / 1,000 Women |
| 15 to 19 years | 0 (0.0%) | 0.0 |
| 20 to 34 years | 8 (66.7%) | 23.0 |
| 35 to 50 years | 4 (33.3%) | 26.0 |
| Total | 12 (100.0%) | 20.0 |
Fertility by Age by Marriage Status in Dry Ridge
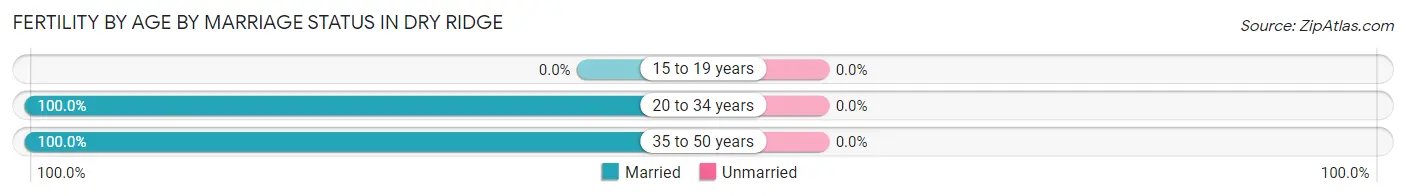
| Age Bracket | Married | Unmarried |
| 15 to 19 years | 0 (0.0%) | 0 (0.0%) |
| 20 to 34 years | 8 (100.0%) | 0 (0.0%) |
| 35 to 50 years | 4 (100.0%) | 0 (0.0%) |
| Total | 12 (100.0%) | 0 (0.0%) |
Fertility by Education in Dry Ridge
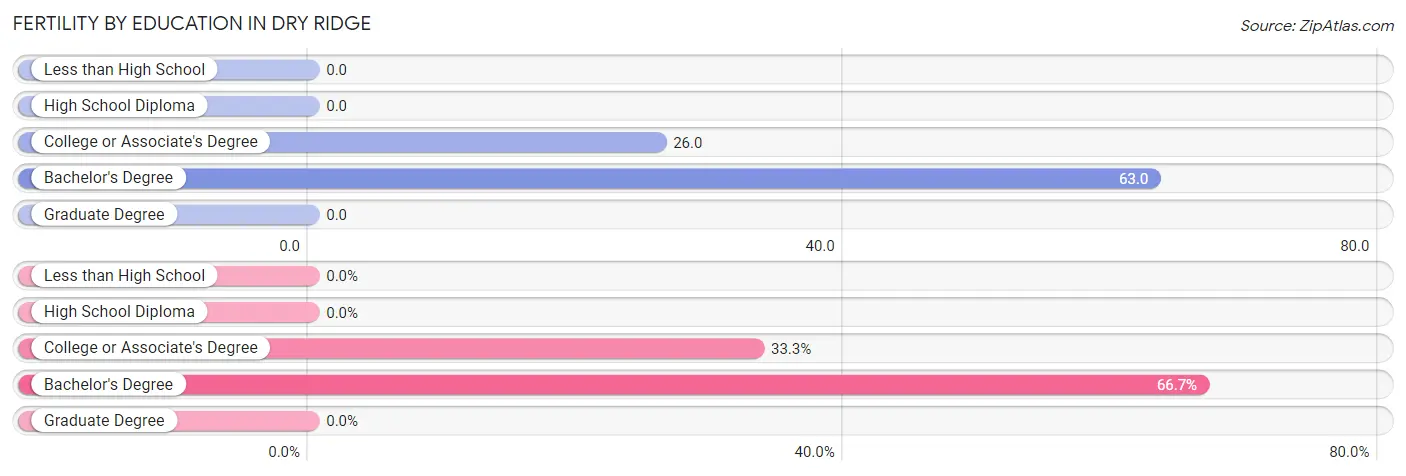
| Educational Attainment | Women with Births | Births / 1,000 Women |
| Less than High School | 0 (0.0%) | 0.0 |
| High School Diploma | 0 (0.0%) | 0.0 |
| College or Associate's Degree | 4 (33.3%) | 26.0 |
| Bachelor's Degree | 8 (66.7%) | 63.0 |
| Graduate Degree | 0 (0.0%) | 0.0 |
| Total | 12 (100.0%) | 20.0 |
Fertility by Education by Marriage Status in Dry Ridge
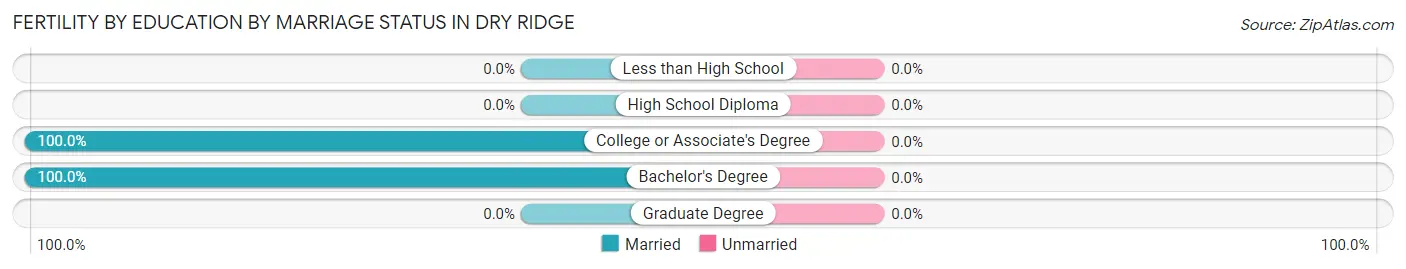
| Educational Attainment | Married | Unmarried |
| Less than High School | 0 (0.0%) | 0 (0.0%) |
| High School Diploma | 0 (0.0%) | 0 (0.0%) |
| College or Associate's Degree | 4 (100.0%) | 0 (0.0%) |
| Bachelor's Degree | 8 (100.0%) | 0 (0.0%) |
| Graduate Degree | 0 (0.0%) | 0 (0.0%) |
| Total | 12 (100.0%) | 0 (0.0%) |
Employment Characteristics in Dry Ridge
Employment by Class of Employer in Dry Ridge
Among the 827 employed individuals in Dry Ridge, private company employees (645 | 78.0%), not-for-profit organizations (73 | 8.8%), and local government employees (37 | 4.5%) make up the most common classes of employment.
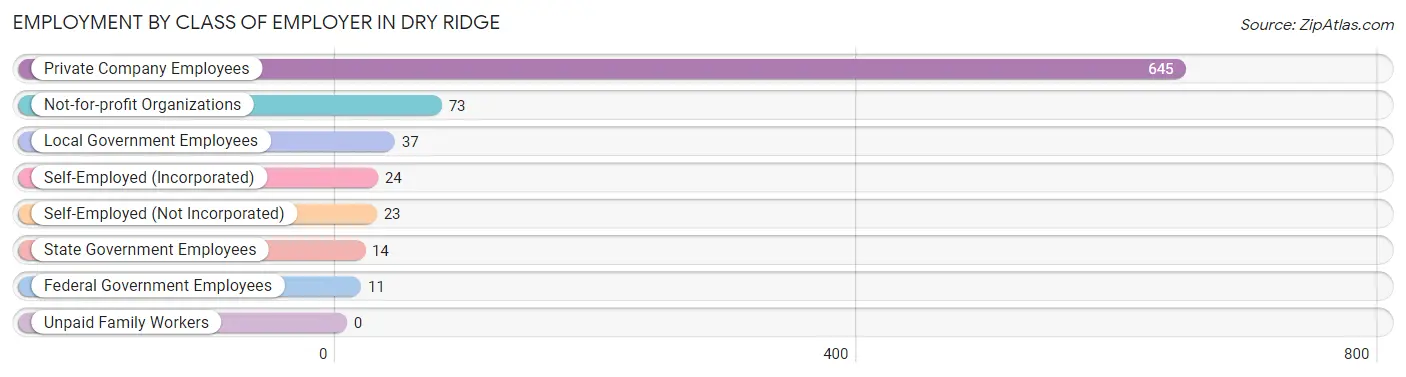
| Employer Class | # Employees | % Employees |
| Private Company Employees | 645 | 78.0% |
| Self-Employed (Incorporated) | 24 | 2.9% |
| Self-Employed (Not Incorporated) | 23 | 2.8% |
| Not-for-profit Organizations | 73 | 8.8% |
| Local Government Employees | 37 | 4.5% |
| State Government Employees | 14 | 1.7% |
| Federal Government Employees | 11 | 1.3% |
| Unpaid Family Workers | 0 | 0.0% |
| Total | 827 | 100.0% |
Employment Status by Age in Dry Ridge
According to the labor force statistics for Dry Ridge, out of the total population over 16 years of age (1,516), 60.4% or 916 individuals are in the labor force, with 5.8% or 53 of them unemployed. The age group with the highest labor force participation rate is 35 to 44 years, with 92.0% or 196 individuals in the labor force. Within the labor force, the 45 to 54 years age range has the highest percentage of unemployed individuals, with 12.8% or 19 of them being unemployed.
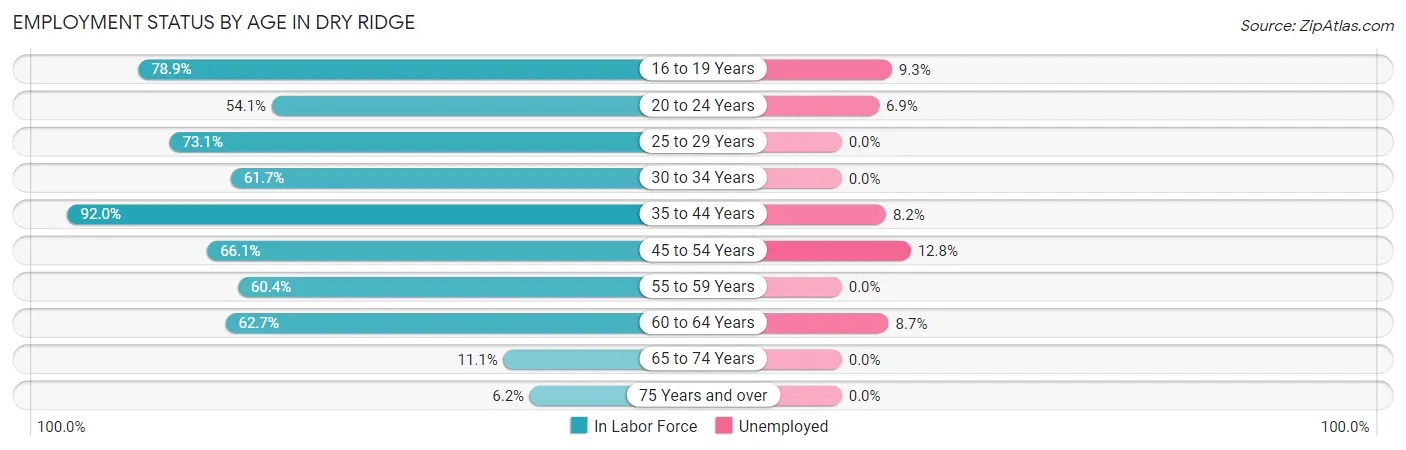
| Age Bracket | In Labor Force | Unemployed |
| 16 to 19 Years | 75 (78.9%) | 7 (9.3%) |
| 20 to 24 Years | 72 (54.1%) | 5 (6.9%) |
| 25 to 29 Years | 158 (73.1%) | 0 (0.0%) |
| 30 to 34 Years | 145 (61.7%) | 0 (0.0%) |
| 35 to 44 Years | 196 (92.0%) | 16 (8.2%) |
| 45 to 54 Years | 148 (66.1%) | 19 (12.8%) |
| 55 to 59 Years | 32 (60.4%) | 0 (0.0%) |
| 60 to 64 Years | 69 (62.7%) | 6 (8.7%) |
| 65 to 74 Years | 12 (11.1%) | 0 (0.0%) |
| 75 Years and over | 8 (6.2%) | 0 (0.0%) |
| Total | 916 (60.4%) | 53 (5.8%) |
Employment Status by Educational Attainment in Dry Ridge
According to labor force statistics for Dry Ridge, 71.2% of individuals (748) out of the total population between 25 and 64 years of age (1,051) are in the labor force, with 5.5% or 41 of them being unemployed. The group with the highest labor force participation rate are those with the educational attainment of bachelor's degree or higher, with 83.2% or 203 individuals in the labor force. Within the labor force, individuals with less than high school education have the highest percentage of unemployment, with 13.9% or 19 of them being unemployed.
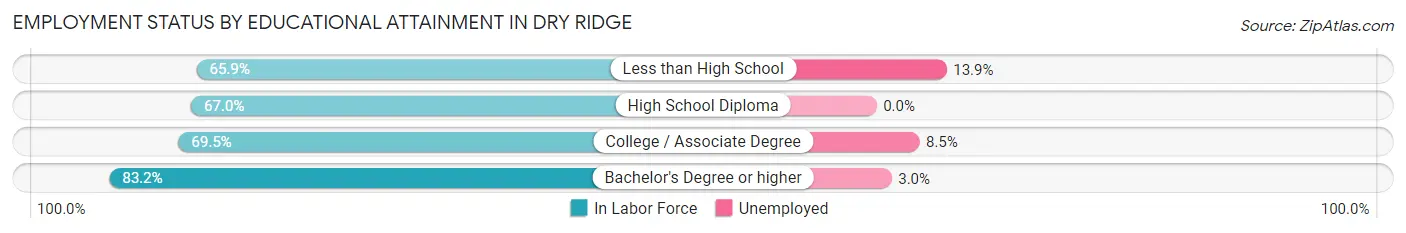
| Educational Attainment | In Labor Force | Unemployed |
| Less than High School | 137 (65.9%) | 29 (13.9%) |
| High School Diploma | 219 (67.0%) | 0 (0.0%) |
| College / Associate Degree | 189 (69.5%) | 23 (8.5%) |
| Bachelor's Degree or higher | 203 (83.2%) | 7 (3.0%) |
| Total | 748 (71.2%) | 58 (5.5%) |
Employment Occupations by Sex in Dry Ridge
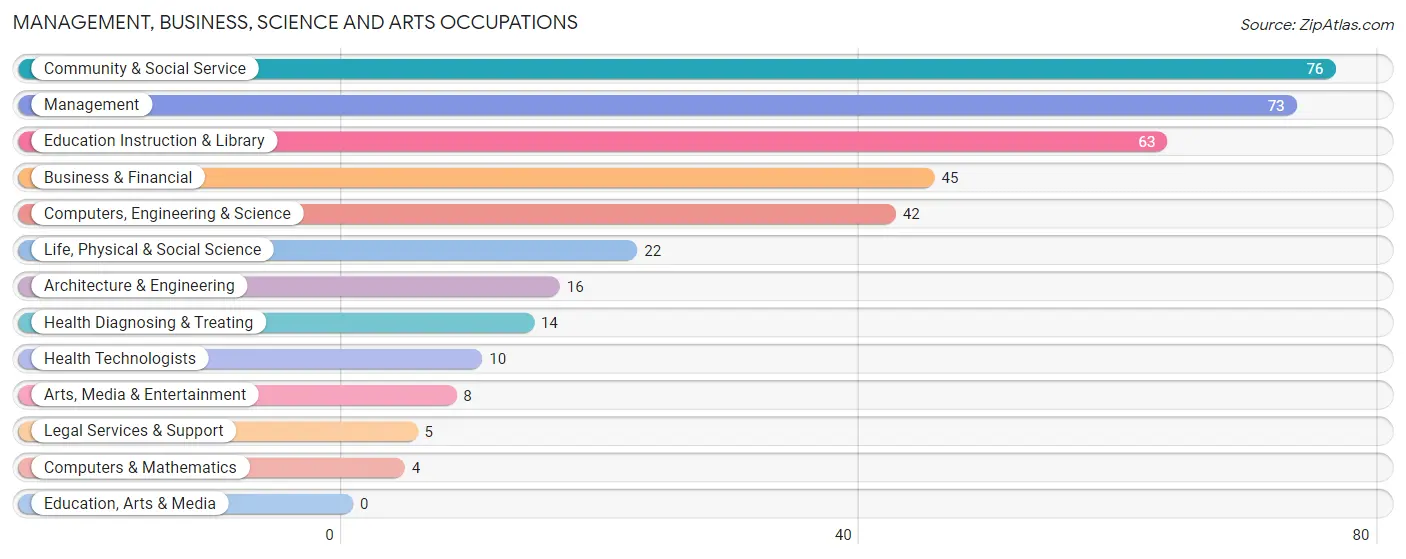
Management, Business, Science and Arts Occupations
The most common Management, Business, Science and Arts occupations in Dry Ridge are Community & Social Service (76 | 8.8%), Management (73 | 8.5%), Education Instruction & Library (63 | 7.3%), Business & Financial (45 | 5.2%), and Computers, Engineering & Science (42 | 4.9%).
Management, Business, Science and Arts Occupations by Sex
Within the Management, Business, Science and Arts occupations in Dry Ridge, the most male-oriented occupations are Computers & Mathematics (100.0%), Architecture & Engineering (100.0%), and Management (68.5%), while the most female-oriented occupations are Legal Services & Support (100.0%), Arts, Media & Entertainment (100.0%), and Health Diagnosing & Treating (100.0%).
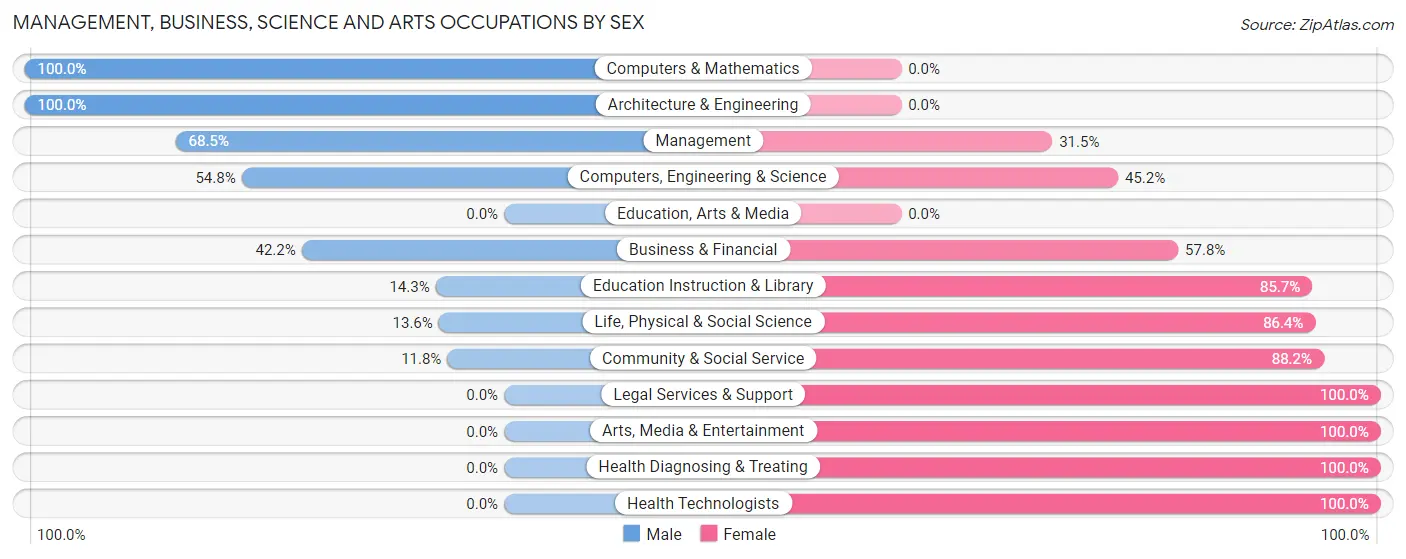
| Occupation | Male | Female |
| Management | 50 (68.5%) | 23 (31.5%) |
| Business & Financial | 19 (42.2%) | 26 (57.8%) |
| Computers, Engineering & Science | 23 (54.8%) | 19 (45.2%) |
| Computers & Mathematics | 4 (100.0%) | 0 (0.0%) |
| Architecture & Engineering | 16 (100.0%) | 0 (0.0%) |
| Life, Physical & Social Science | 3 (13.6%) | 19 (86.4%) |
| Community & Social Service | 9 (11.8%) | 67 (88.2%) |
| Education, Arts & Media | 0 (0.0%) | 0 (0.0%) |
| Legal Services & Support | 0 (0.0%) | 5 (100.0%) |
| Education Instruction & Library | 9 (14.3%) | 54 (85.7%) |
| Arts, Media & Entertainment | 0 (0.0%) | 8 (100.0%) |
| Health Diagnosing & Treating | 0 (0.0%) | 14 (100.0%) |
| Health Technologists | 0 (0.0%) | 10 (100.0%) |
| Total (Category) | 101 (40.4%) | 149 (59.6%) |
| Total (Overall) | 476 (55.2%) | 386 (44.8%) |
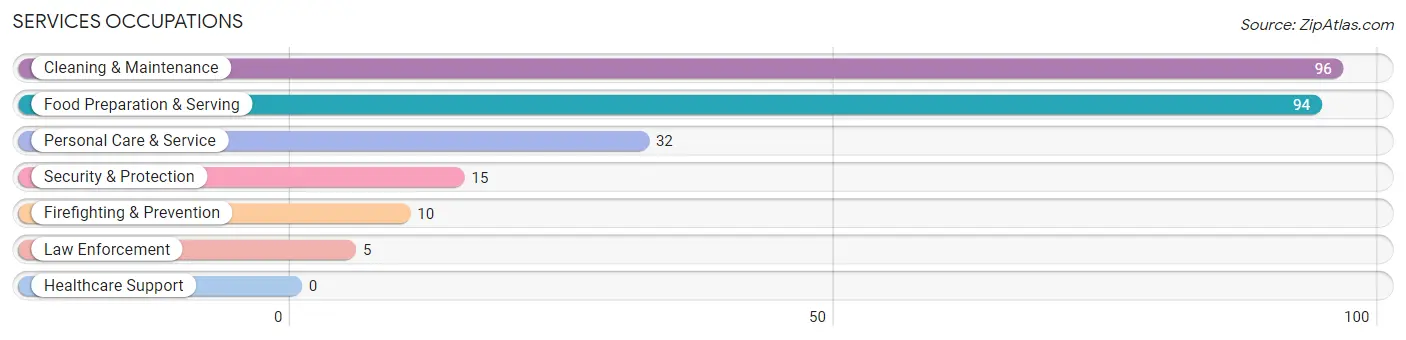
Services Occupations
The most common Services occupations in Dry Ridge are Cleaning & Maintenance (96 | 11.1%), Food Preparation & Serving (94 | 10.9%), Personal Care & Service (32 | 3.7%), Security & Protection (15 | 1.7%), and Firefighting & Prevention (10 | 1.2%).
Services Occupations by Sex
Within the Services occupations in Dry Ridge, the most male-oriented occupations are Law Enforcement (100.0%), Cleaning & Maintenance (94.8%), and Security & Protection (33.3%), while the most female-oriented occupations are Firefighting & Prevention (100.0%), Personal Care & Service (100.0%), and Food Preparation & Serving (96.8%).
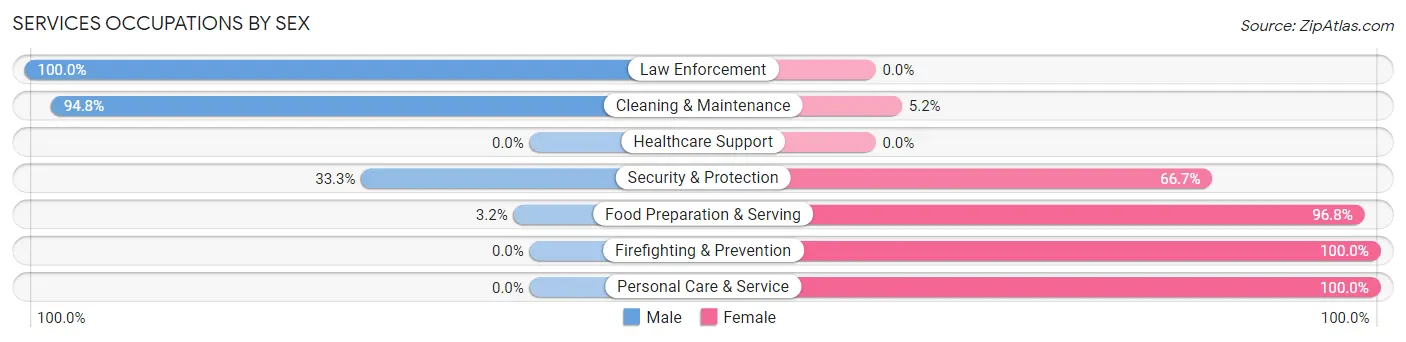
| Occupation | Male | Female |
| Healthcare Support | 0 (0.0%) | 0 (0.0%) |
| Security & Protection | 5 (33.3%) | 10 (66.7%) |
| Firefighting & Prevention | 0 (0.0%) | 10 (100.0%) |
| Law Enforcement | 5 (100.0%) | 0 (0.0%) |
| Food Preparation & Serving | 3 (3.2%) | 91 (96.8%) |
| Cleaning & Maintenance | 91 (94.8%) | 5 (5.2%) |
| Personal Care & Service | 0 (0.0%) | 32 (100.0%) |
| Total (Category) | 99 (41.8%) | 138 (58.2%) |
| Total (Overall) | 476 (55.2%) | 386 (44.8%) |
Sales and Office Occupations
The most common Sales and Office occupations in Dry Ridge are Office & Administration (69 | 8.0%), and Sales & Related (63 | 7.3%).

Sales and Office Occupations by Sex
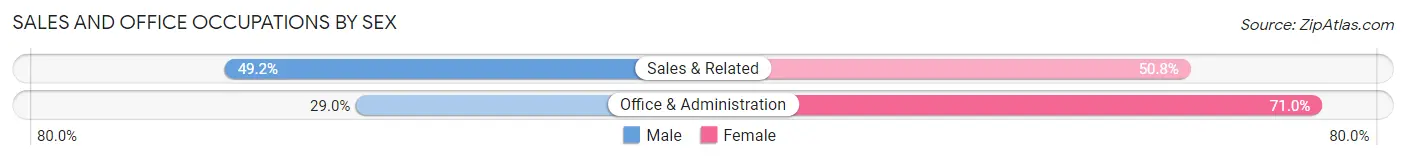
| Occupation | Male | Female |
| Sales & Related | 31 (49.2%) | 32 (50.8%) |
| Office & Administration | 20 (29.0%) | 49 (71.0%) |
| Total (Category) | 51 (38.6%) | 81 (61.4%) |
| Total (Overall) | 476 (55.2%) | 386 (44.8%) |
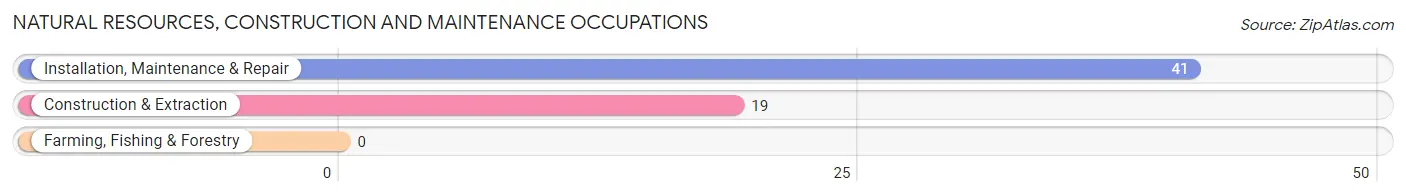
Natural Resources, Construction and Maintenance Occupations
The most common Natural Resources, Construction and Maintenance occupations in Dry Ridge are Installation, Maintenance & Repair (41 | 4.8%), and Construction & Extraction (19 | 2.2%).
Natural Resources, Construction and Maintenance Occupations by Sex
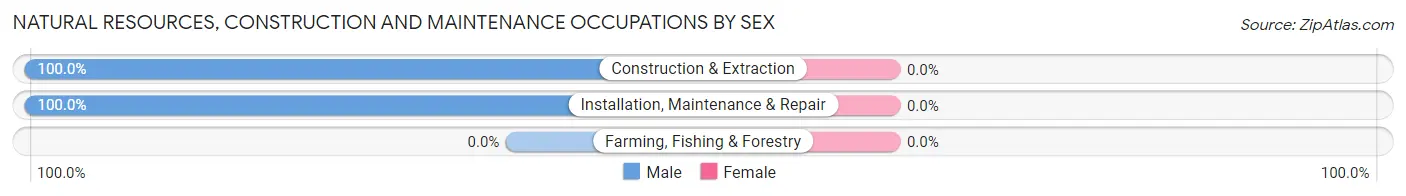
| Occupation | Male | Female |
| Farming, Fishing & Forestry | 0 (0.0%) | 0 (0.0%) |
| Construction & Extraction | 19 (100.0%) | 0 (0.0%) |
| Installation, Maintenance & Repair | 41 (100.0%) | 0 (0.0%) |
| Total (Category) | 60 (100.0%) | 0 (0.0%) |
| Total (Overall) | 476 (55.2%) | 386 (44.8%) |
Production, Transportation and Moving Occupations
The most common Production, Transportation and Moving occupations in Dry Ridge are Production (85 | 9.9%), Transportation (49 | 5.7%), and Material Moving (49 | 5.7%).
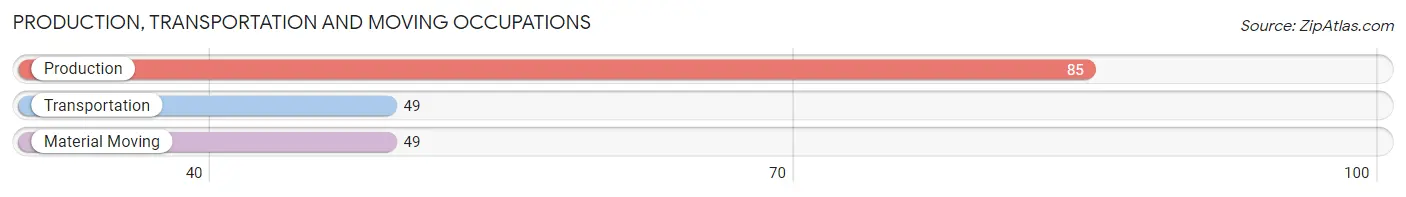
Production, Transportation and Moving Occupations by Sex
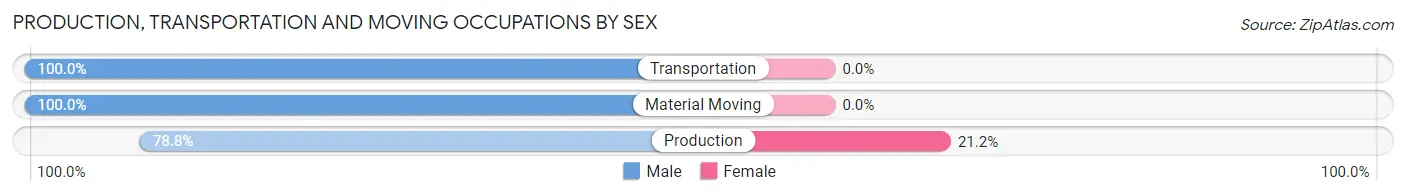
| Occupation | Male | Female |
| Production | 67 (78.8%) | 18 (21.2%) |
| Transportation | 49 (100.0%) | 0 (0.0%) |
| Material Moving | 49 (100.0%) | 0 (0.0%) |
| Total (Category) | 165 (90.2%) | 18 (9.8%) |
| Total (Overall) | 476 (55.2%) | 386 (44.8%) |
Employment Industries by Sex in Dry Ridge
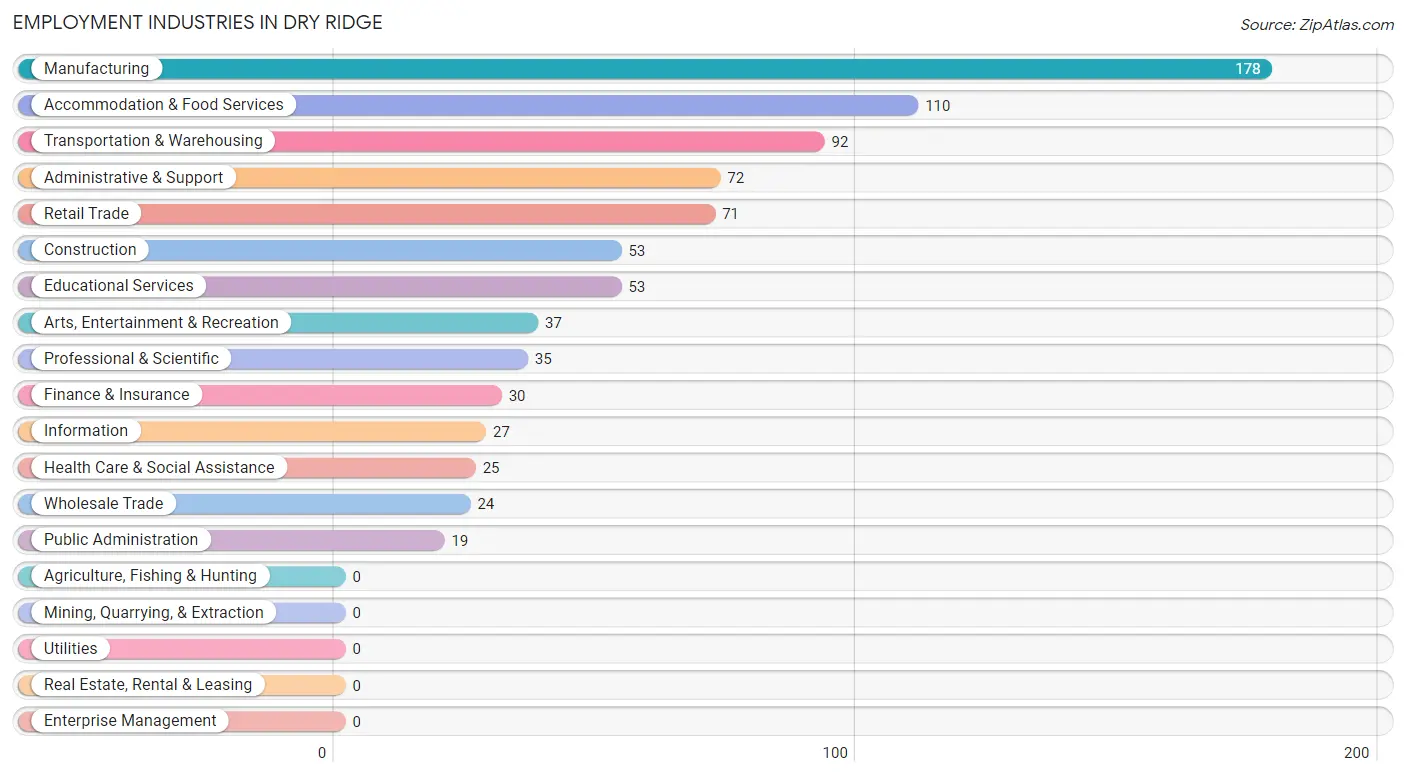
Employment Industries in Dry Ridge
The major employment industries in Dry Ridge include Manufacturing (178 | 20.6%), Accommodation & Food Services (110 | 12.8%), Transportation & Warehousing (92 | 10.7%), Administrative & Support (72 | 8.4%), and Retail Trade (71 | 8.2%).
Employment Industries by Sex in Dry Ridge
The Dry Ridge industries that see more men than women are Construction (100.0%), Administrative & Support (93.1%), and Professional & Scientific (85.7%), whereas the industries that tend to have a higher number of women are Information (100.0%), Health Care & Social Assistance (100.0%), and Accommodation & Food Services (83.6%).
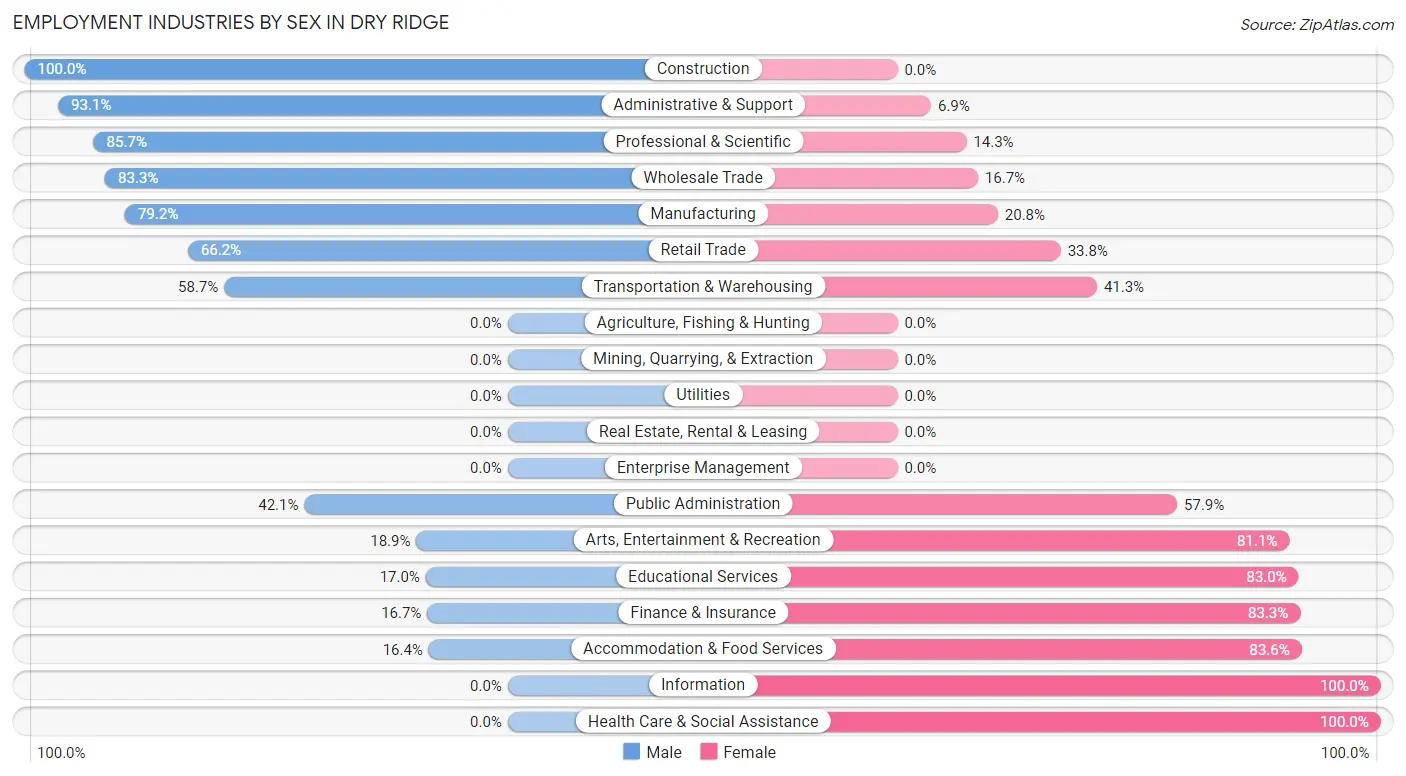
| Industry | Male | Female |
| Agriculture, Fishing & Hunting | 0 (0.0%) | 0 (0.0%) |
| Mining, Quarrying, & Extraction | 0 (0.0%) | 0 (0.0%) |
| Construction | 53 (100.0%) | 0 (0.0%) |
| Manufacturing | 141 (79.2%) | 37 (20.8%) |
| Wholesale Trade | 20 (83.3%) | 4 (16.7%) |
| Retail Trade | 47 (66.2%) | 24 (33.8%) |
| Transportation & Warehousing | 54 (58.7%) | 38 (41.3%) |
| Utilities | 0 (0.0%) | 0 (0.0%) |
| Information | 0 (0.0%) | 27 (100.0%) |
| Finance & Insurance | 5 (16.7%) | 25 (83.3%) |
| Real Estate, Rental & Leasing | 0 (0.0%) | 0 (0.0%) |
| Professional & Scientific | 30 (85.7%) | 5 (14.3%) |
| Enterprise Management | 0 (0.0%) | 0 (0.0%) |
| Administrative & Support | 67 (93.1%) | 5 (6.9%) |
| Educational Services | 9 (17.0%) | 44 (83.0%) |
| Health Care & Social Assistance | 0 (0.0%) | 25 (100.0%) |
| Arts, Entertainment & Recreation | 7 (18.9%) | 30 (81.1%) |
| Accommodation & Food Services | 18 (16.4%) | 92 (83.6%) |
| Public Administration | 8 (42.1%) | 11 (57.9%) |
| Total | 476 (55.2%) | 386 (44.8%) |
Education in Dry Ridge
School Enrollment in Dry Ridge
The most common levels of schooling among the 636 students in Dry Ridge are elementary school (238 | 37.4%), middle school (123 | 19.3%), and high school (98 | 15.4%).
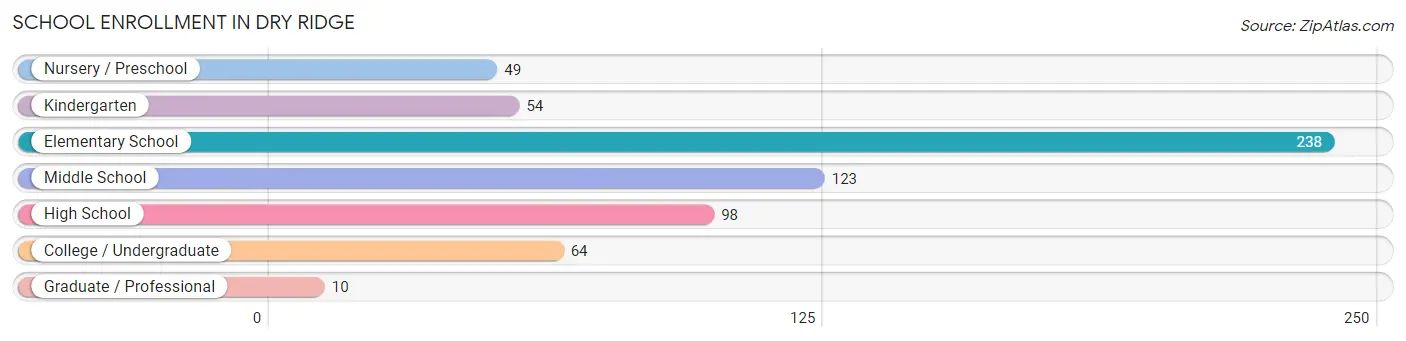
| School Level | # Students | % Students |
| Nursery / Preschool | 49 | 7.7% |
| Kindergarten | 54 | 8.5% |
| Elementary School | 238 | 37.4% |
| Middle School | 123 | 19.3% |
| High School | 98 | 15.4% |
| College / Undergraduate | 64 | 10.1% |
| Graduate / Professional | 10 | 1.6% |
| Total | 636 | 100.0% |
School Enrollment by Age by Funding Source in Dry Ridge
Out of a total of 636 students who are enrolled in schools in Dry Ridge, 49 (7.7%) attend a private institution, while the remaining 587 (92.3%) are enrolled in public schools. The age group of 15 to 17 year olds has the highest likelihood of being enrolled in private schools, with 18 (26.5% in the age bracket) enrolled. Conversely, the age group of 18 to 19 year olds has the lowest likelihood of being enrolled in a private school, with 57 (100.0% in the age bracket) attending a public institution.
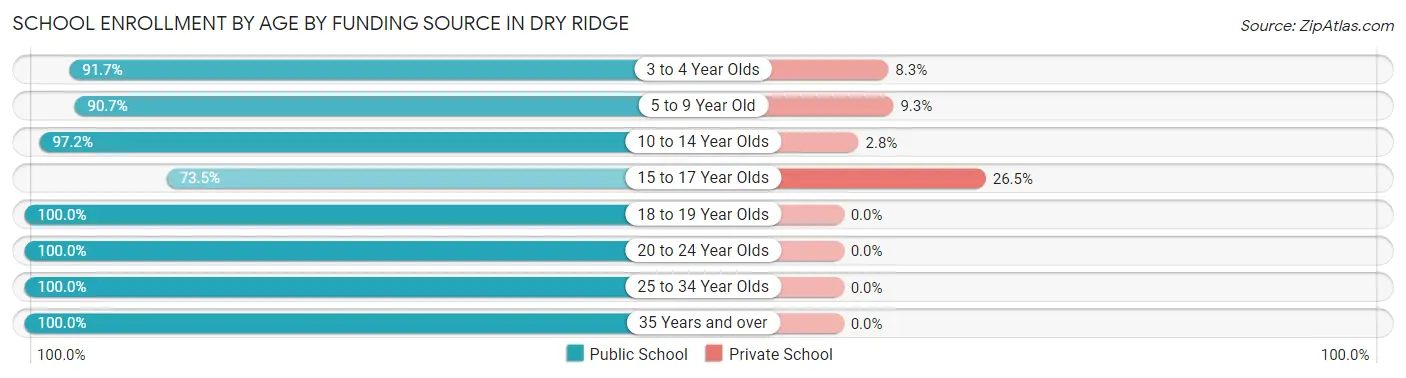
| Age Bracket | Public School | Private School |
| 3 to 4 Year Olds | 33 (91.7%) | 3 (8.3%) |
| 5 to 9 Year Old | 225 (90.7%) | 23 (9.3%) |
| 10 to 14 Year Olds | 175 (97.2%) | 5 (2.8%) |
| 15 to 17 Year Olds | 50 (73.5%) | 18 (26.5%) |
| 18 to 19 Year Olds | 57 (100.0%) | 0 (0.0%) |
| 20 to 24 Year Olds | 37 (100.0%) | 0 (0.0%) |
| 25 to 34 Year Olds | 5 (100.0%) | 0 (0.0%) |
| 35 Years and over | 5 (100.0%) | 0 (0.0%) |
| Total | 587 (92.3%) | 49 (7.7%) |
Educational Attainment by Field of Study in Dry Ridge
Arts & humanities (84 | 29.5%), education (43 | 15.1%), business (35 | 12.3%), bio, nature & agricultural (34 | 11.9%), and science & technology (27 | 9.5%) are the most common fields of study among 285 individuals in Dry Ridge who have obtained a bachelor's degree or higher.
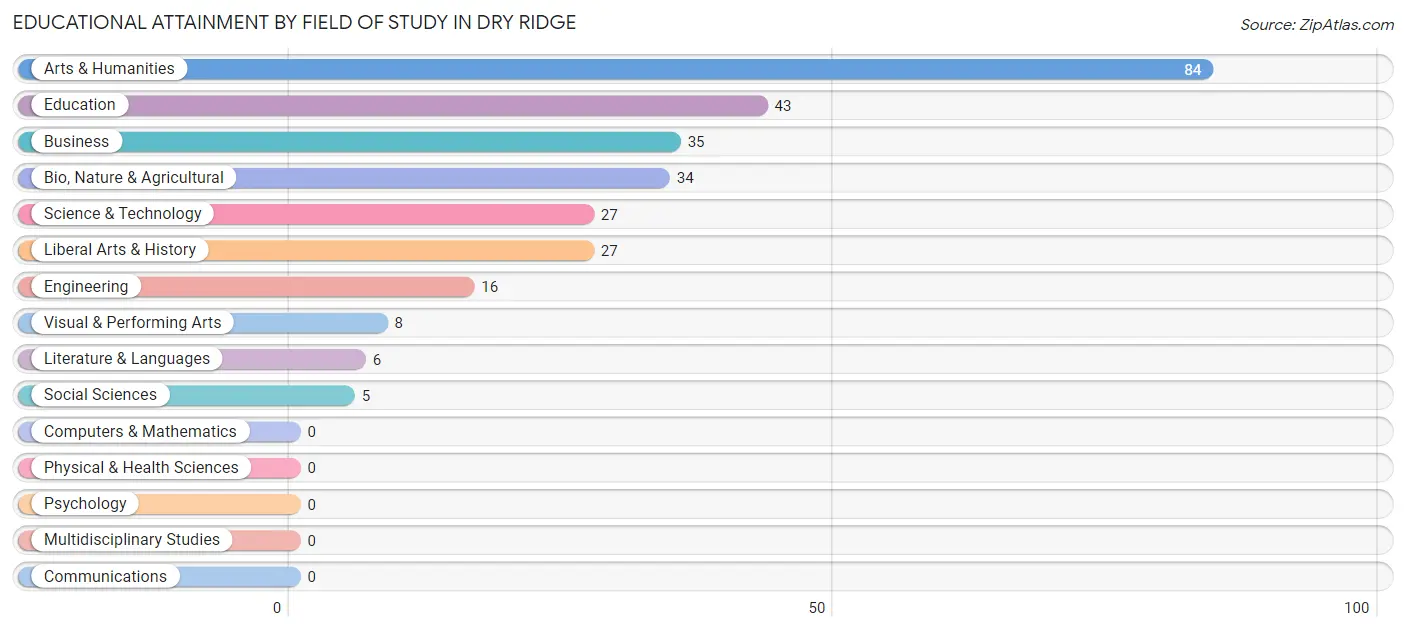
| Field of Study | # Graduates | % Graduates |
| Computers & Mathematics | 0 | 0.0% |
| Bio, Nature & Agricultural | 34 | 11.9% |
| Physical & Health Sciences | 0 | 0.0% |
| Psychology | 0 | 0.0% |
| Social Sciences | 5 | 1.8% |
| Engineering | 16 | 5.6% |
| Multidisciplinary Studies | 0 | 0.0% |
| Science & Technology | 27 | 9.5% |
| Business | 35 | 12.3% |
| Education | 43 | 15.1% |
| Literature & Languages | 6 | 2.1% |
| Liberal Arts & History | 27 | 9.5% |
| Visual & Performing Arts | 8 | 2.8% |
| Communications | 0 | 0.0% |
| Arts & Humanities | 84 | 29.5% |
| Total | 285 | 100.0% |
Transportation & Commute in Dry Ridge
Vehicle Availability by Sex in Dry Ridge
The most prevalent vehicle ownership categories in Dry Ridge are males with 2 vehicles (179, accounting for 37.6%) and females with 2 vehicles (129, making up 51.0%).
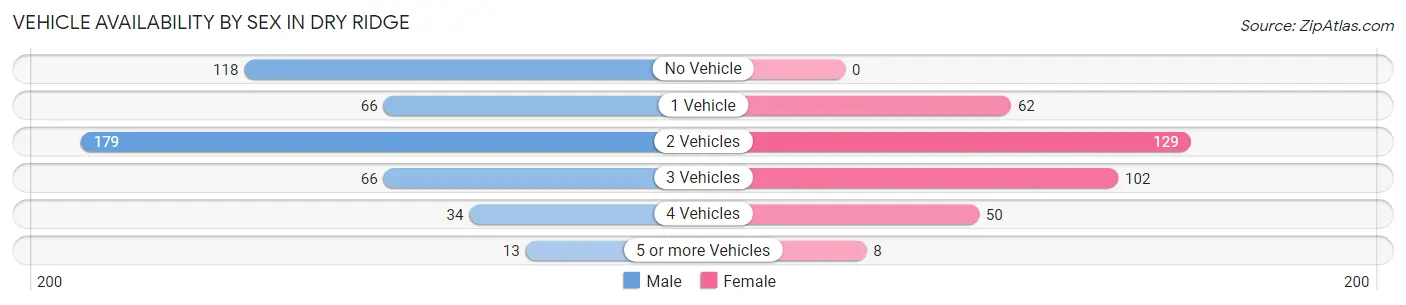
| Vehicles Available | Male | Female |
| No Vehicle | 118 (24.8%) | 0 (0.0%) |
| 1 Vehicle | 66 (13.9%) | 62 (17.7%) |
| 2 Vehicles | 179 (37.6%) | 129 (36.7%) |
| 3 Vehicles | 66 (13.9%) | 102 (29.1%) |
| 4 Vehicles | 34 (7.1%) | 50 (14.2%) |
| 5 or more Vehicles | 13 (2.7%) | 8 (2.3%) |
| Total | 476 (100.0%) | 351 (100.0%) |
Commute Time in Dry Ridge
The most frequently occuring commute durations in Dry Ridge are 5 to 9 minutes (163 commuters, 20.7%), 30 to 34 minutes (99 commuters, 12.6%), and 10 to 14 minutes (88 commuters, 11.2%).
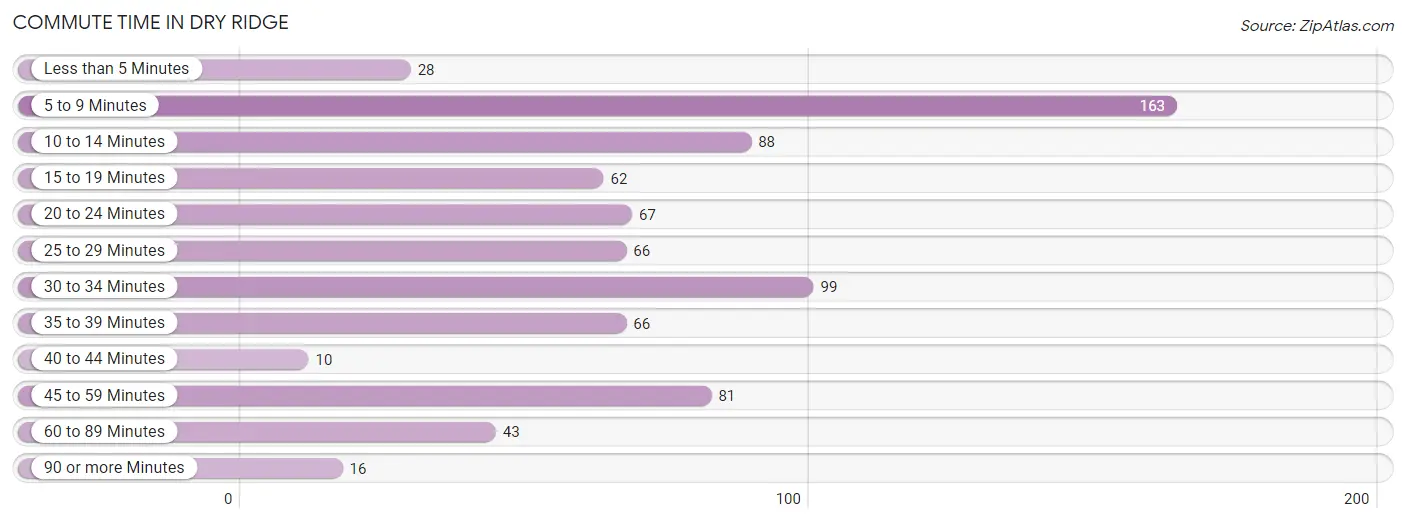
| Commute Time | # Commuters | % Commuters |
| Less than 5 Minutes | 28 | 3.5% |
| 5 to 9 Minutes | 163 | 20.7% |
| 10 to 14 Minutes | 88 | 11.2% |
| 15 to 19 Minutes | 62 | 7.9% |
| 20 to 24 Minutes | 67 | 8.5% |
| 25 to 29 Minutes | 66 | 8.4% |
| 30 to 34 Minutes | 99 | 12.6% |
| 35 to 39 Minutes | 66 | 8.4% |
| 40 to 44 Minutes | 10 | 1.3% |
| 45 to 59 Minutes | 81 | 10.3% |
| 60 to 89 Minutes | 43 | 5.4% |
| 90 or more Minutes | 16 | 2.0% |
Commute Time by Sex in Dry Ridge
The most common commute times in Dry Ridge are 5 to 9 minutes (116 commuters, 25.7%) for males and 10 to 14 minutes (74 commuters, 21.9%) for females.
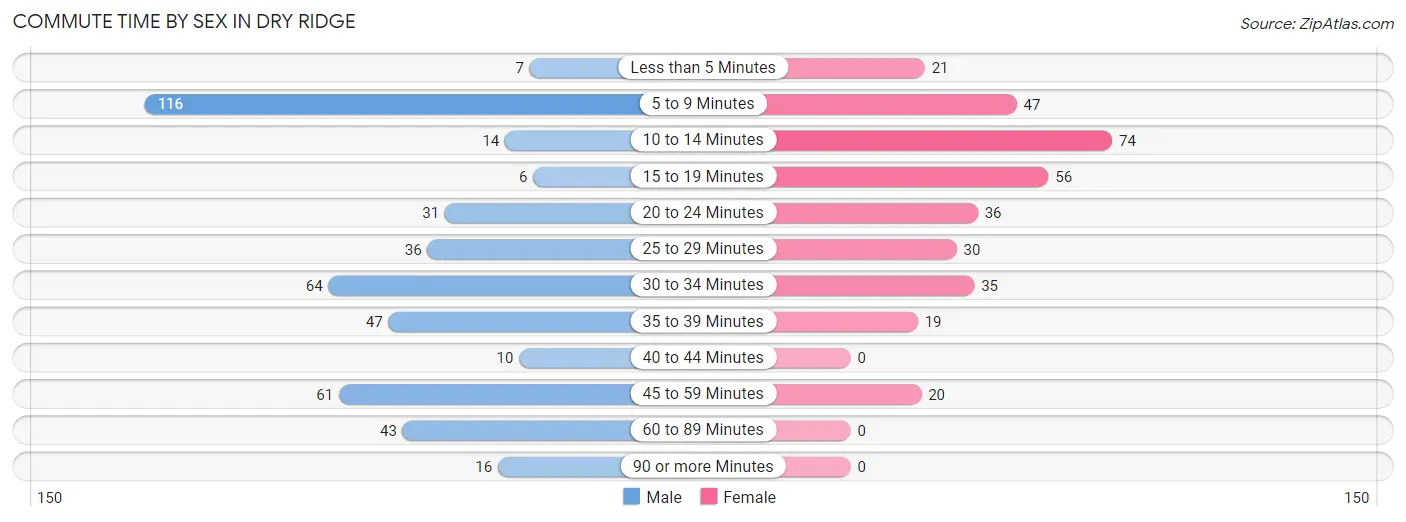
| Commute Time | Male | Female |
| Less than 5 Minutes | 7 (1.5%) | 21 (6.2%) |
| 5 to 9 Minutes | 116 (25.7%) | 47 (13.9%) |
| 10 to 14 Minutes | 14 (3.1%) | 74 (21.9%) |
| 15 to 19 Minutes | 6 (1.3%) | 56 (16.6%) |
| 20 to 24 Minutes | 31 (6.9%) | 36 (10.6%) |
| 25 to 29 Minutes | 36 (8.0%) | 30 (8.9%) |
| 30 to 34 Minutes | 64 (14.2%) | 35 (10.4%) |
| 35 to 39 Minutes | 47 (10.4%) | 19 (5.6%) |
| 40 to 44 Minutes | 10 (2.2%) | 0 (0.0%) |
| 45 to 59 Minutes | 61 (13.5%) | 20 (5.9%) |
| 60 to 89 Minutes | 43 (9.5%) | 0 (0.0%) |
| 90 or more Minutes | 16 (3.5%) | 0 (0.0%) |
Time of Departure to Work by Sex in Dry Ridge
The most frequent times of departure to work in Dry Ridge are 7:00 AM to 7:29 AM (136, 30.2%) for males and 4:00 PM to 11:59 PM (83, 24.6%) for females.
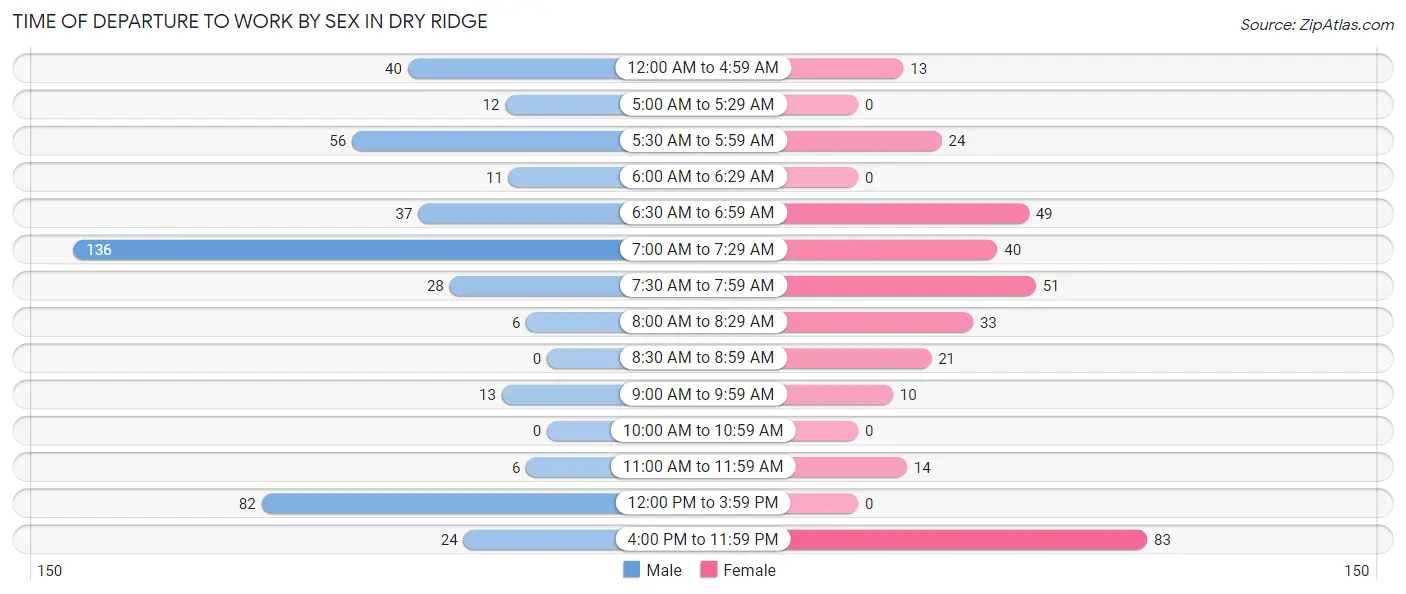
| Time of Departure | Male | Female |
| 12:00 AM to 4:59 AM | 40 (8.9%) | 13 (3.8%) |
| 5:00 AM to 5:29 AM | 12 (2.7%) | 0 (0.0%) |
| 5:30 AM to 5:59 AM | 56 (12.4%) | 24 (7.1%) |
| 6:00 AM to 6:29 AM | 11 (2.4%) | 0 (0.0%) |
| 6:30 AM to 6:59 AM | 37 (8.2%) | 49 (14.5%) |
| 7:00 AM to 7:29 AM | 136 (30.2%) | 40 (11.8%) |
| 7:30 AM to 7:59 AM | 28 (6.2%) | 51 (15.1%) |
| 8:00 AM to 8:29 AM | 6 (1.3%) | 33 (9.8%) |
| 8:30 AM to 8:59 AM | 0 (0.0%) | 21 (6.2%) |
| 9:00 AM to 9:59 AM | 13 (2.9%) | 10 (3.0%) |
| 10:00 AM to 10:59 AM | 0 (0.0%) | 0 (0.0%) |
| 11:00 AM to 11:59 AM | 6 (1.3%) | 14 (4.1%) |
| 12:00 PM to 3:59 PM | 82 (18.2%) | 0 (0.0%) |
| 4:00 PM to 11:59 PM | 24 (5.3%) | 83 (24.6%) |
| Total | 451 (100.0%) | 338 (100.0%) |
Housing Occupancy in Dry Ridge
Occupancy by Ownership in Dry Ridge
Of the total 900 dwellings in Dry Ridge, owner-occupied units account for 383 (42.6%), while renter-occupied units make up 517 (57.4%).
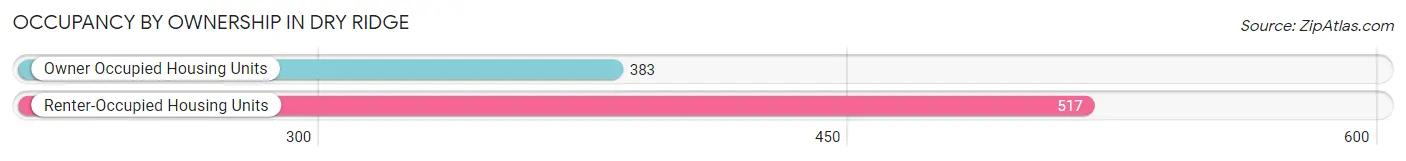
| Occupancy | # Housing Units | % Housing Units |
| Owner Occupied Housing Units | 383 | 42.6% |
| Renter-Occupied Housing Units | 517 | 57.4% |
| Total Occupied Housing Units | 900 | 100.0% |
Occupancy by Household Size in Dry Ridge
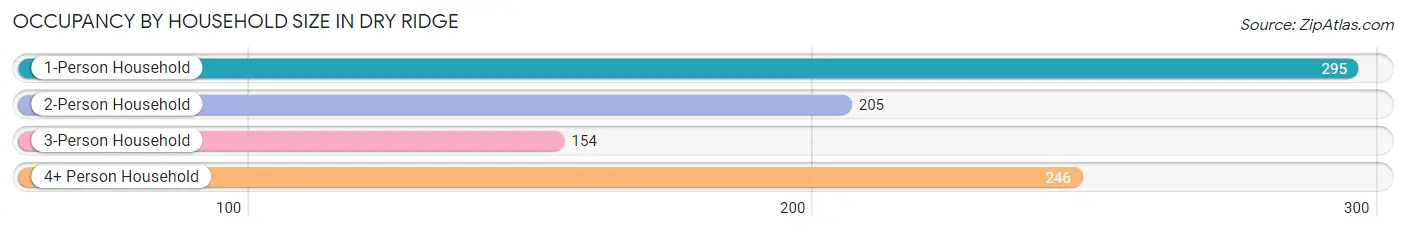
| Household Size | # Housing Units | % Housing Units |
| 1-Person Household | 295 | 32.8% |
| 2-Person Household | 205 | 22.8% |
| 3-Person Household | 154 | 17.1% |
| 4+ Person Household | 246 | 27.3% |
| Total Housing Units | 900 | 100.0% |
Occupancy by Ownership by Household Size in Dry Ridge
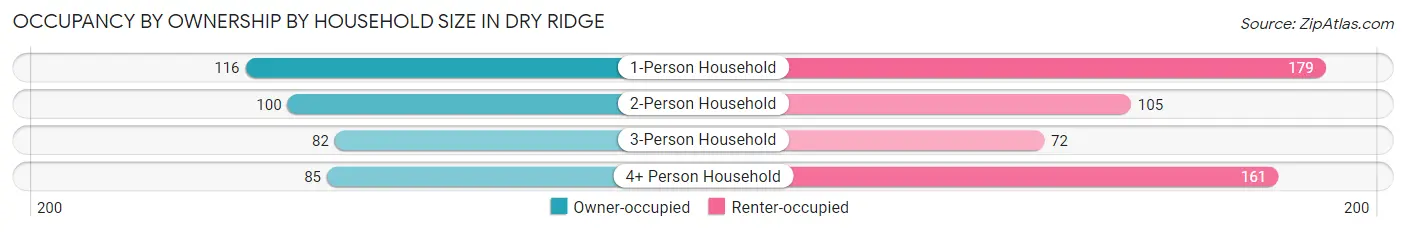
| Household Size | Owner-occupied | Renter-occupied |
| 1-Person Household | 116 (39.3%) | 179 (60.7%) |
| 2-Person Household | 100 (48.8%) | 105 (51.2%) |
| 3-Person Household | 82 (53.2%) | 72 (46.8%) |
| 4+ Person Household | 85 (34.5%) | 161 (65.4%) |
| Total Housing Units | 383 (42.6%) | 517 (57.4%) |
Occupancy by Educational Attainment in Dry Ridge
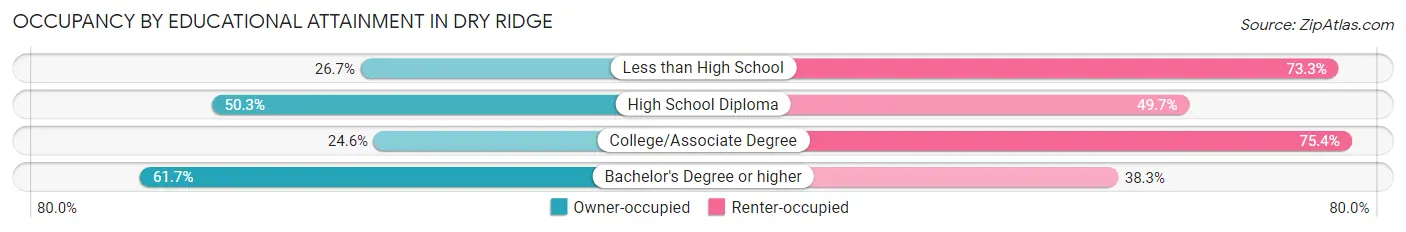
| Household Size | Owner-occupied | Renter-occupied |
| Less than High School | 52 (26.7%) | 143 (73.3%) |
| High School Diploma | 153 (50.3%) | 151 (49.7%) |
| College/Associate Degree | 46 (24.6%) | 141 (75.4%) |
| Bachelor's Degree or higher | 132 (61.7%) | 82 (38.3%) |
Occupancy by Age of Householder in Dry Ridge
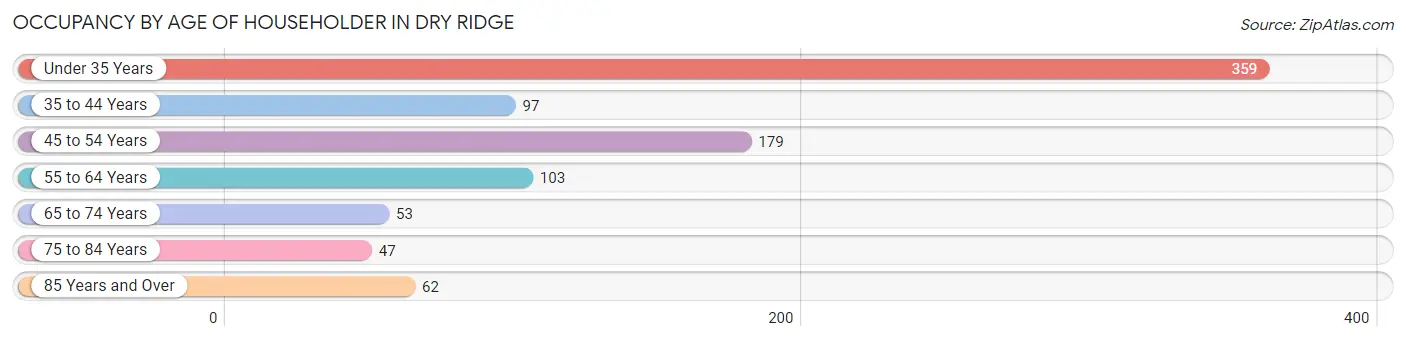
| Age Bracket | # Households | % Households |
| Under 35 Years | 359 | 39.9% |
| 35 to 44 Years | 97 | 10.8% |
| 45 to 54 Years | 179 | 19.9% |
| 55 to 64 Years | 103 | 11.4% |
| 65 to 74 Years | 53 | 5.9% |
| 75 to 84 Years | 47 | 5.2% |
| 85 Years and Over | 62 | 6.9% |
| Total | 900 | 100.0% |
Housing Finances in Dry Ridge
Median Income by Occupancy in Dry Ridge
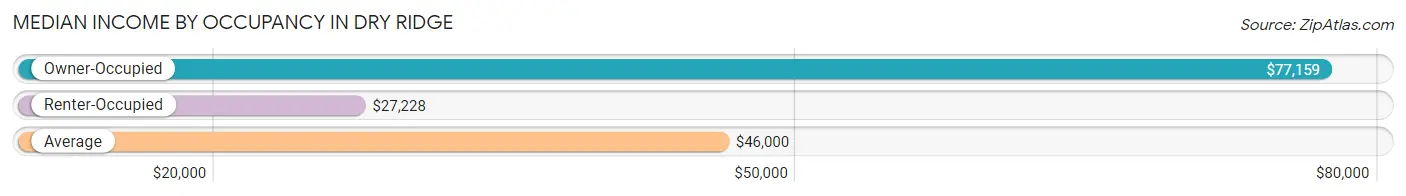
| Occupancy Type | # Households | Median Income |
| Owner-Occupied | 383 (42.6%) | $77,159 |
| Renter-Occupied | 517 (57.4%) | $27,228 |
| Average | 900 (100.0%) | $46,000 |
Occupancy by Householder Income Bracket in Dry Ridge
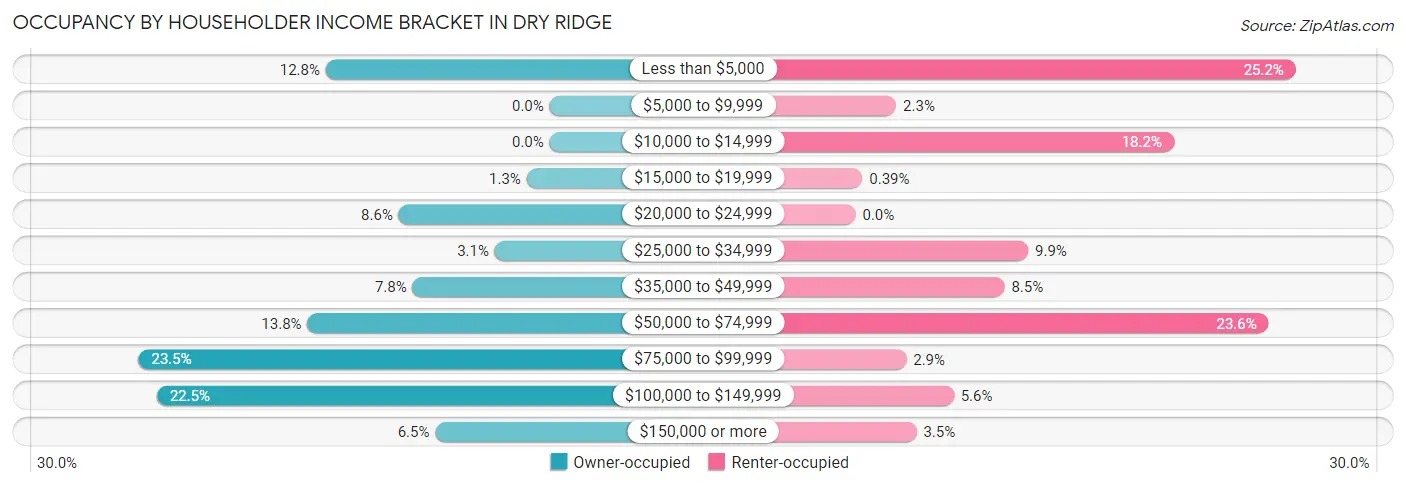
| Income Bracket | Owner-occupied | Renter-occupied |
| Less than $5,000 | 49 (12.8%) | 130 (25.2%) |
| $5,000 to $9,999 | 0 (0.0%) | 12 (2.3%) |
| $10,000 to $14,999 | 0 (0.0%) | 94 (18.2%) |
| $15,000 to $19,999 | 5 (1.3%) | 2 (0.4%) |
| $20,000 to $24,999 | 33 (8.6%) | 0 (0.0%) |
| $25,000 to $34,999 | 12 (3.1%) | 51 (9.9%) |
| $35,000 to $49,999 | 30 (7.8%) | 44 (8.5%) |
| $50,000 to $74,999 | 53 (13.8%) | 122 (23.6%) |
| $75,000 to $99,999 | 90 (23.5%) | 15 (2.9%) |
| $100,000 to $149,999 | 86 (22.5%) | 29 (5.6%) |
| $150,000 or more | 25 (6.5%) | 18 (3.5%) |
| Total | 383 (100.0%) | 517 (100.0%) |
Monthly Housing Cost Tiers in Dry Ridge
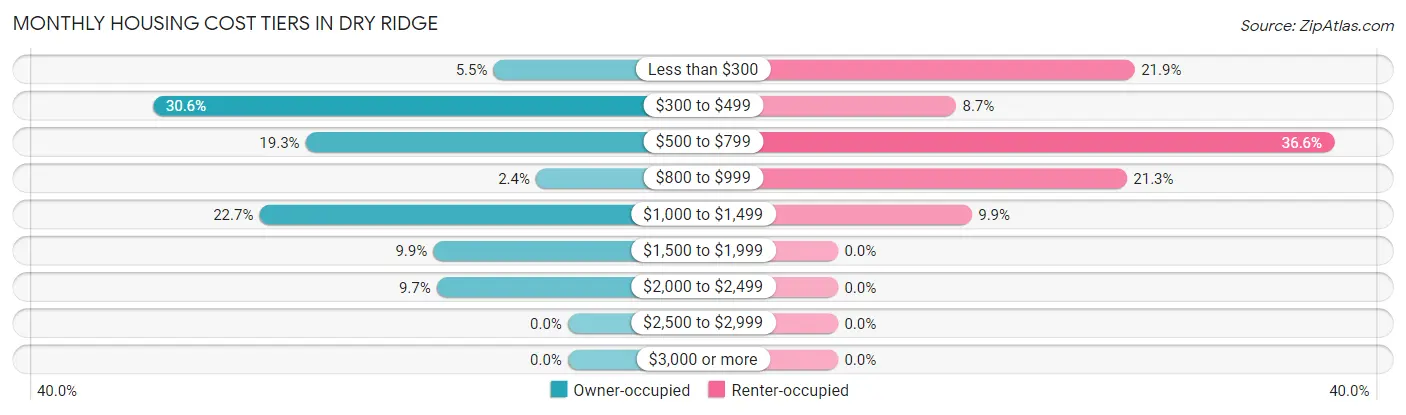
| Monthly Cost | Owner-occupied | Renter-occupied |
| Less than $300 | 21 (5.5%) | 113 (21.9%) |
| $300 to $499 | 117 (30.5%) | 45 (8.7%) |
| $500 to $799 | 74 (19.3%) | 189 (36.6%) |
| $800 to $999 | 9 (2.4%) | 110 (21.3%) |
| $1,000 to $1,499 | 87 (22.7%) | 51 (9.9%) |
| $1,500 to $1,999 | 38 (9.9%) | 0 (0.0%) |
| $2,000 to $2,499 | 37 (9.7%) | 0 (0.0%) |
| $2,500 to $2,999 | 0 (0.0%) | 0 (0.0%) |
| $3,000 or more | 0 (0.0%) | 0 (0.0%) |
| Total | 383 (100.0%) | 517 (100.0%) |
Physical Housing Characteristics in Dry Ridge
Housing Structures in Dry Ridge
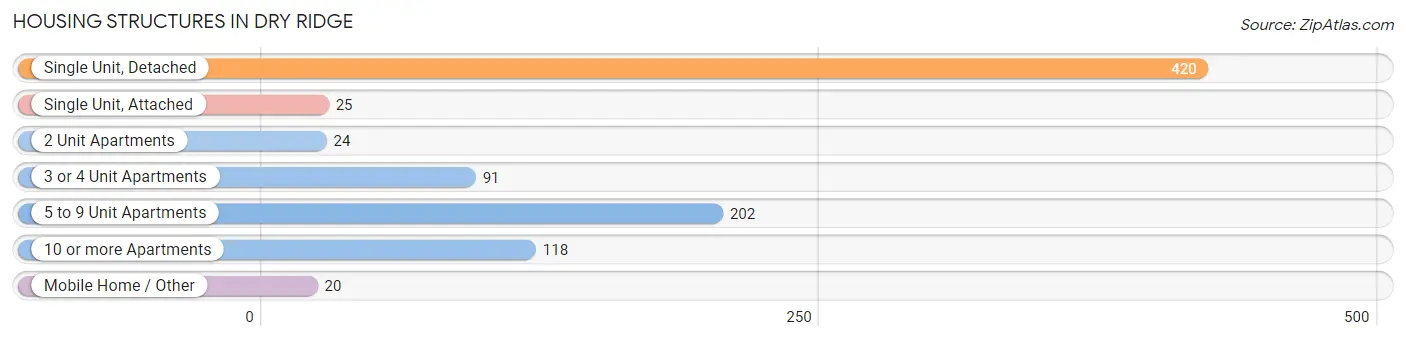
| Structure Type | # Housing Units | % Housing Units |
| Single Unit, Detached | 420 | 46.7% |
| Single Unit, Attached | 25 | 2.8% |
| 2 Unit Apartments | 24 | 2.7% |
| 3 or 4 Unit Apartments | 91 | 10.1% |
| 5 to 9 Unit Apartments | 202 | 22.4% |
| 10 or more Apartments | 118 | 13.1% |
| Mobile Home / Other | 20 | 2.2% |
| Total | 900 | 100.0% |
Housing Structures by Occupancy in Dry Ridge
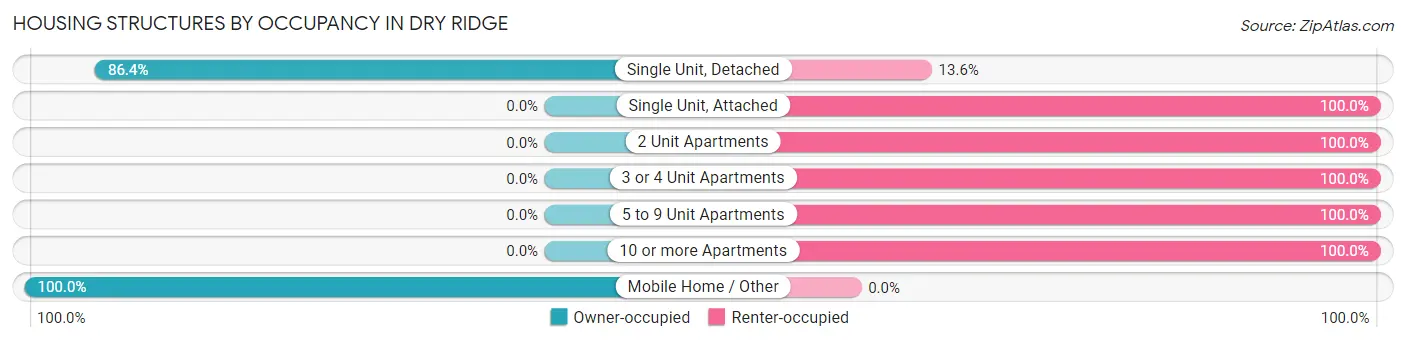
| Structure Type | Owner-occupied | Renter-occupied |
| Single Unit, Detached | 363 (86.4%) | 57 (13.6%) |
| Single Unit, Attached | 0 (0.0%) | 25 (100.0%) |
| 2 Unit Apartments | 0 (0.0%) | 24 (100.0%) |
| 3 or 4 Unit Apartments | 0 (0.0%) | 91 (100.0%) |
| 5 to 9 Unit Apartments | 0 (0.0%) | 202 (100.0%) |
| 10 or more Apartments | 0 (0.0%) | 118 (100.0%) |
| Mobile Home / Other | 20 (100.0%) | 0 (0.0%) |
| Total | 383 (42.6%) | 517 (57.4%) |
Housing Structures by Number of Rooms in Dry Ridge
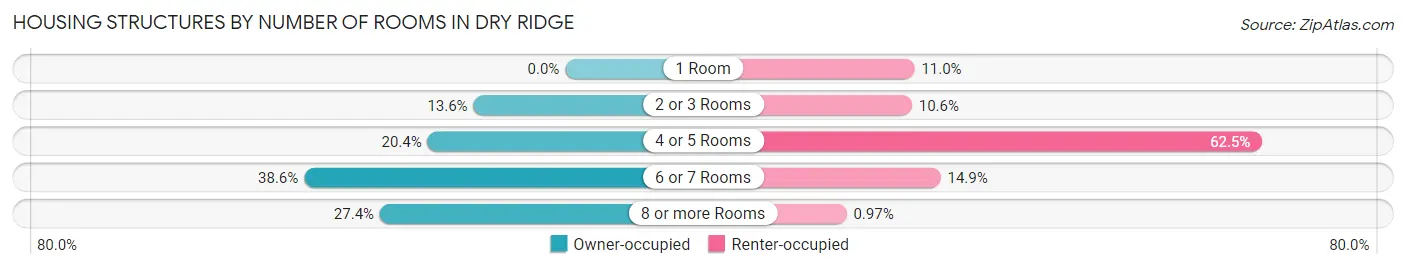
| Number of Rooms | Owner-occupied | Renter-occupied |
| 1 Room | 0 (0.0%) | 57 (11.0%) |
| 2 or 3 Rooms | 52 (13.6%) | 55 (10.6%) |
| 4 or 5 Rooms | 78 (20.4%) | 323 (62.5%) |
| 6 or 7 Rooms | 148 (38.6%) | 77 (14.9%) |
| 8 or more Rooms | 105 (27.4%) | 5 (1.0%) |
| Total | 383 (100.0%) | 517 (100.0%) |
Housing Structure by Heating Type in Dry Ridge
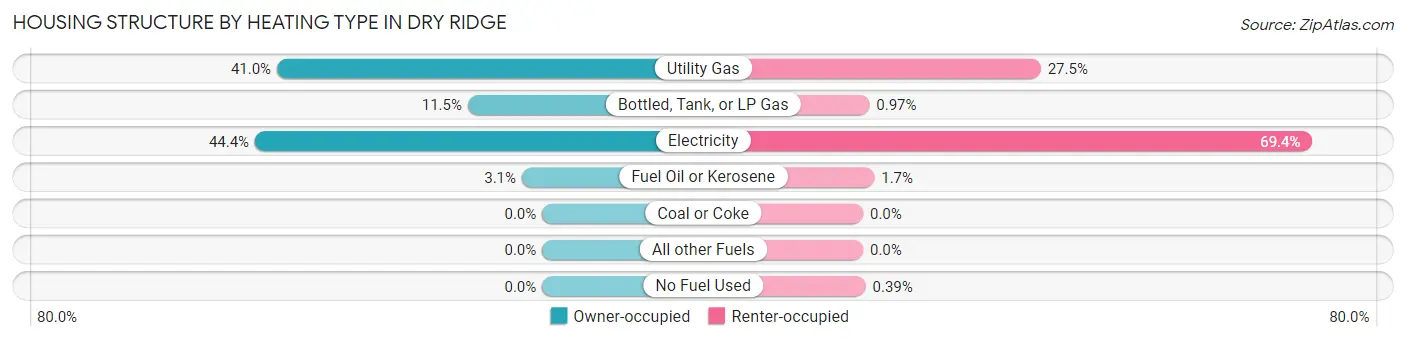
| Heating Type | Owner-occupied | Renter-occupied |
| Utility Gas | 157 (41.0%) | 142 (27.5%) |
| Bottled, Tank, or LP Gas | 44 (11.5%) | 5 (1.0%) |
| Electricity | 170 (44.4%) | 359 (69.4%) |
| Fuel Oil or Kerosene | 12 (3.1%) | 9 (1.7%) |
| Coal or Coke | 0 (0.0%) | 0 (0.0%) |
| All other Fuels | 0 (0.0%) | 0 (0.0%) |
| No Fuel Used | 0 (0.0%) | 2 (0.4%) |
| Total | 383 (100.0%) | 517 (100.0%) |
Household Vehicle Usage in Dry Ridge
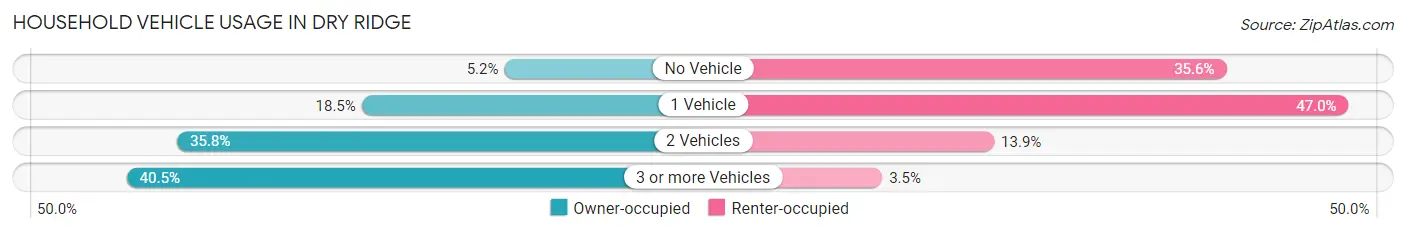
| Vehicles per Household | Owner-occupied | Renter-occupied |
| No Vehicle | 20 (5.2%) | 184 (35.6%) |
| 1 Vehicle | 71 (18.5%) | 243 (47.0%) |
| 2 Vehicles | 137 (35.8%) | 72 (13.9%) |
| 3 or more Vehicles | 155 (40.5%) | 18 (3.5%) |
| Total | 383 (100.0%) | 517 (100.0%) |
Real Estate & Mortgages in Dry Ridge
Real Estate and Mortgage Overview in Dry Ridge
| Characteristic | Without Mortgage | With Mortgage |
| Housing Units | 218 | 165 |
| Median Property Value | $155,100 | $183,000 |
| Median Household Income | $56,429 | $20 |
| Monthly Housing Costs | $467 | $0 |
| Real Estate Taxes | $1,063 | $0 |
Property Value by Mortgage Status in Dry Ridge
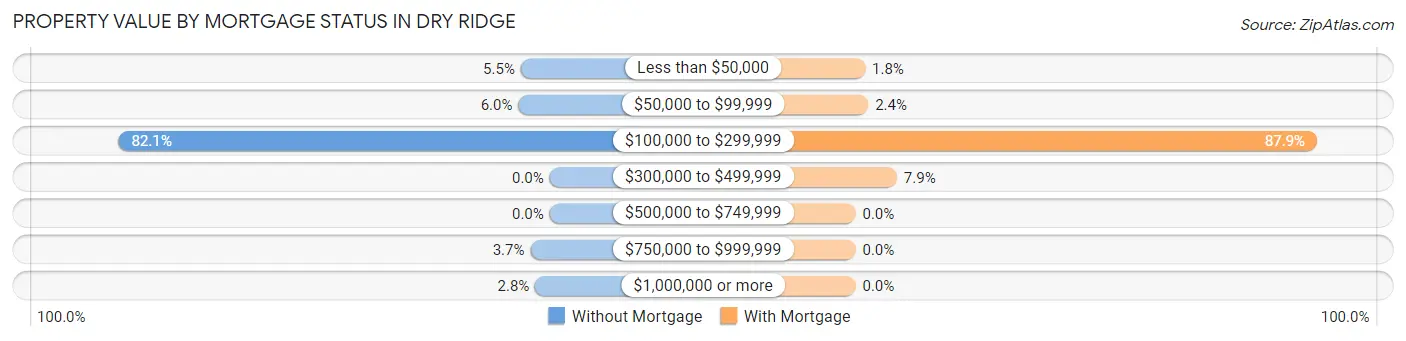
| Property Value | Without Mortgage | With Mortgage |
| Less than $50,000 | 12 (5.5%) | 3 (1.8%) |
| $50,000 to $99,999 | 13 (6.0%) | 4 (2.4%) |
| $100,000 to $299,999 | 179 (82.1%) | 145 (87.9%) |
| $300,000 to $499,999 | 0 (0.0%) | 13 (7.9%) |
| $500,000 to $749,999 | 0 (0.0%) | 0 (0.0%) |
| $750,000 to $999,999 | 8 (3.7%) | 0 (0.0%) |
| $1,000,000 or more | 6 (2.8%) | 0 (0.0%) |
| Total | 218 (100.0%) | 165 (100.0%) |
Household Income by Mortgage Status in Dry Ridge
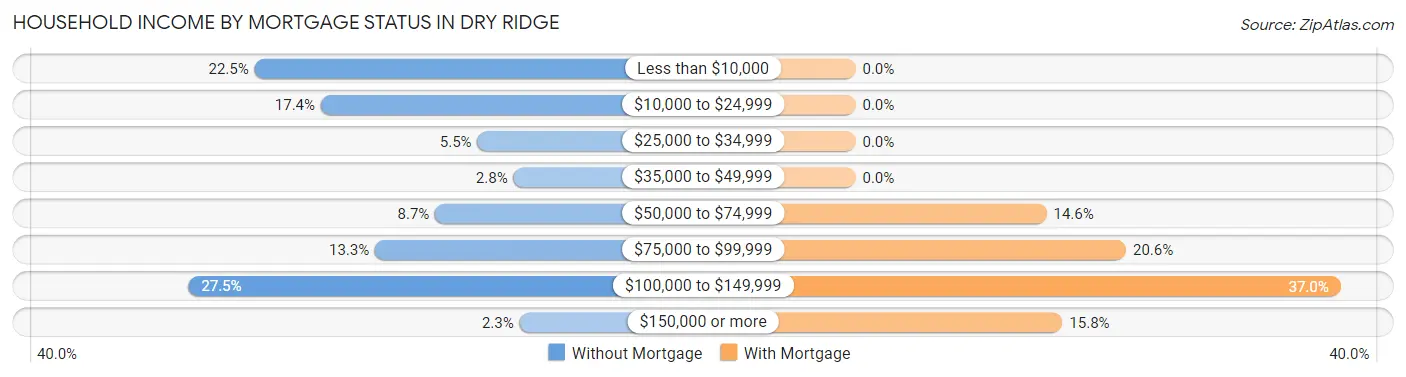
| Household Income | Without Mortgage | With Mortgage |
| Less than $10,000 | 49 (22.5%) | 0 (0.0%) |
| $10,000 to $24,999 | 38 (17.4%) | 0 (0.0%) |
| $25,000 to $34,999 | 12 (5.5%) | 0 (0.0%) |
| $35,000 to $49,999 | 6 (2.8%) | 0 (0.0%) |
| $50,000 to $74,999 | 19 (8.7%) | 24 (14.5%) |
| $75,000 to $99,999 | 29 (13.3%) | 34 (20.6%) |
| $100,000 to $149,999 | 60 (27.5%) | 61 (37.0%) |
| $150,000 or more | 5 (2.3%) | 26 (15.8%) |
| Total | 218 (100.0%) | 165 (100.0%) |
Property Value to Household Income Ratio in Dry Ridge
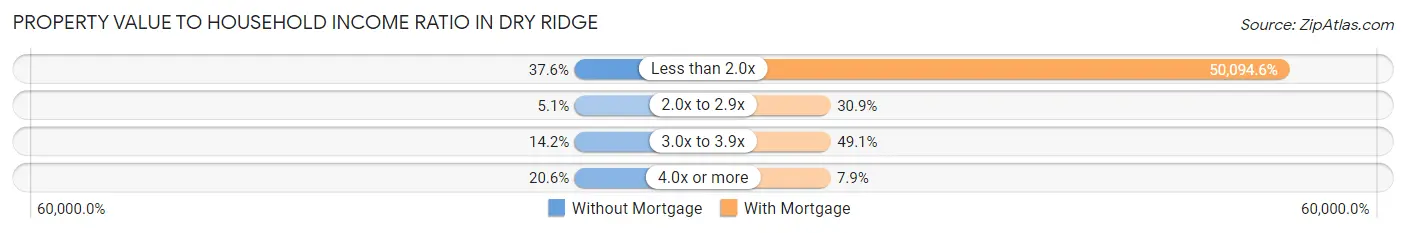
| Value-to-Income Ratio | Without Mortgage | With Mortgage |
| Less than 2.0x | 82 (37.6%) | 82,656 (50,094.5%) |
| 2.0x to 2.9x | 11 (5.1%) | 51 (30.9%) |
| 3.0x to 3.9x | 31 (14.2%) | 81 (49.1%) |
| 4.0x or more | 45 (20.6%) | 13 (7.9%) |
| Total | 218 (100.0%) | 165 (100.0%) |
Real Estate Taxes by Mortgage Status in Dry Ridge
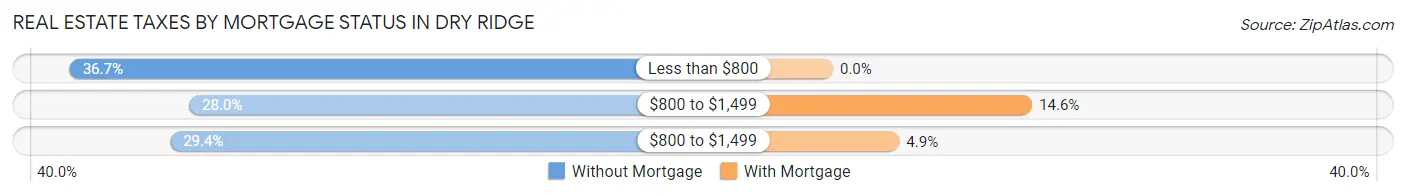
| Property Taxes | Without Mortgage | With Mortgage |
| Less than $800 | 80 (36.7%) | 0 (0.0%) |
| $800 to $1,499 | 61 (28.0%) | 24 (14.5%) |
| $800 to $1,499 | 64 (29.4%) | 8 (4.9%) |
| Total | 218 (100.0%) | 165 (100.0%) |
Health & Disability in Dry Ridge
Health Insurance Coverage by Age in Dry Ridge
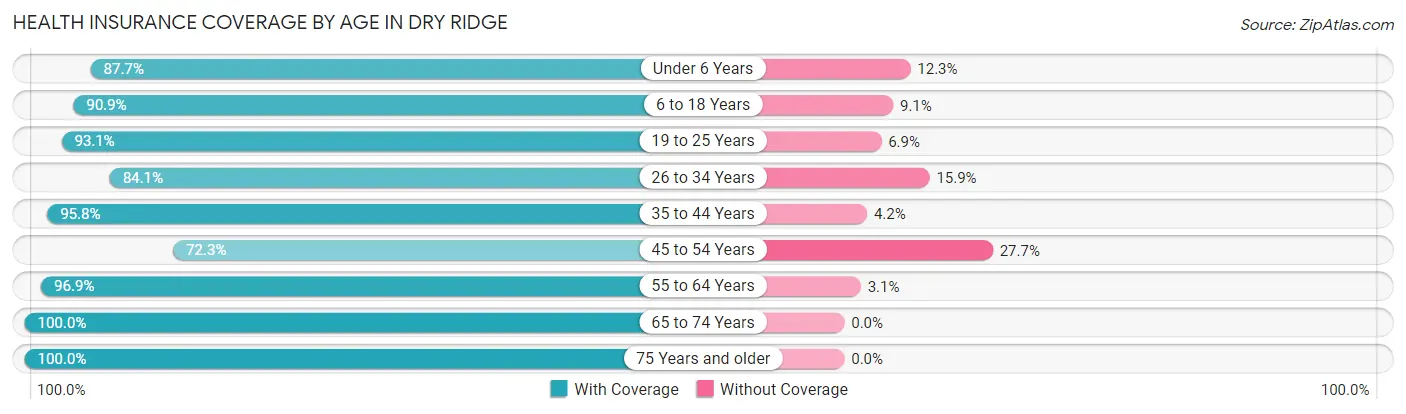
| Age Bracket | With Coverage | Without Coverage |
| Under 6 Years | 249 (87.7%) | 35 (12.3%) |
| 6 to 18 Years | 450 (90.9%) | 45 (9.1%) |
| 19 to 25 Years | 176 (93.1%) | 13 (6.9%) |
| 26 to 34 Years | 355 (84.1%) | 67 (15.9%) |
| 35 to 44 Years | 204 (95.8%) | 9 (4.2%) |
| 45 to 54 Years | 162 (72.3%) | 62 (27.7%) |
| 55 to 64 Years | 158 (96.9%) | 5 (3.1%) |
| 65 to 74 Years | 108 (100.0%) | 0 (0.0%) |
| 75 Years and older | 129 (100.0%) | 0 (0.0%) |
| Total | 1,991 (89.4%) | 236 (10.6%) |
Health Insurance Coverage by Citizenship Status in Dry Ridge
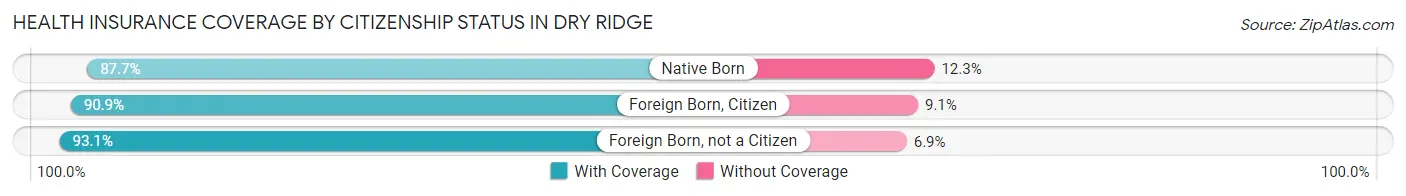
| Citizenship Status | With Coverage | Without Coverage |
| Native Born | 249 (87.7%) | 35 (12.3%) |
| Foreign Born, Citizen | 450 (90.9%) | 45 (9.1%) |
| Foreign Born, not a Citizen | 176 (93.1%) | 13 (6.9%) |
Health Insurance Coverage by Household Income in Dry Ridge
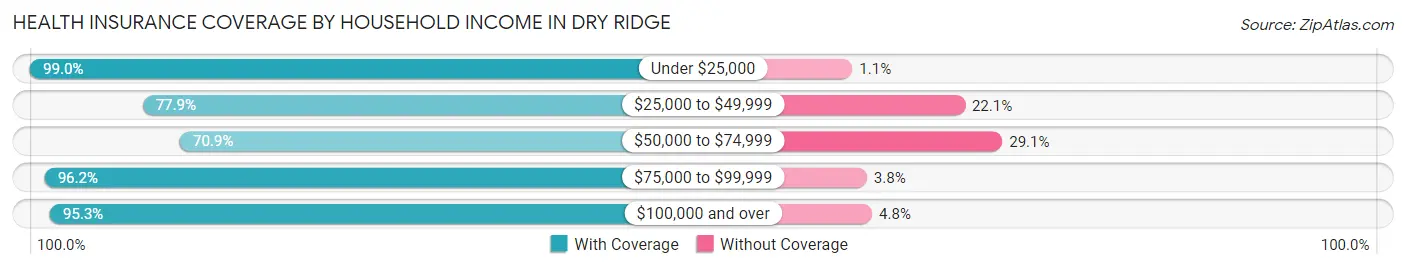
| Household Income | With Coverage | Without Coverage |
| Under $25,000 | 660 (99.0%) | 7 (1.1%) |
| $25,000 to $49,999 | 320 (77.9%) | 91 (22.1%) |
| $50,000 to $74,999 | 253 (70.9%) | 104 (29.1%) |
| $75,000 to $99,999 | 357 (96.2%) | 14 (3.8%) |
| $100,000 and over | 401 (95.3%) | 20 (4.8%) |
Public vs Private Health Insurance Coverage by Age in Dry Ridge
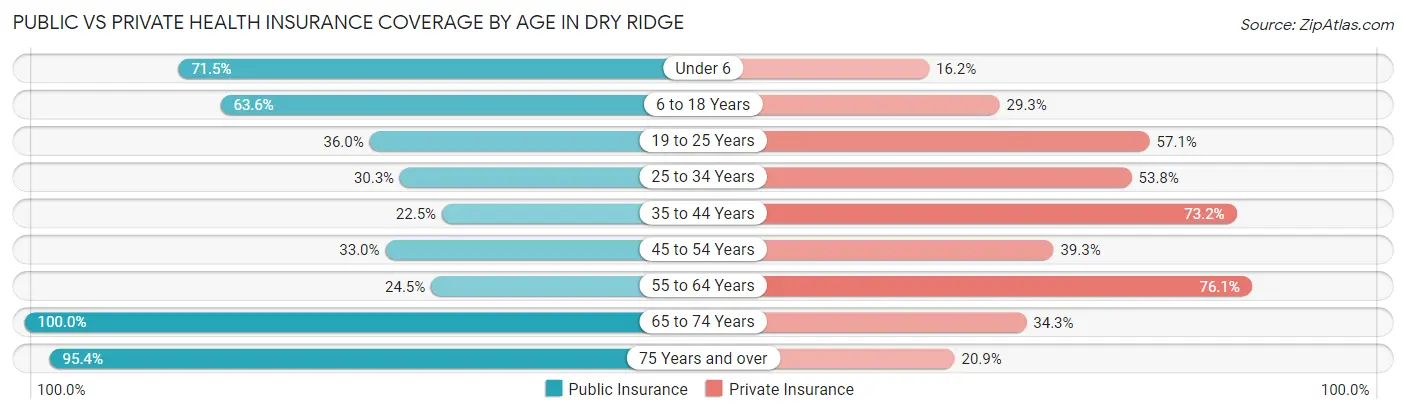
| Age Bracket | Public Insurance | Private Insurance |
| Under 6 | 203 (71.5%) | 46 (16.2%) |
| 6 to 18 Years | 315 (63.6%) | 145 (29.3%) |
| 19 to 25 Years | 68 (36.0%) | 108 (57.1%) |
| 25 to 34 Years | 128 (30.3%) | 227 (53.8%) |
| 35 to 44 Years | 48 (22.5%) | 156 (73.2%) |
| 45 to 54 Years | 74 (33.0%) | 88 (39.3%) |
| 55 to 64 Years | 40 (24.5%) | 124 (76.1%) |
| 65 to 74 Years | 108 (100.0%) | 37 (34.3%) |
| 75 Years and over | 123 (95.4%) | 27 (20.9%) |
| Total | 1,107 (49.7%) | 958 (43.0%) |
Disability Status by Sex by Age in Dry Ridge
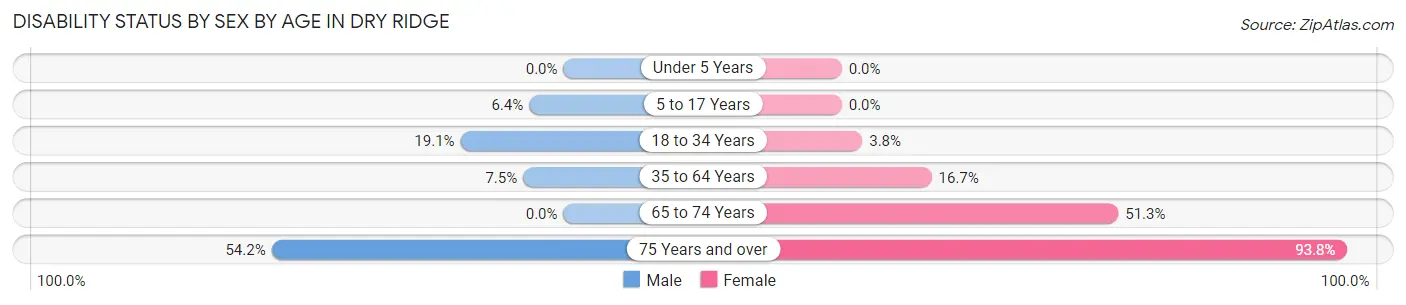
| Age Bracket | Male | Female |
| Under 5 Years | 0 (0.0%) | 0 (0.0%) |
| 5 to 17 Years | 13 (6.4%) | 0 (0.0%) |
| 18 to 34 Years | 47 (19.1%) | 15 (3.8%) |
| 35 to 64 Years | 22 (7.5%) | 51 (16.7%) |
| 65 to 74 Years | 0 (0.0%) | 39 (51.3%) |
| 75 Years and over | 26 (54.2%) | 76 (93.8%) |
Disability Class by Sex by Age in Dry Ridge
Disability Class: Hearing Difficulty
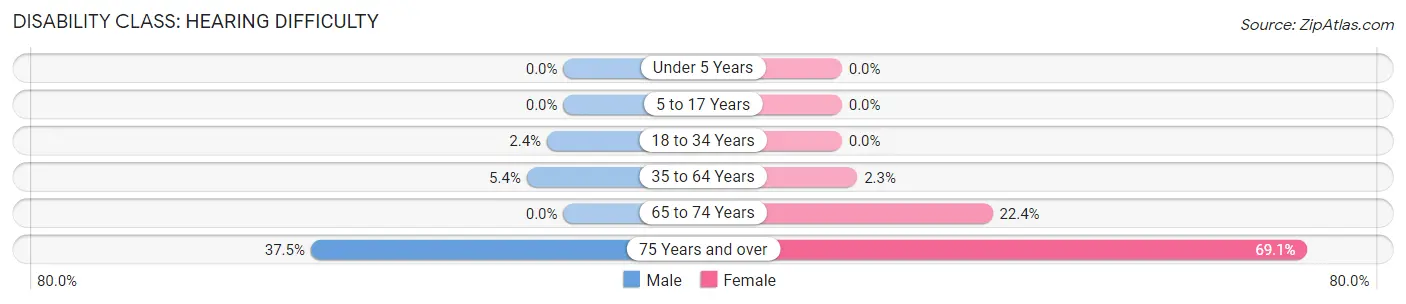
| Age Bracket | Male | Female |
| Under 5 Years | 0 (0.0%) | 0 (0.0%) |
| 5 to 17 Years | 0 (0.0%) | 0 (0.0%) |
| 18 to 34 Years | 6 (2.4%) | 0 (0.0%) |
| 35 to 64 Years | 16 (5.4%) | 7 (2.3%) |
| 65 to 74 Years | 0 (0.0%) | 17 (22.4%) |
| 75 Years and over | 18 (37.5%) | 56 (69.1%) |
Disability Class: Vision Difficulty
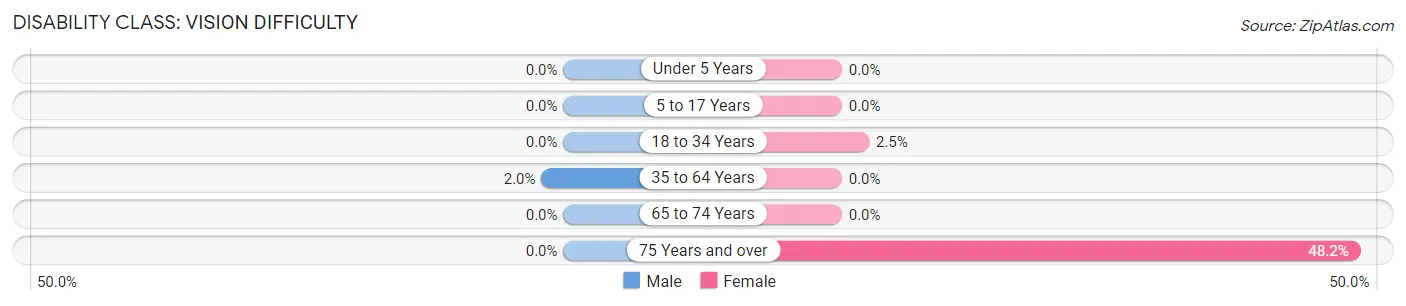
| Age Bracket | Male | Female |
| Under 5 Years | 0 (0.0%) | 0 (0.0%) |
| 5 to 17 Years | 0 (0.0%) | 0 (0.0%) |
| 18 to 34 Years | 0 (0.0%) | 10 (2.5%) |
| 35 to 64 Years | 6 (2.0%) | 0 (0.0%) |
| 65 to 74 Years | 0 (0.0%) | 0 (0.0%) |
| 75 Years and over | 0 (0.0%) | 39 (48.1%) |
Disability Class: Cognitive Difficulty
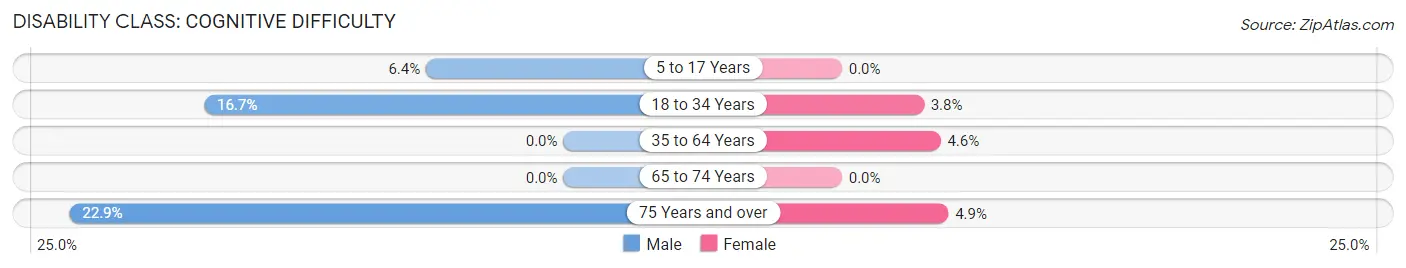
| Age Bracket | Male | Female |
| 5 to 17 Years | 13 (6.4%) | 0 (0.0%) |
| 18 to 34 Years | 41 (16.7%) | 15 (3.8%) |
| 35 to 64 Years | 0 (0.0%) | 14 (4.6%) |
| 65 to 74 Years | 0 (0.0%) | 0 (0.0%) |
| 75 Years and over | 11 (22.9%) | 4 (4.9%) |
Disability Class: Ambulatory Difficulty
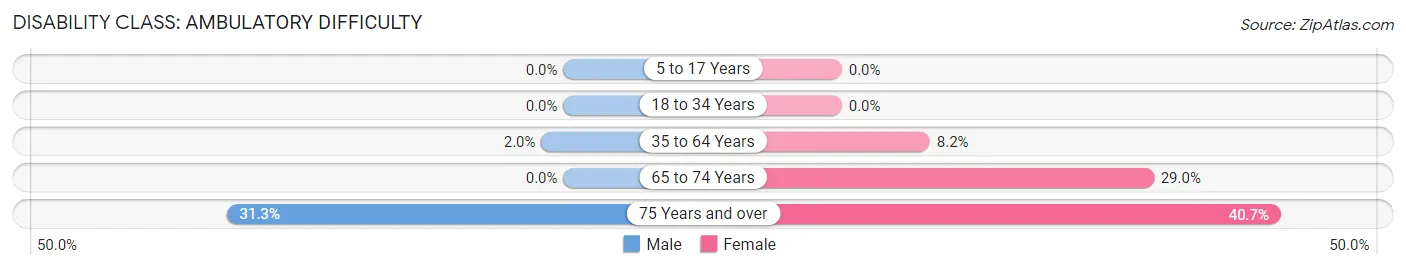
| Age Bracket | Male | Female |
| 5 to 17 Years | 0 (0.0%) | 0 (0.0%) |
| 18 to 34 Years | 0 (0.0%) | 0 (0.0%) |
| 35 to 64 Years | 6 (2.0%) | 25 (8.2%) |
| 65 to 74 Years | 0 (0.0%) | 22 (28.9%) |
| 75 Years and over | 15 (31.2%) | 33 (40.7%) |
Disability Class: Self-Care Difficulty
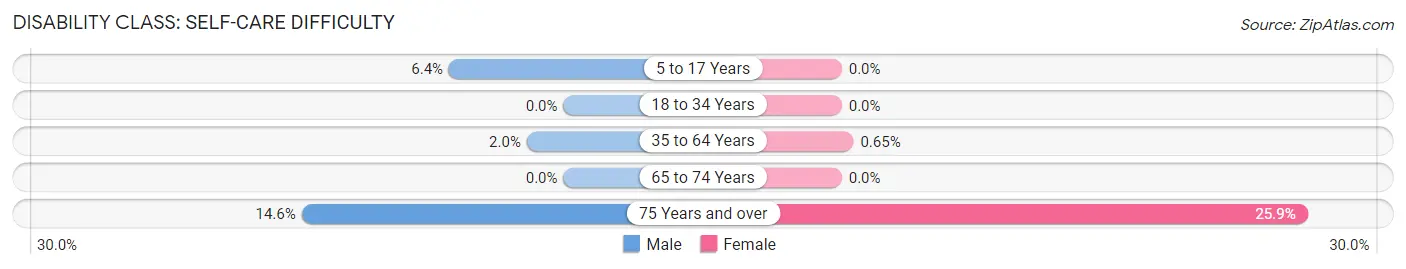
| Age Bracket | Male | Female |
| 5 to 17 Years | 13 (6.4%) | 0 (0.0%) |
| 18 to 34 Years | 0 (0.0%) | 0 (0.0%) |
| 35 to 64 Years | 6 (2.0%) | 2 (0.6%) |
| 65 to 74 Years | 0 (0.0%) | 0 (0.0%) |
| 75 Years and over | 7 (14.6%) | 21 (25.9%) |
Technology Access in Dry Ridge
Computing Device Access in Dry Ridge
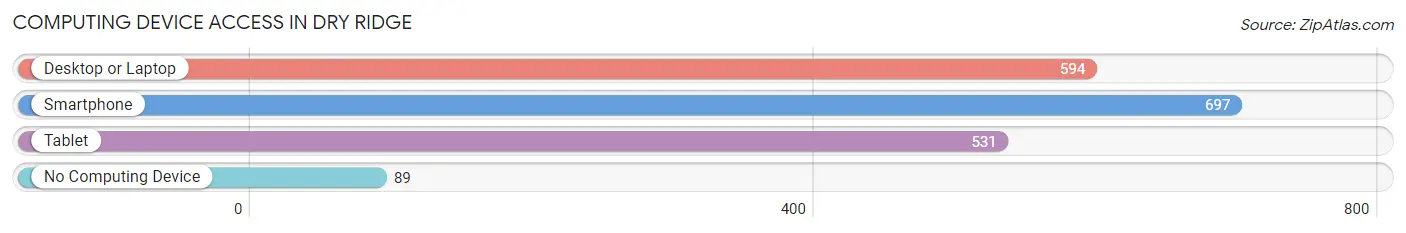
| Device Type | # Households | % Households |
| Desktop or Laptop | 594 | 66.0% |
| Smartphone | 697 | 77.4% |
| Tablet | 531 | 59.0% |
| No Computing Device | 89 | 9.9% |
| Total | 900 | 100.0% |
Internet Access in Dry Ridge
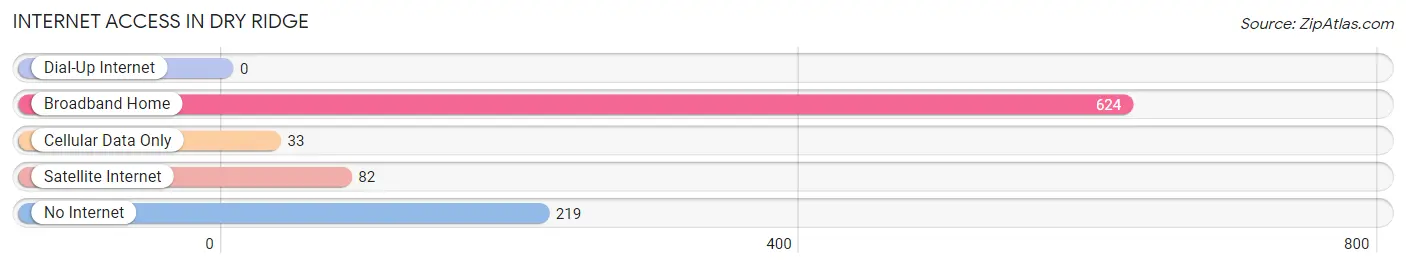
| Internet Type | # Households | % Households |
| Dial-Up Internet | 0 | 0.0% |
| Broadband Home | 624 | 69.3% |
| Cellular Data Only | 33 | 3.7% |
| Satellite Internet | 82 | 9.1% |
| No Internet | 219 | 24.3% |
| Total | 900 | 100.0% |
Dry Ridge Summary
Dry Ridge is a small city located in Grant County, Kentucky, United States. It is situated in the northern part of the state, about 25 miles south of Cincinnati, Ohio. The city has a population of approximately 2,500 people and is part of the Cincinnati-Middletown Metropolitan Statistical Area.
History
The area that is now Dry Ridge was first settled in the early 1800s by a group of German immigrants. The town was originally known as “Dry Ridge” due to the lack of water in the area. The name was changed to “Dry Ridge” in 1845 when the post office was established.
The town was incorporated in 1867 and was primarily an agricultural community. The town was known for its tobacco production and was home to several tobacco warehouses. The town also had a number of small businesses, including a general store, a blacksmith shop, and a grist mill.
In the late 19th century, the town began to experience a period of growth and development. The railroad arrived in 1887, bringing with it new opportunities for commerce and industry. The town was also home to several manufacturing companies, including a furniture factory, a brickyard, and a canning factory.
Geography
Dry Ridge is located in northern Kentucky, about 25 miles south of Cincinnati, Ohio. The city is situated in the rolling hills of the Bluegrass region of the state. The city is bordered by the towns of Williamstown to the north, Corinth to the east, and Crittenden to the south.
The city has a total area of 1.3 square miles, all of which is land. The city is located at an elevation of 845 feet above sea level. The climate in Dry Ridge is characterized by hot, humid summers and cold, wet winters.
Economy
The economy of Dry Ridge is largely based on agriculture and manufacturing. The city is home to several large farms, which produce a variety of crops, including corn, soybeans, and tobacco. The city is also home to several manufacturing companies, including a furniture factory, a brickyard, and a canning factory.
The city is also home to several retail stores, restaurants, and other businesses. The city is served by the Grant County Airport, which provides air service to the surrounding area.
Demographics
As of the 2010 census, the population of Dry Ridge was 2,500. The racial makeup of the city was 97.2% White, 0.8% African American, 0.4% Native American, 0.2% Asian, and 1.4% from other races. Hispanic or Latino of any race were 1.2% of the population.
The median household income in Dry Ridge was $37,500, and the median family income was $45,000. The per capita income in the city was $19,000. About 11.2% of the population was below the poverty line.
Conclusion
Dry Ridge is a small city located in Grant County, Kentucky. The city has a population of approximately 2,500 people and is part of the Cincinnati-Middletown Metropolitan Statistical Area. The city was originally settled in the early 1800s by a group of German immigrants and was incorporated in 1867. The economy of Dry Ridge is largely based on agriculture and manufacturing. The city is also home to several retail stores, restaurants, and other businesses. The population of Dry Ridge is predominantly White, with a small percentage of African American, Native American, and Asian residents. The median household income in Dry Ridge is $37,500, and the median family income is $45,000.
Common Questions
What is Per Capita Income in Dry Ridge?
Per Capita income in Dry Ridge is $22,993.
What is the Median Family Income in Dry Ridge?
Median Family Income in Dry Ridge is $51,250.
What is the Median Household income in Dry Ridge?
Median Household Income in Dry Ridge is $46,000.
What is Income or Wage Gap in Dry Ridge?
Income or Wage Gap in Dry Ridge is 55.1%.
Women in Dry Ridge earn 44.9 cents for every dollar earned by a man.
What is Inequality or Gini Index in Dry Ridge?
Inequality or Gini Index in Dry Ridge is 0.52.
What is the Total Population of Dry Ridge?
Total Population of Dry Ridge is 2,227.
What is the Total Male Population of Dry Ridge?
Total Male Population of Dry Ridge is 938.
What is the Total Female Population of Dry Ridge?
Total Female Population of Dry Ridge is 1,289.
What is the Ratio of Males per 100 Females in Dry Ridge?
There are 72.77 Males per 100 Females in Dry Ridge.
What is the Ratio of Females per 100 Males in Dry Ridge?
There are 137.42 Females per 100 Males in Dry Ridge.
What is the Median Population Age in Dry Ridge?
Median Population Age in Dry Ridge is 28.3 Years.
What is the Average Family Size in Dry Ridge
Average Family Size in Dry Ridge is 3.1 People.
What is the Average Household Size in Dry Ridge
Average Household Size in Dry Ridge is 2.5 People.
How Large is the Labor Force in Dry Ridge?
There are 916 People in the Labor Forcein in Dry Ridge.
What is the Percentage of People in the Labor Force in Dry Ridge?
60.4% of People are in the Labor Force in Dry Ridge.
What is the Unemployment Rate in Dry Ridge?
Unemployment Rate in Dry Ridge is 5.8%.