Iowa City, IA Map & Demographics
Iowa City Map
Iowa City Overview
$34,820
PER CAPITA INCOME
$103,193
AVG FAMILY INCOME
$54,879
AVG HOUSEHOLD INCOME
37.8%
WAGE / INCOME GAP [ % ]
62.2¢/ $1
WAGE / INCOME GAP [ $ ]
$12,927
FAMILY INCOME DEFICIT
0.52
INEQUALITY / GINI INDEX
74,878
TOTAL POPULATION
37,104
MALE POPULATION
37,774
FEMALE POPULATION
98.23
MALES / 100 FEMALES
101.81
FEMALES / 100 MALES
26.0
MEDIAN AGE
3.0
AVG FAMILY SIZE
2.2
AVG HOUSEHOLD SIZE
44,273
LABOR FORCE [ PEOPLE ]
67.9%
PERCENT IN LABOR FORCE
4.8%
UNEMPLOYMENT RATE
Iowa City Area Codes
Income in Iowa City
Income Overview in Iowa City
Per Capita Income in Iowa City is $34,820, while median incomes of families and households are $103,193 and $54,879 respectively.
| Characteristic | Number | Measure |
| Per Capita Income | 74,878 | $34,820 |
| Median Family Income | 12,528 | $103,193 |
| Mean Family Income | 12,528 | $127,913 |
| Median Household Income | 30,544 | $54,879 |
| Mean Household Income | 30,544 | $83,548 |
| Income Deficit | 12,528 | $12,927 |
| Wage / Income Gap (%) | 74,878 | 37.81% |
| Wage / Income Gap ($) | 74,878 | 62.19¢ per $1 |
| Gini / Inequality Index | 74,878 | 0.52 |
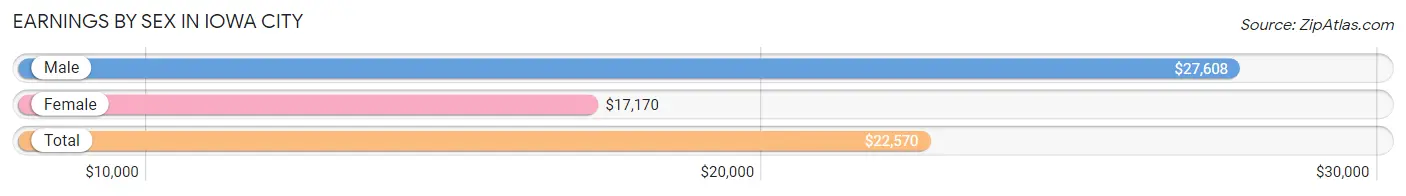
Earnings by Sex in Iowa City
Average Earnings in Iowa City are $22,570, $27,608 for men and $17,170 for women, a difference of 37.8%.
| Sex | Number | Average Earnings |
| Male | 25,237 (49.6%) | $27,608 |
| Female | 25,620 (50.4%) | $17,170 |
| Total | 50,857 (100.0%) | $22,570 |
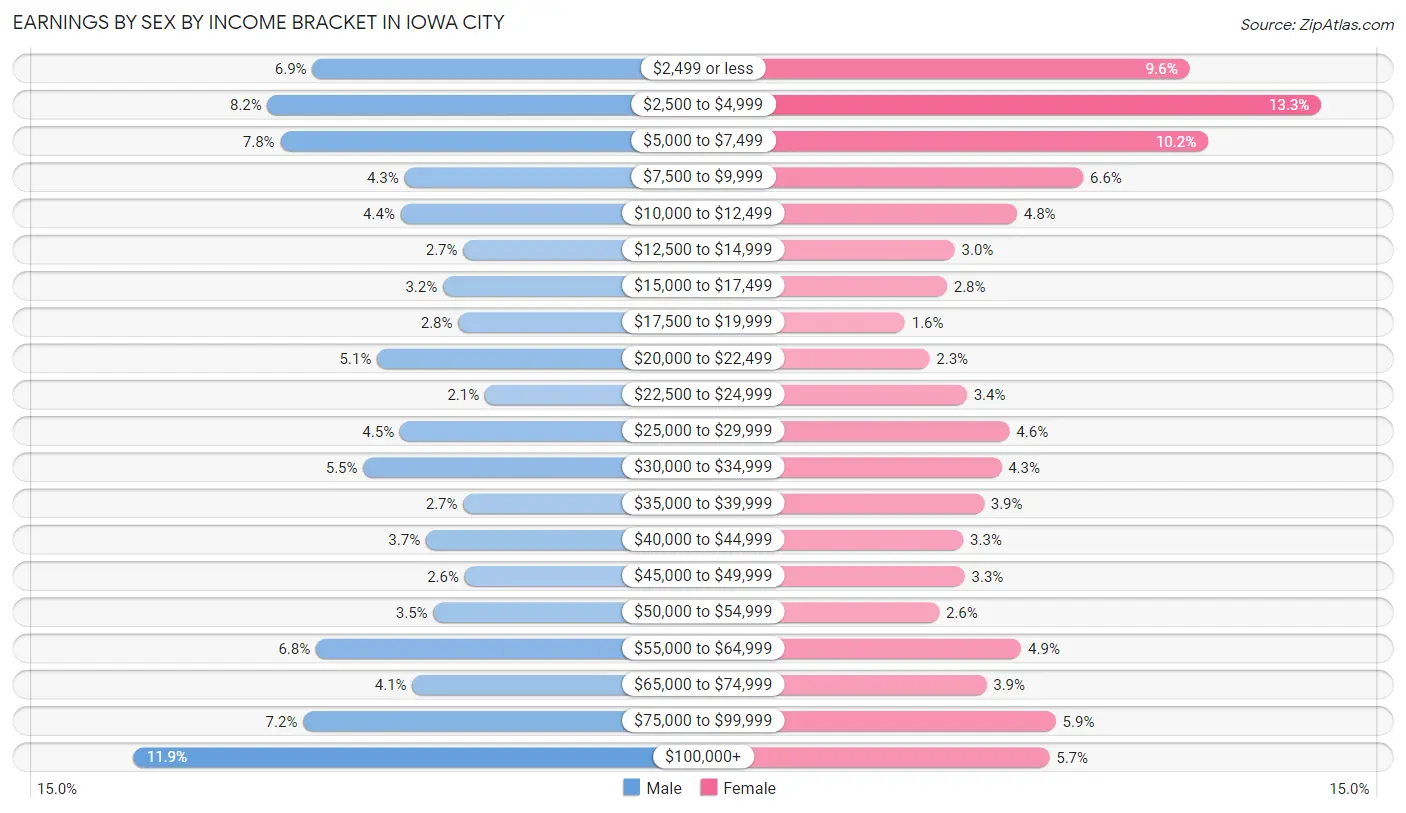
Earnings by Sex by Income Bracket in Iowa City
The most common earnings brackets in Iowa City are $100,000+ for men (3,012 | 11.9%) and $2,500 to $4,999 for women (3,415 | 13.3%).
| Income | Male | Female |
| $2,499 or less | 1,744 (6.9%) | 2,466 (9.6%) |
| $2,500 to $4,999 | 2,062 (8.2%) | 3,415 (13.3%) |
| $5,000 to $7,499 | 1,972 (7.8%) | 2,601 (10.2%) |
| $7,500 to $9,999 | 1,091 (4.3%) | 1,702 (6.6%) |
| $10,000 to $12,499 | 1,117 (4.4%) | 1,225 (4.8%) |
| $12,500 to $14,999 | 675 (2.7%) | 776 (3.0%) |
| $15,000 to $17,499 | 818 (3.2%) | 720 (2.8%) |
| $17,500 to $19,999 | 710 (2.8%) | 417 (1.6%) |
| $20,000 to $22,499 | 1,284 (5.1%) | 595 (2.3%) |
| $22,500 to $24,999 | 519 (2.1%) | 864 (3.4%) |
| $25,000 to $29,999 | 1,124 (4.4%) | 1,170 (4.6%) |
| $30,000 to $34,999 | 1,384 (5.5%) | 1,113 (4.3%) |
| $35,000 to $39,999 | 673 (2.7%) | 986 (3.8%) |
| $40,000 to $44,999 | 938 (3.7%) | 838 (3.3%) |
| $45,000 to $49,999 | 664 (2.6%) | 847 (3.3%) |
| $50,000 to $54,999 | 887 (3.5%) | 663 (2.6%) |
| $55,000 to $64,999 | 1,719 (6.8%) | 1,255 (4.9%) |
| $65,000 to $74,999 | 1,035 (4.1%) | 1,005 (3.9%) |
| $75,000 to $99,999 | 1,809 (7.2%) | 1,505 (5.9%) |
| $100,000+ | 3,012 (11.9%) | 1,457 (5.7%) |
| Total | 25,237 (100.0%) | 25,620 (100.0%) |
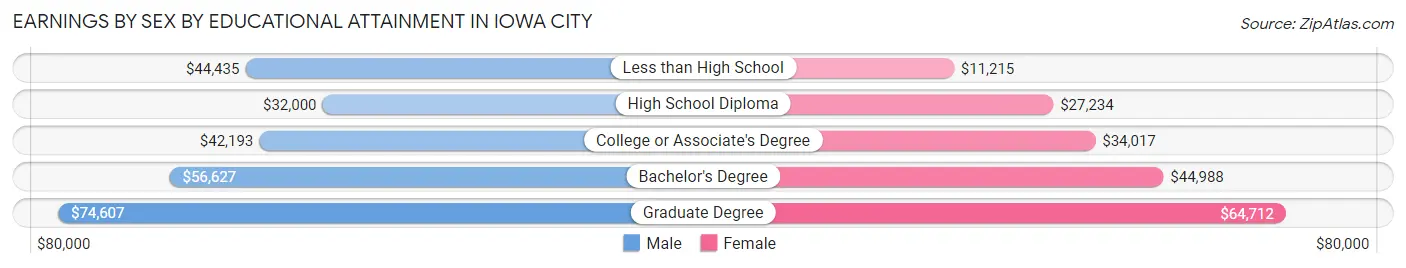
Earnings by Sex by Educational Attainment in Iowa City
Average earnings in Iowa City are $52,376 for men and $44,181 for women, a difference of 15.7%. Men with an educational attainment of graduate degree enjoy the highest average annual earnings of $74,607, while those with high school diploma education earn the least with $32,000. Women with an educational attainment of graduate degree earn the most with the average annual earnings of $64,712, while those with less than high school education have the smallest earnings of $11,215.
| Educational Attainment | Male Income | Female Income |
| Less than High School | $44,435 | $11,215 |
| High School Diploma | $32,000 | $27,234 |
| College or Associate's Degree | $42,193 | $34,017 |
| Bachelor's Degree | $56,627 | $44,988 |
| Graduate Degree | $74,607 | $64,712 |
| Total | $52,376 | $44,181 |
Family Income in Iowa City
Family Income Brackets in Iowa City
According to the Iowa City family income data, there are 2,844 families falling into the $100,000 to $149,999 income range, which is the most common income bracket and makes up 22.7% of all families. Conversely, the $10,000 to $14,999 income bracket is the least frequent group with only 200 families (1.6%) belonging to this category.
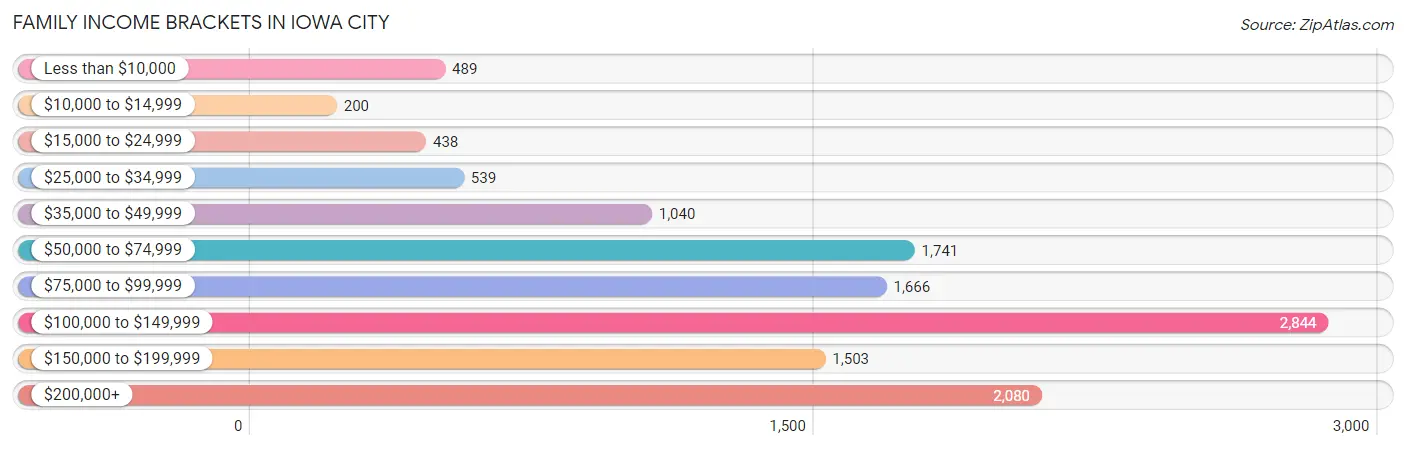
| Income Bracket | # Families | % Families |
| Less than $10,000 | 489 | 3.9% |
| $10,000 to $14,999 | 200 | 1.6% |
| $15,000 to $24,999 | 438 | 3.5% |
| $25,000 to $34,999 | 539 | 4.3% |
| $35,000 to $49,999 | 1,040 | 8.3% |
| $50,000 to $74,999 | 1,741 | 13.9% |
| $75,000 to $99,999 | 1,666 | 13.3% |
| $100,000 to $149,999 | 2,844 | 22.7% |
| $150,000 to $199,999 | 1,503 | 12.0% |
| $200,000+ | 2,080 | 16.6% |
Family Income by Famaliy Size in Iowa City
4-person families (2,135 | 17.0%) account for the highest median family income in Iowa City with $126,964 per family, while 2-person families (6,872 | 54.8%) have the highest median income of $47,768 per family member.
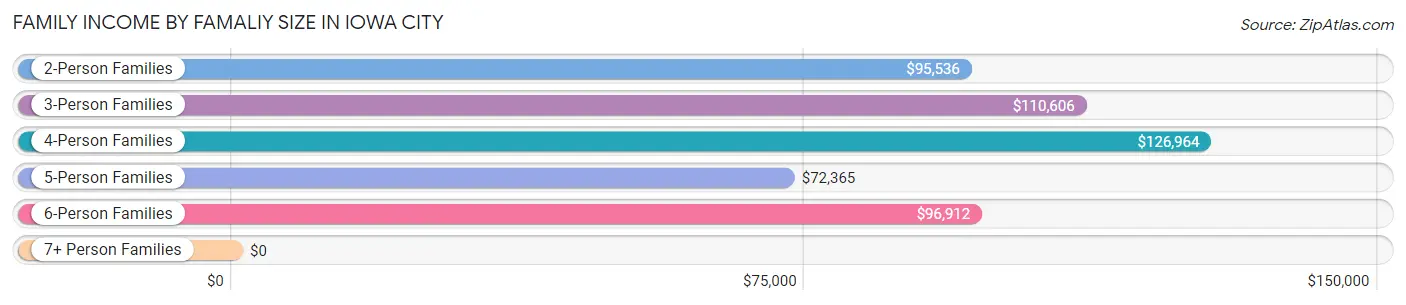
| Income Bracket | # Families | Median Income |
| 2-Person Families | 6,872 (54.8%) | $95,536 |
| 3-Person Families | 2,216 (17.7%) | $110,606 |
| 4-Person Families | 2,135 (17.0%) | $126,964 |
| 5-Person Families | 858 (6.9%) | $72,365 |
| 6-Person Families | 284 (2.3%) | $96,912 |
| 7+ Person Families | 163 (1.3%) | $0 |
| Total | 12,528 (100.0%) | $103,193 |
Family Income by Number of Earners in Iowa City
The median family income in Iowa City is $103,193, with families comprising 3+ earners (1,134) having the highest median family income of $160,682, while families with 1 earner (3,566) have the lowest median family income of $68,958, accounting for 9.0% and 28.5% of families, respectively.
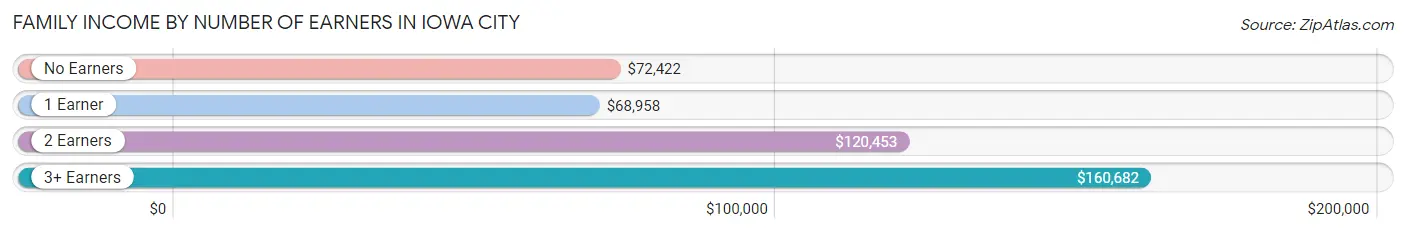
| Number of Earners | # Families | Median Income |
| No Earners | 1,571 (12.5%) | $72,422 |
| 1 Earner | 3,566 (28.5%) | $68,958 |
| 2 Earners | 6,257 (49.9%) | $120,453 |
| 3+ Earners | 1,134 (9.0%) | $160,682 |
| Total | 12,528 (100.0%) | $103,193 |
Household Income in Iowa City
Household Income Brackets in Iowa City
With 4,643 households falling in the category, the $50,000 to $74,999 income range is the most frequent in Iowa City, accounting for 15.2% of all households. In contrast, only 1,710 households (5.6%) fall into the $10,000 to $14,999 income bracket, making it the least populous group.
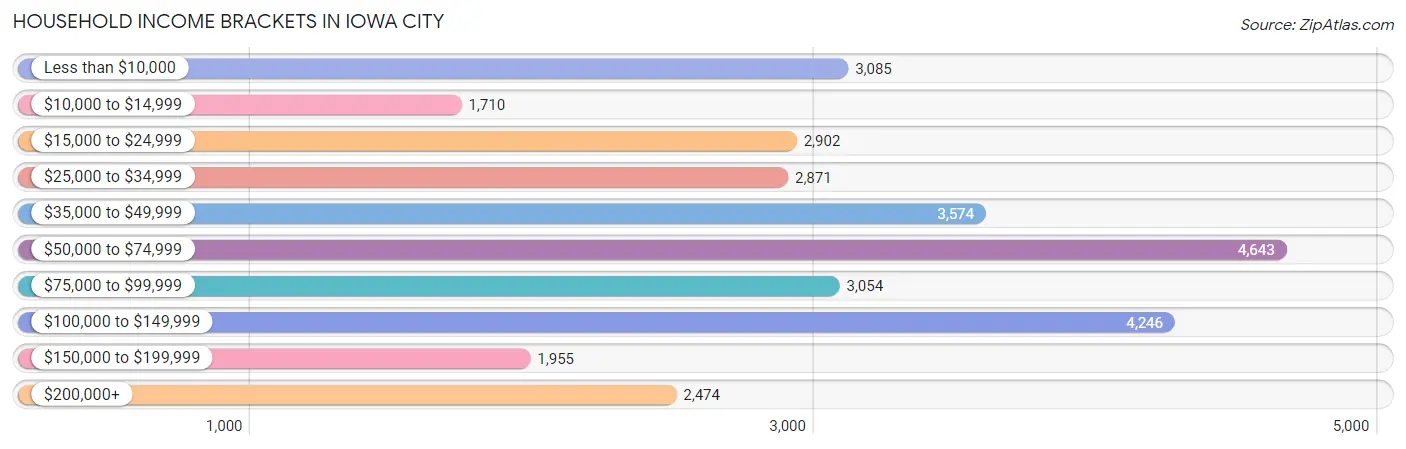
| Income Bracket | # Households | % Households |
| Less than $10,000 | 3,085 | 10.1% |
| $10,000 to $14,999 | 1,710 | 5.6% |
| $15,000 to $24,999 | 2,902 | 9.5% |
| $25,000 to $34,999 | 2,871 | 9.4% |
| $35,000 to $49,999 | 3,574 | 11.7% |
| $50,000 to $74,999 | 4,643 | 15.2% |
| $75,000 to $99,999 | 3,054 | 10.0% |
| $100,000 to $149,999 | 4,246 | 13.9% |
| $150,000 to $199,999 | 1,955 | 6.4% |
| $200,000+ | 2,474 | 8.1% |
Household Income by Householder Age in Iowa City
The median household income in Iowa City is $54,879, with the highest median household income of $95,291 found in the 45 to 64 years age bracket for the primary householder. A total of 7,383 households (24.2%) fall into this category. Meanwhile, the 15 to 24 years age bracket for the primary householder has the lowest median household income of $21,335, with 7,797 households (25.5%) in this group.
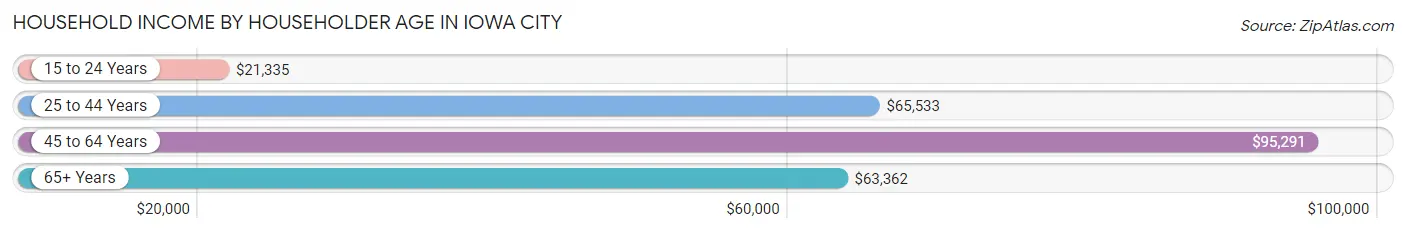
| Income Bracket | # Households | Median Income |
| 15 to 24 Years | 7,797 (25.5%) | $21,335 |
| 25 to 44 Years | 9,721 (31.8%) | $65,533 |
| 45 to 64 Years | 7,383 (24.2%) | $95,291 |
| 65+ Years | 5,643 (18.5%) | $63,362 |
| Total | 30,544 (100.0%) | $54,879 |
Poverty in Iowa City
Income Below Poverty by Sex and Age in Iowa City
With 25.0% poverty level for males and 28.5% for females among the residents of Iowa City, 18 to 24 year old males and 18 to 24 year old females are the most vulnerable to poverty, with 5,272 males (56.1%) and 7,218 females (68.9%) in their respective age groups living below the poverty level.
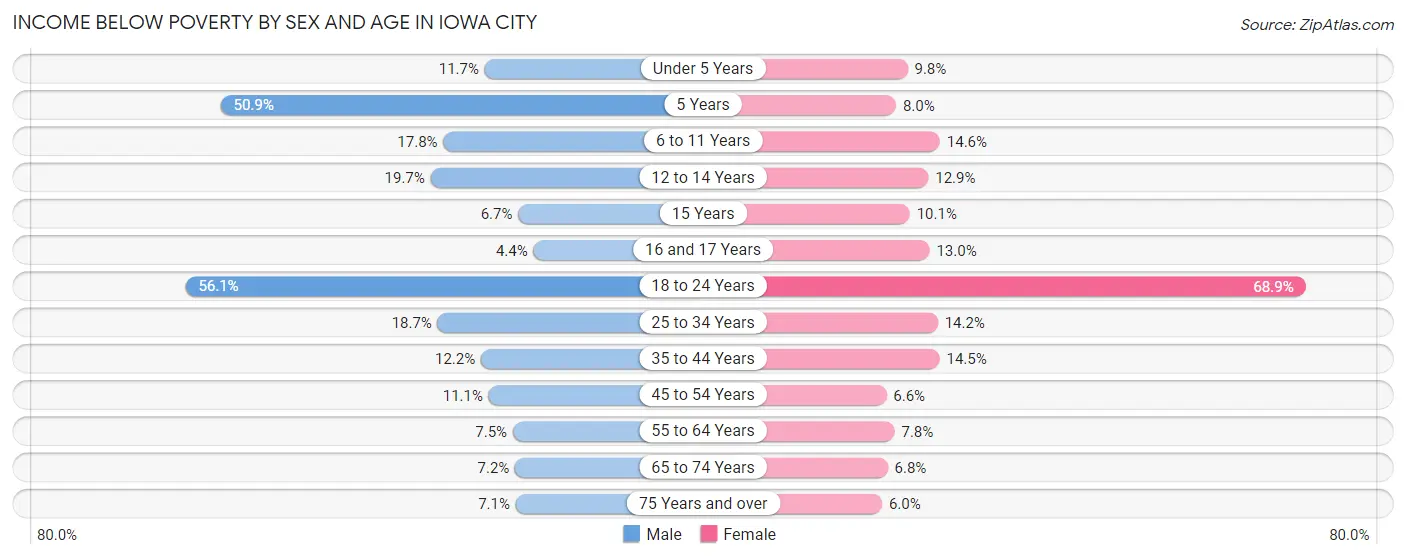
| Age Bracket | Male | Female |
| Under 5 Years | 207 (11.7%) | 128 (9.8%) |
| 5 Years | 227 (50.9%) | 16 (8.0%) |
| 6 to 11 Years | 314 (17.8%) | 259 (14.6%) |
| 12 to 14 Years | 178 (19.7%) | 105 (12.9%) |
| 15 Years | 18 (6.7%) | 23 (10.1%) |
| 16 and 17 Years | 21 (4.4%) | 75 (13.0%) |
| 18 to 24 Years | 5,272 (56.1%) | 7,218 (68.9%) |
| 25 to 34 Years | 1,080 (18.7%) | 682 (14.2%) |
| 35 to 44 Years | 471 (12.2%) | 545 (14.5%) |
| 45 to 54 Years | 362 (11.1%) | 196 (6.6%) |
| 55 to 64 Years | 208 (7.5%) | 222 (7.8%) |
| 65 to 74 Years | 175 (7.1%) | 180 (6.8%) |
| 75 Years and over | 97 (7.1%) | 113 (6.0%) |
| Total | 8,630 (25.0%) | 9,762 (28.5%) |
Income Above Poverty by Sex and Age in Iowa City
According to the poverty statistics in Iowa City, males aged 16 and 17 years and females aged 75 years and over are the age groups that are most secure financially, with 95.6% of males and 94.0% of females in these age groups living above the poverty line.
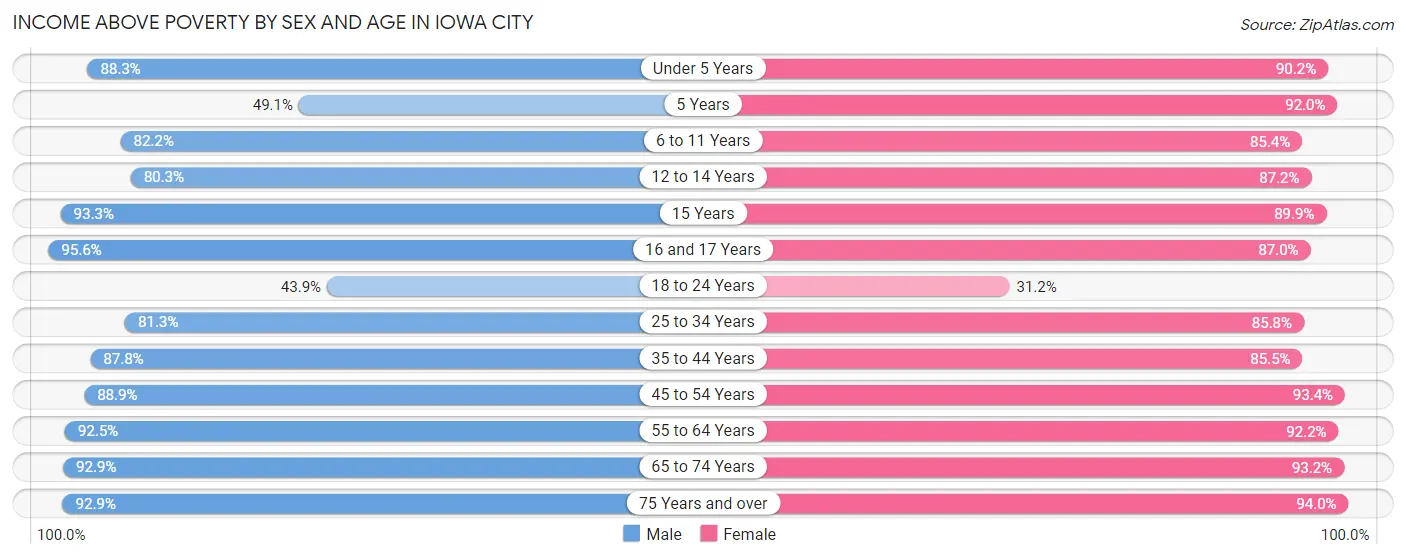
| Age Bracket | Male | Female |
| Under 5 Years | 1,567 (88.3%) | 1,183 (90.2%) |
| 5 Years | 219 (49.1%) | 183 (92.0%) |
| 6 to 11 Years | 1,449 (82.2%) | 1,520 (85.4%) |
| 12 to 14 Years | 725 (80.3%) | 712 (87.2%) |
| 15 Years | 251 (93.3%) | 205 (89.9%) |
| 16 and 17 Years | 453 (95.6%) | 501 (87.0%) |
| 18 to 24 Years | 4,123 (43.9%) | 3,266 (31.1%) |
| 25 to 34 Years | 4,708 (81.3%) | 4,109 (85.8%) |
| 35 to 44 Years | 3,384 (87.8%) | 3,210 (85.5%) |
| 45 to 54 Years | 2,908 (88.9%) | 2,765 (93.4%) |
| 55 to 64 Years | 2,569 (92.5%) | 2,613 (92.2%) |
| 65 to 74 Years | 2,274 (92.8%) | 2,467 (93.2%) |
| 75 Years and over | 1,277 (92.9%) | 1,783 (94.0%) |
| Total | 25,907 (75.0%) | 24,517 (71.5%) |
Income Below Poverty Among Married-Couple Families in Iowa City
The poverty statistics for married-couple families in Iowa City show that 5.2% or 526 of the total 10,093 families live below the poverty line. Families with 5 or more children have the highest poverty rate of 87.2%, comprising of 41 families. On the other hand, families with no children have the lowest poverty rate of 1.3%, which includes 81 families.
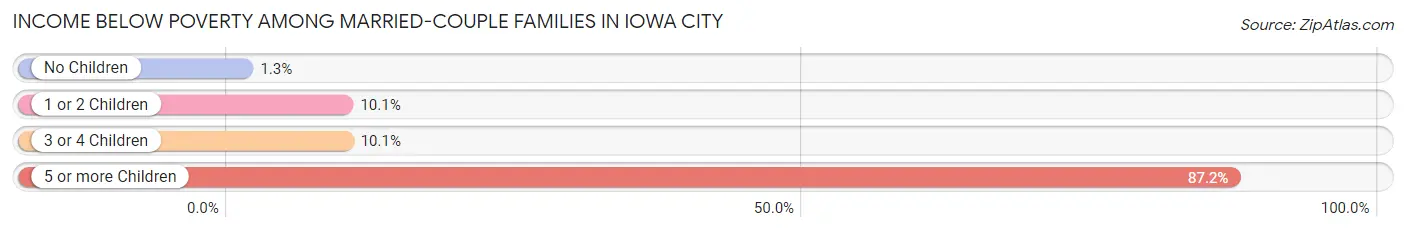
| Children | Above Poverty | Below Poverty |
| No Children | 5,946 (98.7%) | 81 (1.3%) |
| 1 or 2 Children | 2,811 (89.9%) | 314 (10.1%) |
| 3 or 4 Children | 804 (89.9%) | 90 (10.1%) |
| 5 or more Children | 6 (12.8%) | 41 (87.2%) |
| Total | 9,567 (94.8%) | 526 (5.2%) |
Income Below Poverty Among Single-Parent Households in Iowa City
According to the poverty data in Iowa City, 15.5% or 113 single-father households and 25.7% or 439 single-mother households are living below the poverty line. Among single-father households, those with 3 or 4 children have the highest poverty rate, with 23 households (48.9%) experiencing poverty. Likewise, among single-mother households, those with 5 or more children have the highest poverty rate, with 4 households (100.0%) falling below the poverty line.
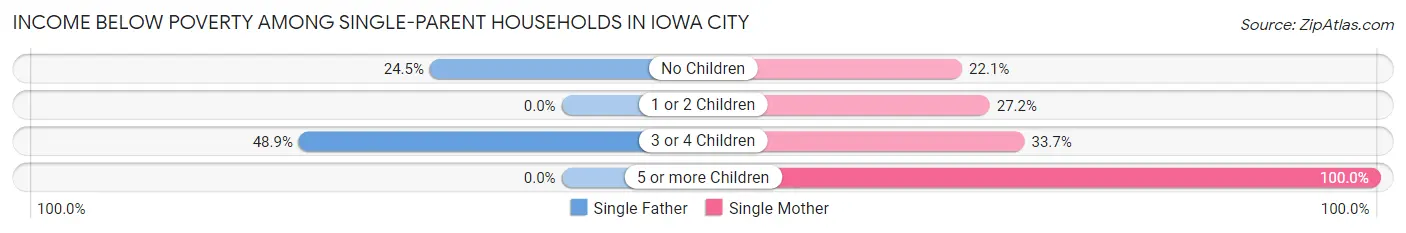
| Children | Single Father | Single Mother |
| No Children | 90 (24.5%) | 173 (22.1%) |
| 1 or 2 Children | 0 (0.0%) | 199 (27.2%) |
| 3 or 4 Children | 23 (48.9%) | 63 (33.7%) |
| 5 or more Children | 0 (0.0%) | 4 (100.0%) |
| Total | 113 (15.5%) | 439 (25.7%) |
Income Below Poverty Among Married-Couple vs Single-Parent Households in Iowa City
The poverty data for Iowa City shows that 526 of the married-couple family households (5.2%) and 552 of the single-parent households (22.7%) are living below the poverty level. Within the married-couple family households, those with 5 or more children have the highest poverty rate, with 41 households (87.2%) falling below the poverty line. Among the single-parent households, those with 5 or more children have the highest poverty rate, with 4 household (100.0%) living below poverty.
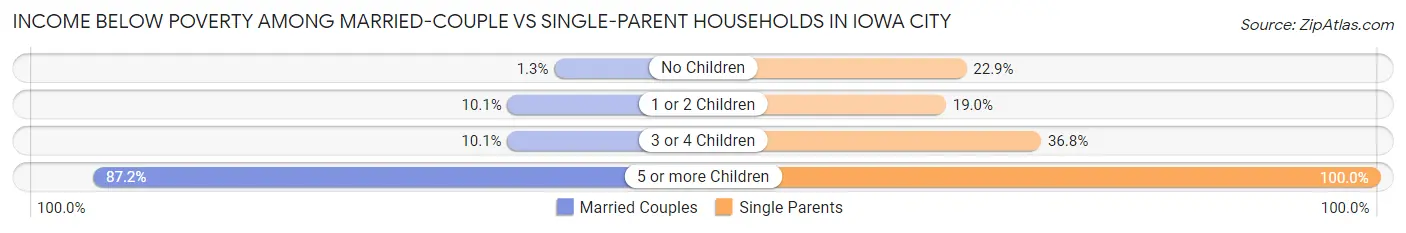
| Children | Married-Couple Families | Single-Parent Households |
| No Children | 81 (1.3%) | 263 (22.9%) |
| 1 or 2 Children | 314 (10.1%) | 199 (19.0%) |
| 3 or 4 Children | 90 (10.1%) | 86 (36.7%) |
| 5 or more Children | 41 (87.2%) | 4 (100.0%) |
| Total | 526 (5.2%) | 552 (22.7%) |
Race in Iowa City
The most populous races in Iowa City are White / Caucasian (56,832 | 75.9%), Black / African American (6,359 | 8.5%), and Asian (5,898 | 7.9%).
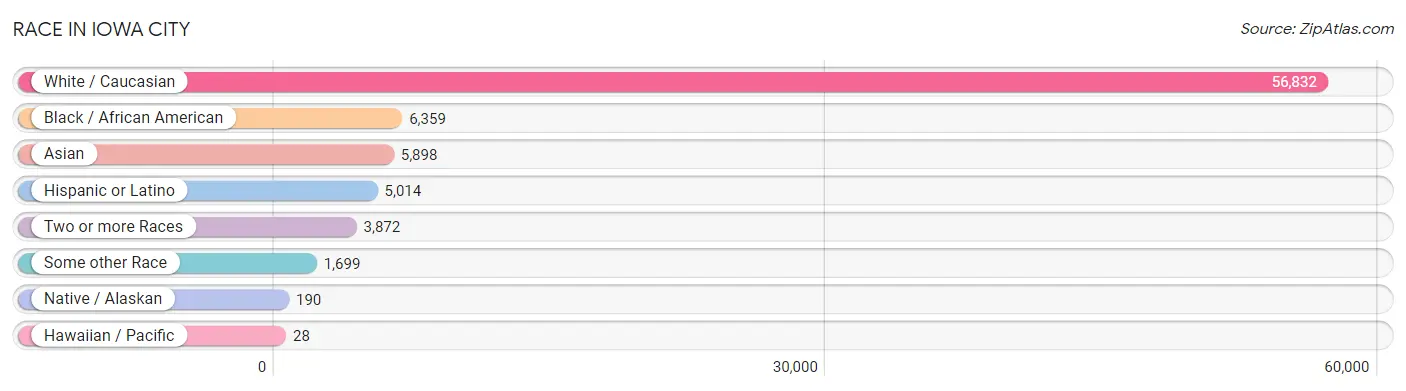
| Race | # Population | % Population |
| Asian | 5,898 | 7.9% |
| Black / African American | 6,359 | 8.5% |
| Hawaiian / Pacific | 28 | 0.0% |
| Hispanic or Latino | 5,014 | 6.7% |
| Native / Alaskan | 190 | 0.3% |
| White / Caucasian | 56,832 | 75.9% |
| Two or more Races | 3,872 | 5.2% |
| Some other Race | 1,699 | 2.3% |
| Total | 74,878 | 100.0% |
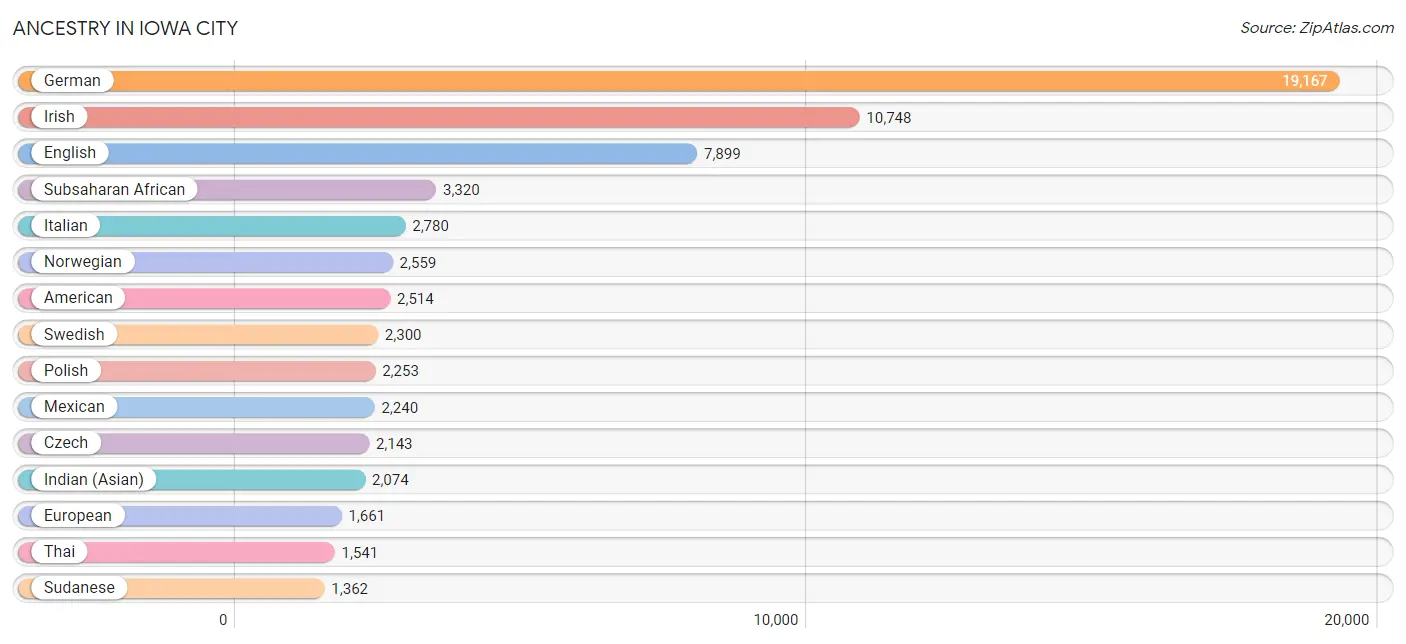
Ancestry in Iowa City
The most populous ancestries reported in Iowa City are German (19,167 | 25.6%), Irish (10,748 | 14.3%), English (7,899 | 10.5%), Subsaharan African (3,320 | 4.4%), and Italian (2,780 | 3.7%), together accounting for 58.6% of all Iowa City residents.
| Ancestry | # Population | % Population |
| African | 867 | 1.2% |
| Albanian | 20 | 0.0% |
| American | 2,514 | 3.4% |
| Apache | 16 | 0.0% |
| Arab | 1,290 | 1.7% |
| Argentinean | 34 | 0.1% |
| Armenian | 64 | 0.1% |
| Assyrian / Chaldean / Syriac | 14 | 0.0% |
| Australian | 12 | 0.0% |
| Austrian | 97 | 0.1% |
| Bahamian | 11 | 0.0% |
| Bangladeshi | 89 | 0.1% |
| Basque | 10 | 0.0% |
| Belgian | 194 | 0.3% |
| Bhutanese | 198 | 0.3% |
| Bolivian | 62 | 0.1% |
| Brazilian | 53 | 0.1% |
| British | 556 | 0.7% |
| British West Indian | 34 | 0.1% |
| Bulgarian | 4 | 0.0% |
| Burmese | 1,142 | 1.5% |
| Cambodian | 13 | 0.0% |
| Canadian | 130 | 0.2% |
| Celtic | 20 | 0.0% |
| Central American | 846 | 1.1% |
| Central American Indian | 127 | 0.2% |
| Cherokee | 109 | 0.2% |
| Chilean | 51 | 0.1% |
| Chippewa | 3 | 0.0% |
| Colombian | 234 | 0.3% |
| Costa Rican | 20 | 0.0% |
| Croatian | 70 | 0.1% |
| Crow | 19 | 0.0% |
| Cuban | 231 | 0.3% |
| Czech | 2,143 | 2.9% |
| Czechoslovakian | 195 | 0.3% |
| Danish | 1,197 | 1.6% |
| Dominican | 25 | 0.0% |
| Dutch | 1,145 | 1.5% |
| Eastern European | 221 | 0.3% |
| Egyptian | 11 | 0.0% |
| English | 7,899 | 10.5% |
| Estonian | 3 | 0.0% |
| European | 1,661 | 2.2% |
| Fijian | 20 | 0.0% |
| Filipino | 60 | 0.1% |
| Finnish | 128 | 0.2% |
| French | 1,212 | 1.6% |
| French Canadian | 353 | 0.5% |
| German | 19,167 | 25.6% |
| Ghanaian | 16 | 0.0% |
| Greek | 173 | 0.2% |
| Guamanian / Chamorro | 8 | 0.0% |
| Guatemalan | 145 | 0.2% |
| Haitian | 10 | 0.0% |
| Honduran | 465 | 0.6% |
| Hungarian | 117 | 0.2% |
| Icelander | 91 | 0.1% |
| Indian (Asian) | 2,074 | 2.8% |
| Indonesian | 13 | 0.0% |
| Iranian | 230 | 0.3% |
| Iraqi | 124 | 0.2% |
| Irish | 10,748 | 14.3% |
| Israeli | 30 | 0.0% |
| Italian | 2,780 | 3.7% |
| Jamaican | 85 | 0.1% |
| Japanese | 41 | 0.1% |
| Jordanian | 25 | 0.0% |
| Kenyan | 375 | 0.5% |
| Korean | 439 | 0.6% |
| Laotian | 4 | 0.0% |
| Lebanese | 174 | 0.2% |
| Lithuanian | 158 | 0.2% |
| Luxembourger | 86 | 0.1% |
| Malaysian | 15 | 0.0% |
| Maltese | 15 | 0.0% |
| Mexican | 2,240 | 3.0% |
| Mexican American Indian | 45 | 0.1% |
| Mongolian | 39 | 0.1% |
| Moroccan | 65 | 0.1% |
| Native Hawaiian | 38 | 0.1% |
| Nigerian | 71 | 0.1% |
| Northern European | 391 | 0.5% |
| Norwegian | 2,559 | 3.4% |
| Okinawan | 25 | 0.0% |
| Pakistani | 76 | 0.1% |
| Palestinian | 305 | 0.4% |
| Pennsylvania German | 27 | 0.0% |
| Peruvian | 23 | 0.0% |
| Polish | 2,253 | 3.0% |
| Portuguese | 58 | 0.1% |
| Potawatomi | 34 | 0.1% |
| Puerto Rican | 601 | 0.8% |
| Romanian | 8 | 0.0% |
| Russian | 458 | 0.6% |
| Salvadoran | 216 | 0.3% |
| Samoan | 1 | 0.0% |
| Scandinavian | 401 | 0.5% |
| Scotch-Irish | 462 | 0.6% |
| Scottish | 1,211 | 1.6% |
| Serbian | 63 | 0.1% |
| Sioux | 85 | 0.1% |
| Slavic | 27 | 0.0% |
| Slovak | 90 | 0.1% |
| Slovene | 59 | 0.1% |
| South African | 3 | 0.0% |
| South American | 524 | 0.7% |
| Spaniard | 58 | 0.1% |
| Spanish | 252 | 0.3% |
| Sri Lankan | 1,066 | 1.4% |
| Subsaharan African | 3,320 | 4.4% |
| Sudanese | 1,362 | 1.8% |
| Swedish | 2,300 | 3.1% |
| Swiss | 563 | 0.7% |
| Syrian | 39 | 0.1% |
| Thai | 1,541 | 2.1% |
| Tongan | 11 | 0.0% |
| Trinidadian and Tobagonian | 29 | 0.0% |
| Turkish | 42 | 0.1% |
| Ukrainian | 86 | 0.1% |
| Uruguayan | 42 | 0.1% |
| Venezuelan | 78 | 0.1% |
| Vietnamese | 91 | 0.1% |
| Welsh | 546 | 0.7% |
| West Indian | 19 | 0.0% |
| Yaqui | 3 | 0.0% |
| Yugoslavian | 97 | 0.1% | View All 127 Rows |
Immigrants in Iowa City
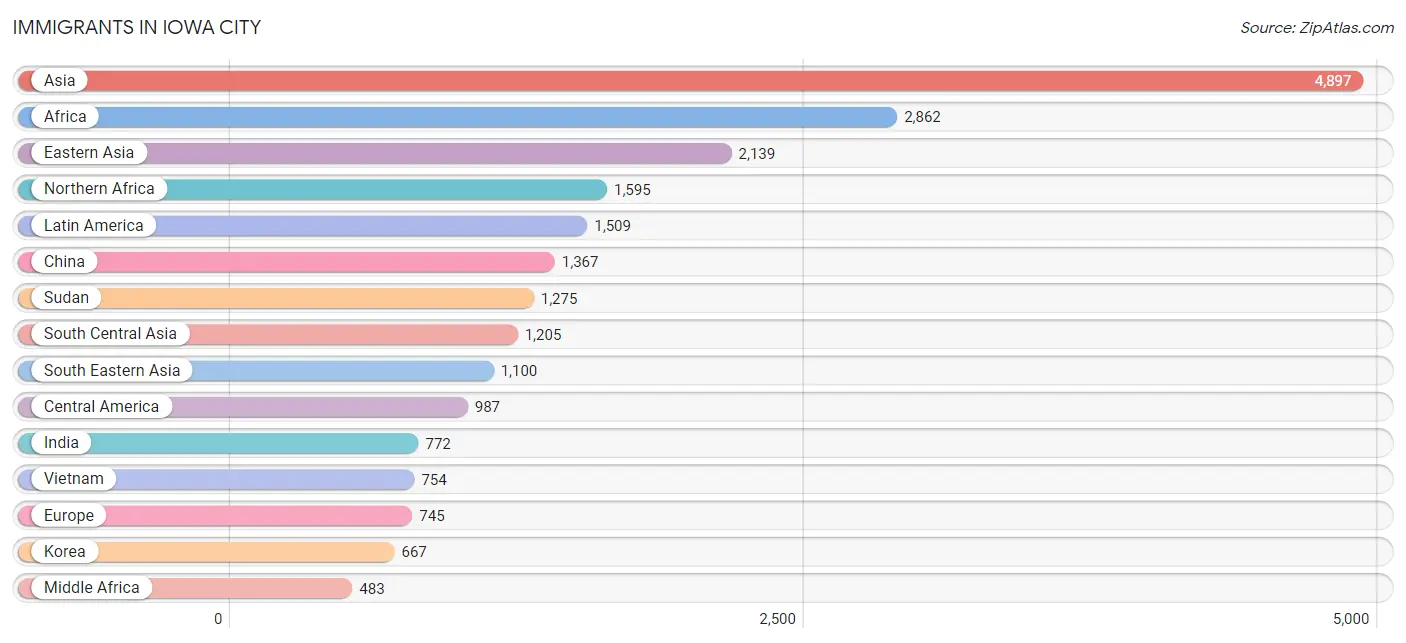
The most numerous immigrant groups reported in Iowa City came from Asia (4,897 | 6.5%), Africa (2,862 | 3.8%), Eastern Asia (2,139 | 2.9%), Northern Africa (1,595 | 2.1%), and Latin America (1,509 | 2.0%), together accounting for 17.4% of all Iowa City residents.
| Immigration Origin | # Population | % Population |
| Africa | 2,862 | 3.8% |
| Argentina | 11 | 0.0% |
| Armenia | 22 | 0.0% |
| Asia | 4,897 | 6.5% |
| Australia | 24 | 0.0% |
| Austria | 14 | 0.0% |
| Bangladesh | 157 | 0.2% |
| Bosnia and Herzegovina | 60 | 0.1% |
| Brazil | 52 | 0.1% |
| Cambodia | 14 | 0.0% |
| Canada | 157 | 0.2% |
| Caribbean | 200 | 0.3% |
| Central America | 987 | 1.3% |
| Chile | 27 | 0.0% |
| China | 1,367 | 1.8% |
| Colombia | 129 | 0.2% |
| Congo | 18 | 0.0% |
| Cuba | 149 | 0.2% |
| Czechoslovakia | 44 | 0.1% |
| Denmark | 11 | 0.0% |
| Dominican Republic | 32 | 0.0% |
| Eastern Africa | 212 | 0.3% |
| Eastern Asia | 2,139 | 2.9% |
| Eastern Europe | 340 | 0.4% |
| Egypt | 65 | 0.1% |
| El Salvador | 198 | 0.3% |
| England | 40 | 0.1% |
| Ethiopia | 18 | 0.0% |
| Europe | 745 | 1.0% |
| France | 13 | 0.0% |
| Germany | 108 | 0.1% |
| Ghana | 2 | 0.0% |
| Guatemala | 63 | 0.1% |
| Guyana | 10 | 0.0% |
| Honduras | 282 | 0.4% |
| Hong Kong | 3 | 0.0% |
| India | 772 | 1.0% |
| Indonesia | 9 | 0.0% |
| Iran | 95 | 0.1% |
| Iraq | 100 | 0.1% |
| Israel | 26 | 0.0% |
| Italy | 61 | 0.1% |
| Jamaica | 17 | 0.0% |
| Japan | 105 | 0.1% |
| Jordan | 131 | 0.2% |
| Kazakhstan | 18 | 0.0% |
| Kenya | 179 | 0.2% |
| Korea | 667 | 0.9% |
| Latin America | 1,509 | 2.0% |
| Lebanon | 21 | 0.0% |
| Malaysia | 63 | 0.1% |
| Mexico | 444 | 0.6% |
| Middle Africa | 483 | 0.6% |
| Morocco | 47 | 0.1% |
| Nepal | 19 | 0.0% |
| Netherlands | 15 | 0.0% |
| Nigeria | 67 | 0.1% |
| North Macedonia | 11 | 0.0% |
| Northern Africa | 1,595 | 2.1% |
| Northern Europe | 115 | 0.2% |
| Oceania | 116 | 0.2% |
| Pakistan | 25 | 0.0% |
| Philippines | 89 | 0.1% |
| Poland | 77 | 0.1% |
| Russia | 82 | 0.1% |
| Saudi Arabia | 75 | 0.1% |
| Sierra Leone | 69 | 0.1% |
| Singapore | 60 | 0.1% |
| South Africa | 151 | 0.2% |
| South America | 322 | 0.4% |
| South Central Asia | 1,205 | 1.6% |
| South Eastern Asia | 1,100 | 1.5% |
| Southern Europe | 132 | 0.2% |
| Spain | 71 | 0.1% |
| Sri Lanka | 110 | 0.2% |
| Sudan | 1,275 | 1.7% |
| Switzerland | 8 | 0.0% |
| Taiwan | 40 | 0.1% |
| Thailand | 111 | 0.2% |
| Turkey | 29 | 0.0% |
| Uganda | 15 | 0.0% |
| Ukraine | 8 | 0.0% |
| Venezuela | 93 | 0.1% |
| Vietnam | 754 | 1.0% |
| Western Africa | 421 | 0.6% |
| Western Asia | 453 | 0.6% |
| Western Europe | 158 | 0.2% |
| Zaire | 465 | 0.6% | View All 88 Rows |
Sex and Age in Iowa City
Sex and Age in Iowa City
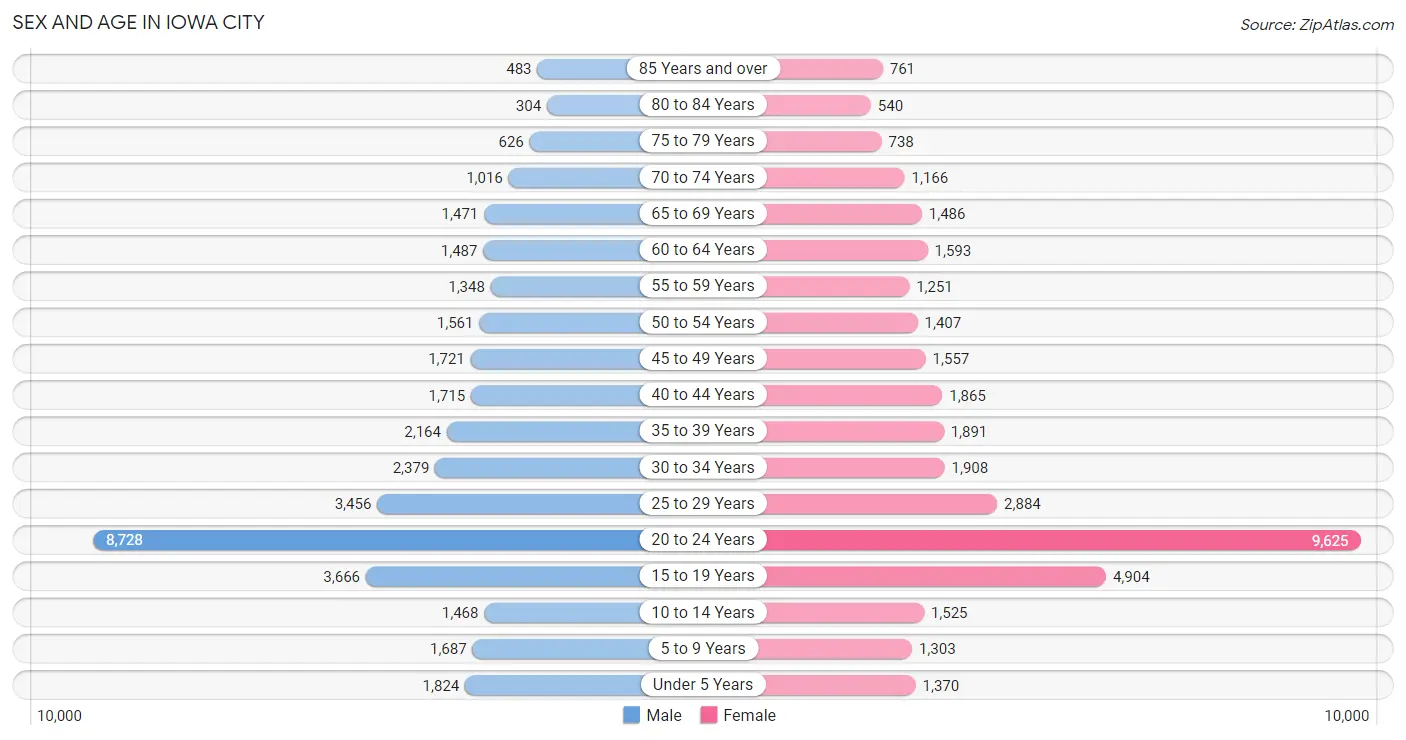
The most populous age groups in Iowa City are 20 to 24 Years (8,728 | 23.5%) for men and 20 to 24 Years (9,625 | 25.5%) for women.
| Age Bracket | Male | Female |
| Under 5 Years | 1,824 (4.9%) | 1,370 (3.6%) |
| 5 to 9 Years | 1,687 (4.5%) | 1,303 (3.5%) |
| 10 to 14 Years | 1,468 (4.0%) | 1,525 (4.0%) |
| 15 to 19 Years | 3,666 (9.9%) | 4,904 (13.0%) |
| 20 to 24 Years | 8,728 (23.5%) | 9,625 (25.5%) |
| 25 to 29 Years | 3,456 (9.3%) | 2,884 (7.6%) |
| 30 to 34 Years | 2,379 (6.4%) | 1,908 (5.1%) |
| 35 to 39 Years | 2,164 (5.8%) | 1,891 (5.0%) |
| 40 to 44 Years | 1,715 (4.6%) | 1,865 (4.9%) |
| 45 to 49 Years | 1,721 (4.6%) | 1,557 (4.1%) |
| 50 to 54 Years | 1,561 (4.2%) | 1,407 (3.7%) |
| 55 to 59 Years | 1,348 (3.6%) | 1,251 (3.3%) |
| 60 to 64 Years | 1,487 (4.0%) | 1,593 (4.2%) |
| 65 to 69 Years | 1,471 (4.0%) | 1,486 (3.9%) |
| 70 to 74 Years | 1,016 (2.7%) | 1,166 (3.1%) |
| 75 to 79 Years | 626 (1.7%) | 738 (1.9%) |
| 80 to 84 Years | 304 (0.8%) | 540 (1.4%) |
| 85 Years and over | 483 (1.3%) | 761 (2.0%) |
| Total | 37,104 (100.0%) | 37,774 (100.0%) |
Families and Households in Iowa City
Median Family Size in Iowa City
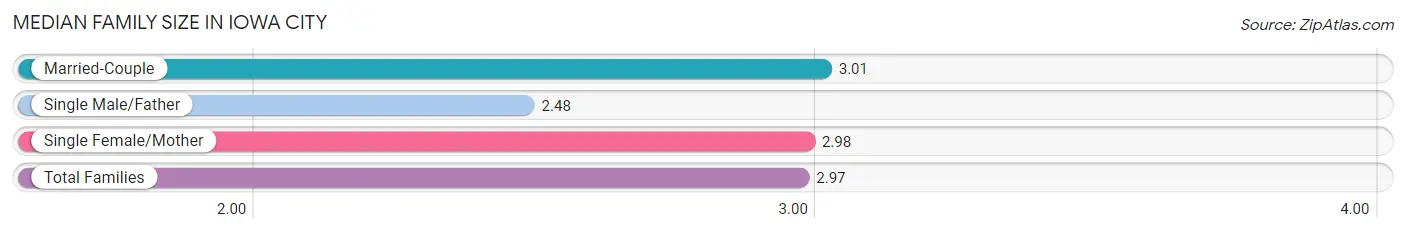
The median family size in Iowa City is 2.97 persons per family, with married-couple families (10,093 | 80.6%) accounting for the largest median family size of 3.01 persons per family. On the other hand, single male/father families (729 | 5.8%) represent the smallest median family size with 2.48 persons per family.
| Family Type | # Families | Family Size |
| Married-Couple | 10,093 (80.6%) | 3.01 |
| Single Male/Father | 729 (5.8%) | 2.48 |
| Single Female/Mother | 1,706 (13.6%) | 2.98 |
| Total Families | 12,528 (100.0%) | 2.97 |
Median Household Size in Iowa City
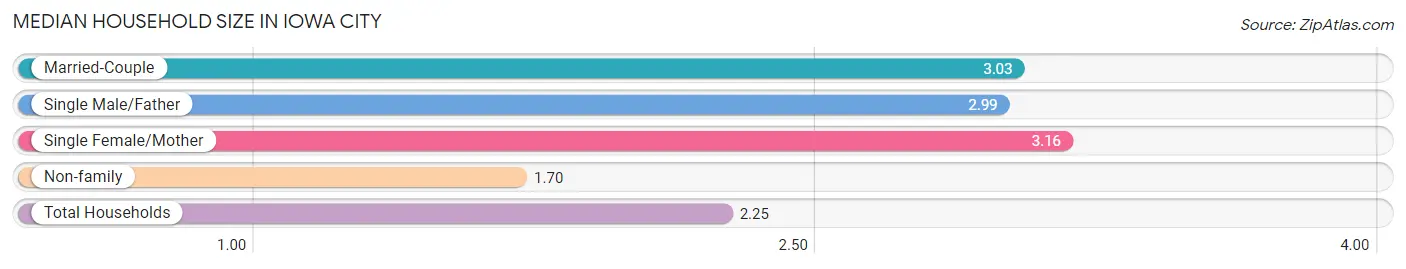
The median household size in Iowa City is 2.25 persons per household, with single female/mother households (1,706 | 5.6%) accounting for the largest median household size of 3.16 persons per household. non-family households (18,016 | 59.0%) represent the smallest median household size with 1.70 persons per household.
| Household Type | # Households | Household Size |
| Married-Couple | 10,093 (33.0%) | 3.03 |
| Single Male/Father | 729 (2.4%) | 2.99 |
| Single Female/Mother | 1,706 (5.6%) | 3.16 |
| Non-family | 18,016 (59.0%) | 1.70 |
| Total Households | 30,544 (100.0%) | 2.25 |
Household Size by Marriage Status in Iowa City
Out of a total of 30,544 households in Iowa City, 12,528 (41.0%) are family households, while 18,016 (59.0%) are nonfamily households. The most numerous type of family households are 2-person households, comprising 6,364, and the most common type of nonfamily households are 1-person households, comprising 10,984.
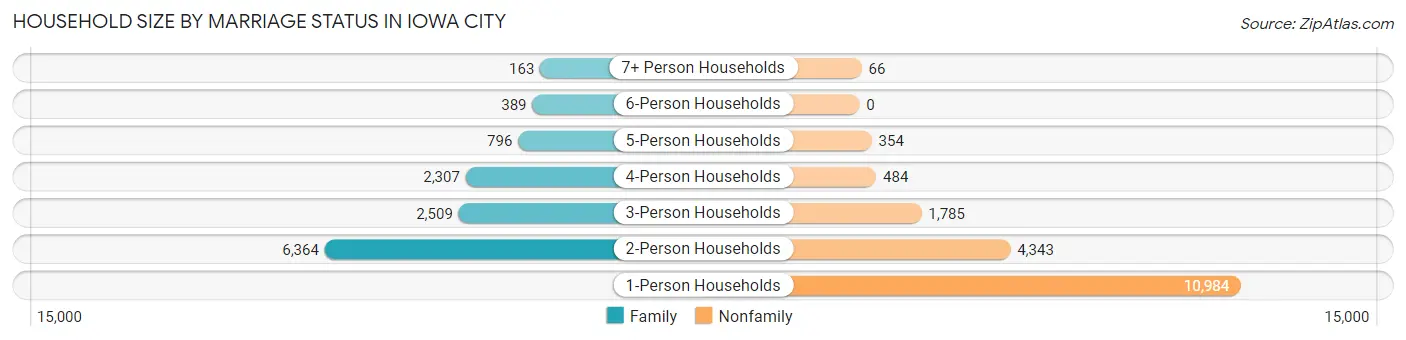
| Household Size | Family Households | Nonfamily Households |
| 1-Person Households | - | 10,984 (36.0%) |
| 2-Person Households | 6,364 (20.8%) | 4,343 (14.2%) |
| 3-Person Households | 2,509 (8.2%) | 1,785 (5.8%) |
| 4-Person Households | 2,307 (7.5%) | 484 (1.6%) |
| 5-Person Households | 796 (2.6%) | 354 (1.2%) |
| 6-Person Households | 389 (1.3%) | 0 (0.0%) |
| 7+ Person Households | 163 (0.5%) | 66 (0.2%) |
| Total | 12,528 (41.0%) | 18,016 (59.0%) |
Female Fertility in Iowa City
Fertility by Age in Iowa City
Average fertility rate in Iowa City is 26.0 births per 1,000 women. Women in the age bracket of 20 to 34 years have the highest fertility rate with 34.0 births per 1,000 women. Women in the age bracket of 20 to 34 years acount for 74.6% of all women with births.
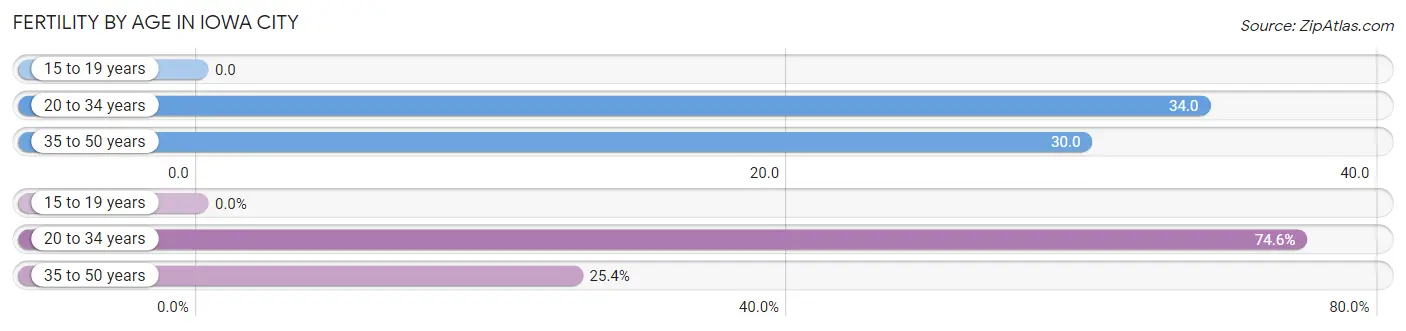
| Age Bracket | Women with Births | Births / 1,000 Women |
| 15 to 19 years | 0 (0.0%) | 0.0 |
| 20 to 34 years | 490 (74.6%) | 34.0 |
| 35 to 50 years | 167 (25.4%) | 30.0 |
| Total | 657 (100.0%) | 26.0 |
Fertility by Age by Marriage Status in Iowa City
79.6% of women with births (657) in Iowa City are married. The highest percentage of unmarried women with births falls into 35 to 50 years age bracket with 28.1% of them unmarried at the time of birth, while the lowest percentage of unmarried women with births belong to 20 to 34 years age bracket with 17.8% of them unmarried.
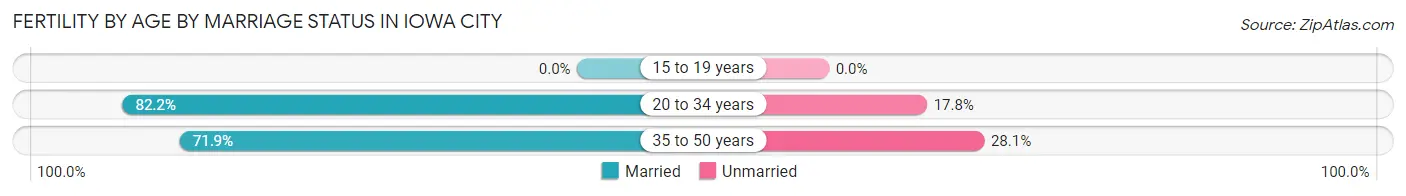
| Age Bracket | Married | Unmarried |
| 15 to 19 years | 0 (0.0%) | 0 (0.0%) |
| 20 to 34 years | 403 (82.2%) | 87 (17.8%) |
| 35 to 50 years | 120 (71.9%) | 47 (28.1%) |
| Total | 523 (79.6%) | 134 (20.4%) |
Fertility by Education in Iowa City
Average fertility rate in Iowa City is 26.0 births per 1,000 women. Women with the education attainment of bachelor's degree have the highest fertility rate of 69.0 births per 1,000 women, while women with the education attainment of high school diploma have the lowest fertility at 3.0 births per 1,000 women. Women with the education attainment of bachelor's degree represent 58.5% of all women with births.
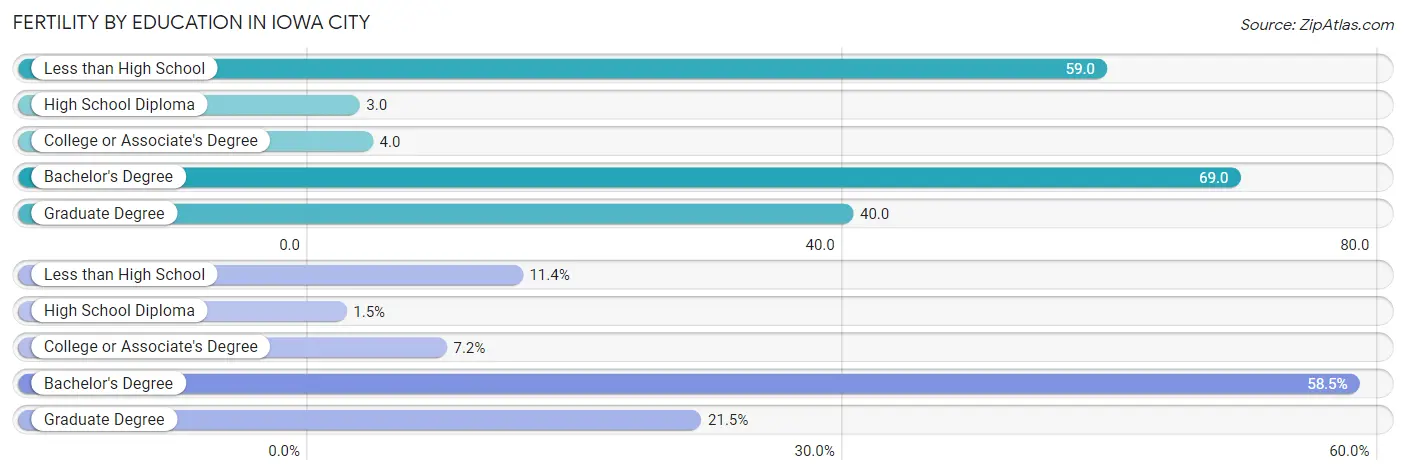
| Educational Attainment | Women with Births | Births / 1,000 Women |
| Less than High School | 75 (11.4%) | 59.0 |
| High School Diploma | 10 (1.5%) | 3.0 |
| College or Associate's Degree | 47 (7.1%) | 4.0 |
| Bachelor's Degree | 384 (58.5%) | 69.0 |
| Graduate Degree | 141 (21.5%) | 40.0 |
| Total | 657 (100.0%) | 26.0 |
Fertility by Education by Marriage Status in Iowa City
20.4% of women with births in Iowa City are unmarried. Women with the educational attainment of high school diploma are most likely to be married with 100.0% of them married at childbirth, while women with the educational attainment of less than high school are least likely to be married with 76.0% of them unmarried at childbirth.
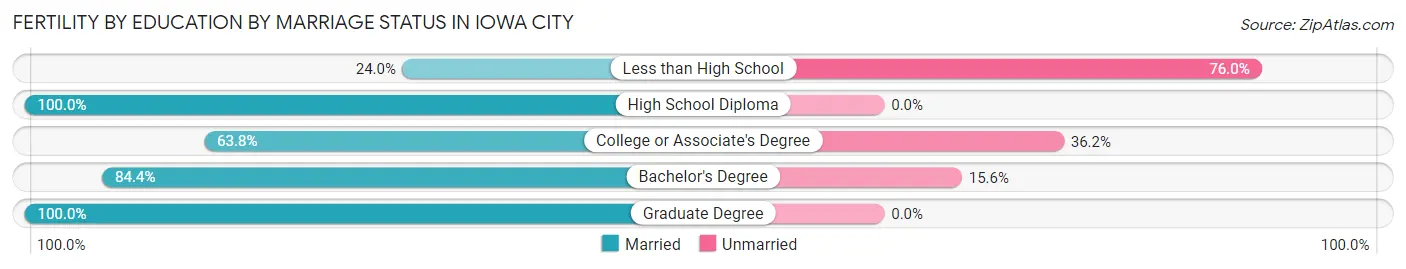
| Educational Attainment | Married | Unmarried |
| Less than High School | 18 (24.0%) | 57 (76.0%) |
| High School Diploma | 10 (100.0%) | 0 (0.0%) |
| College or Associate's Degree | 30 (63.8%) | 17 (36.2%) |
| Bachelor's Degree | 324 (84.4%) | 60 (15.6%) |
| Graduate Degree | 141 (100.0%) | 0 (0.0%) |
| Total | 523 (79.6%) | 134 (20.4%) |
Employment Characteristics in Iowa City
Employment by Class of Employer in Iowa City
Among the 40,631 employed individuals in Iowa City, private company employees (21,147 | 52.0%), state government employees (9,441 | 23.2%), and not-for-profit organizations (4,485 | 11.0%) make up the most common classes of employment.
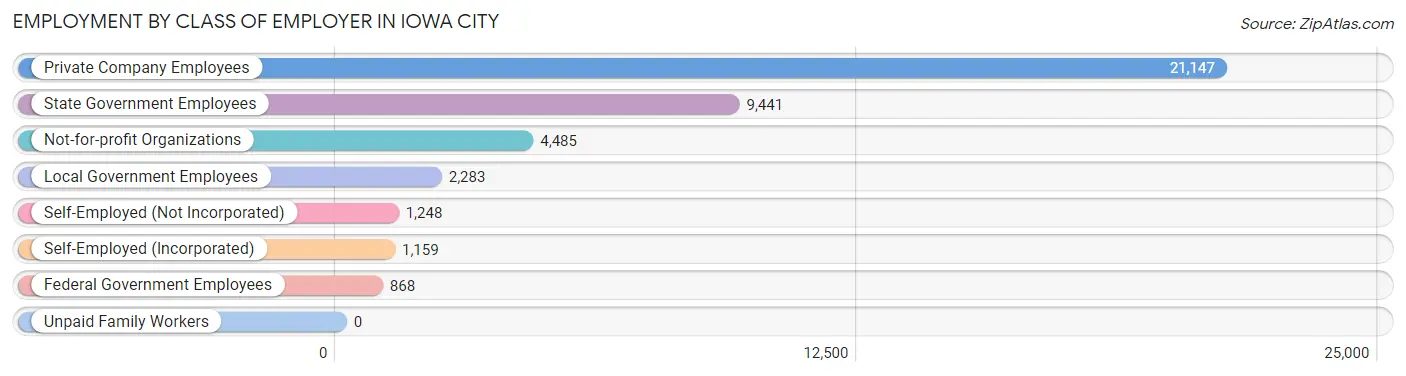
| Employer Class | # Employees | % Employees |
| Private Company Employees | 21,147 | 52.0% |
| Self-Employed (Incorporated) | 1,159 | 2.9% |
| Self-Employed (Not Incorporated) | 1,248 | 3.1% |
| Not-for-profit Organizations | 4,485 | 11.0% |
| Local Government Employees | 2,283 | 5.6% |
| State Government Employees | 9,441 | 23.2% |
| Federal Government Employees | 868 | 2.1% |
| Unpaid Family Workers | 0 | 0.0% |
| Total | 40,631 | 100.0% |
Employment Status by Age in Iowa City
According to the labor force statistics for Iowa City, out of the total population over 16 years of age (65,203), 67.9% or 44,273 individuals are in the labor force, with 4.8% or 2,125 of them unemployed. The age group with the highest labor force participation rate is 45 to 54 years, with 88.1% or 5,503 individuals in the labor force. Within the labor force, the 16 to 19 years age range has the highest percentage of unemployed individuals, with 11.4% or 441 of them being unemployed.
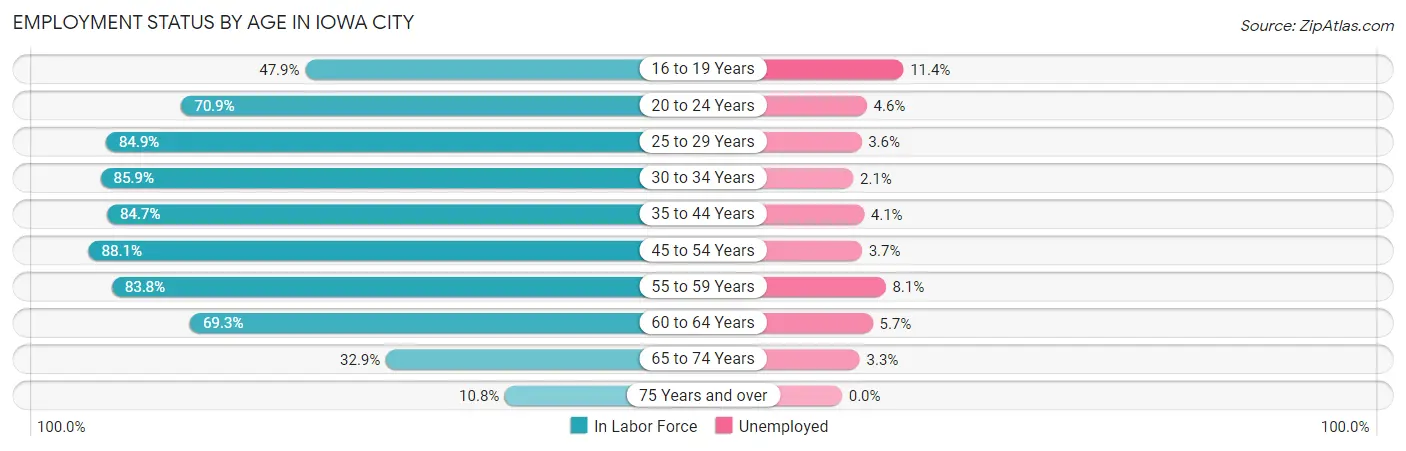
| Age Bracket | In Labor Force | Unemployed |
| 16 to 19 Years | 3,866 (47.9%) | 441 (11.4%) |
| 20 to 24 Years | 13,012 (70.9%) | 599 (4.6%) |
| 25 to 29 Years | 5,383 (84.9%) | 194 (3.6%) |
| 30 to 34 Years | 3,683 (85.9%) | 77 (2.1%) |
| 35 to 44 Years | 6,467 (84.7%) | 265 (4.1%) |
| 45 to 54 Years | 5,503 (88.1%) | 204 (3.7%) |
| 55 to 59 Years | 2,178 (83.8%) | 176 (8.1%) |
| 60 to 64 Years | 2,134 (69.3%) | 122 (5.7%) |
| 65 to 74 Years | 1,691 (32.9%) | 56 (3.3%) |
| 75 Years and over | 373 (10.8%) | 0 (0.0%) |
| Total | 44,273 (67.9%) | 2,125 (4.8%) |
Employment Status by Educational Attainment in Iowa City
According to labor force statistics for Iowa City, 84.0% of individuals (25,357) out of the total population between 25 and 64 years of age (30,187) are in the labor force, with 4.1% or 1,040 of them being unemployed. The group with the highest labor force participation rate are those with the educational attainment of bachelor's degree or higher, with 86.8% or 16,159 individuals in the labor force. Within the labor force, individuals with less than high school education have the highest percentage of unemployment, with 15.4% or 106 of them being unemployed.
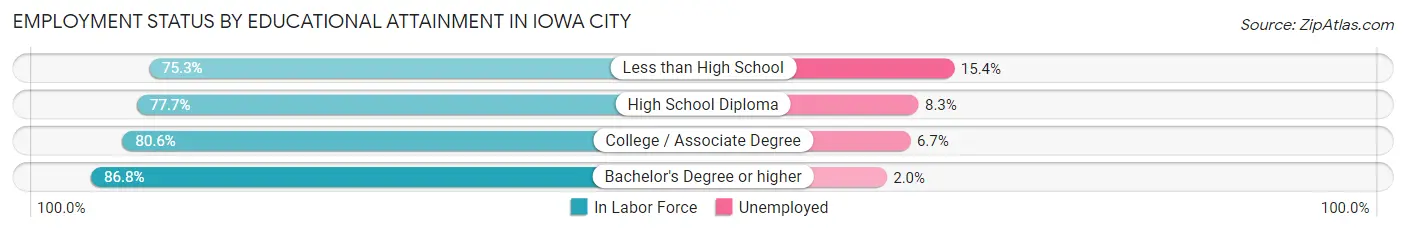
| Educational Attainment | In Labor Force | Unemployed |
| Less than High School | 689 (75.3%) | 141 (15.4%) |
| High School Diploma | 2,693 (77.7%) | 288 (8.3%) |
| College / Associate Degree | 5,795 (80.6%) | 482 (6.7%) |
| Bachelor's Degree or higher | 16,159 (86.8%) | 372 (2.0%) |
| Total | 25,357 (84.0%) | 1,238 (4.1%) |
Employment Occupations by Sex in Iowa City
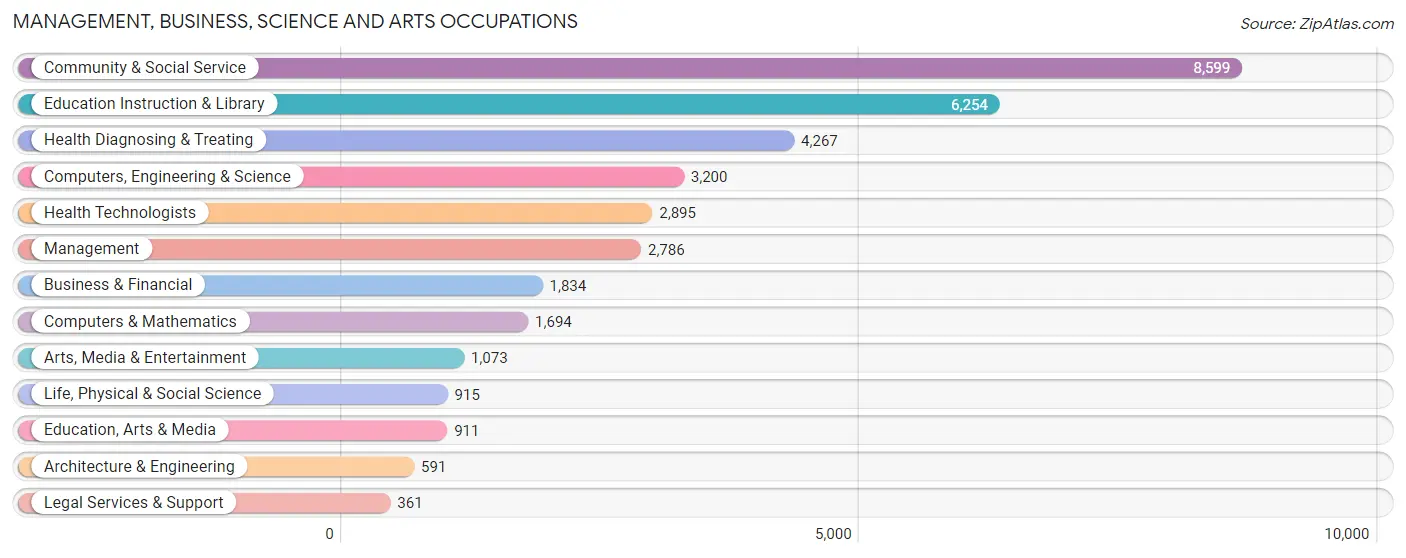
Management, Business, Science and Arts Occupations
The most common Management, Business, Science and Arts occupations in Iowa City are Community & Social Service (8,599 | 20.5%), Education Instruction & Library (6,254 | 14.9%), Health Diagnosing & Treating (4,267 | 10.2%), Computers, Engineering & Science (3,200 | 7.6%), and Health Technologists (2,895 | 6.9%).
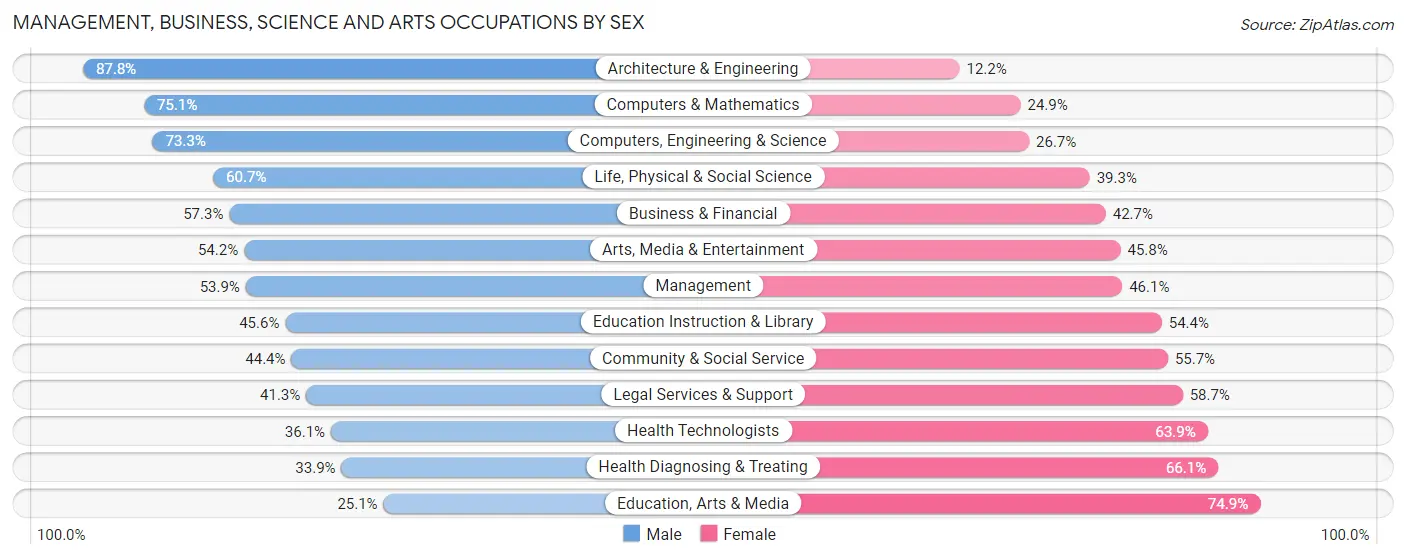
Management, Business, Science and Arts Occupations by Sex
Within the Management, Business, Science and Arts occupations in Iowa City, the most male-oriented occupations are Architecture & Engineering (87.8%), Computers & Mathematics (75.1%), and Computers, Engineering & Science (73.3%), while the most female-oriented occupations are Education, Arts & Media (74.9%), Health Diagnosing & Treating (66.1%), and Health Technologists (63.9%).
| Occupation | Male | Female |
| Management | 1,501 (53.9%) | 1,285 (46.1%) |
| Business & Financial | 1,051 (57.3%) | 783 (42.7%) |
| Computers, Engineering & Science | 2,346 (73.3%) | 854 (26.7%) |
| Computers & Mathematics | 1,272 (75.1%) | 422 (24.9%) |
| Architecture & Engineering | 519 (87.8%) | 72 (12.2%) |
| Life, Physical & Social Science | 555 (60.7%) | 360 (39.3%) |
| Community & Social Service | 3,814 (44.4%) | 4,785 (55.6%) |
| Education, Arts & Media | 229 (25.1%) | 682 (74.9%) |
| Legal Services & Support | 149 (41.3%) | 212 (58.7%) |
| Education Instruction & Library | 2,854 (45.6%) | 3,400 (54.4%) |
| Arts, Media & Entertainment | 582 (54.2%) | 491 (45.8%) |
| Health Diagnosing & Treating | 1,447 (33.9%) | 2,820 (66.1%) |
| Health Technologists | 1,045 (36.1%) | 1,850 (63.9%) |
| Total (Category) | 10,159 (49.1%) | 10,527 (50.9%) |
| Total (Overall) | 21,221 (50.5%) | 20,758 (49.4%) |
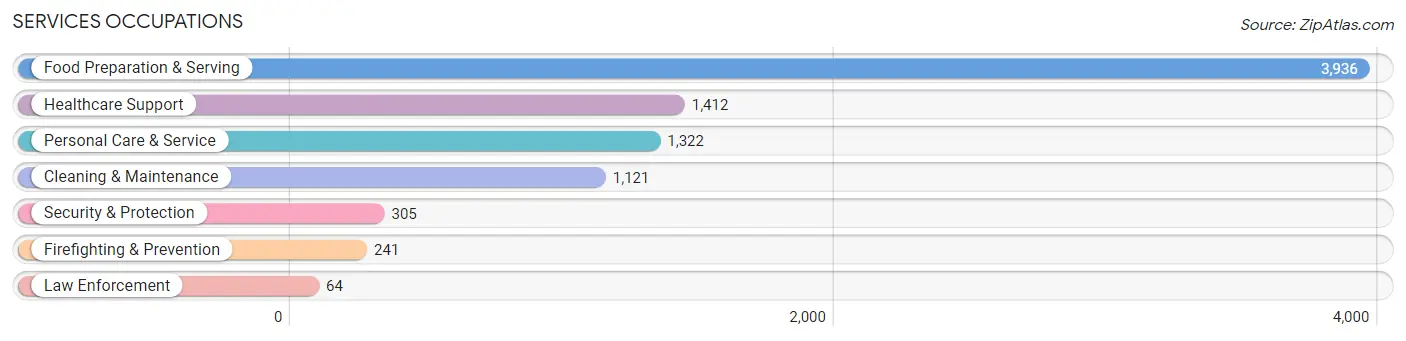
Services Occupations
The most common Services occupations in Iowa City are Food Preparation & Serving (3,936 | 9.4%), Healthcare Support (1,412 | 3.4%), Personal Care & Service (1,322 | 3.2%), Cleaning & Maintenance (1,121 | 2.7%), and Security & Protection (305 | 0.7%).
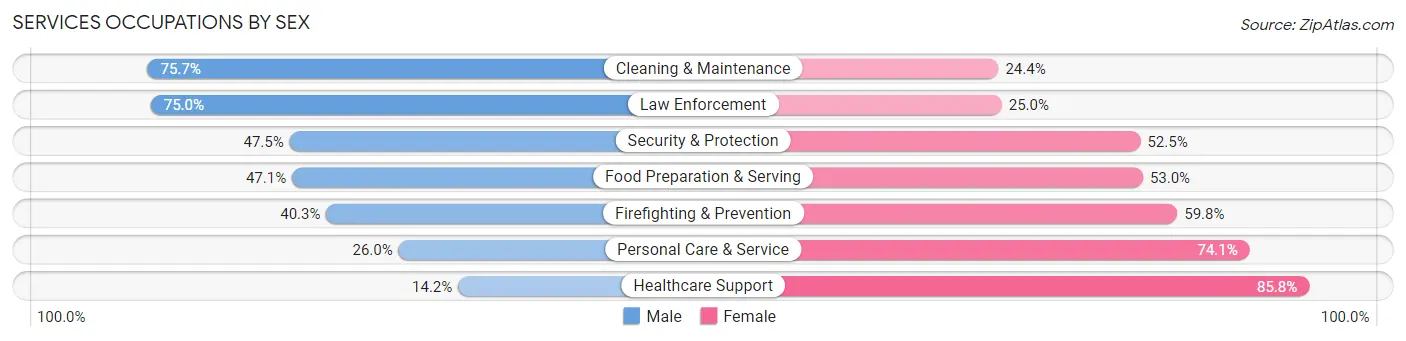
Services Occupations by Sex
Within the Services occupations in Iowa City, the most male-oriented occupations are Cleaning & Maintenance (75.6%), Law Enforcement (75.0%), and Security & Protection (47.5%), while the most female-oriented occupations are Healthcare Support (85.8%), Personal Care & Service (74.1%), and Firefighting & Prevention (59.8%).
| Occupation | Male | Female |
| Healthcare Support | 200 (14.2%) | 1,212 (85.8%) |
| Security & Protection | 145 (47.5%) | 160 (52.5%) |
| Firefighting & Prevention | 97 (40.3%) | 144 (59.8%) |
| Law Enforcement | 48 (75.0%) | 16 (25.0%) |
| Food Preparation & Serving | 1,852 (47.0%) | 2,084 (52.9%) |
| Cleaning & Maintenance | 848 (75.6%) | 273 (24.3%) |
| Personal Care & Service | 343 (26.0%) | 979 (74.1%) |
| Total (Category) | 3,388 (41.8%) | 4,708 (58.2%) |
| Total (Overall) | 21,221 (50.5%) | 20,758 (49.4%) |
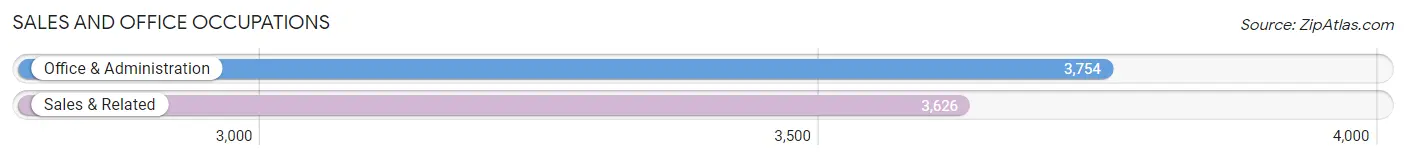
Sales and Office Occupations
The most common Sales and Office occupations in Iowa City are Office & Administration (3,754 | 8.9%), and Sales & Related (3,626 | 8.6%).
Sales and Office Occupations by Sex
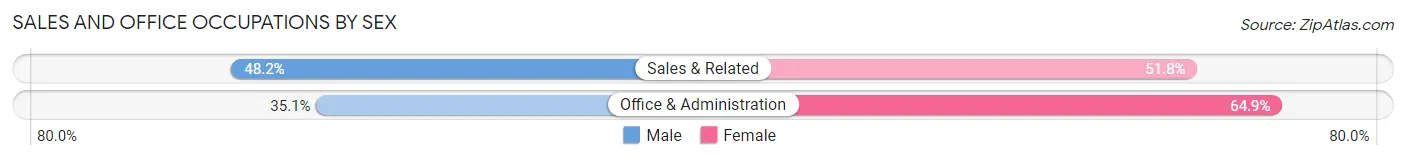
| Occupation | Male | Female |
| Sales & Related | 1,747 (48.2%) | 1,879 (51.8%) |
| Office & Administration | 1,318 (35.1%) | 2,436 (64.9%) |
| Total (Category) | 3,065 (41.5%) | 4,315 (58.5%) |
| Total (Overall) | 21,221 (50.5%) | 20,758 (49.4%) |
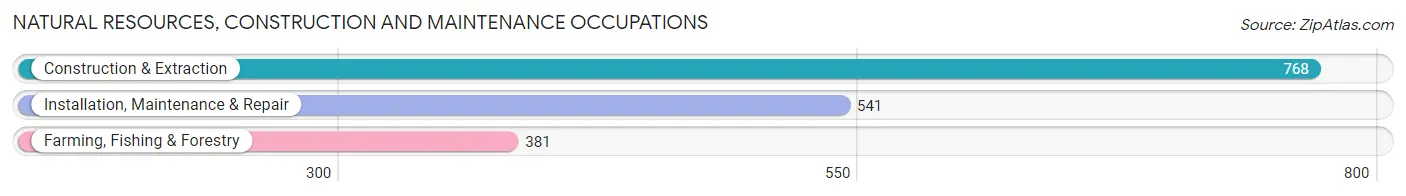
Natural Resources, Construction and Maintenance Occupations
The most common Natural Resources, Construction and Maintenance occupations in Iowa City are Construction & Extraction (768 | 1.8%), Installation, Maintenance & Repair (541 | 1.3%), and Farming, Fishing & Forestry (381 | 0.9%).
Natural Resources, Construction and Maintenance Occupations by Sex
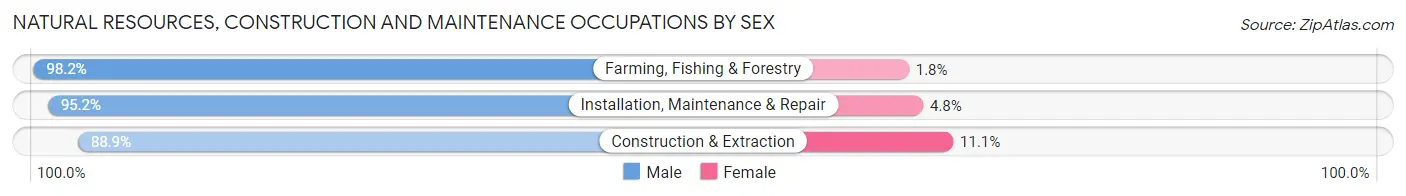
| Occupation | Male | Female |
| Farming, Fishing & Forestry | 374 (98.2%) | 7 (1.8%) |
| Construction & Extraction | 683 (88.9%) | 85 (11.1%) |
| Installation, Maintenance & Repair | 515 (95.2%) | 26 (4.8%) |
| Total (Category) | 1,572 (93.0%) | 118 (7.0%) |
| Total (Overall) | 21,221 (50.5%) | 20,758 (49.4%) |
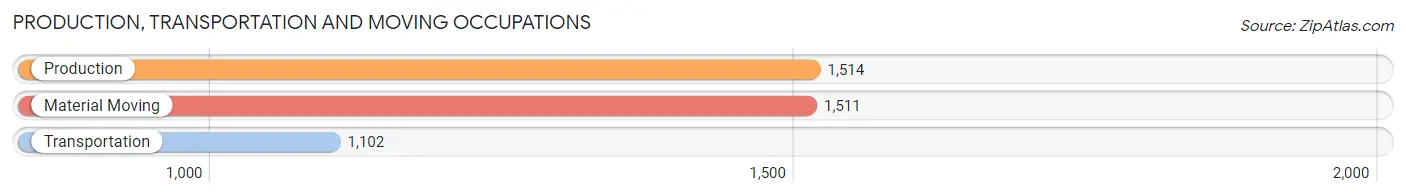
Production, Transportation and Moving Occupations
The most common Production, Transportation and Moving occupations in Iowa City are Production (1,514 | 3.6%), Material Moving (1,511 | 3.6%), and Transportation (1,102 | 2.6%).
Production, Transportation and Moving Occupations by Sex
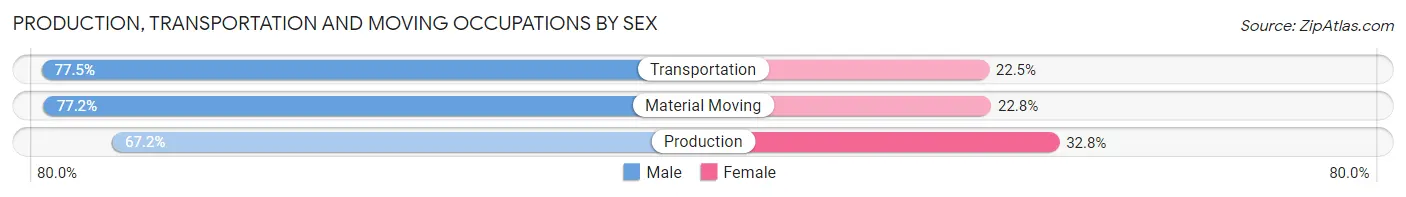
| Occupation | Male | Female |
| Production | 1,017 (67.2%) | 497 (32.8%) |
| Transportation | 854 (77.5%) | 248 (22.5%) |
| Material Moving | 1,166 (77.2%) | 345 (22.8%) |
| Total (Category) | 3,037 (73.6%) | 1,090 (26.4%) |
| Total (Overall) | 21,221 (50.5%) | 20,758 (49.4%) |
Employment Industries by Sex in Iowa City
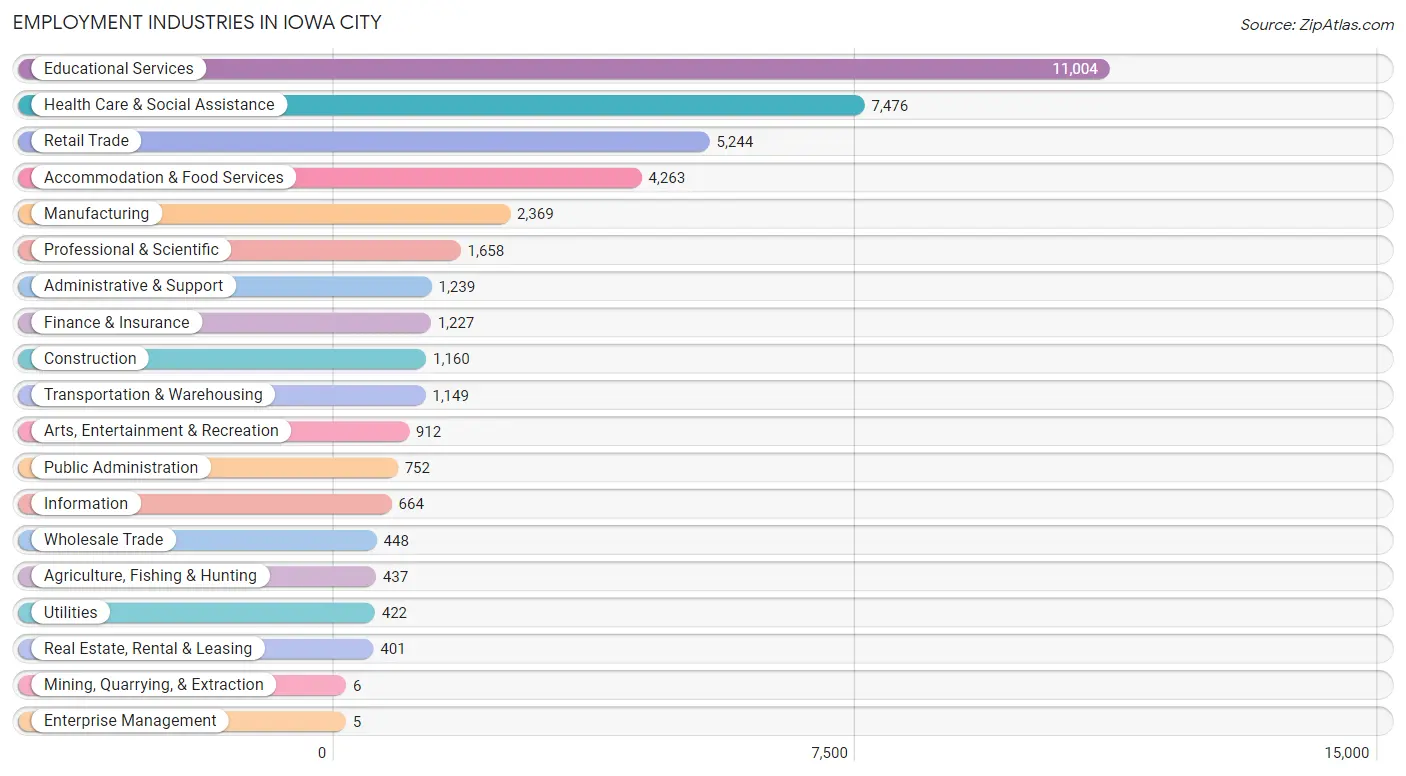
Employment Industries in Iowa City
The major employment industries in Iowa City include Educational Services (11,004 | 26.2%), Health Care & Social Assistance (7,476 | 17.8%), Retail Trade (5,244 | 12.5%), Accommodation & Food Services (4,263 | 10.2%), and Manufacturing (2,369 | 5.6%).
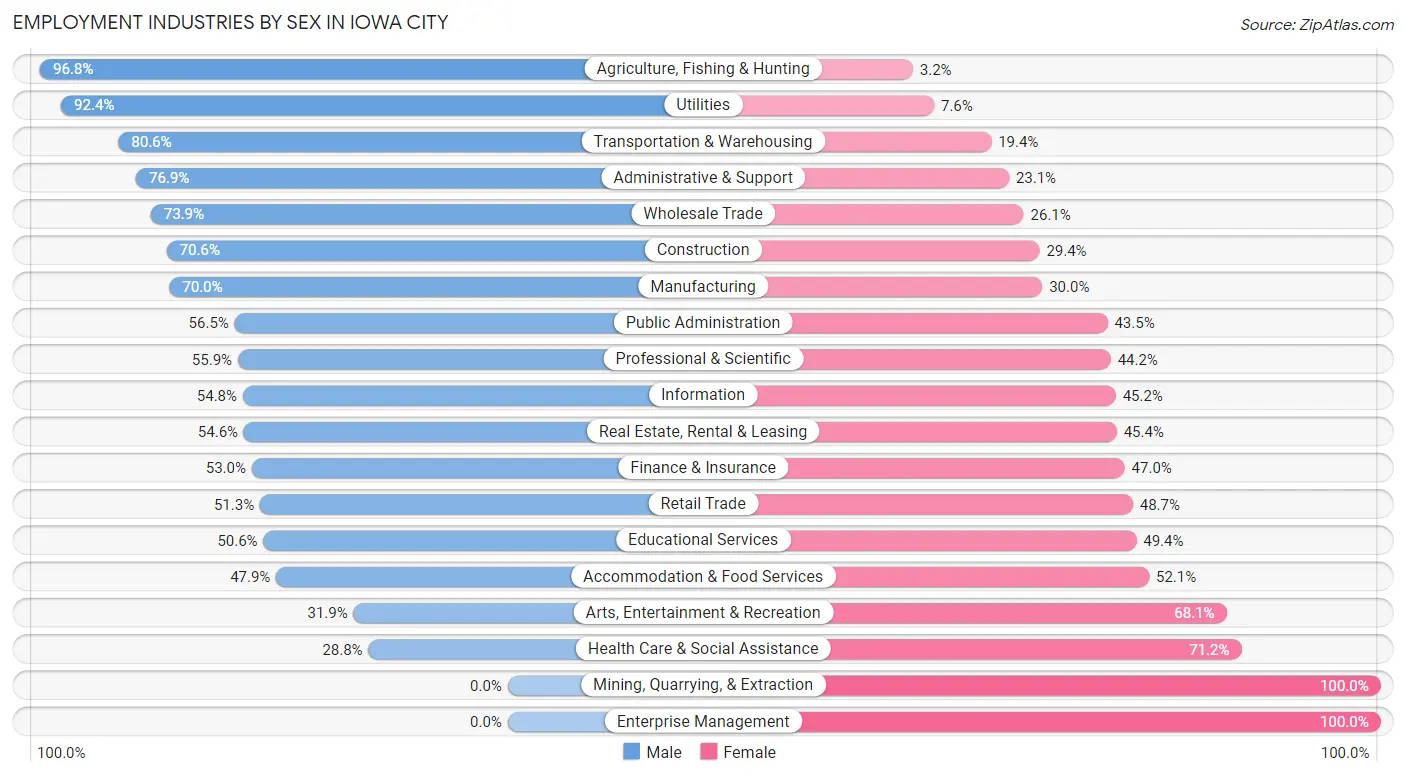
Employment Industries by Sex in Iowa City
The Iowa City industries that see more men than women are Agriculture, Fishing & Hunting (96.8%), Utilities (92.4%), and Transportation & Warehousing (80.6%), whereas the industries that tend to have a higher number of women are Mining, Quarrying, & Extraction (100.0%), Enterprise Management (100.0%), and Health Care & Social Assistance (71.2%).
| Industry | Male | Female |
| Agriculture, Fishing & Hunting | 423 (96.8%) | 14 (3.2%) |
| Mining, Quarrying, & Extraction | 0 (0.0%) | 6 (100.0%) |
| Construction | 819 (70.6%) | 341 (29.4%) |
| Manufacturing | 1,659 (70.0%) | 710 (30.0%) |
| Wholesale Trade | 331 (73.9%) | 117 (26.1%) |
| Retail Trade | 2,689 (51.3%) | 2,555 (48.7%) |
| Transportation & Warehousing | 926 (80.6%) | 223 (19.4%) |
| Utilities | 390 (92.4%) | 32 (7.6%) |
| Information | 364 (54.8%) | 300 (45.2%) |
| Finance & Insurance | 650 (53.0%) | 577 (47.0%) |
| Real Estate, Rental & Leasing | 219 (54.6%) | 182 (45.4%) |
| Professional & Scientific | 926 (55.8%) | 732 (44.2%) |
| Enterprise Management | 0 (0.0%) | 5 (100.0%) |
| Administrative & Support | 953 (76.9%) | 286 (23.1%) |
| Educational Services | 5,564 (50.6%) | 5,440 (49.4%) |
| Health Care & Social Assistance | 2,155 (28.8%) | 5,321 (71.2%) |
| Arts, Entertainment & Recreation | 291 (31.9%) | 621 (68.1%) |
| Accommodation & Food Services | 2,043 (47.9%) | 2,220 (52.1%) |
| Public Administration | 425 (56.5%) | 327 (43.5%) |
| Total | 21,221 (50.5%) | 20,758 (49.4%) |
Education in Iowa City
School Enrollment in Iowa City
The most common levels of schooling among the 33,140 students in Iowa City are college / undergraduate (20,289 | 61.2%), graduate / professional (4,629 | 14.0%), and middle school (2,392 | 7.2%).
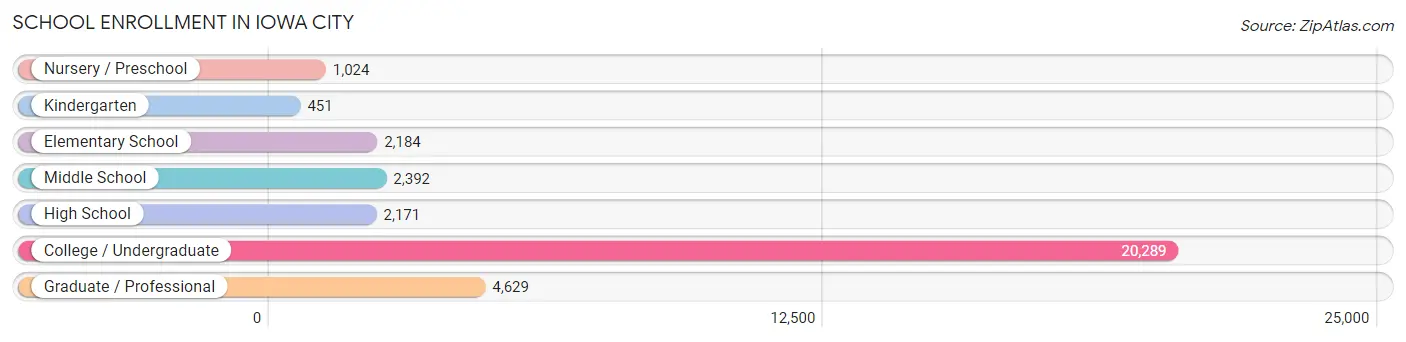
| School Level | # Students | % Students |
| Nursery / Preschool | 1,024 | 3.1% |
| Kindergarten | 451 | 1.4% |
| Elementary School | 2,184 | 6.6% |
| Middle School | 2,392 | 7.2% |
| High School | 2,171 | 6.6% |
| College / Undergraduate | 20,289 | 61.2% |
| Graduate / Professional | 4,629 | 14.0% |
| Total | 33,140 | 100.0% |
School Enrollment by Age by Funding Source in Iowa City
Out of a total of 33,140 students who are enrolled in schools in Iowa City, 2,651 (8.0%) attend a private institution, while the remaining 30,489 (92.0%) are enrolled in public schools. The age group of 3 to 4 year olds has the highest likelihood of being enrolled in private schools, with 434 (74.7% in the age bracket) enrolled. Conversely, the age group of 18 to 19 year olds has the lowest likelihood of being enrolled in a private school, with 6,453 (98.2% in the age bracket) attending a public institution.
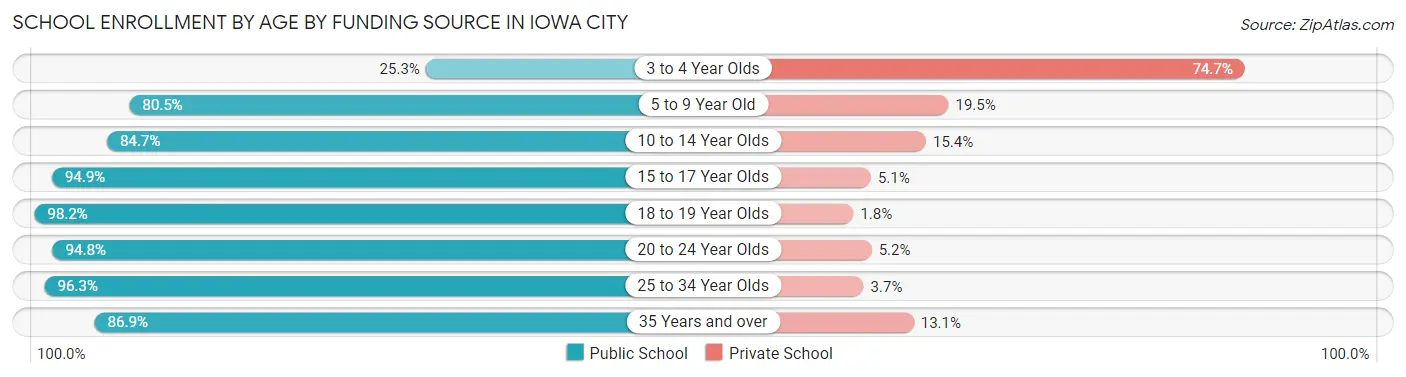
| Age Bracket | Public School | Private School |
| 3 to 4 Year Olds | 147 (25.3%) | 434 (74.7%) |
| 5 to 9 Year Old | 2,254 (80.5%) | 547 (19.5%) |
| 10 to 14 Year Olds | 2,504 (84.7%) | 454 (15.3%) |
| 15 to 17 Year Olds | 1,435 (94.9%) | 77 (5.1%) |
| 18 to 19 Year Olds | 6,453 (98.2%) | 120 (1.8%) |
| 20 to 24 Year Olds | 13,781 (94.8%) | 761 (5.2%) |
| 25 to 34 Year Olds | 2,927 (96.3%) | 113 (3.7%) |
| 35 Years and over | 985 (86.9%) | 148 (13.1%) |
| Total | 30,489 (92.0%) | 2,651 (8.0%) |
Educational Attainment by Field of Study in Iowa City
Bio, nature & agricultural (3,000 | 11.4%), business (2,612 | 9.9%), education (2,525 | 9.6%), science & technology (2,429 | 9.2%), and literature & languages (2,303 | 8.7%) are the most common fields of study among 26,437 individuals in Iowa City who have obtained a bachelor's degree or higher.
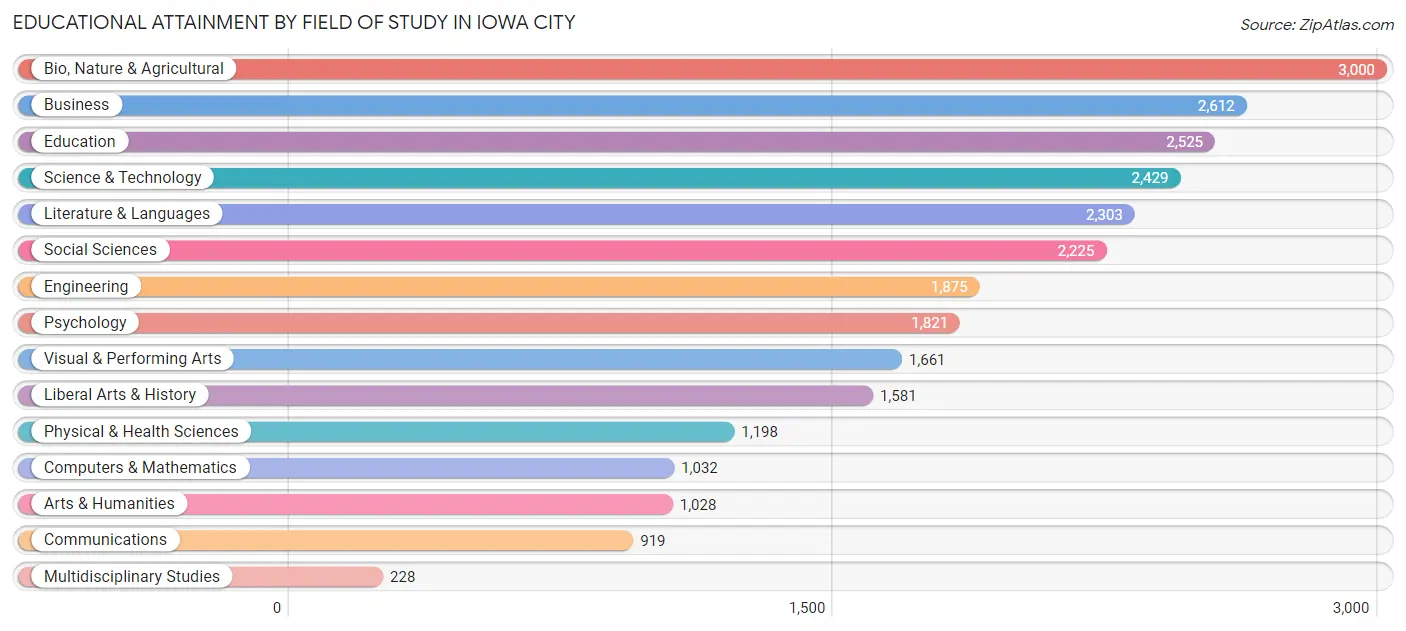
| Field of Study | # Graduates | % Graduates |
| Computers & Mathematics | 1,032 | 3.9% |
| Bio, Nature & Agricultural | 3,000 | 11.4% |
| Physical & Health Sciences | 1,198 | 4.5% |
| Psychology | 1,821 | 6.9% |
| Social Sciences | 2,225 | 8.4% |
| Engineering | 1,875 | 7.1% |
| Multidisciplinary Studies | 228 | 0.9% |
| Science & Technology | 2,429 | 9.2% |
| Business | 2,612 | 9.9% |
| Education | 2,525 | 9.6% |
| Literature & Languages | 2,303 | 8.7% |
| Liberal Arts & History | 1,581 | 6.0% |
| Visual & Performing Arts | 1,661 | 6.3% |
| Communications | 919 | 3.5% |
| Arts & Humanities | 1,028 | 3.9% |
| Total | 26,437 | 100.0% |
Transportation & Commute in Iowa City
Vehicle Availability by Sex in Iowa City
The most prevalent vehicle ownership categories in Iowa City are males with 2 vehicles (7,833, accounting for 39.4%) and females with 2 vehicles (8,091, making up 41.6%).
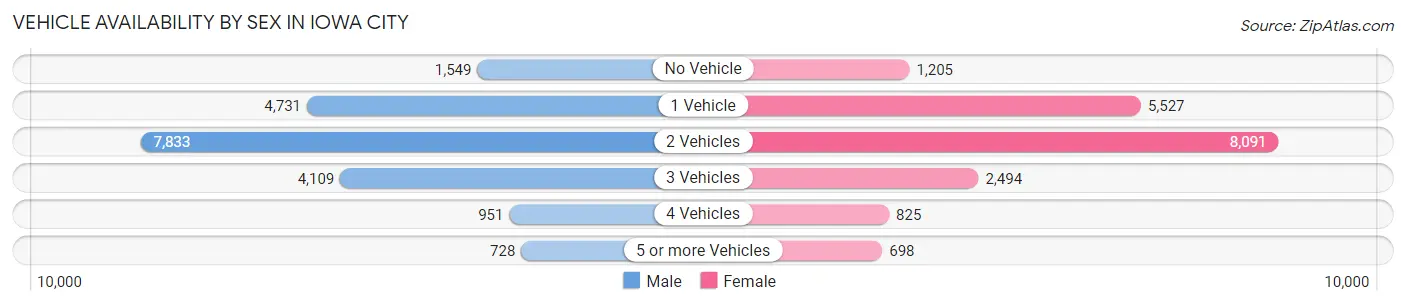
| Vehicles Available | Male | Female |
| No Vehicle | 1,549 (7.8%) | 1,205 (6.4%) |
| 1 Vehicle | 4,731 (23.8%) | 5,527 (29.3%) |
| 2 Vehicles | 7,833 (39.4%) | 8,091 (42.9%) |
| 3 Vehicles | 4,109 (20.6%) | 2,494 (13.2%) |
| 4 Vehicles | 951 (4.8%) | 825 (4.4%) |
| 5 or more Vehicles | 728 (3.7%) | 698 (3.7%) |
| Total | 19,901 (100.0%) | 18,840 (100.0%) |
Commute Time in Iowa City
The most frequently occuring commute durations in Iowa City are 10 to 14 minutes (10,180 commuters, 27.8%), 15 to 19 minutes (8,204 commuters, 22.4%), and 5 to 9 minutes (5,562 commuters, 15.2%).
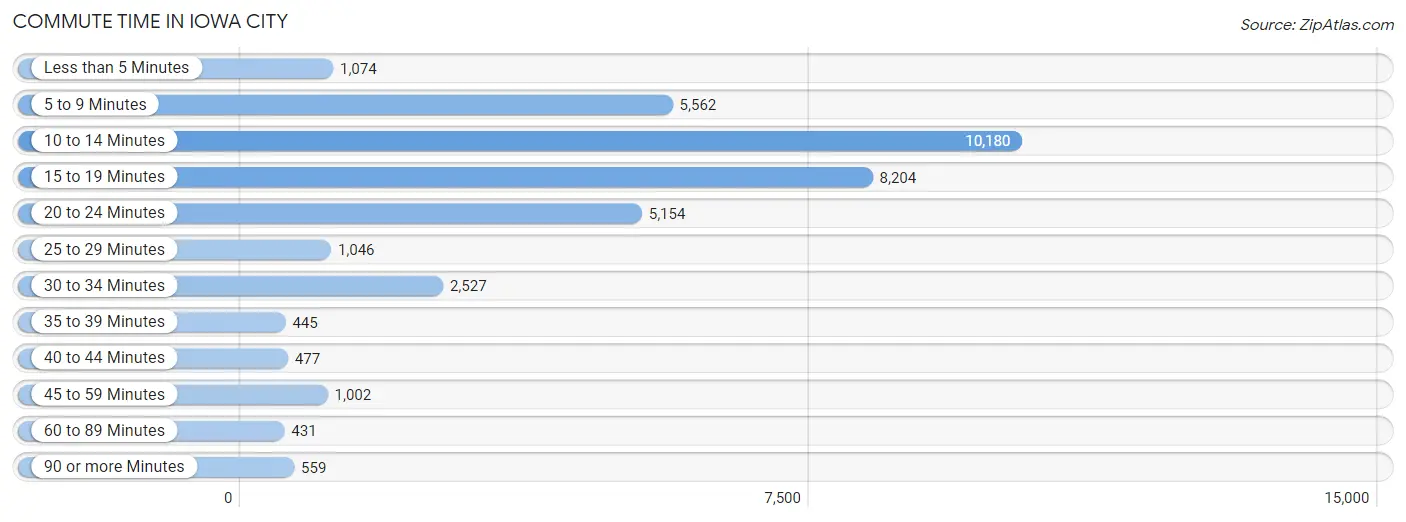
| Commute Time | # Commuters | % Commuters |
| Less than 5 Minutes | 1,074 | 2.9% |
| 5 to 9 Minutes | 5,562 | 15.2% |
| 10 to 14 Minutes | 10,180 | 27.8% |
| 15 to 19 Minutes | 8,204 | 22.4% |
| 20 to 24 Minutes | 5,154 | 14.1% |
| 25 to 29 Minutes | 1,046 | 2.9% |
| 30 to 34 Minutes | 2,527 | 6.9% |
| 35 to 39 Minutes | 445 | 1.2% |
| 40 to 44 Minutes | 477 | 1.3% |
| 45 to 59 Minutes | 1,002 | 2.7% |
| 60 to 89 Minutes | 431 | 1.2% |
| 90 or more Minutes | 559 | 1.5% |
Commute Time by Sex in Iowa City
The most common commute times in Iowa City are 10 to 14 minutes (5,431 commuters, 29.2%) for males and 10 to 14 minutes (4,749 commuters, 26.3%) for females.
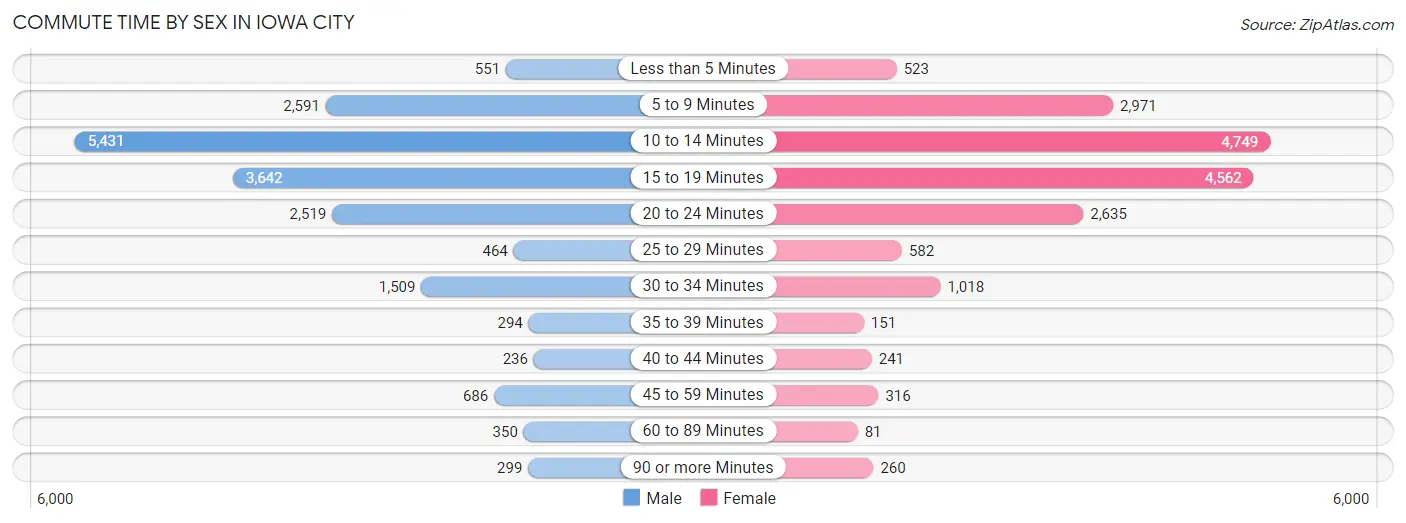
| Commute Time | Male | Female |
| Less than 5 Minutes | 551 (3.0%) | 523 (2.9%) |
| 5 to 9 Minutes | 2,591 (14.0%) | 2,971 (16.4%) |
| 10 to 14 Minutes | 5,431 (29.2%) | 4,749 (26.3%) |
| 15 to 19 Minutes | 3,642 (19.6%) | 4,562 (25.2%) |
| 20 to 24 Minutes | 2,519 (13.6%) | 2,635 (14.6%) |
| 25 to 29 Minutes | 464 (2.5%) | 582 (3.2%) |
| 30 to 34 Minutes | 1,509 (8.1%) | 1,018 (5.6%) |
| 35 to 39 Minutes | 294 (1.6%) | 151 (0.8%) |
| 40 to 44 Minutes | 236 (1.3%) | 241 (1.3%) |
| 45 to 59 Minutes | 686 (3.7%) | 316 (1.8%) |
| 60 to 89 Minutes | 350 (1.9%) | 81 (0.4%) |
| 90 or more Minutes | 299 (1.6%) | 260 (1.4%) |
Time of Departure to Work by Sex in Iowa City
The most frequent times of departure to work in Iowa City are 7:30 AM to 7:59 AM (2,693, 14.5%) for males and 7:30 AM to 7:59 AM (2,782, 15.4%) for females.
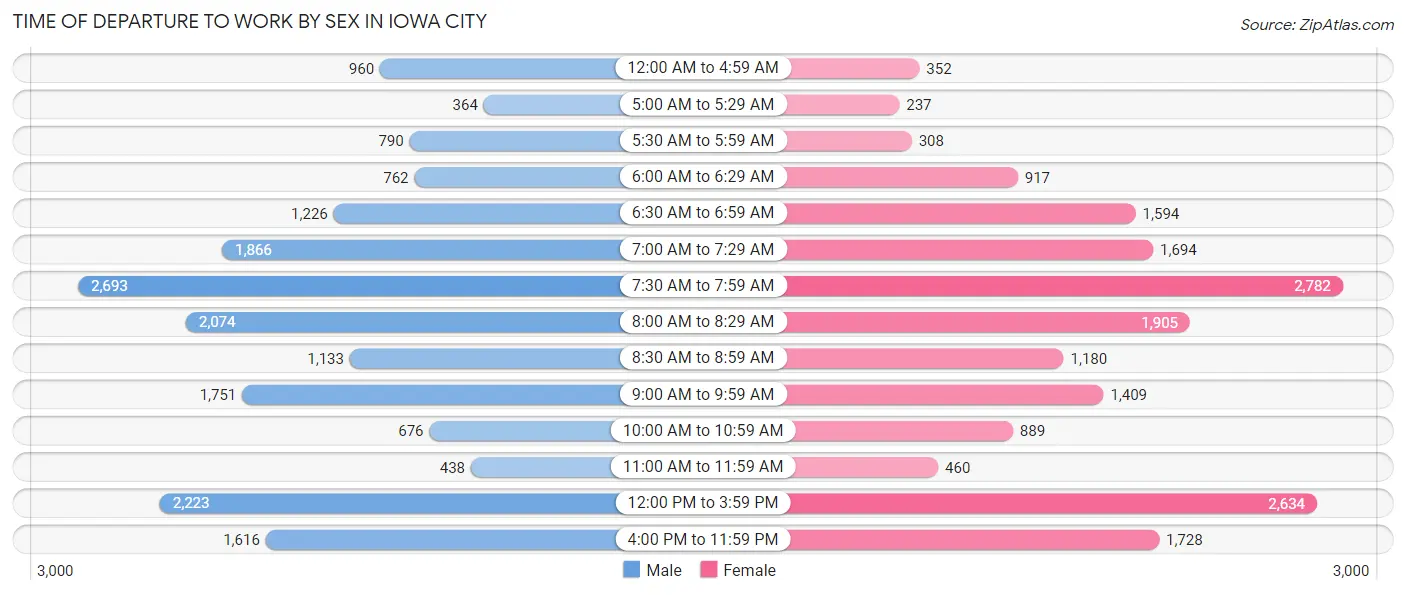
| Time of Departure | Male | Female |
| 12:00 AM to 4:59 AM | 960 (5.2%) | 352 (1.9%) |
| 5:00 AM to 5:29 AM | 364 (2.0%) | 237 (1.3%) |
| 5:30 AM to 5:59 AM | 790 (4.3%) | 308 (1.7%) |
| 6:00 AM to 6:29 AM | 762 (4.1%) | 917 (5.1%) |
| 6:30 AM to 6:59 AM | 1,226 (6.6%) | 1,594 (8.8%) |
| 7:00 AM to 7:29 AM | 1,866 (10.1%) | 1,694 (9.4%) |
| 7:30 AM to 7:59 AM | 2,693 (14.5%) | 2,782 (15.4%) |
| 8:00 AM to 8:29 AM | 2,074 (11.2%) | 1,905 (10.5%) |
| 8:30 AM to 8:59 AM | 1,133 (6.1%) | 1,180 (6.5%) |
| 9:00 AM to 9:59 AM | 1,751 (9.4%) | 1,409 (7.8%) |
| 10:00 AM to 10:59 AM | 676 (3.6%) | 889 (4.9%) |
| 11:00 AM to 11:59 AM | 438 (2.4%) | 460 (2.5%) |
| 12:00 PM to 3:59 PM | 2,223 (12.0%) | 2,634 (14.6%) |
| 4:00 PM to 11:59 PM | 1,616 (8.7%) | 1,728 (9.6%) |
| Total | 18,572 (100.0%) | 18,089 (100.0%) |
Housing Occupancy in Iowa City
Occupancy by Ownership in Iowa City
Of the total 30,544 dwellings in Iowa City, owner-occupied units account for 14,157 (46.4%), while renter-occupied units make up 16,387 (53.6%).
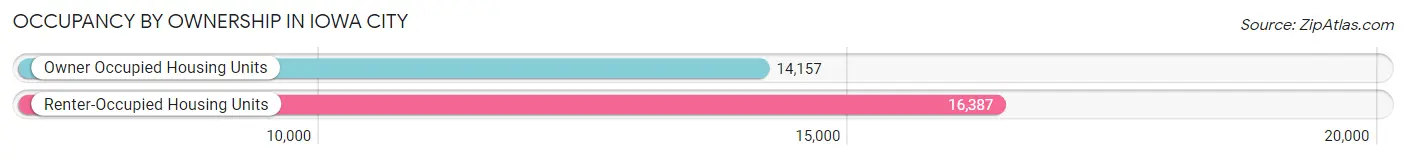
| Occupancy | # Housing Units | % Housing Units |
| Owner Occupied Housing Units | 14,157 | 46.4% |
| Renter-Occupied Housing Units | 16,387 | 53.6% |
| Total Occupied Housing Units | 30,544 | 100.0% |
Occupancy by Household Size in Iowa City
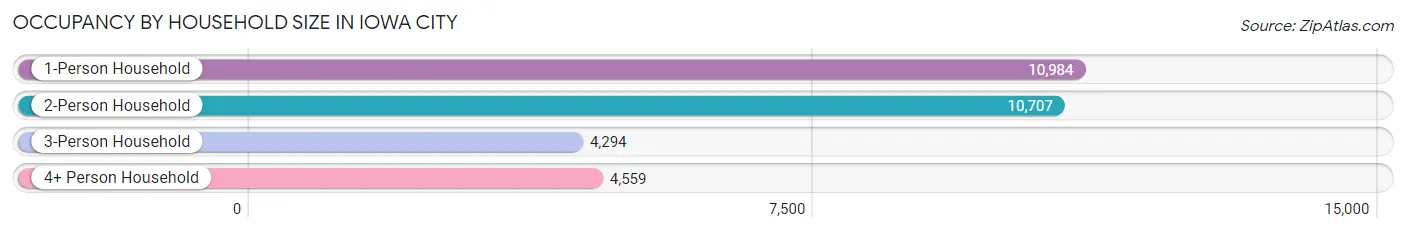
| Household Size | # Housing Units | % Housing Units |
| 1-Person Household | 10,984 | 36.0% |
| 2-Person Household | 10,707 | 35.0% |
| 3-Person Household | 4,294 | 14.1% |
| 4+ Person Household | 4,559 | 14.9% |
| Total Housing Units | 30,544 | 100.0% |
Occupancy by Ownership by Household Size in Iowa City
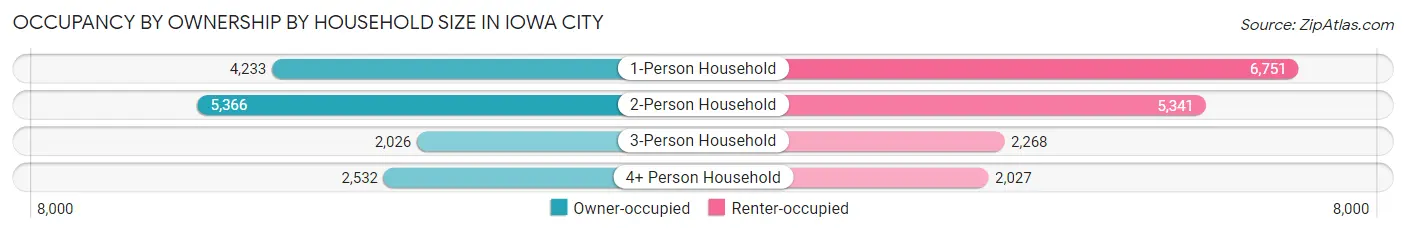
| Household Size | Owner-occupied | Renter-occupied |
| 1-Person Household | 4,233 (38.5%) | 6,751 (61.5%) |
| 2-Person Household | 5,366 (50.1%) | 5,341 (49.9%) |
| 3-Person Household | 2,026 (47.2%) | 2,268 (52.8%) |
| 4+ Person Household | 2,532 (55.5%) | 2,027 (44.5%) |
| Total Housing Units | 14,157 (46.4%) | 16,387 (53.6%) |
Occupancy by Educational Attainment in Iowa City
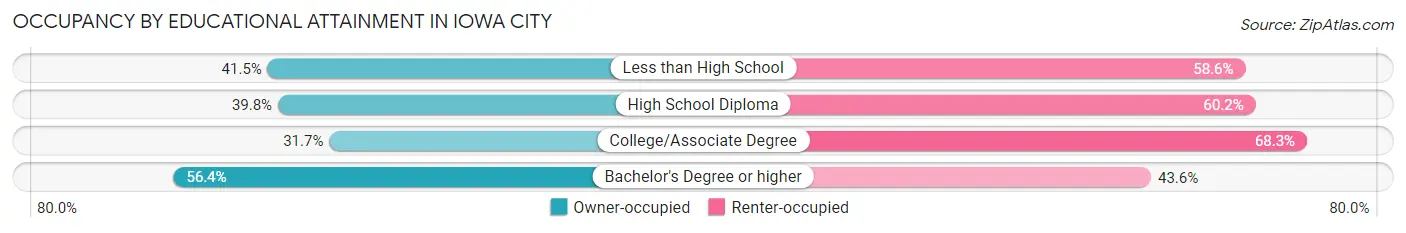
| Household Size | Owner-occupied | Renter-occupied |
| Less than High School | 274 (41.4%) | 387 (58.6%) |
| High School Diploma | 1,356 (39.8%) | 2,049 (60.2%) |
| College/Associate Degree | 3,085 (31.7%) | 6,652 (68.3%) |
| Bachelor's Degree or higher | 9,442 (56.4%) | 7,299 (43.6%) |
Occupancy by Age of Householder in Iowa City
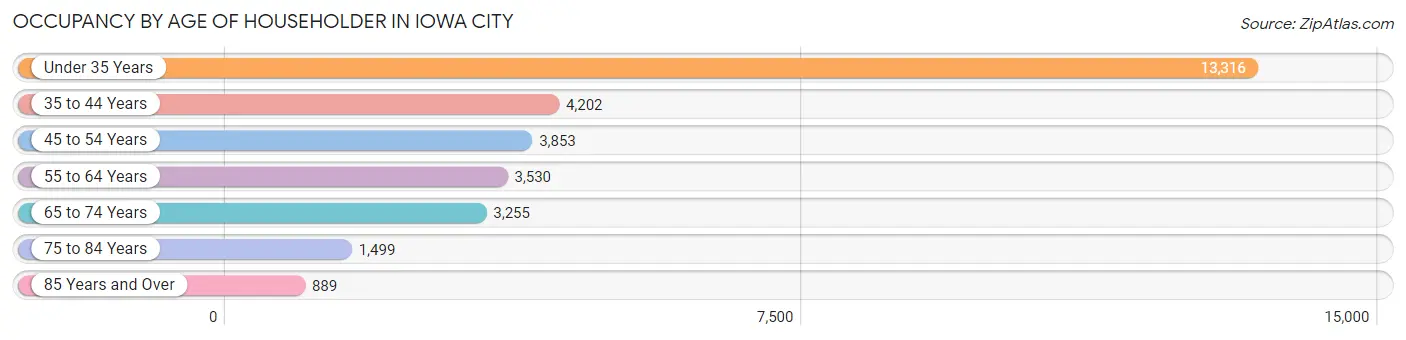
| Age Bracket | # Households | % Households |
| Under 35 Years | 13,316 | 43.6% |
| 35 to 44 Years | 4,202 | 13.8% |
| 45 to 54 Years | 3,853 | 12.6% |
| 55 to 64 Years | 3,530 | 11.6% |
| 65 to 74 Years | 3,255 | 10.7% |
| 75 to 84 Years | 1,499 | 4.9% |
| 85 Years and Over | 889 | 2.9% |
| Total | 30,544 | 100.0% |
Housing Finances in Iowa City
Median Income by Occupancy in Iowa City
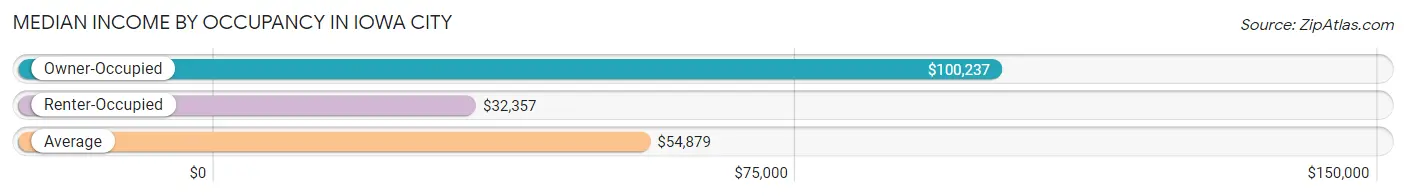
| Occupancy Type | # Households | Median Income |
| Owner-Occupied | 14,157 (46.4%) | $100,237 |
| Renter-Occupied | 16,387 (53.6%) | $32,357 |
| Average | 30,544 (100.0%) | $54,879 |
Occupancy by Householder Income Bracket in Iowa City
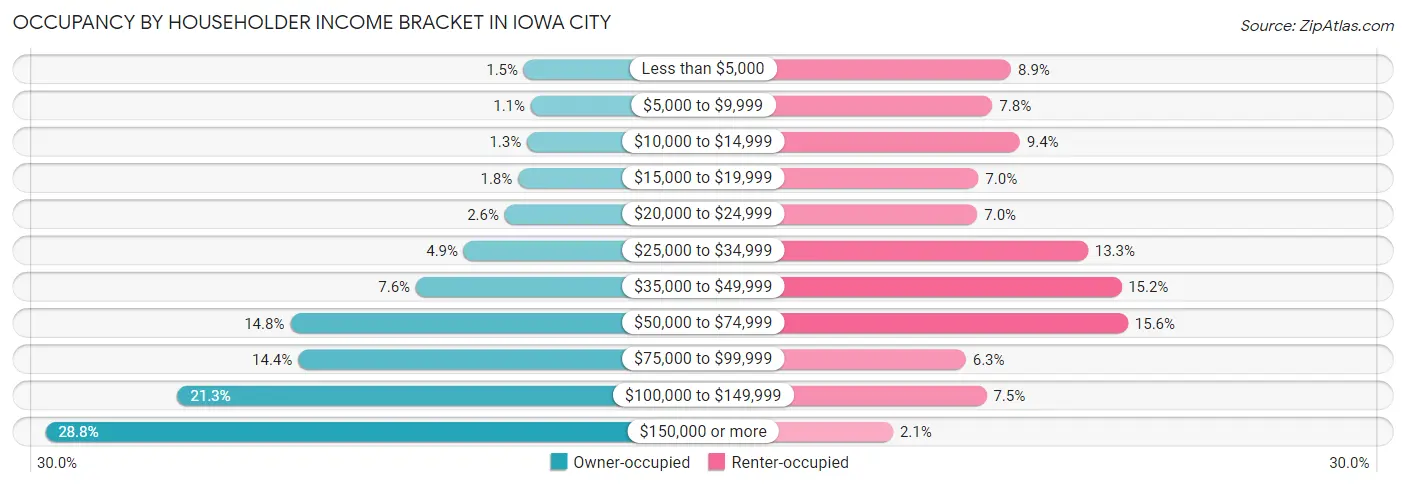
| Income Bracket | Owner-occupied | Renter-occupied |
| Less than $5,000 | 208 (1.5%) | 1,457 (8.9%) |
| $5,000 to $9,999 | 152 (1.1%) | 1,282 (7.8%) |
| $10,000 to $14,999 | 182 (1.3%) | 1,538 (9.4%) |
| $15,000 to $19,999 | 255 (1.8%) | 1,151 (7.0%) |
| $20,000 to $24,999 | 363 (2.6%) | 1,140 (7.0%) |
| $25,000 to $34,999 | 693 (4.9%) | 2,175 (13.3%) |
| $35,000 to $49,999 | 1,081 (7.6%) | 2,488 (15.2%) |
| $50,000 to $74,999 | 2,098 (14.8%) | 2,549 (15.6%) |
| $75,000 to $99,999 | 2,034 (14.4%) | 1,032 (6.3%) |
| $100,000 to $149,999 | 3,011 (21.3%) | 1,225 (7.5%) |
| $150,000 or more | 4,080 (28.8%) | 350 (2.1%) |
| Total | 14,157 (100.0%) | 16,387 (100.0%) |
Monthly Housing Cost Tiers in Iowa City
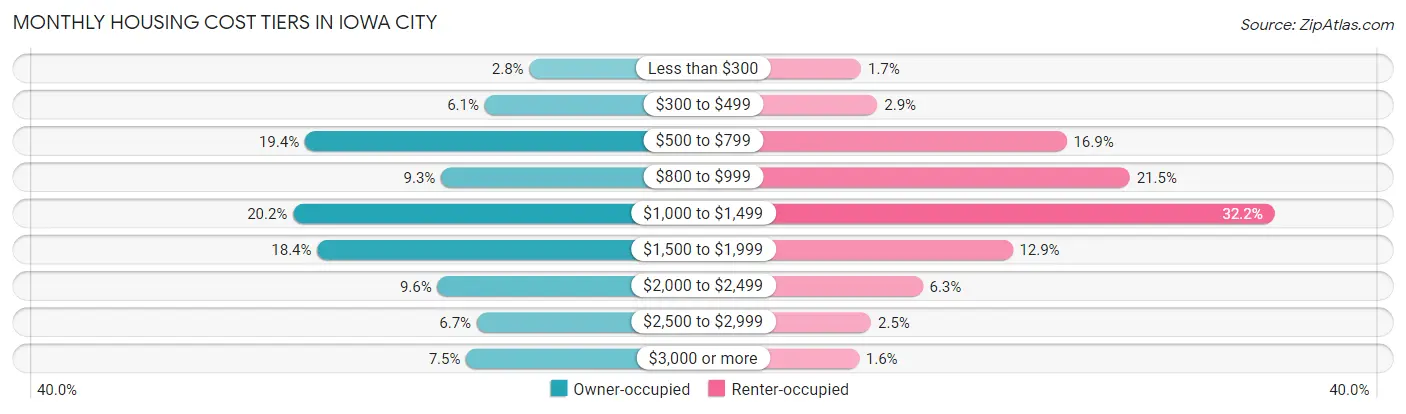
| Monthly Cost | Owner-occupied | Renter-occupied |
| Less than $300 | 399 (2.8%) | 285 (1.7%) |
| $300 to $499 | 865 (6.1%) | 482 (2.9%) |
| $500 to $799 | 2,739 (19.4%) | 2,765 (16.9%) |
| $800 to $999 | 1,320 (9.3%) | 3,528 (21.5%) |
| $1,000 to $1,499 | 2,862 (20.2%) | 5,275 (32.2%) |
| $1,500 to $1,999 | 2,610 (18.4%) | 2,112 (12.9%) |
| $2,000 to $2,499 | 1,358 (9.6%) | 1,028 (6.3%) |
| $2,500 to $2,999 | 947 (6.7%) | 406 (2.5%) |
| $3,000 or more | 1,057 (7.5%) | 259 (1.6%) |
| Total | 14,157 (100.0%) | 16,387 (100.0%) |
Physical Housing Characteristics in Iowa City
Housing Structures in Iowa City
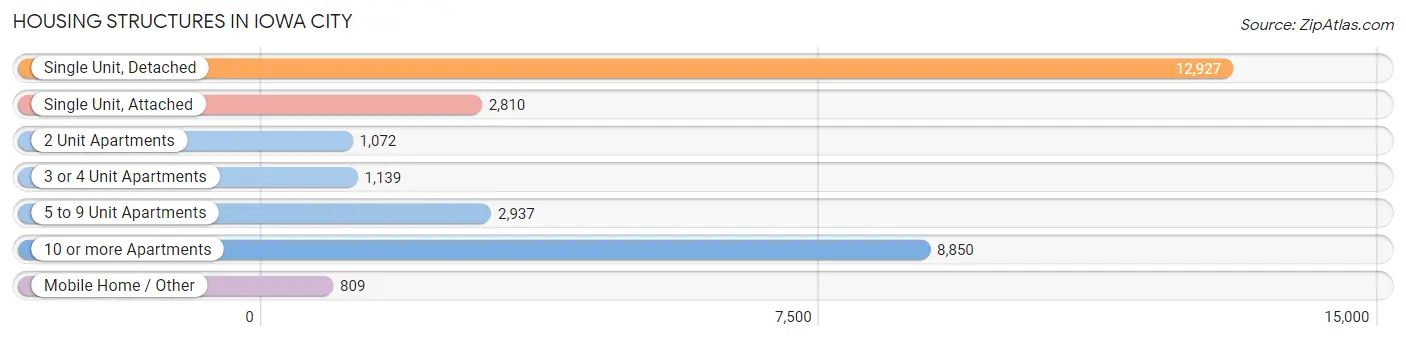
| Structure Type | # Housing Units | % Housing Units |
| Single Unit, Detached | 12,927 | 42.3% |
| Single Unit, Attached | 2,810 | 9.2% |
| 2 Unit Apartments | 1,072 | 3.5% |
| 3 or 4 Unit Apartments | 1,139 | 3.7% |
| 5 to 9 Unit Apartments | 2,937 | 9.6% |
| 10 or more Apartments | 8,850 | 29.0% |
| Mobile Home / Other | 809 | 2.6% |
| Total | 30,544 | 100.0% |
Housing Structures by Occupancy in Iowa City
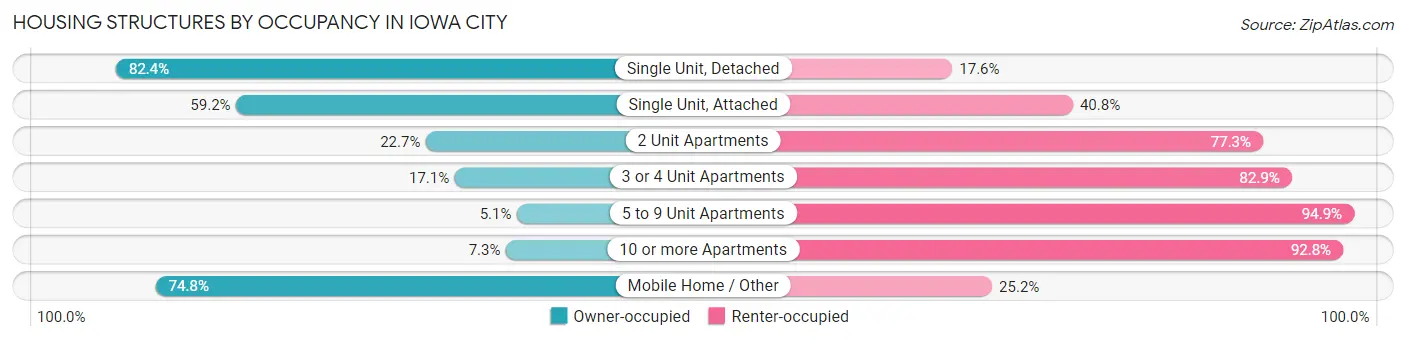
| Structure Type | Owner-occupied | Renter-occupied |
| Single Unit, Detached | 10,657 (82.4%) | 2,270 (17.6%) |
| Single Unit, Attached | 1,664 (59.2%) | 1,146 (40.8%) |
| 2 Unit Apartments | 243 (22.7%) | 829 (77.3%) |
| 3 or 4 Unit Apartments | 195 (17.1%) | 944 (82.9%) |
| 5 to 9 Unit Apartments | 151 (5.1%) | 2,786 (94.9%) |
| 10 or more Apartments | 642 (7.2%) | 8,208 (92.7%) |
| Mobile Home / Other | 605 (74.8%) | 204 (25.2%) |
| Total | 14,157 (46.4%) | 16,387 (53.6%) |
Housing Structures by Number of Rooms in Iowa City
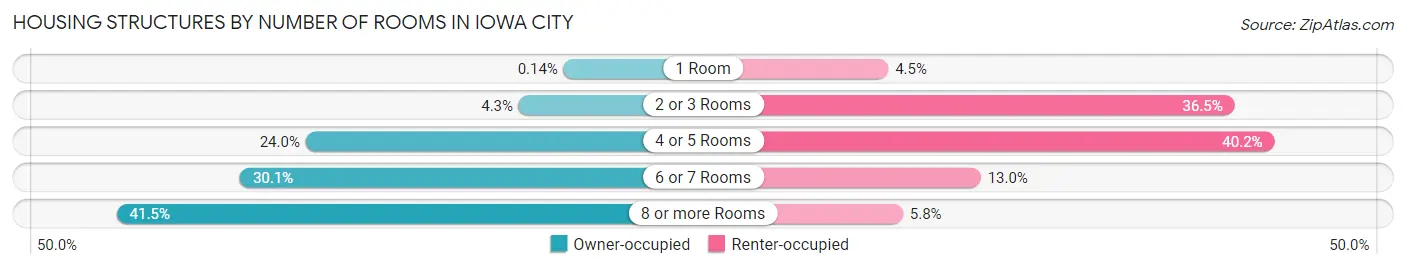
| Number of Rooms | Owner-occupied | Renter-occupied |
| 1 Room | 20 (0.1%) | 733 (4.5%) |
| 2 or 3 Rooms | 607 (4.3%) | 5,982 (36.5%) |
| 4 or 5 Rooms | 3,398 (24.0%) | 6,585 (40.2%) |
| 6 or 7 Rooms | 4,258 (30.1%) | 2,134 (13.0%) |
| 8 or more Rooms | 5,874 (41.5%) | 953 (5.8%) |
| Total | 14,157 (100.0%) | 16,387 (100.0%) |
Housing Structure by Heating Type in Iowa City
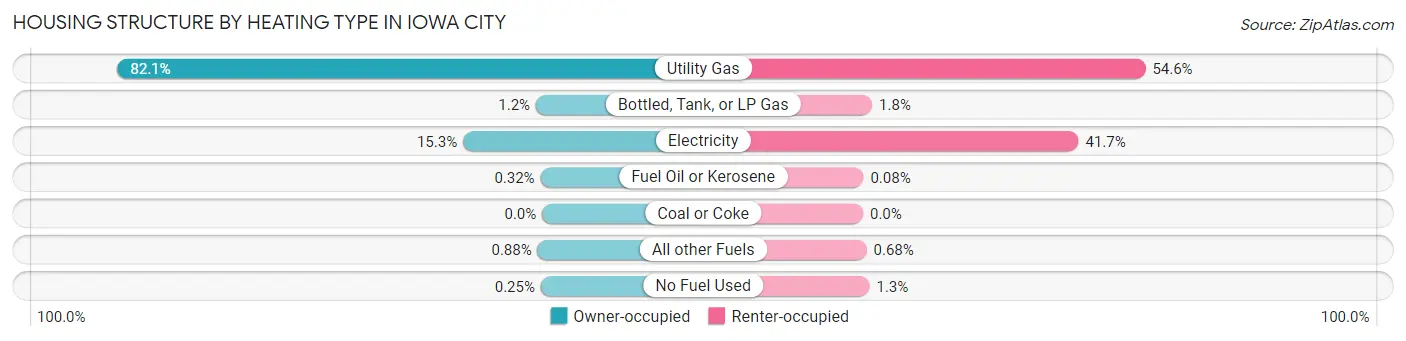
| Heating Type | Owner-occupied | Renter-occupied |
| Utility Gas | 11,619 (82.1%) | 8,943 (54.6%) |
| Bottled, Tank, or LP Gas | 169 (1.2%) | 289 (1.8%) |
| Electricity | 2,164 (15.3%) | 6,825 (41.6%) |
| Fuel Oil or Kerosene | 45 (0.3%) | 13 (0.1%) |
| Coal or Coke | 0 (0.0%) | 0 (0.0%) |
| All other Fuels | 124 (0.9%) | 111 (0.7%) |
| No Fuel Used | 36 (0.3%) | 206 (1.3%) |
| Total | 14,157 (100.0%) | 16,387 (100.0%) |
Household Vehicle Usage in Iowa City
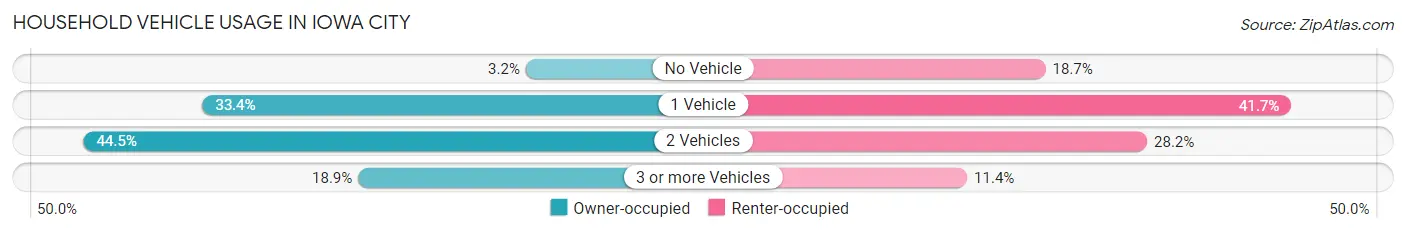
| Vehicles per Household | Owner-occupied | Renter-occupied |
| No Vehicle | 456 (3.2%) | 3,069 (18.7%) |
| 1 Vehicle | 4,730 (33.4%) | 6,826 (41.6%) |
| 2 Vehicles | 6,300 (44.5%) | 4,622 (28.2%) |
| 3 or more Vehicles | 2,671 (18.9%) | 1,870 (11.4%) |
| Total | 14,157 (100.0%) | 16,387 (100.0%) |
Real Estate & Mortgages in Iowa City
Real Estate and Mortgage Overview in Iowa City
| Characteristic | Without Mortgage | With Mortgage |
| Housing Units | 5,421 | 8,736 |
| Median Property Value | $248,800 | $262,100 |
| Median Household Income | $78,662 | $2,862 |
| Monthly Housing Costs | $669 | $1,057 |
| Real Estate Taxes | $4,334 | $163 |
Property Value by Mortgage Status in Iowa City
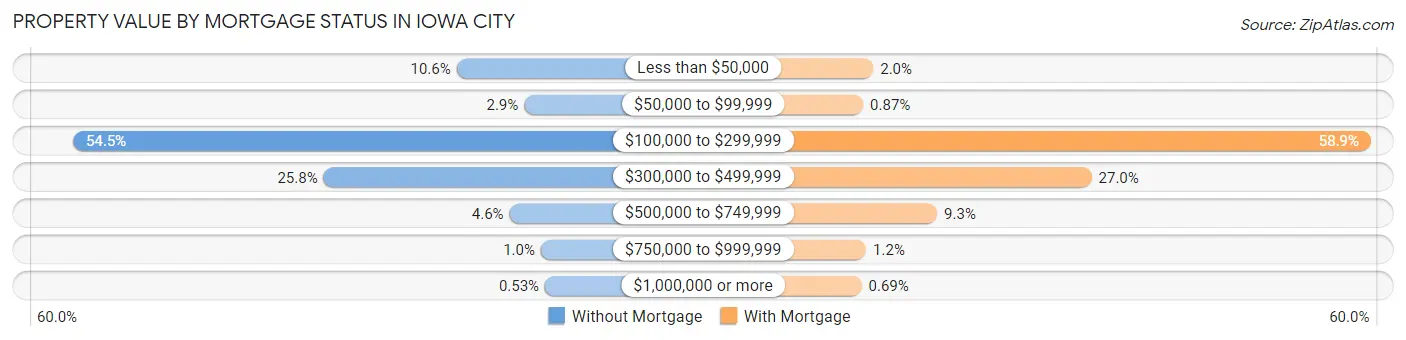
| Property Value | Without Mortgage | With Mortgage |
| Less than $50,000 | 576 (10.6%) | 177 (2.0%) |
| $50,000 to $99,999 | 158 (2.9%) | 76 (0.9%) |
| $100,000 to $299,999 | 2,953 (54.5%) | 5,145 (58.9%) |
| $300,000 to $499,999 | 1,401 (25.8%) | 2,357 (27.0%) |
| $500,000 to $749,999 | 249 (4.6%) | 815 (9.3%) |
| $750,000 to $999,999 | 55 (1.0%) | 106 (1.2%) |
| $1,000,000 or more | 29 (0.5%) | 60 (0.7%) |
| Total | 5,421 (100.0%) | 8,736 (100.0%) |
Household Income by Mortgage Status in Iowa City
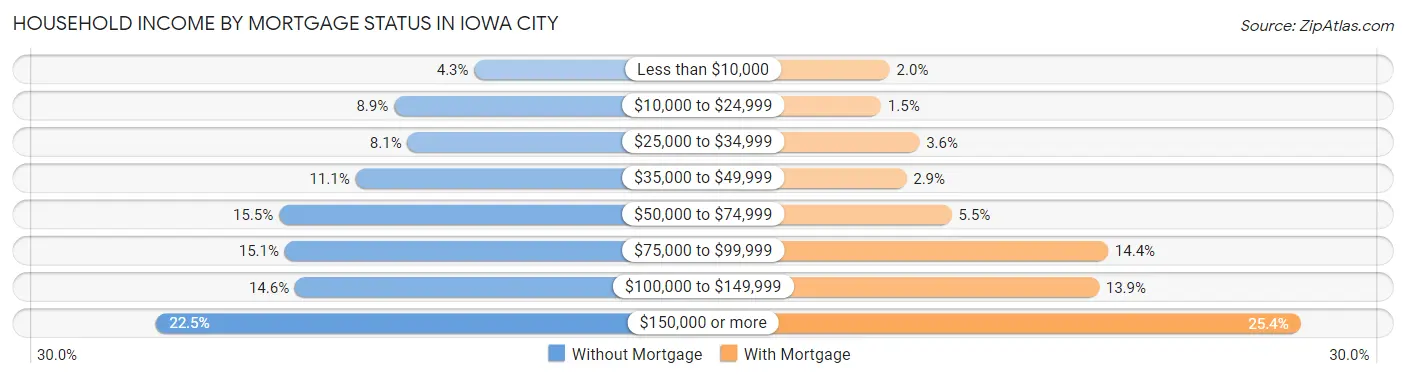
| Household Income | Without Mortgage | With Mortgage |
| Less than $10,000 | 233 (4.3%) | 170 (1.9%) |
| $10,000 to $24,999 | 482 (8.9%) | 127 (1.5%) |
| $25,000 to $34,999 | 440 (8.1%) | 318 (3.6%) |
| $35,000 to $49,999 | 601 (11.1%) | 253 (2.9%) |
| $50,000 to $74,999 | 838 (15.5%) | 480 (5.5%) |
| $75,000 to $99,999 | 820 (15.1%) | 1,260 (14.4%) |
| $100,000 to $149,999 | 789 (14.5%) | 1,214 (13.9%) |
| $150,000 or more | 1,218 (22.5%) | 2,222 (25.4%) |
| Total | 5,421 (100.0%) | 8,736 (100.0%) |
Property Value to Household Income Ratio in Iowa City
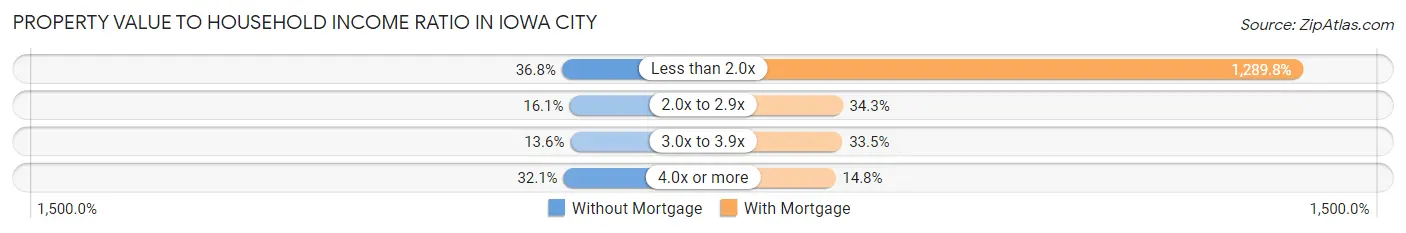
| Value-to-Income Ratio | Without Mortgage | With Mortgage |
| Less than 2.0x | 1,993 (36.8%) | 112,674 (1,289.8%) |
| 2.0x to 2.9x | 874 (16.1%) | 2,992 (34.3%) |
| 3.0x to 3.9x | 736 (13.6%) | 2,924 (33.5%) |
| 4.0x or more | 1,742 (32.1%) | 1,292 (14.8%) |
| Total | 5,421 (100.0%) | 8,736 (100.0%) |
Real Estate Taxes by Mortgage Status in Iowa City
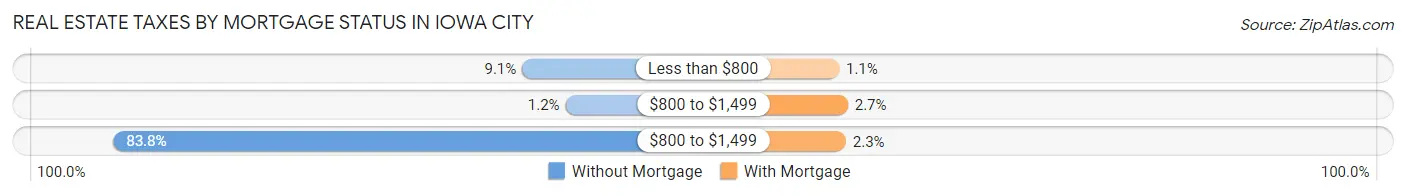
| Property Taxes | Without Mortgage | With Mortgage |
| Less than $800 | 495 (9.1%) | 95 (1.1%) |
| $800 to $1,499 | 66 (1.2%) | 235 (2.7%) |
| $800 to $1,499 | 4,543 (83.8%) | 204 (2.3%) |
| Total | 5,421 (100.0%) | 8,736 (100.0%) |
Health & Disability in Iowa City
Health Insurance Coverage by Age in Iowa City
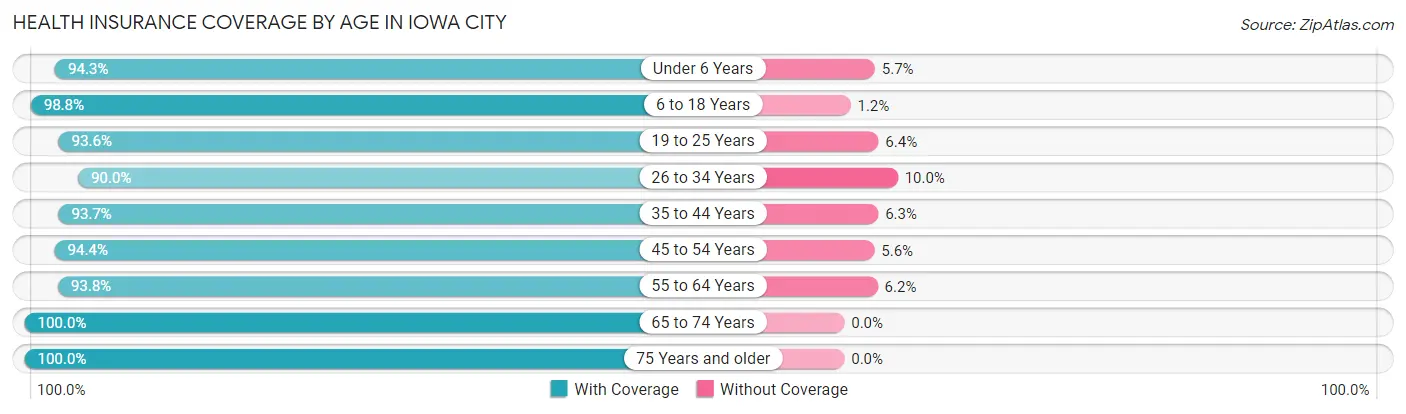
| Age Bracket | With Coverage | Without Coverage |
| Under 6 Years | 3,620 (94.3%) | 219 (5.7%) |
| 6 to 18 Years | 9,503 (98.8%) | 112 (1.2%) |
| 19 to 25 Years | 22,273 (93.6%) | 1,512 (6.4%) |
| 26 to 34 Years | 8,354 (90.0%) | 924 (10.0%) |
| 35 to 44 Years | 7,129 (93.7%) | 481 (6.3%) |
| 45 to 54 Years | 5,885 (94.4%) | 349 (5.6%) |
| 55 to 64 Years | 5,263 (93.8%) | 349 (6.2%) |
| 65 to 74 Years | 5,096 (100.0%) | 0 (0.0%) |
| 75 Years and older | 3,270 (100.0%) | 0 (0.0%) |
| Total | 70,393 (94.7%) | 3,946 (5.3%) |
Health Insurance Coverage by Citizenship Status in Iowa City
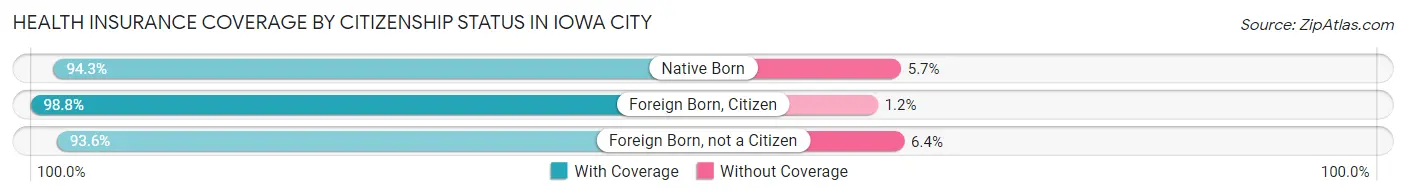
| Citizenship Status | With Coverage | Without Coverage |
| Native Born | 3,620 (94.3%) | 219 (5.7%) |
| Foreign Born, Citizen | 9,503 (98.8%) | 112 (1.2%) |
| Foreign Born, not a Citizen | 22,273 (93.6%) | 1,512 (6.4%) |
Health Insurance Coverage by Household Income in Iowa City
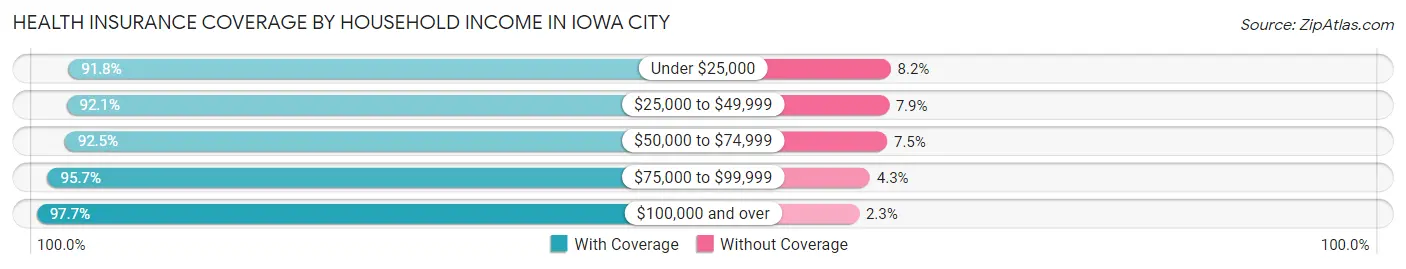
| Household Income | With Coverage | Without Coverage |
| Under $25,000 | 13,015 (91.8%) | 1,164 (8.2%) |
| $25,000 to $49,999 | 12,432 (92.1%) | 1,060 (7.9%) |
| $50,000 to $74,999 | 9,061 (92.5%) | 739 (7.5%) |
| $75,000 to $99,999 | 6,906 (95.7%) | 312 (4.3%) |
| $100,000 and over | 23,350 (97.7%) | 546 (2.3%) |
Public vs Private Health Insurance Coverage by Age in Iowa City
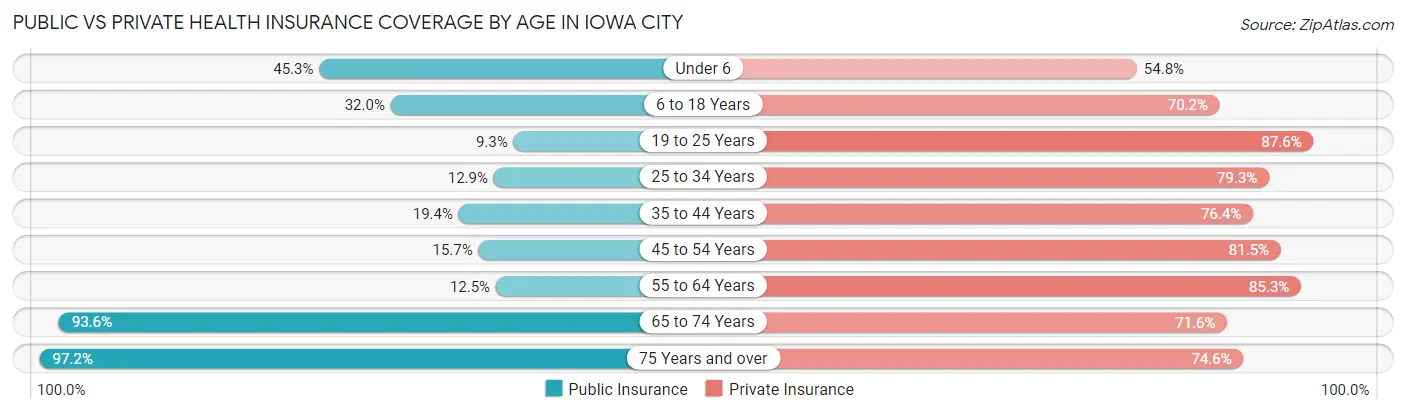
| Age Bracket | Public Insurance | Private Insurance |
| Under 6 | 1,739 (45.3%) | 2,103 (54.8%) |
| 6 to 18 Years | 3,081 (32.0%) | 6,746 (70.2%) |
| 19 to 25 Years | 2,199 (9.2%) | 20,826 (87.6%) |
| 25 to 34 Years | 1,198 (12.9%) | 7,359 (79.3%) |
| 35 to 44 Years | 1,476 (19.4%) | 5,811 (76.4%) |
| 45 to 54 Years | 981 (15.7%) | 5,081 (81.5%) |
| 55 to 64 Years | 702 (12.5%) | 4,785 (85.3%) |
| 65 to 74 Years | 4,772 (93.6%) | 3,646 (71.6%) |
| 75 Years and over | 3,179 (97.2%) | 2,438 (74.6%) |
| Total | 19,327 (26.0%) | 58,795 (79.1%) |
Disability Status by Sex by Age in Iowa City
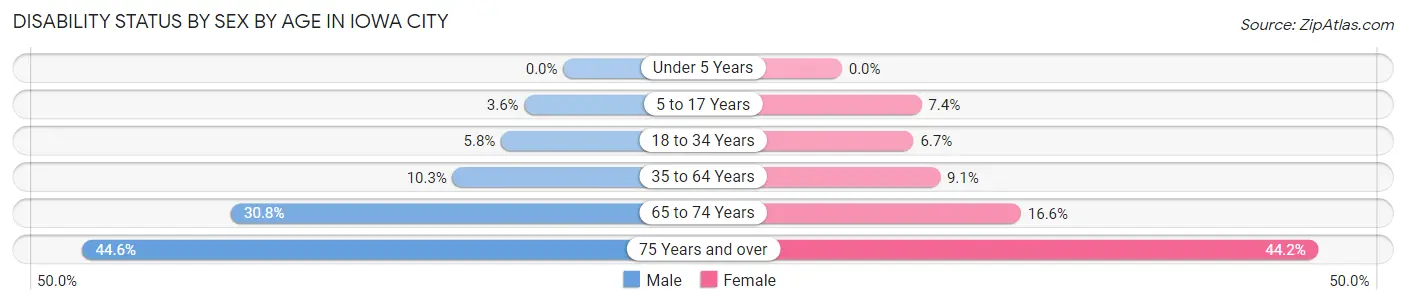
| Age Bracket | Male | Female |
| Under 5 Years | 0 (0.0%) | 0 (0.0%) |
| 5 to 17 Years | 141 (3.6%) | 270 (7.4%) |
| 18 to 34 Years | 997 (5.8%) | 1,230 (6.7%) |
| 35 to 64 Years | 1,017 (10.3%) | 870 (9.1%) |
| 65 to 74 Years | 755 (30.8%) | 440 (16.6%) |
| 75 Years and over | 613 (44.6%) | 837 (44.2%) |
Disability Class by Sex by Age in Iowa City
Disability Class: Hearing Difficulty
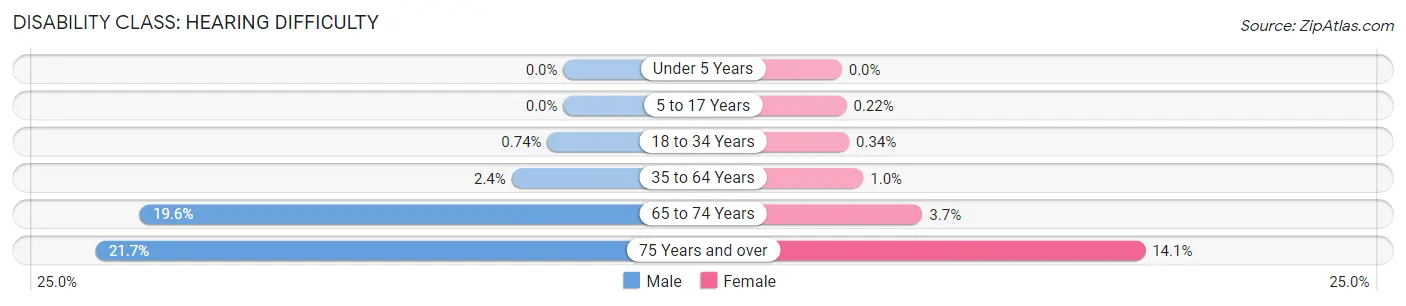
| Age Bracket | Male | Female |
| Under 5 Years | 0 (0.0%) | 0 (0.0%) |
| 5 to 17 Years | 0 (0.0%) | 8 (0.2%) |
| 18 to 34 Years | 128 (0.7%) | 63 (0.3%) |
| 35 to 64 Years | 238 (2.4%) | 96 (1.0%) |
| 65 to 74 Years | 481 (19.6%) | 99 (3.7%) |
| 75 Years and over | 298 (21.7%) | 267 (14.1%) |
Disability Class: Vision Difficulty
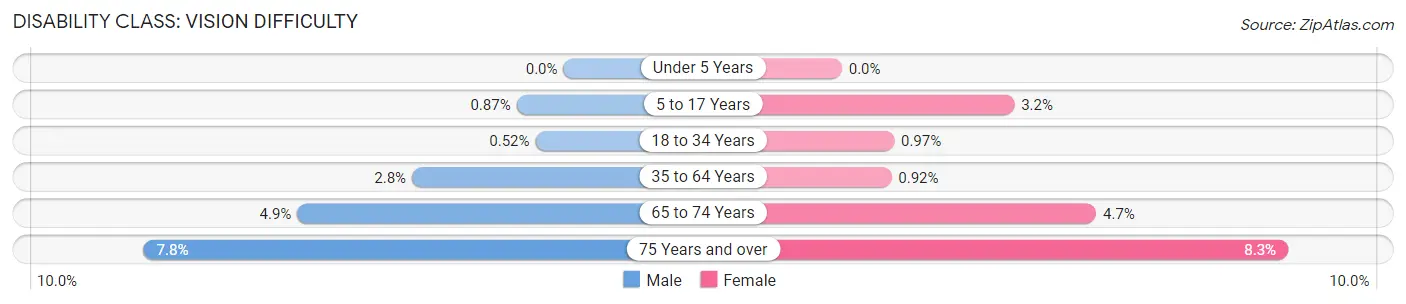
| Age Bracket | Male | Female |
| Under 5 Years | 0 (0.0%) | 0 (0.0%) |
| 5 to 17 Years | 34 (0.9%) | 117 (3.2%) |
| 18 to 34 Years | 90 (0.5%) | 180 (1.0%) |
| 35 to 64 Years | 278 (2.8%) | 88 (0.9%) |
| 65 to 74 Years | 121 (4.9%) | 125 (4.7%) |
| 75 Years and over | 107 (7.8%) | 157 (8.3%) |
Disability Class: Cognitive Difficulty
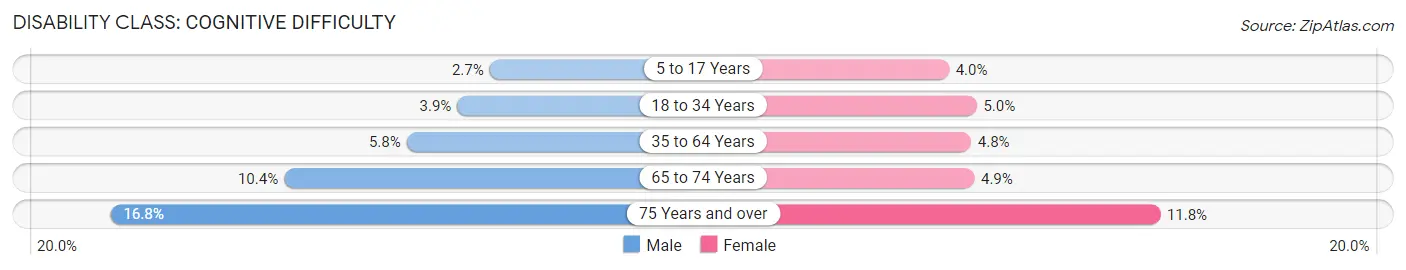
| Age Bracket | Male | Female |
| 5 to 17 Years | 107 (2.7%) | 145 (4.0%) |
| 18 to 34 Years | 681 (3.9%) | 924 (5.0%) |
| 35 to 64 Years | 576 (5.8%) | 458 (4.8%) |
| 65 to 74 Years | 254 (10.4%) | 130 (4.9%) |
| 75 Years and over | 231 (16.8%) | 224 (11.8%) |
Disability Class: Ambulatory Difficulty
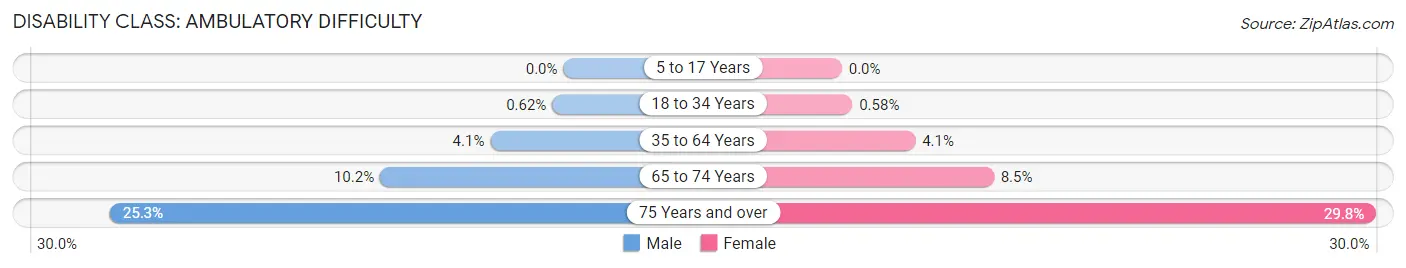
| Age Bracket | Male | Female |
| 5 to 17 Years | 0 (0.0%) | 0 (0.0%) |
| 18 to 34 Years | 107 (0.6%) | 108 (0.6%) |
| 35 to 64 Years | 403 (4.1%) | 391 (4.1%) |
| 65 to 74 Years | 250 (10.2%) | 224 (8.5%) |
| 75 Years and over | 347 (25.3%) | 564 (29.7%) |
Disability Class: Self-Care Difficulty
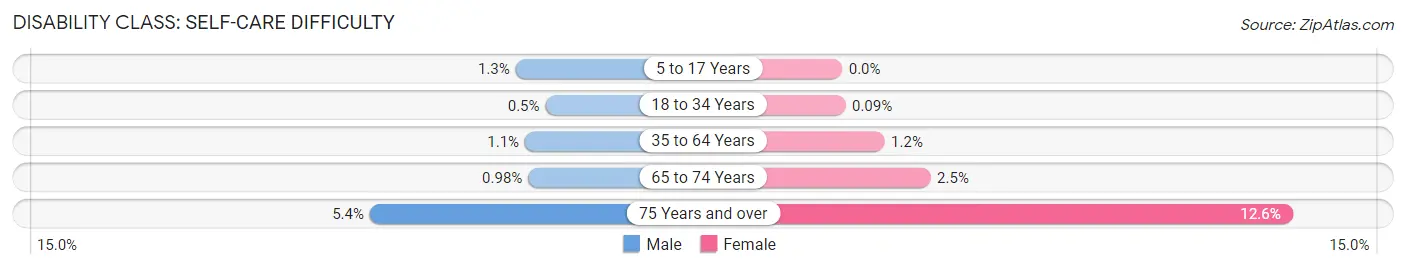
| Age Bracket | Male | Female |
| 5 to 17 Years | 52 (1.3%) | 0 (0.0%) |
| 18 to 34 Years | 86 (0.5%) | 17 (0.1%) |
| 35 to 64 Years | 106 (1.1%) | 113 (1.2%) |
| 65 to 74 Years | 24 (1.0%) | 65 (2.5%) |
| 75 Years and over | 74 (5.4%) | 238 (12.6%) |
Technology Access in Iowa City
Computing Device Access in Iowa City
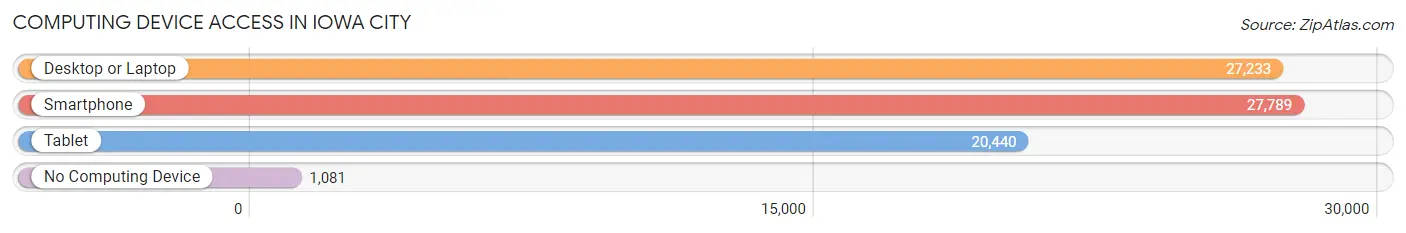
| Device Type | # Households | % Households |
| Desktop or Laptop | 27,233 | 89.2% |
| Smartphone | 27,789 | 91.0% |
| Tablet | 20,440 | 66.9% |
| No Computing Device | 1,081 | 3.5% |
| Total | 30,544 | 100.0% |
Internet Access in Iowa City
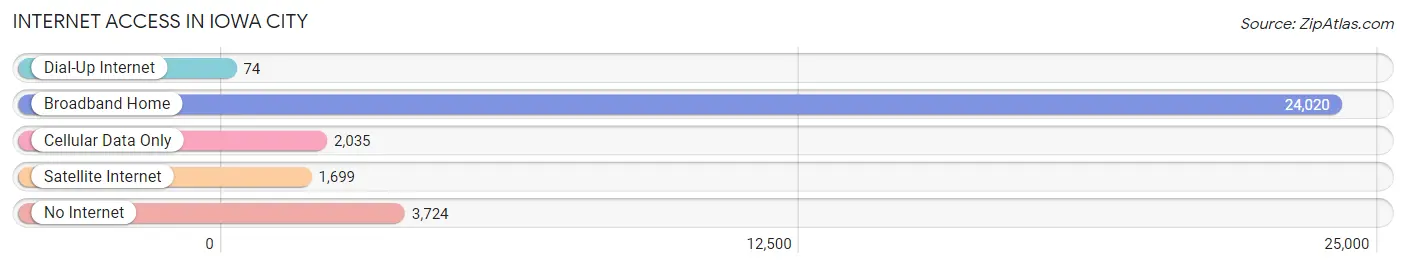
| Internet Type | # Households | % Households |
| Dial-Up Internet | 74 | 0.2% |
| Broadband Home | 24,020 | 78.6% |
| Cellular Data Only | 2,035 | 6.7% |
| Satellite Internet | 1,699 | 5.6% |
| No Internet | 3,724 | 12.2% |
| Total | 30,544 | 100.0% |
Iowa City Summary
Iowa City is a city located in Johnson County, Iowa, United States. It is the county seat of Johnson County and the home of the University of Iowa. The city is located on the Iowa River and is the fifth-largest city in the state of Iowa. As of the 2010 census, the city had a total population of 67,862.
Geography
Iowa City is located in east-central Iowa, approximately 70 miles east of Des Moines. It is situated on the Iowa River, which flows southward through the city. The city is located in the rolling hills of the Iowa River Valley, which is part of the larger Driftless Area. The city is surrounded by several small towns and villages, including North Liberty, Coralville, and Hills.
The city has a total area of 25.2 square miles, of which 24.9 square miles is land and 0.3 square miles is water. The city is located at an elevation of 812 feet above sea level.
History
Iowa City was founded in 1839 by a group of settlers led by John F. Rague. The city was originally named Iowa City after the Iowa River, which flows through the city. The city was incorporated in 1853 and became the county seat of Johnson County.
In the late 19th century, Iowa City was a major center for the manufacture of agricultural equipment. The city was also home to several colleges and universities, including the University of Iowa, which was founded in 1847.
In the 20th century, Iowa City became a major center for the arts and culture. The city is home to several museums, galleries, and theaters, as well as the Iowa Writers' Workshop, which was founded in 1936.
Economy
The economy of Iowa City is largely driven by the University of Iowa, which is the city's largest employer. Other major employers in the city include the University of Iowa Hospitals and Clinics, the Iowa City Community School District, and the City of Iowa City.
The city is also home to several major corporations, including Rockwell Collins, ACT, and Pearson Education. The city is also home to several technology companies, including Google, Microsoft, and Oracle.
Demographics
As of the 2010 census, the city had a population of 67,862. The racial makeup of the city was 83.2% White, 8.3% African American, 0.3% Native American, 4.3% Asian, 0.1% Pacific Islander, 1.7% from other races, and 2.1% from two or more races. Hispanic or Latino of any race were 5.2% of the population.
The median income for a household in the city was $45,945, and the median income for a family was $60,945. The per capita income for the city was $25,945. About 11.2% of families and 17.2% of the population were below the poverty line, including 22.2% of those under age 18 and 6.2% of those age 65 or over.
Common Questions
What is Per Capita Income in Iowa City?
Per Capita income in Iowa City is $34,820.
What is the Median Family Income in Iowa City?
Median Family Income in Iowa City is $103,193.
What is the Median Household income in Iowa City?
Median Household Income in Iowa City is $54,879.
What is Income or Wage Gap in Iowa City?
Income or Wage Gap in Iowa City is 37.8%.
Women in Iowa City earn 62.2 cents for every dollar earned by a man.
What is Family Income Deficit in Iowa City?
Family Income Deficit in Iowa City is $12,927.
Families that are below poverty line in Iowa City earn $12,927 less on average than the poverty threshold level.
What is Inequality or Gini Index in Iowa City?
Inequality or Gini Index in Iowa City is 0.52.
What is the Total Population of Iowa City?
Total Population of Iowa City is 74,878.
What is the Total Male Population of Iowa City?
Total Male Population of Iowa City is 37,104.
What is the Total Female Population of Iowa City?
Total Female Population of Iowa City is 37,774.
What is the Ratio of Males per 100 Females in Iowa City?
There are 98.23 Males per 100 Females in Iowa City.
What is the Ratio of Females per 100 Males in Iowa City?
There are 101.81 Females per 100 Males in Iowa City.
What is the Median Population Age in Iowa City?
Median Population Age in Iowa City is 26.0 Years.
What is the Average Family Size in Iowa City
Average Family Size in Iowa City is 3.0 People.
What is the Average Household Size in Iowa City
Average Household Size in Iowa City is 2.2 People.
How Large is the Labor Force in Iowa City?
There are 44,273 People in the Labor Forcein in Iowa City.
What is the Percentage of People in the Labor Force in Iowa City?
67.9% of People are in the Labor Force in Iowa City.
What is the Unemployment Rate in Iowa City?
Unemployment Rate in Iowa City is 4.8%.