Stonecrest, GA Map & Demographics
Stonecrest Map
Stonecrest Overview
$29,933
PER CAPITA INCOME
$75,771
AVG FAMILY INCOME
$63,438
AVG HOUSEHOLD INCOME
16.6%
WAGE / INCOME GAP [ % ]
83.4¢/ $1
WAGE / INCOME GAP [ $ ]
$10,444
FAMILY INCOME DEFICIT
0.42
INEQUALITY / GINI INDEX
59,445
TOTAL POPULATION
27,102
MALE POPULATION
32,343
FEMALE POPULATION
83.80
MALES / 100 FEMALES
119.34
FEMALES / 100 MALES
34.5
MEDIAN AGE
3.7
AVG FAMILY SIZE
2.9
AVG HOUSEHOLD SIZE
32,440
LABOR FORCE [ PEOPLE ]
68.5%
PERCENT IN LABOR FORCE
8.6%
UNEMPLOYMENT RATE
Income in Stonecrest
Income Overview in Stonecrest
Per Capita Income in Stonecrest is $29,933, while median incomes of families and households are $75,771 and $63,438 respectively.
| Characteristic | Number | Measure |
| Per Capita Income | 59,445 | $29,933 |
| Median Family Income | 12,589 | $75,771 |
| Mean Family Income | 12,589 | $88,655 |
| Median Household Income | 20,439 | $63,438 |
| Mean Household Income | 20,439 | $78,178 |
| Income Deficit | 12,589 | $10,444 |
| Wage / Income Gap (%) | 59,445 | 16.61% |
| Wage / Income Gap ($) | 59,445 | 83.39¢ per $1 |
| Gini / Inequality Index | 59,445 | 0.42 |
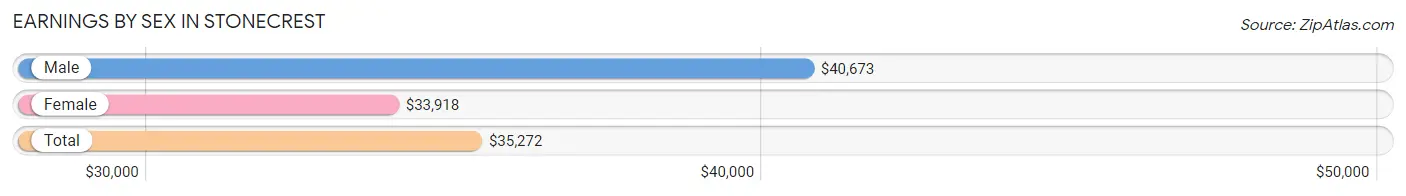
Earnings by Sex in Stonecrest
Average Earnings in Stonecrest are $35,272, $40,673 for men and $33,918 for women, a difference of 16.6%.
| Sex | Number | Average Earnings |
| Male | 13,917 (43.2%) | $40,673 |
| Female | 18,261 (56.8%) | $33,918 |
| Total | 32,178 (100.0%) | $35,272 |
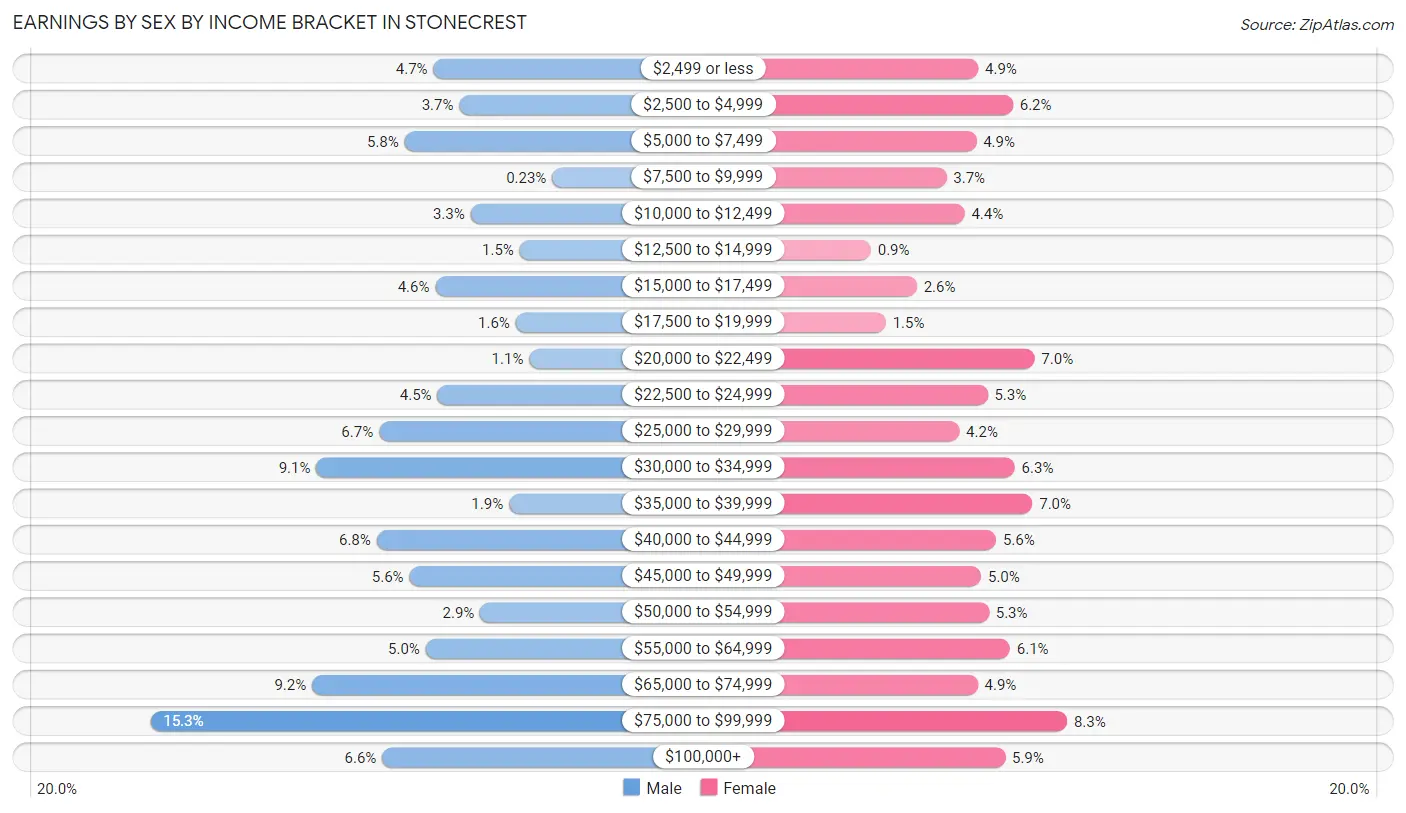
Earnings by Sex by Income Bracket in Stonecrest
The most common earnings brackets in Stonecrest are $75,000 to $99,999 for men (2,128 | 15.3%) and $75,000 to $99,999 for women (1,506 | 8.3%).
| Income | Male | Female |
| $2,499 or less | 651 (4.7%) | 899 (4.9%) |
| $2,500 to $4,999 | 517 (3.7%) | 1,135 (6.2%) |
| $5,000 to $7,499 | 802 (5.8%) | 885 (4.9%) |
| $7,500 to $9,999 | 32 (0.2%) | 682 (3.7%) |
| $10,000 to $12,499 | 458 (3.3%) | 805 (4.4%) |
| $12,500 to $14,999 | 202 (1.5%) | 165 (0.9%) |
| $15,000 to $17,499 | 641 (4.6%) | 479 (2.6%) |
| $17,500 to $19,999 | 222 (1.6%) | 267 (1.5%) |
| $20,000 to $22,499 | 152 (1.1%) | 1,284 (7.0%) |
| $22,500 to $24,999 | 630 (4.5%) | 963 (5.3%) |
| $25,000 to $29,999 | 935 (6.7%) | 768 (4.2%) |
| $30,000 to $34,999 | 1,262 (9.1%) | 1,149 (6.3%) |
| $35,000 to $39,999 | 257 (1.8%) | 1,270 (7.0%) |
| $40,000 to $44,999 | 948 (6.8%) | 1,021 (5.6%) |
| $45,000 to $49,999 | 777 (5.6%) | 919 (5.0%) |
| $50,000 to $54,999 | 408 (2.9%) | 972 (5.3%) |
| $55,000 to $64,999 | 691 (5.0%) | 1,115 (6.1%) |
| $65,000 to $74,999 | 1,285 (9.2%) | 894 (4.9%) |
| $75,000 to $99,999 | 2,128 (15.3%) | 1,506 (8.3%) |
| $100,000+ | 919 (6.6%) | 1,083 (5.9%) |
| Total | 13,917 (100.0%) | 18,261 (100.0%) |
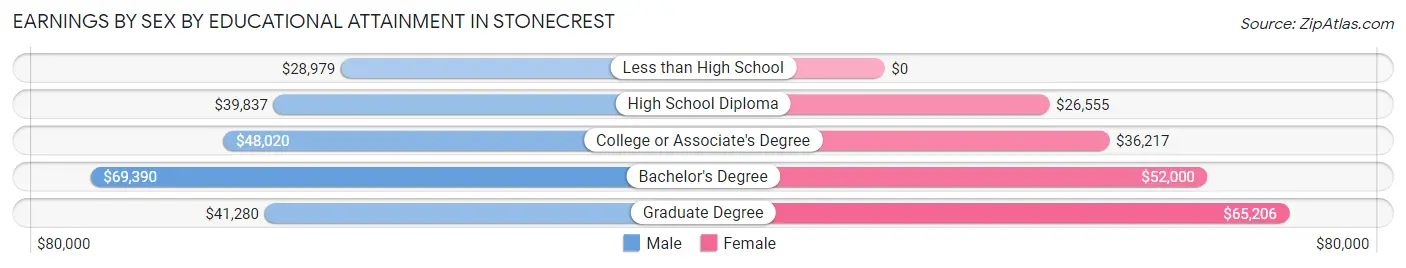
Earnings by Sex by Educational Attainment in Stonecrest
Average earnings in Stonecrest are $44,246 for men and $38,738 for women, a difference of 12.4%. Men with an educational attainment of bachelor's degree enjoy the highest average annual earnings of $69,390, while those with less than high school education earn the least with $28,979. Women with an educational attainment of graduate degree earn the most with the average annual earnings of $65,206, while those with high school diploma education have the smallest earnings of $26,555.
| Educational Attainment | Male Income | Female Income |
| Less than High School | $28,979 | $0 |
| High School Diploma | $39,837 | $26,555 |
| College or Associate's Degree | $48,020 | $36,217 |
| Bachelor's Degree | $69,390 | $52,000 |
| Graduate Degree | $41,280 | $65,206 |
| Total | $44,246 | $38,738 |
Family Income in Stonecrest
Family Income Brackets in Stonecrest
According to the Stonecrest family income data, there are 2,593 families falling into the $75,000 to $99,999 income range, which is the most common income bracket and makes up 20.6% of all families. Conversely, the $10,000 to $14,999 income bracket is the least frequent group with only 277 families (2.2%) belonging to this category.
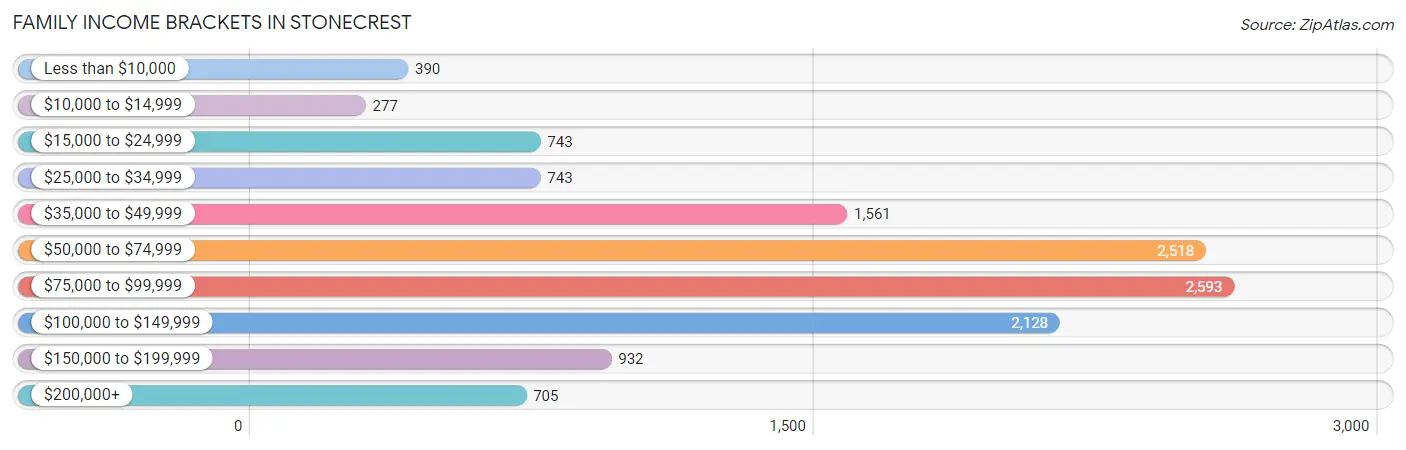
| Income Bracket | # Families | % Families |
| Less than $10,000 | 390 | 3.1% |
| $10,000 to $14,999 | 277 | 2.2% |
| $15,000 to $24,999 | 743 | 5.9% |
| $25,000 to $34,999 | 743 | 5.9% |
| $35,000 to $49,999 | 1,561 | 12.4% |
| $50,000 to $74,999 | 2,518 | 20.0% |
| $75,000 to $99,999 | 2,593 | 20.6% |
| $100,000 to $149,999 | 2,128 | 16.9% |
| $150,000 to $199,999 | 932 | 7.4% |
| $200,000+ | 705 | 5.6% |
Family Income by Famaliy Size in Stonecrest
6-person families (213 | 1.7%) account for the highest median family income in Stonecrest with $106,168 per family, while 2-person families (5,037 | 40.0%) have the highest median income of $38,762 per family member.
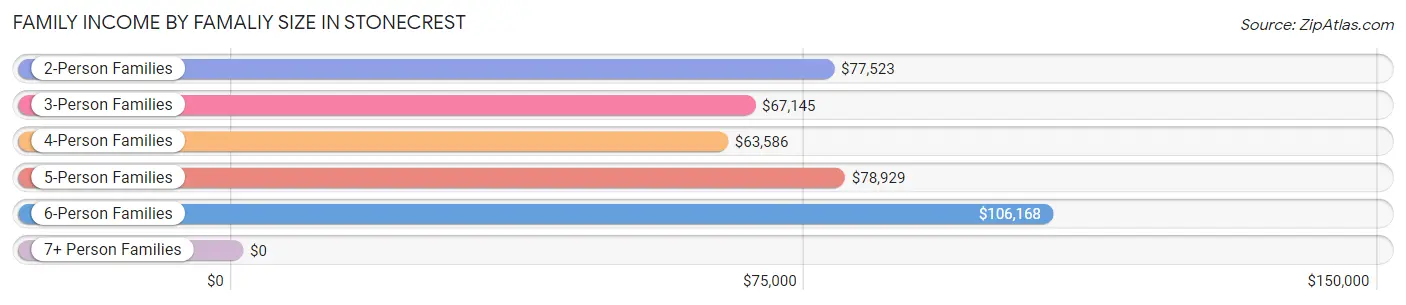
| Income Bracket | # Families | Median Income |
| 2-Person Families | 5,037 (40.0%) | $77,523 |
| 3-Person Families | 3,805 (30.2%) | $67,145 |
| 4-Person Families | 1,877 (14.9%) | $63,586 |
| 5-Person Families | 1,490 (11.8%) | $78,929 |
| 6-Person Families | 213 (1.7%) | $106,168 |
| 7+ Person Families | 167 (1.3%) | $0 |
| Total | 12,589 (100.0%) | $75,771 |
Family Income by Number of Earners in Stonecrest
The median family income in Stonecrest is $75,771, with families comprising 3+ earners (1,397) having the highest median family income of $121,343, while families with no earners (1,170) have the lowest median family income of $31,977, accounting for 11.1% and 9.3% of families, respectively.
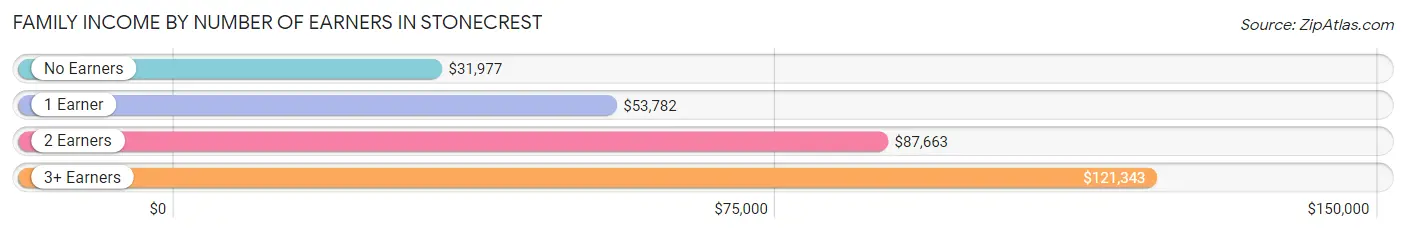
| Number of Earners | # Families | Median Income |
| No Earners | 1,170 (9.3%) | $31,977 |
| 1 Earner | 4,983 (39.6%) | $53,782 |
| 2 Earners | 5,039 (40.0%) | $87,663 |
| 3+ Earners | 1,397 (11.1%) | $121,343 |
| Total | 12,589 (100.0%) | $75,771 |
Household Income in Stonecrest
Household Income Brackets in Stonecrest
With 3,883 households falling in the category, the $50,000 to $74,999 income range is the most frequent in Stonecrest, accounting for 19.0% of all households. In contrast, only 613 households (3.0%) fall into the $10,000 to $14,999 income bracket, making it the least populous group.
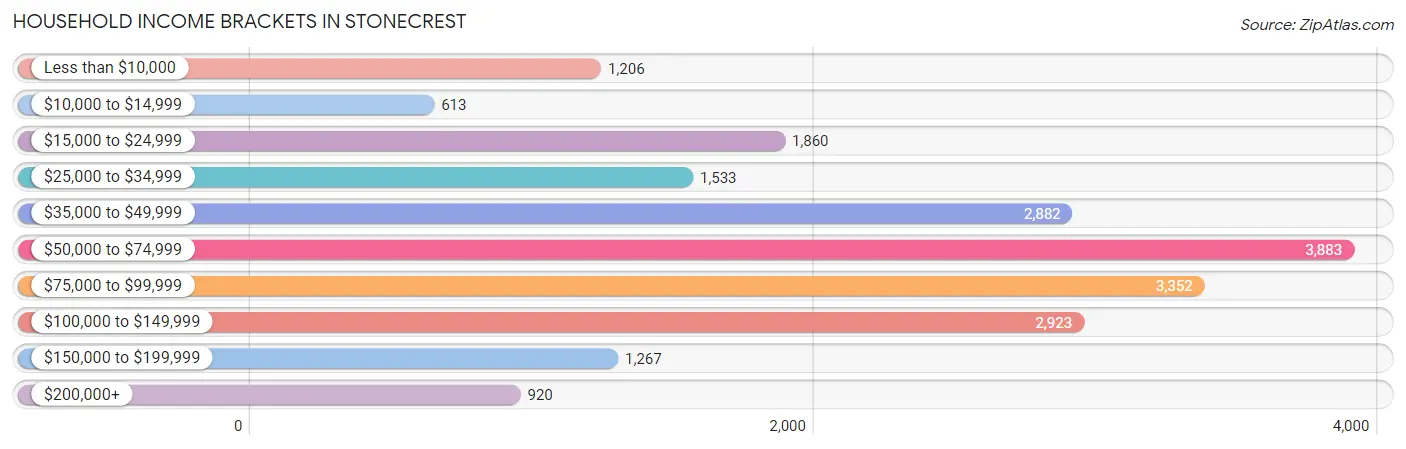
| Income Bracket | # Households | % Households |
| Less than $10,000 | 1,206 | 5.9% |
| $10,000 to $14,999 | 613 | 3.0% |
| $15,000 to $24,999 | 1,860 | 9.1% |
| $25,000 to $34,999 | 1,533 | 7.5% |
| $35,000 to $49,999 | 2,882 | 14.1% |
| $50,000 to $74,999 | 3,883 | 19.0% |
| $75,000 to $99,999 | 3,352 | 16.4% |
| $100,000 to $149,999 | 2,923 | 14.3% |
| $150,000 to $199,999 | 1,267 | 6.2% |
| $200,000+ | 920 | 4.5% |
Household Income by Householder Age in Stonecrest
The median household income in Stonecrest is $63,438, with the highest median household income of $75,595 found in the 45 to 64 years age bracket for the primary householder. A total of 9,084 households (44.4%) fall into this category. Meanwhile, the 15 to 24 years age bracket for the primary householder has the lowest median household income of $0, with 916 households (4.5%) in this group.
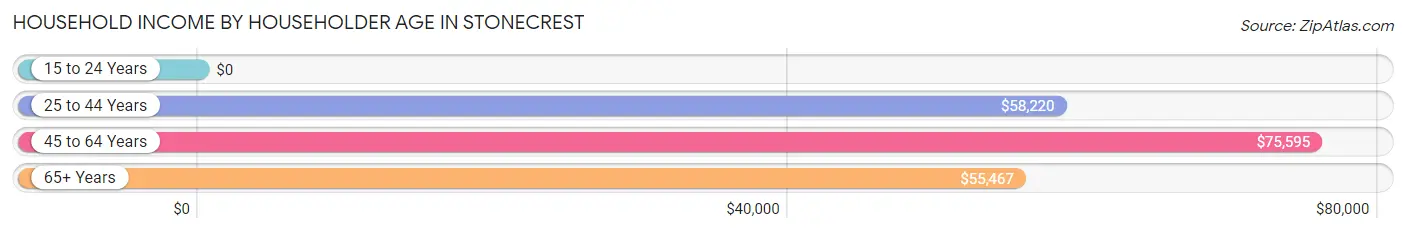
| Income Bracket | # Households | Median Income |
| 15 to 24 Years | 916 (4.5%) | $0 |
| 25 to 44 Years | 6,696 (32.8%) | $58,220 |
| 45 to 64 Years | 9,084 (44.4%) | $75,595 |
| 65+ Years | 3,743 (18.3%) | $55,467 |
| Total | 20,439 (100.0%) | $63,438 |
Poverty in Stonecrest
Income Below Poverty by Sex and Age in Stonecrest
With 14.1% poverty level for males and 16.1% for females among the residents of Stonecrest, 15 year old males and 16 and 17 year old females are the most vulnerable to poverty, with 229 males (38.9%) and 318 females (28.6%) in their respective age groups living below the poverty level.
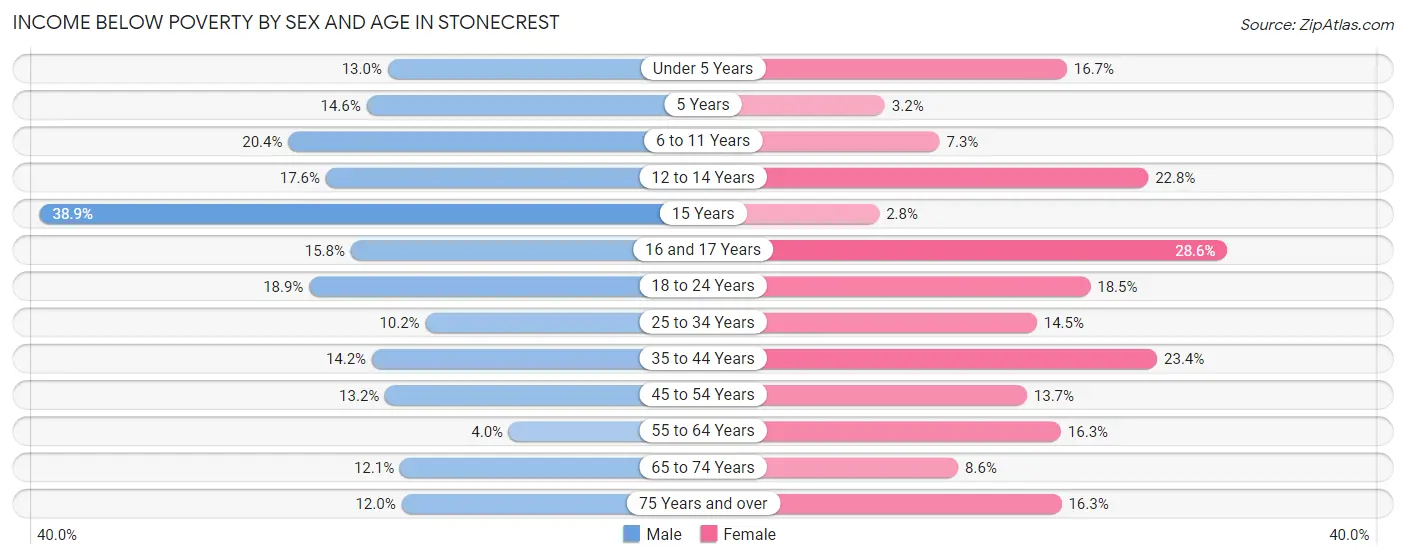
| Age Bracket | Male | Female |
| Under 5 Years | 232 (13.0%) | 324 (16.7%) |
| 5 Years | 39 (14.6%) | 12 (3.2%) |
| 6 to 11 Years | 472 (20.4%) | 117 (7.3%) |
| 12 to 14 Years | 300 (17.6%) | 220 (22.8%) |
| 15 Years | 229 (38.9%) | 9 (2.8%) |
| 16 and 17 Years | 148 (15.8%) | 318 (28.6%) |
| 18 to 24 Years | 642 (18.9%) | 590 (18.4%) |
| 25 to 34 Years | 449 (10.2%) | 747 (14.5%) |
| 35 to 44 Years | 427 (14.2%) | 1,080 (23.4%) |
| 45 to 54 Years | 458 (13.2%) | 701 (13.7%) |
| 55 to 64 Years | 106 (4.0%) | 635 (16.3%) |
| 65 to 74 Years | 229 (12.1%) | 240 (8.6%) |
| 75 Years and over | 72 (12.0%) | 162 (16.3%) |
| Total | 3,803 (14.1%) | 5,155 (16.1%) |
Income Above Poverty by Sex and Age in Stonecrest
According to the poverty statistics in Stonecrest, males aged 55 to 64 years and females aged 15 years are the age groups that are most secure financially, with 96.0% of males and 97.2% of females in these age groups living above the poverty line.
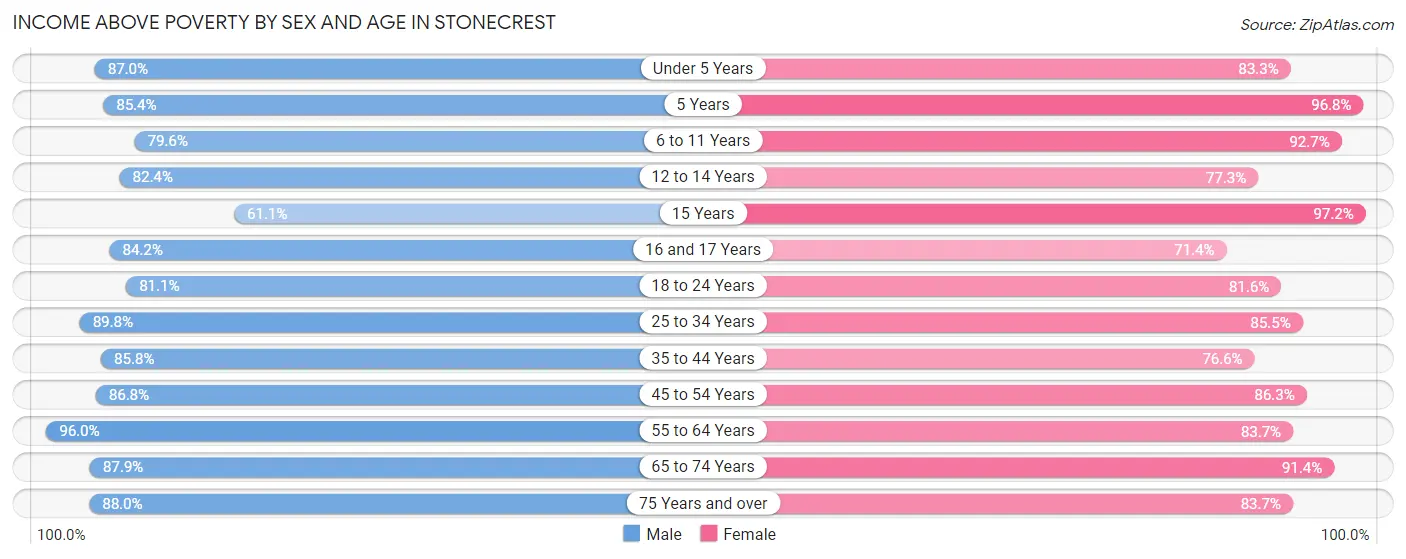
| Age Bracket | Male | Female |
| Under 5 Years | 1,547 (87.0%) | 1,615 (83.3%) |
| 5 Years | 228 (85.4%) | 363 (96.8%) |
| 6 to 11 Years | 1,839 (79.6%) | 1,495 (92.7%) |
| 12 to 14 Years | 1,401 (82.4%) | 747 (77.2%) |
| 15 Years | 360 (61.1%) | 315 (97.2%) |
| 16 and 17 Years | 790 (84.2%) | 793 (71.4%) |
| 18 to 24 Years | 2,760 (81.1%) | 2,608 (81.6%) |
| 25 to 34 Years | 3,935 (89.8%) | 4,413 (85.5%) |
| 35 to 44 Years | 2,578 (85.8%) | 3,533 (76.6%) |
| 45 to 54 Years | 3,004 (86.8%) | 4,401 (86.3%) |
| 55 to 64 Years | 2,517 (96.0%) | 3,268 (83.7%) |
| 65 to 74 Years | 1,659 (87.9%) | 2,538 (91.4%) |
| 75 Years and over | 527 (88.0%) | 831 (83.7%) |
| Total | 23,145 (85.9%) | 26,920 (83.9%) |
Income Below Poverty Among Married-Couple Families in Stonecrest
The poverty statistics for married-couple families in Stonecrest show that 5.0% or 257 of the total 5,121 families live below the poverty line. Families with 1 or 2 children have the highest poverty rate of 10.3%, comprising of 209 families. On the other hand, families with 5 or more children have the lowest poverty rate of 0.0%, which includes 0 families.
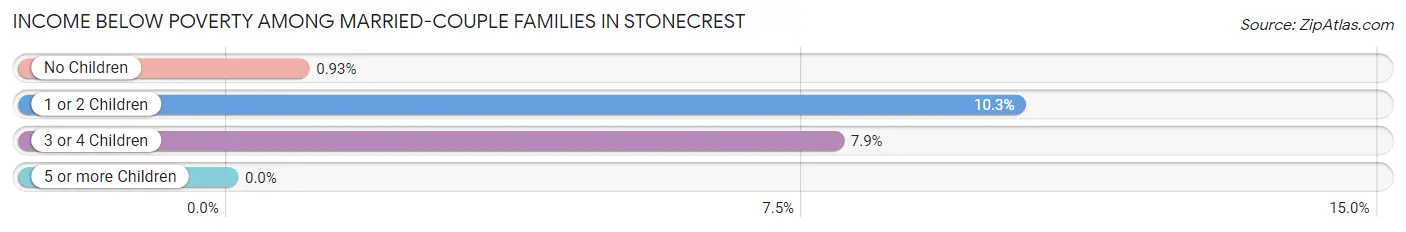
| Children | Above Poverty | Below Poverty |
| No Children | 2,781 (99.1%) | 26 (0.9%) |
| 1 or 2 Children | 1,822 (89.7%) | 209 (10.3%) |
| 3 or 4 Children | 256 (92.1%) | 22 (7.9%) |
| 5 or more Children | 5 (100.0%) | 0 (0.0%) |
| Total | 4,864 (95.0%) | 257 (5.0%) |
Income Below Poverty Among Single-Parent Households in Stonecrest
According to the poverty data in Stonecrest, 6.2% or 94 single-father households and 17.2% or 1,023 single-mother households are living below the poverty line. Among single-father households, those with 1 or 2 children have the highest poverty rate, with 70 households (12.0%) experiencing poverty. Likewise, among single-mother households, those with 1 or 2 children have the highest poverty rate, with 759 households (20.4%) falling below the poverty line.
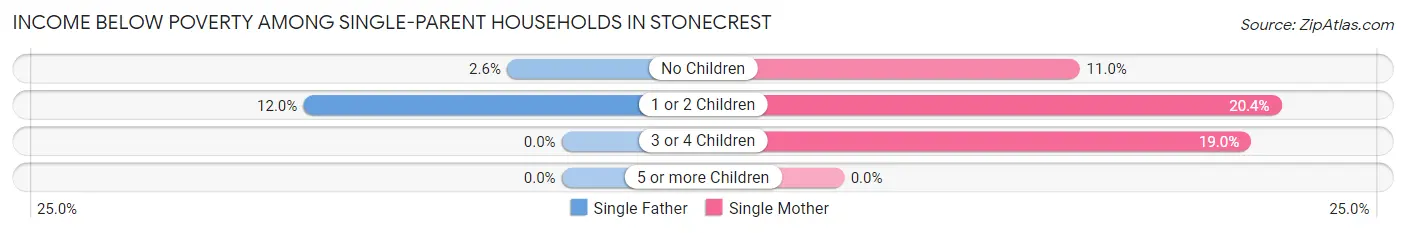
| Children | Single Father | Single Mother |
| No Children | 24 (2.5%) | 194 (11.0%) |
| 1 or 2 Children | 70 (12.0%) | 759 (20.4%) |
| 3 or 4 Children | 0 (0.0%) | 70 (19.0%) |
| 5 or more Children | 0 (0.0%) | 0 (0.0%) |
| Total | 94 (6.2%) | 1,023 (17.2%) |
Income Below Poverty Among Married-Couple vs Single-Parent Households in Stonecrest
The poverty data for Stonecrest shows that 257 of the married-couple family households (5.0%) and 1,117 of the single-parent households (15.0%) are living below the poverty level. Within the married-couple family households, those with 1 or 2 children have the highest poverty rate, with 209 households (10.3%) falling below the poverty line. Among the single-parent households, those with 1 or 2 children have the highest poverty rate, with 829 household (19.3%) living below poverty.
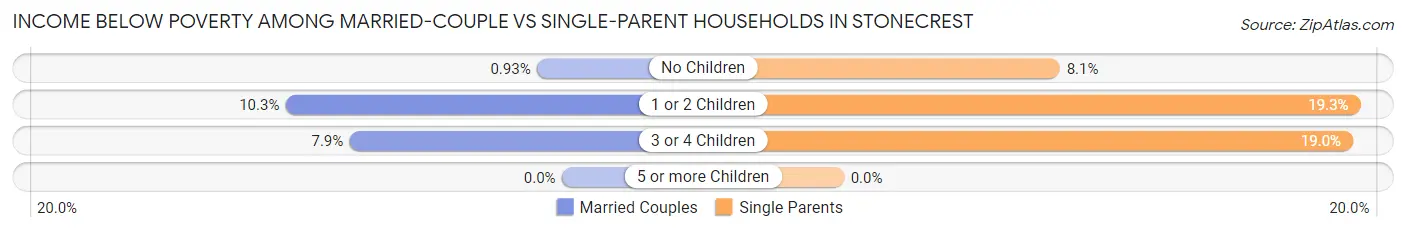
| Children | Married-Couple Families | Single-Parent Households |
| No Children | 26 (0.9%) | 218 (8.1%) |
| 1 or 2 Children | 209 (10.3%) | 829 (19.3%) |
| 3 or 4 Children | 22 (7.9%) | 70 (19.0%) |
| 5 or more Children | 0 (0.0%) | 0 (0.0%) |
| Total | 257 (5.0%) | 1,117 (15.0%) |
Race in Stonecrest
The most populous races in Stonecrest are Black / African American (54,018 | 90.9%), Two or more Races (2,781 | 4.7%), and White / Caucasian (1,674 | 2.8%).
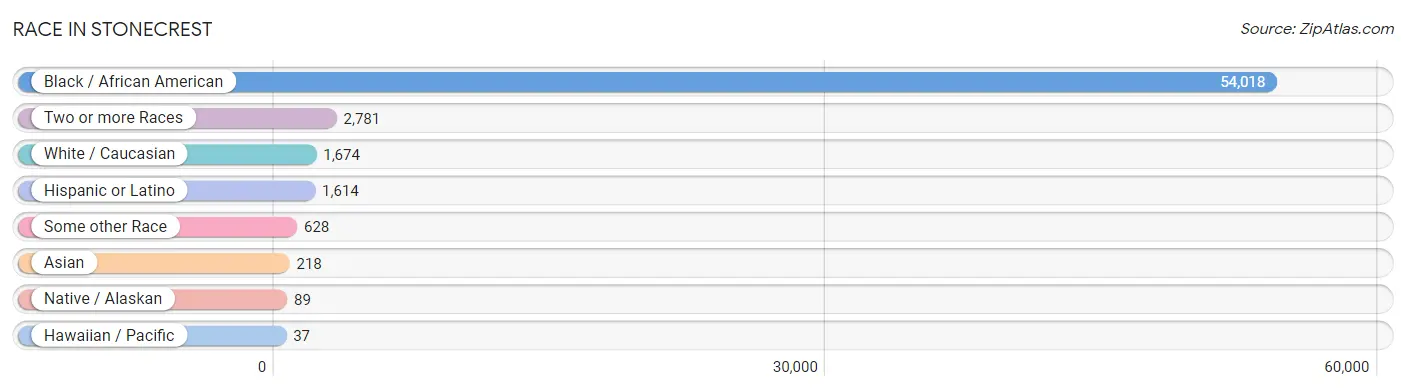
| Race | # Population | % Population |
| Asian | 218 | 0.4% |
| Black / African American | 54,018 | 90.9% |
| Hawaiian / Pacific | 37 | 0.1% |
| Hispanic or Latino | 1,614 | 2.7% |
| Native / Alaskan | 89 | 0.2% |
| White / Caucasian | 1,674 | 2.8% |
| Two or more Races | 2,781 | 4.7% |
| Some other Race | 628 | 1.1% |
| Total | 59,445 | 100.0% |
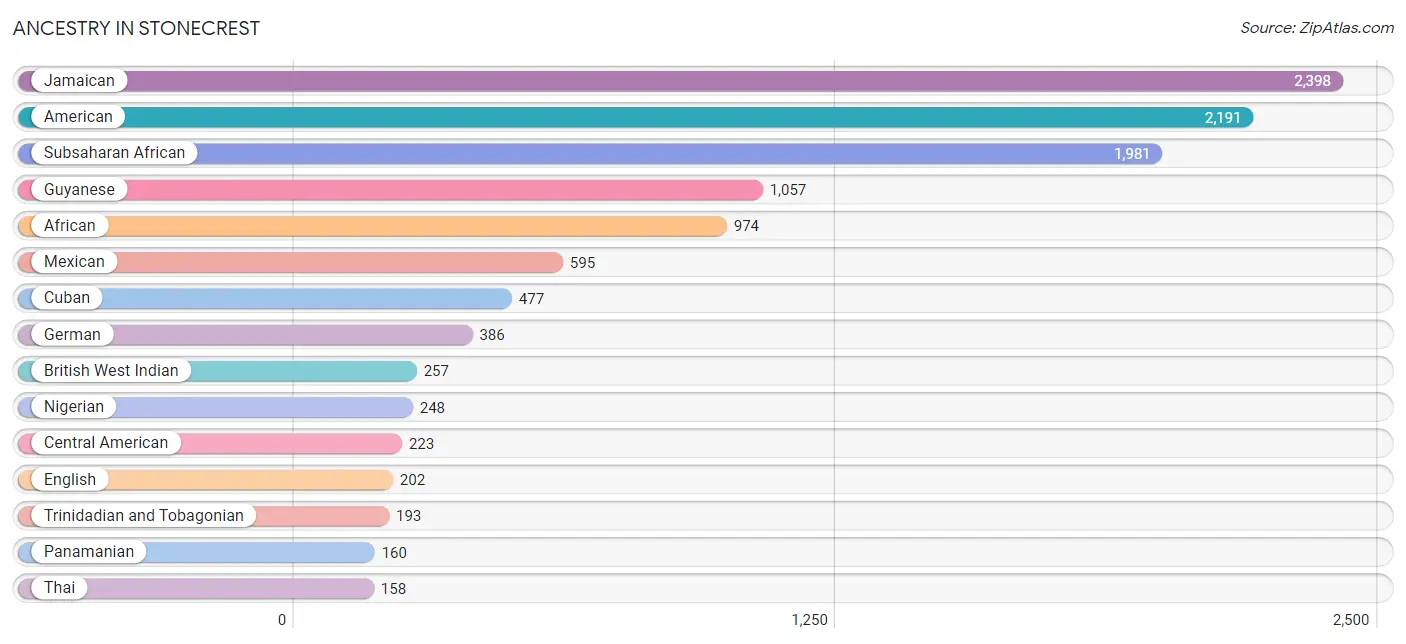
Ancestry in Stonecrest
The most populous ancestries reported in Stonecrest are Jamaican (2,398 | 4.0%), American (2,191 | 3.7%), Subsaharan African (1,981 | 3.3%), Guyanese (1,057 | 1.8%), and African (974 | 1.6%), together accounting for 14.5% of all Stonecrest residents.
| Ancestry | # Population | % Population |
| African | 974 | 1.6% |
| American | 2,191 | 3.7% |
| Bahamian | 112 | 0.2% |
| Barbadian | 74 | 0.1% |
| Blackfeet | 49 | 0.1% |
| British West Indian | 257 | 0.4% |
| Burmese | 80 | 0.1% |
| Canadian | 34 | 0.1% |
| Central American | 223 | 0.4% |
| Cherokee | 9 | 0.0% |
| Choctaw | 24 | 0.0% |
| Colombian | 15 | 0.0% |
| Cuban | 477 | 0.8% |
| Czech | 60 | 0.1% |
| Danish | 63 | 0.1% |
| Dominican | 134 | 0.2% |
| Dutch | 2 | 0.0% |
| English | 202 | 0.3% |
| European | 16 | 0.0% |
| French | 3 | 0.0% |
| German | 386 | 0.6% |
| Ghanaian | 93 | 0.2% |
| Guamanian / Chamorro | 23 | 0.0% |
| Guatemalan | 9 | 0.0% |
| Guyanese | 1,057 | 1.8% |
| Haitian | 140 | 0.2% |
| Honduran | 54 | 0.1% |
| Indian (Asian) | 37 | 0.1% |
| Irish | 154 | 0.3% |
| Italian | 13 | 0.0% |
| Jamaican | 2,398 | 4.0% |
| Korean | 38 | 0.1% |
| Liberian | 58 | 0.1% |
| Mexican | 595 | 1.0% |
| Mexican American Indian | 9 | 0.0% |
| Native Hawaiian | 6 | 0.0% |
| Nigerian | 248 | 0.4% |
| Panamanian | 160 | 0.3% |
| Polish | 23 | 0.0% |
| Puerto Rican | 130 | 0.2% |
| Russian | 27 | 0.1% |
| Samoan | 51 | 0.1% |
| Scotch-Irish | 19 | 0.0% |
| Scottish | 88 | 0.2% |
| Senegalese | 9 | 0.0% |
| Sierra Leonean | 17 | 0.0% |
| Sioux | 1 | 0.0% |
| Somali | 45 | 0.1% |
| South American | 15 | 0.0% |
| Subsaharan African | 1,981 | 3.3% |
| Thai | 158 | 0.3% |
| Trinidadian and Tobagonian | 193 | 0.3% |
| U.S. Virgin Islander | 39 | 0.1% |
| West Indian | 158 | 0.3% | View All 54 Rows |
Immigrants in Stonecrest
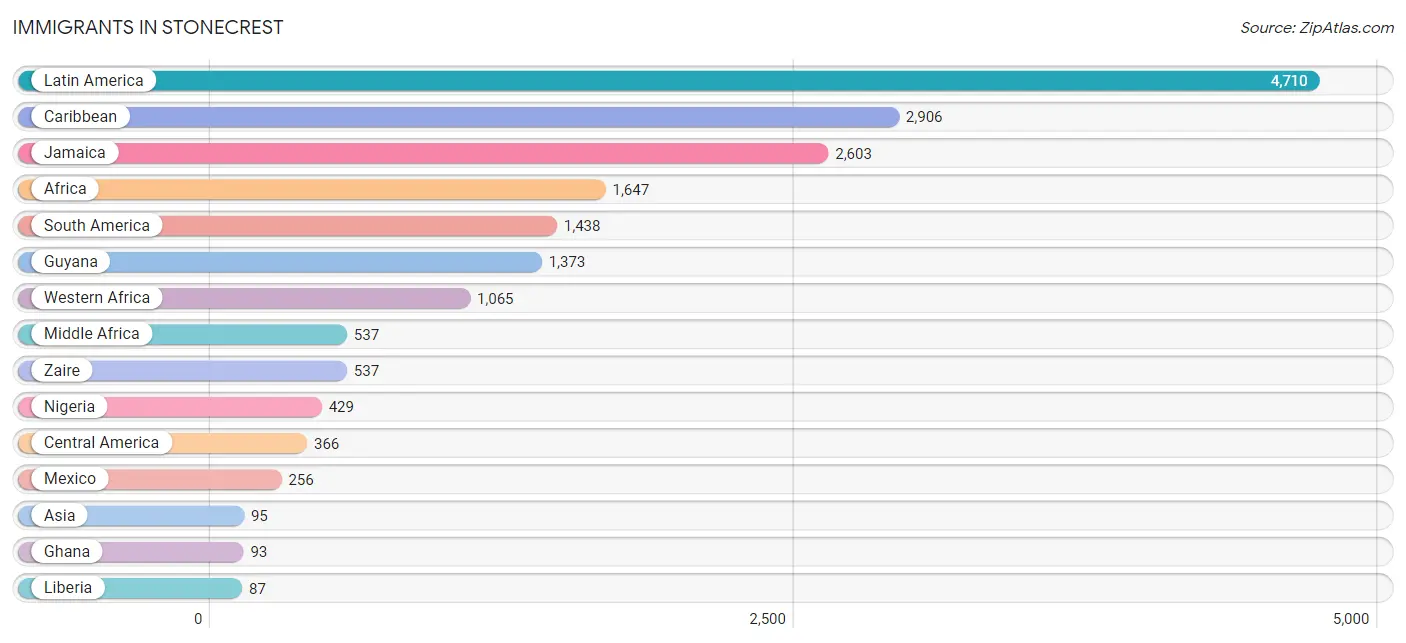
The most numerous immigrant groups reported in Stonecrest came from Latin America (4,710 | 7.9%), Caribbean (2,906 | 4.9%), Jamaica (2,603 | 4.4%), Africa (1,647 | 2.8%), and South America (1,438 | 2.4%), together accounting for 22.4% of all Stonecrest residents.
| Immigration Origin | # Population | % Population |
| Africa | 1,647 | 2.8% |
| Asia | 95 | 0.2% |
| Bahamas | 23 | 0.0% |
| Canada | 32 | 0.1% |
| Caribbean | 2,906 | 4.9% |
| Central America | 366 | 0.6% |
| Colombia | 15 | 0.0% |
| Cuba | 1 | 0.0% |
| Dominican Republic | 70 | 0.1% |
| Eastern Africa | 45 | 0.1% |
| Eastern Europe | 18 | 0.0% |
| England | 27 | 0.1% |
| Europe | 72 | 0.1% |
| France | 3 | 0.0% |
| Ghana | 93 | 0.2% |
| Grenada | 63 | 0.1% |
| Guatemala | 9 | 0.0% |
| Guyana | 1,373 | 2.3% |
| Haiti | 36 | 0.1% |
| Honduras | 54 | 0.1% |
| Hungary | 18 | 0.0% |
| India | 74 | 0.1% |
| Italy | 2 | 0.0% |
| Jamaica | 2,603 | 4.4% |
| Latin America | 4,710 | 7.9% |
| Liberia | 87 | 0.2% |
| Mexico | 256 | 0.4% |
| Middle Africa | 537 | 0.9% |
| Nigeria | 429 | 0.7% |
| Northern Europe | 49 | 0.1% |
| Panama | 47 | 0.1% |
| Scotland | 22 | 0.0% |
| Senegal | 9 | 0.0% |
| Sierra Leone | 17 | 0.0% |
| Somalia | 45 | 0.1% |
| South America | 1,438 | 2.4% |
| South Central Asia | 74 | 0.1% |
| South Eastern Asia | 21 | 0.0% |
| Southern Europe | 2 | 0.0% |
| St. Vincent and the Grenadines | 48 | 0.1% |
| Trinidad and Tobago | 62 | 0.1% |
| Venezuela | 17 | 0.0% |
| Vietnam | 21 | 0.0% |
| Western Africa | 1,065 | 1.8% |
| Western Europe | 3 | 0.0% |
| Zaire | 537 | 0.9% | View All 46 Rows |
Sex and Age in Stonecrest
Sex and Age in Stonecrest
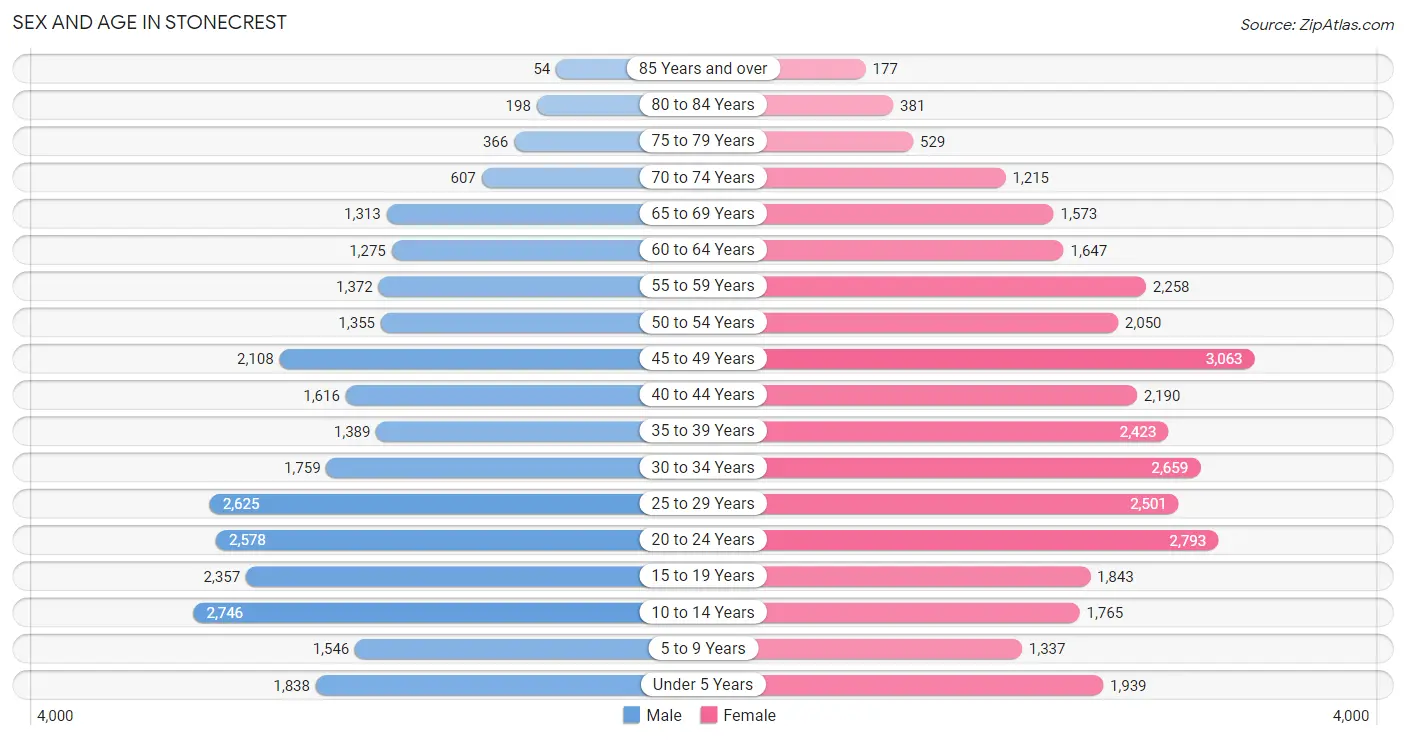
The most populous age groups in Stonecrest are 10 to 14 Years (2,746 | 10.1%) for men and 45 to 49 Years (3,063 | 9.5%) for women.
| Age Bracket | Male | Female |
| Under 5 Years | 1,838 (6.8%) | 1,939 (6.0%) |
| 5 to 9 Years | 1,546 (5.7%) | 1,337 (4.1%) |
| 10 to 14 Years | 2,746 (10.1%) | 1,765 (5.5%) |
| 15 to 19 Years | 2,357 (8.7%) | 1,843 (5.7%) |
| 20 to 24 Years | 2,578 (9.5%) | 2,793 (8.6%) |
| 25 to 29 Years | 2,625 (9.7%) | 2,501 (7.7%) |
| 30 to 34 Years | 1,759 (6.5%) | 2,659 (8.2%) |
| 35 to 39 Years | 1,389 (5.1%) | 2,423 (7.5%) |
| 40 to 44 Years | 1,616 (6.0%) | 2,190 (6.8%) |
| 45 to 49 Years | 2,108 (7.8%) | 3,063 (9.5%) |
| 50 to 54 Years | 1,355 (5.0%) | 2,050 (6.3%) |
| 55 to 59 Years | 1,372 (5.1%) | 2,258 (7.0%) |
| 60 to 64 Years | 1,275 (4.7%) | 1,647 (5.1%) |
| 65 to 69 Years | 1,313 (4.8%) | 1,573 (4.9%) |
| 70 to 74 Years | 607 (2.2%) | 1,215 (3.8%) |
| 75 to 79 Years | 366 (1.3%) | 529 (1.6%) |
| 80 to 84 Years | 198 (0.7%) | 381 (1.2%) |
| 85 Years and over | 54 (0.2%) | 177 (0.5%) |
| Total | 27,102 (100.0%) | 32,343 (100.0%) |
Families and Households in Stonecrest
Median Family Size in Stonecrest
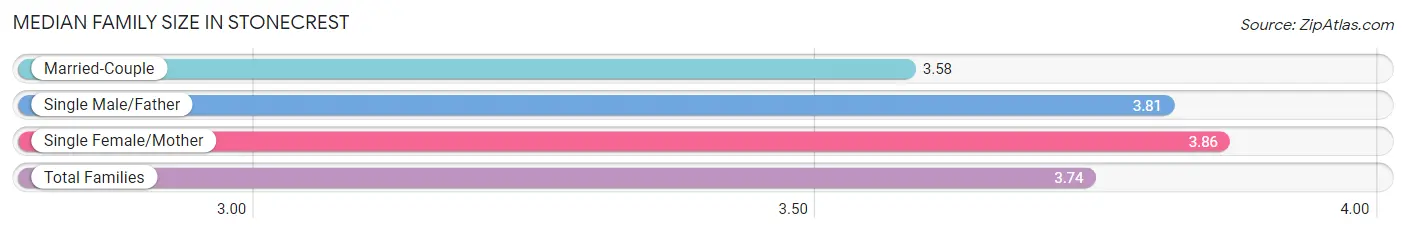
The median family size in Stonecrest is 3.74 persons per family, with single female/mother families (5,943 | 47.2%) accounting for the largest median family size of 3.86 persons per family. On the other hand, married-couple families (5,121 | 40.7%) represent the smallest median family size with 3.58 persons per family.
| Family Type | # Families | Family Size |
| Married-Couple | 5,121 (40.7%) | 3.58 |
| Single Male/Father | 1,525 (12.1%) | 3.81 |
| Single Female/Mother | 5,943 (47.2%) | 3.86 |
| Total Families | 12,589 (100.0%) | 3.74 |
Median Household Size in Stonecrest
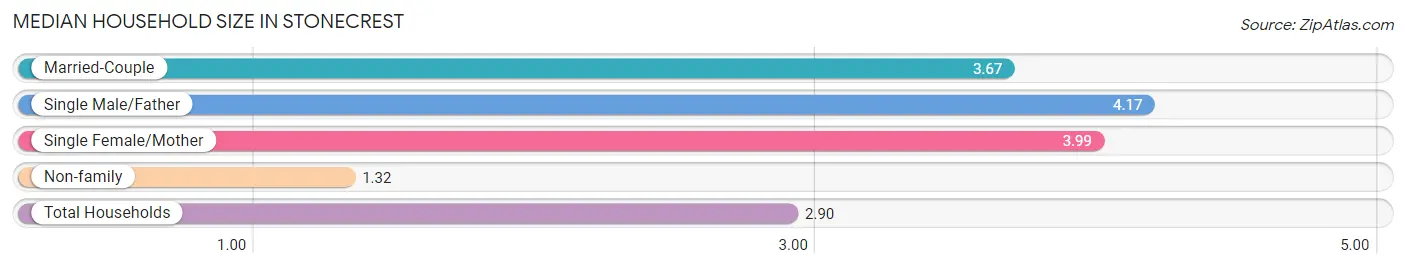
The median household size in Stonecrest is 2.90 persons per household, with single male/father households (1,525 | 7.5%) accounting for the largest median household size of 4.17 persons per household. non-family households (7,850 | 38.4%) represent the smallest median household size with 1.32 persons per household.
| Household Type | # Households | Household Size |
| Married-Couple | 5,121 (25.1%) | 3.67 |
| Single Male/Father | 1,525 (7.5%) | 4.17 |
| Single Female/Mother | 5,943 (29.1%) | 3.99 |
| Non-family | 7,850 (38.4%) | 1.32 |
| Total Households | 20,439 (100.0%) | 2.90 |
Household Size by Marriage Status in Stonecrest
Out of a total of 20,439 households in Stonecrest, 12,589 (61.6%) are family households, while 7,850 (38.4%) are nonfamily households. The most numerous type of family households are 2-person households, comprising 4,584, and the most common type of nonfamily households are 1-person households, comprising 6,470.
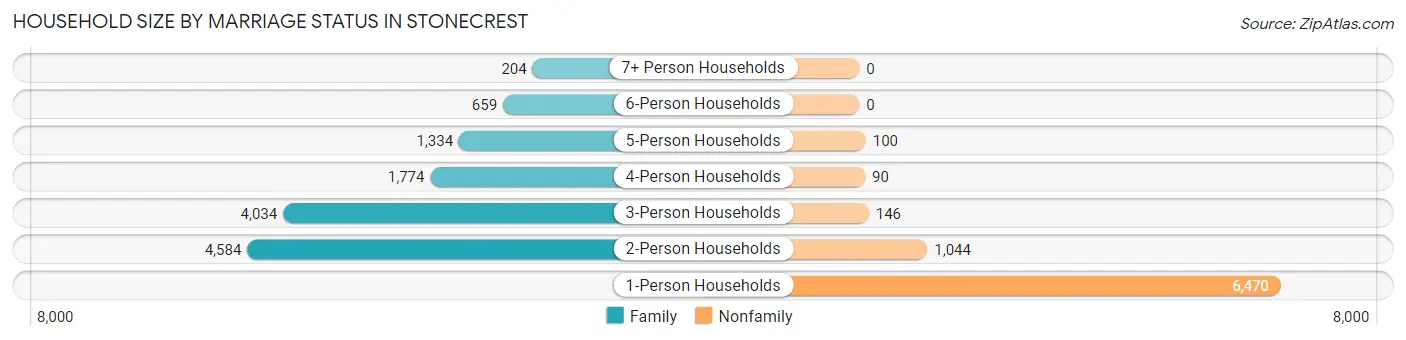
| Household Size | Family Households | Nonfamily Households |
| 1-Person Households | - | 6,470 (31.7%) |
| 2-Person Households | 4,584 (22.4%) | 1,044 (5.1%) |
| 3-Person Households | 4,034 (19.7%) | 146 (0.7%) |
| 4-Person Households | 1,774 (8.7%) | 90 (0.4%) |
| 5-Person Households | 1,334 (6.5%) | 100 (0.5%) |
| 6-Person Households | 659 (3.2%) | 0 (0.0%) |
| 7+ Person Households | 204 (1.0%) | 0 (0.0%) |
| Total | 12,589 (61.6%) | 7,850 (38.4%) |
Female Fertility in Stonecrest
Fertility by Age in Stonecrest
Average fertility rate in Stonecrest is 40.0 births per 1,000 women. Women in the age bracket of 20 to 34 years have the highest fertility rate with 53.0 births per 1,000 women. Women in the age bracket of 20 to 34 years acount for 57.7% of all women with births.
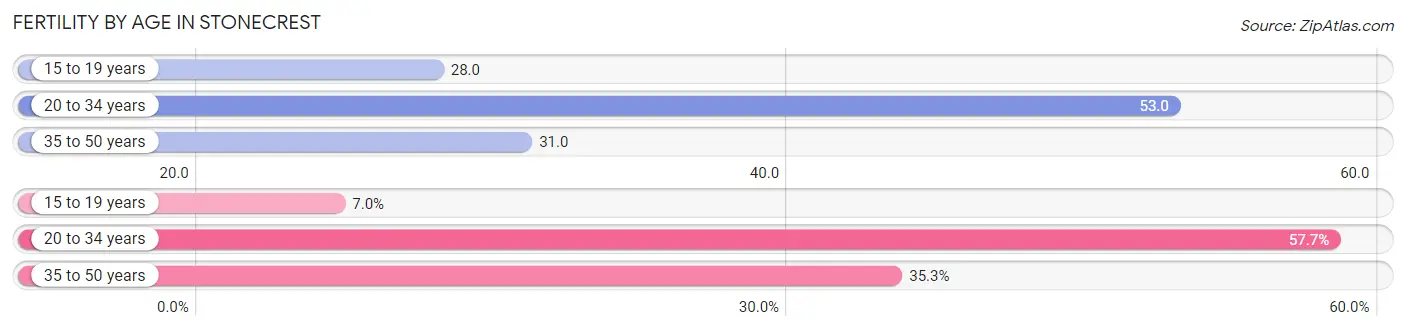
| Age Bracket | Women with Births | Births / 1,000 Women |
| 15 to 19 years | 51 (7.0%) | 28.0 |
| 20 to 34 years | 421 (57.7%) | 53.0 |
| 35 to 50 years | 258 (35.3%) | 31.0 |
| Total | 730 (100.0%) | 40.0 |
Fertility by Age by Marriage Status in Stonecrest
30.5% of women with births (730) in Stonecrest are married. The highest percentage of unmarried women with births falls into 15 to 19 years age bracket with 100.0% of them unmarried at the time of birth, while the lowest percentage of unmarried women with births belong to 35 to 50 years age bracket with 58.1% of them unmarried.
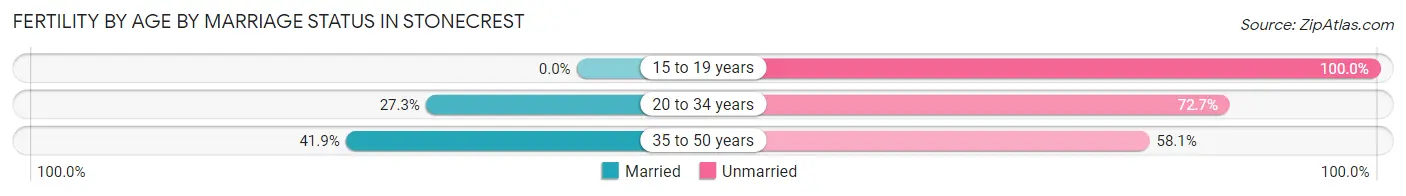
| Age Bracket | Married | Unmarried |
| 15 to 19 years | 0 (0.0%) | 51 (100.0%) |
| 20 to 34 years | 115 (27.3%) | 306 (72.7%) |
| 35 to 50 years | 108 (41.9%) | 150 (58.1%) |
| Total | 223 (30.5%) | 507 (69.5%) |
Fertility by Education in Stonecrest
Average fertility rate in Stonecrest is 40.0 births per 1,000 women. Women with the education attainment of high school diploma have the highest fertility rate of 63.0 births per 1,000 women, while women with the education attainment of bachelor's degree have the lowest fertility at 9.0 births per 1,000 women. Women with the education attainment of high school diploma represent 36.3% of all women with births.
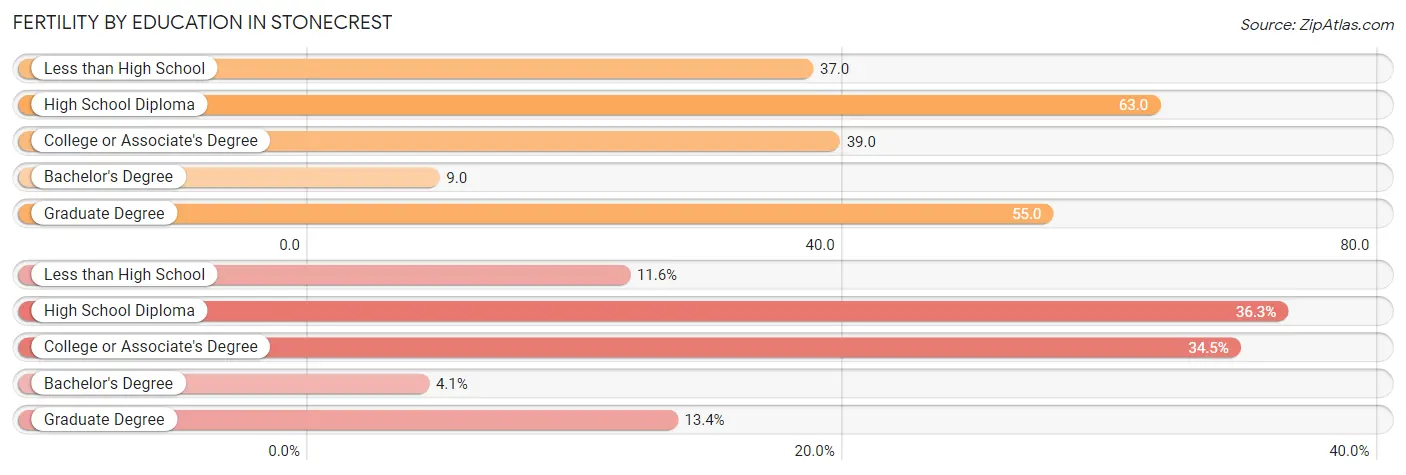
| Educational Attainment | Women with Births | Births / 1,000 Women |
| Less than High School | 85 (11.6%) | 37.0 |
| High School Diploma | 265 (36.3%) | 63.0 |
| College or Associate's Degree | 252 (34.5%) | 39.0 |
| Bachelor's Degree | 30 (4.1%) | 9.0 |
| Graduate Degree | 98 (13.4%) | 55.0 |
| Total | 730 (100.0%) | 40.0 |
Fertility by Education by Marriage Status in Stonecrest
69.5% of women with births in Stonecrest are unmarried. Women with the educational attainment of bachelor's degree are most likely to be married with 63.3% of them married at childbirth, while women with the educational attainment of high school diploma are least likely to be married with 86.0% of them unmarried at childbirth.
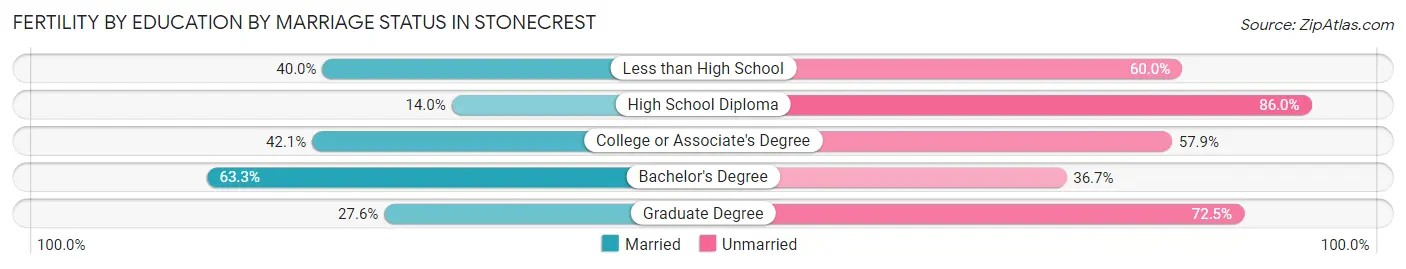
| Educational Attainment | Married | Unmarried |
| Less than High School | 34 (40.0%) | 51 (60.0%) |
| High School Diploma | 37 (14.0%) | 228 (86.0%) |
| College or Associate's Degree | 106 (42.1%) | 146 (57.9%) |
| Bachelor's Degree | 19 (63.3%) | 11 (36.7%) |
| Graduate Degree | 27 (27.6%) | 71 (72.5%) |
| Total | 223 (30.5%) | 507 (69.5%) |
Employment Characteristics in Stonecrest
Employment by Class of Employer in Stonecrest
Among the 28,910 employed individuals in Stonecrest, private company employees (20,450 | 70.7%), local government employees (2,075 | 7.2%), and not-for-profit organizations (1,655 | 5.7%) make up the most common classes of employment.
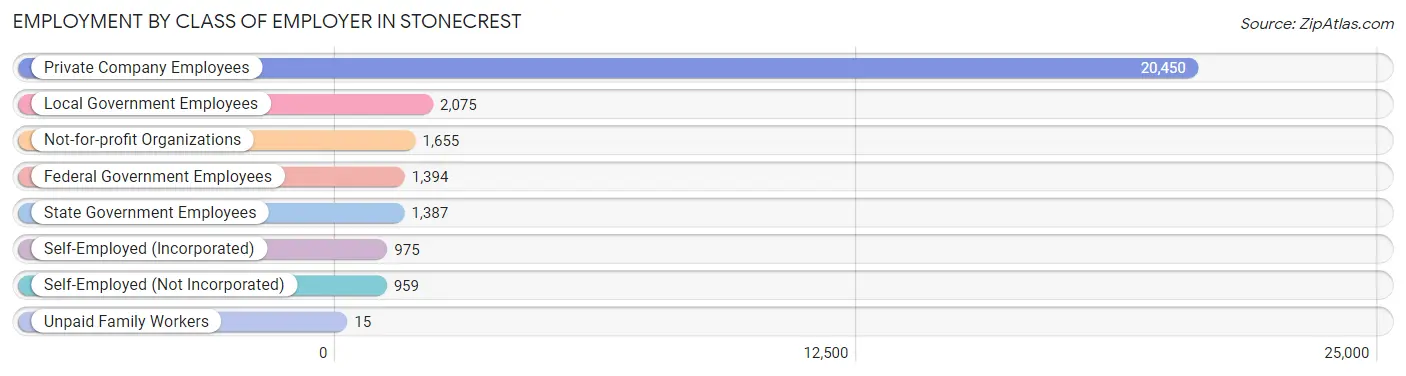
| Employer Class | # Employees | % Employees |
| Private Company Employees | 20,450 | 70.7% |
| Self-Employed (Incorporated) | 975 | 3.4% |
| Self-Employed (Not Incorporated) | 959 | 3.3% |
| Not-for-profit Organizations | 1,655 | 5.7% |
| Local Government Employees | 2,075 | 7.2% |
| State Government Employees | 1,387 | 4.8% |
| Federal Government Employees | 1,394 | 4.8% |
| Unpaid Family Workers | 15 | 0.1% |
| Total | 28,910 | 100.0% |
Employment Status by Age in Stonecrest
According to the labor force statistics for Stonecrest, out of the total population over 16 years of age (47,358), 68.5% or 32,440 individuals are in the labor force, with 8.6% or 2,790 of them unemployed. The age group with the highest labor force participation rate is 25 to 29 years, with 91.5% or 4,690 individuals in the labor force. Within the labor force, the 20 to 24 years age range has the highest percentage of unemployed individuals, with 21.4% or 884 of them being unemployed.
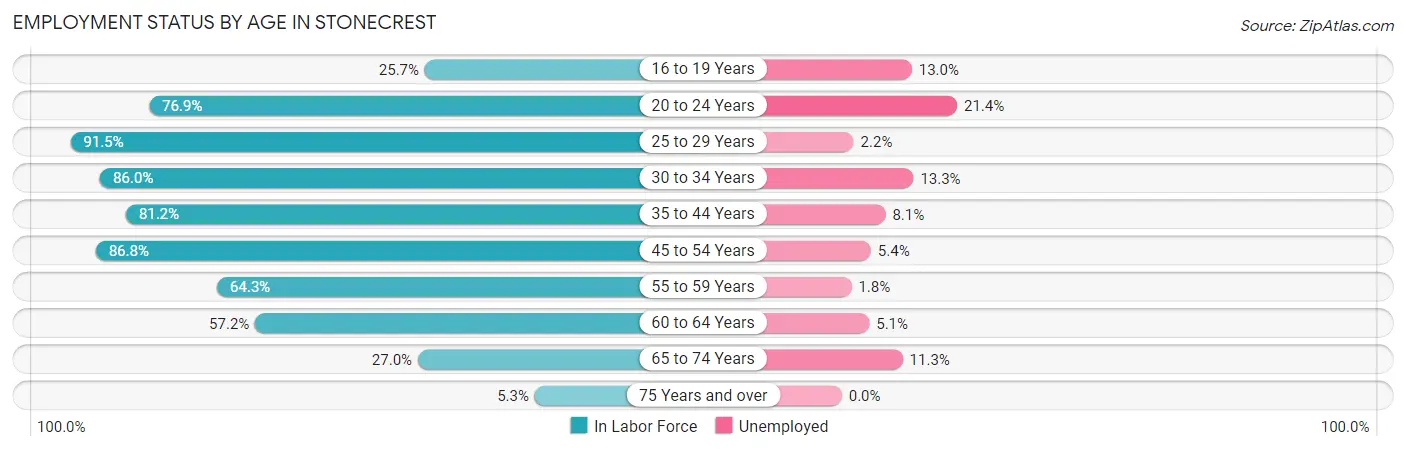
| Age Bracket | In Labor Force | Unemployed |
| 16 to 19 Years | 844 (25.7%) | 110 (13.0%) |
| 20 to 24 Years | 4,130 (76.9%) | 884 (21.4%) |
| 25 to 29 Years | 4,690 (91.5%) | 103 (2.2%) |
| 30 to 34 Years | 3,799 (86.0%) | 505 (13.3%) |
| 35 to 44 Years | 6,186 (81.2%) | 501 (8.1%) |
| 45 to 54 Years | 7,444 (86.8%) | 402 (5.4%) |
| 55 to 59 Years | 2,334 (64.3%) | 42 (1.8%) |
| 60 to 64 Years | 1,671 (57.2%) | 85 (5.1%) |
| 65 to 74 Years | 1,271 (27.0%) | 144 (11.3%) |
| 75 Years and over | 90 (5.3%) | 0 (0.0%) |
| Total | 32,440 (68.5%) | 2,790 (8.6%) |
Employment Status by Educational Attainment in Stonecrest
According to labor force statistics for Stonecrest, 80.9% of individuals (26,123) out of the total population between 25 and 64 years of age (32,290) are in the labor force, with 6.3% or 1,646 of them being unemployed. The group with the highest labor force participation rate are those with the educational attainment of bachelor's degree or higher, with 93.4% or 8,578 individuals in the labor force. Within the labor force, individuals with less than high school education have the highest percentage of unemployment, with 14.9% or 177 of them being unemployed.
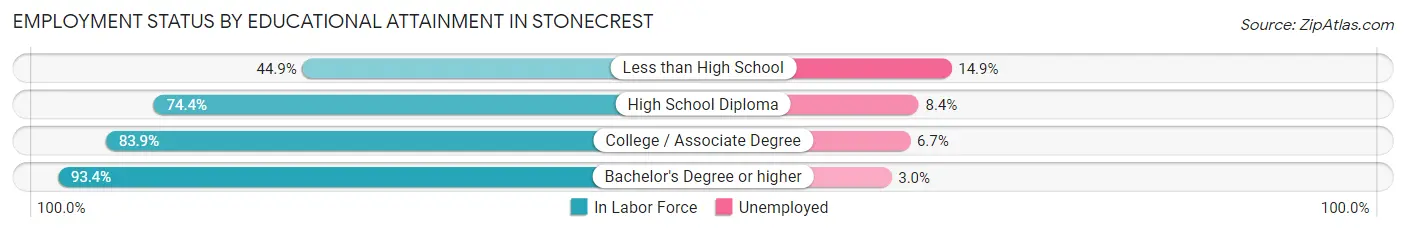
| Educational Attainment | In Labor Force | Unemployed |
| Less than High School | 1,187 (44.9%) | 394 (14.9%) |
| High School Diploma | 6,406 (74.4%) | 723 (8.4%) |
| College / Associate Degree | 9,944 (83.9%) | 794 (6.7%) |
| Bachelor's Degree or higher | 8,578 (93.4%) | 276 (3.0%) |
| Total | 26,123 (80.9%) | 2,034 (6.3%) |
Employment Occupations by Sex in Stonecrest
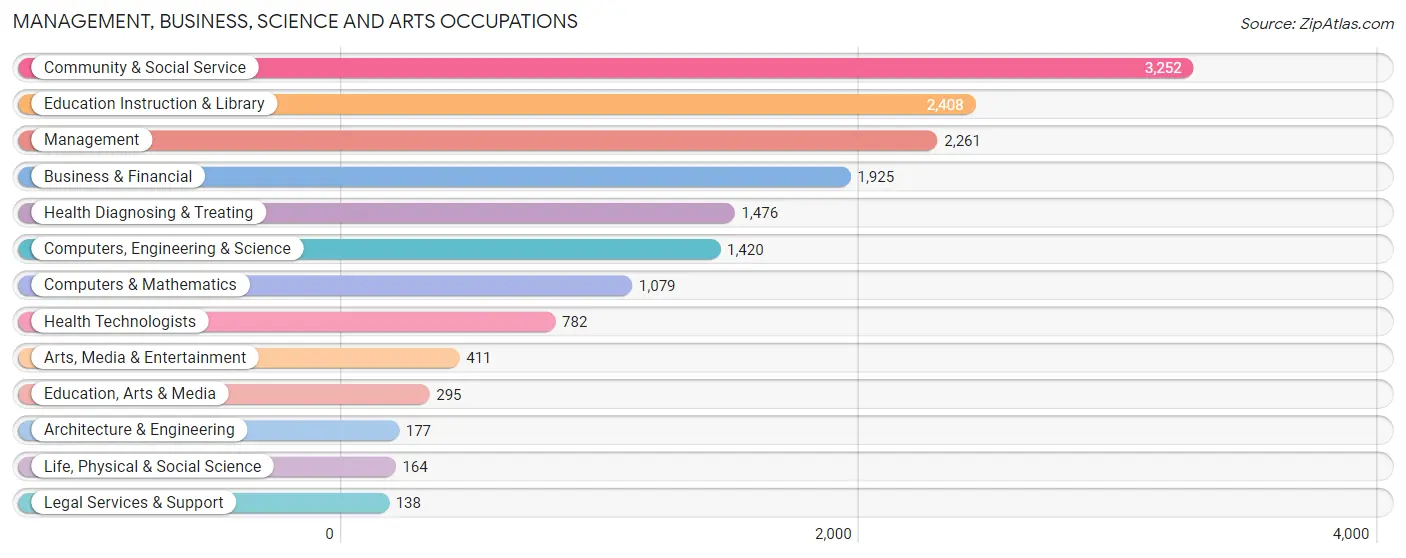
Management, Business, Science and Arts Occupations
The most common Management, Business, Science and Arts occupations in Stonecrest are Community & Social Service (3,252 | 11.0%), Education Instruction & Library (2,408 | 8.1%), Management (2,261 | 7.6%), Business & Financial (1,925 | 6.5%), and Health Diagnosing & Treating (1,476 | 5.0%).
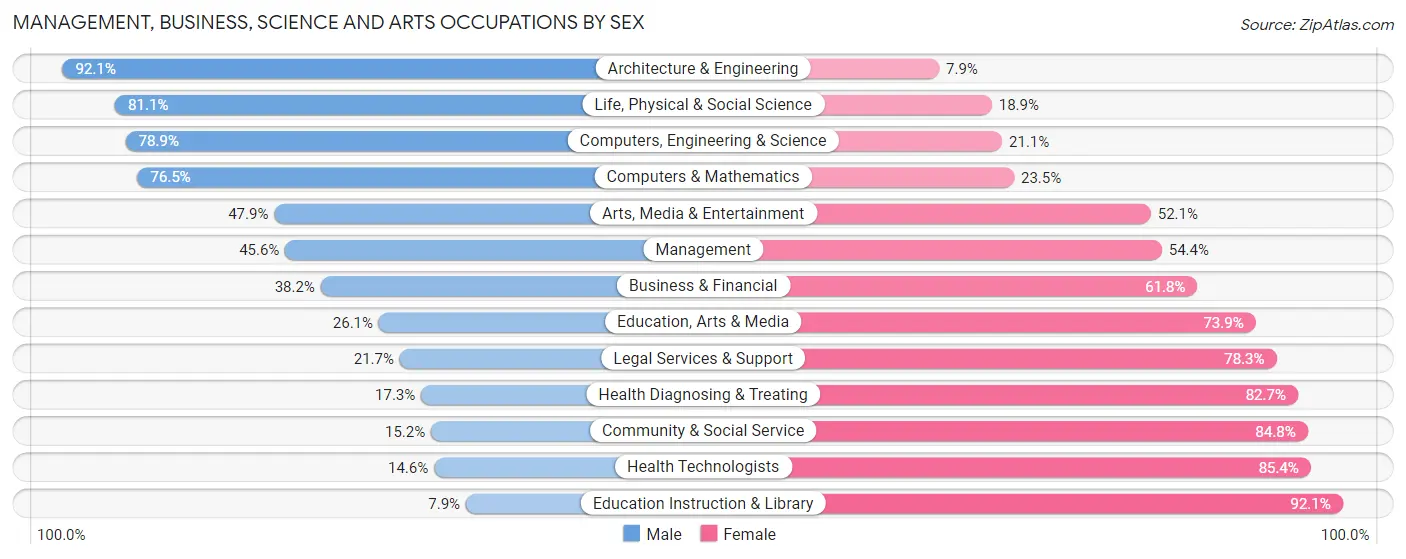
Management, Business, Science and Arts Occupations by Sex
Within the Management, Business, Science and Arts occupations in Stonecrest, the most male-oriented occupations are Architecture & Engineering (92.1%), Life, Physical & Social Science (81.1%), and Computers, Engineering & Science (78.9%), while the most female-oriented occupations are Education Instruction & Library (92.1%), Health Technologists (85.4%), and Community & Social Service (84.8%).
| Occupation | Male | Female |
| Management | 1,032 (45.6%) | 1,229 (54.4%) |
| Business & Financial | 736 (38.2%) | 1,189 (61.8%) |
| Computers, Engineering & Science | 1,121 (78.9%) | 299 (21.1%) |
| Computers & Mathematics | 825 (76.5%) | 254 (23.5%) |
| Architecture & Engineering | 163 (92.1%) | 14 (7.9%) |
| Life, Physical & Social Science | 133 (81.1%) | 31 (18.9%) |
| Community & Social Service | 495 (15.2%) | 2,757 (84.8%) |
| Education, Arts & Media | 77 (26.1%) | 218 (73.9%) |
| Legal Services & Support | 30 (21.7%) | 108 (78.3%) |
| Education Instruction & Library | 191 (7.9%) | 2,217 (92.1%) |
| Arts, Media & Entertainment | 197 (47.9%) | 214 (52.1%) |
| Health Diagnosing & Treating | 255 (17.3%) | 1,221 (82.7%) |
| Health Technologists | 114 (14.6%) | 668 (85.4%) |
| Total (Category) | 3,639 (35.2%) | 6,695 (64.8%) |
| Total (Overall) | 12,634 (42.6%) | 17,021 (57.4%) |
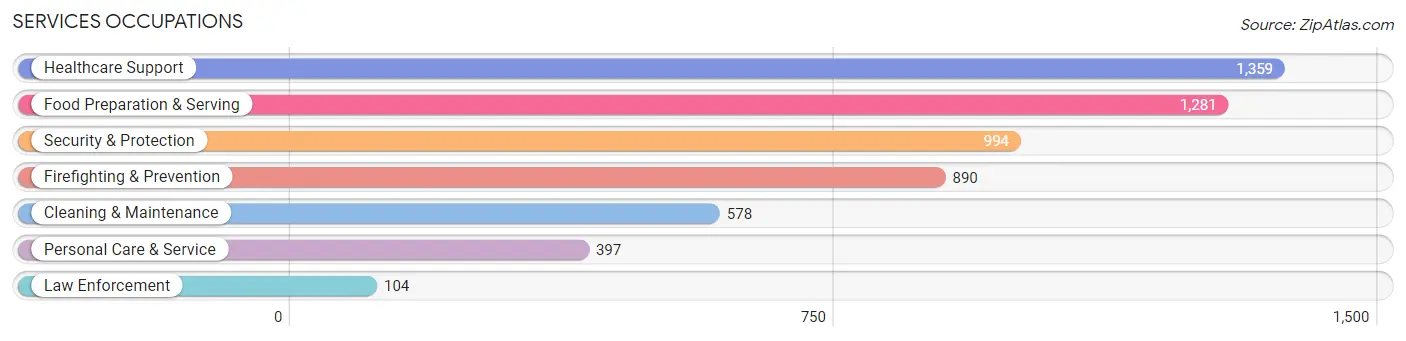
Services Occupations
The most common Services occupations in Stonecrest are Healthcare Support (1,359 | 4.6%), Food Preparation & Serving (1,281 | 4.3%), Security & Protection (994 | 3.4%), Firefighting & Prevention (890 | 3.0%), and Cleaning & Maintenance (578 | 1.9%).
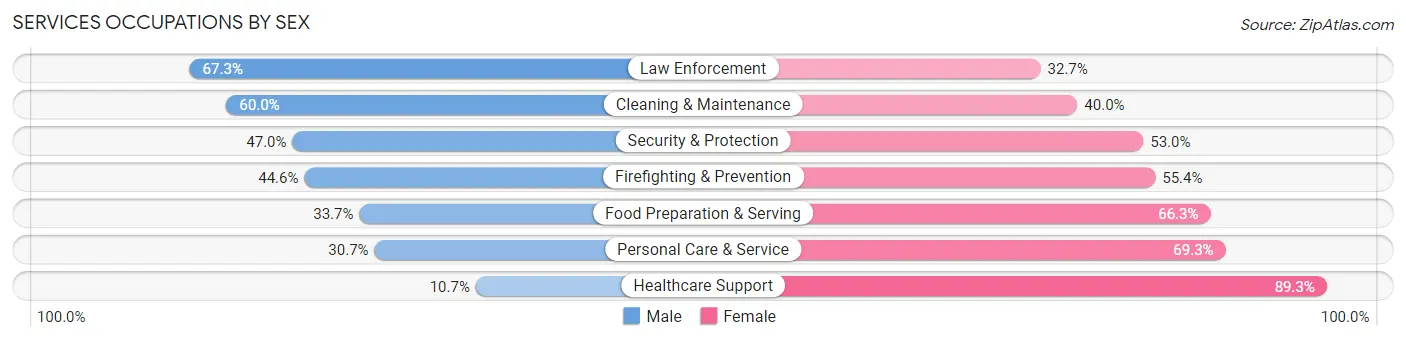
Services Occupations by Sex
Within the Services occupations in Stonecrest, the most male-oriented occupations are Law Enforcement (67.3%), Cleaning & Maintenance (60.0%), and Security & Protection (47.0%), while the most female-oriented occupations are Healthcare Support (89.3%), Personal Care & Service (69.3%), and Food Preparation & Serving (66.3%).
| Occupation | Male | Female |
| Healthcare Support | 145 (10.7%) | 1,214 (89.3%) |
| Security & Protection | 467 (47.0%) | 527 (53.0%) |
| Firefighting & Prevention | 397 (44.6%) | 493 (55.4%) |
| Law Enforcement | 70 (67.3%) | 34 (32.7%) |
| Food Preparation & Serving | 432 (33.7%) | 849 (66.3%) |
| Cleaning & Maintenance | 347 (60.0%) | 231 (40.0%) |
| Personal Care & Service | 122 (30.7%) | 275 (69.3%) |
| Total (Category) | 1,513 (32.8%) | 3,096 (67.2%) |
| Total (Overall) | 12,634 (42.6%) | 17,021 (57.4%) |
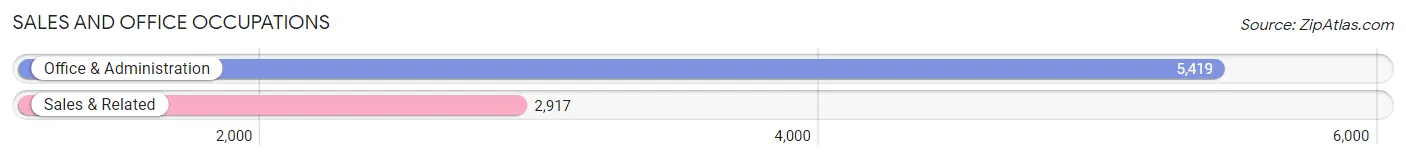
Sales and Office Occupations
The most common Sales and Office occupations in Stonecrest are Office & Administration (5,419 | 18.3%), and Sales & Related (2,917 | 9.8%).
Sales and Office Occupations by Sex
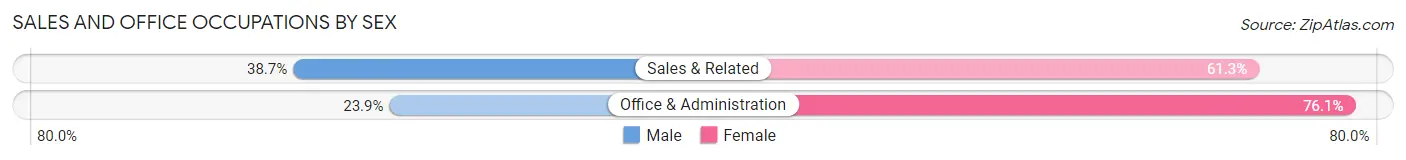
| Occupation | Male | Female |
| Sales & Related | 1,129 (38.7%) | 1,788 (61.3%) |
| Office & Administration | 1,295 (23.9%) | 4,124 (76.1%) |
| Total (Category) | 2,424 (29.1%) | 5,912 (70.9%) |
| Total (Overall) | 12,634 (42.6%) | 17,021 (57.4%) |
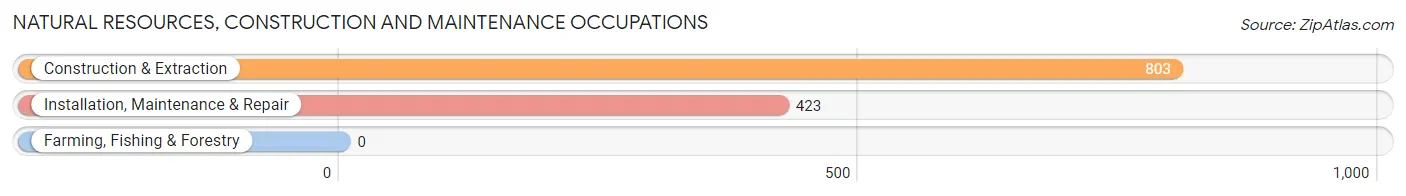
Natural Resources, Construction and Maintenance Occupations
The most common Natural Resources, Construction and Maintenance occupations in Stonecrest are Construction & Extraction (803 | 2.7%), and Installation, Maintenance & Repair (423 | 1.4%).
Natural Resources, Construction and Maintenance Occupations by Sex
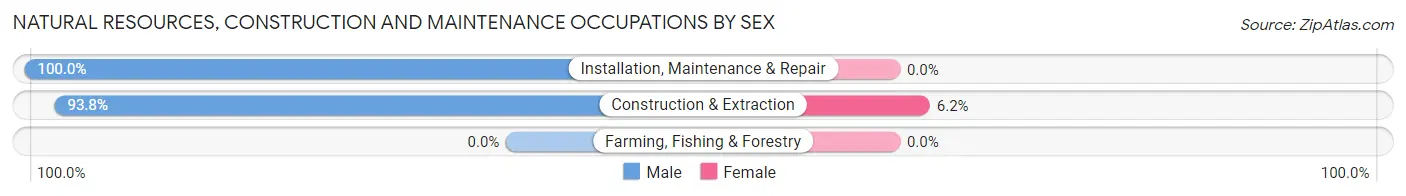
| Occupation | Male | Female |
| Farming, Fishing & Forestry | 0 (0.0%) | 0 (0.0%) |
| Construction & Extraction | 753 (93.8%) | 50 (6.2%) |
| Installation, Maintenance & Repair | 423 (100.0%) | 0 (0.0%) |
| Total (Category) | 1,176 (95.9%) | 50 (4.1%) |
| Total (Overall) | 12,634 (42.6%) | 17,021 (57.4%) |
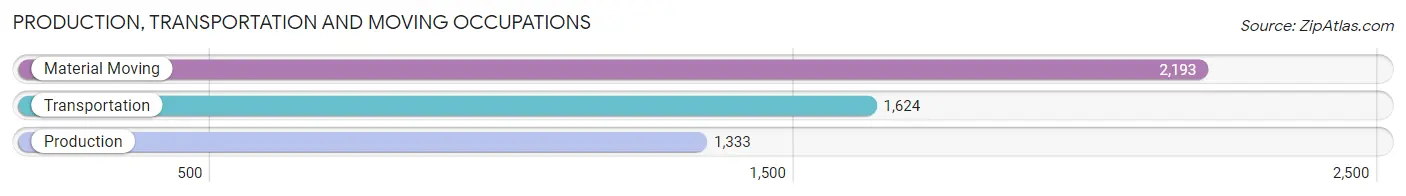
Production, Transportation and Moving Occupations
The most common Production, Transportation and Moving occupations in Stonecrest are Material Moving (2,193 | 7.4%), Transportation (1,624 | 5.5%), and Production (1,333 | 4.5%).
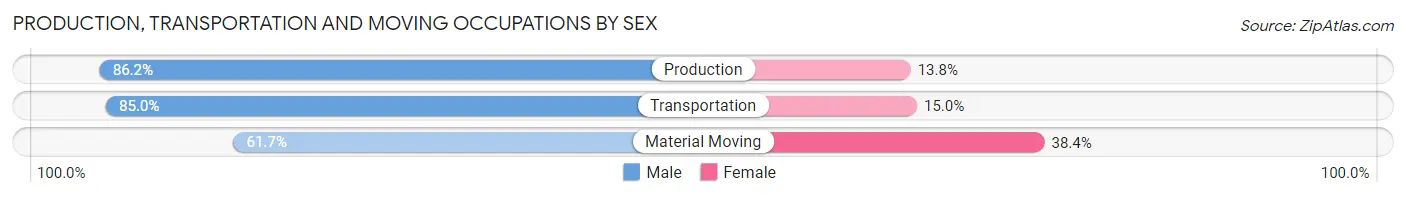
Production, Transportation and Moving Occupations by Sex
| Occupation | Male | Female |
| Production | 1,149 (86.2%) | 184 (13.8%) |
| Transportation | 1,381 (85.0%) | 243 (15.0%) |
| Material Moving | 1,352 (61.7%) | 841 (38.4%) |
| Total (Category) | 3,882 (75.4%) | 1,268 (24.6%) |
| Total (Overall) | 12,634 (42.6%) | 17,021 (57.4%) |
Employment Industries by Sex in Stonecrest
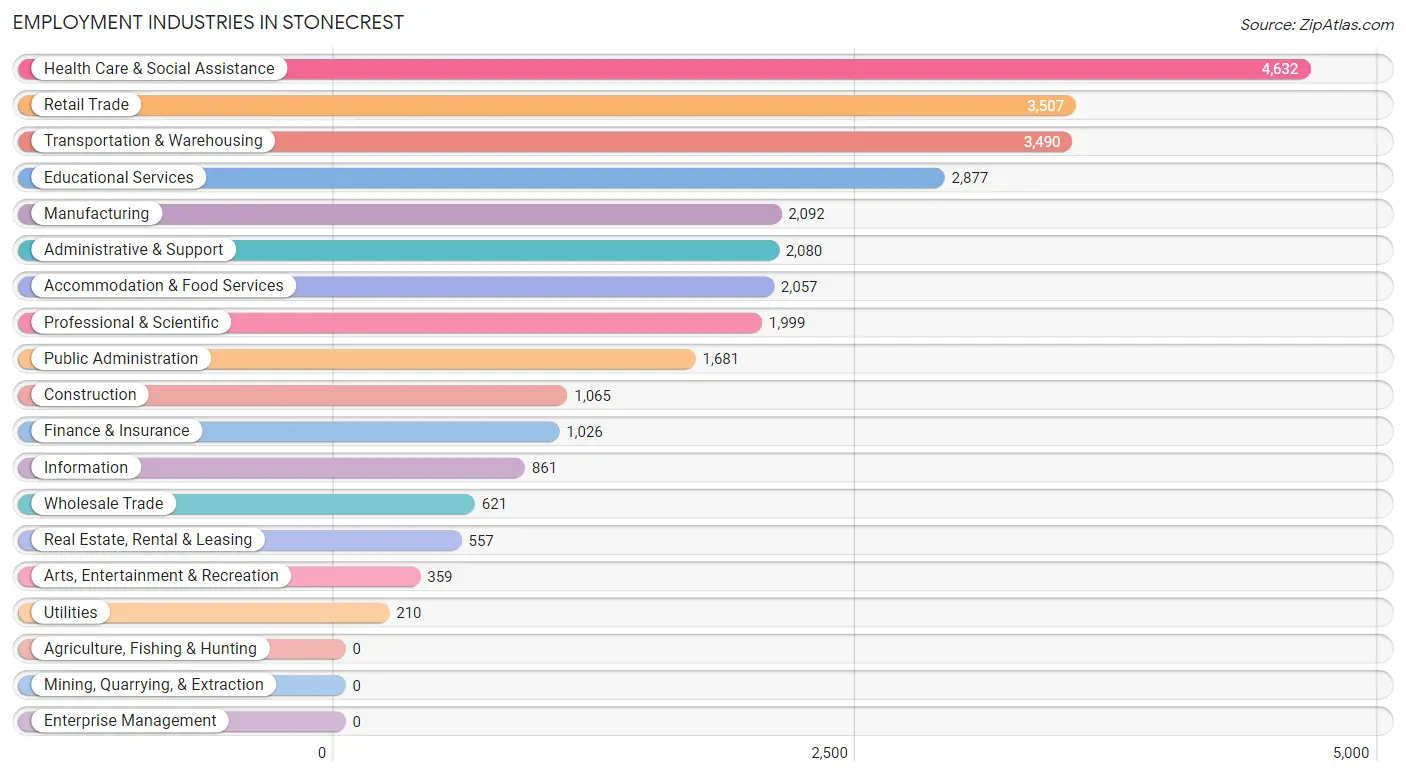
Employment Industries in Stonecrest
The major employment industries in Stonecrest include Health Care & Social Assistance (4,632 | 15.6%), Retail Trade (3,507 | 11.8%), Transportation & Warehousing (3,490 | 11.8%), Educational Services (2,877 | 9.7%), and Manufacturing (2,092 | 7.0%).
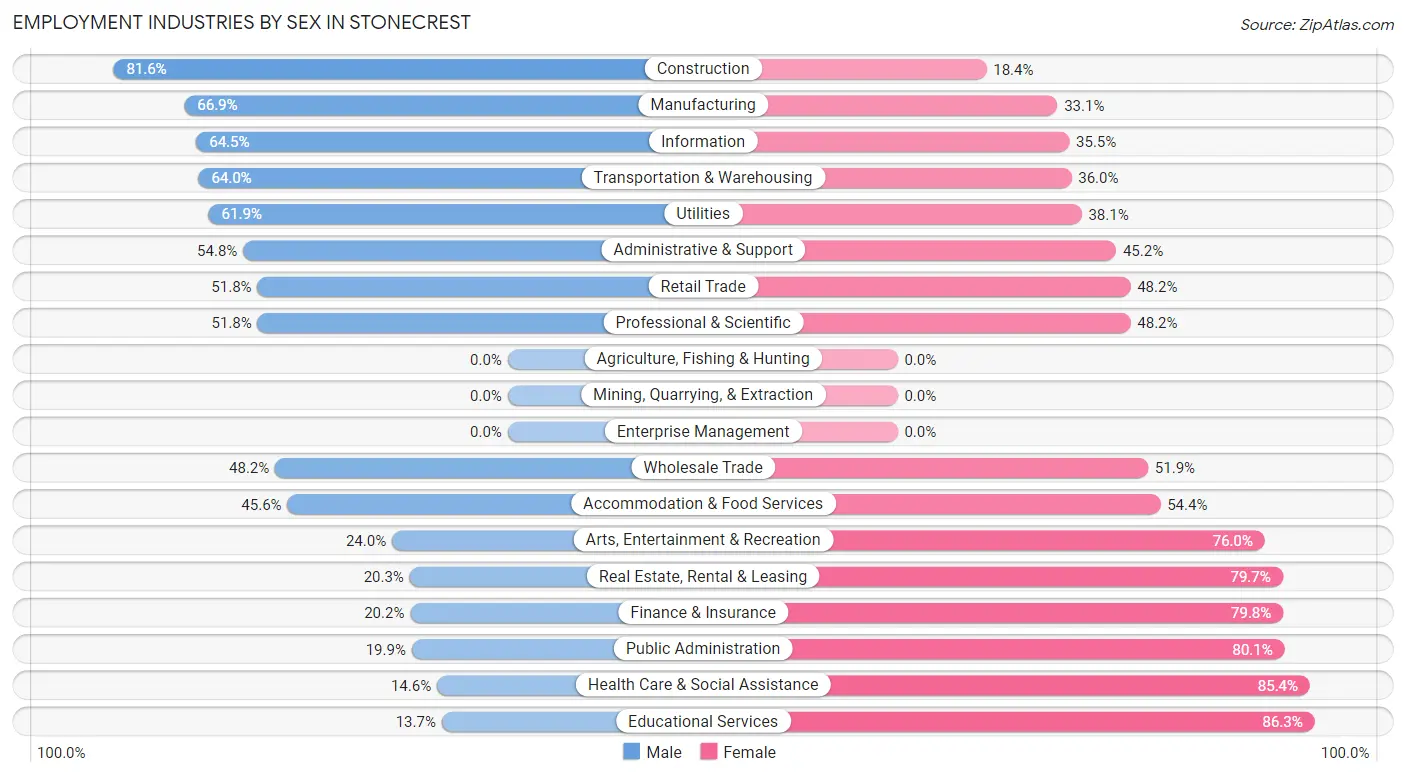
Employment Industries by Sex in Stonecrest
The Stonecrest industries that see more men than women are Construction (81.6%), Manufacturing (66.9%), and Information (64.5%), whereas the industries that tend to have a higher number of women are Educational Services (86.3%), Health Care & Social Assistance (85.4%), and Public Administration (80.1%).
| Industry | Male | Female |
| Agriculture, Fishing & Hunting | 0 (0.0%) | 0 (0.0%) |
| Mining, Quarrying, & Extraction | 0 (0.0%) | 0 (0.0%) |
| Construction | 869 (81.6%) | 196 (18.4%) |
| Manufacturing | 1,400 (66.9%) | 692 (33.1%) |
| Wholesale Trade | 299 (48.1%) | 322 (51.8%) |
| Retail Trade | 1,817 (51.8%) | 1,690 (48.2%) |
| Transportation & Warehousing | 2,234 (64.0%) | 1,256 (36.0%) |
| Utilities | 130 (61.9%) | 80 (38.1%) |
| Information | 555 (64.5%) | 306 (35.5%) |
| Finance & Insurance | 207 (20.2%) | 819 (79.8%) |
| Real Estate, Rental & Leasing | 113 (20.3%) | 444 (79.7%) |
| Professional & Scientific | 1,035 (51.8%) | 964 (48.2%) |
| Enterprise Management | 0 (0.0%) | 0 (0.0%) |
| Administrative & Support | 1,139 (54.8%) | 941 (45.2%) |
| Educational Services | 393 (13.7%) | 2,484 (86.3%) |
| Health Care & Social Assistance | 678 (14.6%) | 3,954 (85.4%) |
| Arts, Entertainment & Recreation | 86 (24.0%) | 273 (76.0%) |
| Accommodation & Food Services | 938 (45.6%) | 1,119 (54.4%) |
| Public Administration | 334 (19.9%) | 1,347 (80.1%) |
| Total | 12,634 (42.6%) | 17,021 (57.4%) |
Education in Stonecrest
School Enrollment in Stonecrest
The most common levels of schooling among the 18,225 students in Stonecrest are high school (4,965 | 27.2%), college / undergraduate (4,241 | 23.3%), and middle school (2,958 | 16.2%).
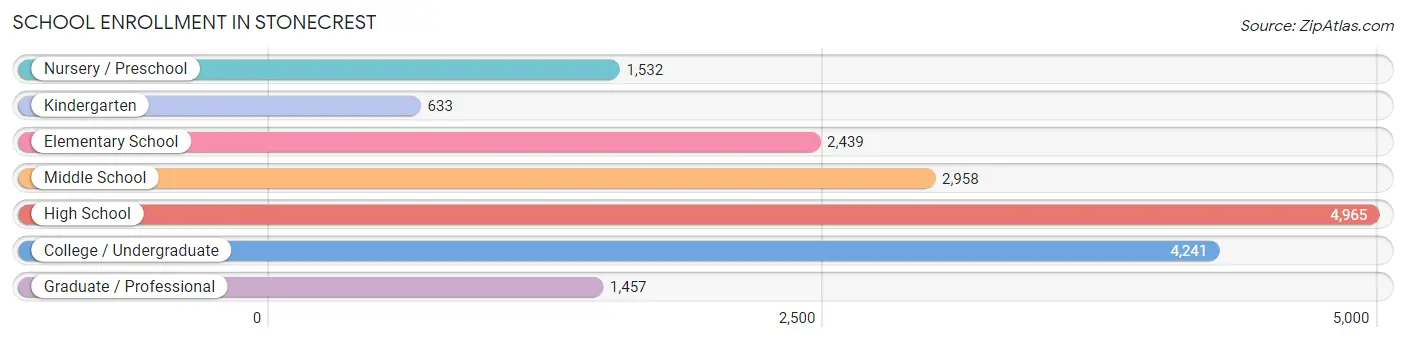
| School Level | # Students | % Students |
| Nursery / Preschool | 1,532 | 8.4% |
| Kindergarten | 633 | 3.5% |
| Elementary School | 2,439 | 13.4% |
| Middle School | 2,958 | 16.2% |
| High School | 4,965 | 27.2% |
| College / Undergraduate | 4,241 | 23.3% |
| Graduate / Professional | 1,457 | 8.0% |
| Total | 18,225 | 100.0% |
School Enrollment by Age by Funding Source in Stonecrest
Out of a total of 18,225 students who are enrolled in schools in Stonecrest, 1,768 (9.7%) attend a private institution, while the remaining 16,457 (90.3%) are enrolled in public schools. The age group of 35 years and over has the highest likelihood of being enrolled in private schools, with 517 (34.2% in the age bracket) enrolled. Conversely, the age group of 18 to 19 year olds has the lowest likelihood of being enrolled in a private school, with 906 (95.9% in the age bracket) attending a public institution.
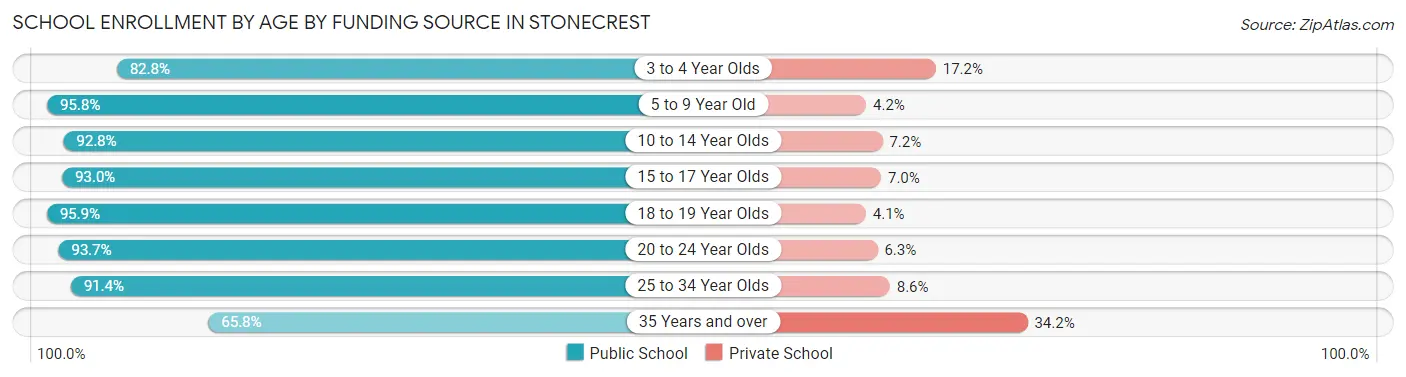
| Age Bracket | Public School | Private School |
| 3 to 4 Year Olds | 1,226 (82.8%) | 254 (17.2%) |
| 5 to 9 Year Old | 2,637 (95.8%) | 115 (4.2%) |
| 10 to 14 Year Olds | 4,185 (92.8%) | 326 (7.2%) |
| 15 to 17 Year Olds | 2,727 (93.0%) | 204 (7.0%) |
| 18 to 19 Year Olds | 906 (95.9%) | 39 (4.1%) |
| 20 to 24 Year Olds | 1,832 (93.7%) | 123 (6.3%) |
| 25 to 34 Year Olds | 1,957 (91.4%) | 184 (8.6%) |
| 35 Years and over | 993 (65.8%) | 517 (34.2%) |
| Total | 16,457 (90.3%) | 1,768 (9.7%) |
Educational Attainment by Field of Study in Stonecrest
Business (3,380 | 29.7%), education (1,376 | 12.1%), science & technology (1,298 | 11.4%), social sciences (1,034 | 9.1%), and arts & humanities (769 | 6.8%) are the most common fields of study among 11,392 individuals in Stonecrest who have obtained a bachelor's degree or higher.
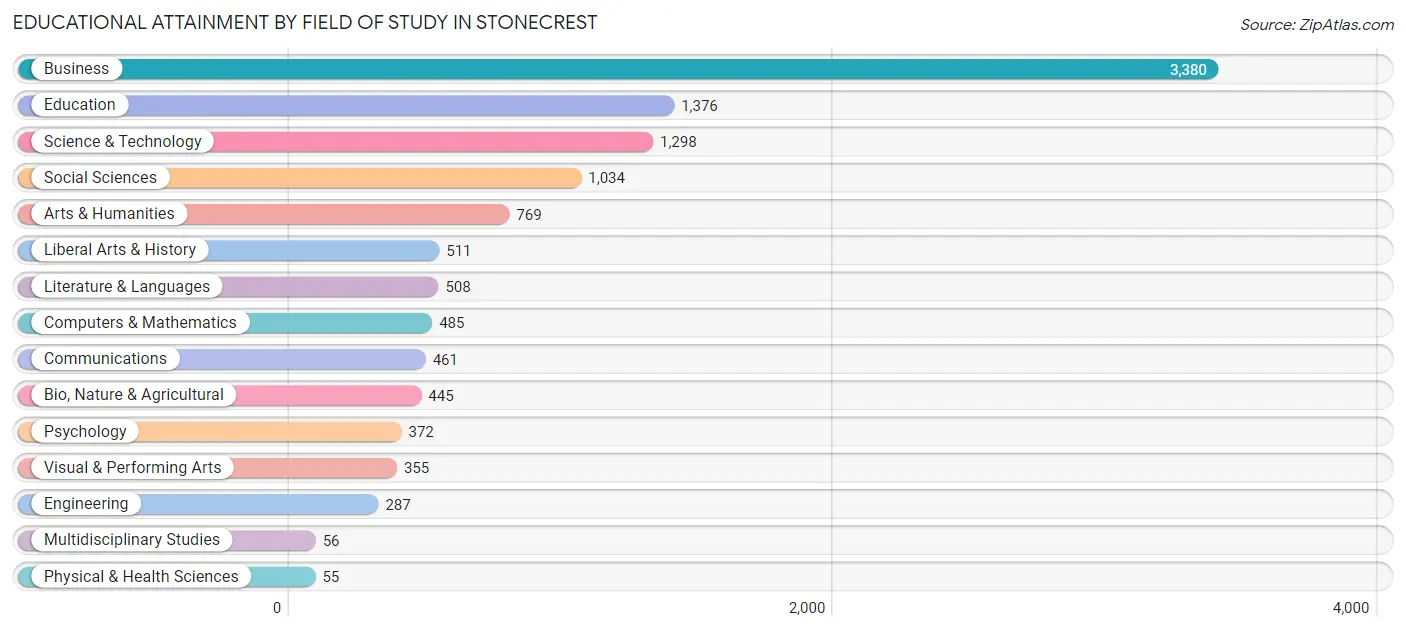
| Field of Study | # Graduates | % Graduates |
| Computers & Mathematics | 485 | 4.3% |
| Bio, Nature & Agricultural | 445 | 3.9% |
| Physical & Health Sciences | 55 | 0.5% |
| Psychology | 372 | 3.3% |
| Social Sciences | 1,034 | 9.1% |
| Engineering | 287 | 2.5% |
| Multidisciplinary Studies | 56 | 0.5% |
| Science & Technology | 1,298 | 11.4% |
| Business | 3,380 | 29.7% |
| Education | 1,376 | 12.1% |
| Literature & Languages | 508 | 4.5% |
| Liberal Arts & History | 511 | 4.5% |
| Visual & Performing Arts | 355 | 3.1% |
| Communications | 461 | 4.1% |
| Arts & Humanities | 769 | 6.8% |
| Total | 11,392 | 100.0% |
Transportation & Commute in Stonecrest
Vehicle Availability by Sex in Stonecrest
The most prevalent vehicle ownership categories in Stonecrest are males with 2 vehicles (5,633, accounting for 45.7%) and females with 2 vehicles (5,492, making up 34.0%).
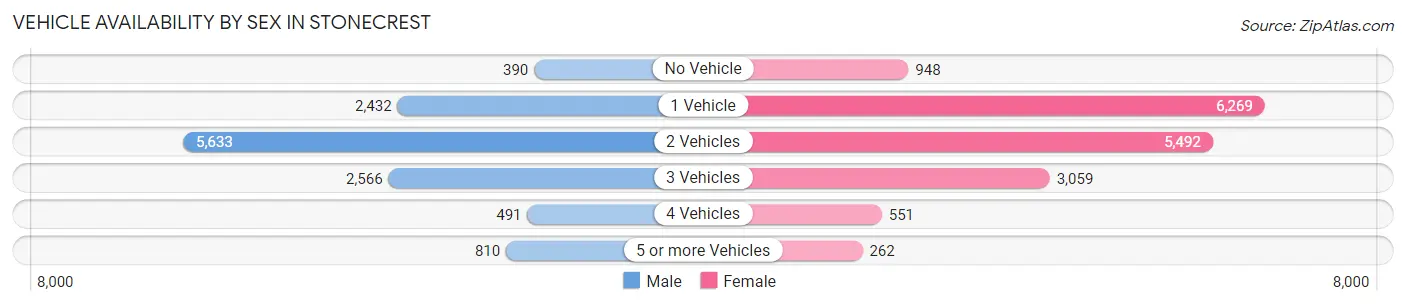
| Vehicles Available | Male | Female |
| No Vehicle | 390 (3.2%) | 948 (5.7%) |
| 1 Vehicle | 2,432 (19.7%) | 6,269 (37.8%) |
| 2 Vehicles | 5,633 (45.7%) | 5,492 (33.1%) |
| 3 Vehicles | 2,566 (20.8%) | 3,059 (18.4%) |
| 4 Vehicles | 491 (4.0%) | 551 (3.3%) |
| 5 or more Vehicles | 810 (6.6%) | 262 (1.6%) |
| Total | 12,322 (100.0%) | 16,581 (100.0%) |
Commute Time in Stonecrest
The most frequently occuring commute durations in Stonecrest are 30 to 34 minutes (5,080 commuters, 20.6%), 45 to 59 minutes (3,671 commuters, 14.9%), and 60 to 89 minutes (2,962 commuters, 12.0%).
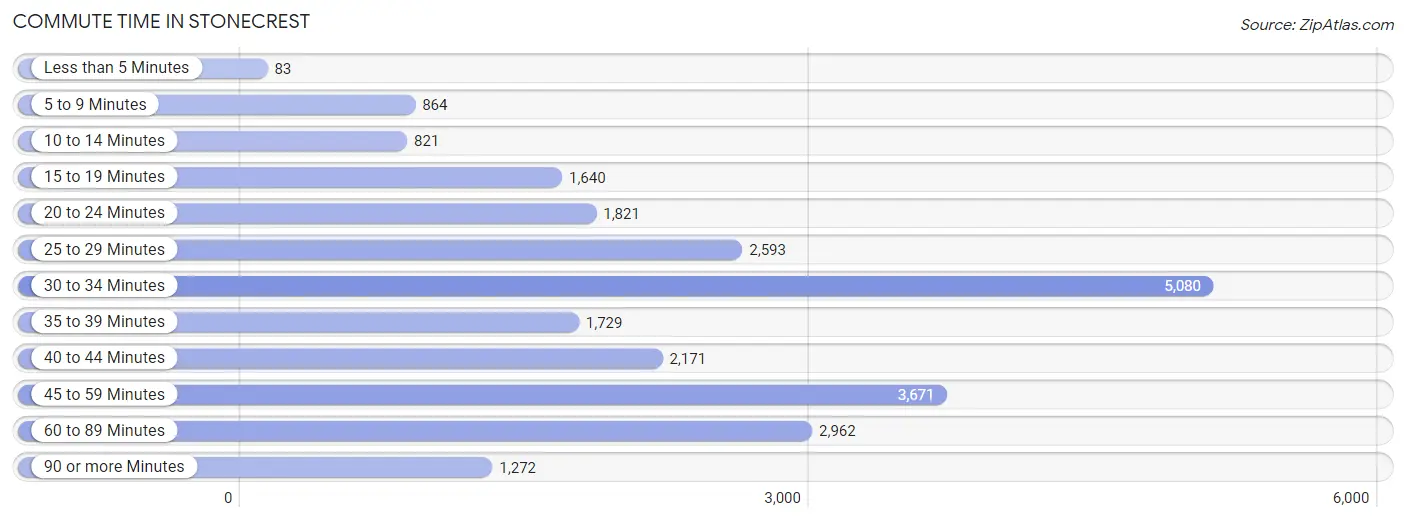
| Commute Time | # Commuters | % Commuters |
| Less than 5 Minutes | 83 | 0.3% |
| 5 to 9 Minutes | 864 | 3.5% |
| 10 to 14 Minutes | 821 | 3.3% |
| 15 to 19 Minutes | 1,640 | 6.6% |
| 20 to 24 Minutes | 1,821 | 7.4% |
| 25 to 29 Minutes | 2,593 | 10.5% |
| 30 to 34 Minutes | 5,080 | 20.6% |
| 35 to 39 Minutes | 1,729 | 7.0% |
| 40 to 44 Minutes | 2,171 | 8.8% |
| 45 to 59 Minutes | 3,671 | 14.9% |
| 60 to 89 Minutes | 2,962 | 12.0% |
| 90 or more Minutes | 1,272 | 5.1% |
Commute Time by Sex in Stonecrest
The most common commute times in Stonecrest are 30 to 34 minutes (1,726 commuters, 16.0%) for males and 30 to 34 minutes (3,354 commuters, 24.1%) for females.
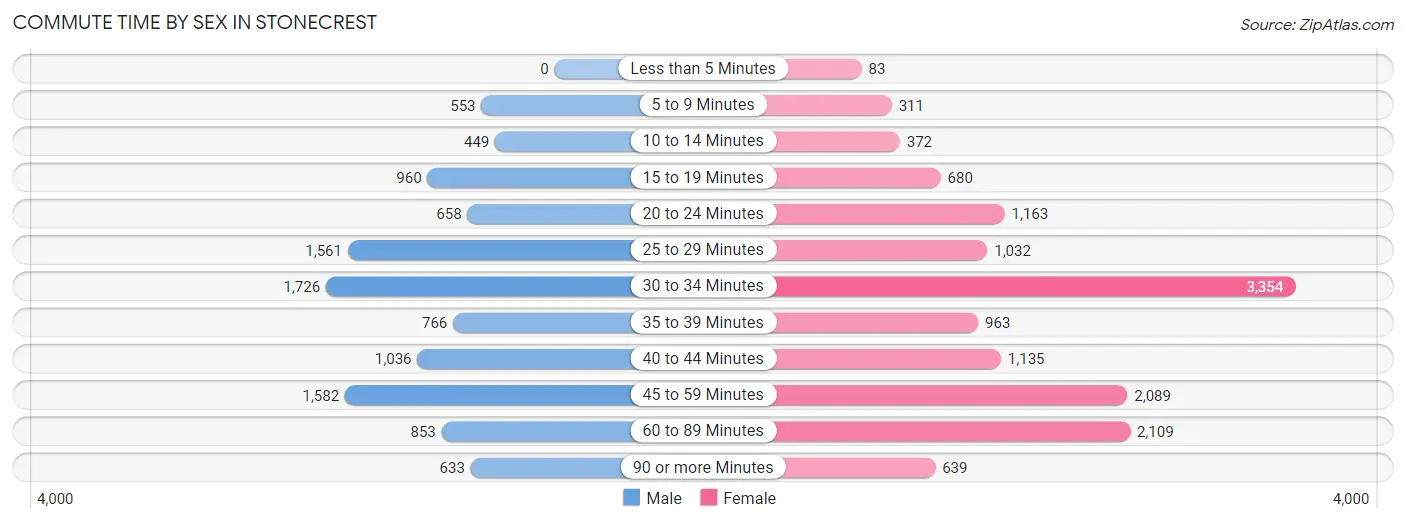
| Commute Time | Male | Female |
| Less than 5 Minutes | 0 (0.0%) | 83 (0.6%) |
| 5 to 9 Minutes | 553 (5.1%) | 311 (2.2%) |
| 10 to 14 Minutes | 449 (4.2%) | 372 (2.7%) |
| 15 to 19 Minutes | 960 (8.9%) | 680 (4.9%) |
| 20 to 24 Minutes | 658 (6.1%) | 1,163 (8.4%) |
| 25 to 29 Minutes | 1,561 (14.5%) | 1,032 (7.4%) |
| 30 to 34 Minutes | 1,726 (16.0%) | 3,354 (24.1%) |
| 35 to 39 Minutes | 766 (7.1%) | 963 (6.9%) |
| 40 to 44 Minutes | 1,036 (9.6%) | 1,135 (8.2%) |
| 45 to 59 Minutes | 1,582 (14.7%) | 2,089 (15.0%) |
| 60 to 89 Minutes | 853 (7.9%) | 2,109 (15.1%) |
| 90 or more Minutes | 633 (5.9%) | 639 (4.6%) |
Time of Departure to Work by Sex in Stonecrest
The most frequent times of departure to work in Stonecrest are 4:00 PM to 11:59 PM (1,351, 12.5%) for males and 6:00 AM to 6:29 AM (2,702, 19.4%) for females.
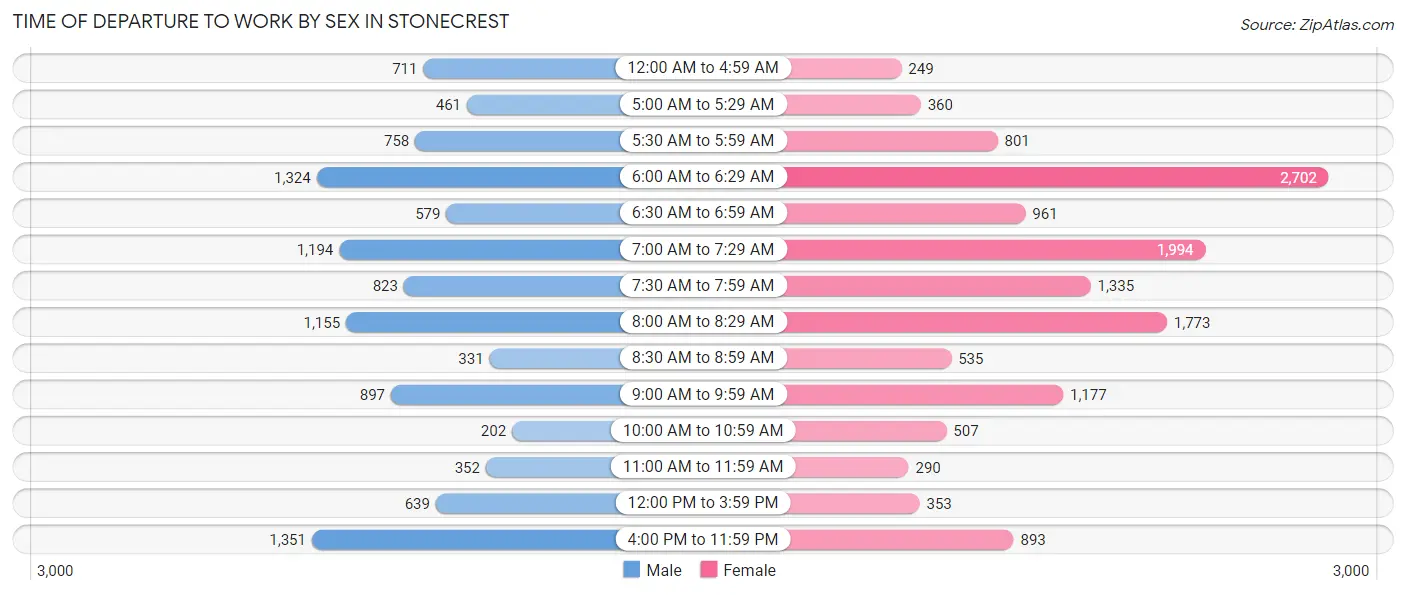
| Time of Departure | Male | Female |
| 12:00 AM to 4:59 AM | 711 (6.6%) | 249 (1.8%) |
| 5:00 AM to 5:29 AM | 461 (4.3%) | 360 (2.6%) |
| 5:30 AM to 5:59 AM | 758 (7.0%) | 801 (5.8%) |
| 6:00 AM to 6:29 AM | 1,324 (12.3%) | 2,702 (19.4%) |
| 6:30 AM to 6:59 AM | 579 (5.4%) | 961 (6.9%) |
| 7:00 AM to 7:29 AM | 1,194 (11.1%) | 1,994 (14.3%) |
| 7:30 AM to 7:59 AM | 823 (7.6%) | 1,335 (9.6%) |
| 8:00 AM to 8:29 AM | 1,155 (10.7%) | 1,773 (12.7%) |
| 8:30 AM to 8:59 AM | 331 (3.1%) | 535 (3.8%) |
| 9:00 AM to 9:59 AM | 897 (8.3%) | 1,177 (8.5%) |
| 10:00 AM to 10:59 AM | 202 (1.9%) | 507 (3.6%) |
| 11:00 AM to 11:59 AM | 352 (3.3%) | 290 (2.1%) |
| 12:00 PM to 3:59 PM | 639 (5.9%) | 353 (2.5%) |
| 4:00 PM to 11:59 PM | 1,351 (12.5%) | 893 (6.4%) |
| Total | 10,777 (100.0%) | 13,930 (100.0%) |
Housing Occupancy in Stonecrest
Occupancy by Ownership in Stonecrest
Of the total 20,439 dwellings in Stonecrest, owner-occupied units account for 10,268 (50.2%), while renter-occupied units make up 10,171 (49.8%).
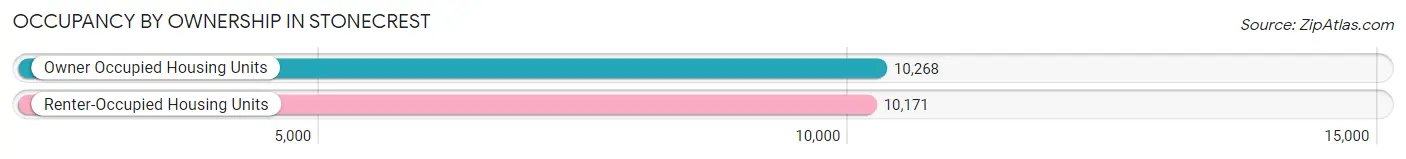
| Occupancy | # Housing Units | % Housing Units |
| Owner Occupied Housing Units | 10,268 | 50.2% |
| Renter-Occupied Housing Units | 10,171 | 49.8% |
| Total Occupied Housing Units | 20,439 | 100.0% |
Occupancy by Household Size in Stonecrest
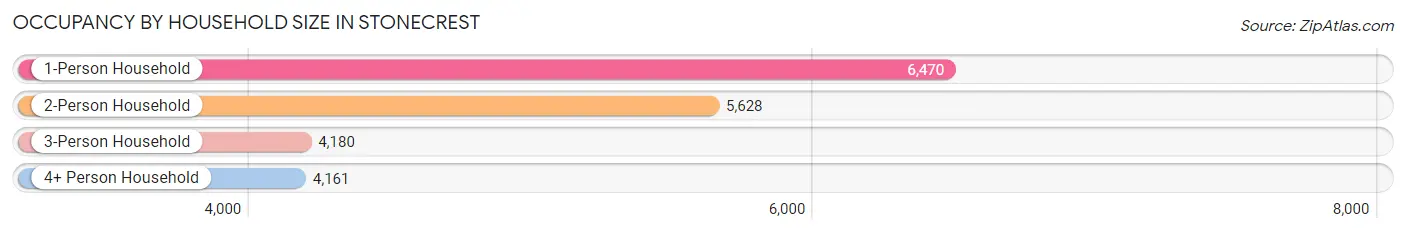
| Household Size | # Housing Units | % Housing Units |
| 1-Person Household | 6,470 | 31.7% |
| 2-Person Household | 5,628 | 27.5% |
| 3-Person Household | 4,180 | 20.4% |
| 4+ Person Household | 4,161 | 20.4% |
| Total Housing Units | 20,439 | 100.0% |
Occupancy by Ownership by Household Size in Stonecrest
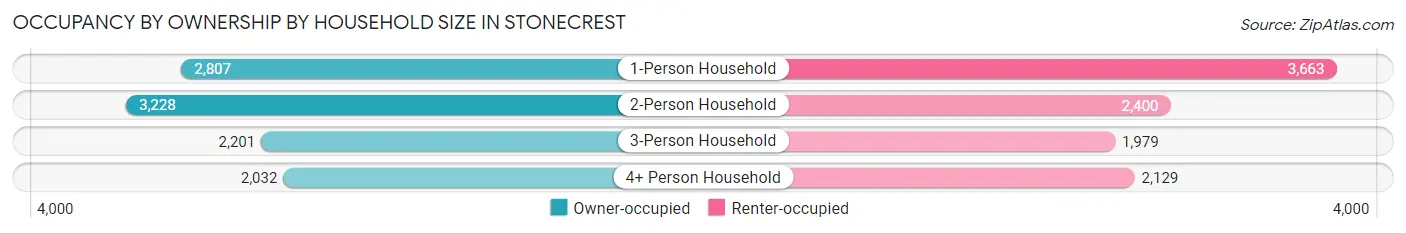
| Household Size | Owner-occupied | Renter-occupied |
| 1-Person Household | 2,807 (43.4%) | 3,663 (56.6%) |
| 2-Person Household | 3,228 (57.4%) | 2,400 (42.6%) |
| 3-Person Household | 2,201 (52.7%) | 1,979 (47.3%) |
| 4+ Person Household | 2,032 (48.8%) | 2,129 (51.2%) |
| Total Housing Units | 10,268 (50.2%) | 10,171 (49.8%) |
Occupancy by Educational Attainment in Stonecrest
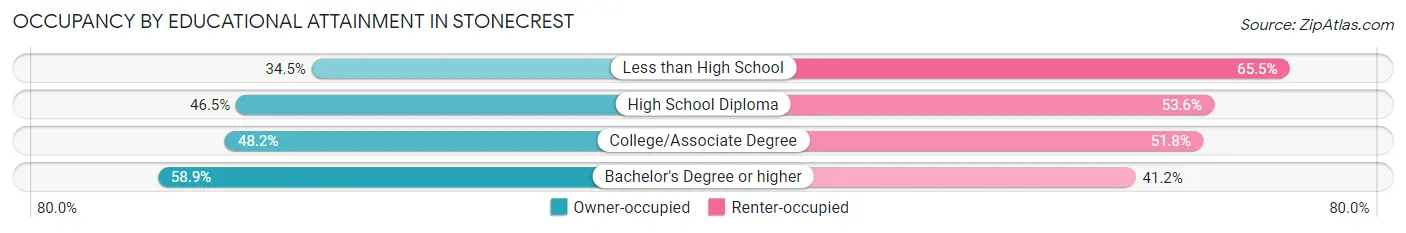
| Household Size | Owner-occupied | Renter-occupied |
| Less than High School | 374 (34.5%) | 711 (65.5%) |
| High School Diploma | 2,055 (46.5%) | 2,369 (53.5%) |
| College/Associate Degree | 4,286 (48.2%) | 4,607 (51.8%) |
| Bachelor's Degree or higher | 3,553 (58.9%) | 2,484 (41.1%) |
Occupancy by Age of Householder in Stonecrest
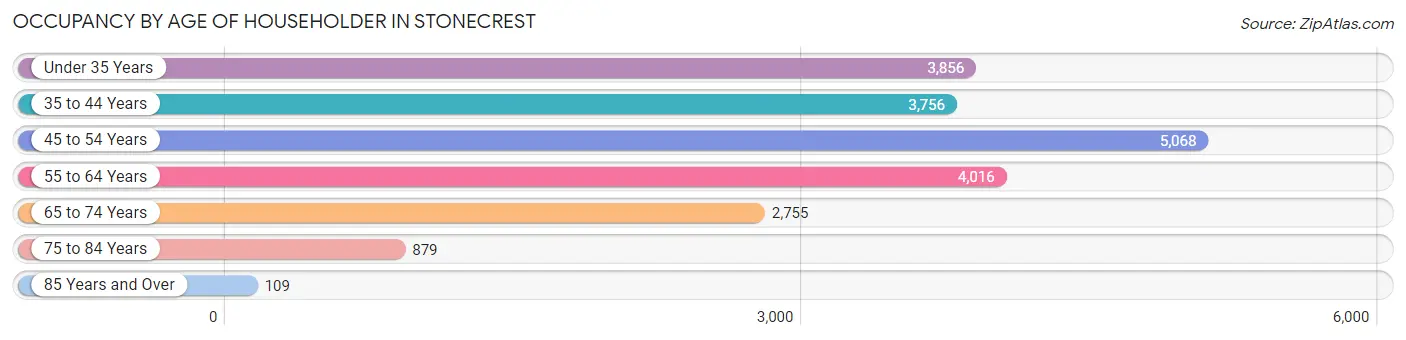
| Age Bracket | # Households | % Households |
| Under 35 Years | 3,856 | 18.9% |
| 35 to 44 Years | 3,756 | 18.4% |
| 45 to 54 Years | 5,068 | 24.8% |
| 55 to 64 Years | 4,016 | 19.7% |
| 65 to 74 Years | 2,755 | 13.5% |
| 75 to 84 Years | 879 | 4.3% |
| 85 Years and Over | 109 | 0.5% |
| Total | 20,439 | 100.0% |
Housing Finances in Stonecrest
Median Income by Occupancy in Stonecrest
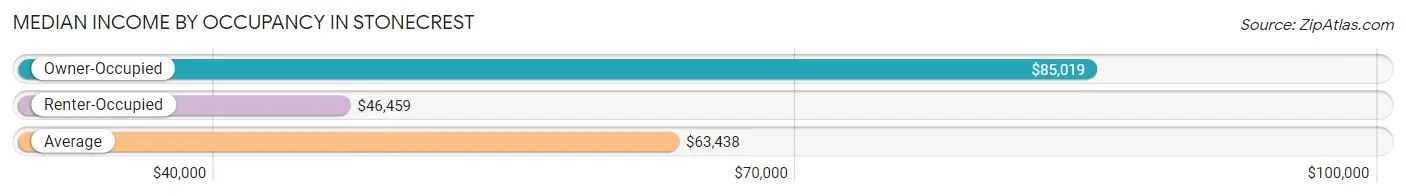
| Occupancy Type | # Households | Median Income |
| Owner-Occupied | 10,268 (50.2%) | $85,019 |
| Renter-Occupied | 10,171 (49.8%) | $46,459 |
| Average | 20,439 (100.0%) | $63,438 |
Occupancy by Householder Income Bracket in Stonecrest
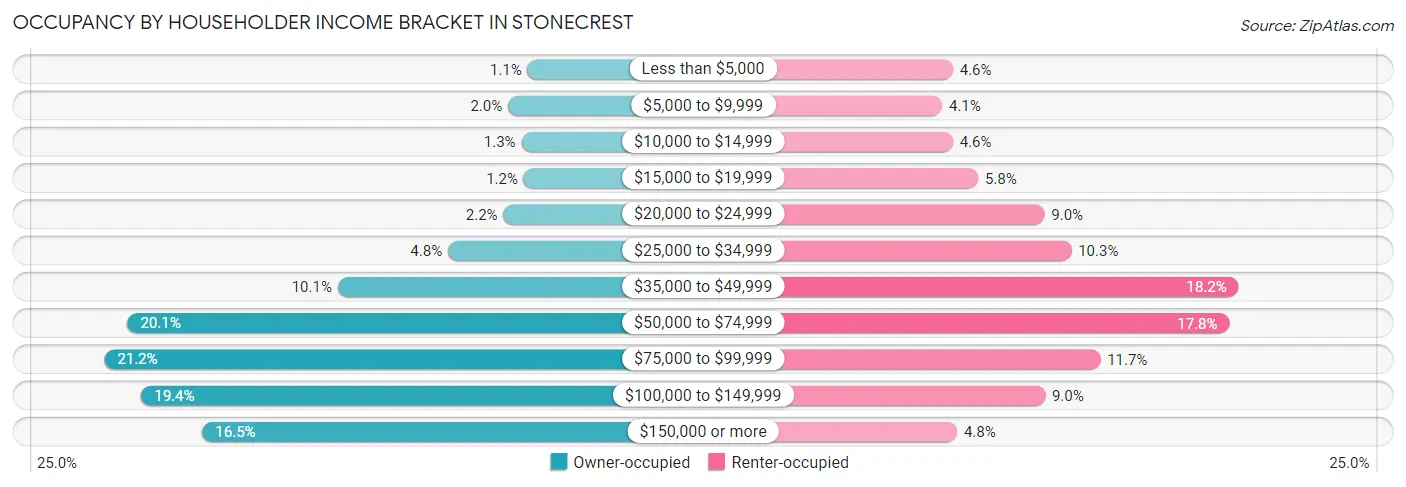
| Income Bracket | Owner-occupied | Renter-occupied |
| Less than $5,000 | 108 (1.1%) | 471 (4.6%) |
| $5,000 to $9,999 | 203 (2.0%) | 419 (4.1%) |
| $10,000 to $14,999 | 138 (1.3%) | 471 (4.6%) |
| $15,000 to $19,999 | 126 (1.2%) | 593 (5.8%) |
| $20,000 to $24,999 | 226 (2.2%) | 914 (9.0%) |
| $25,000 to $34,999 | 497 (4.8%) | 1,045 (10.3%) |
| $35,000 to $49,999 | 1,036 (10.1%) | 1,855 (18.2%) |
| $50,000 to $74,999 | 2,064 (20.1%) | 1,810 (17.8%) |
| $75,000 to $99,999 | 2,177 (21.2%) | 1,185 (11.7%) |
| $100,000 to $149,999 | 1,996 (19.4%) | 917 (9.0%) |
| $150,000 or more | 1,697 (16.5%) | 491 (4.8%) |
| Total | 10,268 (100.0%) | 10,171 (100.0%) |
Monthly Housing Cost Tiers in Stonecrest
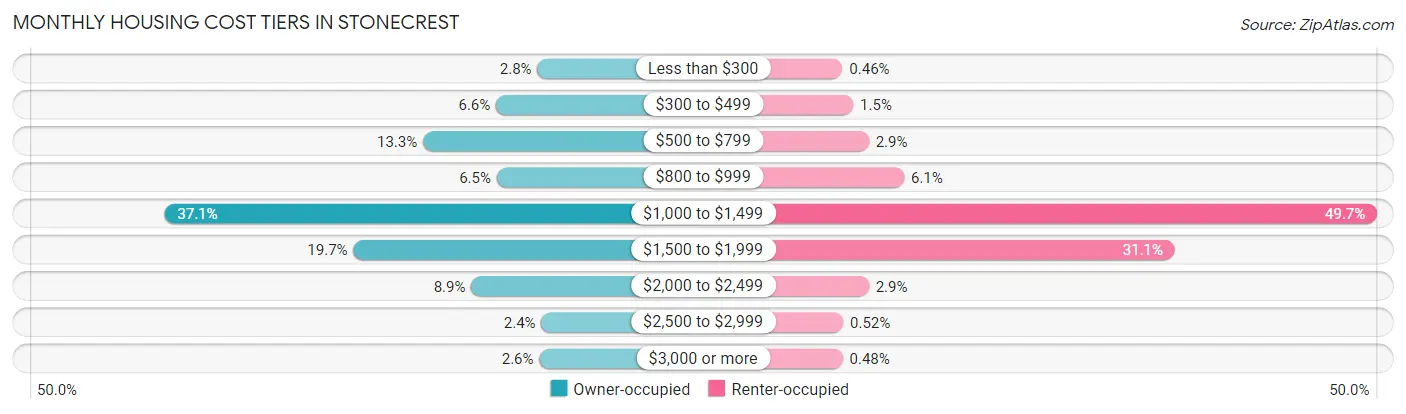
| Monthly Cost | Owner-occupied | Renter-occupied |
| Less than $300 | 286 (2.8%) | 47 (0.5%) |
| $300 to $499 | 677 (6.6%) | 147 (1.5%) |
| $500 to $799 | 1,368 (13.3%) | 293 (2.9%) |
| $800 to $999 | 670 (6.5%) | 623 (6.1%) |
| $1,000 to $1,499 | 3,813 (37.1%) | 5,053 (49.7%) |
| $1,500 to $1,999 | 2,026 (19.7%) | 3,159 (31.1%) |
| $2,000 to $2,499 | 912 (8.9%) | 293 (2.9%) |
| $2,500 to $2,999 | 248 (2.4%) | 53 (0.5%) |
| $3,000 or more | 268 (2.6%) | 49 (0.5%) |
| Total | 10,268 (100.0%) | 10,171 (100.0%) |
Physical Housing Characteristics in Stonecrest
Housing Structures in Stonecrest
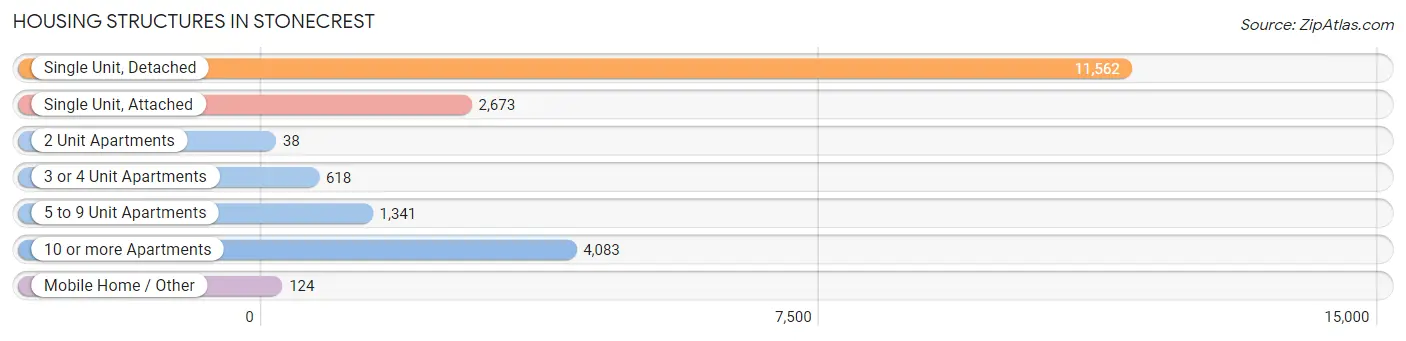
| Structure Type | # Housing Units | % Housing Units |
| Single Unit, Detached | 11,562 | 56.6% |
| Single Unit, Attached | 2,673 | 13.1% |
| 2 Unit Apartments | 38 | 0.2% |
| 3 or 4 Unit Apartments | 618 | 3.0% |
| 5 to 9 Unit Apartments | 1,341 | 6.6% |
| 10 or more Apartments | 4,083 | 20.0% |
| Mobile Home / Other | 124 | 0.6% |
| Total | 20,439 | 100.0% |
Housing Structures by Occupancy in Stonecrest
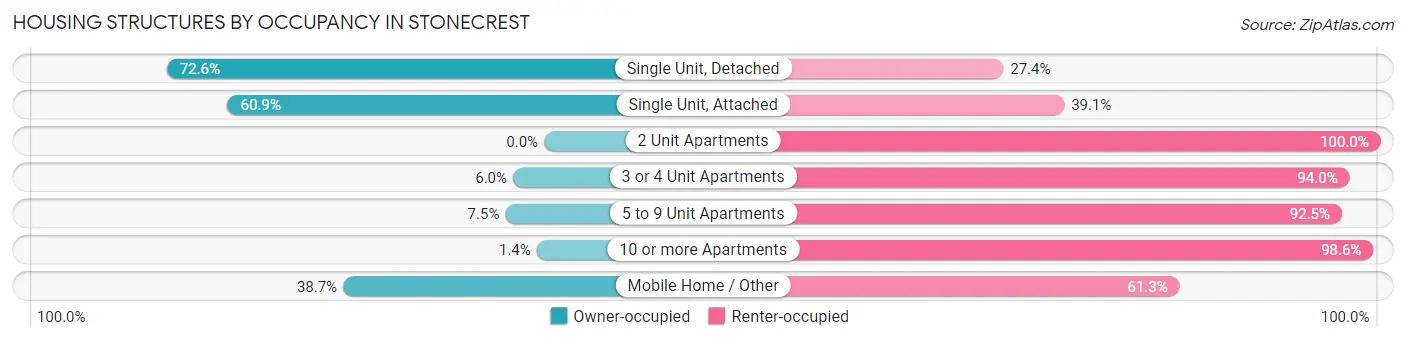
| Structure Type | Owner-occupied | Renter-occupied |
| Single Unit, Detached | 8,397 (72.6%) | 3,165 (27.4%) |
| Single Unit, Attached | 1,628 (60.9%) | 1,045 (39.1%) |
| 2 Unit Apartments | 0 (0.0%) | 38 (100.0%) |
| 3 or 4 Unit Apartments | 37 (6.0%) | 581 (94.0%) |
| 5 to 9 Unit Apartments | 100 (7.5%) | 1,241 (92.5%) |
| 10 or more Apartments | 58 (1.4%) | 4,025 (98.6%) |
| Mobile Home / Other | 48 (38.7%) | 76 (61.3%) |
| Total | 10,268 (50.2%) | 10,171 (49.8%) |
Housing Structures by Number of Rooms in Stonecrest
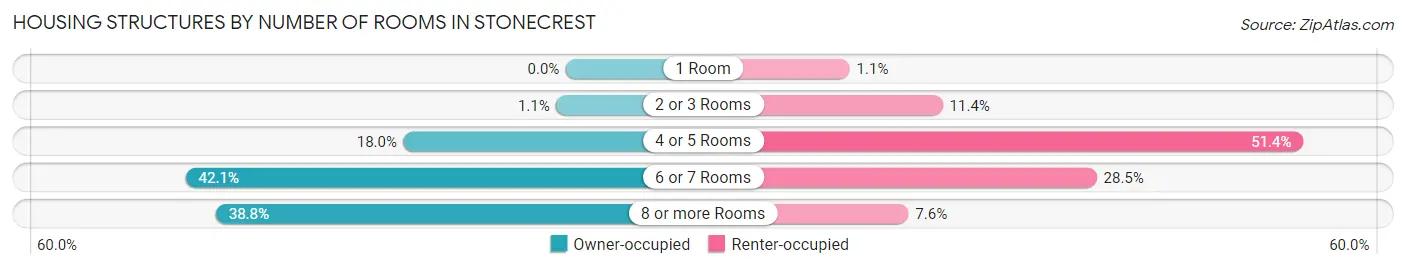
| Number of Rooms | Owner-occupied | Renter-occupied |
| 1 Room | 0 (0.0%) | 110 (1.1%) |
| 2 or 3 Rooms | 110 (1.1%) | 1,159 (11.4%) |
| 4 or 5 Rooms | 1,851 (18.0%) | 5,231 (51.4%) |
| 6 or 7 Rooms | 4,325 (42.1%) | 2,898 (28.5%) |
| 8 or more Rooms | 3,982 (38.8%) | 773 (7.6%) |
| Total | 10,268 (100.0%) | 10,171 (100.0%) |
Housing Structure by Heating Type in Stonecrest
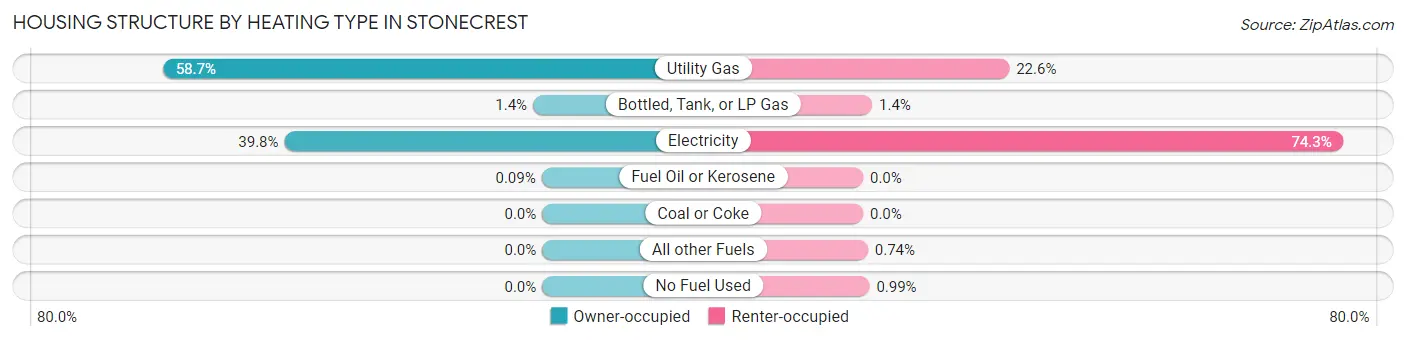
| Heating Type | Owner-occupied | Renter-occupied |
| Utility Gas | 6,022 (58.7%) | 2,299 (22.6%) |
| Bottled, Tank, or LP Gas | 146 (1.4%) | 142 (1.4%) |
| Electricity | 4,091 (39.8%) | 7,554 (74.3%) |
| Fuel Oil or Kerosene | 9 (0.1%) | 0 (0.0%) |
| Coal or Coke | 0 (0.0%) | 0 (0.0%) |
| All other Fuels | 0 (0.0%) | 75 (0.7%) |
| No Fuel Used | 0 (0.0%) | 101 (1.0%) |
| Total | 10,268 (100.0%) | 10,171 (100.0%) |
Household Vehicle Usage in Stonecrest
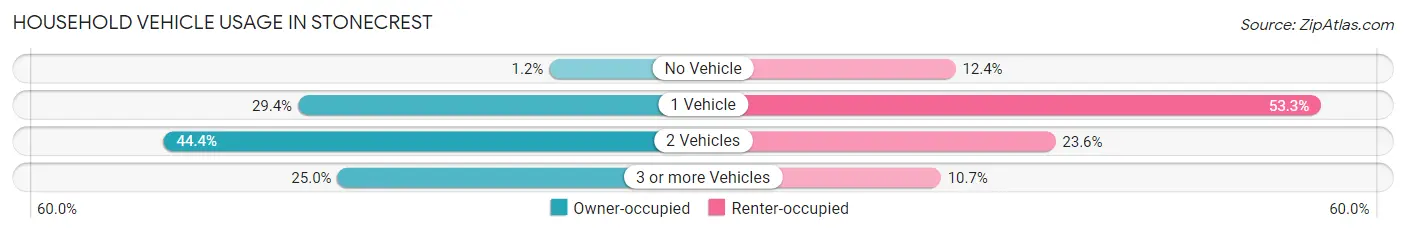
| Vehicles per Household | Owner-occupied | Renter-occupied |
| No Vehicle | 127 (1.2%) | 1,259 (12.4%) |
| 1 Vehicle | 3,017 (29.4%) | 5,424 (53.3%) |
| 2 Vehicles | 4,561 (44.4%) | 2,397 (23.6%) |
| 3 or more Vehicles | 2,563 (25.0%) | 1,091 (10.7%) |
| Total | 10,268 (100.0%) | 10,171 (100.0%) |
Real Estate & Mortgages in Stonecrest
Real Estate and Mortgage Overview in Stonecrest
| Characteristic | Without Mortgage | With Mortgage |
| Housing Units | 1,976 | 8,292 |
| Median Property Value | $148,200 | $189,100 |
| Median Household Income | $56,250 | $1,517 |
| Monthly Housing Costs | $517 | $260 |
| Real Estate Taxes | $1,165 | $104 |
Property Value by Mortgage Status in Stonecrest
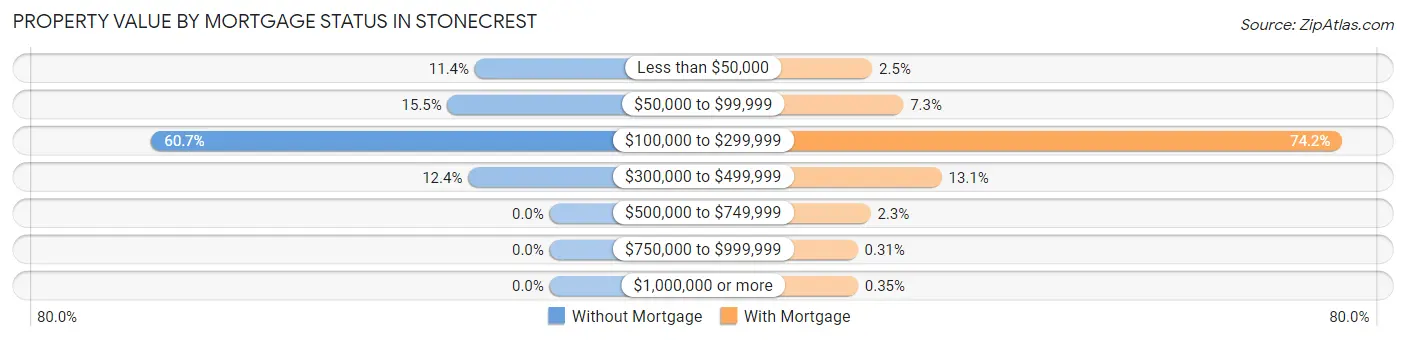
| Property Value | Without Mortgage | With Mortgage |
| Less than $50,000 | 225 (11.4%) | 210 (2.5%) |
| $50,000 to $99,999 | 307 (15.5%) | 602 (7.3%) |
| $100,000 to $299,999 | 1,199 (60.7%) | 6,150 (74.2%) |
| $300,000 to $499,999 | 245 (12.4%) | 1,087 (13.1%) |
| $500,000 to $749,999 | 0 (0.0%) | 188 (2.3%) |
| $750,000 to $999,999 | 0 (0.0%) | 26 (0.3%) |
| $1,000,000 or more | 0 (0.0%) | 29 (0.4%) |
| Total | 1,976 (100.0%) | 8,292 (100.0%) |
Household Income by Mortgage Status in Stonecrest
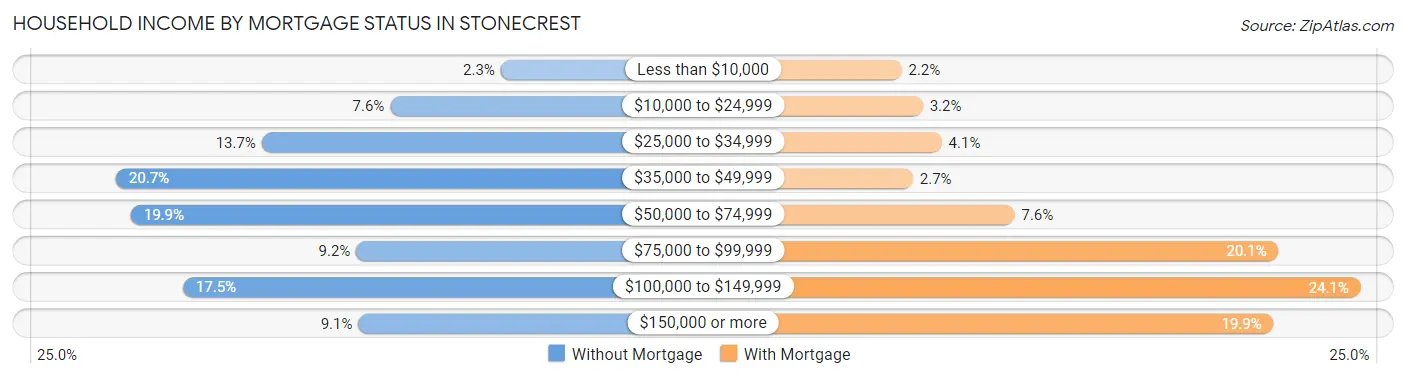
| Household Income | Without Mortgage | With Mortgage |
| Less than $10,000 | 46 (2.3%) | 182 (2.2%) |
| $10,000 to $24,999 | 150 (7.6%) | 265 (3.2%) |
| $25,000 to $34,999 | 271 (13.7%) | 340 (4.1%) |
| $35,000 to $49,999 | 408 (20.6%) | 226 (2.7%) |
| $50,000 to $74,999 | 394 (19.9%) | 628 (7.6%) |
| $75,000 to $99,999 | 182 (9.2%) | 1,670 (20.1%) |
| $100,000 to $149,999 | 345 (17.5%) | 1,995 (24.1%) |
| $150,000 or more | 180 (9.1%) | 1,651 (19.9%) |
| Total | 1,976 (100.0%) | 8,292 (100.0%) |
Property Value to Household Income Ratio in Stonecrest
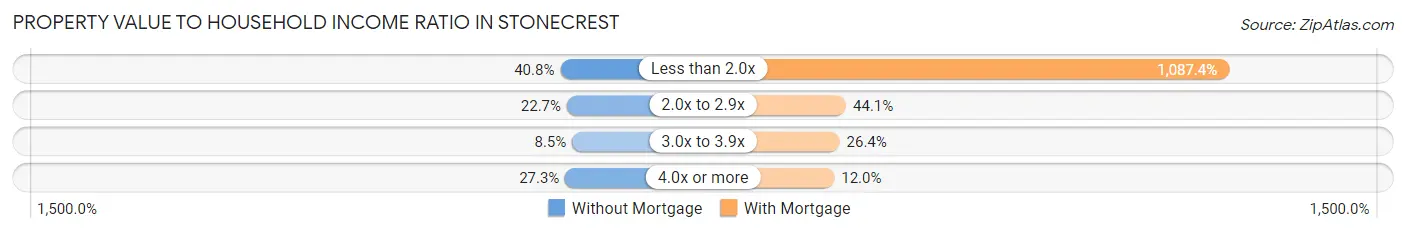
| Value-to-Income Ratio | Without Mortgage | With Mortgage |
| Less than 2.0x | 806 (40.8%) | 90,163 (1,087.3%) |
| 2.0x to 2.9x | 449 (22.7%) | 3,654 (44.1%) |
| 3.0x to 3.9x | 168 (8.5%) | 2,185 (26.4%) |
| 4.0x or more | 540 (27.3%) | 992 (12.0%) |
| Total | 1,976 (100.0%) | 8,292 (100.0%) |
Real Estate Taxes by Mortgage Status in Stonecrest
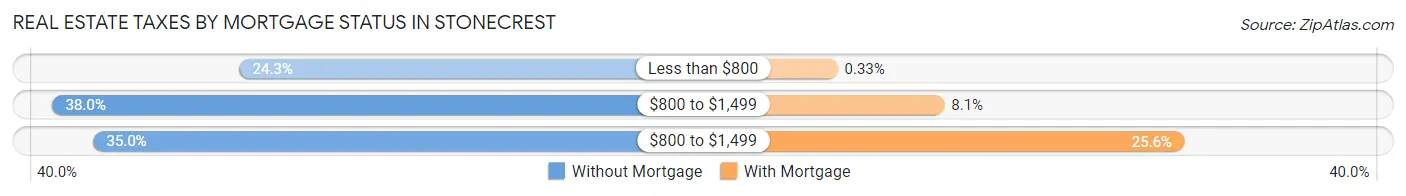
| Property Taxes | Without Mortgage | With Mortgage |
| Less than $800 | 480 (24.3%) | 27 (0.3%) |
| $800 to $1,499 | 750 (38.0%) | 674 (8.1%) |
| $800 to $1,499 | 691 (35.0%) | 2,125 (25.6%) |
| Total | 1,976 (100.0%) | 8,292 (100.0%) |
Health & Disability in Stonecrest
Health Insurance Coverage by Age in Stonecrest
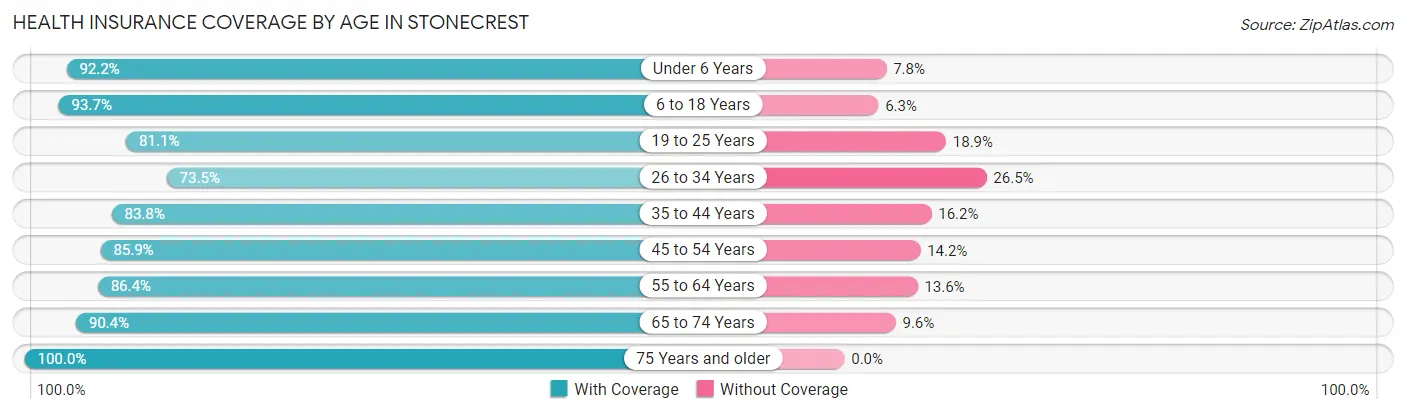
| Age Bracket | With Coverage | Without Coverage |
| Under 6 Years | 4,086 (92.2%) | 346 (7.8%) |
| 6 to 18 Years | 9,415 (93.7%) | 636 (6.3%) |
| 19 to 25 Years | 6,106 (81.1%) | 1,427 (18.9%) |
| 26 to 34 Years | 6,071 (73.5%) | 2,189 (26.5%) |
| 35 to 44 Years | 6,382 (83.8%) | 1,236 (16.2%) |
| 45 to 54 Years | 7,329 (85.9%) | 1,208 (14.1%) |
| 55 to 64 Years | 5,636 (86.4%) | 890 (13.6%) |
| 65 to 74 Years | 4,220 (90.4%) | 446 (9.6%) |
| 75 Years and older | 1,592 (100.0%) | 0 (0.0%) |
| Total | 50,837 (85.9%) | 8,378 (14.1%) |
Health Insurance Coverage by Citizenship Status in Stonecrest
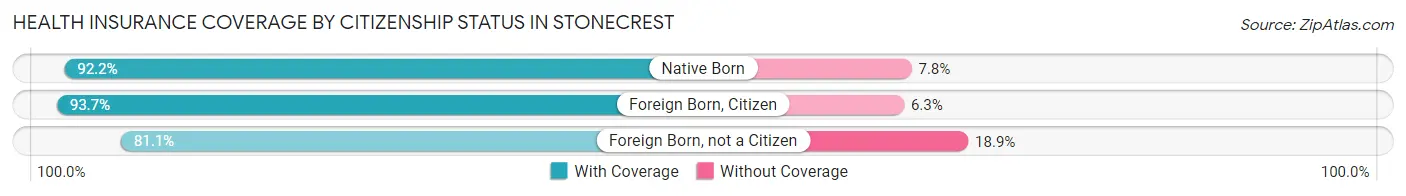
| Citizenship Status | With Coverage | Without Coverage |
| Native Born | 4,086 (92.2%) | 346 (7.8%) |
| Foreign Born, Citizen | 9,415 (93.7%) | 636 (6.3%) |
| Foreign Born, not a Citizen | 6,106 (81.1%) | 1,427 (18.9%) |
Health Insurance Coverage by Household Income in Stonecrest
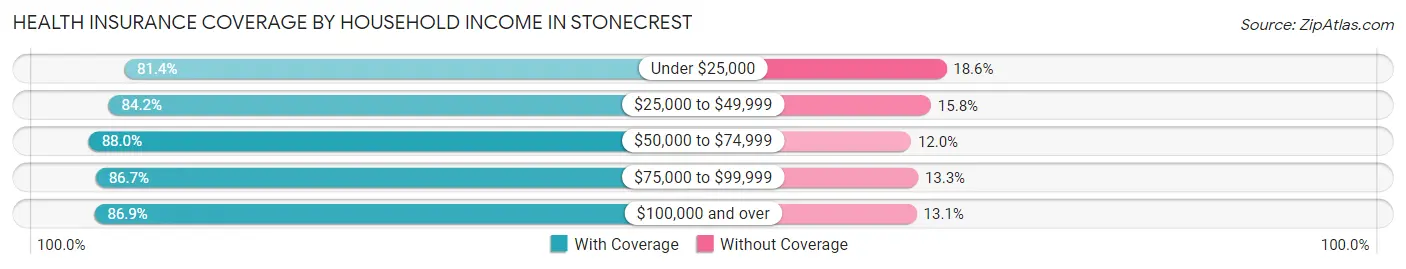
| Household Income | With Coverage | Without Coverage |
| Under $25,000 | 5,932 (81.4%) | 1,359 (18.6%) |
| $25,000 to $49,999 | 9,851 (84.2%) | 1,843 (15.8%) |
| $50,000 to $74,999 | 9,811 (88.0%) | 1,341 (12.0%) |
| $75,000 to $99,999 | 8,434 (86.7%) | 1,297 (13.3%) |
| $100,000 and over | 16,771 (86.9%) | 2,526 (13.1%) |
Public vs Private Health Insurance Coverage by Age in Stonecrest
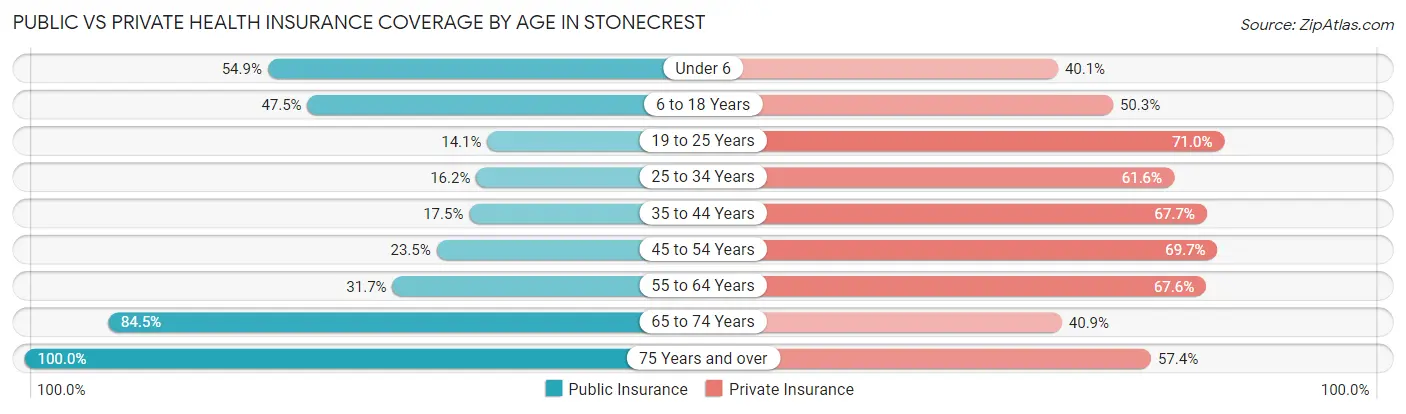
| Age Bracket | Public Insurance | Private Insurance |
| Under 6 | 2,432 (54.9%) | 1,778 (40.1%) |
| 6 to 18 Years | 4,774 (47.5%) | 5,060 (50.3%) |
| 19 to 25 Years | 1,064 (14.1%) | 5,347 (71.0%) |
| 25 to 34 Years | 1,336 (16.2%) | 5,091 (61.6%) |
| 35 to 44 Years | 1,331 (17.5%) | 5,159 (67.7%) |
| 45 to 54 Years | 2,009 (23.5%) | 5,951 (69.7%) |
| 55 to 64 Years | 2,071 (31.7%) | 4,411 (67.6%) |
| 65 to 74 Years | 3,944 (84.5%) | 1,906 (40.8%) |
| 75 Years and over | 1,592 (100.0%) | 914 (57.4%) |
| Total | 20,553 (34.7%) | 35,617 (60.2%) |
Disability Status by Sex by Age in Stonecrest
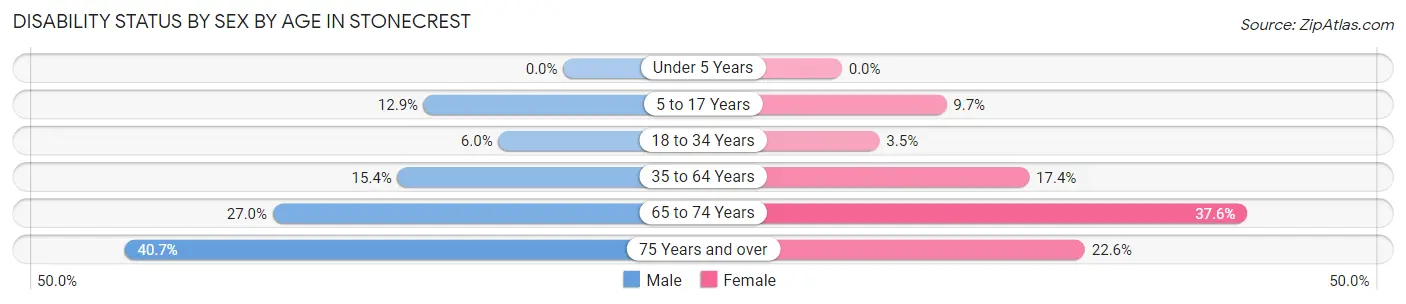
| Age Bracket | Male | Female |
| Under 5 Years | 0 (0.0%) | 0 (0.0%) |
| 5 to 17 Years | 753 (12.9%) | 440 (9.7%) |
| 18 to 34 Years | 469 (6.0%) | 292 (3.5%) |
| 35 to 64 Years | 1,398 (15.4%) | 2,364 (17.4%) |
| 65 to 74 Years | 509 (27.0%) | 1,045 (37.6%) |
| 75 Years and over | 244 (40.7%) | 224 (22.6%) |
Disability Class by Sex by Age in Stonecrest
Disability Class: Hearing Difficulty
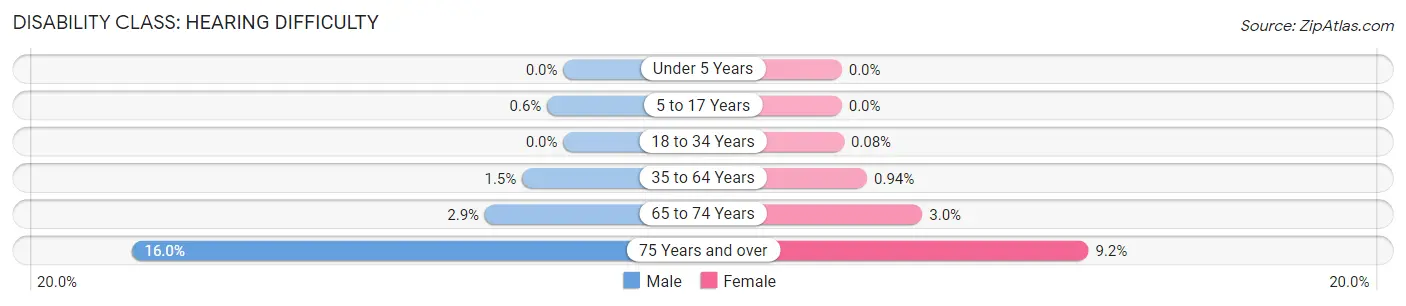
| Age Bracket | Male | Female |
| Under 5 Years | 0 (0.0%) | 0 (0.0%) |
| 5 to 17 Years | 35 (0.6%) | 0 (0.0%) |
| 18 to 34 Years | 0 (0.0%) | 7 (0.1%) |
| 35 to 64 Years | 139 (1.5%) | 128 (0.9%) |
| 65 to 74 Years | 55 (2.9%) | 83 (3.0%) |
| 75 Years and over | 96 (16.0%) | 91 (9.2%) |
Disability Class: Vision Difficulty
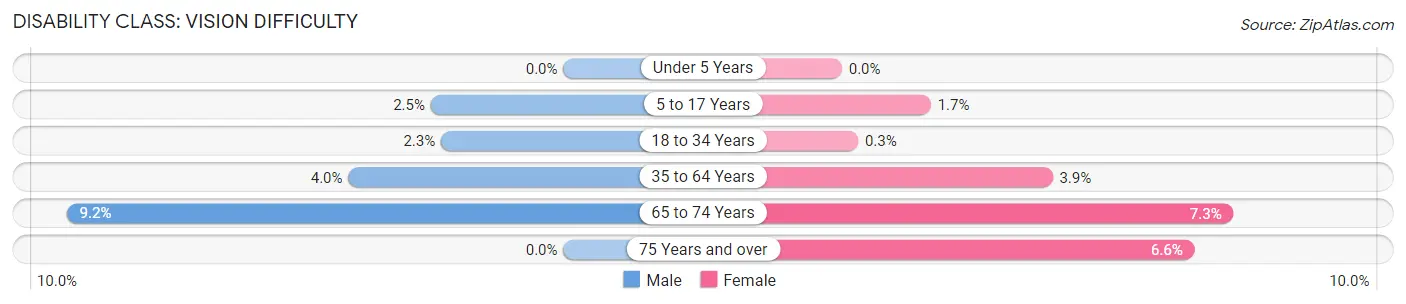
| Age Bracket | Male | Female |
| Under 5 Years | 0 (0.0%) | 0 (0.0%) |
| 5 to 17 Years | 143 (2.5%) | 75 (1.7%) |
| 18 to 34 Years | 177 (2.3%) | 25 (0.3%) |
| 35 to 64 Years | 363 (4.0%) | 531 (3.9%) |
| 65 to 74 Years | 174 (9.2%) | 202 (7.3%) |
| 75 Years and over | 0 (0.0%) | 65 (6.6%) |
Disability Class: Cognitive Difficulty
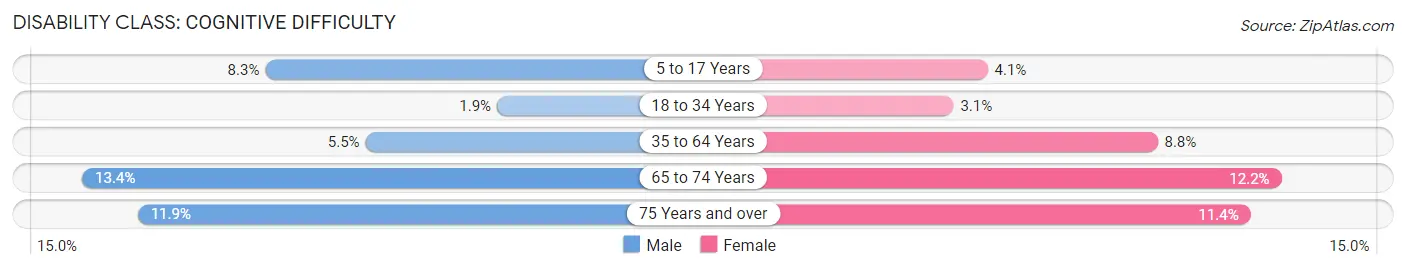
| Age Bracket | Male | Female |
| 5 to 17 Years | 483 (8.3%) | 184 (4.1%) |
| 18 to 34 Years | 144 (1.8%) | 260 (3.1%) |
| 35 to 64 Years | 501 (5.5%) | 1,195 (8.8%) |
| 65 to 74 Years | 253 (13.4%) | 340 (12.2%) |
| 75 Years and over | 71 (11.8%) | 113 (11.4%) |
Disability Class: Ambulatory Difficulty
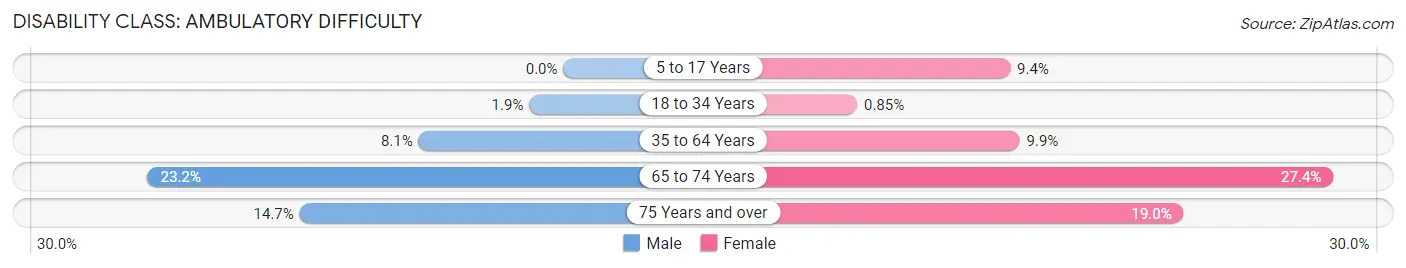
| Age Bracket | Male | Female |
| 5 to 17 Years | 0 (0.0%) | 425 (9.4%) |
| 18 to 34 Years | 148 (1.9%) | 71 (0.9%) |
| 35 to 64 Years | 733 (8.1%) | 1,346 (9.9%) |
| 65 to 74 Years | 437 (23.2%) | 760 (27.4%) |
| 75 Years and over | 88 (14.7%) | 189 (19.0%) |
Disability Class: Self-Care Difficulty
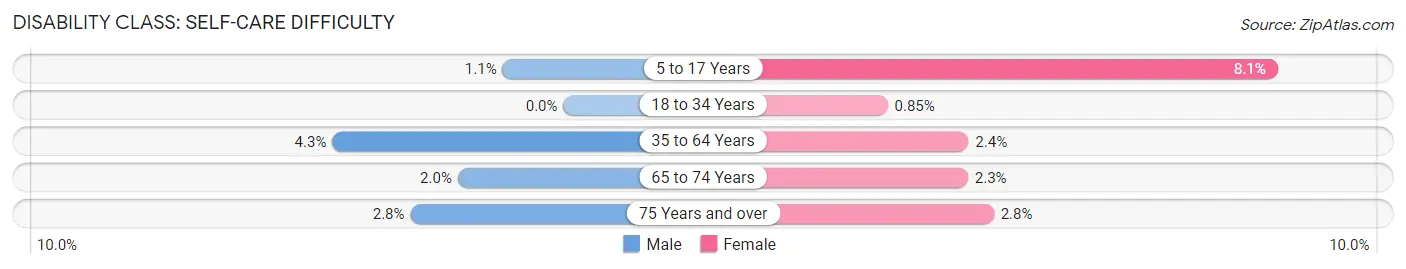
| Age Bracket | Male | Female |
| 5 to 17 Years | 66 (1.1%) | 367 (8.1%) |
| 18 to 34 Years | 0 (0.0%) | 71 (0.9%) |
| 35 to 64 Years | 390 (4.3%) | 319 (2.4%) |
| 65 to 74 Years | 37 (2.0%) | 65 (2.3%) |
| 75 Years and over | 17 (2.8%) | 28 (2.8%) |
Technology Access in Stonecrest
Computing Device Access in Stonecrest
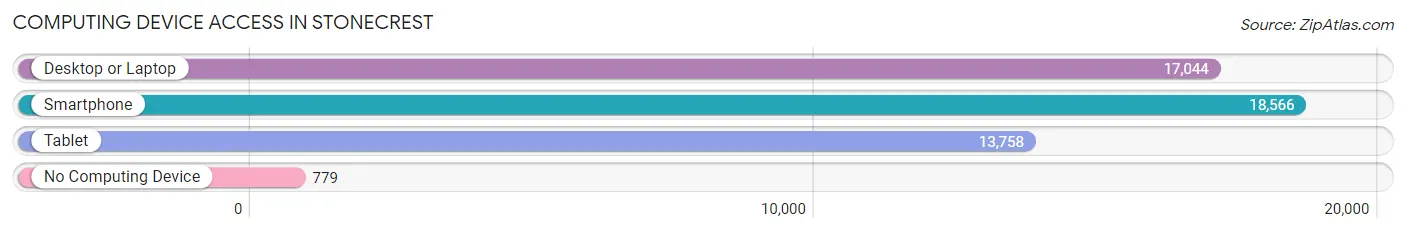
| Device Type | # Households | % Households |
| Desktop or Laptop | 17,044 | 83.4% |
| Smartphone | 18,566 | 90.8% |
| Tablet | 13,758 | 67.3% |
| No Computing Device | 779 | 3.8% |
| Total | 20,439 | 100.0% |
Internet Access in Stonecrest
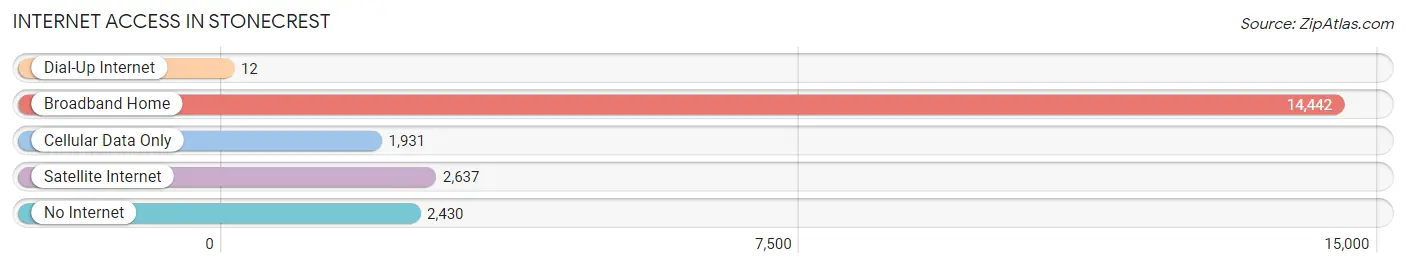
| Internet Type | # Households | % Households |
| Dial-Up Internet | 12 | 0.1% |
| Broadband Home | 14,442 | 70.7% |
| Cellular Data Only | 1,931 | 9.5% |
| Satellite Internet | 2,637 | 12.9% |
| No Internet | 2,430 | 11.9% |
| Total | 20,439 | 100.0% |
Stonecrest Summary
Stonecrest, Georgia is a city located in DeKalb County, Georgia, United States. It is a suburb of Atlanta and is part of the Atlanta metropolitan area. The city was incorporated in 2016 and is the largest city in DeKalb County.
History
Stonecrest was originally part of the unincorporated area of DeKalb County known as the “Stone Mountain-Lithonia-Redan” area. The area was first settled in the early 1800s by farmers and was known as “Stone Mountain”. The area was later renamed “Stonecrest” in the late 1800s.
In the early 1900s, the area was developed as a residential community and was home to many prominent families. The area was also home to a number of businesses, including a cotton mill, a grist mill, and a sawmill.
In the 1950s, the area began to experience rapid growth due to the development of the nearby city of Atlanta. The area was annexed by the city of Atlanta in the 1960s and was later annexed by DeKalb County in the 1970s.
In 2016, the area was incorporated as the City of Stonecrest. The city was named after the nearby Stone Mountain, which is the largest exposed granite monolith in the world.
Geography
Stonecrest is located in DeKalb County, Georgia, United States. It is a suburb of Atlanta and is part of the Atlanta metropolitan area. The city is located in the eastern part of the county, near the cities of Lithonia and Redan.
The city has a total area of 8.3 square miles, of which 8.2 square miles is land and 0.1 square miles is water. The city is located at an elevation of 890 feet above sea level.
Economy
Stonecrest is home to a number of businesses and industries. The city is home to a number of retail stores, restaurants, and other businesses. The city is also home to a number of industrial and manufacturing businesses.
The city is also home to a number of corporate headquarters, including the headquarters of the Home Depot, the world’s largest home improvement retailer.
Demographics
As of the 2010 census, the population of Stonecrest was 54,131. The racial makeup of the city was 57.2% African American, 33.3% White, 4.2% Asian, 0.3% Native American, 0.1% Pacific Islander, and 4.9% from other races.
The median household income in Stonecrest was $50,945, and the median family income was $58,945. The per capita income in Stonecrest was $25,945.
Conclusion
Stonecrest, Georgia is a city located in DeKalb County, Georgia, United States. It is a suburb of Atlanta and is part of the Atlanta metropolitan area. The city was incorporated in 2016 and is the largest city in DeKalb County. Stonecrest is home to a number of businesses and industries, and is also home to a number of corporate headquarters. The population of Stonecrest was 54,131 as of the 2010 census, and the median household income was $50,945.
Common Questions
What is Per Capita Income in Stonecrest?
Per Capita income in Stonecrest is $29,933.
What is the Median Family Income in Stonecrest?
Median Family Income in Stonecrest is $75,771.
What is the Median Household income in Stonecrest?
Median Household Income in Stonecrest is $63,438.
What is Income or Wage Gap in Stonecrest?
Income or Wage Gap in Stonecrest is 16.6%.
Women in Stonecrest earn 83.4 cents for every dollar earned by a man.
What is Family Income Deficit in Stonecrest?
Family Income Deficit in Stonecrest is $10,444.
Families that are below poverty line in Stonecrest earn $10,444 less on average than the poverty threshold level.
What is Inequality or Gini Index in Stonecrest?
Inequality or Gini Index in Stonecrest is 0.42.
What is the Total Population of Stonecrest?
Total Population of Stonecrest is 59,445.
What is the Total Male Population of Stonecrest?
Total Male Population of Stonecrest is 27,102.
What is the Total Female Population of Stonecrest?
Total Female Population of Stonecrest is 32,343.
What is the Ratio of Males per 100 Females in Stonecrest?
There are 83.80 Males per 100 Females in Stonecrest.
What is the Ratio of Females per 100 Males in Stonecrest?
There are 119.34 Females per 100 Males in Stonecrest.
What is the Median Population Age in Stonecrest?
Median Population Age in Stonecrest is 34.5 Years.
What is the Average Family Size in Stonecrest
Average Family Size in Stonecrest is 3.7 People.
What is the Average Household Size in Stonecrest
Average Household Size in Stonecrest is 2.9 People.
How Large is the Labor Force in Stonecrest?
There are 32,440 People in the Labor Forcein in Stonecrest.
What is the Percentage of People in the Labor Force in Stonecrest?
68.5% of People are in the Labor Force in Stonecrest.
What is the Unemployment Rate in Stonecrest?
Unemployment Rate in Stonecrest is 8.6%.