Florence, KY Map & Demographics
Florence Map
Florence Overview
$37,232
PER CAPITA INCOME
$78,591
AVG FAMILY INCOME
$67,352
AVG HOUSEHOLD INCOME
22.2%
WAGE / INCOME GAP [ % ]
77.8¢/ $1
WAGE / INCOME GAP [ $ ]
0.39
INEQUALITY / GINI INDEX
32,056
TOTAL POPULATION
16,012
MALE POPULATION
16,044
FEMALE POPULATION
99.80
MALES / 100 FEMALES
100.20
FEMALES / 100 MALES
39.3
MEDIAN AGE
3.0
AVG FAMILY SIZE
2.3
AVG HOUSEHOLD SIZE
16,973
LABOR FORCE [ PEOPLE ]
65.0%
PERCENT IN LABOR FORCE
2.8%
UNEMPLOYMENT RATE
Florence Zip Codes
Florence Area Codes
Income in Florence
Income Overview in Florence
Per Capita Income in Florence is $37,232, while median incomes of families and households are $78,591 and $67,352 respectively.
| Characteristic | Number | Measure |
| Per Capita Income | 32,056 | $37,232 |
| Median Family Income | 7,838 | $78,591 |
| Mean Family Income | 7,838 | $95,947 |
| Median Household Income | 13,760 | $67,352 |
| Mean Household Income | 13,760 | $83,578 |
| Income Deficit | 7,838 | $0 |
| Wage / Income Gap (%) | 32,056 | 22.15% |
| Wage / Income Gap ($) | 32,056 | 77.85¢ per $1 |
| Gini / Inequality Index | 32,056 | 0.39 |
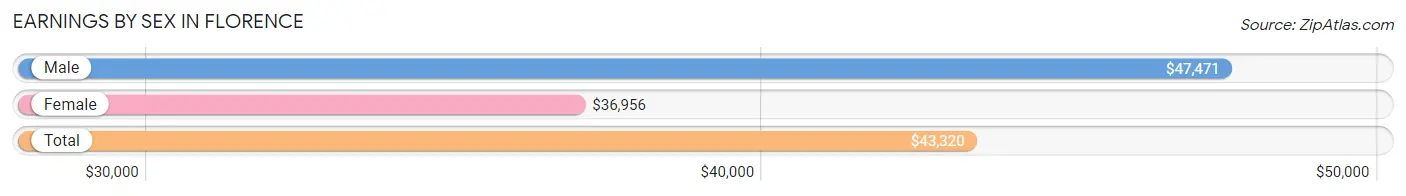
Earnings by Sex in Florence
Average Earnings in Florence are $43,320, $47,471 for men and $36,956 for women, a difference of 22.2%.
| Sex | Number | Average Earnings |
| Male | 9,419 (53.5%) | $47,471 |
| Female | 8,185 (46.5%) | $36,956 |
| Total | 17,604 (100.0%) | $43,320 |
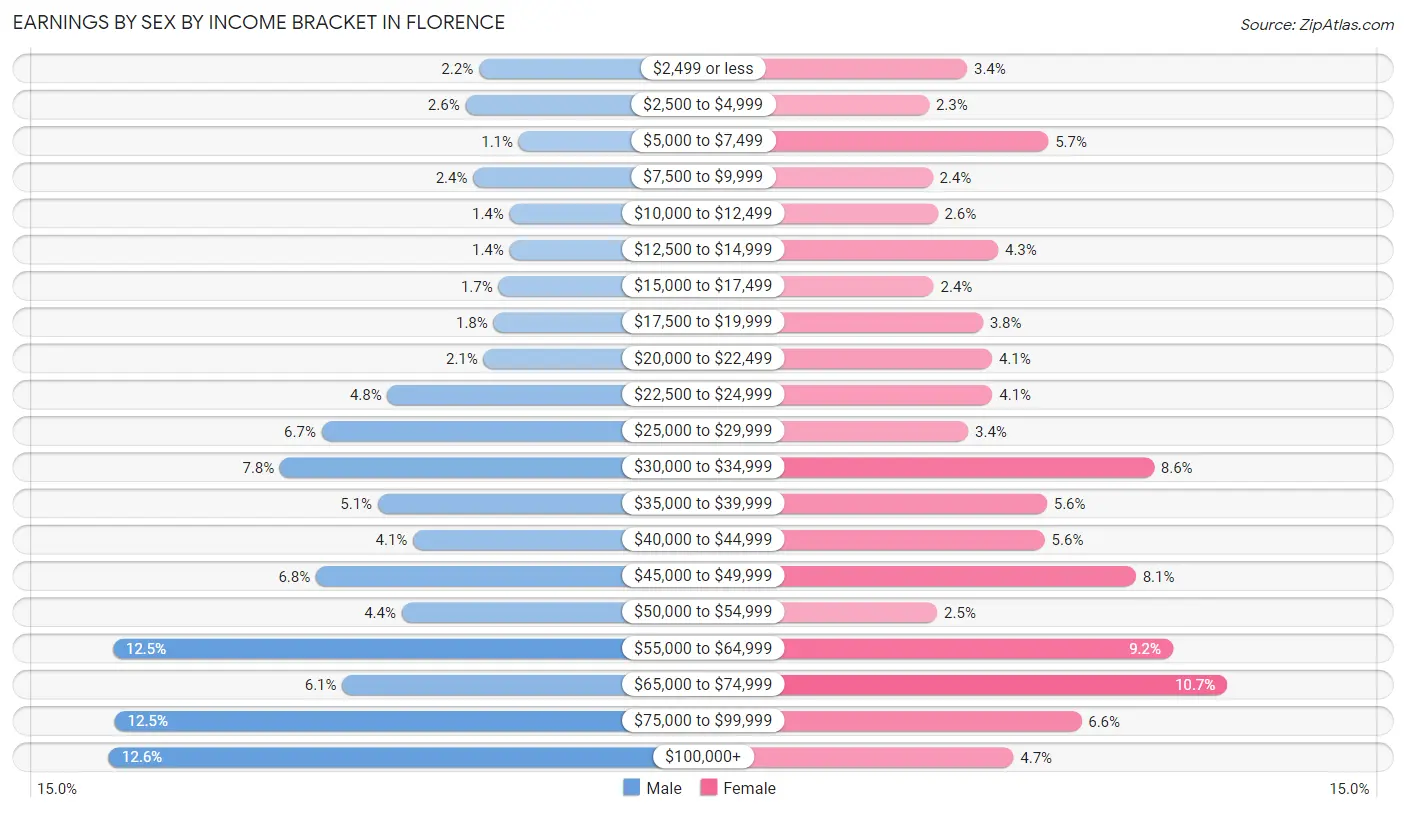
Earnings by Sex by Income Bracket in Florence
The most common earnings brackets in Florence are $100,000+ for men (1,190 | 12.6%) and $65,000 to $74,999 for women (875 | 10.7%).
| Income | Male | Female |
| $2,499 or less | 210 (2.2%) | 277 (3.4%) |
| $2,500 to $4,999 | 246 (2.6%) | 189 (2.3%) |
| $5,000 to $7,499 | 105 (1.1%) | 463 (5.7%) |
| $7,500 to $9,999 | 225 (2.4%) | 197 (2.4%) |
| $10,000 to $12,499 | 129 (1.4%) | 209 (2.5%) |
| $12,500 to $14,999 | 129 (1.4%) | 348 (4.3%) |
| $15,000 to $17,499 | 158 (1.7%) | 200 (2.4%) |
| $17,500 to $19,999 | 171 (1.8%) | 313 (3.8%) |
| $20,000 to $22,499 | 198 (2.1%) | 334 (4.1%) |
| $22,500 to $24,999 | 452 (4.8%) | 335 (4.1%) |
| $25,000 to $29,999 | 626 (6.7%) | 279 (3.4%) |
| $30,000 to $34,999 | 737 (7.8%) | 706 (8.6%) |
| $35,000 to $39,999 | 478 (5.1%) | 460 (5.6%) |
| $40,000 to $44,999 | 384 (4.1%) | 455 (5.6%) |
| $45,000 to $49,999 | 641 (6.8%) | 665 (8.1%) |
| $50,000 to $54,999 | 414 (4.4%) | 208 (2.5%) |
| $55,000 to $64,999 | 1,179 (12.5%) | 750 (9.2%) |
| $65,000 to $74,999 | 572 (6.1%) | 875 (10.7%) |
| $75,000 to $99,999 | 1,175 (12.5%) | 539 (6.6%) |
| $100,000+ | 1,190 (12.6%) | 383 (4.7%) |
| Total | 9,419 (100.0%) | 8,185 (100.0%) |
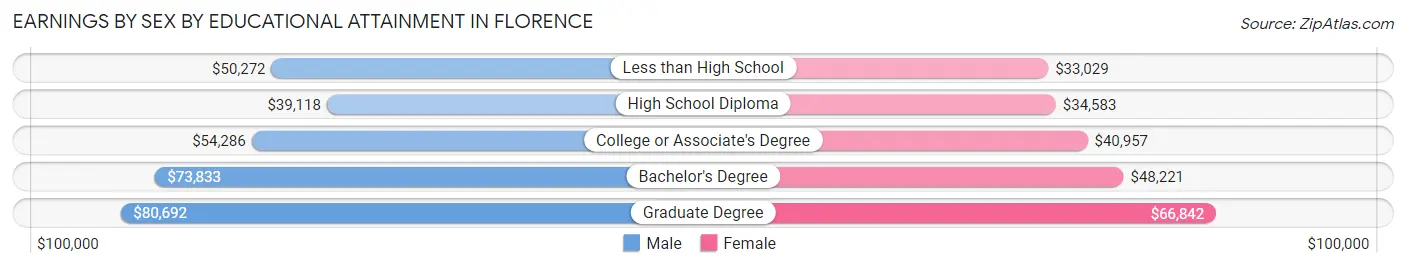
Earnings by Sex by Educational Attainment in Florence
Average earnings in Florence are $54,987 for men and $42,009 for women, a difference of 23.6%. Men with an educational attainment of graduate degree enjoy the highest average annual earnings of $80,692, while those with high school diploma education earn the least with $39,118. Women with an educational attainment of graduate degree earn the most with the average annual earnings of $66,842, while those with less than high school education have the smallest earnings of $33,029.
| Educational Attainment | Male Income | Female Income |
| Less than High School | $50,272 | $33,029 |
| High School Diploma | $39,118 | $34,583 |
| College or Associate's Degree | $54,286 | $40,957 |
| Bachelor's Degree | $73,833 | $48,221 |
| Graduate Degree | $80,692 | $66,842 |
| Total | $54,987 | $42,009 |
Family Income in Florence
Family Income Brackets in Florence
According to the Florence family income data, there are 1,818 families falling into the $100,000 to $149,999 income range, which is the most common income bracket and makes up 23.2% of all families. Conversely, the less than $10,000 income bracket is the least frequent group with only 31 families (0.4%) belonging to this category.
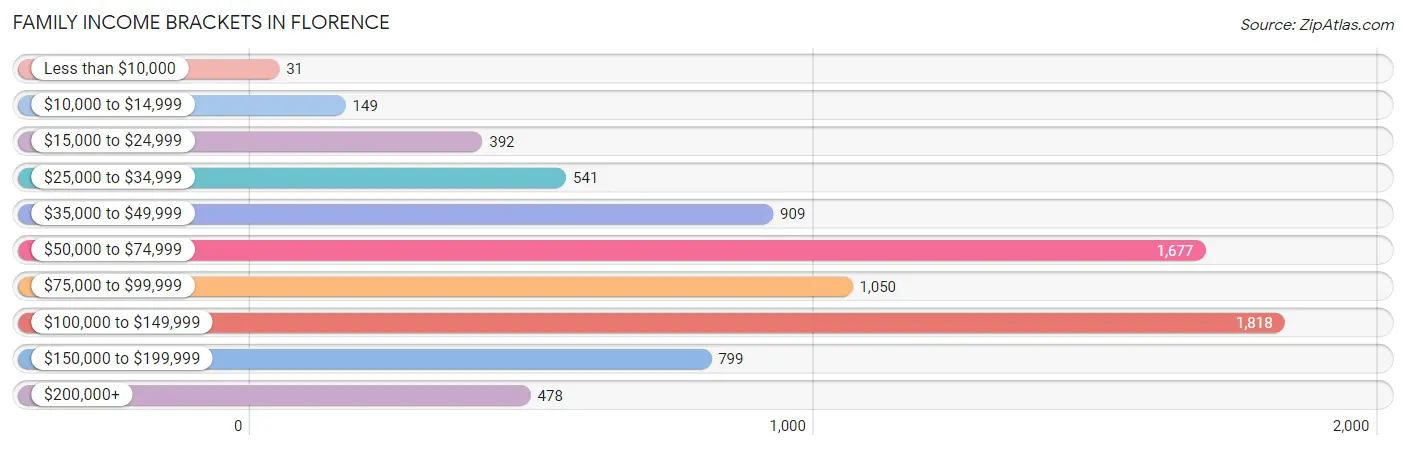
| Income Bracket | # Families | % Families |
| Less than $10,000 | 31 | 0.4% |
| $10,000 to $14,999 | 149 | 1.9% |
| $15,000 to $24,999 | 392 | 5.0% |
| $25,000 to $34,999 | 541 | 6.9% |
| $35,000 to $49,999 | 909 | 11.6% |
| $50,000 to $74,999 | 1,677 | 21.4% |
| $75,000 to $99,999 | 1,050 | 13.4% |
| $100,000 to $149,999 | 1,818 | 23.2% |
| $150,000 to $199,999 | 799 | 10.2% |
| $200,000+ | 478 | 6.1% |
Family Income by Famaliy Size in Florence
6-person families (148 | 1.9%) account for the highest median family income in Florence with $167,500 per family, while 2-person families (4,354 | 55.5%) have the highest median income of $36,208 per family member.
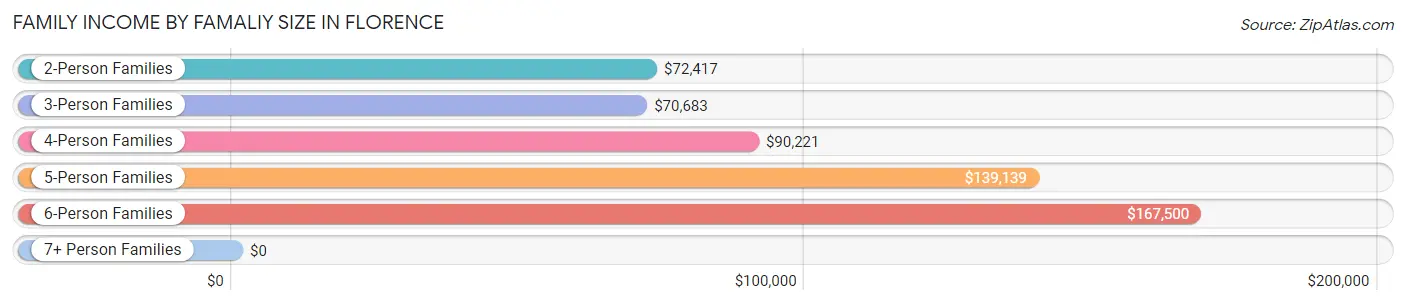
| Income Bracket | # Families | Median Income |
| 2-Person Families | 4,354 (55.5%) | $72,417 |
| 3-Person Families | 1,641 (20.9%) | $70,683 |
| 4-Person Families | 1,165 (14.9%) | $90,221 |
| 5-Person Families | 480 (6.1%) | $139,139 |
| 6-Person Families | 148 (1.9%) | $167,500 |
| 7+ Person Families | 50 (0.6%) | $0 |
| Total | 7,838 (100.0%) | $78,591 |
Family Income by Number of Earners in Florence
The median family income in Florence is $78,591, with families comprising 3+ earners (771) having the highest median family income of $140,917, while families with 1 earner (2,858) have the lowest median family income of $56,377, accounting for 9.8% and 36.5% of families, respectively.
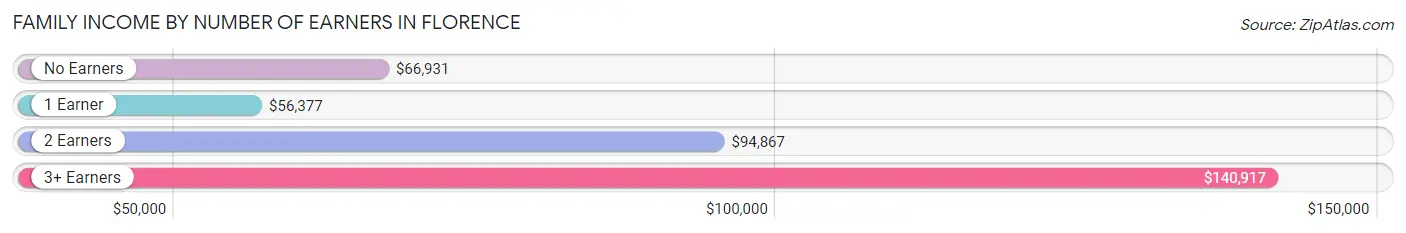
| Number of Earners | # Families | Median Income |
| No Earners | 1,191 (15.2%) | $66,931 |
| 1 Earner | 2,858 (36.5%) | $56,377 |
| 2 Earners | 3,018 (38.5%) | $94,867 |
| 3+ Earners | 771 (9.8%) | $140,917 |
| Total | 7,838 (100.0%) | $78,591 |
Household Income in Florence
Household Income Brackets in Florence
With 3,068 households falling in the category, the $50,000 to $74,999 income range is the most frequent in Florence, accounting for 22.3% of all households. In contrast, only 206 households (1.5%) fall into the less than $10,000 income bracket, making it the least populous group.
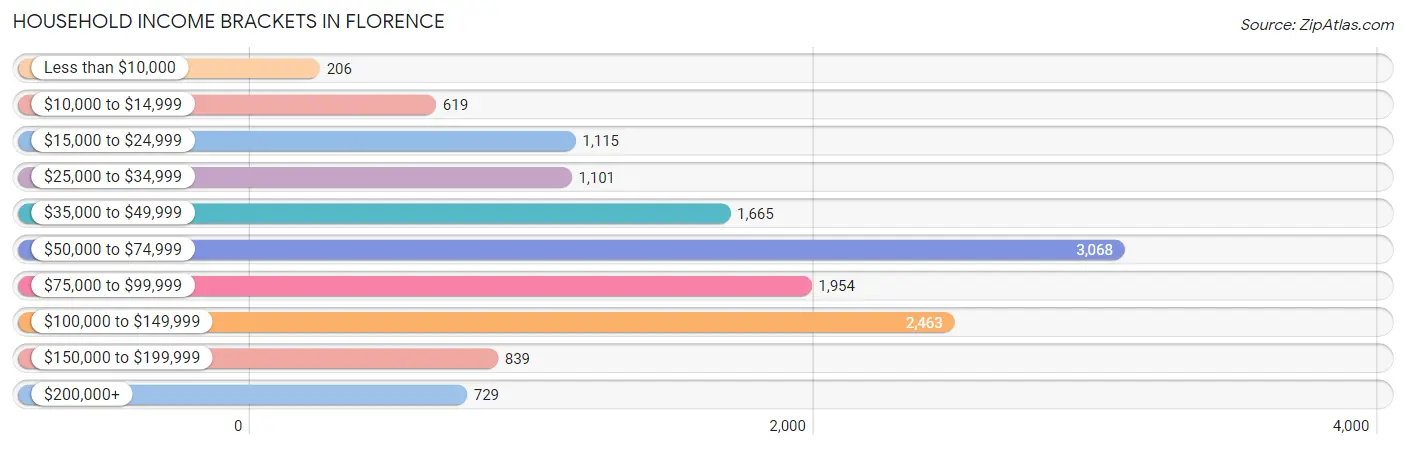
| Income Bracket | # Households | % Households |
| Less than $10,000 | 206 | 1.5% |
| $10,000 to $14,999 | 619 | 4.5% |
| $15,000 to $24,999 | 1,115 | 8.1% |
| $25,000 to $34,999 | 1,101 | 8.0% |
| $35,000 to $49,999 | 1,665 | 12.1% |
| $50,000 to $74,999 | 3,068 | 22.3% |
| $75,000 to $99,999 | 1,954 | 14.2% |
| $100,000 to $149,999 | 2,463 | 17.9% |
| $150,000 to $199,999 | 839 | 6.1% |
| $200,000+ | 729 | 5.3% |
Household Income by Householder Age in Florence
The median household income in Florence is $67,352, with the highest median household income of $79,550 found in the 45 to 64 years age bracket for the primary householder. A total of 4,689 households (34.1%) fall into this category. Meanwhile, the 65+ years age bracket for the primary householder has the lowest median household income of $53,929, with 3,974 households (28.9%) in this group.
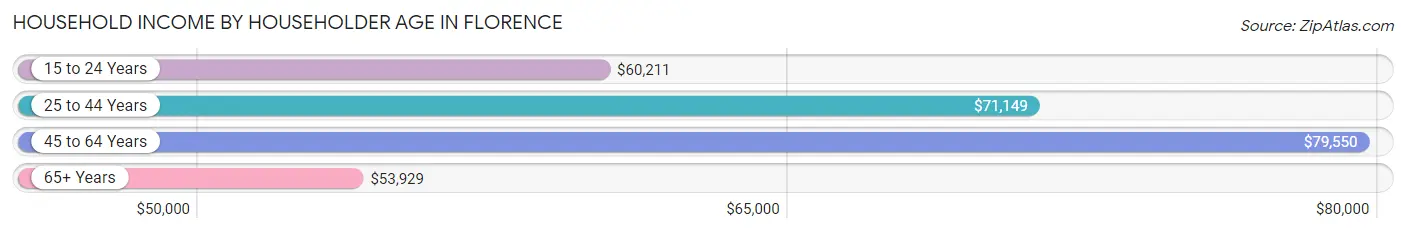
| Income Bracket | # Households | Median Income |
| 15 to 24 Years | 385 (2.8%) | $60,211 |
| 25 to 44 Years | 4,712 (34.2%) | $71,149 |
| 45 to 64 Years | 4,689 (34.1%) | $79,550 |
| 65+ Years | 3,974 (28.9%) | $53,929 |
| Total | 13,760 (100.0%) | $67,352 |
Poverty in Florence
Income Below Poverty by Sex and Age in Florence
With 8.5% poverty level for males and 6.8% for females among the residents of Florence, 6 to 11 year old males and 45 to 54 year old females are the most vulnerable to poverty, with 304 males (29.5%) and 200 females (11.5%) in their respective age groups living below the poverty level.
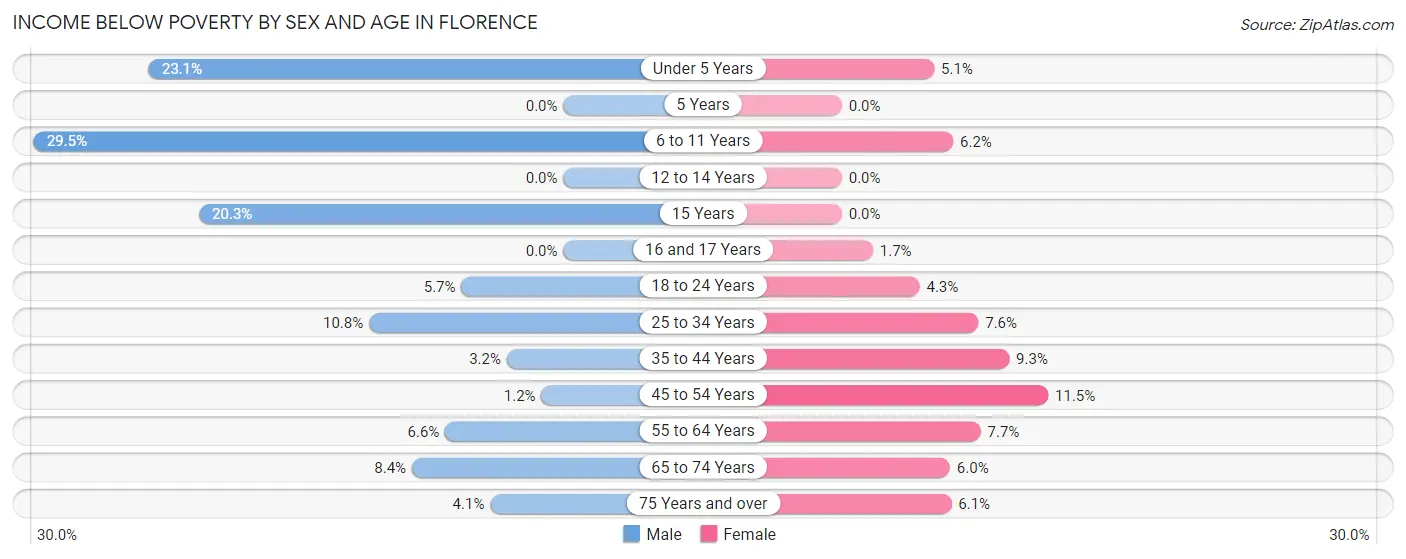
| Age Bracket | Male | Female |
| Under 5 Years | 232 (23.1%) | 49 (5.1%) |
| 5 Years | 0 (0.0%) | 0 (0.0%) |
| 6 to 11 Years | 304 (29.5%) | 46 (6.2%) |
| 12 to 14 Years | 0 (0.0%) | 0 (0.0%) |
| 15 Years | 56 (20.3%) | 0 (0.0%) |
| 16 and 17 Years | 0 (0.0%) | 12 (1.7%) |
| 18 to 24 Years | 89 (5.7%) | 45 (4.3%) |
| 25 to 34 Years | 289 (10.8%) | 154 (7.6%) |
| 35 to 44 Years | 61 (3.2%) | 214 (9.3%) |
| 45 to 54 Years | 25 (1.2%) | 200 (11.5%) |
| 55 to 64 Years | 134 (6.6%) | 133 (7.7%) |
| 65 to 74 Years | 127 (8.4%) | 107 (6.0%) |
| 75 Years and over | 34 (4.1%) | 94 (6.1%) |
| Total | 1,351 (8.5%) | 1,054 (6.8%) |
Income Above Poverty by Sex and Age in Florence
According to the poverty statistics in Florence, males aged 5 years and females aged 5 years are the age groups that are most secure financially, with 100.0% of males and 100.0% of females in these age groups living above the poverty line.
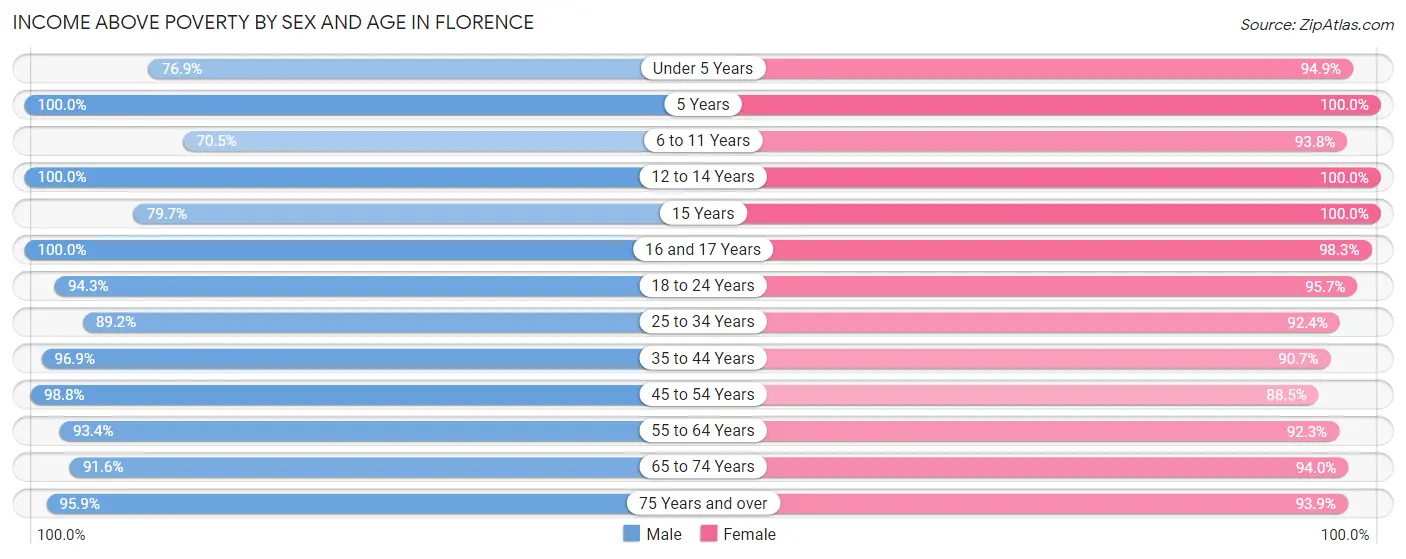
| Age Bracket | Male | Female |
| Under 5 Years | 773 (76.9%) | 905 (94.9%) |
| 5 Years | 155 (100.0%) | 147 (100.0%) |
| 6 to 11 Years | 727 (70.5%) | 696 (93.8%) |
| 12 to 14 Years | 450 (100.0%) | 630 (100.0%) |
| 15 Years | 220 (79.7%) | 289 (100.0%) |
| 16 and 17 Years | 325 (100.0%) | 680 (98.3%) |
| 18 to 24 Years | 1,478 (94.3%) | 995 (95.7%) |
| 25 to 34 Years | 2,381 (89.2%) | 1,872 (92.4%) |
| 35 to 44 Years | 1,875 (96.9%) | 2,083 (90.7%) |
| 45 to 54 Years | 2,029 (98.8%) | 1,540 (88.5%) |
| 55 to 64 Years | 1,902 (93.4%) | 1,588 (92.3%) |
| 65 to 74 Years | 1,379 (91.6%) | 1,670 (94.0%) |
| 75 Years and over | 801 (95.9%) | 1,448 (93.9%) |
| Total | 14,495 (91.5%) | 14,543 (93.2%) |
Income Below Poverty Among Married-Couple Families in Florence
The poverty statistics for married-couple families in Florence show that 0.7% or 35 of the total 5,024 families live below the poverty line. Families with no children have the highest poverty rate of 1.1%, comprising of 35 families. On the other hand, families with 1 or 2 children have the lowest poverty rate of 0.0%, which includes 0 families.
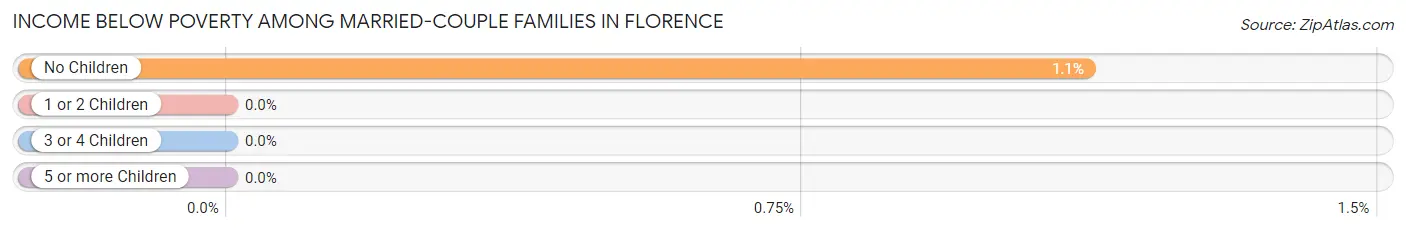
| Children | Above Poverty | Below Poverty |
| No Children | 3,093 (98.9%) | 35 (1.1%) |
| 1 or 2 Children | 1,664 (100.0%) | 0 (0.0%) |
| 3 or 4 Children | 232 (100.0%) | 0 (0.0%) |
| 5 or more Children | 0 (0.0%) | 0 (0.0%) |
| Total | 4,989 (99.3%) | 35 (0.7%) |
Income Below Poverty Among Single-Parent Households in Florence
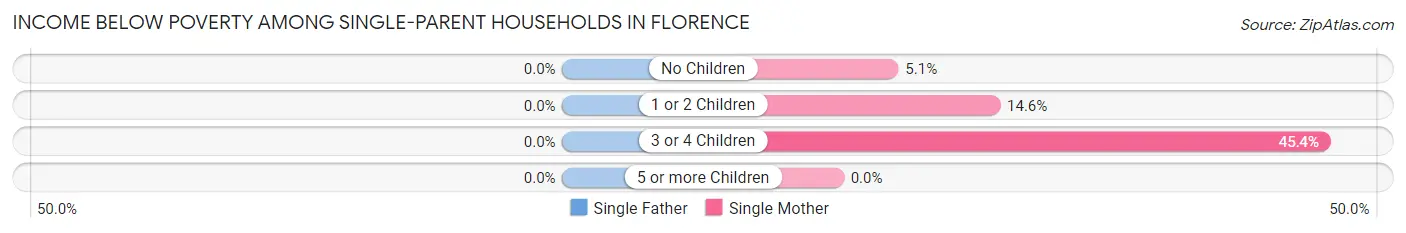
| Children | Single Father | Single Mother |
| No Children | 0 (0.0%) | 47 (5.1%) |
| 1 or 2 Children | 0 (0.0%) | 155 (14.6%) |
| 3 or 4 Children | 0 (0.0%) | 103 (45.4%) |
| 5 or more Children | 0 (0.0%) | 0 (0.0%) |
| Total | 0 (0.0%) | 305 (13.8%) |
Income Below Poverty Among Married-Couple vs Single-Parent Households in Florence
The poverty data for Florence shows that 35 of the married-couple family households (0.7%) and 305 of the single-parent households (10.8%) are living below the poverty level. Within the married-couple family households, those with no children have the highest poverty rate, with 35 households (1.1%) falling below the poverty line. Among the single-parent households, those with 3 or 4 children have the highest poverty rate, with 103 household (41.7%) living below poverty.
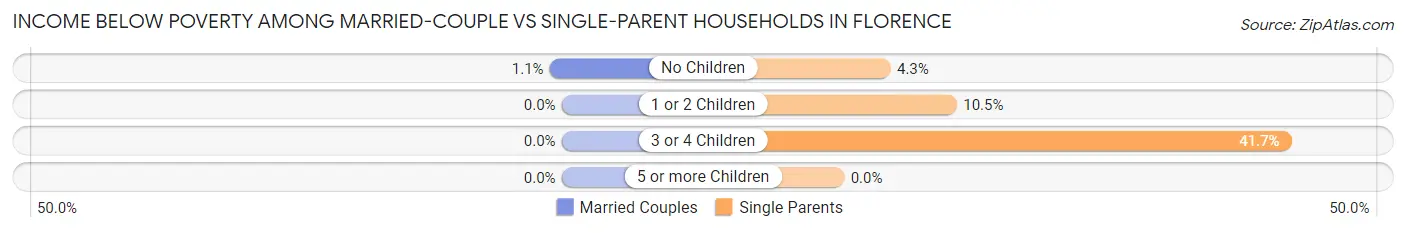
| Children | Married-Couple Families | Single-Parent Households |
| No Children | 35 (1.1%) | 47 (4.3%) |
| 1 or 2 Children | 0 (0.0%) | 155 (10.5%) |
| 3 or 4 Children | 0 (0.0%) | 103 (41.7%) |
| 5 or more Children | 0 (0.0%) | 0 (0.0%) |
| Total | 35 (0.7%) | 305 (10.8%) |
Race in Florence
The most populous races in Florence are White / Caucasian (26,792 | 83.6%), Black / African American (1,922 | 6.0%), and Hispanic or Latino (1,516 | 4.7%).
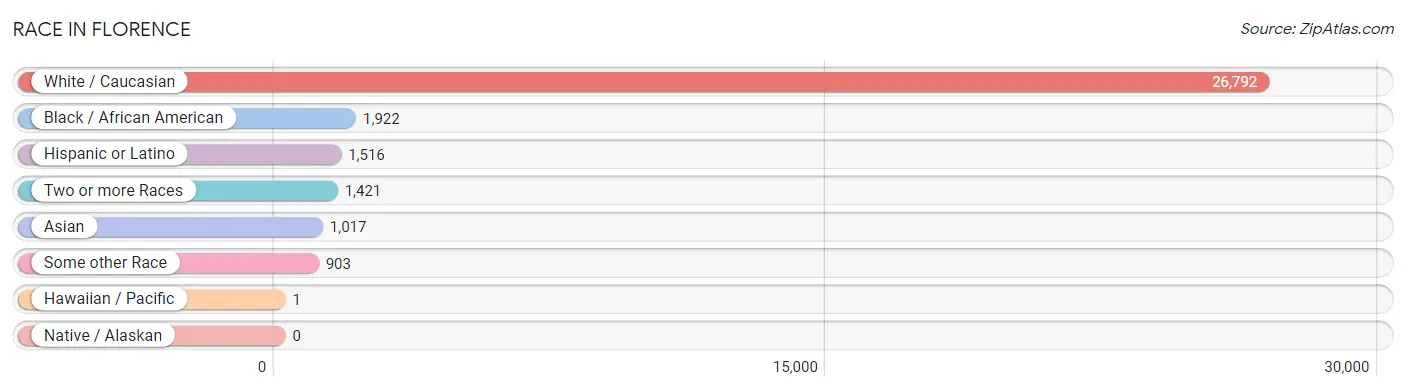
| Race | # Population | % Population |
| Asian | 1,017 | 3.2% |
| Black / African American | 1,922 | 6.0% |
| Hawaiian / Pacific | 1 | 0.0% |
| Hispanic or Latino | 1,516 | 4.7% |
| Native / Alaskan | 0 | 0.0% |
| White / Caucasian | 26,792 | 83.6% |
| Two or more Races | 1,421 | 4.4% |
| Some other Race | 903 | 2.8% |
| Total | 32,056 | 100.0% |
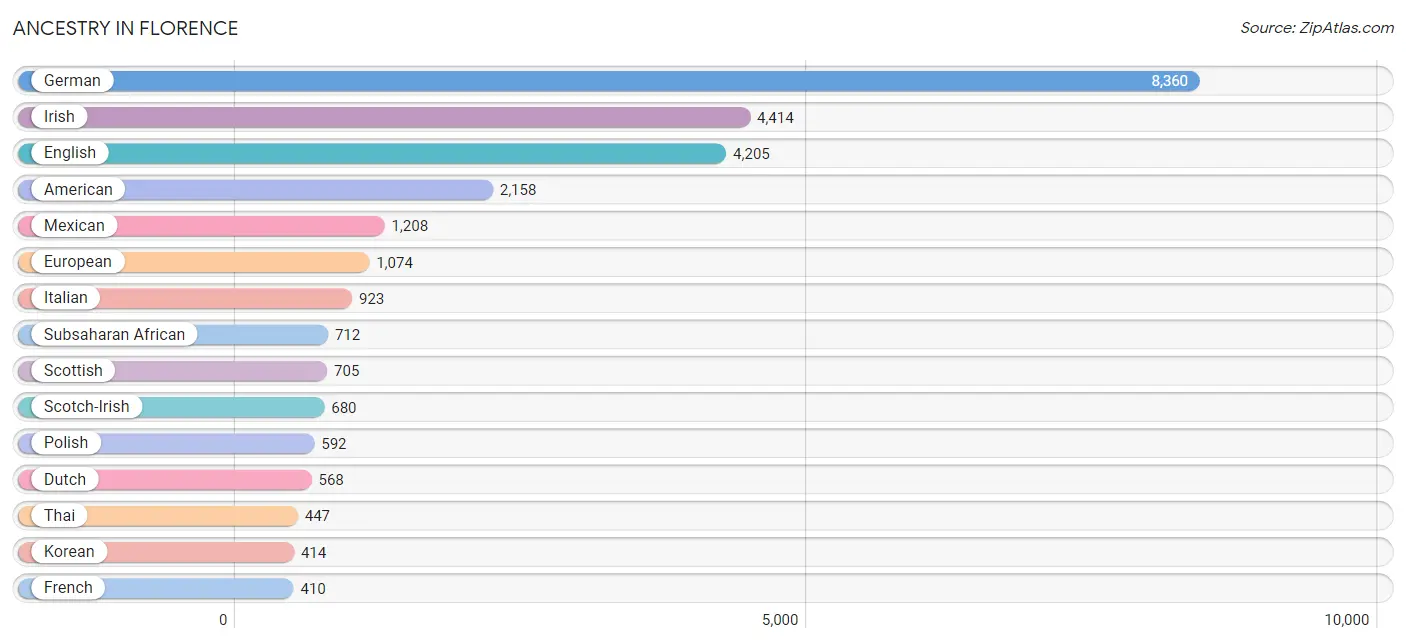
Ancestry in Florence
The most populous ancestries reported in Florence are German (8,360 | 26.1%), Irish (4,414 | 13.8%), English (4,205 | 13.1%), American (2,158 | 6.7%), and Mexican (1,208 | 3.8%), together accounting for 63.5% of all Florence residents.
| Ancestry | # Population | % Population |
| African | 386 | 1.2% |
| Albanian | 137 | 0.4% |
| American | 2,158 | 6.7% |
| Arab | 90 | 0.3% |
| Australian | 35 | 0.1% |
| Austrian | 122 | 0.4% |
| Basque | 29 | 0.1% |
| Bhutanese | 53 | 0.2% |
| Blackfeet | 9 | 0.0% |
| British | 77 | 0.2% |
| Burmese | 31 | 0.1% |
| Canadian | 35 | 0.1% |
| Central American | 145 | 0.4% |
| Cherokee | 18 | 0.1% |
| Choctaw | 3 | 0.0% |
| Colombian | 22 | 0.1% |
| Croatian | 46 | 0.1% |
| Dutch | 568 | 1.8% |
| Eastern European | 31 | 0.1% |
| Ecuadorian | 14 | 0.0% |
| English | 4,205 | 13.1% |
| European | 1,074 | 3.4% |
| Filipino | 42 | 0.1% |
| French | 410 | 1.3% |
| French Canadian | 142 | 0.4% |
| German | 8,360 | 26.1% |
| Greek | 13 | 0.0% |
| Guatemalan | 106 | 0.3% |
| Honduran | 23 | 0.1% |
| Hungarian | 119 | 0.4% |
| Indian (Asian) | 143 | 0.4% |
| Irish | 4,414 | 13.8% |
| Iroquois | 8 | 0.0% |
| Italian | 923 | 2.9% |
| Jamaican | 20 | 0.1% |
| Japanese | 34 | 0.1% |
| Korean | 414 | 1.3% |
| Mexican | 1,208 | 3.8% |
| Mongolian | 21 | 0.1% |
| Moroccan | 72 | 0.2% |
| Native Hawaiian | 37 | 0.1% |
| Northern European | 19 | 0.1% |
| Norwegian | 81 | 0.3% |
| Panamanian | 16 | 0.1% |
| Polish | 592 | 1.8% |
| Portuguese | 11 | 0.0% |
| Puerto Rican | 100 | 0.3% |
| Russian | 47 | 0.2% |
| Scandinavian | 42 | 0.1% |
| Scotch-Irish | 680 | 2.1% |
| Scottish | 705 | 2.2% |
| Serbian | 36 | 0.1% |
| Slovene | 24 | 0.1% |
| South American | 36 | 0.1% |
| Spanish | 18 | 0.1% |
| Sri Lankan | 278 | 0.9% |
| Subsaharan African | 712 | 2.2% |
| Swedish | 157 | 0.5% |
| Swiss | 94 | 0.3% |
| Thai | 447 | 1.4% |
| Ukrainian | 10 | 0.0% |
| Welsh | 387 | 1.2% |
| Yugoslavian | 19 | 0.1% | View All 63 Rows |
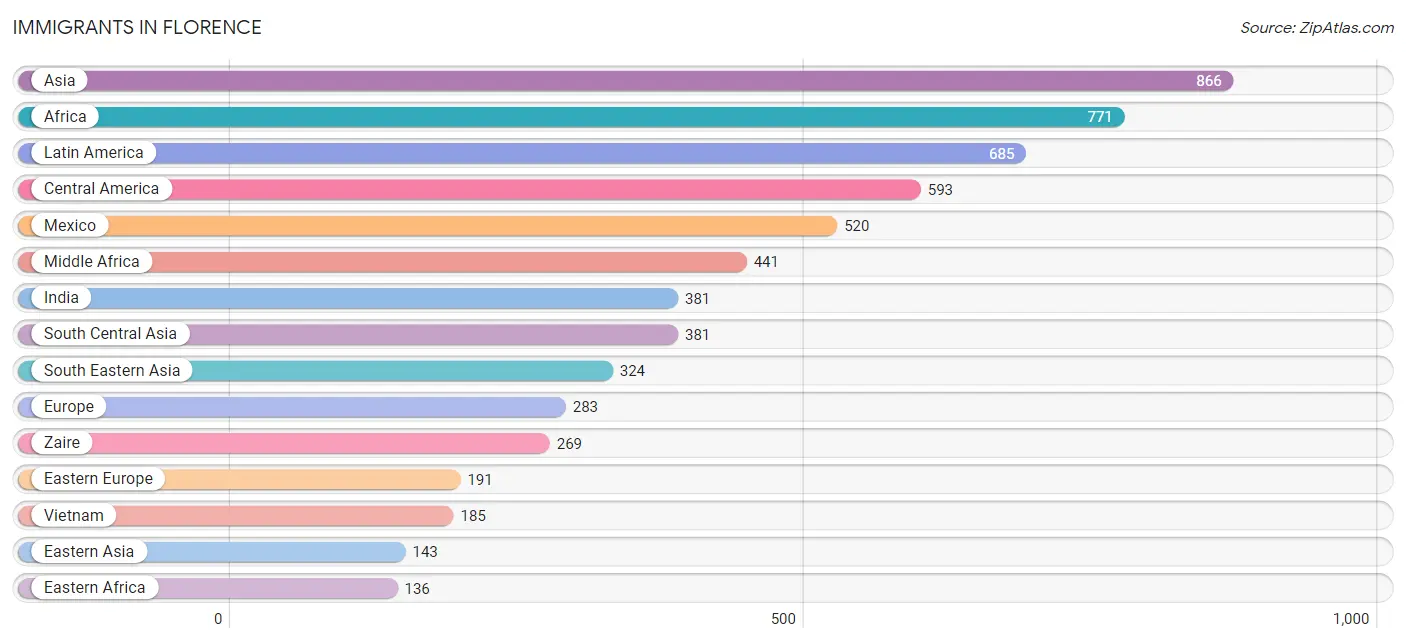
Immigrants in Florence
The most numerous immigrant groups reported in Florence came from Asia (866 | 2.7%), Africa (771 | 2.4%), Latin America (685 | 2.1%), Central America (593 | 1.8%), and Mexico (520 | 1.6%), together accounting for 10.7% of all Florence residents.
| Immigration Origin | # Population | % Population |
| Africa | 771 | 2.4% |
| Albania | 15 | 0.1% |
| Asia | 866 | 2.7% |
| Australia | 35 | 0.1% |
| Bosnia and Herzegovina | 19 | 0.1% |
| Brazil | 27 | 0.1% |
| Cambodia | 14 | 0.0% |
| Cameroon | 93 | 0.3% |
| Canada | 45 | 0.1% |
| Caribbean | 20 | 0.1% |
| Central America | 593 | 1.8% |
| China | 114 | 0.4% |
| Colombia | 22 | 0.1% |
| Eastern Africa | 136 | 0.4% |
| Eastern Asia | 143 | 0.4% |
| Eastern Europe | 191 | 0.6% |
| Ecuador | 14 | 0.0% |
| Europe | 283 | 0.9% |
| Germany | 18 | 0.1% |
| Guatemala | 34 | 0.1% |
| Honduras | 23 | 0.1% |
| India | 381 | 1.2% |
| Indonesia | 1 | 0.0% |
| Iraq | 18 | 0.1% |
| Jamaica | 20 | 0.1% |
| Japan | 29 | 0.1% |
| Latin America | 685 | 2.1% |
| Latvia | 10 | 0.0% |
| Malaysia | 21 | 0.1% |
| Mexico | 520 | 1.6% |
| Middle Africa | 441 | 1.4% |
| Morocco | 72 | 0.2% |
| Netherlands | 29 | 0.1% |
| Northern Africa | 72 | 0.2% |
| Northern Europe | 45 | 0.1% |
| Norway | 3 | 0.0% |
| Oceania | 35 | 0.1% |
| Panama | 16 | 0.1% |
| Philippines | 103 | 0.3% |
| Senegal | 33 | 0.1% |
| Somalia | 109 | 0.3% |
| South America | 72 | 0.2% |
| South Central Asia | 381 | 1.2% |
| South Eastern Asia | 324 | 1.0% |
| Taiwan | 42 | 0.1% |
| Venezuela | 9 | 0.0% |
| Vietnam | 185 | 0.6% |
| Western Africa | 71 | 0.2% |
| Western Asia | 18 | 0.1% |
| Western Europe | 47 | 0.2% |
| Zaire | 269 | 0.8% | View All 51 Rows |
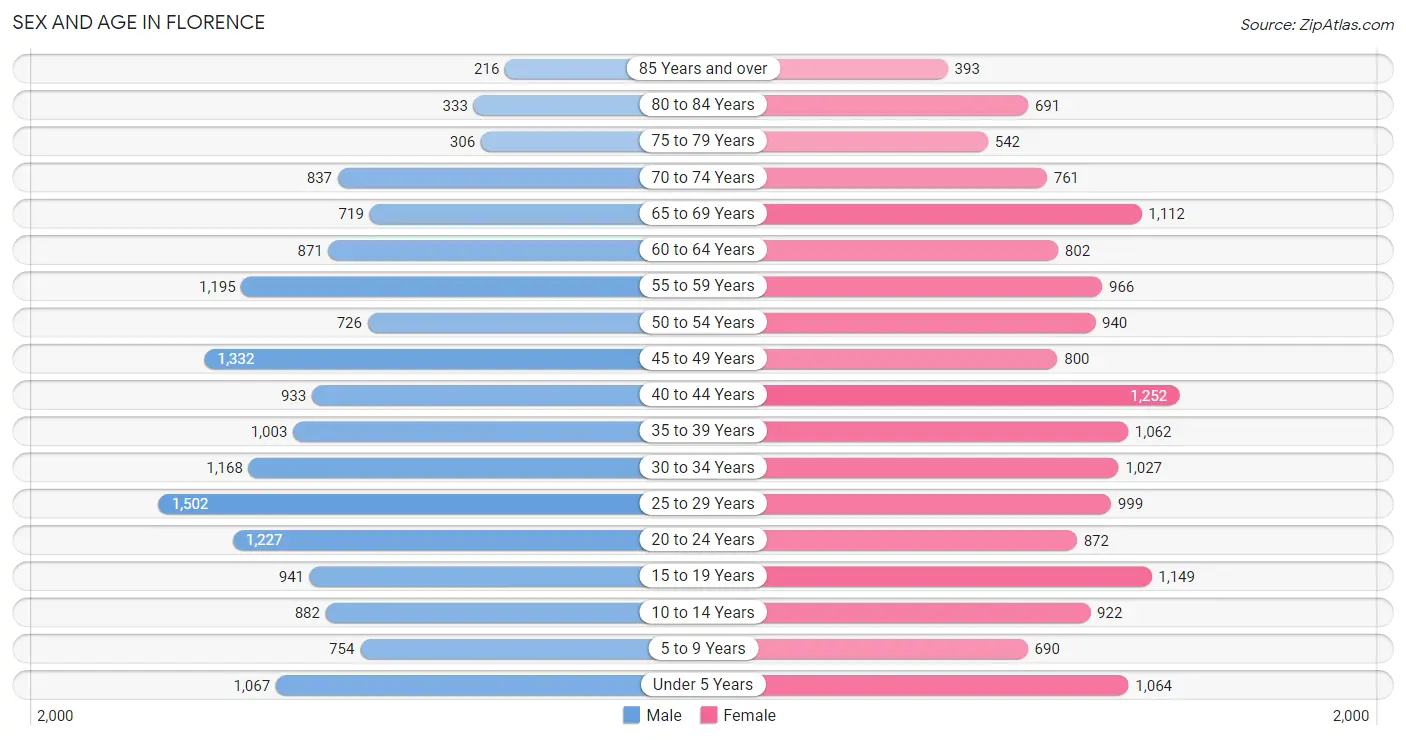
Sex and Age in Florence
Sex and Age in Florence
The most populous age groups in Florence are 25 to 29 Years (1,502 | 9.4%) for men and 40 to 44 Years (1,252 | 7.8%) for women.
| Age Bracket | Male | Female |
| Under 5 Years | 1,067 (6.7%) | 1,064 (6.6%) |
| 5 to 9 Years | 754 (4.7%) | 690 (4.3%) |
| 10 to 14 Years | 882 (5.5%) | 922 (5.8%) |
| 15 to 19 Years | 941 (5.9%) | 1,149 (7.2%) |
| 20 to 24 Years | 1,227 (7.7%) | 872 (5.4%) |
| 25 to 29 Years | 1,502 (9.4%) | 999 (6.2%) |
| 30 to 34 Years | 1,168 (7.3%) | 1,027 (6.4%) |
| 35 to 39 Years | 1,003 (6.3%) | 1,062 (6.6%) |
| 40 to 44 Years | 933 (5.8%) | 1,252 (7.8%) |
| 45 to 49 Years | 1,332 (8.3%) | 800 (5.0%) |
| 50 to 54 Years | 726 (4.5%) | 940 (5.9%) |
| 55 to 59 Years | 1,195 (7.5%) | 966 (6.0%) |
| 60 to 64 Years | 871 (5.4%) | 802 (5.0%) |
| 65 to 69 Years | 719 (4.5%) | 1,112 (6.9%) |
| 70 to 74 Years | 837 (5.2%) | 761 (4.7%) |
| 75 to 79 Years | 306 (1.9%) | 542 (3.4%) |
| 80 to 84 Years | 333 (2.1%) | 691 (4.3%) |
| 85 Years and over | 216 (1.3%) | 393 (2.5%) |
| Total | 16,012 (100.0%) | 16,044 (100.0%) |
Families and Households in Florence
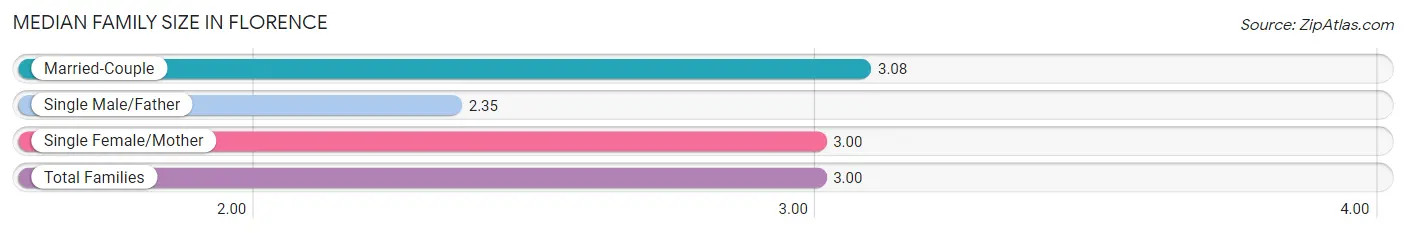
Median Family Size in Florence
The median family size in Florence is 3.00 persons per family, with married-couple families (5,024 | 64.1%) accounting for the largest median family size of 3.08 persons per family. On the other hand, single male/father families (602 | 7.7%) represent the smallest median family size with 2.35 persons per family.
| Family Type | # Families | Family Size |
| Married-Couple | 5,024 (64.1%) | 3.08 |
| Single Male/Father | 602 (7.7%) | 2.35 |
| Single Female/Mother | 2,212 (28.2%) | 3.00 |
| Total Families | 7,838 (100.0%) | 3.00 |
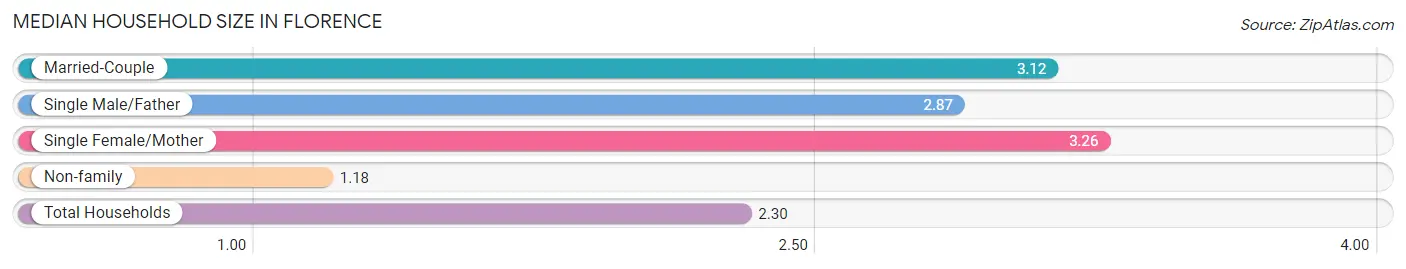
Median Household Size in Florence
The median household size in Florence is 2.30 persons per household, with single female/mother households (2,212 | 16.1%) accounting for the largest median household size of 3.26 persons per household. non-family households (5,922 | 43.0%) represent the smallest median household size with 1.18 persons per household.
| Household Type | # Households | Household Size |
| Married-Couple | 5,024 (36.5%) | 3.12 |
| Single Male/Father | 602 (4.4%) | 2.87 |
| Single Female/Mother | 2,212 (16.1%) | 3.26 |
| Non-family | 5,922 (43.0%) | 1.18 |
| Total Households | 13,760 (100.0%) | 2.30 |
Household Size by Marriage Status in Florence
Out of a total of 13,760 households in Florence, 7,838 (57.0%) are family households, while 5,922 (43.0%) are nonfamily households. The most numerous type of family households are 2-person households, comprising 3,925, and the most common type of nonfamily households are 1-person households, comprising 5,143.
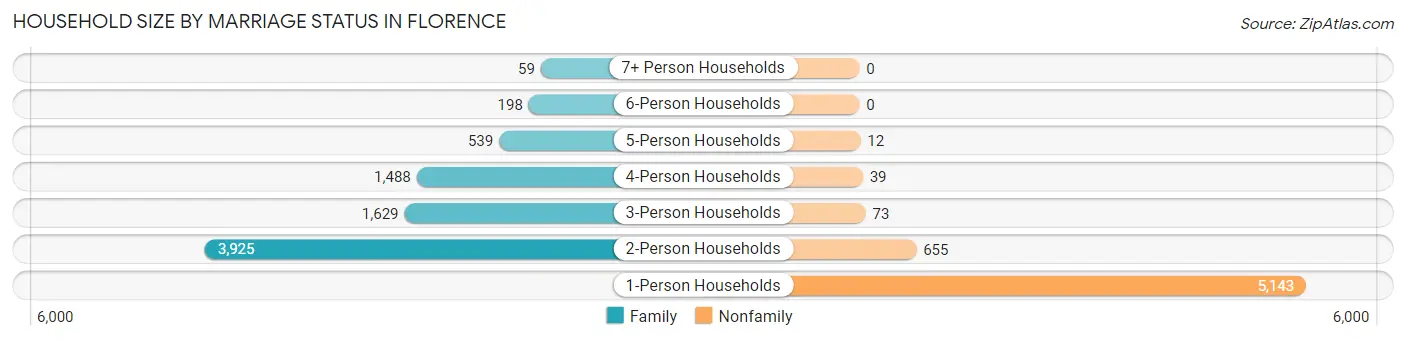
| Household Size | Family Households | Nonfamily Households |
| 1-Person Households | - | 5,143 (37.4%) |
| 2-Person Households | 3,925 (28.5%) | 655 (4.8%) |
| 3-Person Households | 1,629 (11.8%) | 73 (0.5%) |
| 4-Person Households | 1,488 (10.8%) | 39 (0.3%) |
| 5-Person Households | 539 (3.9%) | 12 (0.1%) |
| 6-Person Households | 198 (1.4%) | 0 (0.0%) |
| 7+ Person Households | 59 (0.4%) | 0 (0.0%) |
| Total | 7,838 (57.0%) | 5,922 (43.0%) |
Female Fertility in Florence
Fertility by Age in Florence
Average fertility rate in Florence is 54.0 births per 1,000 women. Women in the age bracket of 20 to 34 years have the highest fertility rate with 103.0 births per 1,000 women. Women in the age bracket of 20 to 34 years acount for 76.2% of all women with births.
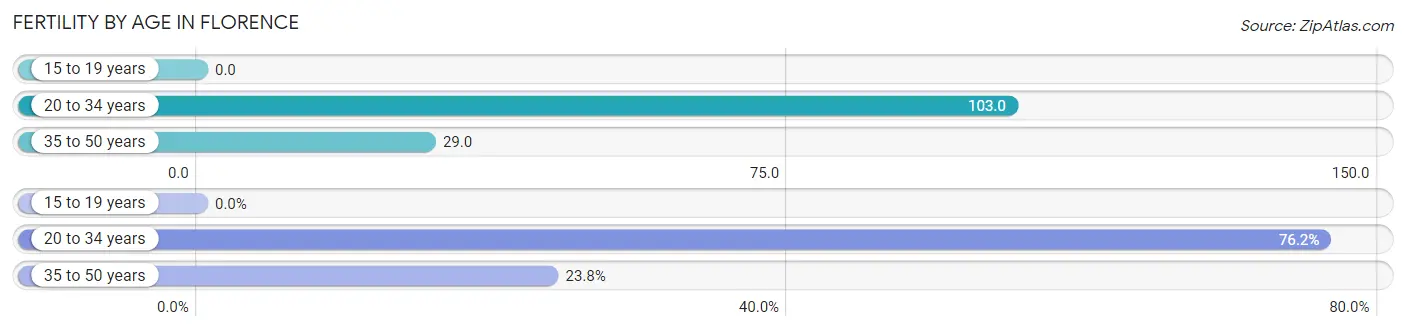
| Age Bracket | Women with Births | Births / 1,000 Women |
| 15 to 19 years | 0 (0.0%) | 0.0 |
| 20 to 34 years | 298 (76.2%) | 103.0 |
| 35 to 50 years | 93 (23.8%) | 29.0 |
| Total | 391 (100.0%) | 54.0 |
Fertility by Age by Marriage Status in Florence
60.6% of women with births (391) in Florence are married. The highest percentage of unmarried women with births falls into 20 to 34 years age bracket with 48.3% of them unmarried at the time of birth, while the lowest percentage of unmarried women with births belong to 35 to 50 years age bracket with 10.8% of them unmarried.
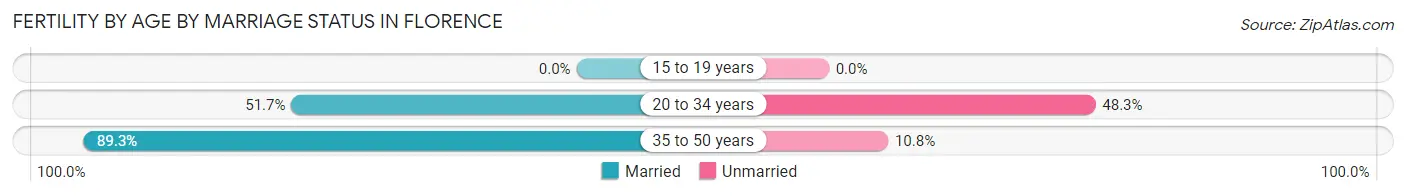
| Age Bracket | Married | Unmarried |
| 15 to 19 years | 0 (0.0%) | 0 (0.0%) |
| 20 to 34 years | 154 (51.7%) | 144 (48.3%) |
| 35 to 50 years | 83 (89.2%) | 10 (10.7%) |
| Total | 237 (60.6%) | 154 (39.4%) |
Fertility by Education in Florence
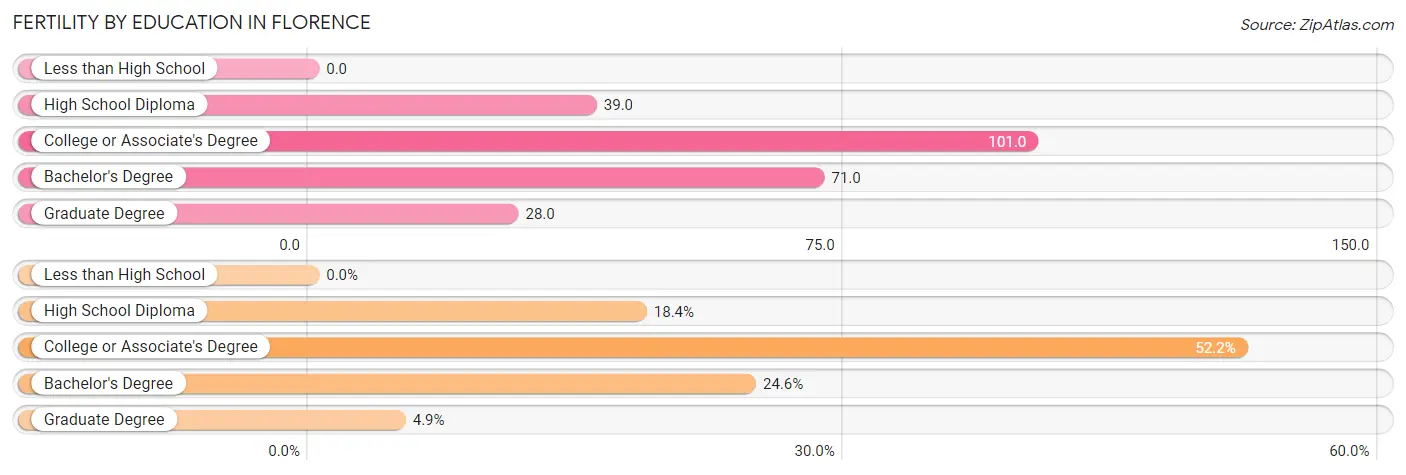
| Educational Attainment | Women with Births | Births / 1,000 Women |
| Less than High School | 0 (0.0%) | 0.0 |
| High School Diploma | 72 (18.4%) | 39.0 |
| College or Associate's Degree | 204 (52.2%) | 101.0 |
| Bachelor's Degree | 96 (24.5%) | 71.0 |
| Graduate Degree | 19 (4.9%) | 28.0 |
| Total | 391 (100.0%) | 54.0 |
Fertility by Education by Marriage Status in Florence
39.4% of women with births in Florence are unmarried. Women with the educational attainment of graduate degree are most likely to be married with 100.0% of them married at childbirth, while women with the educational attainment of high school diploma are least likely to be married with 75.0% of them unmarried at childbirth.
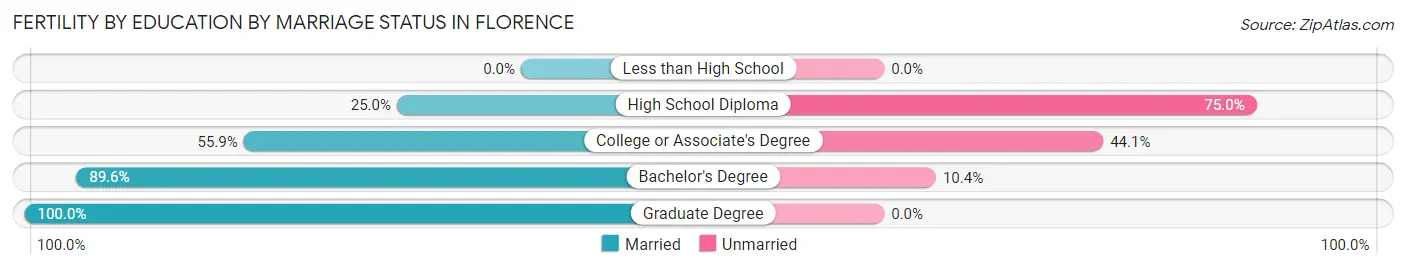
| Educational Attainment | Married | Unmarried |
| Less than High School | 0 (0.0%) | 0 (0.0%) |
| High School Diploma | 18 (25.0%) | 54 (75.0%) |
| College or Associate's Degree | 114 (55.9%) | 90 (44.1%) |
| Bachelor's Degree | 86 (89.6%) | 10 (10.4%) |
| Graduate Degree | 19 (100.0%) | 0 (0.0%) |
| Total | 237 (60.6%) | 154 (39.4%) |
Employment Characteristics in Florence
Employment by Class of Employer in Florence
Among the 16,045 employed individuals in Florence, private company employees (12,516 | 78.0%), not-for-profit organizations (1,528 | 9.5%), and local government employees (736 | 4.6%) make up the most common classes of employment.
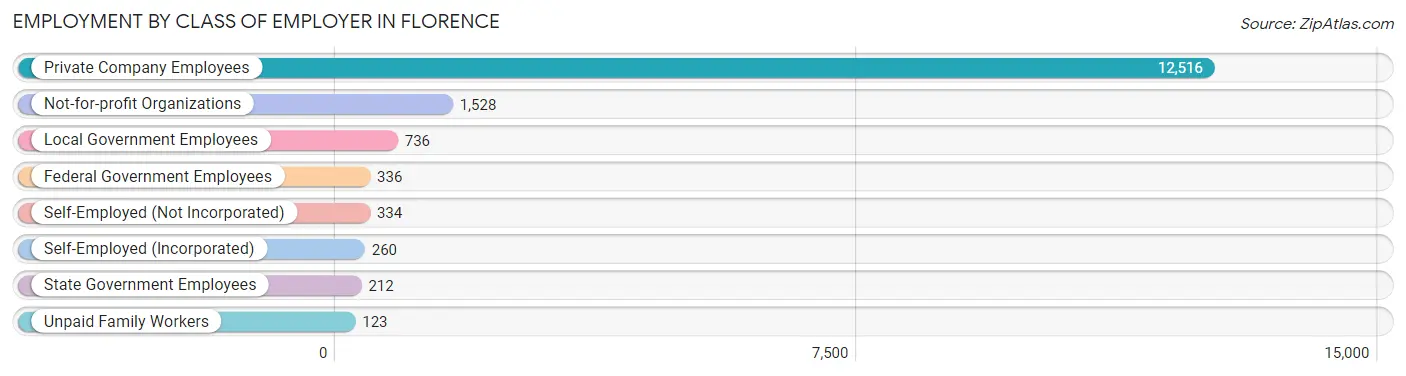
| Employer Class | # Employees | % Employees |
| Private Company Employees | 12,516 | 78.0% |
| Self-Employed (Incorporated) | 260 | 1.6% |
| Self-Employed (Not Incorporated) | 334 | 2.1% |
| Not-for-profit Organizations | 1,528 | 9.5% |
| Local Government Employees | 736 | 4.6% |
| State Government Employees | 212 | 1.3% |
| Federal Government Employees | 336 | 2.1% |
| Unpaid Family Workers | 123 | 0.8% |
| Total | 16,045 | 100.0% |
Employment Status by Age in Florence
According to the labor force statistics for Florence, out of the total population over 16 years of age (26,112), 65.0% or 16,973 individuals are in the labor force, with 2.8% or 475 of them unemployed. The age group with the highest labor force participation rate is 20 to 24 years, with 94.9% or 1,992 individuals in the labor force. Within the labor force, the 16 to 19 years age range has the highest percentage of unemployed individuals, with 7.1% or 45 of them being unemployed.
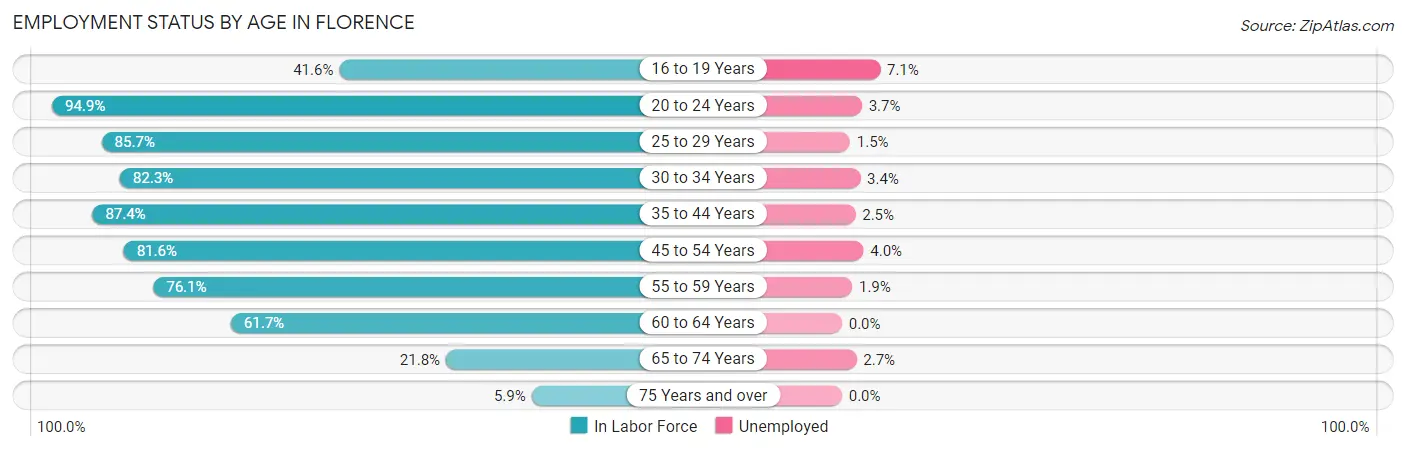
| Age Bracket | In Labor Force | Unemployed |
| 16 to 19 Years | 634 (41.6%) | 45 (7.1%) |
| 20 to 24 Years | 1,992 (94.9%) | 74 (3.7%) |
| 25 to 29 Years | 2,143 (85.7%) | 32 (1.5%) |
| 30 to 34 Years | 1,806 (82.3%) | 61 (3.4%) |
| 35 to 44 Years | 3,714 (87.4%) | 93 (2.5%) |
| 45 to 54 Years | 3,099 (81.6%) | 124 (4.0%) |
| 55 to 59 Years | 1,645 (76.1%) | 31 (1.9%) |
| 60 to 64 Years | 1,032 (61.7%) | 0 (0.0%) |
| 65 to 74 Years | 748 (21.8%) | 20 (2.7%) |
| 75 Years and over | 146 (5.9%) | 0 (0.0%) |
| Total | 16,973 (65.0%) | 475 (2.8%) |
Employment Status by Educational Attainment in Florence
According to labor force statistics for Florence, 81.1% of individuals (13,445) out of the total population between 25 and 64 years of age (16,578) are in the labor force, with 2.6% or 350 of them being unemployed. The group with the highest labor force participation rate are those with the educational attainment of bachelor's degree or higher, with 85.4% or 4,101 individuals in the labor force. Within the labor force, individuals with high school diploma education have the highest percentage of unemployment, with 6.0% or 249 of them being unemployed.
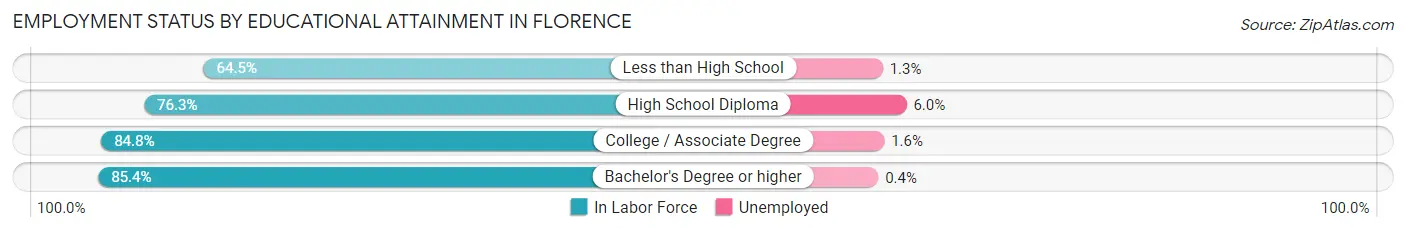
| Educational Attainment | In Labor Force | Unemployed |
| Less than High School | 607 (64.5%) | 12 (1.3%) |
| High School Diploma | 4,145 (76.3%) | 326 (6.0%) |
| College / Associate Degree | 4,581 (84.8%) | 86 (1.6%) |
| Bachelor's Degree or higher | 4,101 (85.4%) | 19 (0.4%) |
| Total | 13,445 (81.1%) | 431 (2.6%) |
Employment Occupations by Sex in Florence
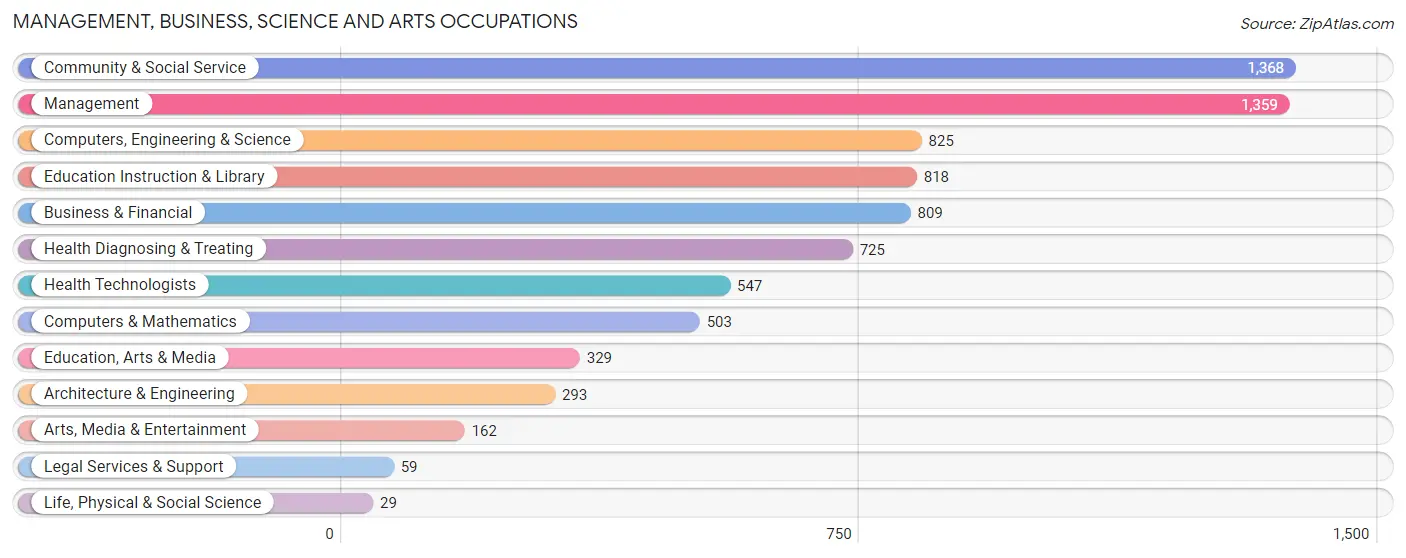
Management, Business, Science and Arts Occupations
The most common Management, Business, Science and Arts occupations in Florence are Community & Social Service (1,368 | 8.3%), Management (1,359 | 8.3%), Computers, Engineering & Science (825 | 5.0%), Education Instruction & Library (818 | 5.0%), and Business & Financial (809 | 4.9%).
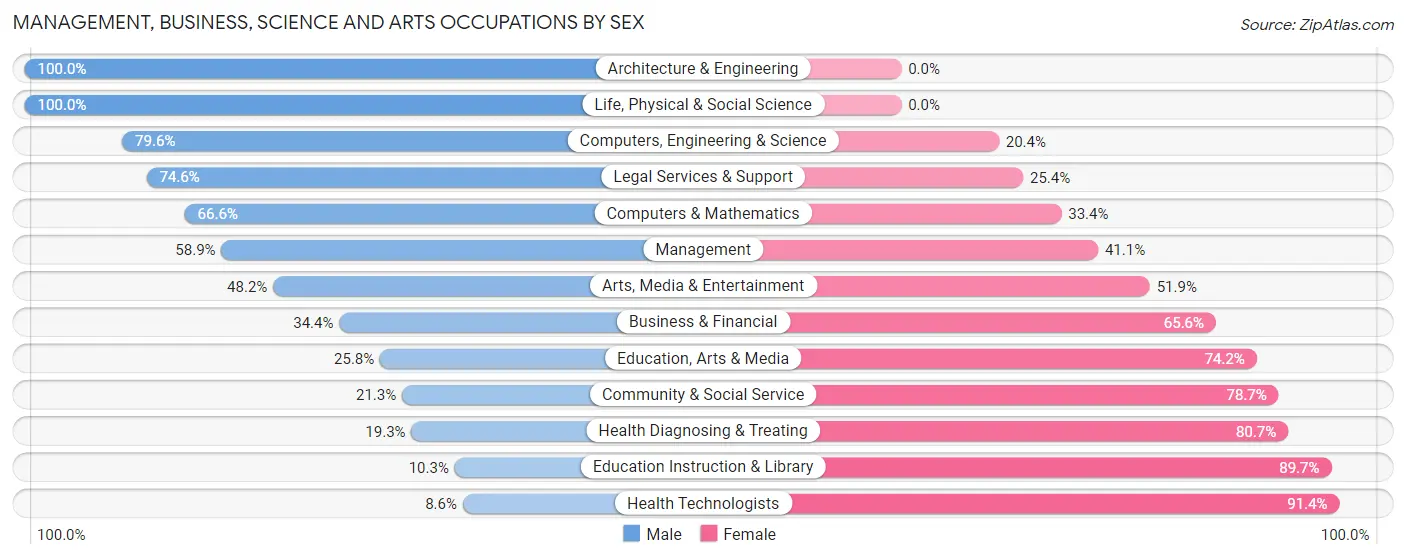
Management, Business, Science and Arts Occupations by Sex
Within the Management, Business, Science and Arts occupations in Florence, the most male-oriented occupations are Architecture & Engineering (100.0%), Life, Physical & Social Science (100.0%), and Computers, Engineering & Science (79.6%), while the most female-oriented occupations are Health Technologists (91.4%), Education Instruction & Library (89.7%), and Health Diagnosing & Treating (80.7%).
| Occupation | Male | Female |
| Management | 801 (58.9%) | 558 (41.1%) |
| Business & Financial | 278 (34.4%) | 531 (65.6%) |
| Computers, Engineering & Science | 657 (79.6%) | 168 (20.4%) |
| Computers & Mathematics | 335 (66.6%) | 168 (33.4%) |
| Architecture & Engineering | 293 (100.0%) | 0 (0.0%) |
| Life, Physical & Social Science | 29 (100.0%) | 0 (0.0%) |
| Community & Social Service | 291 (21.3%) | 1,077 (78.7%) |
| Education, Arts & Media | 85 (25.8%) | 244 (74.2%) |
| Legal Services & Support | 44 (74.6%) | 15 (25.4%) |
| Education Instruction & Library | 84 (10.3%) | 734 (89.7%) |
| Arts, Media & Entertainment | 78 (48.1%) | 84 (51.8%) |
| Health Diagnosing & Treating | 140 (19.3%) | 585 (80.7%) |
| Health Technologists | 47 (8.6%) | 500 (91.4%) |
| Total (Category) | 2,167 (42.6%) | 2,919 (57.4%) |
| Total (Overall) | 8,854 (53.8%) | 7,588 (46.2%) |
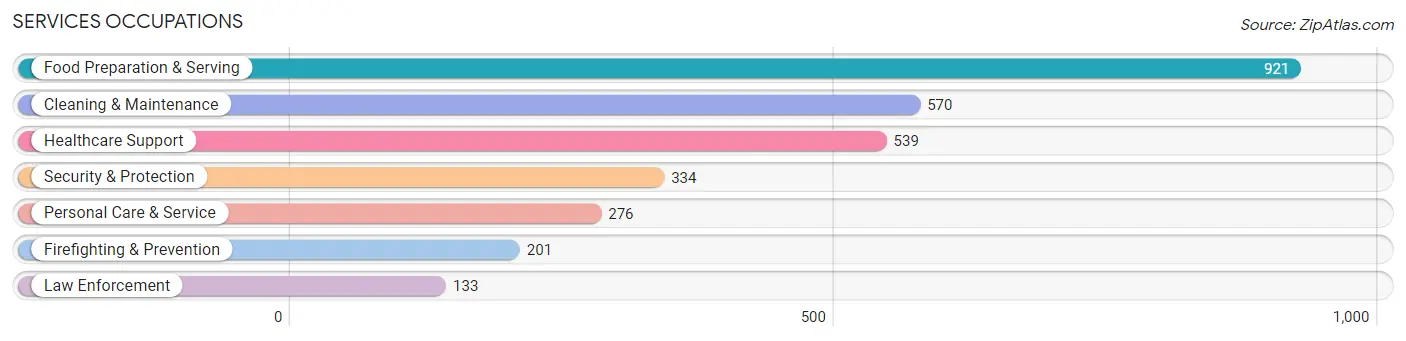
Services Occupations
The most common Services occupations in Florence are Food Preparation & Serving (921 | 5.6%), Cleaning & Maintenance (570 | 3.5%), Healthcare Support (539 | 3.3%), Security & Protection (334 | 2.0%), and Personal Care & Service (276 | 1.7%).
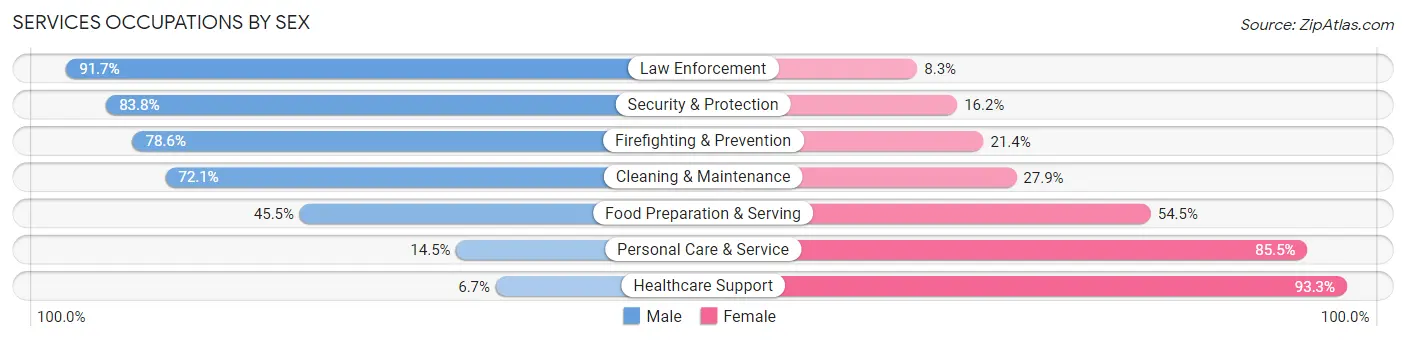
Services Occupations by Sex
Within the Services occupations in Florence, the most male-oriented occupations are Law Enforcement (91.7%), Security & Protection (83.8%), and Firefighting & Prevention (78.6%), while the most female-oriented occupations are Healthcare Support (93.3%), Personal Care & Service (85.5%), and Food Preparation & Serving (54.5%).
| Occupation | Male | Female |
| Healthcare Support | 36 (6.7%) | 503 (93.3%) |
| Security & Protection | 280 (83.8%) | 54 (16.2%) |
| Firefighting & Prevention | 158 (78.6%) | 43 (21.4%) |
| Law Enforcement | 122 (91.7%) | 11 (8.3%) |
| Food Preparation & Serving | 419 (45.5%) | 502 (54.5%) |
| Cleaning & Maintenance | 411 (72.1%) | 159 (27.9%) |
| Personal Care & Service | 40 (14.5%) | 236 (85.5%) |
| Total (Category) | 1,186 (44.9%) | 1,454 (55.1%) |
| Total (Overall) | 8,854 (53.8%) | 7,588 (46.2%) |
Sales and Office Occupations
The most common Sales and Office occupations in Florence are Office & Administration (1,834 | 11.2%), and Sales & Related (1,345 | 8.2%).

Sales and Office Occupations by Sex

| Occupation | Male | Female |
| Sales & Related | 680 (50.6%) | 665 (49.4%) |
| Office & Administration | 349 (19.0%) | 1,485 (81.0%) |
| Total (Category) | 1,029 (32.4%) | 2,150 (67.6%) |
| Total (Overall) | 8,854 (53.8%) | 7,588 (46.2%) |
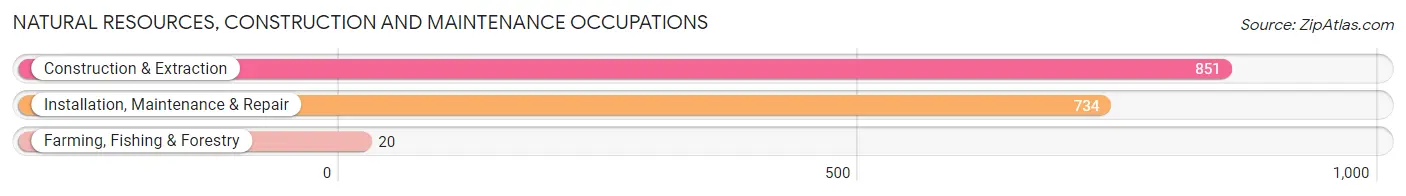
Natural Resources, Construction and Maintenance Occupations
The most common Natural Resources, Construction and Maintenance occupations in Florence are Construction & Extraction (851 | 5.2%), Installation, Maintenance & Repair (734 | 4.5%), and Farming, Fishing & Forestry (20 | 0.1%).
Natural Resources, Construction and Maintenance Occupations by Sex
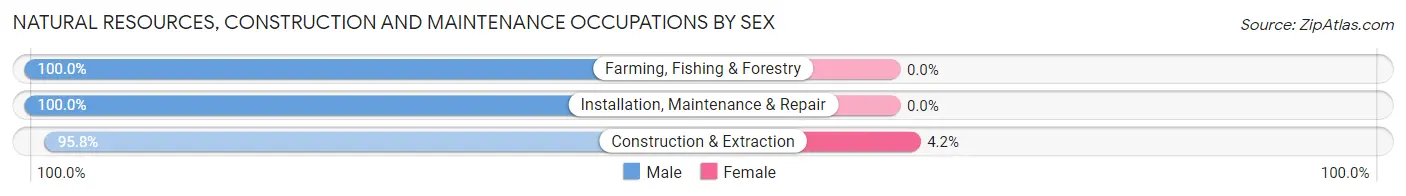
| Occupation | Male | Female |
| Farming, Fishing & Forestry | 20 (100.0%) | 0 (0.0%) |
| Construction & Extraction | 815 (95.8%) | 36 (4.2%) |
| Installation, Maintenance & Repair | 734 (100.0%) | 0 (0.0%) |
| Total (Category) | 1,569 (97.8%) | 36 (2.2%) |
| Total (Overall) | 8,854 (53.8%) | 7,588 (46.2%) |
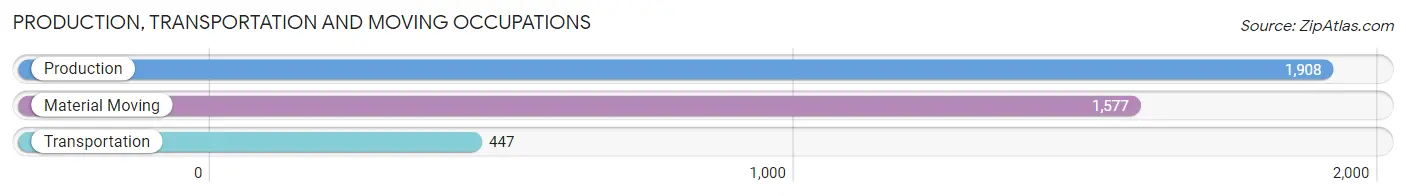
Production, Transportation and Moving Occupations
The most common Production, Transportation and Moving occupations in Florence are Production (1,908 | 11.6%), Material Moving (1,577 | 9.6%), and Transportation (447 | 2.7%).
Production, Transportation and Moving Occupations by Sex
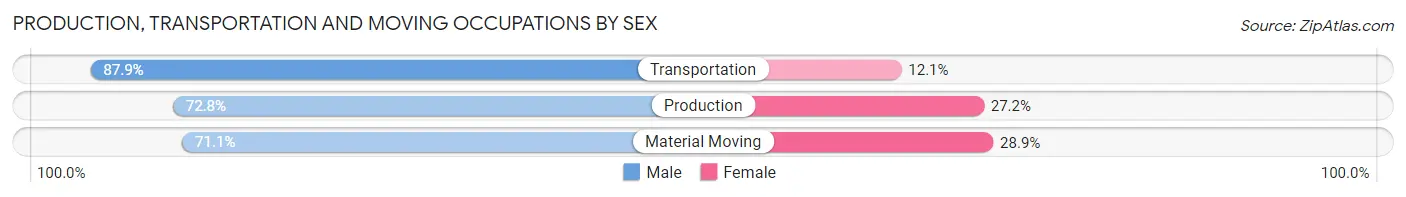
| Occupation | Male | Female |
| Production | 1,389 (72.8%) | 519 (27.2%) |
| Transportation | 393 (87.9%) | 54 (12.1%) |
| Material Moving | 1,121 (71.1%) | 456 (28.9%) |
| Total (Category) | 2,903 (73.8%) | 1,029 (26.2%) |
| Total (Overall) | 8,854 (53.8%) | 7,588 (46.2%) |
Employment Industries by Sex in Florence
Employment Industries in Florence
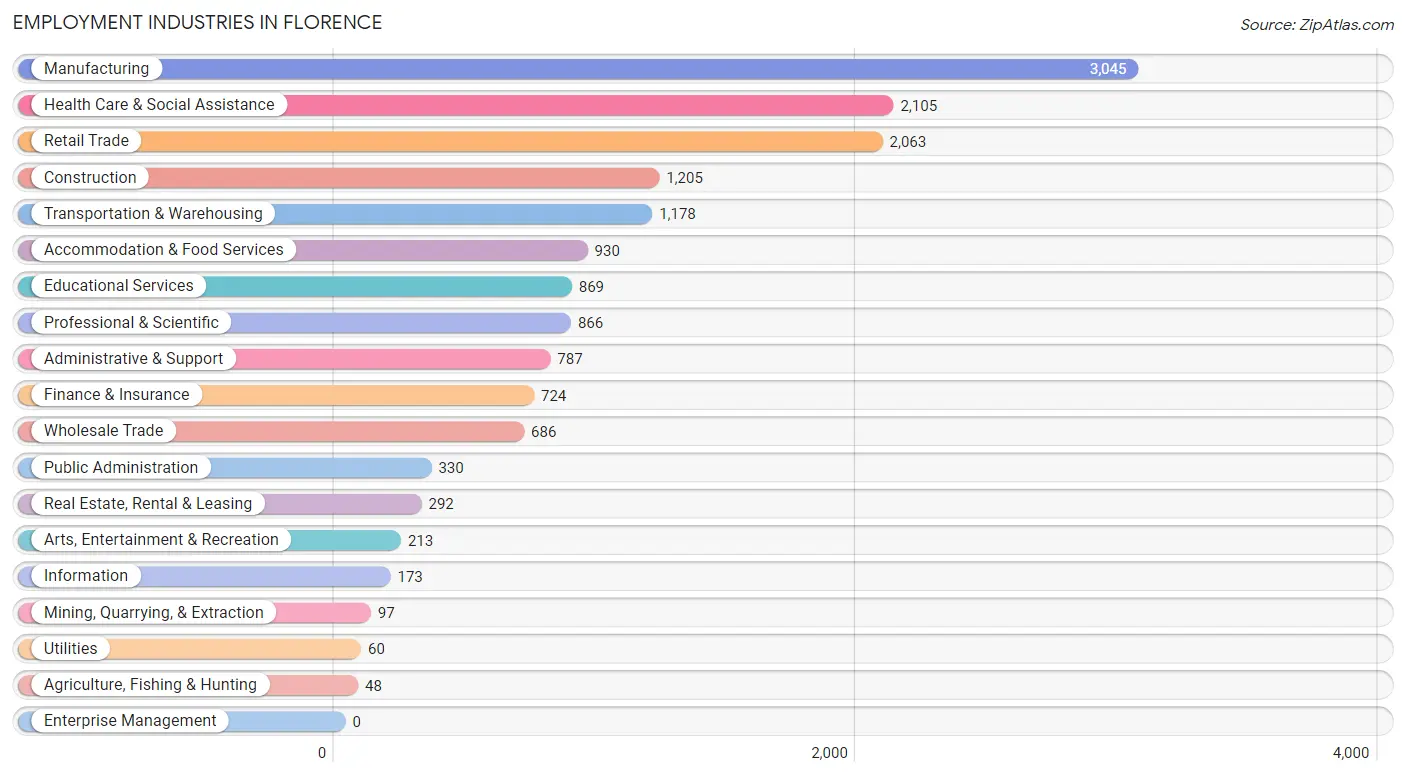
The major employment industries in Florence include Manufacturing (3,045 | 18.5%), Health Care & Social Assistance (2,105 | 12.8%), Retail Trade (2,063 | 12.6%), Construction (1,205 | 7.3%), and Transportation & Warehousing (1,178 | 7.2%).
Employment Industries by Sex in Florence
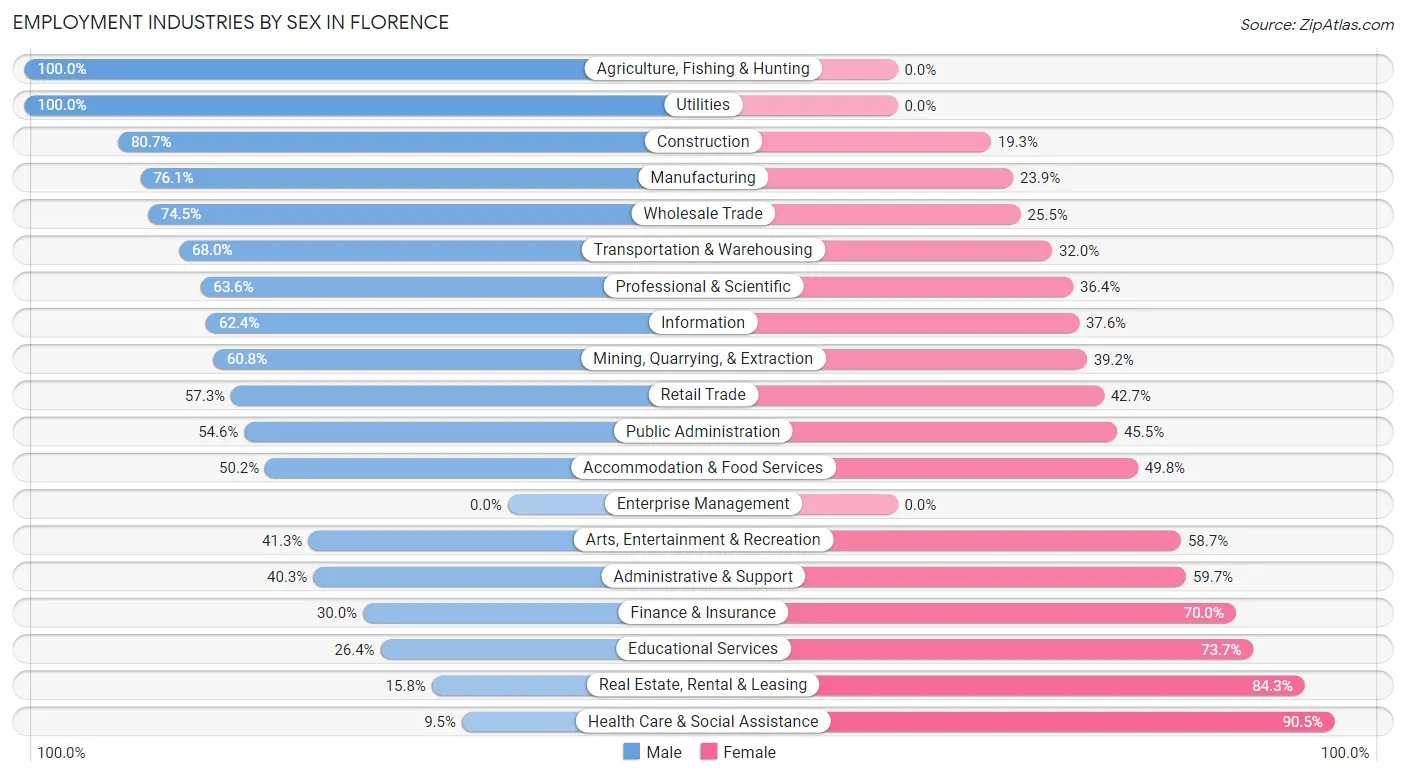
The Florence industries that see more men than women are Agriculture, Fishing & Hunting (100.0%), Utilities (100.0%), and Construction (80.7%), whereas the industries that tend to have a higher number of women are Health Care & Social Assistance (90.5%), Real Estate, Rental & Leasing (84.3%), and Educational Services (73.7%).
| Industry | Male | Female |
| Agriculture, Fishing & Hunting | 48 (100.0%) | 0 (0.0%) |
| Mining, Quarrying, & Extraction | 59 (60.8%) | 38 (39.2%) |
| Construction | 972 (80.7%) | 233 (19.3%) |
| Manufacturing | 2,316 (76.1%) | 729 (23.9%) |
| Wholesale Trade | 511 (74.5%) | 175 (25.5%) |
| Retail Trade | 1,182 (57.3%) | 881 (42.7%) |
| Transportation & Warehousing | 801 (68.0%) | 377 (32.0%) |
| Utilities | 60 (100.0%) | 0 (0.0%) |
| Information | 108 (62.4%) | 65 (37.6%) |
| Finance & Insurance | 217 (30.0%) | 507 (70.0%) |
| Real Estate, Rental & Leasing | 46 (15.8%) | 246 (84.3%) |
| Professional & Scientific | 551 (63.6%) | 315 (36.4%) |
| Enterprise Management | 0 (0.0%) | 0 (0.0%) |
| Administrative & Support | 317 (40.3%) | 470 (59.7%) |
| Educational Services | 229 (26.4%) | 640 (73.7%) |
| Health Care & Social Assistance | 200 (9.5%) | 1,905 (90.5%) |
| Arts, Entertainment & Recreation | 88 (41.3%) | 125 (58.7%) |
| Accommodation & Food Services | 467 (50.2%) | 463 (49.8%) |
| Public Administration | 180 (54.5%) | 150 (45.5%) |
| Total | 8,854 (53.8%) | 7,588 (46.2%) |
Education in Florence
School Enrollment in Florence
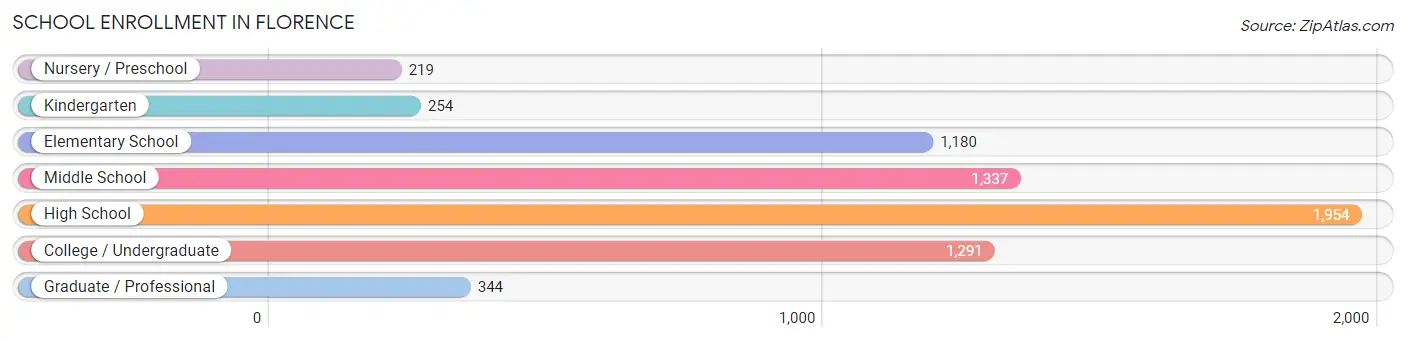
The most common levels of schooling among the 6,579 students in Florence are high school (1,954 | 29.7%), middle school (1,337 | 20.3%), and college / undergraduate (1,291 | 19.6%).
| School Level | # Students | % Students |
| Nursery / Preschool | 219 | 3.3% |
| Kindergarten | 254 | 3.9% |
| Elementary School | 1,180 | 17.9% |
| Middle School | 1,337 | 20.3% |
| High School | 1,954 | 29.7% |
| College / Undergraduate | 1,291 | 19.6% |
| Graduate / Professional | 344 | 5.2% |
| Total | 6,579 | 100.0% |
School Enrollment by Age by Funding Source in Florence
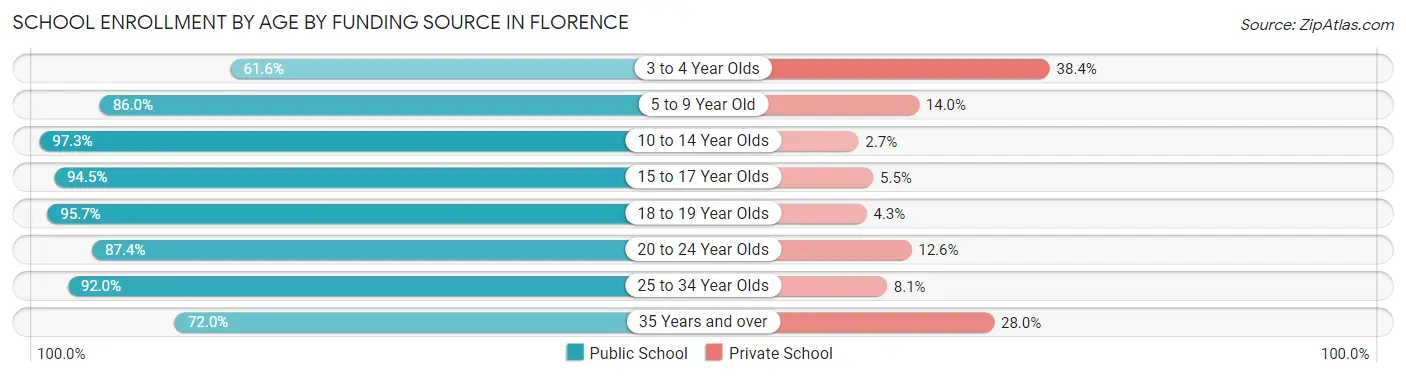
Out of a total of 6,579 students who are enrolled in schools in Florence, 599 (9.1%) attend a private institution, while the remaining 5,980 (90.9%) are enrolled in public schools. The age group of 3 to 4 year olds has the highest likelihood of being enrolled in private schools, with 66 (38.4% in the age bracket) enrolled. Conversely, the age group of 10 to 14 year olds has the lowest likelihood of being enrolled in a private school, with 1,741 (97.3% in the age bracket) attending a public institution.
| Age Bracket | Public School | Private School |
| 3 to 4 Year Olds | 106 (61.6%) | 66 (38.4%) |
| 5 to 9 Year Old | 1,124 (86.0%) | 183 (14.0%) |
| 10 to 14 Year Olds | 1,741 (97.3%) | 49 (2.7%) |
| 15 to 17 Year Olds | 1,431 (94.5%) | 83 (5.5%) |
| 18 to 19 Year Olds | 449 (95.7%) | 20 (4.3%) |
| 20 to 24 Year Olds | 479 (87.4%) | 69 (12.6%) |
| 25 to 34 Year Olds | 411 (91.9%) | 36 (8.1%) |
| 35 Years and over | 239 (72.0%) | 93 (28.0%) |
| Total | 5,980 (90.9%) | 599 (9.1%) |
Educational Attainment by Field of Study in Florence
Business (1,529 | 24.4%), education (994 | 15.9%), science & technology (515 | 8.2%), arts & humanities (491 | 7.8%), and engineering (436 | 7.0%) are the most common fields of study among 6,262 individuals in Florence who have obtained a bachelor's degree or higher.
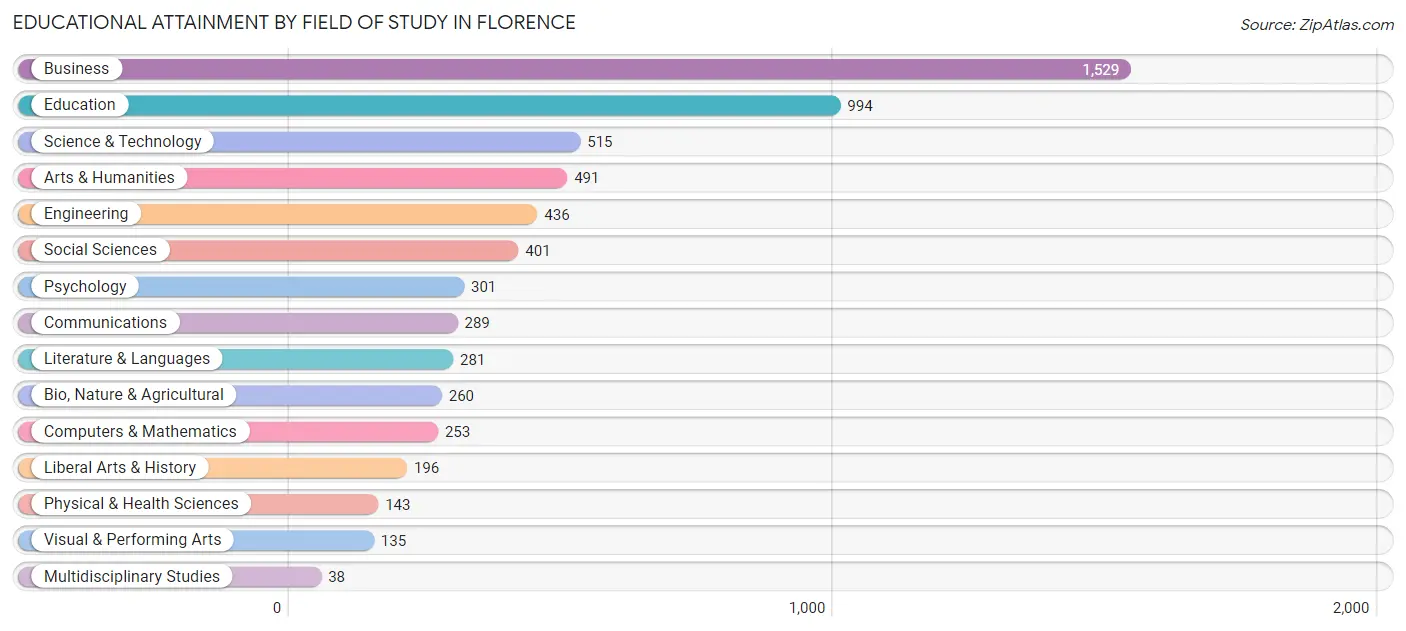
| Field of Study | # Graduates | % Graduates |
| Computers & Mathematics | 253 | 4.0% |
| Bio, Nature & Agricultural | 260 | 4.2% |
| Physical & Health Sciences | 143 | 2.3% |
| Psychology | 301 | 4.8% |
| Social Sciences | 401 | 6.4% |
| Engineering | 436 | 7.0% |
| Multidisciplinary Studies | 38 | 0.6% |
| Science & Technology | 515 | 8.2% |
| Business | 1,529 | 24.4% |
| Education | 994 | 15.9% |
| Literature & Languages | 281 | 4.5% |
| Liberal Arts & History | 196 | 3.1% |
| Visual & Performing Arts | 135 | 2.2% |
| Communications | 289 | 4.6% |
| Arts & Humanities | 491 | 7.8% |
| Total | 6,262 | 100.0% |
Transportation & Commute in Florence
Vehicle Availability by Sex in Florence
The most prevalent vehicle ownership categories in Florence are males with 2 vehicles (3,447, accounting for 40.0%) and females with 2 vehicles (2,776, making up 46.4%).
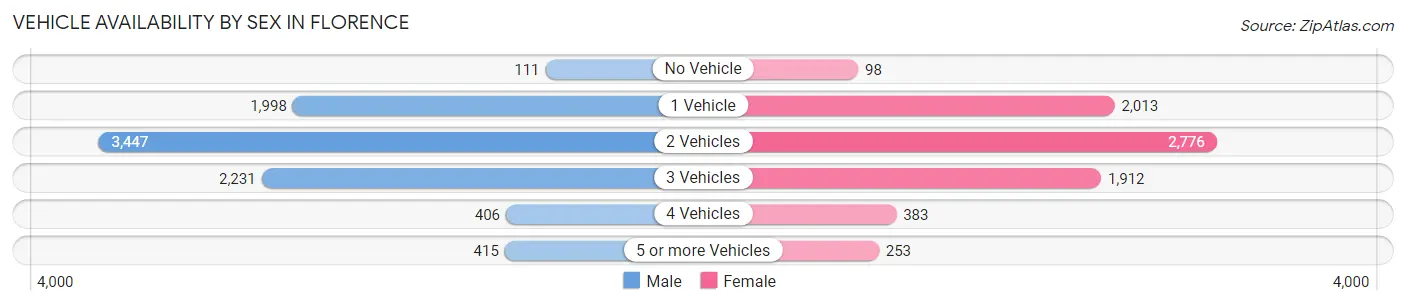
| Vehicles Available | Male | Female |
| No Vehicle | 111 (1.3%) | 98 (1.3%) |
| 1 Vehicle | 1,998 (23.2%) | 2,013 (27.1%) |
| 2 Vehicles | 3,447 (40.0%) | 2,776 (37.3%) |
| 3 Vehicles | 2,231 (25.9%) | 1,912 (25.7%) |
| 4 Vehicles | 406 (4.7%) | 383 (5.1%) |
| 5 or more Vehicles | 415 (4.8%) | 253 (3.4%) |
| Total | 8,608 (100.0%) | 7,435 (100.0%) |
Commute Time in Florence
The most frequently occuring commute durations in Florence are 10 to 14 minutes (2,888 commuters, 19.6%), 15 to 19 minutes (2,869 commuters, 19.5%), and 20 to 24 minutes (2,631 commuters, 17.8%).
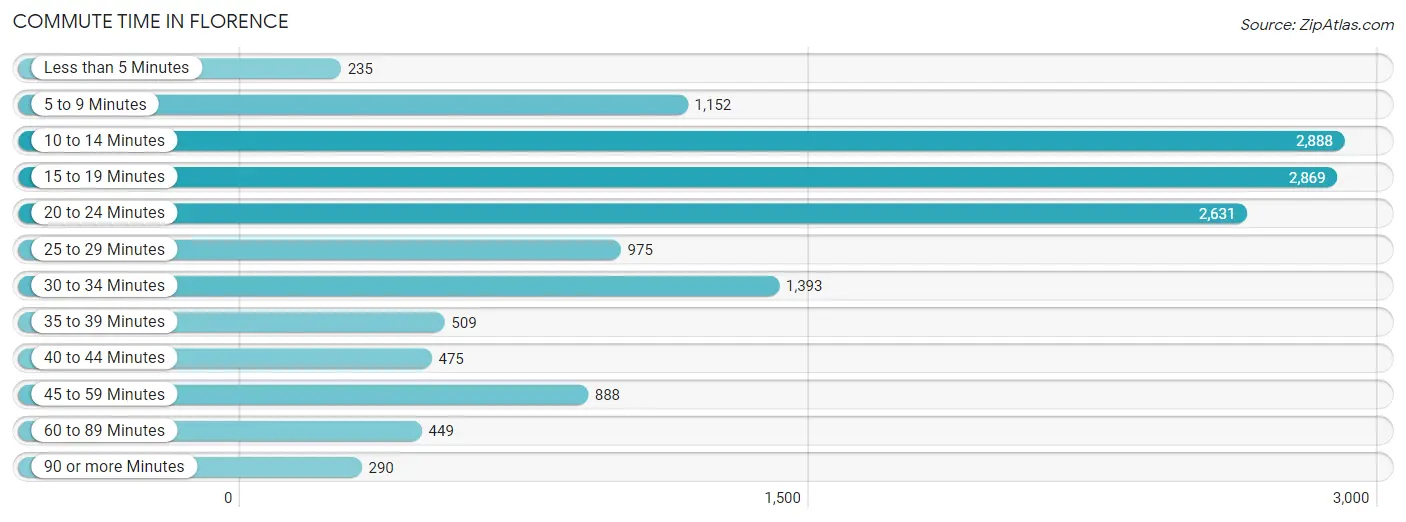
| Commute Time | # Commuters | % Commuters |
| Less than 5 Minutes | 235 | 1.6% |
| 5 to 9 Minutes | 1,152 | 7.8% |
| 10 to 14 Minutes | 2,888 | 19.6% |
| 15 to 19 Minutes | 2,869 | 19.5% |
| 20 to 24 Minutes | 2,631 | 17.8% |
| 25 to 29 Minutes | 975 | 6.6% |
| 30 to 34 Minutes | 1,393 | 9.4% |
| 35 to 39 Minutes | 509 | 3.5% |
| 40 to 44 Minutes | 475 | 3.2% |
| 45 to 59 Minutes | 888 | 6.0% |
| 60 to 89 Minutes | 449 | 3.0% |
| 90 or more Minutes | 290 | 2.0% |
Commute Time by Sex in Florence
The most common commute times in Florence are 20 to 24 minutes (1,631 commuters, 20.0%) for males and 15 to 19 minutes (1,425 commuters, 21.6%) for females.
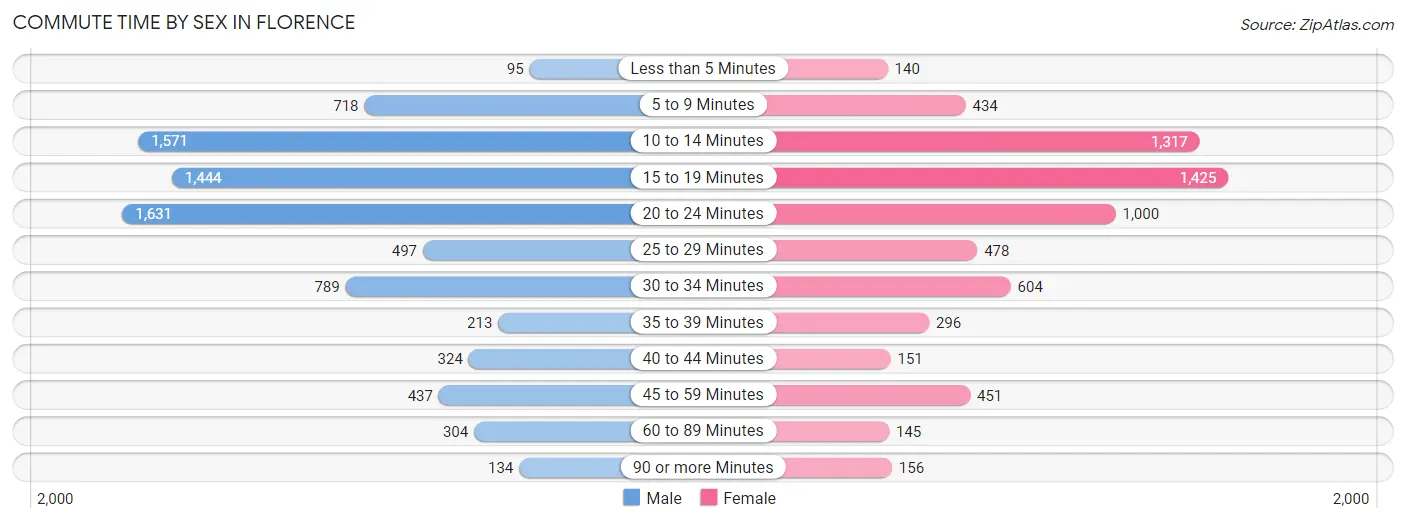
| Commute Time | Male | Female |
| Less than 5 Minutes | 95 (1.2%) | 140 (2.1%) |
| 5 to 9 Minutes | 718 (8.8%) | 434 (6.6%) |
| 10 to 14 Minutes | 1,571 (19.3%) | 1,317 (20.0%) |
| 15 to 19 Minutes | 1,444 (17.7%) | 1,425 (21.6%) |
| 20 to 24 Minutes | 1,631 (20.0%) | 1,000 (15.2%) |
| 25 to 29 Minutes | 497 (6.1%) | 478 (7.2%) |
| 30 to 34 Minutes | 789 (9.7%) | 604 (9.2%) |
| 35 to 39 Minutes | 213 (2.6%) | 296 (4.5%) |
| 40 to 44 Minutes | 324 (4.0%) | 151 (2.3%) |
| 45 to 59 Minutes | 437 (5.4%) | 451 (6.8%) |
| 60 to 89 Minutes | 304 (3.7%) | 145 (2.2%) |
| 90 or more Minutes | 134 (1.6%) | 156 (2.4%) |
Time of Departure to Work by Sex in Florence
The most frequent times of departure to work in Florence are 6:30 AM to 6:59 AM (1,166, 14.3%) for males and 7:00 AM to 7:29 AM (1,131, 17.1%) for females.
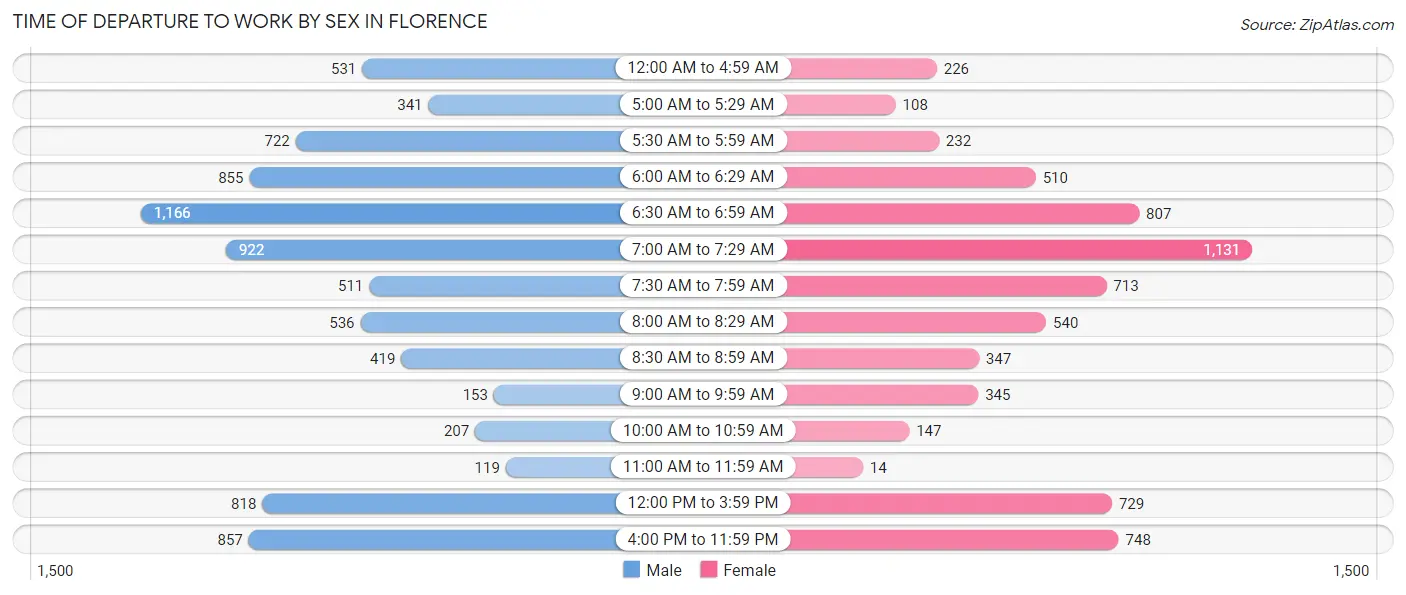
| Time of Departure | Male | Female |
| 12:00 AM to 4:59 AM | 531 (6.5%) | 226 (3.4%) |
| 5:00 AM to 5:29 AM | 341 (4.2%) | 108 (1.6%) |
| 5:30 AM to 5:59 AM | 722 (8.8%) | 232 (3.5%) |
| 6:00 AM to 6:29 AM | 855 (10.5%) | 510 (7.7%) |
| 6:30 AM to 6:59 AM | 1,166 (14.3%) | 807 (12.2%) |
| 7:00 AM to 7:29 AM | 922 (11.3%) | 1,131 (17.1%) |
| 7:30 AM to 7:59 AM | 511 (6.3%) | 713 (10.8%) |
| 8:00 AM to 8:29 AM | 536 (6.6%) | 540 (8.2%) |
| 8:30 AM to 8:59 AM | 419 (5.1%) | 347 (5.3%) |
| 9:00 AM to 9:59 AM | 153 (1.9%) | 345 (5.2%) |
| 10:00 AM to 10:59 AM | 207 (2.5%) | 147 (2.2%) |
| 11:00 AM to 11:59 AM | 119 (1.5%) | 14 (0.2%) |
| 12:00 PM to 3:59 PM | 818 (10.0%) | 729 (11.1%) |
| 4:00 PM to 11:59 PM | 857 (10.5%) | 748 (11.3%) |
| Total | 8,157 (100.0%) | 6,597 (100.0%) |
Housing Occupancy in Florence
Occupancy by Ownership in Florence
Of the total 13,760 dwellings in Florence, owner-occupied units account for 7,788 (56.6%), while renter-occupied units make up 5,972 (43.4%).
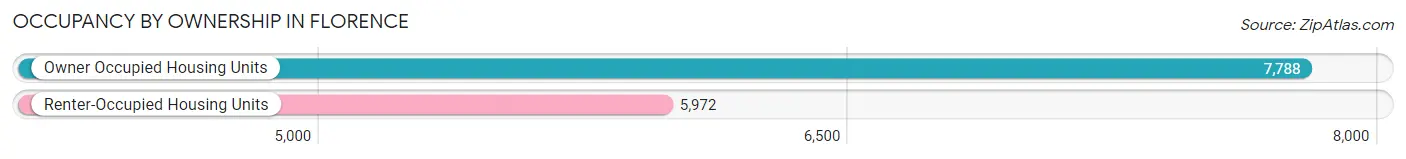
| Occupancy | # Housing Units | % Housing Units |
| Owner Occupied Housing Units | 7,788 | 56.6% |
| Renter-Occupied Housing Units | 5,972 | 43.4% |
| Total Occupied Housing Units | 13,760 | 100.0% |
Occupancy by Household Size in Florence
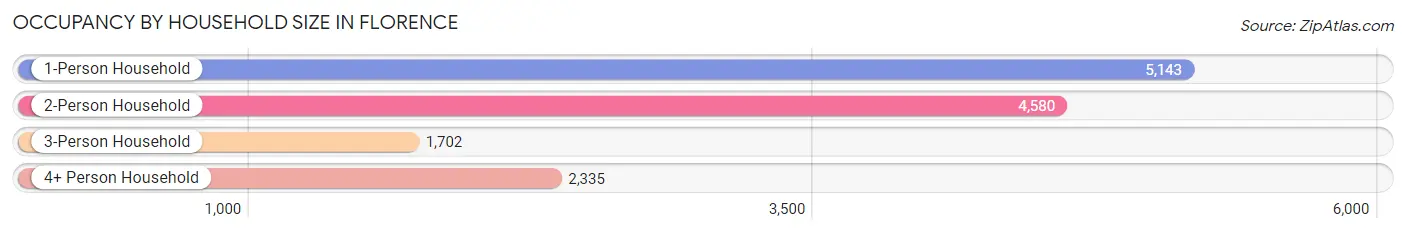
| Household Size | # Housing Units | % Housing Units |
| 1-Person Household | 5,143 | 37.4% |
| 2-Person Household | 4,580 | 33.3% |
| 3-Person Household | 1,702 | 12.4% |
| 4+ Person Household | 2,335 | 17.0% |
| Total Housing Units | 13,760 | 100.0% |
Occupancy by Ownership by Household Size in Florence
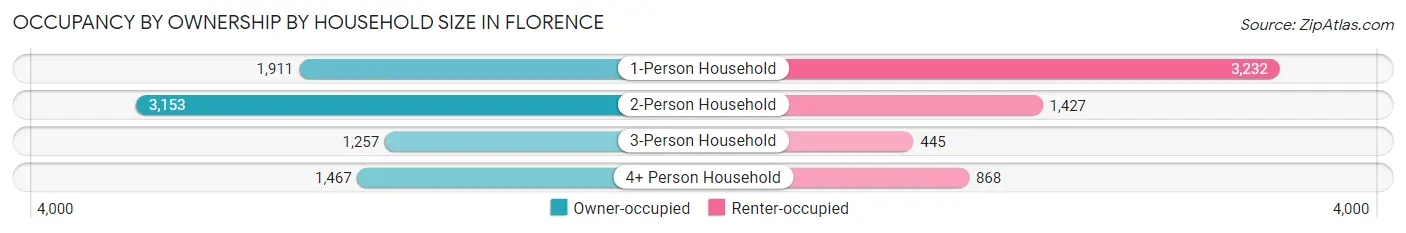
| Household Size | Owner-occupied | Renter-occupied |
| 1-Person Household | 1,911 (37.2%) | 3,232 (62.8%) |
| 2-Person Household | 3,153 (68.8%) | 1,427 (31.2%) |
| 3-Person Household | 1,257 (73.9%) | 445 (26.2%) |
| 4+ Person Household | 1,467 (62.8%) | 868 (37.2%) |
| Total Housing Units | 7,788 (56.6%) | 5,972 (43.4%) |
Occupancy by Educational Attainment in Florence
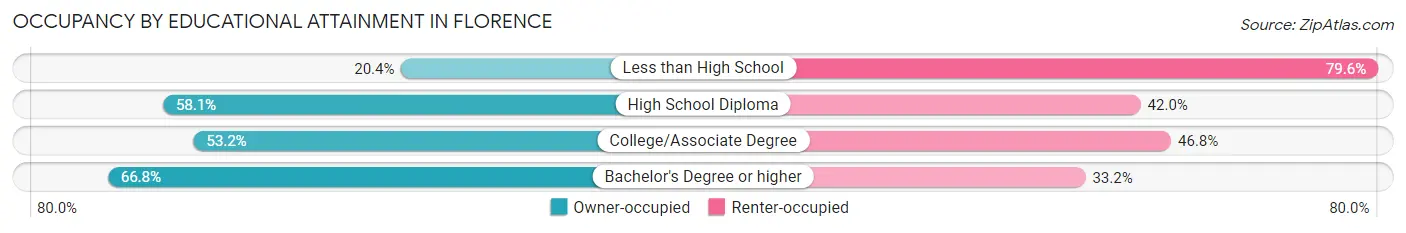
| Household Size | Owner-occupied | Renter-occupied |
| Less than High School | 179 (20.4%) | 698 (79.6%) |
| High School Diploma | 2,249 (58.1%) | 1,625 (41.9%) |
| College/Associate Degree | 2,579 (53.2%) | 2,267 (46.8%) |
| Bachelor's Degree or higher | 2,781 (66.8%) | 1,382 (33.2%) |
Occupancy by Age of Householder in Florence
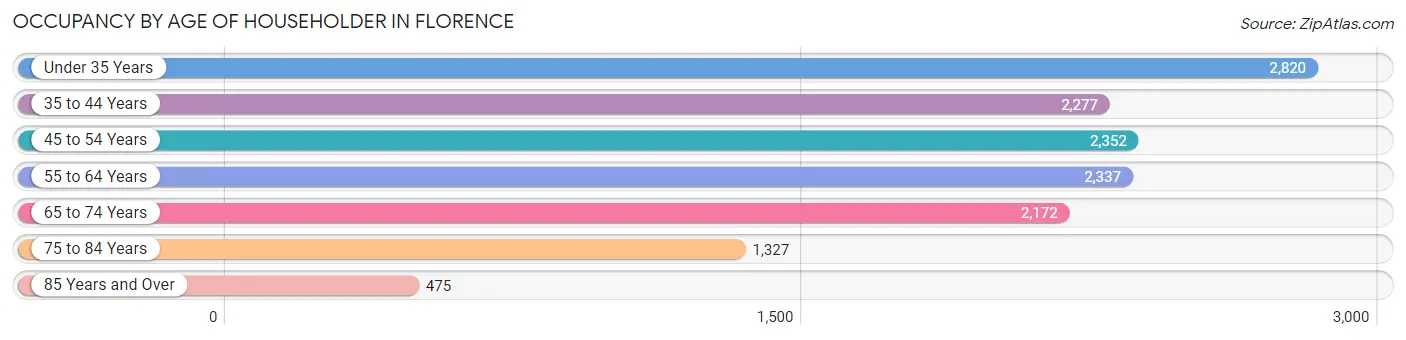
| Age Bracket | # Households | % Households |
| Under 35 Years | 2,820 | 20.5% |
| 35 to 44 Years | 2,277 | 16.6% |
| 45 to 54 Years | 2,352 | 17.1% |
| 55 to 64 Years | 2,337 | 17.0% |
| 65 to 74 Years | 2,172 | 15.8% |
| 75 to 84 Years | 1,327 | 9.6% |
| 85 Years and Over | 475 | 3.5% |
| Total | 13,760 | 100.0% |
Housing Finances in Florence
Median Income by Occupancy in Florence
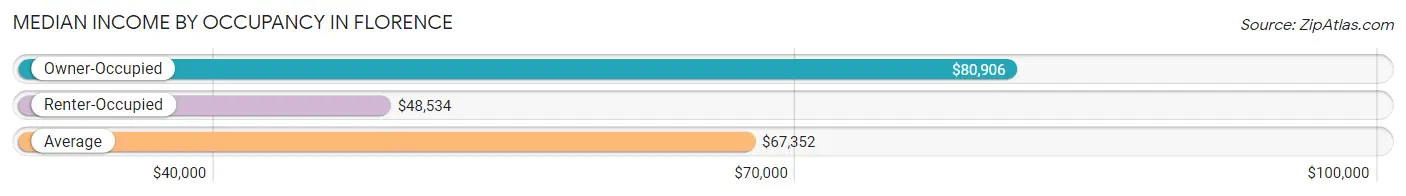
| Occupancy Type | # Households | Median Income |
| Owner-Occupied | 7,788 (56.6%) | $80,906 |
| Renter-Occupied | 5,972 (43.4%) | $48,534 |
| Average | 13,760 (100.0%) | $67,352 |
Occupancy by Householder Income Bracket in Florence
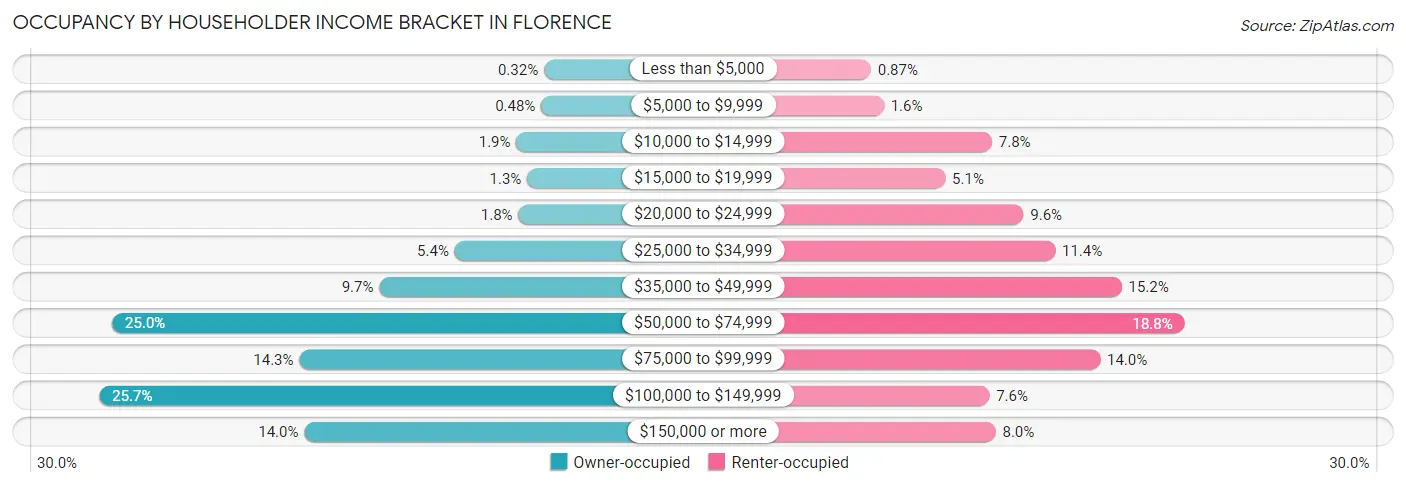
| Income Bracket | Owner-occupied | Renter-occupied |
| Less than $5,000 | 25 (0.3%) | 52 (0.9%) |
| $5,000 to $9,999 | 37 (0.5%) | 96 (1.6%) |
| $10,000 to $14,999 | 148 (1.9%) | 465 (7.8%) |
| $15,000 to $19,999 | 100 (1.3%) | 306 (5.1%) |
| $20,000 to $24,999 | 139 (1.8%) | 573 (9.6%) |
| $25,000 to $34,999 | 422 (5.4%) | 681 (11.4%) |
| $35,000 to $49,999 | 758 (9.7%) | 908 (15.2%) |
| $50,000 to $74,999 | 1,948 (25.0%) | 1,123 (18.8%) |
| $75,000 to $99,999 | 1,114 (14.3%) | 834 (14.0%) |
| $100,000 to $149,999 | 2,005 (25.7%) | 456 (7.6%) |
| $150,000 or more | 1,092 (14.0%) | 478 (8.0%) |
| Total | 7,788 (100.0%) | 5,972 (100.0%) |
Monthly Housing Cost Tiers in Florence
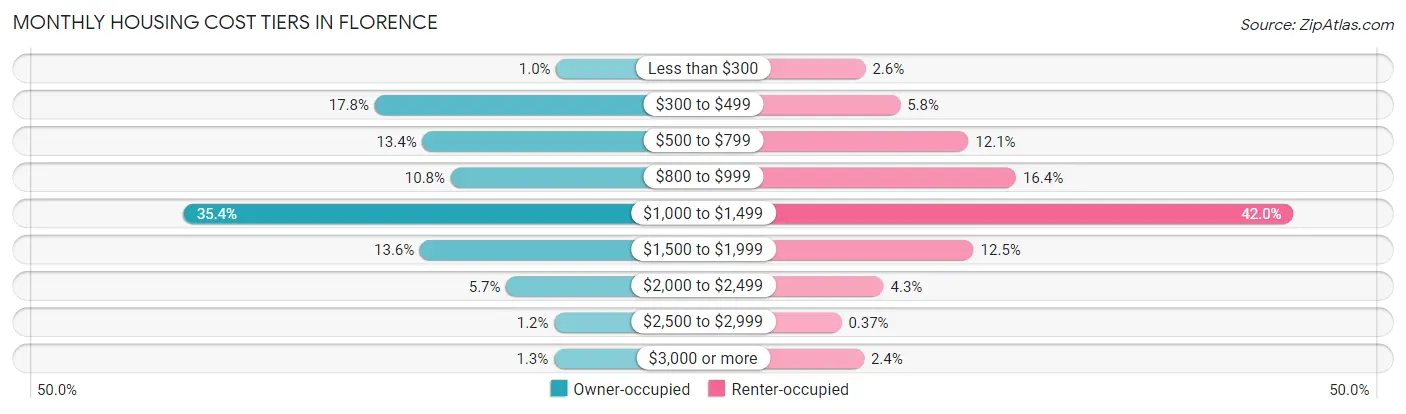
| Monthly Cost | Owner-occupied | Renter-occupied |
| Less than $300 | 81 (1.0%) | 154 (2.6%) |
| $300 to $499 | 1,383 (17.8%) | 345 (5.8%) |
| $500 to $799 | 1,041 (13.4%) | 720 (12.1%) |
| $800 to $999 | 838 (10.8%) | 982 (16.4%) |
| $1,000 to $1,499 | 2,753 (35.3%) | 2,507 (42.0%) |
| $1,500 to $1,999 | 1,058 (13.6%) | 749 (12.5%) |
| $2,000 to $2,499 | 440 (5.7%) | 254 (4.3%) |
| $2,500 to $2,999 | 96 (1.2%) | 22 (0.4%) |
| $3,000 or more | 98 (1.3%) | 146 (2.4%) |
| Total | 7,788 (100.0%) | 5,972 (100.0%) |
Physical Housing Characteristics in Florence
Housing Structures in Florence
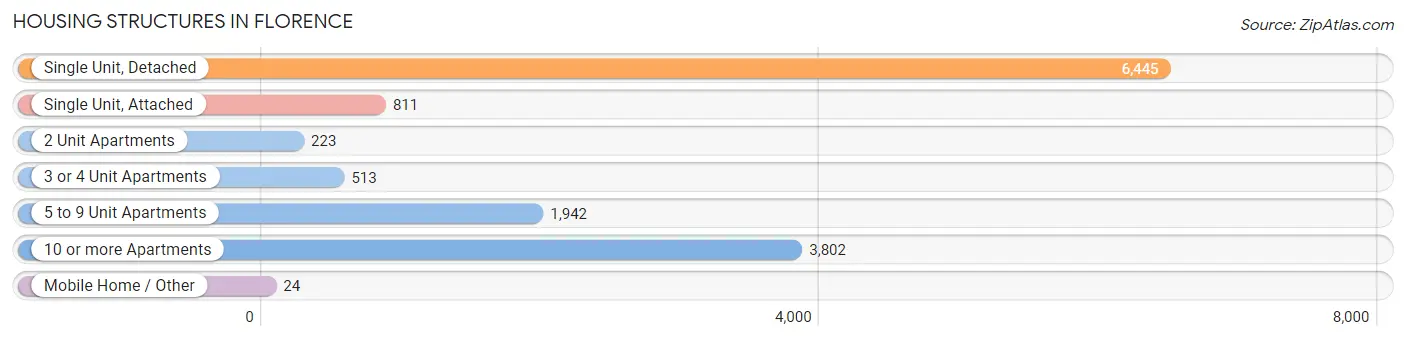
| Structure Type | # Housing Units | % Housing Units |
| Single Unit, Detached | 6,445 | 46.8% |
| Single Unit, Attached | 811 | 5.9% |
| 2 Unit Apartments | 223 | 1.6% |
| 3 or 4 Unit Apartments | 513 | 3.7% |
| 5 to 9 Unit Apartments | 1,942 | 14.1% |
| 10 or more Apartments | 3,802 | 27.6% |
| Mobile Home / Other | 24 | 0.2% |
| Total | 13,760 | 100.0% |
Housing Structures by Occupancy in Florence
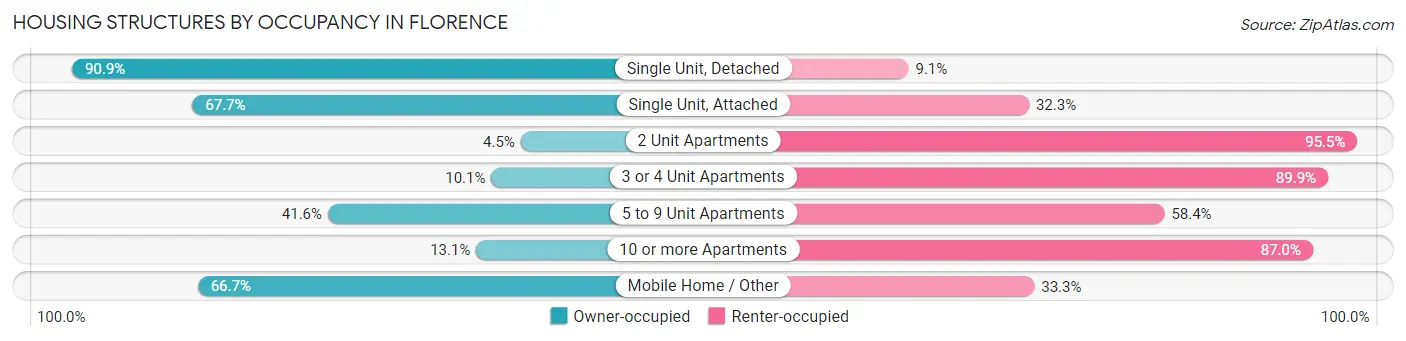
| Structure Type | Owner-occupied | Renter-occupied |
| Single Unit, Detached | 5,857 (90.9%) | 588 (9.1%) |
| Single Unit, Attached | 549 (67.7%) | 262 (32.3%) |
| 2 Unit Apartments | 10 (4.5%) | 213 (95.5%) |
| 3 or 4 Unit Apartments | 52 (10.1%) | 461 (89.9%) |
| 5 to 9 Unit Apartments | 808 (41.6%) | 1,134 (58.4%) |
| 10 or more Apartments | 496 (13.1%) | 3,306 (87.0%) |
| Mobile Home / Other | 16 (66.7%) | 8 (33.3%) |
| Total | 7,788 (56.6%) | 5,972 (43.4%) |
Housing Structures by Number of Rooms in Florence
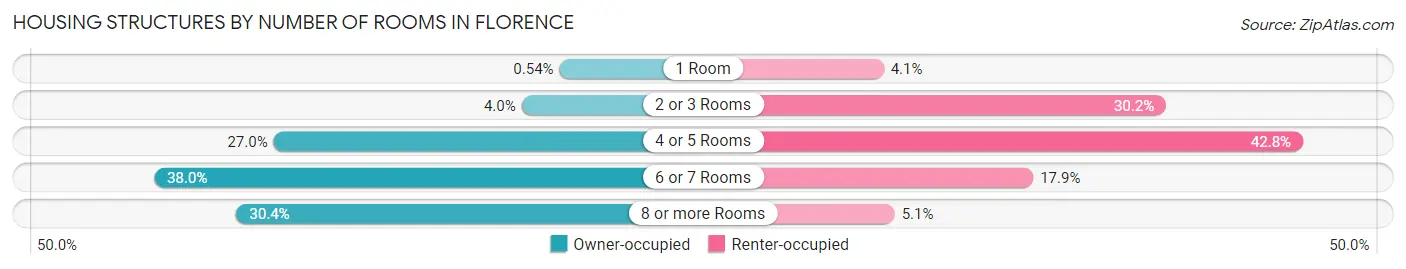
| Number of Rooms | Owner-occupied | Renter-occupied |
| 1 Room | 42 (0.5%) | 242 (4.1%) |
| 2 or 3 Rooms | 315 (4.0%) | 1,802 (30.2%) |
| 4 or 5 Rooms | 2,101 (27.0%) | 2,557 (42.8%) |
| 6 or 7 Rooms | 2,962 (38.0%) | 1,068 (17.9%) |
| 8 or more Rooms | 2,368 (30.4%) | 303 (5.1%) |
| Total | 7,788 (100.0%) | 5,972 (100.0%) |
Housing Structure by Heating Type in Florence
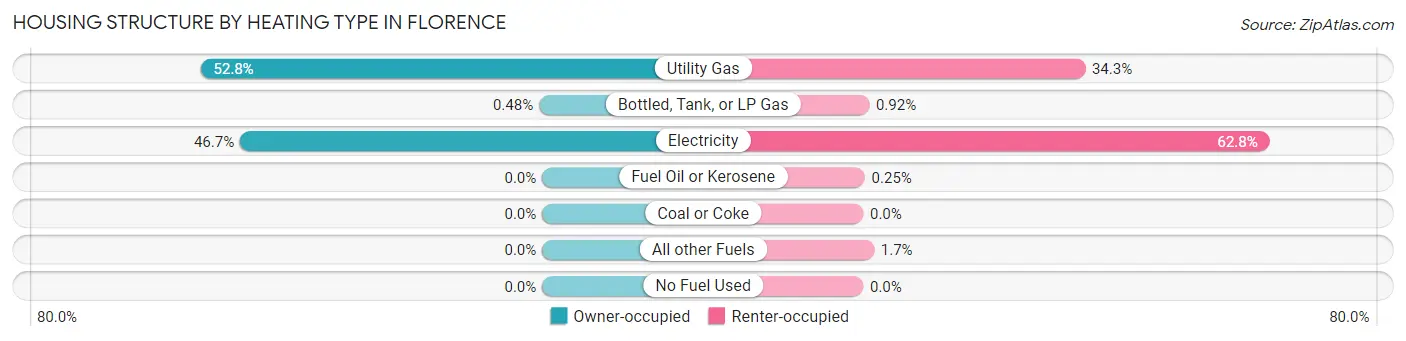
| Heating Type | Owner-occupied | Renter-occupied |
| Utility Gas | 4,114 (52.8%) | 2,049 (34.3%) |
| Bottled, Tank, or LP Gas | 37 (0.5%) | 55 (0.9%) |
| Electricity | 3,637 (46.7%) | 3,753 (62.8%) |
| Fuel Oil or Kerosene | 0 (0.0%) | 15 (0.3%) |
| Coal or Coke | 0 (0.0%) | 0 (0.0%) |
| All other Fuels | 0 (0.0%) | 100 (1.7%) |
| No Fuel Used | 0 (0.0%) | 0 (0.0%) |
| Total | 7,788 (100.0%) | 5,972 (100.0%) |
Household Vehicle Usage in Florence
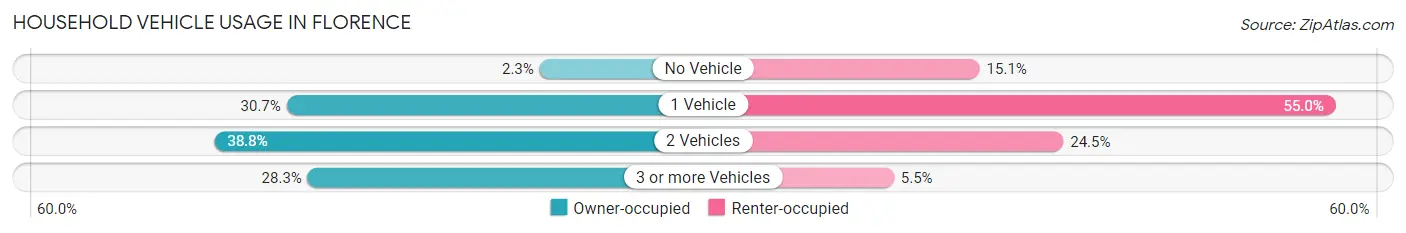
| Vehicles per Household | Owner-occupied | Renter-occupied |
| No Vehicle | 180 (2.3%) | 901 (15.1%) |
| 1 Vehicle | 2,387 (30.6%) | 3,283 (55.0%) |
| 2 Vehicles | 3,018 (38.8%) | 1,461 (24.5%) |
| 3 or more Vehicles | 2,203 (28.3%) | 327 (5.5%) |
| Total | 7,788 (100.0%) | 5,972 (100.0%) |
Real Estate & Mortgages in Florence
Real Estate and Mortgage Overview in Florence
| Characteristic | Without Mortgage | With Mortgage |
| Housing Units | 2,474 | 5,314 |
| Median Property Value | $169,400 | $184,600 |
| Median Household Income | $66,600 | $836 |
| Monthly Housing Costs | $485 | $98 |
| Real Estate Taxes | $1,515 | $91 |
Property Value by Mortgage Status in Florence
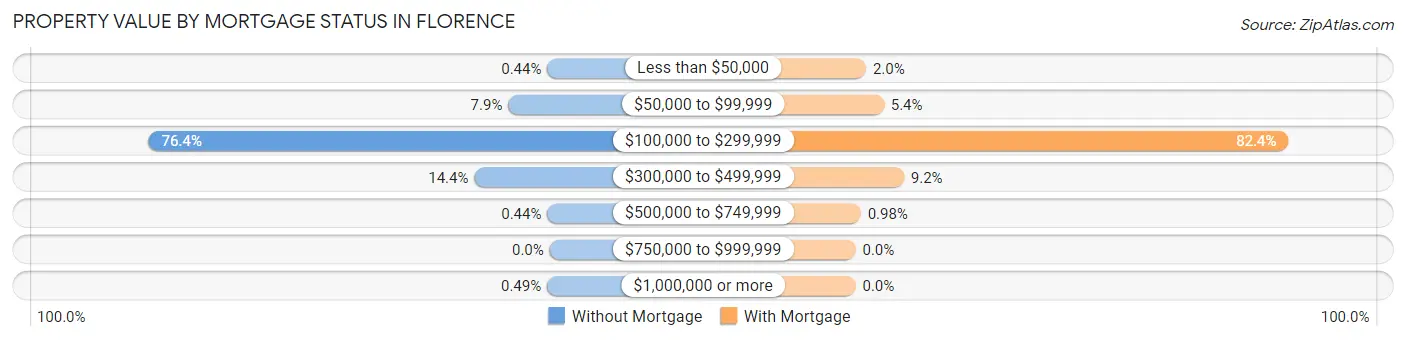
| Property Value | Without Mortgage | With Mortgage |
| Less than $50,000 | 11 (0.4%) | 106 (2.0%) |
| $50,000 to $99,999 | 195 (7.9%) | 286 (5.4%) |
| $100,000 to $299,999 | 1,890 (76.4%) | 4,381 (82.4%) |
| $300,000 to $499,999 | 355 (14.3%) | 489 (9.2%) |
| $500,000 to $749,999 | 11 (0.4%) | 52 (1.0%) |
| $750,000 to $999,999 | 0 (0.0%) | 0 (0.0%) |
| $1,000,000 or more | 12 (0.5%) | 0 (0.0%) |
| Total | 2,474 (100.0%) | 5,314 (100.0%) |
Household Income by Mortgage Status in Florence
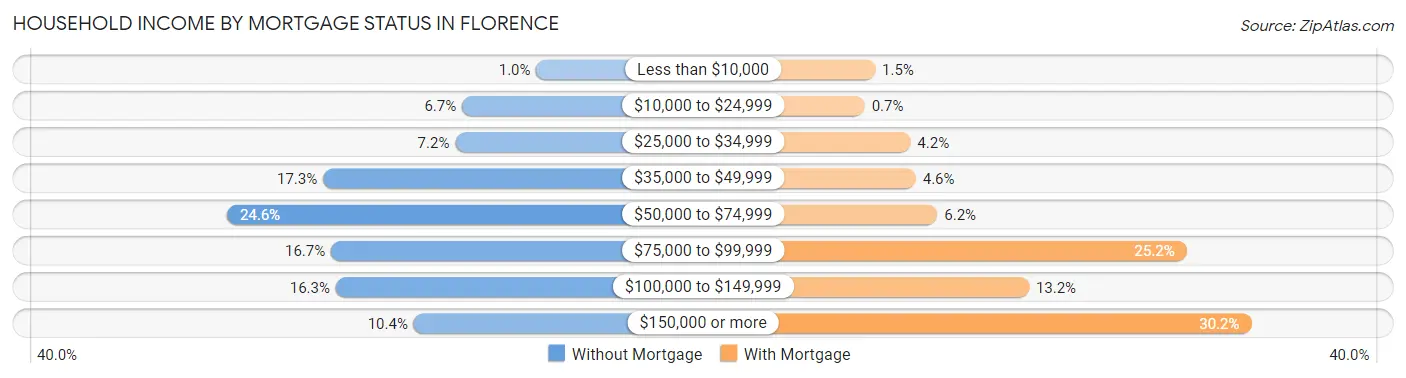
| Household Income | Without Mortgage | With Mortgage |
| Less than $10,000 | 25 (1.0%) | 79 (1.5%) |
| $10,000 to $24,999 | 165 (6.7%) | 37 (0.7%) |
| $25,000 to $34,999 | 178 (7.2%) | 222 (4.2%) |
| $35,000 to $49,999 | 427 (17.3%) | 244 (4.6%) |
| $50,000 to $74,999 | 608 (24.6%) | 331 (6.2%) |
| $75,000 to $99,999 | 412 (16.7%) | 1,340 (25.2%) |
| $100,000 to $149,999 | 403 (16.3%) | 702 (13.2%) |
| $150,000 or more | 256 (10.3%) | 1,602 (30.1%) |
| Total | 2,474 (100.0%) | 5,314 (100.0%) |
Property Value to Household Income Ratio in Florence
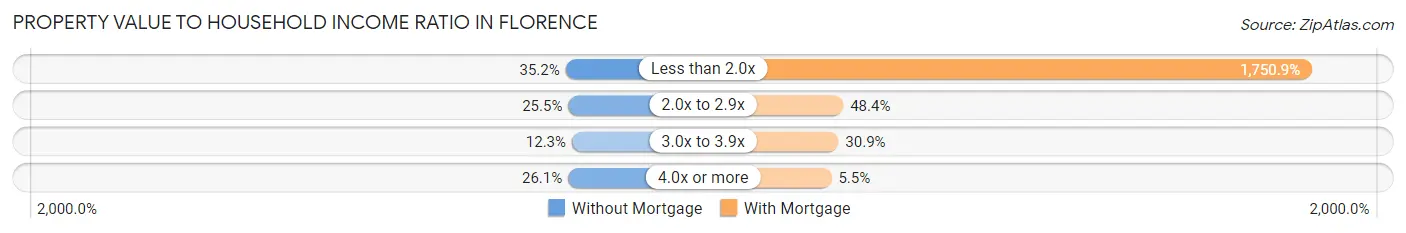
| Value-to-Income Ratio | Without Mortgage | With Mortgage |
| Less than 2.0x | 870 (35.2%) | 93,041 (1,750.9%) |
| 2.0x to 2.9x | 630 (25.5%) | 2,571 (48.4%) |
| 3.0x to 3.9x | 303 (12.2%) | 1,641 (30.9%) |
| 4.0x or more | 646 (26.1%) | 293 (5.5%) |
| Total | 2,474 (100.0%) | 5,314 (100.0%) |
Real Estate Taxes by Mortgage Status in Florence
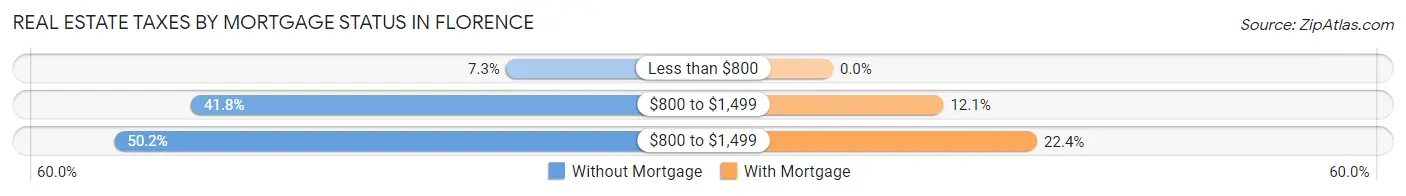
| Property Taxes | Without Mortgage | With Mortgage |
| Less than $800 | 180 (7.3%) | 0 (0.0%) |
| $800 to $1,499 | 1,033 (41.7%) | 643 (12.1%) |
| $800 to $1,499 | 1,241 (50.2%) | 1,189 (22.4%) |
| Total | 2,474 (100.0%) | 5,314 (100.0%) |
Health & Disability in Florence
Health Insurance Coverage by Age in Florence
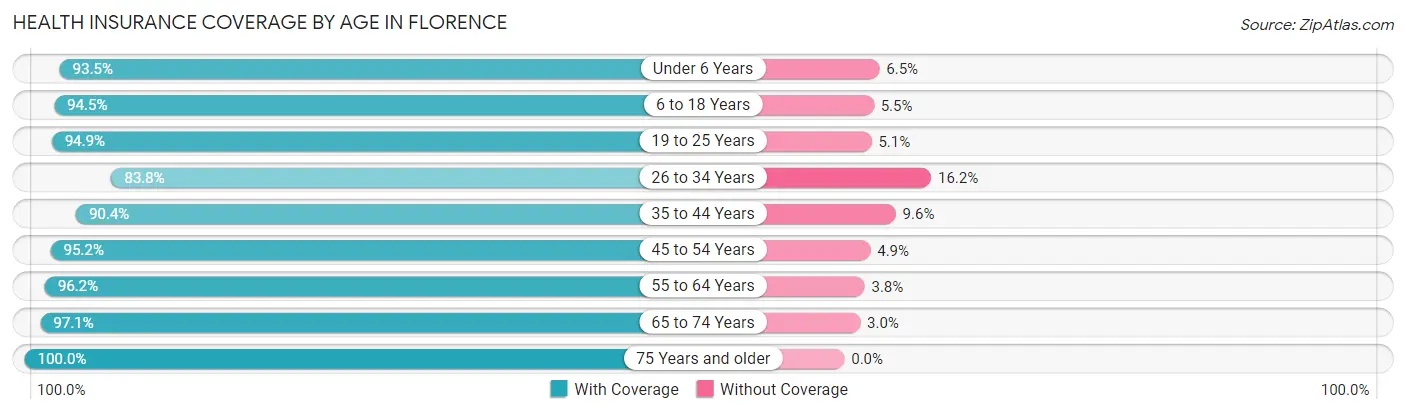
| Age Bracket | With Coverage | Without Coverage |
| Under 6 Years | 2,274 (93.5%) | 159 (6.5%) |
| 6 to 18 Years | 4,462 (94.5%) | 259 (5.5%) |
| 19 to 25 Years | 2,554 (94.9%) | 136 (5.1%) |
| 26 to 34 Years | 3,705 (83.8%) | 715 (16.2%) |
| 35 to 44 Years | 3,794 (90.4%) | 402 (9.6%) |
| 45 to 54 Years | 3,610 (95.2%) | 184 (4.9%) |
| 55 to 64 Years | 3,615 (96.2%) | 142 (3.8%) |
| 65 to 74 Years | 3,186 (97.1%) | 97 (2.9%) |
| 75 Years and older | 2,377 (100.0%) | 0 (0.0%) |
| Total | 29,577 (93.4%) | 2,094 (6.6%) |
Health Insurance Coverage by Citizenship Status in Florence
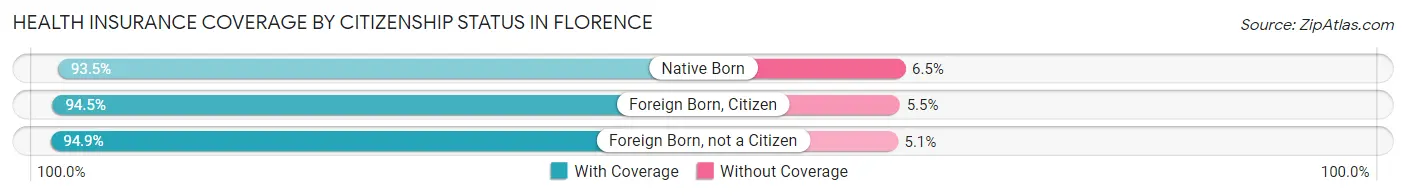
| Citizenship Status | With Coverage | Without Coverage |
| Native Born | 2,274 (93.5%) | 159 (6.5%) |
| Foreign Born, Citizen | 4,462 (94.5%) | 259 (5.5%) |
| Foreign Born, not a Citizen | 2,554 (94.9%) | 136 (5.1%) |
Health Insurance Coverage by Household Income in Florence
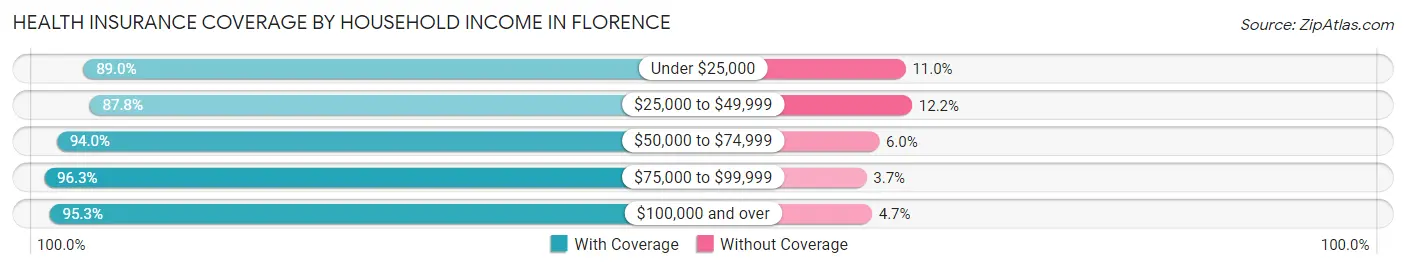
| Household Income | With Coverage | Without Coverage |
| Under $25,000 | 2,429 (89.0%) | 300 (11.0%) |
| $25,000 to $49,999 | 4,652 (87.8%) | 646 (12.2%) |
| $50,000 to $74,999 | 6,279 (94.0%) | 402 (6.0%) |
| $75,000 to $99,999 | 4,304 (96.3%) | 164 (3.7%) |
| $100,000 and over | 11,846 (95.3%) | 582 (4.7%) |
Public vs Private Health Insurance Coverage by Age in Florence
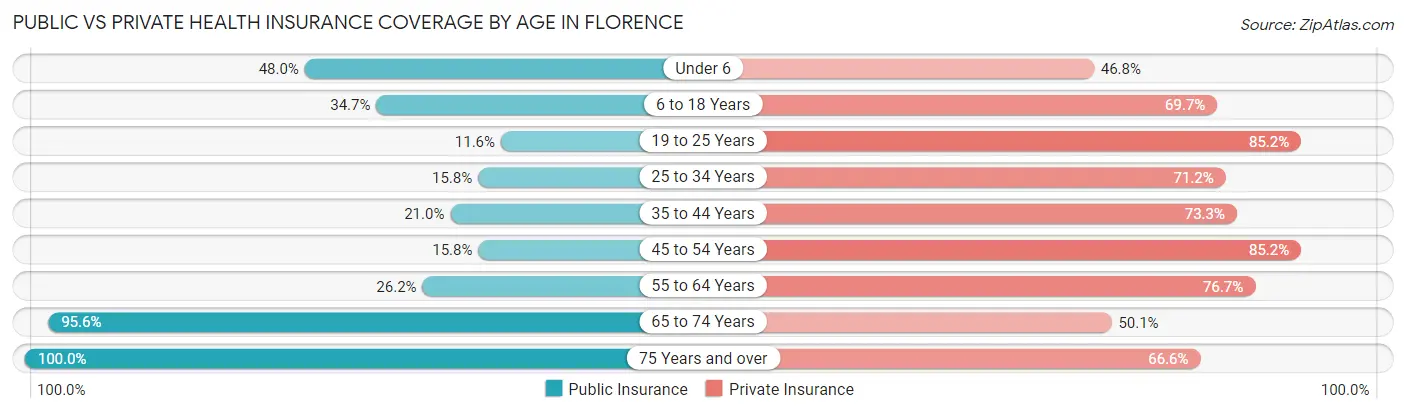
| Age Bracket | Public Insurance | Private Insurance |
| Under 6 | 1,168 (48.0%) | 1,138 (46.8%) |
| 6 to 18 Years | 1,639 (34.7%) | 3,289 (69.7%) |
| 19 to 25 Years | 312 (11.6%) | 2,293 (85.2%) |
| 25 to 34 Years | 700 (15.8%) | 3,149 (71.2%) |
| 35 to 44 Years | 881 (21.0%) | 3,076 (73.3%) |
| 45 to 54 Years | 599 (15.8%) | 3,234 (85.2%) |
| 55 to 64 Years | 983 (26.2%) | 2,882 (76.7%) |
| 65 to 74 Years | 3,139 (95.6%) | 1,643 (50.0%) |
| 75 Years and over | 2,376 (100.0%) | 1,582 (66.5%) |
| Total | 11,797 (37.2%) | 22,286 (70.4%) |
Disability Status by Sex by Age in Florence
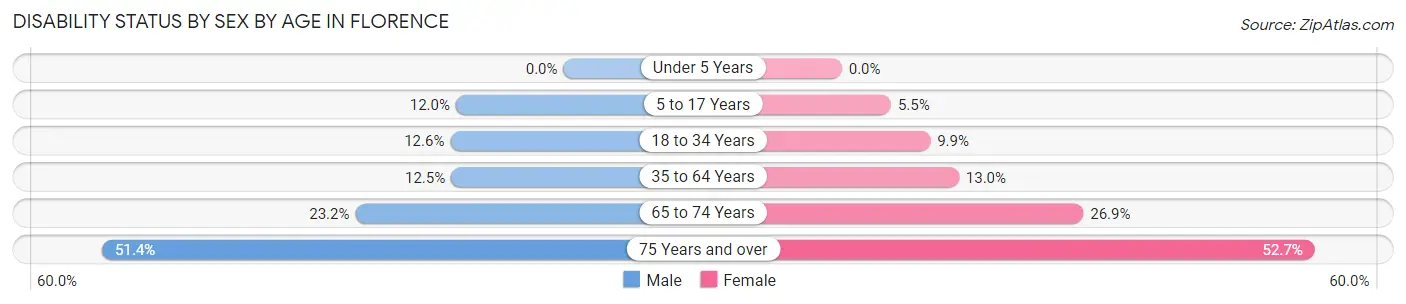
| Age Bracket | Male | Female |
| Under 5 Years | 0 (0.0%) | 0 (0.0%) |
| 5 to 17 Years | 268 (12.0%) | 142 (5.5%) |
| 18 to 34 Years | 534 (12.6%) | 302 (9.9%) |
| 35 to 64 Years | 749 (12.5%) | 751 (13.0%) |
| 65 to 74 Years | 349 (23.2%) | 478 (26.9%) |
| 75 Years and over | 429 (51.4%) | 812 (52.7%) |
Disability Class by Sex by Age in Florence
Disability Class: Hearing Difficulty
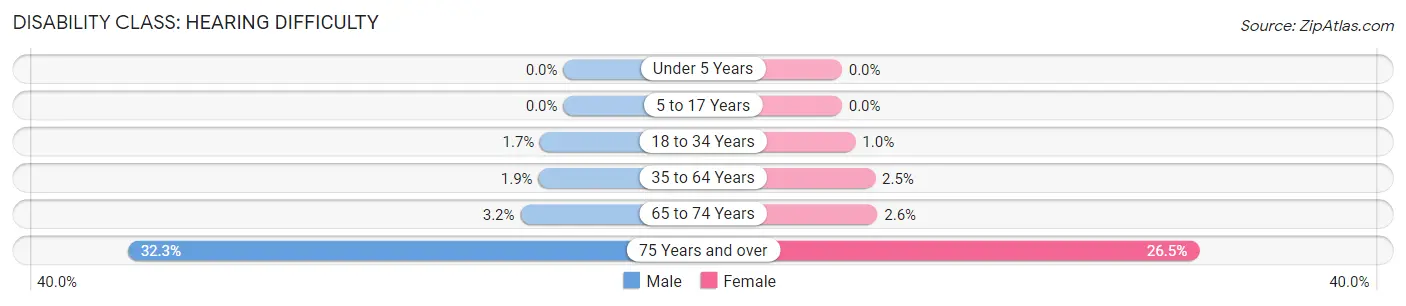
| Age Bracket | Male | Female |
| Under 5 Years | 0 (0.0%) | 0 (0.0%) |
| 5 to 17 Years | 0 (0.0%) | 0 (0.0%) |
| 18 to 34 Years | 73 (1.7%) | 31 (1.0%) |
| 35 to 64 Years | 111 (1.8%) | 142 (2.5%) |
| 65 to 74 Years | 48 (3.2%) | 47 (2.6%) |
| 75 Years and over | 270 (32.3%) | 409 (26.5%) |
Disability Class: Vision Difficulty
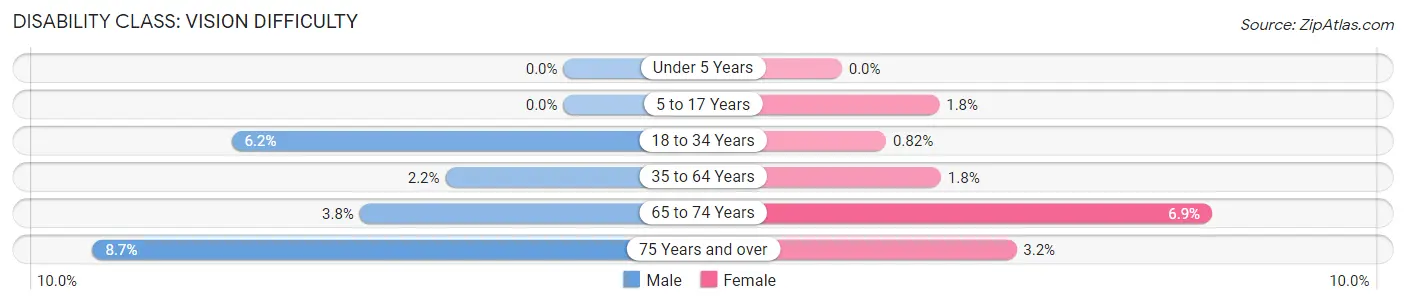
| Age Bracket | Male | Female |
| Under 5 Years | 0 (0.0%) | 0 (0.0%) |
| 5 to 17 Years | 0 (0.0%) | 47 (1.8%) |
| 18 to 34 Years | 261 (6.2%) | 25 (0.8%) |
| 35 to 64 Years | 131 (2.2%) | 106 (1.8%) |
| 65 to 74 Years | 57 (3.8%) | 122 (6.9%) |
| 75 Years and over | 73 (8.7%) | 50 (3.2%) |
Disability Class: Cognitive Difficulty
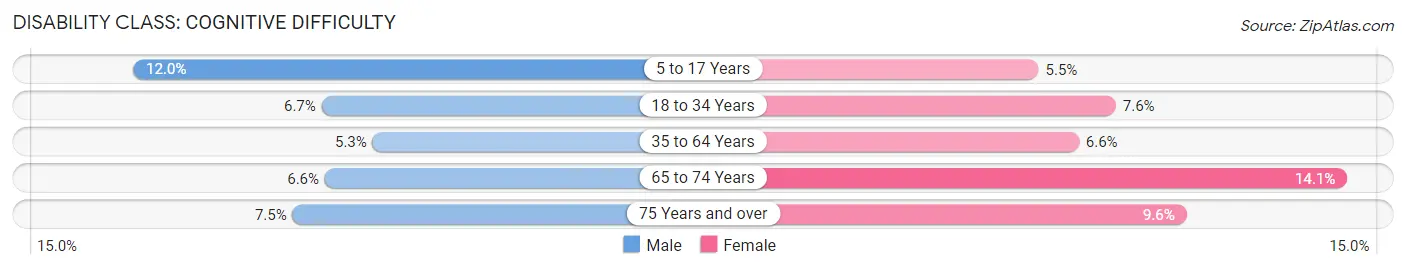
| Age Bracket | Male | Female |
| 5 to 17 Years | 268 (12.0%) | 142 (5.5%) |
| 18 to 34 Years | 285 (6.7%) | 234 (7.6%) |
| 35 to 64 Years | 318 (5.3%) | 380 (6.6%) |
| 65 to 74 Years | 100 (6.6%) | 250 (14.1%) |
| 75 Years and over | 63 (7.5%) | 148 (9.6%) |
Disability Class: Ambulatory Difficulty
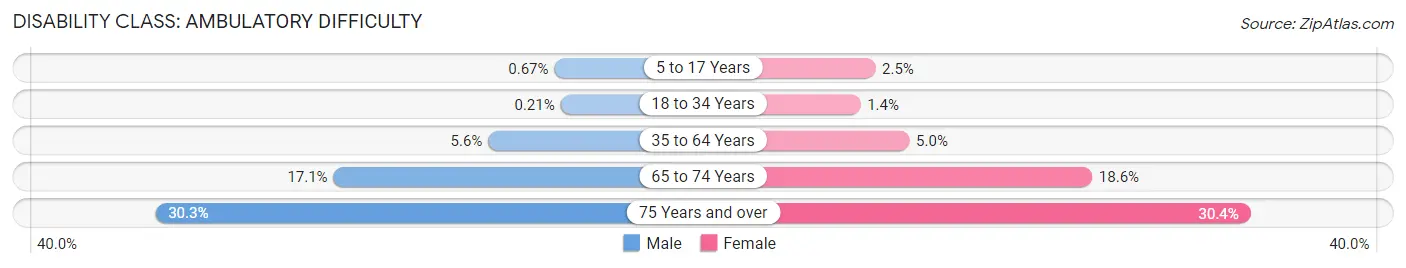
| Age Bracket | Male | Female |
| 5 to 17 Years | 15 (0.7%) | 64 (2.5%) |
| 18 to 34 Years | 9 (0.2%) | 42 (1.4%) |
| 35 to 64 Years | 334 (5.6%) | 288 (5.0%) |
| 65 to 74 Years | 257 (17.1%) | 330 (18.6%) |
| 75 Years and over | 253 (30.3%) | 468 (30.3%) |
Disability Class: Self-Care Difficulty
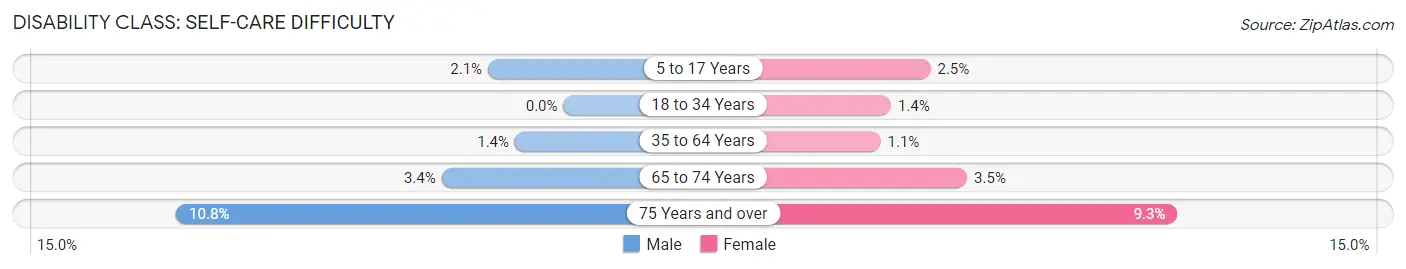
| Age Bracket | Male | Female |
| 5 to 17 Years | 47 (2.1%) | 64 (2.5%) |
| 18 to 34 Years | 0 (0.0%) | 42 (1.4%) |
| 35 to 64 Years | 81 (1.3%) | 62 (1.1%) |
| 65 to 74 Years | 51 (3.4%) | 62 (3.5%) |
| 75 Years and over | 90 (10.8%) | 144 (9.3%) |
Technology Access in Florence
Computing Device Access in Florence
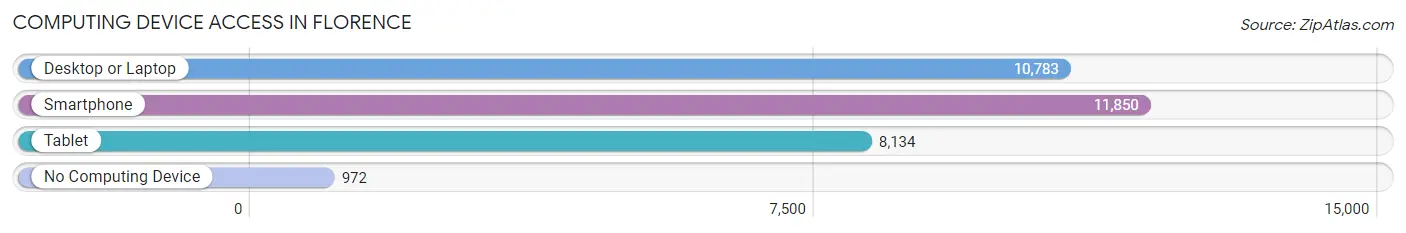
| Device Type | # Households | % Households |
| Desktop or Laptop | 10,783 | 78.4% |
| Smartphone | 11,850 | 86.1% |
| Tablet | 8,134 | 59.1% |
| No Computing Device | 972 | 7.1% |
| Total | 13,760 | 100.0% |
Internet Access in Florence
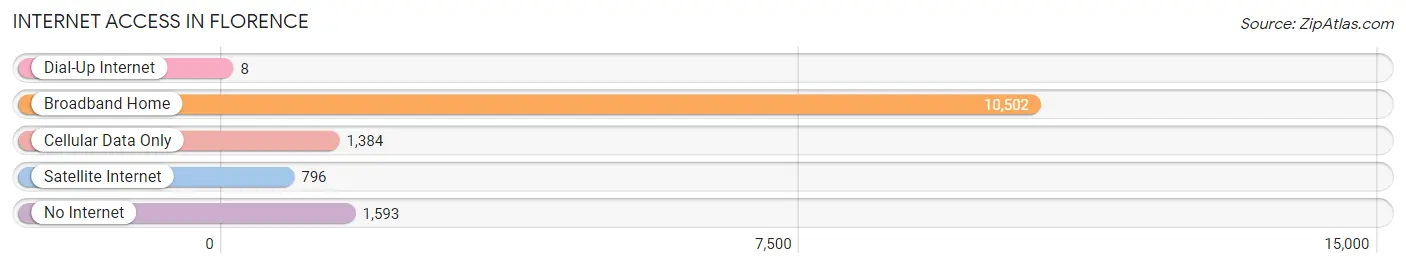
| Internet Type | # Households | % Households |
| Dial-Up Internet | 8 | 0.1% |
| Broadband Home | 10,502 | 76.3% |
| Cellular Data Only | 1,384 | 10.1% |
| Satellite Internet | 796 | 5.8% |
| No Internet | 1,593 | 11.6% |
| Total | 13,760 | 100.0% |
Florence Summary
Florence, Kentucky is a city located in Boone County, Kentucky, United States. It is part of the Cincinnati metropolitan area and is located about 20 miles south of downtown Cincinnati. The population of Florence was 29,951 at the 2010 census, making it the largest city in Boone County.
History
Florence was founded in 1794 by Revolutionary War veteran James Wilkinson. He named the city after his daughter, Florence. The city was incorporated in 1818 and was the county seat of Boone County until the county seat was moved to Burlington in 1842.
Florence was a major stop on the Underground Railroad, with many slaves escaping to freedom in the North. The city was also home to the first public school in Boone County, which opened in 1820.
In the late 19th century, Florence was a major center for the tobacco industry. The city was home to several tobacco warehouses and factories, as well as a major tobacco auction house.
Geography
Florence is located in northern Boone County, at the intersection of Interstate 71 and U.S. Route 42. It is about 20 miles south of downtown Cincinnati. The city is situated on the banks of the Ohio River, and is bordered by the cities of Union, Walton, and Burlington.
The city has a total area of 8.3 square miles, of which 8.2 square miles is land and 0.1 square miles is water.
Economy
Florence is home to several major employers, including St. Elizabeth Healthcare, DHL, and Amazon. The city is also home to several manufacturing companies, including Toyota Motor Manufacturing Kentucky, which produces the Camry, Avalon, and Lexus ES.
Florence is also home to several shopping centers, including Florence Mall, Florence Antique Mall, and Florence Marketplace.
Demographics
As of the 2010 census, there were 29,951 people, 11,845 households, and 8,072 families residing in the city. The population density was 3,637.3 people per square mile. The racial makeup of the city was 87.3% White, 8.2% African American, 0.3% Native American, 1.3% Asian, 0.1% Pacific Islander, 1.2% from other races, and 1.6% from two or more races. Hispanic or Latino of any race were 3.2% of the population.
The median income for a household in the city was $50,945, and the median income for a family was $60,945. The per capita income for the city was $24,945. About 5.2% of families and 7.2% of the population were below the poverty line, including 9.2% of those under age 18 and 6.2% of those age 65 or over.
Common Questions
What is Per Capita Income in Florence?
Per Capita income in Florence is $37,232.
What is the Median Family Income in Florence?
Median Family Income in Florence is $78,591.
What is the Median Household income in Florence?
Median Household Income in Florence is $67,352.
What is Income or Wage Gap in Florence?
Income or Wage Gap in Florence is 22.2%.
Women in Florence earn 77.8 cents for every dollar earned by a man.
What is Inequality or Gini Index in Florence?
Inequality or Gini Index in Florence is 0.39.
What is the Total Population of Florence?
Total Population of Florence is 32,056.
What is the Total Male Population of Florence?
Total Male Population of Florence is 16,012.
What is the Total Female Population of Florence?
Total Female Population of Florence is 16,044.
What is the Ratio of Males per 100 Females in Florence?
There are 99.80 Males per 100 Females in Florence.
What is the Ratio of Females per 100 Males in Florence?
There are 100.20 Females per 100 Males in Florence.
What is the Median Population Age in Florence?
Median Population Age in Florence is 39.3 Years.
What is the Average Family Size in Florence
Average Family Size in Florence is 3.0 People.
What is the Average Household Size in Florence
Average Household Size in Florence is 2.3 People.
How Large is the Labor Force in Florence?
There are 16,973 People in the Labor Forcein in Florence.
What is the Percentage of People in the Labor Force in Florence?
65.0% of People are in the Labor Force in Florence.
What is the Unemployment Rate in Florence?
Unemployment Rate in Florence is 2.8%.