Pearland, TX Map & Demographics
Pearland Map
Pearland Overview
$47,077
PER CAPITA INCOME
$129,972
AVG FAMILY INCOME
$111,123
AVG HOUSEHOLD INCOME
20.2%
WAGE / INCOME GAP [ % ]
79.8¢/ $1
WAGE / INCOME GAP [ $ ]
0.40
INEQUALITY / GINI INDEX
124,478
TOTAL POPULATION
60,438
MALE POPULATION
64,040
FEMALE POPULATION
94.38
MALES / 100 FEMALES
105.96
FEMALES / 100 MALES
36.2
MEDIAN AGE
3.4
AVG FAMILY SIZE
2.9
AVG HOUSEHOLD SIZE
64,494
LABOR FORCE [ PEOPLE ]
68.6%
PERCENT IN LABOR FORCE
3.2%
UNEMPLOYMENT RATE
Income in Pearland
Income Overview in Pearland
Per Capita Income in Pearland is $47,077, while median incomes of families and households are $129,972 and $111,123 respectively.
| Characteristic | Number | Measure |
| Per Capita Income | 124,478 | $47,077 |
| Median Family Income | 31,819 | $129,972 |
| Mean Family Income | 31,819 | $154,677 |
| Median Household Income | 42,451 | $111,123 |
| Mean Household Income | 42,451 | $136,934 |
| Income Deficit | 31,819 | $0 |
| Wage / Income Gap (%) | 124,478 | 20.22% |
| Wage / Income Gap ($) | 124,478 | 79.78¢ per $1 |
| Gini / Inequality Index | 124,478 | 0.40 |
Earnings by Sex in Pearland
Average Earnings in Pearland are $62,716, $69,939 for men and $55,799 for women, a difference of 20.2%.
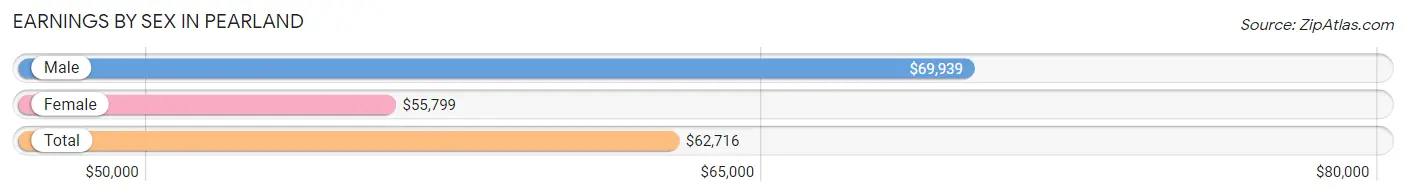
| Sex | Number | Average Earnings |
| Male | 35,681 (53.3%) | $69,939 |
| Female | 31,251 (46.7%) | $55,799 |
| Total | 66,932 (100.0%) | $62,716 |
Earnings by Sex by Income Bracket in Pearland
The most common earnings brackets in Pearland are $100,000+ for men (10,671 | 29.9%) and $100,000+ for women (5,852 | 18.7%).
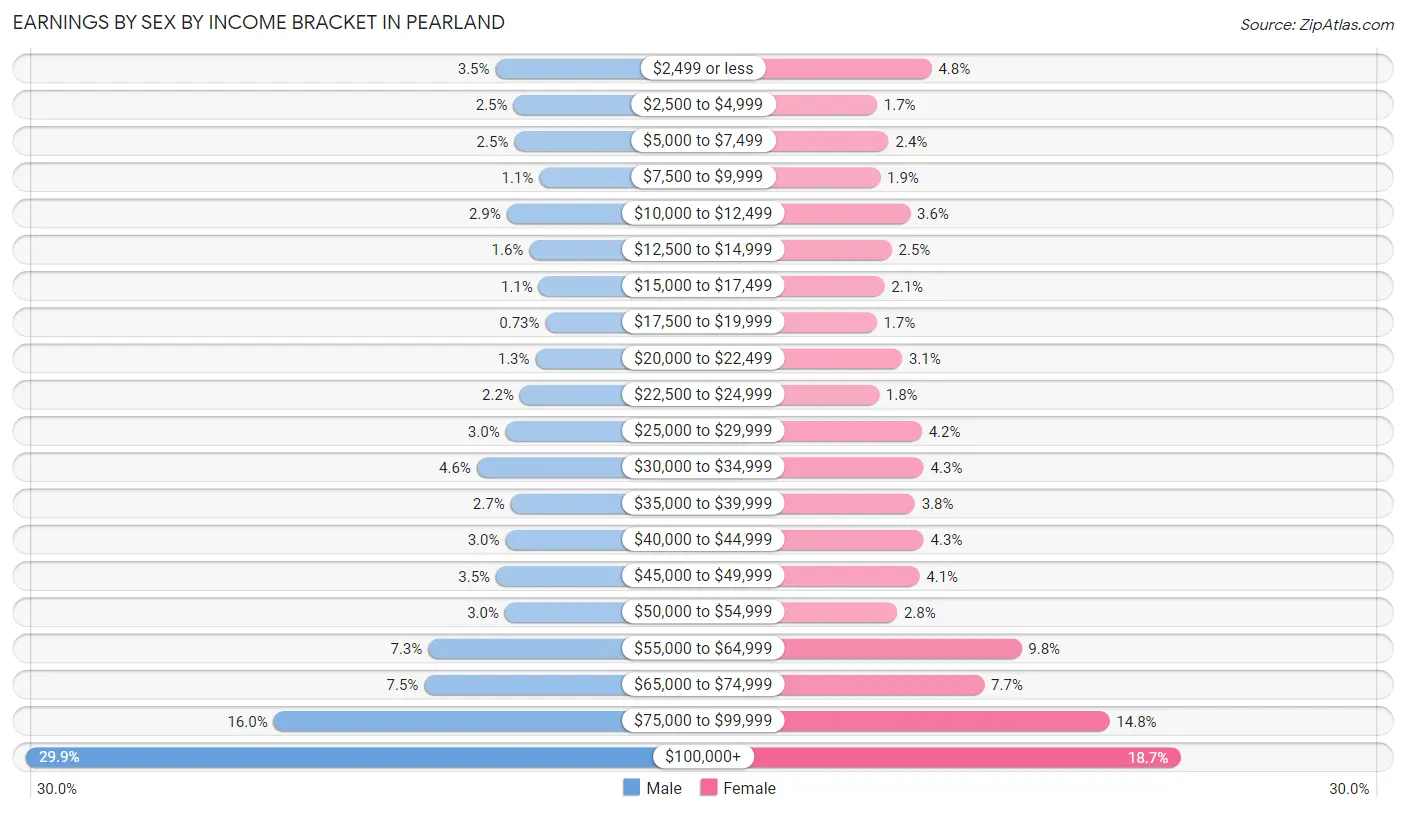
| Income | Male | Female |
| $2,499 or less | 1,263 (3.5%) | 1,486 (4.8%) |
| $2,500 to $4,999 | 901 (2.5%) | 528 (1.7%) |
| $5,000 to $7,499 | 886 (2.5%) | 734 (2.4%) |
| $7,500 to $9,999 | 385 (1.1%) | 584 (1.9%) |
| $10,000 to $12,499 | 1,038 (2.9%) | 1,112 (3.6%) |
| $12,500 to $14,999 | 584 (1.6%) | 787 (2.5%) |
| $15,000 to $17,499 | 397 (1.1%) | 660 (2.1%) |
| $17,500 to $19,999 | 262 (0.7%) | 521 (1.7%) |
| $20,000 to $22,499 | 459 (1.3%) | 970 (3.1%) |
| $22,500 to $24,999 | 775 (2.2%) | 562 (1.8%) |
| $25,000 to $29,999 | 1,060 (3.0%) | 1,315 (4.2%) |
| $30,000 to $34,999 | 1,638 (4.6%) | 1,351 (4.3%) |
| $35,000 to $39,999 | 960 (2.7%) | 1,195 (3.8%) |
| $40,000 to $44,999 | 1,063 (3.0%) | 1,349 (4.3%) |
| $45,000 to $49,999 | 1,251 (3.5%) | 1,275 (4.1%) |
| $50,000 to $54,999 | 1,074 (3.0%) | 880 (2.8%) |
| $55,000 to $64,999 | 2,611 (7.3%) | 3,065 (9.8%) |
| $65,000 to $74,999 | 2,689 (7.5%) | 2,413 (7.7%) |
| $75,000 to $99,999 | 5,714 (16.0%) | 4,612 (14.8%) |
| $100,000+ | 10,671 (29.9%) | 5,852 (18.7%) |
| Total | 35,681 (100.0%) | 31,251 (100.0%) |
Earnings by Sex by Educational Attainment in Pearland
Average earnings in Pearland are $76,120 for men and $60,325 for women, a difference of 20.7%. Men with an educational attainment of graduate degree enjoy the highest average annual earnings of $110,256, while those with less than high school education earn the least with $59,115. Women with an educational attainment of graduate degree earn the most with the average annual earnings of $88,293, while those with less than high school education have the smallest earnings of $21,420.
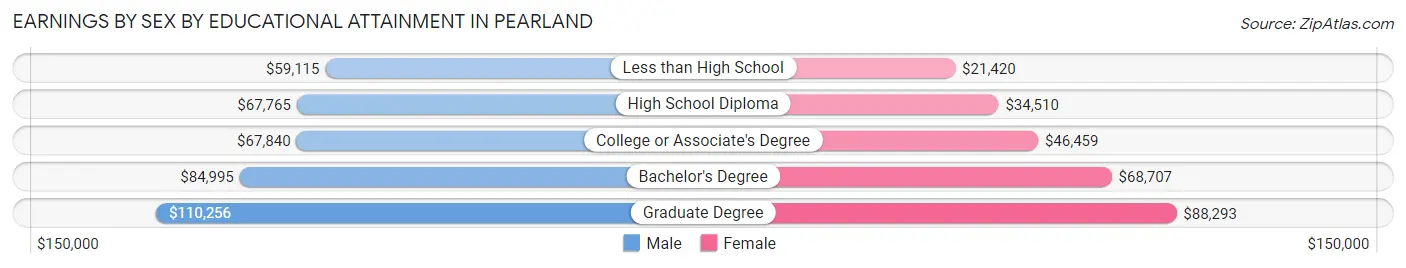
| Educational Attainment | Male Income | Female Income |
| Less than High School | $59,115 | $21,420 |
| High School Diploma | $67,765 | $34,510 |
| College or Associate's Degree | $67,840 | $46,459 |
| Bachelor's Degree | $84,995 | $68,707 |
| Graduate Degree | $110,256 | $88,293 |
| Total | $76,120 | $60,325 |
Family Income in Pearland
Family Income Brackets in Pearland
According to the Pearland family income data, there are 7,637 families falling into the $100,000 to $149,999 income range, which is the most common income bracket and makes up 24.0% of all families. Conversely, the $10,000 to $14,999 income bracket is the least frequent group with only 127 families (0.4%) belonging to this category.
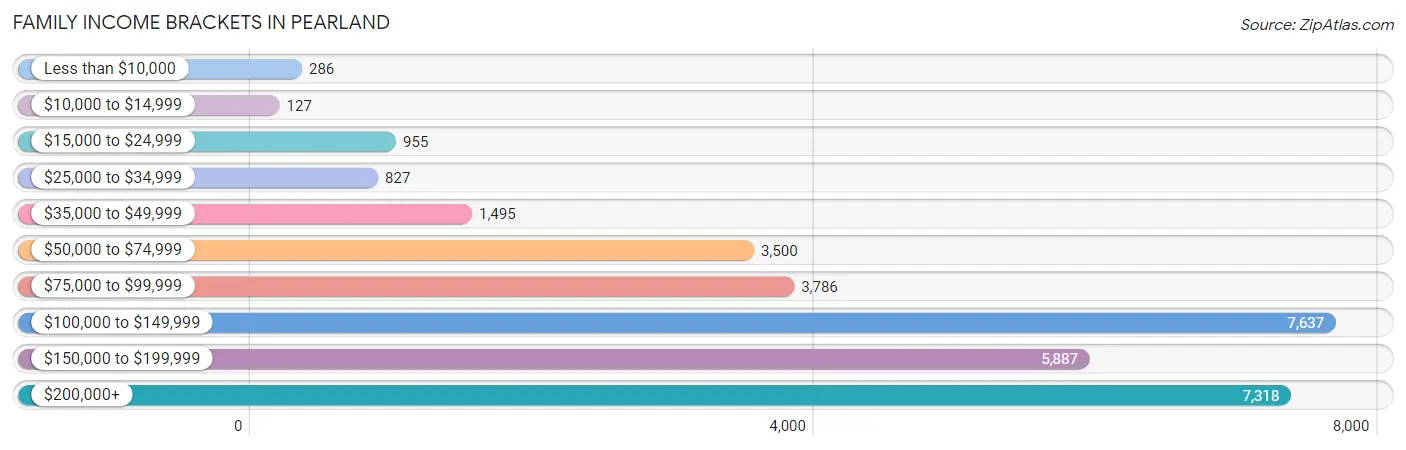
| Income Bracket | # Families | % Families |
| Less than $10,000 | 286 | 0.9% |
| $10,000 to $14,999 | 127 | 0.4% |
| $15,000 to $24,999 | 955 | 3.0% |
| $25,000 to $34,999 | 827 | 2.6% |
| $35,000 to $49,999 | 1,495 | 4.7% |
| $50,000 to $74,999 | 3,500 | 11.0% |
| $75,000 to $99,999 | 3,786 | 11.9% |
| $100,000 to $149,999 | 7,637 | 24.0% |
| $150,000 to $199,999 | 5,887 | 18.5% |
| $200,000+ | 7,318 | 23.0% |
Family Income by Famaliy Size in Pearland
7+ person families (599 | 1.9%) account for the highest median family income in Pearland with $187,472 per family, while 2-person families (10,923 | 34.3%) have the highest median income of $55,563 per family member.
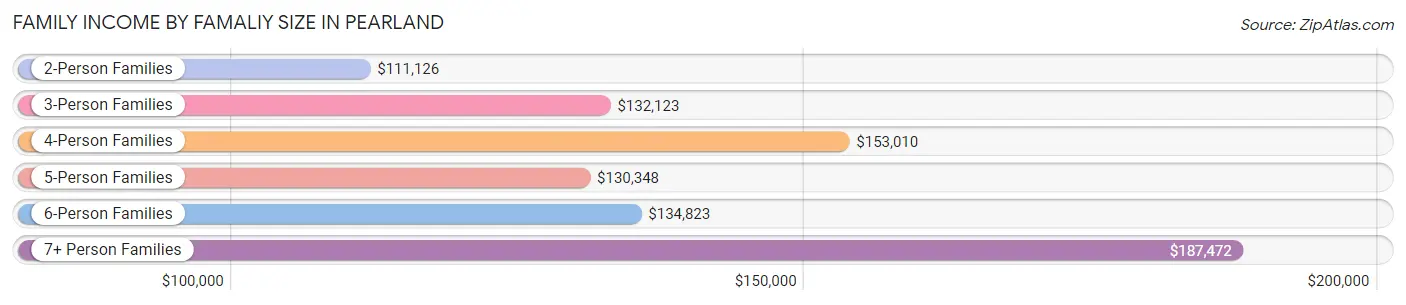
| Income Bracket | # Families | Median Income |
| 2-Person Families | 10,923 (34.3%) | $111,126 |
| 3-Person Families | 6,915 (21.7%) | $132,123 |
| 4-Person Families | 8,736 (27.5%) | $153,010 |
| 5-Person Families | 3,434 (10.8%) | $130,348 |
| 6-Person Families | 1,212 (3.8%) | $134,823 |
| 7+ Person Families | 599 (1.9%) | $187,472 |
| Total | 31,819 (100.0%) | $129,972 |
Family Income by Number of Earners in Pearland
The median family income in Pearland is $129,972, with families comprising 3+ earners (4,390) having the highest median family income of $185,056, while families with no earners (2,491) have the lowest median family income of $56,250, accounting for 13.8% and 7.8% of families, respectively.
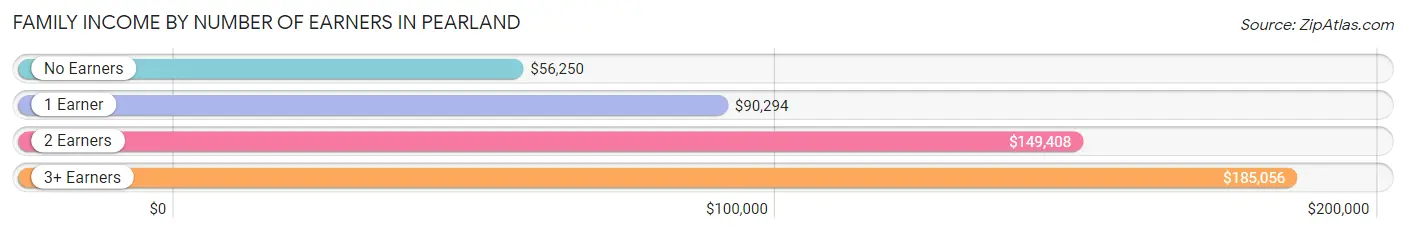
| Number of Earners | # Families | Median Income |
| No Earners | 2,491 (7.8%) | $56,250 |
| 1 Earner | 9,538 (30.0%) | $90,294 |
| 2 Earners | 15,400 (48.4%) | $149,408 |
| 3+ Earners | 4,390 (13.8%) | $185,056 |
| Total | 31,819 (100.0%) | $129,972 |
Household Income in Pearland
Household Income Brackets in Pearland
With 9,721 households falling in the category, the $100,000 to $149,999 income range is the most frequent in Pearland, accounting for 22.9% of all households. In contrast, only 509 households (1.2%) fall into the $10,000 to $14,999 income bracket, making it the least populous group.
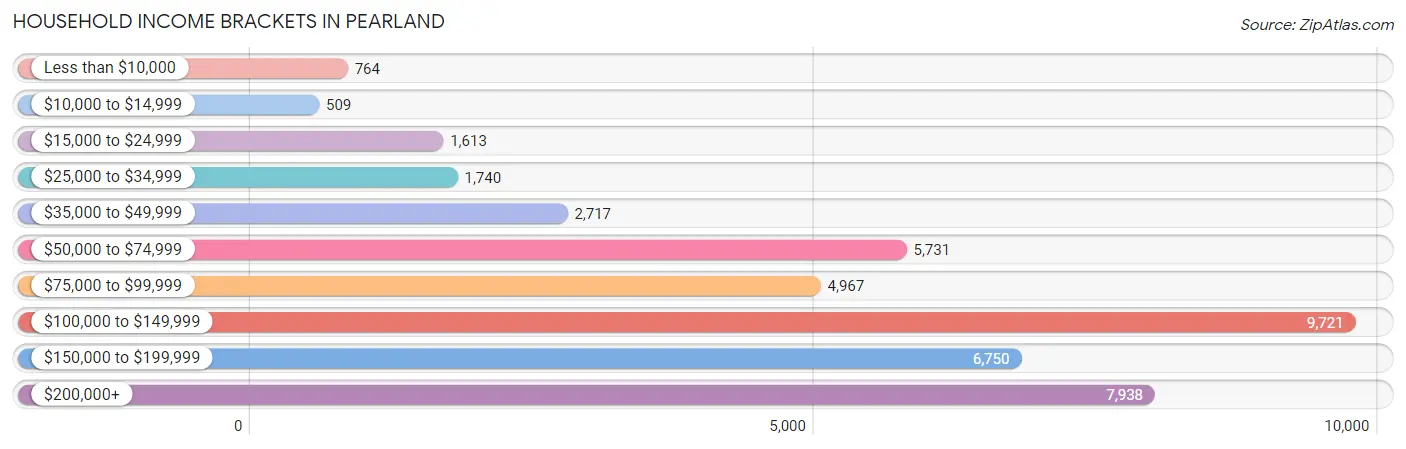
| Income Bracket | # Households | % Households |
| Less than $10,000 | 764 | 1.8% |
| $10,000 to $14,999 | 509 | 1.2% |
| $15,000 to $24,999 | 1,613 | 3.8% |
| $25,000 to $34,999 | 1,740 | 4.1% |
| $35,000 to $49,999 | 2,717 | 6.4% |
| $50,000 to $74,999 | 5,731 | 13.5% |
| $75,000 to $99,999 | 4,967 | 11.7% |
| $100,000 to $149,999 | 9,721 | 22.9% |
| $150,000 to $199,999 | 6,750 | 15.9% |
| $200,000+ | 7,938 | 18.7% |
Household Income by Householder Age in Pearland
The median household income in Pearland is $111,123, with the highest median household income of $133,758 found in the 45 to 64 years age bracket for the primary householder. A total of 16,207 households (38.2%) fall into this category. Meanwhile, the 65+ years age bracket for the primary householder has the lowest median household income of $62,368, with 7,981 households (18.8%) in this group.
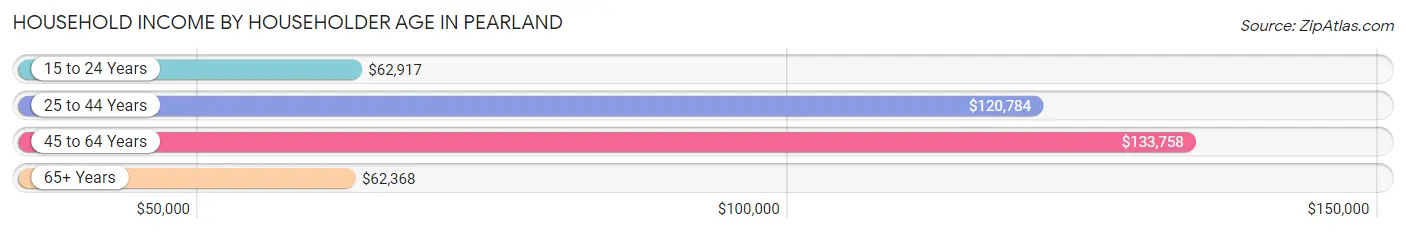
| Income Bracket | # Households | Median Income |
| 15 to 24 Years | 937 (2.2%) | $62,917 |
| 25 to 44 Years | 17,326 (40.8%) | $120,784 |
| 45 to 64 Years | 16,207 (38.2%) | $133,758 |
| 65+ Years | 7,981 (18.8%) | $62,368 |
| Total | 42,451 (100.0%) | $111,123 |
Poverty in Pearland
Income Below Poverty by Sex and Age in Pearland
With 3.7% poverty level for males and 5.3% for females among the residents of Pearland, 18 to 24 year old males and 16 and 17 year old females are the most vulnerable to poverty, with 465 males (9.1%) and 176 females (10.2%) in their respective age groups living below the poverty level.
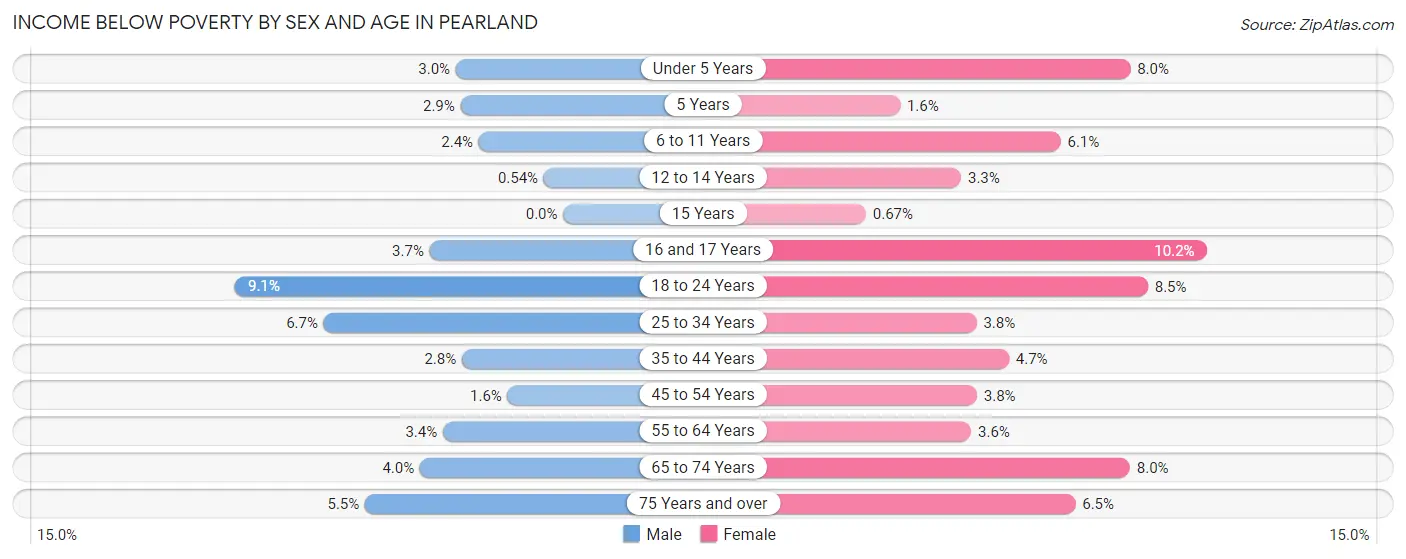
| Age Bracket | Male | Female |
| Under 5 Years | 129 (3.0%) | 382 (8.0%) |
| 5 Years | 24 (2.9%) | 14 (1.6%) |
| 6 to 11 Years | 148 (2.4%) | 338 (6.1%) |
| 12 to 14 Years | 14 (0.5%) | 106 (3.3%) |
| 15 Years | 0 (0.0%) | 6 (0.7%) |
| 16 and 17 Years | 98 (3.7%) | 176 (10.2%) |
| 18 to 24 Years | 465 (9.1%) | 324 (8.5%) |
| 25 to 34 Years | 487 (6.7%) | 336 (3.7%) |
| 35 to 44 Years | 277 (2.8%) | 501 (4.6%) |
| 45 to 54 Years | 125 (1.5%) | 319 (3.8%) |
| 55 to 64 Years | 207 (3.4%) | 231 (3.6%) |
| 65 to 74 Years | 157 (4.0%) | 418 (8.0%) |
| 75 Years and over | 115 (5.5%) | 195 (6.5%) |
| Total | 2,246 (3.7%) | 3,346 (5.3%) |
Income Above Poverty by Sex and Age in Pearland
According to the poverty statistics in Pearland, males aged 15 years and females aged 15 years are the age groups that are most secure financially, with 100.0% of males and 99.3% of females in these age groups living above the poverty line.
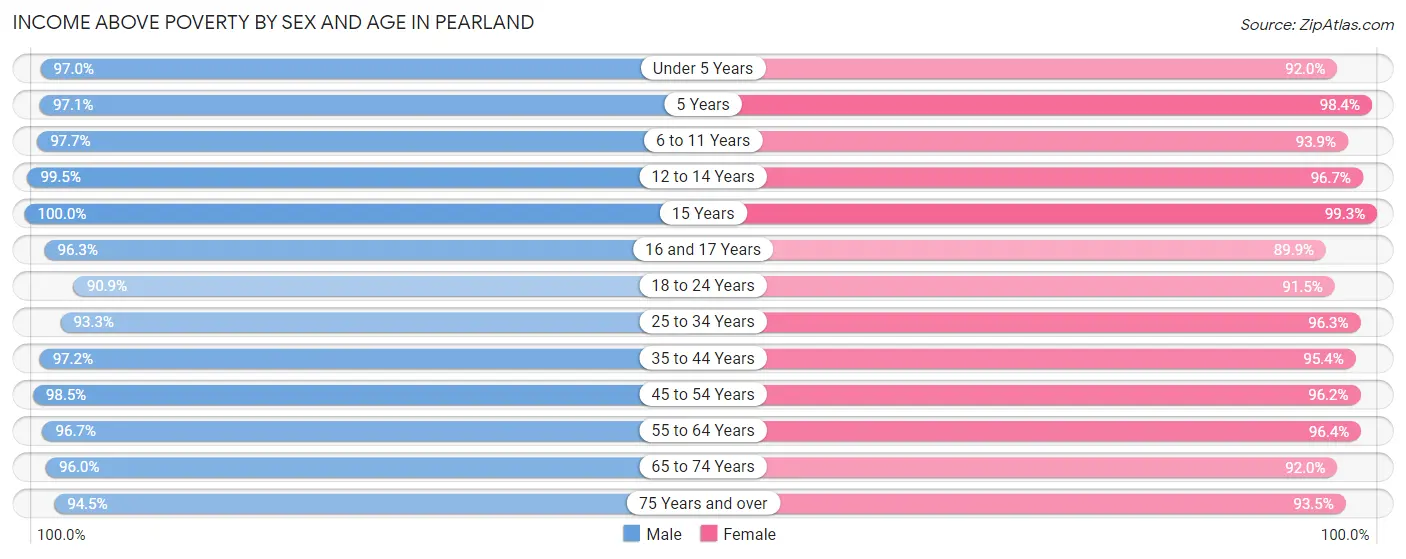
| Age Bracket | Male | Female |
| Under 5 Years | 4,183 (97.0%) | 4,374 (92.0%) |
| 5 Years | 815 (97.1%) | 849 (98.4%) |
| 6 to 11 Years | 6,140 (97.7%) | 5,208 (93.9%) |
| 12 to 14 Years | 2,585 (99.5%) | 3,088 (96.7%) |
| 15 Years | 965 (100.0%) | 889 (99.3%) |
| 16 and 17 Years | 2,539 (96.3%) | 1,558 (89.8%) |
| 18 to 24 Years | 4,622 (90.9%) | 3,478 (91.5%) |
| 25 to 34 Years | 6,812 (93.3%) | 8,615 (96.3%) |
| 35 to 44 Years | 9,541 (97.2%) | 10,284 (95.4%) |
| 45 to 54 Years | 7,964 (98.5%) | 8,176 (96.2%) |
| 55 to 64 Years | 5,974 (96.7%) | 6,181 (96.4%) |
| 65 to 74 Years | 3,776 (96.0%) | 4,791 (92.0%) |
| 75 Years and over | 1,968 (94.5%) | 2,803 (93.5%) |
| Total | 57,884 (96.3%) | 60,294 (94.7%) |
Income Below Poverty Among Married-Couple Families in Pearland
The poverty statistics for married-couple families in Pearland show that 2.5% or 654 of the total 26,556 families live below the poverty line. Families with 3 or 4 children have the highest poverty rate of 7.0%, comprising of 167 families. On the other hand, families with 5 or more children have the lowest poverty rate of 0.0%, which includes 0 families.
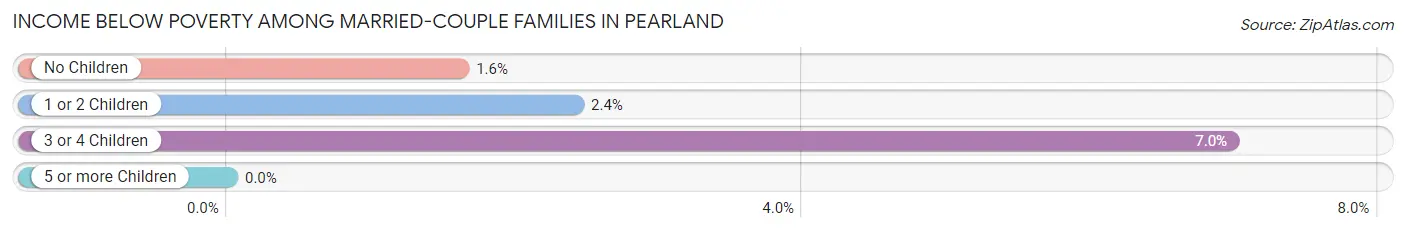
| Children | Above Poverty | Below Poverty |
| No Children | 11,373 (98.4%) | 186 (1.6%) |
| 1 or 2 Children | 12,205 (97.6%) | 301 (2.4%) |
| 3 or 4 Children | 2,229 (93.0%) | 167 (7.0%) |
| 5 or more Children | 95 (100.0%) | 0 (0.0%) |
| Total | 25,902 (97.5%) | 654 (2.5%) |
Income Below Poverty Among Single-Parent Households in Pearland
According to the poverty data in Pearland, 1.5% or 20 single-father households and 4.7% or 183 single-mother households are living below the poverty line. Among single-father households, those with 1 or 2 children have the highest poverty rate, with 20 households (3.1%) experiencing poverty. Likewise, among single-mother households, those with 3 or 4 children have the highest poverty rate, with 61 households (15.6%) falling below the poverty line.
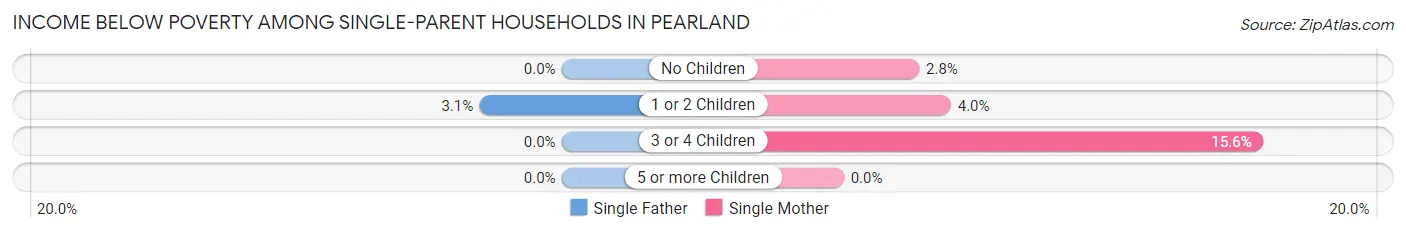
| Children | Single Father | Single Mother |
| No Children | 0 (0.0%) | 41 (2.8%) |
| 1 or 2 Children | 20 (3.1%) | 81 (4.0%) |
| 3 or 4 Children | 0 (0.0%) | 61 (15.6%) |
| 5 or more Children | 0 (0.0%) | 0 (0.0%) |
| Total | 20 (1.5%) | 183 (4.7%) |
Income Below Poverty Among Married-Couple vs Single-Parent Households in Pearland
The poverty data for Pearland shows that 654 of the married-couple family households (2.5%) and 203 of the single-parent households (3.9%) are living below the poverty level. Within the married-couple family households, those with 3 or 4 children have the highest poverty rate, with 167 households (7.0%) falling below the poverty line. Among the single-parent households, those with 3 or 4 children have the highest poverty rate, with 61 household (12.2%) living below poverty.
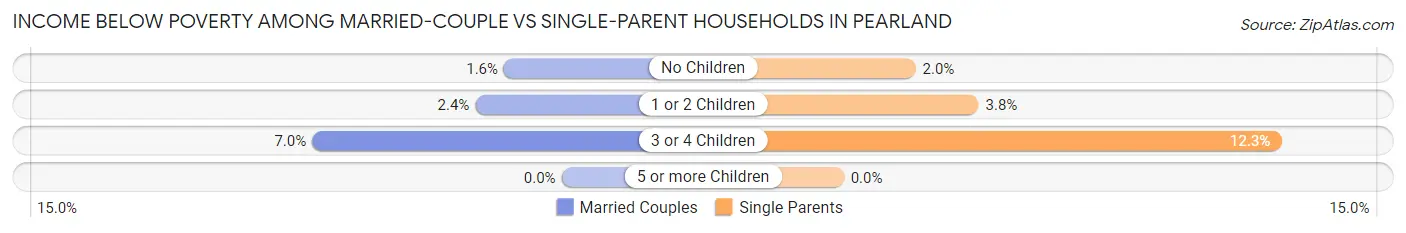
| Children | Married-Couple Families | Single-Parent Households |
| No Children | 186 (1.6%) | 41 (2.0%) |
| 1 or 2 Children | 301 (2.4%) | 101 (3.8%) |
| 3 or 4 Children | 167 (7.0%) | 61 (12.2%) |
| 5 or more Children | 0 (0.0%) | 0 (0.0%) |
| Total | 654 (2.5%) | 203 (3.9%) |
Race in Pearland
The most populous races in Pearland are White / Caucasian (61,045 | 49.0%), Hispanic or Latino (32,831 | 26.4%), and Black / African American (23,059 | 18.5%).
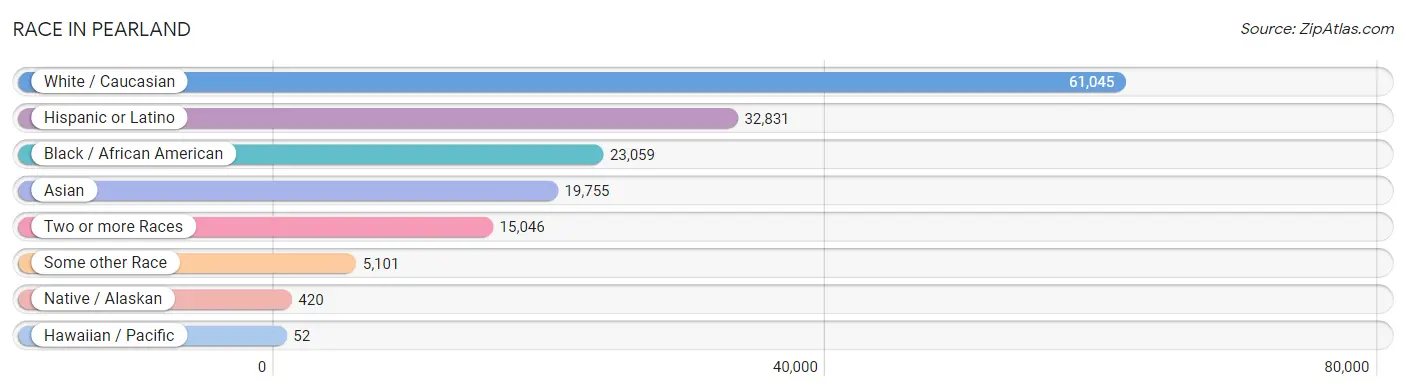
| Race | # Population | % Population |
| Asian | 19,755 | 15.9% |
| Black / African American | 23,059 | 18.5% |
| Hawaiian / Pacific | 52 | 0.0% |
| Hispanic or Latino | 32,831 | 26.4% |
| Native / Alaskan | 420 | 0.3% |
| White / Caucasian | 61,045 | 49.0% |
| Two or more Races | 15,046 | 12.1% |
| Some other Race | 5,101 | 4.1% |
| Total | 124,478 | 100.0% |
Ancestry in Pearland
The most populous ancestries reported in Pearland are Mexican (25,089 | 20.2%), German (10,340 | 8.3%), English (9,016 | 7.2%), Irish (8,591 | 6.9%), and Thai (5,808 | 4.7%), together accounting for 47.3% of all Pearland residents.
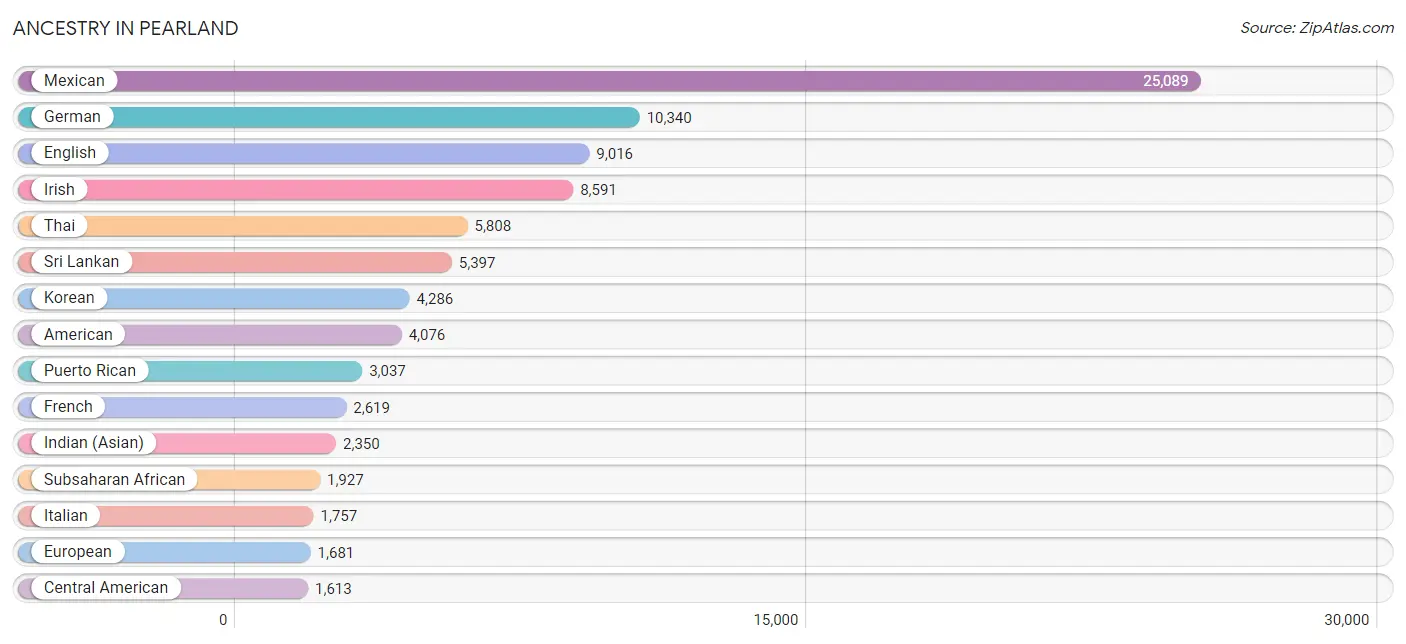
| Ancestry | # Population | % Population |
| African | 915 | 0.7% |
| Albanian | 67 | 0.1% |
| American | 4,076 | 3.3% |
| Apache | 38 | 0.0% |
| Arab | 874 | 0.7% |
| Argentinean | 33 | 0.0% |
| Austrian | 286 | 0.2% |
| Barbadian | 19 | 0.0% |
| Belgian | 60 | 0.1% |
| Bhutanese | 201 | 0.2% |
| Blackfeet | 33 | 0.0% |
| Bolivian | 8 | 0.0% |
| Brazilian | 83 | 0.1% |
| British | 1,177 | 0.9% |
| British West Indian | 9 | 0.0% |
| Burmese | 1,023 | 0.8% |
| Cajun | 96 | 0.1% |
| Canadian | 48 | 0.0% |
| Central American | 1,613 | 1.3% |
| Central American Indian | 120 | 0.1% |
| Cherokee | 176 | 0.1% |
| Chickasaw | 14 | 0.0% |
| Chippewa | 41 | 0.0% |
| Choctaw | 66 | 0.1% |
| Colombian | 324 | 0.3% |
| Costa Rican | 213 | 0.2% |
| Cree | 9 | 0.0% |
| Creek | 25 | 0.0% |
| Croatian | 48 | 0.0% |
| Cuban | 123 | 0.1% |
| Czech | 1,224 | 1.0% |
| Czechoslovakian | 90 | 0.1% |
| Danish | 213 | 0.2% |
| Dominican | 66 | 0.1% |
| Dutch | 861 | 0.7% |
| Dutch West Indian | 10 | 0.0% |
| Eastern European | 221 | 0.2% |
| Ecuadorian | 182 | 0.2% |
| Egyptian | 75 | 0.1% |
| English | 9,016 | 7.2% |
| Ethiopian | 110 | 0.1% |
| European | 1,681 | 1.3% |
| Filipino | 536 | 0.4% |
| Finnish | 72 | 0.1% |
| French | 2,619 | 2.1% |
| French Canadian | 272 | 0.2% |
| German | 10,340 | 8.3% |
| Greek | 259 | 0.2% |
| Haitian | 281 | 0.2% |
| Honduran | 411 | 0.3% |
| Hungarian | 326 | 0.3% |
| Icelander | 36 | 0.0% |
| Indian (Asian) | 2,350 | 1.9% |
| Indonesian | 14 | 0.0% |
| Inupiat | 48 | 0.0% |
| Iranian | 115 | 0.1% |
| Irish | 8,591 | 6.9% |
| Israeli | 37 | 0.0% |
| Italian | 1,757 | 1.4% |
| Jamaican | 72 | 0.1% |
| Japanese | 141 | 0.1% |
| Jordanian | 41 | 0.0% |
| Korean | 4,286 | 3.4% |
| Latvian | 36 | 0.0% |
| Lebanese | 180 | 0.1% |
| Lithuanian | 96 | 0.1% |
| Maltese | 36 | 0.0% |
| Mexican | 25,089 | 20.2% |
| Mexican American Indian | 66 | 0.1% |
| Mongolian | 38 | 0.0% |
| Native Hawaiian | 42 | 0.0% |
| Navajo | 38 | 0.0% |
| Nigerian | 401 | 0.3% |
| Northern European | 322 | 0.3% |
| Norwegian | 344 | 0.3% |
| Okinawan | 5 | 0.0% |
| Osage | 58 | 0.1% |
| Pakistani | 84 | 0.1% |
| Palestinian | 110 | 0.1% |
| Panamanian | 41 | 0.0% |
| Peruvian | 93 | 0.1% |
| Polish | 1,380 | 1.1% |
| Portuguese | 414 | 0.3% |
| Potawatomi | 15 | 0.0% |
| Pueblo | 32 | 0.0% |
| Puerto Rican | 3,037 | 2.4% |
| Russian | 455 | 0.4% |
| Salvadoran | 948 | 0.8% |
| Samoan | 30 | 0.0% |
| Scandinavian | 95 | 0.1% |
| Scotch-Irish | 623 | 0.5% |
| Scottish | 1,115 | 0.9% |
| Serbian | 14 | 0.0% |
| Sioux | 12 | 0.0% |
| Slovak | 127 | 0.1% |
| Slovene | 20 | 0.0% |
| South American | 1,337 | 1.1% |
| Spaniard | 326 | 0.3% |
| Spanish | 197 | 0.2% |
| Sri Lankan | 5,397 | 4.3% |
| Subsaharan African | 1,927 | 1.5% |
| Swedish | 485 | 0.4% |
| Swiss | 218 | 0.2% |
| Syrian | 15 | 0.0% |
| Thai | 5,808 | 4.7% |
| Tongan | 14 | 0.0% |
| Trinidadian and Tobagonian | 19 | 0.0% |
| Turkish | 30 | 0.0% |
| Ukrainian | 92 | 0.1% |
| Venezuelan | 697 | 0.6% |
| Vietnamese | 30 | 0.0% |
| Welsh | 241 | 0.2% |
| Yaqui | 2 | 0.0% |
| Zimbabwean | 7 | 0.0% | View All 114 Rows |
Immigrants in Pearland
The most numerous immigrant groups reported in Pearland came from Asia (13,754 | 11.1%), Latin America (6,808 | 5.5%), South Eastern Asia (6,022 | 4.8%), Central America (4,908 | 3.9%), and South Central Asia (4,864 | 3.9%), together accounting for 29.2% of all Pearland residents.
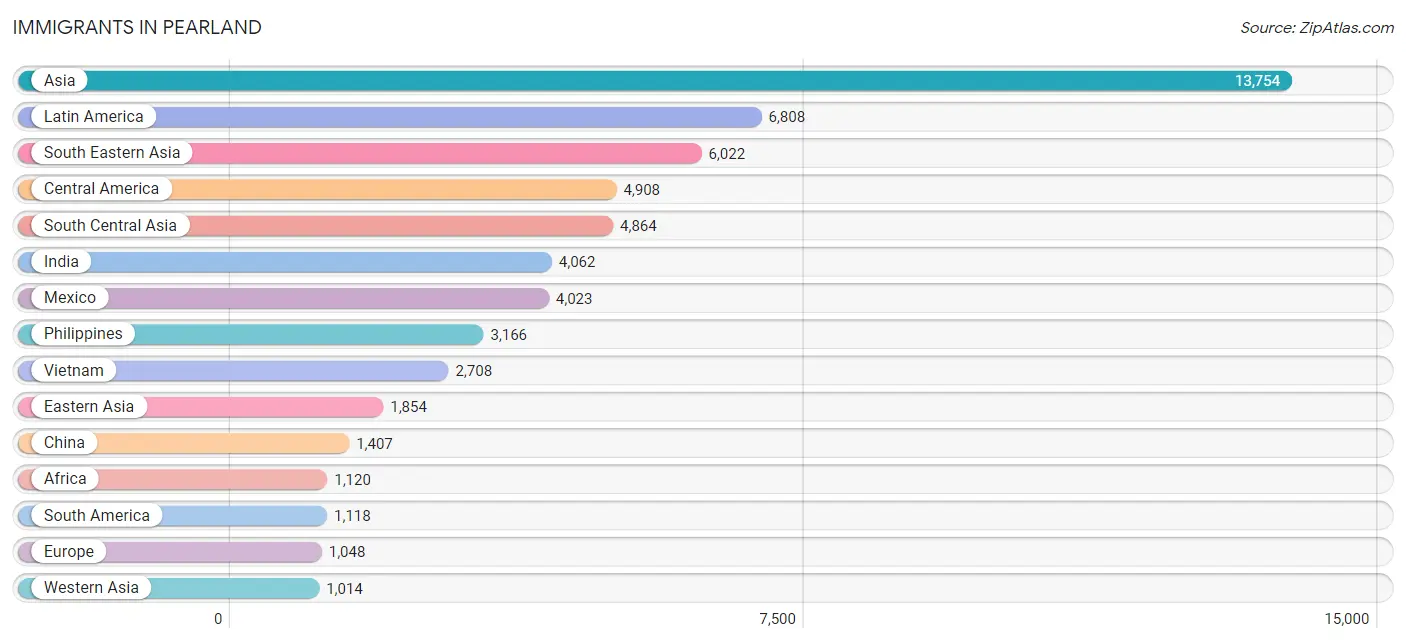
| Immigration Origin | # Population | % Population |
| Africa | 1,120 | 0.9% |
| Albania | 31 | 0.0% |
| Argentina | 33 | 0.0% |
| Asia | 13,754 | 11.1% |
| Australia | 5 | 0.0% |
| Bangladesh | 54 | 0.0% |
| Barbados | 19 | 0.0% |
| Brazil | 137 | 0.1% |
| Cambodia | 57 | 0.1% |
| Cameroon | 405 | 0.3% |
| Canada | 102 | 0.1% |
| Caribbean | 782 | 0.6% |
| Central America | 4,908 | 3.9% |
| China | 1,407 | 1.1% |
| Colombia | 112 | 0.1% |
| Costa Rica | 213 | 0.2% |
| Cuba | 97 | 0.1% |
| Czechoslovakia | 16 | 0.0% |
| Dominican Republic | 127 | 0.1% |
| Eastern Africa | 295 | 0.2% |
| Eastern Asia | 1,854 | 1.5% |
| Eastern Europe | 526 | 0.4% |
| Ecuador | 105 | 0.1% |
| Egypt | 95 | 0.1% |
| El Salvador | 326 | 0.3% |
| England | 81 | 0.1% |
| Eritrea | 92 | 0.1% |
| Ethiopia | 90 | 0.1% |
| Europe | 1,048 | 0.8% |
| France | 15 | 0.0% |
| Germany | 292 | 0.2% |
| Greece | 36 | 0.0% |
| Grenada | 9 | 0.0% |
| Haiti | 197 | 0.2% |
| Honduras | 346 | 0.3% |
| Hong Kong | 7 | 0.0% |
| Hungary | 78 | 0.1% |
| India | 4,062 | 3.3% |
| Indonesia | 22 | 0.0% |
| Iraq | 42 | 0.0% |
| Israel | 37 | 0.0% |
| Jamaica | 281 | 0.2% |
| Japan | 9 | 0.0% |
| Jordan | 44 | 0.0% |
| Kenya | 48 | 0.0% |
| Korea | 438 | 0.4% |
| Kuwait | 269 | 0.2% |
| Latin America | 6,808 | 5.5% |
| Latvia | 11 | 0.0% |
| Lebanon | 181 | 0.2% |
| Malaysia | 41 | 0.0% |
| Mexico | 4,023 | 3.2% |
| Middle Africa | 446 | 0.4% |
| Nepal | 97 | 0.1% |
| Nigeria | 247 | 0.2% |
| Northern Africa | 104 | 0.1% |
| Northern Europe | 179 | 0.1% |
| Oceania | 5 | 0.0% |
| Pakistan | 651 | 0.5% |
| Peru | 79 | 0.1% |
| Philippines | 3,166 | 2.5% |
| Romania | 22 | 0.0% |
| Russia | 213 | 0.2% |
| Saudi Arabia | 137 | 0.1% |
| Singapore | 5 | 0.0% |
| South Africa | 18 | 0.0% |
| South America | 1,118 | 0.9% |
| South Central Asia | 4,864 | 3.9% |
| South Eastern Asia | 6,022 | 4.8% |
| Southern Europe | 36 | 0.0% |
| Syria | 199 | 0.2% |
| Taiwan | 222 | 0.2% |
| Thailand | 9 | 0.0% |
| Trinidad and Tobago | 52 | 0.0% |
| Uganda | 19 | 0.0% |
| Ukraine | 45 | 0.0% |
| Venezuela | 652 | 0.5% |
| Vietnam | 2,708 | 2.2% |
| Western Africa | 257 | 0.2% |
| Western Asia | 1,014 | 0.8% |
| Western Europe | 307 | 0.3% |
| Zaire | 41 | 0.0% |
| Zimbabwe | 26 | 0.0% | View All 83 Rows |
Sex and Age in Pearland
Sex and Age in Pearland
The most populous age groups in Pearland are 15 to 19 Years (5,372 | 8.9%) for men and 35 to 39 Years (5,589 | 8.7%) for women.
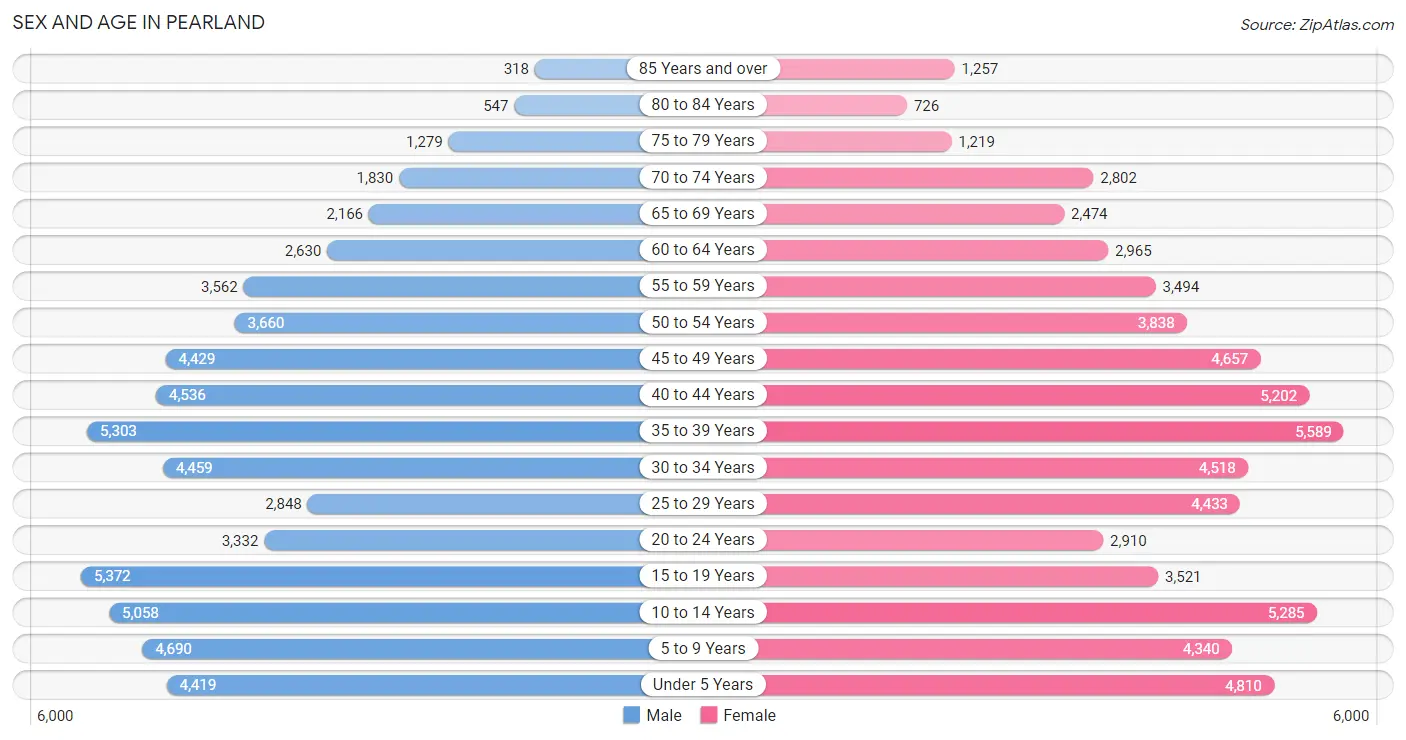
| Age Bracket | Male | Female |
| Under 5 Years | 4,419 (7.3%) | 4,810 (7.5%) |
| 5 to 9 Years | 4,690 (7.8%) | 4,340 (6.8%) |
| 10 to 14 Years | 5,058 (8.4%) | 5,285 (8.3%) |
| 15 to 19 Years | 5,372 (8.9%) | 3,521 (5.5%) |
| 20 to 24 Years | 3,332 (5.5%) | 2,910 (4.5%) |
| 25 to 29 Years | 2,848 (4.7%) | 4,433 (6.9%) |
| 30 to 34 Years | 4,459 (7.4%) | 4,518 (7.0%) |
| 35 to 39 Years | 5,303 (8.8%) | 5,589 (8.7%) |
| 40 to 44 Years | 4,536 (7.5%) | 5,202 (8.1%) |
| 45 to 49 Years | 4,429 (7.3%) | 4,657 (7.3%) |
| 50 to 54 Years | 3,660 (6.1%) | 3,838 (6.0%) |
| 55 to 59 Years | 3,562 (5.9%) | 3,494 (5.5%) |
| 60 to 64 Years | 2,630 (4.3%) | 2,965 (4.6%) |
| 65 to 69 Years | 2,166 (3.6%) | 2,474 (3.9%) |
| 70 to 74 Years | 1,830 (3.0%) | 2,802 (4.4%) |
| 75 to 79 Years | 1,279 (2.1%) | 1,219 (1.9%) |
| 80 to 84 Years | 547 (0.9%) | 726 (1.1%) |
| 85 Years and over | 318 (0.5%) | 1,257 (2.0%) |
| Total | 60,438 (100.0%) | 64,040 (100.0%) |
Families and Households in Pearland
Median Family Size in Pearland
The median family size in Pearland is 3.43 persons per family, with married-couple families (26,556 | 83.5%) accounting for the largest median family size of 3.49 persons per family. On the other hand, single male/father families (1,375 | 4.3%) represent the smallest median family size with 2.95 persons per family.
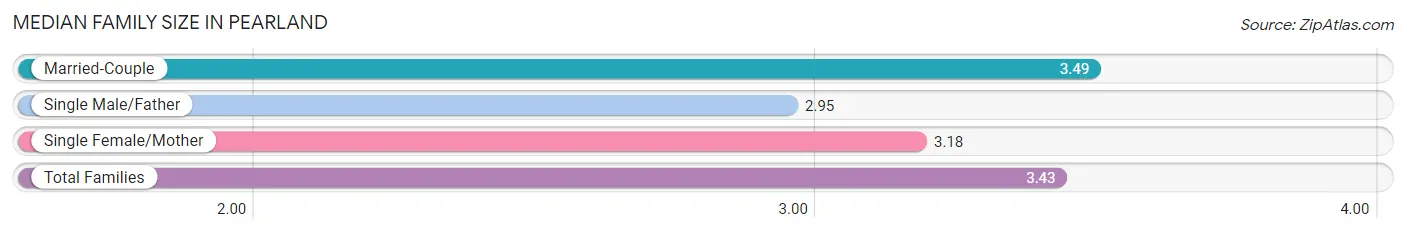
| Family Type | # Families | Family Size |
| Married-Couple | 26,556 (83.5%) | 3.49 |
| Single Male/Father | 1,375 (4.3%) | 2.95 |
| Single Female/Mother | 3,888 (12.2%) | 3.18 |
| Total Families | 31,819 (100.0%) | 3.43 |
Median Household Size in Pearland
The median household size in Pearland is 2.92 persons per household, with married-couple households (26,556 | 62.6%) accounting for the largest median household size of 3.52 persons per household. non-family households (10,632 | 25.1%) represent the smallest median household size with 1.18 persons per household.
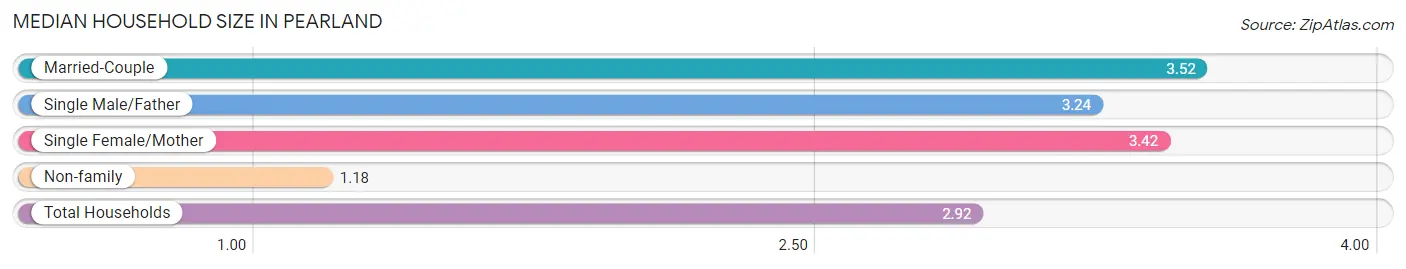
| Household Type | # Households | Household Size |
| Married-Couple | 26,556 (62.6%) | 3.52 |
| Single Male/Father | 1,375 (3.2%) | 3.24 |
| Single Female/Mother | 3,888 (9.2%) | 3.42 |
| Non-family | 10,632 (25.1%) | 1.18 |
| Total Households | 42,451 (100.0%) | 2.92 |
Household Size by Marriage Status in Pearland
Out of a total of 42,451 households in Pearland, 31,819 (75.0%) are family households, while 10,632 (25.1%) are nonfamily households. The most numerous type of family households are 2-person households, comprising 10,218, and the most common type of nonfamily households are 1-person households, comprising 9,014.
| Household Size | Family Households | Nonfamily Households |
| 1-Person Households | - | 9,014 (21.2%) |
| 2-Person Households | 10,218 (24.1%) | 1,470 (3.5%) |
| 3-Person Households | 6,875 (16.2%) | 97 (0.2%) |
| 4-Person Households | 9,206 (21.7%) | 22 (0.1%) |
| 5-Person Households | 3,530 (8.3%) | 29 (0.1%) |
| 6-Person Households | 1,323 (3.1%) | 0 (0.0%) |
| 7+ Person Households | 667 (1.6%) | 0 (0.0%) |
| Total | 31,819 (75.0%) | 10,632 (25.1%) |
Female Fertility in Pearland
Fertility by Age in Pearland
Average fertility rate in Pearland is 70.0 births per 1,000 women. Women in the age bracket of 20 to 34 years have the highest fertility rate with 85.0 births per 1,000 women. Women in the age bracket of 35 to 50 years acount for 54.2% of all women with births.
| Age Bracket | Women with Births | Births / 1,000 Women |
| 15 to 19 years | 0 (0.0%) | 0.0 |
| 20 to 34 years | 1,006 (45.8%) | 85.0 |
| 35 to 50 years | 1,190 (54.2%) | 75.0 |
| Total | 2,196 (100.0%) | 70.0 |
Fertility by Age by Marriage Status in Pearland
89.8% of women with births (2,196) in Pearland are married. The highest percentage of unmarried women with births falls into 20 to 34 years age bracket with 11.2% of them unmarried at the time of birth, while the lowest percentage of unmarried women with births belong to 35 to 50 years age bracket with 9.4% of them unmarried.
| Age Bracket | Married | Unmarried |
| 15 to 19 years | 0 (0.0%) | 0 (0.0%) |
| 20 to 34 years | 893 (88.8%) | 113 (11.2%) |
| 35 to 50 years | 1,078 (90.6%) | 112 (9.4%) |
| Total | 1,972 (89.8%) | 224 (10.2%) |
Fertility by Education in Pearland
Average fertility rate in Pearland is 70.0 births per 1,000 women. Women with the education attainment of graduate degree have the highest fertility rate of 113.0 births per 1,000 women, while women with the education attainment of less than high school have the lowest fertility at 12.0 births per 1,000 women. Women with the education attainment of bachelor's degree represent 42.0% of all women with births.
| Educational Attainment | Women with Births | Births / 1,000 Women |
| Less than High School | 43 (2.0%) | 12.0 |
| High School Diploma | 63 (2.9%) | 15.0 |
| College or Associate's Degree | 563 (25.6%) | 65.0 |
| Bachelor's Degree | 922 (42.0%) | 97.0 |
| Graduate Degree | 605 (27.6%) | 113.0 |
| Total | 2,196 (100.0%) | 70.0 |
Fertility by Education by Marriage Status in Pearland
10.2% of women with births in Pearland are unmarried. Women with the educational attainment of bachelor's degree are most likely to be married with 97.4% of them married at childbirth, while women with the educational attainment of less than high school are least likely to be married with 67.4% of them unmarried at childbirth.
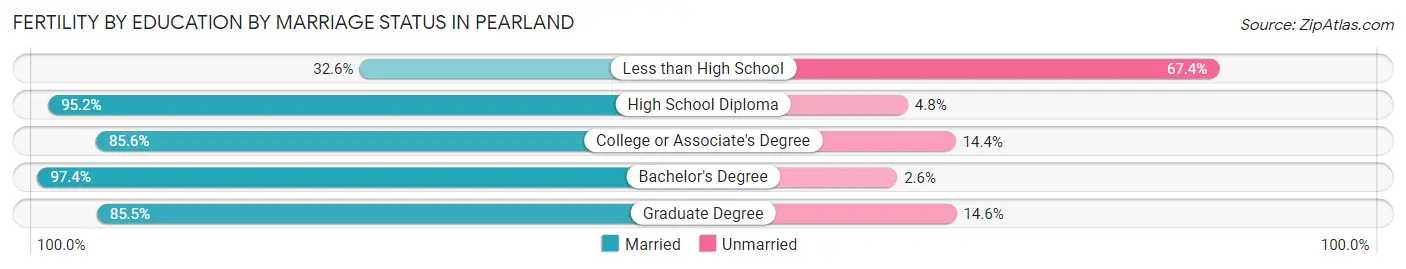
| Educational Attainment | Married | Unmarried |
| Less than High School | 14 (32.6%) | 29 (67.4%) |
| High School Diploma | 60 (95.2%) | 3 (4.8%) |
| College or Associate's Degree | 482 (85.6%) | 81 (14.4%) |
| Bachelor's Degree | 898 (97.4%) | 24 (2.6%) |
| Graduate Degree | 517 (85.5%) | 88 (14.5%) |
| Total | 1,972 (89.8%) | 224 (10.2%) |
Employment Characteristics in Pearland
Employment by Class of Employer in Pearland
Among the 61,364 employed individuals in Pearland, private company employees (40,408 | 65.8%), local government employees (5,056 | 8.2%), and not-for-profit organizations (4,715 | 7.7%) make up the most common classes of employment.
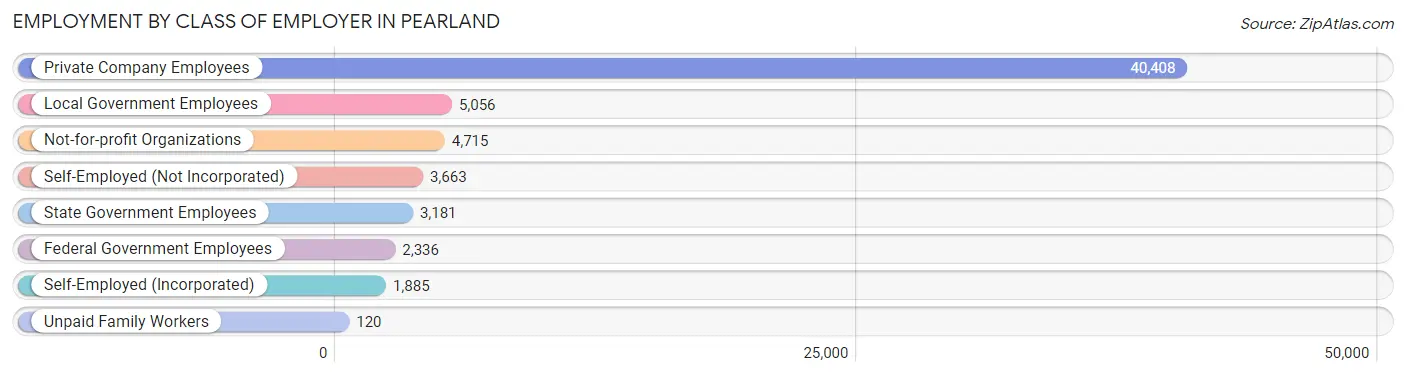
| Employer Class | # Employees | % Employees |
| Private Company Employees | 40,408 | 65.8% |
| Self-Employed (Incorporated) | 1,885 | 3.1% |
| Self-Employed (Not Incorporated) | 3,663 | 6.0% |
| Not-for-profit Organizations | 4,715 | 7.7% |
| Local Government Employees | 5,056 | 8.2% |
| State Government Employees | 3,181 | 5.2% |
| Federal Government Employees | 2,336 | 3.8% |
| Unpaid Family Workers | 120 | 0.2% |
| Total | 61,364 | 100.0% |
Employment Status by Age in Pearland
According to the labor force statistics for Pearland, out of the total population over 16 years of age (94,015), 68.6% or 64,494 individuals are in the labor force, with 3.2% or 2,064 of them unemployed. The age group with the highest labor force participation rate is 45 to 54 years, with 88.2% or 14,627 individuals in the labor force. Within the labor force, the 16 to 19 years age range has the highest percentage of unemployed individuals, with 22.1% or 360 of them being unemployed.
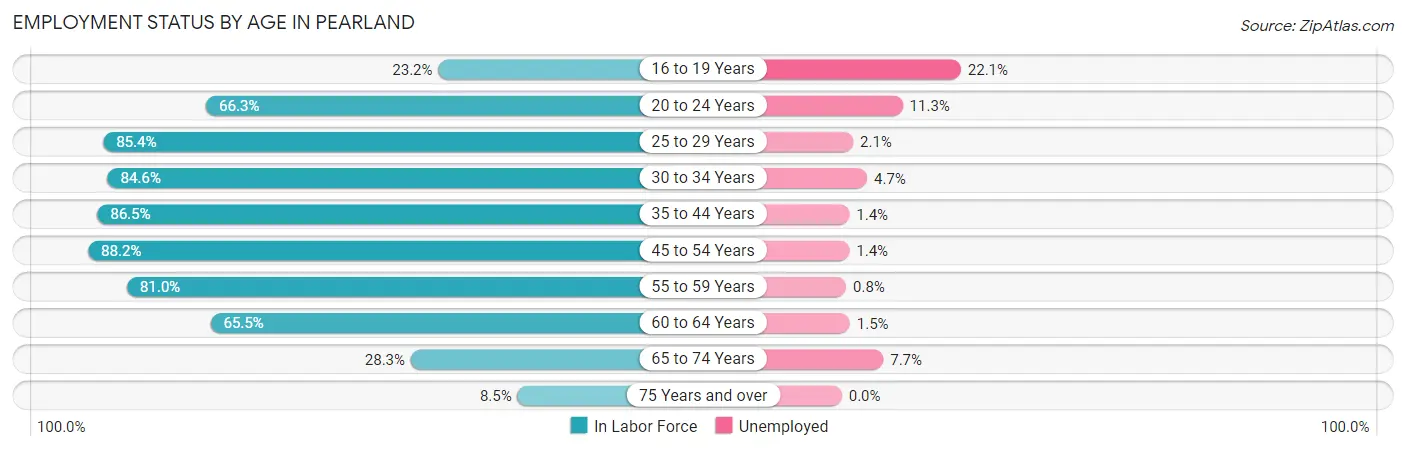
| Age Bracket | In Labor Force | Unemployed |
| 16 to 19 Years | 1,631 (23.2%) | 360 (22.1%) |
| 20 to 24 Years | 4,138 (66.3%) | 468 (11.3%) |
| 25 to 29 Years | 6,218 (85.4%) | 131 (2.1%) |
| 30 to 34 Years | 7,595 (84.6%) | 357 (4.7%) |
| 35 to 44 Years | 17,845 (86.5%) | 250 (1.4%) |
| 45 to 54 Years | 14,627 (88.2%) | 205 (1.4%) |
| 55 to 59 Years | 5,715 (81.0%) | 46 (0.8%) |
| 60 to 64 Years | 3,665 (65.5%) | 55 (1.5%) |
| 65 to 74 Years | 2,624 (28.3%) | 202 (7.7%) |
| 75 Years and over | 454 (8.5%) | 0 (0.0%) |
| Total | 64,494 (68.6%) | 2,064 (3.2%) |
Employment Status by Educational Attainment in Pearland
According to labor force statistics for Pearland, 84.2% of individuals (55,676) out of the total population between 25 and 64 years of age (66,123) are in the labor force, with 1.9% or 1,058 of them being unemployed. The group with the highest labor force participation rate are those with the educational attainment of bachelor's degree or higher, with 88.7% or 28,981 individuals in the labor force. Within the labor force, individuals with college / associate degree education have the highest percentage of unemployment, with 3.7% or 628 of them being unemployed.
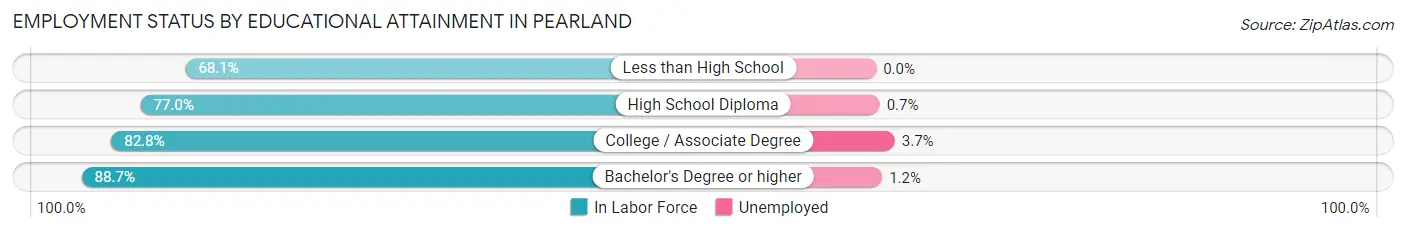
| Educational Attainment | In Labor Force | Unemployed |
| Less than High School | 1,857 (68.1%) | 0 (0.0%) |
| High School Diploma | 7,862 (77.0%) | 71 (0.7%) |
| College / Associate Degree | 16,984 (82.8%) | 759 (3.7%) |
| Bachelor's Degree or higher | 28,981 (88.7%) | 392 (1.2%) |
| Total | 55,676 (84.2%) | 1,256 (1.9%) |
Employment Occupations by Sex in Pearland
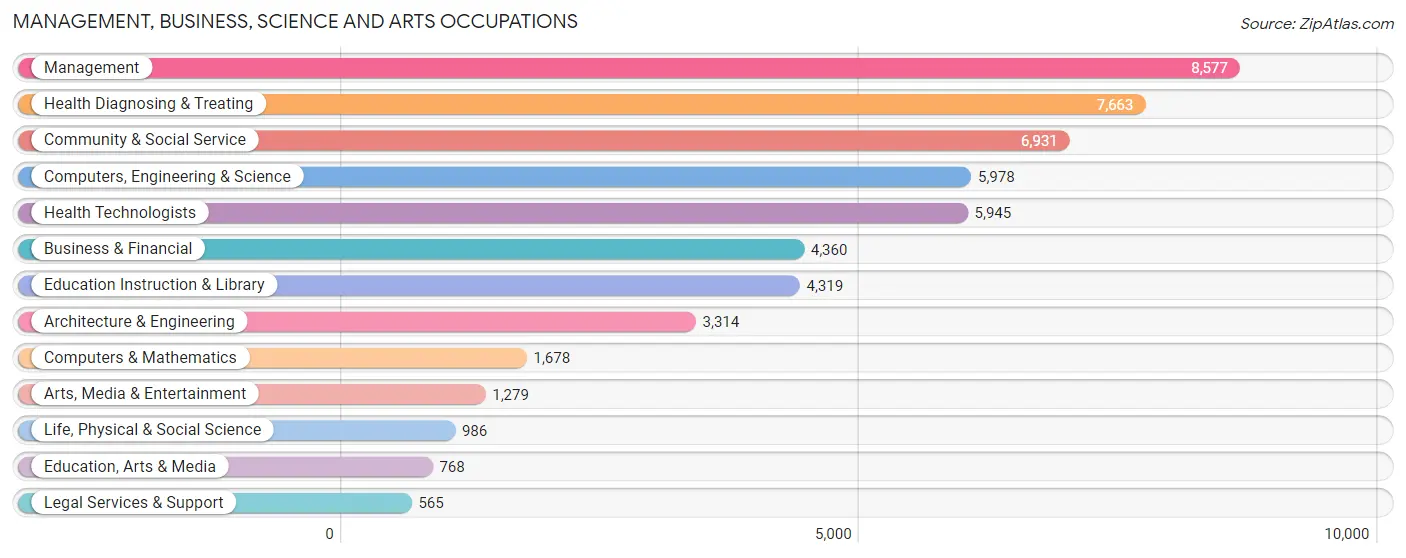
Management, Business, Science and Arts Occupations
The most common Management, Business, Science and Arts occupations in Pearland are Management (8,577 | 13.8%), Health Diagnosing & Treating (7,663 | 12.3%), Community & Social Service (6,931 | 11.2%), Computers, Engineering & Science (5,978 | 9.6%), and Health Technologists (5,945 | 9.6%).
Management, Business, Science and Arts Occupations by Sex
Within the Management, Business, Science and Arts occupations in Pearland, the most male-oriented occupations are Architecture & Engineering (78.5%), Arts, Media & Entertainment (71.5%), and Computers, Engineering & Science (69.7%), while the most female-oriented occupations are Health Technologists (78.6%), Health Diagnosing & Treating (77.2%), and Education Instruction & Library (76.9%).
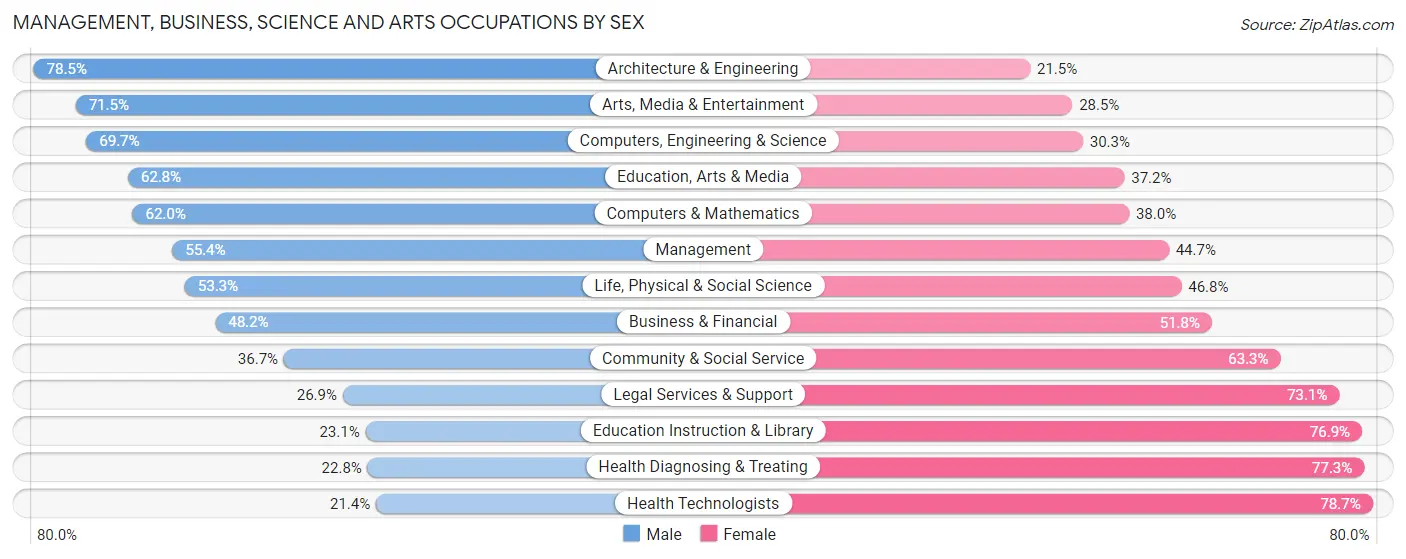
| Occupation | Male | Female |
| Management | 4,747 (55.3%) | 3,830 (44.7%) |
| Business & Financial | 2,100 (48.2%) | 2,260 (51.8%) |
| Computers, Engineering & Science | 4,166 (69.7%) | 1,812 (30.3%) |
| Computers & Mathematics | 1,040 (62.0%) | 638 (38.0%) |
| Architecture & Engineering | 2,601 (78.5%) | 713 (21.5%) |
| Life, Physical & Social Science | 525 (53.2%) | 461 (46.8%) |
| Community & Social Service | 2,546 (36.7%) | 4,385 (63.3%) |
| Education, Arts & Media | 482 (62.8%) | 286 (37.2%) |
| Legal Services & Support | 152 (26.9%) | 413 (73.1%) |
| Education Instruction & Library | 998 (23.1%) | 3,321 (76.9%) |
| Arts, Media & Entertainment | 914 (71.5%) | 365 (28.5%) |
| Health Diagnosing & Treating | 1,743 (22.8%) | 5,920 (77.2%) |
| Health Technologists | 1,269 (21.3%) | 4,676 (78.6%) |
| Total (Category) | 15,302 (45.7%) | 18,207 (54.3%) |
| Total (Overall) | 33,119 (53.3%) | 29,052 (46.7%) |
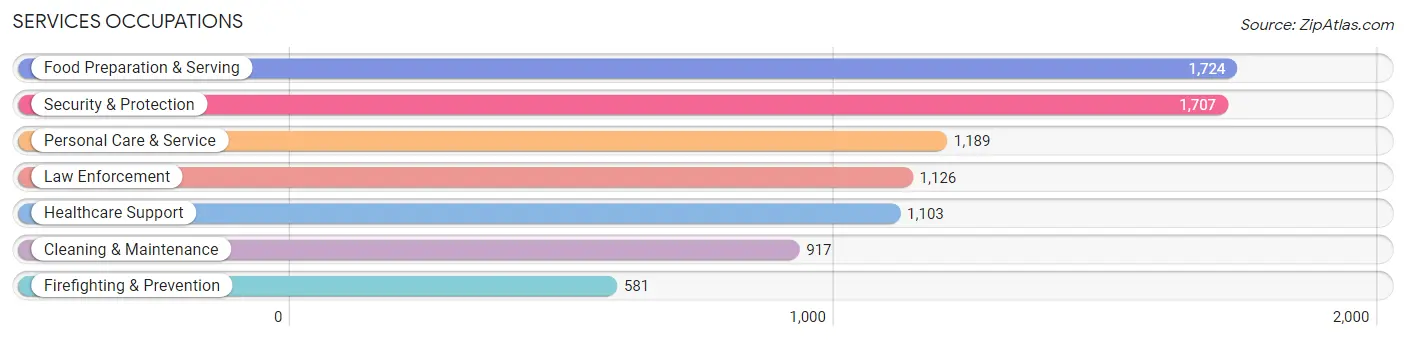
Services Occupations
The most common Services occupations in Pearland are Food Preparation & Serving (1,724 | 2.8%), Security & Protection (1,707 | 2.8%), Personal Care & Service (1,189 | 1.9%), Law Enforcement (1,126 | 1.8%), and Healthcare Support (1,103 | 1.8%).
Services Occupations by Sex
Within the Services occupations in Pearland, the most male-oriented occupations are Firefighting & Prevention (84.0%), Security & Protection (82.2%), and Law Enforcement (81.3%), while the most female-oriented occupations are Personal Care & Service (79.0%), Healthcare Support (62.7%), and Food Preparation & Serving (52.8%).
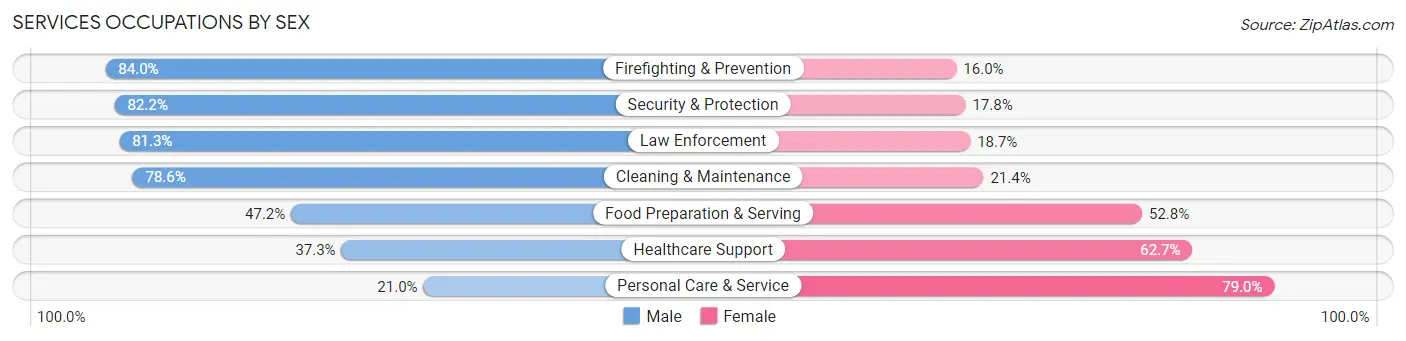
| Occupation | Male | Female |
| Healthcare Support | 411 (37.3%) | 692 (62.7%) |
| Security & Protection | 1,403 (82.2%) | 304 (17.8%) |
| Firefighting & Prevention | 488 (84.0%) | 93 (16.0%) |
| Law Enforcement | 915 (81.3%) | 211 (18.7%) |
| Food Preparation & Serving | 814 (47.2%) | 910 (52.8%) |
| Cleaning & Maintenance | 721 (78.6%) | 196 (21.4%) |
| Personal Care & Service | 250 (21.0%) | 939 (79.0%) |
| Total (Category) | 3,599 (54.2%) | 3,041 (45.8%) |
| Total (Overall) | 33,119 (53.3%) | 29,052 (46.7%) |
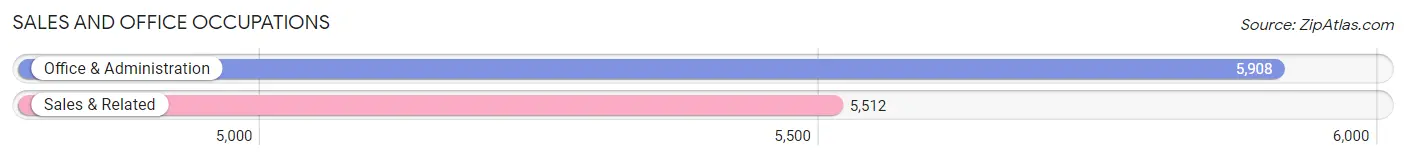
Sales and Office Occupations
The most common Sales and Office occupations in Pearland are Office & Administration (5,908 | 9.5%), and Sales & Related (5,512 | 8.9%).
Sales and Office Occupations by Sex
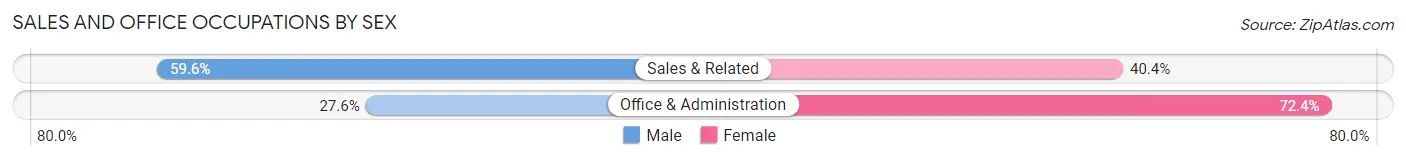
| Occupation | Male | Female |
| Sales & Related | 3,286 (59.6%) | 2,226 (40.4%) |
| Office & Administration | 1,628 (27.6%) | 4,280 (72.4%) |
| Total (Category) | 4,914 (43.0%) | 6,506 (57.0%) |
| Total (Overall) | 33,119 (53.3%) | 29,052 (46.7%) |
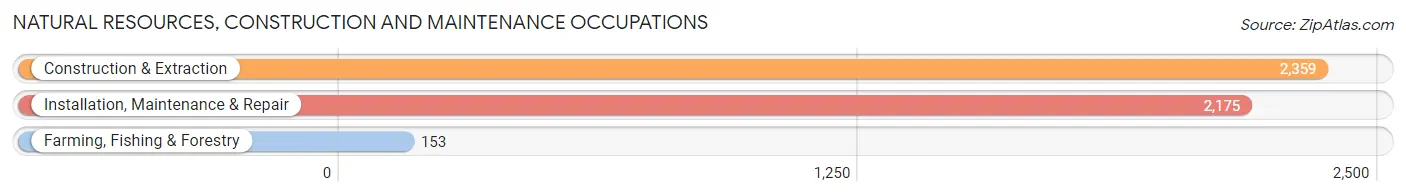
Natural Resources, Construction and Maintenance Occupations
The most common Natural Resources, Construction and Maintenance occupations in Pearland are Construction & Extraction (2,359 | 3.8%), Installation, Maintenance & Repair (2,175 | 3.5%), and Farming, Fishing & Forestry (153 | 0.3%).
Natural Resources, Construction and Maintenance Occupations by Sex
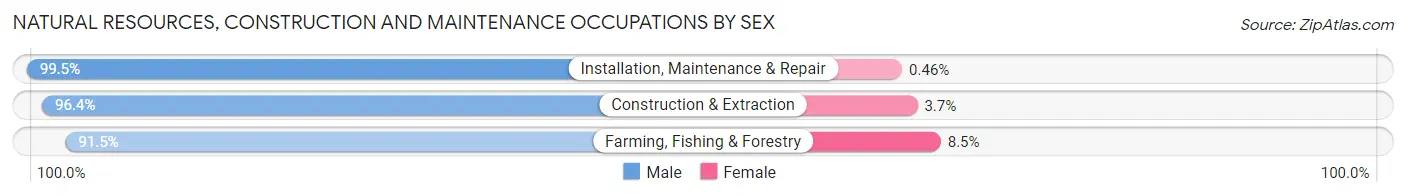
| Occupation | Male | Female |
| Farming, Fishing & Forestry | 140 (91.5%) | 13 (8.5%) |
| Construction & Extraction | 2,273 (96.4%) | 86 (3.6%) |
| Installation, Maintenance & Repair | 2,165 (99.5%) | 10 (0.5%) |
| Total (Category) | 4,578 (97.7%) | 109 (2.3%) |
| Total (Overall) | 33,119 (53.3%) | 29,052 (46.7%) |
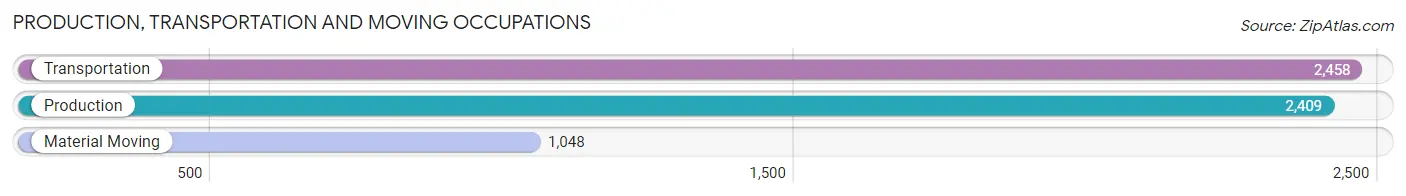
Production, Transportation and Moving Occupations
The most common Production, Transportation and Moving occupations in Pearland are Transportation (2,458 | 4.0%), Production (2,409 | 3.9%), and Material Moving (1,048 | 1.7%).
Production, Transportation and Moving Occupations by Sex
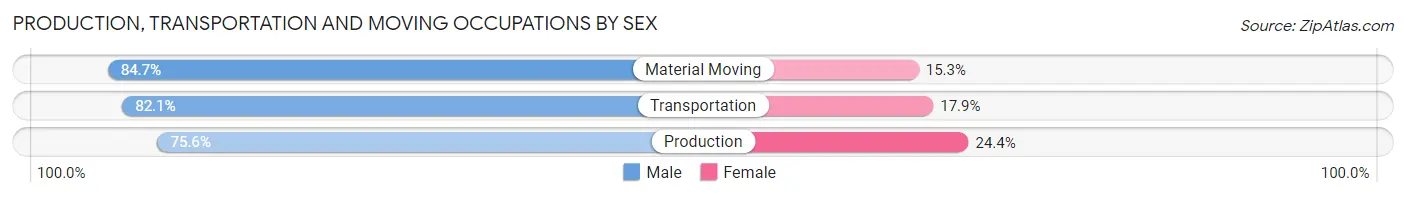
| Occupation | Male | Female |
| Production | 1,821 (75.6%) | 588 (24.4%) |
| Transportation | 2,017 (82.1%) | 441 (17.9%) |
| Material Moving | 888 (84.7%) | 160 (15.3%) |
| Total (Category) | 4,726 (79.9%) | 1,189 (20.1%) |
| Total (Overall) | 33,119 (53.3%) | 29,052 (46.7%) |
Employment Industries by Sex in Pearland
Employment Industries in Pearland
The major employment industries in Pearland include Health Care & Social Assistance (11,446 | 18.4%), Educational Services (6,830 | 11.0%), Manufacturing (6,252 | 10.1%), Retail Trade (5,361 | 8.6%), and Professional & Scientific (5,186 | 8.3%).
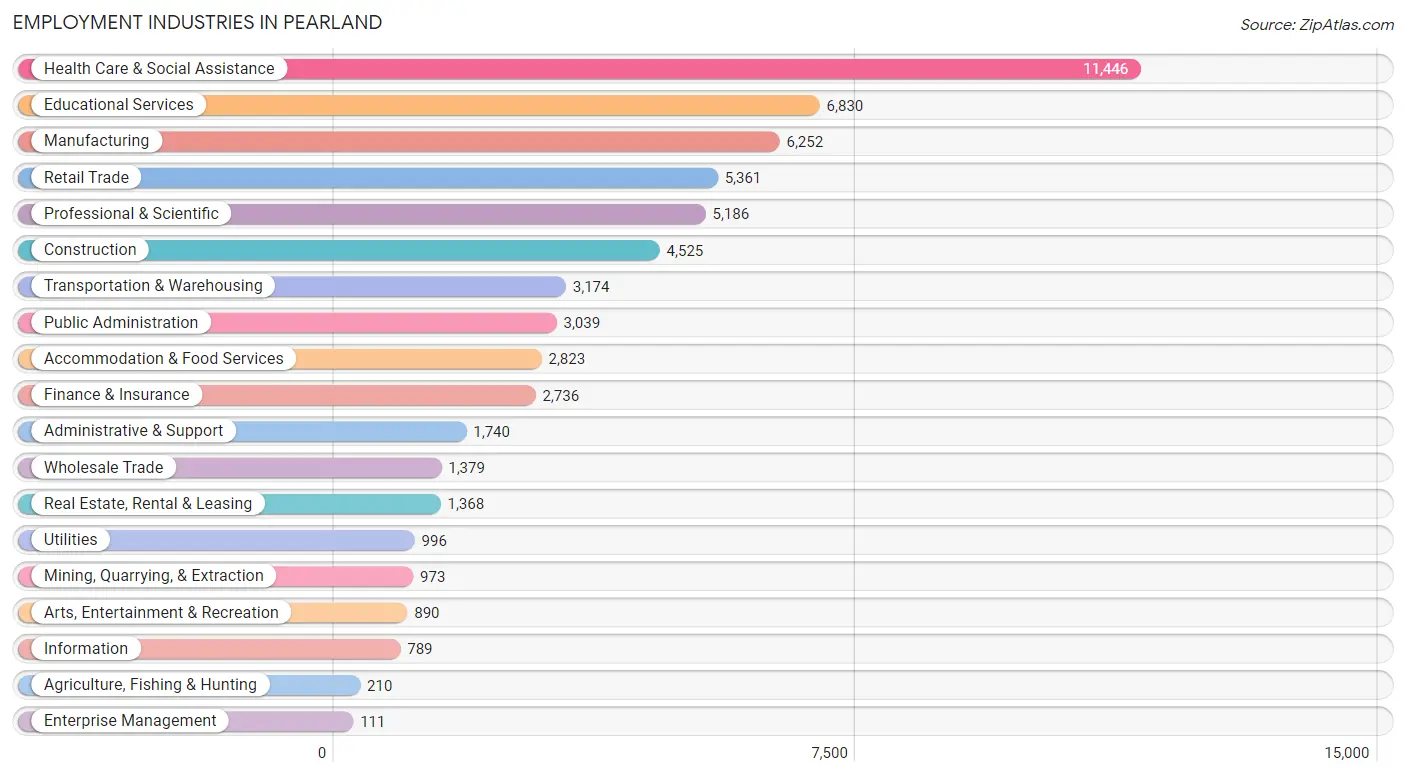
Employment Industries by Sex in Pearland
The Pearland industries that see more men than women are Agriculture, Fishing & Hunting (97.6%), Construction (87.7%), and Mining, Quarrying, & Extraction (85.5%), whereas the industries that tend to have a higher number of women are Health Care & Social Assistance (72.7%), Educational Services (72.5%), and Enterprise Management (71.2%).
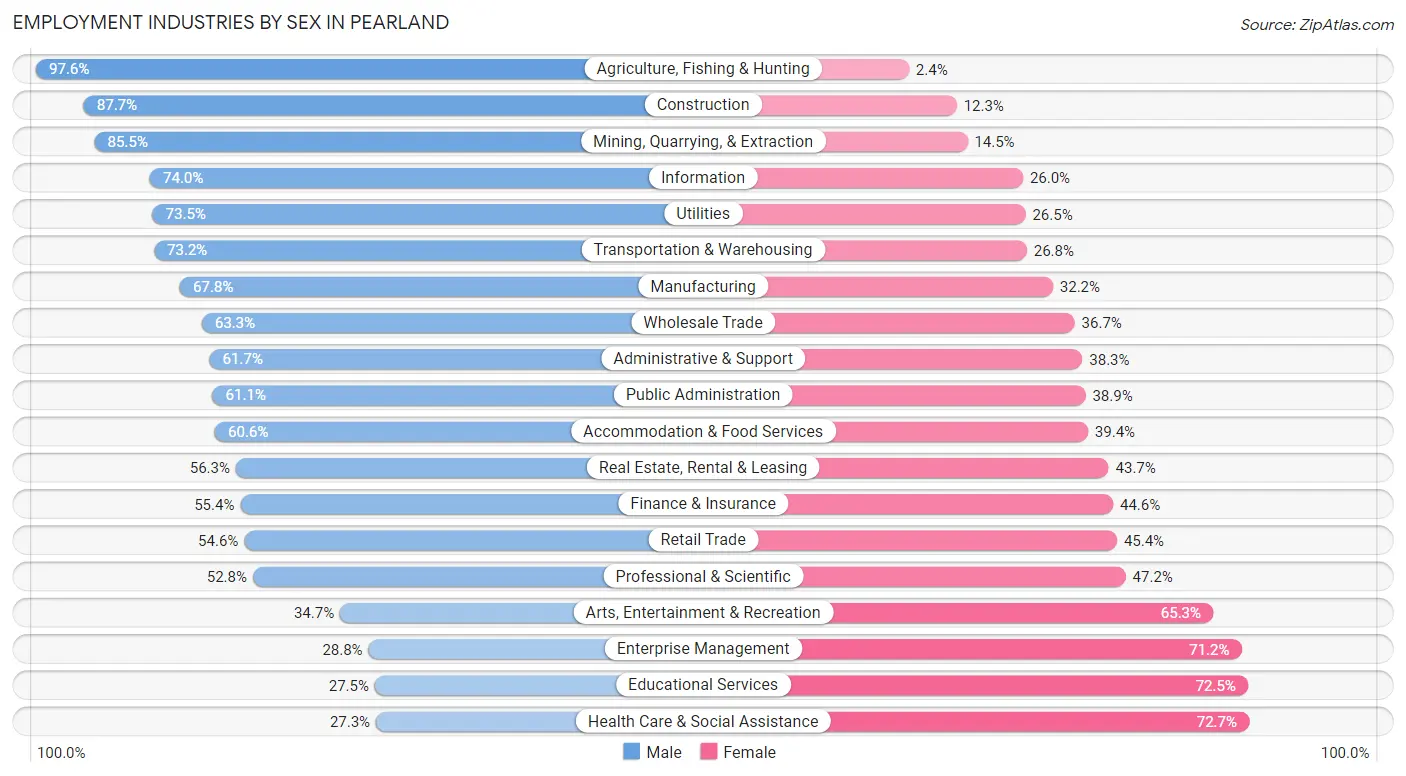
| Industry | Male | Female |
| Agriculture, Fishing & Hunting | 205 (97.6%) | 5 (2.4%) |
| Mining, Quarrying, & Extraction | 832 (85.5%) | 141 (14.5%) |
| Construction | 3,970 (87.7%) | 555 (12.3%) |
| Manufacturing | 4,241 (67.8%) | 2,011 (32.2%) |
| Wholesale Trade | 873 (63.3%) | 506 (36.7%) |
| Retail Trade | 2,925 (54.6%) | 2,436 (45.4%) |
| Transportation & Warehousing | 2,324 (73.2%) | 850 (26.8%) |
| Utilities | 732 (73.5%) | 264 (26.5%) |
| Information | 584 (74.0%) | 205 (26.0%) |
| Finance & Insurance | 1,515 (55.4%) | 1,221 (44.6%) |
| Real Estate, Rental & Leasing | 770 (56.3%) | 598 (43.7%) |
| Professional & Scientific | 2,736 (52.8%) | 2,450 (47.2%) |
| Enterprise Management | 32 (28.8%) | 79 (71.2%) |
| Administrative & Support | 1,074 (61.7%) | 666 (38.3%) |
| Educational Services | 1,879 (27.5%) | 4,951 (72.5%) |
| Health Care & Social Assistance | 3,123 (27.3%) | 8,323 (72.7%) |
| Arts, Entertainment & Recreation | 309 (34.7%) | 581 (65.3%) |
| Accommodation & Food Services | 1,710 (60.6%) | 1,113 (39.4%) |
| Public Administration | 1,856 (61.1%) | 1,183 (38.9%) |
| Total | 33,119 (53.3%) | 29,052 (46.7%) |
Education in Pearland
School Enrollment in Pearland
The most common levels of schooling among the 36,239 students in Pearland are high school (8,234 | 22.7%), middle school (8,031 | 22.2%), and elementary school (7,082 | 19.5%).
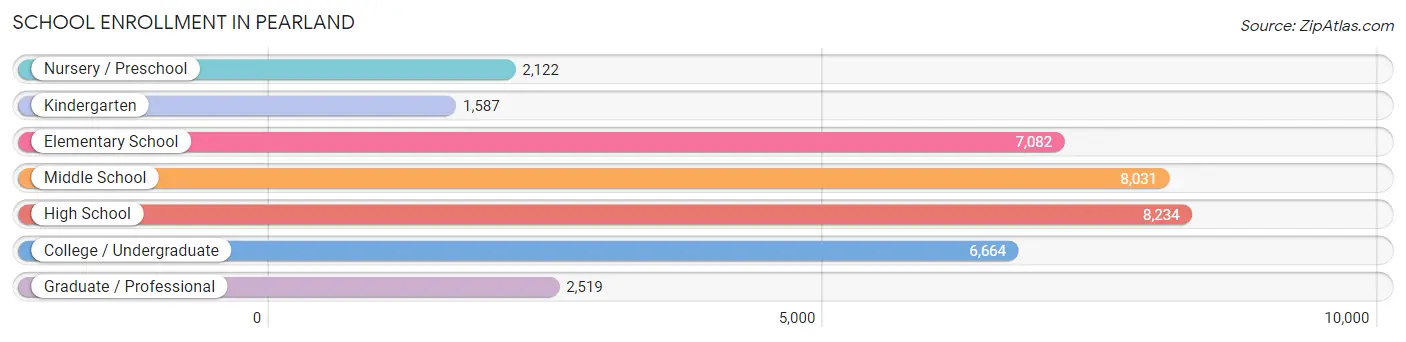
| School Level | # Students | % Students |
| Nursery / Preschool | 2,122 | 5.9% |
| Kindergarten | 1,587 | 4.4% |
| Elementary School | 7,082 | 19.5% |
| Middle School | 8,031 | 22.2% |
| High School | 8,234 | 22.7% |
| College / Undergraduate | 6,664 | 18.4% |
| Graduate / Professional | 2,519 | 7.0% |
| Total | 36,239 | 100.0% |
School Enrollment by Age by Funding Source in Pearland
Out of a total of 36,239 students who are enrolled in schools in Pearland, 4,457 (12.3%) attend a private institution, while the remaining 31,782 (87.7%) are enrolled in public schools. The age group of 3 to 4 year olds has the highest likelihood of being enrolled in private schools, with 804 (52.8% in the age bracket) enrolled. Conversely, the age group of 10 to 14 year olds has the lowest likelihood of being enrolled in a private school, with 9,654 (95.7% in the age bracket) attending a public institution.
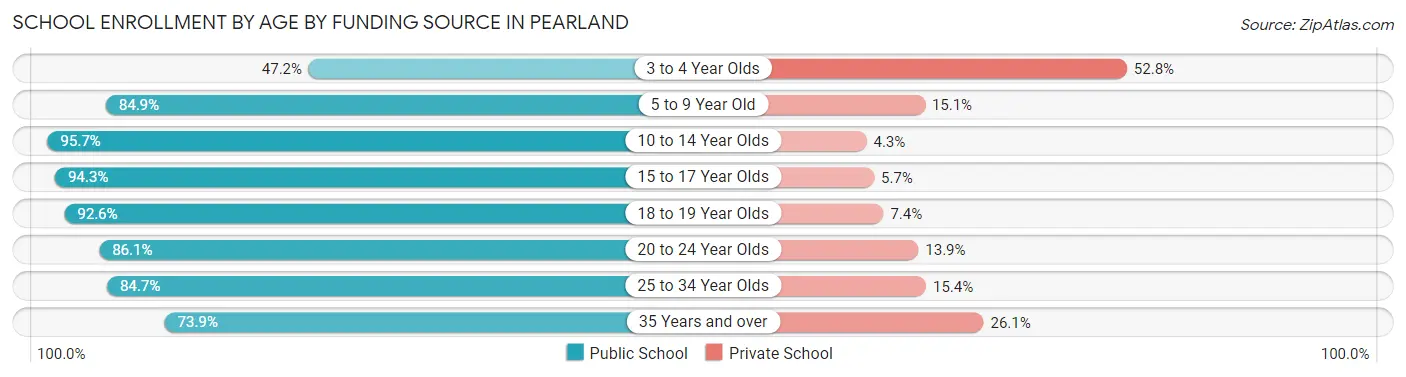
| Age Bracket | Public School | Private School |
| 3 to 4 Year Olds | 720 (47.2%) | 804 (52.8%) |
| 5 to 9 Year Old | 7,303 (84.9%) | 1,303 (15.1%) |
| 10 to 14 Year Olds | 9,654 (95.7%) | 430 (4.3%) |
| 15 to 17 Year Olds | 5,693 (94.3%) | 342 (5.7%) |
| 18 to 19 Year Olds | 1,998 (92.6%) | 160 (7.4%) |
| 20 to 24 Year Olds | 2,718 (86.1%) | 439 (13.9%) |
| 25 to 34 Year Olds | 1,859 (84.7%) | 337 (15.3%) |
| 35 Years and over | 1,833 (73.9%) | 646 (26.1%) |
| Total | 31,782 (87.7%) | 4,457 (12.3%) |
Educational Attainment by Field of Study in Pearland
Business (8,016 | 20.0%), science & technology (6,215 | 15.5%), engineering (5,527 | 13.8%), education (3,570 | 8.9%), and bio, nature & agricultural (3,232 | 8.1%) are the most common fields of study among 40,081 individuals in Pearland who have obtained a bachelor's degree or higher.
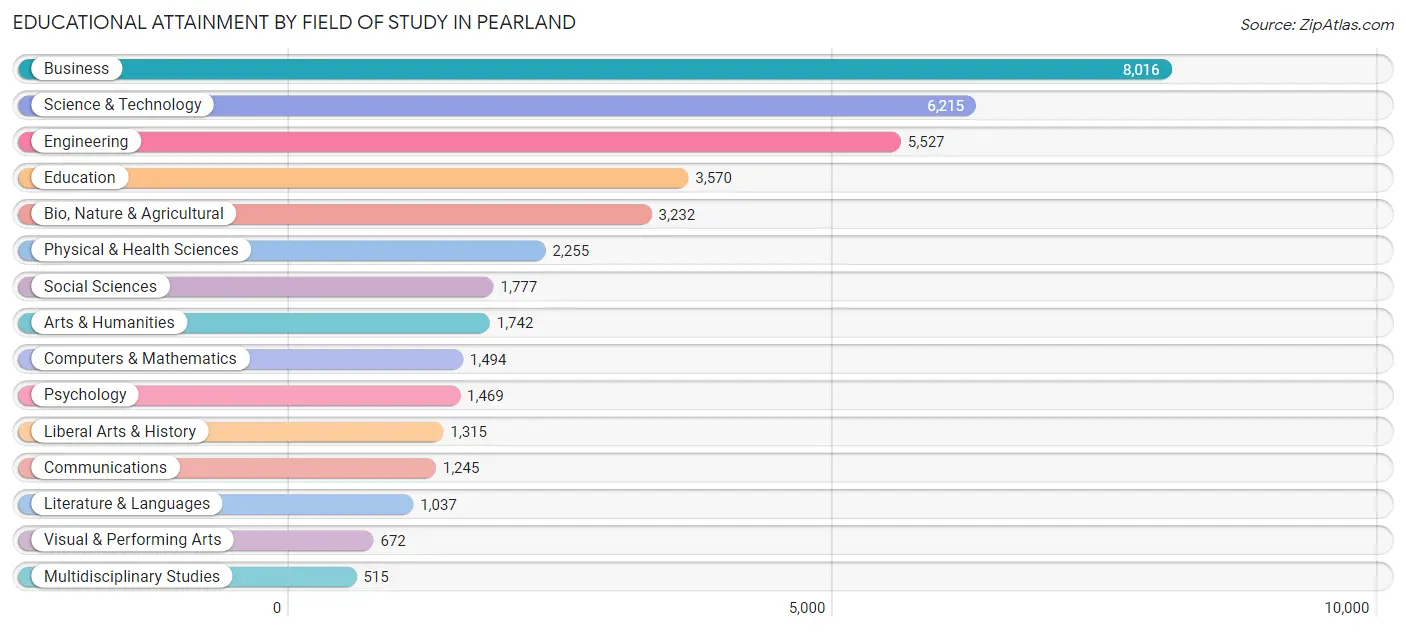
| Field of Study | # Graduates | % Graduates |
| Computers & Mathematics | 1,494 | 3.7% |
| Bio, Nature & Agricultural | 3,232 | 8.1% |
| Physical & Health Sciences | 2,255 | 5.6% |
| Psychology | 1,469 | 3.7% |
| Social Sciences | 1,777 | 4.4% |
| Engineering | 5,527 | 13.8% |
| Multidisciplinary Studies | 515 | 1.3% |
| Science & Technology | 6,215 | 15.5% |
| Business | 8,016 | 20.0% |
| Education | 3,570 | 8.9% |
| Literature & Languages | 1,037 | 2.6% |
| Liberal Arts & History | 1,315 | 3.3% |
| Visual & Performing Arts | 672 | 1.7% |
| Communications | 1,245 | 3.1% |
| Arts & Humanities | 1,742 | 4.3% |
| Total | 40,081 | 100.0% |
Transportation & Commute in Pearland
Vehicle Availability by Sex in Pearland
The most prevalent vehicle ownership categories in Pearland are males with 2 vehicles (16,073, accounting for 48.8%) and females with 2 vehicles (12,231, making up 56.6%).
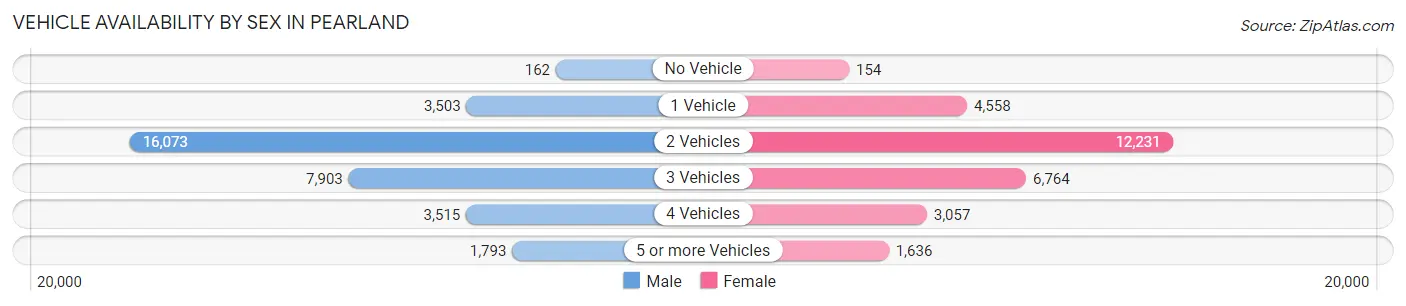
| Vehicles Available | Male | Female |
| No Vehicle | 162 (0.5%) | 154 (0.5%) |
| 1 Vehicle | 3,503 (10.6%) | 4,558 (16.1%) |
| 2 Vehicles | 16,073 (48.8%) | 12,231 (43.1%) |
| 3 Vehicles | 7,903 (24.0%) | 6,764 (23.8%) |
| 4 Vehicles | 3,515 (10.7%) | 3,057 (10.8%) |
| 5 or more Vehicles | 1,793 (5.4%) | 1,636 (5.8%) |
| Total | 32,949 (100.0%) | 28,400 (100.0%) |
Commute Time in Pearland
The most frequently occuring commute durations in Pearland are 30 to 34 minutes (10,749 commuters, 19.5%), 45 to 59 minutes (8,260 commuters, 15.0%), and 20 to 24 minutes (6,695 commuters, 12.2%).
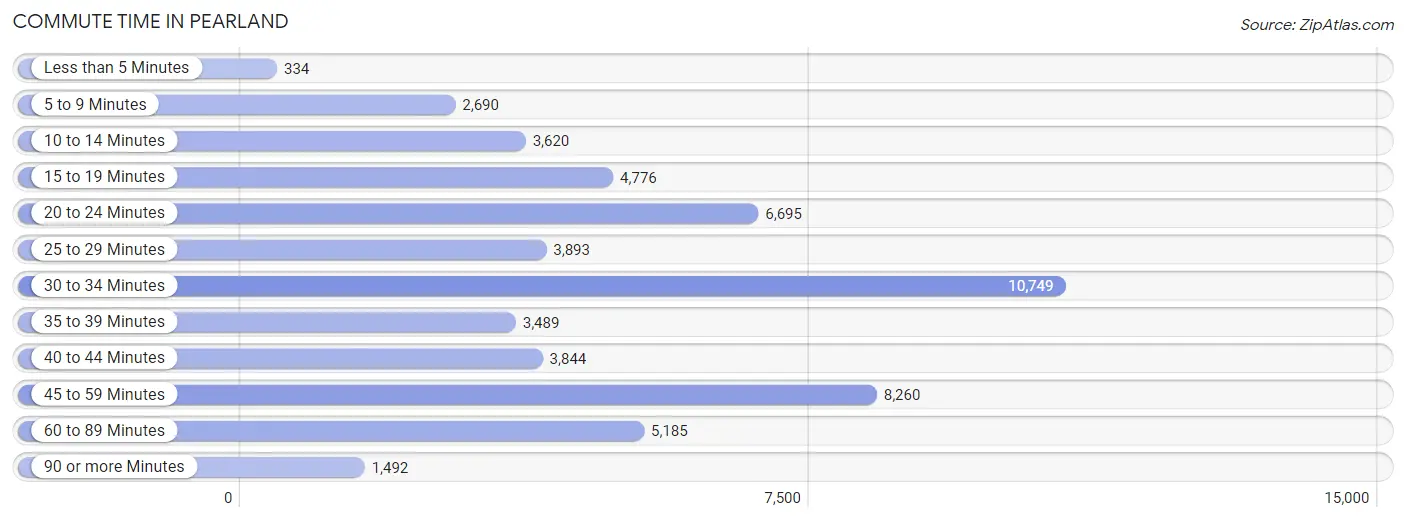
| Commute Time | # Commuters | % Commuters |
| Less than 5 Minutes | 334 | 0.6% |
| 5 to 9 Minutes | 2,690 | 4.9% |
| 10 to 14 Minutes | 3,620 | 6.6% |
| 15 to 19 Minutes | 4,776 | 8.7% |
| 20 to 24 Minutes | 6,695 | 12.2% |
| 25 to 29 Minutes | 3,893 | 7.1% |
| 30 to 34 Minutes | 10,749 | 19.5% |
| 35 to 39 Minutes | 3,489 | 6.3% |
| 40 to 44 Minutes | 3,844 | 7.0% |
| 45 to 59 Minutes | 8,260 | 15.0% |
| 60 to 89 Minutes | 5,185 | 9.4% |
| 90 or more Minutes | 1,492 | 2.7% |
Commute Time by Sex in Pearland
The most common commute times in Pearland are 30 to 34 minutes (6,075 commuters, 20.3%) for males and 30 to 34 minutes (4,674 commuters, 18.7%) for females.
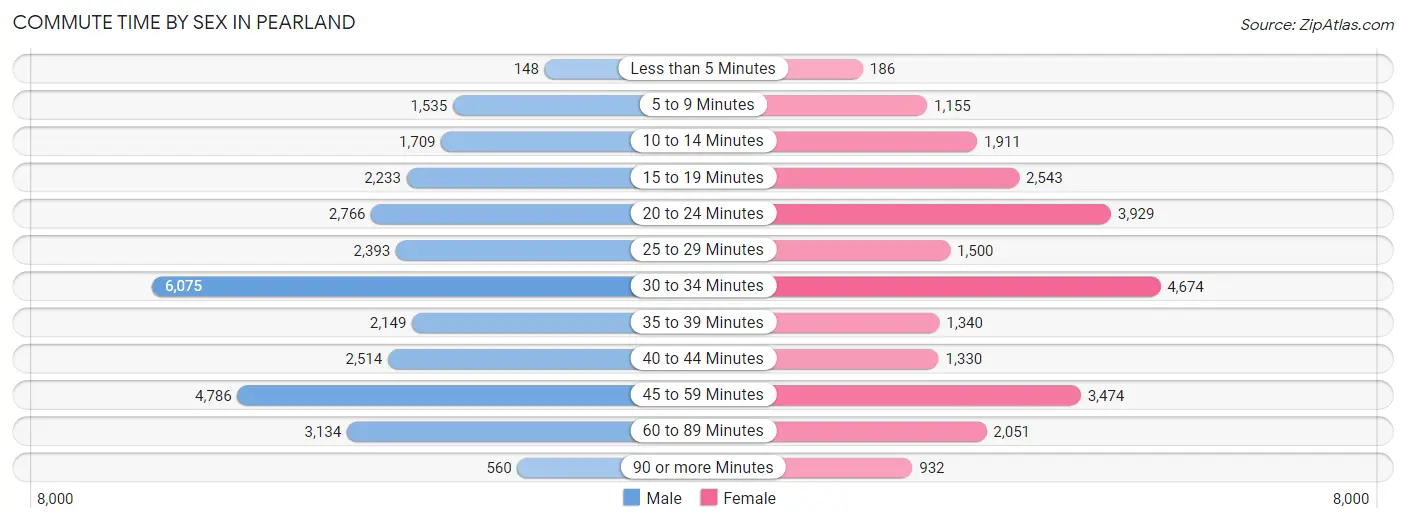
| Commute Time | Male | Female |
| Less than 5 Minutes | 148 (0.5%) | 186 (0.7%) |
| 5 to 9 Minutes | 1,535 (5.1%) | 1,155 (4.6%) |
| 10 to 14 Minutes | 1,709 (5.7%) | 1,911 (7.6%) |
| 15 to 19 Minutes | 2,233 (7.4%) | 2,543 (10.2%) |
| 20 to 24 Minutes | 2,766 (9.2%) | 3,929 (15.7%) |
| 25 to 29 Minutes | 2,393 (8.0%) | 1,500 (6.0%) |
| 30 to 34 Minutes | 6,075 (20.3%) | 4,674 (18.7%) |
| 35 to 39 Minutes | 2,149 (7.2%) | 1,340 (5.3%) |
| 40 to 44 Minutes | 2,514 (8.4%) | 1,330 (5.3%) |
| 45 to 59 Minutes | 4,786 (16.0%) | 3,474 (13.9%) |
| 60 to 89 Minutes | 3,134 (10.4%) | 2,051 (8.2%) |
| 90 or more Minutes | 560 (1.9%) | 932 (3.7%) |
Time of Departure to Work by Sex in Pearland
The most frequent times of departure to work in Pearland are 7:00 AM to 7:29 AM (3,966, 13.2%) for males and 7:00 AM to 7:29 AM (3,509, 14.0%) for females.
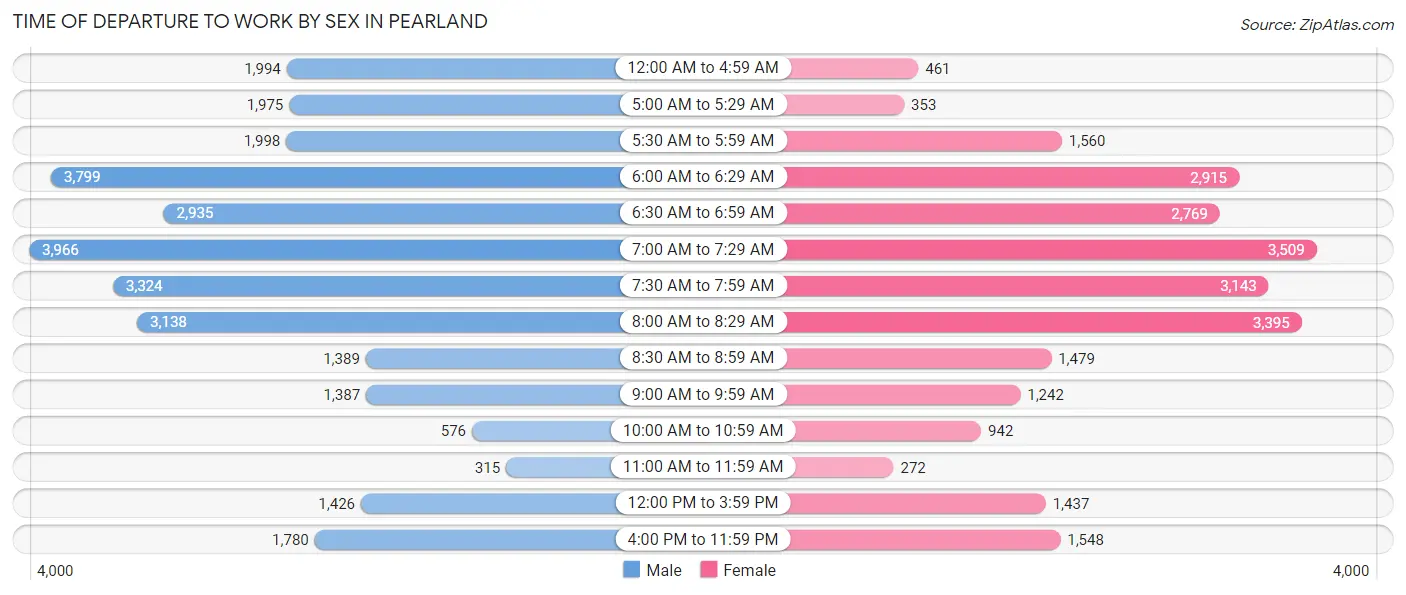
| Time of Departure | Male | Female |
| 12:00 AM to 4:59 AM | 1,994 (6.7%) | 461 (1.8%) |
| 5:00 AM to 5:29 AM | 1,975 (6.6%) | 353 (1.4%) |
| 5:30 AM to 5:59 AM | 1,998 (6.7%) | 1,560 (6.2%) |
| 6:00 AM to 6:29 AM | 3,799 (12.7%) | 2,915 (11.7%) |
| 6:30 AM to 6:59 AM | 2,935 (9.8%) | 2,769 (11.1%) |
| 7:00 AM to 7:29 AM | 3,966 (13.2%) | 3,509 (14.0%) |
| 7:30 AM to 7:59 AM | 3,324 (11.1%) | 3,143 (12.6%) |
| 8:00 AM to 8:29 AM | 3,138 (10.5%) | 3,395 (13.6%) |
| 8:30 AM to 8:59 AM | 1,389 (4.6%) | 1,479 (5.9%) |
| 9:00 AM to 9:59 AM | 1,387 (4.6%) | 1,242 (5.0%) |
| 10:00 AM to 10:59 AM | 576 (1.9%) | 942 (3.8%) |
| 11:00 AM to 11:59 AM | 315 (1.1%) | 272 (1.1%) |
| 12:00 PM to 3:59 PM | 1,426 (4.8%) | 1,437 (5.7%) |
| 4:00 PM to 11:59 PM | 1,780 (5.9%) | 1,548 (6.2%) |
| Total | 30,002 (100.0%) | 25,025 (100.0%) |
Housing Occupancy in Pearland
Occupancy by Ownership in Pearland
Of the total 42,451 dwellings in Pearland, owner-occupied units account for 32,506 (76.6%), while renter-occupied units make up 9,945 (23.4%).
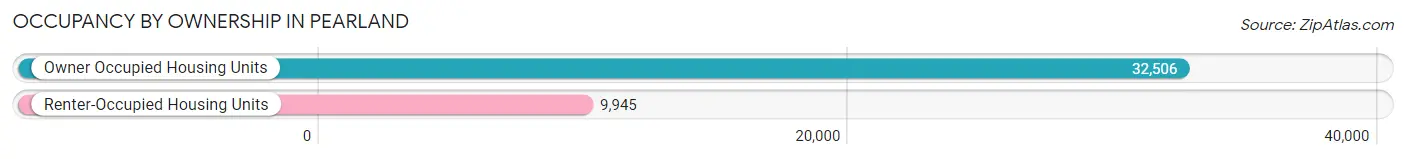
| Occupancy | # Housing Units | % Housing Units |
| Owner Occupied Housing Units | 32,506 | 76.6% |
| Renter-Occupied Housing Units | 9,945 | 23.4% |
| Total Occupied Housing Units | 42,451 | 100.0% |
Occupancy by Household Size in Pearland
| Household Size | # Housing Units | % Housing Units |
| 1-Person Household | 9,014 | 21.2% |
| 2-Person Household | 11,688 | 27.5% |
| 3-Person Household | 6,972 | 16.4% |
| 4+ Person Household | 14,777 | 34.8% |
| Total Housing Units | 42,451 | 100.0% |
Occupancy by Ownership by Household Size in Pearland
| Household Size | Owner-occupied | Renter-occupied |
| 1-Person Household | 4,549 (50.5%) | 4,465 (49.5%) |
| 2-Person Household | 9,300 (79.6%) | 2,388 (20.4%) |
| 3-Person Household | 5,915 (84.8%) | 1,057 (15.2%) |
| 4+ Person Household | 12,742 (86.2%) | 2,035 (13.8%) |
| Total Housing Units | 32,506 (76.6%) | 9,945 (23.4%) |
Occupancy by Educational Attainment in Pearland
| Household Size | Owner-occupied | Renter-occupied |
| Less than High School | 1,226 (77.4%) | 357 (22.6%) |
| High School Diploma | 4,029 (67.8%) | 1,917 (32.2%) |
| College/Associate Degree | 9,480 (74.5%) | 3,245 (25.5%) |
| Bachelor's Degree or higher | 17,771 (80.1%) | 4,426 (19.9%) |
Occupancy by Age of Householder in Pearland
| Age Bracket | # Households | % Households |
| Under 35 Years | 7,499 | 17.7% |
| 35 to 44 Years | 10,764 | 25.4% |
| 45 to 54 Years | 8,992 | 21.2% |
| 55 to 64 Years | 7,215 | 17.0% |
| 65 to 74 Years | 5,114 | 12.0% |
| 75 to 84 Years | 2,142 | 5.1% |
| 85 Years and Over | 725 | 1.7% |
| Total | 42,451 | 100.0% |
Housing Finances in Pearland
Median Income by Occupancy in Pearland
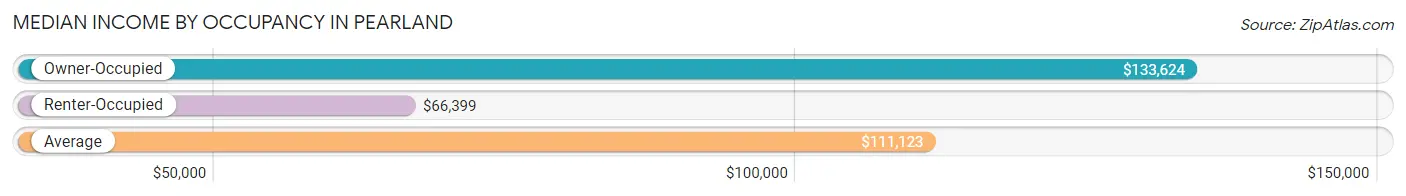
| Occupancy Type | # Households | Median Income |
| Owner-Occupied | 32,506 (76.6%) | $133,624 |
| Renter-Occupied | 9,945 (23.4%) | $66,399 |
| Average | 42,451 (100.0%) | $111,123 |
Occupancy by Householder Income Bracket in Pearland
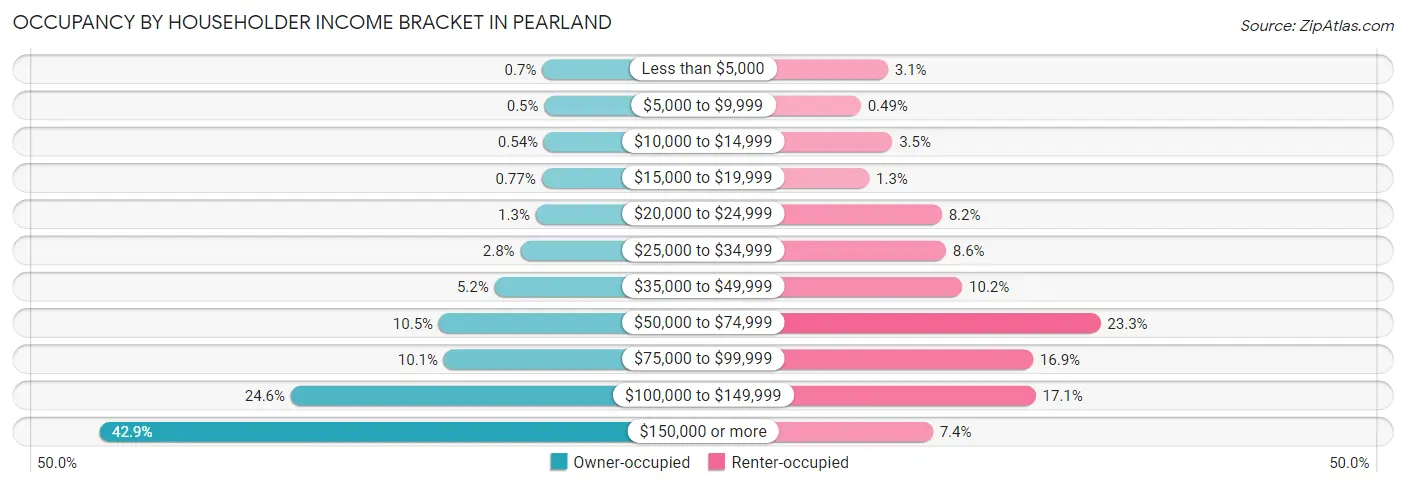
| Income Bracket | Owner-occupied | Renter-occupied |
| Less than $5,000 | 227 (0.7%) | 306 (3.1%) |
| $5,000 to $9,999 | 162 (0.5%) | 49 (0.5%) |
| $10,000 to $14,999 | 174 (0.5%) | 347 (3.5%) |
| $15,000 to $19,999 | 251 (0.8%) | 128 (1.3%) |
| $20,000 to $24,999 | 429 (1.3%) | 816 (8.2%) |
| $25,000 to $34,999 | 904 (2.8%) | 855 (8.6%) |
| $35,000 to $49,999 | 1,704 (5.2%) | 1,009 (10.2%) |
| $50,000 to $74,999 | 3,425 (10.5%) | 2,319 (23.3%) |
| $75,000 to $99,999 | 3,273 (10.1%) | 1,680 (16.9%) |
| $100,000 to $149,999 | 8,011 (24.6%) | 1,705 (17.1%) |
| $150,000 or more | 13,946 (42.9%) | 731 (7.3%) |
| Total | 32,506 (100.0%) | 9,945 (100.0%) |
Monthly Housing Cost Tiers in Pearland
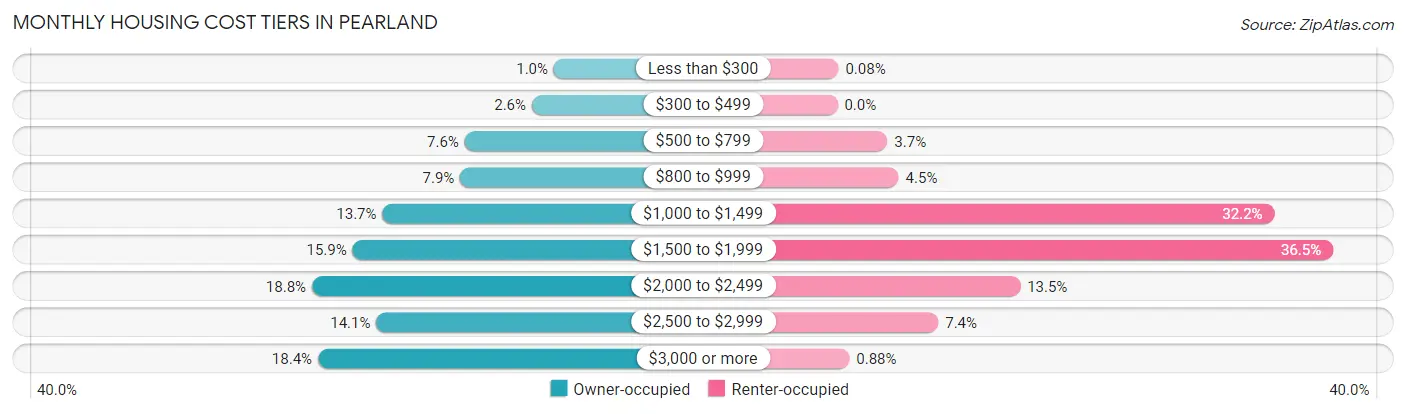
| Monthly Cost | Owner-occupied | Renter-occupied |
| Less than $300 | 332 (1.0%) | 8 (0.1%) |
| $300 to $499 | 858 (2.6%) | 0 (0.0%) |
| $500 to $799 | 2,467 (7.6%) | 366 (3.7%) |
| $800 to $999 | 2,573 (7.9%) | 449 (4.5%) |
| $1,000 to $1,499 | 4,437 (13.7%) | 3,200 (32.2%) |
| $1,500 to $1,999 | 5,153 (15.9%) | 3,630 (36.5%) |
| $2,000 to $2,499 | 6,124 (18.8%) | 1,339 (13.5%) |
| $2,500 to $2,999 | 4,582 (14.1%) | 739 (7.4%) |
| $3,000 or more | 5,980 (18.4%) | 88 (0.9%) |
| Total | 32,506 (100.0%) | 9,945 (100.0%) |
Physical Housing Characteristics in Pearland
Housing Structures in Pearland
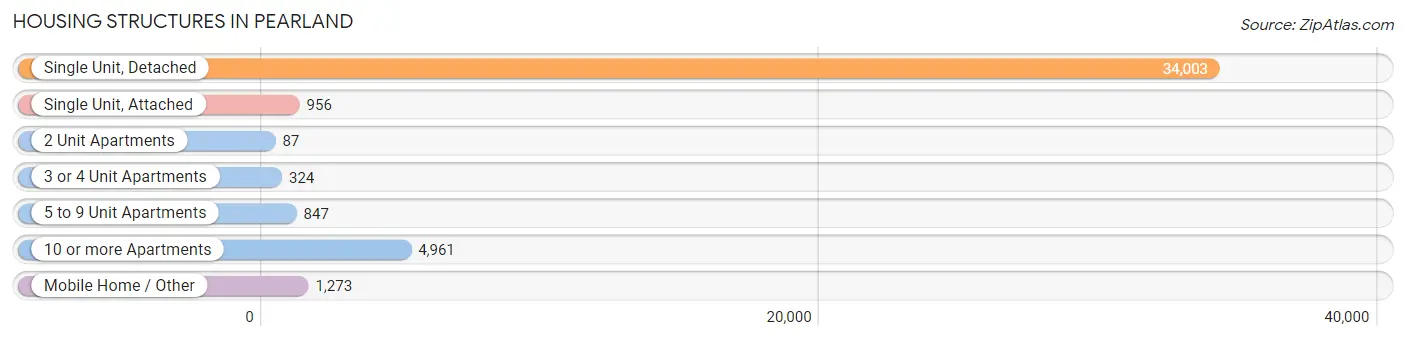
| Structure Type | # Housing Units | % Housing Units |
| Single Unit, Detached | 34,003 | 80.1% |
| Single Unit, Attached | 956 | 2.2% |
| 2 Unit Apartments | 87 | 0.2% |
| 3 or 4 Unit Apartments | 324 | 0.8% |
| 5 to 9 Unit Apartments | 847 | 2.0% |
| 10 or more Apartments | 4,961 | 11.7% |
| Mobile Home / Other | 1,273 | 3.0% |
| Total | 42,451 | 100.0% |
Housing Structures by Occupancy in Pearland
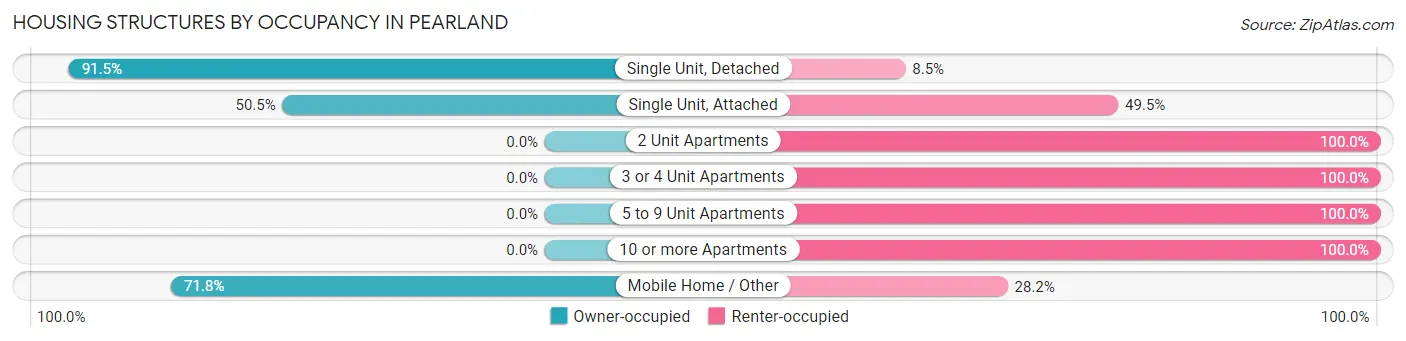
| Structure Type | Owner-occupied | Renter-occupied |
| Single Unit, Detached | 31,109 (91.5%) | 2,894 (8.5%) |
| Single Unit, Attached | 483 (50.5%) | 473 (49.5%) |
| 2 Unit Apartments | 0 (0.0%) | 87 (100.0%) |
| 3 or 4 Unit Apartments | 0 (0.0%) | 324 (100.0%) |
| 5 to 9 Unit Apartments | 0 (0.0%) | 847 (100.0%) |
| 10 or more Apartments | 0 (0.0%) | 4,961 (100.0%) |
| Mobile Home / Other | 914 (71.8%) | 359 (28.2%) |
| Total | 32,506 (76.6%) | 9,945 (23.4%) |
Housing Structures by Number of Rooms in Pearland
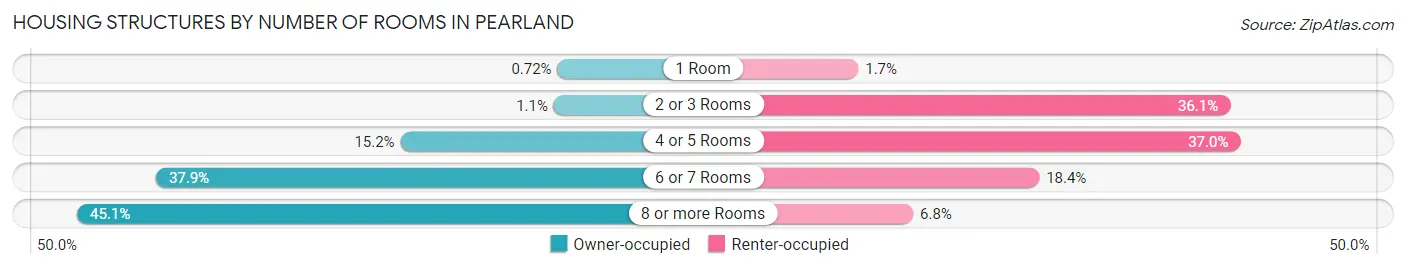
| Number of Rooms | Owner-occupied | Renter-occupied |
| 1 Room | 234 (0.7%) | 169 (1.7%) |
| 2 or 3 Rooms | 343 (1.1%) | 3,588 (36.1%) |
| 4 or 5 Rooms | 4,953 (15.2%) | 3,682 (37.0%) |
| 6 or 7 Rooms | 12,303 (37.9%) | 1,833 (18.4%) |
| 8 or more Rooms | 14,673 (45.1%) | 673 (6.8%) |
| Total | 32,506 (100.0%) | 9,945 (100.0%) |
Housing Structure by Heating Type in Pearland
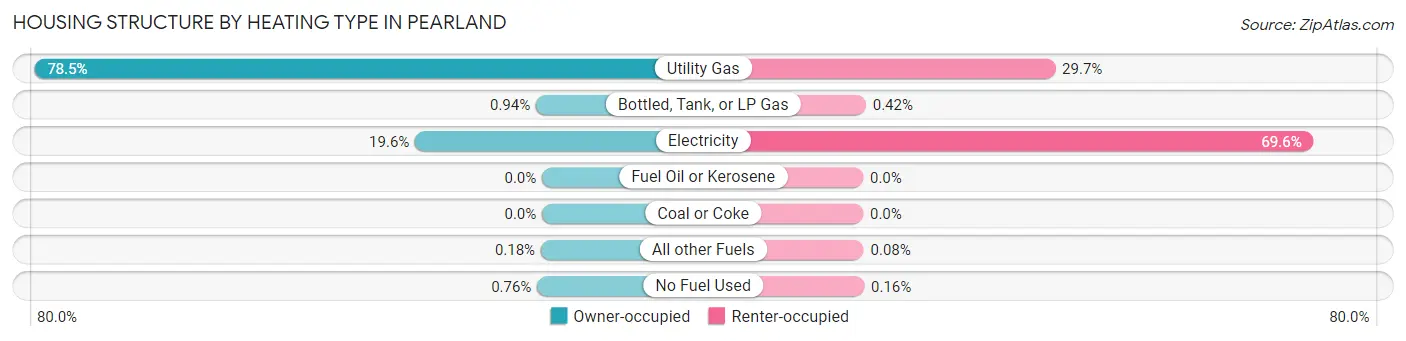
| Heating Type | Owner-occupied | Renter-occupied |
| Utility Gas | 25,519 (78.5%) | 2,954 (29.7%) |
| Bottled, Tank, or LP Gas | 305 (0.9%) | 42 (0.4%) |
| Electricity | 6,379 (19.6%) | 6,925 (69.6%) |
| Fuel Oil or Kerosene | 0 (0.0%) | 0 (0.0%) |
| Coal or Coke | 0 (0.0%) | 0 (0.0%) |
| All other Fuels | 57 (0.2%) | 8 (0.1%) |
| No Fuel Used | 246 (0.8%) | 16 (0.2%) |
| Total | 32,506 (100.0%) | 9,945 (100.0%) |
Household Vehicle Usage in Pearland
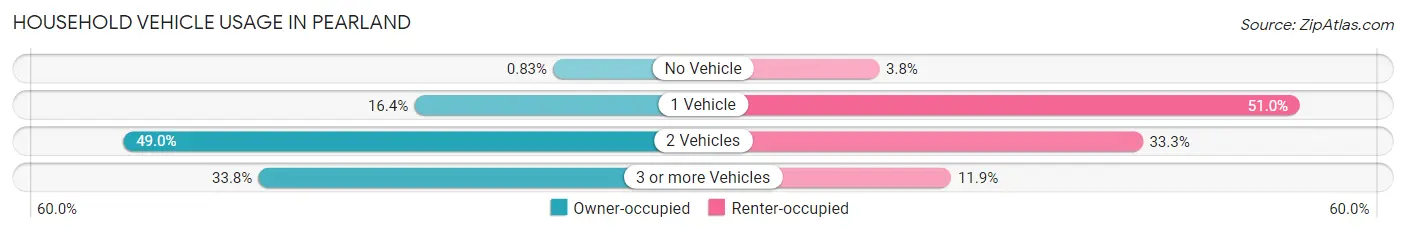
| Vehicles per Household | Owner-occupied | Renter-occupied |
| No Vehicle | 269 (0.8%) | 381 (3.8%) |
| 1 Vehicle | 5,323 (16.4%) | 5,068 (51.0%) |
| 2 Vehicles | 15,913 (48.9%) | 3,315 (33.3%) |
| 3 or more Vehicles | 11,001 (33.8%) | 1,181 (11.9%) |
| Total | 32,506 (100.0%) | 9,945 (100.0%) |
Real Estate & Mortgages in Pearland
Real Estate and Mortgage Overview in Pearland
| Characteristic | Without Mortgage | With Mortgage |
| Housing Units | 9,338 | 23,168 |
| Median Property Value | $289,200 | $319,400 |
| Median Household Income | $96,875 | $10,935 |
| Monthly Housing Costs | $951 | $5,897 |
| Real Estate Taxes | $5,656 | $698 |
Property Value by Mortgage Status in Pearland
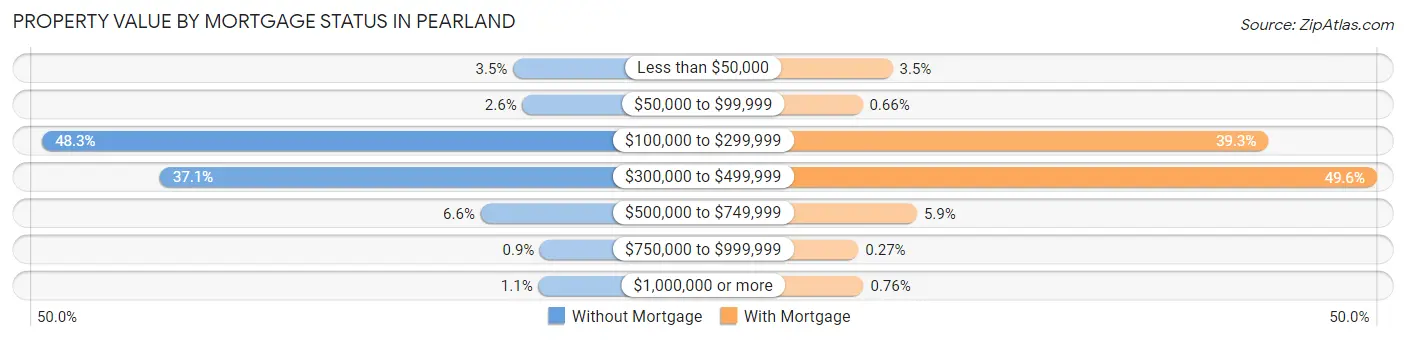
| Property Value | Without Mortgage | With Mortgage |
| Less than $50,000 | 324 (3.5%) | 817 (3.5%) |
| $50,000 to $99,999 | 241 (2.6%) | 153 (0.7%) |
| $100,000 to $299,999 | 4,512 (48.3%) | 9,104 (39.3%) |
| $300,000 to $499,999 | 3,465 (37.1%) | 11,500 (49.6%) |
| $500,000 to $749,999 | 613 (6.6%) | 1,356 (5.9%) |
| $750,000 to $999,999 | 84 (0.9%) | 63 (0.3%) |
| $1,000,000 or more | 99 (1.1%) | 175 (0.8%) |
| Total | 9,338 (100.0%) | 23,168 (100.0%) |
Household Income by Mortgage Status in Pearland
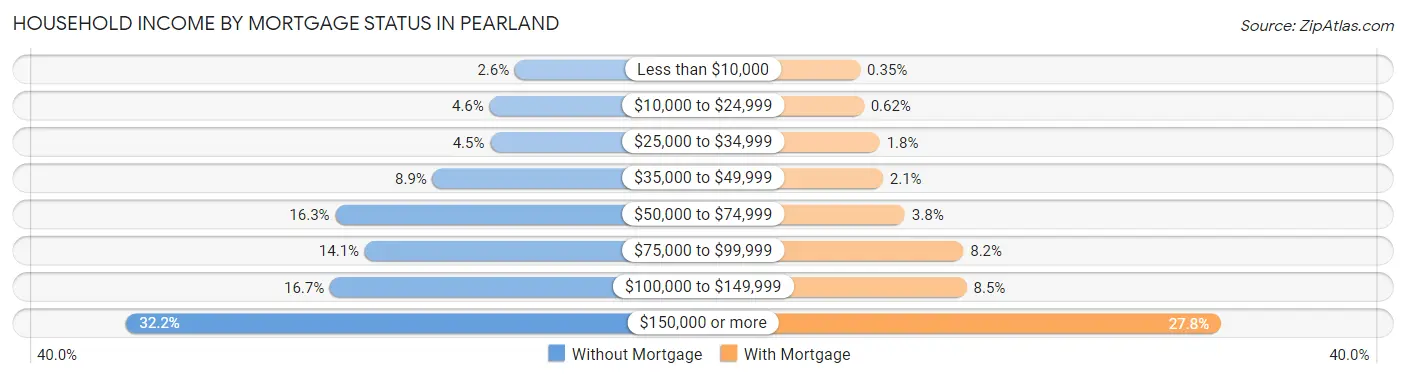
| Household Income | Without Mortgage | With Mortgage |
| Less than $10,000 | 246 (2.6%) | 80 (0.4%) |
| $10,000 to $24,999 | 427 (4.6%) | 143 (0.6%) |
| $25,000 to $34,999 | 422 (4.5%) | 427 (1.8%) |
| $35,000 to $49,999 | 832 (8.9%) | 482 (2.1%) |
| $50,000 to $74,999 | 1,524 (16.3%) | 872 (3.8%) |
| $75,000 to $99,999 | 1,314 (14.1%) | 1,901 (8.2%) |
| $100,000 to $149,999 | 1,562 (16.7%) | 1,959 (8.5%) |
| $150,000 or more | 3,011 (32.2%) | 6,449 (27.8%) |
| Total | 9,338 (100.0%) | 23,168 (100.0%) |
Property Value to Household Income Ratio in Pearland
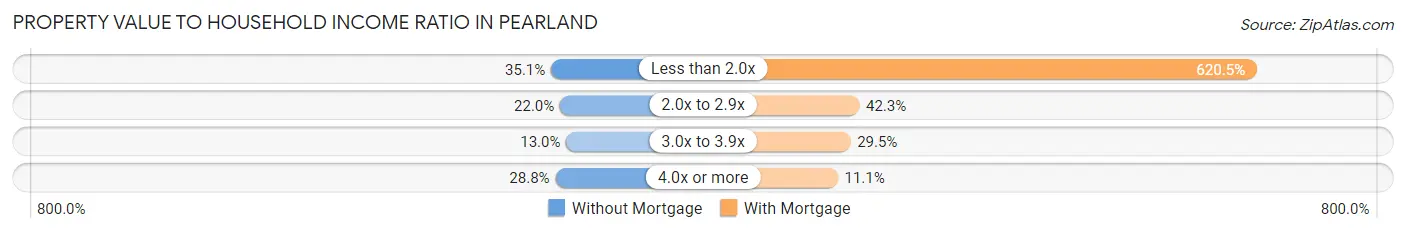
| Value-to-Income Ratio | Without Mortgage | With Mortgage |
| Less than 2.0x | 3,275 (35.1%) | 143,750 (620.5%) |
| 2.0x to 2.9x | 2,050 (22.0%) | 9,809 (42.3%) |
| 3.0x to 3.9x | 1,212 (13.0%) | 6,831 (29.5%) |
| 4.0x or more | 2,689 (28.8%) | 2,567 (11.1%) |
| Total | 9,338 (100.0%) | 23,168 (100.0%) |
Real Estate Taxes by Mortgage Status in Pearland
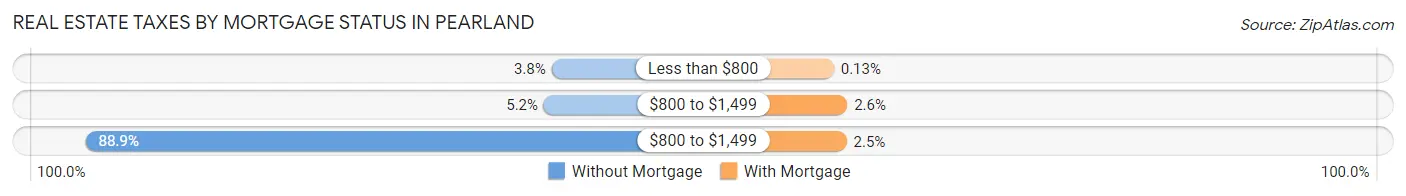
| Property Taxes | Without Mortgage | With Mortgage |
| Less than $800 | 350 (3.7%) | 31 (0.1%) |
| $800 to $1,499 | 482 (5.2%) | 599 (2.6%) |
| $800 to $1,499 | 8,298 (88.9%) | 572 (2.5%) |
| Total | 9,338 (100.0%) | 23,168 (100.0%) |
Health & Disability in Pearland
Health Insurance Coverage by Age in Pearland
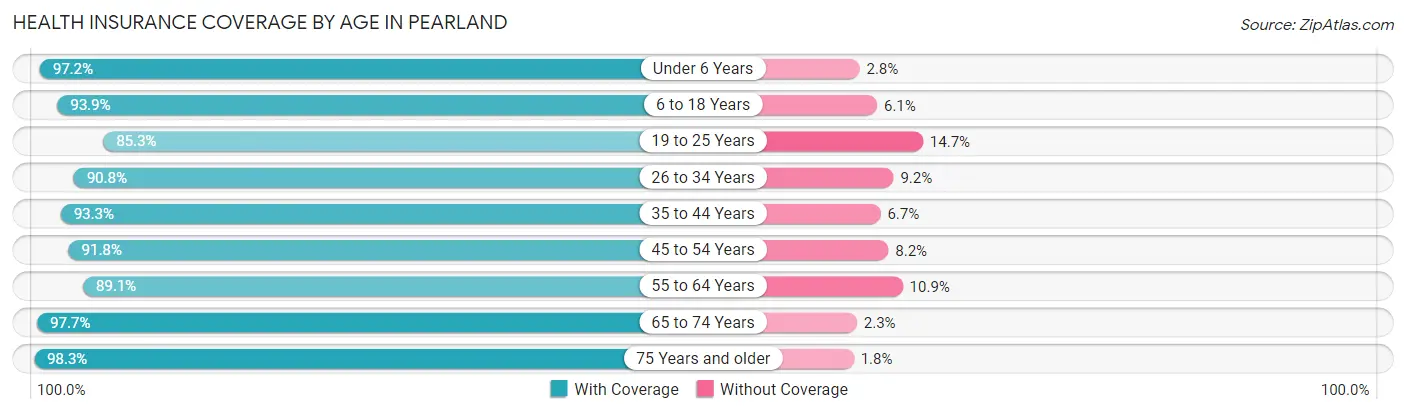
| Age Bracket | With Coverage | Without Coverage |
| Under 6 Years | 10,621 (97.2%) | 310 (2.8%) |
| 6 to 18 Years | 24,073 (93.9%) | 1,567 (6.1%) |
| 19 to 25 Years | 7,015 (85.3%) | 1,205 (14.7%) |
| 26 to 34 Years | 13,702 (90.8%) | 1,383 (9.2%) |
| 35 to 44 Years | 19,214 (93.3%) | 1,389 (6.7%) |
| 45 to 54 Years | 15,054 (91.8%) | 1,347 (8.2%) |
| 55 to 64 Years | 11,223 (89.1%) | 1,370 (10.9%) |
| 65 to 74 Years | 8,928 (97.7%) | 214 (2.3%) |
| 75 Years and older | 4,992 (98.3%) | 89 (1.8%) |
| Total | 114,822 (92.8%) | 8,874 (7.2%) |
Health Insurance Coverage by Citizenship Status in Pearland
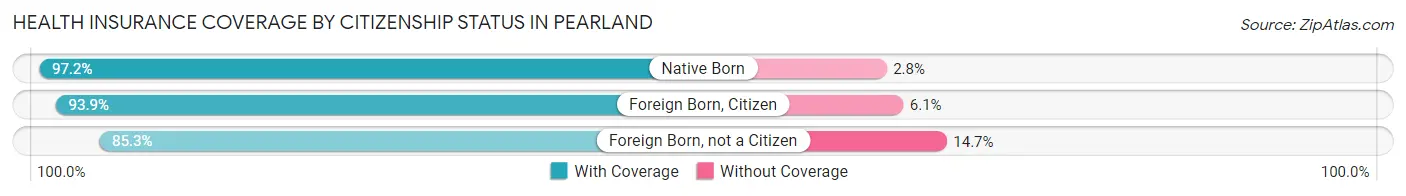
| Citizenship Status | With Coverage | Without Coverage |
| Native Born | 10,621 (97.2%) | 310 (2.8%) |
| Foreign Born, Citizen | 24,073 (93.9%) | 1,567 (6.1%) |
| Foreign Born, not a Citizen | 7,015 (85.3%) | 1,205 (14.7%) |
Health Insurance Coverage by Household Income in Pearland
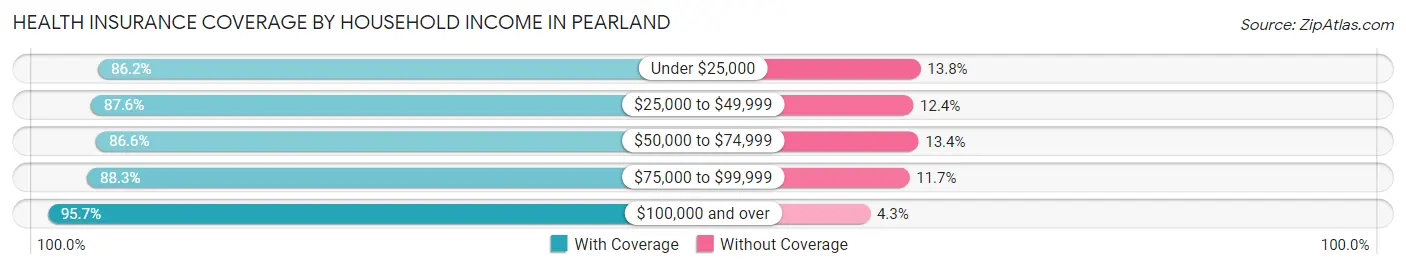
| Household Income | With Coverage | Without Coverage |
| Under $25,000 | 4,381 (86.2%) | 701 (13.8%) |
| $25,000 to $49,999 | 7,551 (87.6%) | 1,071 (12.4%) |
| $50,000 to $74,999 | 12,257 (86.6%) | 1,897 (13.4%) |
| $75,000 to $99,999 | 12,331 (88.3%) | 1,636 (11.7%) |
| $100,000 and over | 78,223 (95.7%) | 3,548 (4.3%) |
Public vs Private Health Insurance Coverage by Age in Pearland
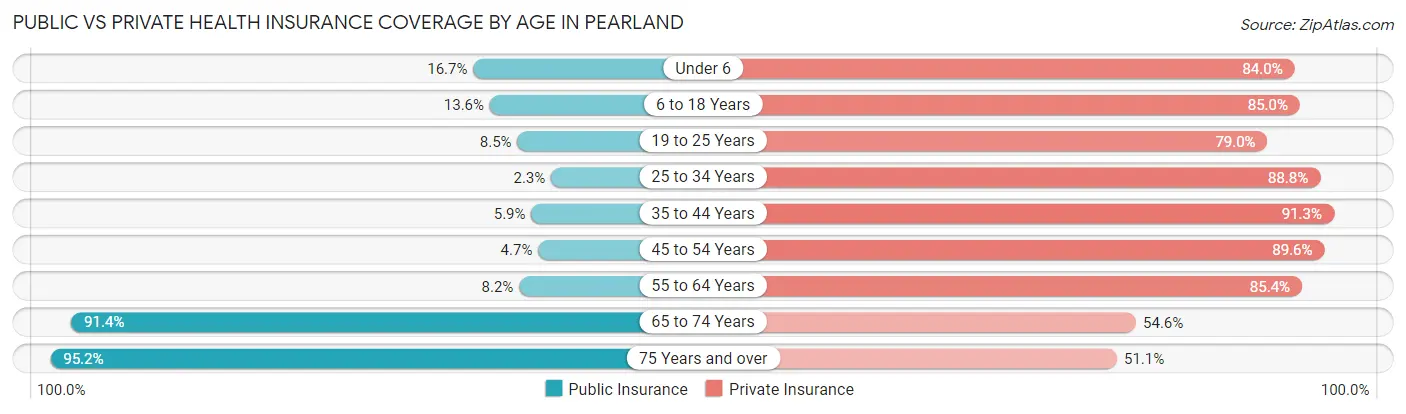
| Age Bracket | Public Insurance | Private Insurance |
| Under 6 | 1,828 (16.7%) | 9,184 (84.0%) |
| 6 to 18 Years | 3,497 (13.6%) | 21,795 (85.0%) |
| 19 to 25 Years | 701 (8.5%) | 6,494 (79.0%) |
| 25 to 34 Years | 342 (2.3%) | 13,389 (88.8%) |
| 35 to 44 Years | 1,223 (5.9%) | 18,815 (91.3%) |
| 45 to 54 Years | 764 (4.7%) | 14,690 (89.6%) |
| 55 to 64 Years | 1,033 (8.2%) | 10,755 (85.4%) |
| 65 to 74 Years | 8,352 (91.4%) | 4,994 (54.6%) |
| 75 Years and over | 4,838 (95.2%) | 2,596 (51.1%) |
| Total | 22,578 (18.2%) | 102,712 (83.0%) |
Disability Status by Sex by Age in Pearland
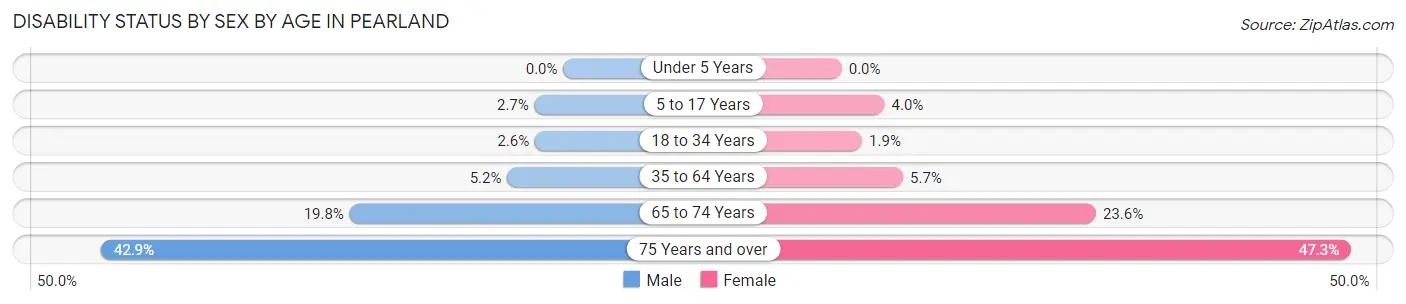
| Age Bracket | Male | Female |
| Under 5 Years | 0 (0.0%) | 0 (0.0%) |
| 5 to 17 Years | 356 (2.7%) | 486 (4.0%) |
| 18 to 34 Years | 323 (2.6%) | 241 (1.9%) |
| 35 to 64 Years | 1,244 (5.2%) | 1,463 (5.7%) |
| 65 to 74 Years | 780 (19.8%) | 1,229 (23.6%) |
| 75 Years and over | 894 (42.9%) | 1,417 (47.3%) |
Disability Class by Sex by Age in Pearland
Disability Class: Hearing Difficulty
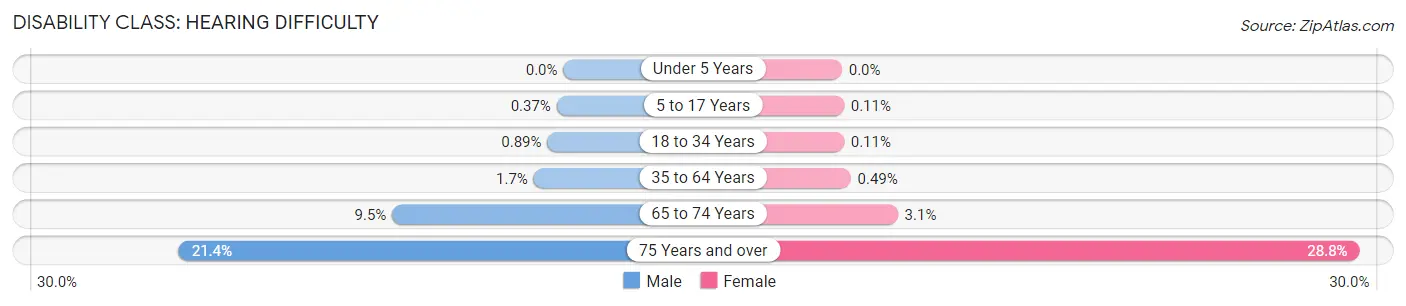
| Age Bracket | Male | Female |
| Under 5 Years | 0 (0.0%) | 0 (0.0%) |
| 5 to 17 Years | 50 (0.4%) | 13 (0.1%) |
| 18 to 34 Years | 110 (0.9%) | 14 (0.1%) |
| 35 to 64 Years | 395 (1.7%) | 127 (0.5%) |
| 65 to 74 Years | 375 (9.5%) | 162 (3.1%) |
| 75 Years and over | 446 (21.4%) | 864 (28.8%) |
Disability Class: Vision Difficulty
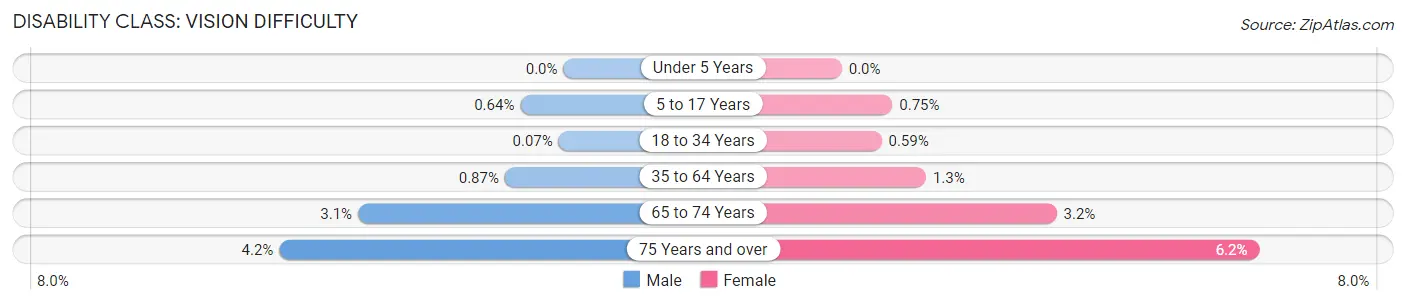
| Age Bracket | Male | Female |
| Under 5 Years | 0 (0.0%) | 0 (0.0%) |
| 5 to 17 Years | 86 (0.6%) | 92 (0.7%) |
| 18 to 34 Years | 9 (0.1%) | 75 (0.6%) |
| 35 to 64 Years | 207 (0.9%) | 322 (1.3%) |
| 65 to 74 Years | 120 (3.0%) | 166 (3.2%) |
| 75 Years and over | 88 (4.2%) | 186 (6.2%) |
Disability Class: Cognitive Difficulty
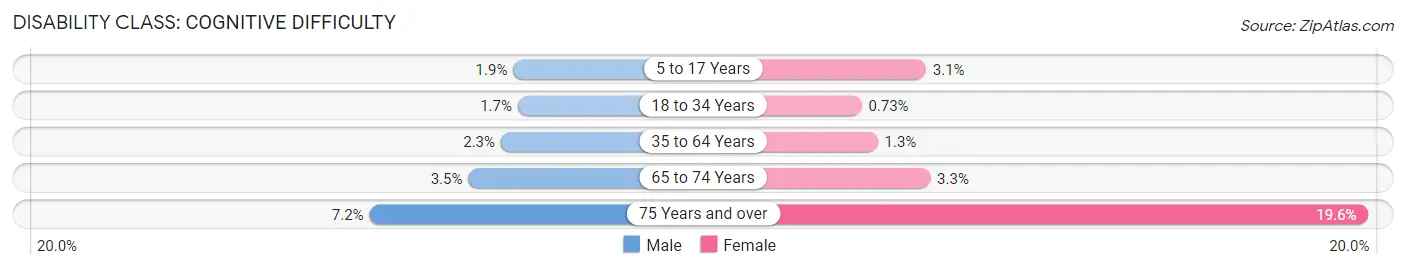
| Age Bracket | Male | Female |
| 5 to 17 Years | 248 (1.9%) | 382 (3.1%) |
| 18 to 34 Years | 208 (1.7%) | 93 (0.7%) |
| 35 to 64 Years | 555 (2.3%) | 341 (1.3%) |
| 65 to 74 Years | 139 (3.5%) | 171 (3.3%) |
| 75 Years and over | 150 (7.2%) | 586 (19.6%) |
Disability Class: Ambulatory Difficulty
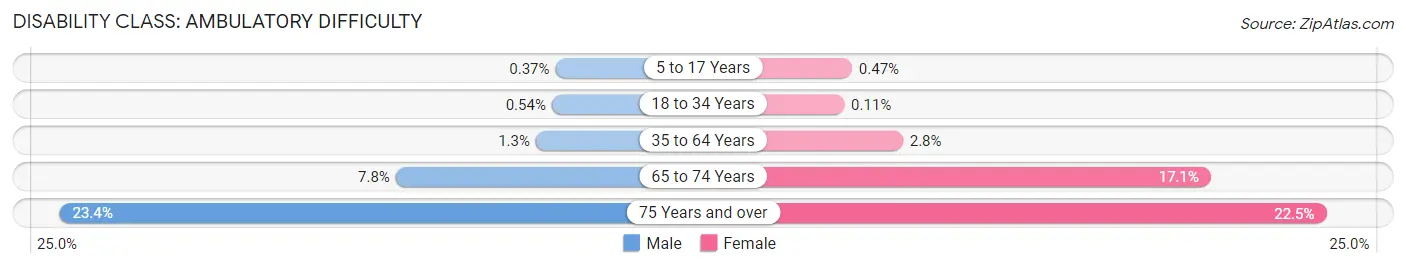
| Age Bracket | Male | Female |
| 5 to 17 Years | 50 (0.4%) | 58 (0.5%) |
| 18 to 34 Years | 66 (0.5%) | 14 (0.1%) |
| 35 to 64 Years | 305 (1.3%) | 727 (2.8%) |
| 65 to 74 Years | 306 (7.8%) | 892 (17.1%) |
| 75 Years and over | 487 (23.4%) | 674 (22.5%) |
Disability Class: Self-Care Difficulty

| Age Bracket | Male | Female |
| 5 to 17 Years | 100 (0.7%) | 93 (0.8%) |
| 18 to 34 Years | 71 (0.6%) | 40 (0.3%) |
| 35 to 64 Years | 179 (0.7%) | 168 (0.6%) |
| 65 to 74 Years | 39 (1.0%) | 69 (1.3%) |
| 75 Years and over | 358 (17.2%) | 316 (10.5%) |
Technology Access in Pearland
Computing Device Access in Pearland
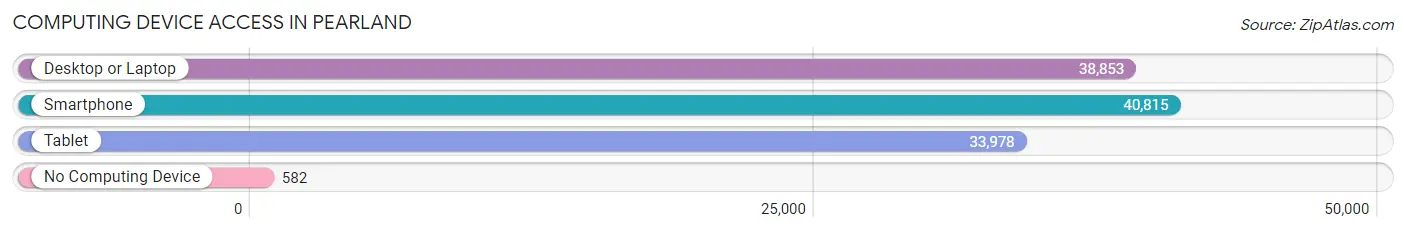
| Device Type | # Households | % Households |
| Desktop or Laptop | 38,853 | 91.5% |
| Smartphone | 40,815 | 96.2% |
| Tablet | 33,978 | 80.0% |
| No Computing Device | 582 | 1.4% |
| Total | 42,451 | 100.0% |
Internet Access in Pearland
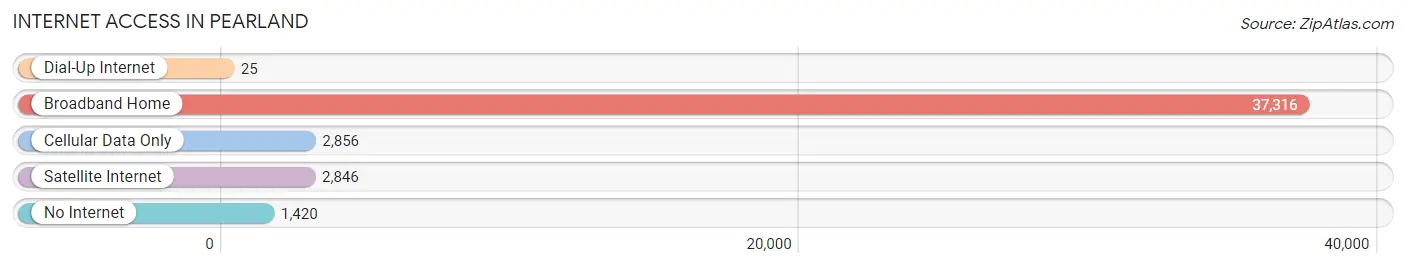
| Internet Type | # Households | % Households |
| Dial-Up Internet | 25 | 0.1% |
| Broadband Home | 37,316 | 87.9% |
| Cellular Data Only | 2,856 | 6.7% |
| Satellite Internet | 2,846 | 6.7% |
| No Internet | 1,420 | 3.4% |
| Total | 42,451 | 100.0% |
Pearland Summary
Pearland, Texas is a city located in the Houston-The Woodlands-Sugar Land metropolitan area in Brazoria County, Texas. The city is located approximately 25 miles south of downtown Houston and is part of the Greater Houston metropolitan area. As of the 2010 census, the city had a population of 91,252, making it the third-largest city in Brazoria County.
History
Pearland, Texas was founded in 1894 by a group of settlers from the nearby town of Markham. The settlers named the town after the abundant pear trees in the area. The town was incorporated in 1959 and has since grown to become one of the largest cities in Brazoria County.
Geography
Pearland is located in the Houston-The Woodlands-Sugar Land metropolitan area in Brazoria County, Texas. The city is located approximately 25 miles south of downtown Houston and is part of the Greater Houston metropolitan area. The city is situated on the Gulf Coastal Plain and is bordered by the cities of Houston, Alvin, Friendswood, and Manvel. The city has a total area of 37.2 square miles, of which 36.9 square miles is land and 0.3 square miles is water.
Economy
Pearland’s economy is largely based on the oil and gas industry, as well as manufacturing and retail. The city is home to several major oil and gas companies, including Chevron, Shell, and ExxonMobil. The city is also home to several manufacturing companies, including Dow Chemical, BASF, and LyondellBasell. The city is also home to several retail stores, including Walmart, Target, and Home Depot.
Demographics
As of the 2010 census, the city had a population of 91,252, making it the third-largest city in Brazoria County. The population is composed of a diverse mix of ethnicities, with the largest groups being White (54.2%), Hispanic or Latino (30.2%), African American (10.3%), and Asian (4.2%). The median household income in Pearland is $77,845, and the median age is 34.7 years. The city has a high rate of homeownership, with 73.2% of residents owning their own homes.
Common Questions
What is Per Capita Income in Pearland?
Per Capita income in Pearland is $47,077.
What is the Median Family Income in Pearland?
Median Family Income in Pearland is $129,972.
What is the Median Household income in Pearland?
Median Household Income in Pearland is $111,123.
What is Income or Wage Gap in Pearland?
Income or Wage Gap in Pearland is 20.2%.
Women in Pearland earn 79.8 cents for every dollar earned by a man.
What is Inequality or Gini Index in Pearland?
Inequality or Gini Index in Pearland is 0.40.
What is the Total Population of Pearland?
Total Population of Pearland is 124,478.
What is the Total Male Population of Pearland?
Total Male Population of Pearland is 60,438.
What is the Total Female Population of Pearland?
Total Female Population of Pearland is 64,040.
What is the Ratio of Males per 100 Females in Pearland?
There are 94.38 Males per 100 Females in Pearland.
What is the Ratio of Females per 100 Males in Pearland?
There are 105.96 Females per 100 Males in Pearland.
What is the Median Population Age in Pearland?
Median Population Age in Pearland is 36.2 Years.
What is the Average Family Size in Pearland
Average Family Size in Pearland is 3.4 People.
What is the Average Household Size in Pearland
Average Household Size in Pearland is 2.9 People.
How Large is the Labor Force in Pearland?
There are 64,494 People in the Labor Forcein in Pearland.
What is the Percentage of People in the Labor Force in Pearland?
68.6% of People are in the Labor Force in Pearland.
What is the Unemployment Rate in Pearland?
Unemployment Rate in Pearland is 3.2%.