Sanford, FL Map & Demographics
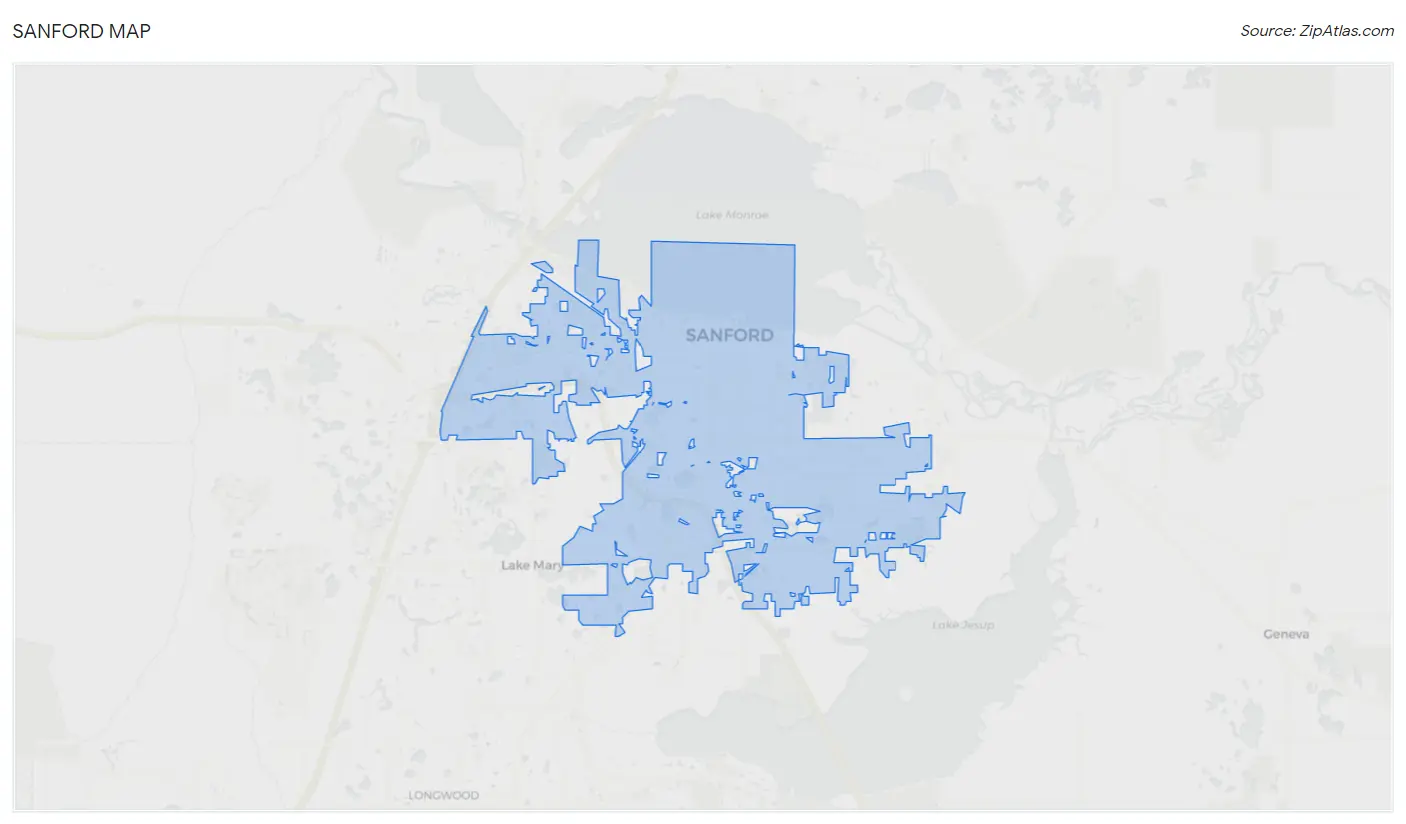
Sanford Map
Sanford Overview
$31,797
PER CAPITA INCOME
$70,732
AVG FAMILY INCOME
$59,181
AVG HOUSEHOLD INCOME
11.6%
WAGE / INCOME GAP [ % ]
88.4¢/ $1
WAGE / INCOME GAP [ $ ]
$10,842
FAMILY INCOME DEFICIT
0.44
INEQUALITY / GINI INDEX
61,272
TOTAL POPULATION
30,695
MALE POPULATION
30,577
FEMALE POPULATION
100.39
MALES / 100 FEMALES
99.62
FEMALES / 100 MALES
35.6
MEDIAN AGE
3.2
AVG FAMILY SIZE
2.5
AVG HOUSEHOLD SIZE
33,040
LABOR FORCE [ PEOPLE ]
67.2%
PERCENT IN LABOR FORCE
5.2%
UNEMPLOYMENT RATE
Income in Sanford
Income Overview in Sanford
Per Capita Income in Sanford is $31,797, while median incomes of families and households are $70,732 and $59,181 respectively.
| Characteristic | Number | Measure |
| Per Capita Income | 61,272 | $31,797 |
| Median Family Income | 14,410 | $70,732 |
| Mean Family Income | 14,410 | $88,516 |
| Median Household Income | 23,683 | $59,181 |
| Mean Household Income | 23,683 | $79,848 |
| Income Deficit | 14,410 | $10,842 |
| Wage / Income Gap (%) | 61,272 | 11.62% |
| Wage / Income Gap ($) | 61,272 | 88.38¢ per $1 |
| Gini / Inequality Index | 61,272 | 0.44 |
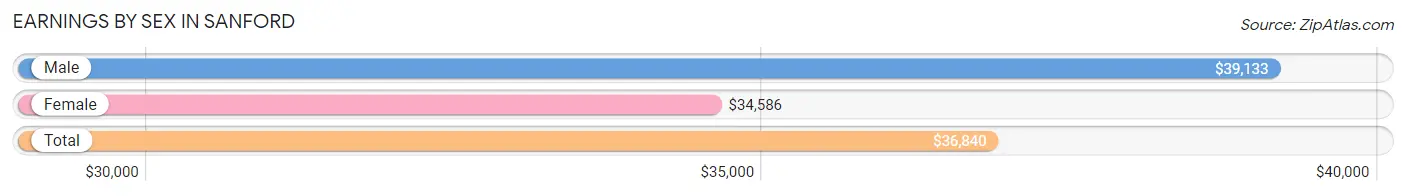
Earnings by Sex in Sanford
Average Earnings in Sanford are $36,840, $39,133 for men and $34,586 for women, a difference of 11.6%.
| Sex | Number | Average Earnings |
| Male | 18,443 (54.9%) | $39,133 |
| Female | 15,119 (45.1%) | $34,586 |
| Total | 33,562 (100.0%) | $36,840 |
Earnings by Sex by Income Bracket in Sanford
The most common earnings brackets in Sanford are $55,000 to $64,999 for men (1,893 | 10.3%) and $30,000 to $34,999 for women (1,598 | 10.6%).
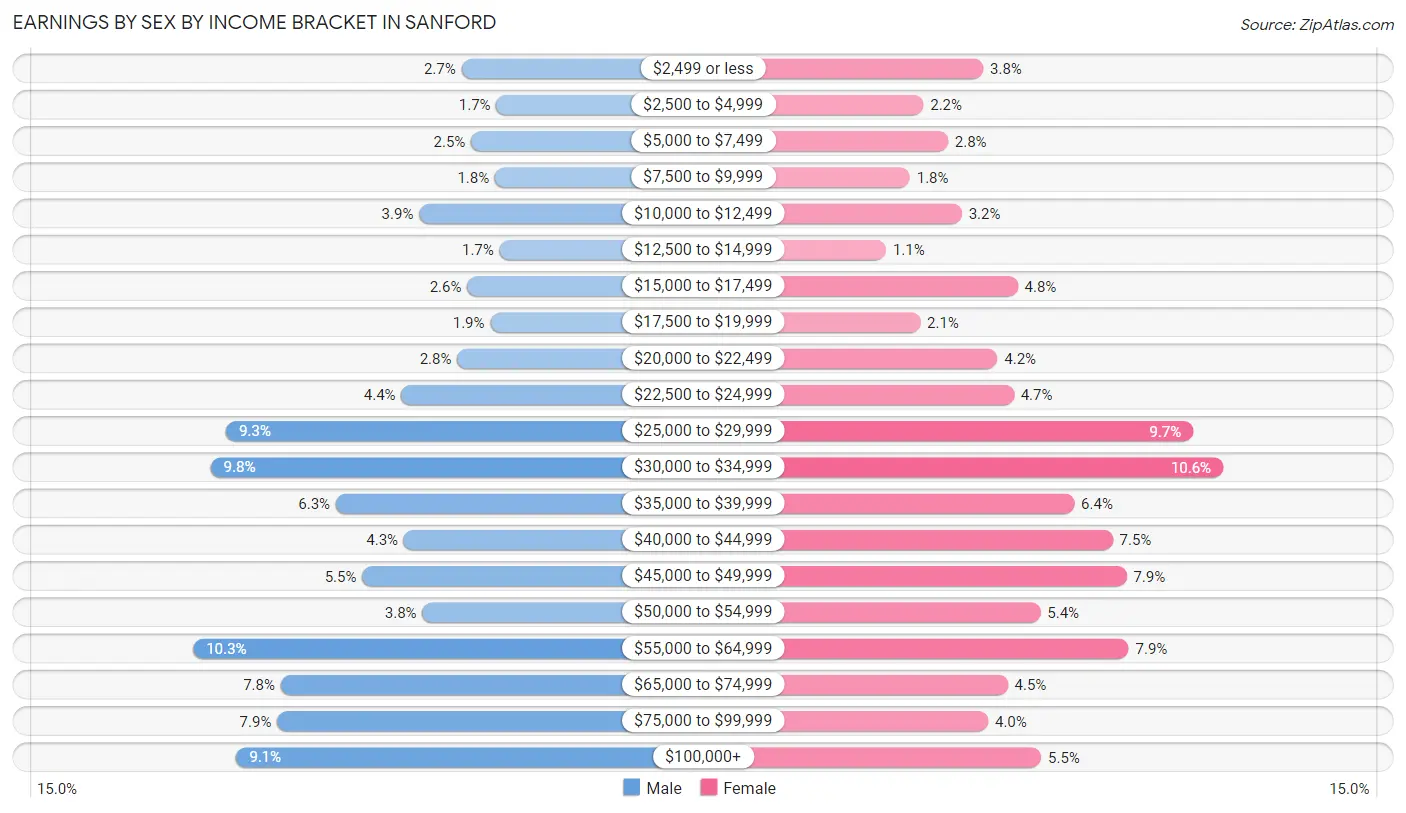
| Income | Male | Female |
| $2,499 or less | 501 (2.7%) | 579 (3.8%) |
| $2,500 to $4,999 | 320 (1.7%) | 325 (2.1%) |
| $5,000 to $7,499 | 452 (2.5%) | 429 (2.8%) |
| $7,500 to $9,999 | 328 (1.8%) | 267 (1.8%) |
| $10,000 to $12,499 | 721 (3.9%) | 488 (3.2%) |
| $12,500 to $14,999 | 305 (1.7%) | 167 (1.1%) |
| $15,000 to $17,499 | 472 (2.6%) | 725 (4.8%) |
| $17,500 to $19,999 | 352 (1.9%) | 311 (2.1%) |
| $20,000 to $22,499 | 523 (2.8%) | 640 (4.2%) |
| $22,500 to $24,999 | 814 (4.4%) | 709 (4.7%) |
| $25,000 to $29,999 | 1,722 (9.3%) | 1,471 (9.7%) |
| $30,000 to $34,999 | 1,801 (9.8%) | 1,598 (10.6%) |
| $35,000 to $39,999 | 1,153 (6.2%) | 966 (6.4%) |
| $40,000 to $44,999 | 800 (4.3%) | 1,129 (7.5%) |
| $45,000 to $49,999 | 1,016 (5.5%) | 1,188 (7.9%) |
| $50,000 to $54,999 | 705 (3.8%) | 822 (5.4%) |
| $55,000 to $64,999 | 1,893 (10.3%) | 1,197 (7.9%) |
| $65,000 to $74,999 | 1,439 (7.8%) | 683 (4.5%) |
| $75,000 to $99,999 | 1,457 (7.9%) | 600 (4.0%) |
| $100,000+ | 1,669 (9.0%) | 825 (5.5%) |
| Total | 18,443 (100.0%) | 15,119 (100.0%) |
Earnings by Sex by Educational Attainment in Sanford
Average earnings in Sanford are $45,910 for men and $37,372 for women, a difference of 18.6%. Men with an educational attainment of bachelor's degree enjoy the highest average annual earnings of $61,209, while those with less than high school education earn the least with $26,843. Women with an educational attainment of bachelor's degree earn the most with the average annual earnings of $47,856, while those with high school diploma education have the smallest earnings of $30,648.
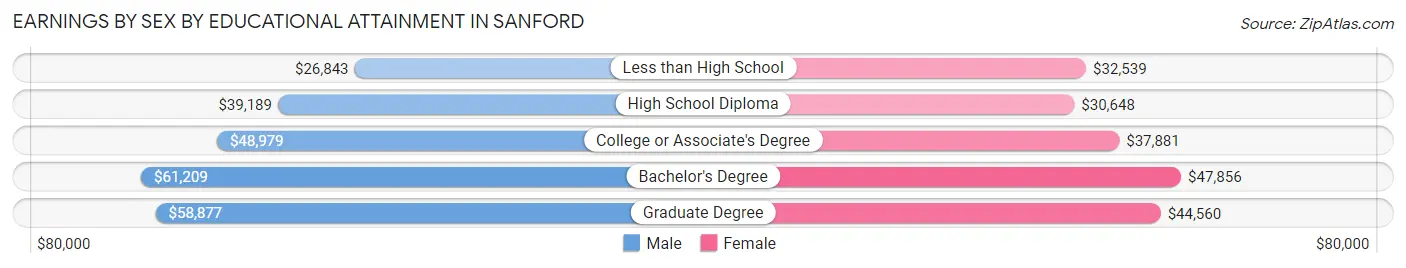
| Educational Attainment | Male Income | Female Income |
| Less than High School | $26,843 | $32,539 |
| High School Diploma | $39,189 | $30,648 |
| College or Associate's Degree | $48,979 | $37,881 |
| Bachelor's Degree | $61,209 | $47,856 |
| Graduate Degree | $58,877 | $44,560 |
| Total | $45,910 | $37,372 |
Family Income in Sanford
Family Income Brackets in Sanford
According to the Sanford family income data, there are 3,358 families falling into the $50,000 to $74,999 income range, which is the most common income bracket and makes up 23.3% of all families. Conversely, the $10,000 to $14,999 income bracket is the least frequent group with only 403 families (2.8%) belonging to this category.
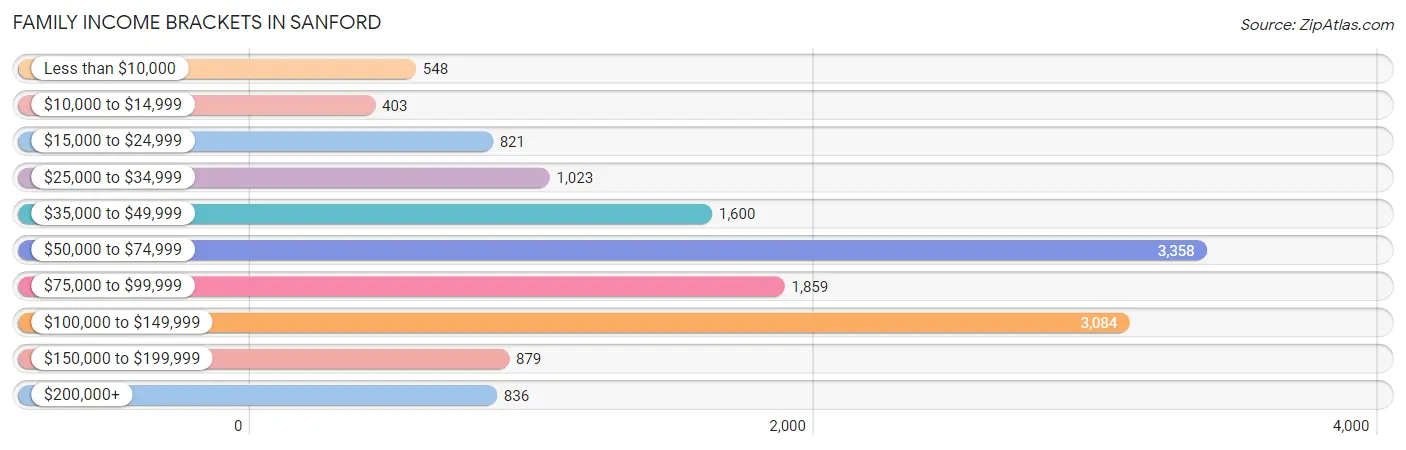
| Income Bracket | # Families | % Families |
| Less than $10,000 | 548 | 3.8% |
| $10,000 to $14,999 | 403 | 2.8% |
| $15,000 to $24,999 | 821 | 5.7% |
| $25,000 to $34,999 | 1,023 | 7.1% |
| $35,000 to $49,999 | 1,600 | 11.1% |
| $50,000 to $74,999 | 3,358 | 23.3% |
| $75,000 to $99,999 | 1,859 | 12.9% |
| $100,000 to $149,999 | 3,084 | 21.4% |
| $150,000 to $199,999 | 879 | 6.1% |
| $200,000+ | 836 | 5.8% |
Family Income by Famaliy Size in Sanford
6-person families (406 | 2.8%) account for the highest median family income in Sanford with $115,667 per family, while 2-person families (6,033 | 41.9%) have the highest median income of $27,835 per family member.
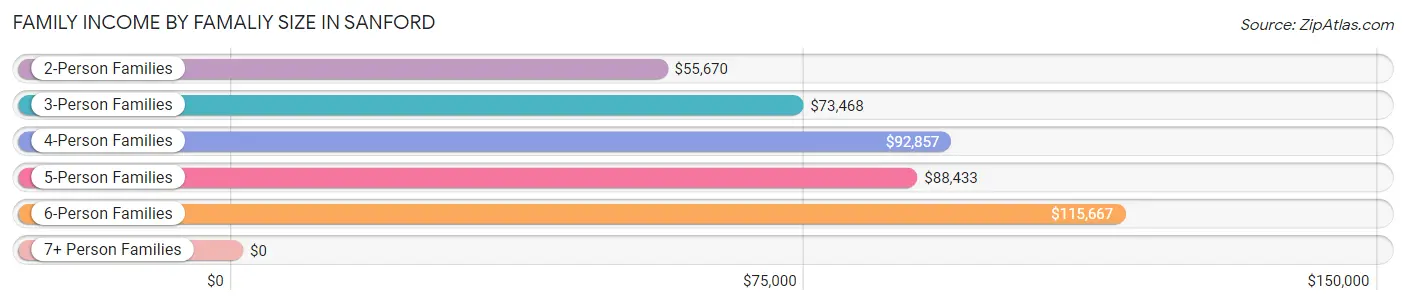
| Income Bracket | # Families | Median Income |
| 2-Person Families | 6,033 (41.9%) | $55,670 |
| 3-Person Families | 3,054 (21.2%) | $73,468 |
| 4-Person Families | 3,226 (22.4%) | $92,857 |
| 5-Person Families | 1,496 (10.4%) | $88,433 |
| 6-Person Families | 406 (2.8%) | $115,667 |
| 7+ Person Families | 195 (1.3%) | $0 |
| Total | 14,410 (100.0%) | $70,732 |
Family Income by Number of Earners in Sanford
The median family income in Sanford is $70,732, with families comprising 3+ earners (1,949) having the highest median family income of $129,648, while families with no earners (1,774) have the lowest median family income of $30,128, accounting for 13.5% and 12.3% of families, respectively.
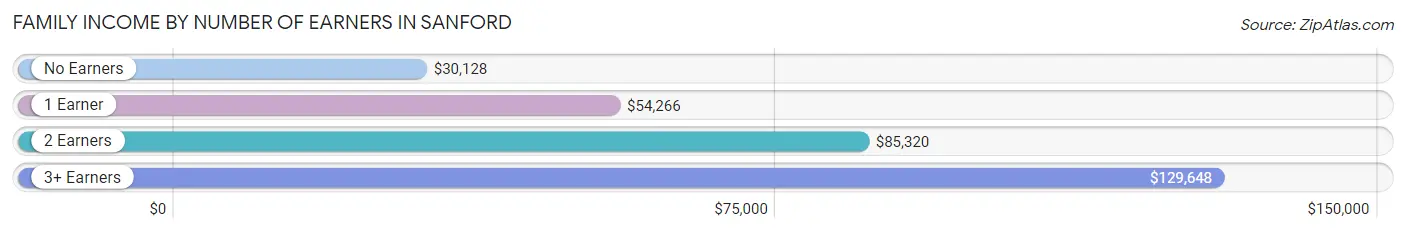
| Number of Earners | # Families | Median Income |
| No Earners | 1,774 (12.3%) | $30,128 |
| 1 Earner | 5,363 (37.2%) | $54,266 |
| 2 Earners | 5,324 (36.9%) | $85,320 |
| 3+ Earners | 1,949 (13.5%) | $129,648 |
| Total | 14,410 (100.0%) | $70,732 |
Household Income in Sanford
Household Income Brackets in Sanford
With 5,044 households falling in the category, the $50,000 to $74,999 income range is the most frequent in Sanford, accounting for 21.3% of all households. In contrast, only 876 households (3.7%) fall into the $10,000 to $14,999 income bracket, making it the least populous group.
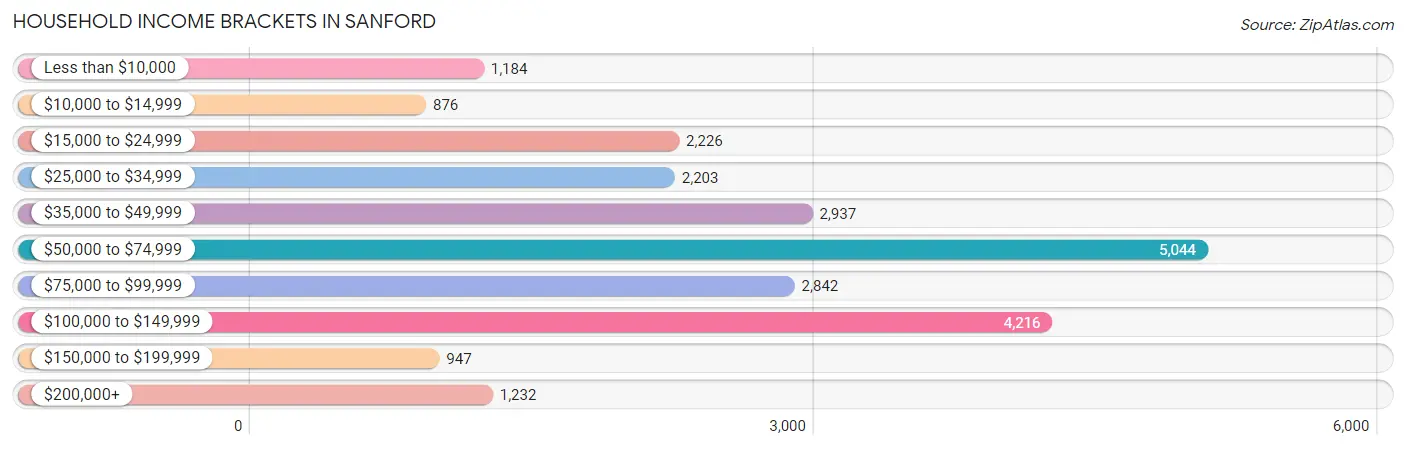
| Income Bracket | # Households | % Households |
| Less than $10,000 | 1,184 | 5.0% |
| $10,000 to $14,999 | 876 | 3.7% |
| $15,000 to $24,999 | 2,226 | 9.4% |
| $25,000 to $34,999 | 2,203 | 9.3% |
| $35,000 to $49,999 | 2,937 | 12.4% |
| $50,000 to $74,999 | 5,044 | 21.3% |
| $75,000 to $99,999 | 2,842 | 12.0% |
| $100,000 to $149,999 | 4,216 | 17.8% |
| $150,000 to $199,999 | 947 | 4.0% |
| $200,000+ | 1,232 | 5.2% |
Household Income by Householder Age in Sanford
The median household income in Sanford is $59,181, with the highest median household income of $66,994 found in the 45 to 64 years age bracket for the primary householder. A total of 8,261 households (34.9%) fall into this category. Meanwhile, the 65+ years age bracket for the primary householder has the lowest median household income of $42,631, with 4,705 households (19.9%) in this group.
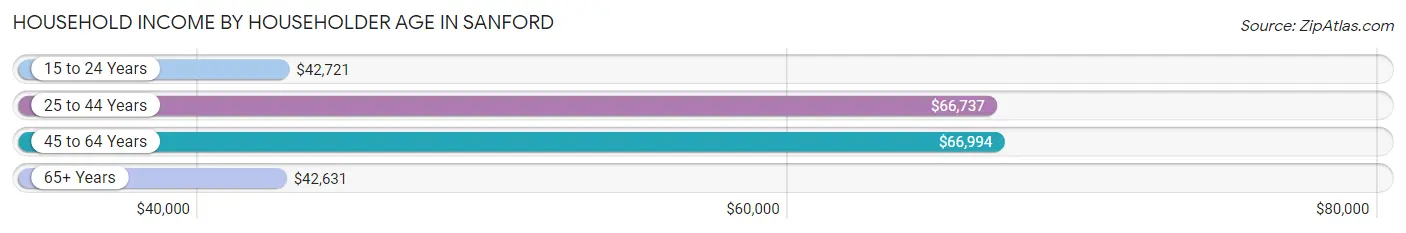
| Income Bracket | # Households | Median Income |
| 15 to 24 Years | 1,330 (5.6%) | $42,721 |
| 25 to 44 Years | 9,387 (39.6%) | $66,737 |
| 45 to 64 Years | 8,261 (34.9%) | $66,994 |
| 65+ Years | 4,705 (19.9%) | $42,631 |
| Total | 23,683 (100.0%) | $59,181 |
Poverty in Sanford
Income Below Poverty by Sex and Age in Sanford
With 10.9% poverty level for males and 14.7% for females among the residents of Sanford, under 5 year old males and 5 year old females are the most vulnerable to poverty, with 415 males (20.2%) and 122 females (22.8%) in their respective age groups living below the poverty level.
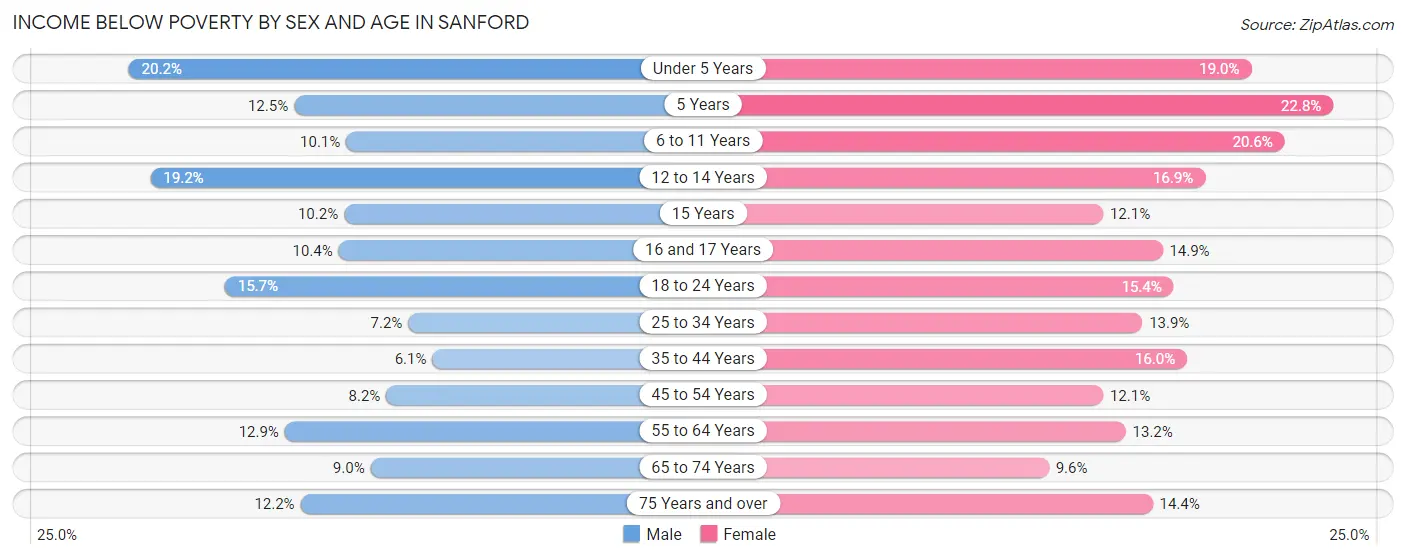
| Age Bracket | Male | Female |
| Under 5 Years | 415 (20.2%) | 293 (19.0%) |
| 5 Years | 41 (12.5%) | 122 (22.8%) |
| 6 to 11 Years | 207 (10.1%) | 470 (20.5%) |
| 12 to 14 Years | 288 (19.2%) | 158 (16.9%) |
| 15 Years | 39 (10.2%) | 44 (12.1%) |
| 16 and 17 Years | 53 (10.4%) | 93 (14.9%) |
| 18 to 24 Years | 517 (15.7%) | 394 (15.4%) |
| 25 to 34 Years | 390 (7.2%) | 717 (13.9%) |
| 35 to 44 Years | 270 (6.1%) | 746 (16.0%) |
| 45 to 54 Years | 281 (8.2%) | 432 (12.1%) |
| 55 to 64 Years | 433 (12.9%) | 465 (13.2%) |
| 65 to 74 Years | 191 (8.9%) | 253 (9.6%) |
| 75 Years and over | 134 (12.2%) | 270 (14.4%) |
| Total | 3,259 (10.9%) | 4,457 (14.7%) |
Income Above Poverty by Sex and Age in Sanford
According to the poverty statistics in Sanford, males aged 35 to 44 years and females aged 65 to 74 years are the age groups that are most secure financially, with 93.9% of males and 90.4% of females in these age groups living above the poverty line.
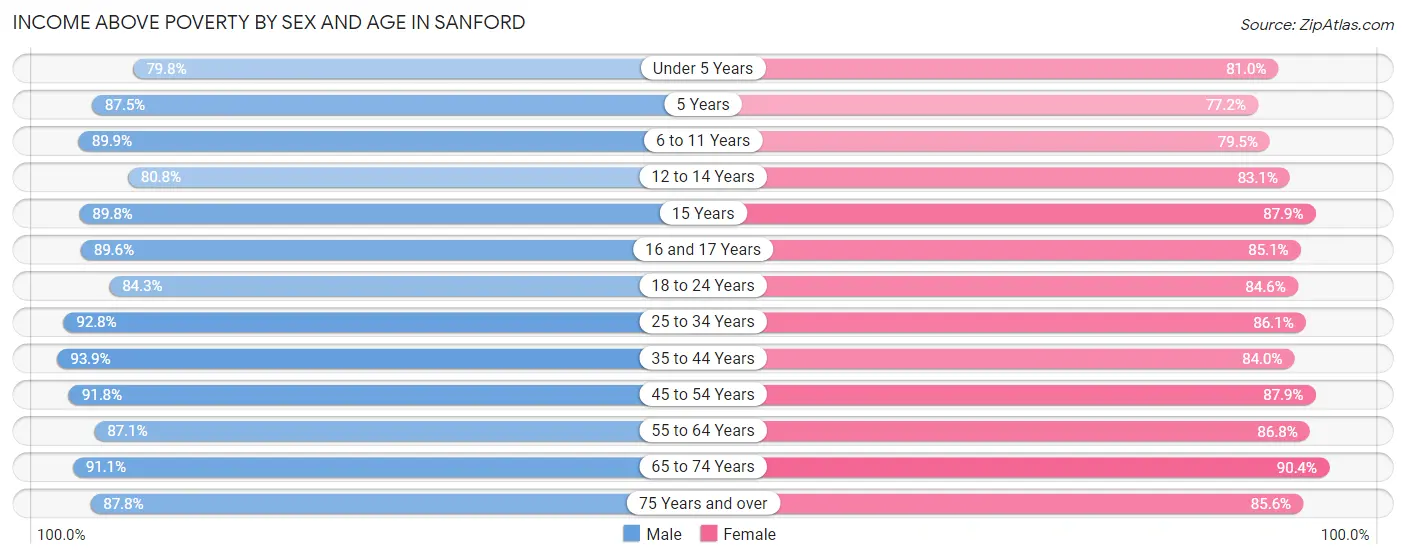
| Age Bracket | Male | Female |
| Under 5 Years | 1,643 (79.8%) | 1,249 (81.0%) |
| 5 Years | 287 (87.5%) | 413 (77.2%) |
| 6 to 11 Years | 1,846 (89.9%) | 1,817 (79.4%) |
| 12 to 14 Years | 1,215 (80.8%) | 779 (83.1%) |
| 15 Years | 344 (89.8%) | 319 (87.9%) |
| 16 and 17 Years | 455 (89.6%) | 532 (85.1%) |
| 18 to 24 Years | 2,773 (84.3%) | 2,164 (84.6%) |
| 25 to 34 Years | 5,023 (92.8%) | 4,425 (86.1%) |
| 35 to 44 Years | 4,172 (93.9%) | 3,910 (84.0%) |
| 45 to 54 Years | 3,137 (91.8%) | 3,133 (87.9%) |
| 55 to 64 Years | 2,917 (87.1%) | 3,066 (86.8%) |
| 65 to 74 Years | 1,942 (91.0%) | 2,382 (90.4%) |
| 75 Years and over | 964 (87.8%) | 1,602 (85.6%) |
| Total | 26,718 (89.1%) | 25,791 (85.3%) |
Income Below Poverty Among Married-Couple Families in Sanford
The poverty statistics for married-couple families in Sanford show that 4.5% or 391 of the total 8,710 families live below the poverty line. Families with 5 or more children have the highest poverty rate of 20.8%, comprising of 5 families. On the other hand, families with no children have the lowest poverty rate of 4.4%, which includes 206 families.
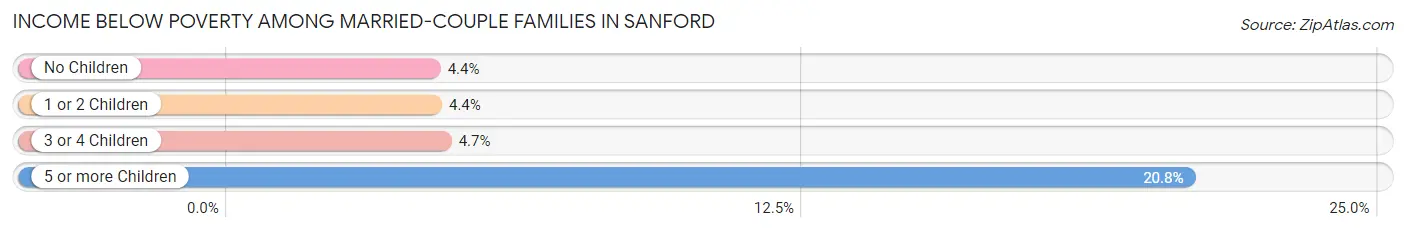
| Children | Above Poverty | Below Poverty |
| No Children | 4,465 (95.6%) | 206 (4.4%) |
| 1 or 2 Children | 3,097 (95.6%) | 144 (4.4%) |
| 3 or 4 Children | 738 (95.4%) | 36 (4.6%) |
| 5 or more Children | 19 (79.2%) | 5 (20.8%) |
| Total | 8,319 (95.5%) | 391 (4.5%) |
Income Below Poverty Among Single-Parent Households in Sanford
According to the poverty data in Sanford, 8.3% or 139 single-father households and 24.8% or 996 single-mother households are living below the poverty line. Among single-father households, those with 1 or 2 children have the highest poverty rate, with 99 households (12.6%) experiencing poverty. Likewise, among single-mother households, those with 3 or 4 children have the highest poverty rate, with 308 households (49.8%) falling below the poverty line.
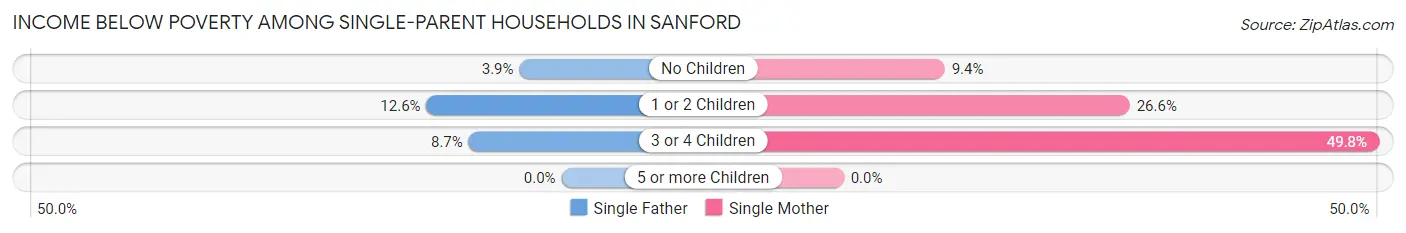
| Children | Single Father | Single Mother |
| No Children | 31 (3.9%) | 119 (9.4%) |
| 1 or 2 Children | 99 (12.6%) | 569 (26.6%) |
| 3 or 4 Children | 9 (8.6%) | 308 (49.8%) |
| 5 or more Children | 0 (0.0%) | 0 (0.0%) |
| Total | 139 (8.3%) | 996 (24.8%) |
Income Below Poverty Among Married-Couple vs Single-Parent Households in Sanford
The poverty data for Sanford shows that 391 of the married-couple family households (4.5%) and 1,135 of the single-parent households (19.9%) are living below the poverty level. Within the married-couple family households, those with 5 or more children have the highest poverty rate, with 5 households (20.8%) falling below the poverty line. Among the single-parent households, those with 3 or 4 children have the highest poverty rate, with 317 household (43.9%) living below poverty.
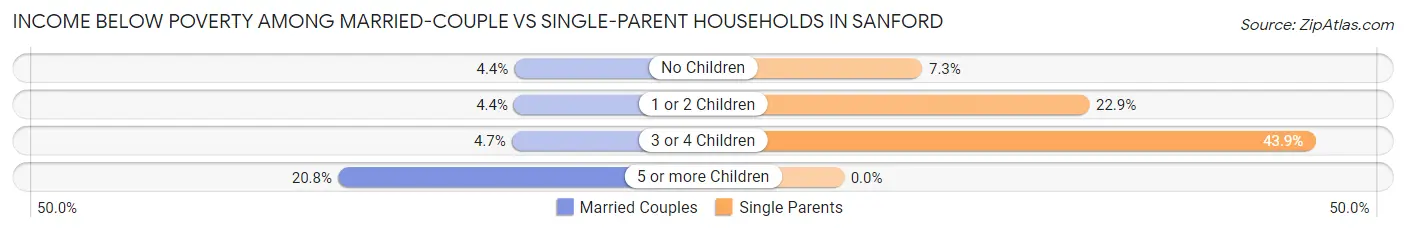
| Children | Married-Couple Families | Single-Parent Households |
| No Children | 206 (4.4%) | 150 (7.3%) |
| 1 or 2 Children | 144 (4.4%) | 668 (22.9%) |
| 3 or 4 Children | 36 (4.6%) | 317 (43.9%) |
| 5 or more Children | 5 (20.8%) | 0 (0.0%) |
| Total | 391 (4.5%) | 1,135 (19.9%) |
Race in Sanford
The most populous races in Sanford are White / Caucasian (28,117 | 45.9%), Black / African American (16,706 | 27.3%), and Hispanic or Latino (16,126 | 26.3%).
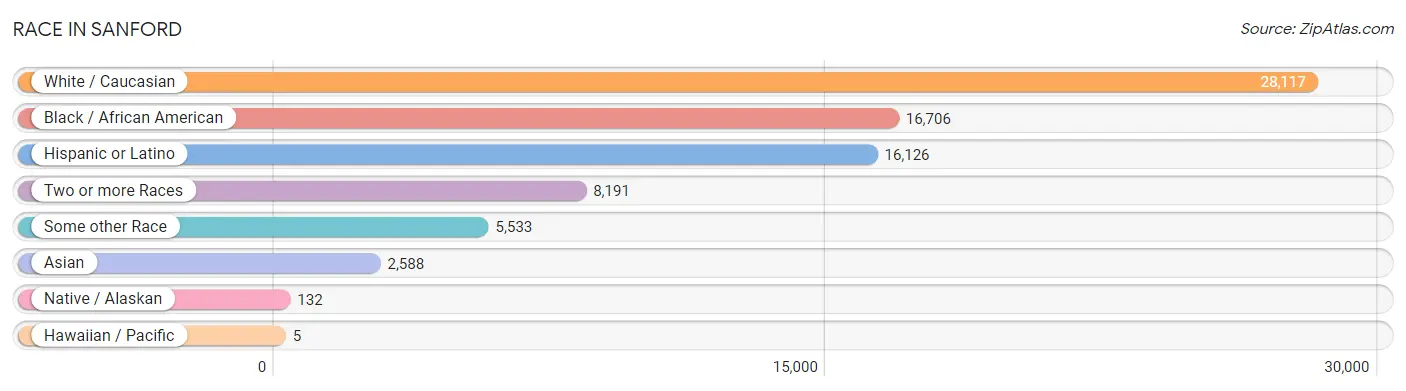
| Race | # Population | % Population |
| Asian | 2,588 | 4.2% |
| Black / African American | 16,706 | 27.3% |
| Hawaiian / Pacific | 5 | 0.0% |
| Hispanic or Latino | 16,126 | 26.3% |
| Native / Alaskan | 132 | 0.2% |
| White / Caucasian | 28,117 | 45.9% |
| Two or more Races | 8,191 | 13.4% |
| Some other Race | 5,533 | 9.0% |
| Total | 61,272 | 100.0% |
Ancestry in Sanford
The most populous ancestries reported in Sanford are American (10,579 | 17.3%), Puerto Rican (6,527 | 10.6%), German (5,068 | 8.3%), Irish (4,187 | 6.8%), and South American (4,186 | 6.8%), together accounting for 49.9% of all Sanford residents.
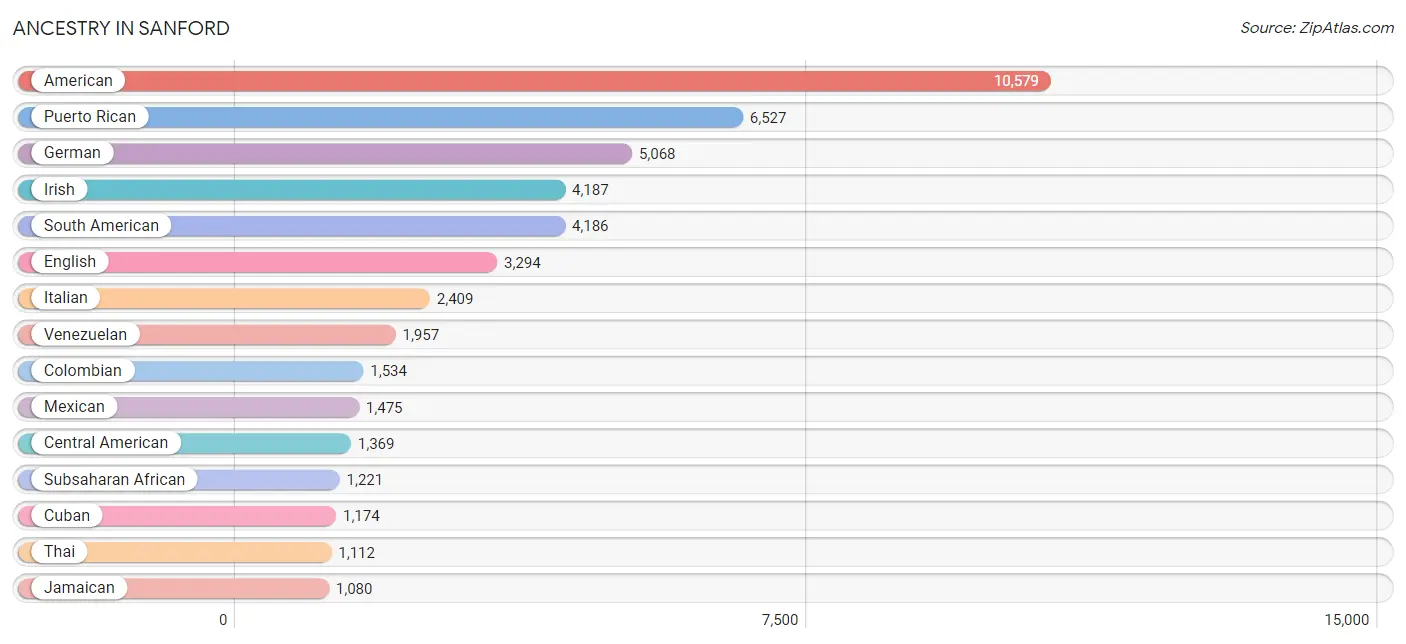
| Ancestry | # Population | % Population |
| African | 578 | 0.9% |
| Albanian | 237 | 0.4% |
| American | 10,579 | 17.3% |
| Apache | 19 | 0.0% |
| Arab | 311 | 0.5% |
| Argentinean | 211 | 0.3% |
| Armenian | 16 | 0.0% |
| Austrian | 54 | 0.1% |
| Bahamian | 94 | 0.2% |
| Belgian | 53 | 0.1% |
| Bhutanese | 148 | 0.2% |
| Blackfeet | 36 | 0.1% |
| Brazilian | 169 | 0.3% |
| British | 166 | 0.3% |
| British West Indian | 12 | 0.0% |
| Burmese | 150 | 0.2% |
| Canadian | 17 | 0.0% |
| Central American | 1,369 | 2.2% |
| Central American Indian | 145 | 0.2% |
| Cherokee | 225 | 0.4% |
| Colombian | 1,534 | 2.5% |
| Costa Rican | 10 | 0.0% |
| Croatian | 52 | 0.1% |
| Cuban | 1,174 | 1.9% |
| Czech | 57 | 0.1% |
| Czechoslovakian | 17 | 0.0% |
| Danish | 32 | 0.1% |
| Dominican | 906 | 1.5% |
| Dutch | 340 | 0.5% |
| Eastern European | 53 | 0.1% |
| Ecuadorian | 245 | 0.4% |
| Egyptian | 126 | 0.2% |
| English | 3,294 | 5.4% |
| Ethiopian | 227 | 0.4% |
| European | 641 | 1.1% |
| Finnish | 103 | 0.2% |
| French | 305 | 0.5% |
| French Canadian | 375 | 0.6% |
| German | 5,068 | 8.3% |
| German Russian | 9 | 0.0% |
| Ghanaian | 7 | 0.0% |
| Greek | 91 | 0.2% |
| Guatemalan | 540 | 0.9% |
| Guyanese | 68 | 0.1% |
| Haitian | 591 | 1.0% |
| Honduran | 128 | 0.2% |
| Hungarian | 219 | 0.4% |
| Indian (Asian) | 321 | 0.5% |
| Indonesian | 181 | 0.3% |
| Iranian | 62 | 0.1% |
| Irish | 4,187 | 6.8% |
| Israeli | 16 | 0.0% |
| Italian | 2,409 | 3.9% |
| Jamaican | 1,080 | 1.8% |
| Korean | 202 | 0.3% |
| Lebanese | 151 | 0.3% |
| Lithuanian | 6 | 0.0% |
| Maltese | 51 | 0.1% |
| Mexican | 1,475 | 2.4% |
| Moroccan | 5 | 0.0% |
| Nicaraguan | 43 | 0.1% |
| Nigerian | 338 | 0.5% |
| Northern European | 35 | 0.1% |
| Norwegian | 157 | 0.3% |
| Pakistani | 6 | 0.0% |
| Palestinian | 9 | 0.0% |
| Panamanian | 276 | 0.4% |
| Peruvian | 137 | 0.2% |
| Polish | 956 | 1.6% |
| Portuguese | 196 | 0.3% |
| Puerto Rican | 6,527 | 10.6% |
| Romanian | 72 | 0.1% |
| Russian | 231 | 0.4% |
| Salvadoran | 372 | 0.6% |
| Scandinavian | 84 | 0.1% |
| Scotch-Irish | 266 | 0.4% |
| Scottish | 654 | 1.1% |
| Slavic | 55 | 0.1% |
| Slovak | 16 | 0.0% |
| South American | 4,186 | 6.8% |
| South American Indian | 11 | 0.0% |
| Spaniard | 115 | 0.2% |
| Spanish | 7 | 0.0% |
| Sri Lankan | 479 | 0.8% |
| Subsaharan African | 1,221 | 2.0% |
| Swedish | 392 | 0.6% |
| Swiss | 3 | 0.0% |
| Syrian | 4 | 0.0% |
| Thai | 1,112 | 1.8% |
| Trinidadian and Tobagonian | 208 | 0.3% |
| Turkish | 95 | 0.2% |
| U.S. Virgin Islander | 40 | 0.1% |
| Ukrainian | 118 | 0.2% |
| Uruguayan | 102 | 0.2% |
| Venezuelan | 1,957 | 3.2% |
| Vietnamese | 91 | 0.2% |
| Welsh | 148 | 0.2% |
| West Indian | 82 | 0.1% | View All 98 Rows |
Immigrants in Sanford
The most numerous immigrant groups reported in Sanford came from Latin America (7,753 | 12.7%), South America (3,949 | 6.5%), Caribbean (2,184 | 3.6%), Venezuela (2,003 | 3.3%), and Asia (1,668 | 2.7%), together accounting for 28.6% of all Sanford residents.
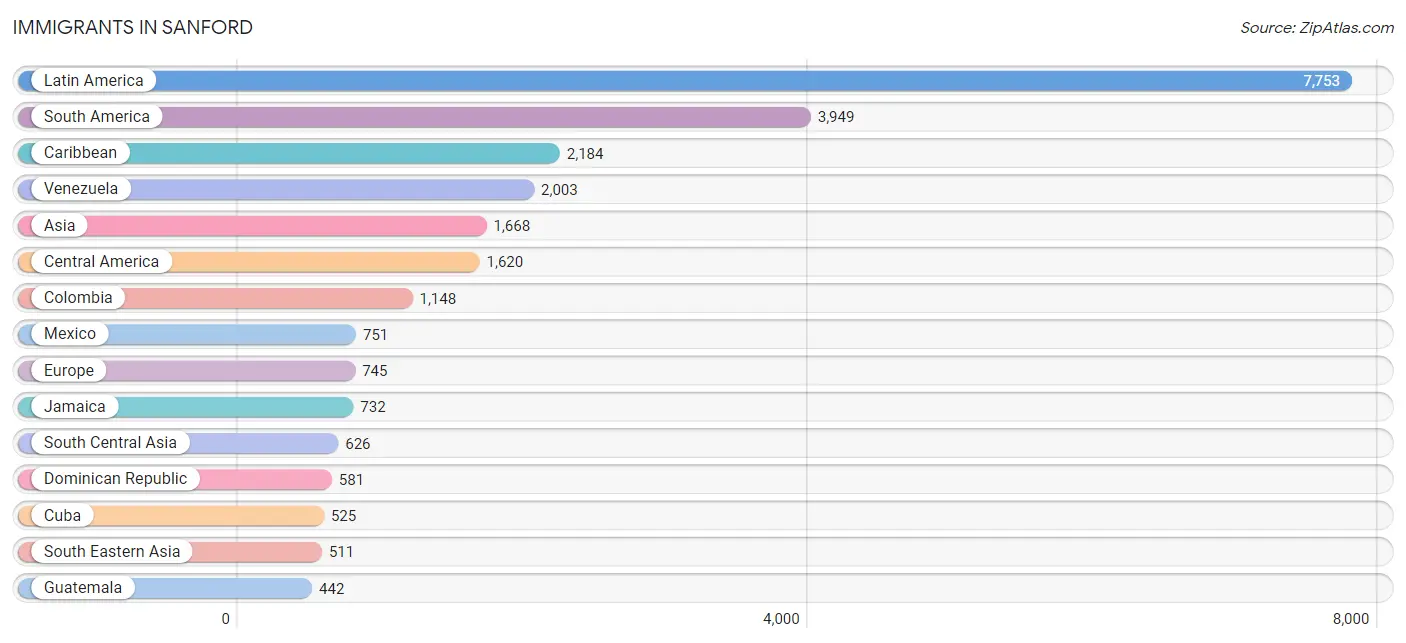
| Immigration Origin | # Population | % Population |
| Africa | 438 | 0.7% |
| Albania | 116 | 0.2% |
| Argentina | 100 | 0.2% |
| Armenia | 1 | 0.0% |
| Asia | 1,668 | 2.7% |
| Austria | 27 | 0.0% |
| Bahamas | 14 | 0.0% |
| Bangladesh | 61 | 0.1% |
| Brazil | 77 | 0.1% |
| Canada | 85 | 0.1% |
| Caribbean | 2,184 | 3.6% |
| Central America | 1,620 | 2.6% |
| China | 313 | 0.5% |
| Colombia | 1,148 | 1.9% |
| Cuba | 525 | 0.9% |
| Czechoslovakia | 3 | 0.0% |
| Dominican Republic | 581 | 0.9% |
| Eastern Africa | 285 | 0.5% |
| Eastern Asia | 400 | 0.6% |
| Eastern Europe | 276 | 0.4% |
| Ecuador | 281 | 0.5% |
| El Salvador | 137 | 0.2% |
| England | 86 | 0.1% |
| Eritrea | 110 | 0.2% |
| Europe | 745 | 1.2% |
| France | 11 | 0.0% |
| Germany | 158 | 0.3% |
| Ghana | 17 | 0.0% |
| Guatemala | 442 | 0.7% |
| Guyana | 129 | 0.2% |
| Haiti | 320 | 0.5% |
| Honduras | 128 | 0.2% |
| Hungary | 4 | 0.0% |
| India | 406 | 0.7% |
| Iran | 31 | 0.1% |
| Ireland | 41 | 0.1% |
| Jamaica | 732 | 1.2% |
| Kenya | 12 | 0.0% |
| Korea | 87 | 0.1% |
| Latin America | 7,753 | 12.7% |
| Malaysia | 26 | 0.0% |
| Mexico | 751 | 1.2% |
| Morocco | 16 | 0.0% |
| Nicaragua | 20 | 0.0% |
| Nigeria | 99 | 0.2% |
| Northern Africa | 16 | 0.0% |
| Northern Europe | 268 | 0.4% |
| Oceania | 5 | 0.0% |
| Pakistan | 128 | 0.2% |
| Panama | 142 | 0.2% |
| Peru | 123 | 0.2% |
| Philippines | 67 | 0.1% |
| Romania | 48 | 0.1% |
| Russia | 68 | 0.1% |
| Saudi Arabia | 23 | 0.0% |
| Singapore | 64 | 0.1% |
| South Africa | 7 | 0.0% |
| South America | 3,949 | 6.5% |
| South Central Asia | 626 | 1.0% |
| South Eastern Asia | 511 | 0.8% |
| Sweden | 14 | 0.0% |
| Thailand | 6 | 0.0% |
| Turkey | 98 | 0.2% |
| Ukraine | 37 | 0.1% |
| Uruguay | 88 | 0.1% |
| Venezuela | 2,003 | 3.3% |
| Vietnam | 274 | 0.4% |
| Western Africa | 119 | 0.2% |
| Western Asia | 126 | 0.2% |
| Western Europe | 196 | 0.3% | View All 70 Rows |
Sex and Age in Sanford
Sex and Age in Sanford
The most populous age groups in Sanford are 30 to 34 Years (3,110 | 10.1%) for men and 30 to 34 Years (2,931 | 9.6%) for women.
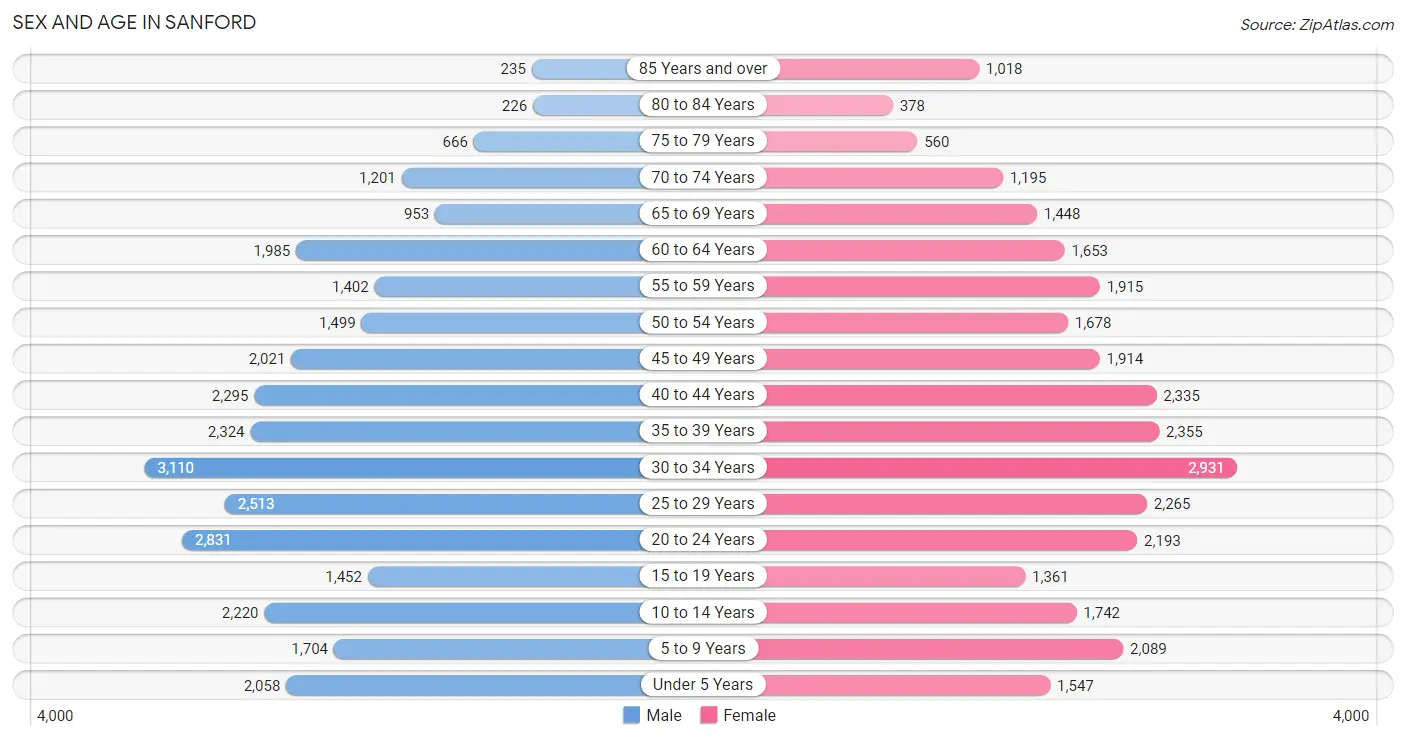
| Age Bracket | Male | Female |
| Under 5 Years | 2,058 (6.7%) | 1,547 (5.1%) |
| 5 to 9 Years | 1,704 (5.6%) | 2,089 (6.8%) |
| 10 to 14 Years | 2,220 (7.2%) | 1,742 (5.7%) |
| 15 to 19 Years | 1,452 (4.7%) | 1,361 (4.4%) |
| 20 to 24 Years | 2,831 (9.2%) | 2,193 (7.2%) |
| 25 to 29 Years | 2,513 (8.2%) | 2,265 (7.4%) |
| 30 to 34 Years | 3,110 (10.1%) | 2,931 (9.6%) |
| 35 to 39 Years | 2,324 (7.6%) | 2,355 (7.7%) |
| 40 to 44 Years | 2,295 (7.5%) | 2,335 (7.6%) |
| 45 to 49 Years | 2,021 (6.6%) | 1,914 (6.3%) |
| 50 to 54 Years | 1,499 (4.9%) | 1,678 (5.5%) |
| 55 to 59 Years | 1,402 (4.6%) | 1,915 (6.3%) |
| 60 to 64 Years | 1,985 (6.5%) | 1,653 (5.4%) |
| 65 to 69 Years | 953 (3.1%) | 1,448 (4.7%) |
| 70 to 74 Years | 1,201 (3.9%) | 1,195 (3.9%) |
| 75 to 79 Years | 666 (2.2%) | 560 (1.8%) |
| 80 to 84 Years | 226 (0.7%) | 378 (1.2%) |
| 85 Years and over | 235 (0.8%) | 1,018 (3.3%) |
| Total | 30,695 (100.0%) | 30,577 (100.0%) |
Families and Households in Sanford
Median Family Size in Sanford
The median family size in Sanford is 3.21 persons per family, with married-couple families (8,710 | 60.4%) accounting for the largest median family size of 3.36 persons per family. On the other hand, single male/father families (1,681 | 11.7%) represent the smallest median family size with 2.65 persons per family.
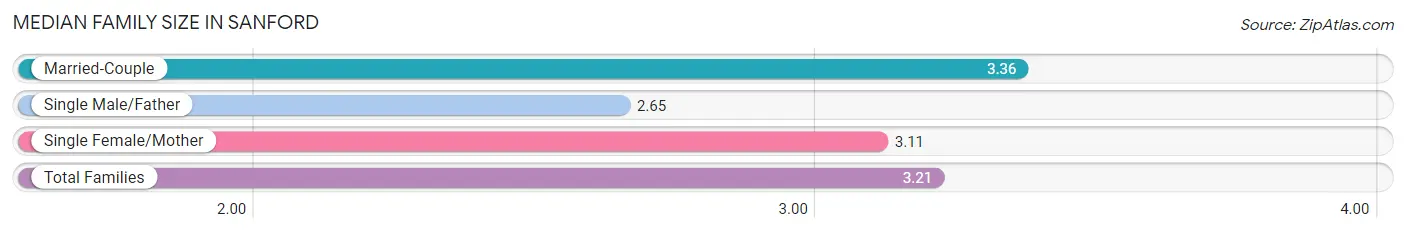
| Family Type | # Families | Family Size |
| Married-Couple | 8,710 (60.4%) | 3.36 |
| Single Male/Father | 1,681 (11.7%) | 2.65 |
| Single Female/Mother | 4,019 (27.9%) | 3.11 |
| Total Families | 14,410 (100.0%) | 3.21 |
Median Household Size in Sanford
The median household size in Sanford is 2.54 persons per household, with married-couple households (8,710 | 36.8%) accounting for the largest median household size of 3.38 persons per household. non-family households (9,273 | 39.2%) represent the smallest median household size with 1.35 persons per household.
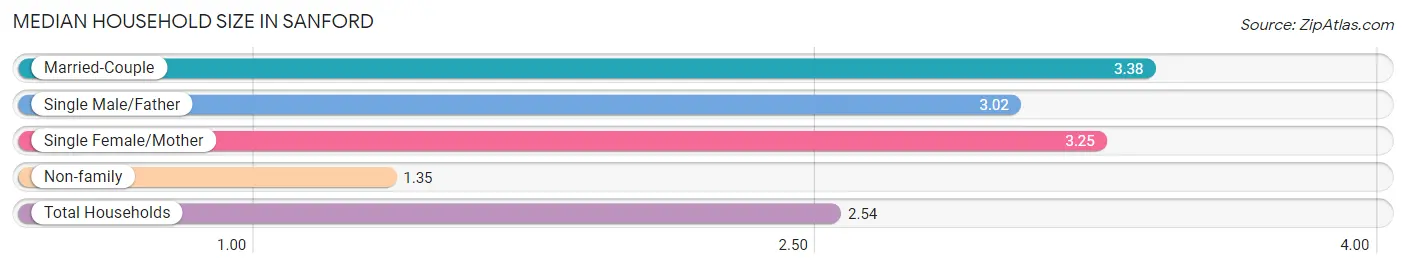
| Household Type | # Households | Household Size |
| Married-Couple | 8,710 (36.8%) | 3.38 |
| Single Male/Father | 1,681 (7.1%) | 3.02 |
| Single Female/Mother | 4,019 (17.0%) | 3.25 |
| Non-family | 9,273 (39.2%) | 1.35 |
| Total Households | 23,683 (100.0%) | 2.54 |
Household Size by Marriage Status in Sanford
Out of a total of 23,683 households in Sanford, 14,410 (60.9%) are family households, while 9,273 (39.2%) are nonfamily households. The most numerous type of family households are 2-person households, comprising 5,522, and the most common type of nonfamily households are 1-person households, comprising 7,040.
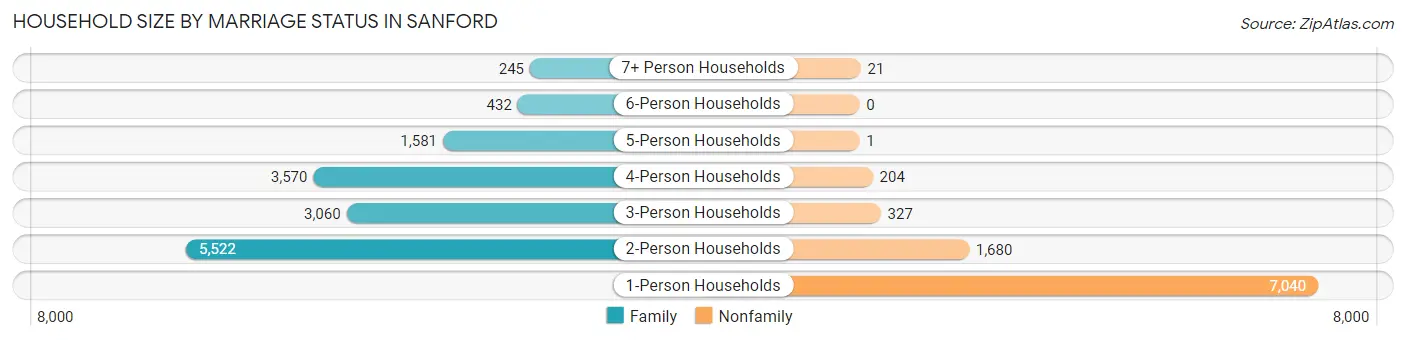
| Household Size | Family Households | Nonfamily Households |
| 1-Person Households | - | 7,040 (29.7%) |
| 2-Person Households | 5,522 (23.3%) | 1,680 (7.1%) |
| 3-Person Households | 3,060 (12.9%) | 327 (1.4%) |
| 4-Person Households | 3,570 (15.1%) | 204 (0.9%) |
| 5-Person Households | 1,581 (6.7%) | 1 (0.0%) |
| 6-Person Households | 432 (1.8%) | 0 (0.0%) |
| 7+ Person Households | 245 (1.0%) | 21 (0.1%) |
| Total | 14,410 (60.9%) | 9,273 (39.2%) |
Female Fertility in Sanford
Fertility by Age in Sanford
Average fertility rate in Sanford is 37.0 births per 1,000 women. Women in the age bracket of 35 to 50 years have the highest fertility rate with 46.0 births per 1,000 women. Women in the age bracket of 35 to 50 years acount for 55.0% of all women with births.
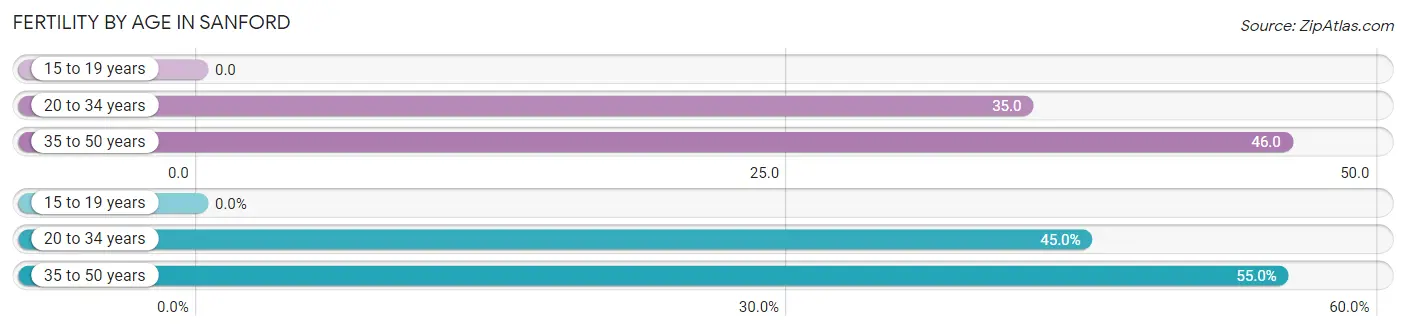
| Age Bracket | Women with Births | Births / 1,000 Women |
| 15 to 19 years | 0 (0.0%) | 0.0 |
| 20 to 34 years | 257 (45.0%) | 35.0 |
| 35 to 50 years | 314 (55.0%) | 46.0 |
| Total | 571 (100.0%) | 37.0 |
Fertility by Age by Marriage Status in Sanford
52.5% of women with births (571) in Sanford are married. The highest percentage of unmarried women with births falls into 35 to 50 years age bracket with 52.2% of them unmarried at the time of birth, while the lowest percentage of unmarried women with births belong to 20 to 34 years age bracket with 41.6% of them unmarried.
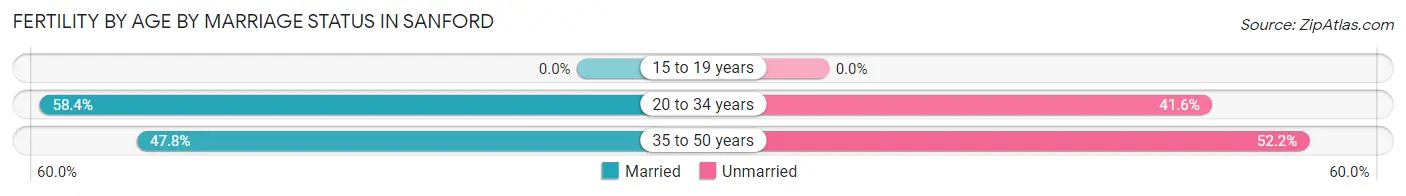
| Age Bracket | Married | Unmarried |
| 15 to 19 years | 0 (0.0%) | 0 (0.0%) |
| 20 to 34 years | 150 (58.4%) | 107 (41.6%) |
| 35 to 50 years | 150 (47.8%) | 164 (52.2%) |
| Total | 300 (52.5%) | 271 (47.5%) |
Fertility by Education in Sanford
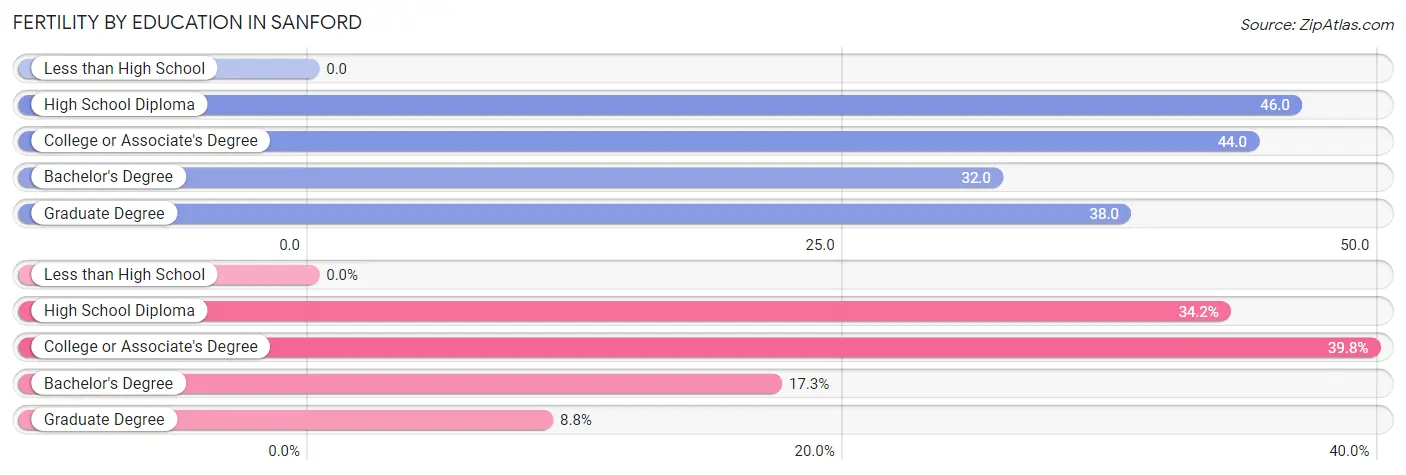
| Educational Attainment | Women with Births | Births / 1,000 Women |
| Less than High School | 0 (0.0%) | 0.0 |
| High School Diploma | 195 (34.2%) | 46.0 |
| College or Associate's Degree | 227 (39.8%) | 44.0 |
| Bachelor's Degree | 99 (17.3%) | 32.0 |
| Graduate Degree | 50 (8.8%) | 38.0 |
| Total | 571 (100.0%) | 37.0 |
Fertility by Education by Marriage Status in Sanford
47.5% of women with births in Sanford are unmarried. Women with the educational attainment of graduate degree are most likely to be married with 100.0% of them married at childbirth, while women with the educational attainment of college or associate's degree are least likely to be married with 72.7% of them unmarried at childbirth.
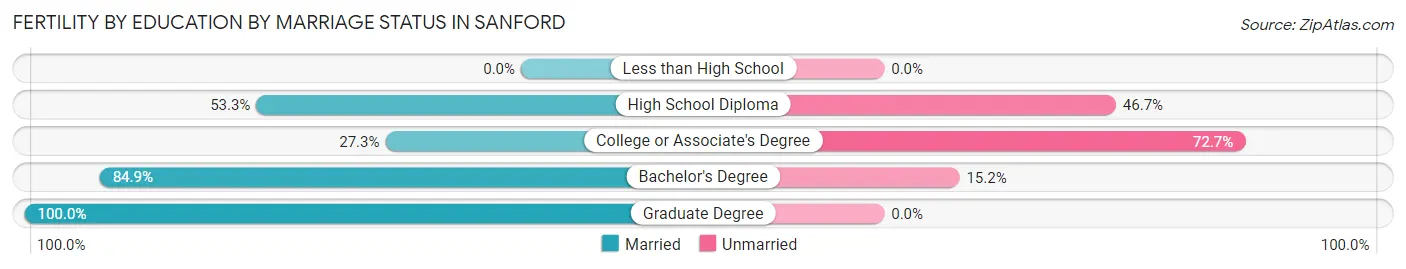
| Educational Attainment | Married | Unmarried |
| Less than High School | 0 (0.0%) | 0 (0.0%) |
| High School Diploma | 104 (53.3%) | 91 (46.7%) |
| College or Associate's Degree | 62 (27.3%) | 165 (72.7%) |
| Bachelor's Degree | 84 (84.9%) | 15 (15.1%) |
| Graduate Degree | 50 (100.0%) | 0 (0.0%) |
| Total | 300 (52.5%) | 271 (47.5%) |
Employment Characteristics in Sanford
Employment by Class of Employer in Sanford
Among the 30,596 employed individuals in Sanford, private company employees (22,630 | 74.0%), local government employees (2,485 | 8.1%), and not-for-profit organizations (2,195 | 7.2%) make up the most common classes of employment.
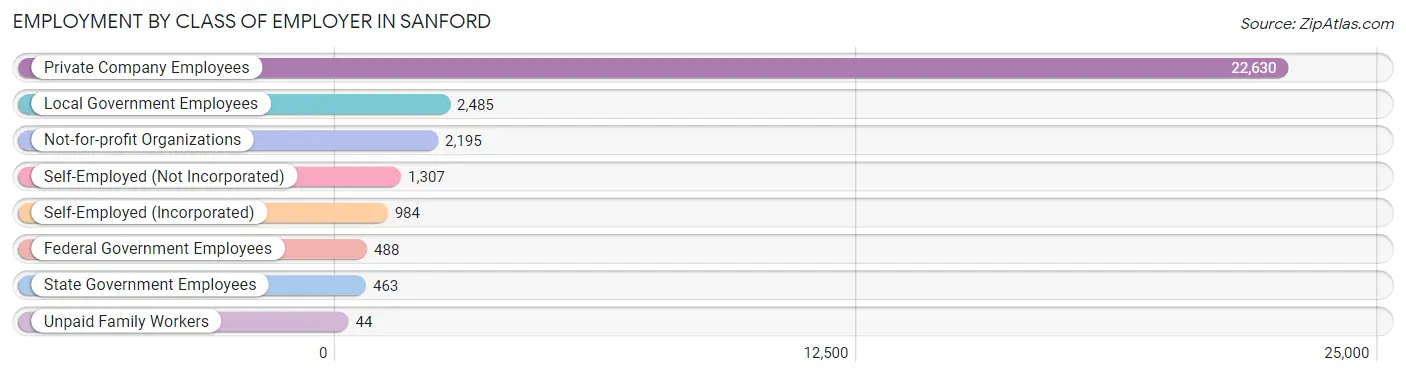
| Employer Class | # Employees | % Employees |
| Private Company Employees | 22,630 | 74.0% |
| Self-Employed (Incorporated) | 984 | 3.2% |
| Self-Employed (Not Incorporated) | 1,307 | 4.3% |
| Not-for-profit Organizations | 2,195 | 7.2% |
| Local Government Employees | 2,485 | 8.1% |
| State Government Employees | 463 | 1.5% |
| Federal Government Employees | 488 | 1.6% |
| Unpaid Family Workers | 44 | 0.1% |
| Total | 30,596 | 100.0% |
Employment Status by Age in Sanford
According to the labor force statistics for Sanford, out of the total population over 16 years of age (49,166), 67.2% or 33,040 individuals are in the labor force, with 5.2% or 1,718 of them unemployed. The age group with the highest labor force participation rate is 30 to 34 years, with 88.0% or 5,316 individuals in the labor force. Within the labor force, the 16 to 19 years age range has the highest percentage of unemployed individuals, with 17.9% or 166 of them being unemployed.
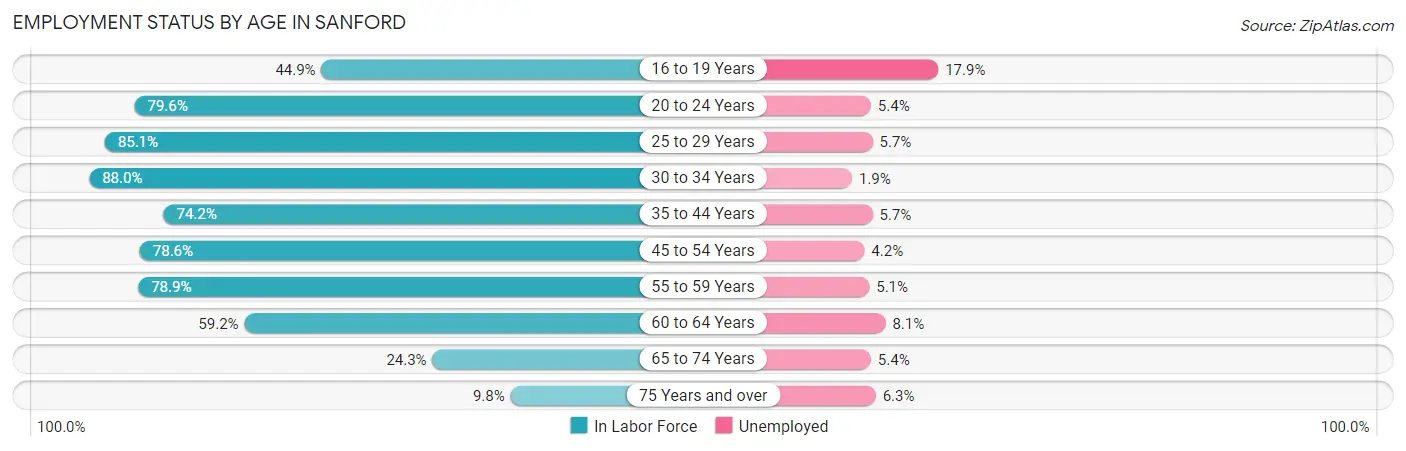
| Age Bracket | In Labor Force | Unemployed |
| 16 to 19 Years | 928 (44.9%) | 166 (17.9%) |
| 20 to 24 Years | 3,999 (79.6%) | 216 (5.4%) |
| 25 to 29 Years | 4,066 (85.1%) | 232 (5.7%) |
| 30 to 34 Years | 5,316 (88.0%) | 101 (1.9%) |
| 35 to 44 Years | 6,907 (74.2%) | 394 (5.7%) |
| 45 to 54 Years | 5,590 (78.6%) | 235 (4.2%) |
| 55 to 59 Years | 2,617 (78.9%) | 133 (5.1%) |
| 60 to 64 Years | 2,154 (59.2%) | 174 (8.1%) |
| 65 to 74 Years | 1,166 (24.3%) | 63 (5.4%) |
| 75 Years and over | 302 (9.8%) | 19 (6.3%) |
| Total | 33,040 (67.2%) | 1,718 (5.2%) |
Employment Status by Educational Attainment in Sanford
According to labor force statistics for Sanford, 77.9% of individuals (26,638) out of the total population between 25 and 64 years of age (34,195) are in the labor force, with 4.8% or 1,279 of them being unemployed. The group with the highest labor force participation rate are those with the educational attainment of bachelor's degree or higher, with 89.0% or 8,323 individuals in the labor force. Within the labor force, individuals with less than high school education have the highest percentage of unemployment, with 10.1% or 182 of them being unemployed.
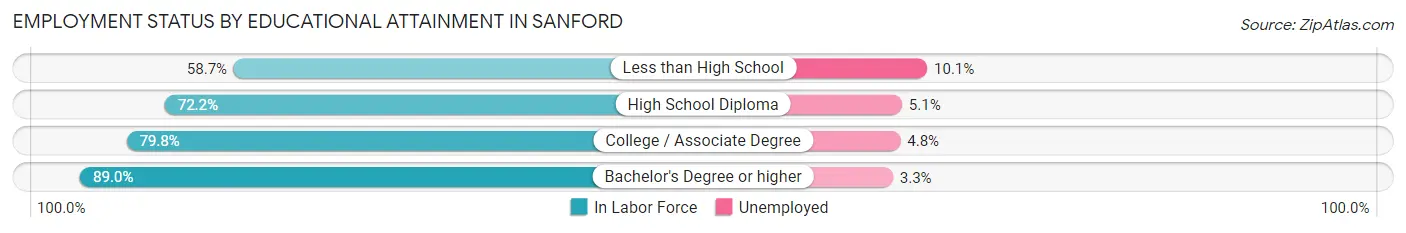
| Educational Attainment | In Labor Force | Unemployed |
| Less than High School | 1,803 (58.7%) | 310 (10.1%) |
| High School Diploma | 7,993 (72.2%) | 565 (5.1%) |
| College / Associate Degree | 8,540 (79.8%) | 514 (4.8%) |
| Bachelor's Degree or higher | 8,323 (89.0%) | 309 (3.3%) |
| Total | 26,638 (77.9%) | 1,641 (4.8%) |
Employment Occupations by Sex in Sanford
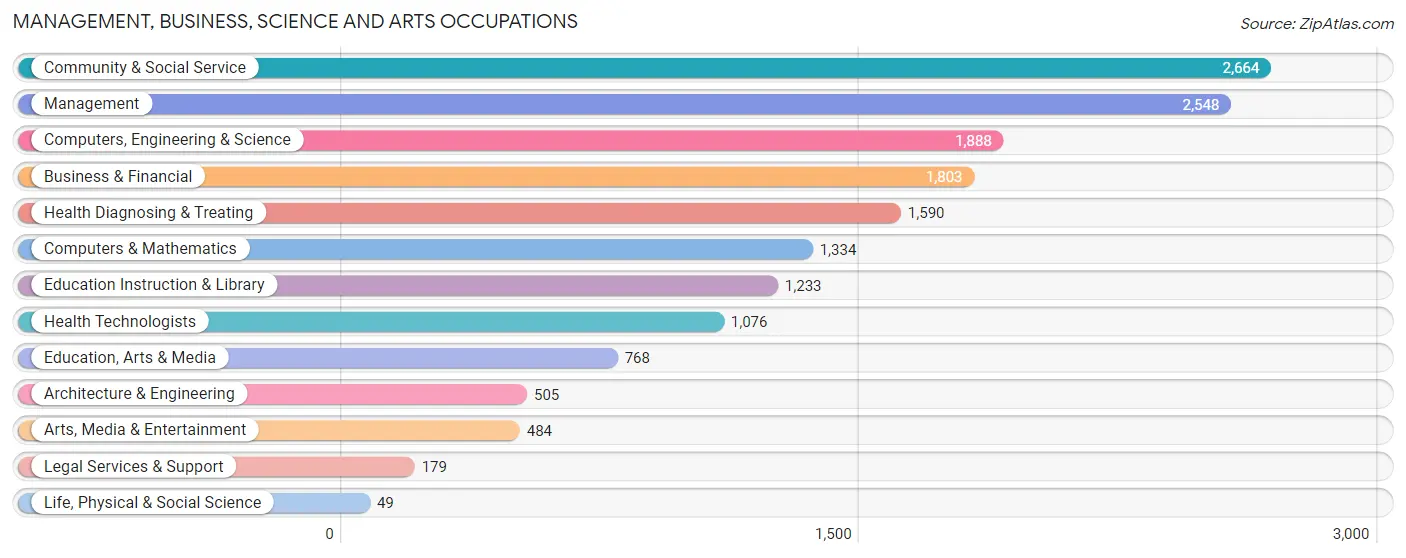
Management, Business, Science and Arts Occupations
The most common Management, Business, Science and Arts occupations in Sanford are Community & Social Service (2,664 | 8.5%), Management (2,548 | 8.2%), Computers, Engineering & Science (1,888 | 6.0%), Business & Financial (1,803 | 5.8%), and Health Diagnosing & Treating (1,590 | 5.1%).
Management, Business, Science and Arts Occupations by Sex
Within the Management, Business, Science and Arts occupations in Sanford, the most male-oriented occupations are Arts, Media & Entertainment (63.0%), Computers & Mathematics (58.8%), and Computers, Engineering & Science (56.4%), while the most female-oriented occupations are Legal Services & Support (98.9%), Life, Physical & Social Science (83.7%), and Health Diagnosing & Treating (81.3%).
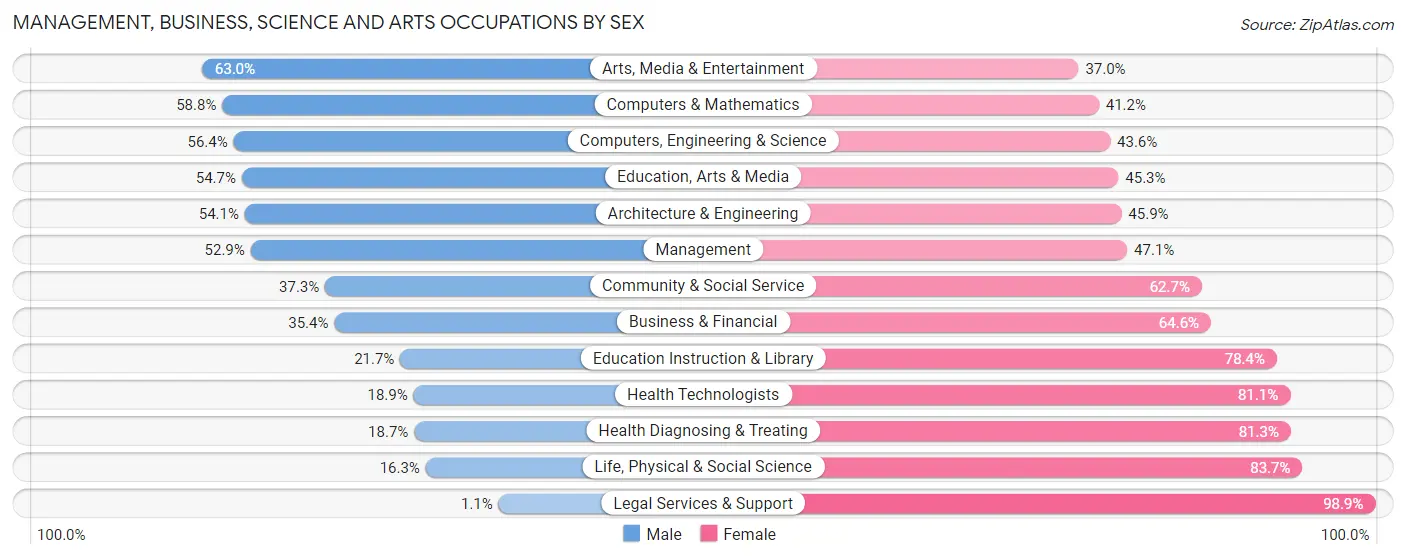
| Occupation | Male | Female |
| Management | 1,347 (52.9%) | 1,201 (47.1%) |
| Business & Financial | 638 (35.4%) | 1,165 (64.6%) |
| Computers, Engineering & Science | 1,065 (56.4%) | 823 (43.6%) |
| Computers & Mathematics | 784 (58.8%) | 550 (41.2%) |
| Architecture & Engineering | 273 (54.1%) | 232 (45.9%) |
| Life, Physical & Social Science | 8 (16.3%) | 41 (83.7%) |
| Community & Social Service | 994 (37.3%) | 1,670 (62.7%) |
| Education, Arts & Media | 420 (54.7%) | 348 (45.3%) |
| Legal Services & Support | 2 (1.1%) | 177 (98.9%) |
| Education Instruction & Library | 267 (21.6%) | 966 (78.3%) |
| Arts, Media & Entertainment | 305 (63.0%) | 179 (37.0%) |
| Health Diagnosing & Treating | 298 (18.7%) | 1,292 (81.3%) |
| Health Technologists | 203 (18.9%) | 873 (81.1%) |
| Total (Category) | 4,342 (41.4%) | 6,151 (58.6%) |
| Total (Overall) | 17,327 (55.4%) | 13,933 (44.6%) |
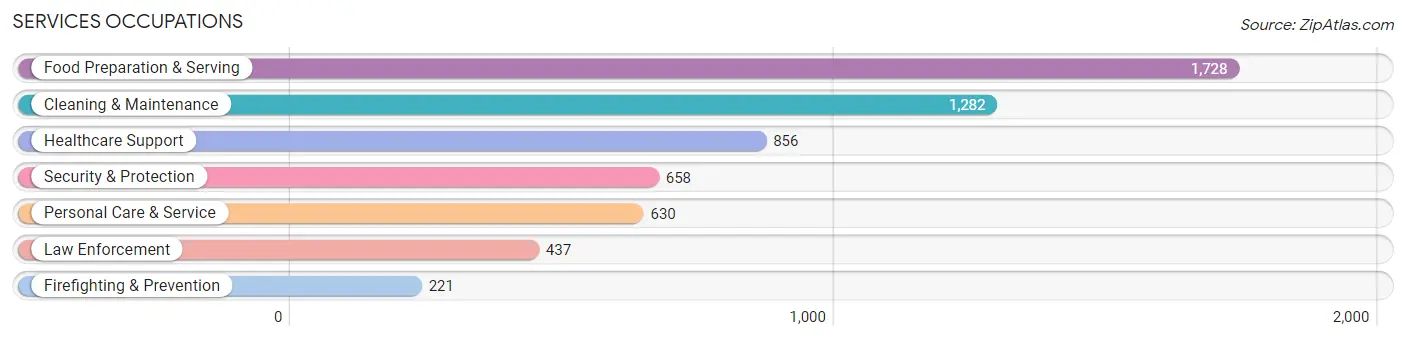
Services Occupations
The most common Services occupations in Sanford are Food Preparation & Serving (1,728 | 5.5%), Cleaning & Maintenance (1,282 | 4.1%), Healthcare Support (856 | 2.7%), Security & Protection (658 | 2.1%), and Personal Care & Service (630 | 2.0%).
Services Occupations by Sex
Within the Services occupations in Sanford, the most male-oriented occupations are Cleaning & Maintenance (76.4%), Firefighting & Prevention (57.9%), and Food Preparation & Serving (55.1%), while the most female-oriented occupations are Healthcare Support (87.0%), Personal Care & Service (64.4%), and Law Enforcement (51.0%).
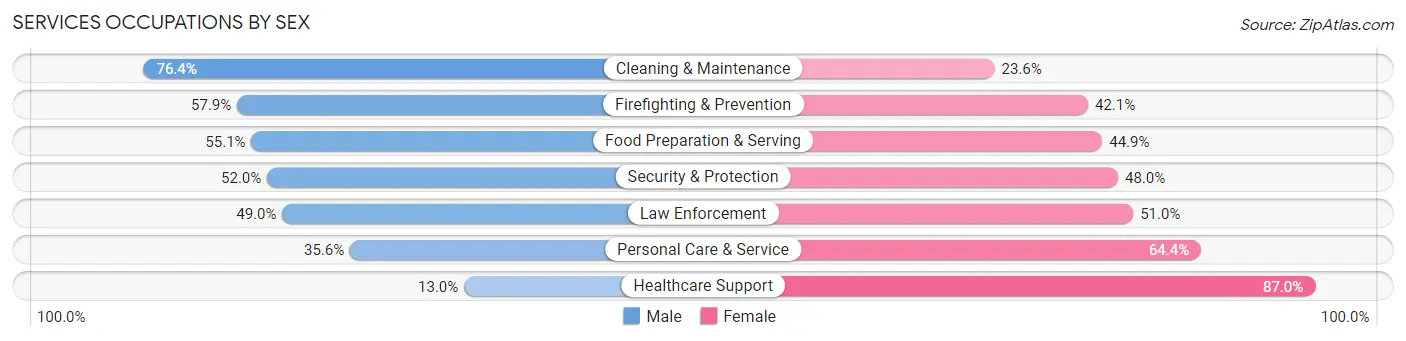
| Occupation | Male | Female |
| Healthcare Support | 111 (13.0%) | 745 (87.0%) |
| Security & Protection | 342 (52.0%) | 316 (48.0%) |
| Firefighting & Prevention | 128 (57.9%) | 93 (42.1%) |
| Law Enforcement | 214 (49.0%) | 223 (51.0%) |
| Food Preparation & Serving | 952 (55.1%) | 776 (44.9%) |
| Cleaning & Maintenance | 980 (76.4%) | 302 (23.6%) |
| Personal Care & Service | 224 (35.6%) | 406 (64.4%) |
| Total (Category) | 2,609 (50.6%) | 2,545 (49.4%) |
| Total (Overall) | 17,327 (55.4%) | 13,933 (44.6%) |
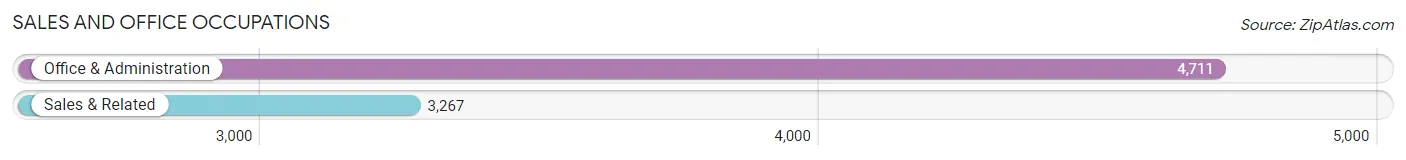
Sales and Office Occupations
The most common Sales and Office occupations in Sanford are Office & Administration (4,711 | 15.1%), and Sales & Related (3,267 | 10.4%).
Sales and Office Occupations by Sex
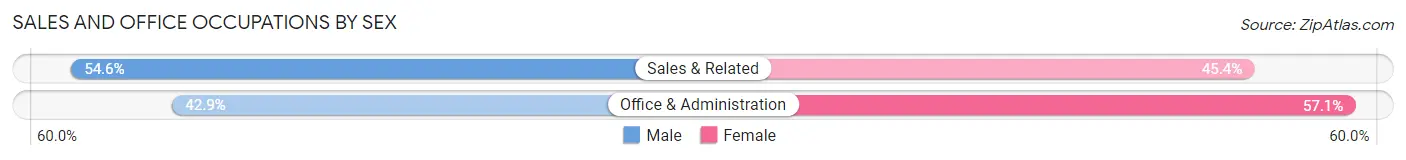
| Occupation | Male | Female |
| Sales & Related | 1,784 (54.6%) | 1,483 (45.4%) |
| Office & Administration | 2,023 (42.9%) | 2,688 (57.1%) |
| Total (Category) | 3,807 (47.7%) | 4,171 (52.3%) |
| Total (Overall) | 17,327 (55.4%) | 13,933 (44.6%) |
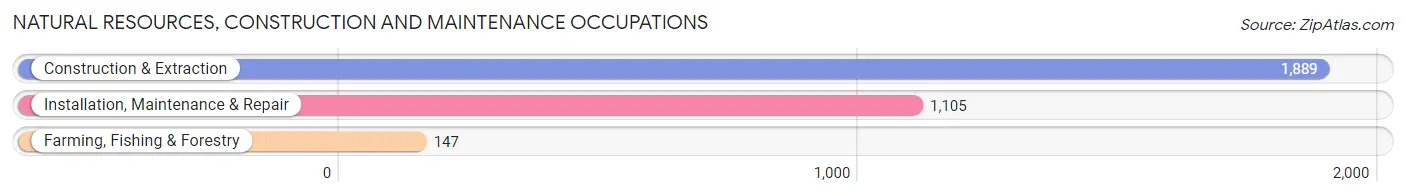
Natural Resources, Construction and Maintenance Occupations
The most common Natural Resources, Construction and Maintenance occupations in Sanford are Construction & Extraction (1,889 | 6.0%), Installation, Maintenance & Repair (1,105 | 3.5%), and Farming, Fishing & Forestry (147 | 0.5%).
Natural Resources, Construction and Maintenance Occupations by Sex
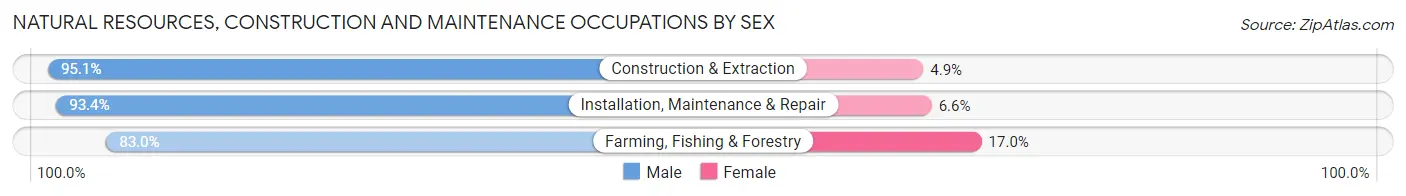
| Occupation | Male | Female |
| Farming, Fishing & Forestry | 122 (83.0%) | 25 (17.0%) |
| Construction & Extraction | 1,797 (95.1%) | 92 (4.9%) |
| Installation, Maintenance & Repair | 1,032 (93.4%) | 73 (6.6%) |
| Total (Category) | 2,951 (94.0%) | 190 (6.0%) |
| Total (Overall) | 17,327 (55.4%) | 13,933 (44.6%) |
Production, Transportation and Moving Occupations
The most common Production, Transportation and Moving occupations in Sanford are Transportation (1,881 | 6.0%), Production (1,416 | 4.5%), and Material Moving (1,197 | 3.8%).
Production, Transportation and Moving Occupations by Sex
| Occupation | Male | Female |
| Production | 870 (61.4%) | 546 (38.6%) |
| Transportation | 1,674 (89.0%) | 207 (11.0%) |
| Material Moving | 1,074 (89.7%) | 123 (10.3%) |
| Total (Category) | 3,618 (80.5%) | 876 (19.5%) |
| Total (Overall) | 17,327 (55.4%) | 13,933 (44.6%) |
Employment Industries by Sex in Sanford
Employment Industries in Sanford
The major employment industries in Sanford include Retail Trade (3,510 | 11.2%), Health Care & Social Assistance (3,374 | 10.8%), Professional & Scientific (2,943 | 9.4%), Construction (2,626 | 8.4%), and Administrative & Support (2,335 | 7.5%).
Employment Industries by Sex in Sanford
The Sanford industries that see more men than women are Mining, Quarrying, & Extraction (100.0%), Wholesale Trade (92.8%), and Construction (92.3%), whereas the industries that tend to have a higher number of women are Enterprise Management (100.0%), Health Care & Social Assistance (81.9%), and Finance & Insurance (68.3%).
| Industry | Male | Female |
| Agriculture, Fishing & Hunting | 128 (88.3%) | 17 (11.7%) |
| Mining, Quarrying, & Extraction | 7 (100.0%) | 0 (0.0%) |
| Construction | 2,423 (92.3%) | 203 (7.7%) |
| Manufacturing | 1,120 (68.8%) | 508 (31.2%) |
| Wholesale Trade | 1,032 (92.8%) | 80 (7.2%) |
| Retail Trade | 1,822 (51.9%) | 1,688 (48.1%) |
| Transportation & Warehousing | 1,721 (74.3%) | 597 (25.8%) |
| Utilities | 170 (41.8%) | 237 (58.2%) |
| Information | 375 (54.7%) | 311 (45.3%) |
| Finance & Insurance | 582 (31.7%) | 1,253 (68.3%) |
| Real Estate, Rental & Leasing | 181 (38.7%) | 287 (61.3%) |
| Professional & Scientific | 1,278 (43.4%) | 1,665 (56.6%) |
| Enterprise Management | 0 (0.0%) | 16 (100.0%) |
| Administrative & Support | 1,455 (62.3%) | 880 (37.7%) |
| Educational Services | 1,068 (49.7%) | 1,081 (50.3%) |
| Health Care & Social Assistance | 612 (18.1%) | 2,762 (81.9%) |
| Arts, Entertainment & Recreation | 419 (67.7%) | 200 (32.3%) |
| Accommodation & Food Services | 1,120 (54.3%) | 944 (45.7%) |
| Public Administration | 453 (41.1%) | 649 (58.9%) |
| Total | 17,327 (55.4%) | 13,933 (44.6%) |
Education in Sanford
School Enrollment in Sanford
The most common levels of schooling among the 13,887 students in Sanford are college / undergraduate (2,858 | 20.6%), high school (2,857 | 20.6%), and elementary school (2,847 | 20.5%).
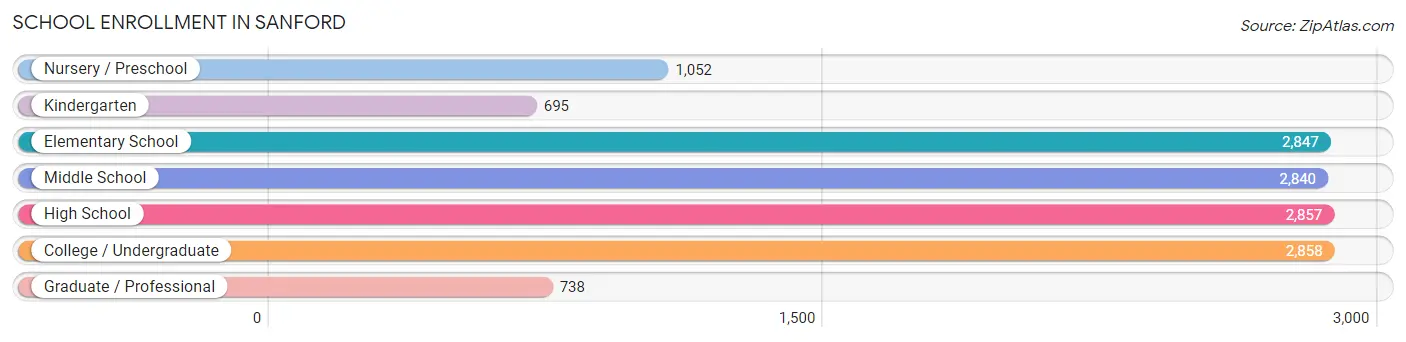
| School Level | # Students | % Students |
| Nursery / Preschool | 1,052 | 7.6% |
| Kindergarten | 695 | 5.0% |
| Elementary School | 2,847 | 20.5% |
| Middle School | 2,840 | 20.4% |
| High School | 2,857 | 20.6% |
| College / Undergraduate | 2,858 | 20.6% |
| Graduate / Professional | 738 | 5.3% |
| Total | 13,887 | 100.0% |
School Enrollment by Age by Funding Source in Sanford
Out of a total of 13,887 students who are enrolled in schools in Sanford, 2,028 (14.6%) attend a private institution, while the remaining 11,859 (85.4%) are enrolled in public schools. The age group of 35 years and over has the highest likelihood of being enrolled in private schools, with 518 (64.9% in the age bracket) enrolled. Conversely, the age group of 10 to 14 year olds has the lowest likelihood of being enrolled in a private school, with 3,687 (96.4% in the age bracket) attending a public institution.
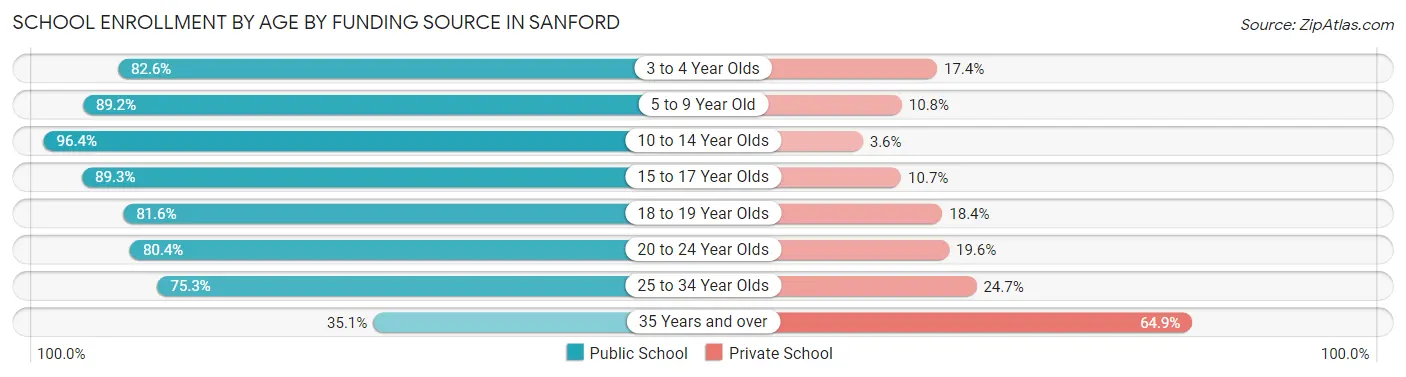
| Age Bracket | Public School | Private School |
| 3 to 4 Year Olds | 684 (82.6%) | 144 (17.4%) |
| 5 to 9 Year Old | 3,110 (89.2%) | 378 (10.8%) |
| 10 to 14 Year Olds | 3,687 (96.4%) | 136 (3.6%) |
| 15 to 17 Year Olds | 1,634 (89.3%) | 196 (10.7%) |
| 18 to 19 Year Olds | 493 (81.6%) | 111 (18.4%) |
| 20 to 24 Year Olds | 1,187 (80.4%) | 290 (19.6%) |
| 25 to 34 Year Olds | 782 (75.3%) | 257 (24.7%) |
| 35 Years and over | 280 (35.1%) | 518 (64.9%) |
| Total | 11,859 (85.4%) | 2,028 (14.6%) |
Educational Attainment by Field of Study in Sanford
Business (2,739 | 23.9%), education (1,042 | 9.1%), liberal arts & history (1,001 | 8.7%), science & technology (959 | 8.4%), and arts & humanities (850 | 7.4%) are the most common fields of study among 11,475 individuals in Sanford who have obtained a bachelor's degree or higher.
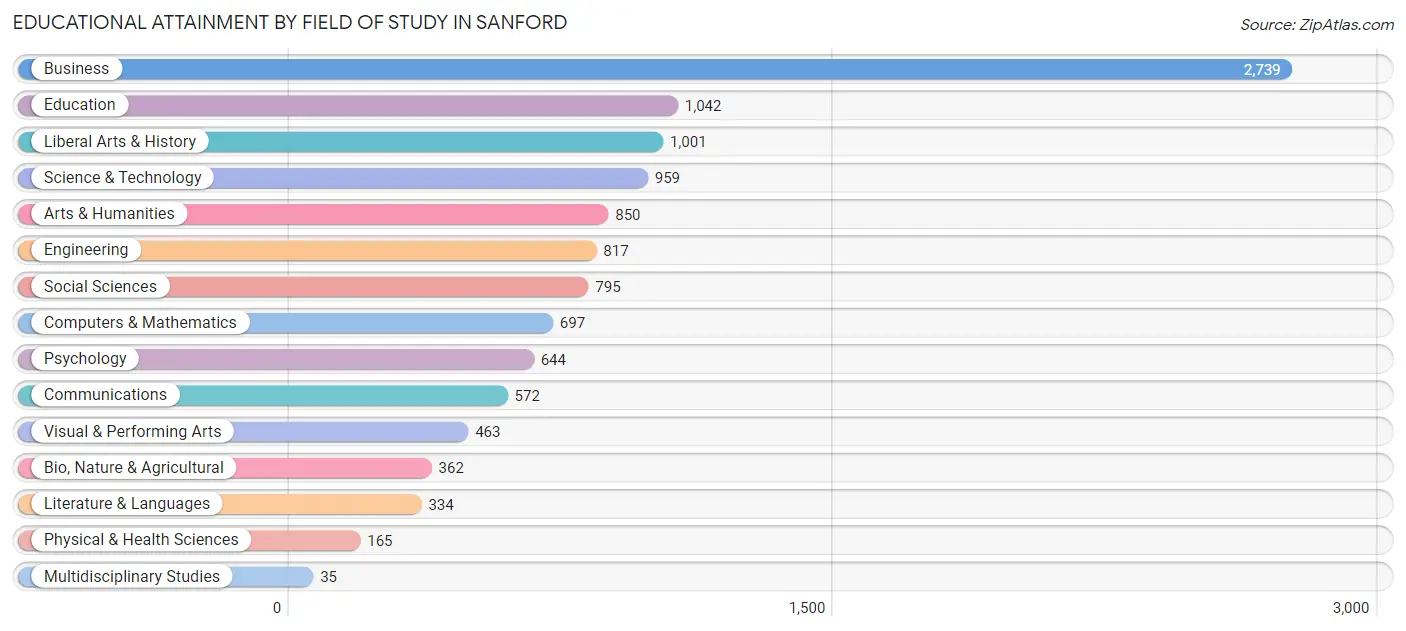
| Field of Study | # Graduates | % Graduates |
| Computers & Mathematics | 697 | 6.1% |
| Bio, Nature & Agricultural | 362 | 3.2% |
| Physical & Health Sciences | 165 | 1.4% |
| Psychology | 644 | 5.6% |
| Social Sciences | 795 | 6.9% |
| Engineering | 817 | 7.1% |
| Multidisciplinary Studies | 35 | 0.3% |
| Science & Technology | 959 | 8.4% |
| Business | 2,739 | 23.9% |
| Education | 1,042 | 9.1% |
| Literature & Languages | 334 | 2.9% |
| Liberal Arts & History | 1,001 | 8.7% |
| Visual & Performing Arts | 463 | 4.0% |
| Communications | 572 | 5.0% |
| Arts & Humanities | 850 | 7.4% |
| Total | 11,475 | 100.0% |
Transportation & Commute in Sanford
Vehicle Availability by Sex in Sanford
The most prevalent vehicle ownership categories in Sanford are males with 2 vehicles (6,521, accounting for 38.2%) and females with 2 vehicles (5,895, making up 48.4%).
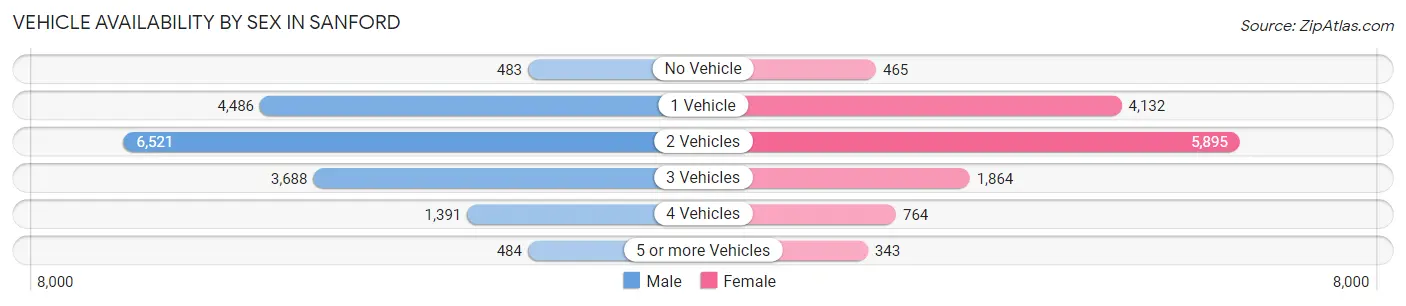
| Vehicles Available | Male | Female |
| No Vehicle | 483 (2.8%) | 465 (3.5%) |
| 1 Vehicle | 4,486 (26.3%) | 4,132 (30.7%) |
| 2 Vehicles | 6,521 (38.2%) | 5,895 (43.8%) |
| 3 Vehicles | 3,688 (21.6%) | 1,864 (13.9%) |
| 4 Vehicles | 1,391 (8.2%) | 764 (5.7%) |
| 5 or more Vehicles | 484 (2.8%) | 343 (2.5%) |
| Total | 17,053 (100.0%) | 13,463 (100.0%) |
Commute Time in Sanford
The most frequently occuring commute durations in Sanford are 10 to 14 minutes (5,164 commuters, 19.5%), 15 to 19 minutes (4,126 commuters, 15.6%), and 20 to 24 minutes (3,310 commuters, 12.5%).
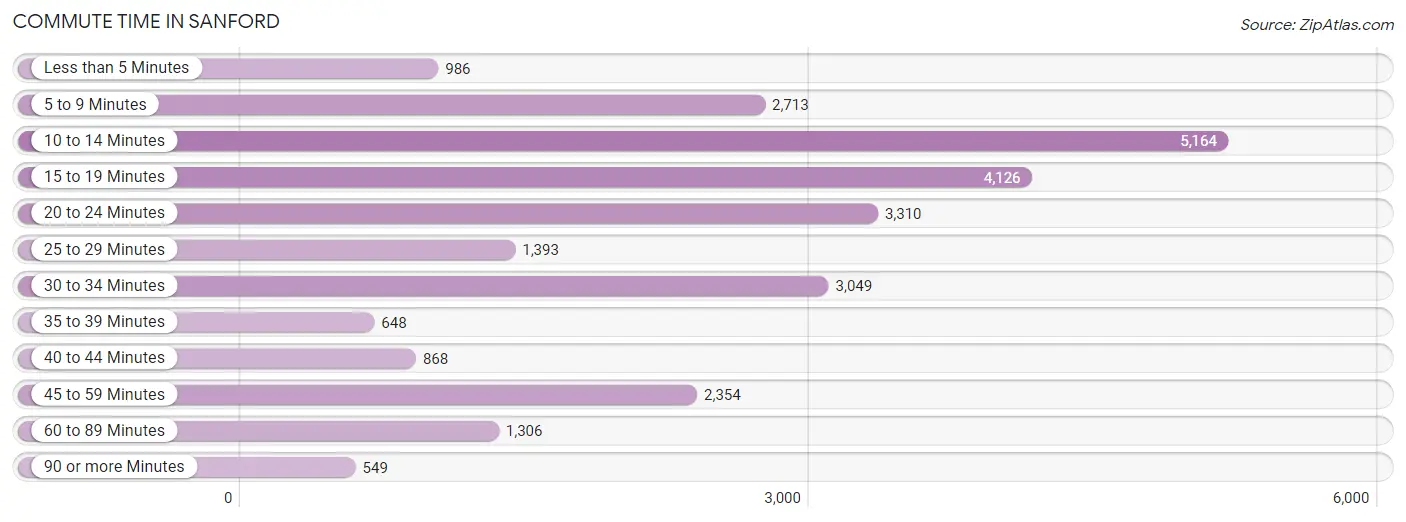
| Commute Time | # Commuters | % Commuters |
| Less than 5 Minutes | 986 | 3.7% |
| 5 to 9 Minutes | 2,713 | 10.2% |
| 10 to 14 Minutes | 5,164 | 19.5% |
| 15 to 19 Minutes | 4,126 | 15.6% |
| 20 to 24 Minutes | 3,310 | 12.5% |
| 25 to 29 Minutes | 1,393 | 5.3% |
| 30 to 34 Minutes | 3,049 | 11.5% |
| 35 to 39 Minutes | 648 | 2.5% |
| 40 to 44 Minutes | 868 | 3.3% |
| 45 to 59 Minutes | 2,354 | 8.9% |
| 60 to 89 Minutes | 1,306 | 4.9% |
| 90 or more Minutes | 549 | 2.1% |
Commute Time by Sex in Sanford
The most common commute times in Sanford are 10 to 14 minutes (3,119 commuters, 20.3%) for males and 10 to 14 minutes (2,045 commuters, 18.5%) for females.
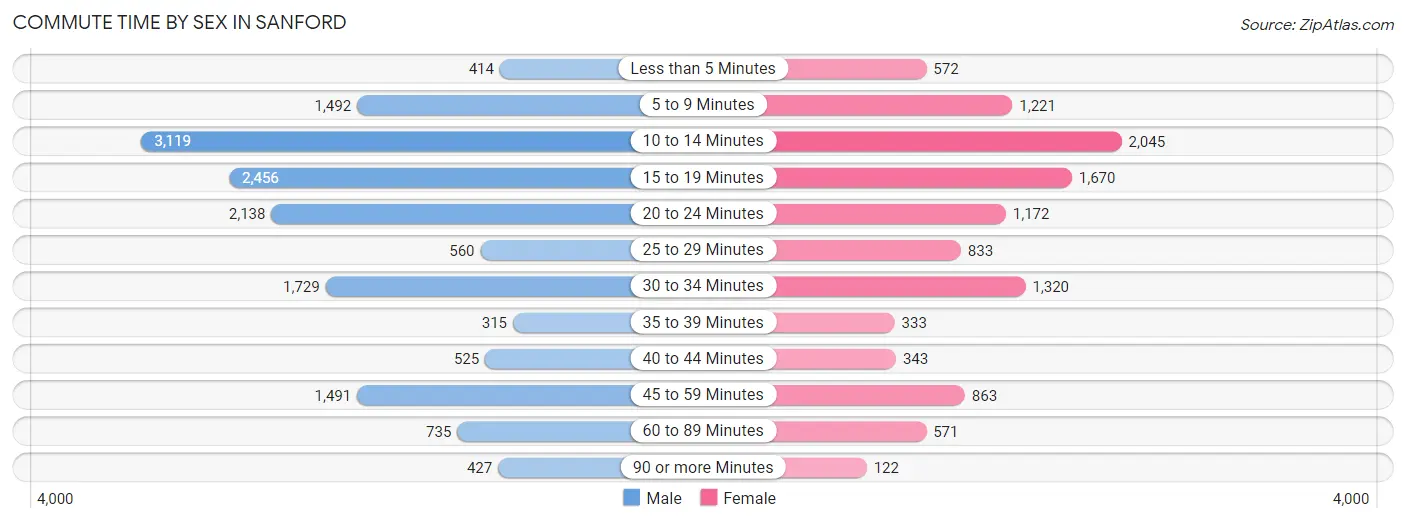
| Commute Time | Male | Female |
| Less than 5 Minutes | 414 (2.7%) | 572 (5.2%) |
| 5 to 9 Minutes | 1,492 (9.7%) | 1,221 (11.0%) |
| 10 to 14 Minutes | 3,119 (20.3%) | 2,045 (18.5%) |
| 15 to 19 Minutes | 2,456 (16.0%) | 1,670 (15.1%) |
| 20 to 24 Minutes | 2,138 (13.9%) | 1,172 (10.6%) |
| 25 to 29 Minutes | 560 (3.6%) | 833 (7.5%) |
| 30 to 34 Minutes | 1,729 (11.2%) | 1,320 (11.9%) |
| 35 to 39 Minutes | 315 (2.1%) | 333 (3.0%) |
| 40 to 44 Minutes | 525 (3.4%) | 343 (3.1%) |
| 45 to 59 Minutes | 1,491 (9.7%) | 863 (7.8%) |
| 60 to 89 Minutes | 735 (4.8%) | 571 (5.2%) |
| 90 or more Minutes | 427 (2.8%) | 122 (1.1%) |
Time of Departure to Work by Sex in Sanford
The most frequent times of departure to work in Sanford are 7:00 AM to 7:29 AM (2,170, 14.1%) for males and 8:00 AM to 8:29 AM (1,429, 12.9%) for females.
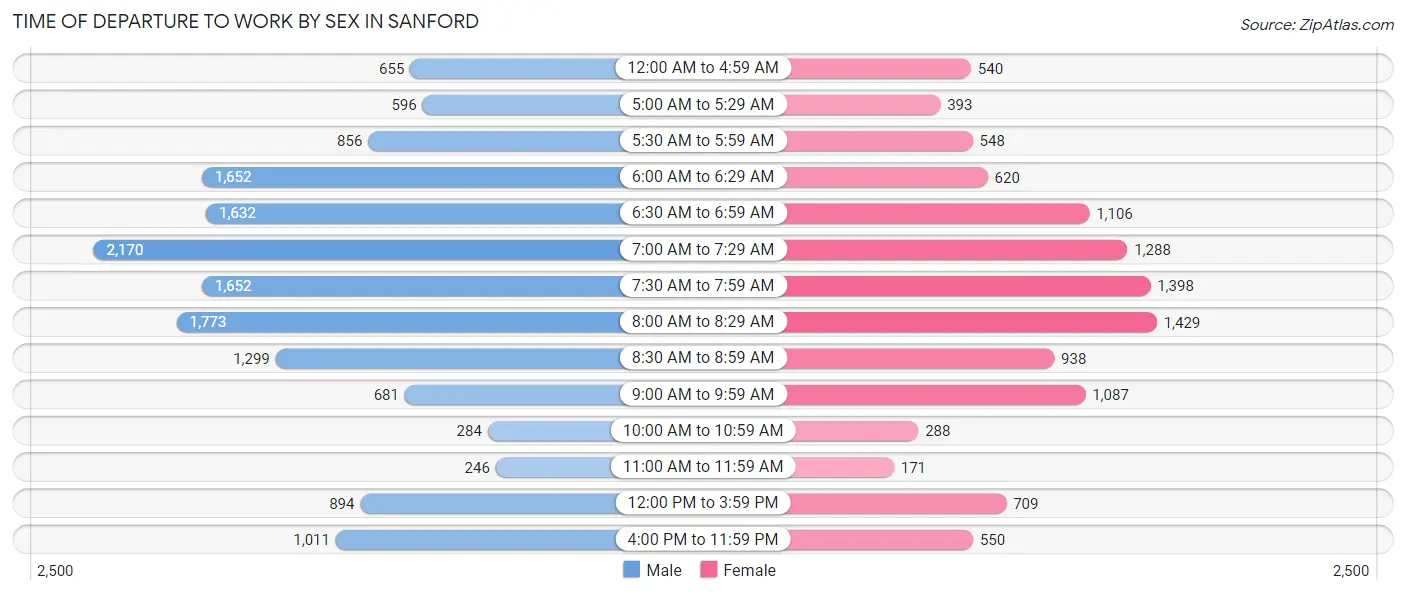
| Time of Departure | Male | Female |
| 12:00 AM to 4:59 AM | 655 (4.3%) | 540 (4.9%) |
| 5:00 AM to 5:29 AM | 596 (3.9%) | 393 (3.5%) |
| 5:30 AM to 5:59 AM | 856 (5.6%) | 548 (5.0%) |
| 6:00 AM to 6:29 AM | 1,652 (10.7%) | 620 (5.6%) |
| 6:30 AM to 6:59 AM | 1,632 (10.6%) | 1,106 (10.0%) |
| 7:00 AM to 7:29 AM | 2,170 (14.1%) | 1,288 (11.6%) |
| 7:30 AM to 7:59 AM | 1,652 (10.7%) | 1,398 (12.6%) |
| 8:00 AM to 8:29 AM | 1,773 (11.5%) | 1,429 (12.9%) |
| 8:30 AM to 8:59 AM | 1,299 (8.4%) | 938 (8.5%) |
| 9:00 AM to 9:59 AM | 681 (4.4%) | 1,087 (9.8%) |
| 10:00 AM to 10:59 AM | 284 (1.8%) | 288 (2.6%) |
| 11:00 AM to 11:59 AM | 246 (1.6%) | 171 (1.5%) |
| 12:00 PM to 3:59 PM | 894 (5.8%) | 709 (6.4%) |
| 4:00 PM to 11:59 PM | 1,011 (6.6%) | 550 (5.0%) |
| Total | 15,401 (100.0%) | 11,065 (100.0%) |
Housing Occupancy in Sanford
Occupancy by Ownership in Sanford
Of the total 23,683 dwellings in Sanford, owner-occupied units account for 12,226 (51.6%), while renter-occupied units make up 11,457 (48.4%).
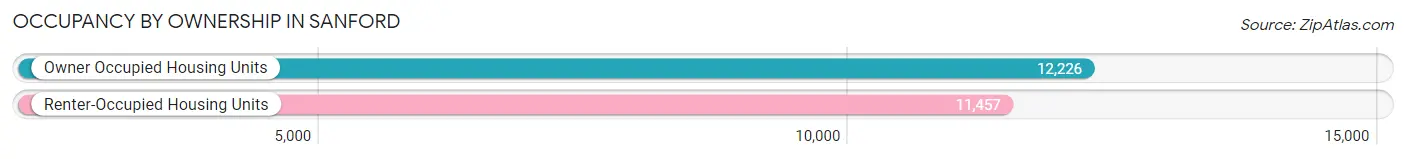
| Occupancy | # Housing Units | % Housing Units |
| Owner Occupied Housing Units | 12,226 | 51.6% |
| Renter-Occupied Housing Units | 11,457 | 48.4% |
| Total Occupied Housing Units | 23,683 | 100.0% |
Occupancy by Household Size in Sanford
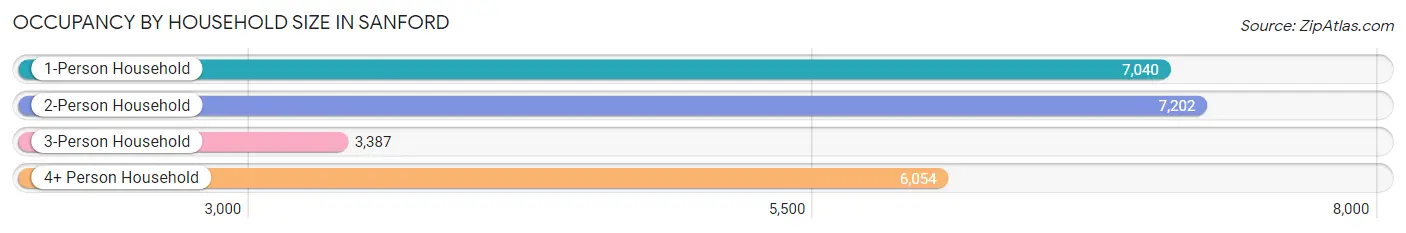
| Household Size | # Housing Units | % Housing Units |
| 1-Person Household | 7,040 | 29.7% |
| 2-Person Household | 7,202 | 30.4% |
| 3-Person Household | 3,387 | 14.3% |
| 4+ Person Household | 6,054 | 25.6% |
| Total Housing Units | 23,683 | 100.0% |
Occupancy by Ownership by Household Size in Sanford
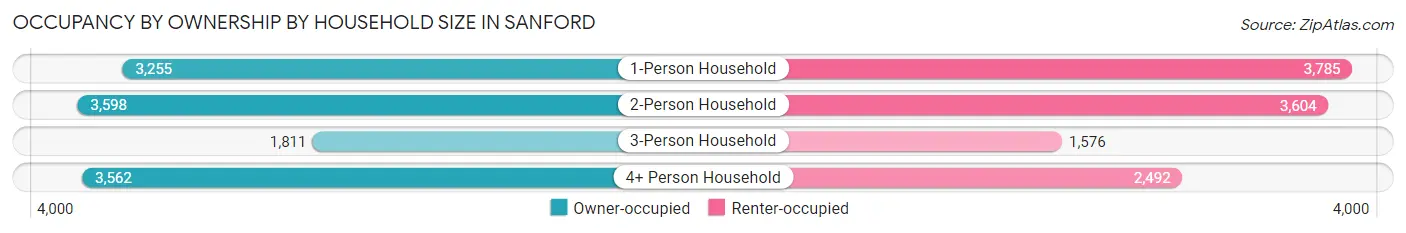
| Household Size | Owner-occupied | Renter-occupied |
| 1-Person Household | 3,255 (46.2%) | 3,785 (53.8%) |
| 2-Person Household | 3,598 (50.0%) | 3,604 (50.0%) |
| 3-Person Household | 1,811 (53.5%) | 1,576 (46.5%) |
| 4+ Person Household | 3,562 (58.8%) | 2,492 (41.2%) |
| Total Housing Units | 12,226 (51.6%) | 11,457 (48.4%) |
Occupancy by Educational Attainment in Sanford
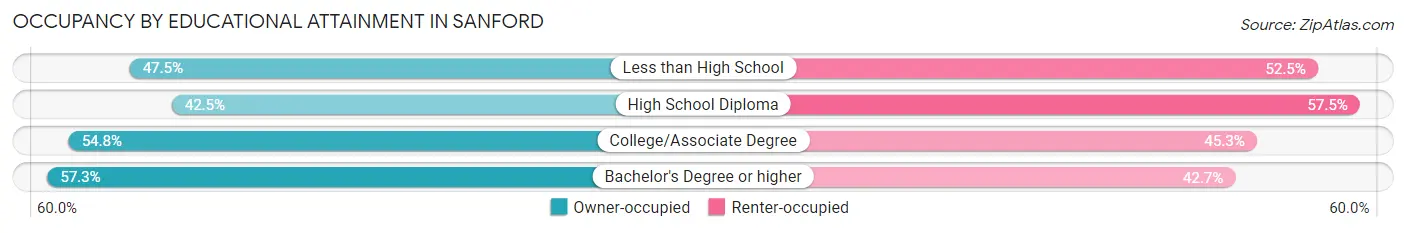
| Household Size | Owner-occupied | Renter-occupied |
| Less than High School | 935 (47.5%) | 1,034 (52.5%) |
| High School Diploma | 2,685 (42.5%) | 3,634 (57.5%) |
| College/Associate Degree | 4,625 (54.7%) | 3,822 (45.3%) |
| Bachelor's Degree or higher | 3,981 (57.3%) | 2,967 (42.7%) |
Occupancy by Age of Householder in Sanford
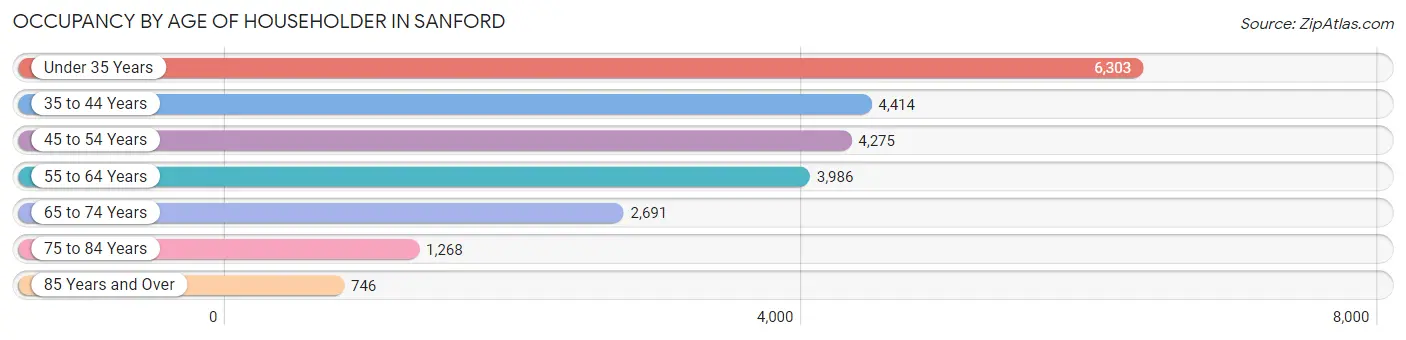
| Age Bracket | # Households | % Households |
| Under 35 Years | 6,303 | 26.6% |
| 35 to 44 Years | 4,414 | 18.6% |
| 45 to 54 Years | 4,275 | 18.0% |
| 55 to 64 Years | 3,986 | 16.8% |
| 65 to 74 Years | 2,691 | 11.4% |
| 75 to 84 Years | 1,268 | 5.3% |
| 85 Years and Over | 746 | 3.2% |
| Total | 23,683 | 100.0% |
Housing Finances in Sanford
Median Income by Occupancy in Sanford
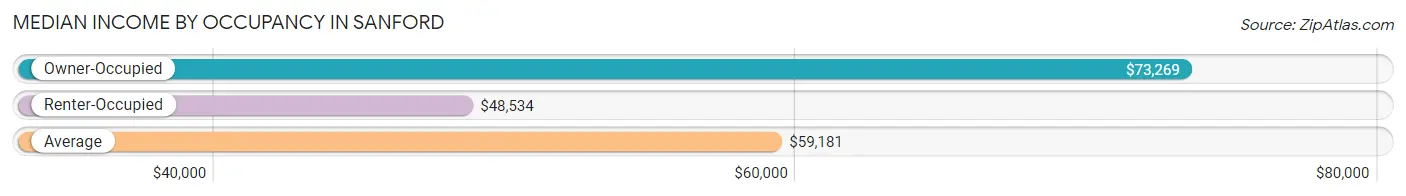
| Occupancy Type | # Households | Median Income |
| Owner-Occupied | 12,226 (51.6%) | $73,269 |
| Renter-Occupied | 11,457 (48.4%) | $48,534 |
| Average | 23,683 (100.0%) | $59,181 |
Occupancy by Householder Income Bracket in Sanford
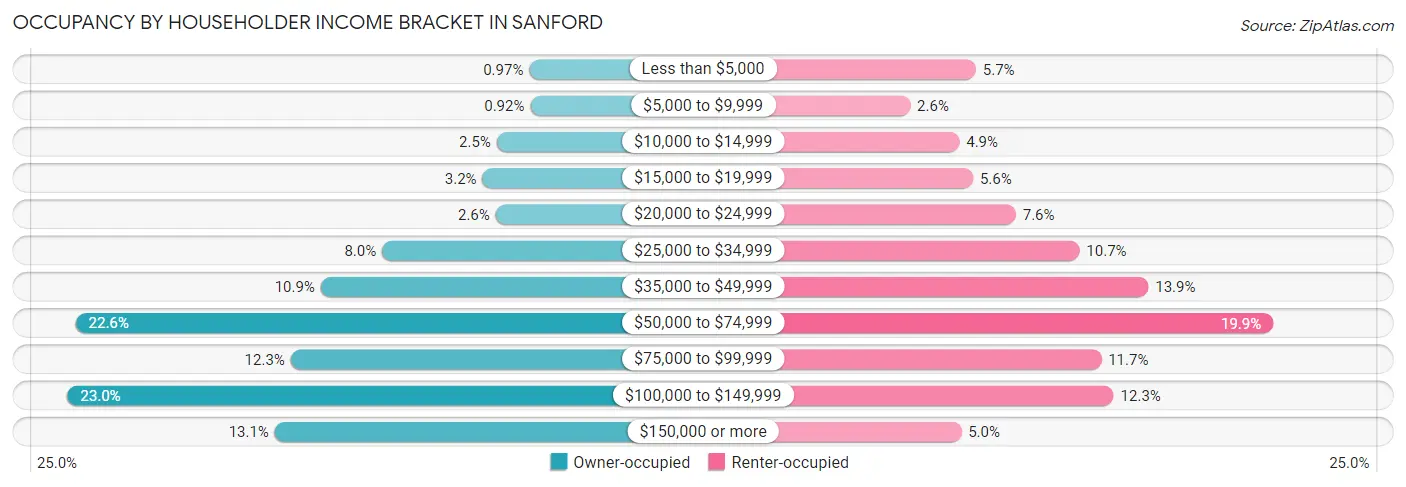
| Income Bracket | Owner-occupied | Renter-occupied |
| Less than $5,000 | 118 (1.0%) | 657 (5.7%) |
| $5,000 to $9,999 | 112 (0.9%) | 298 (2.6%) |
| $10,000 to $14,999 | 308 (2.5%) | 566 (4.9%) |
| $15,000 to $19,999 | 391 (3.2%) | 641 (5.6%) |
| $20,000 to $24,999 | 314 (2.6%) | 874 (7.6%) |
| $25,000 to $34,999 | 976 (8.0%) | 1,221 (10.7%) |
| $35,000 to $49,999 | 1,333 (10.9%) | 1,597 (13.9%) |
| $50,000 to $74,999 | 2,759 (22.6%) | 2,278 (19.9%) |
| $75,000 to $99,999 | 1,508 (12.3%) | 1,341 (11.7%) |
| $100,000 to $149,999 | 2,807 (23.0%) | 1,408 (12.3%) |
| $150,000 or more | 1,600 (13.1%) | 576 (5.0%) |
| Total | 12,226 (100.0%) | 11,457 (100.0%) |
Monthly Housing Cost Tiers in Sanford
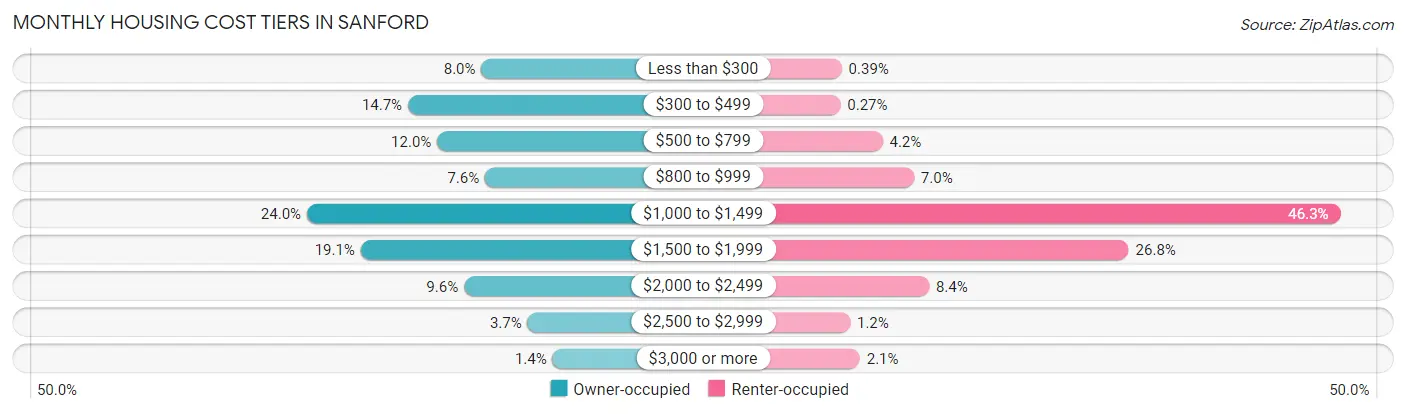
| Monthly Cost | Owner-occupied | Renter-occupied |
| Less than $300 | 972 (8.0%) | 45 (0.4%) |
| $300 to $499 | 1,798 (14.7%) | 31 (0.3%) |
| $500 to $799 | 1,469 (12.0%) | 476 (4.2%) |
| $800 to $999 | 931 (7.6%) | 807 (7.0%) |
| $1,000 to $1,499 | 2,936 (24.0%) | 5,305 (46.3%) |
| $1,500 to $1,999 | 2,330 (19.1%) | 3,072 (26.8%) |
| $2,000 to $2,499 | 1,167 (9.6%) | 966 (8.4%) |
| $2,500 to $2,999 | 452 (3.7%) | 133 (1.2%) |
| $3,000 or more | 171 (1.4%) | 236 (2.1%) |
| Total | 12,226 (100.0%) | 11,457 (100.0%) |
Physical Housing Characteristics in Sanford
Housing Structures in Sanford
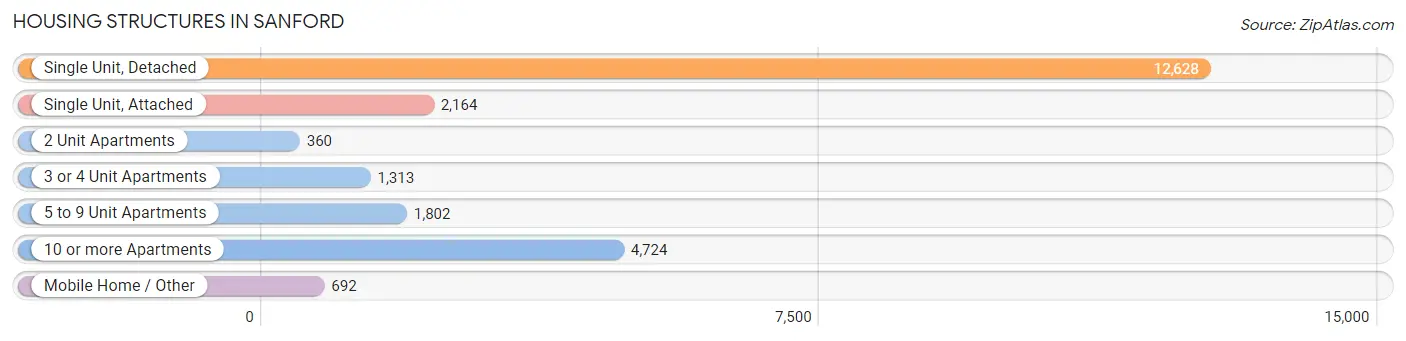
| Structure Type | # Housing Units | % Housing Units |
| Single Unit, Detached | 12,628 | 53.3% |
| Single Unit, Attached | 2,164 | 9.1% |
| 2 Unit Apartments | 360 | 1.5% |
| 3 or 4 Unit Apartments | 1,313 | 5.5% |
| 5 to 9 Unit Apartments | 1,802 | 7.6% |
| 10 or more Apartments | 4,724 | 20.0% |
| Mobile Home / Other | 692 | 2.9% |
| Total | 23,683 | 100.0% |
Housing Structures by Occupancy in Sanford
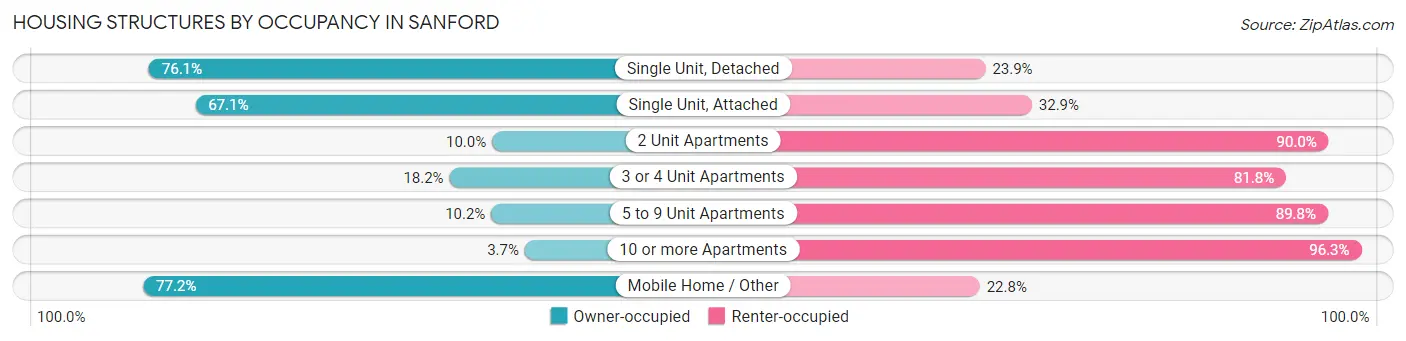
| Structure Type | Owner-occupied | Renter-occupied |
| Single Unit, Detached | 9,606 (76.1%) | 3,022 (23.9%) |
| Single Unit, Attached | 1,453 (67.1%) | 711 (32.9%) |
| 2 Unit Apartments | 36 (10.0%) | 324 (90.0%) |
| 3 or 4 Unit Apartments | 239 (18.2%) | 1,074 (81.8%) |
| 5 to 9 Unit Apartments | 183 (10.2%) | 1,619 (89.8%) |
| 10 or more Apartments | 175 (3.7%) | 4,549 (96.3%) |
| Mobile Home / Other | 534 (77.2%) | 158 (22.8%) |
| Total | 12,226 (51.6%) | 11,457 (48.4%) |
Housing Structures by Number of Rooms in Sanford
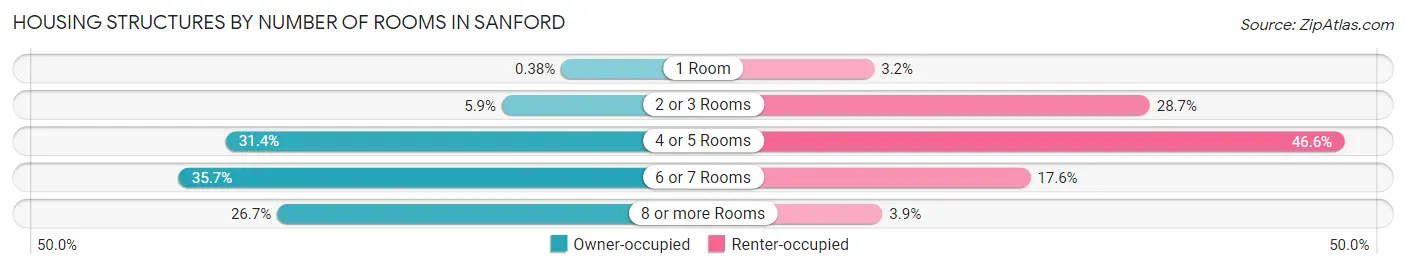
| Number of Rooms | Owner-occupied | Renter-occupied |
| 1 Room | 46 (0.4%) | 364 (3.2%) |
| 2 or 3 Rooms | 716 (5.9%) | 3,284 (28.7%) |
| 4 or 5 Rooms | 3,836 (31.4%) | 5,340 (46.6%) |
| 6 or 7 Rooms | 4,368 (35.7%) | 2,019 (17.6%) |
| 8 or more Rooms | 3,260 (26.7%) | 450 (3.9%) |
| Total | 12,226 (100.0%) | 11,457 (100.0%) |
Housing Structure by Heating Type in Sanford
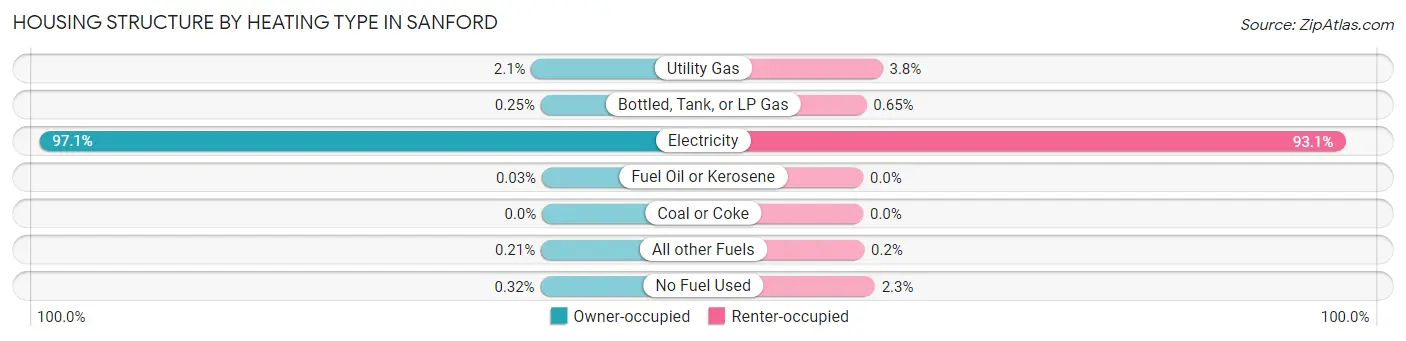
| Heating Type | Owner-occupied | Renter-occupied |
| Utility Gas | 252 (2.1%) | 431 (3.8%) |
| Bottled, Tank, or LP Gas | 30 (0.3%) | 75 (0.6%) |
| Electricity | 11,875 (97.1%) | 10,670 (93.1%) |
| Fuel Oil or Kerosene | 4 (0.0%) | 0 (0.0%) |
| Coal or Coke | 0 (0.0%) | 0 (0.0%) |
| All other Fuels | 26 (0.2%) | 23 (0.2%) |
| No Fuel Used | 39 (0.3%) | 258 (2.2%) |
| Total | 12,226 (100.0%) | 11,457 (100.0%) |
Household Vehicle Usage in Sanford
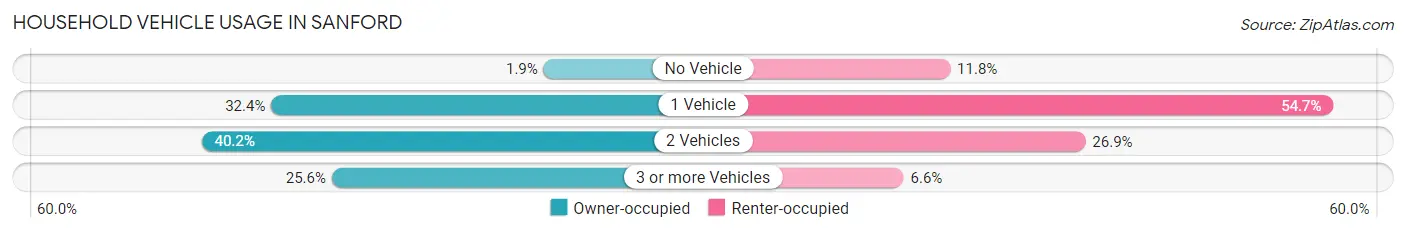
| Vehicles per Household | Owner-occupied | Renter-occupied |
| No Vehicle | 227 (1.9%) | 1,351 (11.8%) |
| 1 Vehicle | 3,958 (32.4%) | 6,267 (54.7%) |
| 2 Vehicles | 4,912 (40.2%) | 3,086 (26.9%) |
| 3 or more Vehicles | 3,129 (25.6%) | 753 (6.6%) |
| Total | 12,226 (100.0%) | 11,457 (100.0%) |
Real Estate & Mortgages in Sanford
Real Estate and Mortgage Overview in Sanford
| Characteristic | Without Mortgage | With Mortgage |
| Housing Units | 4,069 | 8,157 |
| Median Property Value | $193,300 | $262,000 |
| Median Household Income | $54,380 | $1,274 |
| Monthly Housing Costs | $419 | $171 |
| Real Estate Taxes | $961 | $431 |
Property Value by Mortgage Status in Sanford
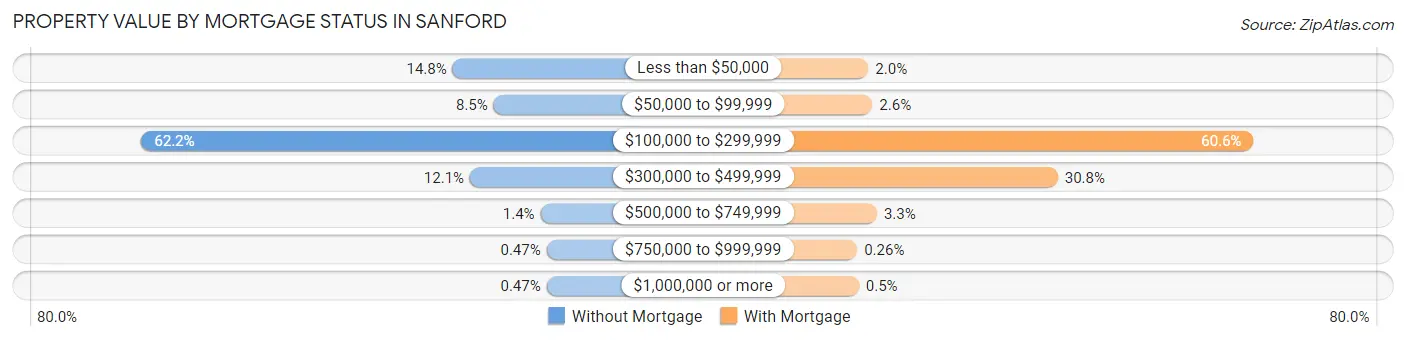
| Property Value | Without Mortgage | With Mortgage |
| Less than $50,000 | 602 (14.8%) | 160 (2.0%) |
| $50,000 to $99,999 | 347 (8.5%) | 210 (2.6%) |
| $100,000 to $299,999 | 2,531 (62.2%) | 4,945 (60.6%) |
| $300,000 to $499,999 | 494 (12.1%) | 2,514 (30.8%) |
| $500,000 to $749,999 | 57 (1.4%) | 266 (3.3%) |
| $750,000 to $999,999 | 19 (0.5%) | 21 (0.3%) |
| $1,000,000 or more | 19 (0.5%) | 41 (0.5%) |
| Total | 4,069 (100.0%) | 8,157 (100.0%) |
Household Income by Mortgage Status in Sanford
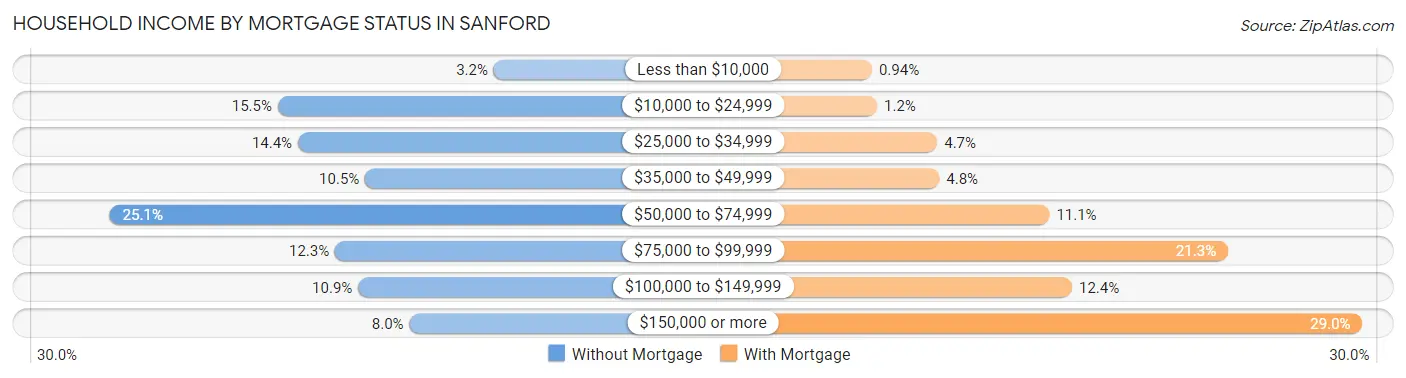
| Household Income | Without Mortgage | With Mortgage |
| Less than $10,000 | 130 (3.2%) | 77 (0.9%) |
| $10,000 to $24,999 | 632 (15.5%) | 100 (1.2%) |
| $25,000 to $34,999 | 585 (14.4%) | 381 (4.7%) |
| $35,000 to $49,999 | 429 (10.5%) | 391 (4.8%) |
| $50,000 to $74,999 | 1,023 (25.1%) | 904 (11.1%) |
| $75,000 to $99,999 | 499 (12.3%) | 1,736 (21.3%) |
| $100,000 to $149,999 | 445 (10.9%) | 1,009 (12.4%) |
| $150,000 or more | 326 (8.0%) | 2,362 (29.0%) |
| Total | 4,069 (100.0%) | 8,157 (100.0%) |
Property Value to Household Income Ratio in Sanford
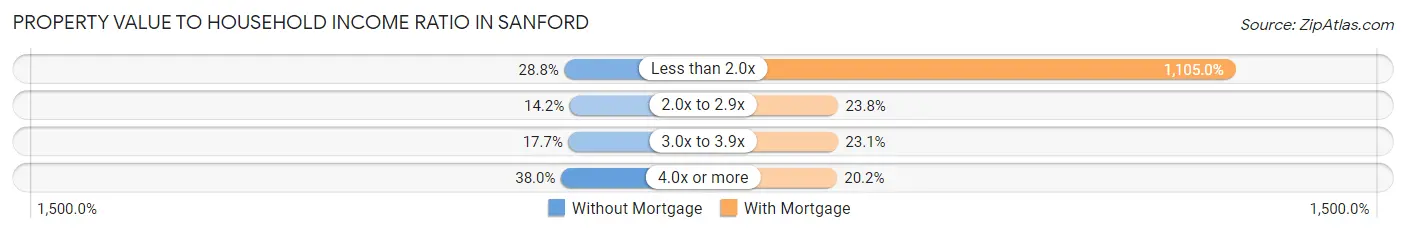
| Value-to-Income Ratio | Without Mortgage | With Mortgage |
| Less than 2.0x | 1,170 (28.7%) | 90,136 (1,105.0%) |
| 2.0x to 2.9x | 577 (14.2%) | 1,940 (23.8%) |
| 3.0x to 3.9x | 719 (17.7%) | 1,884 (23.1%) |
| 4.0x or more | 1,544 (38.0%) | 1,646 (20.2%) |
| Total | 4,069 (100.0%) | 8,157 (100.0%) |
Real Estate Taxes by Mortgage Status in Sanford
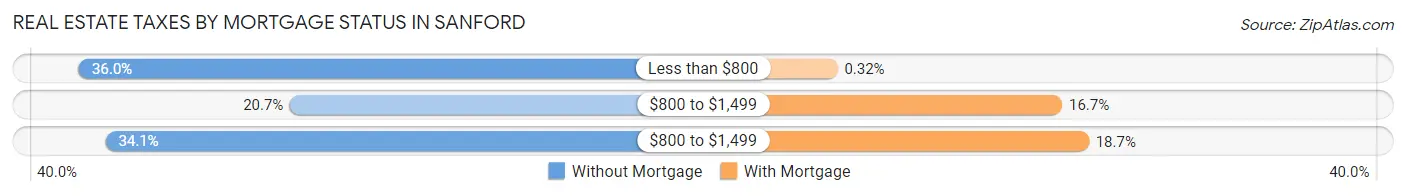
| Property Taxes | Without Mortgage | With Mortgage |
| Less than $800 | 1,466 (36.0%) | 26 (0.3%) |
| $800 to $1,499 | 841 (20.7%) | 1,365 (16.7%) |
| $800 to $1,499 | 1,387 (34.1%) | 1,524 (18.7%) |
| Total | 4,069 (100.0%) | 8,157 (100.0%) |
Health & Disability in Sanford
Health Insurance Coverage by Age in Sanford
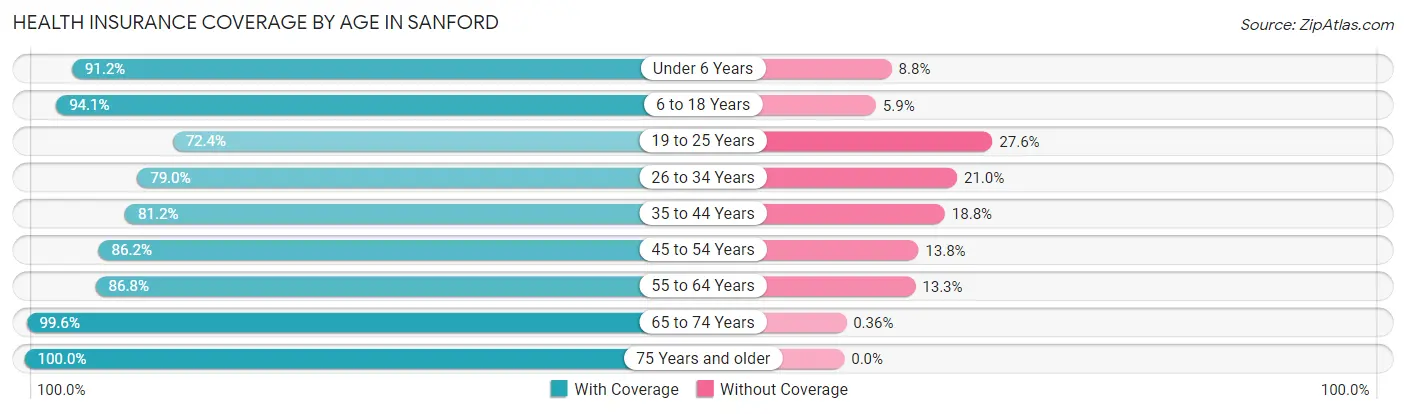
| Age Bracket | With Coverage | Without Coverage |
| Under 6 Years | 4,109 (91.2%) | 398 (8.8%) |
| 6 to 18 Years | 8,613 (94.1%) | 540 (5.9%) |
| 19 to 25 Years | 4,678 (72.4%) | 1,785 (27.6%) |
| 26 to 34 Years | 7,492 (79.0%) | 1,995 (21.0%) |
| 35 to 44 Years | 7,368 (81.2%) | 1,701 (18.8%) |
| 45 to 54 Years | 6,018 (86.2%) | 965 (13.8%) |
| 55 to 64 Years | 5,969 (86.8%) | 912 (13.3%) |
| 65 to 74 Years | 4,751 (99.6%) | 17 (0.4%) |
| 75 Years and older | 2,970 (100.0%) | 0 (0.0%) |
| Total | 51,968 (86.2%) | 8,313 (13.8%) |
Health Insurance Coverage by Citizenship Status in Sanford
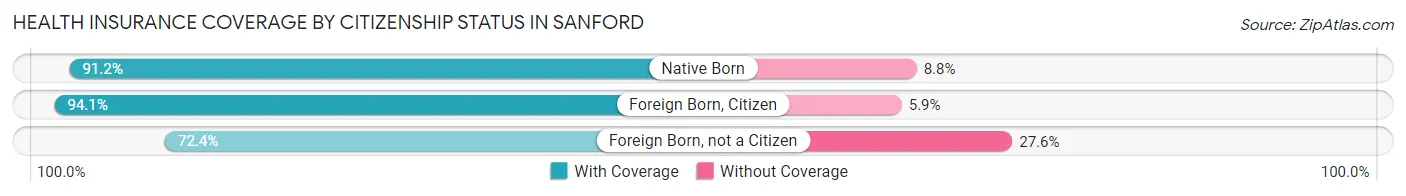
| Citizenship Status | With Coverage | Without Coverage |
| Native Born | 4,109 (91.2%) | 398 (8.8%) |
| Foreign Born, Citizen | 8,613 (94.1%) | 540 (5.9%) |
| Foreign Born, not a Citizen | 4,678 (72.4%) | 1,785 (27.6%) |
Health Insurance Coverage by Household Income in Sanford
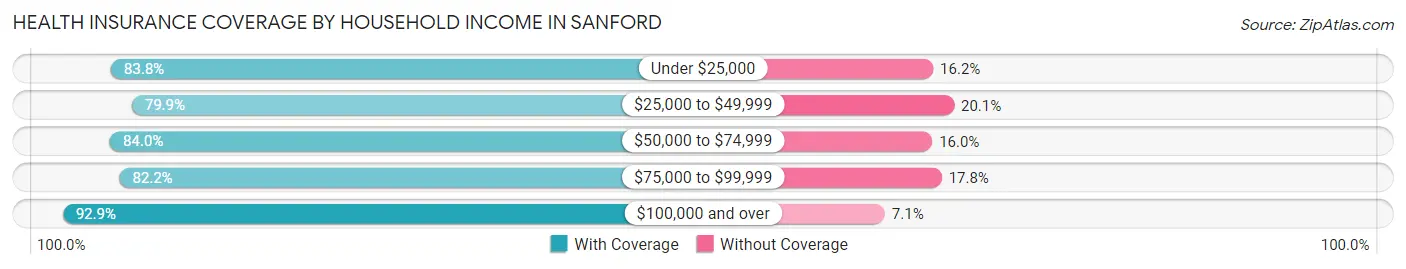
| Household Income | With Coverage | Without Coverage |
| Under $25,000 | 6,292 (83.8%) | 1,215 (16.2%) |
| $25,000 to $49,999 | 8,221 (79.9%) | 2,067 (20.1%) |
| $50,000 to $74,999 | 10,508 (84.0%) | 2,002 (16.0%) |
| $75,000 to $99,999 | 6,718 (82.2%) | 1,453 (17.8%) |
| $100,000 and over | 20,086 (92.9%) | 1,545 (7.1%) |
Public vs Private Health Insurance Coverage by Age in Sanford
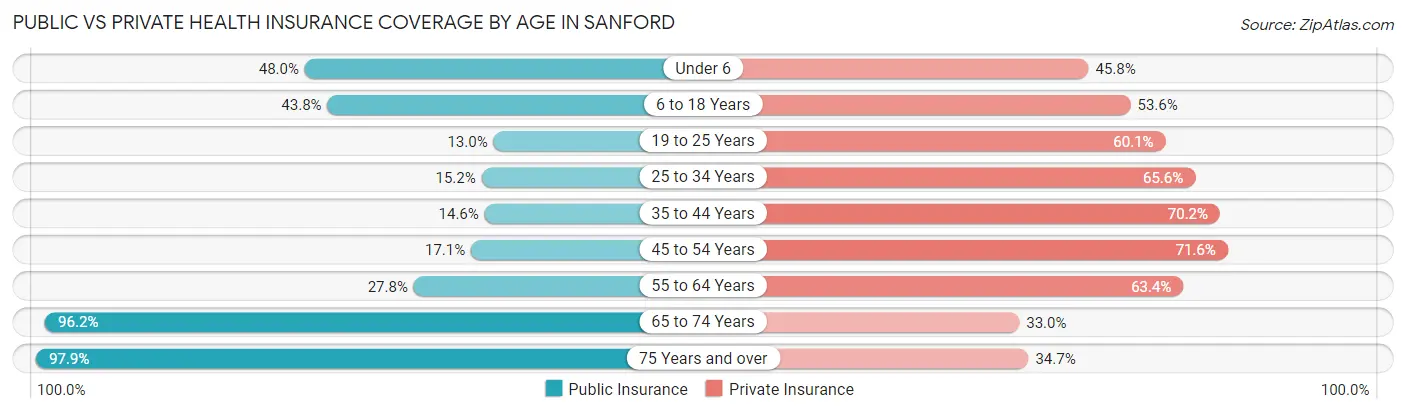
| Age Bracket | Public Insurance | Private Insurance |
| Under 6 | 2,163 (48.0%) | 2,064 (45.8%) |
| 6 to 18 Years | 4,008 (43.8%) | 4,906 (53.6%) |
| 19 to 25 Years | 838 (13.0%) | 3,882 (60.1%) |
| 25 to 34 Years | 1,440 (15.2%) | 6,220 (65.6%) |
| 35 to 44 Years | 1,326 (14.6%) | 6,364 (70.2%) |
| 45 to 54 Years | 1,196 (17.1%) | 5,001 (71.6%) |
| 55 to 64 Years | 1,911 (27.8%) | 4,360 (63.4%) |
| 65 to 74 Years | 4,586 (96.2%) | 1,571 (33.0%) |
| 75 Years and over | 2,907 (97.9%) | 1,029 (34.6%) |
| Total | 20,375 (33.8%) | 35,397 (58.7%) |
Disability Status by Sex by Age in Sanford
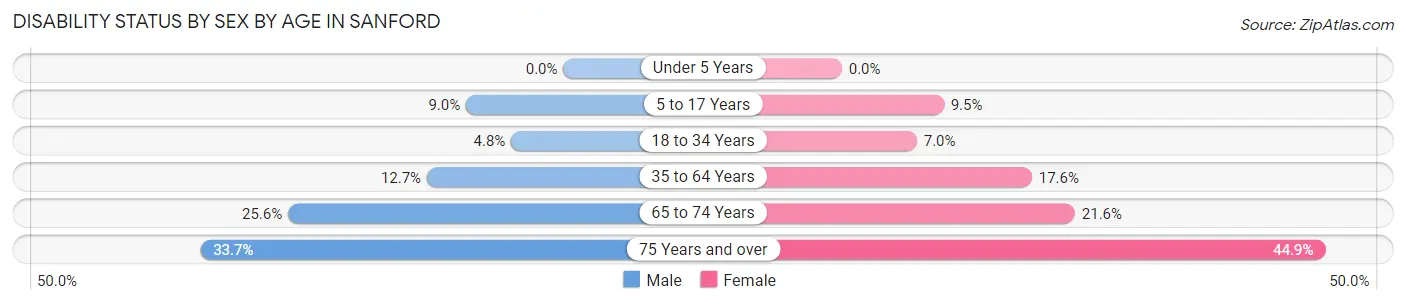
| Age Bracket | Male | Female |
| Under 5 Years | 0 (0.0%) | 0 (0.0%) |
| 5 to 17 Years | 435 (9.0%) | 456 (9.5%) |
| 18 to 34 Years | 420 (4.8%) | 536 (7.0%) |
| 35 to 64 Years | 1,416 (12.7%) | 2,072 (17.6%) |
| 65 to 74 Years | 545 (25.6%) | 570 (21.6%) |
| 75 Years and over | 370 (33.7%) | 840 (44.9%) |
Disability Class by Sex by Age in Sanford
Disability Class: Hearing Difficulty
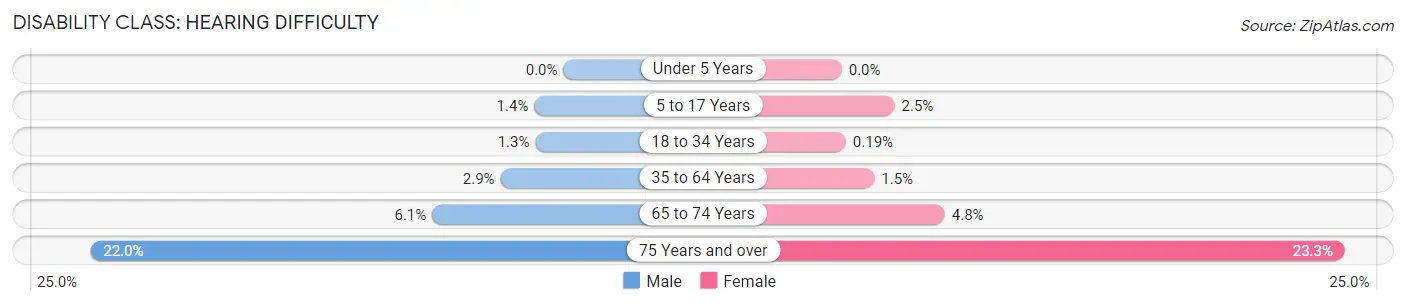
| Age Bracket | Male | Female |
| Under 5 Years | 0 (0.0%) | 0 (0.0%) |
| 5 to 17 Years | 65 (1.3%) | 118 (2.5%) |
| 18 to 34 Years | 113 (1.3%) | 15 (0.2%) |
| 35 to 64 Years | 327 (2.9%) | 177 (1.5%) |
| 65 to 74 Years | 130 (6.1%) | 126 (4.8%) |
| 75 Years and over | 241 (22.0%) | 437 (23.3%) |
Disability Class: Vision Difficulty
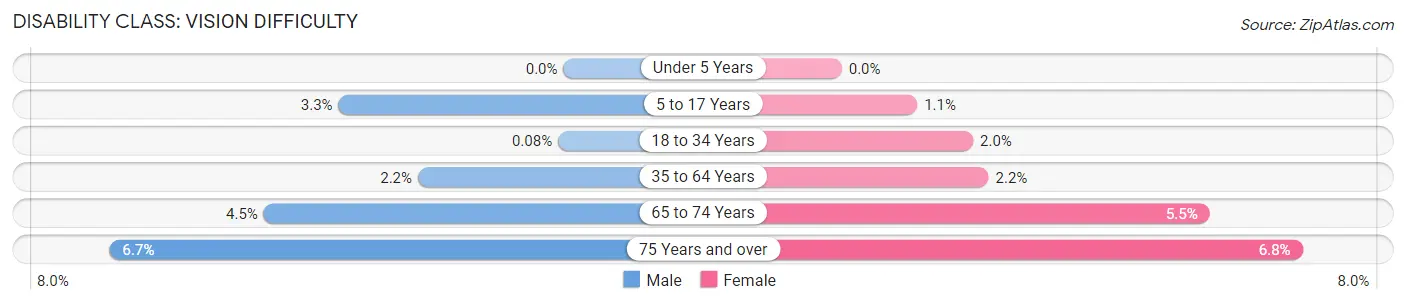
| Age Bracket | Male | Female |
| Under 5 Years | 0 (0.0%) | 0 (0.0%) |
| 5 to 17 Years | 161 (3.3%) | 54 (1.1%) |
| 18 to 34 Years | 7 (0.1%) | 150 (1.9%) |
| 35 to 64 Years | 242 (2.2%) | 256 (2.2%) |
| 65 to 74 Years | 95 (4.4%) | 144 (5.5%) |
| 75 Years and over | 74 (6.7%) | 128 (6.8%) |
Disability Class: Cognitive Difficulty
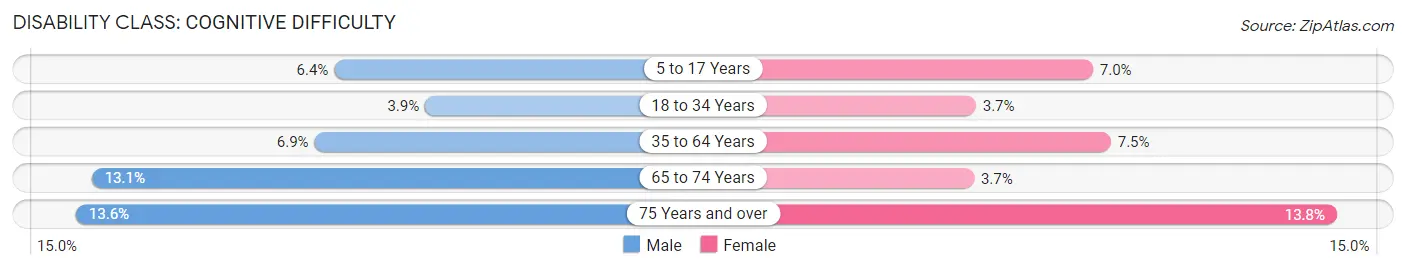
| Age Bracket | Male | Female |
| 5 to 17 Years | 307 (6.4%) | 337 (7.0%) |
| 18 to 34 Years | 334 (3.8%) | 287 (3.7%) |
| 35 to 64 Years | 775 (6.9%) | 880 (7.5%) |
| 65 to 74 Years | 280 (13.1%) | 97 (3.7%) |
| 75 Years and over | 149 (13.6%) | 258 (13.8%) |
Disability Class: Ambulatory Difficulty
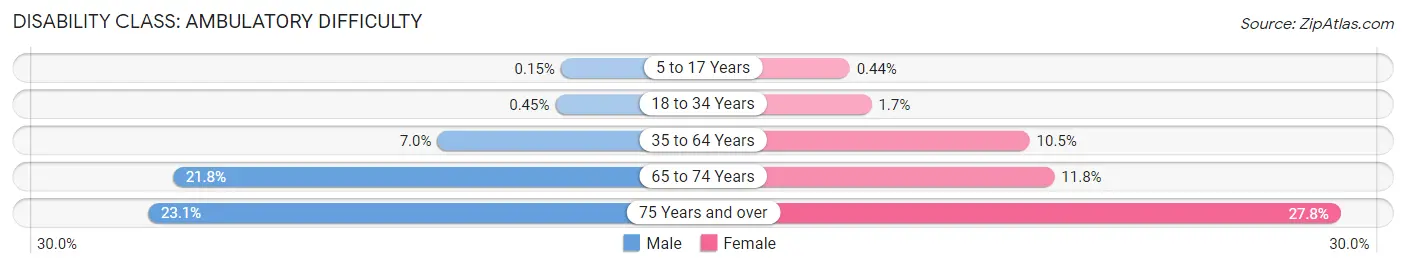
| Age Bracket | Male | Female |
| 5 to 17 Years | 7 (0.2%) | 21 (0.4%) |
| 18 to 34 Years | 39 (0.4%) | 127 (1.7%) |
| 35 to 64 Years | 785 (7.0%) | 1,229 (10.5%) |
| 65 to 74 Years | 464 (21.7%) | 312 (11.8%) |
| 75 Years and over | 254 (23.1%) | 520 (27.8%) |
Disability Class: Self-Care Difficulty
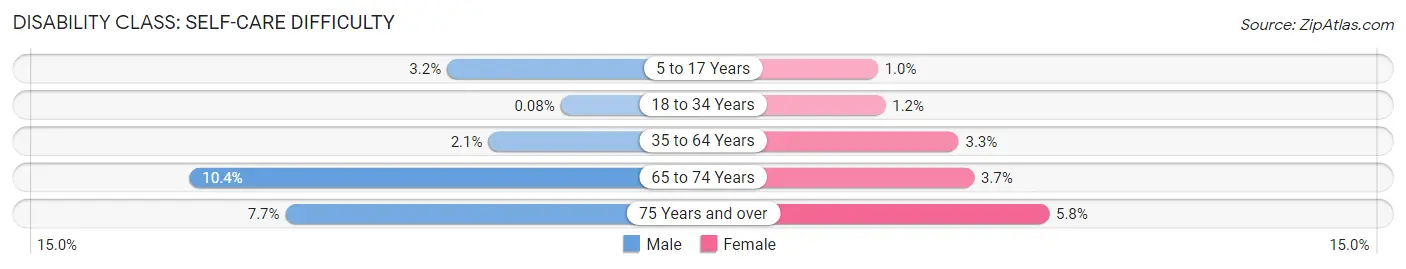
| Age Bracket | Male | Female |
| 5 to 17 Years | 156 (3.2%) | 48 (1.0%) |
| 18 to 34 Years | 7 (0.1%) | 93 (1.2%) |
| 35 to 64 Years | 234 (2.1%) | 382 (3.3%) |
| 65 to 74 Years | 222 (10.4%) | 97 (3.7%) |
| 75 Years and over | 85 (7.7%) | 108 (5.8%) |
Technology Access in Sanford
Computing Device Access in Sanford
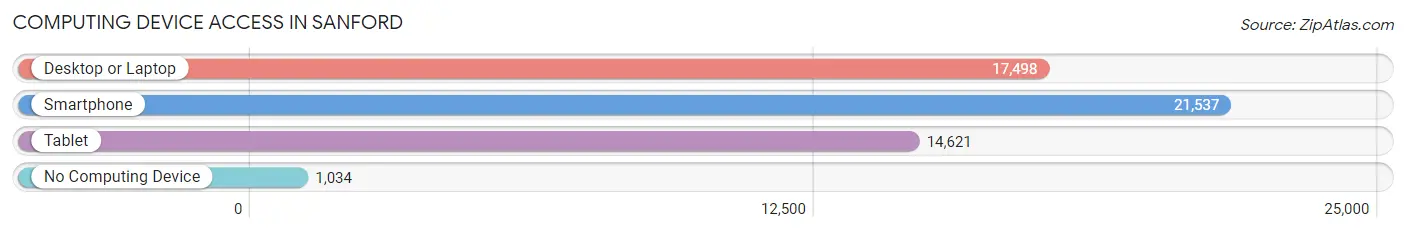
| Device Type | # Households | % Households |
| Desktop or Laptop | 17,498 | 73.9% |
| Smartphone | 21,537 | 90.9% |
| Tablet | 14,621 | 61.7% |
| No Computing Device | 1,034 | 4.4% |
| Total | 23,683 | 100.0% |
Internet Access in Sanford
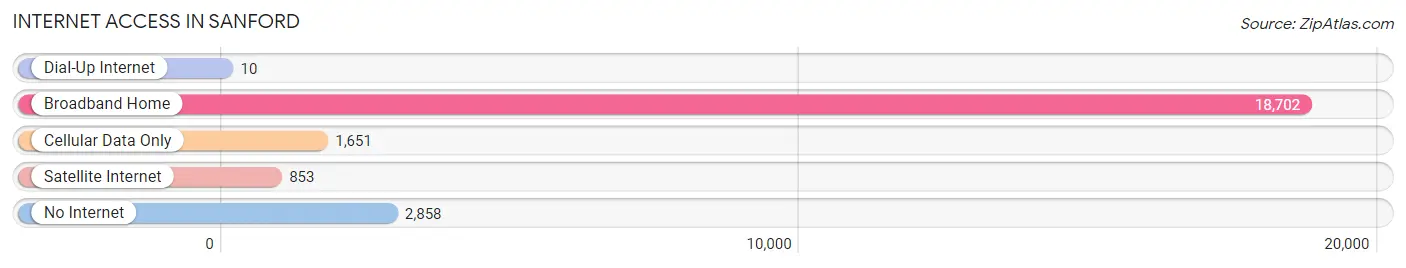
| Internet Type | # Households | % Households |
| Dial-Up Internet | 10 | 0.0% |
| Broadband Home | 18,702 | 79.0% |
| Cellular Data Only | 1,651 | 7.0% |
| Satellite Internet | 853 | 3.6% |
| No Internet | 2,858 | 12.1% |
| Total | 23,683 | 100.0% |
Sanford Summary
Sanford, Florida is a city located in Seminole County, Florida, United States. It is the county seat of Seminole County and is part of the Orlando–Kissimmee–Sanford Metropolitan Statistical Area. As of the 2010 census, the city had a population of 53,570.
History
Sanford was founded in 1877 by Henry S. Sanford, a businessman and diplomat from Connecticut. He purchased 12,548 acres of land on the south shore of Lake Monroe and named the area after himself. The city was incorporated in 1877 and was named the county seat of Seminole County in 1913.
In the early 1900s, Sanford was a popular tourist destination due to its proximity to the St. Johns River and Lake Monroe. The city was also known for its citrus industry, which was a major source of income for the area.
In the 1950s, Sanford began to experience rapid growth due to the influx of people from the north and the development of the Orlando area. The city experienced a population boom in the 1970s and 1980s, and by the 1990s, it had become a major suburb of Orlando.
Geography
Sanford is located in Central Florida, approximately 25 miles northeast of Orlando. It is situated on the south shore of Lake Monroe, which is part of the St. Johns River. The city is bordered by Lake Mary to the north, Longwood to the east, and Oviedo to the south.
The city has a total area of 24.3 square miles, of which 22.7 square miles is land and 1.6 square miles is water. The terrain is mostly flat, with some rolling hills in the northern part of the city.
Economy
Sanford is a major economic center in Central Florida. The city is home to several major employers, including Seminole County Public Schools, Central Florida Regional Hospital, and the Seminole County Sheriff's Office.
The city is also home to several major retail and entertainment venues, including the Seminole Towne Center, the Central Florida Zoo, and the Sanford Sports Complex.
The city's economy is also supported by its tourism industry. Sanford is home to several popular attractions, including the Central Florida Zoo, the Sanford Sports Complex, and the Sanford Museum of Art.
Demographics
As of the 2010 census, there were 53,570 people, 20,845 households, and 13,845 families residing in the city. The population density was 2,323.3 people per square mile. The racial makeup of the city was 68.2% White, 22.3% African American, 0.4% Native American, 2.2% Asian, 0.1% Pacific Islander, 4.7% from other races, and 2.1% from two or more races. Hispanic or Latino of any race were 11.3% of the population.
The median income for a household in the city was $41,945, and the median income for a family was $50,945. The per capita income for the city was $21,845. About 13.2% of families and 16.3% of the population were below the poverty line, including 22.3% of those under age 18 and 10.2% of those age 65 or over.
Common Questions
What is Per Capita Income in Sanford?
Per Capita income in Sanford is $31,797.
What is the Median Family Income in Sanford?
Median Family Income in Sanford is $70,732.
What is the Median Household income in Sanford?
Median Household Income in Sanford is $59,181.
What is Income or Wage Gap in Sanford?
Income or Wage Gap in Sanford is 11.6%.
Women in Sanford earn 88.4 cents for every dollar earned by a man.
What is Family Income Deficit in Sanford?
Family Income Deficit in Sanford is $10,842.
Families that are below poverty line in Sanford earn $10,842 less on average than the poverty threshold level.
What is Inequality or Gini Index in Sanford?
Inequality or Gini Index in Sanford is 0.44.
What is the Total Population of Sanford?
Total Population of Sanford is 61,272.
What is the Total Male Population of Sanford?
Total Male Population of Sanford is 30,695.
What is the Total Female Population of Sanford?
Total Female Population of Sanford is 30,577.
What is the Ratio of Males per 100 Females in Sanford?
There are 100.39 Males per 100 Females in Sanford.
What is the Ratio of Females per 100 Males in Sanford?
There are 99.62 Females per 100 Males in Sanford.
What is the Median Population Age in Sanford?
Median Population Age in Sanford is 35.6 Years.
What is the Average Family Size in Sanford
Average Family Size in Sanford is 3.2 People.
What is the Average Household Size in Sanford
Average Household Size in Sanford is 2.5 People.
How Large is the Labor Force in Sanford?
There are 33,040 People in the Labor Forcein in Sanford.
What is the Percentage of People in the Labor Force in Sanford?
67.2% of People are in the Labor Force in Sanford.
What is the Unemployment Rate in Sanford?
Unemployment Rate in Sanford is 5.2%.