Azure, MT Map & Demographics
Azure Map
Azure Overview
$14,653
PER CAPITA INCOME
$70,417
AVG FAMILY INCOME
0.39
INEQUALITY / GINI INDEX
386
TOTAL POPULATION
233
MALE POPULATION
153
FEMALE POPULATION
152.29
MALES / 100 FEMALES
65.67
FEMALES / 100 MALES
20.1
MEDIAN AGE
4.2
AVG FAMILY SIZE
3.9
AVG HOUSEHOLD SIZE
108
LABOR FORCE [ PEOPLE ]
49.8%
PERCENT IN LABOR FORCE
30.6%
UNEMPLOYMENT RATE
Income in Azure
Income Overview in Azure
| Characteristic | Number | Measure |
| Per Capita Income | 386 | $14,653 |
| Median Family Income | 87 | $70,417 |
| Mean Family Income | 87 | $63,913 |
| Median Household Income | 100 | $0 |
| Mean Household Income | 100 | $56,501 |
| Income Deficit | 87 | $0 |
| Wage / Income Gap (%) | 386 | 0.00% |
| Wage / Income Gap ($) | 386 | 100.00¢ per $1 |
| Gini / Inequality Index | 386 | 0.39 |
Earnings by Sex in Azure
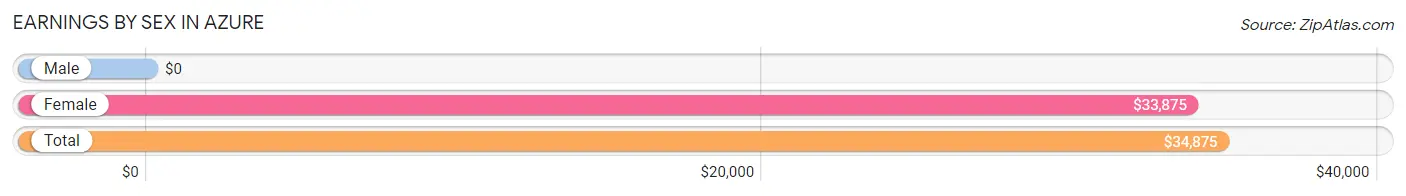
| Sex | Number | Average Earnings |
| Male | 80 (76.2%) | $0 |
| Female | 25 (23.8%) | $33,875 |
| Total | 105 (100.0%) | $34,875 |
Earnings by Sex by Income Bracket in Azure
The most common earnings brackets in Azure are $2,500 to $4,999 for men (26 | 32.5%) and $30,000 to $34,999 for women (10 | 40.0%).
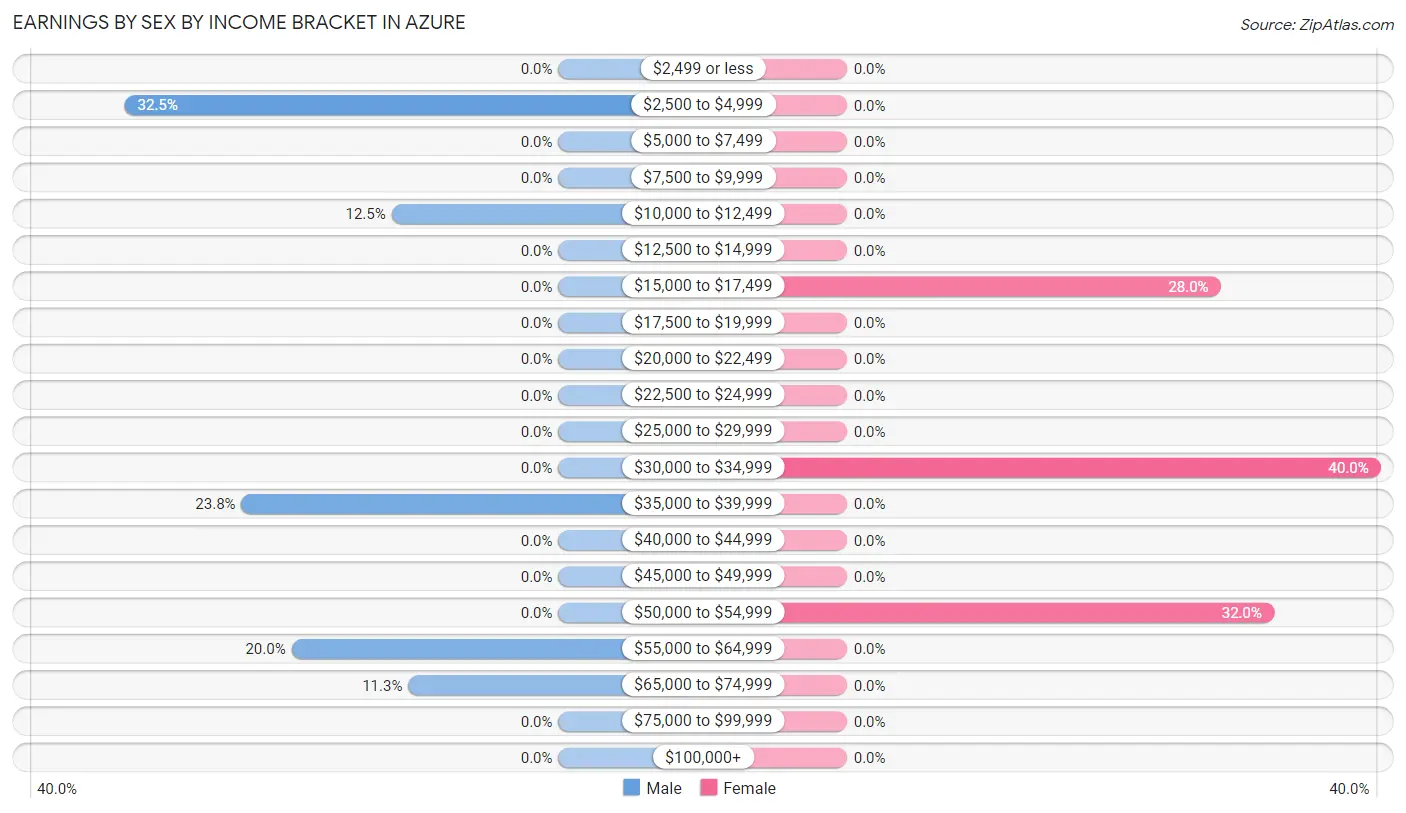
| Income | Male | Female |
| $2,499 or less | 0 (0.0%) | 0 (0.0%) |
| $2,500 to $4,999 | 26 (32.5%) | 0 (0.0%) |
| $5,000 to $7,499 | 0 (0.0%) | 0 (0.0%) |
| $7,500 to $9,999 | 0 (0.0%) | 0 (0.0%) |
| $10,000 to $12,499 | 10 (12.5%) | 0 (0.0%) |
| $12,500 to $14,999 | 0 (0.0%) | 0 (0.0%) |
| $15,000 to $17,499 | 0 (0.0%) | 7 (28.0%) |
| $17,500 to $19,999 | 0 (0.0%) | 0 (0.0%) |
| $20,000 to $22,499 | 0 (0.0%) | 0 (0.0%) |
| $22,500 to $24,999 | 0 (0.0%) | 0 (0.0%) |
| $25,000 to $29,999 | 0 (0.0%) | 0 (0.0%) |
| $30,000 to $34,999 | 0 (0.0%) | 10 (40.0%) |
| $35,000 to $39,999 | 19 (23.7%) | 0 (0.0%) |
| $40,000 to $44,999 | 0 (0.0%) | 0 (0.0%) |
| $45,000 to $49,999 | 0 (0.0%) | 0 (0.0%) |
| $50,000 to $54,999 | 0 (0.0%) | 8 (32.0%) |
| $55,000 to $64,999 | 16 (20.0%) | 0 (0.0%) |
| $65,000 to $74,999 | 9 (11.3%) | 0 (0.0%) |
| $75,000 to $99,999 | 0 (0.0%) | 0 (0.0%) |
| $100,000+ | 0 (0.0%) | 0 (0.0%) |
| Total | 80 (100.0%) | 25 (100.0%) |
Earnings by Sex by Educational Attainment in Azure
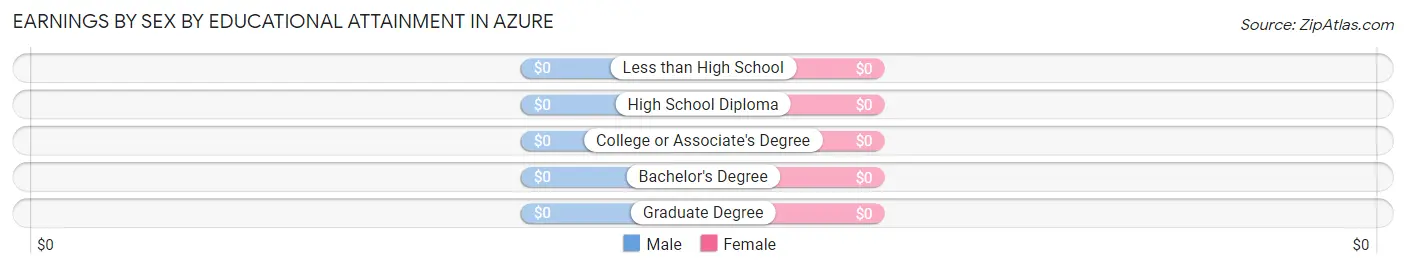
| Educational Attainment | Male Income | Female Income |
| Less than High School | - | - |
| High School Diploma | - | - |
| College or Associate's Degree | - | - |
| Bachelor's Degree | - | - |
| Graduate Degree | - | - |
| Total | - | - |
Family Income in Azure
Family Income Brackets in Azure
According to the Azure family income data, there are 25 families falling into the $50,000 to $74,999 income range, which is the most common income bracket and makes up 28.7% of all families.
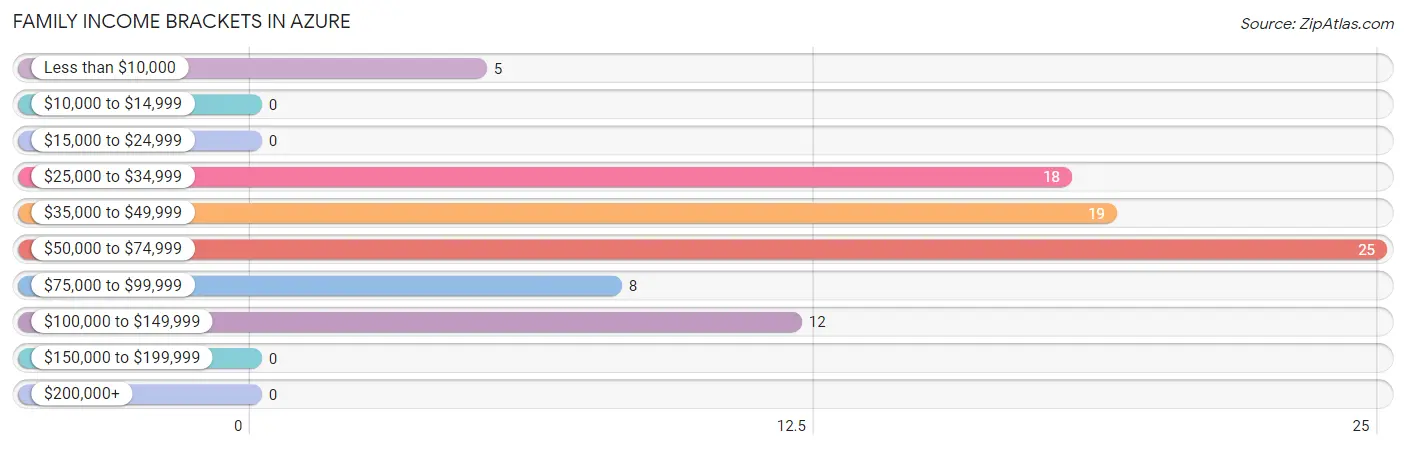
| Income Bracket | # Families | % Families |
| Less than $10,000 | 5 | 5.7% |
| $10,000 to $14,999 | 0 | 0.0% |
| $15,000 to $24,999 | 0 | 0.0% |
| $25,000 to $34,999 | 18 | 20.7% |
| $35,000 to $49,999 | 19 | 21.8% |
| $50,000 to $74,999 | 25 | 28.7% |
| $75,000 to $99,999 | 8 | 9.2% |
| $100,000 to $149,999 | 12 | 13.8% |
| $150,000 to $199,999 | 0 | 0.0% |
| $200,000+ | 0 | 0.0% |
Family Income by Famaliy Size in Azure
| Income Bracket | # Families | Median Income |
| 2-Person Families | 26 (29.9%) | $0 |
| 3-Person Families | 19 (21.8%) | $0 |
| 4-Person Families | 9 (10.3%) | $0 |
| 5-Person Families | 0 (0.0%) | $0 |
| 6-Person Families | 25 (28.7%) | $0 |
| 7+ Person Families | 8 (9.2%) | $0 |
| Total | 87 (100.0%) | $70,417 |
Family Income by Number of Earners in Azure
| Number of Earners | # Families | Median Income |
| No Earners | 13 (14.9%) | $0 |
| 1 Earner | 50 (57.5%) | $0 |
| 2 Earners | 16 (18.4%) | $0 |
| 3+ Earners | 8 (9.2%) | $0 |
| Total | 87 (100.0%) | $70,417 |
Household Income in Azure
Household Income Brackets in Azure
With 25 households falling in the category, the $50,000 to $74,999 income range is the most frequent in Azure, accounting for 25.0% of all households.
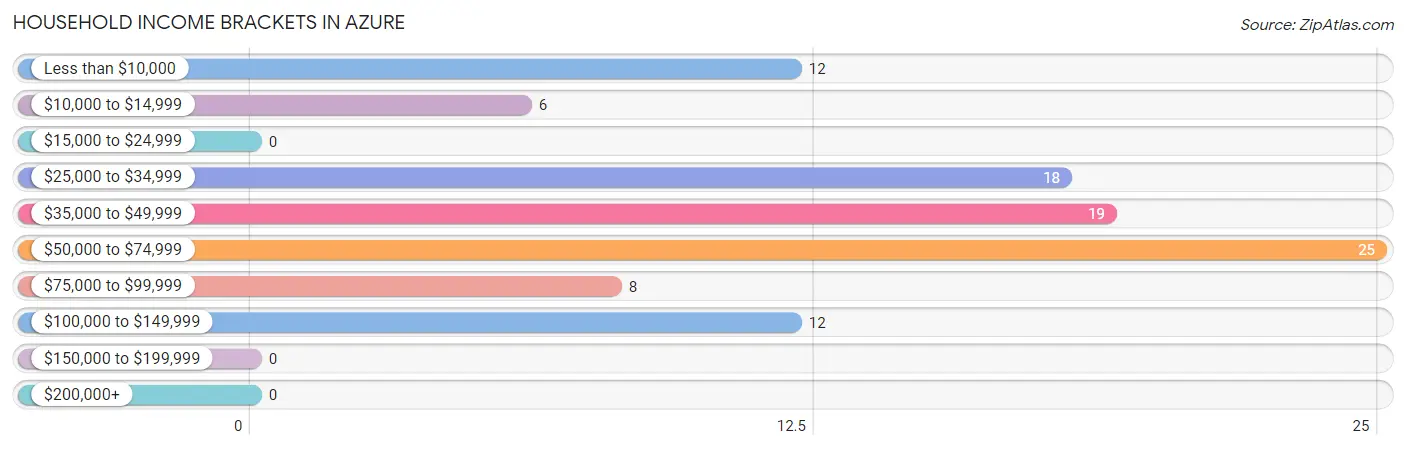
| Income Bracket | # Households | % Households |
| Less than $10,000 | 12 | 12.0% |
| $10,000 to $14,999 | 6 | 6.0% |
| $15,000 to $24,999 | 0 | 0.0% |
| $25,000 to $34,999 | 18 | 18.0% |
| $35,000 to $49,999 | 19 | 19.0% |
| $50,000 to $74,999 | 25 | 25.0% |
| $75,000 to $99,999 | 8 | 8.0% |
| $100,000 to $149,999 | 12 | 12.0% |
| $150,000 to $199,999 | 0 | 0.0% |
| $200,000+ | 0 | 0.0% |
Household Income by Householder Age in Azure
The median household income in Azure is $0, with the highest median household income of $39,013 found in the 25 to 44 years age bracket for the primary householder. A total of 33 households (33.0%) fall into this category.
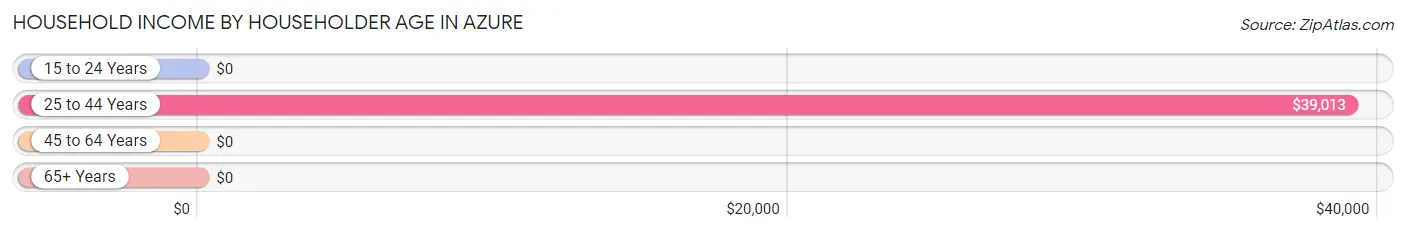
| Income Bracket | # Households | Median Income |
| 15 to 24 Years | 0 (0.0%) | $0 |
| 25 to 44 Years | 33 (33.0%) | $39,013 |
| 45 to 64 Years | 39 (39.0%) | $0 |
| 65+ Years | 28 (28.0%) | $0 |
| Total | 100 (100.0%) | $0 |
Poverty in Azure
Income Below Poverty by Sex and Age in Azure
With 24.5% poverty level for males and 47.7% for females among the residents of Azure, 15 year old males and 5 year old females are the most vulnerable to poverty, with 5 males (100.0%) and 6 females (100.0%) in their respective age groups living below the poverty level.
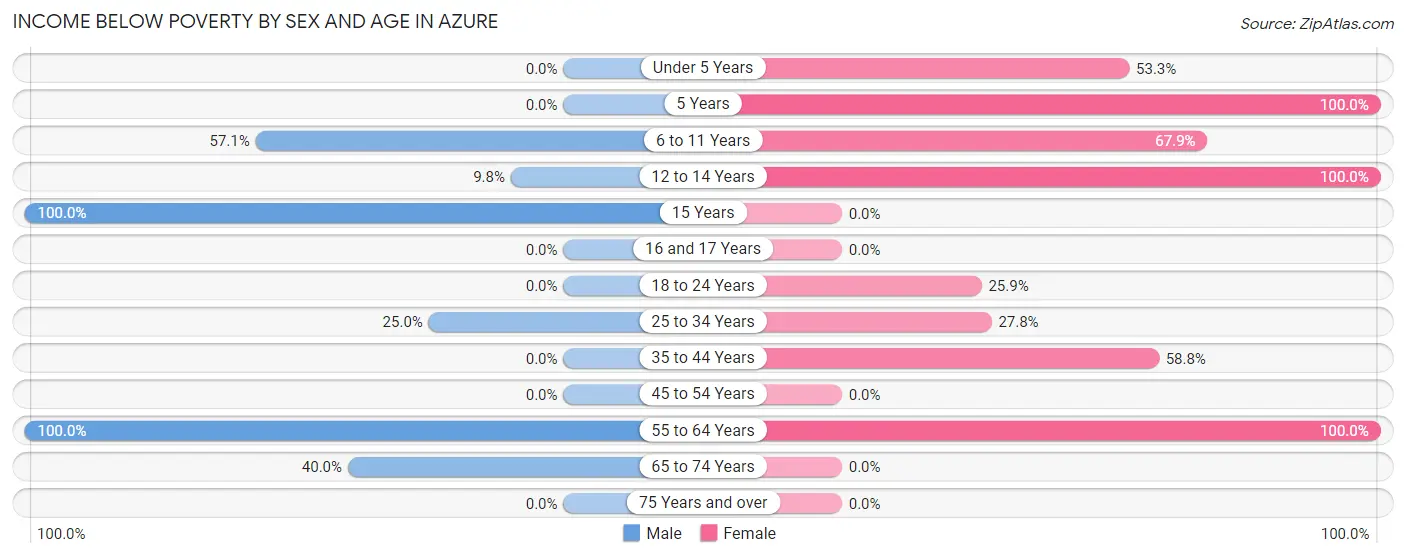
| Age Bracket | Male | Female |
| Under 5 Years | 0 (0.0%) | 8 (53.3%) |
| 5 Years | 0 (0.0%) | 6 (100.0%) |
| 6 to 11 Years | 24 (57.1%) | 19 (67.9%) |
| 12 to 14 Years | 4 (9.8%) | 12 (100.0%) |
| 15 Years | 5 (100.0%) | 0 (0.0%) |
| 16 and 17 Years | 0 (0.0%) | 0 (0.0%) |
| 18 to 24 Years | 0 (0.0%) | 7 (25.9%) |
| 25 to 34 Years | 3 (25.0%) | 5 (27.8%) |
| 35 to 44 Years | 0 (0.0%) | 10 (58.8%) |
| 45 to 54 Years | 0 (0.0%) | 0 (0.0%) |
| 55 to 64 Years | 13 (100.0%) | 6 (100.0%) |
| 65 to 74 Years | 8 (40.0%) | 0 (0.0%) |
| 75 Years and over | 0 (0.0%) | 0 (0.0%) |
| Total | 57 (24.5%) | 73 (47.7%) |
Income Above Poverty by Sex and Age in Azure
According to the poverty statistics in Azure, males aged under 5 years and females aged 16 and 17 years are the age groups that are most secure financially, with 100.0% of males and 100.0% of females in these age groups living above the poverty line.
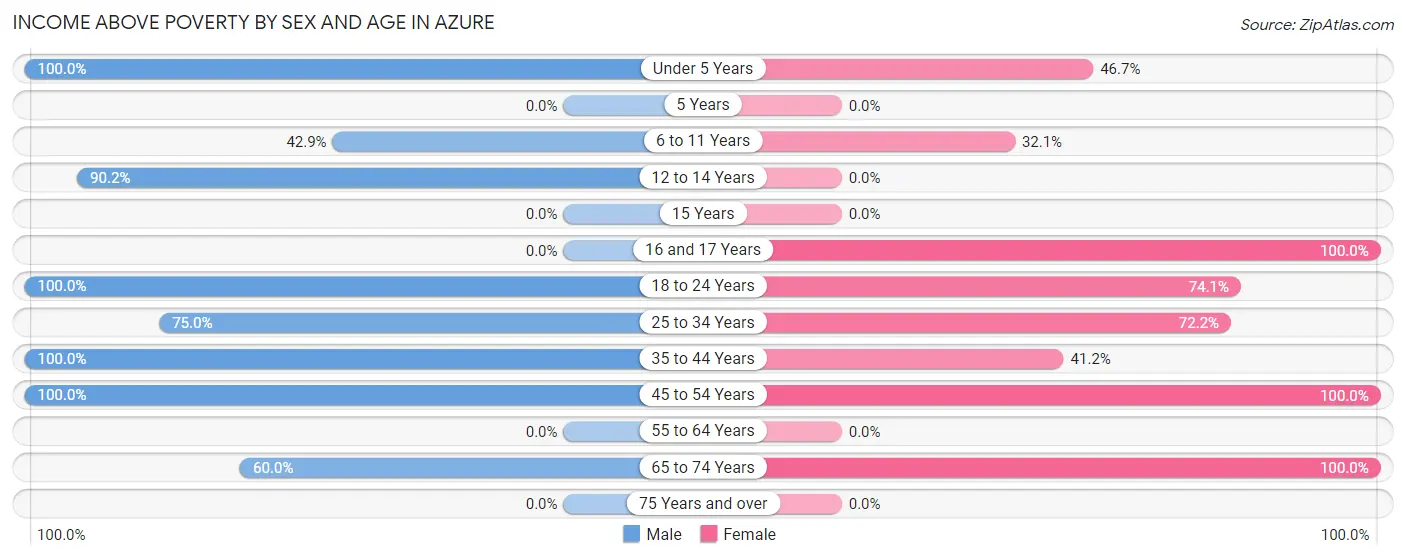
| Age Bracket | Male | Female |
| Under 5 Years | 20 (100.0%) | 7 (46.7%) |
| 5 Years | 0 (0.0%) | 0 (0.0%) |
| 6 to 11 Years | 18 (42.9%) | 9 (32.1%) |
| 12 to 14 Years | 37 (90.2%) | 0 (0.0%) |
| 15 Years | 0 (0.0%) | 0 (0.0%) |
| 16 and 17 Years | 0 (0.0%) | 6 (100.0%) |
| 18 to 24 Years | 10 (100.0%) | 20 (74.1%) |
| 25 to 34 Years | 9 (75.0%) | 13 (72.2%) |
| 35 to 44 Years | 48 (100.0%) | 7 (41.2%) |
| 45 to 54 Years | 22 (100.0%) | 10 (100.0%) |
| 55 to 64 Years | 0 (0.0%) | 0 (0.0%) |
| 65 to 74 Years | 12 (60.0%) | 8 (100.0%) |
| 75 Years and over | 0 (0.0%) | 0 (0.0%) |
| Total | 176 (75.5%) | 80 (52.3%) |
Income Below Poverty Among Married-Couple Families in Azure
The poverty statistics for married-couple families in Azure show that 33.3% or 8 of the total 24 families live below the poverty line. Families with 5 or more children have the highest poverty rate of 100.0%, comprising of 8 families. On the other hand, families with no children have the lowest poverty rate of 0.0%, which includes 0 families.
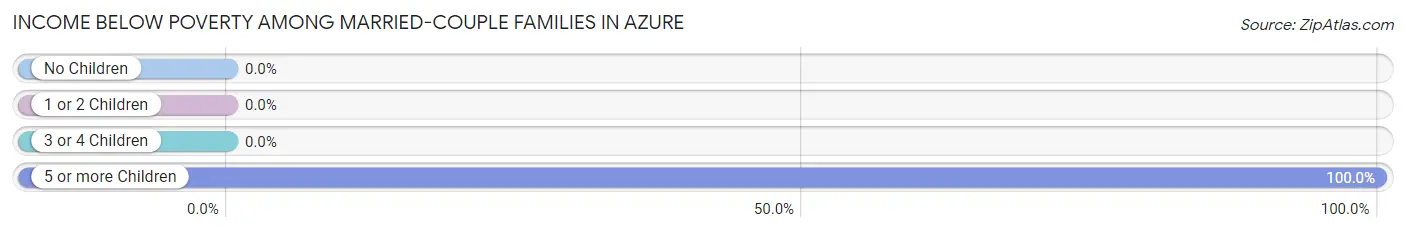
| Children | Above Poverty | Below Poverty |
| No Children | 16 (100.0%) | 0 (0.0%) |
| 1 or 2 Children | 0 (0.0%) | 0 (0.0%) |
| 3 or 4 Children | 0 (0.0%) | 0 (0.0%) |
| 5 or more Children | 0 (0.0%) | 8 (100.0%) |
| Total | 16 (66.7%) | 8 (33.3%) |
Income Below Poverty Among Single-Parent Households in Azure
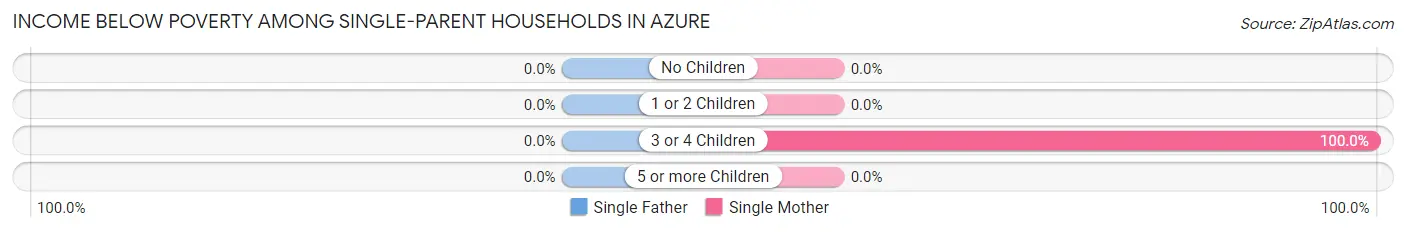
| Children | Single Father | Single Mother |
| No Children | 0 (0.0%) | 0 (0.0%) |
| 1 or 2 Children | 0 (0.0%) | 0 (0.0%) |
| 3 or 4 Children | 0 (0.0%) | 5 (100.0%) |
| 5 or more Children | 0 (0.0%) | 0 (0.0%) |
| Total | 0 (0.0%) | 5 (21.7%) |
Income Below Poverty Among Married-Couple vs Single-Parent Households in Azure
The poverty data for Azure shows that 8 of the married-couple family households (33.3%) and 5 of the single-parent households (7.9%) are living below the poverty level. Within the married-couple family households, those with 5 or more children have the highest poverty rate, with 8 households (100.0%) falling below the poverty line. Among the single-parent households, those with 3 or 4 children have the highest poverty rate, with 5 household (19.2%) living below poverty.
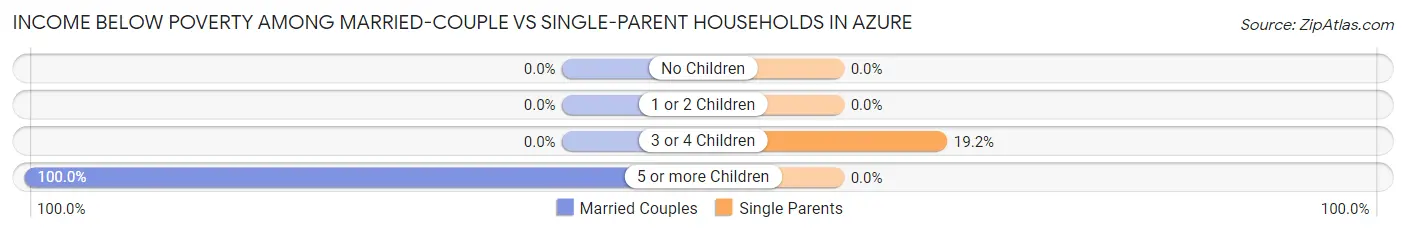
| Children | Married-Couple Families | Single-Parent Households |
| No Children | 0 (0.0%) | 0 (0.0%) |
| 1 or 2 Children | 0 (0.0%) | 0 (0.0%) |
| 3 or 4 Children | 0 (0.0%) | 5 (19.2%) |
| 5 or more Children | 8 (100.0%) | 0 (0.0%) |
| Total | 8 (33.3%) | 5 (7.9%) |
Race in Azure
The most populous races in Azure are , and Native / Alaskan (386 | 100.0%).
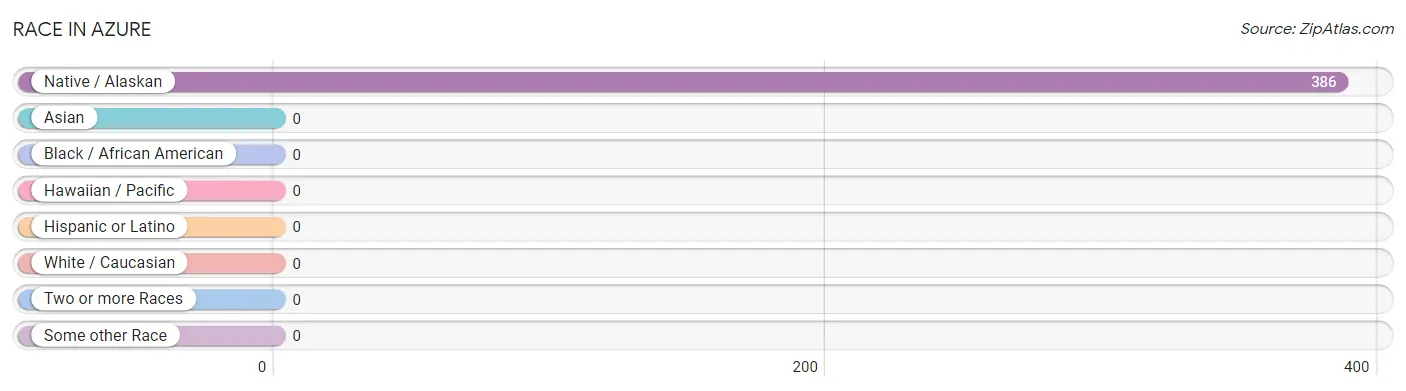
| Race | # Population | % Population |
| Asian | 0 | 0.0% |
| Black / African American | 0 | 0.0% |
| Hawaiian / Pacific | 0 | 0.0% |
| Hispanic or Latino | 0 | 0.0% |
| Native / Alaskan | 386 | 100.0% |
| White / Caucasian | 0 | 0.0% |
| Two or more Races | 0 | 0.0% |
| Some other Race | 0 | 0.0% |
| Total | 386 | 100.0% |
Ancestry in Azure
The most populous ancestries reported in Azure are Sioux (55 | 14.2%), and Cree (7 | 1.8%), together accounting for 16.1% of all Azure residents.
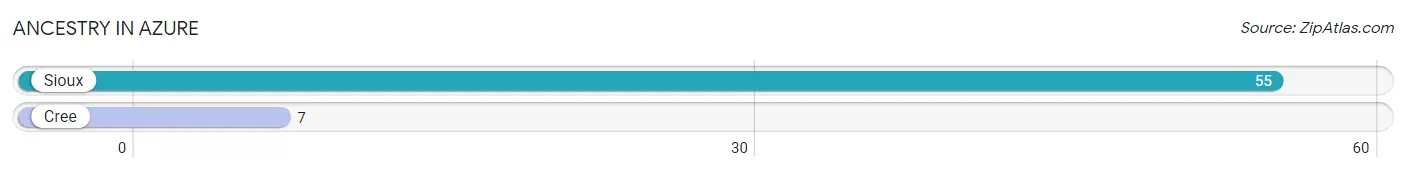
| Ancestry | # Population | % Population |
| Cree | 7 | 1.8% |
| Sioux | 55 | 14.2% | View All 2 Rows |
Immigrants in Azure

| Immigration Origin | # Population | % Population | View All 0 Rows |
Sex and Age in Azure
Sex and Age in Azure
The most populous age groups in Azure are 10 to 14 Years (56 | 24.0%) for men and 10 to 14 Years (27 | 17.6%) for women.
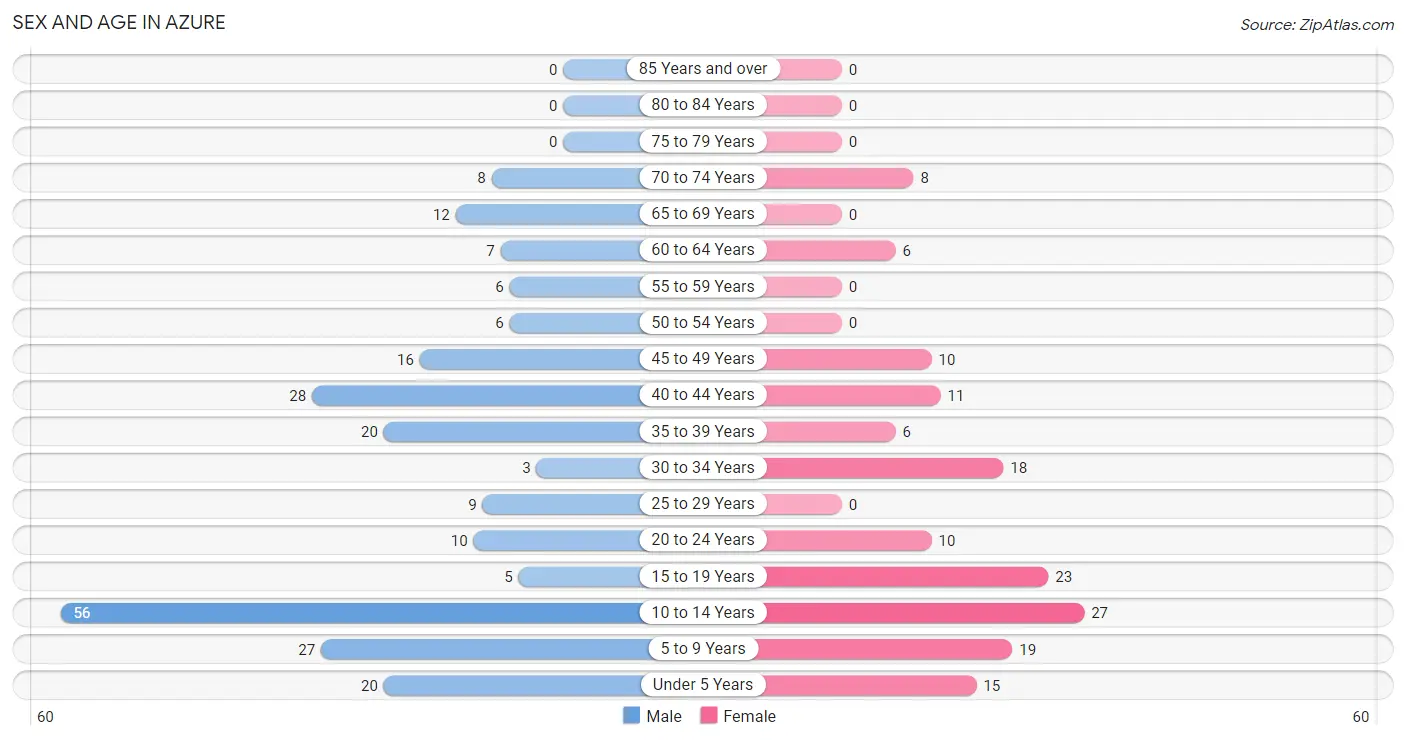
| Age Bracket | Male | Female |
| Under 5 Years | 20 (8.6%) | 15 (9.8%) |
| 5 to 9 Years | 27 (11.6%) | 19 (12.4%) |
| 10 to 14 Years | 56 (24.0%) | 27 (17.6%) |
| 15 to 19 Years | 5 (2.1%) | 23 (15.0%) |
| 20 to 24 Years | 10 (4.3%) | 10 (6.5%) |
| 25 to 29 Years | 9 (3.9%) | 0 (0.0%) |
| 30 to 34 Years | 3 (1.3%) | 18 (11.8%) |
| 35 to 39 Years | 20 (8.6%) | 6 (3.9%) |
| 40 to 44 Years | 28 (12.0%) | 11 (7.2%) |
| 45 to 49 Years | 16 (6.9%) | 10 (6.5%) |
| 50 to 54 Years | 6 (2.6%) | 0 (0.0%) |
| 55 to 59 Years | 6 (2.6%) | 0 (0.0%) |
| 60 to 64 Years | 7 (3.0%) | 6 (3.9%) |
| 65 to 69 Years | 12 (5.1%) | 0 (0.0%) |
| 70 to 74 Years | 8 (3.4%) | 8 (5.2%) |
| 75 to 79 Years | 0 (0.0%) | 0 (0.0%) |
| 80 to 84 Years | 0 (0.0%) | 0 (0.0%) |
| 85 Years and over | 0 (0.0%) | 0 (0.0%) |
| Total | 233 (100.0%) | 153 (100.0%) |
Families and Households in Azure
Median Family Size in Azure
The median family size in Azure is 4.24 persons per family, with single female/mother families (23 | 26.4%) accounting for the largest median family size of 4.78 persons per family. On the other hand, single male/father families (40 | 46.0%) represent the smallest median family size with 3.95 persons per family.
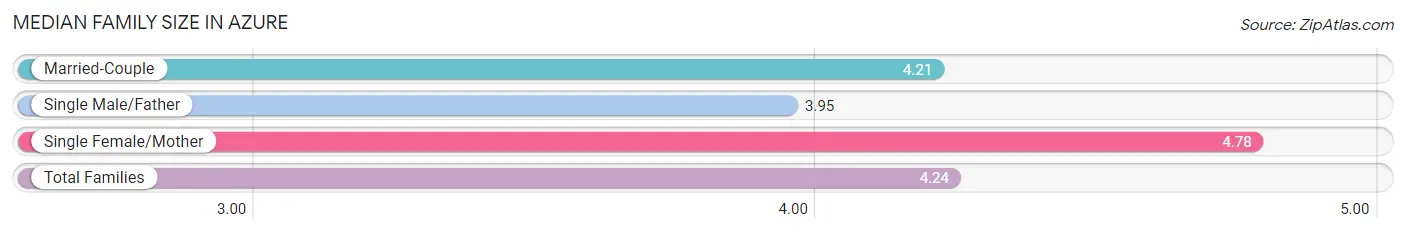
| Family Type | # Families | Family Size |
| Married-Couple | 24 (27.6%) | 4.21 |
| Single Male/Father | 40 (46.0%) | 3.95 |
| Single Female/Mother | 23 (26.4%) | 4.78 |
| Total Families | 87 (100.0%) | 4.24 |
Median Household Size in Azure
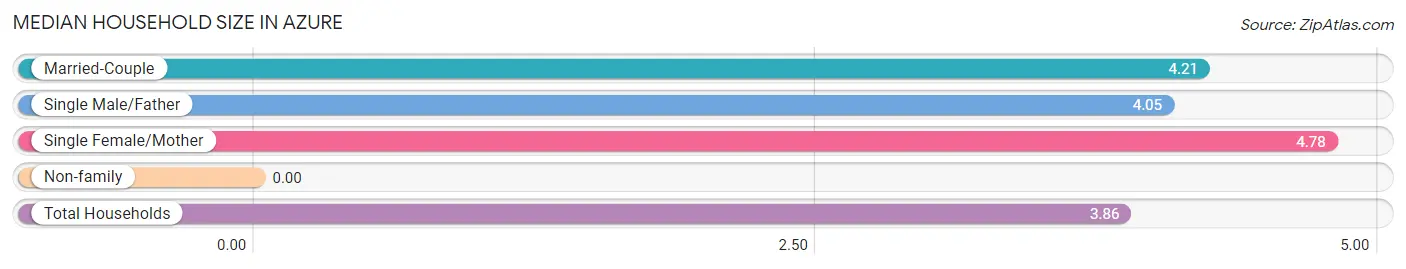
| Household Type | # Households | Household Size |
| Married-Couple | 24 (24.0%) | 4.21 |
| Single Male/Father | 40 (40.0%) | 4.05 |
| Single Female/Mother | 23 (23.0%) | 4.78 |
| Non-family | 13 (13.0%) | - |
| Total Households | 100 (100.0%) | 3.86 |
Household Size by Marriage Status in Azure
Out of a total of 100 households in Azure, 87 (87.0%) are family households, while 13 (13.0%) are nonfamily households. The most numerous type of family households are 2-person households, comprising 26, and the most common type of nonfamily households are 1-person households, comprising 13.
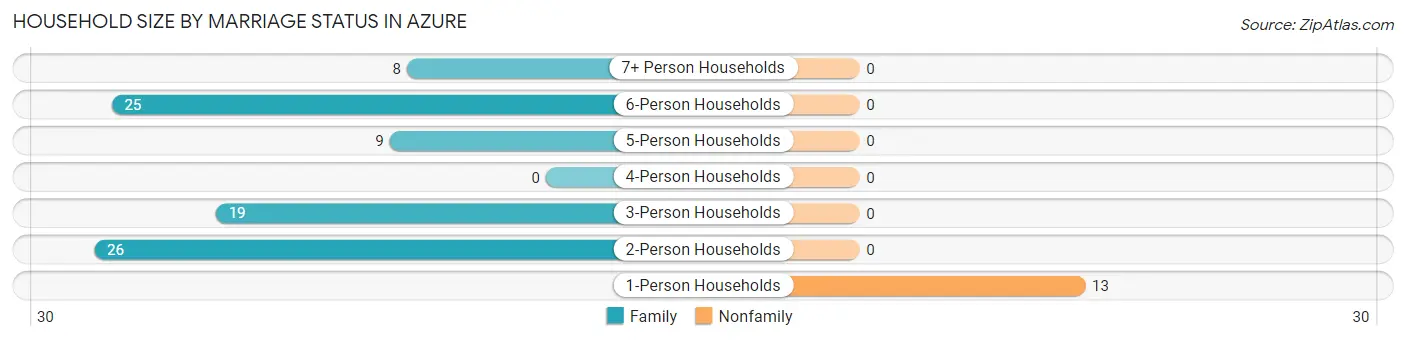
| Household Size | Family Households | Nonfamily Households |
| 1-Person Households | - | 13 (13.0%) |
| 2-Person Households | 26 (26.0%) | 0 (0.0%) |
| 3-Person Households | 19 (19.0%) | 0 (0.0%) |
| 4-Person Households | 0 (0.0%) | 0 (0.0%) |
| 5-Person Households | 9 (9.0%) | 0 (0.0%) |
| 6-Person Households | 25 (25.0%) | 0 (0.0%) |
| 7+ Person Households | 8 (8.0%) | 0 (0.0%) |
| Total | 87 (87.0%) | 13 (13.0%) |
Female Fertility in Azure
Fertility by Age in Azure
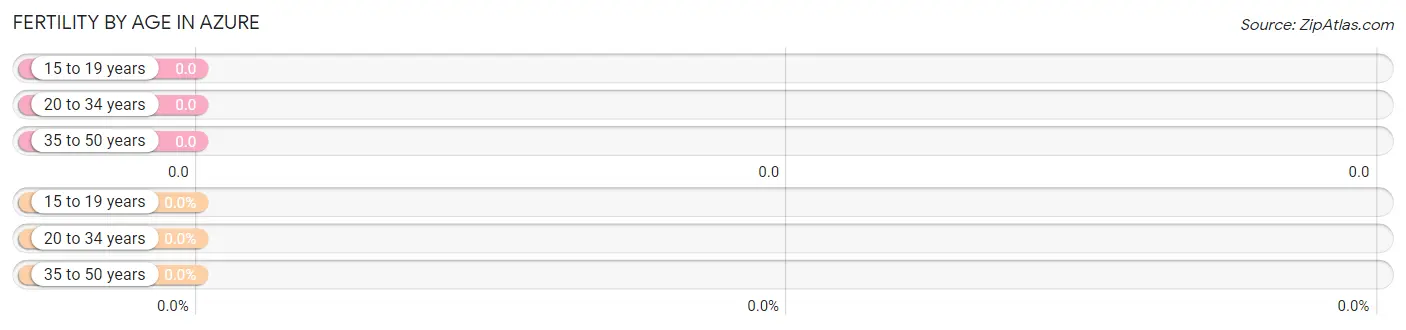
| Age Bracket | Women with Births | Births / 1,000 Women |
| 15 to 19 years | 0 (0.0%) | 0.0 |
| 20 to 34 years | 0 (0.0%) | 0.0 |
| 35 to 50 years | 0 (0.0%) | 0.0 |
| Total | 0 (0.0%) | 0.0 |
Fertility by Age by Marriage Status in Azure
| Age Bracket | Married | Unmarried |
| 15 to 19 years | 0 (0.0%) | 0 (0.0%) |
| 20 to 34 years | 0 (0.0%) | 0 (0.0%) |
| 35 to 50 years | 0 (0.0%) | 0 (0.0%) |
| Total | 0 (0.0%) | 0 (0.0%) |
Fertility by Education in Azure
| Educational Attainment | Women with Births | Births / 1,000 Women |
| Less than High School | 0 (0.0%) | 0.0 |
| High School Diploma | 0 (0.0%) | 0.0 |
| College or Associate's Degree | 0 (0.0%) | 0.0 |
| Bachelor's Degree | 0 (0.0%) | 0.0 |
| Graduate Degree | 0 (0.0%) | 0.0 |
| Total | 0 (0.0%) | 0.0 |
Fertility by Education by Marriage Status in Azure
| Educational Attainment | Married | Unmarried |
| Less than High School | 0 (0.0%) | 0 (0.0%) |
| High School Diploma | 0 (0.0%) | 0 (0.0%) |
| College or Associate's Degree | 0 (0.0%) | 0 (0.0%) |
| Bachelor's Degree | 0 (0.0%) | 0 (0.0%) |
| Graduate Degree | 0 (0.0%) | 0 (0.0%) |
| Total | 0 (0.0%) | 0 (0.0%) |
Employment Characteristics in Azure
Employment by Class of Employer in Azure
Among the 75 employed individuals in Azure, local government employees (33 | 44.0%), federal government employees (26 | 34.7%), and private company employees (16 | 21.3%) make up the most common classes of employment.
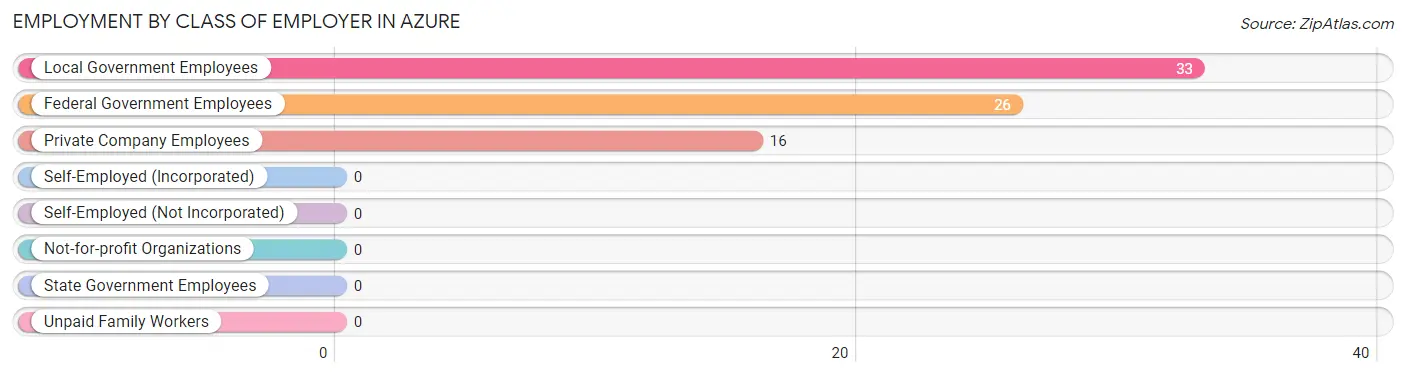
| Employer Class | # Employees | % Employees |
| Private Company Employees | 16 | 21.3% |
| Self-Employed (Incorporated) | 0 | 0.0% |
| Self-Employed (Not Incorporated) | 0 | 0.0% |
| Not-for-profit Organizations | 0 | 0.0% |
| Local Government Employees | 33 | 44.0% |
| State Government Employees | 0 | 0.0% |
| Federal Government Employees | 26 | 34.7% |
| Unpaid Family Workers | 0 | 0.0% |
| Total | 75 | 100.0% |
Employment Status by Age in Azure
According to the labor force statistics for Azure, out of the total population over 16 years of age (217), 49.8% or 108 individuals are in the labor force, with 30.6% or 33 of them unemployed. The age group with the highest labor force participation rate is 45 to 54 years, with 100.0% or 32 individuals in the labor force. Within the labor force, the 20 to 24 years age range has the highest percentage of unemployed individuals, with 100.0% or 10 of them being unemployed.
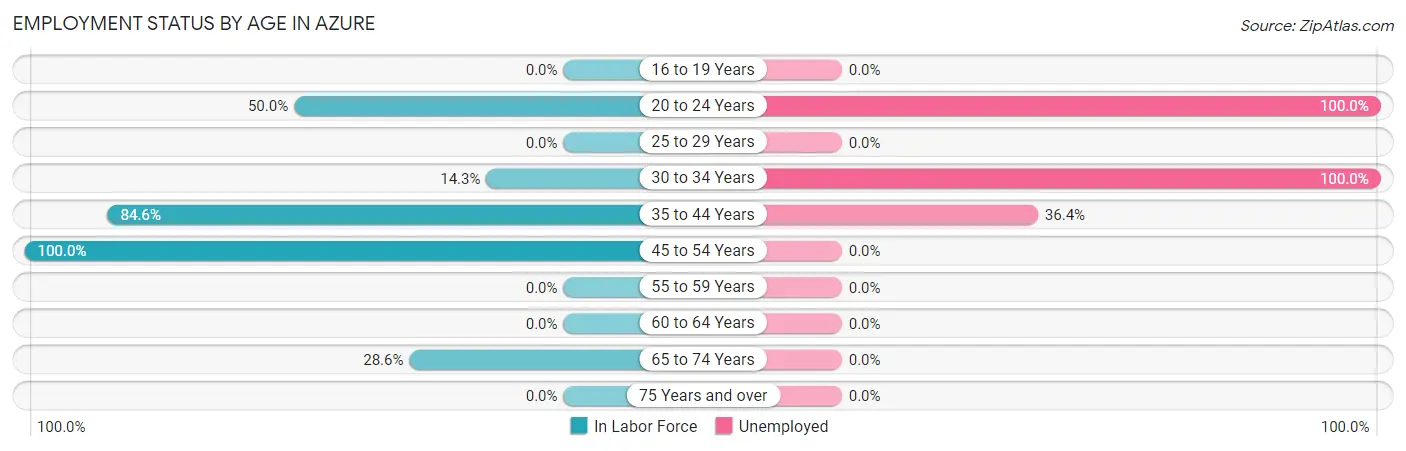
| Age Bracket | In Labor Force | Unemployed |
| 16 to 19 Years | 0 (0.0%) | 0 (0.0%) |
| 20 to 24 Years | 10 (50.0%) | 10 (100.0%) |
| 25 to 29 Years | 0 (0.0%) | 0 (0.0%) |
| 30 to 34 Years | 3 (14.3%) | 3 (100.0%) |
| 35 to 44 Years | 55 (84.6%) | 20 (36.4%) |
| 45 to 54 Years | 32 (100.0%) | 0 (0.0%) |
| 55 to 59 Years | 0 (0.0%) | 0 (0.0%) |
| 60 to 64 Years | 0 (0.0%) | 0 (0.0%) |
| 65 to 74 Years | 8 (28.6%) | 0 (0.0%) |
| 75 Years and over | 0 (0.0%) | 0 (0.0%) |
| Total | 108 (49.8%) | 33 (30.6%) |
Employment Status by Educational Attainment in Azure
According to labor force statistics for Azure, 61.6% of individuals (90) out of the total population between 25 and 64 years of age (146) are in the labor force, with 25.6% or 23 of them being unemployed. The group with the highest labor force participation rate are those with the educational attainment of college / associate degree, with 80.4% or 45 individuals in the labor force. Within the labor force, individuals with college / associate degree education have the highest percentage of unemployment, with 44.4% or 20 of them being unemployed.
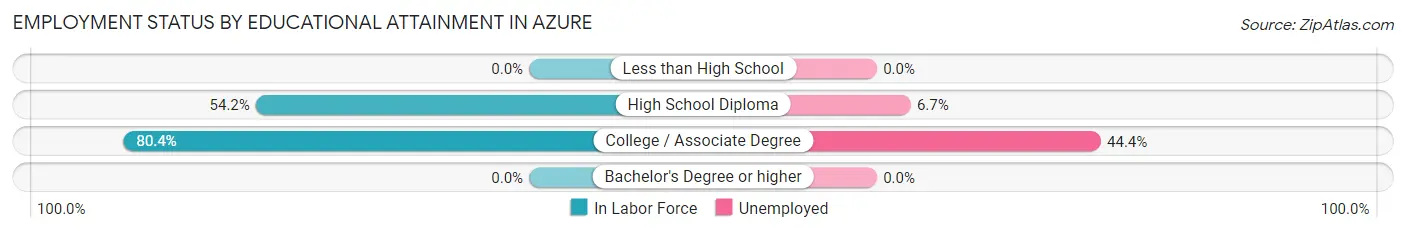
| Educational Attainment | In Labor Force | Unemployed |
| Less than High School | 0 (0.0%) | 0 (0.0%) |
| High School Diploma | 45 (54.2%) | 6 (6.7%) |
| College / Associate Degree | 45 (80.4%) | 25 (44.4%) |
| Bachelor's Degree or higher | 0 (0.0%) | 0 (0.0%) |
| Total | 90 (61.6%) | 37 (25.6%) |
Employment Occupations by Sex in Azure
Management, Business, Science and Arts Occupations
The most common Management, Business, Science and Arts occupations in Azure are Community & Social Service (16 | 21.3%), Education, Arts & Media (16 | 21.3%), and Management (8 | 10.7%).
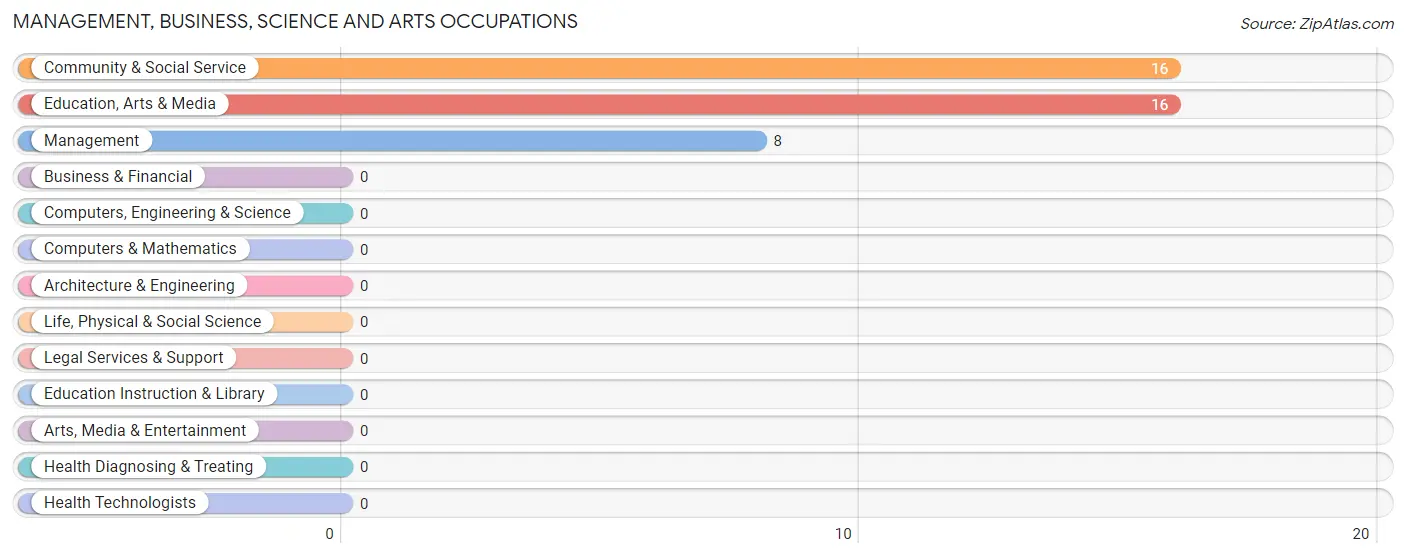
Management, Business, Science and Arts Occupations by Sex
Within the Management, Business, Science and Arts occupations in Azure, the most male-oriented occupations are Community & Social Service (37.5%), and Education, Arts & Media (37.5%), while the most female-oriented occupations are Management (100.0%), Community & Social Service (62.5%), and Education, Arts & Media (62.5%).
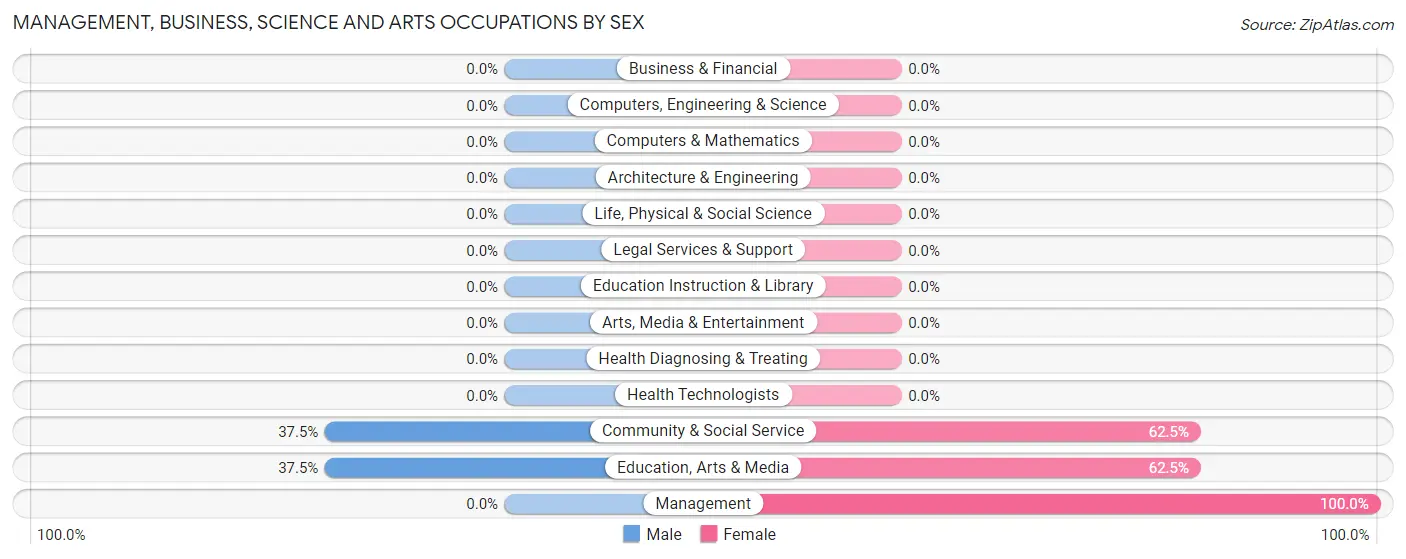
| Occupation | Male | Female |
| Management | 0 (0.0%) | 8 (100.0%) |
| Business & Financial | 0 (0.0%) | 0 (0.0%) |
| Computers, Engineering & Science | 0 (0.0%) | 0 (0.0%) |
| Computers & Mathematics | 0 (0.0%) | 0 (0.0%) |
| Architecture & Engineering | 0 (0.0%) | 0 (0.0%) |
| Life, Physical & Social Science | 0 (0.0%) | 0 (0.0%) |
| Community & Social Service | 6 (37.5%) | 10 (62.5%) |
| Education, Arts & Media | 6 (37.5%) | 10 (62.5%) |
| Legal Services & Support | 0 (0.0%) | 0 (0.0%) |
| Education Instruction & Library | 0 (0.0%) | 0 (0.0%) |
| Arts, Media & Entertainment | 0 (0.0%) | 0 (0.0%) |
| Health Diagnosing & Treating | 0 (0.0%) | 0 (0.0%) |
| Health Technologists | 0 (0.0%) | 0 (0.0%) |
| Total (Category) | 6 (25.0%) | 18 (75.0%) |
| Total (Overall) | 50 (66.7%) | 25 (33.3%) |
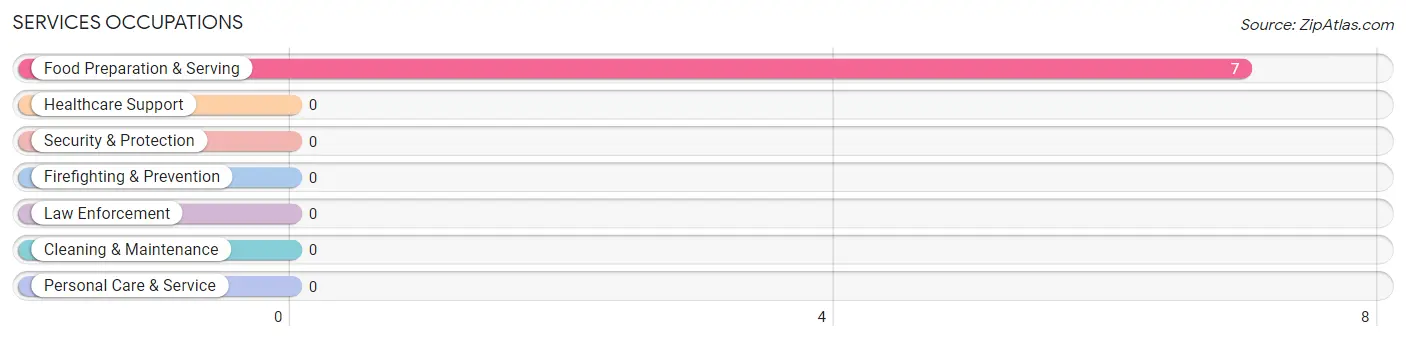
Services Occupations
The most common Services occupations in Azure are , and Food Preparation & Serving (7 | 9.3%).
Services Occupations by Sex
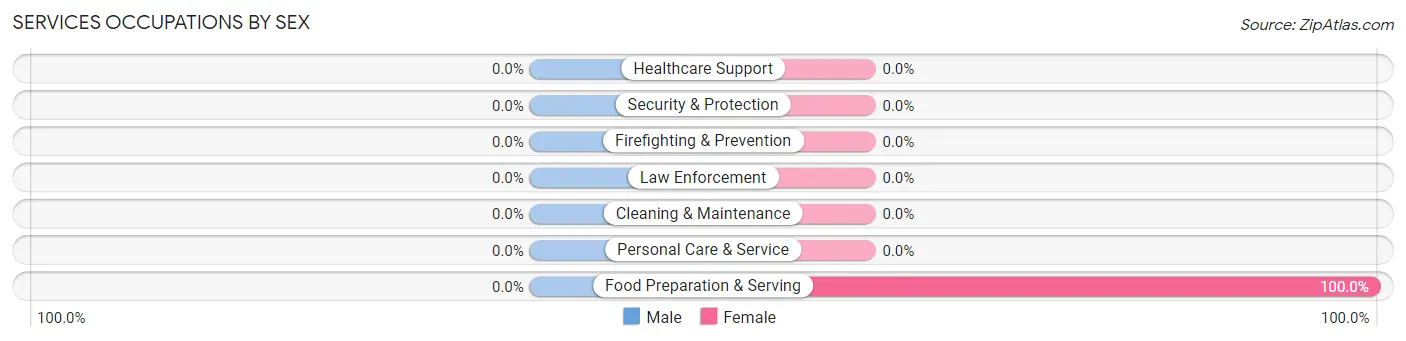
| Occupation | Male | Female |
| Healthcare Support | 0 (0.0%) | 0 (0.0%) |
| Security & Protection | 0 (0.0%) | 0 (0.0%) |
| Firefighting & Prevention | 0 (0.0%) | 0 (0.0%) |
| Law Enforcement | 0 (0.0%) | 0 (0.0%) |
| Food Preparation & Serving | 0 (0.0%) | 7 (100.0%) |
| Cleaning & Maintenance | 0 (0.0%) | 0 (0.0%) |
| Personal Care & Service | 0 (0.0%) | 0 (0.0%) |
| Total (Category) | 0 (0.0%) | 7 (100.0%) |
| Total (Overall) | 50 (66.7%) | 25 (33.3%) |
Sales and Office Occupations
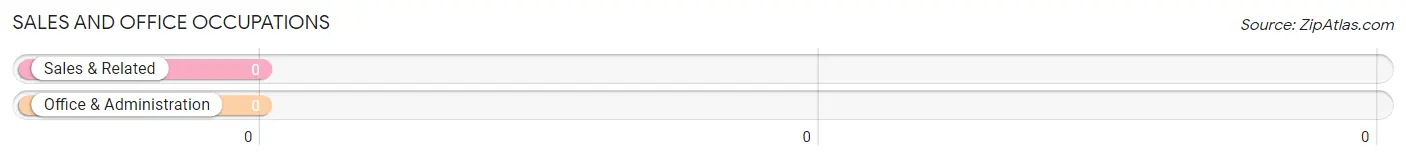
Sales and Office Occupations by Sex
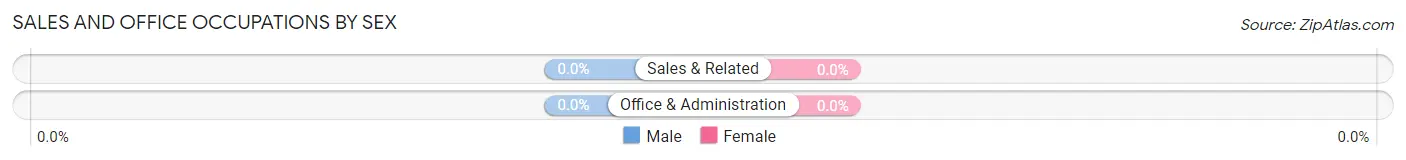
| Occupation | Male | Female |
| Sales & Related | 0 (0.0%) | 0 (0.0%) |
| Office & Administration | 0 (0.0%) | 0 (0.0%) |
| Total (Category) | 0 (0.0%) | 0 (0.0%) |
| Total (Overall) | 50 (66.7%) | 25 (33.3%) |
Natural Resources, Construction and Maintenance Occupations
The most common Natural Resources, Construction and Maintenance occupations in Azure are Construction & Extraction (19 | 25.3%), and Installation, Maintenance & Repair (16 | 21.3%).
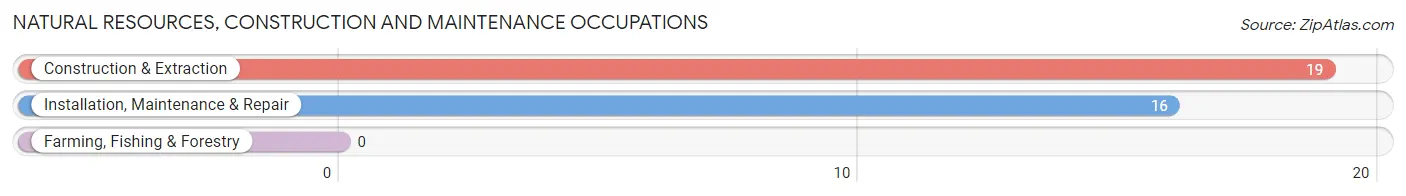
Natural Resources, Construction and Maintenance Occupations by Sex
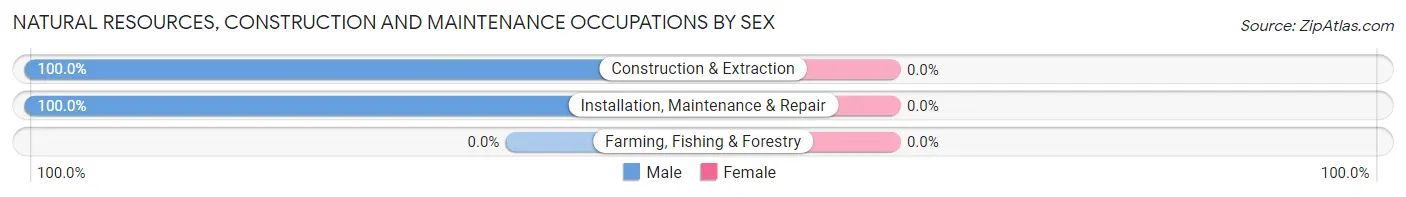
| Occupation | Male | Female |
| Farming, Fishing & Forestry | 0 (0.0%) | 0 (0.0%) |
| Construction & Extraction | 19 (100.0%) | 0 (0.0%) |
| Installation, Maintenance & Repair | 16 (100.0%) | 0 (0.0%) |
| Total (Category) | 35 (100.0%) | 0 (0.0%) |
| Total (Overall) | 50 (66.7%) | 25 (33.3%) |
Production, Transportation and Moving Occupations
The most common Production, Transportation and Moving occupations in Azure are , and Production (9 | 12.0%).
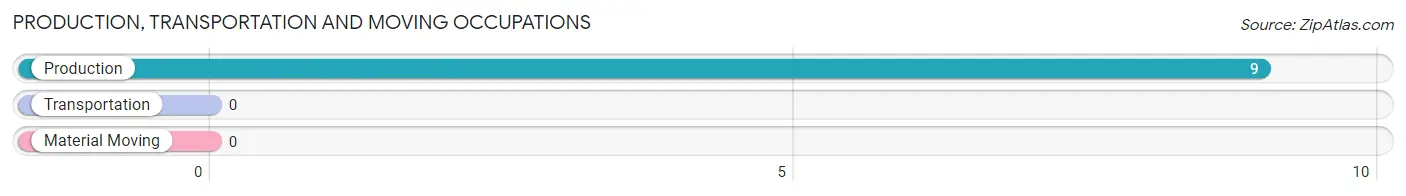
Production, Transportation and Moving Occupations by Sex
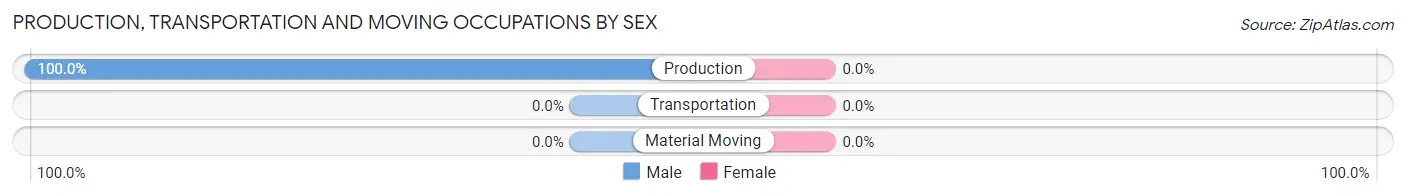
| Occupation | Male | Female |
| Production | 9 (100.0%) | 0 (0.0%) |
| Transportation | 0 (0.0%) | 0 (0.0%) |
| Material Moving | 0 (0.0%) | 0 (0.0%) |
| Total (Category) | 9 (100.0%) | 0 (0.0%) |
| Total (Overall) | 50 (66.7%) | 25 (33.3%) |
Employment Industries by Sex in Azure
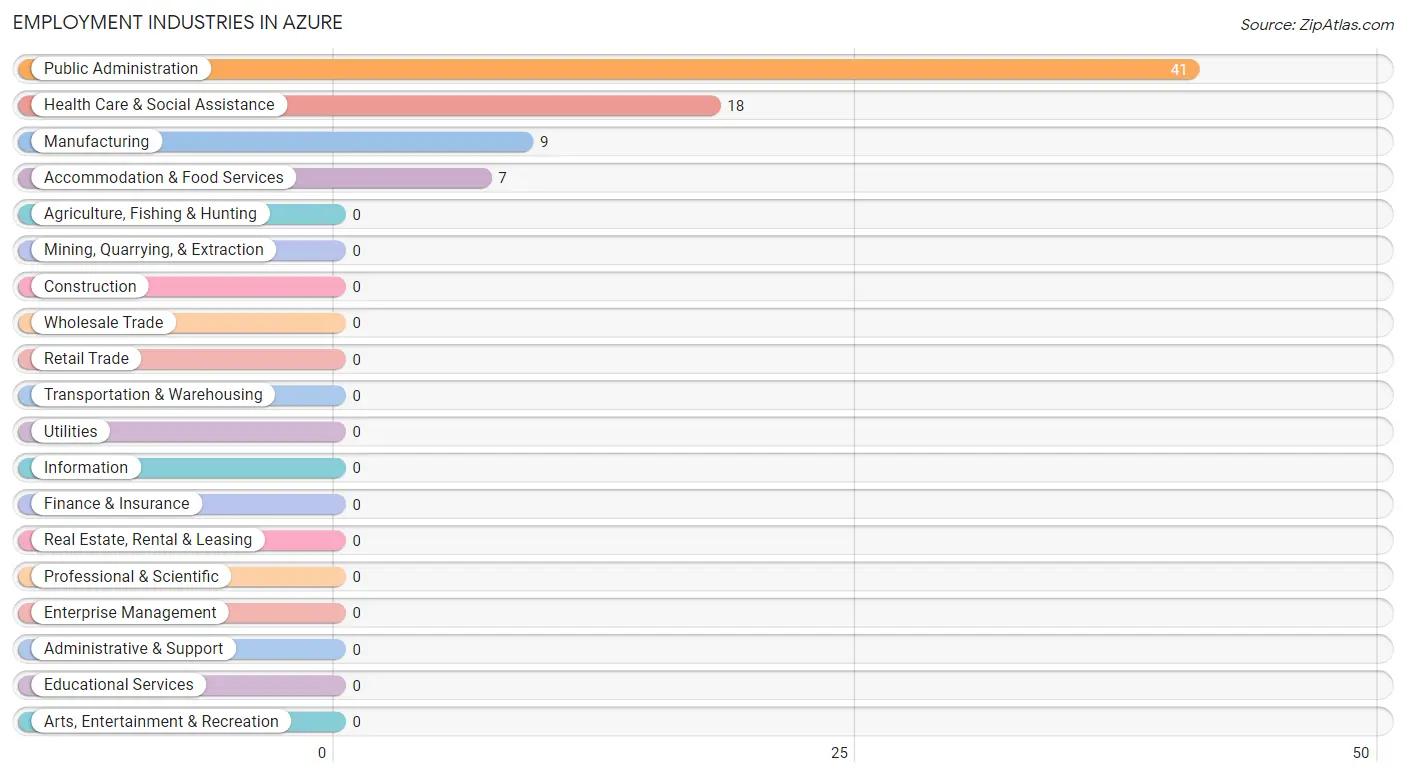
Employment Industries in Azure
The major employment industries in Azure include Public Administration (41 | 54.7%), Health Care & Social Assistance (18 | 24.0%), Manufacturing (9 | 12.0%), and Accommodation & Food Services (7 | 9.3%).
Employment Industries by Sex in Azure
The Azure industries that see more men than women are Manufacturing (100.0%), and Public Administration (100.0%), whereas the industries that tend to have a higher number of women are Health Care & Social Assistance (100.0%), and Accommodation & Food Services (100.0%).
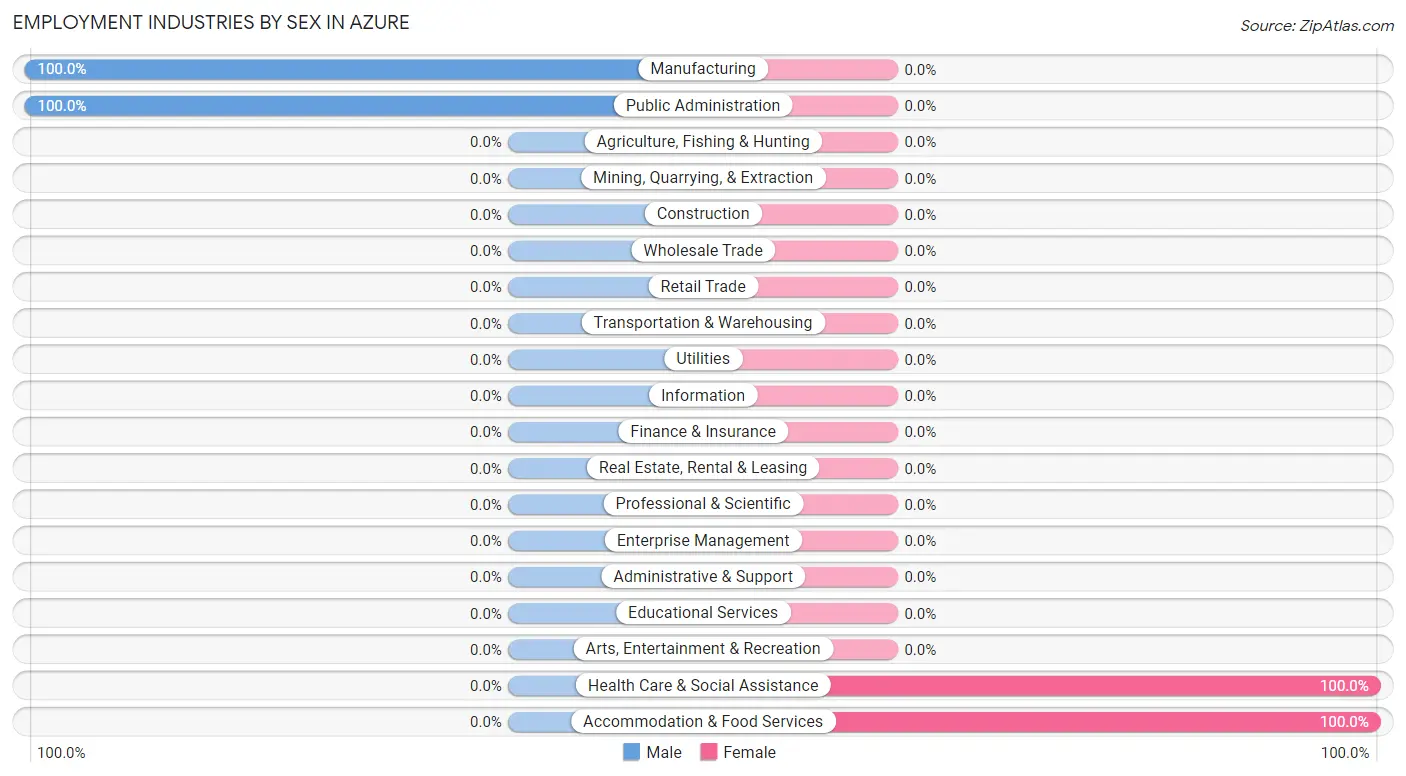
| Industry | Male | Female |
| Agriculture, Fishing & Hunting | 0 (0.0%) | 0 (0.0%) |
| Mining, Quarrying, & Extraction | 0 (0.0%) | 0 (0.0%) |
| Construction | 0 (0.0%) | 0 (0.0%) |
| Manufacturing | 9 (100.0%) | 0 (0.0%) |
| Wholesale Trade | 0 (0.0%) | 0 (0.0%) |
| Retail Trade | 0 (0.0%) | 0 (0.0%) |
| Transportation & Warehousing | 0 (0.0%) | 0 (0.0%) |
| Utilities | 0 (0.0%) | 0 (0.0%) |
| Information | 0 (0.0%) | 0 (0.0%) |
| Finance & Insurance | 0 (0.0%) | 0 (0.0%) |
| Real Estate, Rental & Leasing | 0 (0.0%) | 0 (0.0%) |
| Professional & Scientific | 0 (0.0%) | 0 (0.0%) |
| Enterprise Management | 0 (0.0%) | 0 (0.0%) |
| Administrative & Support | 0 (0.0%) | 0 (0.0%) |
| Educational Services | 0 (0.0%) | 0 (0.0%) |
| Health Care & Social Assistance | 0 (0.0%) | 18 (100.0%) |
| Arts, Entertainment & Recreation | 0 (0.0%) | 0 (0.0%) |
| Accommodation & Food Services | 0 (0.0%) | 7 (100.0%) |
| Public Administration | 41 (100.0%) | 0 (0.0%) |
| Total | 50 (66.7%) | 25 (33.3%) |
Education in Azure
School Enrollment in Azure
The most common levels of schooling among the 133 students in Azure are middle school (48 | 36.1%), elementary school (42 | 31.6%), and high school (37 | 27.8%).
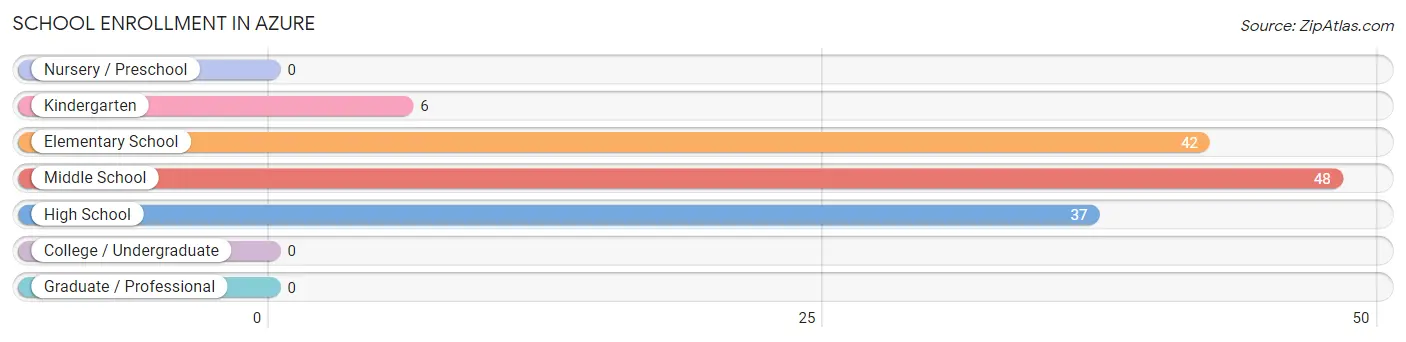
| School Level | # Students | % Students |
| Nursery / Preschool | 0 | 0.0% |
| Kindergarten | 6 | 4.5% |
| Elementary School | 42 | 31.6% |
| Middle School | 48 | 36.1% |
| High School | 37 | 27.8% |
| College / Undergraduate | 0 | 0.0% |
| Graduate / Professional | 0 | 0.0% |
| Total | 133 | 100.0% |
School Enrollment by Age by Funding Source in Azure
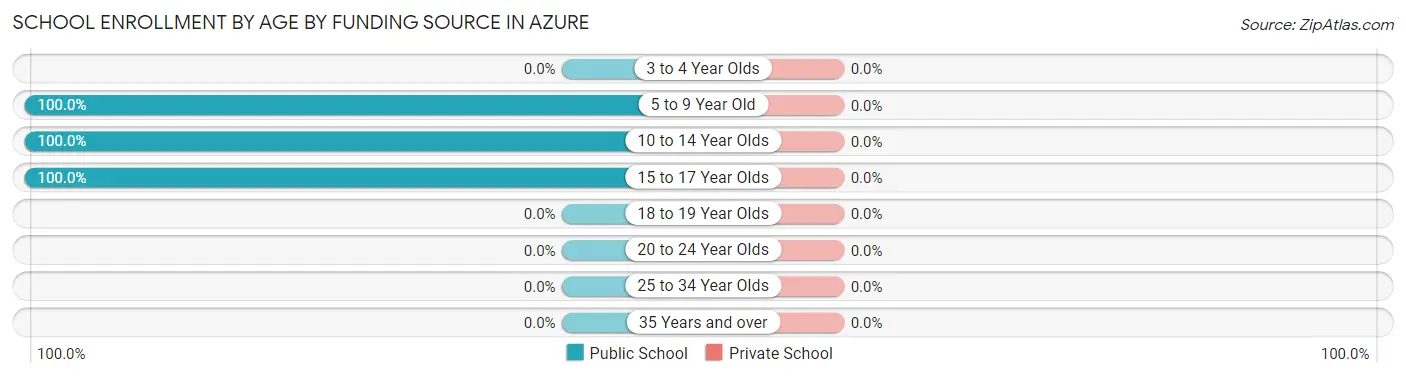
| Age Bracket | Public School | Private School |
| 3 to 4 Year Olds | 0 (0.0%) | 0 (0.0%) |
| 5 to 9 Year Old | 39 (100.0%) | 0 (0.0%) |
| 10 to 14 Year Olds | 83 (100.0%) | 0 (0.0%) |
| 15 to 17 Year Olds | 11 (100.0%) | 0 (0.0%) |
| 18 to 19 Year Olds | 0 (0.0%) | 0 (0.0%) |
| 20 to 24 Year Olds | 0 (0.0%) | 0 (0.0%) |
| 25 to 34 Year Olds | 0 (0.0%) | 0 (0.0%) |
| 35 Years and over | 0 (0.0%) | 0 (0.0%) |
| Total | 133 (100.0%) | 0 (0.0%) |
Educational Attainment by Field of Study in Azure
, and education (8 | 100.0%) are the most common fields of study among 8 individuals in Azure who have obtained a bachelor's degree or higher.
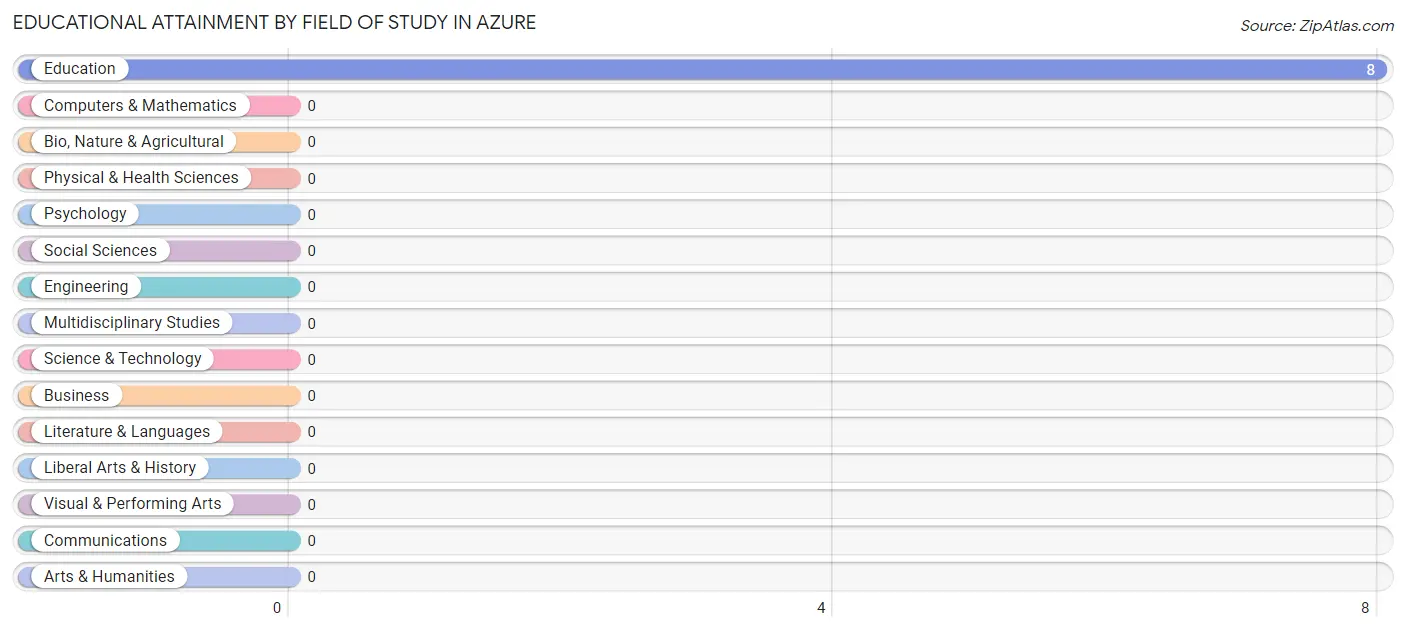
| Field of Study | # Graduates | % Graduates |
| Computers & Mathematics | 0 | 0.0% |
| Bio, Nature & Agricultural | 0 | 0.0% |
| Physical & Health Sciences | 0 | 0.0% |
| Psychology | 0 | 0.0% |
| Social Sciences | 0 | 0.0% |
| Engineering | 0 | 0.0% |
| Multidisciplinary Studies | 0 | 0.0% |
| Science & Technology | 0 | 0.0% |
| Business | 0 | 0.0% |
| Education | 8 | 100.0% |
| Literature & Languages | 0 | 0.0% |
| Liberal Arts & History | 0 | 0.0% |
| Visual & Performing Arts | 0 | 0.0% |
| Communications | 0 | 0.0% |
| Arts & Humanities | 0 | 0.0% |
| Total | 8 | 100.0% |
Transportation & Commute in Azure
Vehicle Availability by Sex in Azure
The most prevalent vehicle ownership categories in Azure are males with 1 vehicle (19, accounting for 38.0%) and females with 1 vehicle (10, making up 76.0%).
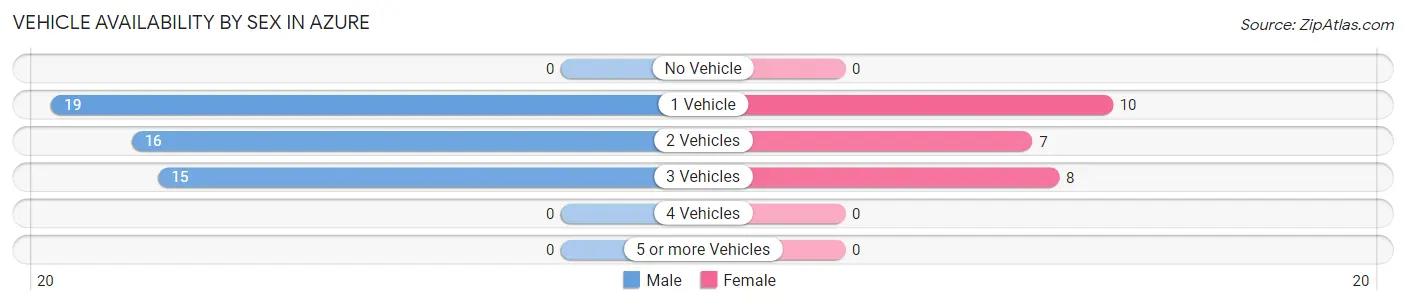
| Vehicles Available | Male | Female |
| No Vehicle | 0 (0.0%) | 0 (0.0%) |
| 1 Vehicle | 19 (38.0%) | 10 (40.0%) |
| 2 Vehicles | 16 (32.0%) | 7 (28.0%) |
| 3 Vehicles | 15 (30.0%) | 8 (32.0%) |
| 4 Vehicles | 0 (0.0%) | 0 (0.0%) |
| 5 or more Vehicles | 0 (0.0%) | 0 (0.0%) |
| Total | 50 (100.0%) | 25 (100.0%) |
Commute Time in Azure
The most frequently occuring commute durations in Azure are 15 to 19 minutes (35 commuters, 46.7%), 10 to 14 minutes (23 commuters, 30.7%), and 20 to 24 minutes (17 commuters, 22.7%).
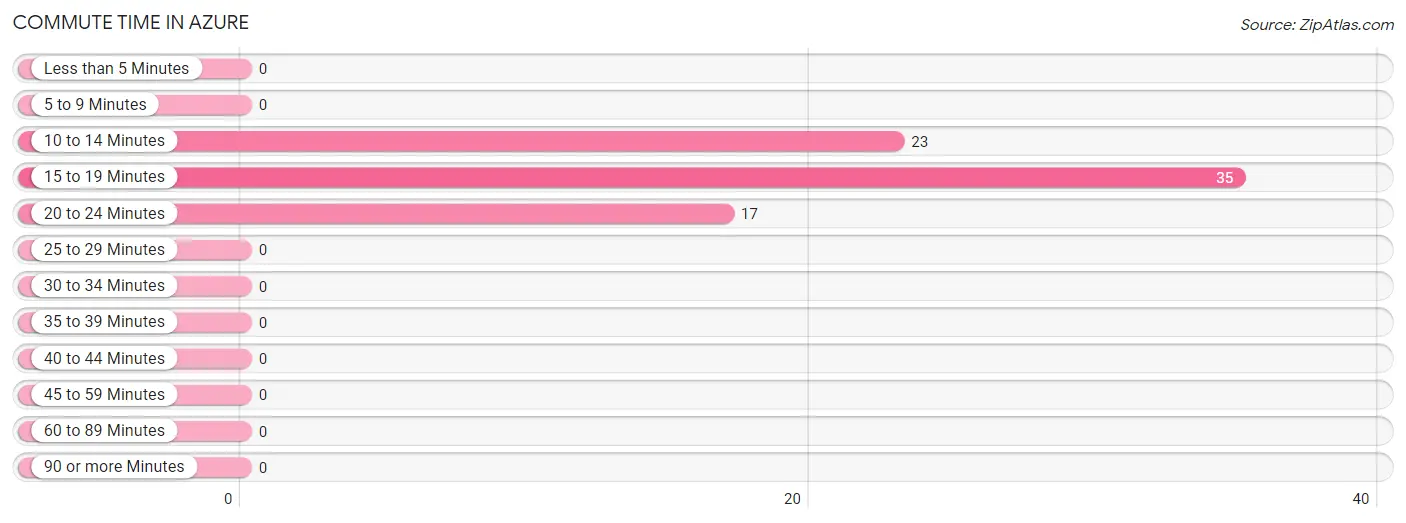
| Commute Time | # Commuters | % Commuters |
| Less than 5 Minutes | 0 | 0.0% |
| 5 to 9 Minutes | 0 | 0.0% |
| 10 to 14 Minutes | 23 | 30.7% |
| 15 to 19 Minutes | 35 | 46.7% |
| 20 to 24 Minutes | 17 | 22.7% |
| 25 to 29 Minutes | 0 | 0.0% |
| 30 to 34 Minutes | 0 | 0.0% |
| 35 to 39 Minutes | 0 | 0.0% |
| 40 to 44 Minutes | 0 | 0.0% |
| 45 to 59 Minutes | 0 | 0.0% |
| 60 to 89 Minutes | 0 | 0.0% |
| 90 or more Minutes | 0 | 0.0% |
Commute Time by Sex in Azure
The most common commute times in Azure are 15 to 19 minutes (25 commuters, 50.0%) for males and 15 to 19 minutes (10 commuters, 40.0%) for females.
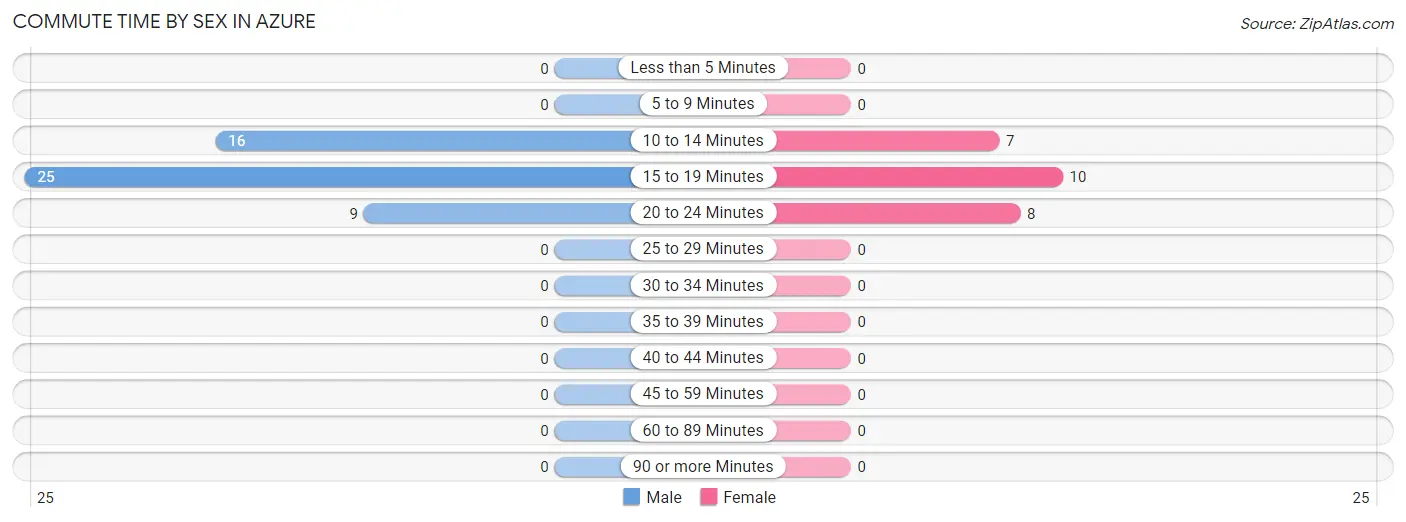
| Commute Time | Male | Female |
| Less than 5 Minutes | 0 (0.0%) | 0 (0.0%) |
| 5 to 9 Minutes | 0 (0.0%) | 0 (0.0%) |
| 10 to 14 Minutes | 16 (32.0%) | 7 (28.0%) |
| 15 to 19 Minutes | 25 (50.0%) | 10 (40.0%) |
| 20 to 24 Minutes | 9 (18.0%) | 8 (32.0%) |
| 25 to 29 Minutes | 0 (0.0%) | 0 (0.0%) |
| 30 to 34 Minutes | 0 (0.0%) | 0 (0.0%) |
| 35 to 39 Minutes | 0 (0.0%) | 0 (0.0%) |
| 40 to 44 Minutes | 0 (0.0%) | 0 (0.0%) |
| 45 to 59 Minutes | 0 (0.0%) | 0 (0.0%) |
| 60 to 89 Minutes | 0 (0.0%) | 0 (0.0%) |
| 90 or more Minutes | 0 (0.0%) | 0 (0.0%) |
Time of Departure to Work by Sex in Azure
The most frequent times of departure to work in Azure are 9:00 AM to 9:59 AM (25, 50.0%) for males and 7:30 AM to 7:59 AM (18, 72.0%) for females.
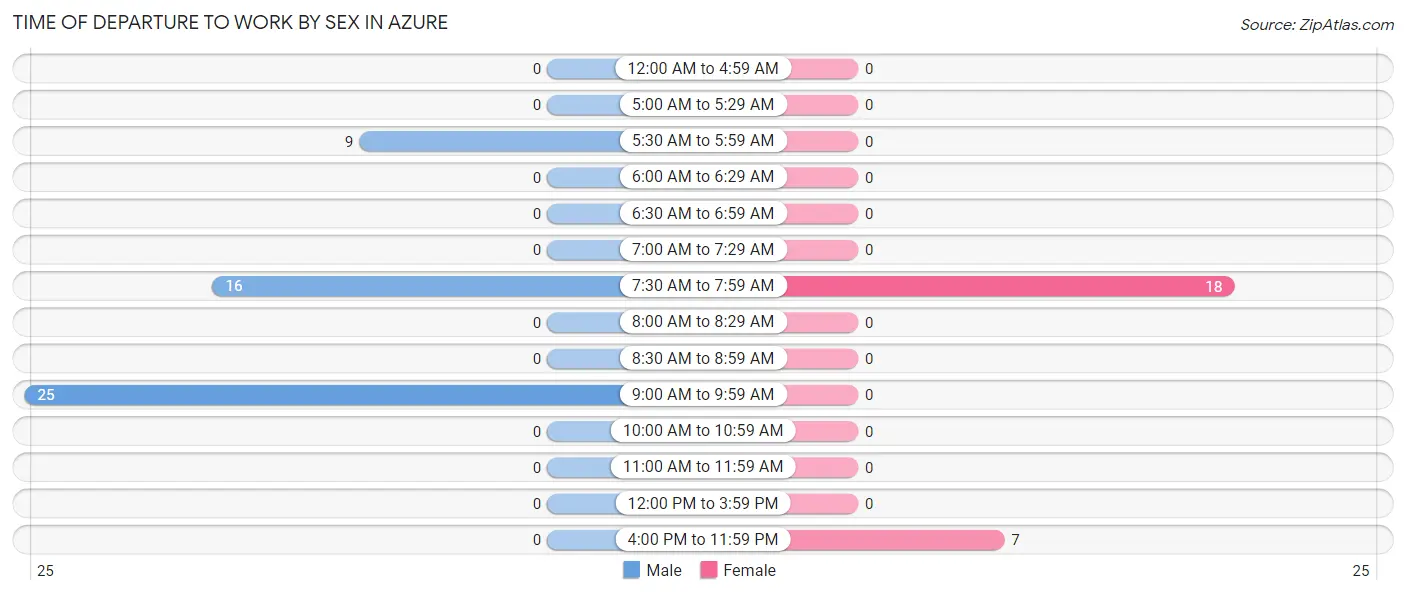
| Time of Departure | Male | Female |
| 12:00 AM to 4:59 AM | 0 (0.0%) | 0 (0.0%) |
| 5:00 AM to 5:29 AM | 0 (0.0%) | 0 (0.0%) |
| 5:30 AM to 5:59 AM | 9 (18.0%) | 0 (0.0%) |
| 6:00 AM to 6:29 AM | 0 (0.0%) | 0 (0.0%) |
| 6:30 AM to 6:59 AM | 0 (0.0%) | 0 (0.0%) |
| 7:00 AM to 7:29 AM | 0 (0.0%) | 0 (0.0%) |
| 7:30 AM to 7:59 AM | 16 (32.0%) | 18 (72.0%) |
| 8:00 AM to 8:29 AM | 0 (0.0%) | 0 (0.0%) |
| 8:30 AM to 8:59 AM | 0 (0.0%) | 0 (0.0%) |
| 9:00 AM to 9:59 AM | 25 (50.0%) | 0 (0.0%) |
| 10:00 AM to 10:59 AM | 0 (0.0%) | 0 (0.0%) |
| 11:00 AM to 11:59 AM | 0 (0.0%) | 0 (0.0%) |
| 12:00 PM to 3:59 PM | 0 (0.0%) | 0 (0.0%) |
| 4:00 PM to 11:59 PM | 0 (0.0%) | 7 (28.0%) |
| Total | 50 (100.0%) | 25 (100.0%) |
Housing Occupancy in Azure
Occupancy by Ownership in Azure
Of the total 100 dwellings in Azure, owner-occupied units account for 43 (43.0%), while renter-occupied units make up 57 (57.0%).
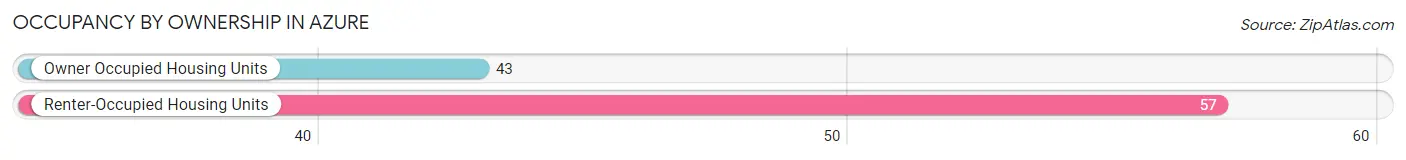
| Occupancy | # Housing Units | % Housing Units |
| Owner Occupied Housing Units | 43 | 43.0% |
| Renter-Occupied Housing Units | 57 | 57.0% |
| Total Occupied Housing Units | 100 | 100.0% |
Occupancy by Household Size in Azure
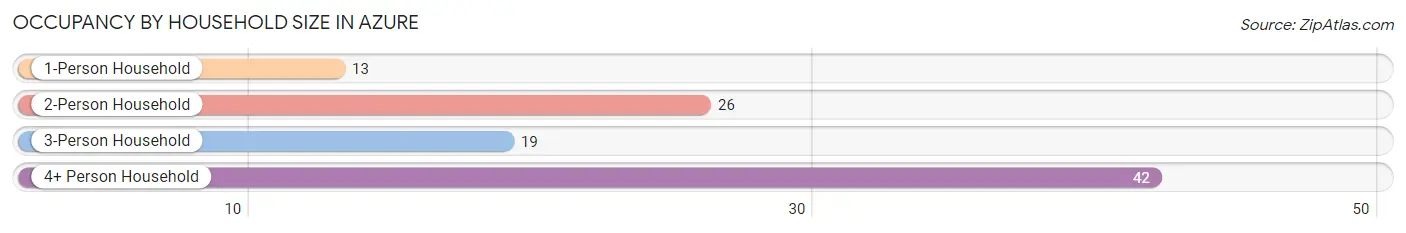
| Household Size | # Housing Units | % Housing Units |
| 1-Person Household | 13 | 13.0% |
| 2-Person Household | 26 | 26.0% |
| 3-Person Household | 19 | 19.0% |
| 4+ Person Household | 42 | 42.0% |
| Total Housing Units | 100 | 100.0% |
Occupancy by Ownership by Household Size in Azure
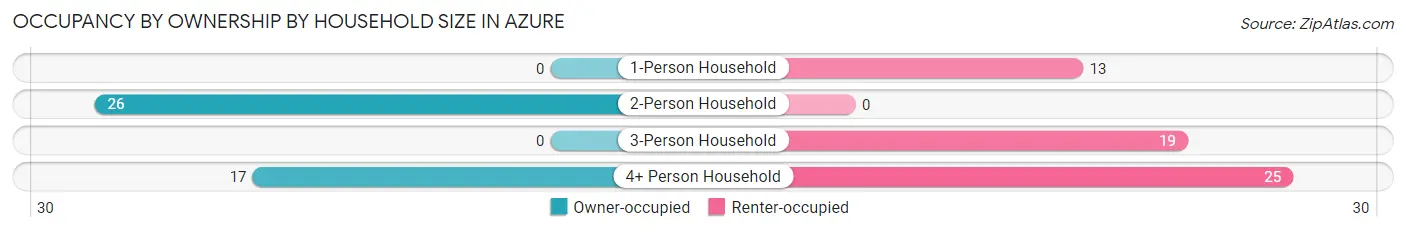
| Household Size | Owner-occupied | Renter-occupied |
| 1-Person Household | 0 (0.0%) | 13 (100.0%) |
| 2-Person Household | 26 (100.0%) | 0 (0.0%) |
| 3-Person Household | 0 (0.0%) | 19 (100.0%) |
| 4+ Person Household | 17 (40.5%) | 25 (59.5%) |
| Total Housing Units | 43 (43.0%) | 57 (57.0%) |
Occupancy by Educational Attainment in Azure
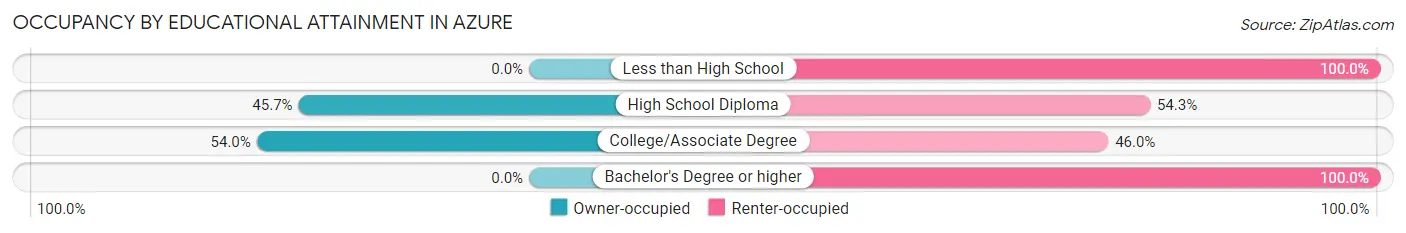
| Household Size | Owner-occupied | Renter-occupied |
| Less than High School | 0 (0.0%) | 7 (100.0%) |
| High School Diploma | 16 (45.7%) | 19 (54.3%) |
| College/Associate Degree | 27 (54.0%) | 23 (46.0%) |
| Bachelor's Degree or higher | 0 (0.0%) | 8 (100.0%) |
Occupancy by Age of Householder in Azure
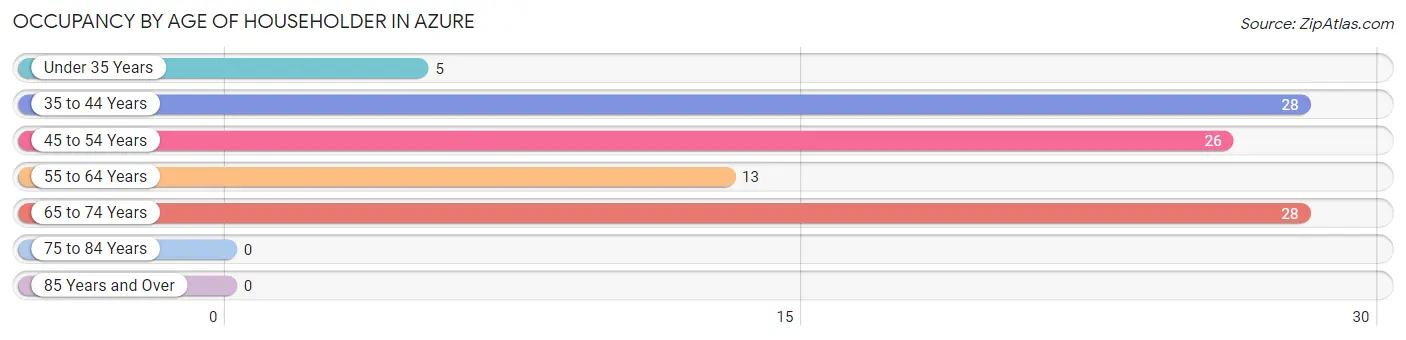
| Age Bracket | # Households | % Households |
| Under 35 Years | 5 | 5.0% |
| 35 to 44 Years | 28 | 28.0% |
| 45 to 54 Years | 26 | 26.0% |
| 55 to 64 Years | 13 | 13.0% |
| 65 to 74 Years | 28 | 28.0% |
| 75 to 84 Years | 0 | 0.0% |
| 85 Years and Over | 0 | 0.0% |
| Total | 100 | 100.0% |
Housing Finances in Azure
Median Income by Occupancy in Azure
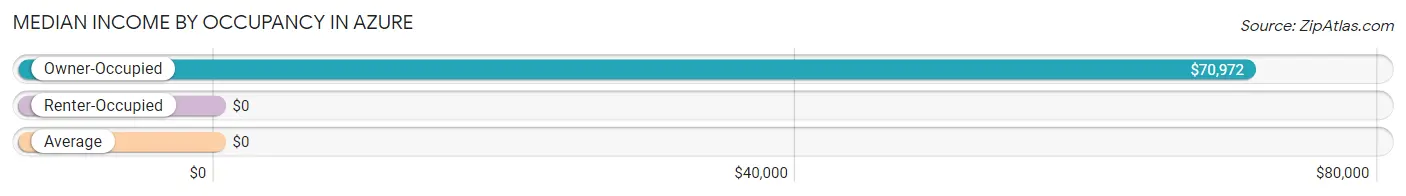
| Occupancy Type | # Households | Median Income |
| Owner-Occupied | 43 (43.0%) | $70,972 |
| Renter-Occupied | 57 (57.0%) | $0 |
| Average | 100 (100.0%) | $0 |
Occupancy by Householder Income Bracket in Azure
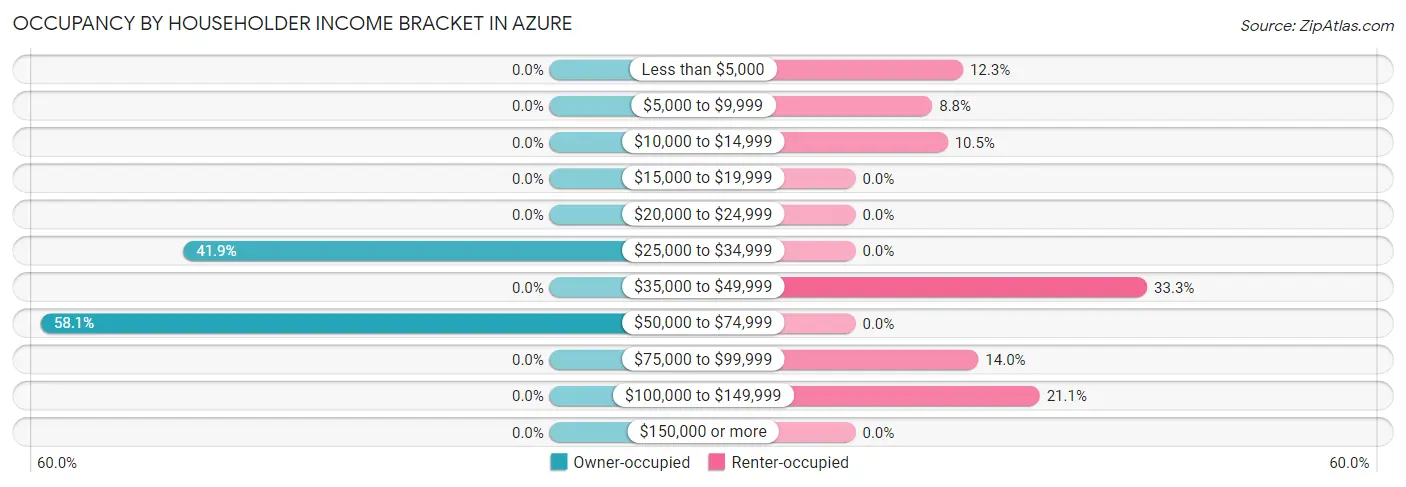
| Income Bracket | Owner-occupied | Renter-occupied |
| Less than $5,000 | 0 (0.0%) | 7 (12.3%) |
| $5,000 to $9,999 | 0 (0.0%) | 5 (8.8%) |
| $10,000 to $14,999 | 0 (0.0%) | 6 (10.5%) |
| $15,000 to $19,999 | 0 (0.0%) | 0 (0.0%) |
| $20,000 to $24,999 | 0 (0.0%) | 0 (0.0%) |
| $25,000 to $34,999 | 18 (41.9%) | 0 (0.0%) |
| $35,000 to $49,999 | 0 (0.0%) | 19 (33.3%) |
| $50,000 to $74,999 | 25 (58.1%) | 0 (0.0%) |
| $75,000 to $99,999 | 0 (0.0%) | 8 (14.0%) |
| $100,000 to $149,999 | 0 (0.0%) | 12 (21.0%) |
| $150,000 or more | 0 (0.0%) | 0 (0.0%) |
| Total | 43 (100.0%) | 57 (100.0%) |
Monthly Housing Cost Tiers in Azure
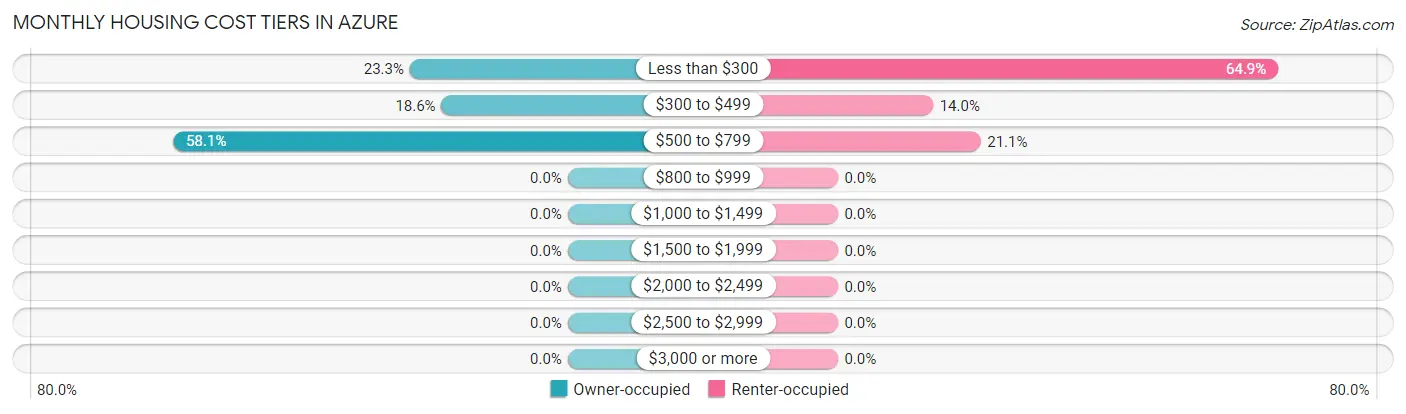
| Monthly Cost | Owner-occupied | Renter-occupied |
| Less than $300 | 10 (23.3%) | 37 (64.9%) |
| $300 to $499 | 8 (18.6%) | 8 (14.0%) |
| $500 to $799 | 25 (58.1%) | 12 (21.0%) |
| $800 to $999 | 0 (0.0%) | 0 (0.0%) |
| $1,000 to $1,499 | 0 (0.0%) | 0 (0.0%) |
| $1,500 to $1,999 | 0 (0.0%) | 0 (0.0%) |
| $2,000 to $2,499 | 0 (0.0%) | 0 (0.0%) |
| $2,500 to $2,999 | 0 (0.0%) | 0 (0.0%) |
| $3,000 or more | 0 (0.0%) | 0 (0.0%) |
| Total | 43 (100.0%) | 57 (100.0%) |
Physical Housing Characteristics in Azure
Housing Structures in Azure
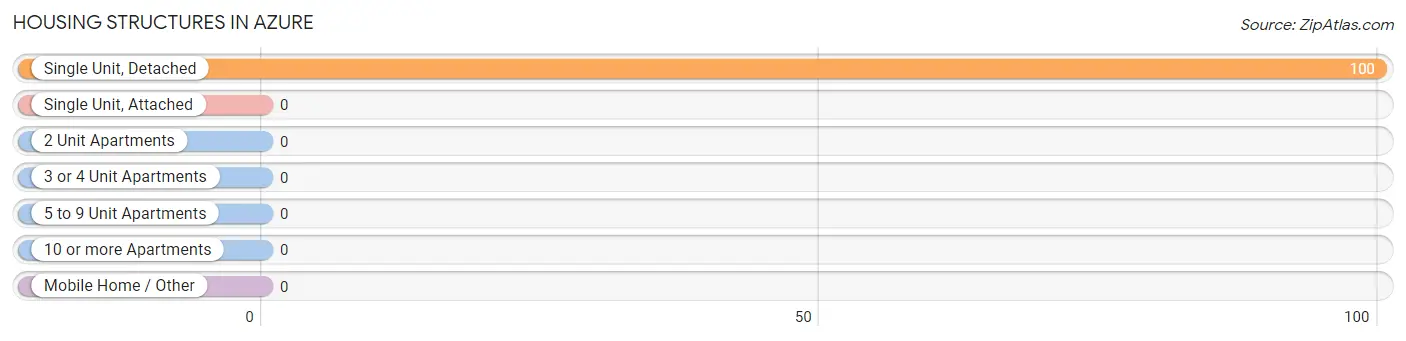
| Structure Type | # Housing Units | % Housing Units |
| Single Unit, Detached | 100 | 100.0% |
| Single Unit, Attached | 0 | 0.0% |
| 2 Unit Apartments | 0 | 0.0% |
| 3 or 4 Unit Apartments | 0 | 0.0% |
| 5 to 9 Unit Apartments | 0 | 0.0% |
| 10 or more Apartments | 0 | 0.0% |
| Mobile Home / Other | 0 | 0.0% |
| Total | 100 | 100.0% |
Housing Structures by Occupancy in Azure
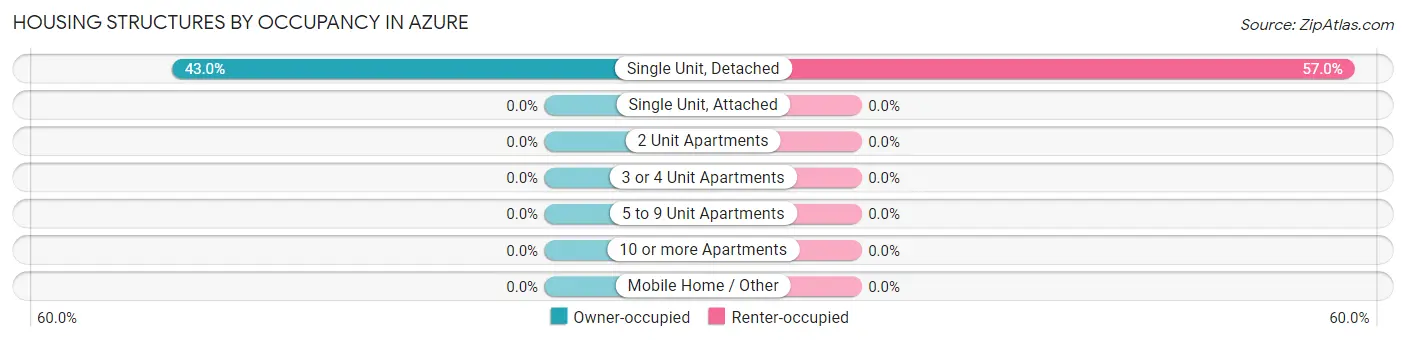
| Structure Type | Owner-occupied | Renter-occupied |
| Single Unit, Detached | 43 (43.0%) | 57 (57.0%) |
| Single Unit, Attached | 0 (0.0%) | 0 (0.0%) |
| 2 Unit Apartments | 0 (0.0%) | 0 (0.0%) |
| 3 or 4 Unit Apartments | 0 (0.0%) | 0 (0.0%) |
| 5 to 9 Unit Apartments | 0 (0.0%) | 0 (0.0%) |
| 10 or more Apartments | 0 (0.0%) | 0 (0.0%) |
| Mobile Home / Other | 0 (0.0%) | 0 (0.0%) |
| Total | 43 (43.0%) | 57 (57.0%) |
Housing Structures by Number of Rooms in Azure
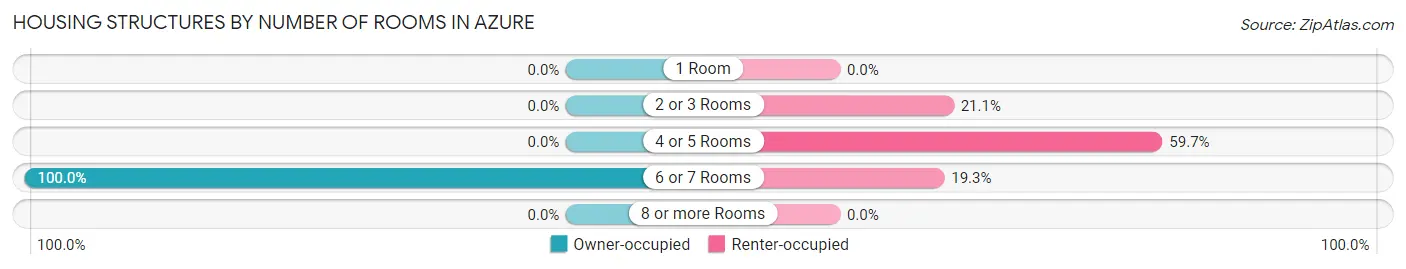
| Number of Rooms | Owner-occupied | Renter-occupied |
| 1 Room | 0 (0.0%) | 0 (0.0%) |
| 2 or 3 Rooms | 0 (0.0%) | 12 (21.0%) |
| 4 or 5 Rooms | 0 (0.0%) | 34 (59.7%) |
| 6 or 7 Rooms | 43 (100.0%) | 11 (19.3%) |
| 8 or more Rooms | 0 (0.0%) | 0 (0.0%) |
| Total | 43 (100.0%) | 57 (100.0%) |
Housing Structure by Heating Type in Azure
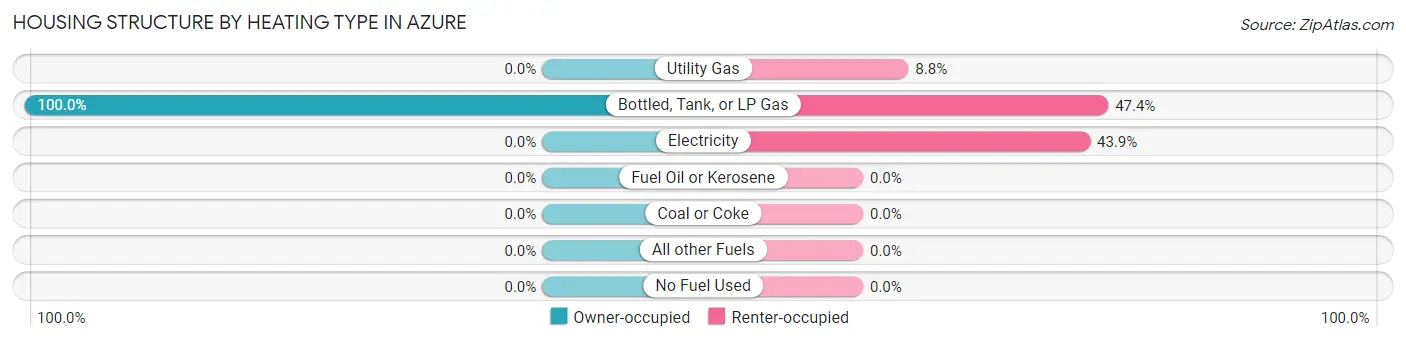
| Heating Type | Owner-occupied | Renter-occupied |
| Utility Gas | 0 (0.0%) | 5 (8.8%) |
| Bottled, Tank, or LP Gas | 43 (100.0%) | 27 (47.4%) |
| Electricity | 0 (0.0%) | 25 (43.9%) |
| Fuel Oil or Kerosene | 0 (0.0%) | 0 (0.0%) |
| Coal or Coke | 0 (0.0%) | 0 (0.0%) |
| All other Fuels | 0 (0.0%) | 0 (0.0%) |
| No Fuel Used | 0 (0.0%) | 0 (0.0%) |
| Total | 43 (100.0%) | 57 (100.0%) |
Household Vehicle Usage in Azure
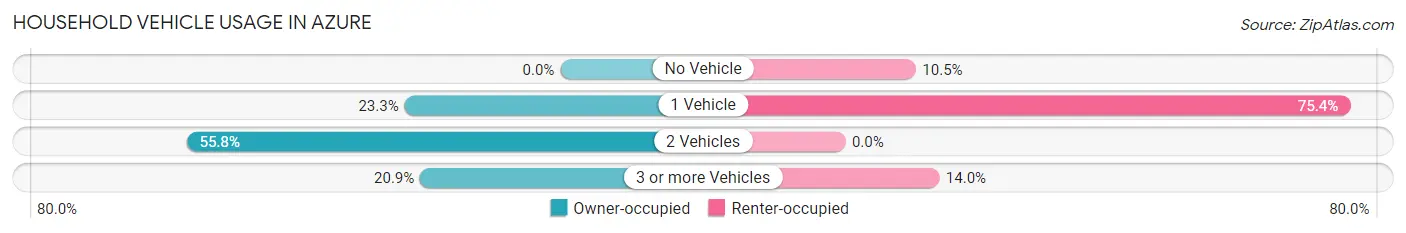
| Vehicles per Household | Owner-occupied | Renter-occupied |
| No Vehicle | 0 (0.0%) | 6 (10.5%) |
| 1 Vehicle | 10 (23.3%) | 43 (75.4%) |
| 2 Vehicles | 24 (55.8%) | 0 (0.0%) |
| 3 or more Vehicles | 9 (20.9%) | 8 (14.0%) |
| Total | 43 (100.0%) | 57 (100.0%) |
Real Estate & Mortgages in Azure
Real Estate and Mortgage Overview in Azure
| Characteristic | Without Mortgage | With Mortgage |
| Housing Units | 27 | 16 |
| Median Property Value | $117,800 | $0 |
| Median Household Income | - | - |
| Monthly Housing Costs | $444 | $0 |
| Real Estate Taxes | - | - |
Property Value by Mortgage Status in Azure
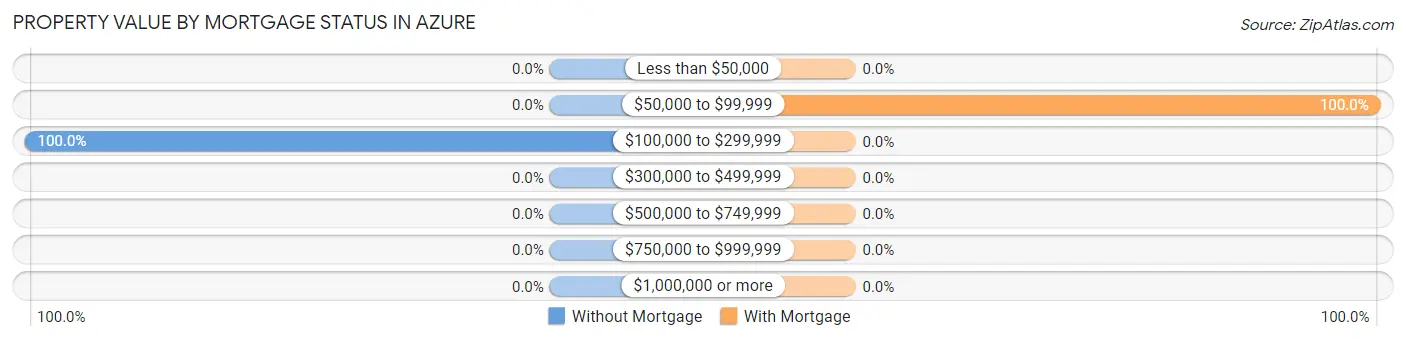
| Property Value | Without Mortgage | With Mortgage |
| Less than $50,000 | 0 (0.0%) | 0 (0.0%) |
| $50,000 to $99,999 | 0 (0.0%) | 16 (100.0%) |
| $100,000 to $299,999 | 27 (100.0%) | 0 (0.0%) |
| $300,000 to $499,999 | 0 (0.0%) | 0 (0.0%) |
| $500,000 to $749,999 | 0 (0.0%) | 0 (0.0%) |
| $750,000 to $999,999 | 0 (0.0%) | 0 (0.0%) |
| $1,000,000 or more | 0 (0.0%) | 0 (0.0%) |
| Total | 27 (100.0%) | 16 (100.0%) |
Household Income by Mortgage Status in Azure
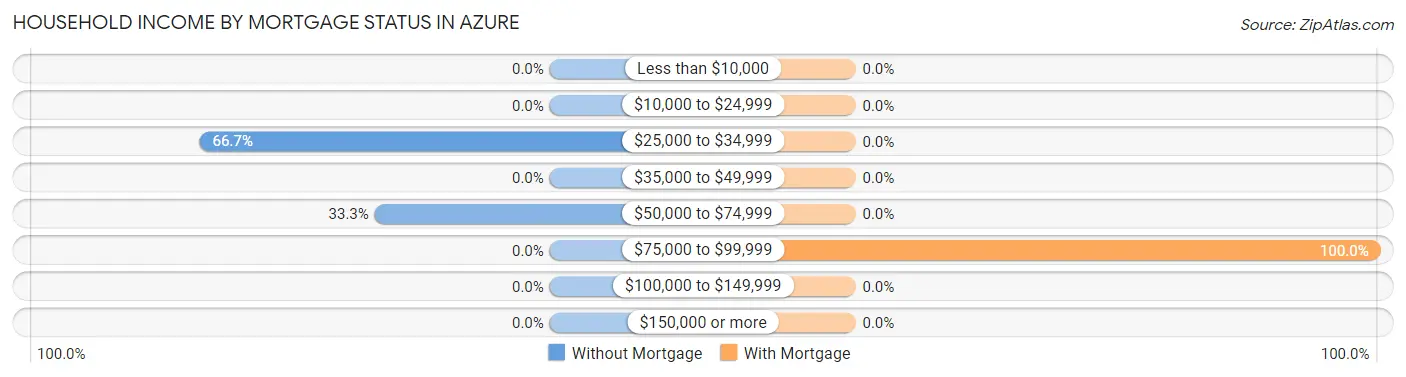
| Household Income | Without Mortgage | With Mortgage |
| Less than $10,000 | 0 (0.0%) | 0 (0.0%) |
| $10,000 to $24,999 | 0 (0.0%) | 0 (0.0%) |
| $25,000 to $34,999 | 18 (66.7%) | 0 (0.0%) |
| $35,000 to $49,999 | 0 (0.0%) | 0 (0.0%) |
| $50,000 to $74,999 | 9 (33.3%) | 0 (0.0%) |
| $75,000 to $99,999 | 0 (0.0%) | 16 (100.0%) |
| $100,000 to $149,999 | 0 (0.0%) | 0 (0.0%) |
| $150,000 or more | 0 (0.0%) | 0 (0.0%) |
| Total | 27 (100.0%) | 16 (100.0%) |
Property Value to Household Income Ratio in Azure
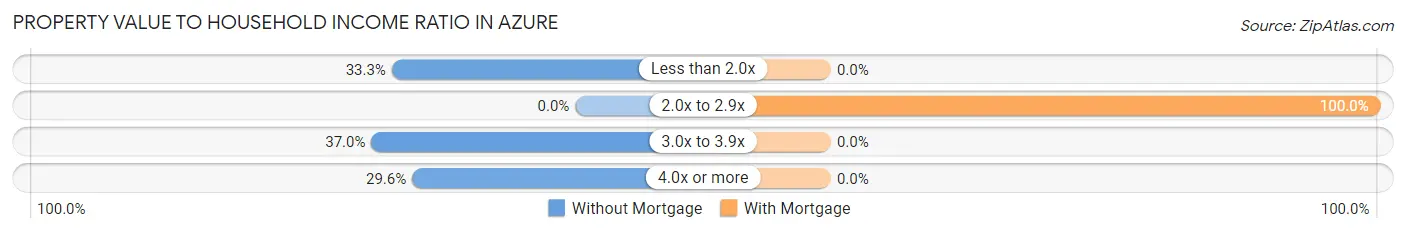
| Value-to-Income Ratio | Without Mortgage | With Mortgage |
| Less than 2.0x | 9 (33.3%) | 0 (0.0%) |
| 2.0x to 2.9x | 0 (0.0%) | 16 (100.0%) |
| 3.0x to 3.9x | 10 (37.0%) | 0 (0.0%) |
| 4.0x or more | 8 (29.6%) | 0 (0.0%) |
| Total | 27 (100.0%) | 16 (100.0%) |
Real Estate Taxes by Mortgage Status in Azure
| Property Taxes | Without Mortgage | With Mortgage |
| Less than $800 | 0 (0.0%) | 0 (0.0%) |
| $800 to $1,499 | 0 (0.0%) | 0 (0.0%) |
| $800 to $1,499 | 0 (0.0%) | 0 (0.0%) |
| Total | 27 (100.0%) | 16 (100.0%) |
Health & Disability in Azure
Health Insurance Coverage by Age in Azure
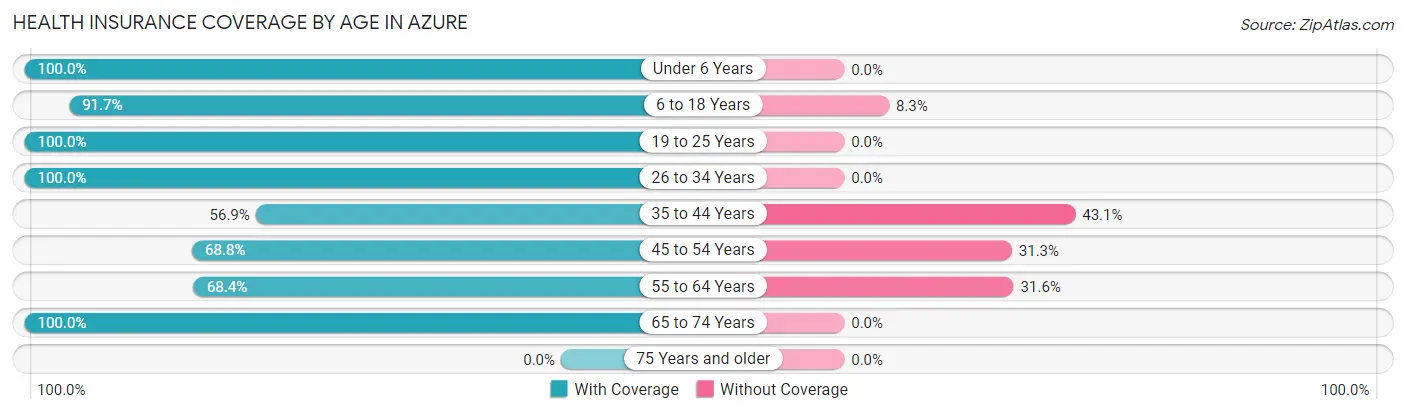
| Age Bracket | With Coverage | Without Coverage |
| Under 6 Years | 41 (100.0%) | 0 (0.0%) |
| 6 to 18 Years | 132 (91.7%) | 12 (8.3%) |
| 19 to 25 Years | 36 (100.0%) | 0 (0.0%) |
| 26 to 34 Years | 21 (100.0%) | 0 (0.0%) |
| 35 to 44 Years | 37 (56.9%) | 28 (43.1%) |
| 45 to 54 Years | 22 (68.8%) | 10 (31.2%) |
| 55 to 64 Years | 13 (68.4%) | 6 (31.6%) |
| 65 to 74 Years | 28 (100.0%) | 0 (0.0%) |
| 75 Years and older | 0 (0.0%) | 0 (0.0%) |
| Total | 330 (85.5%) | 56 (14.5%) |
Health Insurance Coverage by Citizenship Status in Azure
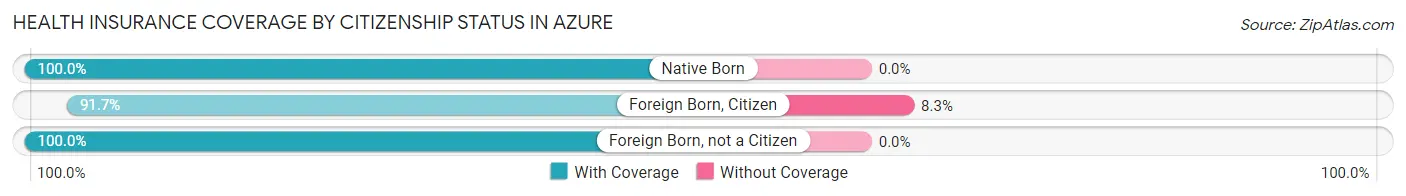
| Citizenship Status | With Coverage | Without Coverage |
| Native Born | 41 (100.0%) | 0 (0.0%) |
| Foreign Born, Citizen | 132 (91.7%) | 12 (8.3%) |
| Foreign Born, not a Citizen | 36 (100.0%) | 0 (0.0%) |
Health Insurance Coverage by Household Income in Azure
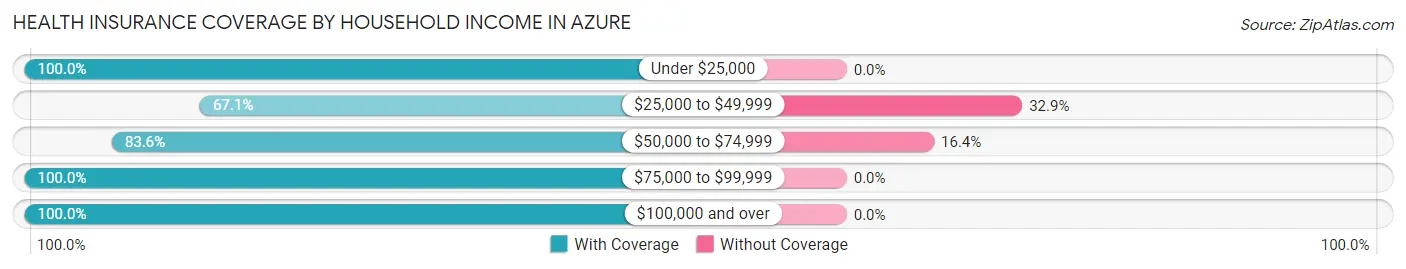
| Household Income | With Coverage | Without Coverage |
| Under $25,000 | 48 (100.0%) | 0 (0.0%) |
| $25,000 to $49,999 | 96 (67.1%) | 47 (32.9%) |
| $50,000 to $74,999 | 46 (83.6%) | 9 (16.4%) |
| $75,000 to $99,999 | 53 (100.0%) | 0 (0.0%) |
| $100,000 and over | 87 (100.0%) | 0 (0.0%) |
Public vs Private Health Insurance Coverage by Age in Azure
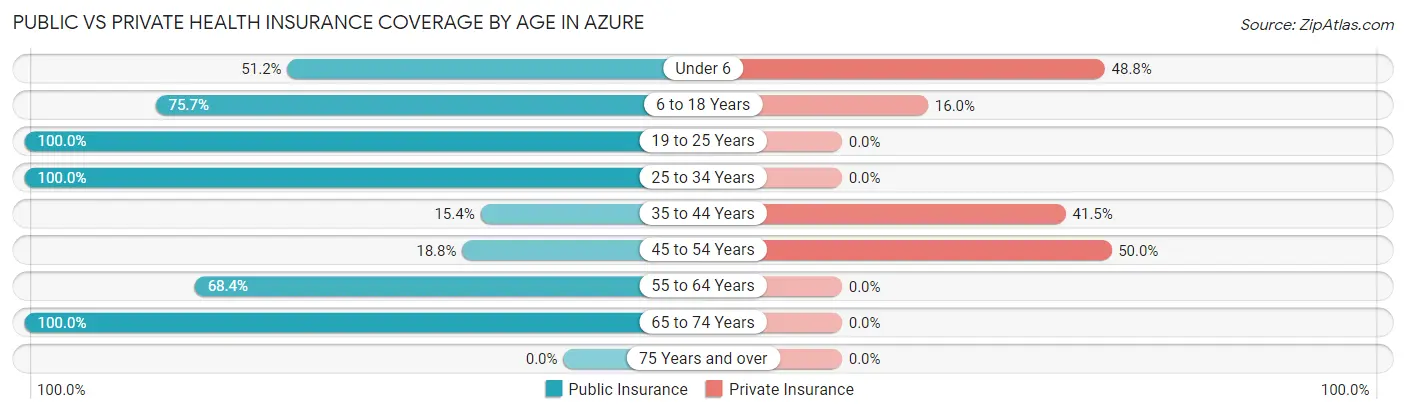
| Age Bracket | Public Insurance | Private Insurance |
| Under 6 | 21 (51.2%) | 20 (48.8%) |
| 6 to 18 Years | 109 (75.7%) | 23 (16.0%) |
| 19 to 25 Years | 36 (100.0%) | 0 (0.0%) |
| 25 to 34 Years | 21 (100.0%) | 0 (0.0%) |
| 35 to 44 Years | 10 (15.4%) | 27 (41.5%) |
| 45 to 54 Years | 6 (18.8%) | 16 (50.0%) |
| 55 to 64 Years | 13 (68.4%) | 0 (0.0%) |
| 65 to 74 Years | 28 (100.0%) | 0 (0.0%) |
| 75 Years and over | 0 (0.0%) | 0 (0.0%) |
| Total | 244 (63.2%) | 86 (22.3%) |
Disability Status by Sex by Age in Azure
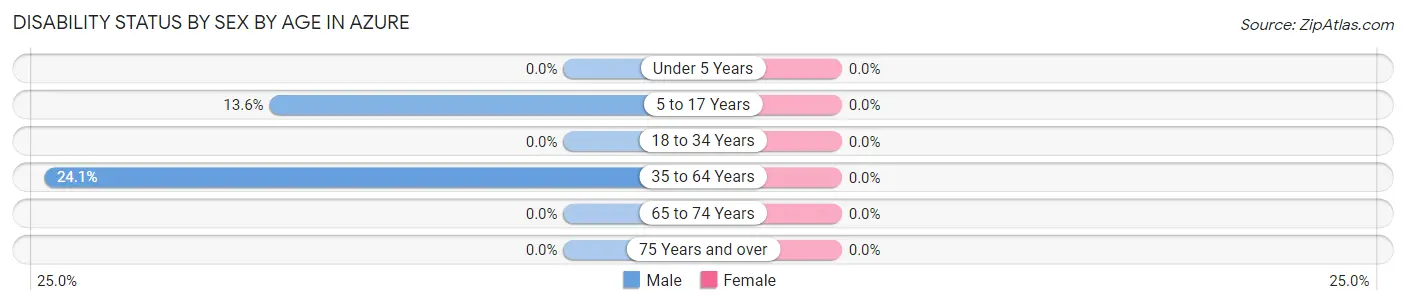
| Age Bracket | Male | Female |
| Under 5 Years | 0 (0.0%) | 0 (0.0%) |
| 5 to 17 Years | 12 (13.6%) | 0 (0.0%) |
| 18 to 34 Years | 0 (0.0%) | 0 (0.0%) |
| 35 to 64 Years | 20 (24.1%) | 0 (0.0%) |
| 65 to 74 Years | 0 (0.0%) | 0 (0.0%) |
| 75 Years and over | 0 (0.0%) | 0 (0.0%) |
Disability Class by Sex by Age in Azure
Disability Class: Hearing Difficulty
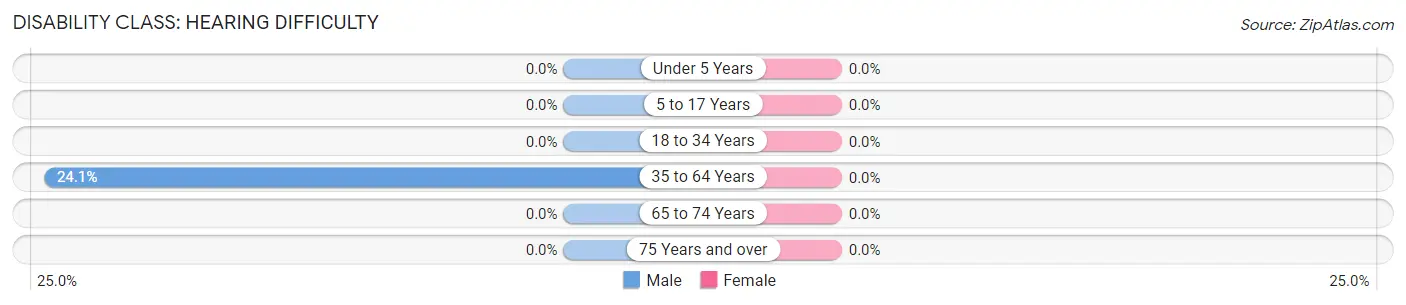
| Age Bracket | Male | Female |
| Under 5 Years | 0 (0.0%) | 0 (0.0%) |
| 5 to 17 Years | 0 (0.0%) | 0 (0.0%) |
| 18 to 34 Years | 0 (0.0%) | 0 (0.0%) |
| 35 to 64 Years | 20 (24.1%) | 0 (0.0%) |
| 65 to 74 Years | 0 (0.0%) | 0 (0.0%) |
| 75 Years and over | 0 (0.0%) | 0 (0.0%) |
Disability Class: Vision Difficulty
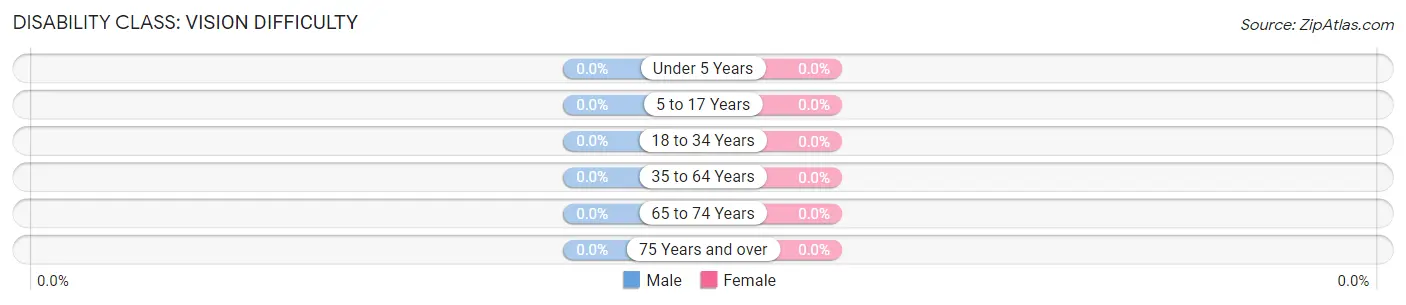
| Age Bracket | Male | Female |
| Under 5 Years | 0 (0.0%) | 0 (0.0%) |
| 5 to 17 Years | 0 (0.0%) | 0 (0.0%) |
| 18 to 34 Years | 0 (0.0%) | 0 (0.0%) |
| 35 to 64 Years | 0 (0.0%) | 0 (0.0%) |
| 65 to 74 Years | 0 (0.0%) | 0 (0.0%) |
| 75 Years and over | 0 (0.0%) | 0 (0.0%) |
Disability Class: Cognitive Difficulty
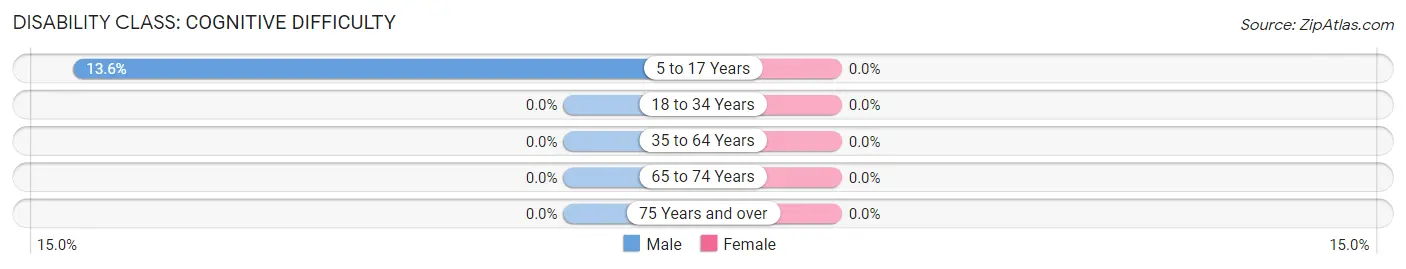
| Age Bracket | Male | Female |
| 5 to 17 Years | 12 (13.6%) | 0 (0.0%) |
| 18 to 34 Years | 0 (0.0%) | 0 (0.0%) |
| 35 to 64 Years | 0 (0.0%) | 0 (0.0%) |
| 65 to 74 Years | 0 (0.0%) | 0 (0.0%) |
| 75 Years and over | 0 (0.0%) | 0 (0.0%) |
Disability Class: Ambulatory Difficulty
| Age Bracket | Male | Female |
| 5 to 17 Years | 0 (0.0%) | 0 (0.0%) |
| 18 to 34 Years | 0 (0.0%) | 0 (0.0%) |
| 35 to 64 Years | 0 (0.0%) | 0 (0.0%) |
| 65 to 74 Years | 0 (0.0%) | 0 (0.0%) |
| 75 Years and over | 0 (0.0%) | 0 (0.0%) |
Disability Class: Self-Care Difficulty
| Age Bracket | Male | Female |
| 5 to 17 Years | 0 (0.0%) | 0 (0.0%) |
| 18 to 34 Years | 0 (0.0%) | 0 (0.0%) |
| 35 to 64 Years | 0 (0.0%) | 0 (0.0%) |
| 65 to 74 Years | 0 (0.0%) | 0 (0.0%) |
| 75 Years and over | 0 (0.0%) | 0 (0.0%) |
Technology Access in Azure
Computing Device Access in Azure
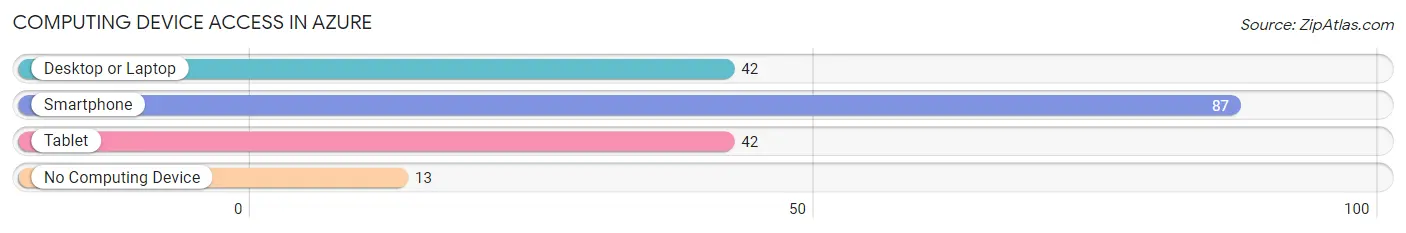
| Device Type | # Households | % Households |
| Desktop or Laptop | 42 | 42.0% |
| Smartphone | 87 | 87.0% |
| Tablet | 42 | 42.0% |
| No Computing Device | 13 | 13.0% |
| Total | 100 | 100.0% |
Internet Access in Azure
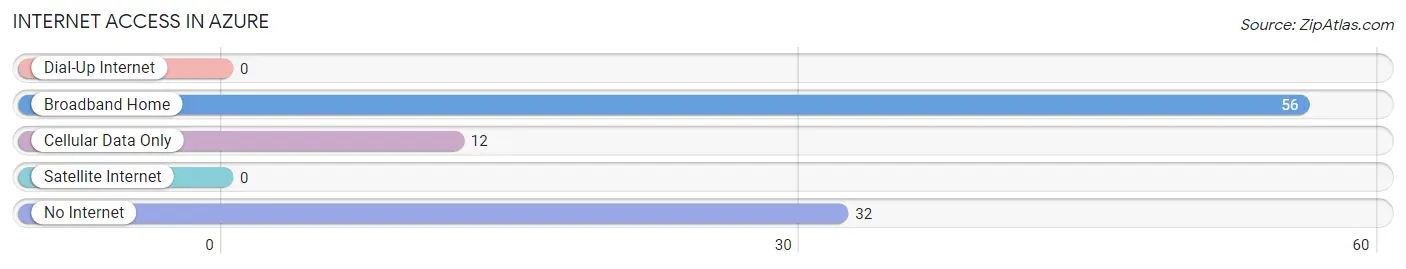
| Internet Type | # Households | % Households |
| Dial-Up Internet | 0 | 0.0% |
| Broadband Home | 56 | 56.0% |
| Cellular Data Only | 12 | 12.0% |
| Satellite Internet | 0 | 0.0% |
| No Internet | 32 | 32.0% |
| Total | 100 | 100.0% |
Azure Summary
Azure is a small town located in the state of Montana, in the United States. It is situated in the western part of the state, in the foothills of the Rocky Mountains. The town has a population of approximately 1,000 people, and is located in the county of Cascade.
History
Azure was founded in 1883 by a group of settlers from the Midwest. The town was originally named “Azureville”, after the blue sky that was visible from the area. The settlers were attracted to the area due to its abundance of natural resources, including timber, minerals, and water. The town quickly grew, and by the early 1900s, it had become a bustling center of commerce and industry.
The town was home to several sawmills, a flour mill, a brickyard, and a number of other businesses. The town also had a railroad station, which allowed for the transportation of goods and people to and from the area.
In the early 1900s, the town was also home to a number of saloons and gambling halls. This led to a period of lawlessness and violence, which eventually led to the town being placed under martial law in 1909.
Geography
Azure is located in the western part of Montana, in the foothills of the Rocky Mountains. The town is situated at an elevation of 4,000 feet, and is surrounded by mountains and forests. The town is located near the Flathead River, which provides a source of water for the area.
The climate in Azure is generally mild, with temperatures ranging from the low 30s in the winter to the high 80s in the summer. The town receives an average of 20 inches of precipitation per year, with most of it falling in the form of snow.
Economy
The economy of Azure is largely based on tourism and agriculture. The town is home to a number of tourist attractions, including the Flathead River, which is popular for fishing and rafting. The town also has a number of small businesses, including restaurants, shops, and galleries.
Agriculture is also an important part of the economy in Azure. The town is home to a number of farms, which produce a variety of crops, including wheat, barley, and hay. The town also has a number of cattle ranches, which produce beef and dairy products.
Demographics
As of the 2010 census, the population of Azure was 1,000 people. The town is predominantly white, with a small percentage of African Americans, Native Americans, and other ethnicities. The median household income in Azure is $35,000, and the median age is 37 years old.
The town is served by a number of public schools, including Azure Elementary School, Azure Middle School, and Azure High School. The town also has a number of churches, including the First Baptist Church, the Church of Jesus Christ of Latter-day Saints, and the United Methodist Church.
Conclusion
Azure is a small town located in the western part of Montana, in the foothills of the Rocky Mountains. The town has a population of approximately 1,000 people, and is home to a number of tourist attractions, businesses, and farms. The town is predominantly white, with a small percentage of African Americans, Native Americans, and other ethnicities. The economy of Azure is largely based on tourism and agriculture, and the town is served by a number of public schools and churches.
Common Questions
What is Per Capita Income in Azure?
Per Capita income in Azure is $14,653.
What is the Median Family Income in Azure?
Median Family Income in Azure is $70,417.
What is Inequality or Gini Index in Azure?
Inequality or Gini Index in Azure is 0.39.
What is the Total Population of Azure?
Total Population of Azure is 386.
What is the Total Male Population of Azure?
Total Male Population of Azure is 233.
What is the Total Female Population of Azure?
Total Female Population of Azure is 153.
What is the Ratio of Males per 100 Females in Azure?
There are 152.29 Males per 100 Females in Azure.
What is the Ratio of Females per 100 Males in Azure?
There are 65.67 Females per 100 Males in Azure.
What is the Median Population Age in Azure?
Median Population Age in Azure is 20.1 Years.
What is the Average Family Size in Azure
Average Family Size in Azure is 4.2 People.
What is the Average Household Size in Azure
Average Household Size in Azure is 3.9 People.
How Large is the Labor Force in Azure?
There are 108 People in the Labor Forcein in Azure.
What is the Percentage of People in the Labor Force in Azure?
49.8% of People are in the Labor Force in Azure.
What is the Unemployment Rate in Azure?
Unemployment Rate in Azure is 30.6%.