Metamora, IN Map & Demographics
Metamora Map
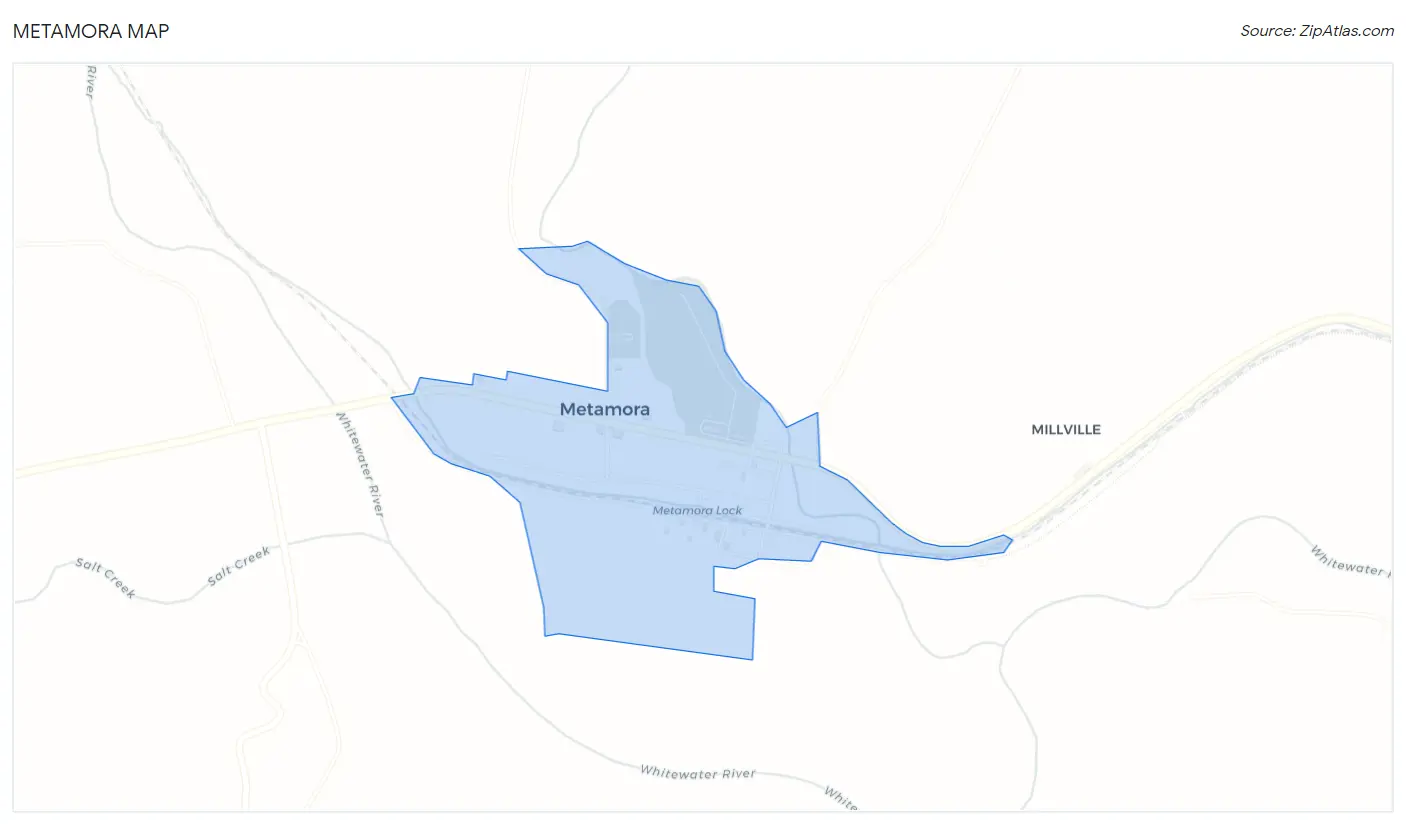
Metamora Overview
$17,166
PER CAPITA INCOME
$77,909
AVG FAMILY INCOME
0.28
INEQUALITY / GINI INDEX
405
TOTAL POPULATION
190
MALE POPULATION
215
FEMALE POPULATION
88.37
MALES / 100 FEMALES
113.16
FEMALES / 100 MALES
49.6
MEDIAN AGE
3.2
AVG FAMILY SIZE
2.8
AVG HOUSEHOLD SIZE
109
LABOR FORCE [ PEOPLE ]
34.3%
PERCENT IN LABOR FORCE
24.8%
UNEMPLOYMENT RATE
Metamora Zip Codes
Income in Metamora
Income Overview in Metamora
| Characteristic | Number | Measure |
| Per Capita Income | 405 | $17,166 |
| Median Family Income | 118 | $77,909 |
| Mean Family Income | 118 | $63,968 |
| Median Household Income | 145 | $0 |
| Mean Household Income | 145 | $55,241 |
| Income Deficit | 118 | $0 |
| Wage / Income Gap (%) | 405 | 0.00% |
| Wage / Income Gap ($) | 405 | 100.00¢ per $1 |
| Gini / Inequality Index | 405 | 0.28 |
Earnings by Sex in Metamora
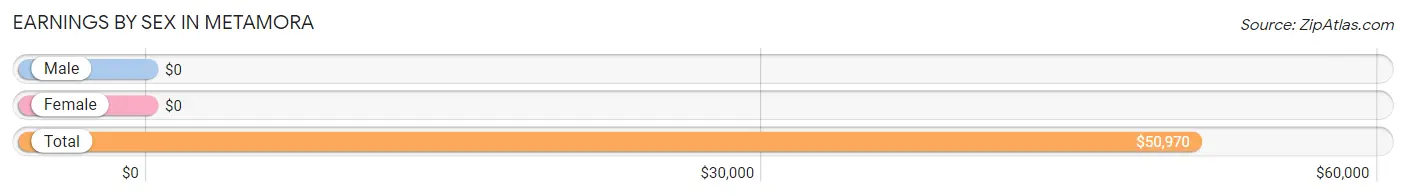
| Sex | Number | Average Earnings |
| Male | 67 (81.7%) | $0 |
| Female | 15 (18.3%) | $0 |
| Total | 82 (100.0%) | $50,970 |
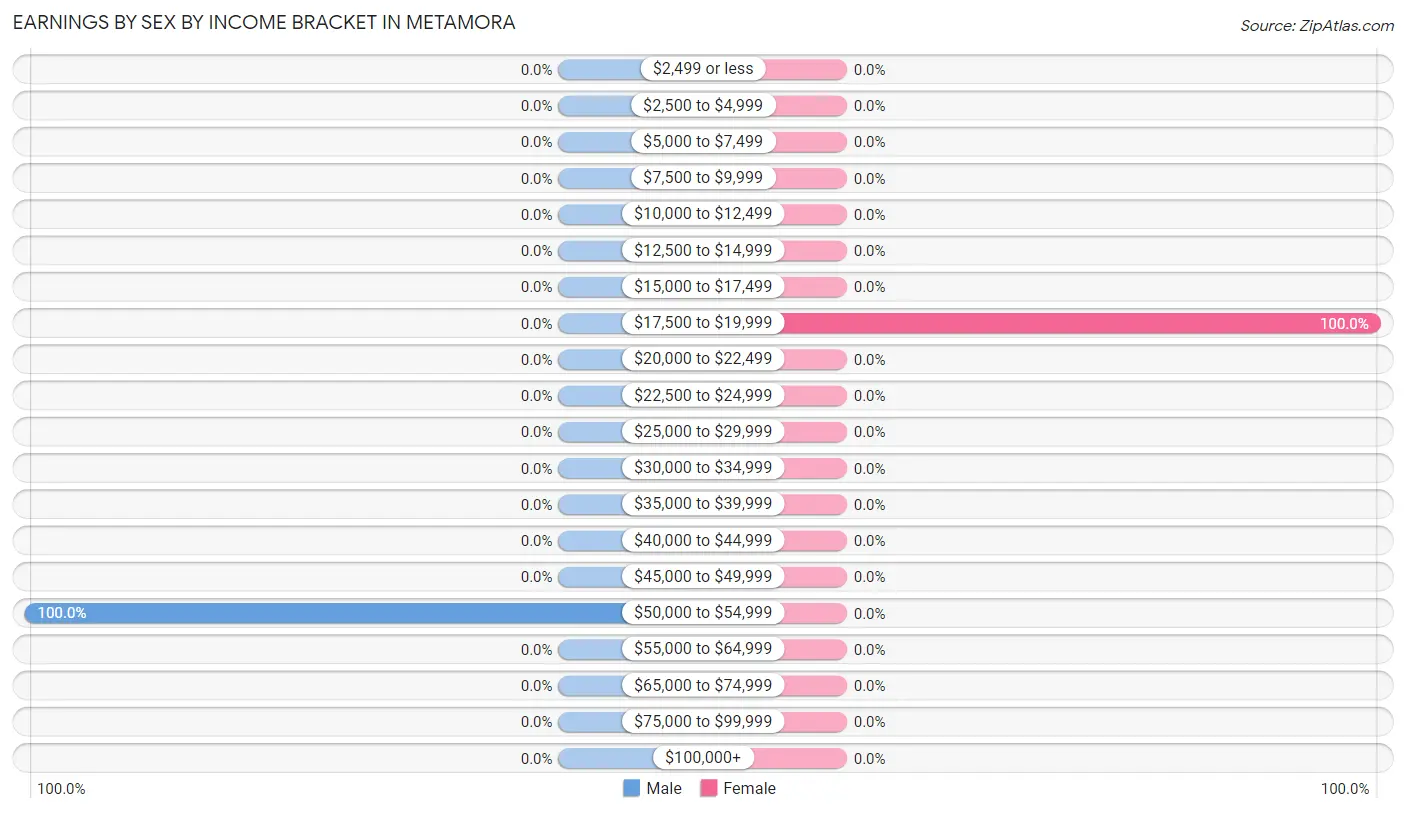
Earnings by Sex by Income Bracket in Metamora
The most common earnings brackets in Metamora are $50,000 to $54,999 for men (67 | 100.0%) and $17,500 to $19,999 for women (15 | 100.0%).
| Income | Male | Female |
| $2,499 or less | 0 (0.0%) | 0 (0.0%) |
| $2,500 to $4,999 | 0 (0.0%) | 0 (0.0%) |
| $5,000 to $7,499 | 0 (0.0%) | 0 (0.0%) |
| $7,500 to $9,999 | 0 (0.0%) | 0 (0.0%) |
| $10,000 to $12,499 | 0 (0.0%) | 0 (0.0%) |
| $12,500 to $14,999 | 0 (0.0%) | 0 (0.0%) |
| $15,000 to $17,499 | 0 (0.0%) | 0 (0.0%) |
| $17,500 to $19,999 | 0 (0.0%) | 15 (100.0%) |
| $20,000 to $22,499 | 0 (0.0%) | 0 (0.0%) |
| $22,500 to $24,999 | 0 (0.0%) | 0 (0.0%) |
| $25,000 to $29,999 | 0 (0.0%) | 0 (0.0%) |
| $30,000 to $34,999 | 0 (0.0%) | 0 (0.0%) |
| $35,000 to $39,999 | 0 (0.0%) | 0 (0.0%) |
| $40,000 to $44,999 | 0 (0.0%) | 0 (0.0%) |
| $45,000 to $49,999 | 0 (0.0%) | 0 (0.0%) |
| $50,000 to $54,999 | 67 (100.0%) | 0 (0.0%) |
| $55,000 to $64,999 | 0 (0.0%) | 0 (0.0%) |
| $65,000 to $74,999 | 0 (0.0%) | 0 (0.0%) |
| $75,000 to $99,999 | 0 (0.0%) | 0 (0.0%) |
| $100,000+ | 0 (0.0%) | 0 (0.0%) |
| Total | 67 (100.0%) | 15 (100.0%) |
Earnings by Sex by Educational Attainment in Metamora
| Educational Attainment | Male Income | Female Income |
| Less than High School | - | - |
| High School Diploma | - | - |
| College or Associate's Degree | - | - |
| Bachelor's Degree | - | - |
| Graduate Degree | - | - |
| Total | - | - |
Family Income in Metamora
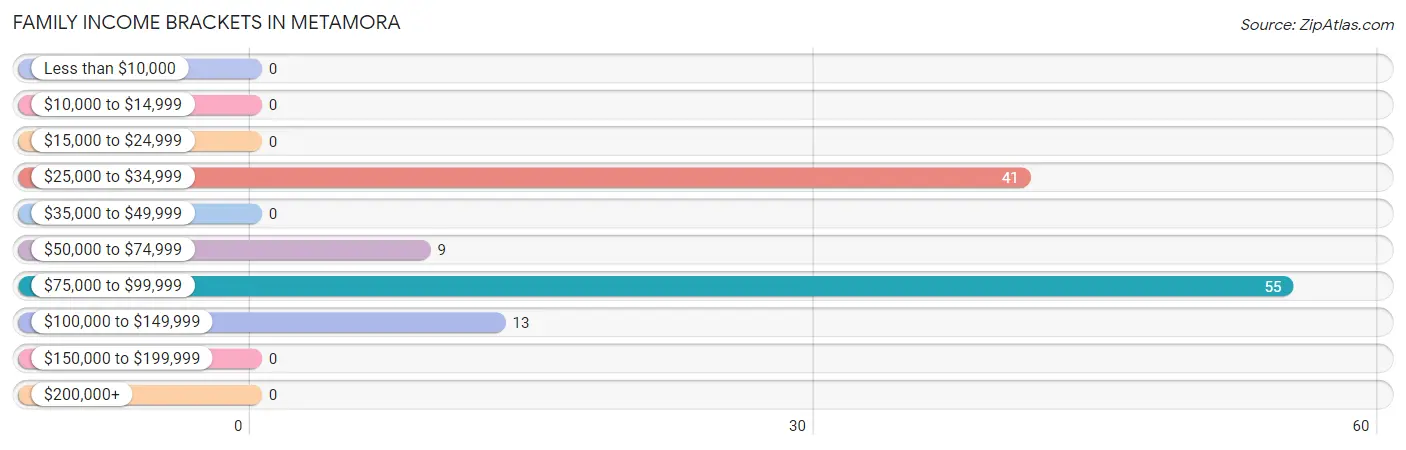
Family Income Brackets in Metamora
According to the Metamora family income data, there are 55 families falling into the $75,000 to $99,999 income range, which is the most common income bracket and makes up 46.6% of all families.
| Income Bracket | # Families | % Families |
| Less than $10,000 | 0 | 0.0% |
| $10,000 to $14,999 | 0 | 0.0% |
| $15,000 to $24,999 | 0 | 0.0% |
| $25,000 to $34,999 | 41 | 34.7% |
| $35,000 to $49,999 | 0 | 0.0% |
| $50,000 to $74,999 | 9 | 7.6% |
| $75,000 to $99,999 | 55 | 46.6% |
| $100,000 to $149,999 | 13 | 11.0% |
| $150,000 to $199,999 | 0 | 0.0% |
| $200,000+ | 0 | 0.0% |
Family Income by Famaliy Size in Metamora
| Income Bracket | # Families | Median Income |
| 2-Person Families | 63 (53.4%) | $0 |
| 3-Person Families | 0 (0.0%) | $0 |
| 4-Person Families | 0 (0.0%) | $0 |
| 5-Person Families | 0 (0.0%) | $0 |
| 6-Person Families | 0 (0.0%) | $0 |
| 7+ Person Families | 55 (46.6%) | $0 |
| Total | 118 (100.0%) | $77,909 |
Family Income by Number of Earners in Metamora
| Number of Earners | # Families | Median Income |
| No Earners | 50 (42.4%) | $0 |
| 1 Earner | 68 (57.6%) | $0 |
| 2 Earners | 0 (0.0%) | $0 |
| 3+ Earners | 0 (0.0%) | $0 |
| Total | 118 (100.0%) | $77,909 |
Household Income in Metamora
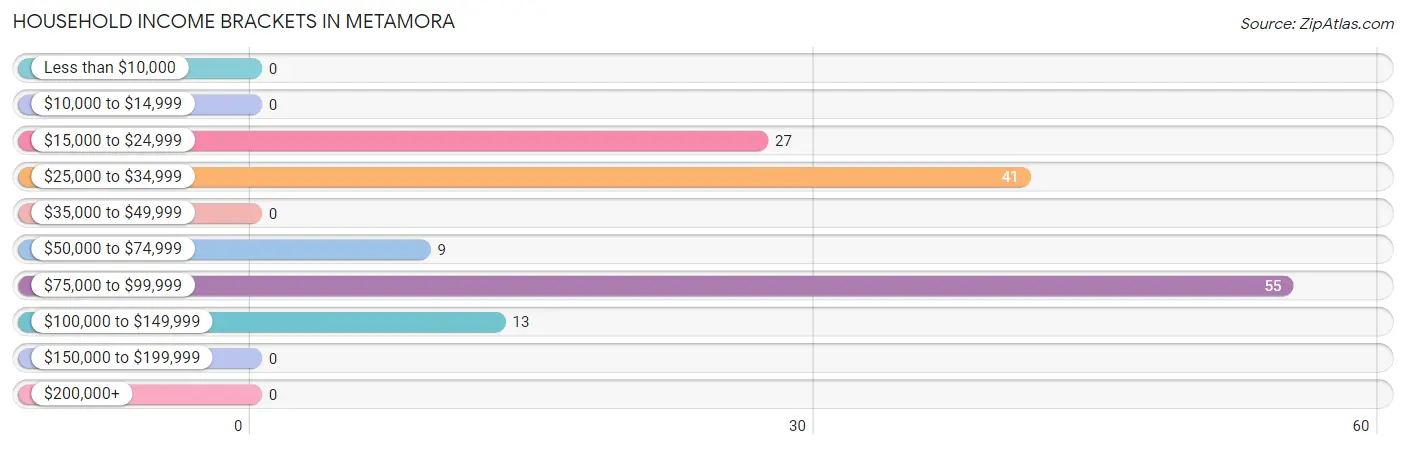
Household Income Brackets in Metamora
With 55 households falling in the category, the $75,000 to $99,999 income range is the most frequent in Metamora, accounting for 37.9% of all households.
| Income Bracket | # Households | % Households |
| Less than $10,000 | 0 | 0.0% |
| $10,000 to $14,999 | 0 | 0.0% |
| $15,000 to $24,999 | 27 | 18.6% |
| $25,000 to $34,999 | 41 | 28.3% |
| $35,000 to $49,999 | 0 | 0.0% |
| $50,000 to $74,999 | 9 | 6.2% |
| $75,000 to $99,999 | 55 | 37.9% |
| $100,000 to $149,999 | 13 | 9.0% |
| $150,000 to $199,999 | 0 | 0.0% |
| $200,000+ | 0 | 0.0% |
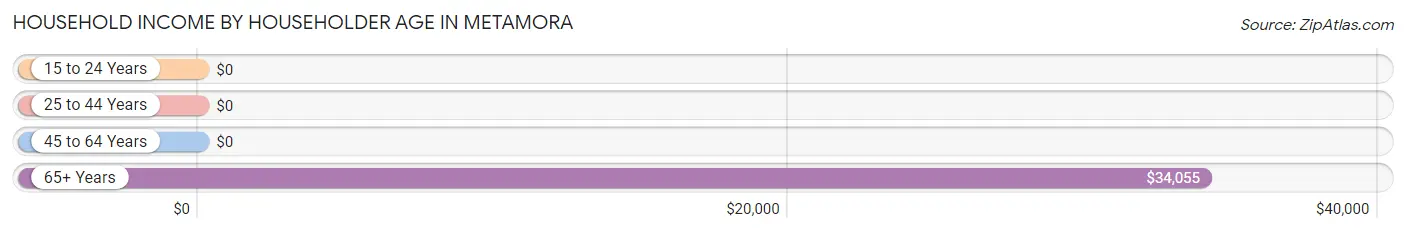
Household Income by Householder Age in Metamora
The median household income in Metamora is $0, with the highest median household income of $34,055 found in the 65+ years age bracket for the primary householder. A total of 75 households (51.7%) fall into this category.
| Income Bracket | # Households | Median Income |
| 15 to 24 Years | 0 (0.0%) | $0 |
| 25 to 44 Years | 0 (0.0%) | $0 |
| 45 to 64 Years | 70 (48.3%) | $0 |
| 65+ Years | 75 (51.7%) | $34,055 |
| Total | 145 (100.0%) | $0 |
Poverty in Metamora
Income Below Poverty by Sex and Age in Metamora
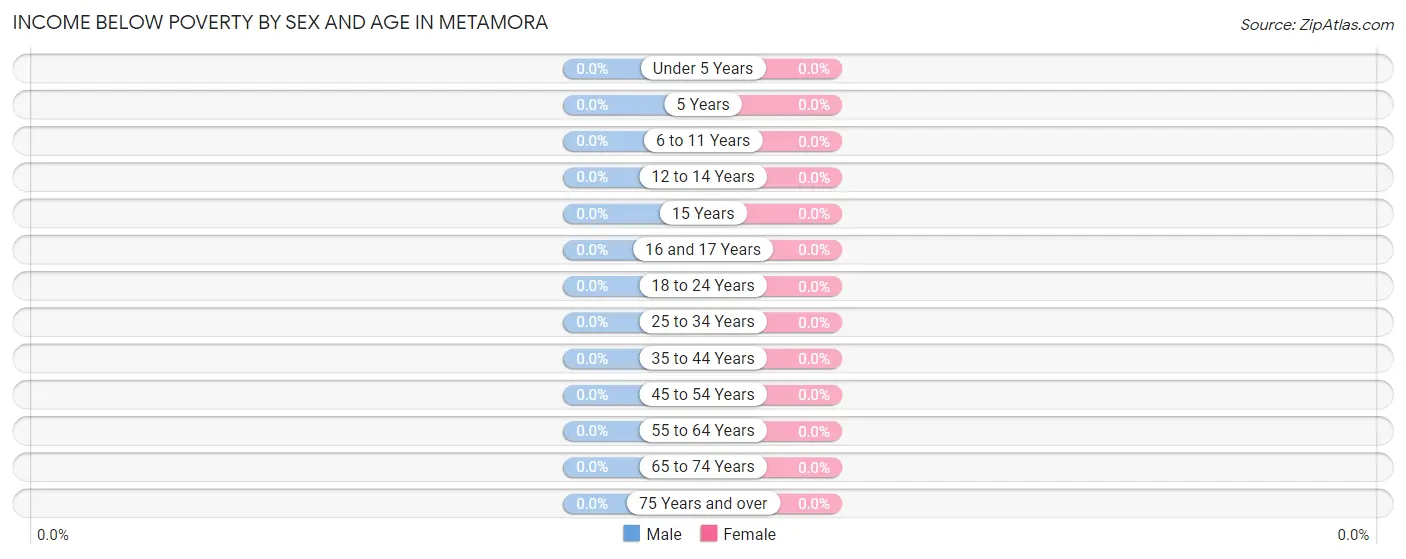
| Age Bracket | Male | Female |
| Under 5 Years | 0 (0.0%) | 0 (0.0%) |
| 5 Years | 0 (0.0%) | 0 (0.0%) |
| 6 to 11 Years | 0 (0.0%) | 0 (0.0%) |
| 12 to 14 Years | 0 (0.0%) | 0 (0.0%) |
| 15 Years | 0 (0.0%) | 0 (0.0%) |
| 16 and 17 Years | 0 (0.0%) | 0 (0.0%) |
| 18 to 24 Years | 0 (0.0%) | 0 (0.0%) |
| 25 to 34 Years | 0 (0.0%) | 0 (0.0%) |
| 35 to 44 Years | 0 (0.0%) | 0 (0.0%) |
| 45 to 54 Years | 0 (0.0%) | 0 (0.0%) |
| 55 to 64 Years | 0 (0.0%) | 0 (0.0%) |
| 65 to 74 Years | 0 (0.0%) | 0 (0.0%) |
| 75 Years and over | 0 (0.0%) | 0 (0.0%) |
| Total | 0 (0.0%) | 0 (0.0%) |
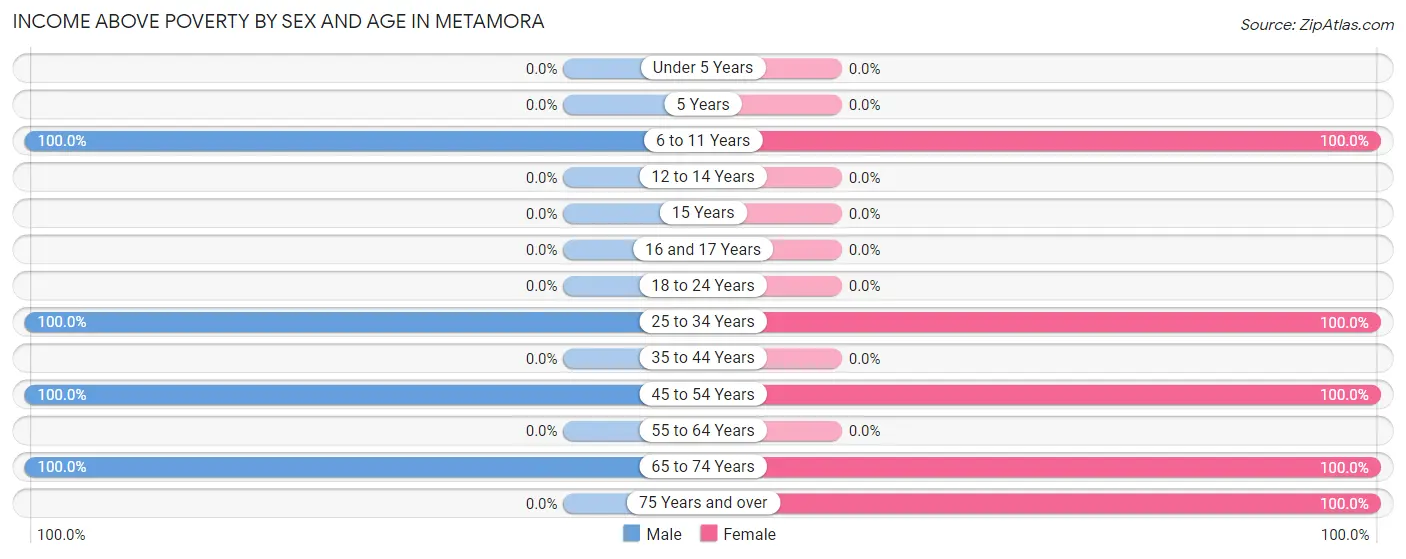
Income Above Poverty by Sex and Age in Metamora
According to the poverty statistics in Metamora, males aged 6 to 11 years and females aged 6 to 11 years are the age groups that are most secure financially, with 100.0% of males and 100.0% of females in these age groups living above the poverty line.
| Age Bracket | Male | Female |
| Under 5 Years | 0 (0.0%) | 0 (0.0%) |
| 5 Years | 0 (0.0%) | 0 (0.0%) |
| 6 to 11 Years | 47 (100.0%) | 40 (100.0%) |
| 12 to 14 Years | 0 (0.0%) | 0 (0.0%) |
| 15 Years | 0 (0.0%) | 0 (0.0%) |
| 16 and 17 Years | 0 (0.0%) | 0 (0.0%) |
| 18 to 24 Years | 0 (0.0%) | 0 (0.0%) |
| 25 to 34 Years | 26 (100.0%) | 27 (100.0%) |
| 35 to 44 Years | 0 (0.0%) | 0 (0.0%) |
| 45 to 54 Years | 54 (100.0%) | 70 (100.0%) |
| 55 to 64 Years | 0 (0.0%) | 0 (0.0%) |
| 65 to 74 Years | 63 (100.0%) | 34 (100.0%) |
| 75 Years and over | 0 (0.0%) | 44 (100.0%) |
| Total | 190 (100.0%) | 215 (100.0%) |
Income Below Poverty Among Married-Couple Families in Metamora
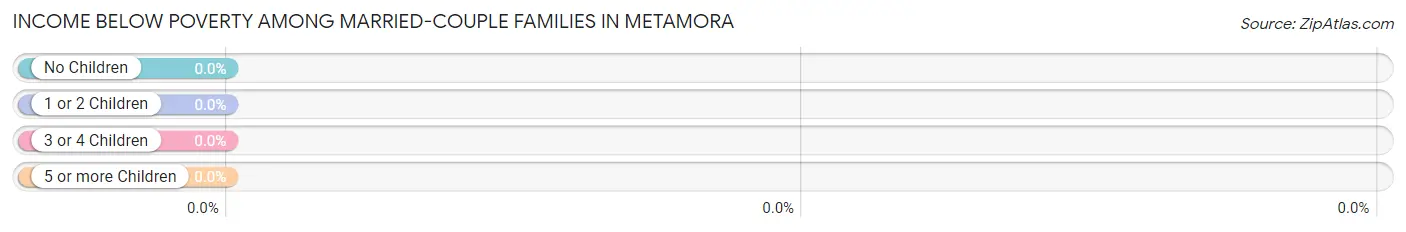
| Children | Above Poverty | Below Poverty |
| No Children | 63 (100.0%) | 0 (0.0%) |
| 1 or 2 Children | 55 (100.0%) | 0 (0.0%) |
| 3 or 4 Children | 0 (0.0%) | 0 (0.0%) |
| 5 or more Children | 0 (0.0%) | 0 (0.0%) |
| Total | 118 (100.0%) | 0 (0.0%) |
Income Below Poverty Among Single-Parent Households in Metamora
| Children | Single Father | Single Mother |
| No Children | 0 (0.0%) | 0 (0.0%) |
| 1 or 2 Children | 0 (0.0%) | 0 (0.0%) |
| 3 or 4 Children | 0 (0.0%) | 0 (0.0%) |
| 5 or more Children | 0 (0.0%) | 0 (0.0%) |
| Total | 0 (0.0%) | 0 (0.0%) |
Income Below Poverty Among Married-Couple vs Single-Parent Households in Metamora
| Children | Married-Couple Families | Single-Parent Households |
| No Children | 0 (0.0%) | 0 (0.0%) |
| 1 or 2 Children | 0 (0.0%) | 0 (0.0%) |
| 3 or 4 Children | 0 (0.0%) | 0 (0.0%) |
| 5 or more Children | 0 (0.0%) | 0 (0.0%) |
| Total | 0 (0.0%) | 0 (0.0%) |
Race in Metamora
The most populous races in Metamora are , and White / Caucasian (405 | 100.0%).
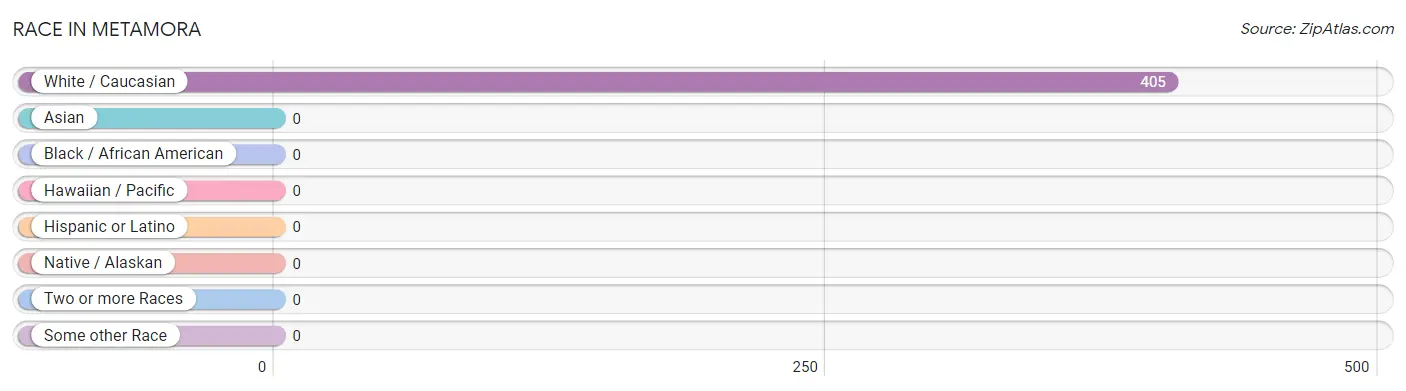
| Race | # Population | % Population |
| Asian | 0 | 0.0% |
| Black / African American | 0 | 0.0% |
| Hawaiian / Pacific | 0 | 0.0% |
| Hispanic or Latino | 0 | 0.0% |
| Native / Alaskan | 0 | 0.0% |
| White / Caucasian | 405 | 100.0% |
| Two or more Races | 0 | 0.0% |
| Some other Race | 0 | 0.0% |
| Total | 405 | 100.0% |
Ancestry in Metamora
The most populous ancestries reported in Metamora are American (263 | 64.9%), German (18 | 4.4%), English (15 | 3.7%), and Scottish (15 | 3.7%), together accounting for 76.8% of all Metamora residents.
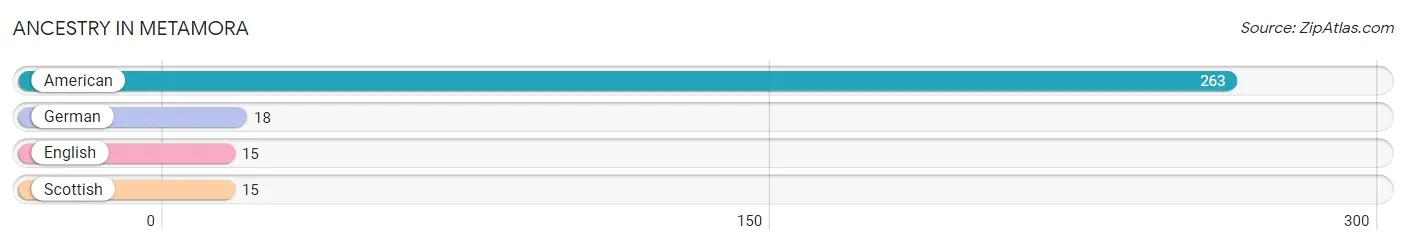
| Ancestry | # Population | % Population |
| American | 263 | 64.9% |
| English | 15 | 3.7% |
| German | 18 | 4.4% |
| Scottish | 15 | 3.7% | View All 4 Rows |
Immigrants in Metamora

| Immigration Origin | # Population | % Population | View All 0 Rows |
Sex and Age in Metamora
Sex and Age in Metamora
The most populous age groups in Metamora are 45 to 49 Years (54 | 28.4%) for men and 50 to 54 Years (55 | 25.6%) for women.
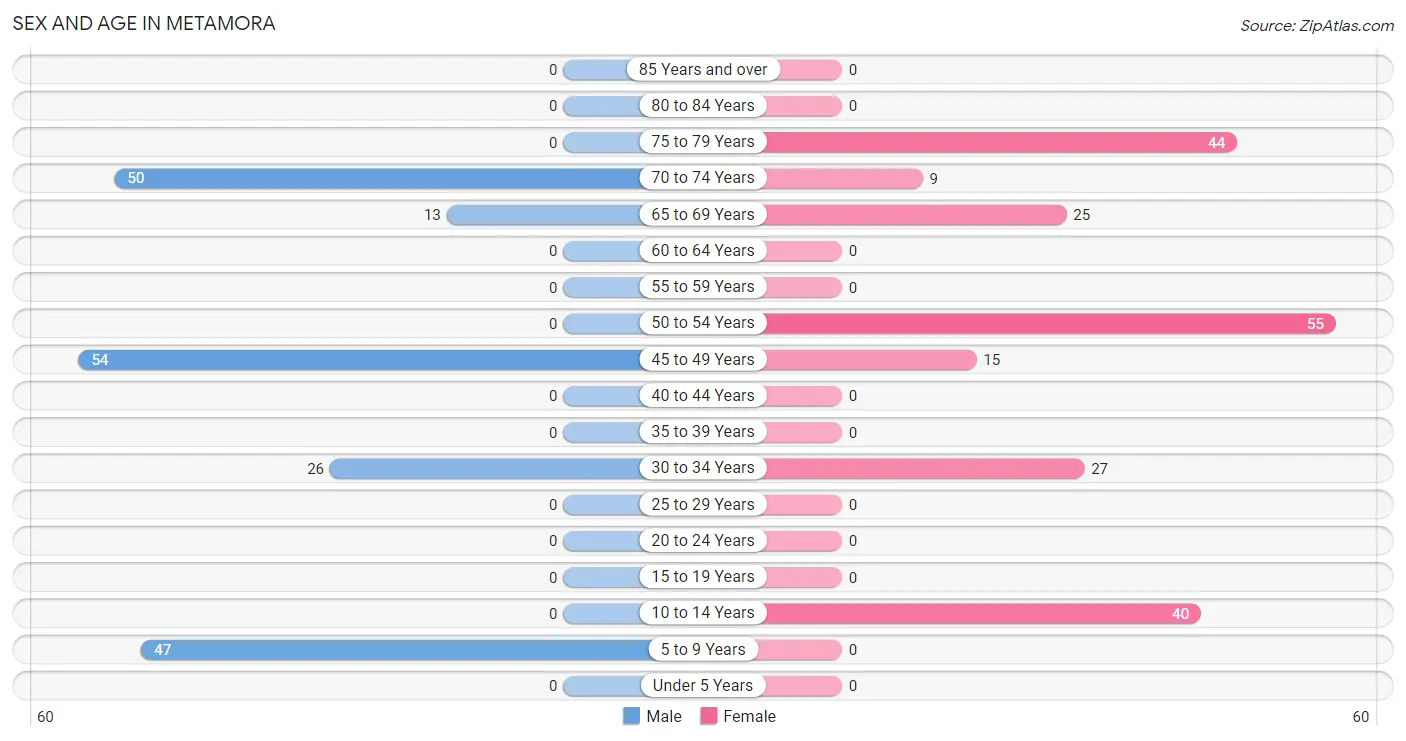
| Age Bracket | Male | Female |
| Under 5 Years | 0 (0.0%) | 0 (0.0%) |
| 5 to 9 Years | 47 (24.7%) | 0 (0.0%) |
| 10 to 14 Years | 0 (0.0%) | 40 (18.6%) |
| 15 to 19 Years | 0 (0.0%) | 0 (0.0%) |
| 20 to 24 Years | 0 (0.0%) | 0 (0.0%) |
| 25 to 29 Years | 0 (0.0%) | 0 (0.0%) |
| 30 to 34 Years | 26 (13.7%) | 27 (12.6%) |
| 35 to 39 Years | 0 (0.0%) | 0 (0.0%) |
| 40 to 44 Years | 0 (0.0%) | 0 (0.0%) |
| 45 to 49 Years | 54 (28.4%) | 15 (7.0%) |
| 50 to 54 Years | 0 (0.0%) | 55 (25.6%) |
| 55 to 59 Years | 0 (0.0%) | 0 (0.0%) |
| 60 to 64 Years | 0 (0.0%) | 0 (0.0%) |
| 65 to 69 Years | 13 (6.8%) | 25 (11.6%) |
| 70 to 74 Years | 50 (26.3%) | 9 (4.2%) |
| 75 to 79 Years | 0 (0.0%) | 44 (20.5%) |
| 80 to 84 Years | 0 (0.0%) | 0 (0.0%) |
| 85 Years and over | 0 (0.0%) | 0 (0.0%) |
| Total | 190 (100.0%) | 215 (100.0%) |
Families and Households in Metamora
Median Family Size in Metamora
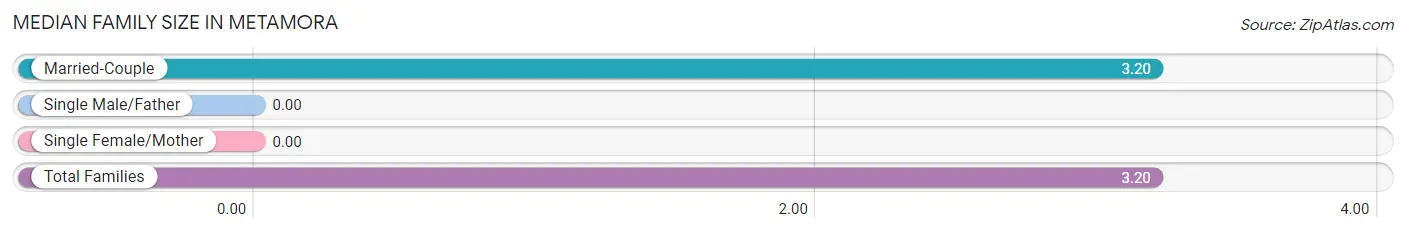
| Family Type | # Families | Family Size |
| Married-Couple | 118 (100.0%) | 3.20 |
| Single Male/Father | 0 (0.0%) | - |
| Single Female/Mother | 0 (0.0%) | - |
| Total Families | 118 (100.0%) | 3.20 |
Median Household Size in Metamora
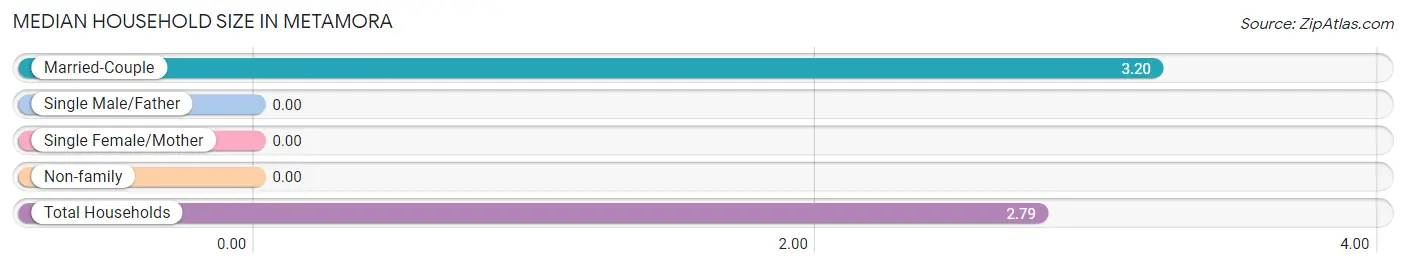
| Household Type | # Households | Household Size |
| Married-Couple | 118 (81.4%) | 3.20 |
| Single Male/Father | 0 (0.0%) | - |
| Single Female/Mother | 0 (0.0%) | - |
| Non-family | 27 (18.6%) | - |
| Total Households | 145 (100.0%) | 2.79 |
Household Size by Marriage Status in Metamora
Out of a total of 145 households in Metamora, 118 (81.4%) are family households, while 27 (18.6%) are nonfamily households. The most numerous type of family households are 2-person households, comprising 63, and the most common type of nonfamily households are 1-person households, comprising 27.
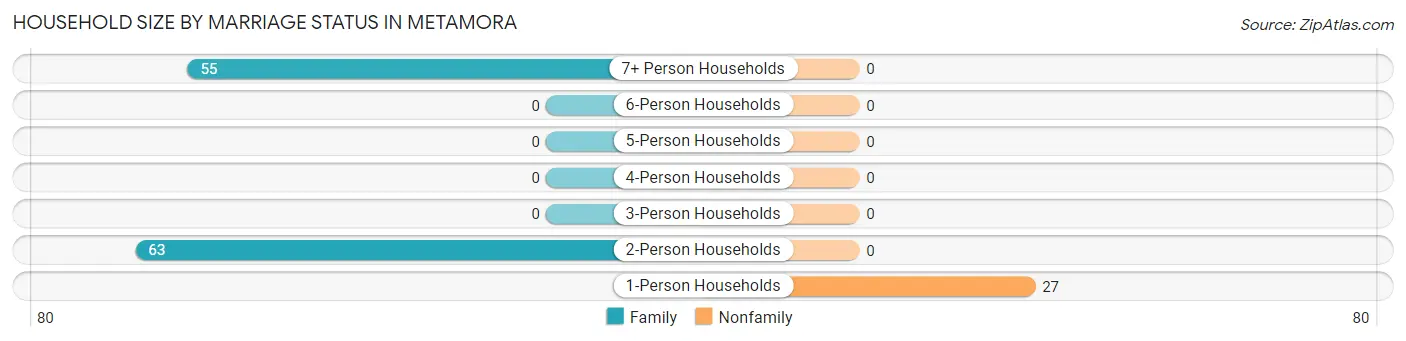
| Household Size | Family Households | Nonfamily Households |
| 1-Person Households | - | 27 (18.6%) |
| 2-Person Households | 63 (43.4%) | 0 (0.0%) |
| 3-Person Households | 0 (0.0%) | 0 (0.0%) |
| 4-Person Households | 0 (0.0%) | 0 (0.0%) |
| 5-Person Households | 0 (0.0%) | 0 (0.0%) |
| 6-Person Households | 0 (0.0%) | 0 (0.0%) |
| 7+ Person Households | 55 (37.9%) | 0 (0.0%) |
| Total | 118 (81.4%) | 27 (18.6%) |
Female Fertility in Metamora
Fertility by Age in Metamora
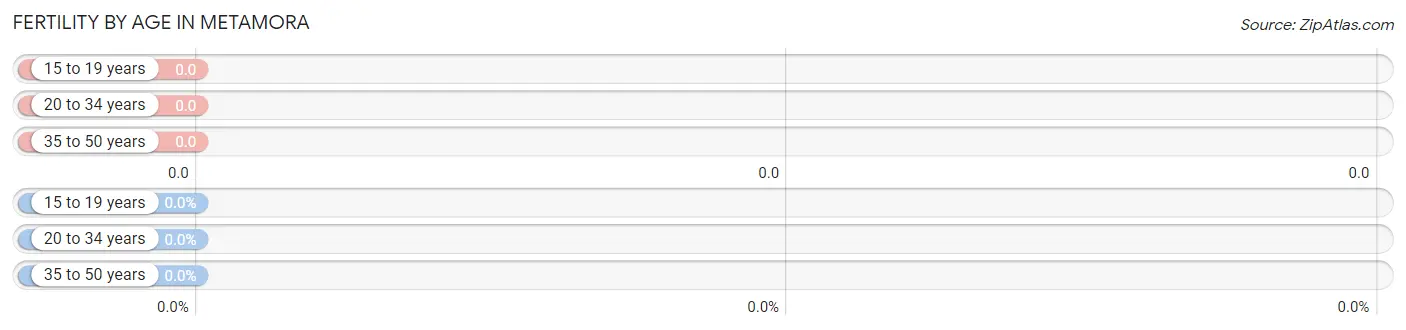
| Age Bracket | Women with Births | Births / 1,000 Women |
| 15 to 19 years | 0 (0.0%) | 0.0 |
| 20 to 34 years | 0 (0.0%) | 0.0 |
| 35 to 50 years | 0 (0.0%) | 0.0 |
| Total | 0 (0.0%) | 0.0 |
Fertility by Age by Marriage Status in Metamora
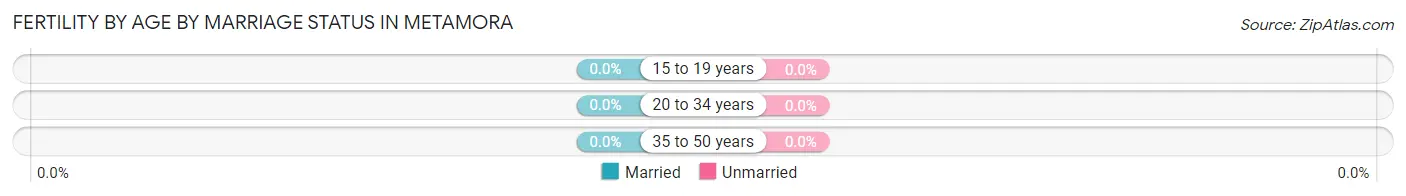
| Age Bracket | Married | Unmarried |
| 15 to 19 years | 0 (0.0%) | 0 (0.0%) |
| 20 to 34 years | 0 (0.0%) | 0 (0.0%) |
| 35 to 50 years | 0 (0.0%) | 0 (0.0%) |
| Total | 0 (0.0%) | 0 (0.0%) |
Fertility by Education in Metamora
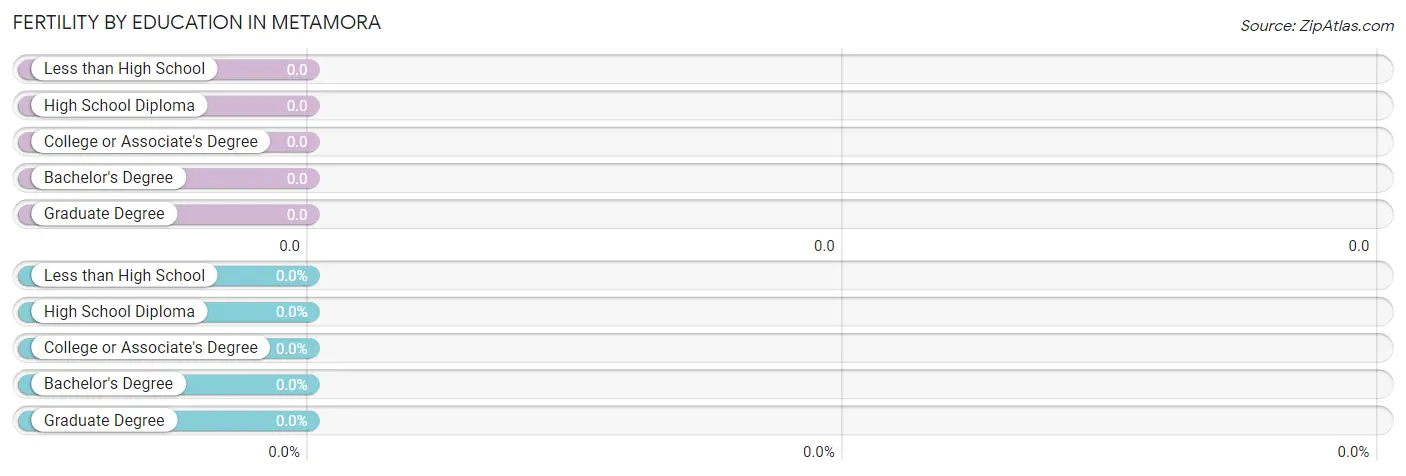
| Educational Attainment | Women with Births | Births / 1,000 Women |
| Less than High School | 0 (0.0%) | 0.0 |
| High School Diploma | 0 (0.0%) | 0.0 |
| College or Associate's Degree | 0 (0.0%) | 0.0 |
| Bachelor's Degree | 0 (0.0%) | 0.0 |
| Graduate Degree | 0 (0.0%) | 0.0 |
| Total | 0 (0.0%) | 0.0 |
Fertility by Education by Marriage Status in Metamora
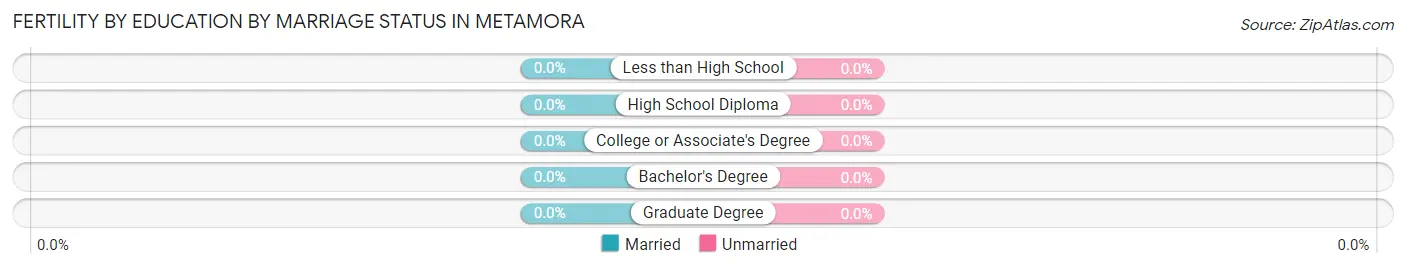
| Educational Attainment | Married | Unmarried |
| Less than High School | 0 (0.0%) | 0 (0.0%) |
| High School Diploma | 0 (0.0%) | 0 (0.0%) |
| College or Associate's Degree | 0 (0.0%) | 0 (0.0%) |
| Bachelor's Degree | 0 (0.0%) | 0 (0.0%) |
| Graduate Degree | 0 (0.0%) | 0 (0.0%) |
| Total | 0 (0.0%) | 0 (0.0%) |
Employment Characteristics in Metamora
Employment by Class of Employer in Metamora
Among the 82 employed individuals in Metamora, private company employees (67 | 81.7%), and self-employed (not incorporated) (15 | 18.3%) make up the most common classes of employment.
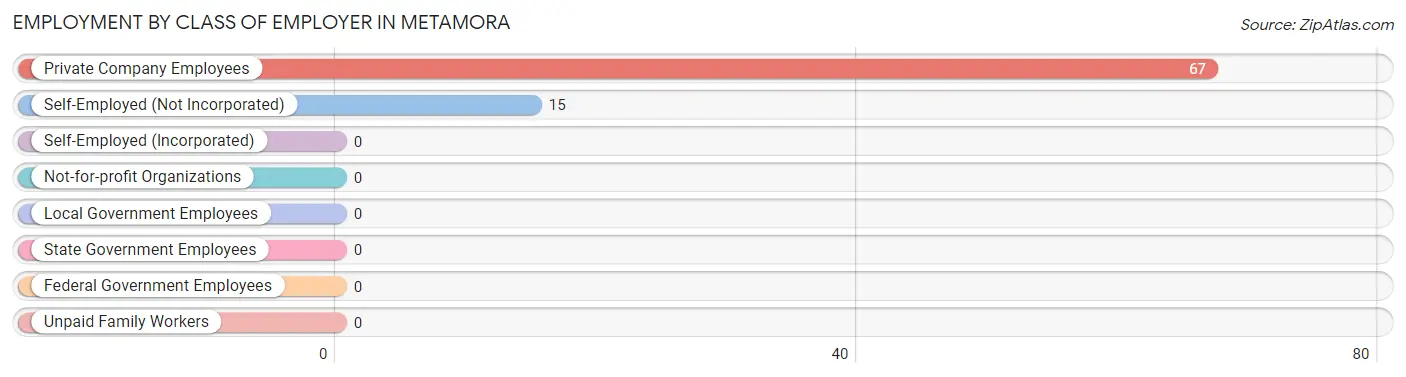
| Employer Class | # Employees | % Employees |
| Private Company Employees | 67 | 81.7% |
| Self-Employed (Incorporated) | 0 | 0.0% |
| Self-Employed (Not Incorporated) | 15 | 18.3% |
| Not-for-profit Organizations | 0 | 0.0% |
| Local Government Employees | 0 | 0.0% |
| State Government Employees | 0 | 0.0% |
| Federal Government Employees | 0 | 0.0% |
| Unpaid Family Workers | 0 | 0.0% |
| Total | 82 | 100.0% |
Employment Status by Age in Metamora
According to the labor force statistics for Metamora, out of the total population over 16 years of age (318), 34.3% or 109 individuals are in the labor force, with 24.8% or 27 of them unemployed. The age group with the highest labor force participation rate is 45 to 54 years, with 55.6% or 69 individuals in the labor force. Within the labor force, the 30 to 34 years age range has the highest percentage of unemployed individuals, with 100.0% or 27 of them being unemployed.
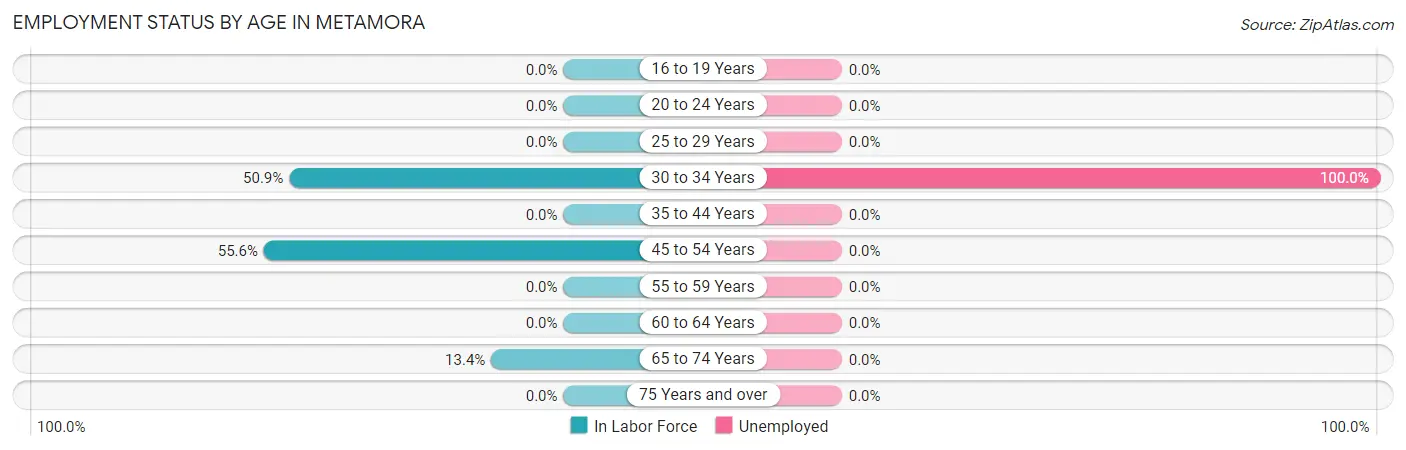
| Age Bracket | In Labor Force | Unemployed |
| 16 to 19 Years | 0 (0.0%) | 0 (0.0%) |
| 20 to 24 Years | 0 (0.0%) | 0 (0.0%) |
| 25 to 29 Years | 0 (0.0%) | 0 (0.0%) |
| 30 to 34 Years | 27 (50.9%) | 27 (100.0%) |
| 35 to 44 Years | 0 (0.0%) | 0 (0.0%) |
| 45 to 54 Years | 69 (55.6%) | 0 (0.0%) |
| 55 to 59 Years | 0 (0.0%) | 0 (0.0%) |
| 60 to 64 Years | 0 (0.0%) | 0 (0.0%) |
| 65 to 74 Years | 13 (13.4%) | 0 (0.0%) |
| 75 Years and over | 0 (0.0%) | 0 (0.0%) |
| Total | 109 (34.3%) | 27 (24.8%) |
Employment Status by Educational Attainment in Metamora
According to labor force statistics for Metamora, 54.2% of individuals (96) out of the total population between 25 and 64 years of age (177) are in the labor force, with 28.1% or 27 of them being unemployed. The group with the highest labor force participation rate are those with the educational attainment of college / associate degree, with 100.0% or 15 individuals in the labor force. Within the labor force, individuals with high school diploma education have the highest percentage of unemployment, with 33.3% or 27 of them being unemployed.
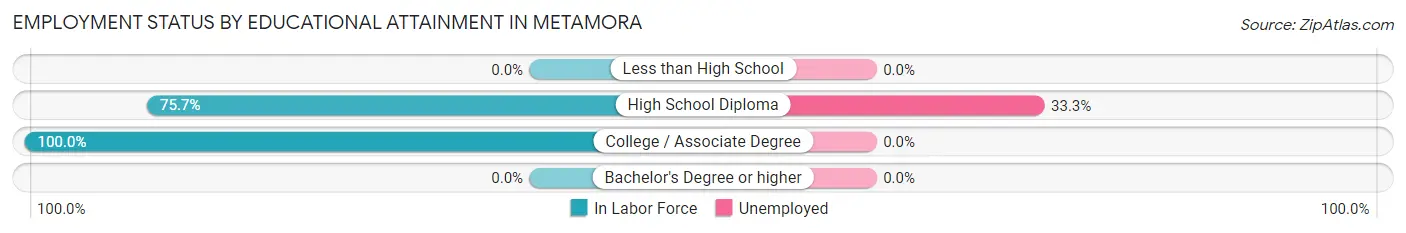
| Educational Attainment | In Labor Force | Unemployed |
| Less than High School | 0 (0.0%) | 0 (0.0%) |
| High School Diploma | 81 (75.7%) | 36 (33.3%) |
| College / Associate Degree | 15 (100.0%) | 0 (0.0%) |
| Bachelor's Degree or higher | 0 (0.0%) | 0 (0.0%) |
| Total | 96 (54.2%) | 50 (28.1%) |
Employment Occupations by Sex in Metamora
Management, Business, Science and Arts Occupations
Management, Business, Science and Arts Occupations by Sex
| Occupation | Male | Female |
| Management | 0 (0.0%) | 0 (0.0%) |
| Business & Financial | 0 (0.0%) | 0 (0.0%) |
| Computers, Engineering & Science | 0 (0.0%) | 0 (0.0%) |
| Computers & Mathematics | 0 (0.0%) | 0 (0.0%) |
| Architecture & Engineering | 0 (0.0%) | 0 (0.0%) |
| Life, Physical & Social Science | 0 (0.0%) | 0 (0.0%) |
| Community & Social Service | 0 (0.0%) | 0 (0.0%) |
| Education, Arts & Media | 0 (0.0%) | 0 (0.0%) |
| Legal Services & Support | 0 (0.0%) | 0 (0.0%) |
| Education Instruction & Library | 0 (0.0%) | 0 (0.0%) |
| Arts, Media & Entertainment | 0 (0.0%) | 0 (0.0%) |
| Health Diagnosing & Treating | 0 (0.0%) | 0 (0.0%) |
| Health Technologists | 0 (0.0%) | 0 (0.0%) |
| Total (Category) | 0 (0.0%) | 0 (0.0%) |
| Total (Overall) | 67 (81.7%) | 15 (18.3%) |
Services Occupations
Services Occupations by Sex
| Occupation | Male | Female |
| Healthcare Support | 0 (0.0%) | 0 (0.0%) |
| Security & Protection | 0 (0.0%) | 0 (0.0%) |
| Firefighting & Prevention | 0 (0.0%) | 0 (0.0%) |
| Law Enforcement | 0 (0.0%) | 0 (0.0%) |
| Food Preparation & Serving | 0 (0.0%) | 0 (0.0%) |
| Cleaning & Maintenance | 0 (0.0%) | 0 (0.0%) |
| Personal Care & Service | 0 (0.0%) | 0 (0.0%) |
| Total (Category) | 0 (0.0%) | 0 (0.0%) |
| Total (Overall) | 67 (81.7%) | 15 (18.3%) |
Sales and Office Occupations
Sales and Office Occupations by Sex
| Occupation | Male | Female |
| Sales & Related | 0 (0.0%) | 0 (0.0%) |
| Office & Administration | 0 (0.0%) | 0 (0.0%) |
| Total (Category) | 0 (0.0%) | 0 (0.0%) |
| Total (Overall) | 67 (81.7%) | 15 (18.3%) |
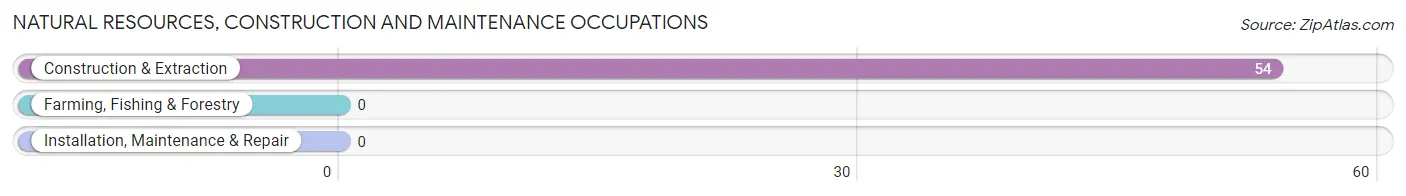
Natural Resources, Construction and Maintenance Occupations
The most common Natural Resources, Construction and Maintenance occupations in Metamora are , and Construction & Extraction (54 | 65.8%).
Natural Resources, Construction and Maintenance Occupations by Sex
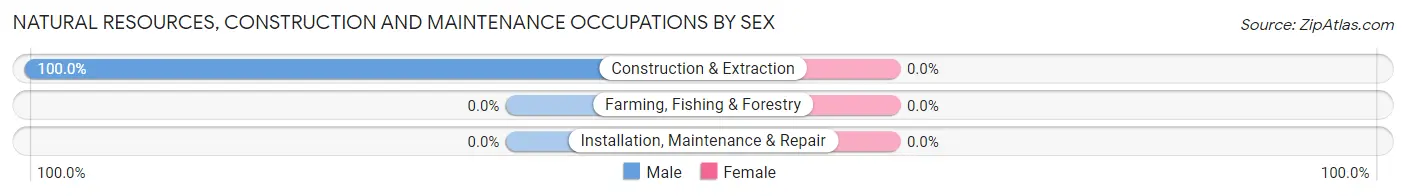
| Occupation | Male | Female |
| Farming, Fishing & Forestry | 0 (0.0%) | 0 (0.0%) |
| Construction & Extraction | 54 (100.0%) | 0 (0.0%) |
| Installation, Maintenance & Repair | 0 (0.0%) | 0 (0.0%) |
| Total (Category) | 54 (100.0%) | 0 (0.0%) |
| Total (Overall) | 67 (81.7%) | 15 (18.3%) |
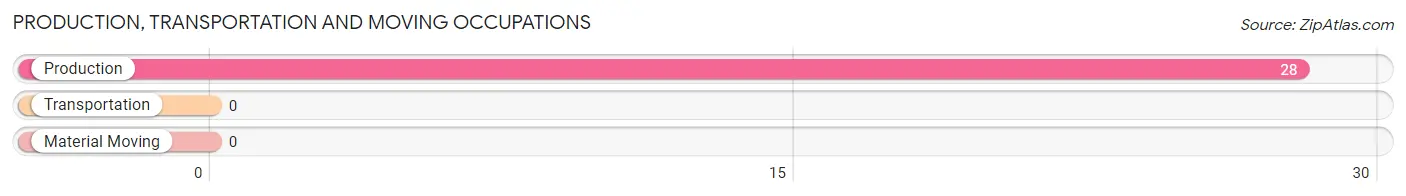
Production, Transportation and Moving Occupations
The most common Production, Transportation and Moving occupations in Metamora are , and Production (28 | 34.2%).
Production, Transportation and Moving Occupations by Sex
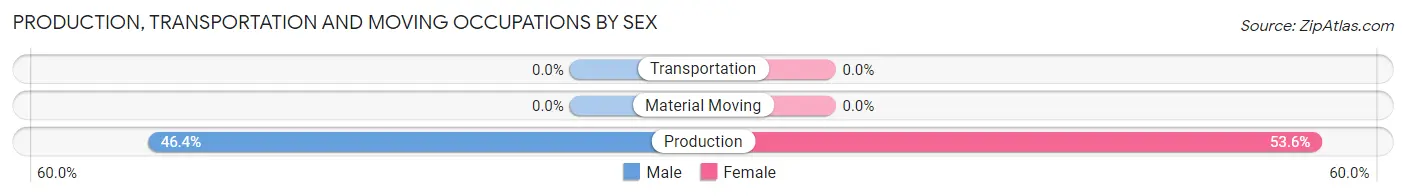
| Occupation | Male | Female |
| Production | 13 (46.4%) | 15 (53.6%) |
| Transportation | 0 (0.0%) | 0 (0.0%) |
| Material Moving | 0 (0.0%) | 0 (0.0%) |
| Total (Category) | 13 (46.4%) | 15 (53.6%) |
| Total (Overall) | 67 (81.7%) | 15 (18.3%) |
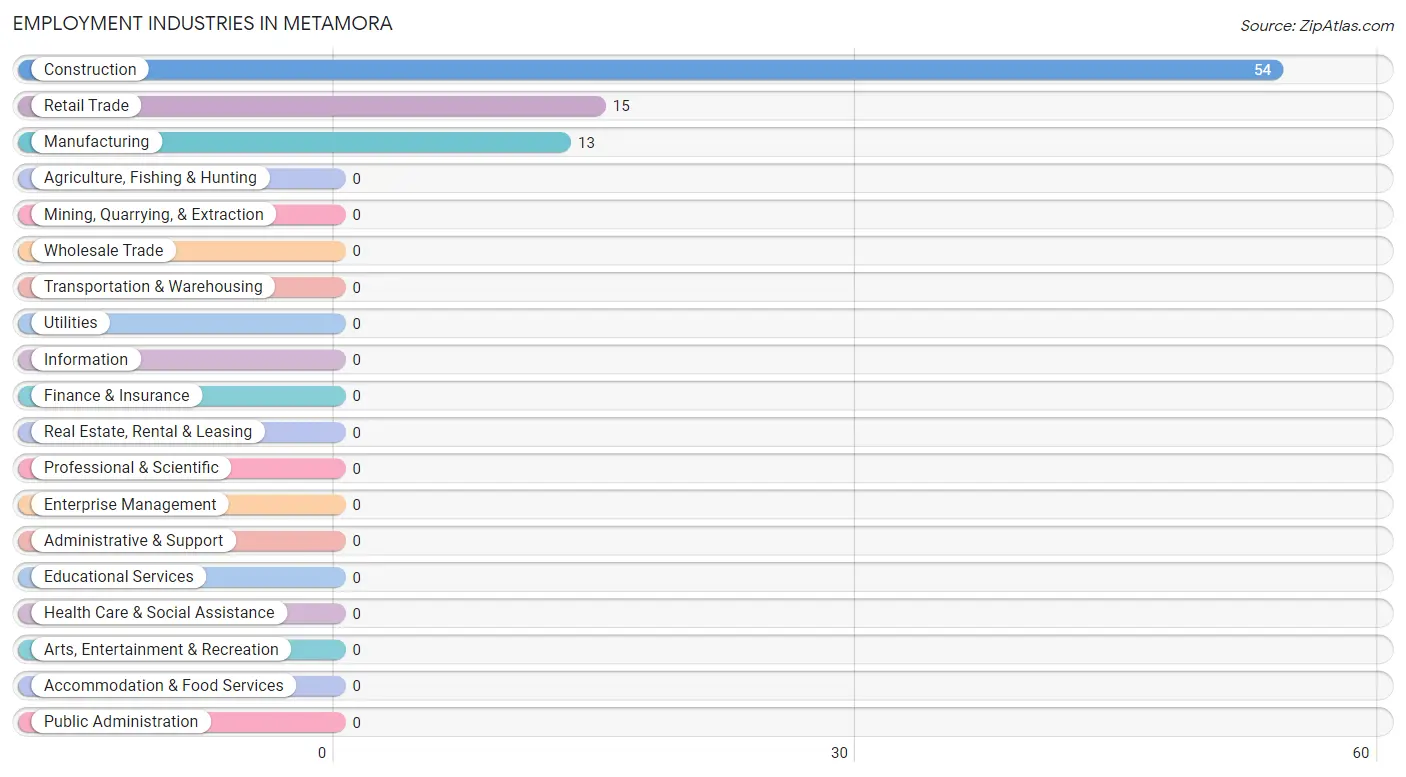
Employment Industries by Sex in Metamora
Employment Industries in Metamora
The major employment industries in Metamora include Construction (54 | 65.8%), Retail Trade (15 | 18.3%), and Manufacturing (13 | 15.9%).
Employment Industries by Sex in Metamora
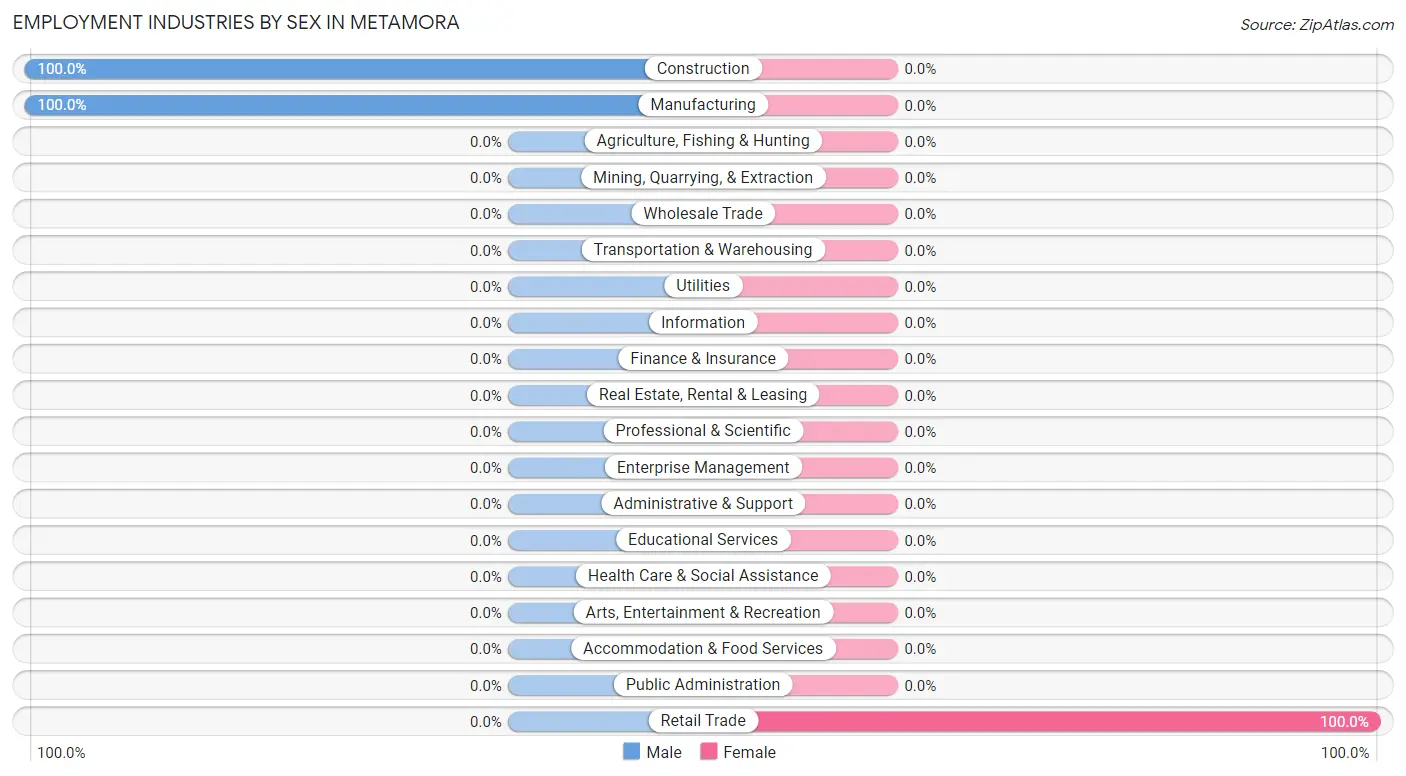
| Industry | Male | Female |
| Agriculture, Fishing & Hunting | 0 (0.0%) | 0 (0.0%) |
| Mining, Quarrying, & Extraction | 0 (0.0%) | 0 (0.0%) |
| Construction | 54 (100.0%) | 0 (0.0%) |
| Manufacturing | 13 (100.0%) | 0 (0.0%) |
| Wholesale Trade | 0 (0.0%) | 0 (0.0%) |
| Retail Trade | 0 (0.0%) | 15 (100.0%) |
| Transportation & Warehousing | 0 (0.0%) | 0 (0.0%) |
| Utilities | 0 (0.0%) | 0 (0.0%) |
| Information | 0 (0.0%) | 0 (0.0%) |
| Finance & Insurance | 0 (0.0%) | 0 (0.0%) |
| Real Estate, Rental & Leasing | 0 (0.0%) | 0 (0.0%) |
| Professional & Scientific | 0 (0.0%) | 0 (0.0%) |
| Enterprise Management | 0 (0.0%) | 0 (0.0%) |
| Administrative & Support | 0 (0.0%) | 0 (0.0%) |
| Educational Services | 0 (0.0%) | 0 (0.0%) |
| Health Care & Social Assistance | 0 (0.0%) | 0 (0.0%) |
| Arts, Entertainment & Recreation | 0 (0.0%) | 0 (0.0%) |
| Accommodation & Food Services | 0 (0.0%) | 0 (0.0%) |
| Public Administration | 0 (0.0%) | 0 (0.0%) |
| Total | 67 (81.7%) | 15 (18.3%) |
Education in Metamora
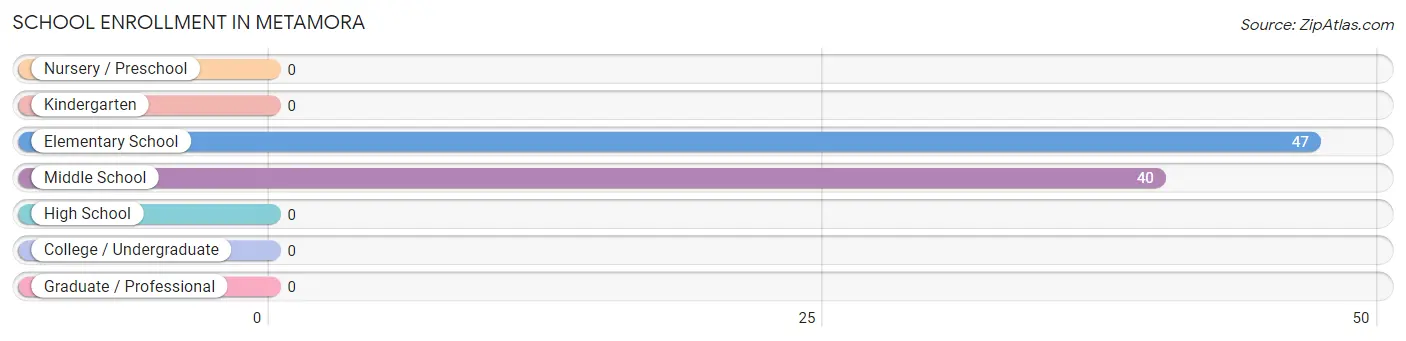
School Enrollment in Metamora
The most common levels of schooling among the 87 students in Metamora are elementary school (47 | 54.0%), and middle school (40 | 46.0%).
| School Level | # Students | % Students |
| Nursery / Preschool | 0 | 0.0% |
| Kindergarten | 0 | 0.0% |
| Elementary School | 47 | 54.0% |
| Middle School | 40 | 46.0% |
| High School | 0 | 0.0% |
| College / Undergraduate | 0 | 0.0% |
| Graduate / Professional | 0 | 0.0% |
| Total | 87 | 100.0% |
School Enrollment by Age by Funding Source in Metamora
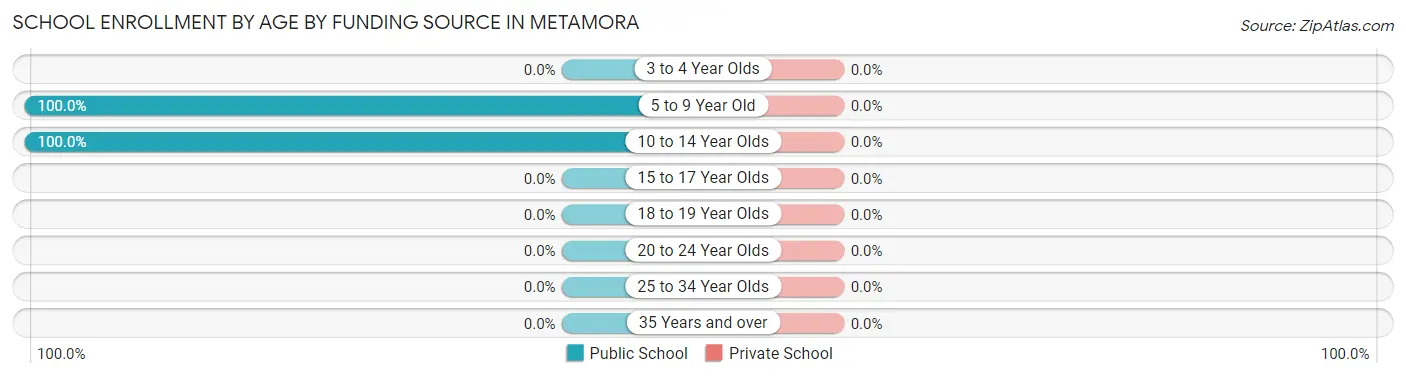
| Age Bracket | Public School | Private School |
| 3 to 4 Year Olds | 0 (0.0%) | 0 (0.0%) |
| 5 to 9 Year Old | 47 (100.0%) | 0 (0.0%) |
| 10 to 14 Year Olds | 40 (100.0%) | 0 (0.0%) |
| 15 to 17 Year Olds | 0 (0.0%) | 0 (0.0%) |
| 18 to 19 Year Olds | 0 (0.0%) | 0 (0.0%) |
| 20 to 24 Year Olds | 0 (0.0%) | 0 (0.0%) |
| 25 to 34 Year Olds | 0 (0.0%) | 0 (0.0%) |
| 35 Years and over | 0 (0.0%) | 0 (0.0%) |
| Total | 87 (100.0%) | 0 (0.0%) |
Educational Attainment by Field of Study in Metamora
, and education (13 | 100.0%) are the most common fields of study among 13 individuals in Metamora who have obtained a bachelor's degree or higher.
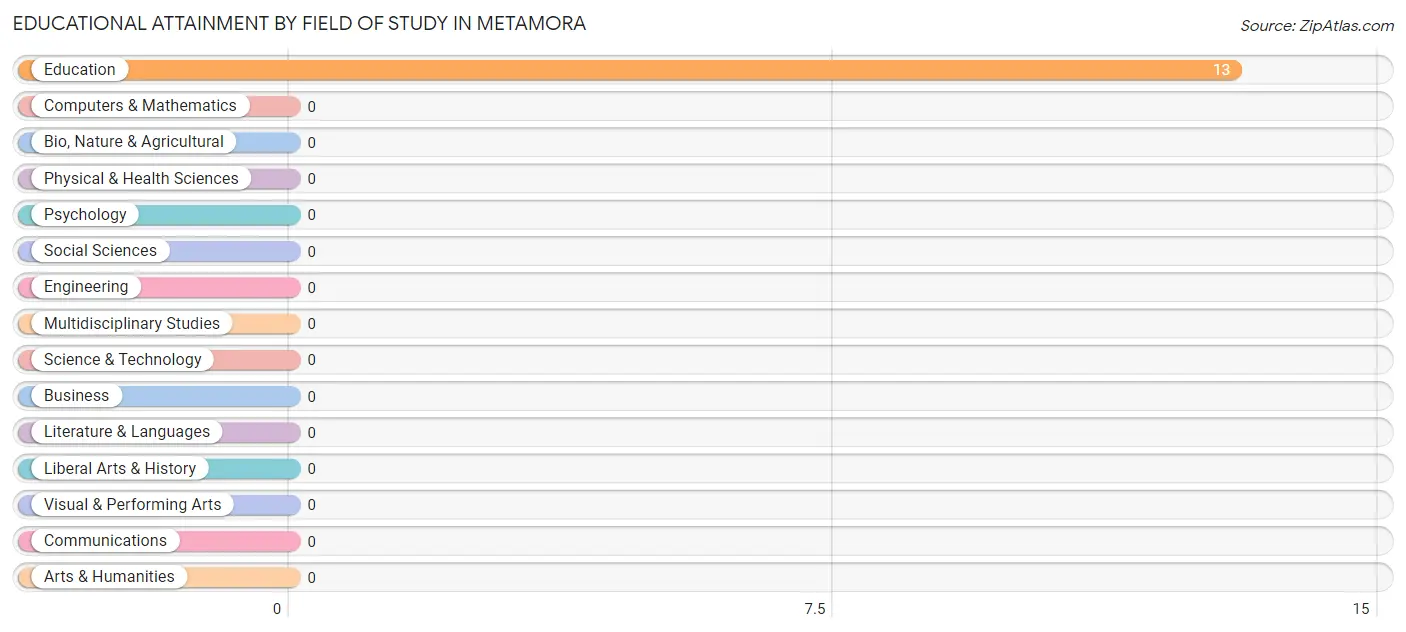
| Field of Study | # Graduates | % Graduates |
| Computers & Mathematics | 0 | 0.0% |
| Bio, Nature & Agricultural | 0 | 0.0% |
| Physical & Health Sciences | 0 | 0.0% |
| Psychology | 0 | 0.0% |
| Social Sciences | 0 | 0.0% |
| Engineering | 0 | 0.0% |
| Multidisciplinary Studies | 0 | 0.0% |
| Science & Technology | 0 | 0.0% |
| Business | 0 | 0.0% |
| Education | 13 | 100.0% |
| Literature & Languages | 0 | 0.0% |
| Liberal Arts & History | 0 | 0.0% |
| Visual & Performing Arts | 0 | 0.0% |
| Communications | 0 | 0.0% |
| Arts & Humanities | 0 | 0.0% |
| Total | 13 | 100.0% |
Transportation & Commute in Metamora
Vehicle Availability by Sex in Metamora
The most prevalent vehicle ownership categories in Metamora are males with 4 vehicles (54, accounting for 80.6%) and females with 4 vehicles (0, making up 360.0%).
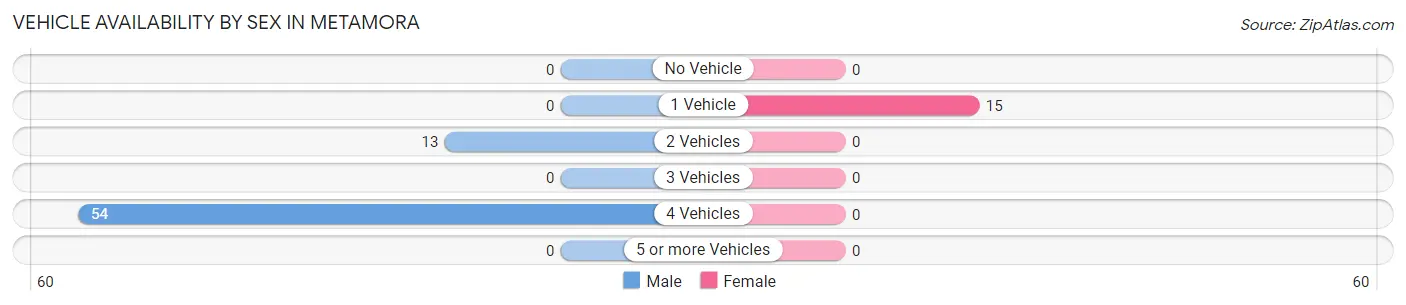
| Vehicles Available | Male | Female |
| No Vehicle | 0 (0.0%) | 0 (0.0%) |
| 1 Vehicle | 0 (0.0%) | 15 (100.0%) |
| 2 Vehicles | 13 (19.4%) | 0 (0.0%) |
| 3 Vehicles | 0 (0.0%) | 0 (0.0%) |
| 4 Vehicles | 54 (80.6%) | 0 (0.0%) |
| 5 or more Vehicles | 0 (0.0%) | 0 (0.0%) |
| Total | 67 (100.0%) | 15 (100.0%) |
Commute Time in Metamora
The most frequently occuring commute durations in Metamora are less than 5 minutes (54 commuters, 80.6%), 90 or more minutes (13 commuters, 19.4%), and 5 to 9 minutes (0 commuters, 0.0%).
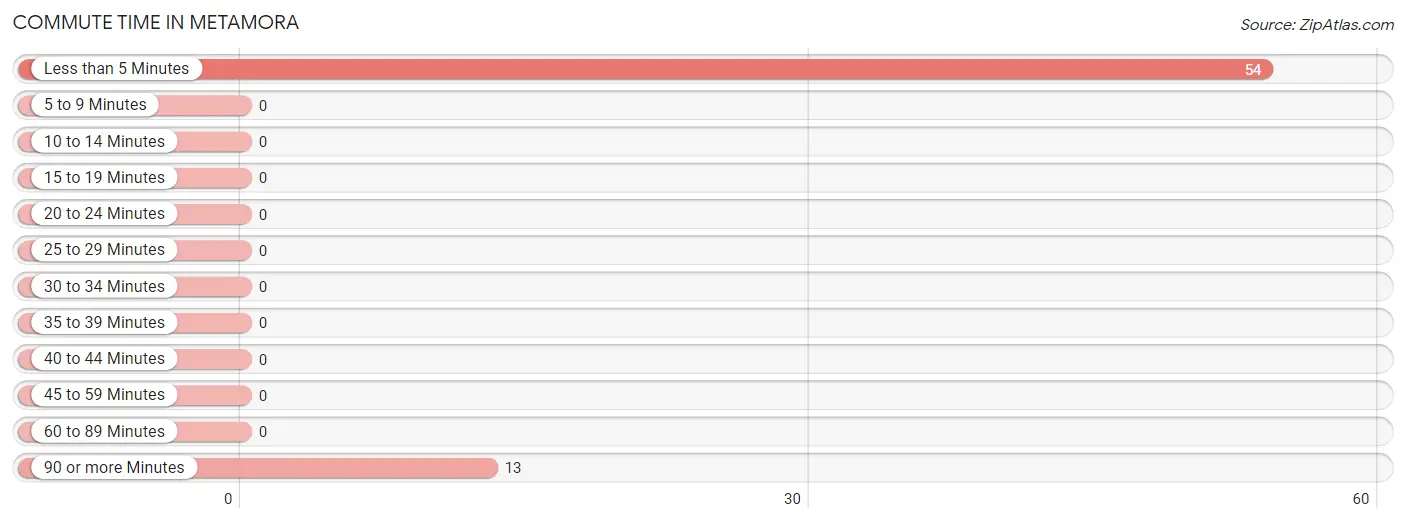
| Commute Time | # Commuters | % Commuters |
| Less than 5 Minutes | 54 | 80.6% |
| 5 to 9 Minutes | 0 | 0.0% |
| 10 to 14 Minutes | 0 | 0.0% |
| 15 to 19 Minutes | 0 | 0.0% |
| 20 to 24 Minutes | 0 | 0.0% |
| 25 to 29 Minutes | 0 | 0.0% |
| 30 to 34 Minutes | 0 | 0.0% |
| 35 to 39 Minutes | 0 | 0.0% |
| 40 to 44 Minutes | 0 | 0.0% |
| 45 to 59 Minutes | 0 | 0.0% |
| 60 to 89 Minutes | 0 | 0.0% |
| 90 or more Minutes | 13 | 19.4% |
Commute Time by Sex in Metamora
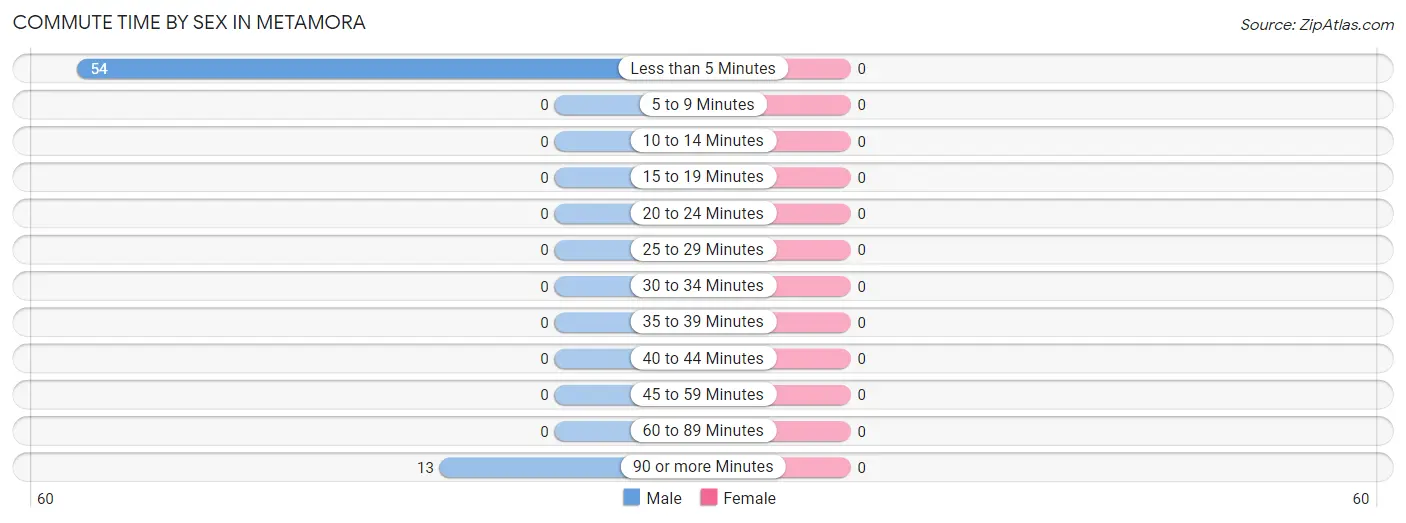
| Commute Time | Male | Female |
| Less than 5 Minutes | 54 (80.6%) | 0 (0.0%) |
| 5 to 9 Minutes | 0 (0.0%) | 0 (0.0%) |
| 10 to 14 Minutes | 0 (0.0%) | 0 (0.0%) |
| 15 to 19 Minutes | 0 (0.0%) | 0 (0.0%) |
| 20 to 24 Minutes | 0 (0.0%) | 0 (0.0%) |
| 25 to 29 Minutes | 0 (0.0%) | 0 (0.0%) |
| 30 to 34 Minutes | 0 (0.0%) | 0 (0.0%) |
| 35 to 39 Minutes | 0 (0.0%) | 0 (0.0%) |
| 40 to 44 Minutes | 0 (0.0%) | 0 (0.0%) |
| 45 to 59 Minutes | 0 (0.0%) | 0 (0.0%) |
| 60 to 89 Minutes | 0 (0.0%) | 0 (0.0%) |
| 90 or more Minutes | 13 (19.4%) | 0 (0.0%) |
Time of Departure to Work by Sex in Metamora
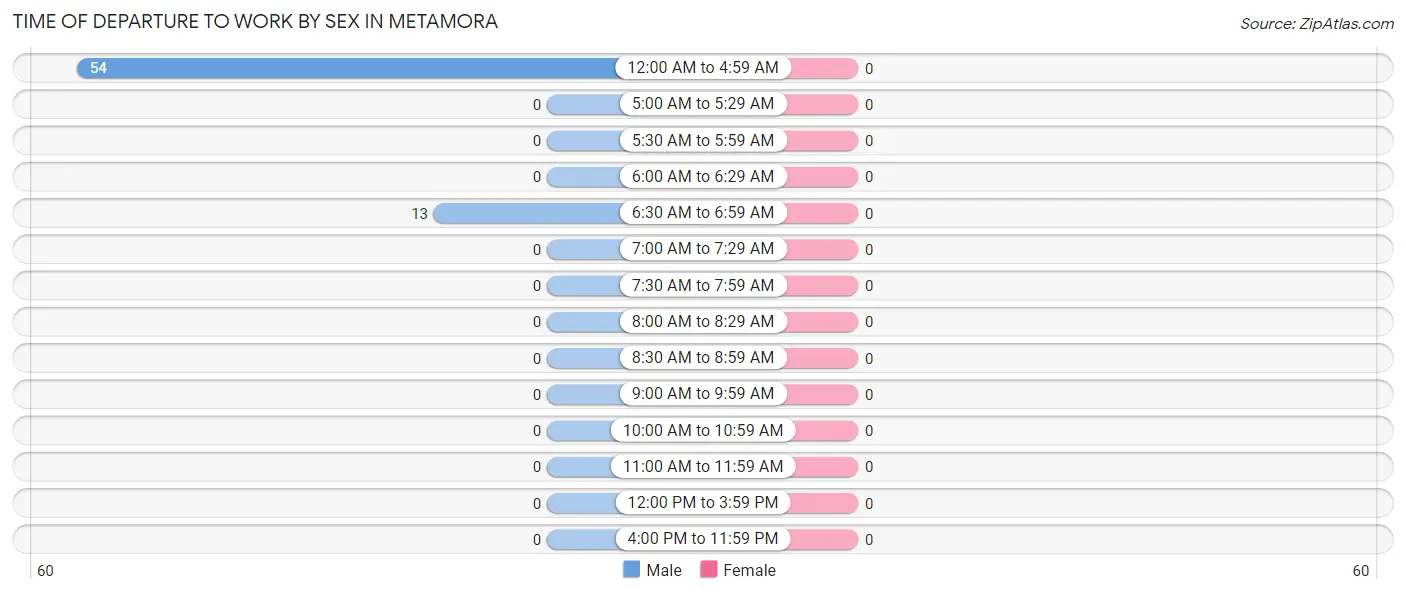
| Time of Departure | Male | Female |
| 12:00 AM to 4:59 AM | 54 (80.6%) | 0 (0.0%) |
| 5:00 AM to 5:29 AM | 0 (0.0%) | 0 (0.0%) |
| 5:30 AM to 5:59 AM | 0 (0.0%) | 0 (0.0%) |
| 6:00 AM to 6:29 AM | 0 (0.0%) | 0 (0.0%) |
| 6:30 AM to 6:59 AM | 13 (19.4%) | 0 (0.0%) |
| 7:00 AM to 7:29 AM | 0 (0.0%) | 0 (0.0%) |
| 7:30 AM to 7:59 AM | 0 (0.0%) | 0 (0.0%) |
| 8:00 AM to 8:29 AM | 0 (0.0%) | 0 (0.0%) |
| 8:30 AM to 8:59 AM | 0 (0.0%) | 0 (0.0%) |
| 9:00 AM to 9:59 AM | 0 (0.0%) | 0 (0.0%) |
| 10:00 AM to 10:59 AM | 0 (0.0%) | 0 (0.0%) |
| 11:00 AM to 11:59 AM | 0 (0.0%) | 0 (0.0%) |
| 12:00 PM to 3:59 PM | 0 (0.0%) | 0 (0.0%) |
| 4:00 PM to 11:59 PM | 0 (0.0%) | 0 (0.0%) |
| Total | 67 (100.0%) | 0 (0.0%) |
Housing Occupancy in Metamora
Occupancy by Ownership in Metamora
Of the total 145 dwellings in Metamora, owner-occupied units account for 132 (91.0%), while renter-occupied units make up 13 (9.0%).
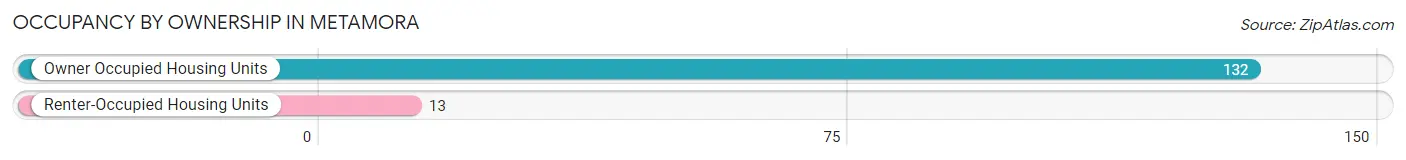
| Occupancy | # Housing Units | % Housing Units |
| Owner Occupied Housing Units | 132 | 91.0% |
| Renter-Occupied Housing Units | 13 | 9.0% |
| Total Occupied Housing Units | 145 | 100.0% |
Occupancy by Household Size in Metamora
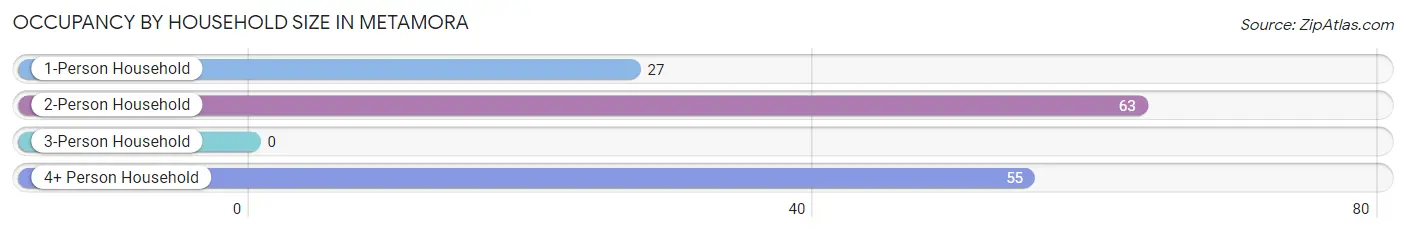
| Household Size | # Housing Units | % Housing Units |
| 1-Person Household | 27 | 18.6% |
| 2-Person Household | 63 | 43.4% |
| 3-Person Household | 0 | 0.0% |
| 4+ Person Household | 55 | 37.9% |
| Total Housing Units | 145 | 100.0% |
Occupancy by Ownership by Household Size in Metamora
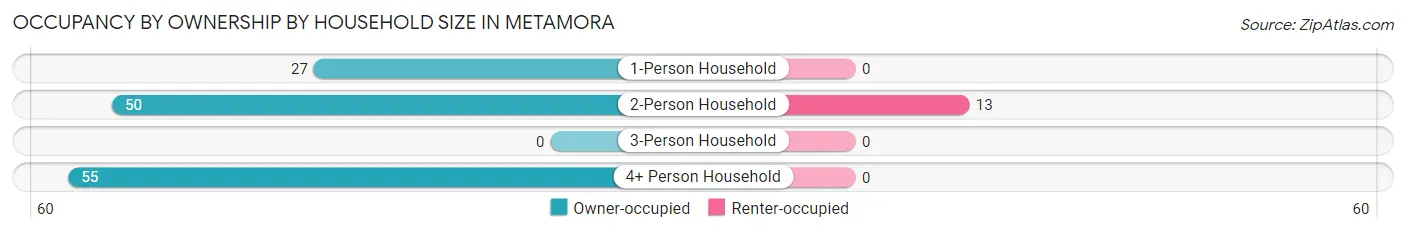
| Household Size | Owner-occupied | Renter-occupied |
| 1-Person Household | 27 (100.0%) | 0 (0.0%) |
| 2-Person Household | 50 (79.4%) | 13 (20.6%) |
| 3-Person Household | 0 (0.0%) | 0 (0.0%) |
| 4+ Person Household | 55 (100.0%) | 0 (0.0%) |
| Total Housing Units | 132 (91.0%) | 13 (9.0%) |
Occupancy by Educational Attainment in Metamora
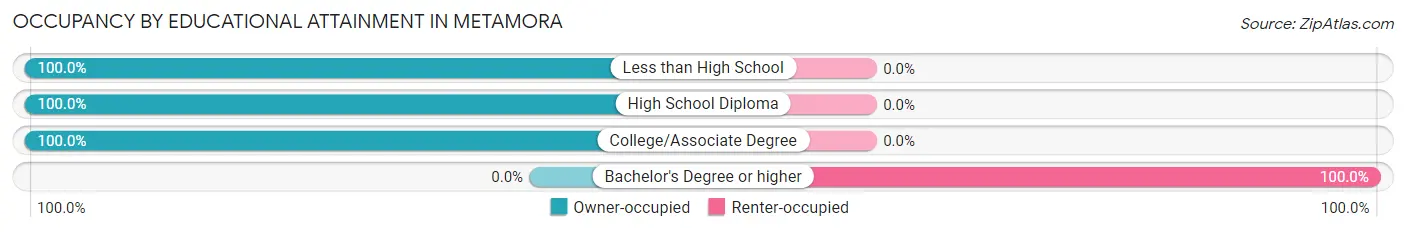
| Household Size | Owner-occupied | Renter-occupied |
| Less than High School | 105 (100.0%) | 0 (0.0%) |
| High School Diploma | 12 (100.0%) | 0 (0.0%) |
| College/Associate Degree | 15 (100.0%) | 0 (0.0%) |
| Bachelor's Degree or higher | 0 (0.0%) | 13 (100.0%) |
Occupancy by Age of Householder in Metamora
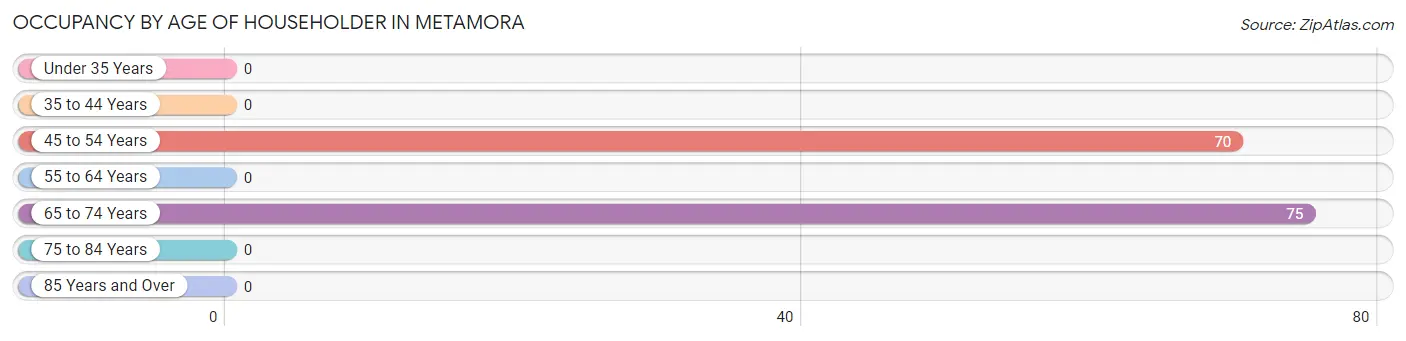
| Age Bracket | # Households | % Households |
| Under 35 Years | 0 | 0.0% |
| 35 to 44 Years | 0 | 0.0% |
| 45 to 54 Years | 70 | 48.3% |
| 55 to 64 Years | 0 | 0.0% |
| 65 to 74 Years | 75 | 51.7% |
| 75 to 84 Years | 0 | 0.0% |
| 85 Years and Over | 0 | 0.0% |
| Total | 145 | 100.0% |
Housing Finances in Metamora
Median Income by Occupancy in Metamora
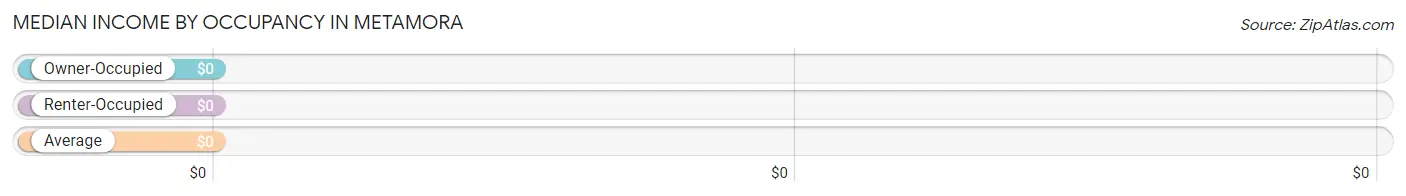
| Occupancy Type | # Households | Median Income |
| Owner-Occupied | 132 (91.0%) | $0 |
| Renter-Occupied | 13 (9.0%) | $0 |
| Average | 145 (100.0%) | $0 |
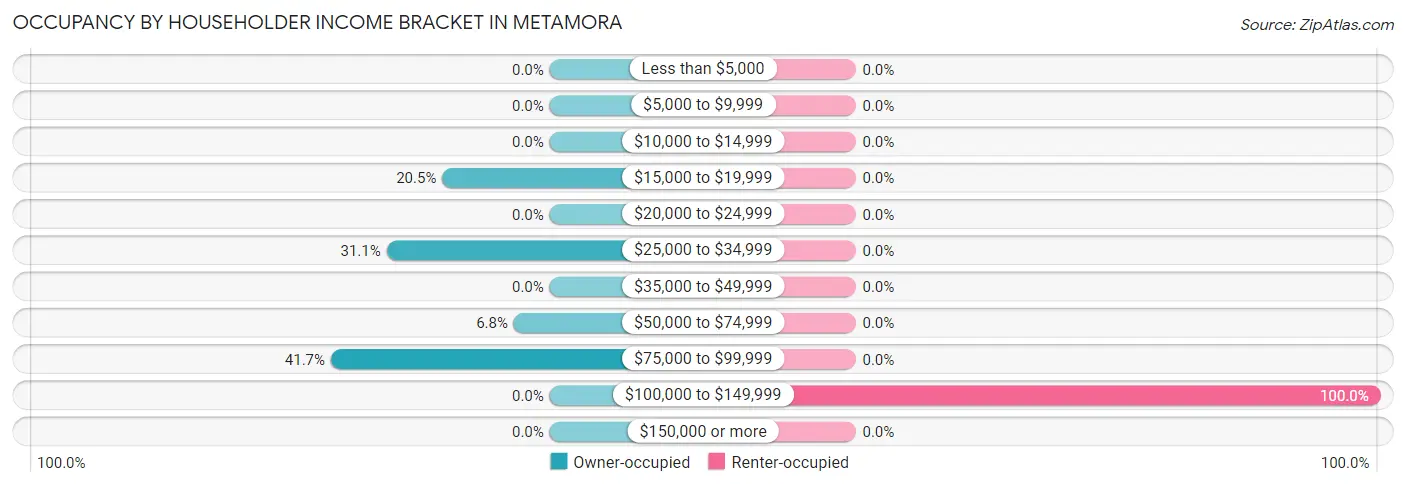
Occupancy by Householder Income Bracket in Metamora
| Income Bracket | Owner-occupied | Renter-occupied |
| Less than $5,000 | 0 (0.0%) | 0 (0.0%) |
| $5,000 to $9,999 | 0 (0.0%) | 0 (0.0%) |
| $10,000 to $14,999 | 0 (0.0%) | 0 (0.0%) |
| $15,000 to $19,999 | 27 (20.4%) | 0 (0.0%) |
| $20,000 to $24,999 | 0 (0.0%) | 0 (0.0%) |
| $25,000 to $34,999 | 41 (31.1%) | 0 (0.0%) |
| $35,000 to $49,999 | 0 (0.0%) | 0 (0.0%) |
| $50,000 to $74,999 | 9 (6.8%) | 0 (0.0%) |
| $75,000 to $99,999 | 55 (41.7%) | 0 (0.0%) |
| $100,000 to $149,999 | 0 (0.0%) | 13 (100.0%) |
| $150,000 or more | 0 (0.0%) | 0 (0.0%) |
| Total | 132 (100.0%) | 13 (100.0%) |
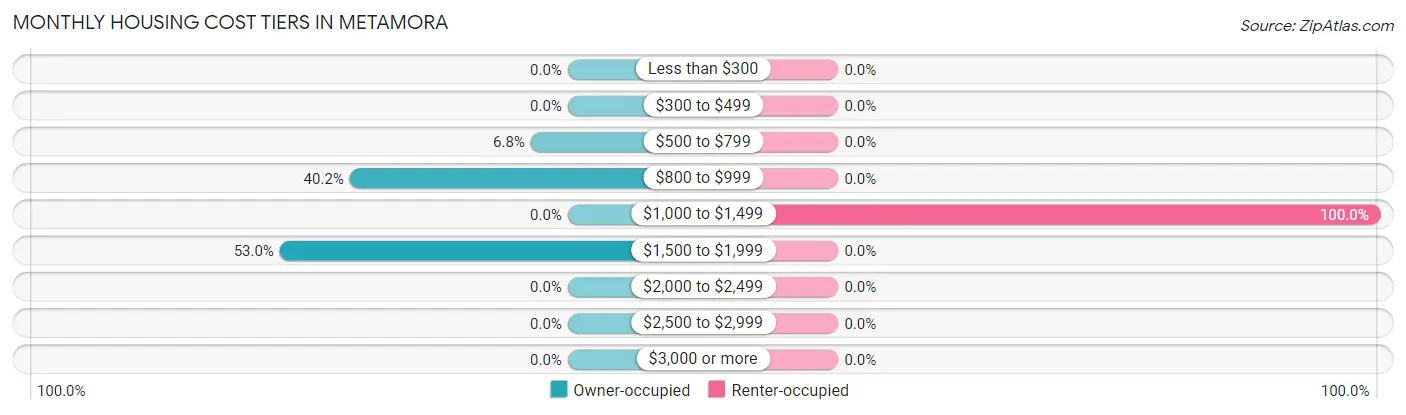
Monthly Housing Cost Tiers in Metamora
| Monthly Cost | Owner-occupied | Renter-occupied |
| Less than $300 | 0 (0.0%) | 0 (0.0%) |
| $300 to $499 | 0 (0.0%) | 0 (0.0%) |
| $500 to $799 | 9 (6.8%) | 0 (0.0%) |
| $800 to $999 | 53 (40.2%) | 0 (0.0%) |
| $1,000 to $1,499 | 0 (0.0%) | 13 (100.0%) |
| $1,500 to $1,999 | 70 (53.0%) | 0 (0.0%) |
| $2,000 to $2,499 | 0 (0.0%) | 0 (0.0%) |
| $2,500 to $2,999 | 0 (0.0%) | 0 (0.0%) |
| $3,000 or more | 0 (0.0%) | 0 (0.0%) |
| Total | 132 (100.0%) | 13 (100.0%) |
Physical Housing Characteristics in Metamora
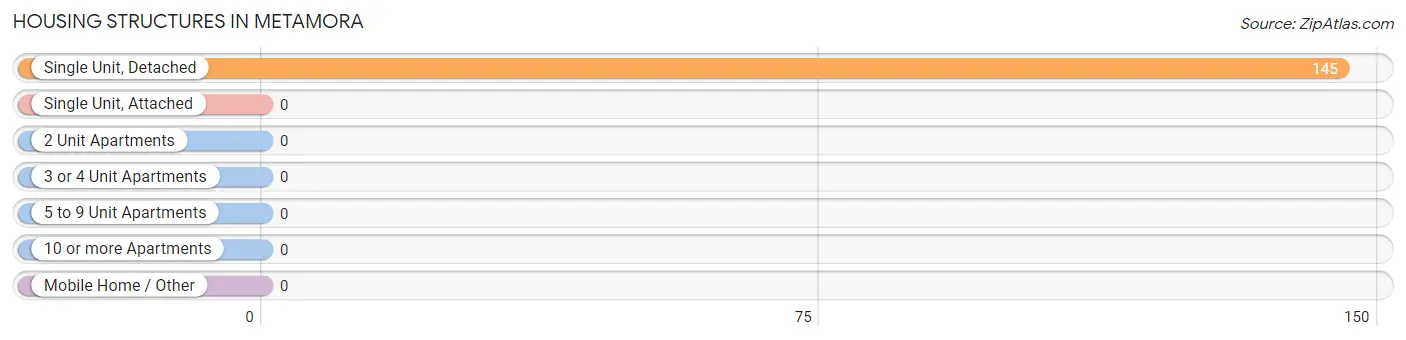
Housing Structures in Metamora
| Structure Type | # Housing Units | % Housing Units |
| Single Unit, Detached | 145 | 100.0% |
| Single Unit, Attached | 0 | 0.0% |
| 2 Unit Apartments | 0 | 0.0% |
| 3 or 4 Unit Apartments | 0 | 0.0% |
| 5 to 9 Unit Apartments | 0 | 0.0% |
| 10 or more Apartments | 0 | 0.0% |
| Mobile Home / Other | 0 | 0.0% |
| Total | 145 | 100.0% |
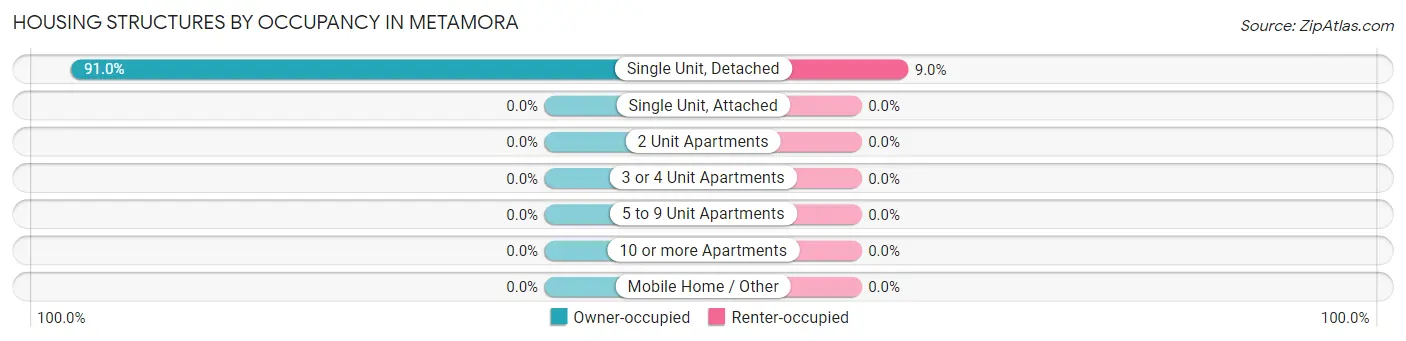
Housing Structures by Occupancy in Metamora
| Structure Type | Owner-occupied | Renter-occupied |
| Single Unit, Detached | 132 (91.0%) | 13 (9.0%) |
| Single Unit, Attached | 0 (0.0%) | 0 (0.0%) |
| 2 Unit Apartments | 0 (0.0%) | 0 (0.0%) |
| 3 or 4 Unit Apartments | 0 (0.0%) | 0 (0.0%) |
| 5 to 9 Unit Apartments | 0 (0.0%) | 0 (0.0%) |
| 10 or more Apartments | 0 (0.0%) | 0 (0.0%) |
| Mobile Home / Other | 0 (0.0%) | 0 (0.0%) |
| Total | 132 (91.0%) | 13 (9.0%) |
Housing Structures by Number of Rooms in Metamora
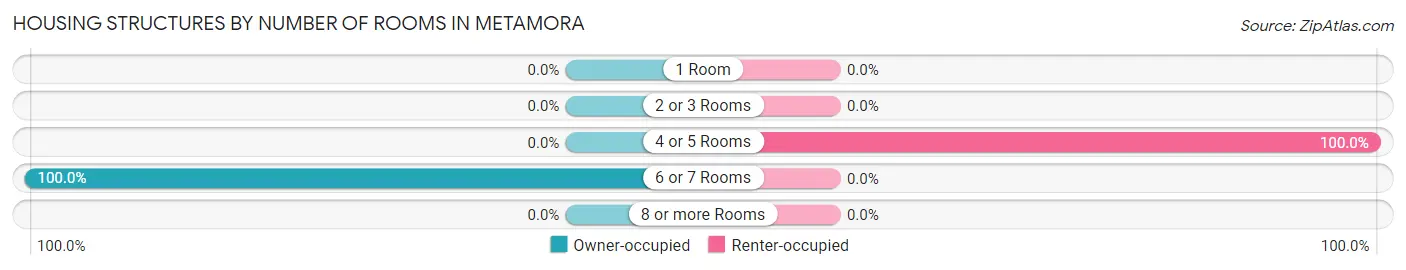
| Number of Rooms | Owner-occupied | Renter-occupied |
| 1 Room | 0 (0.0%) | 0 (0.0%) |
| 2 or 3 Rooms | 0 (0.0%) | 0 (0.0%) |
| 4 or 5 Rooms | 0 (0.0%) | 13 (100.0%) |
| 6 or 7 Rooms | 132 (100.0%) | 0 (0.0%) |
| 8 or more Rooms | 0 (0.0%) | 0 (0.0%) |
| Total | 132 (100.0%) | 13 (100.0%) |
Housing Structure by Heating Type in Metamora
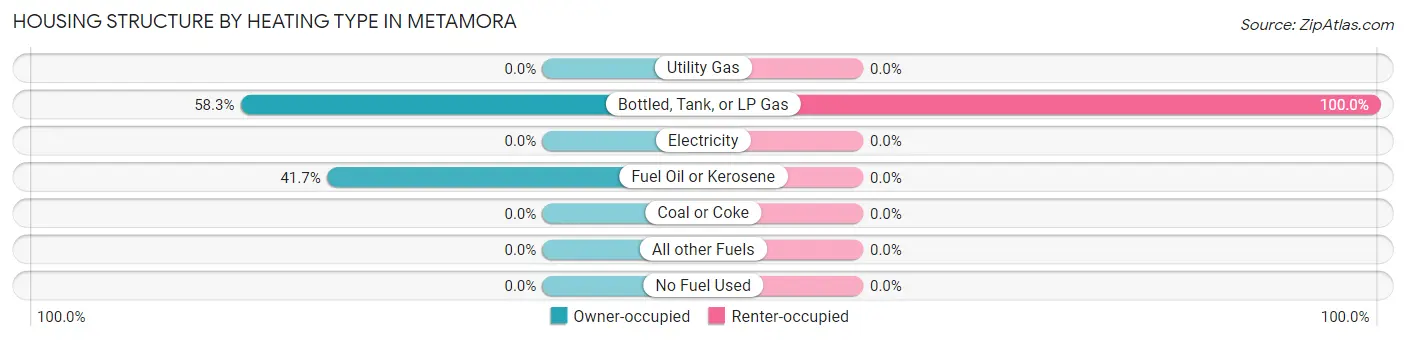
| Heating Type | Owner-occupied | Renter-occupied |
| Utility Gas | 0 (0.0%) | 0 (0.0%) |
| Bottled, Tank, or LP Gas | 77 (58.3%) | 13 (100.0%) |
| Electricity | 0 (0.0%) | 0 (0.0%) |
| Fuel Oil or Kerosene | 55 (41.7%) | 0 (0.0%) |
| Coal or Coke | 0 (0.0%) | 0 (0.0%) |
| All other Fuels | 0 (0.0%) | 0 (0.0%) |
| No Fuel Used | 0 (0.0%) | 0 (0.0%) |
| Total | 132 (100.0%) | 13 (100.0%) |
Household Vehicle Usage in Metamora
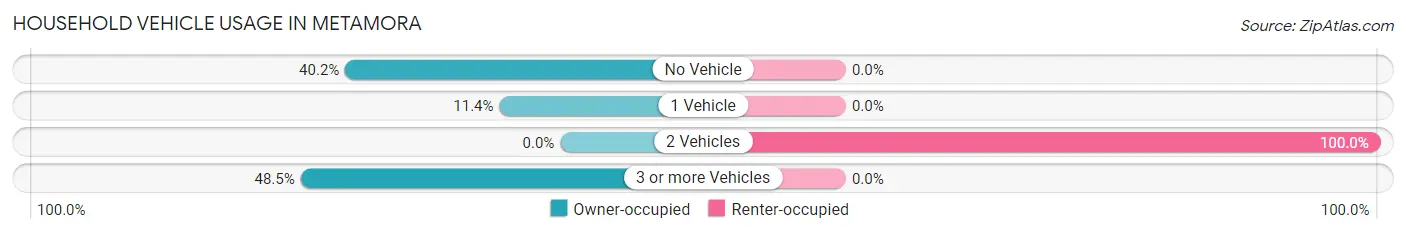
| Vehicles per Household | Owner-occupied | Renter-occupied |
| No Vehicle | 53 (40.2%) | 0 (0.0%) |
| 1 Vehicle | 15 (11.4%) | 0 (0.0%) |
| 2 Vehicles | 0 (0.0%) | 13 (100.0%) |
| 3 or more Vehicles | 64 (48.5%) | 0 (0.0%) |
| Total | 132 (100.0%) | 13 (100.0%) |
Real Estate & Mortgages in Metamora
Real Estate and Mortgage Overview in Metamora
| Characteristic | Without Mortgage | With Mortgage |
| Housing Units | 9 | 123 |
| Median Property Value | - | - |
| Median Household Income | - | - |
| Monthly Housing Costs | - | - |
| Real Estate Taxes | - | - |
Property Value by Mortgage Status in Metamora
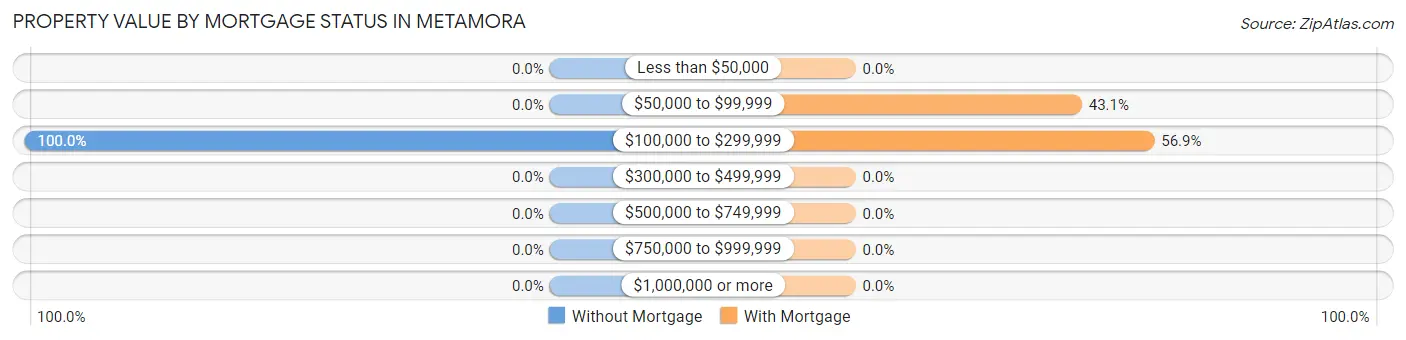
| Property Value | Without Mortgage | With Mortgage |
| Less than $50,000 | 0 (0.0%) | 0 (0.0%) |
| $50,000 to $99,999 | 0 (0.0%) | 53 (43.1%) |
| $100,000 to $299,999 | 9 (100.0%) | 70 (56.9%) |
| $300,000 to $499,999 | 0 (0.0%) | 0 (0.0%) |
| $500,000 to $749,999 | 0 (0.0%) | 0 (0.0%) |
| $750,000 to $999,999 | 0 (0.0%) | 0 (0.0%) |
| $1,000,000 or more | 0 (0.0%) | 0 (0.0%) |
| Total | 9 (100.0%) | 123 (100.0%) |
Household Income by Mortgage Status in Metamora
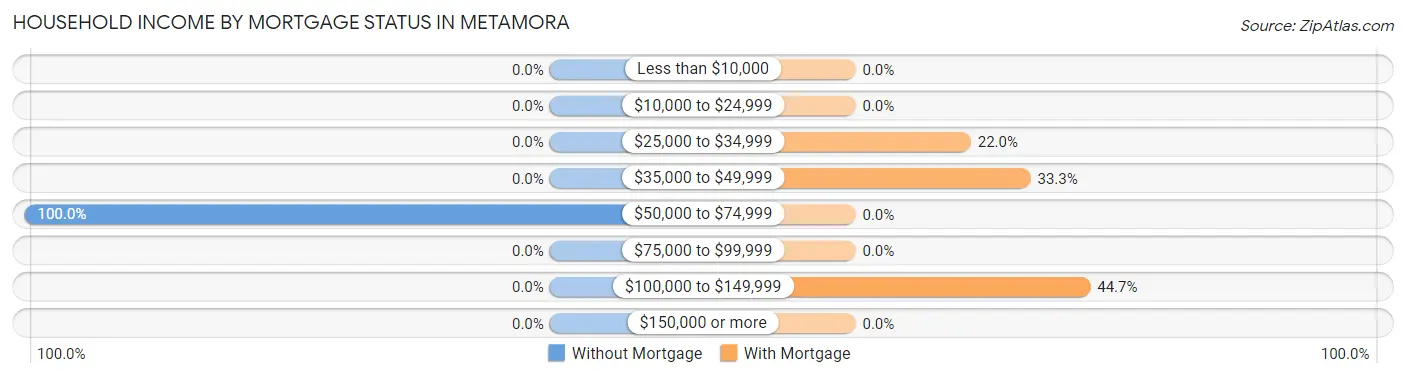
| Household Income | Without Mortgage | With Mortgage |
| Less than $10,000 | 0 (0.0%) | 0 (0.0%) |
| $10,000 to $24,999 | 0 (0.0%) | 0 (0.0%) |
| $25,000 to $34,999 | 0 (0.0%) | 27 (22.0%) |
| $35,000 to $49,999 | 0 (0.0%) | 41 (33.3%) |
| $50,000 to $74,999 | 9 (100.0%) | 0 (0.0%) |
| $75,000 to $99,999 | 0 (0.0%) | 0 (0.0%) |
| $100,000 to $149,999 | 0 (0.0%) | 55 (44.7%) |
| $150,000 or more | 0 (0.0%) | 0 (0.0%) |
| Total | 9 (100.0%) | 123 (100.0%) |
Property Value to Household Income Ratio in Metamora
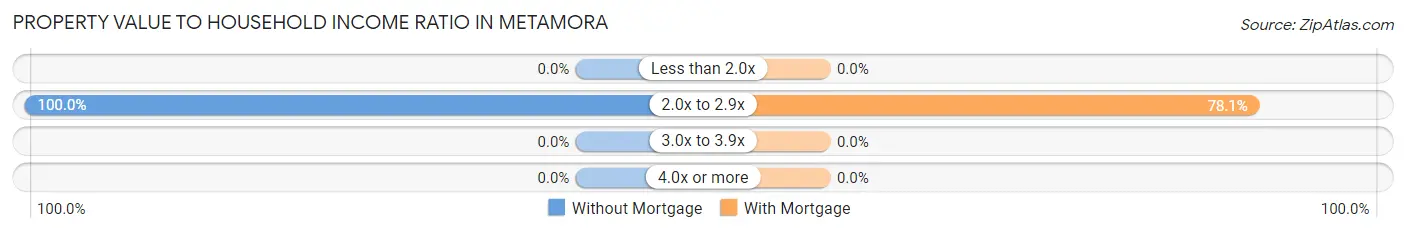
| Value-to-Income Ratio | Without Mortgage | With Mortgage |
| Less than 2.0x | 0 (0.0%) | 0 (0.0%) |
| 2.0x to 2.9x | 9 (100.0%) | 96 (78.0%) |
| 3.0x to 3.9x | 0 (0.0%) | 0 (0.0%) |
| 4.0x or more | 0 (0.0%) | 0 (0.0%) |
| Total | 9 (100.0%) | 123 (100.0%) |
Real Estate Taxes by Mortgage Status in Metamora
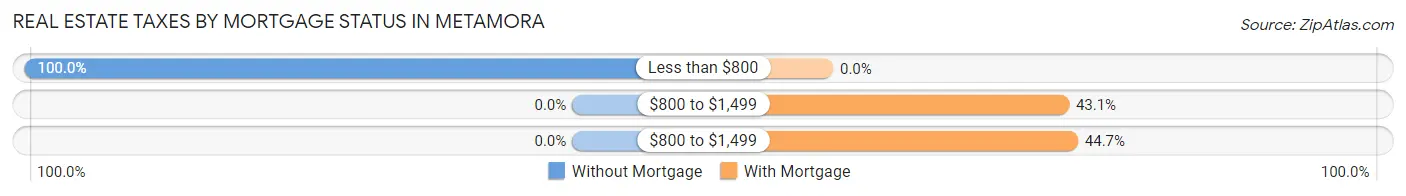
| Property Taxes | Without Mortgage | With Mortgage |
| Less than $800 | 9 (100.0%) | 0 (0.0%) |
| $800 to $1,499 | 0 (0.0%) | 53 (43.1%) |
| $800 to $1,499 | 0 (0.0%) | 55 (44.7%) |
| Total | 9 (100.0%) | 123 (100.0%) |
Health & Disability in Metamora
Health Insurance Coverage by Age in Metamora
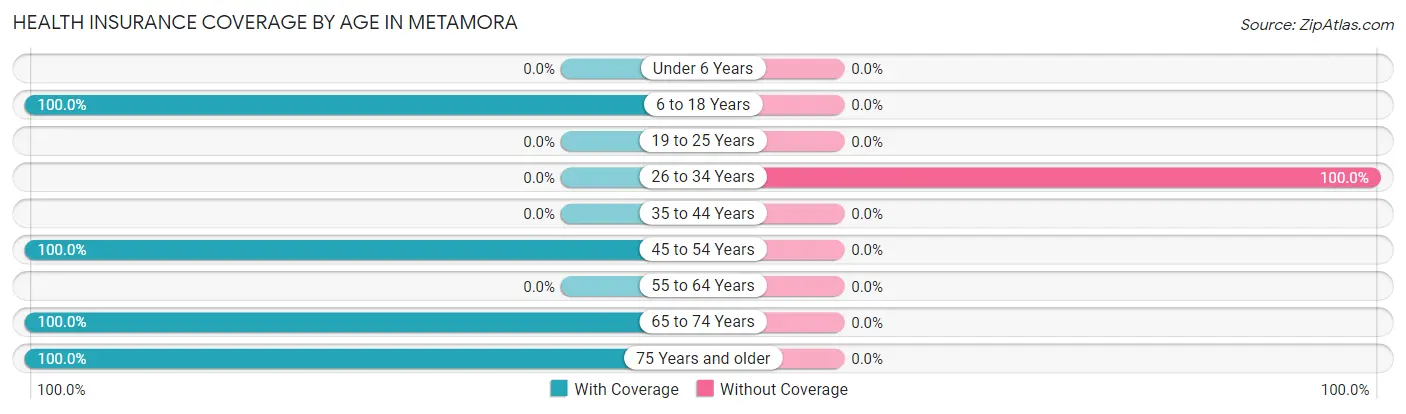
| Age Bracket | With Coverage | Without Coverage |
| Under 6 Years | 0 (0.0%) | 0 (0.0%) |
| 6 to 18 Years | 87 (100.0%) | 0 (0.0%) |
| 19 to 25 Years | 0 (0.0%) | 0 (0.0%) |
| 26 to 34 Years | 0 (0.0%) | 53 (100.0%) |
| 35 to 44 Years | 0 (0.0%) | 0 (0.0%) |
| 45 to 54 Years | 124 (100.0%) | 0 (0.0%) |
| 55 to 64 Years | 0 (0.0%) | 0 (0.0%) |
| 65 to 74 Years | 97 (100.0%) | 0 (0.0%) |
| 75 Years and older | 44 (100.0%) | 0 (0.0%) |
| Total | 352 (86.9%) | 53 (13.1%) |
Health Insurance Coverage by Citizenship Status in Metamora
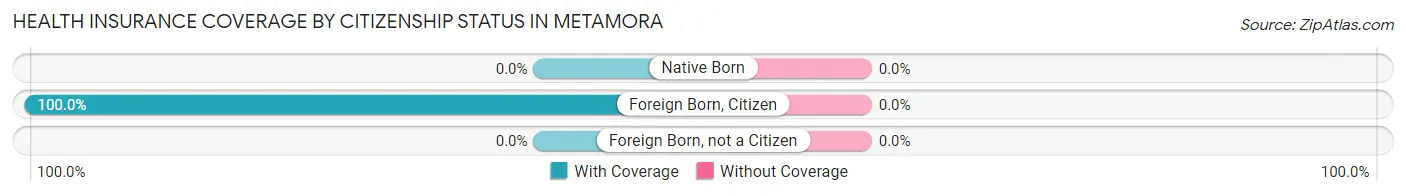
| Citizenship Status | With Coverage | Without Coverage |
| Native Born | 0 (0.0%) | 0 (0.0%) |
| Foreign Born, Citizen | 87 (100.0%) | 0 (0.0%) |
| Foreign Born, not a Citizen | 0 (0.0%) | 0 (0.0%) |
Health Insurance Coverage by Household Income in Metamora
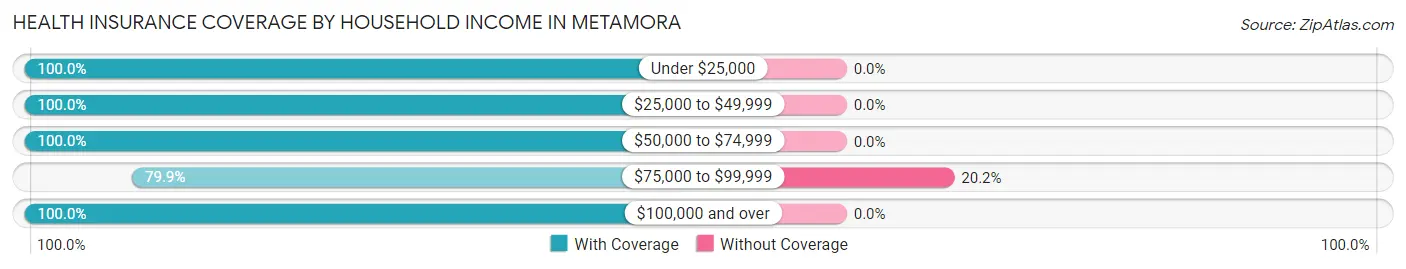
| Household Income | With Coverage | Without Coverage |
| Under $25,000 | 27 (100.0%) | 0 (0.0%) |
| $25,000 to $49,999 | 71 (100.0%) | 0 (0.0%) |
| $50,000 to $74,999 | 18 (100.0%) | 0 (0.0%) |
| $75,000 to $99,999 | 210 (79.8%) | 53 (20.2%) |
| $100,000 and over | 26 (100.0%) | 0 (0.0%) |
Public vs Private Health Insurance Coverage by Age in Metamora
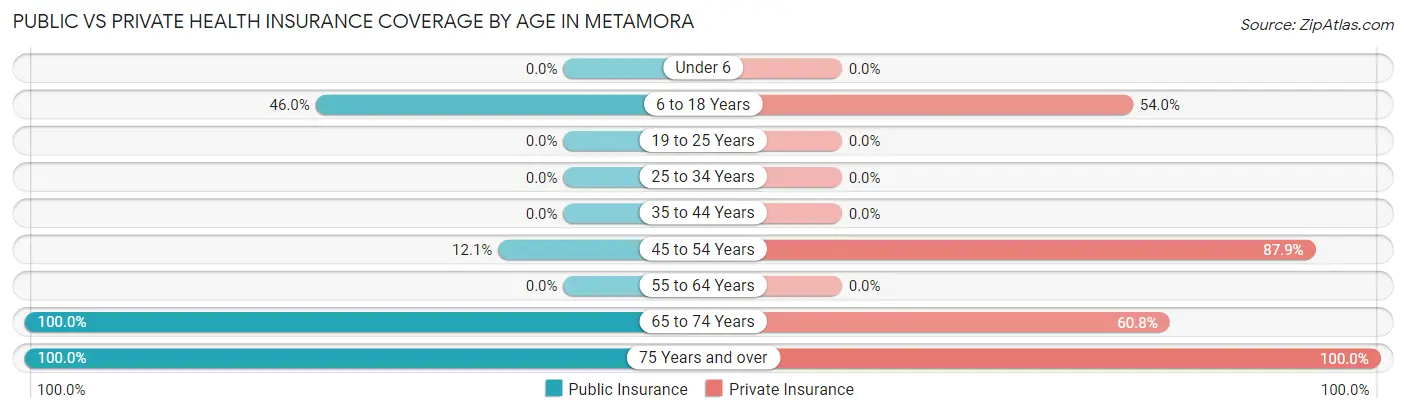
| Age Bracket | Public Insurance | Private Insurance |
| Under 6 | 0 (0.0%) | 0 (0.0%) |
| 6 to 18 Years | 40 (46.0%) | 47 (54.0%) |
| 19 to 25 Years | 0 (0.0%) | 0 (0.0%) |
| 25 to 34 Years | 0 (0.0%) | 0 (0.0%) |
| 35 to 44 Years | 0 (0.0%) | 0 (0.0%) |
| 45 to 54 Years | 15 (12.1%) | 109 (87.9%) |
| 55 to 64 Years | 0 (0.0%) | 0 (0.0%) |
| 65 to 74 Years | 97 (100.0%) | 59 (60.8%) |
| 75 Years and over | 44 (100.0%) | 44 (100.0%) |
| Total | 196 (48.4%) | 259 (63.9%) |
Disability Status by Sex by Age in Metamora
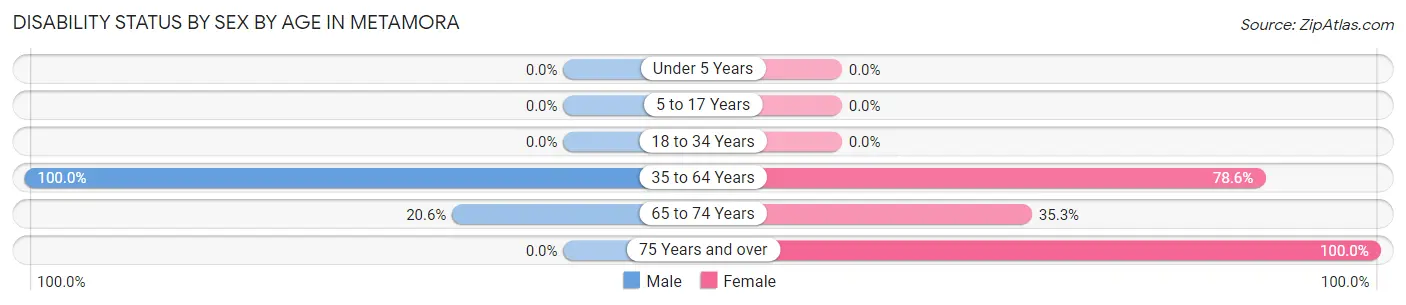
| Age Bracket | Male | Female |
| Under 5 Years | 0 (0.0%) | 0 (0.0%) |
| 5 to 17 Years | 0 (0.0%) | 0 (0.0%) |
| 18 to 34 Years | 0 (0.0%) | 0 (0.0%) |
| 35 to 64 Years | 54 (100.0%) | 55 (78.6%) |
| 65 to 74 Years | 13 (20.6%) | 12 (35.3%) |
| 75 Years and over | 0 (0.0%) | 44 (100.0%) |
Disability Class by Sex by Age in Metamora
Disability Class: Hearing Difficulty
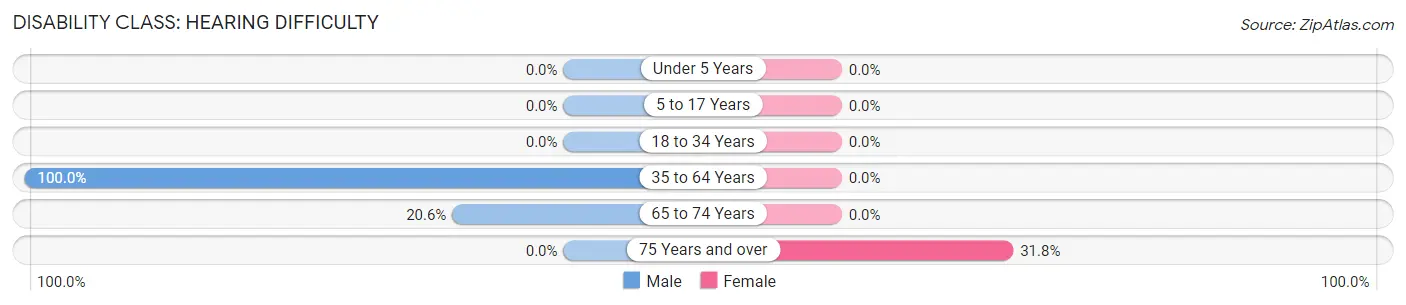
| Age Bracket | Male | Female |
| Under 5 Years | 0 (0.0%) | 0 (0.0%) |
| 5 to 17 Years | 0 (0.0%) | 0 (0.0%) |
| 18 to 34 Years | 0 (0.0%) | 0 (0.0%) |
| 35 to 64 Years | 54 (100.0%) | 0 (0.0%) |
| 65 to 74 Years | 13 (20.6%) | 0 (0.0%) |
| 75 Years and over | 0 (0.0%) | 14 (31.8%) |
Disability Class: Vision Difficulty
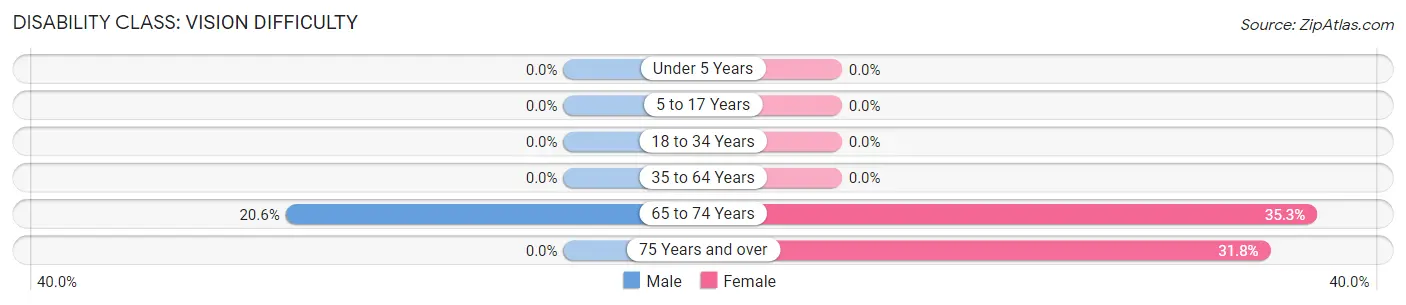
| Age Bracket | Male | Female |
| Under 5 Years | 0 (0.0%) | 0 (0.0%) |
| 5 to 17 Years | 0 (0.0%) | 0 (0.0%) |
| 18 to 34 Years | 0 (0.0%) | 0 (0.0%) |
| 35 to 64 Years | 0 (0.0%) | 0 (0.0%) |
| 65 to 74 Years | 13 (20.6%) | 12 (35.3%) |
| 75 Years and over | 0 (0.0%) | 14 (31.8%) |
Disability Class: Cognitive Difficulty
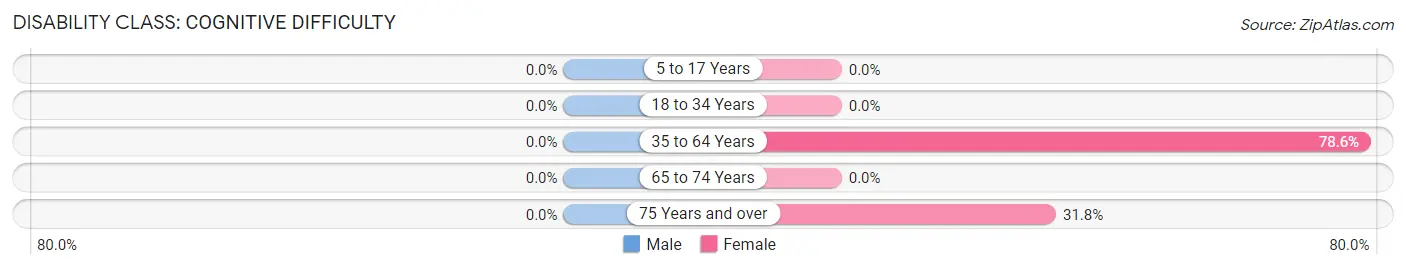
| Age Bracket | Male | Female |
| 5 to 17 Years | 0 (0.0%) | 0 (0.0%) |
| 18 to 34 Years | 0 (0.0%) | 0 (0.0%) |
| 35 to 64 Years | 0 (0.0%) | 55 (78.6%) |
| 65 to 74 Years | 0 (0.0%) | 0 (0.0%) |
| 75 Years and over | 0 (0.0%) | 14 (31.8%) |
Disability Class: Ambulatory Difficulty
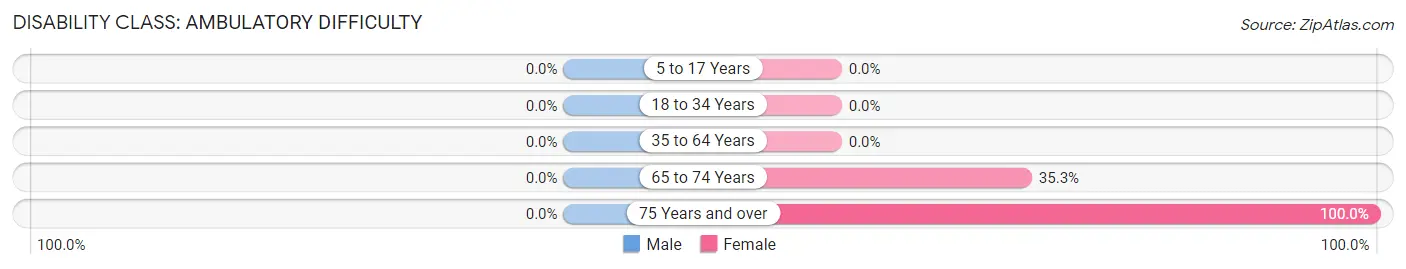
| Age Bracket | Male | Female |
| 5 to 17 Years | 0 (0.0%) | 0 (0.0%) |
| 18 to 34 Years | 0 (0.0%) | 0 (0.0%) |
| 35 to 64 Years | 0 (0.0%) | 0 (0.0%) |
| 65 to 74 Years | 0 (0.0%) | 12 (35.3%) |
| 75 Years and over | 0 (0.0%) | 44 (100.0%) |
Disability Class: Self-Care Difficulty
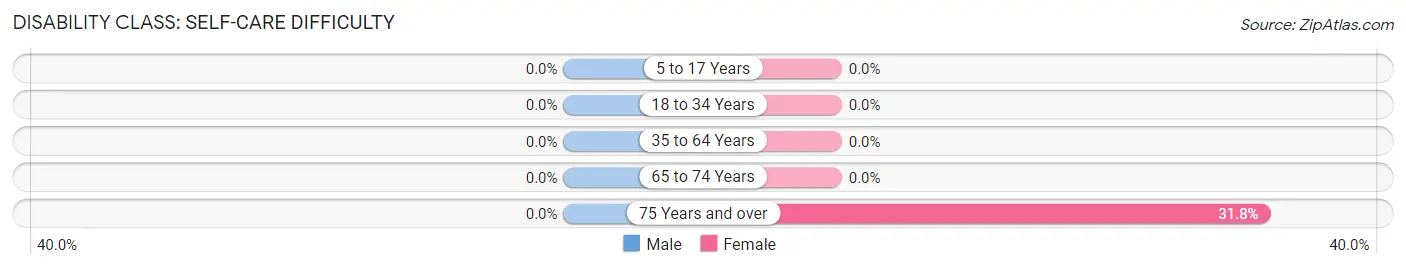
| Age Bracket | Male | Female |
| 5 to 17 Years | 0 (0.0%) | 0 (0.0%) |
| 18 to 34 Years | 0 (0.0%) | 0 (0.0%) |
| 35 to 64 Years | 0 (0.0%) | 0 (0.0%) |
| 65 to 74 Years | 0 (0.0%) | 0 (0.0%) |
| 75 Years and over | 0 (0.0%) | 14 (31.8%) |
Technology Access in Metamora
Computing Device Access in Metamora
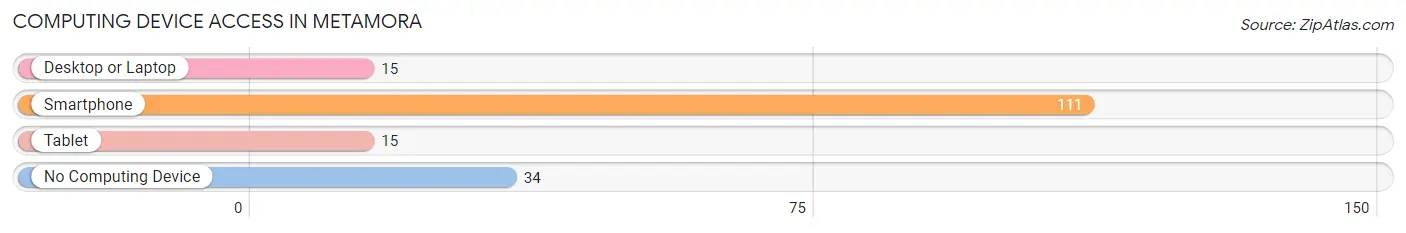
| Device Type | # Households | % Households |
| Desktop or Laptop | 15 | 10.3% |
| Smartphone | 111 | 76.5% |
| Tablet | 15 | 10.3% |
| No Computing Device | 34 | 23.4% |
| Total | 145 | 100.0% |
Internet Access in Metamora
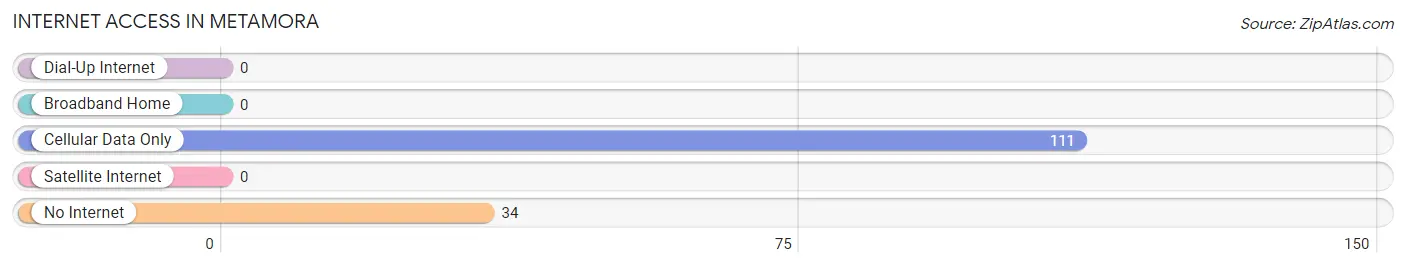
| Internet Type | # Households | % Households |
| Dial-Up Internet | 0 | 0.0% |
| Broadband Home | 0 | 0.0% |
| Cellular Data Only | 111 | 76.5% |
| Satellite Internet | 0 | 0.0% |
| No Internet | 34 | 23.4% |
| Total | 145 | 100.0% |
Metamora Summary
Metamora, Indiana is a small town located in Franklin County, Indiana. It is situated on the banks of the Whitewater River and is part of the Cincinnati metropolitan area. The town has a population of approximately 1,500 people and is known for its historic buildings and quaint atmosphere.
History
Metamora was founded in 1818 by a group of settlers from North Carolina. The town was named after the nearby Metamora Creek, which was named after the Native American tribe that once lived in the area. The town was originally a farming community, but it soon became a center for industry. In 1837, the first steamboat was built in Metamora, and the town soon became a hub for riverboat traffic.
In the late 19th century, Metamora became a popular tourist destination. The town was known for its picturesque scenery and its many historic buildings. The town was also home to a number of factories, including a woolen mill, a flour mill, and a sawmill.
Geography
Metamora is located in the southeastern corner of Franklin County, Indiana. The town is situated on the banks of the Whitewater River, which flows through the town. The town is surrounded by rolling hills and farmland. The town is located approximately 30 miles east of Indianapolis and is part of the Cincinnati metropolitan area.
Economy
Metamora’s economy is largely based on agriculture and tourism. The town is home to a number of farms, which produce a variety of crops, including corn, soybeans, and wheat. The town is also home to a number of small businesses, including restaurants, shops, and galleries.
The town is also a popular tourist destination. The town is home to a number of historic buildings, including the Metamora Courthouse, which was built in 1837. The town is also home to a number of parks and recreational areas, including the Metamora State Park.
Demographics
As of the 2010 census, Metamora had a population of 1,500 people. The town is predominantly white, with approximately 95% of the population identifying as white. The town also has a small Hispanic population, with approximately 4% of the population identifying as Hispanic or Latino. The median household income in Metamora is approximately $45,000, and the median home value is approximately $150,000.
Metamora is a small town with a rich history and a unique atmosphere. The town is home to a number of historic buildings and recreational areas, and it is a popular tourist destination. The town’s economy is largely based on agriculture and tourism, and the town has a diverse population. Metamora is a great place to live and visit, and it is sure to provide a unique experience for all who visit.
Common Questions
What is Per Capita Income in Metamora?
Per Capita income in Metamora is $17,166.
What is the Median Family Income in Metamora?
Median Family Income in Metamora is $77,909.
What is Inequality or Gini Index in Metamora?
Inequality or Gini Index in Metamora is 0.28.
What is the Total Population of Metamora?
Total Population of Metamora is 405.
What is the Total Male Population of Metamora?
Total Male Population of Metamora is 190.
What is the Total Female Population of Metamora?
Total Female Population of Metamora is 215.
What is the Ratio of Males per 100 Females in Metamora?
There are 88.37 Males per 100 Females in Metamora.
What is the Ratio of Females per 100 Males in Metamora?
There are 113.16 Females per 100 Males in Metamora.
What is the Median Population Age in Metamora?
Median Population Age in Metamora is 49.6 Years.
What is the Average Family Size in Metamora
Average Family Size in Metamora is 3.2 People.
What is the Average Household Size in Metamora
Average Household Size in Metamora is 2.8 People.
How Large is the Labor Force in Metamora?
There are 109 People in the Labor Forcein in Metamora.
What is the Percentage of People in the Labor Force in Metamora?
34.3% of People are in the Labor Force in Metamora.
What is the Unemployment Rate in Metamora?
Unemployment Rate in Metamora is 24.8%.