Melville, LA Map & Demographics
Melville Map
Melville Overview
$15,966
PER CAPITA INCOME
$42,361
AVG FAMILY INCOME
$38,833
AVG HOUSEHOLD INCOME
26.6%
WAGE / INCOME GAP [ % ]
73.4¢/ $1
WAGE / INCOME GAP [ $ ]
0.49
INEQUALITY / GINI INDEX
729
TOTAL POPULATION
333
MALE POPULATION
396
FEMALE POPULATION
84.09
MALES / 100 FEMALES
118.92
FEMALES / 100 MALES
40.1
MEDIAN AGE
3.0
AVG FAMILY SIZE
2.5
AVG HOUSEHOLD SIZE
226
LABOR FORCE [ PEOPLE ]
40.6%
PERCENT IN LABOR FORCE
Melville Zip Codes
Melville Area Codes
Income in Melville
Income Overview in Melville
Per Capita Income in Melville is $15,966, while median incomes of families and households are $42,361 and $38,833 respectively.
| Characteristic | Number | Measure |
| Per Capita Income | 729 | $15,966 |
| Median Family Income | 207 | $42,361 |
| Mean Family Income | 207 | $43,572 |
| Median Household Income | 298 | $38,833 |
| Mean Household Income | 298 | $38,023 |
| Income Deficit | 207 | $0 |
| Wage / Income Gap (%) | 729 | 26.56% |
| Wage / Income Gap ($) | 729 | 73.44¢ per $1 |
| Gini / Inequality Index | 729 | 0.49 |
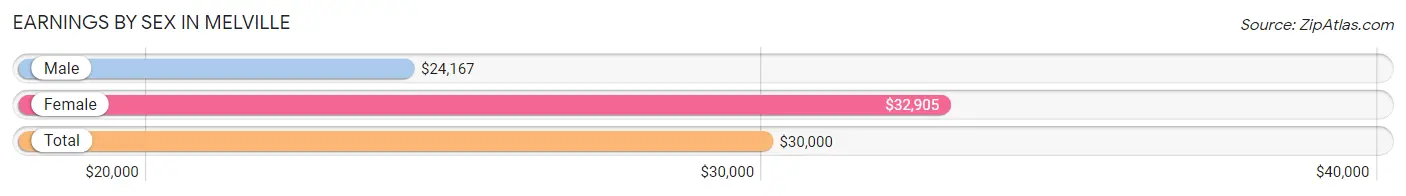
Earnings by Sex in Melville
Average Earnings in Melville are $30,000, $24,167 for men and $32,905 for women, a difference of 26.6%.
| Sex | Number | Average Earnings |
| Male | 90 (39.8%) | $24,167 |
| Female | 136 (60.2%) | $32,905 |
| Total | 226 (100.0%) | $30,000 |
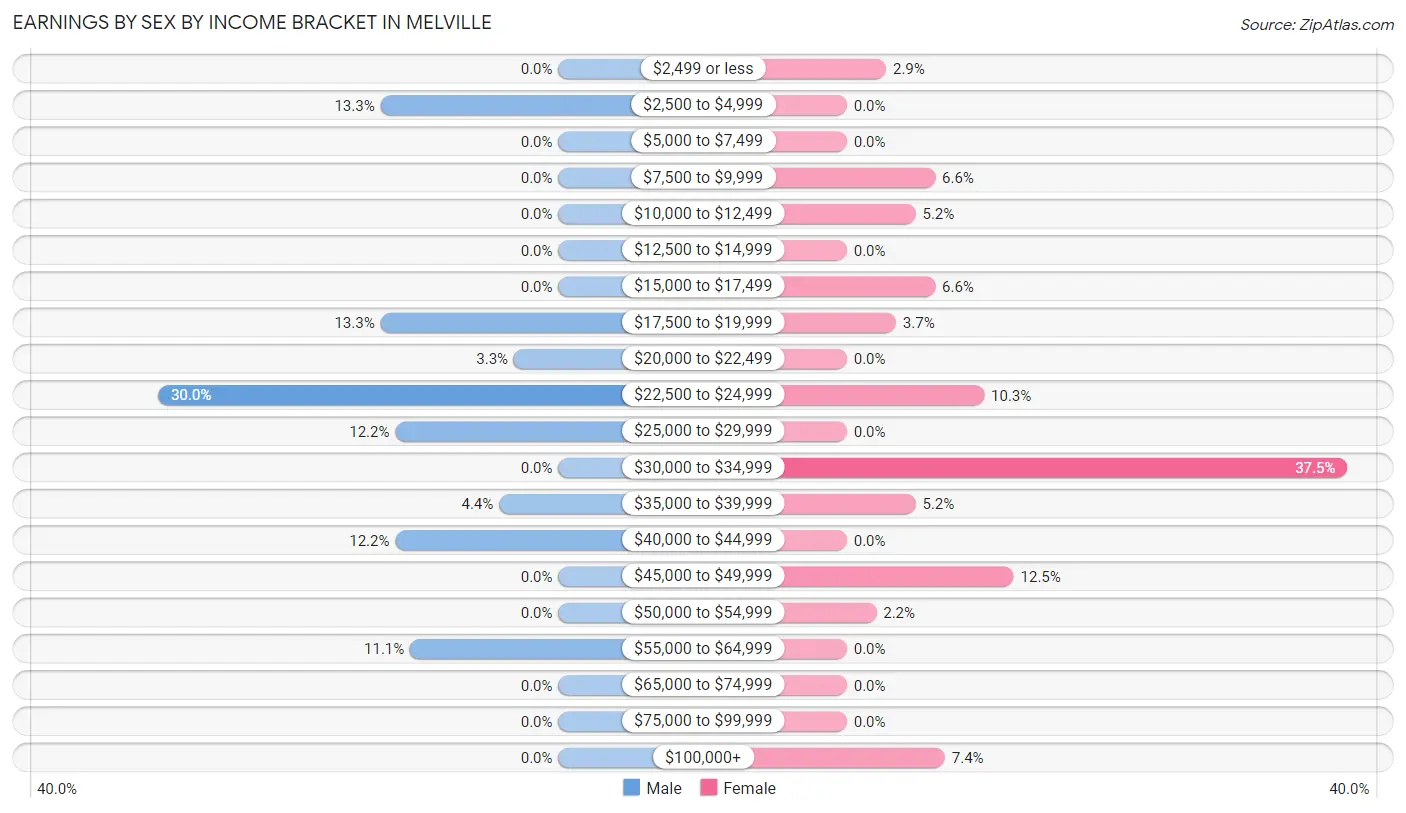
Earnings by Sex by Income Bracket in Melville
The most common earnings brackets in Melville are $22,500 to $24,999 for men (27 | 30.0%) and $30,000 to $34,999 for women (51 | 37.5%).
| Income | Male | Female |
| $2,499 or less | 0 (0.0%) | 4 (2.9%) |
| $2,500 to $4,999 | 12 (13.3%) | 0 (0.0%) |
| $5,000 to $7,499 | 0 (0.0%) | 0 (0.0%) |
| $7,500 to $9,999 | 0 (0.0%) | 9 (6.6%) |
| $10,000 to $12,499 | 0 (0.0%) | 7 (5.1%) |
| $12,500 to $14,999 | 0 (0.0%) | 0 (0.0%) |
| $15,000 to $17,499 | 0 (0.0%) | 9 (6.6%) |
| $17,500 to $19,999 | 12 (13.3%) | 5 (3.7%) |
| $20,000 to $22,499 | 3 (3.3%) | 0 (0.0%) |
| $22,500 to $24,999 | 27 (30.0%) | 14 (10.3%) |
| $25,000 to $29,999 | 11 (12.2%) | 0 (0.0%) |
| $30,000 to $34,999 | 0 (0.0%) | 51 (37.5%) |
| $35,000 to $39,999 | 4 (4.4%) | 7 (5.1%) |
| $40,000 to $44,999 | 11 (12.2%) | 0 (0.0%) |
| $45,000 to $49,999 | 0 (0.0%) | 17 (12.5%) |
| $50,000 to $54,999 | 0 (0.0%) | 3 (2.2%) |
| $55,000 to $64,999 | 10 (11.1%) | 0 (0.0%) |
| $65,000 to $74,999 | 0 (0.0%) | 0 (0.0%) |
| $75,000 to $99,999 | 0 (0.0%) | 0 (0.0%) |
| $100,000+ | 0 (0.0%) | 10 (7.3%) |
| Total | 90 (100.0%) | 136 (100.0%) |
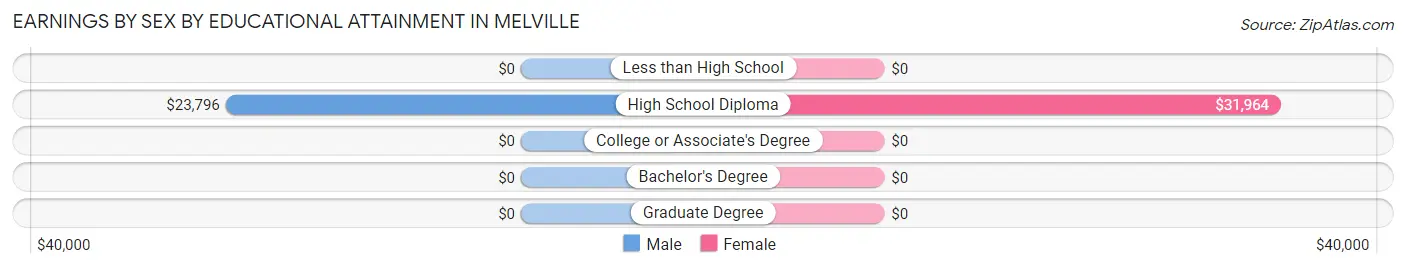
Earnings by Sex by Educational Attainment in Melville
Average earnings in Melville are $24,167 for men and $32,905 for women, a difference of 26.6%. Men with an educational attainment of high school diploma enjoy the highest average annual earnings of $23,796, while those with high school diploma education earn the least with $23,796. Women with an educational attainment of high school diploma earn the most with the average annual earnings of $31,964, while those with high school diploma education have the smallest earnings of $31,964.
| Educational Attainment | Male Income | Female Income |
| Less than High School | - | - |
| High School Diploma | $23,796 | $31,964 |
| College or Associate's Degree | - | - |
| Bachelor's Degree | - | - |
| Graduate Degree | - | - |
| Total | $24,167 | $32,905 |
Family Income in Melville
Family Income Brackets in Melville
According to the Melville family income data, there are 55 families falling into the $35,000 to $49,999 income range, which is the most common income bracket and makes up 26.6% of all families.
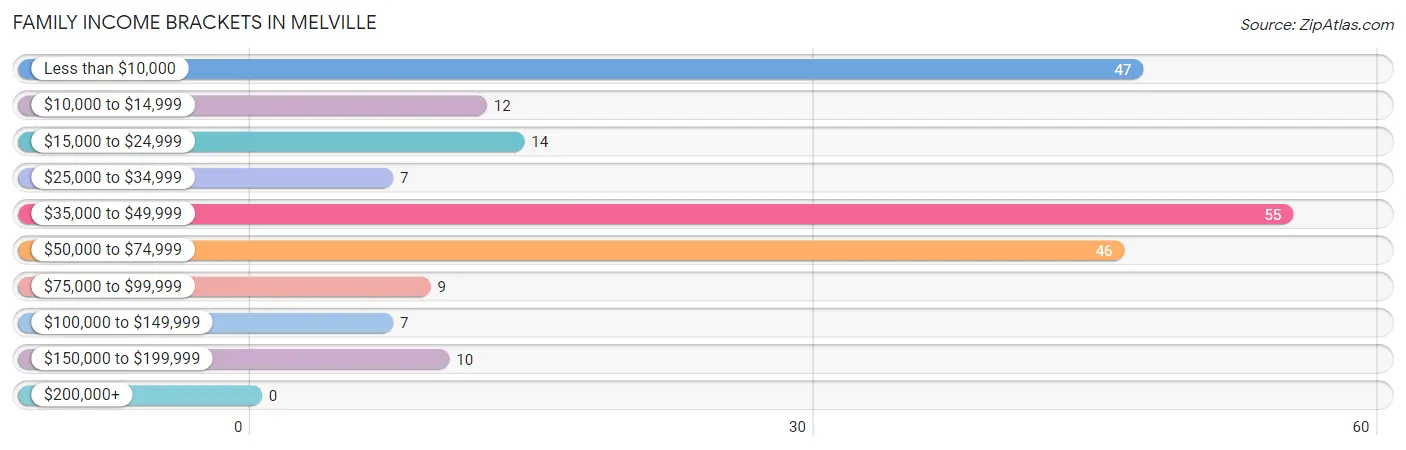
| Income Bracket | # Families | % Families |
| Less than $10,000 | 47 | 22.7% |
| $10,000 to $14,999 | 12 | 5.8% |
| $15,000 to $24,999 | 14 | 6.8% |
| $25,000 to $34,999 | 7 | 3.4% |
| $35,000 to $49,999 | 55 | 26.6% |
| $50,000 to $74,999 | 46 | 22.2% |
| $75,000 to $99,999 | 9 | 4.3% |
| $100,000 to $149,999 | 7 | 3.4% |
| $150,000 to $199,999 | 10 | 4.8% |
| $200,000+ | 0 | 0.0% |
Family Income by Famaliy Size in Melville
2-person families (93 | 44.9%) account for the highest median family income in Melville with $43,427 per family, while 2-person families (93 | 44.9%) have the highest median income of $21,714 per family member.
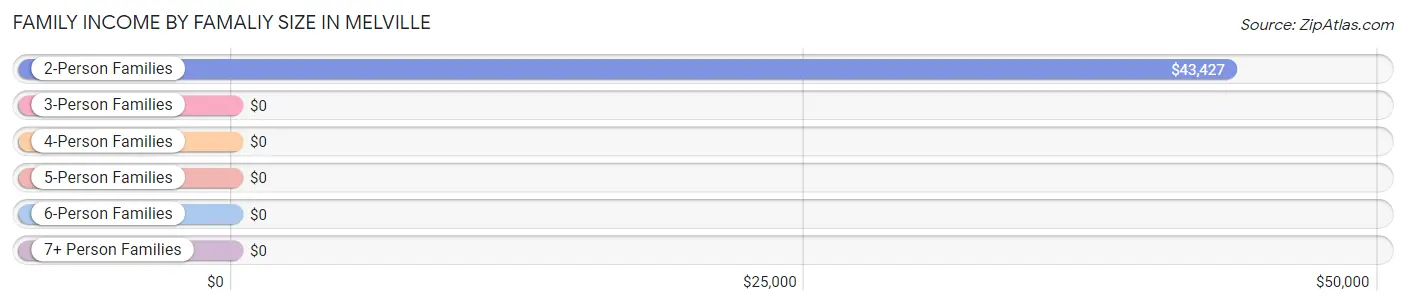
| Income Bracket | # Families | Median Income |
| 2-Person Families | 93 (44.9%) | $43,427 |
| 3-Person Families | 40 (19.3%) | $0 |
| 4-Person Families | 72 (34.8%) | $0 |
| 5-Person Families | 0 (0.0%) | $0 |
| 6-Person Families | 0 (0.0%) | $0 |
| 7+ Person Families | 2 (1.0%) | $0 |
| Total | 207 (100.0%) | $42,361 |
Family Income by Number of Earners in Melville

| Number of Earners | # Families | Median Income |
| No Earners | 61 (29.5%) | $2,499 |
| 1 Earner | 116 (56.0%) | $50,081 |
| 2 Earners | 30 (14.5%) | $43,750 |
| 3+ Earners | 0 (0.0%) | $0 |
| Total | 207 (100.0%) | $42,361 |
Household Income in Melville
Household Income Brackets in Melville
With 68 households falling in the category, the less than $10,000 income range is the most frequent in Melville, accounting for 22.8% of all households.
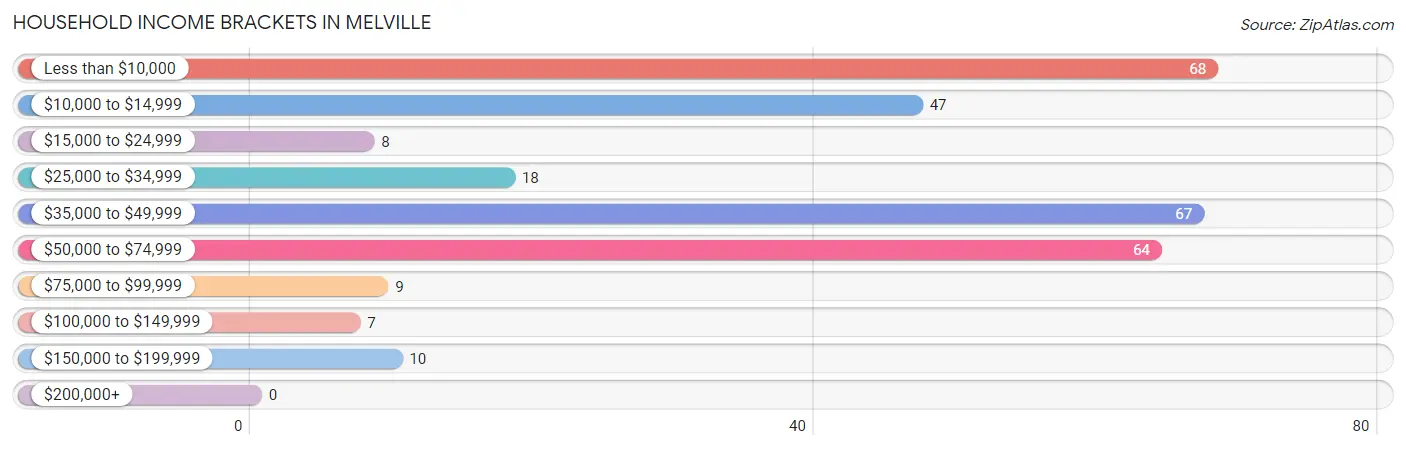
| Income Bracket | # Households | % Households |
| Less than $10,000 | 68 | 22.8% |
| $10,000 to $14,999 | 47 | 15.8% |
| $15,000 to $24,999 | 8 | 2.7% |
| $25,000 to $34,999 | 18 | 6.0% |
| $35,000 to $49,999 | 67 | 22.5% |
| $50,000 to $74,999 | 64 | 21.5% |
| $75,000 to $99,999 | 9 | 3.0% |
| $100,000 to $149,999 | 7 | 2.3% |
| $150,000 to $199,999 | 10 | 3.4% |
| $200,000+ | 0 | 0.0% |
Household Income by Householder Age in Melville
The median household income in Melville is $38,833, with the highest median household income of $43,871 found in the 65+ years age bracket for the primary householder. A total of 98 households (32.9%) fall into this category.
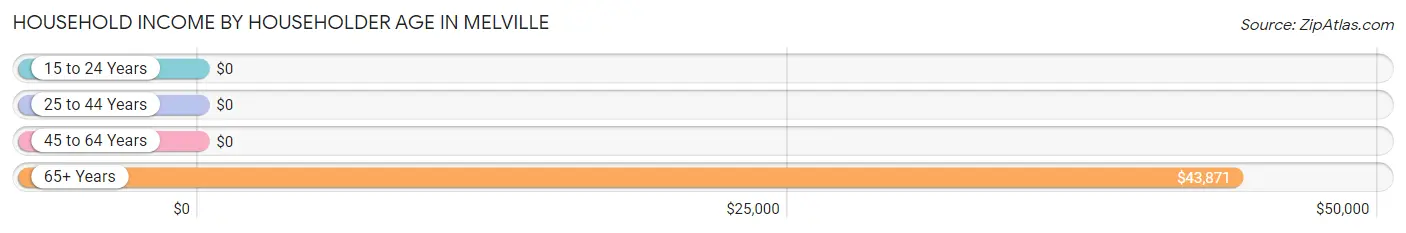
| Income Bracket | # Households | Median Income |
| 15 to 24 Years | 0 (0.0%) | $0 |
| 25 to 44 Years | 111 (37.2%) | $0 |
| 45 to 64 Years | 89 (29.9%) | $0 |
| 65+ Years | 98 (32.9%) | $43,871 |
| Total | 298 (100.0%) | $38,833 |
Poverty in Melville
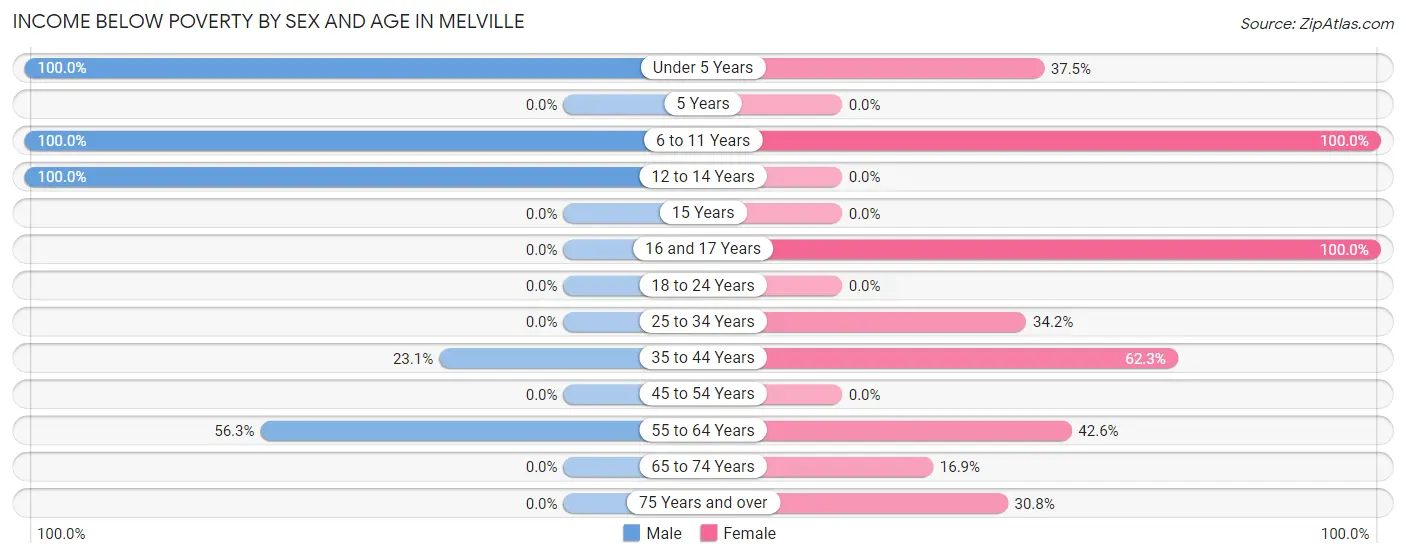
Income Below Poverty by Sex and Age in Melville
With 39.3% poverty level for males and 43.2% for females among the residents of Melville, under 5 year old males and 6 to 11 year old females are the most vulnerable to poverty, with 27 males (100.0%) and 40 females (100.0%) in their respective age groups living below the poverty level.
| Age Bracket | Male | Female |
| Under 5 Years | 27 (100.0%) | 15 (37.5%) |
| 5 Years | 0 (0.0%) | 0 (0.0%) |
| 6 to 11 Years | 21 (100.0%) | 40 (100.0%) |
| 12 to 14 Years | 44 (100.0%) | 0 (0.0%) |
| 15 Years | 0 (0.0%) | 0 (0.0%) |
| 16 and 17 Years | 0 (0.0%) | 14 (100.0%) |
| 18 to 24 Years | 0 (0.0%) | 0 (0.0%) |
| 25 to 34 Years | 0 (0.0%) | 13 (34.2%) |
| 35 to 44 Years | 12 (23.1%) | 43 (62.3%) |
| 45 to 54 Years | 0 (0.0%) | 0 (0.0%) |
| 55 to 64 Years | 27 (56.2%) | 26 (42.6%) |
| 65 to 74 Years | 0 (0.0%) | 12 (16.9%) |
| 75 Years and over | 0 (0.0%) | 8 (30.8%) |
| Total | 131 (39.3%) | 171 (43.2%) |
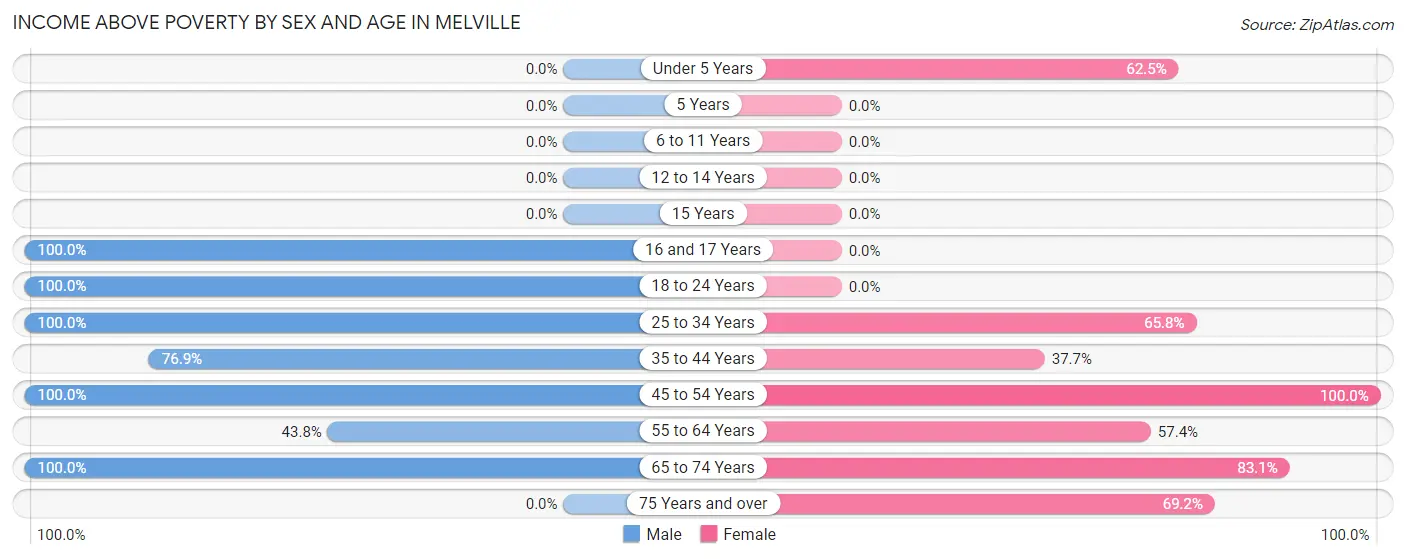
Income Above Poverty by Sex and Age in Melville
According to the poverty statistics in Melville, males aged 16 and 17 years and females aged 45 to 54 years are the age groups that are most secure financially, with 100.0% of males and 100.0% of females in these age groups living above the poverty line.
| Age Bracket | Male | Female |
| Under 5 Years | 0 (0.0%) | 25 (62.5%) |
| 5 Years | 0 (0.0%) | 0 (0.0%) |
| 6 to 11 Years | 0 (0.0%) | 0 (0.0%) |
| 12 to 14 Years | 0 (0.0%) | 0 (0.0%) |
| 15 Years | 0 (0.0%) | 0 (0.0%) |
| 16 and 17 Years | 30 (100.0%) | 0 (0.0%) |
| 18 to 24 Years | 21 (100.0%) | 0 (0.0%) |
| 25 to 34 Years | 16 (100.0%) | 25 (65.8%) |
| 35 to 44 Years | 40 (76.9%) | 26 (37.7%) |
| 45 to 54 Years | 20 (100.0%) | 37 (100.0%) |
| 55 to 64 Years | 21 (43.8%) | 35 (57.4%) |
| 65 to 74 Years | 54 (100.0%) | 59 (83.1%) |
| 75 Years and over | 0 (0.0%) | 18 (69.2%) |
| Total | 202 (60.7%) | 225 (56.8%) |
Income Below Poverty Among Married-Couple Families in Melville
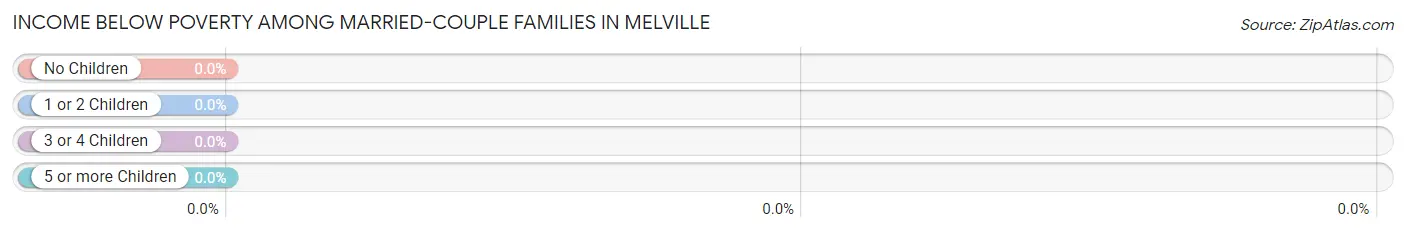
| Children | Above Poverty | Below Poverty |
| No Children | 68 (100.0%) | 0 (0.0%) |
| 1 or 2 Children | 26 (100.0%) | 0 (0.0%) |
| 3 or 4 Children | 0 (0.0%) | 0 (0.0%) |
| 5 or more Children | 0 (0.0%) | 0 (0.0%) |
| Total | 94 (100.0%) | 0 (0.0%) |
Income Below Poverty Among Single-Parent Households in Melville
According to the poverty data in Melville, 63.2% or 12 single-father households and 62.8% or 59 single-mother households are living below the poverty line. Among single-father households, those with 1 or 2 children have the highest poverty rate, with 12 households (100.0%) experiencing poverty. Likewise, among single-mother households, those with 3 or 4 children have the highest poverty rate, with 31 households (100.0%) falling below the poverty line.
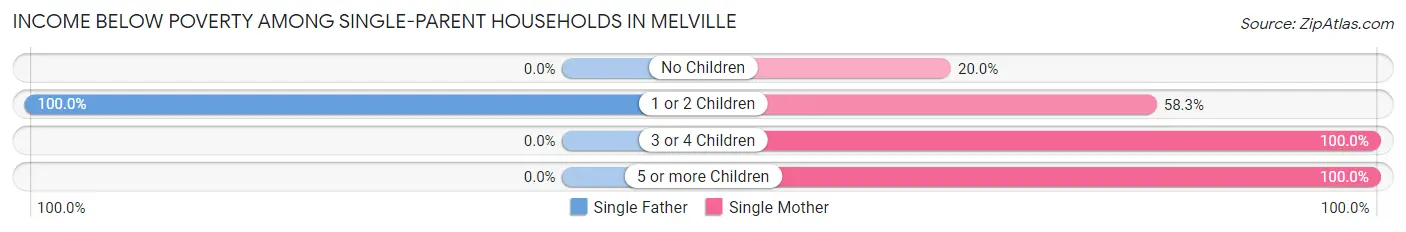
| Children | Single Father | Single Mother |
| No Children | 0 (0.0%) | 5 (20.0%) |
| 1 or 2 Children | 12 (100.0%) | 21 (58.3%) |
| 3 or 4 Children | 0 (0.0%) | 31 (100.0%) |
| 5 or more Children | 0 (0.0%) | 2 (100.0%) |
| Total | 12 (63.2%) | 59 (62.8%) |
Income Below Poverty Among Married-Couple vs Single-Parent Households in Melville
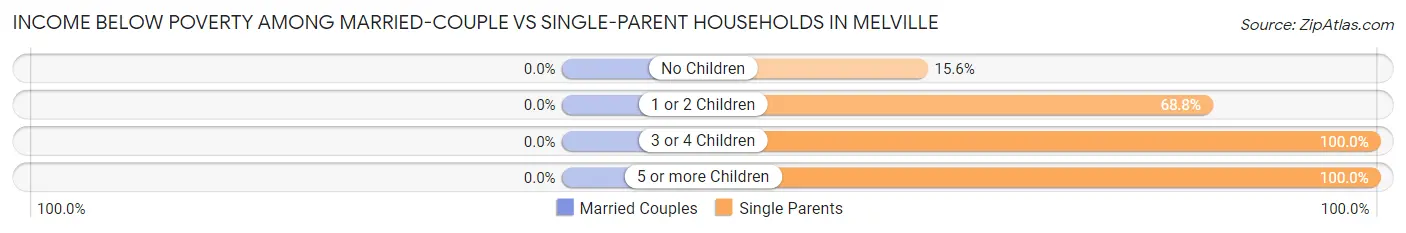
| Children | Married-Couple Families | Single-Parent Households |
| No Children | 0 (0.0%) | 5 (15.6%) |
| 1 or 2 Children | 0 (0.0%) | 33 (68.8%) |
| 3 or 4 Children | 0 (0.0%) | 31 (100.0%) |
| 5 or more Children | 0 (0.0%) | 2 (100.0%) |
| Total | 0 (0.0%) | 71 (62.8%) |
Race in Melville
The most populous races in Melville are Black / African American (469 | 64.3%), White / Caucasian (233 | 32.0%), and Two or more Races (27 | 3.7%).
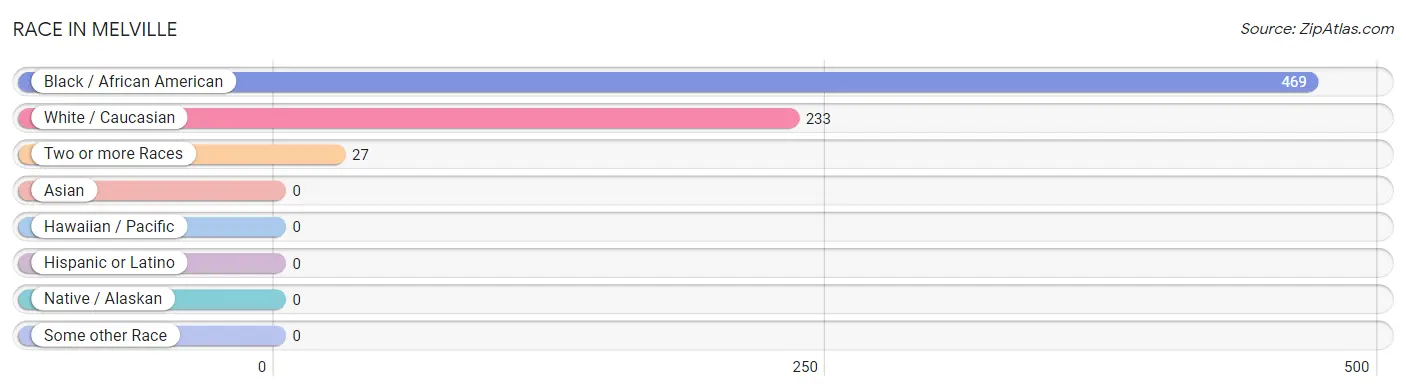
| Race | # Population | % Population |
| Asian | 0 | 0.0% |
| Black / African American | 469 | 64.3% |
| Hawaiian / Pacific | 0 | 0.0% |
| Hispanic or Latino | 0 | 0.0% |
| Native / Alaskan | 0 | 0.0% |
| White / Caucasian | 233 | 32.0% |
| Two or more Races | 27 | 3.7% |
| Some other Race | 0 | 0.0% |
| Total | 729 | 100.0% |
Ancestry in Melville
The most populous ancestries reported in Melville are French Canadian (103 | 14.1%), German (27 | 3.7%), French (23 | 3.2%), English (11 | 1.5%), and Italian (3 | 0.4%), together accounting for 22.9% of all Melville residents.
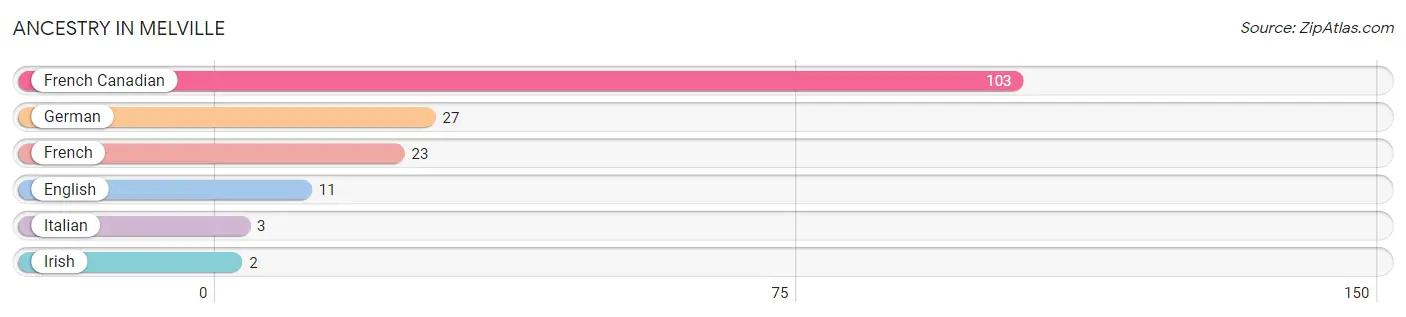
| Ancestry | # Population | % Population |
| English | 11 | 1.5% |
| French | 23 | 3.2% |
| French Canadian | 103 | 14.1% |
| German | 27 | 3.7% |
| Irish | 2 | 0.3% |
| Italian | 3 | 0.4% | View All 6 Rows |
Immigrants in Melville

| Immigration Origin | # Population | % Population | View All 0 Rows |
Sex and Age in Melville
Sex and Age in Melville
The most populous age groups in Melville are 10 to 14 Years (53 | 15.9%) for men and Under 5 Years (40 | 10.1%) for women.
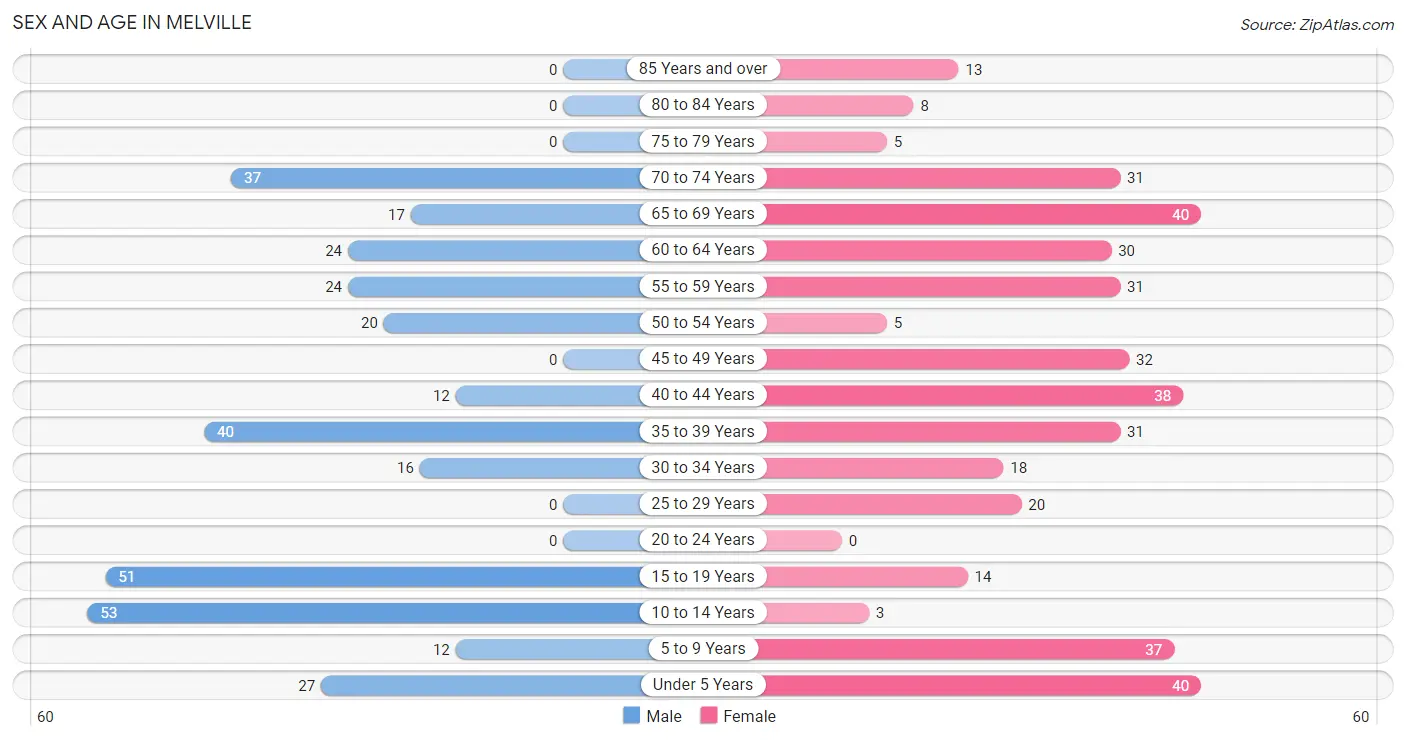
| Age Bracket | Male | Female |
| Under 5 Years | 27 (8.1%) | 40 (10.1%) |
| 5 to 9 Years | 12 (3.6%) | 37 (9.3%) |
| 10 to 14 Years | 53 (15.9%) | 3 (0.8%) |
| 15 to 19 Years | 51 (15.3%) | 14 (3.5%) |
| 20 to 24 Years | 0 (0.0%) | 0 (0.0%) |
| 25 to 29 Years | 0 (0.0%) | 20 (5.1%) |
| 30 to 34 Years | 16 (4.8%) | 18 (4.5%) |
| 35 to 39 Years | 40 (12.0%) | 31 (7.8%) |
| 40 to 44 Years | 12 (3.6%) | 38 (9.6%) |
| 45 to 49 Years | 0 (0.0%) | 32 (8.1%) |
| 50 to 54 Years | 20 (6.0%) | 5 (1.3%) |
| 55 to 59 Years | 24 (7.2%) | 31 (7.8%) |
| 60 to 64 Years | 24 (7.2%) | 30 (7.6%) |
| 65 to 69 Years | 17 (5.1%) | 40 (10.1%) |
| 70 to 74 Years | 37 (11.1%) | 31 (7.8%) |
| 75 to 79 Years | 0 (0.0%) | 5 (1.3%) |
| 80 to 84 Years | 0 (0.0%) | 8 (2.0%) |
| 85 Years and over | 0 (0.0%) | 13 (3.3%) |
| Total | 333 (100.0%) | 396 (100.0%) |
Families and Households in Melville
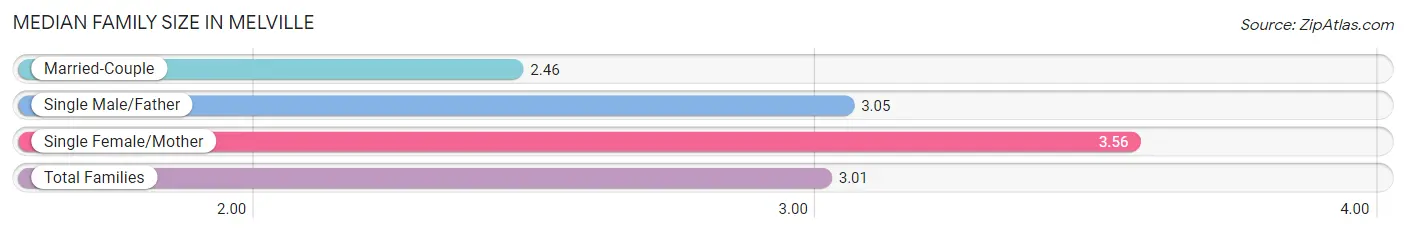
Median Family Size in Melville
The median family size in Melville is 3.01 persons per family, with single female/mother families (94 | 45.4%) accounting for the largest median family size of 3.56 persons per family. On the other hand, married-couple families (94 | 45.4%) represent the smallest median family size with 2.46 persons per family.
| Family Type | # Families | Family Size |
| Married-Couple | 94 (45.4%) | 2.46 |
| Single Male/Father | 19 (9.2%) | 3.05 |
| Single Female/Mother | 94 (45.4%) | 3.56 |
| Total Families | 207 (100.0%) | 3.01 |
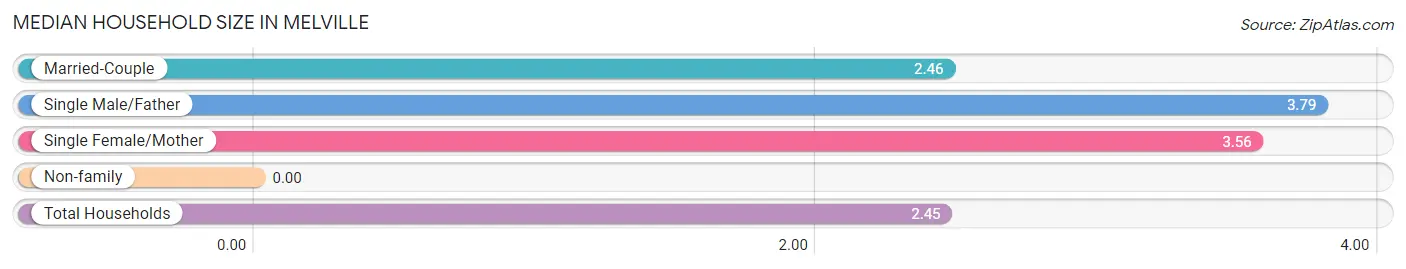
Median Household Size in Melville
| Household Type | # Households | Household Size |
| Married-Couple | 94 (31.5%) | 2.46 |
| Single Male/Father | 19 (6.4%) | 3.79 |
| Single Female/Mother | 94 (31.5%) | 3.56 |
| Non-family | 91 (30.5%) | - |
| Total Households | 298 (100.0%) | 2.45 |
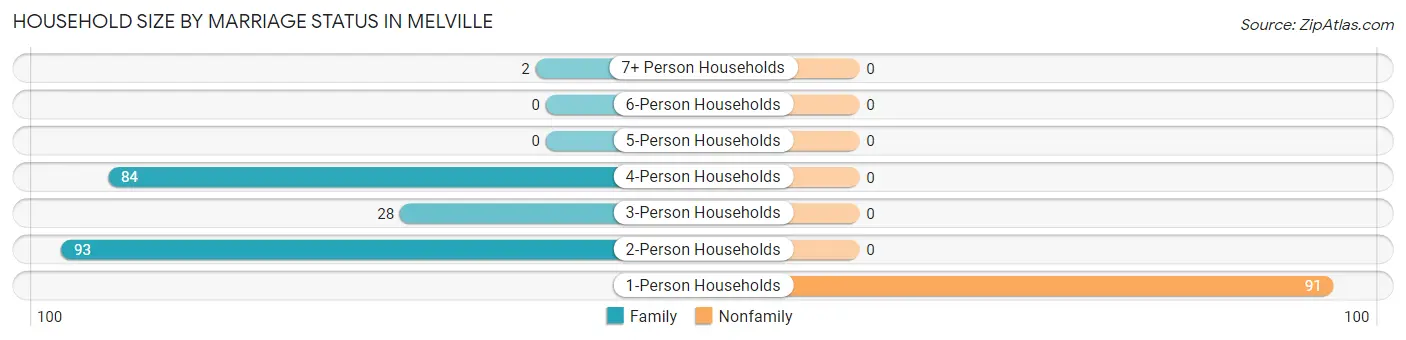
Household Size by Marriage Status in Melville
Out of a total of 298 households in Melville, 207 (69.5%) are family households, while 91 (30.5%) are nonfamily households. The most numerous type of family households are 2-person households, comprising 93, and the most common type of nonfamily households are 1-person households, comprising 91.
| Household Size | Family Households | Nonfamily Households |
| 1-Person Households | - | 91 (30.5%) |
| 2-Person Households | 93 (31.2%) | 0 (0.0%) |
| 3-Person Households | 28 (9.4%) | 0 (0.0%) |
| 4-Person Households | 84 (28.2%) | 0 (0.0%) |
| 5-Person Households | 0 (0.0%) | 0 (0.0%) |
| 6-Person Households | 0 (0.0%) | 0 (0.0%) |
| 7+ Person Households | 2 (0.7%) | 0 (0.0%) |
| Total | 207 (69.5%) | 91 (30.5%) |
Female Fertility in Melville
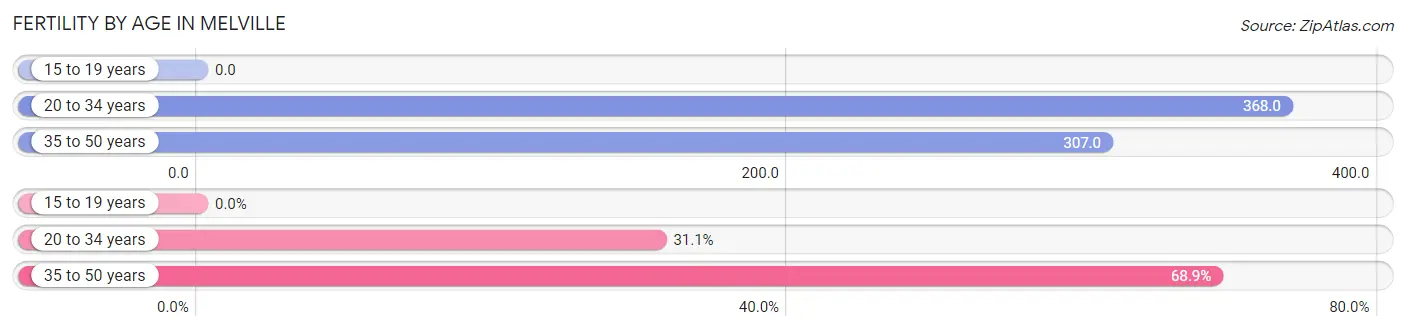
Fertility by Age in Melville
Average fertility rate in Melville is 294.0 births per 1,000 women. Women in the age bracket of 20 to 34 years have the highest fertility rate with 368.0 births per 1,000 women. Women in the age bracket of 35 to 50 years acount for 68.9% of all women with births.
| Age Bracket | Women with Births | Births / 1,000 Women |
| 15 to 19 years | 0 (0.0%) | 0.0 |
| 20 to 34 years | 14 (31.1%) | 368.0 |
| 35 to 50 years | 31 (68.9%) | 307.0 |
| Total | 45 (100.0%) | 294.0 |
Fertility by Age by Marriage Status in Melville
68.9% of women with births (45) in Melville are married. The highest percentage of unmarried women with births falls into 20 to 34 years age bracket with 100.0% of them unmarried at the time of birth, while the lowest percentage of unmarried women with births belong to 35 to 50 years age bracket with 0.0% of them unmarried.
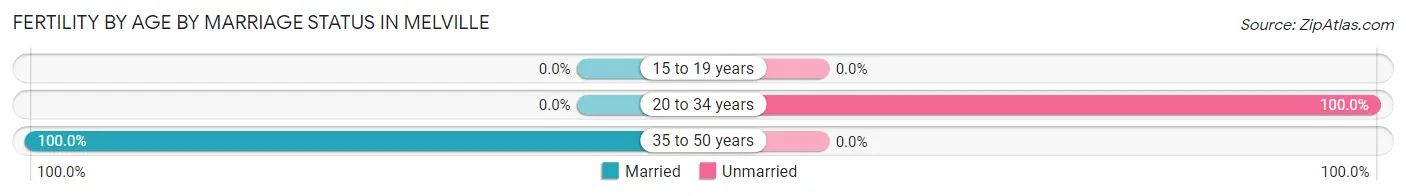
| Age Bracket | Married | Unmarried |
| 15 to 19 years | 0 (0.0%) | 0 (0.0%) |
| 20 to 34 years | 0 (0.0%) | 14 (100.0%) |
| 35 to 50 years | 31 (100.0%) | 0 (0.0%) |
| Total | 31 (68.9%) | 14 (31.1%) |
Fertility by Education in Melville
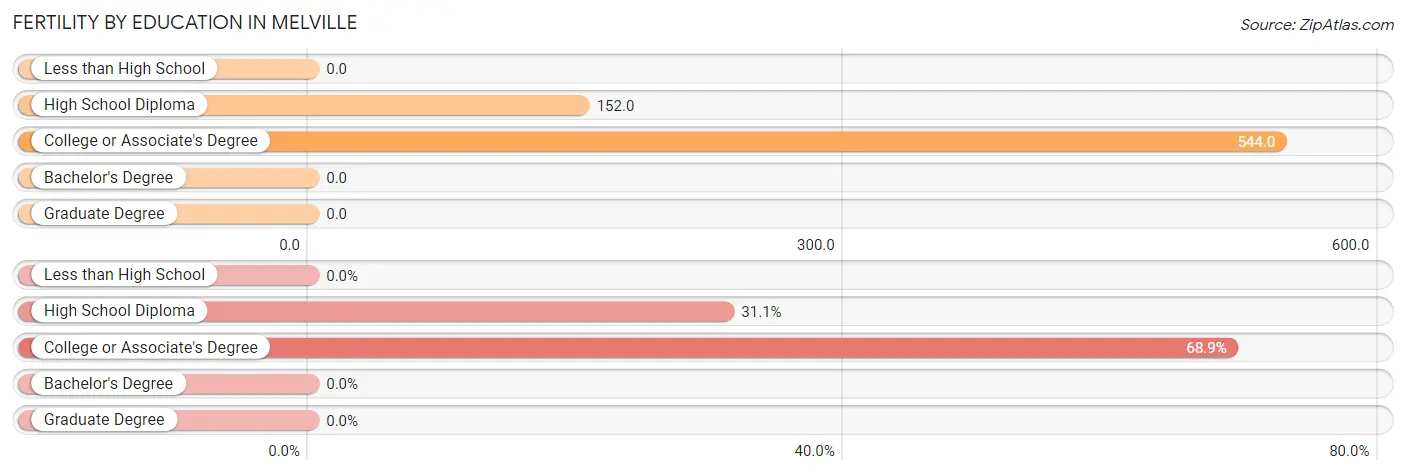
| Educational Attainment | Women with Births | Births / 1,000 Women |
| Less than High School | 0 (0.0%) | 0.0 |
| High School Diploma | 14 (31.1%) | 152.0 |
| College or Associate's Degree | 31 (68.9%) | 544.0 |
| Bachelor's Degree | 0 (0.0%) | 0.0 |
| Graduate Degree | 0 (0.0%) | 0.0 |
| Total | 45 (100.0%) | 294.0 |
Fertility by Education by Marriage Status in Melville
31.1% of women with births in Melville are unmarried. Women with the educational attainment of college or associate's degree are most likely to be married with 100.0% of them married at childbirth, while women with the educational attainment of high school diploma are least likely to be married with 100.0% of them unmarried at childbirth.
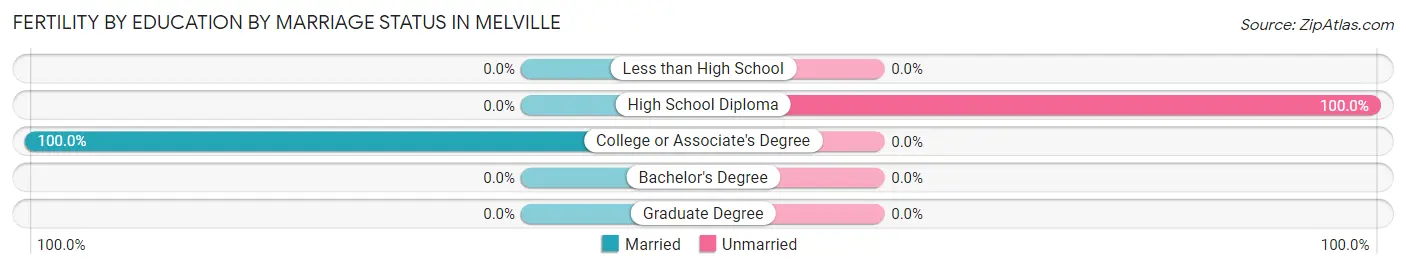
| Educational Attainment | Married | Unmarried |
| Less than High School | 0 (0.0%) | 0 (0.0%) |
| High School Diploma | 0 (0.0%) | 14 (100.0%) |
| College or Associate's Degree | 31 (100.0%) | 0 (0.0%) |
| Bachelor's Degree | 0 (0.0%) | 0 (0.0%) |
| Graduate Degree | 0 (0.0%) | 0 (0.0%) |
| Total | 31 (68.9%) | 14 (31.1%) |
Employment Characteristics in Melville
Employment by Class of Employer in Melville
Among the 226 employed individuals in Melville, private company employees (133 | 58.9%), not-for-profit organizations (46 | 20.3%), and self-employed (not incorporated) (30 | 13.3%) make up the most common classes of employment.
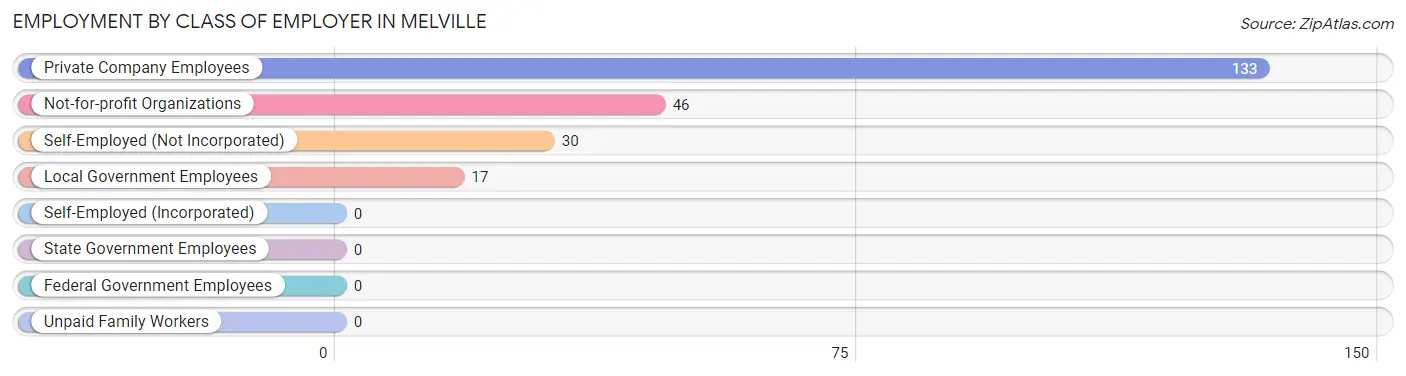
| Employer Class | # Employees | % Employees |
| Private Company Employees | 133 | 58.9% |
| Self-Employed (Incorporated) | 0 | 0.0% |
| Self-Employed (Not Incorporated) | 30 | 13.3% |
| Not-for-profit Organizations | 46 | 20.3% |
| Local Government Employees | 17 | 7.5% |
| State Government Employees | 0 | 0.0% |
| Federal Government Employees | 0 | 0.0% |
| Unpaid Family Workers | 0 | 0.0% |
| Total | 226 | 100.0% |
Employment Status by Age in Melville
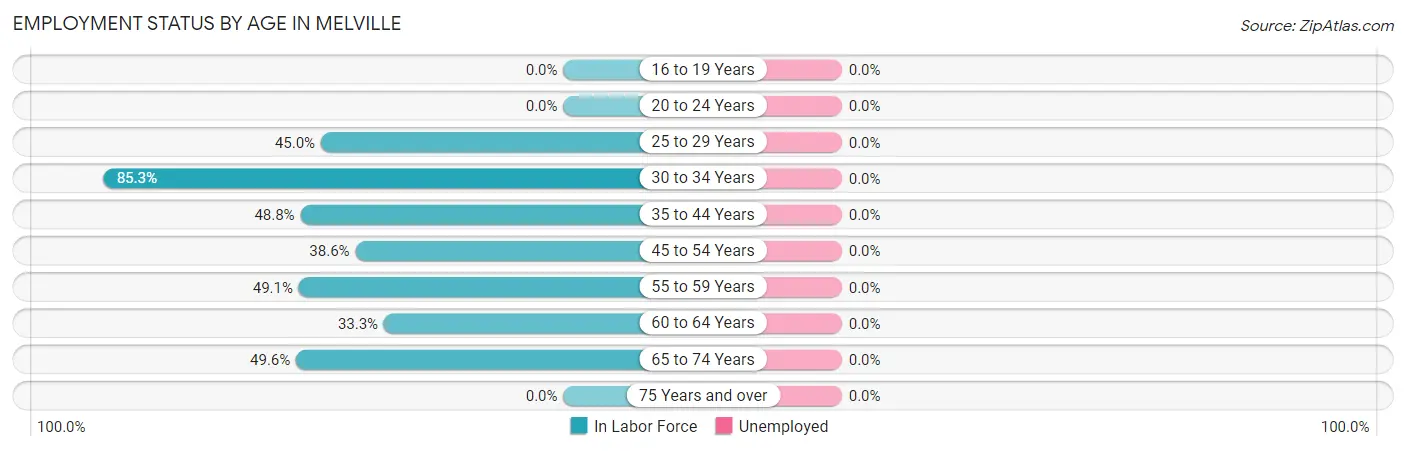
| Age Bracket | In Labor Force | Unemployed |
| 16 to 19 Years | 0 (0.0%) | 0 (0.0%) |
| 20 to 24 Years | 0 (0.0%) | 0 (0.0%) |
| 25 to 29 Years | 9 (45.0%) | 0 (0.0%) |
| 30 to 34 Years | 29 (85.3%) | 0 (0.0%) |
| 35 to 44 Years | 59 (48.8%) | 0 (0.0%) |
| 45 to 54 Years | 22 (38.6%) | 0 (0.0%) |
| 55 to 59 Years | 27 (49.1%) | 0 (0.0%) |
| 60 to 64 Years | 18 (33.3%) | 0 (0.0%) |
| 65 to 74 Years | 62 (49.6%) | 0 (0.0%) |
| 75 Years and over | 0 (0.0%) | 0 (0.0%) |
| Total | 226 (40.6%) | 0 (0.0%) |
Employment Status by Educational Attainment in Melville
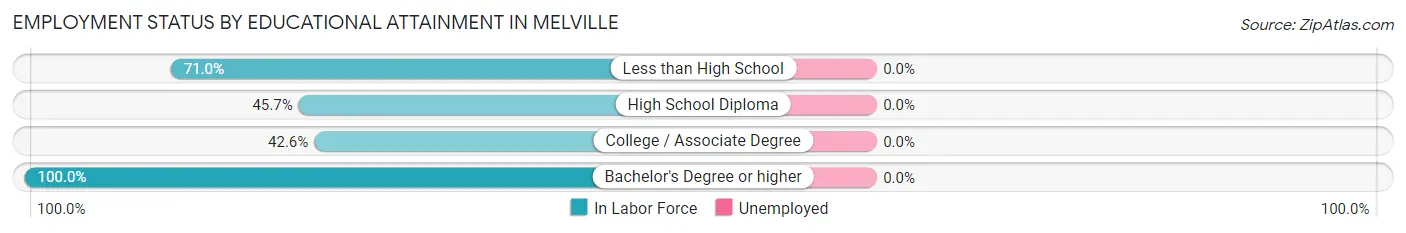
| Educational Attainment | In Labor Force | Unemployed |
| Less than High School | 22 (71.0%) | 0 (0.0%) |
| High School Diploma | 112 (45.7%) | 0 (0.0%) |
| College / Associate Degree | 26 (42.6%) | 0 (0.0%) |
| Bachelor's Degree or higher | 4 (100.0%) | 0 (0.0%) |
| Total | 164 (48.1%) | 0 (0.0%) |
Employment Occupations by Sex in Melville
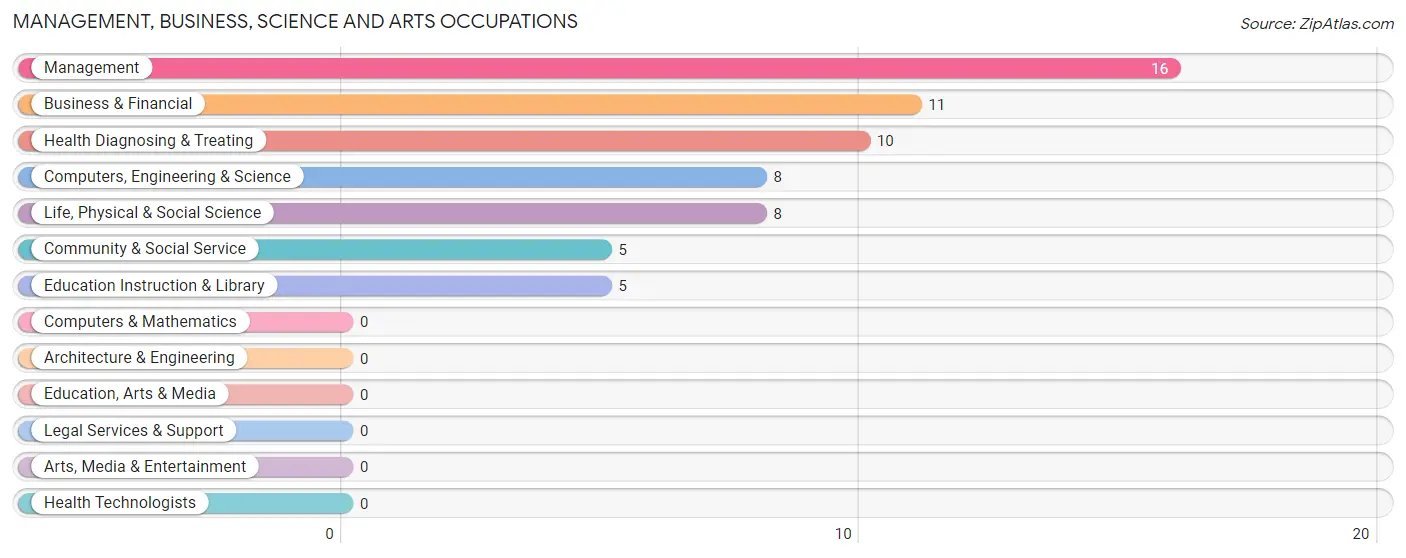
Management, Business, Science and Arts Occupations
The most common Management, Business, Science and Arts occupations in Melville are Management (16 | 7.1%), Business & Financial (11 | 4.9%), Health Diagnosing & Treating (10 | 4.4%), Computers, Engineering & Science (8 | 3.5%), and Life, Physical & Social Science (8 | 3.5%).
Management, Business, Science and Arts Occupations by Sex
Within the Management, Business, Science and Arts occupations in Melville, the most male-oriented occupations are Computers, Engineering & Science (100.0%), and Life, Physical & Social Science (100.0%), while the most female-oriented occupations are Management (100.0%), Business & Financial (100.0%), and Community & Social Service (100.0%).
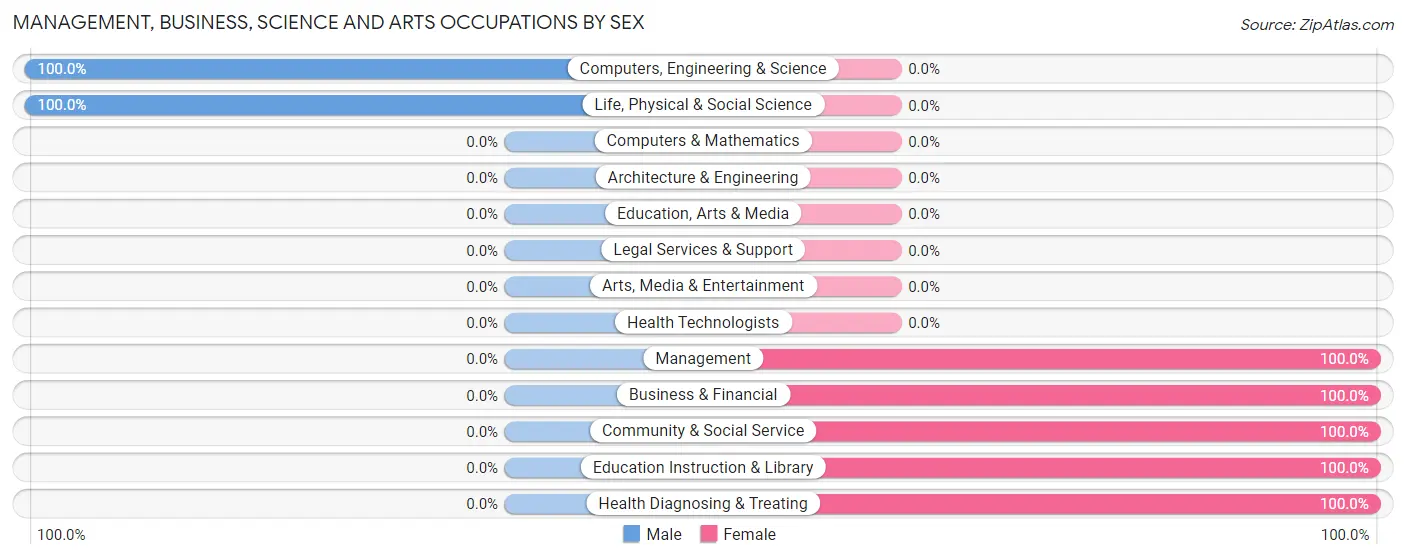
| Occupation | Male | Female |
| Management | 0 (0.0%) | 16 (100.0%) |
| Business & Financial | 0 (0.0%) | 11 (100.0%) |
| Computers, Engineering & Science | 8 (100.0%) | 0 (0.0%) |
| Computers & Mathematics | 0 (0.0%) | 0 (0.0%) |
| Architecture & Engineering | 0 (0.0%) | 0 (0.0%) |
| Life, Physical & Social Science | 8 (100.0%) | 0 (0.0%) |
| Community & Social Service | 0 (0.0%) | 5 (100.0%) |
| Education, Arts & Media | 0 (0.0%) | 0 (0.0%) |
| Legal Services & Support | 0 (0.0%) | 0 (0.0%) |
| Education Instruction & Library | 0 (0.0%) | 5 (100.0%) |
| Arts, Media & Entertainment | 0 (0.0%) | 0 (0.0%) |
| Health Diagnosing & Treating | 0 (0.0%) | 10 (100.0%) |
| Health Technologists | 0 (0.0%) | 0 (0.0%) |
| Total (Category) | 8 (16.0%) | 42 (84.0%) |
| Total (Overall) | 90 (39.8%) | 136 (60.2%) |
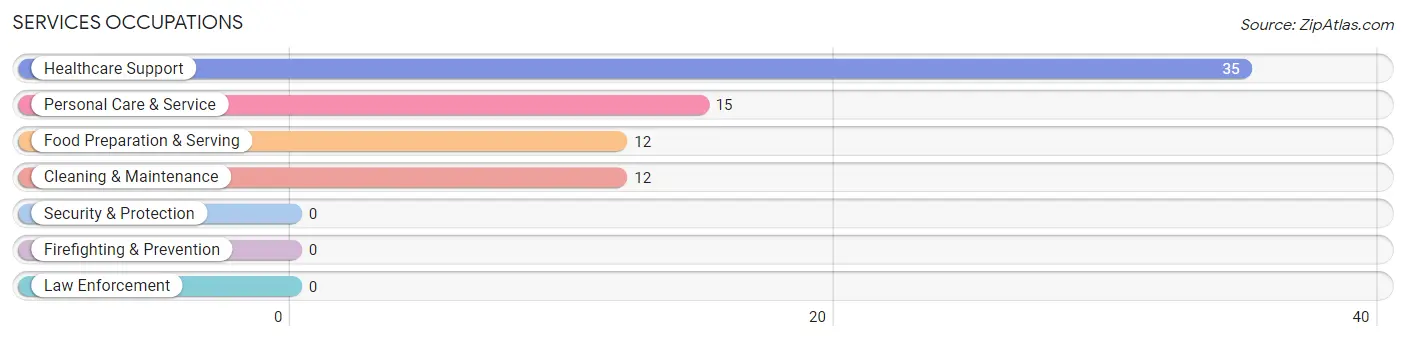
Services Occupations
The most common Services occupations in Melville are Healthcare Support (35 | 15.5%), Personal Care & Service (15 | 6.6%), Food Preparation & Serving (12 | 5.3%), and Cleaning & Maintenance (12 | 5.3%).
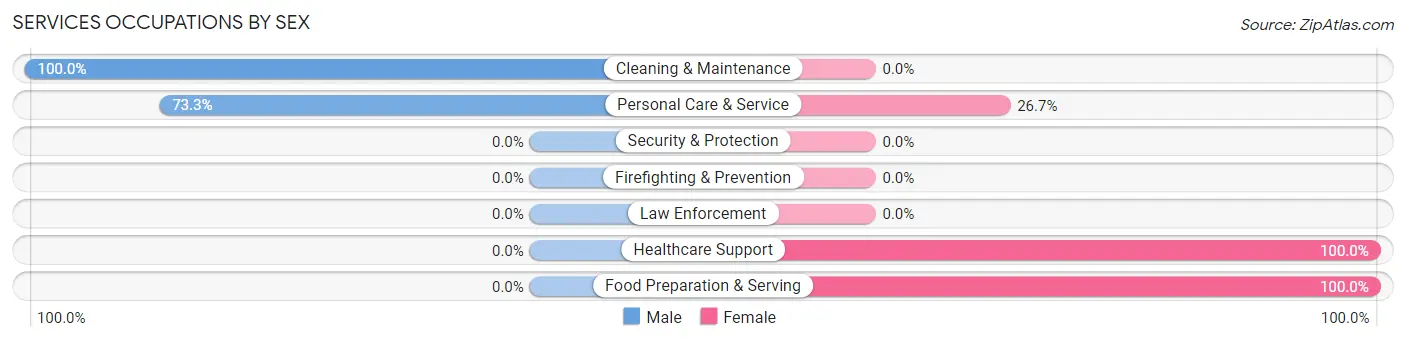
Services Occupations by Sex
Within the Services occupations in Melville, the most male-oriented occupations are Cleaning & Maintenance (100.0%), and Personal Care & Service (73.3%), while the most female-oriented occupations are Healthcare Support (100.0%), Food Preparation & Serving (100.0%), and Personal Care & Service (26.7%).
| Occupation | Male | Female |
| Healthcare Support | 0 (0.0%) | 35 (100.0%) |
| Security & Protection | 0 (0.0%) | 0 (0.0%) |
| Firefighting & Prevention | 0 (0.0%) | 0 (0.0%) |
| Law Enforcement | 0 (0.0%) | 0 (0.0%) |
| Food Preparation & Serving | 0 (0.0%) | 12 (100.0%) |
| Cleaning & Maintenance | 12 (100.0%) | 0 (0.0%) |
| Personal Care & Service | 11 (73.3%) | 4 (26.7%) |
| Total (Category) | 23 (31.1%) | 51 (68.9%) |
| Total (Overall) | 90 (39.8%) | 136 (60.2%) |
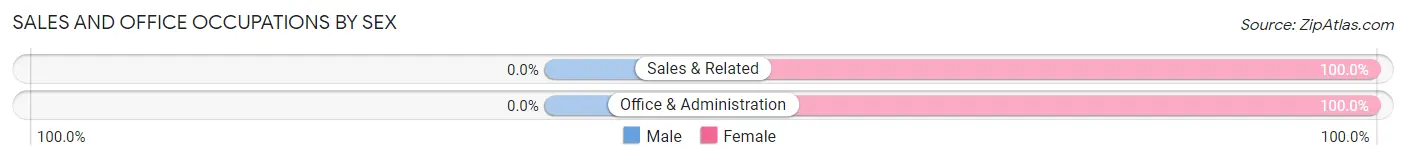
Sales and Office Occupations
The most common Sales and Office occupations in Melville are Office & Administration (29 | 12.8%), and Sales & Related (14 | 6.2%).

Sales and Office Occupations by Sex
| Occupation | Male | Female |
| Sales & Related | 0 (0.0%) | 14 (100.0%) |
| Office & Administration | 0 (0.0%) | 29 (100.0%) |
| Total (Category) | 0 (0.0%) | 43 (100.0%) |
| Total (Overall) | 90 (39.8%) | 136 (60.2%) |
Natural Resources, Construction and Maintenance Occupations
The most common Natural Resources, Construction and Maintenance occupations in Melville are , and Construction & Extraction (52 | 23.0%).

Natural Resources, Construction and Maintenance Occupations by Sex

| Occupation | Male | Female |
| Farming, Fishing & Forestry | 0 (0.0%) | 0 (0.0%) |
| Construction & Extraction | 52 (100.0%) | 0 (0.0%) |
| Installation, Maintenance & Repair | 0 (0.0%) | 0 (0.0%) |
| Total (Category) | 52 (100.0%) | 0 (0.0%) |
| Total (Overall) | 90 (39.8%) | 136 (60.2%) |
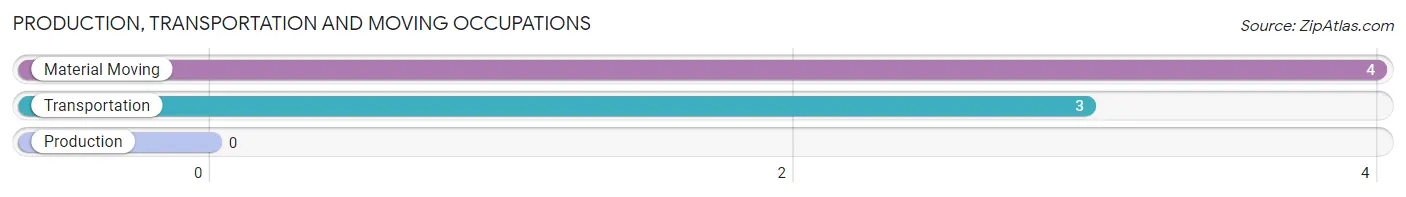
Production, Transportation and Moving Occupations
The most common Production, Transportation and Moving occupations in Melville are Material Moving (4 | 1.8%), and Transportation (3 | 1.3%).
Production, Transportation and Moving Occupations by Sex
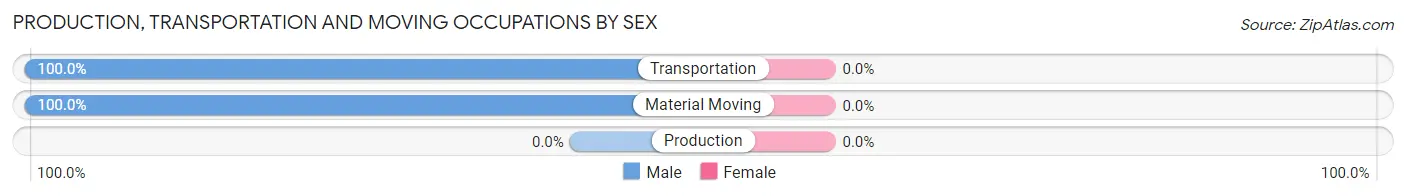
| Occupation | Male | Female |
| Production | 0 (0.0%) | 0 (0.0%) |
| Transportation | 3 (100.0%) | 0 (0.0%) |
| Material Moving | 4 (100.0%) | 0 (0.0%) |
| Total (Category) | 7 (100.0%) | 0 (0.0%) |
| Total (Overall) | 90 (39.8%) | 136 (60.2%) |
Employment Industries by Sex in Melville
Employment Industries in Melville
The major employment industries in Melville include Health Care & Social Assistance (87 | 38.5%), Construction (58 | 25.7%), Retail Trade (23 | 10.2%), Agriculture, Fishing & Hunting (12 | 5.3%), and Administrative & Support (12 | 5.3%).
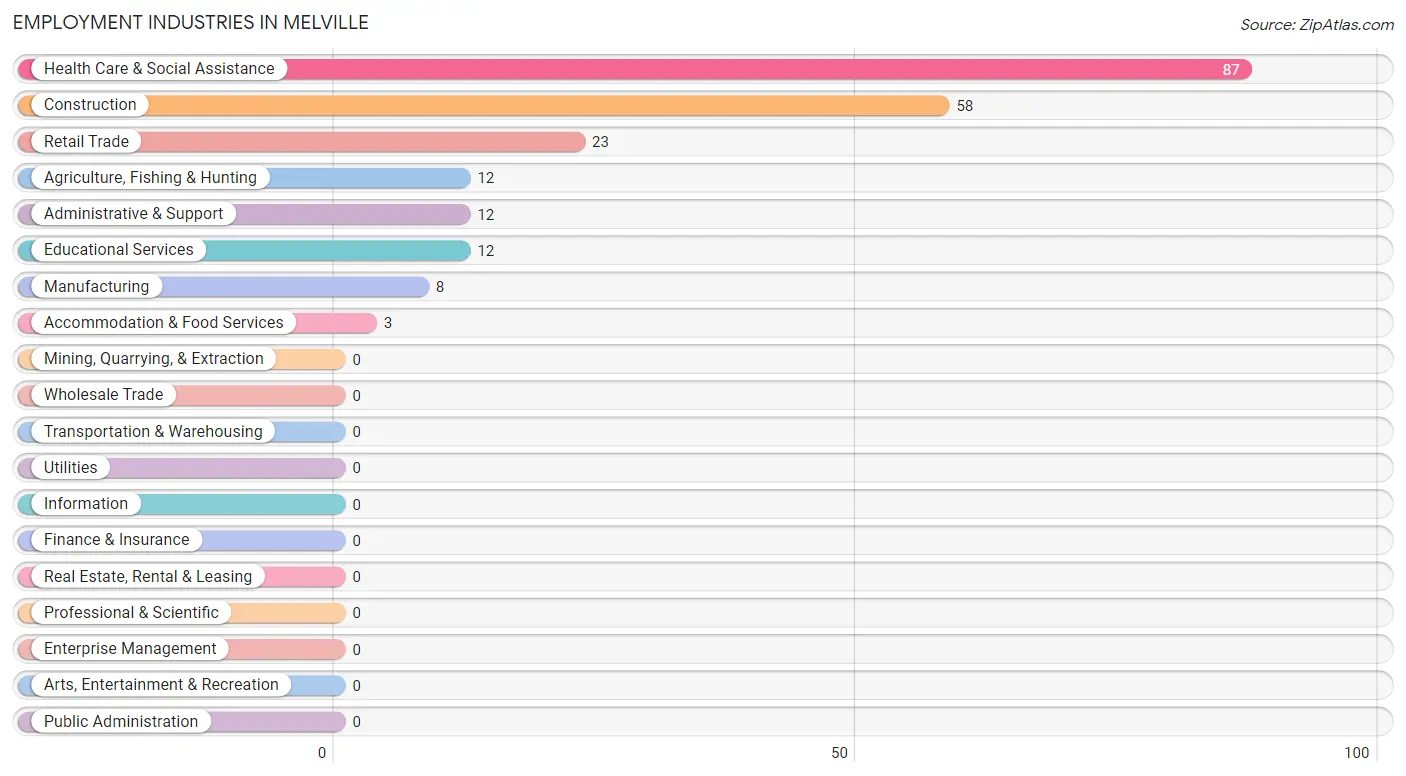
Employment Industries by Sex in Melville
The Melville industries that see more men than women are Agriculture, Fishing & Hunting (100.0%), Manufacturing (100.0%), and Administrative & Support (100.0%), whereas the industries that tend to have a higher number of women are Retail Trade (100.0%), Health Care & Social Assistance (100.0%), and Accommodation & Food Services (100.0%).

| Industry | Male | Female |
| Agriculture, Fishing & Hunting | 12 (100.0%) | 0 (0.0%) |
| Mining, Quarrying, & Extraction | 0 (0.0%) | 0 (0.0%) |
| Construction | 44 (75.9%) | 14 (24.1%) |
| Manufacturing | 8 (100.0%) | 0 (0.0%) |
| Wholesale Trade | 0 (0.0%) | 0 (0.0%) |
| Retail Trade | 0 (0.0%) | 23 (100.0%) |
| Transportation & Warehousing | 0 (0.0%) | 0 (0.0%) |
| Utilities | 0 (0.0%) | 0 (0.0%) |
| Information | 0 (0.0%) | 0 (0.0%) |
| Finance & Insurance | 0 (0.0%) | 0 (0.0%) |
| Real Estate, Rental & Leasing | 0 (0.0%) | 0 (0.0%) |
| Professional & Scientific | 0 (0.0%) | 0 (0.0%) |
| Enterprise Management | 0 (0.0%) | 0 (0.0%) |
| Administrative & Support | 12 (100.0%) | 0 (0.0%) |
| Educational Services | 3 (25.0%) | 9 (75.0%) |
| Health Care & Social Assistance | 0 (0.0%) | 87 (100.0%) |
| Arts, Entertainment & Recreation | 0 (0.0%) | 0 (0.0%) |
| Accommodation & Food Services | 0 (0.0%) | 3 (100.0%) |
| Public Administration | 0 (0.0%) | 0 (0.0%) |
| Total | 90 (39.8%) | 136 (60.2%) |
Education in Melville
School Enrollment in Melville
The most common levels of schooling among the 158 students in Melville are middle school (56 | 35.4%), high school (51 | 32.3%), and kindergarten (34 | 21.5%).
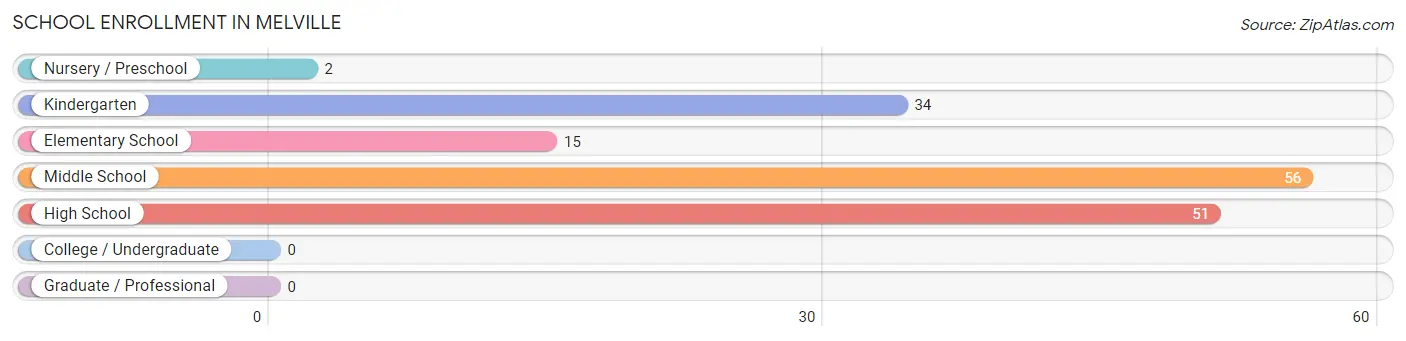
| School Level | # Students | % Students |
| Nursery / Preschool | 2 | 1.3% |
| Kindergarten | 34 | 21.5% |
| Elementary School | 15 | 9.5% |
| Middle School | 56 | 35.4% |
| High School | 51 | 32.3% |
| College / Undergraduate | 0 | 0.0% |
| Graduate / Professional | 0 | 0.0% |
| Total | 158 | 100.0% |
School Enrollment by Age by Funding Source in Melville
Out of a total of 158 students who are enrolled in schools in Melville, 9 (5.7%) attend a private institution, while the remaining 149 (94.3%) are enrolled in public schools. The age group of 5 to 9 year old has the highest likelihood of being enrolled in private schools, with 6 (12.2% in the age bracket) enrolled. Conversely, the age group of 3 to 4 year olds has the lowest likelihood of being enrolled in a private school, with 2 (100.0% in the age bracket) attending a public institution.
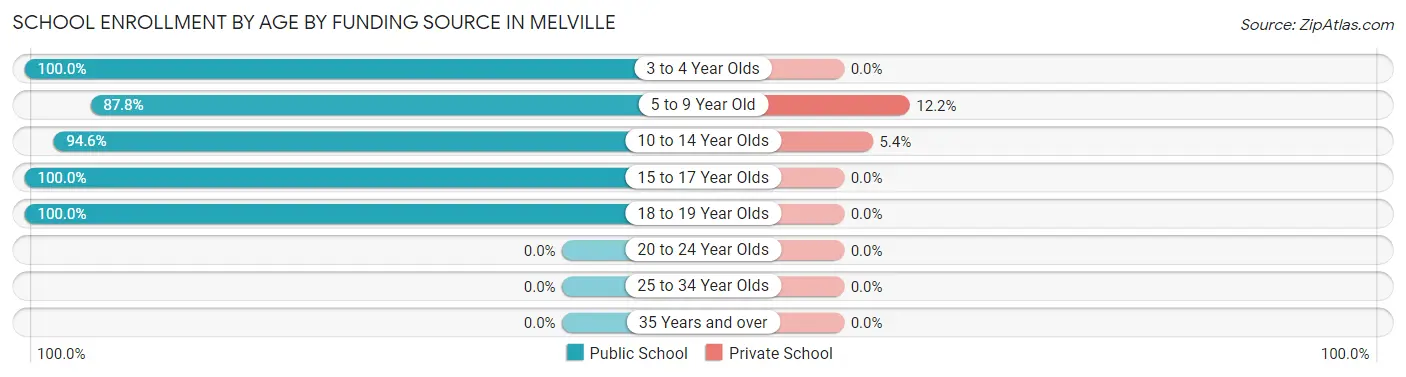
| Age Bracket | Public School | Private School |
| 3 to 4 Year Olds | 2 (100.0%) | 0 (0.0%) |
| 5 to 9 Year Old | 43 (87.8%) | 6 (12.2%) |
| 10 to 14 Year Olds | 53 (94.6%) | 3 (5.4%) |
| 15 to 17 Year Olds | 30 (100.0%) | 0 (0.0%) |
| 18 to 19 Year Olds | 21 (100.0%) | 0 (0.0%) |
| 20 to 24 Year Olds | 0 (0.0%) | 0 (0.0%) |
| 25 to 34 Year Olds | 0 (0.0%) | 0 (0.0%) |
| 35 Years and over | 0 (0.0%) | 0 (0.0%) |
| Total | 149 (94.3%) | 9 (5.7%) |
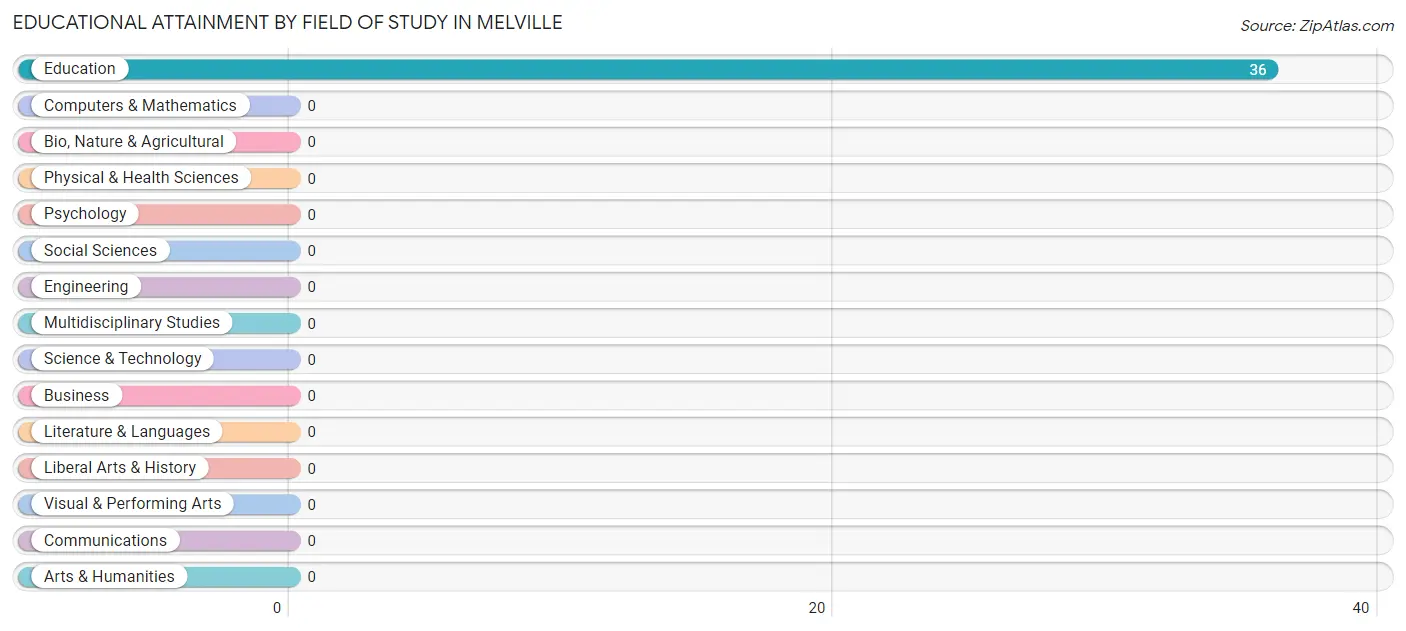
Educational Attainment by Field of Study in Melville
, and education (36 | 100.0%) are the most common fields of study among 36 individuals in Melville who have obtained a bachelor's degree or higher.
| Field of Study | # Graduates | % Graduates |
| Computers & Mathematics | 0 | 0.0% |
| Bio, Nature & Agricultural | 0 | 0.0% |
| Physical & Health Sciences | 0 | 0.0% |
| Psychology | 0 | 0.0% |
| Social Sciences | 0 | 0.0% |
| Engineering | 0 | 0.0% |
| Multidisciplinary Studies | 0 | 0.0% |
| Science & Technology | 0 | 0.0% |
| Business | 0 | 0.0% |
| Education | 36 | 100.0% |
| Literature & Languages | 0 | 0.0% |
| Liberal Arts & History | 0 | 0.0% |
| Visual & Performing Arts | 0 | 0.0% |
| Communications | 0 | 0.0% |
| Arts & Humanities | 0 | 0.0% |
| Total | 36 | 100.0% |
Transportation & Commute in Melville
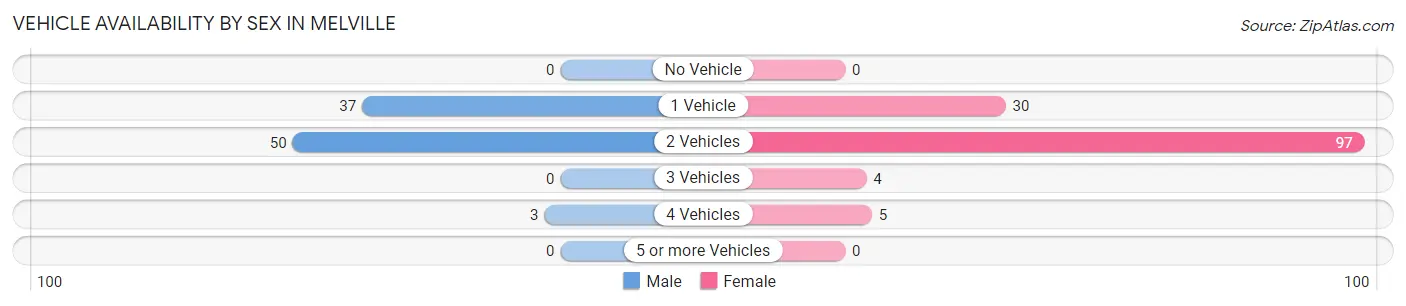
Vehicle Availability by Sex in Melville
The most prevalent vehicle ownership categories in Melville are males with 2 vehicles (50, accounting for 55.6%) and females with 2 vehicles (97, making up 36.8%).
| Vehicles Available | Male | Female |
| No Vehicle | 0 (0.0%) | 0 (0.0%) |
| 1 Vehicle | 37 (41.1%) | 30 (22.1%) |
| 2 Vehicles | 50 (55.6%) | 97 (71.3%) |
| 3 Vehicles | 0 (0.0%) | 4 (2.9%) |
| 4 Vehicles | 3 (3.3%) | 5 (3.7%) |
| 5 or more Vehicles | 0 (0.0%) | 0 (0.0%) |
| Total | 90 (100.0%) | 136 (100.0%) |
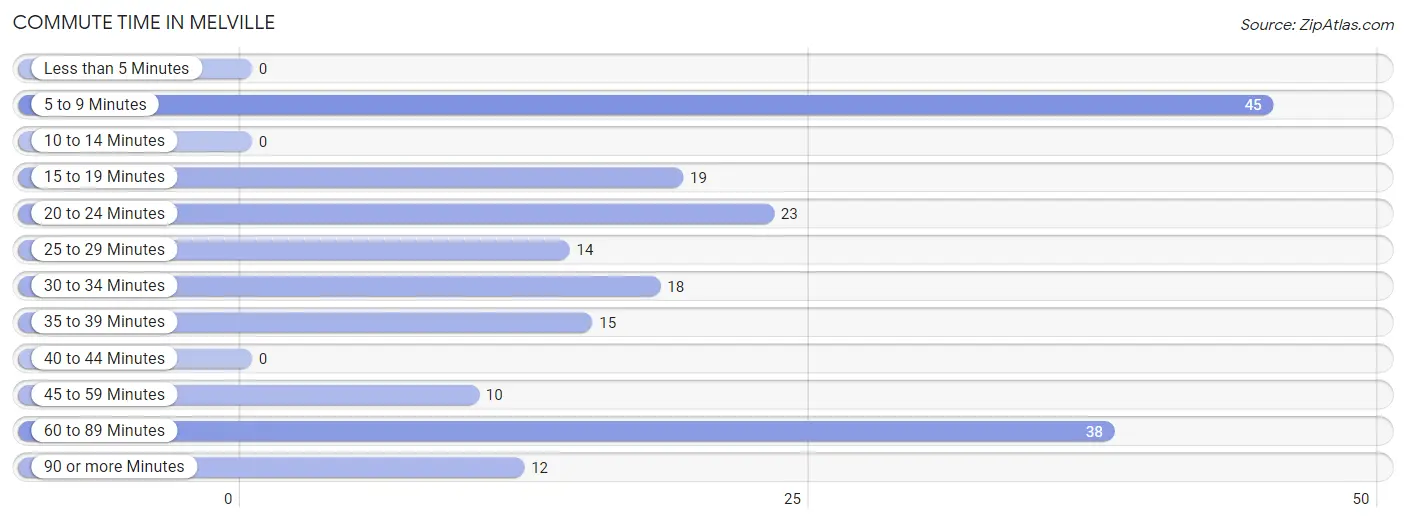
Commute Time in Melville
The most frequently occuring commute durations in Melville are 5 to 9 minutes (45 commuters, 23.2%), 60 to 89 minutes (38 commuters, 19.6%), and 20 to 24 minutes (23 commuters, 11.9%).
| Commute Time | # Commuters | % Commuters |
| Less than 5 Minutes | 0 | 0.0% |
| 5 to 9 Minutes | 45 | 23.2% |
| 10 to 14 Minutes | 0 | 0.0% |
| 15 to 19 Minutes | 19 | 9.8% |
| 20 to 24 Minutes | 23 | 11.9% |
| 25 to 29 Minutes | 14 | 7.2% |
| 30 to 34 Minutes | 18 | 9.3% |
| 35 to 39 Minutes | 15 | 7.7% |
| 40 to 44 Minutes | 0 | 0.0% |
| 45 to 59 Minutes | 10 | 5.1% |
| 60 to 89 Minutes | 38 | 19.6% |
| 90 or more Minutes | 12 | 6.2% |
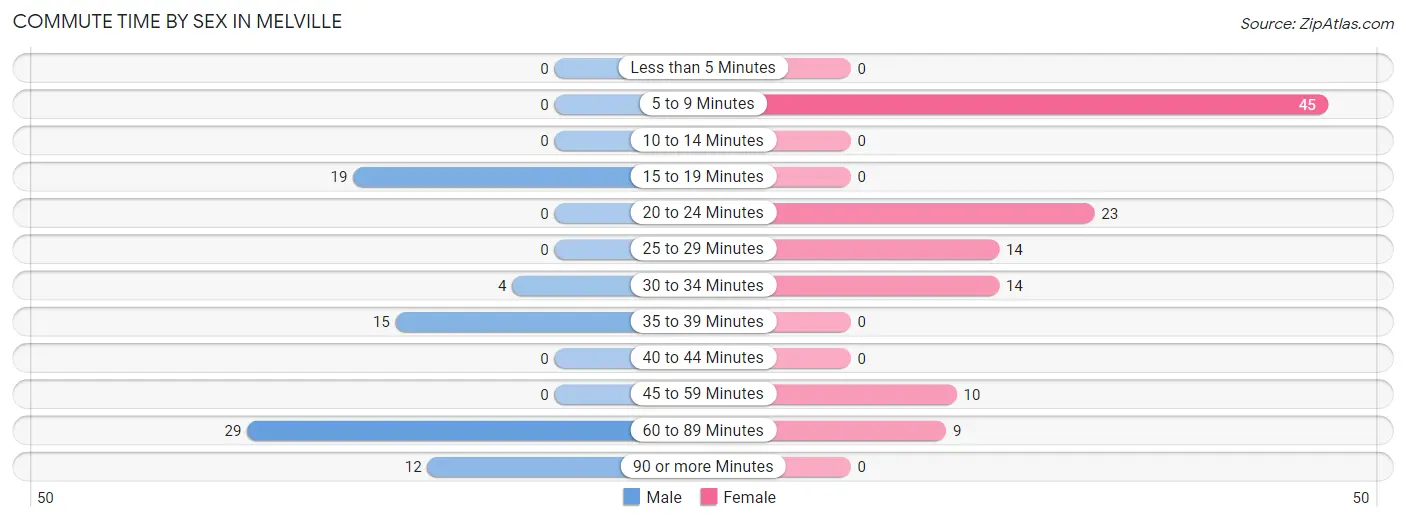
Commute Time by Sex in Melville
The most common commute times in Melville are 60 to 89 minutes (29 commuters, 36.7%) for males and 5 to 9 minutes (45 commuters, 39.1%) for females.
| Commute Time | Male | Female |
| Less than 5 Minutes | 0 (0.0%) | 0 (0.0%) |
| 5 to 9 Minutes | 0 (0.0%) | 45 (39.1%) |
| 10 to 14 Minutes | 0 (0.0%) | 0 (0.0%) |
| 15 to 19 Minutes | 19 (24.0%) | 0 (0.0%) |
| 20 to 24 Minutes | 0 (0.0%) | 23 (20.0%) |
| 25 to 29 Minutes | 0 (0.0%) | 14 (12.2%) |
| 30 to 34 Minutes | 4 (5.1%) | 14 (12.2%) |
| 35 to 39 Minutes | 15 (19.0%) | 0 (0.0%) |
| 40 to 44 Minutes | 0 (0.0%) | 0 (0.0%) |
| 45 to 59 Minutes | 0 (0.0%) | 10 (8.7%) |
| 60 to 89 Minutes | 29 (36.7%) | 9 (7.8%) |
| 90 or more Minutes | 12 (15.2%) | 0 (0.0%) |
Time of Departure to Work by Sex in Melville
The most frequent times of departure to work in Melville are 6:00 AM to 6:29 AM (22, 27.9%) for males and 6:30 AM to 6:59 AM (52, 45.2%) for females.
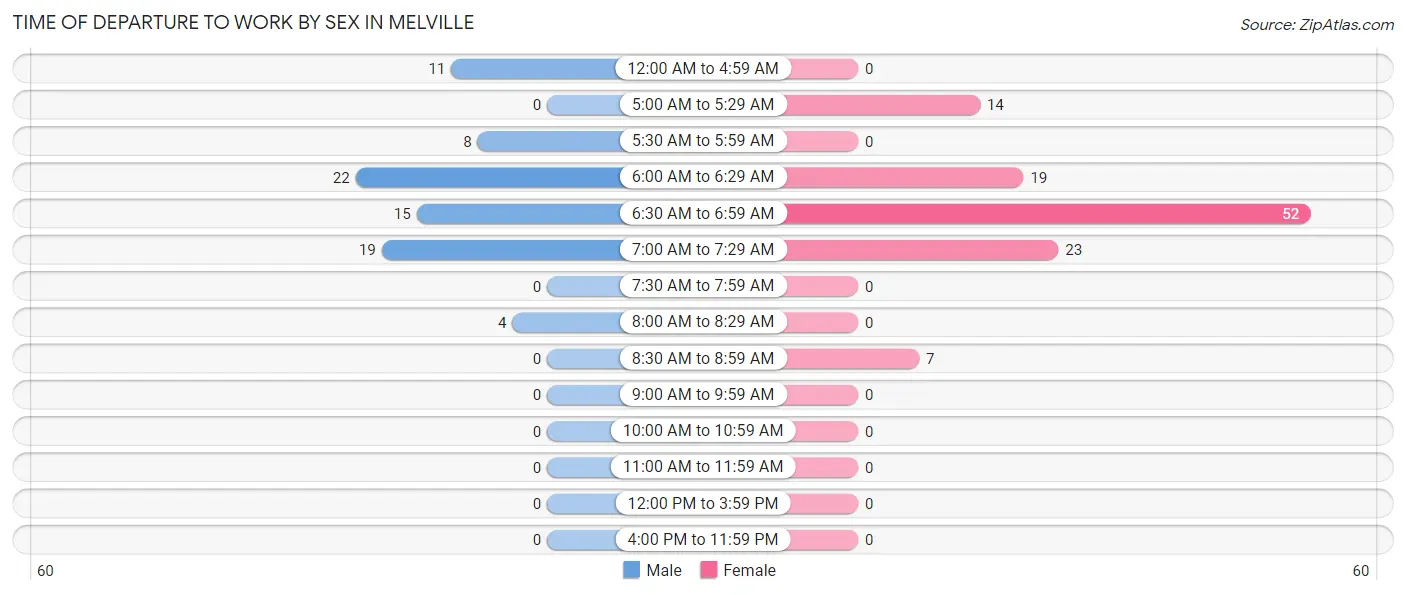
| Time of Departure | Male | Female |
| 12:00 AM to 4:59 AM | 11 (13.9%) | 0 (0.0%) |
| 5:00 AM to 5:29 AM | 0 (0.0%) | 14 (12.2%) |
| 5:30 AM to 5:59 AM | 8 (10.1%) | 0 (0.0%) |
| 6:00 AM to 6:29 AM | 22 (27.9%) | 19 (16.5%) |
| 6:30 AM to 6:59 AM | 15 (19.0%) | 52 (45.2%) |
| 7:00 AM to 7:29 AM | 19 (24.0%) | 23 (20.0%) |
| 7:30 AM to 7:59 AM | 0 (0.0%) | 0 (0.0%) |
| 8:00 AM to 8:29 AM | 4 (5.1%) | 0 (0.0%) |
| 8:30 AM to 8:59 AM | 0 (0.0%) | 7 (6.1%) |
| 9:00 AM to 9:59 AM | 0 (0.0%) | 0 (0.0%) |
| 10:00 AM to 10:59 AM | 0 (0.0%) | 0 (0.0%) |
| 11:00 AM to 11:59 AM | 0 (0.0%) | 0 (0.0%) |
| 12:00 PM to 3:59 PM | 0 (0.0%) | 0 (0.0%) |
| 4:00 PM to 11:59 PM | 0 (0.0%) | 0 (0.0%) |
| Total | 79 (100.0%) | 115 (100.0%) |
Housing Occupancy in Melville
Occupancy by Ownership in Melville
Of the total 298 dwellings in Melville, owner-occupied units account for 241 (80.9%), while renter-occupied units make up 57 (19.1%).
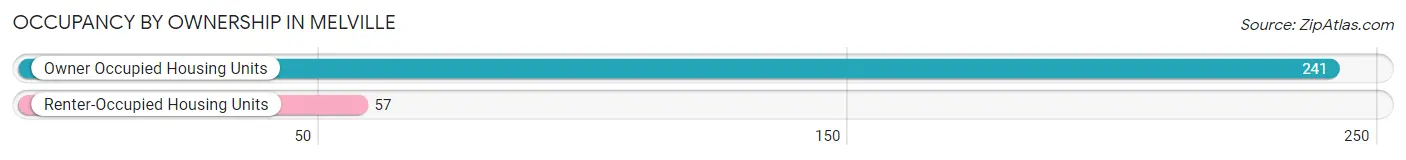
| Occupancy | # Housing Units | % Housing Units |
| Owner Occupied Housing Units | 241 | 80.9% |
| Renter-Occupied Housing Units | 57 | 19.1% |
| Total Occupied Housing Units | 298 | 100.0% |
Occupancy by Household Size in Melville
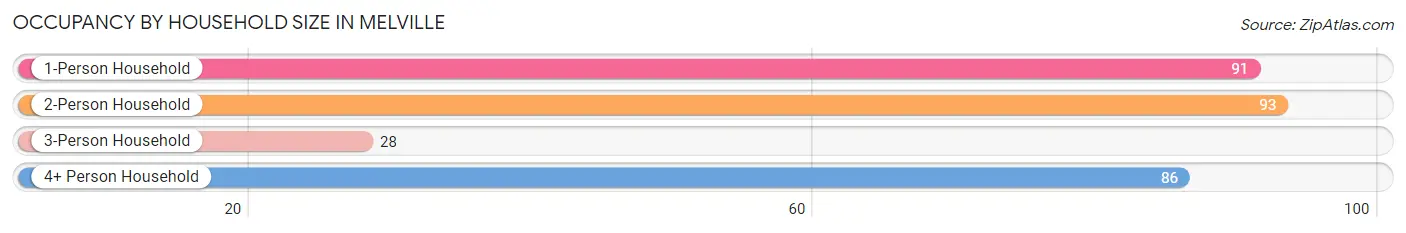
| Household Size | # Housing Units | % Housing Units |
| 1-Person Household | 91 | 30.5% |
| 2-Person Household | 93 | 31.2% |
| 3-Person Household | 28 | 9.4% |
| 4+ Person Household | 86 | 28.9% |
| Total Housing Units | 298 | 100.0% |
Occupancy by Ownership by Household Size in Melville

| Household Size | Owner-occupied | Renter-occupied |
| 1-Person Household | 56 (61.5%) | 35 (38.5%) |
| 2-Person Household | 88 (94.6%) | 5 (5.4%) |
| 3-Person Household | 11 (39.3%) | 17 (60.7%) |
| 4+ Person Household | 86 (100.0%) | 0 (0.0%) |
| Total Housing Units | 241 (80.9%) | 57 (19.1%) |
Occupancy by Educational Attainment in Melville
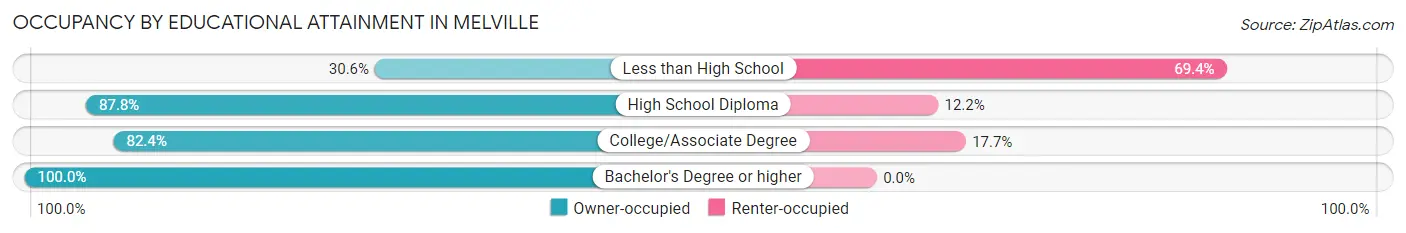
| Household Size | Owner-occupied | Renter-occupied |
| Less than High School | 11 (30.6%) | 25 (69.4%) |
| High School Diploma | 166 (87.8%) | 23 (12.2%) |
| College/Associate Degree | 42 (82.4%) | 9 (17.6%) |
| Bachelor's Degree or higher | 22 (100.0%) | 0 (0.0%) |
Occupancy by Age of Householder in Melville
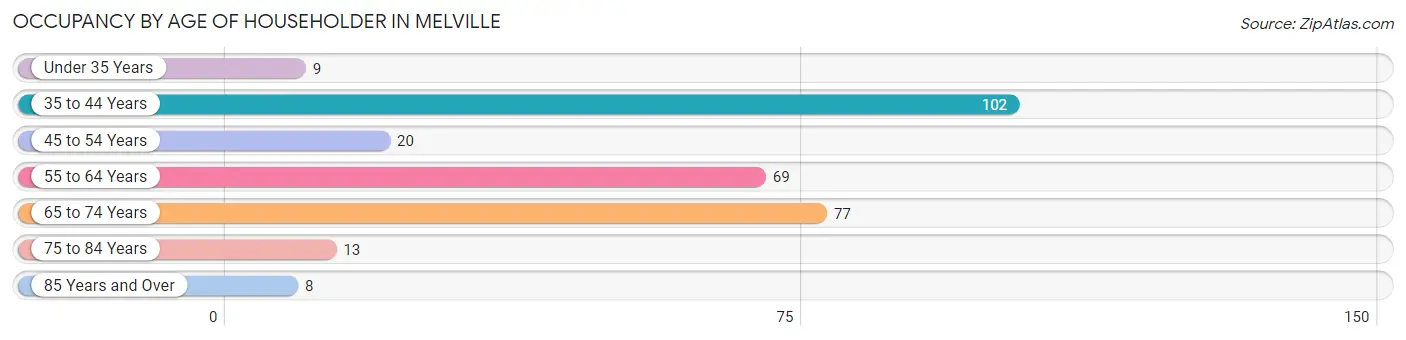
| Age Bracket | # Households | % Households |
| Under 35 Years | 9 | 3.0% |
| 35 to 44 Years | 102 | 34.2% |
| 45 to 54 Years | 20 | 6.7% |
| 55 to 64 Years | 69 | 23.2% |
| 65 to 74 Years | 77 | 25.8% |
| 75 to 84 Years | 13 | 4.4% |
| 85 Years and Over | 8 | 2.7% |
| Total | 298 | 100.0% |
Housing Finances in Melville
Median Income by Occupancy in Melville
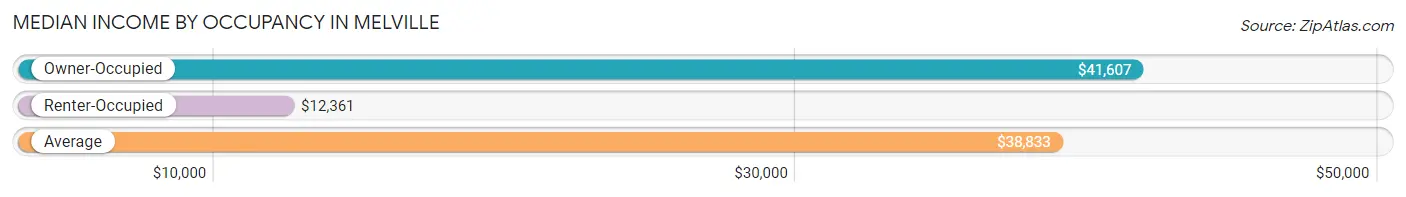
| Occupancy Type | # Households | Median Income |
| Owner-Occupied | 241 (80.9%) | $41,607 |
| Renter-Occupied | 57 (19.1%) | $12,361 |
| Average | 298 (100.0%) | $38,833 |
Occupancy by Householder Income Bracket in Melville
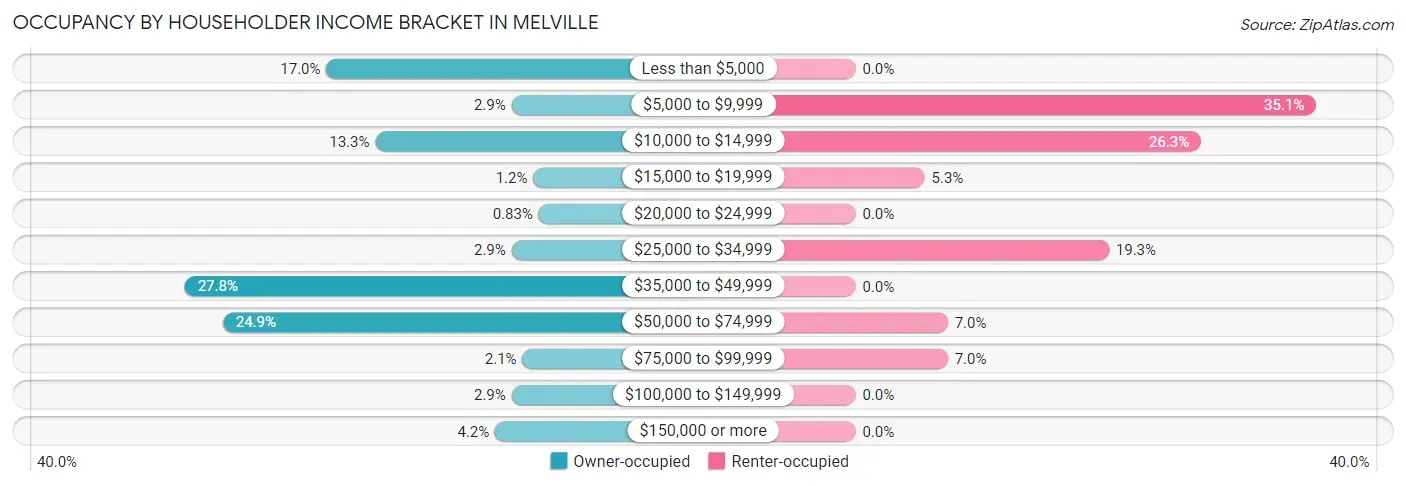
| Income Bracket | Owner-occupied | Renter-occupied |
| Less than $5,000 | 41 (17.0%) | 0 (0.0%) |
| $5,000 to $9,999 | 7 (2.9%) | 20 (35.1%) |
| $10,000 to $14,999 | 32 (13.3%) | 15 (26.3%) |
| $15,000 to $19,999 | 3 (1.2%) | 3 (5.3%) |
| $20,000 to $24,999 | 2 (0.8%) | 0 (0.0%) |
| $25,000 to $34,999 | 7 (2.9%) | 11 (19.3%) |
| $35,000 to $49,999 | 67 (27.8%) | 0 (0.0%) |
| $50,000 to $74,999 | 60 (24.9%) | 4 (7.0%) |
| $75,000 to $99,999 | 5 (2.1%) | 4 (7.0%) |
| $100,000 to $149,999 | 7 (2.9%) | 0 (0.0%) |
| $150,000 or more | 10 (4.2%) | 0 (0.0%) |
| Total | 241 (100.0%) | 57 (100.0%) |
Monthly Housing Cost Tiers in Melville
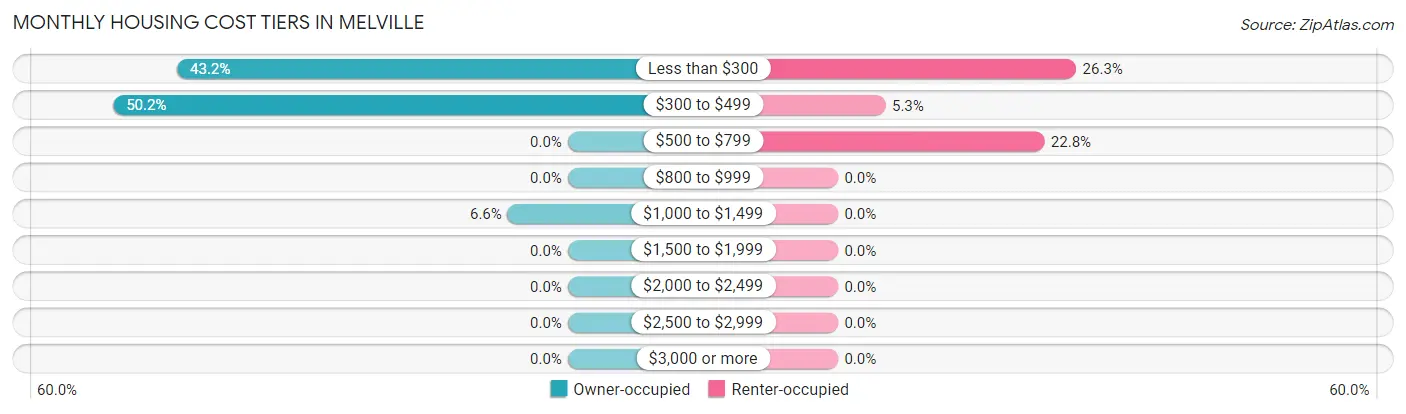
| Monthly Cost | Owner-occupied | Renter-occupied |
| Less than $300 | 104 (43.1%) | 15 (26.3%) |
| $300 to $499 | 121 (50.2%) | 3 (5.3%) |
| $500 to $799 | 0 (0.0%) | 13 (22.8%) |
| $800 to $999 | 0 (0.0%) | 0 (0.0%) |
| $1,000 to $1,499 | 16 (6.6%) | 0 (0.0%) |
| $1,500 to $1,999 | 0 (0.0%) | 0 (0.0%) |
| $2,000 to $2,499 | 0 (0.0%) | 0 (0.0%) |
| $2,500 to $2,999 | 0 (0.0%) | 0 (0.0%) |
| $3,000 or more | 0 (0.0%) | 0 (0.0%) |
| Total | 241 (100.0%) | 57 (100.0%) |
Physical Housing Characteristics in Melville
Housing Structures in Melville
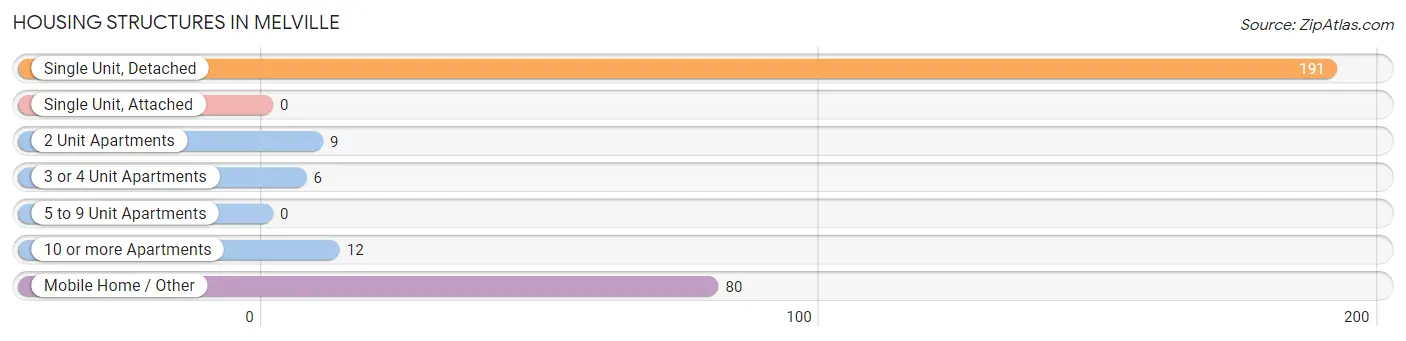
| Structure Type | # Housing Units | % Housing Units |
| Single Unit, Detached | 191 | 64.1% |
| Single Unit, Attached | 0 | 0.0% |
| 2 Unit Apartments | 9 | 3.0% |
| 3 or 4 Unit Apartments | 6 | 2.0% |
| 5 to 9 Unit Apartments | 0 | 0.0% |
| 10 or more Apartments | 12 | 4.0% |
| Mobile Home / Other | 80 | 26.9% |
| Total | 298 | 100.0% |
Housing Structures by Occupancy in Melville
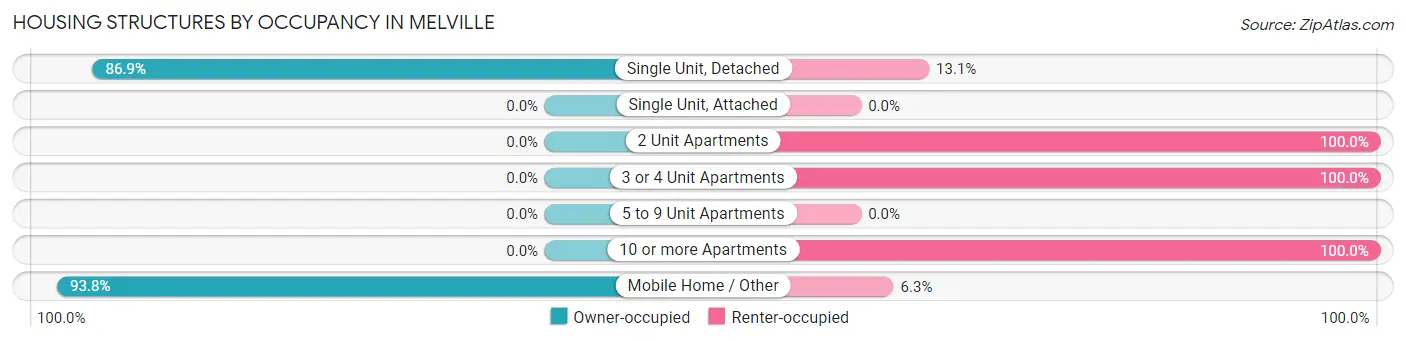
| Structure Type | Owner-occupied | Renter-occupied |
| Single Unit, Detached | 166 (86.9%) | 25 (13.1%) |
| Single Unit, Attached | 0 (0.0%) | 0 (0.0%) |
| 2 Unit Apartments | 0 (0.0%) | 9 (100.0%) |
| 3 or 4 Unit Apartments | 0 (0.0%) | 6 (100.0%) |
| 5 to 9 Unit Apartments | 0 (0.0%) | 0 (0.0%) |
| 10 or more Apartments | 0 (0.0%) | 12 (100.0%) |
| Mobile Home / Other | 75 (93.8%) | 5 (6.2%) |
| Total | 241 (80.9%) | 57 (19.1%) |
Housing Structures by Number of Rooms in Melville
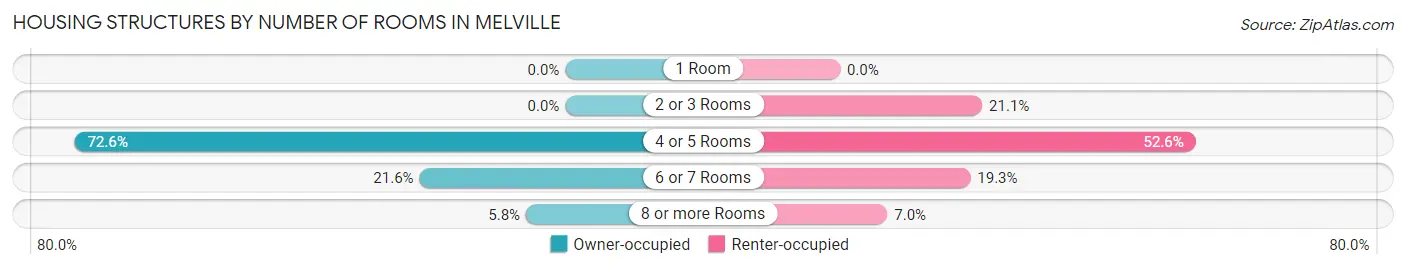
| Number of Rooms | Owner-occupied | Renter-occupied |
| 1 Room | 0 (0.0%) | 0 (0.0%) |
| 2 or 3 Rooms | 0 (0.0%) | 12 (21.0%) |
| 4 or 5 Rooms | 175 (72.6%) | 30 (52.6%) |
| 6 or 7 Rooms | 52 (21.6%) | 11 (19.3%) |
| 8 or more Rooms | 14 (5.8%) | 4 (7.0%) |
| Total | 241 (100.0%) | 57 (100.0%) |
Housing Structure by Heating Type in Melville
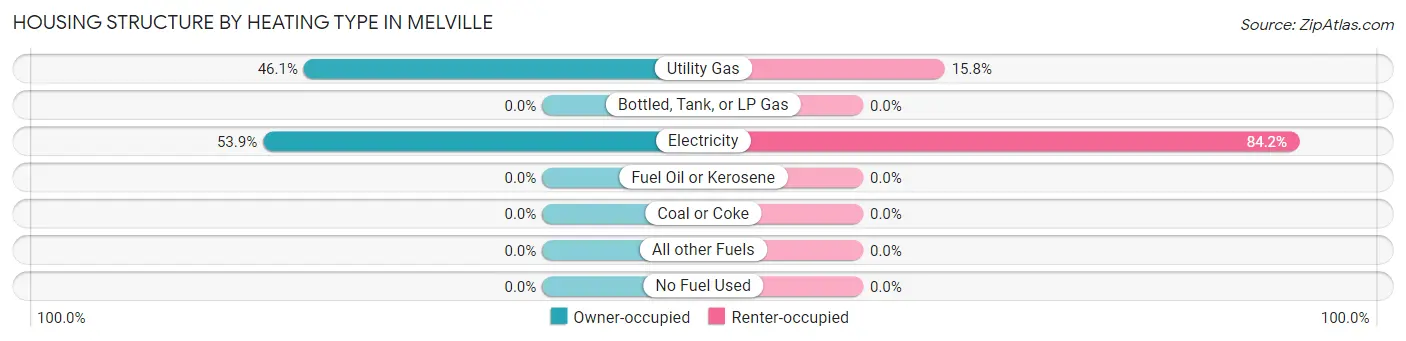
| Heating Type | Owner-occupied | Renter-occupied |
| Utility Gas | 111 (46.1%) | 9 (15.8%) |
| Bottled, Tank, or LP Gas | 0 (0.0%) | 0 (0.0%) |
| Electricity | 130 (53.9%) | 48 (84.2%) |
| Fuel Oil or Kerosene | 0 (0.0%) | 0 (0.0%) |
| Coal or Coke | 0 (0.0%) | 0 (0.0%) |
| All other Fuels | 0 (0.0%) | 0 (0.0%) |
| No Fuel Used | 0 (0.0%) | 0 (0.0%) |
| Total | 241 (100.0%) | 57 (100.0%) |
Household Vehicle Usage in Melville
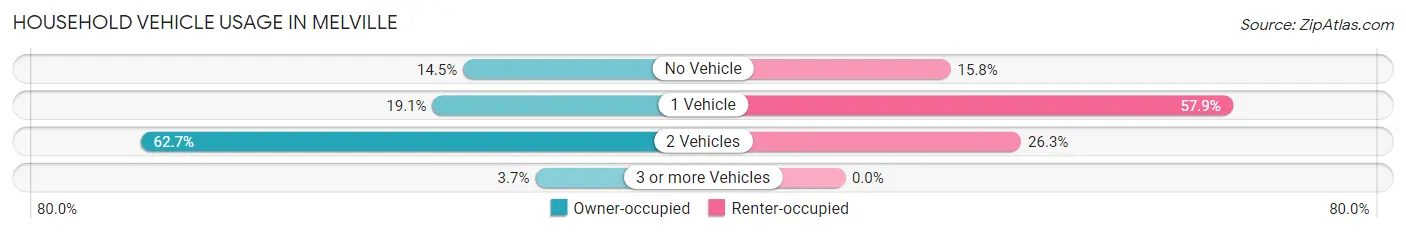
| Vehicles per Household | Owner-occupied | Renter-occupied |
| No Vehicle | 35 (14.5%) | 9 (15.8%) |
| 1 Vehicle | 46 (19.1%) | 33 (57.9%) |
| 2 Vehicles | 151 (62.7%) | 15 (26.3%) |
| 3 or more Vehicles | 9 (3.7%) | 0 (0.0%) |
| Total | 241 (100.0%) | 57 (100.0%) |
Real Estate & Mortgages in Melville
Real Estate and Mortgage Overview in Melville
| Characteristic | Without Mortgage | With Mortgage |
| Housing Units | 225 | 16 |
| Median Property Value | $112,900 | $0 |
| Median Household Income | $41,146 | $0 |
| Monthly Housing Costs | $315 | $0 |
| Real Estate Taxes | - | - |
Property Value by Mortgage Status in Melville
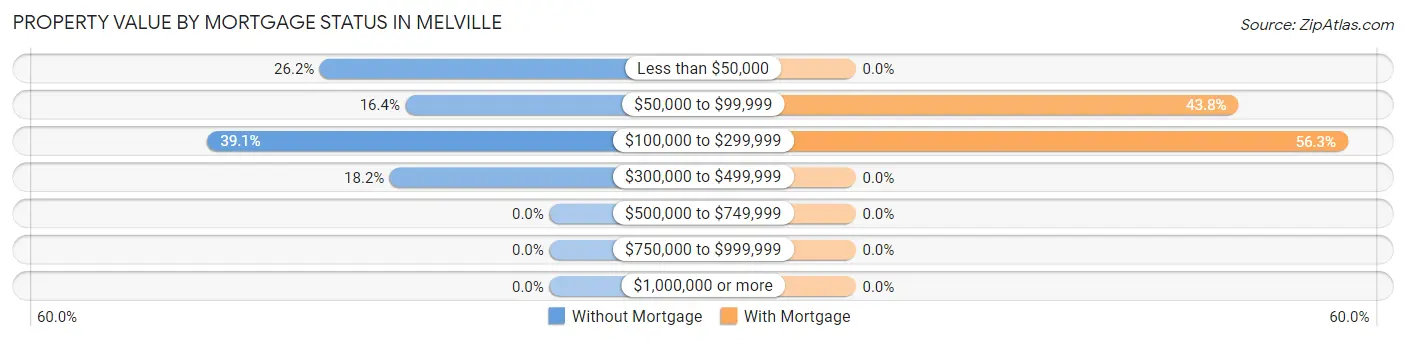
| Property Value | Without Mortgage | With Mortgage |
| Less than $50,000 | 59 (26.2%) | 0 (0.0%) |
| $50,000 to $99,999 | 37 (16.4%) | 7 (43.8%) |
| $100,000 to $299,999 | 88 (39.1%) | 9 (56.2%) |
| $300,000 to $499,999 | 41 (18.2%) | 0 (0.0%) |
| $500,000 to $749,999 | 0 (0.0%) | 0 (0.0%) |
| $750,000 to $999,999 | 0 (0.0%) | 0 (0.0%) |
| $1,000,000 or more | 0 (0.0%) | 0 (0.0%) |
| Total | 225 (100.0%) | 16 (100.0%) |
Household Income by Mortgage Status in Melville
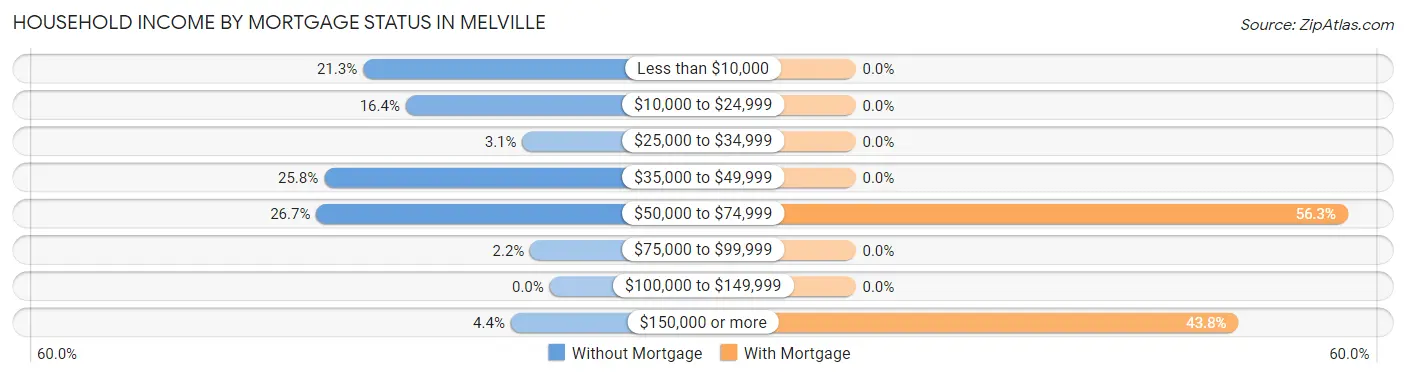
| Household Income | Without Mortgage | With Mortgage |
| Less than $10,000 | 48 (21.3%) | 0 (0.0%) |
| $10,000 to $24,999 | 37 (16.4%) | 0 (0.0%) |
| $25,000 to $34,999 | 7 (3.1%) | 0 (0.0%) |
| $35,000 to $49,999 | 58 (25.8%) | 0 (0.0%) |
| $50,000 to $74,999 | 60 (26.7%) | 9 (56.2%) |
| $75,000 to $99,999 | 5 (2.2%) | 0 (0.0%) |
| $100,000 to $149,999 | 0 (0.0%) | 0 (0.0%) |
| $150,000 or more | 10 (4.4%) | 7 (43.8%) |
| Total | 225 (100.0%) | 16 (100.0%) |
Property Value to Household Income Ratio in Melville
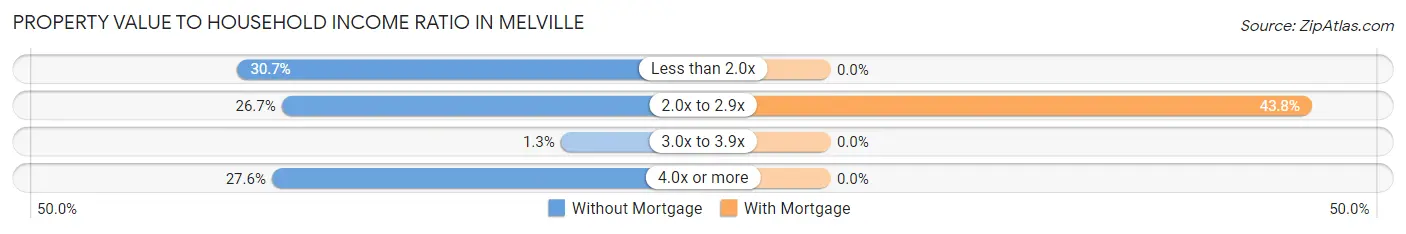
| Value-to-Income Ratio | Without Mortgage | With Mortgage |
| Less than 2.0x | 69 (30.7%) | 0 (0.0%) |
| 2.0x to 2.9x | 60 (26.7%) | 7 (43.8%) |
| 3.0x to 3.9x | 3 (1.3%) | 0 (0.0%) |
| 4.0x or more | 62 (27.6%) | 0 (0.0%) |
| Total | 225 (100.0%) | 16 (100.0%) |
Real Estate Taxes by Mortgage Status in Melville
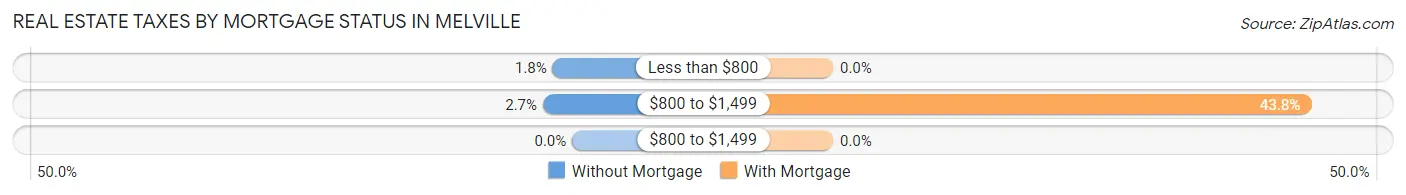
| Property Taxes | Without Mortgage | With Mortgage |
| Less than $800 | 4 (1.8%) | 0 (0.0%) |
| $800 to $1,499 | 6 (2.7%) | 7 (43.8%) |
| $800 to $1,499 | 0 (0.0%) | 0 (0.0%) |
| Total | 225 (100.0%) | 16 (100.0%) |
Health & Disability in Melville
Health Insurance Coverage by Age in Melville
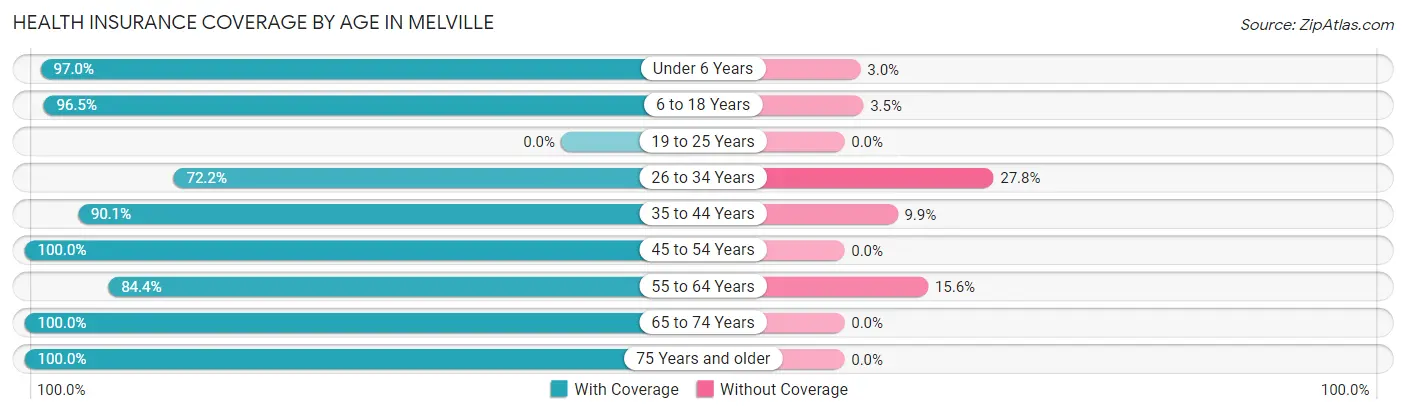
| Age Bracket | With Coverage | Without Coverage |
| Under 6 Years | 65 (97.0%) | 2 (3.0%) |
| 6 to 18 Years | 164 (96.5%) | 6 (3.5%) |
| 19 to 25 Years | 0 (0.0%) | 0 (0.0%) |
| 26 to 34 Years | 39 (72.2%) | 15 (27.8%) |
| 35 to 44 Years | 109 (90.1%) | 12 (9.9%) |
| 45 to 54 Years | 57 (100.0%) | 0 (0.0%) |
| 55 to 64 Years | 92 (84.4%) | 17 (15.6%) |
| 65 to 74 Years | 125 (100.0%) | 0 (0.0%) |
| 75 Years and older | 26 (100.0%) | 0 (0.0%) |
| Total | 677 (92.9%) | 52 (7.1%) |
Health Insurance Coverage by Citizenship Status in Melville
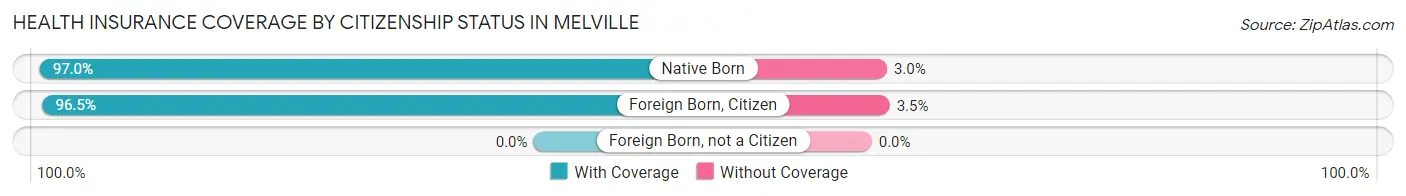
| Citizenship Status | With Coverage | Without Coverage |
| Native Born | 65 (97.0%) | 2 (3.0%) |
| Foreign Born, Citizen | 164 (96.5%) | 6 (3.5%) |
| Foreign Born, not a Citizen | 0 (0.0%) | 0 (0.0%) |
Health Insurance Coverage by Household Income in Melville
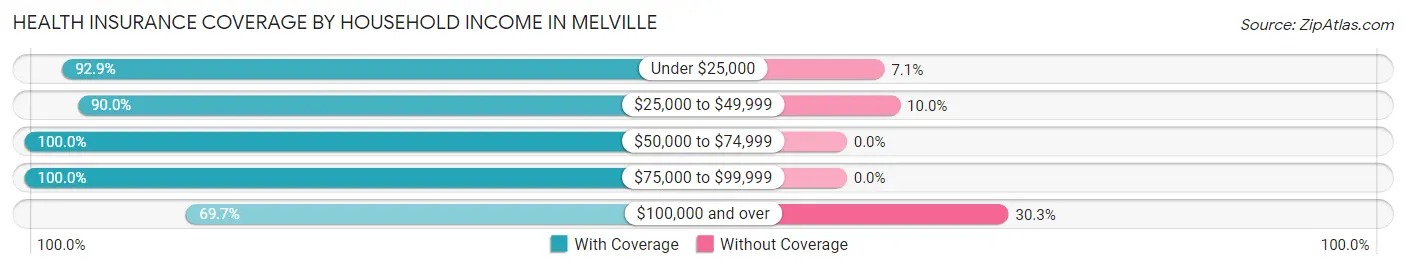
| Household Income | With Coverage | Without Coverage |
| Under $25,000 | 250 (92.9%) | 19 (7.1%) |
| $25,000 to $49,999 | 207 (90.0%) | 23 (10.0%) |
| $50,000 to $74,999 | 177 (100.0%) | 0 (0.0%) |
| $75,000 to $99,999 | 20 (100.0%) | 0 (0.0%) |
| $100,000 and over | 23 (69.7%) | 10 (30.3%) |
Public vs Private Health Insurance Coverage by Age in Melville
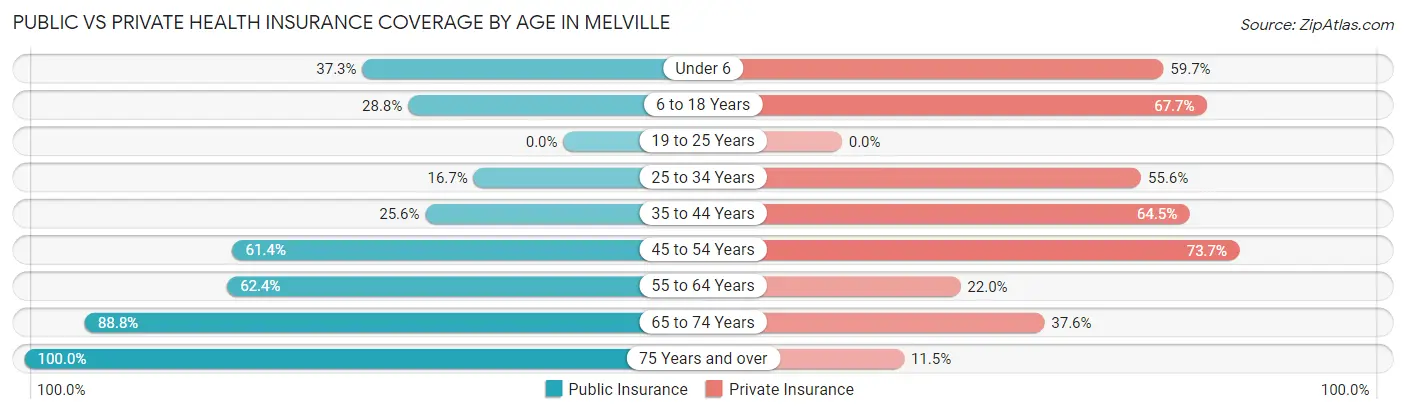
| Age Bracket | Public Insurance | Private Insurance |
| Under 6 | 25 (37.3%) | 40 (59.7%) |
| 6 to 18 Years | 49 (28.8%) | 115 (67.6%) |
| 19 to 25 Years | 0 (0.0%) | 0 (0.0%) |
| 25 to 34 Years | 9 (16.7%) | 30 (55.6%) |
| 35 to 44 Years | 31 (25.6%) | 78 (64.5%) |
| 45 to 54 Years | 35 (61.4%) | 42 (73.7%) |
| 55 to 64 Years | 68 (62.4%) | 24 (22.0%) |
| 65 to 74 Years | 111 (88.8%) | 47 (37.6%) |
| 75 Years and over | 26 (100.0%) | 3 (11.5%) |
| Total | 354 (48.6%) | 379 (52.0%) |
Disability Status by Sex by Age in Melville
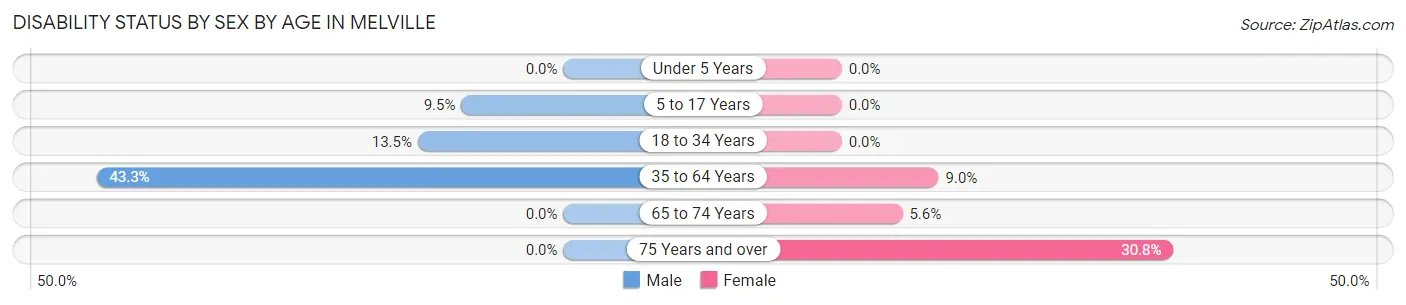
| Age Bracket | Male | Female |
| Under 5 Years | 0 (0.0%) | 0 (0.0%) |
| 5 to 17 Years | 9 (9.5%) | 0 (0.0%) |
| 18 to 34 Years | 5 (13.5%) | 0 (0.0%) |
| 35 to 64 Years | 52 (43.3%) | 15 (9.0%) |
| 65 to 74 Years | 0 (0.0%) | 4 (5.6%) |
| 75 Years and over | 0 (0.0%) | 8 (30.8%) |
Disability Class by Sex by Age in Melville
Disability Class: Hearing Difficulty
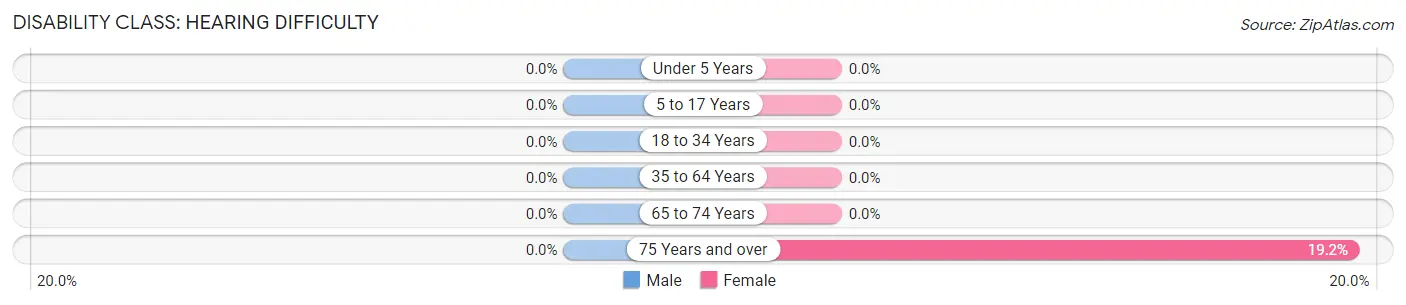
| Age Bracket | Male | Female |
| Under 5 Years | 0 (0.0%) | 0 (0.0%) |
| 5 to 17 Years | 0 (0.0%) | 0 (0.0%) |
| 18 to 34 Years | 0 (0.0%) | 0 (0.0%) |
| 35 to 64 Years | 0 (0.0%) | 0 (0.0%) |
| 65 to 74 Years | 0 (0.0%) | 0 (0.0%) |
| 75 Years and over | 0 (0.0%) | 5 (19.2%) |
Disability Class: Vision Difficulty
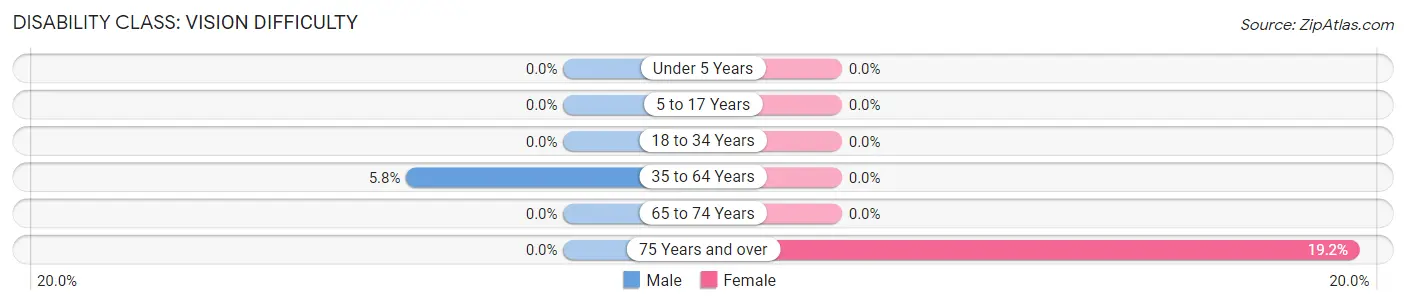
| Age Bracket | Male | Female |
| Under 5 Years | 0 (0.0%) | 0 (0.0%) |
| 5 to 17 Years | 0 (0.0%) | 0 (0.0%) |
| 18 to 34 Years | 0 (0.0%) | 0 (0.0%) |
| 35 to 64 Years | 7 (5.8%) | 0 (0.0%) |
| 65 to 74 Years | 0 (0.0%) | 0 (0.0%) |
| 75 Years and over | 0 (0.0%) | 5 (19.2%) |
Disability Class: Cognitive Difficulty
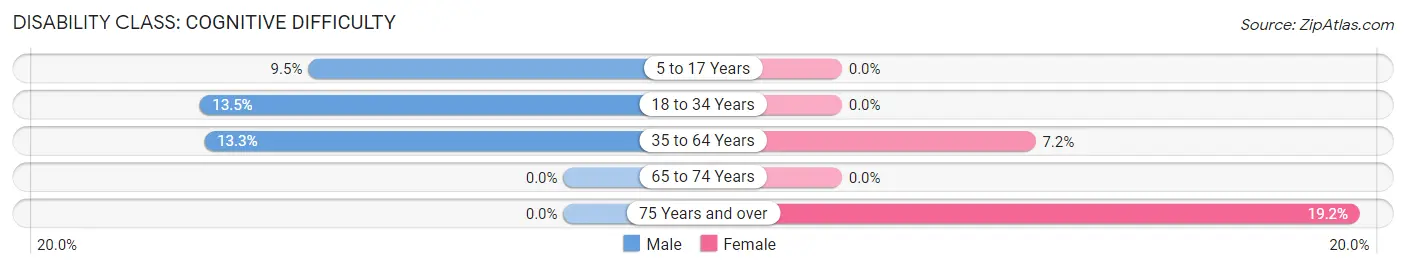
| Age Bracket | Male | Female |
| 5 to 17 Years | 9 (9.5%) | 0 (0.0%) |
| 18 to 34 Years | 5 (13.5%) | 0 (0.0%) |
| 35 to 64 Years | 16 (13.3%) | 12 (7.2%) |
| 65 to 74 Years | 0 (0.0%) | 0 (0.0%) |
| 75 Years and over | 0 (0.0%) | 5 (19.2%) |
Disability Class: Ambulatory Difficulty
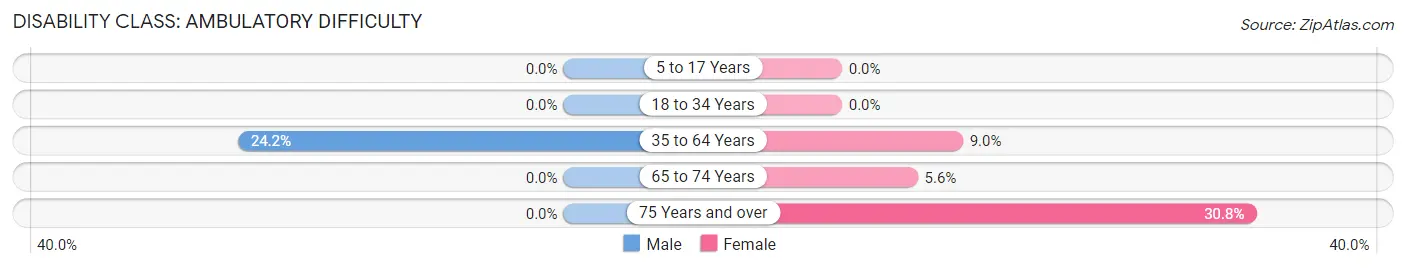
| Age Bracket | Male | Female |
| 5 to 17 Years | 0 (0.0%) | 0 (0.0%) |
| 18 to 34 Years | 0 (0.0%) | 0 (0.0%) |
| 35 to 64 Years | 29 (24.2%) | 15 (9.0%) |
| 65 to 74 Years | 0 (0.0%) | 4 (5.6%) |
| 75 Years and over | 0 (0.0%) | 8 (30.8%) |
Disability Class: Self-Care Difficulty
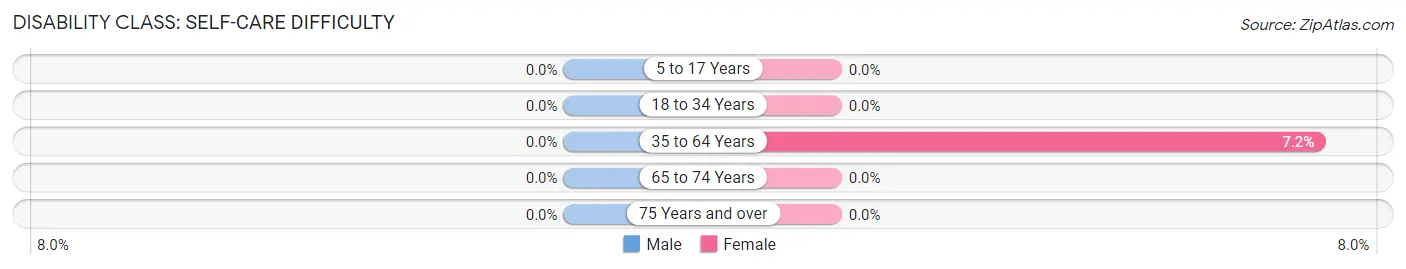
| Age Bracket | Male | Female |
| 5 to 17 Years | 0 (0.0%) | 0 (0.0%) |
| 18 to 34 Years | 0 (0.0%) | 0 (0.0%) |
| 35 to 64 Years | 0 (0.0%) | 12 (7.2%) |
| 65 to 74 Years | 0 (0.0%) | 0 (0.0%) |
| 75 Years and over | 0 (0.0%) | 0 (0.0%) |
Technology Access in Melville
Computing Device Access in Melville
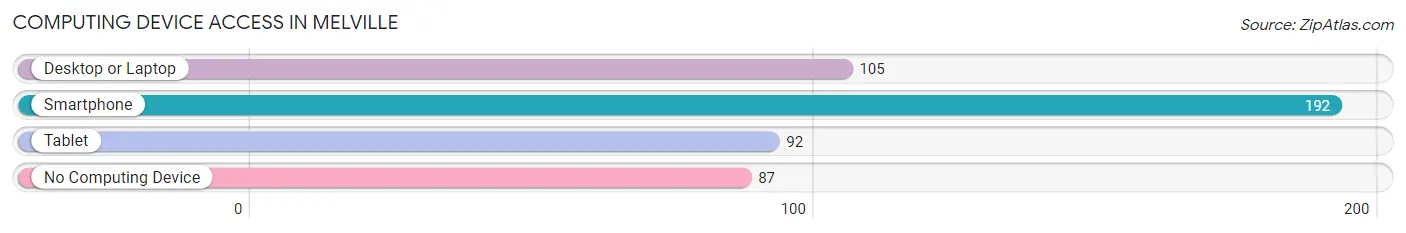
| Device Type | # Households | % Households |
| Desktop or Laptop | 105 | 35.2% |
| Smartphone | 192 | 64.4% |
| Tablet | 92 | 30.9% |
| No Computing Device | 87 | 29.2% |
| Total | 298 | 100.0% |
Internet Access in Melville
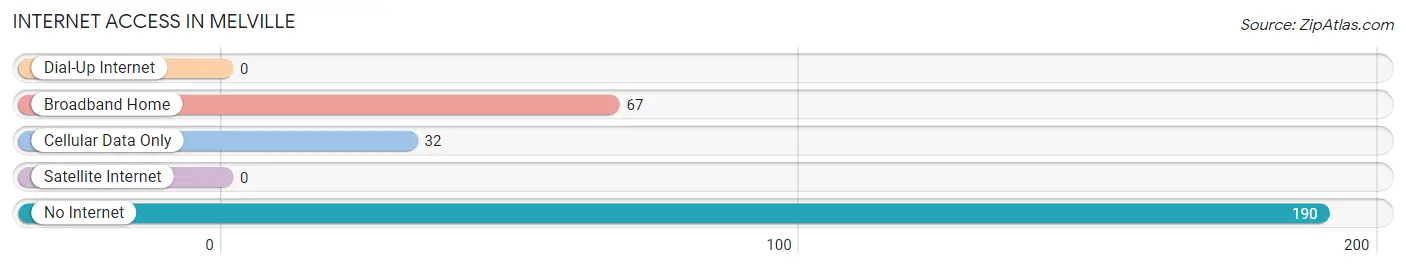
| Internet Type | # Households | % Households |
| Dial-Up Internet | 0 | 0.0% |
| Broadband Home | 67 | 22.5% |
| Cellular Data Only | 32 | 10.7% |
| Satellite Internet | 0 | 0.0% |
| No Internet | 190 | 63.8% |
| Total | 298 | 100.0% |
Melville Summary
Melville, Louisiana is a small town located in St. Landry Parish, Louisiana. It is situated on the banks of the Bayou Teche, approximately 20 miles south of Lafayette. The town was founded in 1837 and is named after the French explorer, Jean-Baptiste Melville. The population of Melville was 1,845 as of the 2010 census.
Geography
Melville is located at 30°41'25"N 92°2'25"W (30.690278, -92.040278). It is situated on the banks of the Bayou Teche, approximately 20 miles south of Lafayette. The town is located in the Acadiana region of Louisiana, which is known for its Cajun culture and cuisine. The terrain is mostly flat, with some rolling hills in the area. The climate is humid subtropical, with hot, humid summers and mild winters.
Economy
The economy of Melville is largely based on agriculture and tourism. The town is home to several farms, which produce a variety of crops, including corn, soybeans, and cotton. The town is also home to several restaurants, which serve traditional Cajun cuisine. Tourism is also an important part of the local economy, as the town is located near several popular attractions, such as the Bayou Teche National Wildlife Refuge and the Jean Lafitte National Historical Park and Preserve.
Demographics
As of the 2010 census, the population of Melville was 1,845. The racial makeup of the town was 79.2% White, 17.7% African American, 0.5% Native American, 0.3% Asian, 0.1% Pacific Islander, 0.7% from other races, and 1.5% from two or more races. Hispanic or Latino of any race were 2.2% of the population.
The median income for a household in Melville was $30,938, and the median income for a family was $37,500. The per capita income for the town was $15,945. About 17.2% of families and 20.2% of the population were below the poverty line, including 28.3% of those under age 18 and 15.2% of those age 65 or over.
Conclusion
Melville, Louisiana is a small town located in St. Landry Parish, Louisiana. It is situated on the banks of the Bayou Teche, approximately 20 miles south of Lafayette. The town was founded in 1837 and is named after the French explorer, Jean-Baptiste Melville. The population of Melville was 1,845 as of the 2010 census. The economy of Melville is largely based on agriculture and tourism, and the town is home to several farms and restaurants. The racial makeup of the town was 79.2% White, 17.7% African American, 0.5% Native American, 0.3% Asian, 0.1% Pacific Islander, 0.7% from other races, and 1.5% from two or more races. The median income for a household in Melville was $30,938, and the median income for a family was $37,500. About 17.2% of families and 20.2% of the population were below the poverty line. Melville is a small town with a rich history and culture, and it is a great place to visit or live.
Common Questions
What is Per Capita Income in Melville?
Per Capita income in Melville is $15,966.
What is the Median Family Income in Melville?
Median Family Income in Melville is $42,361.
What is the Median Household income in Melville?
Median Household Income in Melville is $38,833.
What is Income or Wage Gap in Melville?
Income or Wage Gap in Melville is 26.6%.
Women in Melville earn 73.4 cents for every dollar earned by a man.
What is Inequality or Gini Index in Melville?
Inequality or Gini Index in Melville is 0.49.
What is the Total Population of Melville?
Total Population of Melville is 729.
What is the Total Male Population of Melville?
Total Male Population of Melville is 333.
What is the Total Female Population of Melville?
Total Female Population of Melville is 396.
What is the Ratio of Males per 100 Females in Melville?
There are 84.09 Males per 100 Females in Melville.
What is the Ratio of Females per 100 Males in Melville?
There are 118.92 Females per 100 Males in Melville.
What is the Median Population Age in Melville?
Median Population Age in Melville is 40.1 Years.
What is the Average Family Size in Melville
Average Family Size in Melville is 3.0 People.
What is the Average Household Size in Melville
Average Household Size in Melville is 2.5 People.
How Large is the Labor Force in Melville?
There are 226 People in the Labor Forcein in Melville.
What is the Percentage of People in the Labor Force in Melville?
40.6% of People are in the Labor Force in Melville.