Seboyeta, NM Map & Demographics
Seboyeta Map
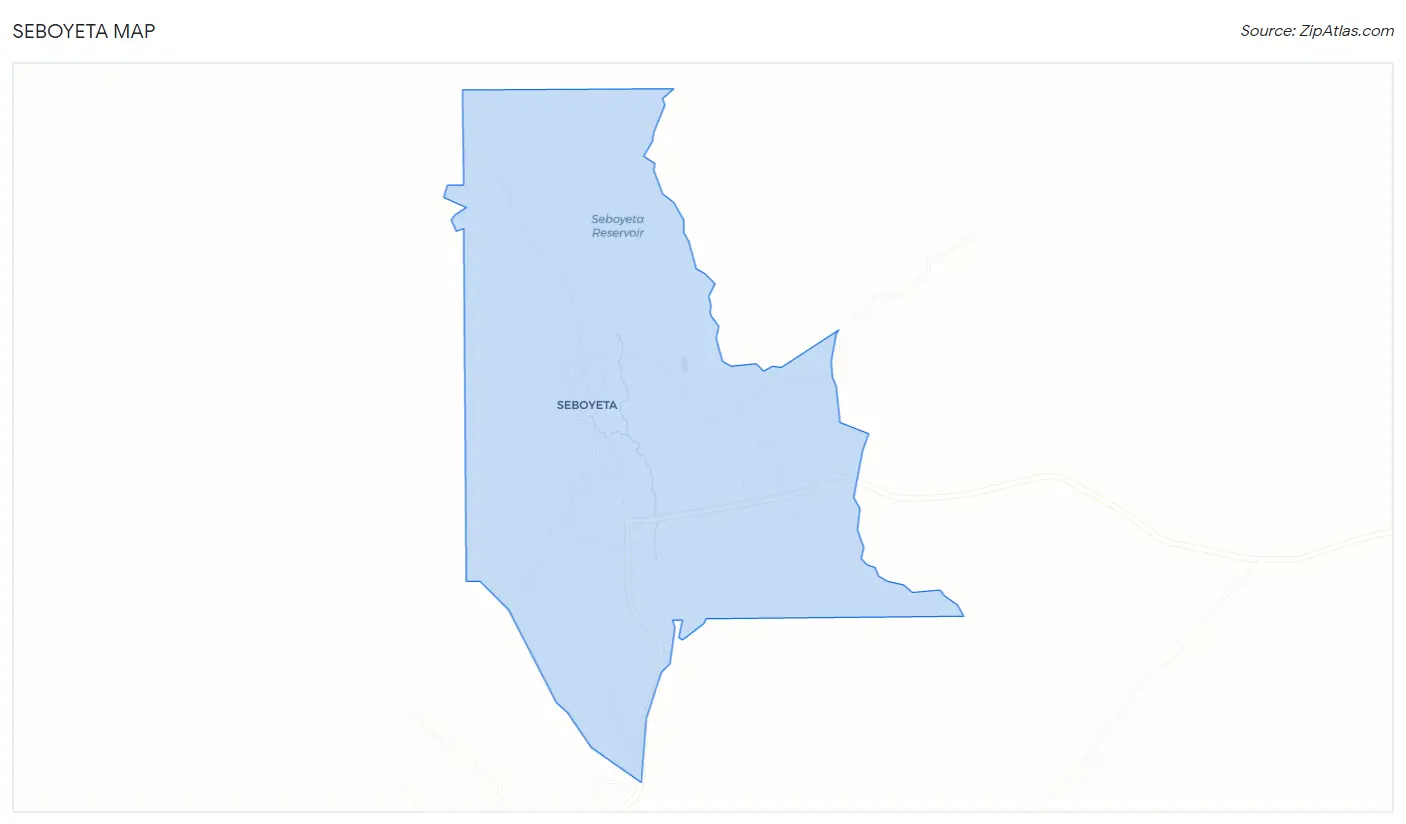
Seboyeta Overview
$26,501
PER CAPITA INCOME
$72,636
AVG FAMILY INCOME
$56,397
AVG HOUSEHOLD INCOME
0.21
INEQUALITY / GINI INDEX
516
TOTAL POPULATION
357
MALE POPULATION
159
FEMALE POPULATION
224.53
MALES / 100 FEMALES
44.54
FEMALES / 100 MALES
43.5
MEDIAN AGE
1.9
AVG FAMILY SIZE
1.8
AVG HOUSEHOLD SIZE
272
LABOR FORCE [ PEOPLE ]
58.4%
PERCENT IN LABOR FORCE
18.0%
UNEMPLOYMENT RATE
Seboyeta Area Codes
Income in Seboyeta
Income Overview in Seboyeta
Per Capita Income in Seboyeta is $26,501, while median incomes of families and households are $72,636 and $56,397 respectively.
| Characteristic | Number | Measure |
| Per Capita Income | 516 | $26,501 |
| Median Family Income | 244 | $72,636 |
| Mean Family Income | 244 | $55,628 |
| Median Household Income | 288 | $56,397 |
| Mean Household Income | 288 | $54,326 |
| Income Deficit | 244 | $0 |
| Wage / Income Gap (%) | 516 | 0.00% |
| Wage / Income Gap ($) | 516 | 100.00¢ per $1 |
| Gini / Inequality Index | 516 | 0.21 |
Earnings by Sex in Seboyeta
| Sex | Number | Average Earnings |
| Male | 223 (100.0%) | $0 |
| Female | 0 (0.0%) | $0 |
| Total | 223 (100.0%) | $0 |
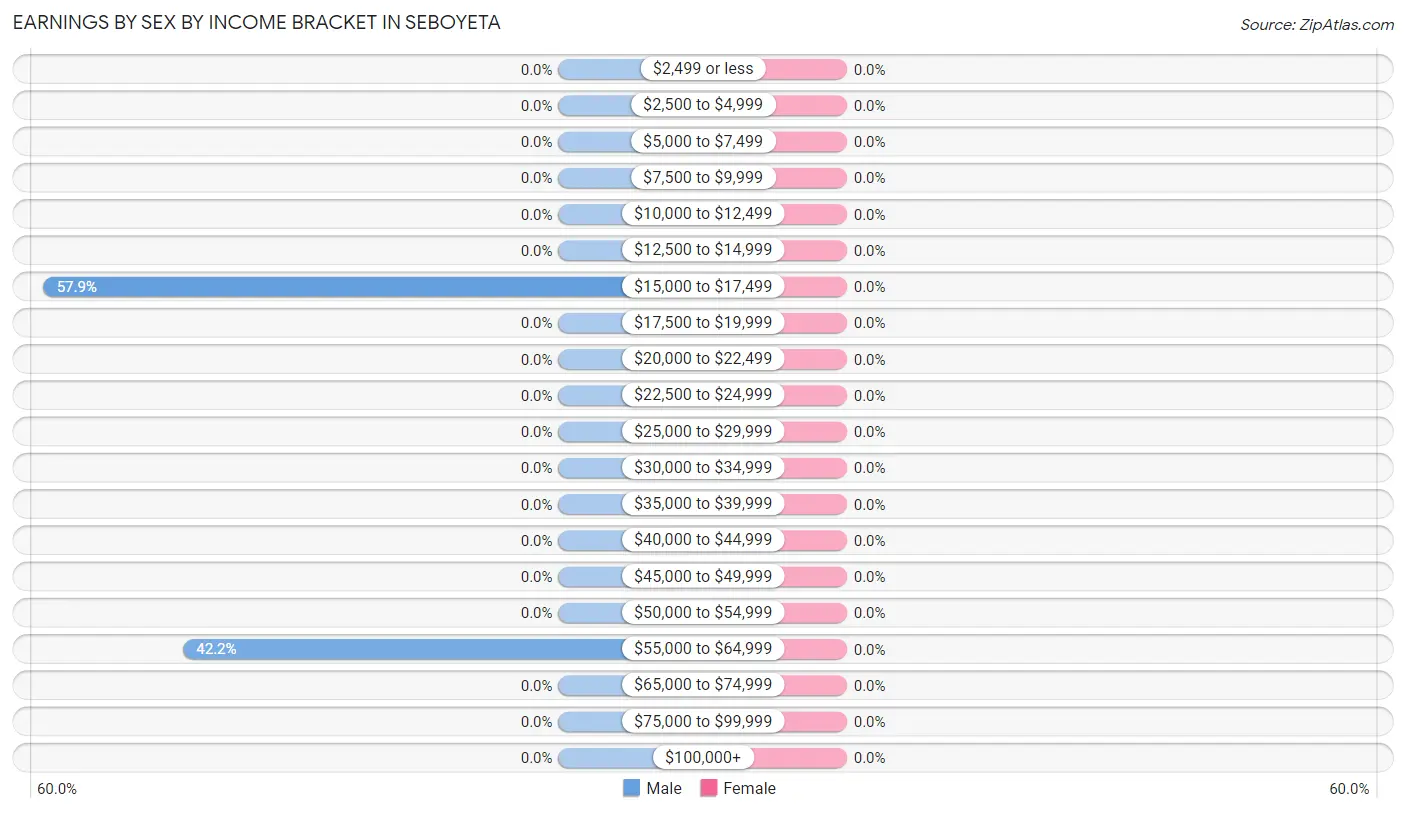
Earnings by Sex by Income Bracket in Seboyeta
| Income | Male | Female |
| $2,499 or less | 0 (0.0%) | 0 (0.0%) |
| $2,500 to $4,999 | 0 (0.0%) | 0 (0.0%) |
| $5,000 to $7,499 | 0 (0.0%) | 0 (0.0%) |
| $7,500 to $9,999 | 0 (0.0%) | 0 (0.0%) |
| $10,000 to $12,499 | 0 (0.0%) | 0 (0.0%) |
| $12,500 to $14,999 | 0 (0.0%) | 0 (0.0%) |
| $15,000 to $17,499 | 129 (57.9%) | 0 (0.0%) |
| $17,500 to $19,999 | 0 (0.0%) | 0 (0.0%) |
| $20,000 to $22,499 | 0 (0.0%) | 0 (0.0%) |
| $22,500 to $24,999 | 0 (0.0%) | 0 (0.0%) |
| $25,000 to $29,999 | 0 (0.0%) | 0 (0.0%) |
| $30,000 to $34,999 | 0 (0.0%) | 0 (0.0%) |
| $35,000 to $39,999 | 0 (0.0%) | 0 (0.0%) |
| $40,000 to $44,999 | 0 (0.0%) | 0 (0.0%) |
| $45,000 to $49,999 | 0 (0.0%) | 0 (0.0%) |
| $50,000 to $54,999 | 0 (0.0%) | 0 (0.0%) |
| $55,000 to $64,999 | 94 (42.1%) | 0 (0.0%) |
| $65,000 to $74,999 | 0 (0.0%) | 0 (0.0%) |
| $75,000 to $99,999 | 0 (0.0%) | 0 (0.0%) |
| $100,000+ | 0 (0.0%) | 0 (0.0%) |
| Total | 223 (100.0%) | 0 (0.0%) |
Earnings by Sex by Educational Attainment in Seboyeta
| Educational Attainment | Male Income | Female Income |
| Less than High School | - | - |
| High School Diploma | - | - |
| College or Associate's Degree | - | - |
| Bachelor's Degree | - | - |
| Graduate Degree | - | - |
| Total | - | - |
Family Income in Seboyeta
Family Income Brackets in Seboyeta
According to the Seboyeta family income data, there are 163 families falling into the $50,000 to $74,999 income range, which is the most common income bracket and makes up 66.8% of all families.
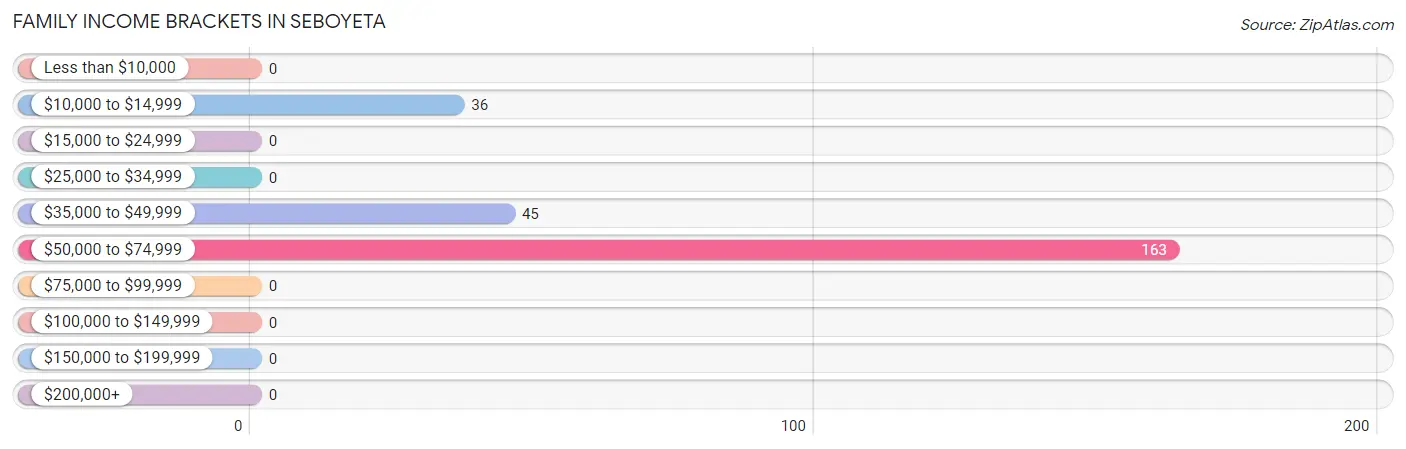
| Income Bracket | # Families | % Families |
| Less than $10,000 | 0 | 0.0% |
| $10,000 to $14,999 | 36 | 14.8% |
| $15,000 to $24,999 | 0 | 0.0% |
| $25,000 to $34,999 | 0 | 0.0% |
| $35,000 to $49,999 | 45 | 18.4% |
| $50,000 to $74,999 | 163 | 66.8% |
| $75,000 to $99,999 | 0 | 0.0% |
| $100,000 to $149,999 | 0 | 0.0% |
| $150,000 to $199,999 | 0 | 0.0% |
| $200,000+ | 0 | 0.0% |
Family Income by Famaliy Size in Seboyeta
2-person families (244 | 100.0%) account for the highest median family income in Seboyeta with $72,636 per family, while 2-person families (244 | 100.0%) have the highest median income of $36,318 per family member.
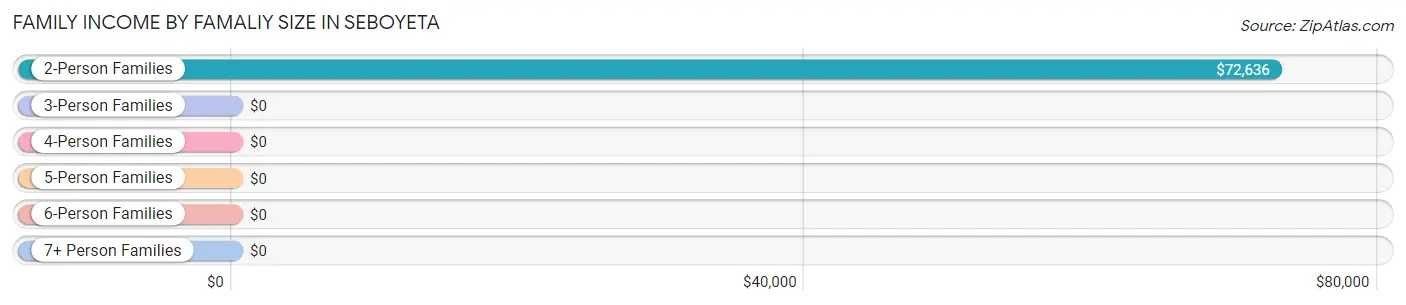
| Income Bracket | # Families | Median Income |
| 2-Person Families | 244 (100.0%) | $72,636 |
| 3-Person Families | 0 (0.0%) | $0 |
| 4-Person Families | 0 (0.0%) | $0 |
| 5-Person Families | 0 (0.0%) | $0 |
| 6-Person Families | 0 (0.0%) | $0 |
| 7+ Person Families | 0 (0.0%) | $0 |
| Total | 244 (100.0%) | $72,636 |
Family Income by Number of Earners in Seboyeta
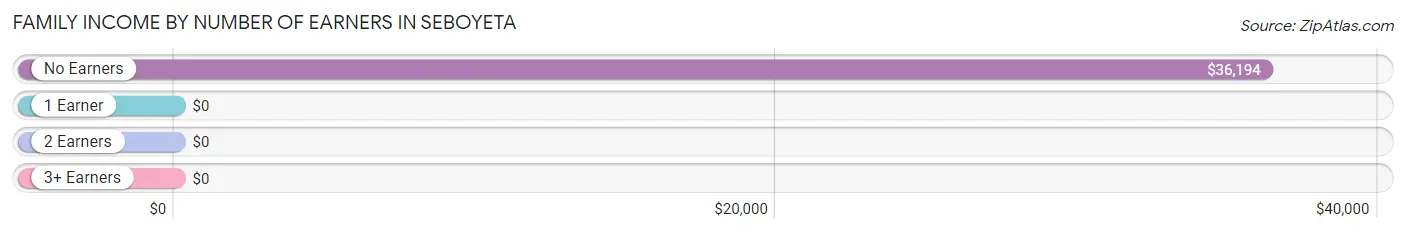
| Number of Earners | # Families | Median Income |
| No Earners | 115 (47.1%) | $36,194 |
| 1 Earner | 0 (0.0%) | $0 |
| 2 Earners | 129 (52.9%) | $0 |
| 3+ Earners | 0 (0.0%) | $0 |
| Total | 244 (100.0%) | $72,636 |
Household Income in Seboyeta
Household Income Brackets in Seboyeta
With 163 households falling in the category, the $50,000 to $74,999 income range is the most frequent in Seboyeta, accounting for 56.6% of all households.
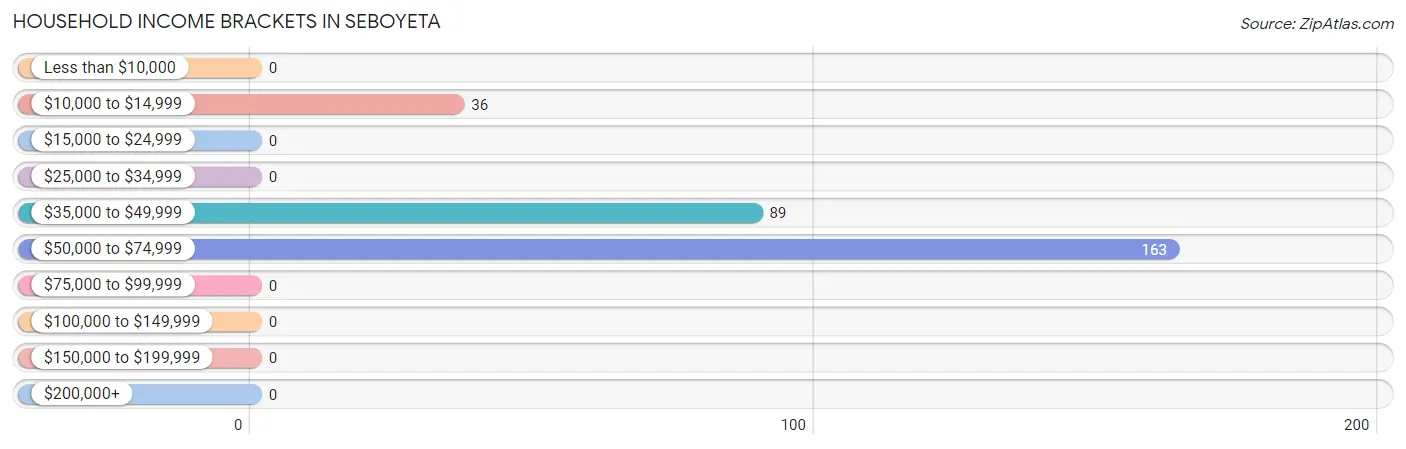
| Income Bracket | # Households | % Households |
| Less than $10,000 | 0 | 0.0% |
| $10,000 to $14,999 | 36 | 12.5% |
| $15,000 to $24,999 | 0 | 0.0% |
| $25,000 to $34,999 | 0 | 0.0% |
| $35,000 to $49,999 | 89 | 30.9% |
| $50,000 to $74,999 | 163 | 56.6% |
| $75,000 to $99,999 | 0 | 0.0% |
| $100,000 to $149,999 | 0 | 0.0% |
| $150,000 to $199,999 | 0 | 0.0% |
| $200,000+ | 0 | 0.0% |
Household Income by Householder Age in Seboyeta
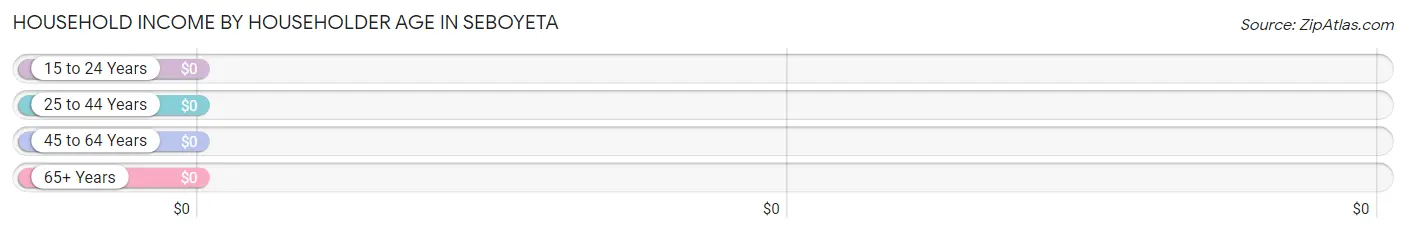
| Income Bracket | # Households | Median Income |
| 15 to 24 Years | 0 (0.0%) | $0 |
| 25 to 44 Years | 129 (44.8%) | $0 |
| 45 to 64 Years | 70 (24.3%) | $0 |
| 65+ Years | 89 (30.9%) | $0 |
| Total | 288 (100.0%) | $56,397 |
Poverty in Seboyeta
Income Below Poverty by Sex and Age in Seboyeta
With 14.0% poverty level for males and 22.6% for females among the residents of Seboyeta, under 5 year old males and 55 to 64 year old females are the most vulnerable to poverty, with 50 males (100.0%) and 36 females (51.4%) in their respective age groups living below the poverty level.
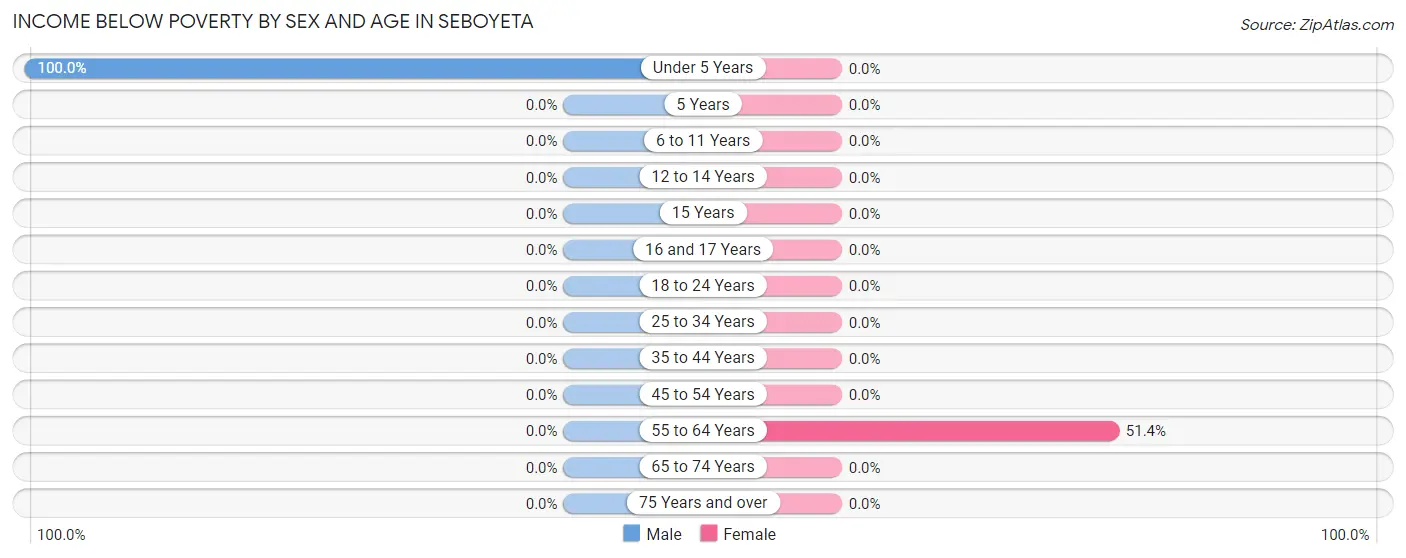
| Age Bracket | Male | Female |
| Under 5 Years | 50 (100.0%) | 0 (0.0%) |
| 5 Years | 0 (0.0%) | 0 (0.0%) |
| 6 to 11 Years | 0 (0.0%) | 0 (0.0%) |
| 12 to 14 Years | 0 (0.0%) | 0 (0.0%) |
| 15 Years | 0 (0.0%) | 0 (0.0%) |
| 16 and 17 Years | 0 (0.0%) | 0 (0.0%) |
| 18 to 24 Years | 0 (0.0%) | 0 (0.0%) |
| 25 to 34 Years | 0 (0.0%) | 0 (0.0%) |
| 35 to 44 Years | 0 (0.0%) | 0 (0.0%) |
| 45 to 54 Years | 0 (0.0%) | 0 (0.0%) |
| 55 to 64 Years | 0 (0.0%) | 36 (51.4%) |
| 65 to 74 Years | 0 (0.0%) | 0 (0.0%) |
| 75 Years and over | 0 (0.0%) | 0 (0.0%) |
| Total | 50 (14.0%) | 36 (22.6%) |
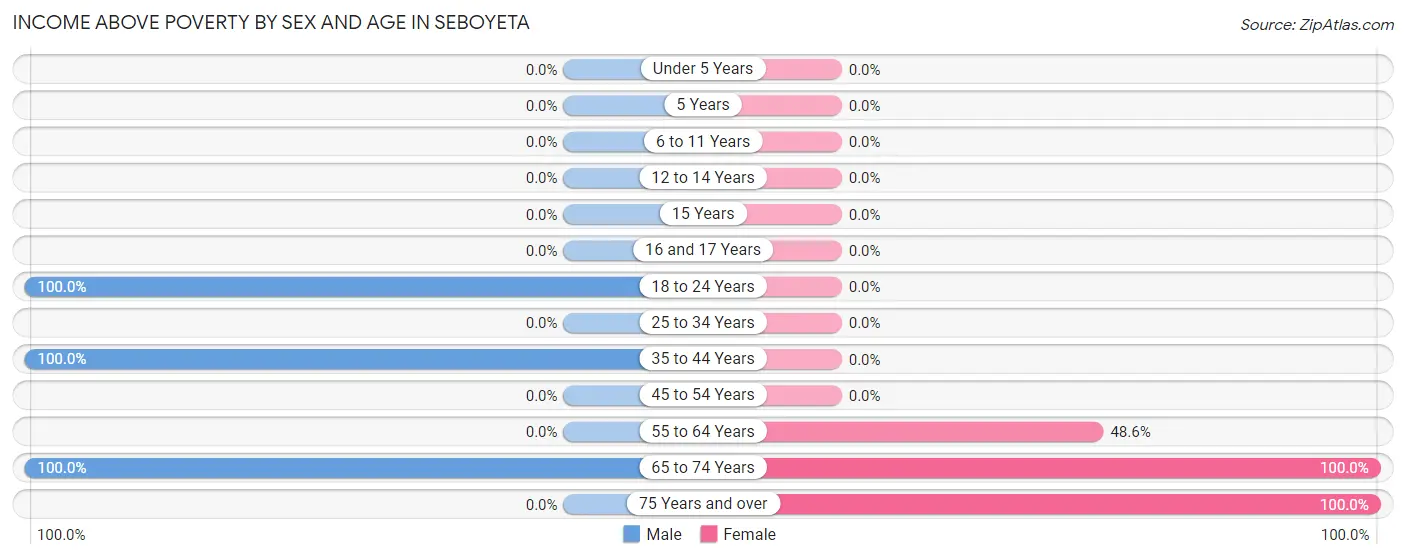
Income Above Poverty by Sex and Age in Seboyeta
According to the poverty statistics in Seboyeta, males aged 18 to 24 years and females aged 65 to 74 years are the age groups that are most secure financially, with 100.0% of males and 100.0% of females in these age groups living above the poverty line.
| Age Bracket | Male | Female |
| Under 5 Years | 0 (0.0%) | 0 (0.0%) |
| 5 Years | 0 (0.0%) | 0 (0.0%) |
| 6 to 11 Years | 0 (0.0%) | 0 (0.0%) |
| 12 to 14 Years | 0 (0.0%) | 0 (0.0%) |
| 15 Years | 0 (0.0%) | 0 (0.0%) |
| 16 and 17 Years | 0 (0.0%) | 0 (0.0%) |
| 18 to 24 Years | 143 (100.0%) | 0 (0.0%) |
| 25 to 34 Years | 0 (0.0%) | 0 (0.0%) |
| 35 to 44 Years | 129 (100.0%) | 0 (0.0%) |
| 45 to 54 Years | 0 (0.0%) | 0 (0.0%) |
| 55 to 64 Years | 0 (0.0%) | 34 (48.6%) |
| 65 to 74 Years | 35 (100.0%) | 45 (100.0%) |
| 75 Years and over | 0 (0.0%) | 44 (100.0%) |
| Total | 307 (86.0%) | 123 (77.4%) |
Income Below Poverty Among Married-Couple Families in Seboyeta
| Children | Above Poverty | Below Poverty |
| No Children | 34 (100.0%) | 0 (0.0%) |
| 1 or 2 Children | 0 (0.0%) | 0 (0.0%) |
| 3 or 4 Children | 0 (0.0%) | 0 (0.0%) |
| 5 or more Children | 0 (0.0%) | 0 (0.0%) |
| Total | 34 (100.0%) | 0 (0.0%) |
Income Below Poverty Among Single-Parent Households in Seboyeta
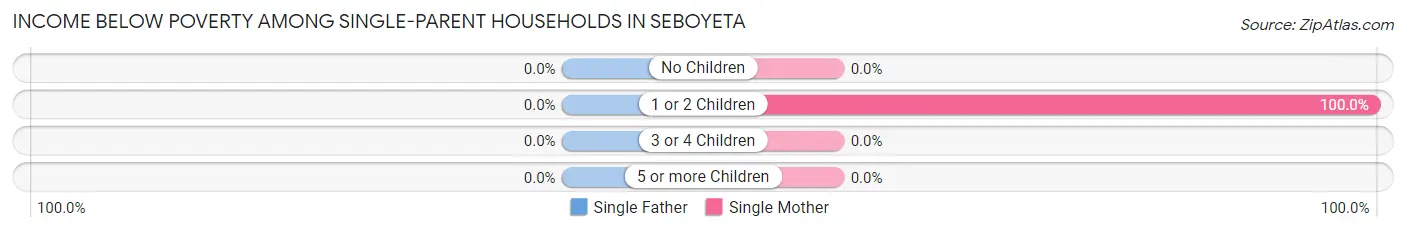
| Children | Single Father | Single Mother |
| No Children | 0 (0.0%) | 0 (0.0%) |
| 1 or 2 Children | 0 (0.0%) | 36 (100.0%) |
| 3 or 4 Children | 0 (0.0%) | 0 (0.0%) |
| 5 or more Children | 0 (0.0%) | 0 (0.0%) |
| Total | 0 (0.0%) | 36 (44.4%) |
Income Below Poverty Among Married-Couple vs Single-Parent Households in Seboyeta
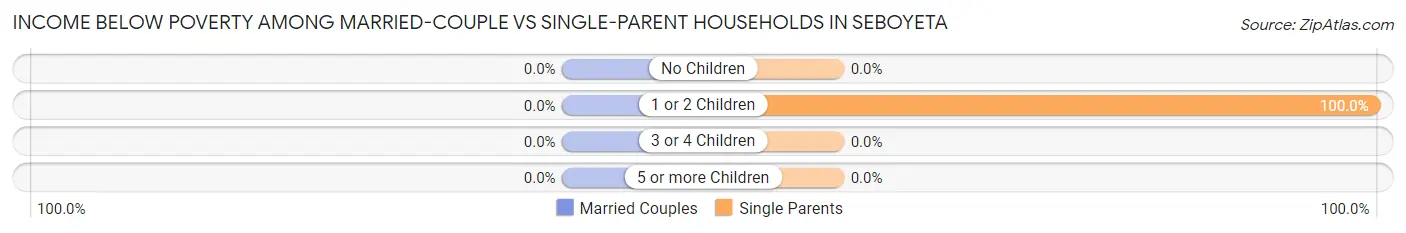
| Children | Married-Couple Families | Single-Parent Households |
| No Children | 0 (0.0%) | 0 (0.0%) |
| 1 or 2 Children | 0 (0.0%) | 36 (100.0%) |
| 3 or 4 Children | 0 (0.0%) | 0 (0.0%) |
| 5 or more Children | 0 (0.0%) | 0 (0.0%) |
| Total | 0 (0.0%) | 36 (17.1%) |
Race in Seboyeta
The most populous races in Seboyeta are Hispanic or Latino (472 | 91.5%), White / Caucasian (223 | 43.2%), and Two or more Races (155 | 30.0%).
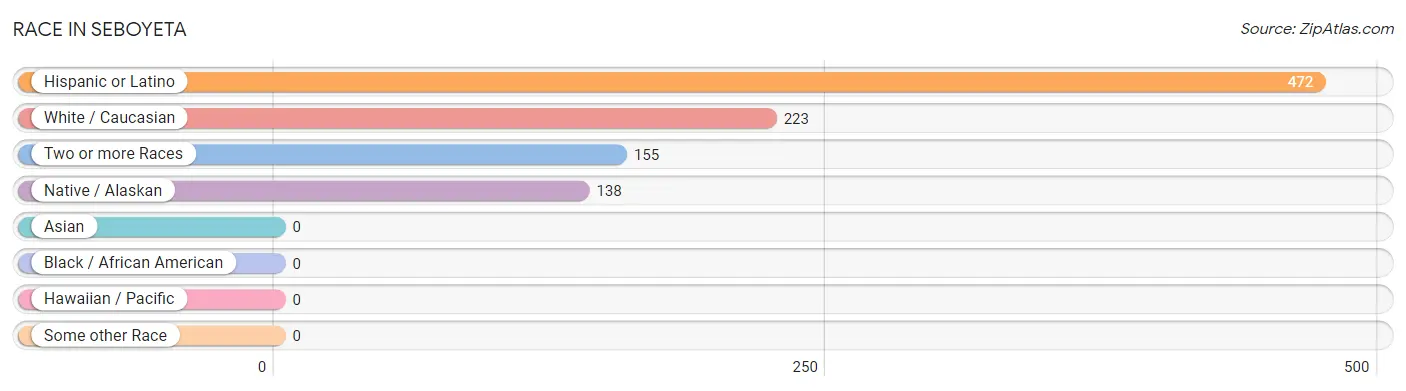
| Race | # Population | % Population |
| Asian | 0 | 0.0% |
| Black / African American | 0 | 0.0% |
| Hawaiian / Pacific | 0 | 0.0% |
| Hispanic or Latino | 472 | 91.5% |
| Native / Alaskan | 138 | 26.7% |
| White / Caucasian | 223 | 43.2% |
| Two or more Races | 155 | 30.0% |
| Some other Race | 0 | 0.0% |
| Total | 516 | 100.0% |
Ancestry in Seboyeta
The most populous ancestries reported in Seboyeta are Spanish (436 | 84.5%), Pueblo (188 | 36.4%), and Spanish American (36 | 7.0%), together accounting for 127.9% of all Seboyeta residents.
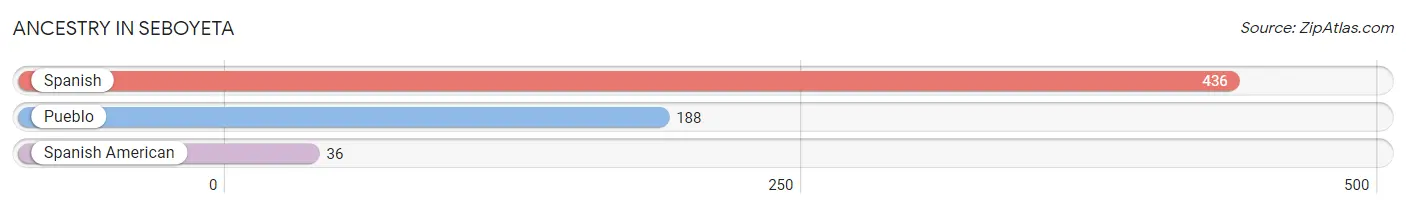
| Ancestry | # Population | % Population |
| Pueblo | 188 | 36.4% |
| Spanish | 436 | 84.5% |
| Spanish American | 36 | 7.0% | View All 3 Rows |
Immigrants in Seboyeta

| Immigration Origin | # Population | % Population | View All 0 Rows |
Sex and Age in Seboyeta
Sex and Age in Seboyeta
The most populous age groups in Seboyeta are 20 to 24 Years (143 | 40.1%) for men and 65 to 69 Years (45 | 28.3%) for women.
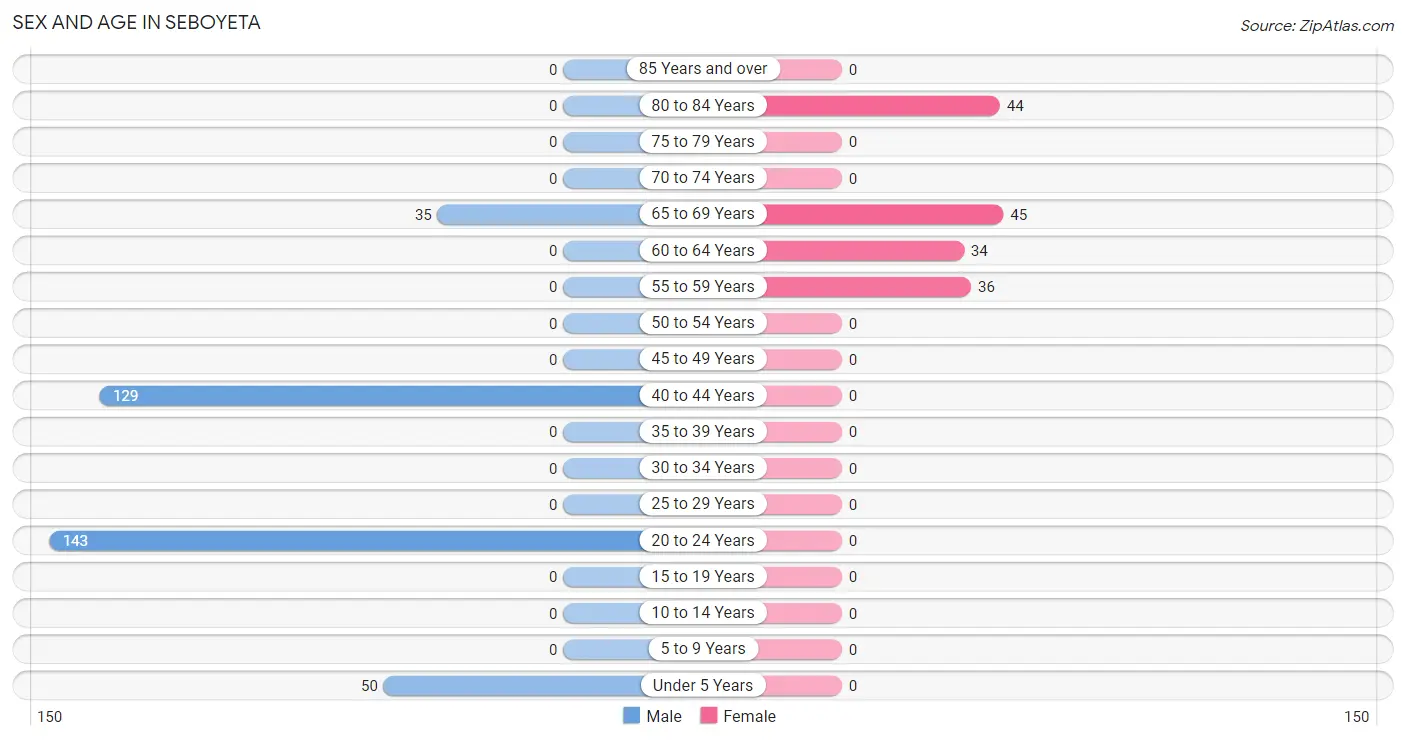
| Age Bracket | Male | Female |
| Under 5 Years | 50 (14.0%) | 0 (0.0%) |
| 5 to 9 Years | 0 (0.0%) | 0 (0.0%) |
| 10 to 14 Years | 0 (0.0%) | 0 (0.0%) |
| 15 to 19 Years | 0 (0.0%) | 0 (0.0%) |
| 20 to 24 Years | 143 (40.1%) | 0 (0.0%) |
| 25 to 29 Years | 0 (0.0%) | 0 (0.0%) |
| 30 to 34 Years | 0 (0.0%) | 0 (0.0%) |
| 35 to 39 Years | 0 (0.0%) | 0 (0.0%) |
| 40 to 44 Years | 129 (36.1%) | 0 (0.0%) |
| 45 to 49 Years | 0 (0.0%) | 0 (0.0%) |
| 50 to 54 Years | 0 (0.0%) | 0 (0.0%) |
| 55 to 59 Years | 0 (0.0%) | 36 (22.6%) |
| 60 to 64 Years | 0 (0.0%) | 34 (21.4%) |
| 65 to 69 Years | 35 (9.8%) | 45 (28.3%) |
| 70 to 74 Years | 0 (0.0%) | 0 (0.0%) |
| 75 to 79 Years | 0 (0.0%) | 0 (0.0%) |
| 80 to 84 Years | 0 (0.0%) | 44 (27.7%) |
| 85 Years and over | 0 (0.0%) | 0 (0.0%) |
| Total | 357 (100.0%) | 159 (100.0%) |
Families and Households in Seboyeta
Median Family Size in Seboyeta
The median family size in Seboyeta is 1.93 persons per family, with single female/mother families (81 | 33.2%) accounting for the largest median family size of 2.22 persons per family. On the other hand, single male/father families (129 | 52.9%) represent the smallest median family size with 1.73 persons per family.
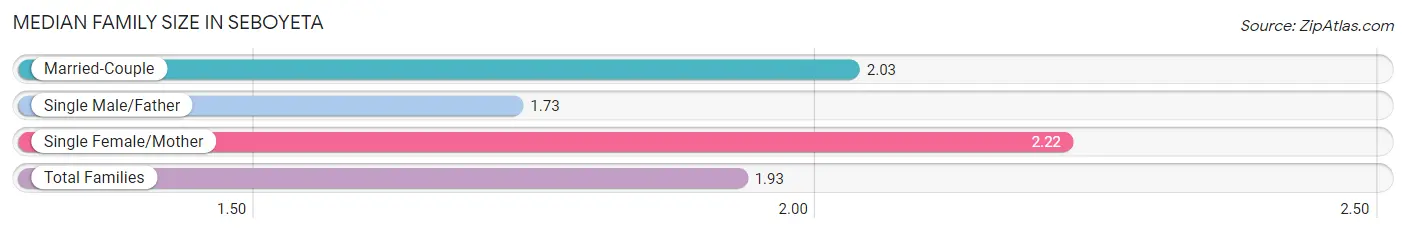
| Family Type | # Families | Family Size |
| Married-Couple | 34 (13.9%) | 2.03 |
| Single Male/Father | 129 (52.9%) | 1.73 |
| Single Female/Mother | 81 (33.2%) | 2.22 |
| Total Families | 244 (100.0%) | 1.93 |
Median Household Size in Seboyeta
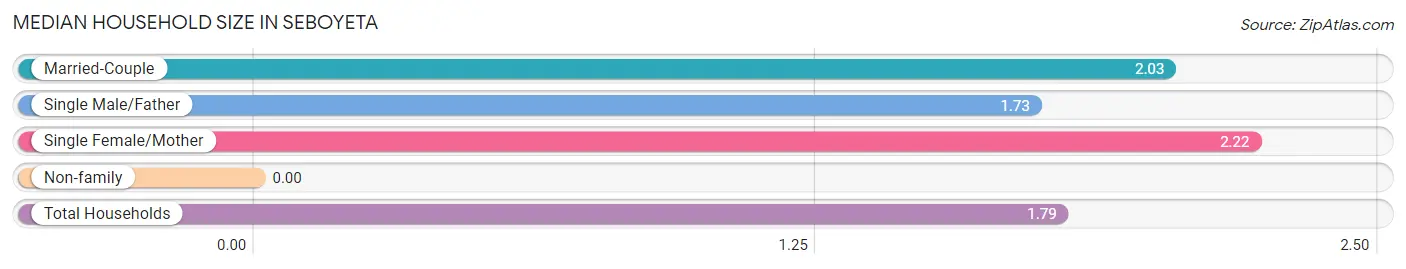
| Household Type | # Households | Household Size |
| Married-Couple | 34 (11.8%) | 2.03 |
| Single Male/Father | 129 (44.8%) | 1.73 |
| Single Female/Mother | 81 (28.1%) | 2.22 |
| Non-family | 44 (15.3%) | - |
| Total Households | 288 (100.0%) | 1.79 |
Household Size by Marriage Status in Seboyeta
Out of a total of 288 households in Seboyeta, 244 (84.7%) are family households, while 44 (15.3%) are nonfamily households. The most numerous type of family households are 2-person households, comprising 244, and the most common type of nonfamily households are 1-person households, comprising 44.
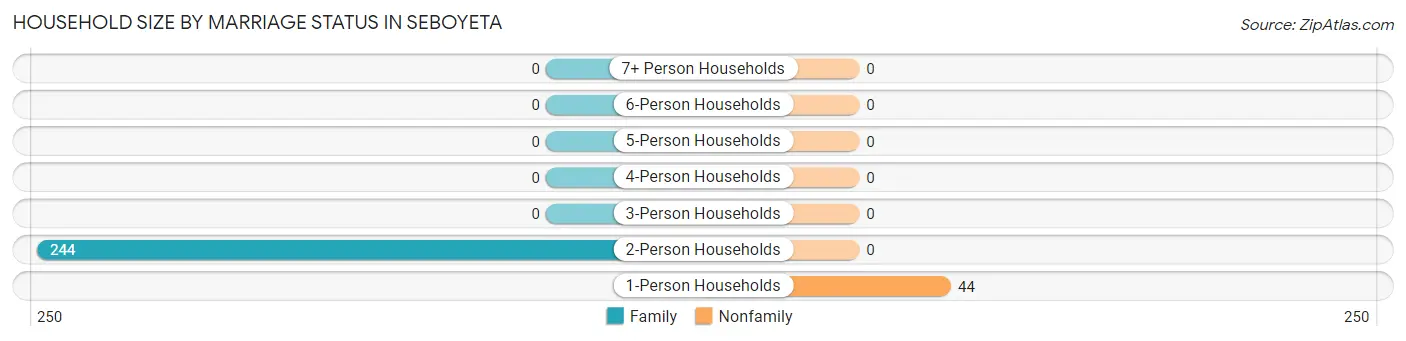
| Household Size | Family Households | Nonfamily Households |
| 1-Person Households | - | 44 (15.3%) |
| 2-Person Households | 244 (84.7%) | 0 (0.0%) |
| 3-Person Households | 0 (0.0%) | 0 (0.0%) |
| 4-Person Households | 0 (0.0%) | 0 (0.0%) |
| 5-Person Households | 0 (0.0%) | 0 (0.0%) |
| 6-Person Households | 0 (0.0%) | 0 (0.0%) |
| 7+ Person Households | 0 (0.0%) | 0 (0.0%) |
| Total | 244 (84.7%) | 44 (15.3%) |
Female Fertility in Seboyeta
Fertility by Age in Seboyeta
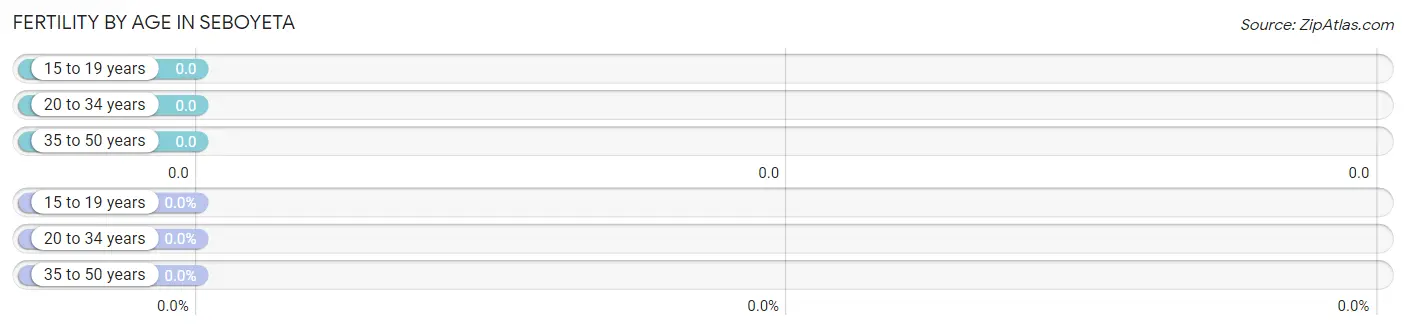
| Age Bracket | Women with Births | Births / 1,000 Women |
| 15 to 19 years | 0 (0.0%) | 0.0 |
| 20 to 34 years | 0 (0.0%) | 0.0 |
| 35 to 50 years | 0 (0.0%) | 0.0 |
| Total | 0 (0.0%) | 0.0 |
Fertility by Age by Marriage Status in Seboyeta
| Age Bracket | Married | Unmarried |
| 15 to 19 years | 0 (0.0%) | 0 (0.0%) |
| 20 to 34 years | 0 (0.0%) | 0 (0.0%) |
| 35 to 50 years | 0 (0.0%) | 0 (0.0%) |
| Total | 0 (0.0%) | 0 (0.0%) |
Fertility by Education in Seboyeta
| Educational Attainment | Women with Births | Births / 1,000 Women |
| Less than High School | 0 (0.0%) | 0.0 |
| High School Diploma | 0 (0.0%) | 0.0 |
| College or Associate's Degree | 0 (0.0%) | 0.0 |
| Bachelor's Degree | 0 (0.0%) | 0.0 |
| Graduate Degree | 0 (0.0%) | 0.0 |
| Total | 0 (0.0%) | 0.0 |
Fertility by Education by Marriage Status in Seboyeta
| Educational Attainment | Married | Unmarried |
| Less than High School | 0 (0.0%) | 0 (0.0%) |
| High School Diploma | 0 (0.0%) | 0 (0.0%) |
| College or Associate's Degree | 0 (0.0%) | 0 (0.0%) |
| Bachelor's Degree | 0 (0.0%) | 0 (0.0%) |
| Graduate Degree | 0 (0.0%) | 0 (0.0%) |
| Total | 0 (0.0%) | 0 (0.0%) |
Employment Characteristics in Seboyeta
Employment by Class of Employer in Seboyeta
Among the 223 employed individuals in Seboyeta, , and private company employees (223 | 100.0%) make up the most common classes of employment.
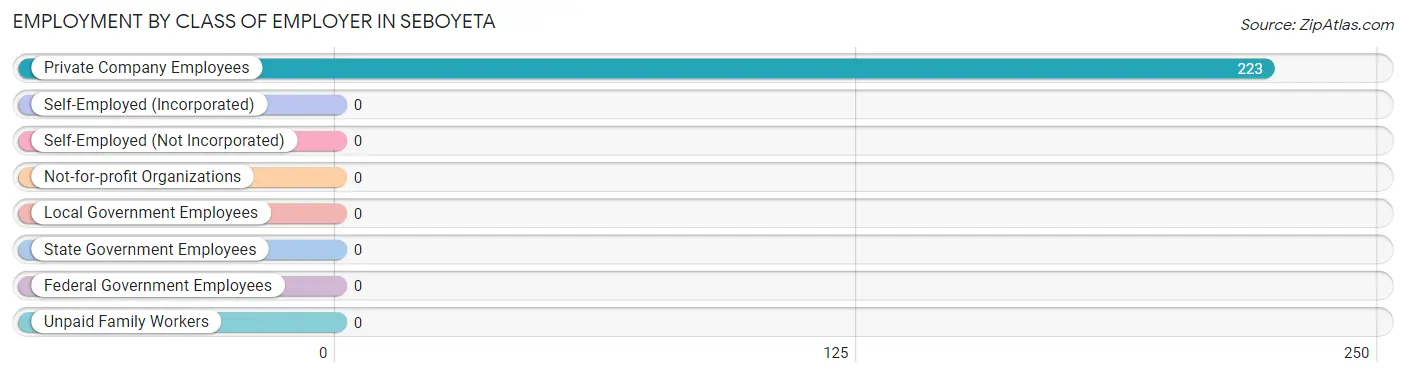
| Employer Class | # Employees | % Employees |
| Private Company Employees | 223 | 100.0% |
| Self-Employed (Incorporated) | 0 | 0.0% |
| Self-Employed (Not Incorporated) | 0 | 0.0% |
| Not-for-profit Organizations | 0 | 0.0% |
| Local Government Employees | 0 | 0.0% |
| State Government Employees | 0 | 0.0% |
| Federal Government Employees | 0 | 0.0% |
| Unpaid Family Workers | 0 | 0.0% |
| Total | 223 | 100.0% |
Employment Status by Age in Seboyeta
According to the labor force statistics for Seboyeta, out of the total population over 16 years of age (466), 58.4% or 272 individuals are in the labor force, with 18.0% or 49 of them unemployed. The age group with the highest labor force participation rate is 20 to 24 years, with 100.0% or 143 individuals in the labor force. Within the labor force, the 20 to 24 years age range has the highest percentage of unemployed individuals, with 34.3% or 49 of them being unemployed.
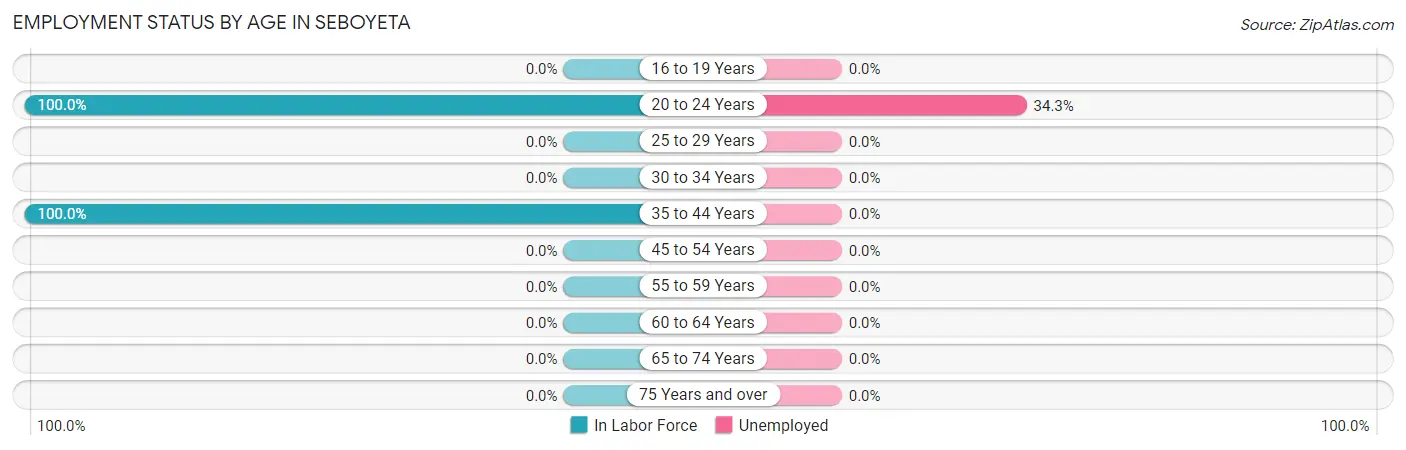
| Age Bracket | In Labor Force | Unemployed |
| 16 to 19 Years | 0 (0.0%) | 0 (0.0%) |
| 20 to 24 Years | 143 (100.0%) | 49 (34.3%) |
| 25 to 29 Years | 0 (0.0%) | 0 (0.0%) |
| 30 to 34 Years | 0 (0.0%) | 0 (0.0%) |
| 35 to 44 Years | 129 (100.0%) | 0 (0.0%) |
| 45 to 54 Years | 0 (0.0%) | 0 (0.0%) |
| 55 to 59 Years | 0 (0.0%) | 0 (0.0%) |
| 60 to 64 Years | 0 (0.0%) | 0 (0.0%) |
| 65 to 74 Years | 0 (0.0%) | 0 (0.0%) |
| 75 Years and over | 0 (0.0%) | 0 (0.0%) |
| Total | 272 (58.4%) | 49 (18.0%) |
Employment Status by Educational Attainment in Seboyeta
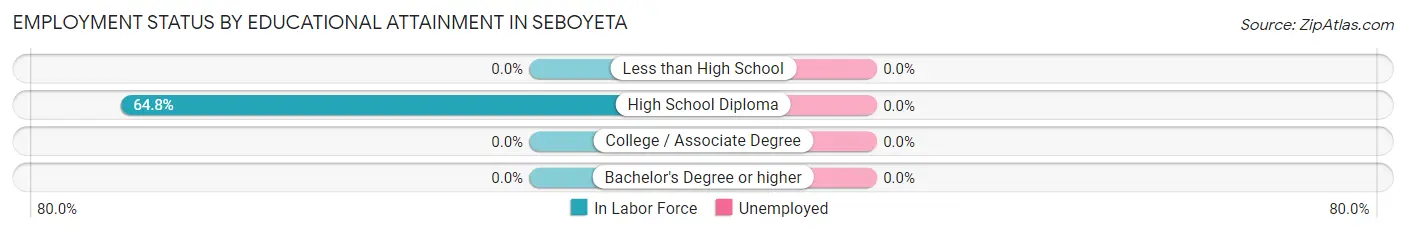
| Educational Attainment | In Labor Force | Unemployed |
| Less than High School | 0 (0.0%) | 0 (0.0%) |
| High School Diploma | 129 (64.8%) | 0 (0.0%) |
| College / Associate Degree | 0 (0.0%) | 0 (0.0%) |
| Bachelor's Degree or higher | 0 (0.0%) | 0 (0.0%) |
| Total | 129 (64.8%) | 0 (0.0%) |
Employment Occupations by Sex in Seboyeta
Management, Business, Science and Arts Occupations
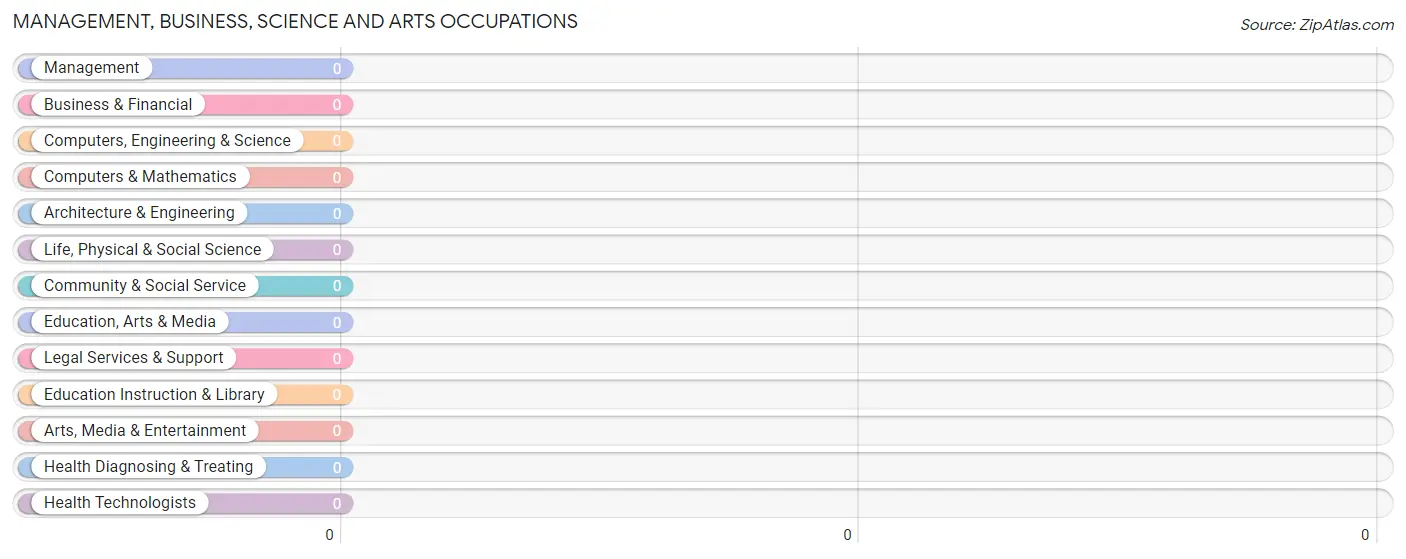
Management, Business, Science and Arts Occupations by Sex
| Occupation | Male | Female |
| Management | 0 (0.0%) | 0 (0.0%) |
| Business & Financial | 0 (0.0%) | 0 (0.0%) |
| Computers, Engineering & Science | 0 (0.0%) | 0 (0.0%) |
| Computers & Mathematics | 0 (0.0%) | 0 (0.0%) |
| Architecture & Engineering | 0 (0.0%) | 0 (0.0%) |
| Life, Physical & Social Science | 0 (0.0%) | 0 (0.0%) |
| Community & Social Service | 0 (0.0%) | 0 (0.0%) |
| Education, Arts & Media | 0 (0.0%) | 0 (0.0%) |
| Legal Services & Support | 0 (0.0%) | 0 (0.0%) |
| Education Instruction & Library | 0 (0.0%) | 0 (0.0%) |
| Arts, Media & Entertainment | 0 (0.0%) | 0 (0.0%) |
| Health Diagnosing & Treating | 0 (0.0%) | 0 (0.0%) |
| Health Technologists | 0 (0.0%) | 0 (0.0%) |
| Total (Category) | 0 (0.0%) | 0 (0.0%) |
| Total (Overall) | 223 (100.0%) | 0 (0.0%) |
Services Occupations
The most common Services occupations in Seboyeta are Security & Protection (94 | 42.1%), and Firefighting & Prevention (94 | 42.1%).
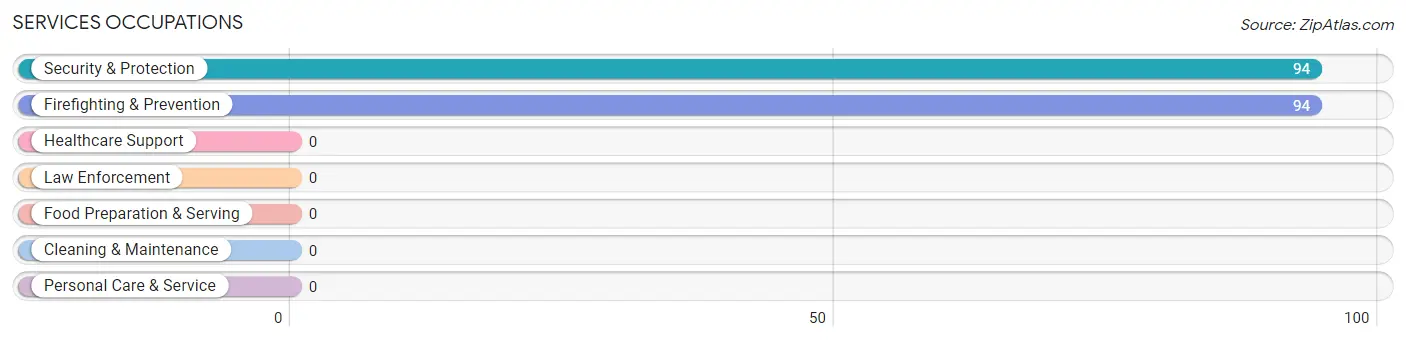
Services Occupations by Sex
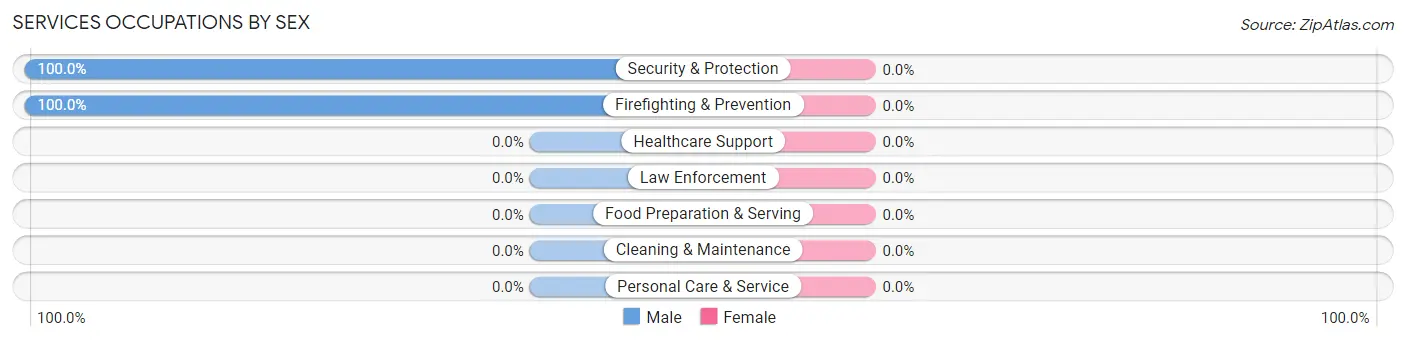
| Occupation | Male | Female |
| Healthcare Support | 0 (0.0%) | 0 (0.0%) |
| Security & Protection | 94 (100.0%) | 0 (0.0%) |
| Firefighting & Prevention | 94 (100.0%) | 0 (0.0%) |
| Law Enforcement | 0 (0.0%) | 0 (0.0%) |
| Food Preparation & Serving | 0 (0.0%) | 0 (0.0%) |
| Cleaning & Maintenance | 0 (0.0%) | 0 (0.0%) |
| Personal Care & Service | 0 (0.0%) | 0 (0.0%) |
| Total (Category) | 94 (100.0%) | 0 (0.0%) |
| Total (Overall) | 223 (100.0%) | 0 (0.0%) |
Sales and Office Occupations
Sales and Office Occupations by Sex
| Occupation | Male | Female |
| Sales & Related | 0 (0.0%) | 0 (0.0%) |
| Office & Administration | 0 (0.0%) | 0 (0.0%) |
| Total (Category) | 0 (0.0%) | 0 (0.0%) |
| Total (Overall) | 223 (100.0%) | 0 (0.0%) |
Natural Resources, Construction and Maintenance Occupations
Natural Resources, Construction and Maintenance Occupations by Sex
| Occupation | Male | Female |
| Farming, Fishing & Forestry | 0 (0.0%) | 0 (0.0%) |
| Construction & Extraction | 0 (0.0%) | 0 (0.0%) |
| Installation, Maintenance & Repair | 0 (0.0%) | 0 (0.0%) |
| Total (Category) | 0 (0.0%) | 0 (0.0%) |
| Total (Overall) | 223 (100.0%) | 0 (0.0%) |
Production, Transportation and Moving Occupations
The most common Production, Transportation and Moving occupations in Seboyeta are , and Transportation (129 | 57.9%).
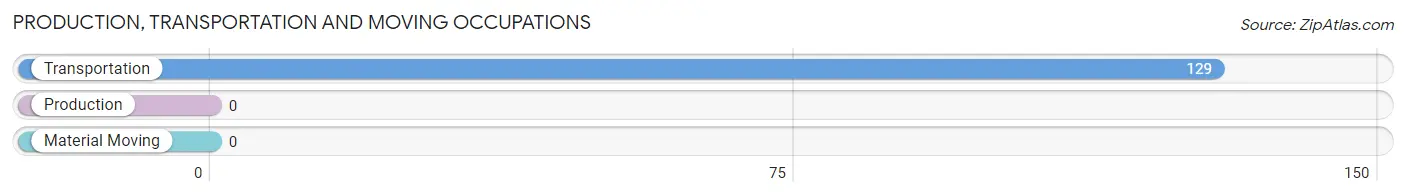
Production, Transportation and Moving Occupations by Sex
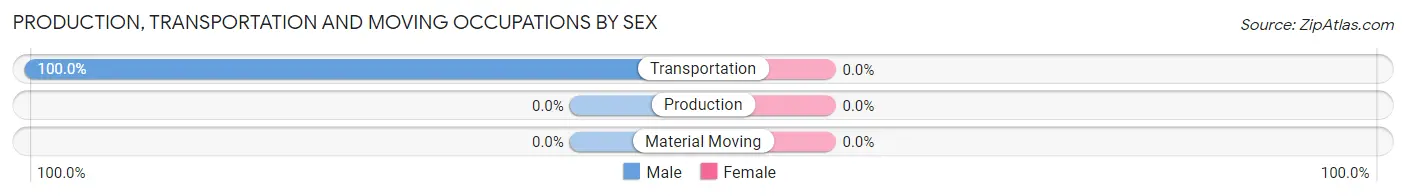
| Occupation | Male | Female |
| Production | 0 (0.0%) | 0 (0.0%) |
| Transportation | 129 (100.0%) | 0 (0.0%) |
| Material Moving | 0 (0.0%) | 0 (0.0%) |
| Total (Category) | 129 (100.0%) | 0 (0.0%) |
| Total (Overall) | 223 (100.0%) | 0 (0.0%) |
Employment Industries by Sex in Seboyeta
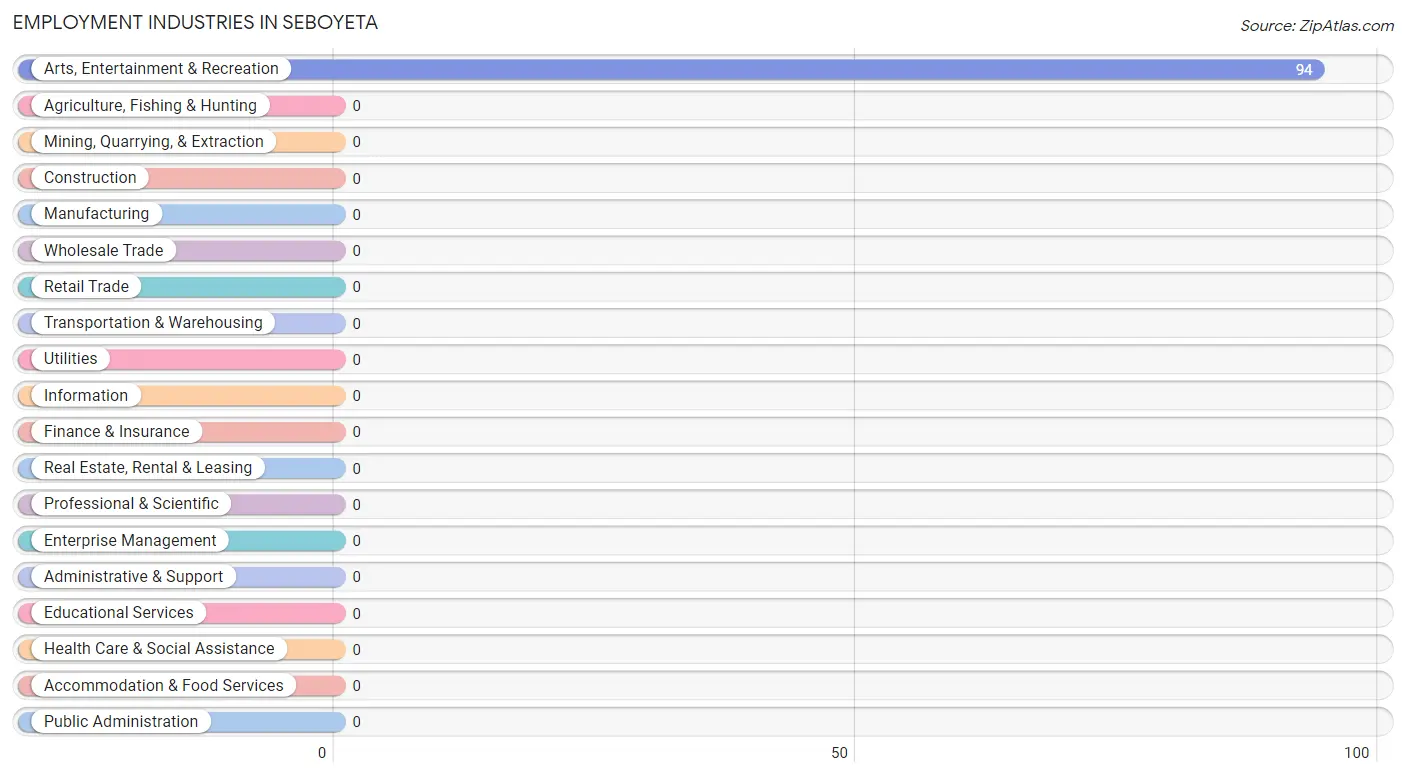
Employment Industries in Seboyeta
The major employment industries in Seboyeta include , and Arts, Entertainment & Recreation (94 | 42.1%).
Employment Industries by Sex in Seboyeta
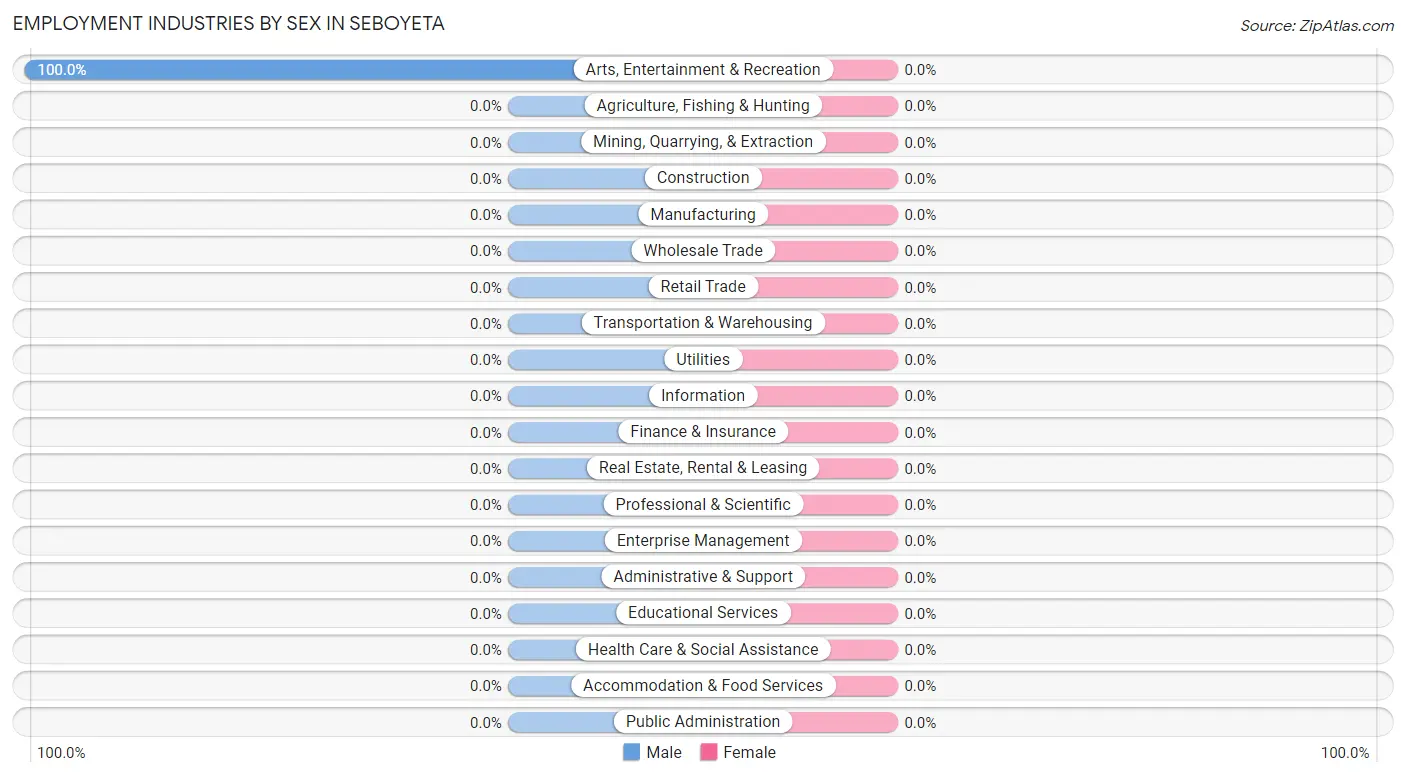
| Industry | Male | Female |
| Agriculture, Fishing & Hunting | 0 (0.0%) | 0 (0.0%) |
| Mining, Quarrying, & Extraction | 0 (0.0%) | 0 (0.0%) |
| Construction | 0 (0.0%) | 0 (0.0%) |
| Manufacturing | 0 (0.0%) | 0 (0.0%) |
| Wholesale Trade | 0 (0.0%) | 0 (0.0%) |
| Retail Trade | 0 (0.0%) | 0 (0.0%) |
| Transportation & Warehousing | 0 (0.0%) | 0 (0.0%) |
| Utilities | 0 (0.0%) | 0 (0.0%) |
| Information | 0 (0.0%) | 0 (0.0%) |
| Finance & Insurance | 0 (0.0%) | 0 (0.0%) |
| Real Estate, Rental & Leasing | 0 (0.0%) | 0 (0.0%) |
| Professional & Scientific | 0 (0.0%) | 0 (0.0%) |
| Enterprise Management | 0 (0.0%) | 0 (0.0%) |
| Administrative & Support | 0 (0.0%) | 0 (0.0%) |
| Educational Services | 0 (0.0%) | 0 (0.0%) |
| Health Care & Social Assistance | 0 (0.0%) | 0 (0.0%) |
| Arts, Entertainment & Recreation | 94 (100.0%) | 0 (0.0%) |
| Accommodation & Food Services | 0 (0.0%) | 0 (0.0%) |
| Public Administration | 0 (0.0%) | 0 (0.0%) |
| Total | 223 (100.0%) | 0 (0.0%) |
Education in Seboyeta
School Enrollment in Seboyeta
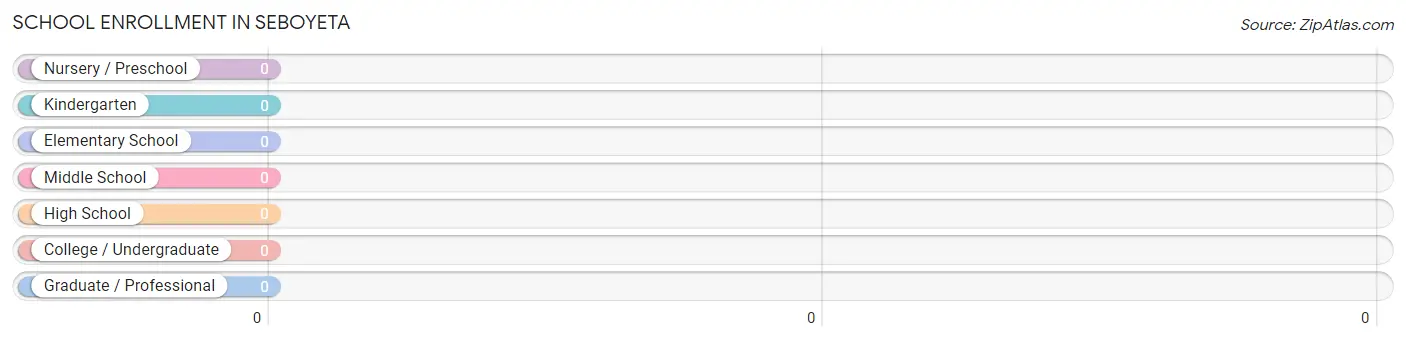
| School Level | # Students | % Students |
| Nursery / Preschool | 0 | 0.0% |
| Kindergarten | 0 | 0.0% |
| Elementary School | 0 | 0.0% |
| Middle School | 0 | 0.0% |
| High School | 0 | 0.0% |
| College / Undergraduate | 0 | 0.0% |
| Graduate / Professional | 0 | 0.0% |
| Total | 0 | 0.0% |
School Enrollment by Age by Funding Source in Seboyeta
| Age Bracket | Public School | Private School |
| 3 to 4 Year Olds | 0 (0.0%) | 0 (0.0%) |
| 5 to 9 Year Old | 0 (0.0%) | 0 (0.0%) |
| 10 to 14 Year Olds | 0 (0.0%) | 0 (0.0%) |
| 15 to 17 Year Olds | 0 (0.0%) | 0 (0.0%) |
| 18 to 19 Year Olds | 0 (0.0%) | 0 (0.0%) |
| 20 to 24 Year Olds | 0 (0.0%) | 0 (0.0%) |
| 25 to 34 Year Olds | 0 (0.0%) | 0 (0.0%) |
| 35 Years and over | 0 (0.0%) | 0 (0.0%) |
| Total | 0 (0.0%) | 0 (0.0%) |
Educational Attainment by Field of Study in Seboyeta
, and education (44 | 100.0%) are the most common fields of study among 44 individuals in Seboyeta who have obtained a bachelor's degree or higher.
| Field of Study | # Graduates | % Graduates |
| Computers & Mathematics | 0 | 0.0% |
| Bio, Nature & Agricultural | 0 | 0.0% |
| Physical & Health Sciences | 0 | 0.0% |
| Psychology | 0 | 0.0% |
| Social Sciences | 0 | 0.0% |
| Engineering | 0 | 0.0% |
| Multidisciplinary Studies | 0 | 0.0% |
| Science & Technology | 0 | 0.0% |
| Business | 0 | 0.0% |
| Education | 44 | 100.0% |
| Literature & Languages | 0 | 0.0% |
| Liberal Arts & History | 0 | 0.0% |
| Visual & Performing Arts | 0 | 0.0% |
| Communications | 0 | 0.0% |
| Arts & Humanities | 0 | 0.0% |
| Total | 44 | 100.0% |
Transportation & Commute in Seboyeta
Vehicle Availability by Sex in Seboyeta
| Vehicles Available | Male | Female |
| No Vehicle | 0 (0.0%) | 0 (0.0%) |
| 1 Vehicle | 223 (100.0%) | 0 (0.0%) |
| 2 Vehicles | 0 (0.0%) | 0 (0.0%) |
| 3 Vehicles | 0 (0.0%) | 0 (0.0%) |
| 4 Vehicles | 0 (0.0%) | 0 (0.0%) |
| 5 or more Vehicles | 0 (0.0%) | 0 (0.0%) |
| Total | 223 (100.0%) | 0 (0.0%) |
Commute Time in Seboyeta
The most frequently occuring commute durations in Seboyeta are 45 to 59 minutes (129 commuters, 57.9%), 40 to 44 minutes (94 commuters, 42.1%), and less than 5 minutes (0 commuters, 0.0%).
| Commute Time | # Commuters | % Commuters |
| Less than 5 Minutes | 0 | 0.0% |
| 5 to 9 Minutes | 0 | 0.0% |
| 10 to 14 Minutes | 0 | 0.0% |
| 15 to 19 Minutes | 0 | 0.0% |
| 20 to 24 Minutes | 0 | 0.0% |
| 25 to 29 Minutes | 0 | 0.0% |
| 30 to 34 Minutes | 0 | 0.0% |
| 35 to 39 Minutes | 0 | 0.0% |
| 40 to 44 Minutes | 94 | 42.1% |
| 45 to 59 Minutes | 129 | 57.9% |
| 60 to 89 Minutes | 0 | 0.0% |
| 90 or more Minutes | 0 | 0.0% |
Commute Time by Sex in Seboyeta
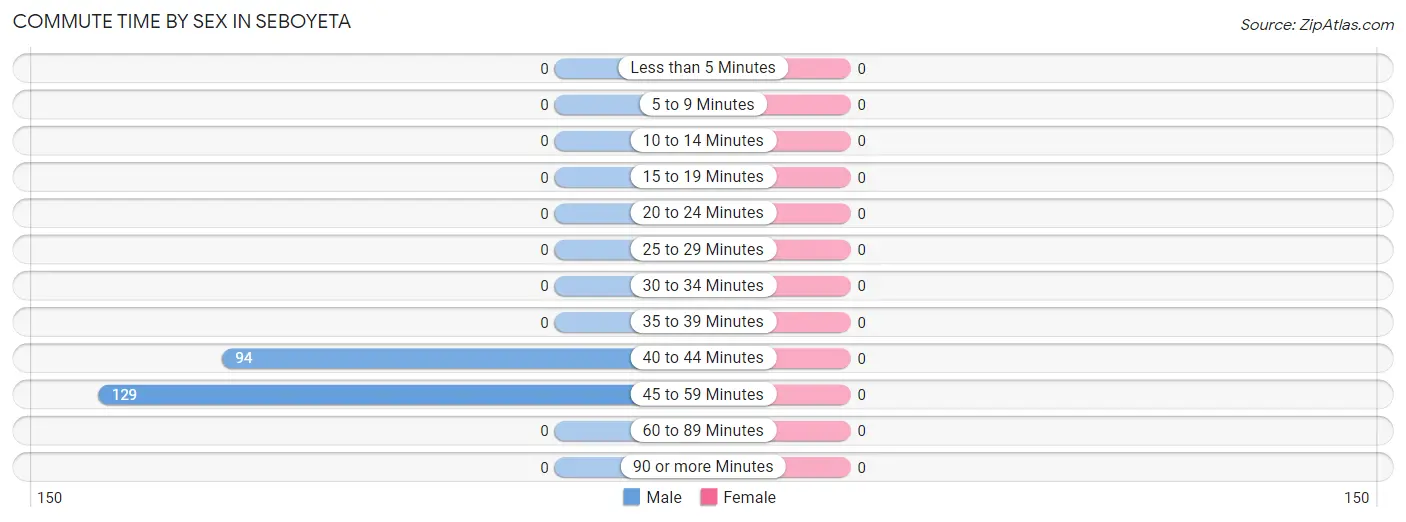
| Commute Time | Male | Female |
| Less than 5 Minutes | 0 (0.0%) | 0 (0.0%) |
| 5 to 9 Minutes | 0 (0.0%) | 0 (0.0%) |
| 10 to 14 Minutes | 0 (0.0%) | 0 (0.0%) |
| 15 to 19 Minutes | 0 (0.0%) | 0 (0.0%) |
| 20 to 24 Minutes | 0 (0.0%) | 0 (0.0%) |
| 25 to 29 Minutes | 0 (0.0%) | 0 (0.0%) |
| 30 to 34 Minutes | 0 (0.0%) | 0 (0.0%) |
| 35 to 39 Minutes | 0 (0.0%) | 0 (0.0%) |
| 40 to 44 Minutes | 94 (42.1%) | 0 (0.0%) |
| 45 to 59 Minutes | 129 (57.9%) | 0 (0.0%) |
| 60 to 89 Minutes | 0 (0.0%) | 0 (0.0%) |
| 90 or more Minutes | 0 (0.0%) | 0 (0.0%) |
Time of Departure to Work by Sex in Seboyeta
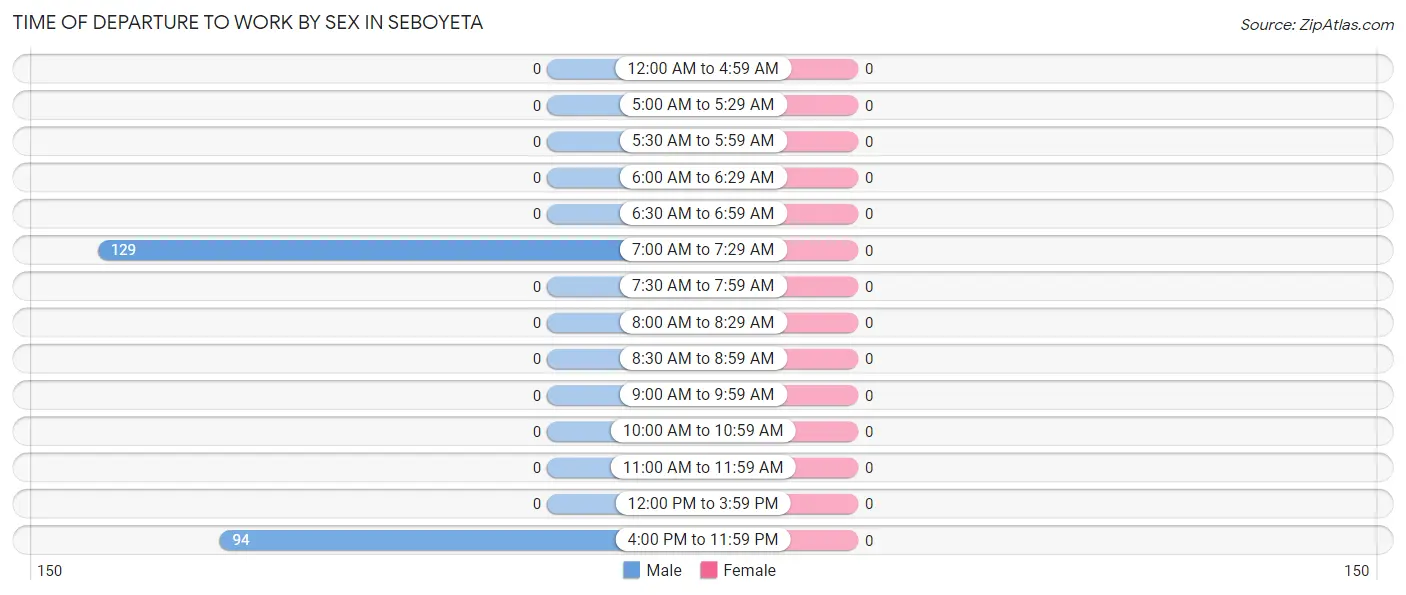
| Time of Departure | Male | Female |
| 12:00 AM to 4:59 AM | 0 (0.0%) | 0 (0.0%) |
| 5:00 AM to 5:29 AM | 0 (0.0%) | 0 (0.0%) |
| 5:30 AM to 5:59 AM | 0 (0.0%) | 0 (0.0%) |
| 6:00 AM to 6:29 AM | 0 (0.0%) | 0 (0.0%) |
| 6:30 AM to 6:59 AM | 0 (0.0%) | 0 (0.0%) |
| 7:00 AM to 7:29 AM | 129 (57.9%) | 0 (0.0%) |
| 7:30 AM to 7:59 AM | 0 (0.0%) | 0 (0.0%) |
| 8:00 AM to 8:29 AM | 0 (0.0%) | 0 (0.0%) |
| 8:30 AM to 8:59 AM | 0 (0.0%) | 0 (0.0%) |
| 9:00 AM to 9:59 AM | 0 (0.0%) | 0 (0.0%) |
| 10:00 AM to 10:59 AM | 0 (0.0%) | 0 (0.0%) |
| 11:00 AM to 11:59 AM | 0 (0.0%) | 0 (0.0%) |
| 12:00 PM to 3:59 PM | 0 (0.0%) | 0 (0.0%) |
| 4:00 PM to 11:59 PM | 94 (42.1%) | 0 (0.0%) |
| Total | 223 (100.0%) | 0 (0.0%) |
Housing Occupancy in Seboyeta
Occupancy by Ownership in Seboyeta
Of the total 288 dwellings in Seboyeta, owner-occupied units account for 159 (55.2%), while renter-occupied units make up 129 (44.8%).
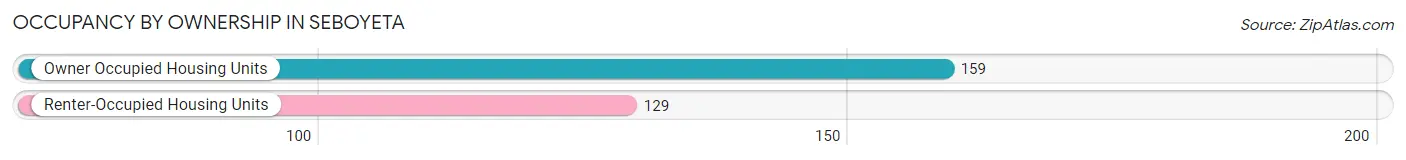
| Occupancy | # Housing Units | % Housing Units |
| Owner Occupied Housing Units | 159 | 55.2% |
| Renter-Occupied Housing Units | 129 | 44.8% |
| Total Occupied Housing Units | 288 | 100.0% |
Occupancy by Household Size in Seboyeta
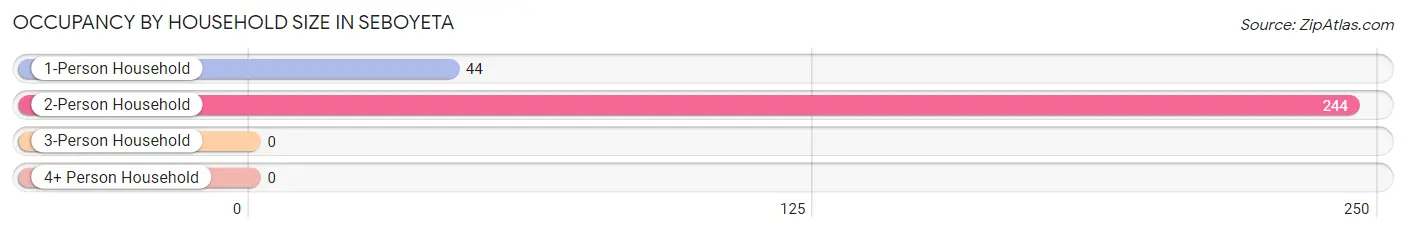
| Household Size | # Housing Units | % Housing Units |
| 1-Person Household | 44 | 15.3% |
| 2-Person Household | 244 | 84.7% |
| 3-Person Household | 0 | 0.0% |
| 4+ Person Household | 0 | 0.0% |
| Total Housing Units | 288 | 100.0% |
Occupancy by Ownership by Household Size in Seboyeta
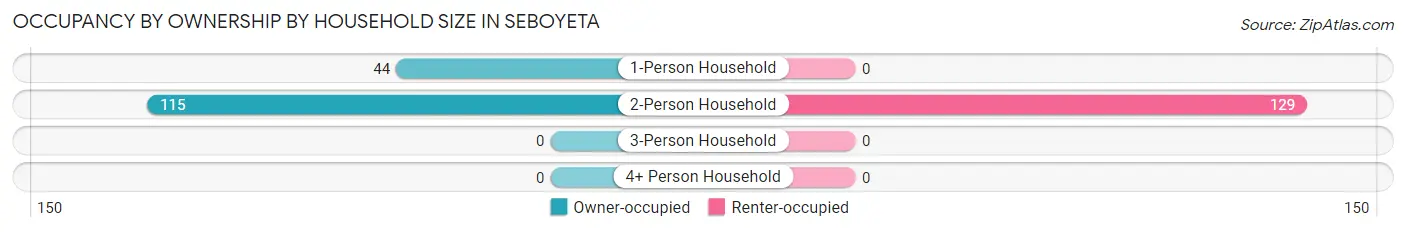
| Household Size | Owner-occupied | Renter-occupied |
| 1-Person Household | 44 (100.0%) | 0 (0.0%) |
| 2-Person Household | 115 (47.1%) | 129 (52.9%) |
| 3-Person Household | 0 (0.0%) | 0 (0.0%) |
| 4+ Person Household | 0 (0.0%) | 0 (0.0%) |
| Total Housing Units | 159 (55.2%) | 129 (44.8%) |
Occupancy by Educational Attainment in Seboyeta
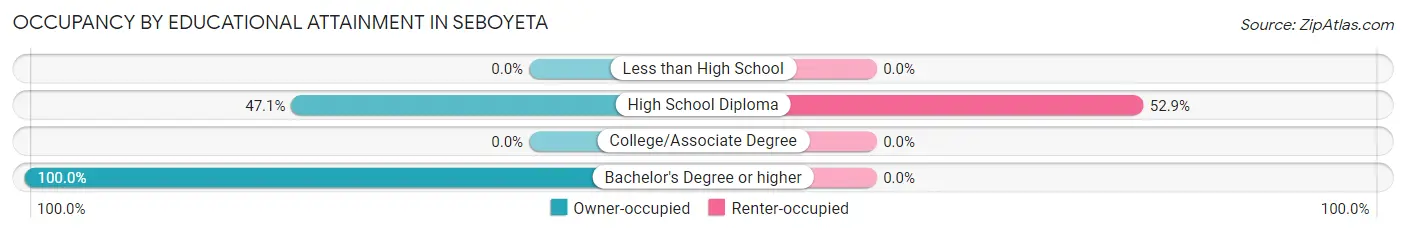
| Household Size | Owner-occupied | Renter-occupied |
| Less than High School | 0 (0.0%) | 0 (0.0%) |
| High School Diploma | 115 (47.1%) | 129 (52.9%) |
| College/Associate Degree | 0 (0.0%) | 0 (0.0%) |
| Bachelor's Degree or higher | 44 (100.0%) | 0 (0.0%) |
Occupancy by Age of Householder in Seboyeta
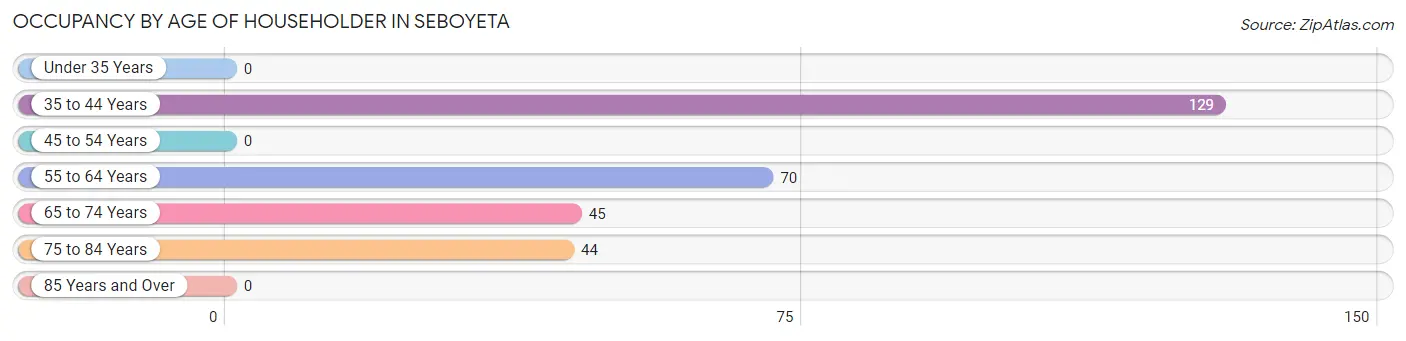
| Age Bracket | # Households | % Households |
| Under 35 Years | 0 | 0.0% |
| 35 to 44 Years | 129 | 44.8% |
| 45 to 54 Years | 0 | 0.0% |
| 55 to 64 Years | 70 | 24.3% |
| 65 to 74 Years | 45 | 15.6% |
| 75 to 84 Years | 44 | 15.3% |
| 85 Years and Over | 0 | 0.0% |
| Total | 288 | 100.0% |
Housing Finances in Seboyeta
Median Income by Occupancy in Seboyeta
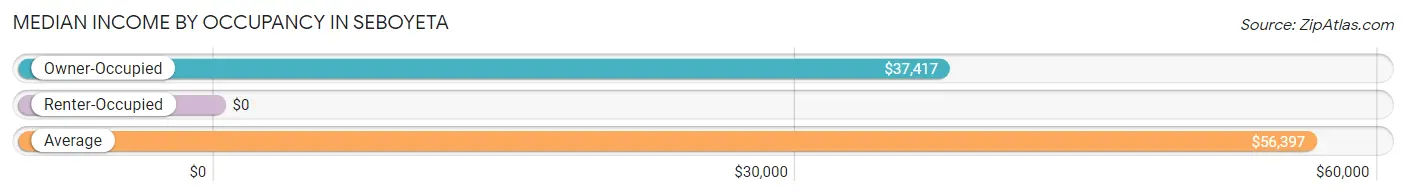
| Occupancy Type | # Households | Median Income |
| Owner-Occupied | 159 (55.2%) | $37,417 |
| Renter-Occupied | 129 (44.8%) | $0 |
| Average | 288 (100.0%) | $56,397 |
Occupancy by Householder Income Bracket in Seboyeta
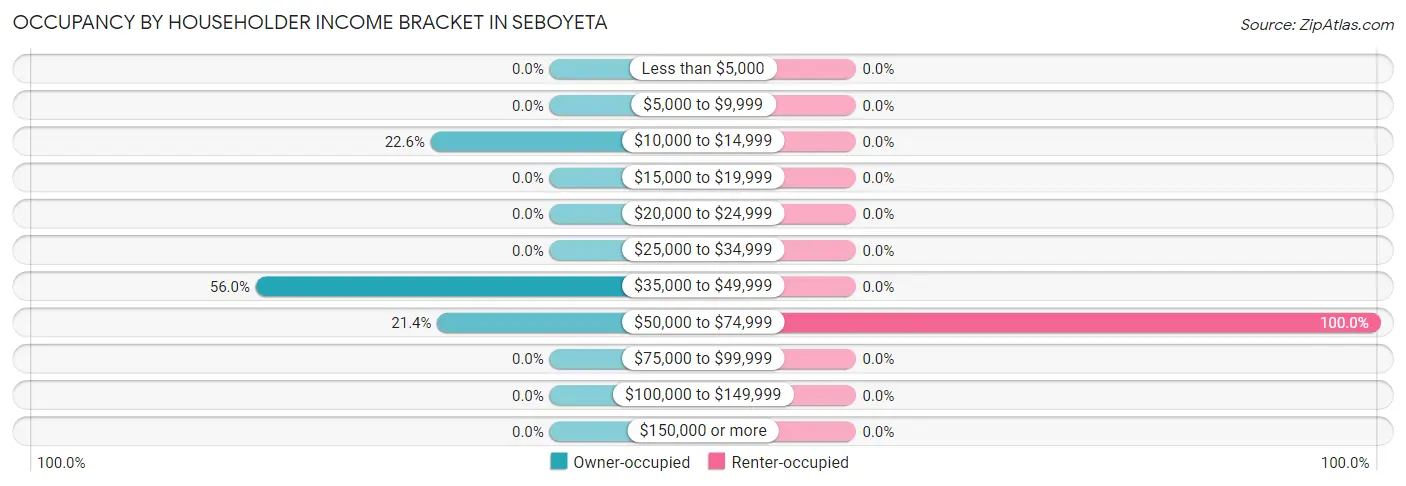
| Income Bracket | Owner-occupied | Renter-occupied |
| Less than $5,000 | 0 (0.0%) | 0 (0.0%) |
| $5,000 to $9,999 | 0 (0.0%) | 0 (0.0%) |
| $10,000 to $14,999 | 36 (22.6%) | 0 (0.0%) |
| $15,000 to $19,999 | 0 (0.0%) | 0 (0.0%) |
| $20,000 to $24,999 | 0 (0.0%) | 0 (0.0%) |
| $25,000 to $34,999 | 0 (0.0%) | 0 (0.0%) |
| $35,000 to $49,999 | 89 (56.0%) | 0 (0.0%) |
| $50,000 to $74,999 | 34 (21.4%) | 129 (100.0%) |
| $75,000 to $99,999 | 0 (0.0%) | 0 (0.0%) |
| $100,000 to $149,999 | 0 (0.0%) | 0 (0.0%) |
| $150,000 or more | 0 (0.0%) | 0 (0.0%) |
| Total | 159 (100.0%) | 129 (100.0%) |
Monthly Housing Cost Tiers in Seboyeta
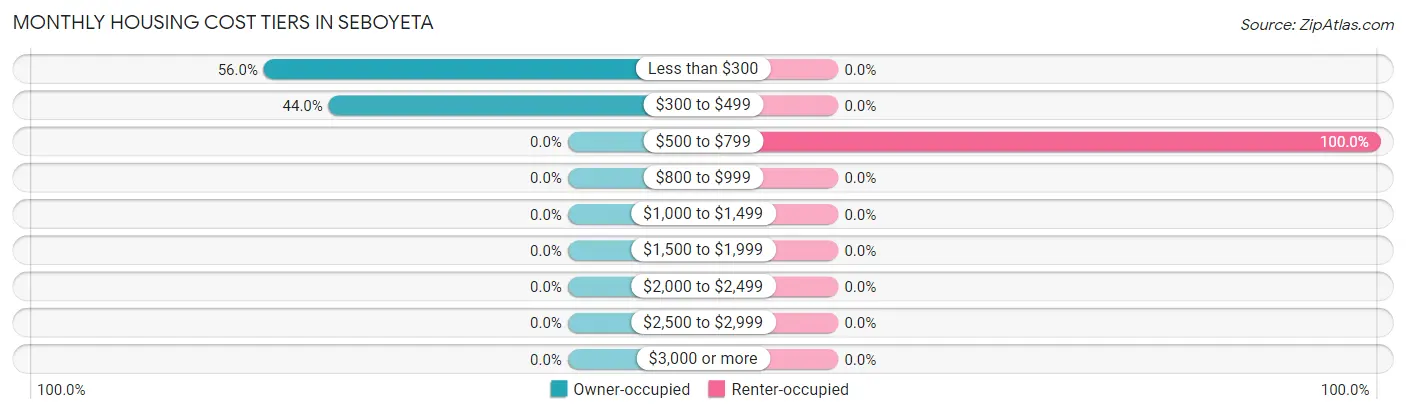
| Monthly Cost | Owner-occupied | Renter-occupied |
| Less than $300 | 89 (56.0%) | 0 (0.0%) |
| $300 to $499 | 70 (44.0%) | 0 (0.0%) |
| $500 to $799 | 0 (0.0%) | 129 (100.0%) |
| $800 to $999 | 0 (0.0%) | 0 (0.0%) |
| $1,000 to $1,499 | 0 (0.0%) | 0 (0.0%) |
| $1,500 to $1,999 | 0 (0.0%) | 0 (0.0%) |
| $2,000 to $2,499 | 0 (0.0%) | 0 (0.0%) |
| $2,500 to $2,999 | 0 (0.0%) | 0 (0.0%) |
| $3,000 or more | 0 (0.0%) | 0 (0.0%) |
| Total | 159 (100.0%) | 129 (100.0%) |
Physical Housing Characteristics in Seboyeta
Housing Structures in Seboyeta
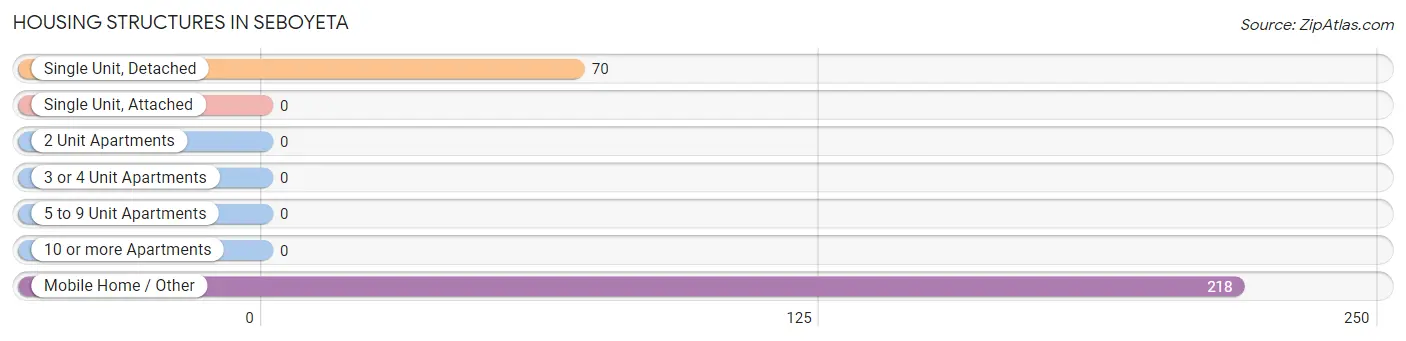
| Structure Type | # Housing Units | % Housing Units |
| Single Unit, Detached | 70 | 24.3% |
| Single Unit, Attached | 0 | 0.0% |
| 2 Unit Apartments | 0 | 0.0% |
| 3 or 4 Unit Apartments | 0 | 0.0% |
| 5 to 9 Unit Apartments | 0 | 0.0% |
| 10 or more Apartments | 0 | 0.0% |
| Mobile Home / Other | 218 | 75.7% |
| Total | 288 | 100.0% |
Housing Structures by Occupancy in Seboyeta
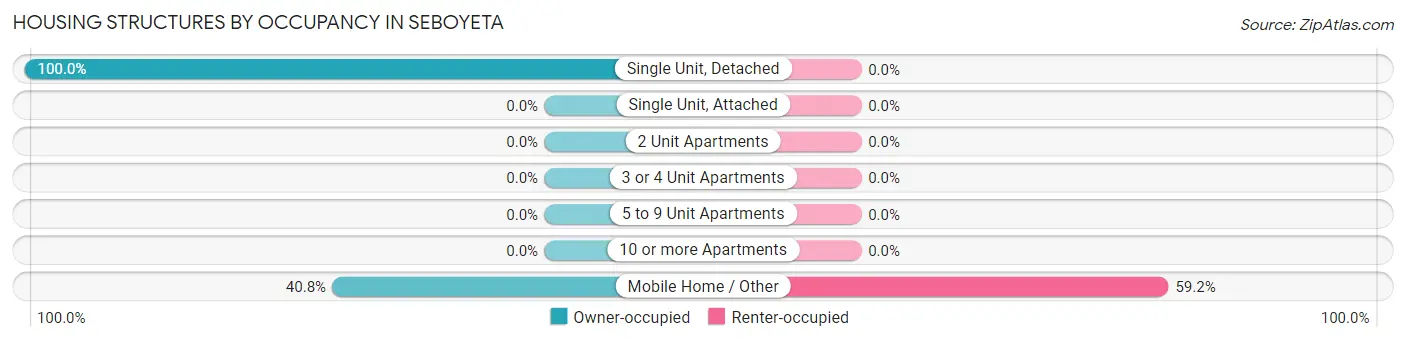
| Structure Type | Owner-occupied | Renter-occupied |
| Single Unit, Detached | 70 (100.0%) | 0 (0.0%) |
| Single Unit, Attached | 0 (0.0%) | 0 (0.0%) |
| 2 Unit Apartments | 0 (0.0%) | 0 (0.0%) |
| 3 or 4 Unit Apartments | 0 (0.0%) | 0 (0.0%) |
| 5 to 9 Unit Apartments | 0 (0.0%) | 0 (0.0%) |
| 10 or more Apartments | 0 (0.0%) | 0 (0.0%) |
| Mobile Home / Other | 89 (40.8%) | 129 (59.2%) |
| Total | 159 (55.2%) | 129 (44.8%) |
Housing Structures by Number of Rooms in Seboyeta
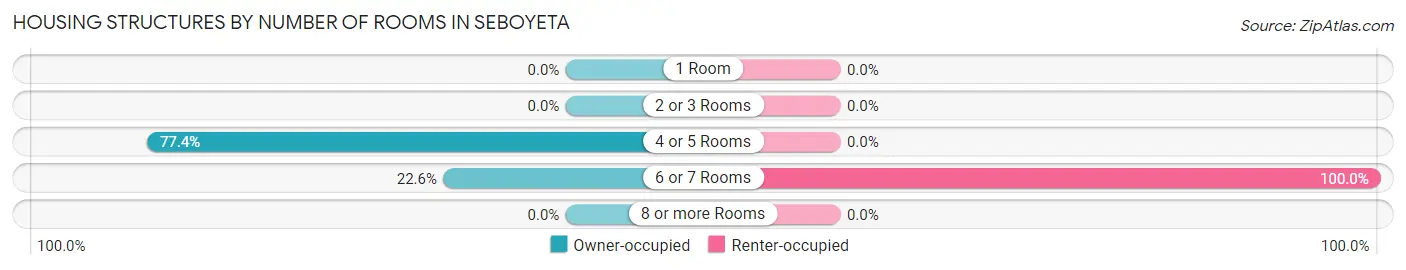
| Number of Rooms | Owner-occupied | Renter-occupied |
| 1 Room | 0 (0.0%) | 0 (0.0%) |
| 2 or 3 Rooms | 0 (0.0%) | 0 (0.0%) |
| 4 or 5 Rooms | 123 (77.4%) | 0 (0.0%) |
| 6 or 7 Rooms | 36 (22.6%) | 129 (100.0%) |
| 8 or more Rooms | 0 (0.0%) | 0 (0.0%) |
| Total | 159 (100.0%) | 129 (100.0%) |
Housing Structure by Heating Type in Seboyeta
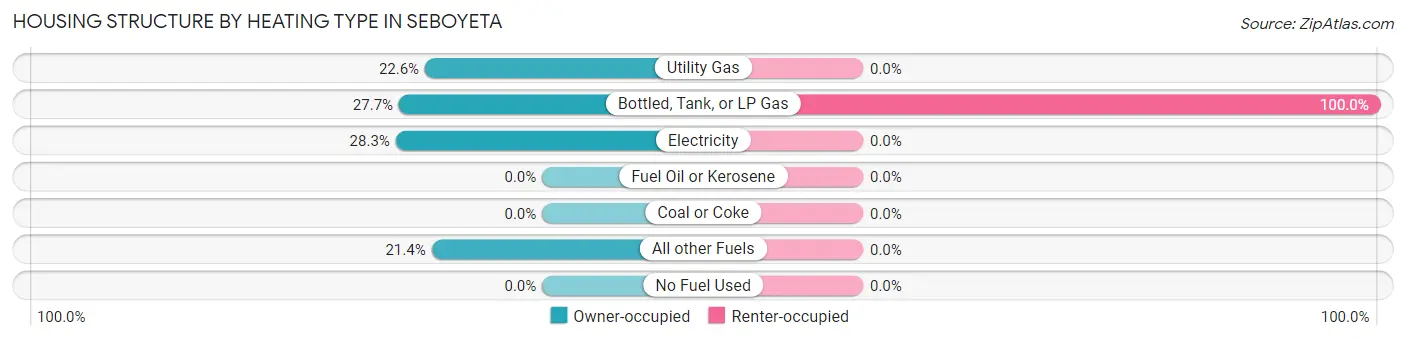
| Heating Type | Owner-occupied | Renter-occupied |
| Utility Gas | 36 (22.6%) | 0 (0.0%) |
| Bottled, Tank, or LP Gas | 44 (27.7%) | 129 (100.0%) |
| Electricity | 45 (28.3%) | 0 (0.0%) |
| Fuel Oil or Kerosene | 0 (0.0%) | 0 (0.0%) |
| Coal or Coke | 0 (0.0%) | 0 (0.0%) |
| All other Fuels | 34 (21.4%) | 0 (0.0%) |
| No Fuel Used | 0 (0.0%) | 0 (0.0%) |
| Total | 159 (100.0%) | 129 (100.0%) |
Household Vehicle Usage in Seboyeta
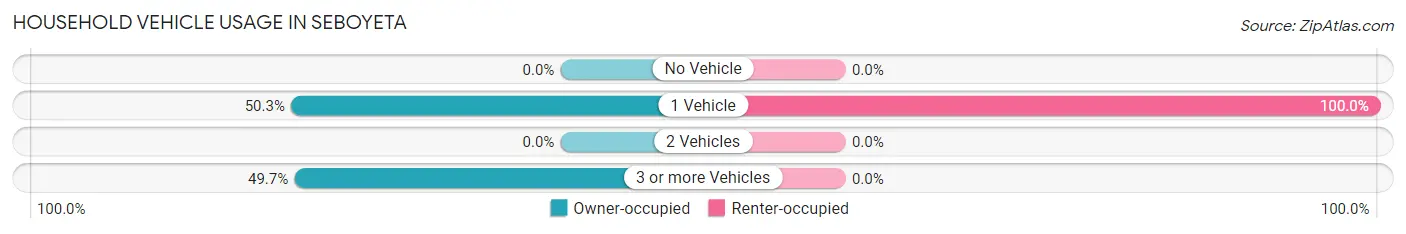
| Vehicles per Household | Owner-occupied | Renter-occupied |
| No Vehicle | 0 (0.0%) | 0 (0.0%) |
| 1 Vehicle | 80 (50.3%) | 129 (100.0%) |
| 2 Vehicles | 0 (0.0%) | 0 (0.0%) |
| 3 or more Vehicles | 79 (49.7%) | 0 (0.0%) |
| Total | 159 (100.0%) | 129 (100.0%) |
Real Estate & Mortgages in Seboyeta
Real Estate and Mortgage Overview in Seboyeta
| Characteristic | Without Mortgage | With Mortgage |
| Housing Units | 159 | 0 |
| Median Property Value | $18,200 | $0 |
| Median Household Income | $37,417 | $0 |
| Monthly Housing Costs | - | - |
| Real Estate Taxes | - | - |
Property Value by Mortgage Status in Seboyeta
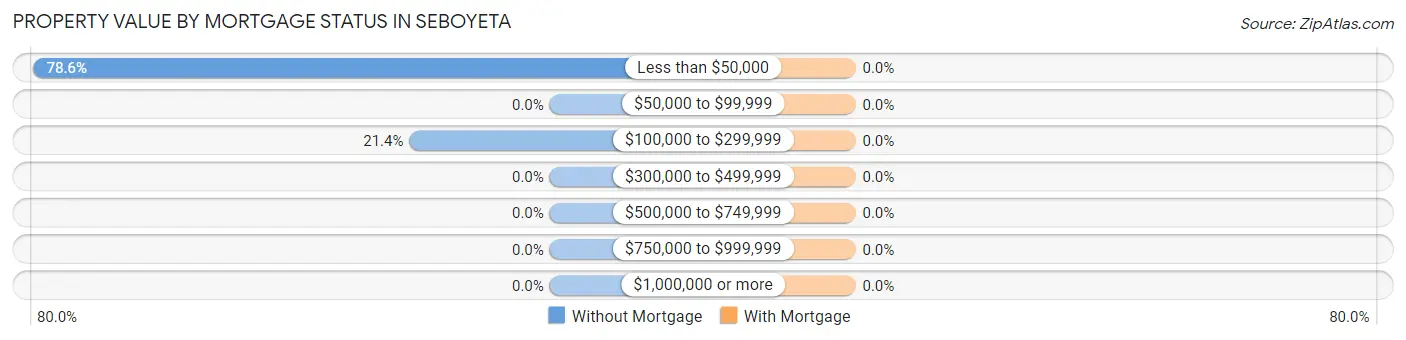
| Property Value | Without Mortgage | With Mortgage |
| Less than $50,000 | 125 (78.6%) | 0 (0.0%) |
| $50,000 to $99,999 | 0 (0.0%) | 0 (0.0%) |
| $100,000 to $299,999 | 34 (21.4%) | 0 (0.0%) |
| $300,000 to $499,999 | 0 (0.0%) | 0 (0.0%) |
| $500,000 to $749,999 | 0 (0.0%) | 0 (0.0%) |
| $750,000 to $999,999 | 0 (0.0%) | 0 (0.0%) |
| $1,000,000 or more | 0 (0.0%) | 0 (0.0%) |
| Total | 159 (100.0%) | 0 (0.0%) |
Household Income by Mortgage Status in Seboyeta
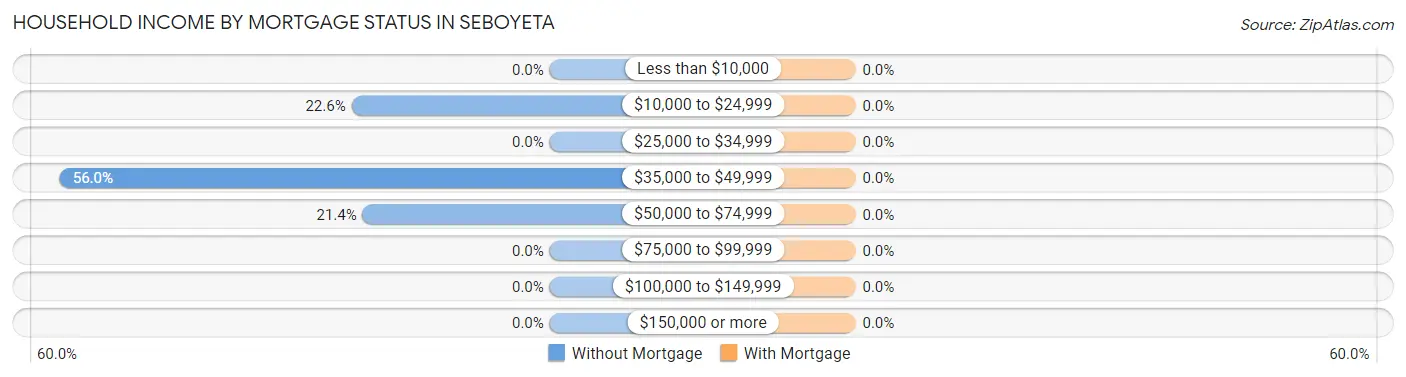
| Household Income | Without Mortgage | With Mortgage |
| Less than $10,000 | 0 (0.0%) | 0 (0.0%) |
| $10,000 to $24,999 | 36 (22.6%) | 0 (0.0%) |
| $25,000 to $34,999 | 0 (0.0%) | 0 (0.0%) |
| $35,000 to $49,999 | 89 (56.0%) | 0 (0.0%) |
| $50,000 to $74,999 | 34 (21.4%) | 0 (0.0%) |
| $75,000 to $99,999 | 0 (0.0%) | 0 (0.0%) |
| $100,000 to $149,999 | 0 (0.0%) | 0 (0.0%) |
| $150,000 or more | 0 (0.0%) | 0 (0.0%) |
| Total | 159 (100.0%) | 0 (0.0%) |
Property Value to Household Income Ratio in Seboyeta
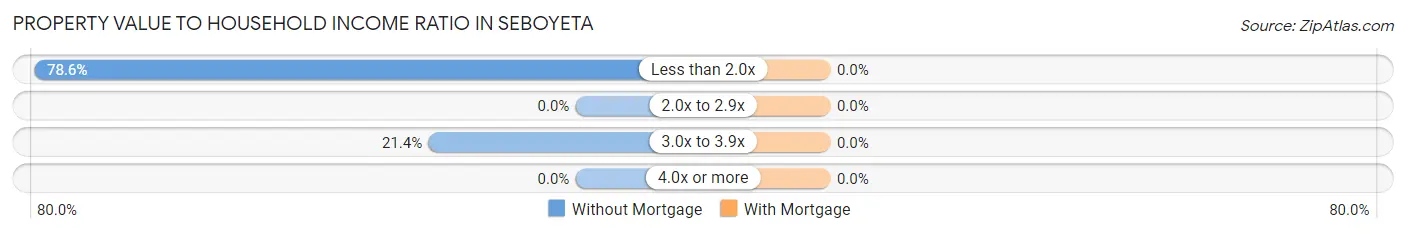
| Value-to-Income Ratio | Without Mortgage | With Mortgage |
| Less than 2.0x | 125 (78.6%) | 0 (0.0%) |
| 2.0x to 2.9x | 0 (0.0%) | 0 (0.0%) |
| 3.0x to 3.9x | 34 (21.4%) | 0 (0.0%) |
| 4.0x or more | 0 (0.0%) | 0 (0.0%) |
| Total | 159 (100.0%) | 0 (0.0%) |
Real Estate Taxes by Mortgage Status in Seboyeta
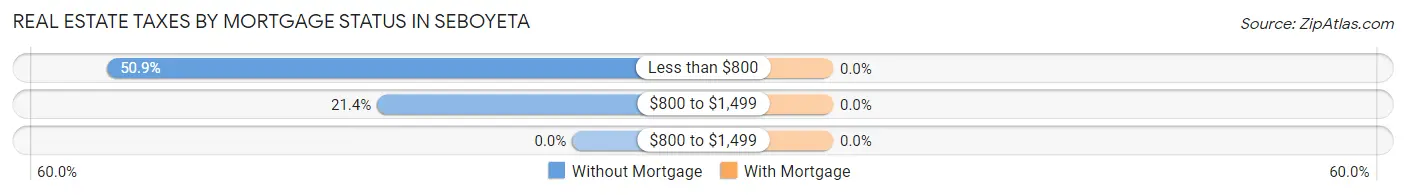
| Property Taxes | Without Mortgage | With Mortgage |
| Less than $800 | 81 (50.9%) | 0 (0.0%) |
| $800 to $1,499 | 34 (21.4%) | 0 (0.0%) |
| $800 to $1,499 | 0 (0.0%) | 0 (0.0%) |
| Total | 159 (100.0%) | 0 (0.0%) |
Health & Disability in Seboyeta
Health Insurance Coverage by Age in Seboyeta
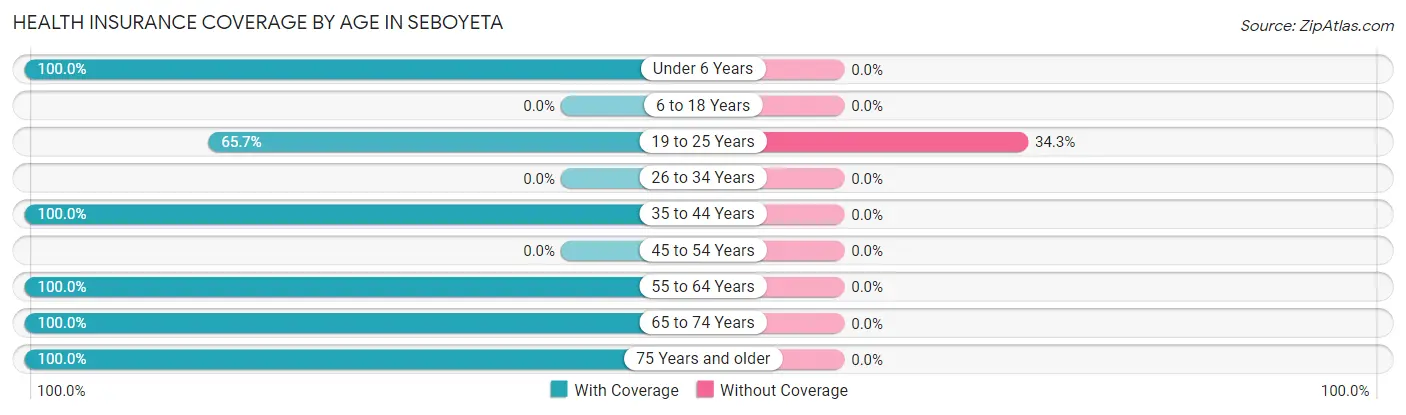
| Age Bracket | With Coverage | Without Coverage |
| Under 6 Years | 50 (100.0%) | 0 (0.0%) |
| 6 to 18 Years | 0 (0.0%) | 0 (0.0%) |
| 19 to 25 Years | 94 (65.7%) | 49 (34.3%) |
| 26 to 34 Years | 0 (0.0%) | 0 (0.0%) |
| 35 to 44 Years | 129 (100.0%) | 0 (0.0%) |
| 45 to 54 Years | 0 (0.0%) | 0 (0.0%) |
| 55 to 64 Years | 70 (100.0%) | 0 (0.0%) |
| 65 to 74 Years | 80 (100.0%) | 0 (0.0%) |
| 75 Years and older | 44 (100.0%) | 0 (0.0%) |
| Total | 467 (90.5%) | 49 (9.5%) |
Health Insurance Coverage by Citizenship Status in Seboyeta
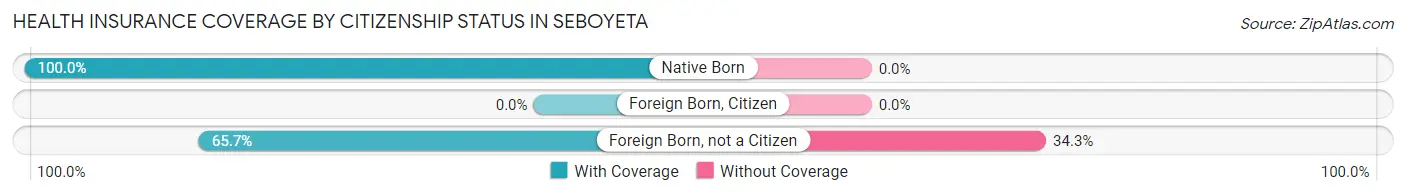
| Citizenship Status | With Coverage | Without Coverage |
| Native Born | 50 (100.0%) | 0 (0.0%) |
| Foreign Born, Citizen | 0 (0.0%) | 0 (0.0%) |
| Foreign Born, not a Citizen | 94 (65.7%) | 49 (34.3%) |
Health Insurance Coverage by Household Income in Seboyeta
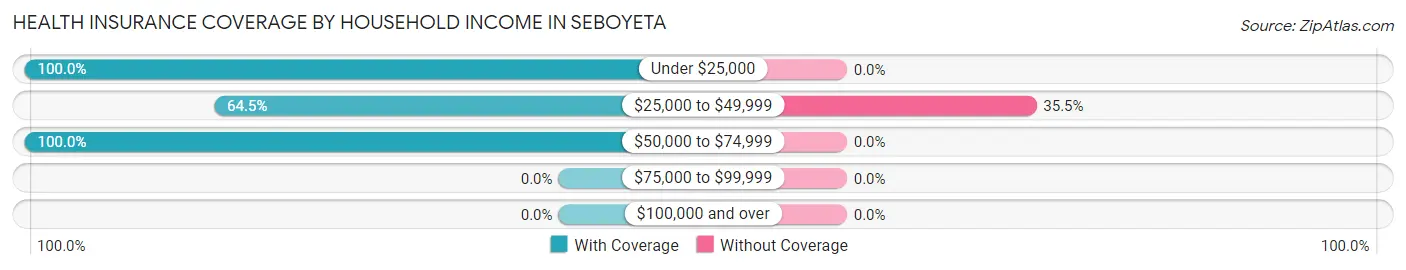
| Household Income | With Coverage | Without Coverage |
| Under $25,000 | 86 (100.0%) | 0 (0.0%) |
| $25,000 to $49,999 | 89 (64.5%) | 49 (35.5%) |
| $50,000 to $74,999 | 292 (100.0%) | 0 (0.0%) |
| $75,000 to $99,999 | 0 (0.0%) | 0 (0.0%) |
| $100,000 and over | 0 (0.0%) | 0 (0.0%) |
Public vs Private Health Insurance Coverage by Age in Seboyeta
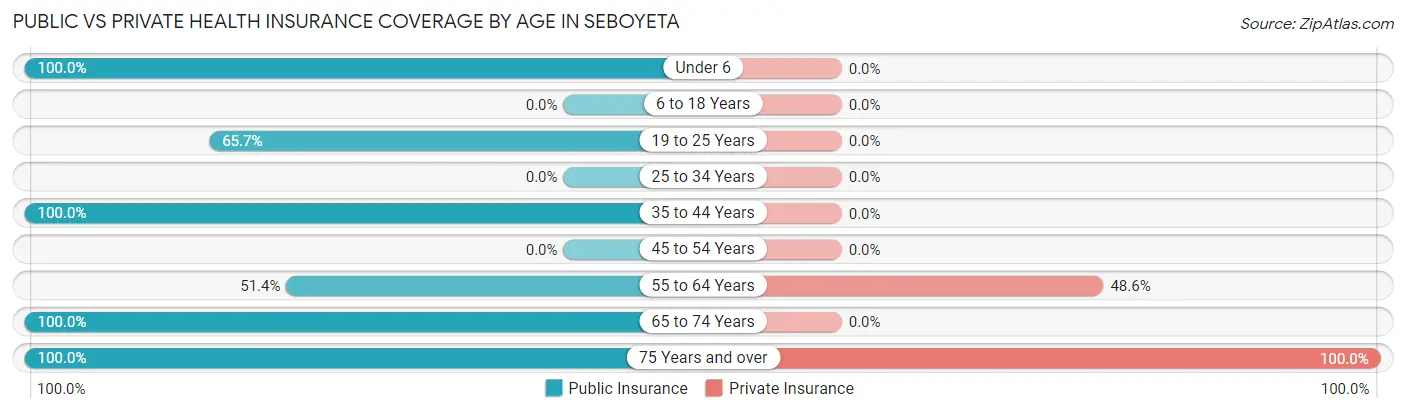
| Age Bracket | Public Insurance | Private Insurance |
| Under 6 | 50 (100.0%) | 0 (0.0%) |
| 6 to 18 Years | 0 (0.0%) | 0 (0.0%) |
| 19 to 25 Years | 94 (65.7%) | 0 (0.0%) |
| 25 to 34 Years | 0 (0.0%) | 0 (0.0%) |
| 35 to 44 Years | 129 (100.0%) | 0 (0.0%) |
| 45 to 54 Years | 0 (0.0%) | 0 (0.0%) |
| 55 to 64 Years | 36 (51.4%) | 34 (48.6%) |
| 65 to 74 Years | 80 (100.0%) | 0 (0.0%) |
| 75 Years and over | 44 (100.0%) | 44 (100.0%) |
| Total | 433 (83.9%) | 78 (15.1%) |
Disability Status by Sex by Age in Seboyeta
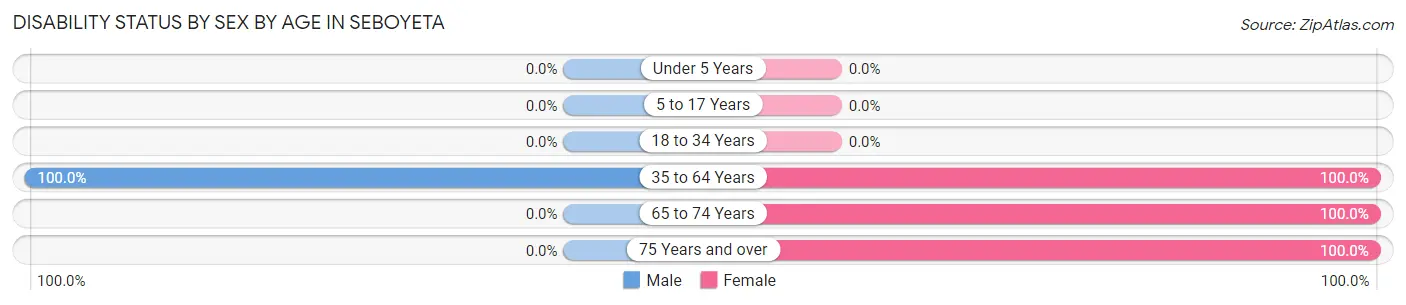
| Age Bracket | Male | Female |
| Under 5 Years | 0 (0.0%) | 0 (0.0%) |
| 5 to 17 Years | 0 (0.0%) | 0 (0.0%) |
| 18 to 34 Years | 0 (0.0%) | 0 (0.0%) |
| 35 to 64 Years | 129 (100.0%) | 70 (100.0%) |
| 65 to 74 Years | 0 (0.0%) | 45 (100.0%) |
| 75 Years and over | 0 (0.0%) | 44 (100.0%) |
Disability Class by Sex by Age in Seboyeta
Disability Class: Hearing Difficulty
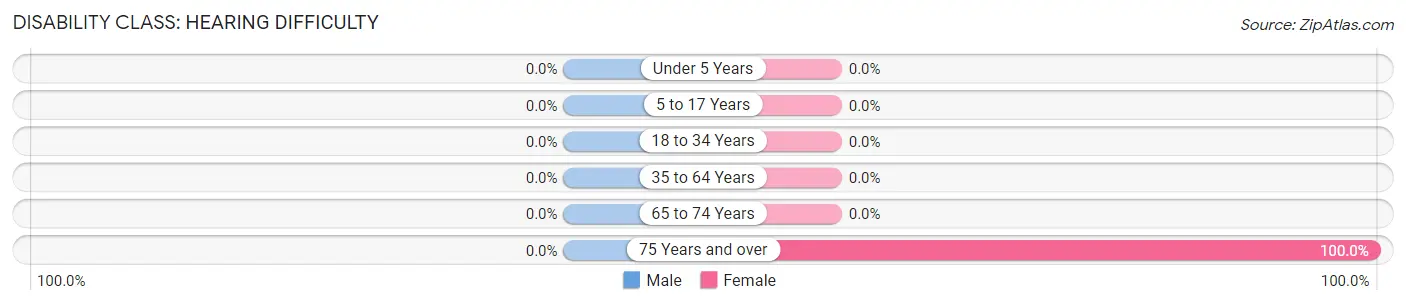
| Age Bracket | Male | Female |
| Under 5 Years | 0 (0.0%) | 0 (0.0%) |
| 5 to 17 Years | 0 (0.0%) | 0 (0.0%) |
| 18 to 34 Years | 0 (0.0%) | 0 (0.0%) |
| 35 to 64 Years | 0 (0.0%) | 0 (0.0%) |
| 65 to 74 Years | 0 (0.0%) | 0 (0.0%) |
| 75 Years and over | 0 (0.0%) | 44 (100.0%) |
Disability Class: Vision Difficulty
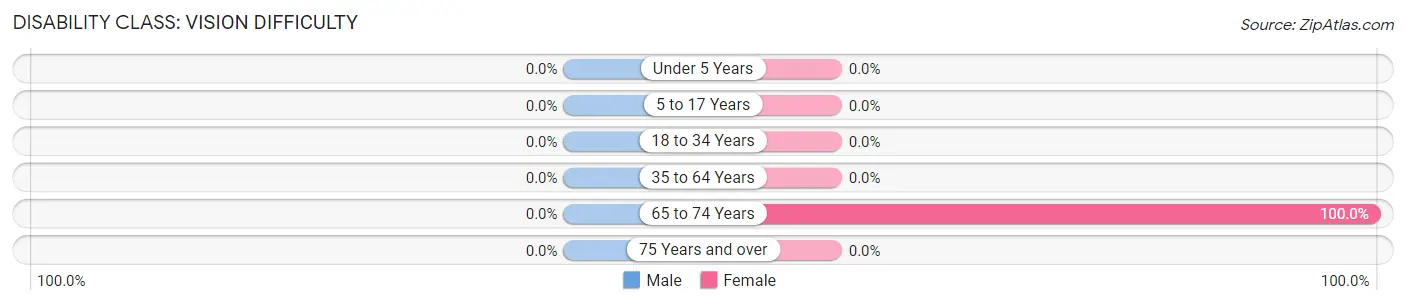
| Age Bracket | Male | Female |
| Under 5 Years | 0 (0.0%) | 0 (0.0%) |
| 5 to 17 Years | 0 (0.0%) | 0 (0.0%) |
| 18 to 34 Years | 0 (0.0%) | 0 (0.0%) |
| 35 to 64 Years | 0 (0.0%) | 0 (0.0%) |
| 65 to 74 Years | 0 (0.0%) | 45 (100.0%) |
| 75 Years and over | 0 (0.0%) | 0 (0.0%) |
Disability Class: Cognitive Difficulty
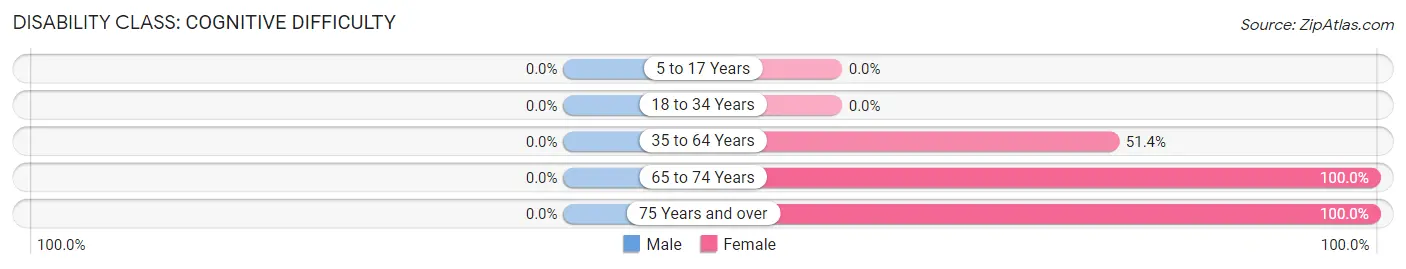
| Age Bracket | Male | Female |
| 5 to 17 Years | 0 (0.0%) | 0 (0.0%) |
| 18 to 34 Years | 0 (0.0%) | 0 (0.0%) |
| 35 to 64 Years | 0 (0.0%) | 36 (51.4%) |
| 65 to 74 Years | 0 (0.0%) | 45 (100.0%) |
| 75 Years and over | 0 (0.0%) | 44 (100.0%) |
Disability Class: Ambulatory Difficulty
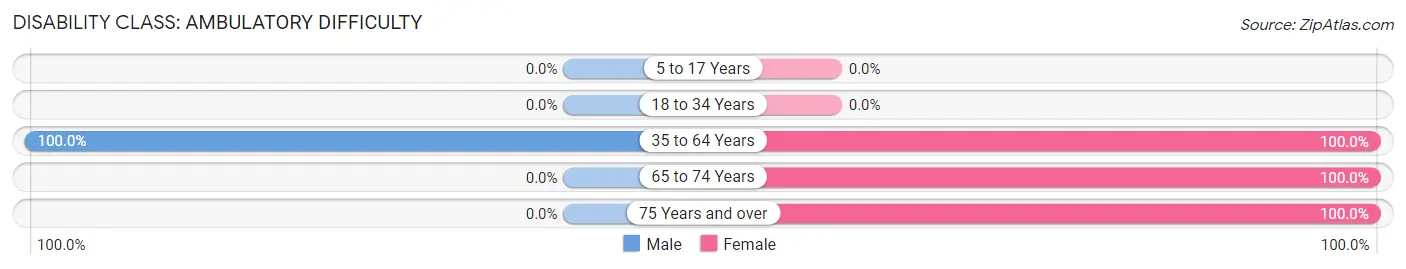
| Age Bracket | Male | Female |
| 5 to 17 Years | 0 (0.0%) | 0 (0.0%) |
| 18 to 34 Years | 0 (0.0%) | 0 (0.0%) |
| 35 to 64 Years | 129 (100.0%) | 70 (100.0%) |
| 65 to 74 Years | 0 (0.0%) | 45 (100.0%) |
| 75 Years and over | 0 (0.0%) | 44 (100.0%) |
Disability Class: Self-Care Difficulty
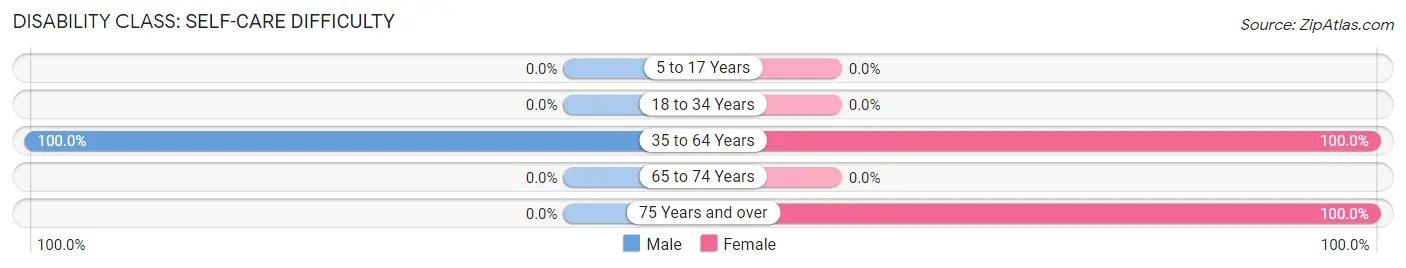
| Age Bracket | Male | Female |
| 5 to 17 Years | 0 (0.0%) | 0 (0.0%) |
| 18 to 34 Years | 0 (0.0%) | 0 (0.0%) |
| 35 to 64 Years | 129 (100.0%) | 70 (100.0%) |
| 65 to 74 Years | 0 (0.0%) | 0 (0.0%) |
| 75 Years and over | 0 (0.0%) | 44 (100.0%) |
Technology Access in Seboyeta
Computing Device Access in Seboyeta
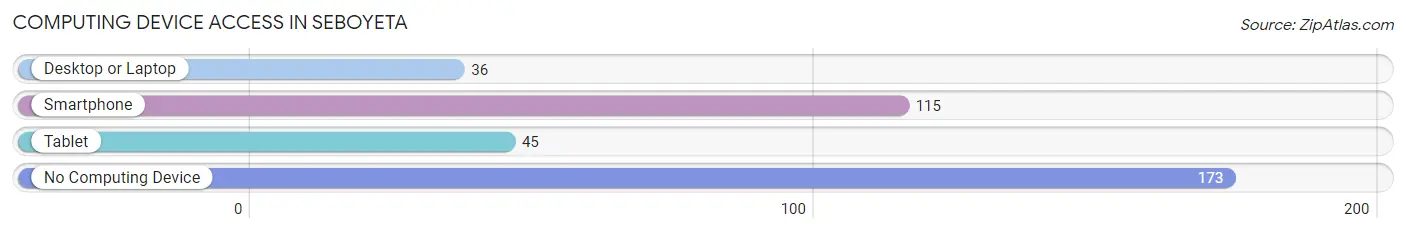
| Device Type | # Households | % Households |
| Desktop or Laptop | 36 | 12.5% |
| Smartphone | 115 | 39.9% |
| Tablet | 45 | 15.6% |
| No Computing Device | 173 | 60.1% |
| Total | 288 | 100.0% |
Internet Access in Seboyeta
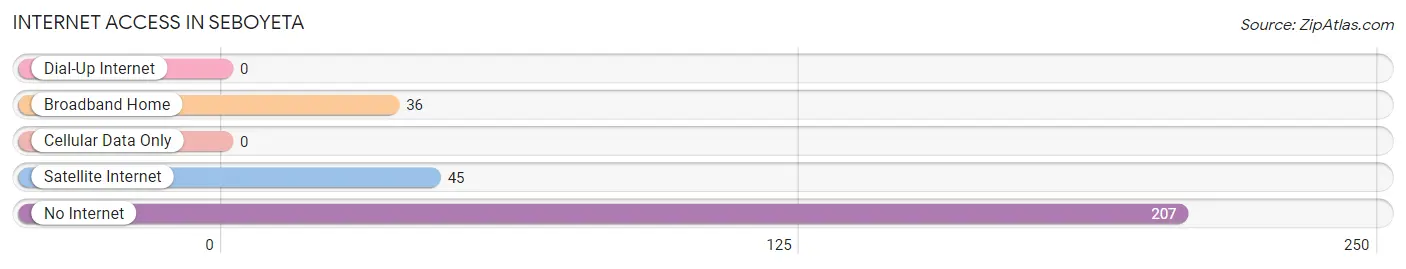
| Internet Type | # Households | % Households |
| Dial-Up Internet | 0 | 0.0% |
| Broadband Home | 36 | 12.5% |
| Cellular Data Only | 0 | 0.0% |
| Satellite Internet | 45 | 15.6% |
| No Internet | 207 | 71.9% |
| Total | 288 | 100.0% |
Seboyeta Summary
Seboyeta is a small unincorporated community located in Cibola County, New Mexico. It is situated in the western part of the state, approximately 25 miles west of Grants and 40 miles east of Gallup. The population of Seboyeta was estimated to be around 200 people in 2020.
History
Seboyeta was founded in 1876 by a group of settlers from the nearby Zuni Pueblo. The settlers named the town after a nearby mountain, Seboyeta Peak. The town was originally a trading post for the Zuni people, and it quickly grew into a small farming community. The town was also known for its sheep and cattle ranching.
In the early 1900s, Seboyeta was a popular stop for travelers on the Santa Fe Trail. The town was also home to a post office, a school, and a few stores.
Geography
Seboyeta is located in the western part of New Mexico, in Cibola County. It is situated in the Zuni Mountains, at an elevation of 6,000 feet. The town is surrounded by the Zuni Indian Reservation, which covers an area of over 1.5 million acres.
The climate in Seboyeta is semi-arid, with hot summers and cold winters. The average annual temperature is around 60 degrees Fahrenheit. The town receives an average of 12 inches of precipitation per year.
Economy
The economy of Seboyeta is largely based on agriculture and ranching. The town is home to several farms and ranches, which produce a variety of crops and livestock. The town is also home to a few small businesses, including a gas station, a grocery store, and a few restaurants.
Demographics
As of the 2010 census, the population of Seboyeta was estimated to be around 200 people. The racial makeup of the town was 95.5% Native American, 2.5% White, and 2% other. The median household income was $25,000, and the median age was 33 years.
Conclusion
Seboyeta is a small unincorporated community located in Cibola County, New Mexico. It was founded in 1876 by a group of settlers from the nearby Zuni Pueblo, and it quickly grew into a small farming community. The town is surrounded by the Zuni Indian Reservation, and the economy is largely based on agriculture and ranching. The population of Seboyeta was estimated to be around 200 people in 2020, and the racial makeup of the town was 95.5% Native American, 2.5% White, and 2% other.
Common Questions
What is Per Capita Income in Seboyeta?
Per Capita income in Seboyeta is $26,501.
What is the Median Family Income in Seboyeta?
Median Family Income in Seboyeta is $72,636.
What is the Median Household income in Seboyeta?
Median Household Income in Seboyeta is $56,397.
What is Inequality or Gini Index in Seboyeta?
Inequality or Gini Index in Seboyeta is 0.21.
What is the Total Population of Seboyeta?
Total Population of Seboyeta is 516.
What is the Total Male Population of Seboyeta?
Total Male Population of Seboyeta is 357.
What is the Total Female Population of Seboyeta?
Total Female Population of Seboyeta is 159.
What is the Ratio of Males per 100 Females in Seboyeta?
There are 224.53 Males per 100 Females in Seboyeta.
What is the Ratio of Females per 100 Males in Seboyeta?
There are 44.54 Females per 100 Males in Seboyeta.
What is the Median Population Age in Seboyeta?
Median Population Age in Seboyeta is 43.5 Years.
What is the Average Family Size in Seboyeta
Average Family Size in Seboyeta is 1.9 People.
What is the Average Household Size in Seboyeta
Average Household Size in Seboyeta is 1.8 People.
How Large is the Labor Force in Seboyeta?
There are 272 People in the Labor Forcein in Seboyeta.
What is the Percentage of People in the Labor Force in Seboyeta?
58.4% of People are in the Labor Force in Seboyeta.
What is the Unemployment Rate in Seboyeta?
Unemployment Rate in Seboyeta is 18.0%.