China Spring, TX Map & Demographics
China Spring Map
China Spring Overview
$27,982
PER CAPITA INCOME
$68,973
AVG FAMILY INCOME
$68,883
AVG HOUSEHOLD INCOME
4.9%
WAGE / INCOME GAP [ % ]
95.1¢/ $1
WAGE / INCOME GAP [ $ ]
0.36
INEQUALITY / GINI INDEX
1,412
TOTAL POPULATION
642
MALE POPULATION
770
FEMALE POPULATION
83.38
MALES / 100 FEMALES
119.94
FEMALES / 100 MALES
35.0
MEDIAN AGE
3.7
AVG FAMILY SIZE
3.4
AVG HOUSEHOLD SIZE
648
LABOR FORCE [ PEOPLE ]
57.1%
PERCENT IN LABOR FORCE
China Spring Zip Codes
China Spring Area Codes
Income in China Spring
Income Overview in China Spring
Per Capita Income in China Spring is $27,982, while median incomes of families and households are $68,973 and $68,883 respectively.
| Characteristic | Number | Measure |
| Per Capita Income | 1,412 | $27,982 |
| Median Family Income | 365 | $68,973 |
| Mean Family Income | 365 | $93,605 |
| Median Household Income | 422 | $68,883 |
| Mean Household Income | 422 | $90,825 |
| Income Deficit | 365 | $0 |
| Wage / Income Gap (%) | 1,412 | 4.91% |
| Wage / Income Gap ($) | 1,412 | 95.09¢ per $1 |
| Gini / Inequality Index | 1,412 | 0.36 |
Earnings by Sex in China Spring
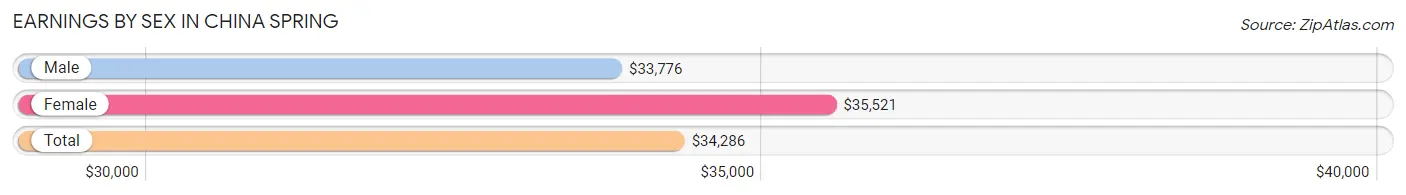
Average Earnings in China Spring are $34,286, $33,776 for men and $35,521 for women, a difference of 4.9%.
| Sex | Number | Average Earnings |
| Male | 276 (41.8%) | $33,776 |
| Female | 384 (58.2%) | $35,521 |
| Total | 660 (100.0%) | $34,286 |
Earnings by Sex by Income Bracket in China Spring
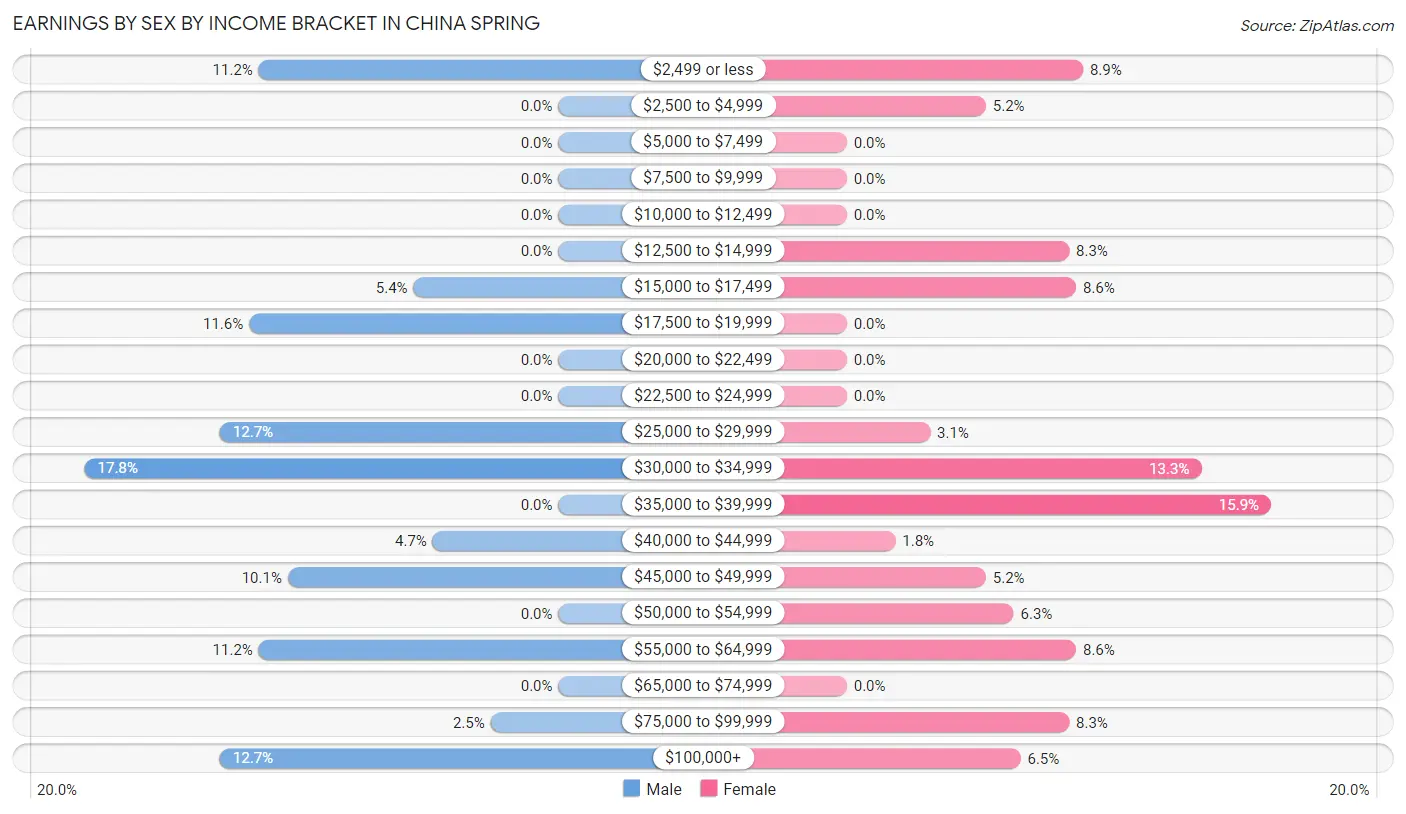
The most common earnings brackets in China Spring are $30,000 to $34,999 for men (49 | 17.7%) and $35,000 to $39,999 for women (61 | 15.9%).
| Income | Male | Female |
| $2,499 or less | 31 (11.2%) | 34 (8.8%) |
| $2,500 to $4,999 | 0 (0.0%) | 20 (5.2%) |
| $5,000 to $7,499 | 0 (0.0%) | 0 (0.0%) |
| $7,500 to $9,999 | 0 (0.0%) | 0 (0.0%) |
| $10,000 to $12,499 | 0 (0.0%) | 0 (0.0%) |
| $12,500 to $14,999 | 0 (0.0%) | 32 (8.3%) |
| $15,000 to $17,499 | 15 (5.4%) | 33 (8.6%) |
| $17,500 to $19,999 | 32 (11.6%) | 0 (0.0%) |
| $20,000 to $22,499 | 0 (0.0%) | 0 (0.0%) |
| $22,500 to $24,999 | 0 (0.0%) | 0 (0.0%) |
| $25,000 to $29,999 | 35 (12.7%) | 12 (3.1%) |
| $30,000 to $34,999 | 49 (17.7%) | 51 (13.3%) |
| $35,000 to $39,999 | 0 (0.0%) | 61 (15.9%) |
| $40,000 to $44,999 | 13 (4.7%) | 7 (1.8%) |
| $45,000 to $49,999 | 28 (10.1%) | 20 (5.2%) |
| $50,000 to $54,999 | 0 (0.0%) | 24 (6.2%) |
| $55,000 to $64,999 | 31 (11.2%) | 33 (8.6%) |
| $65,000 to $74,999 | 0 (0.0%) | 0 (0.0%) |
| $75,000 to $99,999 | 7 (2.5%) | 32 (8.3%) |
| $100,000+ | 35 (12.7%) | 25 (6.5%) |
| Total | 276 (100.0%) | 384 (100.0%) |
Earnings by Sex by Educational Attainment in China Spring
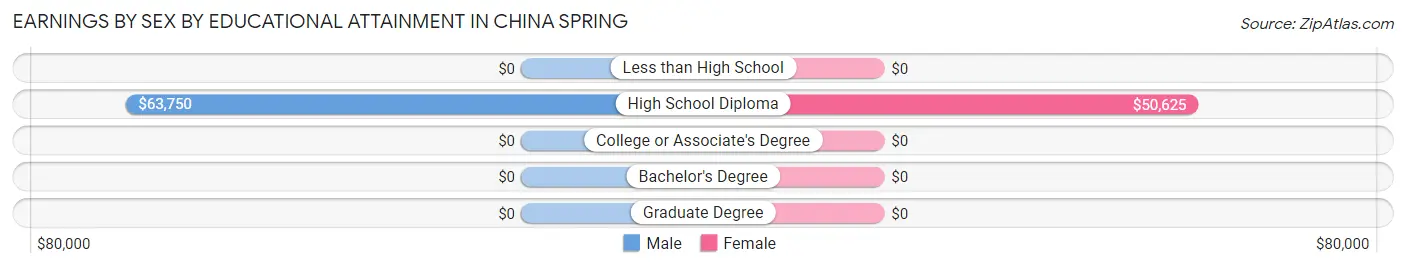
Average earnings in China Spring are $55,000 for men and $36,693 for women, a difference of 33.3%. Men with an educational attainment of high school diploma enjoy the highest average annual earnings of $63,750, while those with high school diploma education earn the least with $63,750. Women with an educational attainment of high school diploma earn the most with the average annual earnings of $50,625, while those with high school diploma education have the smallest earnings of $50,625.
| Educational Attainment | Male Income | Female Income |
| Less than High School | - | - |
| High School Diploma | $63,750 | $50,625 |
| College or Associate's Degree | - | - |
| Bachelor's Degree | - | - |
| Graduate Degree | - | - |
| Total | $55,000 | $36,693 |
Family Income in China Spring
Family Income Brackets in China Spring
According to the China Spring family income data, there are 100 families falling into the $50,000 to $74,999 income range, which is the most common income bracket and makes up 27.4% of all families.
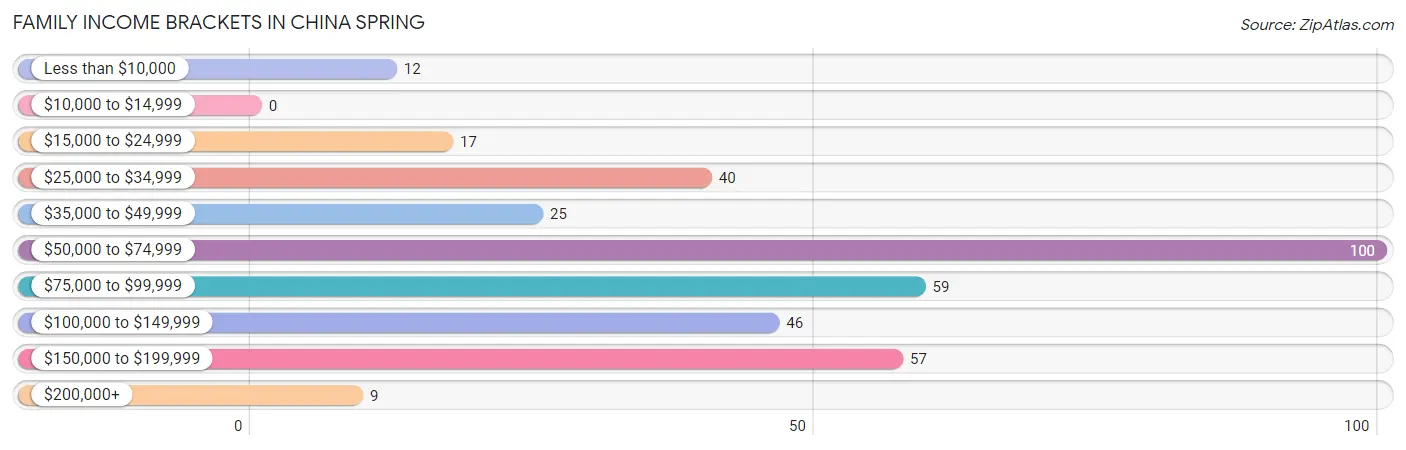
| Income Bracket | # Families | % Families |
| Less than $10,000 | 12 | 3.3% |
| $10,000 to $14,999 | 0 | 0.0% |
| $15,000 to $24,999 | 17 | 4.7% |
| $25,000 to $34,999 | 40 | 11.0% |
| $35,000 to $49,999 | 25 | 6.8% |
| $50,000 to $74,999 | 100 | 27.4% |
| $75,000 to $99,999 | 59 | 16.2% |
| $100,000 to $149,999 | 46 | 12.6% |
| $150,000 to $199,999 | 57 | 15.6% |
| $200,000+ | 9 | 2.5% |
Family Income by Famaliy Size in China Spring
2-person families (133 | 36.4%) account for the highest median family income in China Spring with $53,802 per family, while 2-person families (133 | 36.4%) have the highest median income of $26,901 per family member.
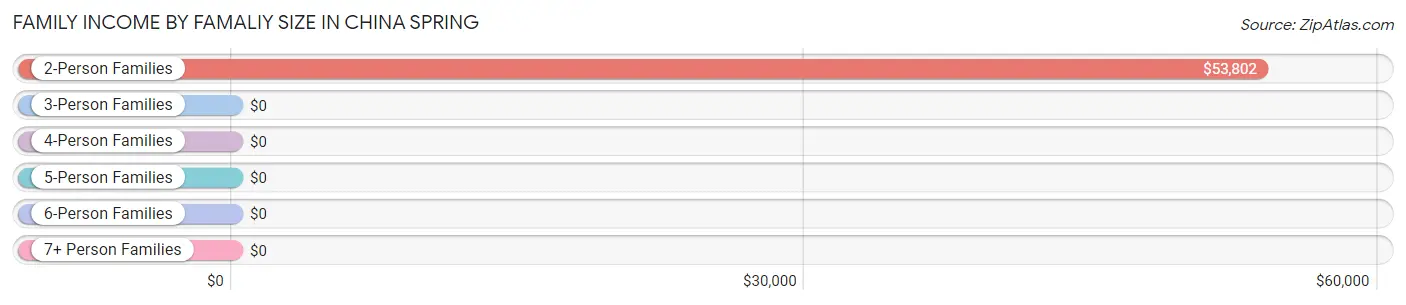
| Income Bracket | # Families | Median Income |
| 2-Person Families | 133 (36.4%) | $53,802 |
| 3-Person Families | 60 (16.4%) | $0 |
| 4-Person Families | 112 (30.7%) | $0 |
| 5-Person Families | 32 (8.8%) | $0 |
| 6-Person Families | 0 (0.0%) | $0 |
| 7+ Person Families | 28 (7.7%) | $0 |
| Total | 365 (100.0%) | $68,973 |
Family Income by Number of Earners in China Spring
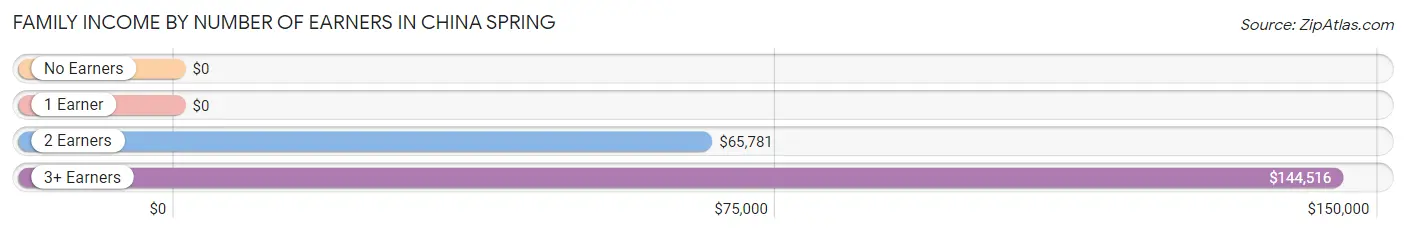
| Number of Earners | # Families | Median Income |
| No Earners | 87 (23.8%) | $0 |
| 1 Earner | 92 (25.2%) | $0 |
| 2 Earners | 110 (30.1%) | $65,781 |
| 3+ Earners | 76 (20.8%) | $144,516 |
| Total | 365 (100.0%) | $68,973 |
Household Income in China Spring
Household Income Brackets in China Spring
With 119 households falling in the category, the $50,000 to $74,999 income range is the most frequent in China Spring, accounting for 28.2% of all households.
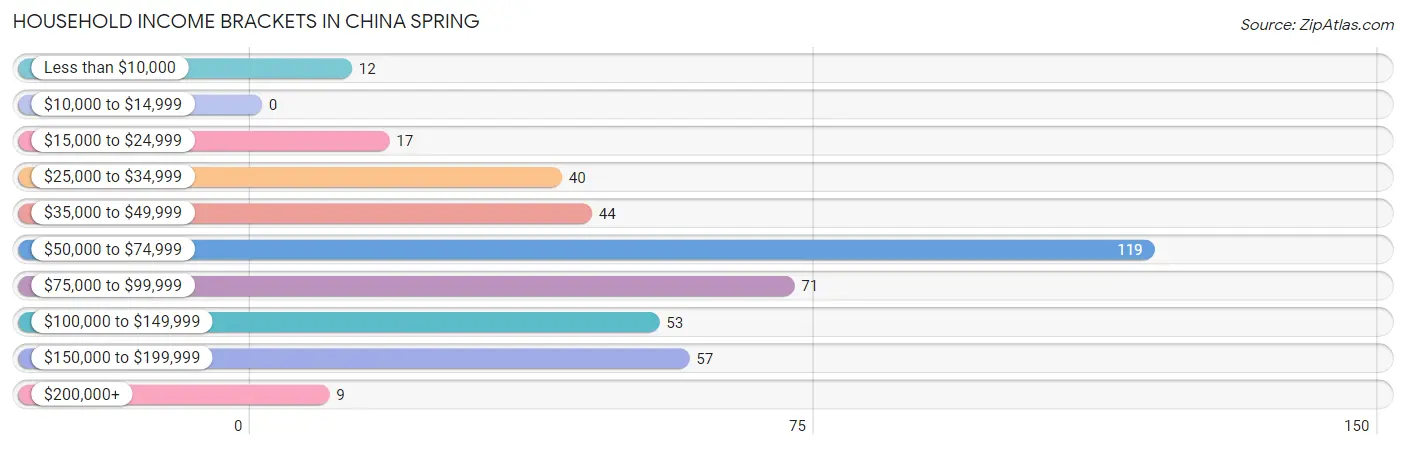
| Income Bracket | # Households | % Households |
| Less than $10,000 | 12 | 2.8% |
| $10,000 to $14,999 | 0 | 0.0% |
| $15,000 to $24,999 | 17 | 4.0% |
| $25,000 to $34,999 | 40 | 9.5% |
| $35,000 to $49,999 | 44 | 10.4% |
| $50,000 to $74,999 | 119 | 28.2% |
| $75,000 to $99,999 | 71 | 16.8% |
| $100,000 to $149,999 | 53 | 12.6% |
| $150,000 to $199,999 | 57 | 13.5% |
| $200,000+ | 9 | 2.1% |
Household Income by Householder Age in China Spring
The median household income in China Spring is $68,883, with the highest median household income of $67,697 found in the 65+ years age bracket for the primary householder. A total of 205 households (48.6%) fall into this category.
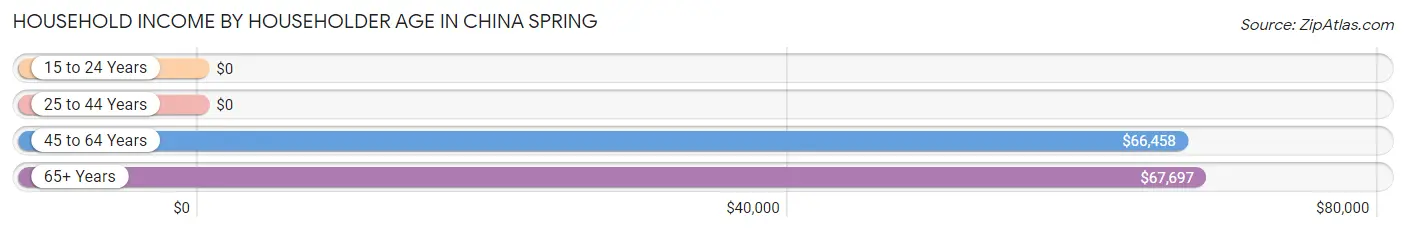
| Income Bracket | # Households | Median Income |
| 15 to 24 Years | 0 (0.0%) | $0 |
| 25 to 44 Years | 89 (21.1%) | $0 |
| 45 to 64 Years | 128 (30.3%) | $66,458 |
| 65+ Years | 205 (48.6%) | $67,697 |
| Total | 422 (100.0%) | $68,883 |
Poverty in China Spring
Income Below Poverty by Sex and Age in China Spring
With 5.6% poverty level for males and 9.1% for females among the residents of China Spring, 25 to 34 year old males and 25 to 34 year old females are the most vulnerable to poverty, with 19 males (29.7%) and 20 females (55.6%) in their respective age groups living below the poverty level.
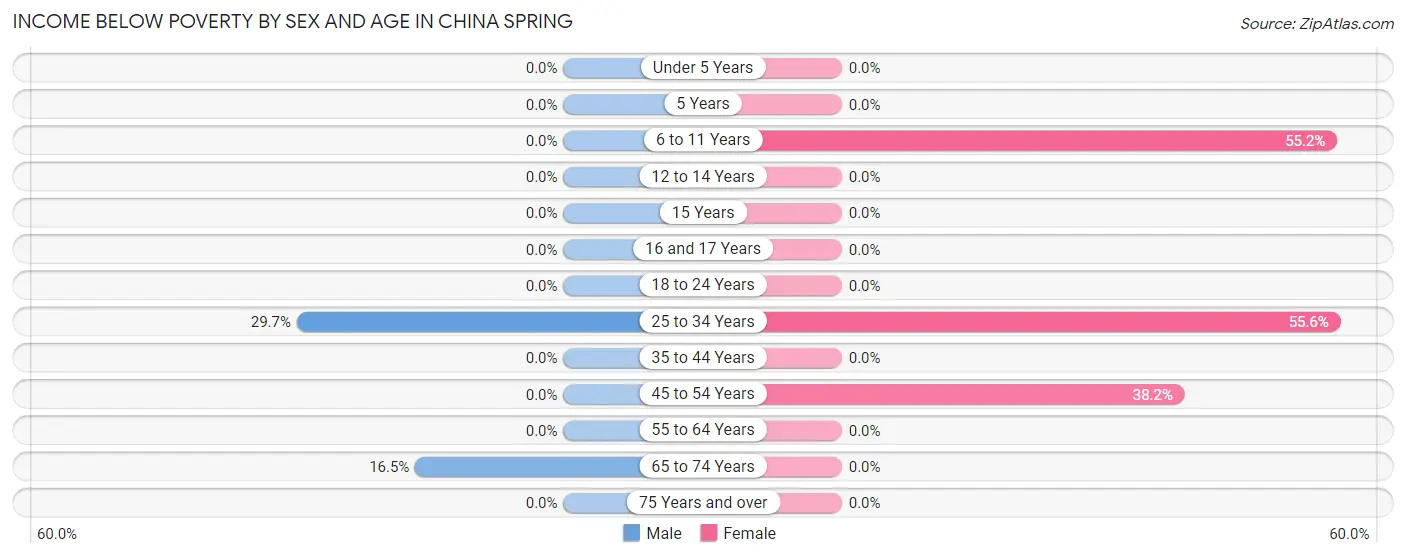
| Age Bracket | Male | Female |
| Under 5 Years | 0 (0.0%) | 0 (0.0%) |
| 5 Years | 0 (0.0%) | 0 (0.0%) |
| 6 to 11 Years | 0 (0.0%) | 16 (55.2%) |
| 12 to 14 Years | 0 (0.0%) | 0 (0.0%) |
| 15 Years | 0 (0.0%) | 0 (0.0%) |
| 16 and 17 Years | 0 (0.0%) | 0 (0.0%) |
| 18 to 24 Years | 0 (0.0%) | 0 (0.0%) |
| 25 to 34 Years | 19 (29.7%) | 20 (55.6%) |
| 35 to 44 Years | 0 (0.0%) | 0 (0.0%) |
| 45 to 54 Years | 0 (0.0%) | 34 (38.2%) |
| 55 to 64 Years | 0 (0.0%) | 0 (0.0%) |
| 65 to 74 Years | 17 (16.5%) | 0 (0.0%) |
| 75 Years and over | 0 (0.0%) | 0 (0.0%) |
| Total | 36 (5.6%) | 70 (9.1%) |
Income Above Poverty by Sex and Age in China Spring
According to the poverty statistics in China Spring, males aged under 5 years and females aged under 5 years are the age groups that are most secure financially, with 100.0% of males and 100.0% of females in these age groups living above the poverty line.
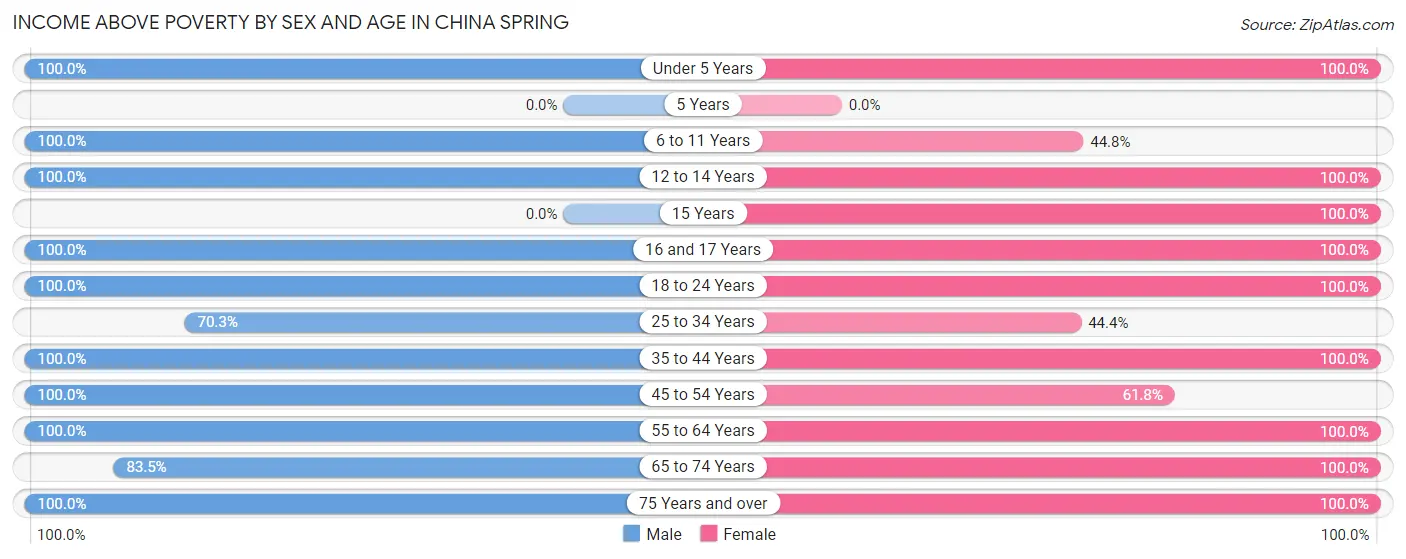
| Age Bracket | Male | Female |
| Under 5 Years | 24 (100.0%) | 29 (100.0%) |
| 5 Years | 0 (0.0%) | 0 (0.0%) |
| 6 to 11 Years | 47 (100.0%) | 13 (44.8%) |
| 12 to 14 Years | 76 (100.0%) | 60 (100.0%) |
| 15 Years | 0 (0.0%) | 13 (100.0%) |
| 16 and 17 Years | 91 (100.0%) | 35 (100.0%) |
| 18 to 24 Years | 118 (100.0%) | 85 (100.0%) |
| 25 to 34 Years | 45 (70.3%) | 16 (44.4%) |
| 35 to 44 Years | 13 (100.0%) | 176 (100.0%) |
| 45 to 54 Years | 31 (100.0%) | 55 (61.8%) |
| 55 to 64 Years | 34 (100.0%) | 48 (100.0%) |
| 65 to 74 Years | 86 (83.5%) | 136 (100.0%) |
| 75 Years and over | 41 (100.0%) | 34 (100.0%) |
| Total | 606 (94.4%) | 700 (90.9%) |
Income Below Poverty Among Married-Couple Families in China Spring
The poverty statistics for married-couple families in China Spring show that 7.9% or 17 of the total 216 families live below the poverty line. Families with no children have the highest poverty rate of 11.5%, comprising of 17 families. On the other hand, families with 1 or 2 children have the lowest poverty rate of 0.0%, which includes 0 families.
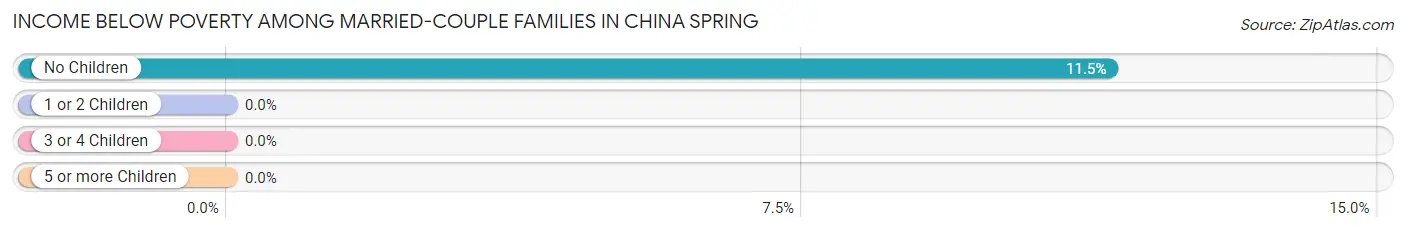
| Children | Above Poverty | Below Poverty |
| No Children | 131 (88.5%) | 17 (11.5%) |
| 1 or 2 Children | 40 (100.0%) | 0 (0.0%) |
| 3 or 4 Children | 0 (0.0%) | 0 (0.0%) |
| 5 or more Children | 28 (100.0%) | 0 (0.0%) |
| Total | 199 (92.1%) | 17 (7.9%) |
Income Below Poverty Among Single-Parent Households in China Spring
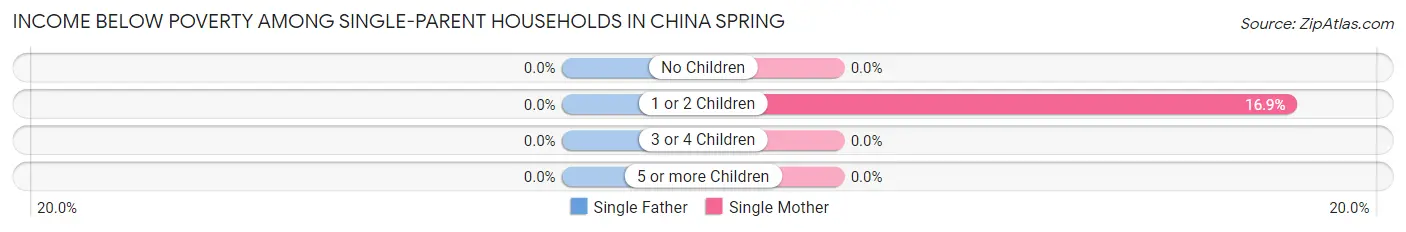
| Children | Single Father | Single Mother |
| No Children | 0 (0.0%) | 0 (0.0%) |
| 1 or 2 Children | 0 (0.0%) | 12 (16.9%) |
| 3 or 4 Children | 0 (0.0%) | 0 (0.0%) |
| 5 or more Children | 0 (0.0%) | 0 (0.0%) |
| Total | 0 (0.0%) | 12 (8.8%) |
Income Below Poverty Among Married-Couple vs Single-Parent Households in China Spring
The poverty data for China Spring shows that 17 of the married-couple family households (7.9%) and 12 of the single-parent households (8.1%) are living below the poverty level. Within the married-couple family households, those with no children have the highest poverty rate, with 17 households (11.5%) falling below the poverty line. Among the single-parent households, those with 1 or 2 children have the highest poverty rate, with 12 household (14.3%) living below poverty.
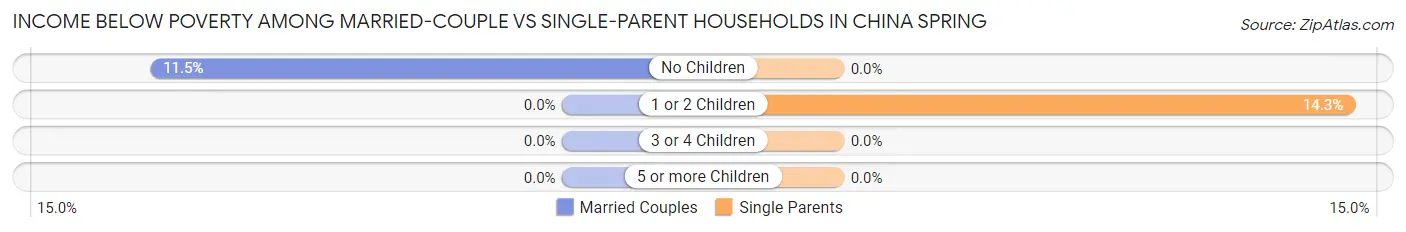
| Children | Married-Couple Families | Single-Parent Households |
| No Children | 17 (11.5%) | 0 (0.0%) |
| 1 or 2 Children | 0 (0.0%) | 12 (14.3%) |
| 3 or 4 Children | 0 (0.0%) | 0 (0.0%) |
| 5 or more Children | 0 (0.0%) | 0 (0.0%) |
| Total | 17 (7.9%) | 12 (8.1%) |
Race in China Spring
The most populous races in China Spring are White / Caucasian (1,412 | 100.0%), and Hispanic or Latino (251 | 17.8%).
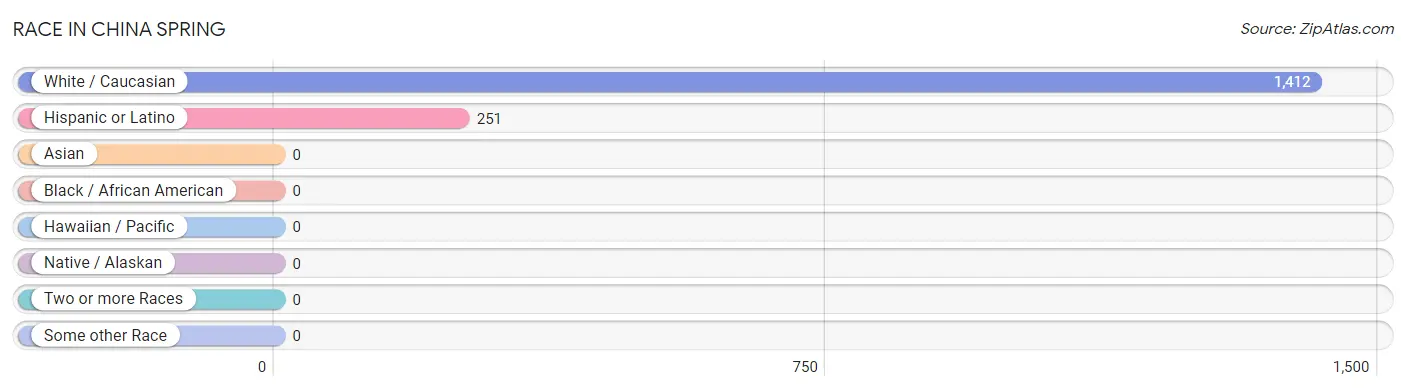
| Race | # Population | % Population |
| Asian | 0 | 0.0% |
| Black / African American | 0 | 0.0% |
| Hawaiian / Pacific | 0 | 0.0% |
| Hispanic or Latino | 251 | 17.8% |
| Native / Alaskan | 0 | 0.0% |
| White / Caucasian | 1,412 | 100.0% |
| Two or more Races | 0 | 0.0% |
| Some other Race | 0 | 0.0% |
| Total | 1,412 | 100.0% |
Ancestry in China Spring
The most populous ancestries reported in China Spring are English (308 | 21.8%), Mexican (251 | 17.8%), Irish (154 | 10.9%), German (142 | 10.1%), and European (78 | 5.5%), together accounting for 66.1% of all China Spring residents.
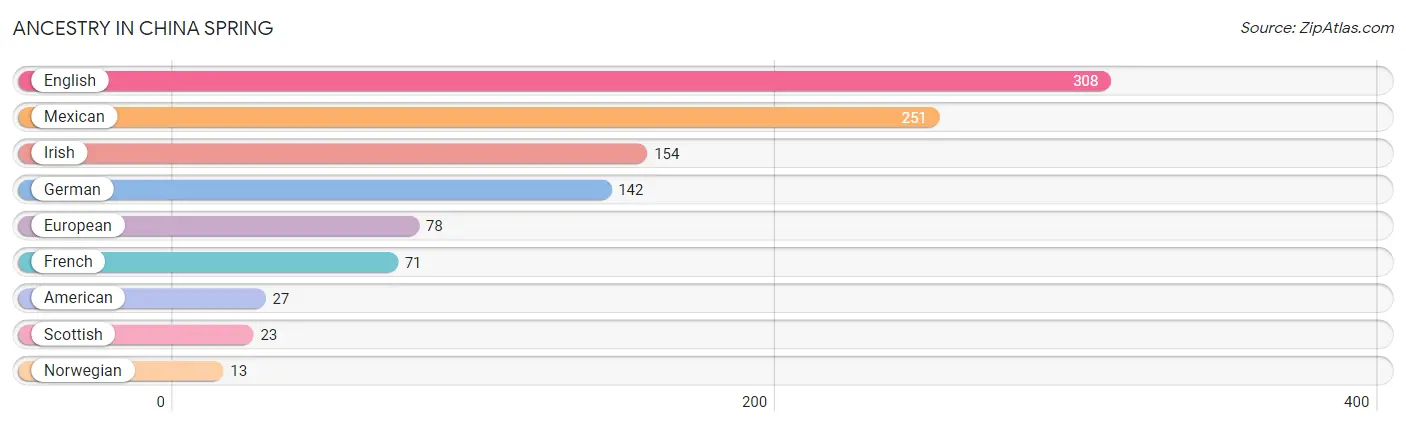
| Ancestry | # Population | % Population |
| American | 27 | 1.9% |
| English | 308 | 21.8% |
| European | 78 | 5.5% |
| French | 71 | 5.0% |
| German | 142 | 10.1% |
| Irish | 154 | 10.9% |
| Mexican | 251 | 17.8% |
| Norwegian | 13 | 0.9% |
| Scottish | 23 | 1.6% | View All 9 Rows |
Immigrants in China Spring

| Immigration Origin | # Population | % Population | View All 0 Rows |
Sex and Age in China Spring
Sex and Age in China Spring
The most populous age groups in China Spring are 15 to 19 Years (123 | 19.2%) for men and 35 to 39 Years (93 | 12.1%) for women.
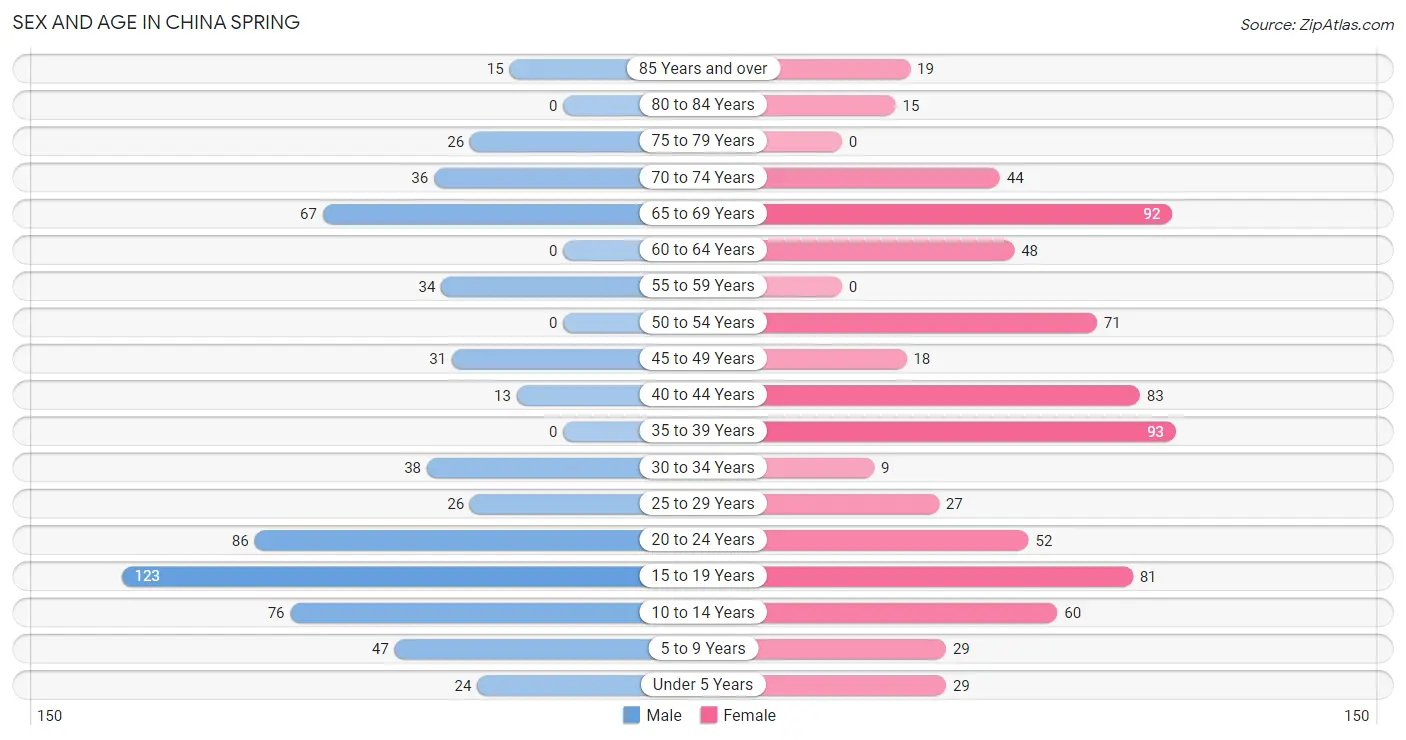
| Age Bracket | Male | Female |
| Under 5 Years | 24 (3.7%) | 29 (3.8%) |
| 5 to 9 Years | 47 (7.3%) | 29 (3.8%) |
| 10 to 14 Years | 76 (11.8%) | 60 (7.8%) |
| 15 to 19 Years | 123 (19.2%) | 81 (10.5%) |
| 20 to 24 Years | 86 (13.4%) | 52 (6.8%) |
| 25 to 29 Years | 26 (4.1%) | 27 (3.5%) |
| 30 to 34 Years | 38 (5.9%) | 9 (1.2%) |
| 35 to 39 Years | 0 (0.0%) | 93 (12.1%) |
| 40 to 44 Years | 13 (2.0%) | 83 (10.8%) |
| 45 to 49 Years | 31 (4.8%) | 18 (2.3%) |
| 50 to 54 Years | 0 (0.0%) | 71 (9.2%) |
| 55 to 59 Years | 34 (5.3%) | 0 (0.0%) |
| 60 to 64 Years | 0 (0.0%) | 48 (6.2%) |
| 65 to 69 Years | 67 (10.4%) | 92 (11.9%) |
| 70 to 74 Years | 36 (5.6%) | 44 (5.7%) |
| 75 to 79 Years | 26 (4.1%) | 0 (0.0%) |
| 80 to 84 Years | 0 (0.0%) | 15 (1.9%) |
| 85 Years and over | 15 (2.3%) | 19 (2.5%) |
| Total | 642 (100.0%) | 770 (100.0%) |
Families and Households in China Spring
Median Family Size in China Spring
The median family size in China Spring is 3.69 persons per family, with single male/father families (13 | 3.6%) accounting for the largest median family size of 4.54 persons per family. On the other hand, married-couple families (216 | 59.2%) represent the smallest median family size with 3.46 persons per family.
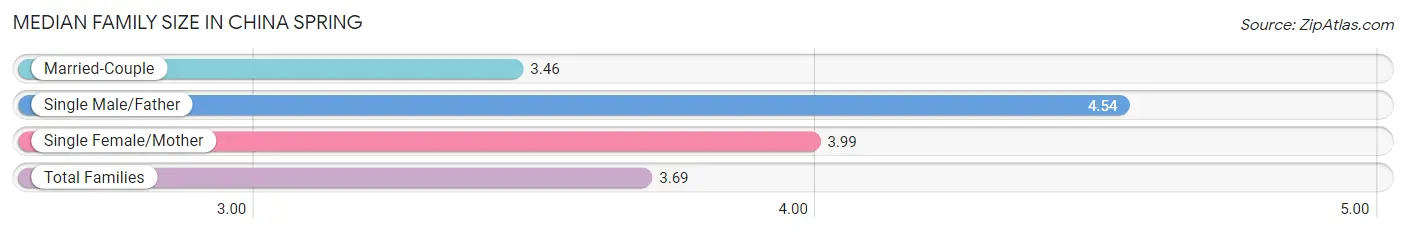
| Family Type | # Families | Family Size |
| Married-Couple | 216 (59.2%) | 3.46 |
| Single Male/Father | 13 (3.6%) | 4.54 |
| Single Female/Mother | 136 (37.3%) | 3.99 |
| Total Families | 365 (100.0%) | 3.69 |
Median Household Size in China Spring
The median household size in China Spring is 3.35 persons per household, with single male/father households (13 | 3.1%) accounting for the largest median household size of 4.54 persons per household. non-family households (57 | 13.5%) represent the smallest median household size with 1.12 persons per household.
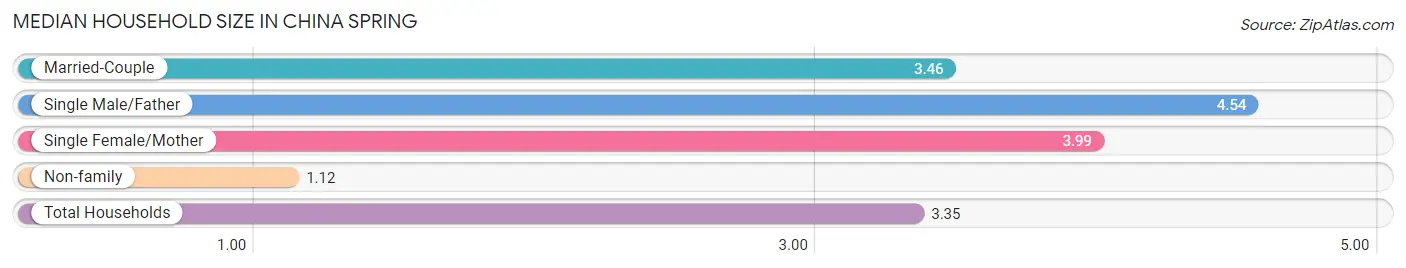
| Household Type | # Households | Household Size |
| Married-Couple | 216 (51.2%) | 3.46 |
| Single Male/Father | 13 (3.1%) | 4.54 |
| Single Female/Mother | 136 (32.2%) | 3.99 |
| Non-family | 57 (13.5%) | 1.12 |
| Total Households | 422 (100.0%) | 3.35 |
Household Size by Marriage Status in China Spring
Out of a total of 422 households in China Spring, 365 (86.5%) are family households, while 57 (13.5%) are nonfamily households. The most numerous type of family households are 2-person households, comprising 133, and the most common type of nonfamily households are 1-person households, comprising 50.
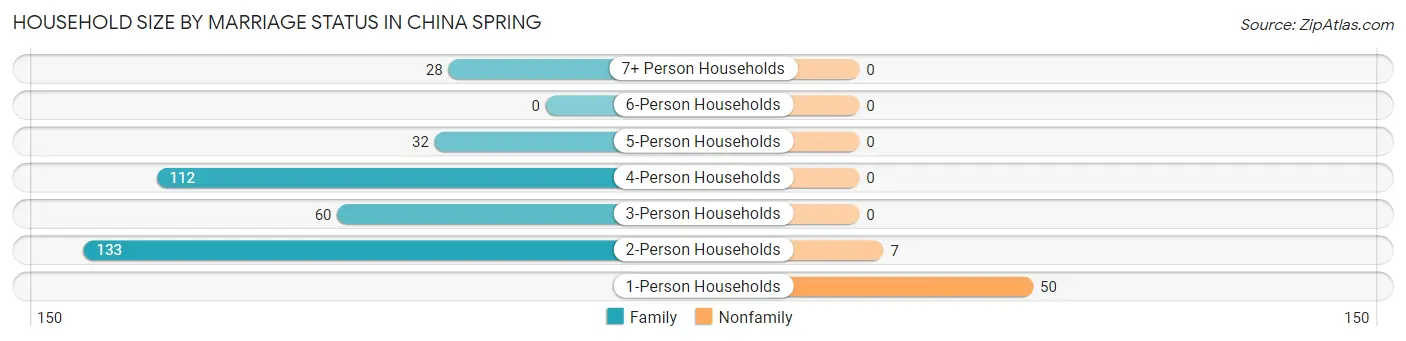
| Household Size | Family Households | Nonfamily Households |
| 1-Person Households | - | 50 (11.8%) |
| 2-Person Households | 133 (31.5%) | 7 (1.7%) |
| 3-Person Households | 60 (14.2%) | 0 (0.0%) |
| 4-Person Households | 112 (26.5%) | 0 (0.0%) |
| 5-Person Households | 32 (7.6%) | 0 (0.0%) |
| 6-Person Households | 0 (0.0%) | 0 (0.0%) |
| 7+ Person Households | 28 (6.6%) | 0 (0.0%) |
| Total | 365 (86.5%) | 57 (13.5%) |
Female Fertility in China Spring
Fertility by Age in China Spring
| Age Bracket | Women with Births | Births / 1,000 Women |
| 15 to 19 years | 0 (0.0%) | 0.0 |
| 20 to 34 years | 0 (0.0%) | 0.0 |
| 35 to 50 years | 0 (0.0%) | 0.0 |
| Total | 0 (0.0%) | 0.0 |
Fertility by Age by Marriage Status in China Spring
| Age Bracket | Married | Unmarried |
| 15 to 19 years | 0 (0.0%) | 0 (0.0%) |
| 20 to 34 years | 0 (0.0%) | 0 (0.0%) |
| 35 to 50 years | 0 (0.0%) | 0 (0.0%) |
| Total | 0 (0.0%) | 0 (0.0%) |
Fertility by Education in China Spring
| Educational Attainment | Women with Births | Births / 1,000 Women |
| Less than High School | 0 (0.0%) | 0.0 |
| High School Diploma | 0 (0.0%) | 0.0 |
| College or Associate's Degree | 0 (0.0%) | 0.0 |
| Bachelor's Degree | 0 (0.0%) | 0.0 |
| Graduate Degree | 0 (0.0%) | 0.0 |
| Total | 0 (0.0%) | 0.0 |
Fertility by Education by Marriage Status in China Spring
| Educational Attainment | Married | Unmarried |
| Less than High School | 0 (0.0%) | 0 (0.0%) |
| High School Diploma | 0 (0.0%) | 0 (0.0%) |
| College or Associate's Degree | 0 (0.0%) | 0 (0.0%) |
| Bachelor's Degree | 0 (0.0%) | 0 (0.0%) |
| Graduate Degree | 0 (0.0%) | 0 (0.0%) |
| Total | 0 (0.0%) | 0 (0.0%) |
Employment Characteristics in China Spring
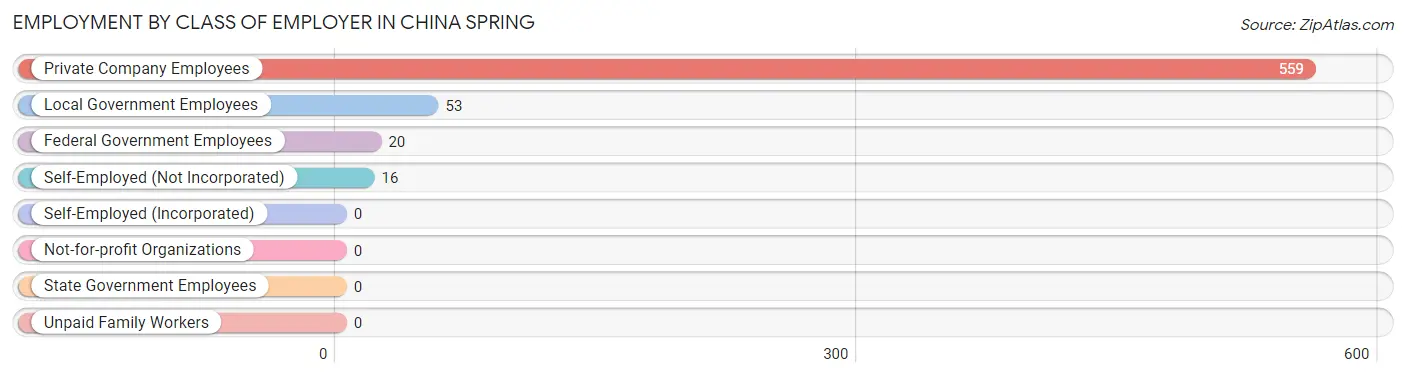
Employment by Class of Employer in China Spring
Among the 648 employed individuals in China Spring, private company employees (559 | 86.3%), local government employees (53 | 8.2%), and federal government employees (20 | 3.1%) make up the most common classes of employment.
| Employer Class | # Employees | % Employees |
| Private Company Employees | 559 | 86.3% |
| Self-Employed (Incorporated) | 0 | 0.0% |
| Self-Employed (Not Incorporated) | 16 | 2.5% |
| Not-for-profit Organizations | 0 | 0.0% |
| Local Government Employees | 53 | 8.2% |
| State Government Employees | 0 | 0.0% |
| Federal Government Employees | 20 | 3.1% |
| Unpaid Family Workers | 0 | 0.0% |
| Total | 648 | 100.0% |
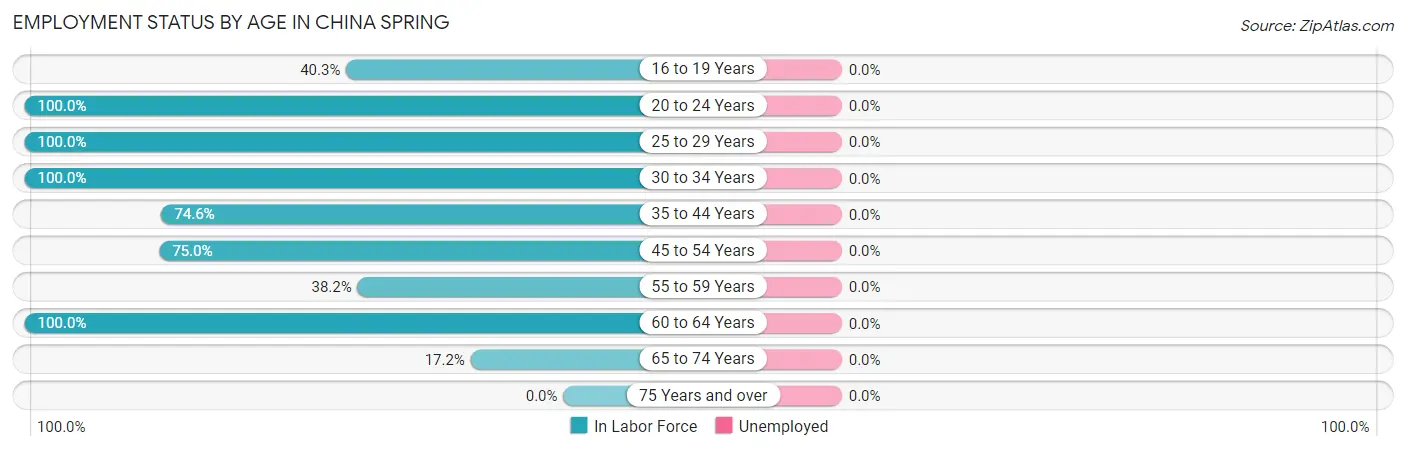
Employment Status by Age in China Spring
| Age Bracket | In Labor Force | Unemployed |
| 16 to 19 Years | 77 (40.3%) | 0 (0.0%) |
| 20 to 24 Years | 138 (100.0%) | 0 (0.0%) |
| 25 to 29 Years | 53 (100.0%) | 0 (0.0%) |
| 30 to 34 Years | 47 (100.0%) | 0 (0.0%) |
| 35 to 44 Years | 141 (74.6%) | 0 (0.0%) |
| 45 to 54 Years | 90 (75.0%) | 0 (0.0%) |
| 55 to 59 Years | 13 (38.2%) | 0 (0.0%) |
| 60 to 64 Years | 48 (100.0%) | 0 (0.0%) |
| 65 to 74 Years | 41 (17.2%) | 0 (0.0%) |
| 75 Years and over | 0 (0.0%) | 0 (0.0%) |
| Total | 648 (57.1%) | 0 (0.0%) |
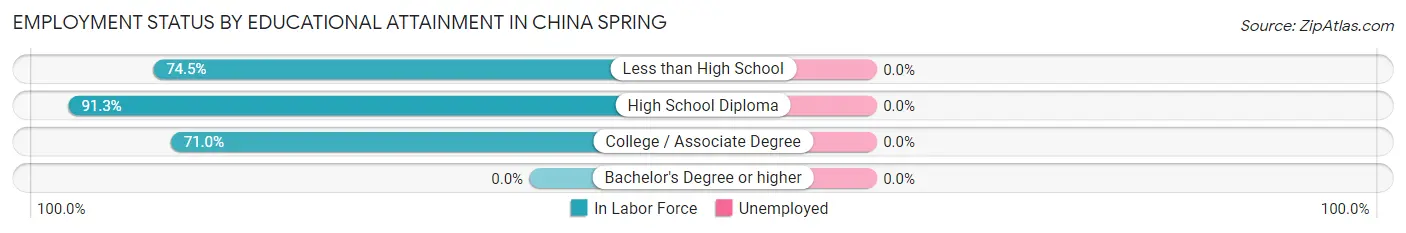
Employment Status by Educational Attainment in China Spring
| Educational Attainment | In Labor Force | Unemployed |
| Less than High School | 35 (74.5%) | 0 (0.0%) |
| High School Diploma | 188 (91.3%) | 0 (0.0%) |
| College / Associate Degree | 169 (71.0%) | 0 (0.0%) |
| Bachelor's Degree or higher | 0 (0.0%) | 0 (0.0%) |
| Total | 392 (79.8%) | 0 (0.0%) |
Employment Occupations by Sex in China Spring
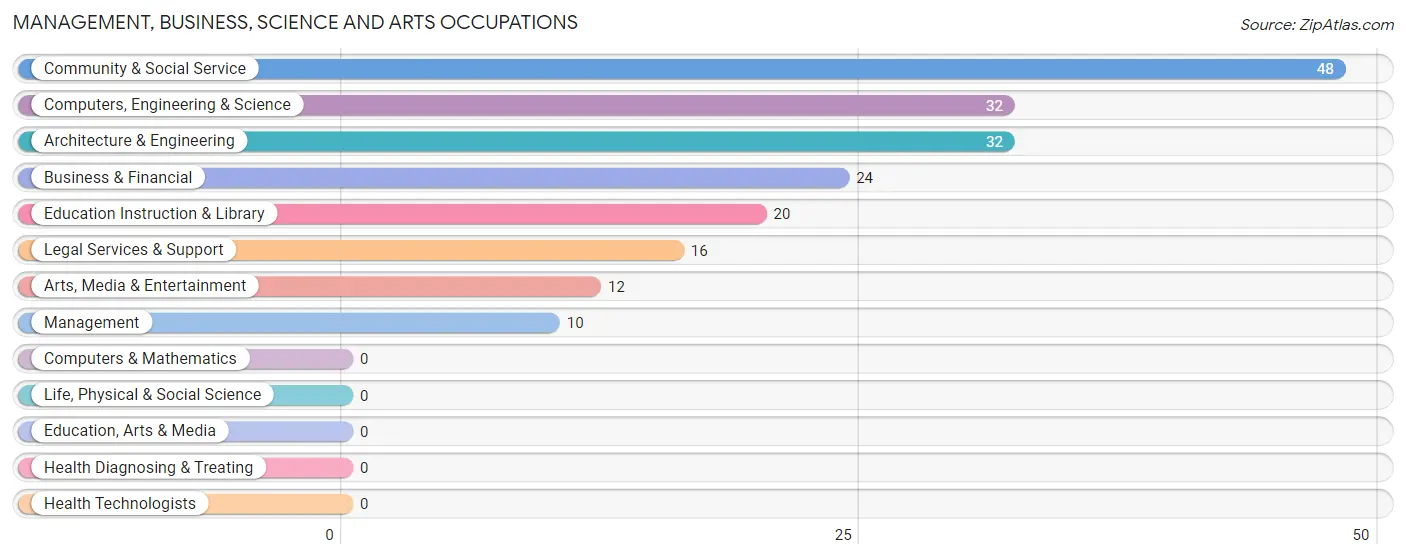
Management, Business, Science and Arts Occupations
The most common Management, Business, Science and Arts occupations in China Spring are Community & Social Service (48 | 7.4%), Computers, Engineering & Science (32 | 4.9%), Architecture & Engineering (32 | 4.9%), Business & Financial (24 | 3.7%), and Education Instruction & Library (20 | 3.1%).
Management, Business, Science and Arts Occupations by Sex
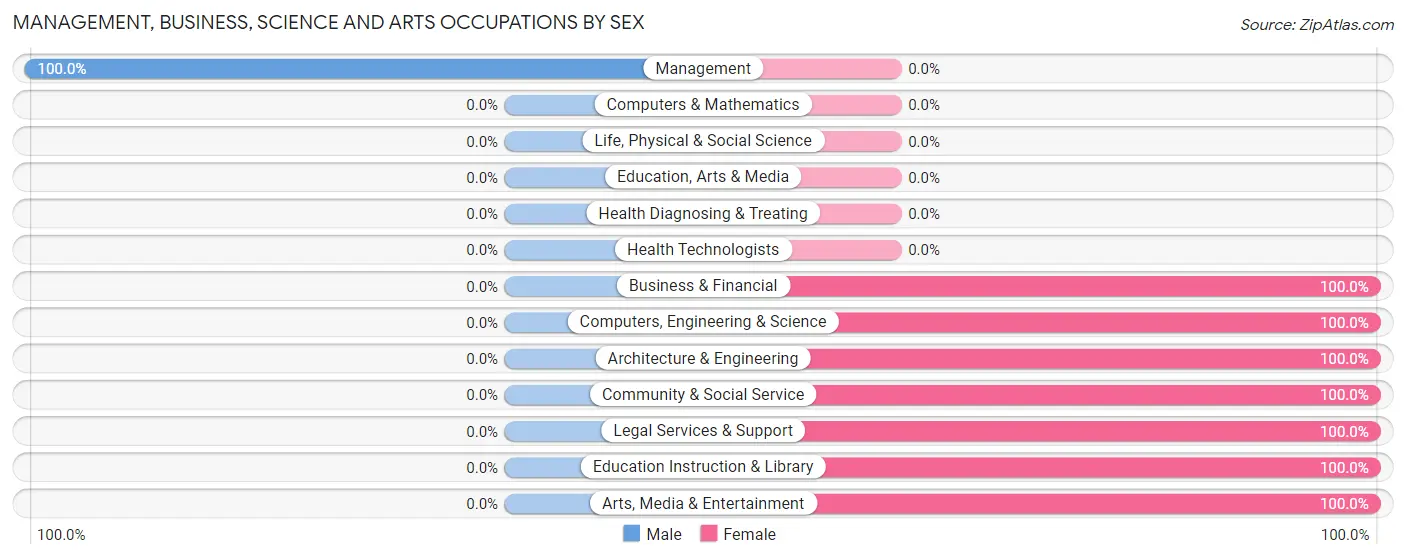
| Occupation | Male | Female |
| Management | 10 (100.0%) | 0 (0.0%) |
| Business & Financial | 0 (0.0%) | 24 (100.0%) |
| Computers, Engineering & Science | 0 (0.0%) | 32 (100.0%) |
| Computers & Mathematics | 0 (0.0%) | 0 (0.0%) |
| Architecture & Engineering | 0 (0.0%) | 32 (100.0%) |
| Life, Physical & Social Science | 0 (0.0%) | 0 (0.0%) |
| Community & Social Service | 0 (0.0%) | 48 (100.0%) |
| Education, Arts & Media | 0 (0.0%) | 0 (0.0%) |
| Legal Services & Support | 0 (0.0%) | 16 (100.0%) |
| Education Instruction & Library | 0 (0.0%) | 20 (100.0%) |
| Arts, Media & Entertainment | 0 (0.0%) | 12 (100.0%) |
| Health Diagnosing & Treating | 0 (0.0%) | 0 (0.0%) |
| Health Technologists | 0 (0.0%) | 0 (0.0%) |
| Total (Category) | 10 (8.8%) | 104 (91.2%) |
| Total (Overall) | 276 (42.6%) | 372 (57.4%) |
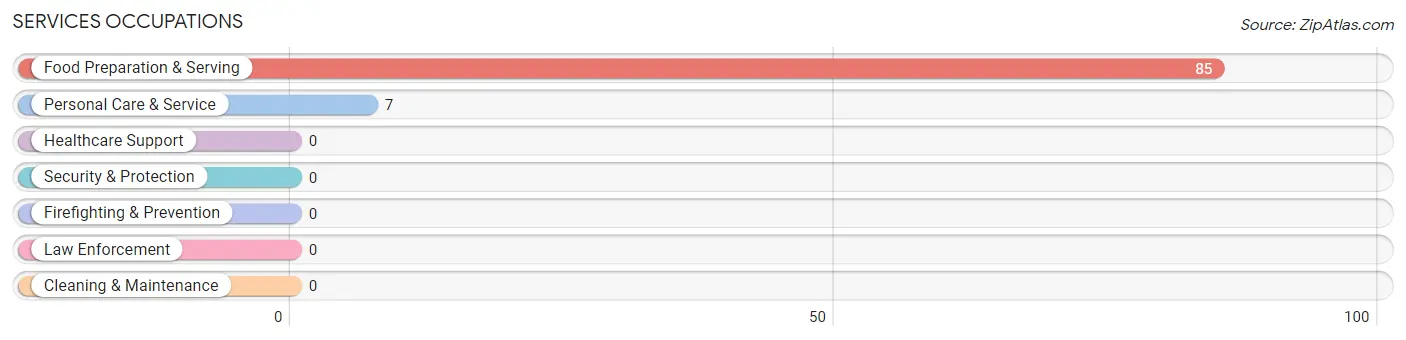
Services Occupations
The most common Services occupations in China Spring are Food Preparation & Serving (85 | 13.1%), and Personal Care & Service (7 | 1.1%).
Services Occupations by Sex
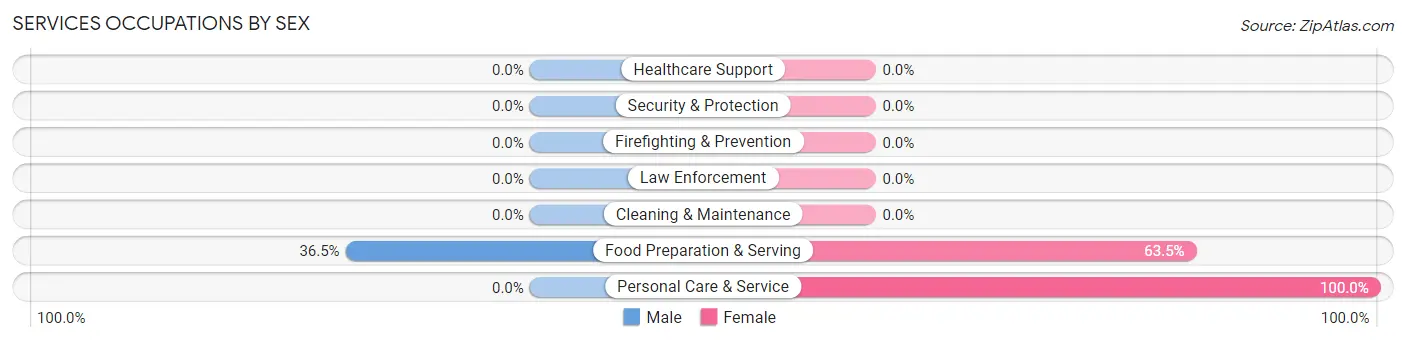
| Occupation | Male | Female |
| Healthcare Support | 0 (0.0%) | 0 (0.0%) |
| Security & Protection | 0 (0.0%) | 0 (0.0%) |
| Firefighting & Prevention | 0 (0.0%) | 0 (0.0%) |
| Law Enforcement | 0 (0.0%) | 0 (0.0%) |
| Food Preparation & Serving | 31 (36.5%) | 54 (63.5%) |
| Cleaning & Maintenance | 0 (0.0%) | 0 (0.0%) |
| Personal Care & Service | 0 (0.0%) | 7 (100.0%) |
| Total (Category) | 31 (33.7%) | 61 (66.3%) |
| Total (Overall) | 276 (42.6%) | 372 (57.4%) |
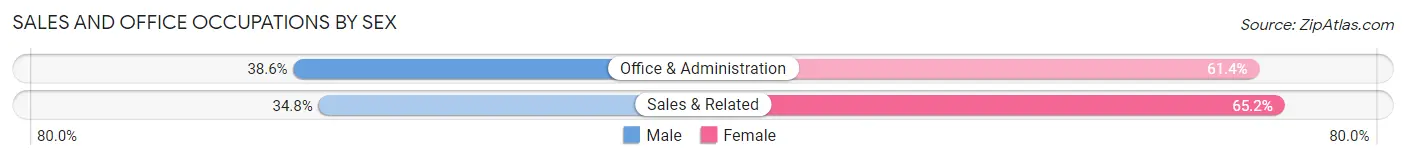
Sales and Office Occupations
The most common Sales and Office occupations in China Spring are Office & Administration (132 | 20.4%), and Sales & Related (92 | 14.2%).

Sales and Office Occupations by Sex
| Occupation | Male | Female |
| Sales & Related | 32 (34.8%) | 60 (65.2%) |
| Office & Administration | 51 (38.6%) | 81 (61.4%) |
| Total (Category) | 83 (37.0%) | 141 (62.9%) |
| Total (Overall) | 276 (42.6%) | 372 (57.4%) |
Natural Resources, Construction and Maintenance Occupations
The most common Natural Resources, Construction and Maintenance occupations in China Spring are Installation, Maintenance & Repair (35 | 5.4%), and Construction & Extraction (13 | 2.0%).
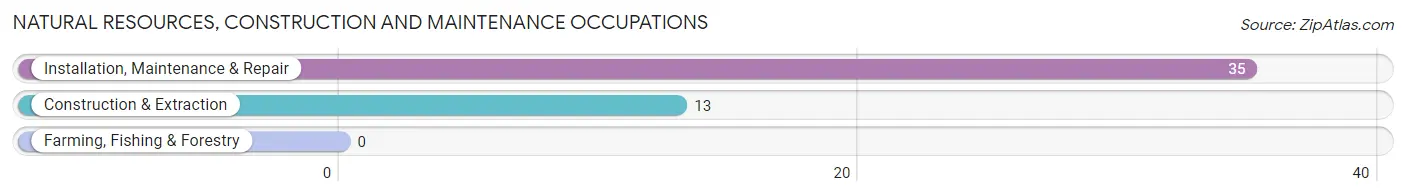
Natural Resources, Construction and Maintenance Occupations by Sex
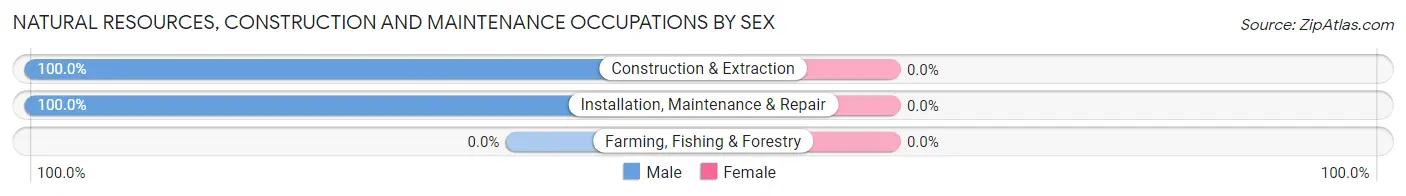
| Occupation | Male | Female |
| Farming, Fishing & Forestry | 0 (0.0%) | 0 (0.0%) |
| Construction & Extraction | 13 (100.0%) | 0 (0.0%) |
| Installation, Maintenance & Repair | 35 (100.0%) | 0 (0.0%) |
| Total (Category) | 48 (100.0%) | 0 (0.0%) |
| Total (Overall) | 276 (42.6%) | 372 (57.4%) |
Production, Transportation and Moving Occupations
The most common Production, Transportation and Moving occupations in China Spring are Transportation (125 | 19.3%), Material Moving (32 | 4.9%), and Production (13 | 2.0%).
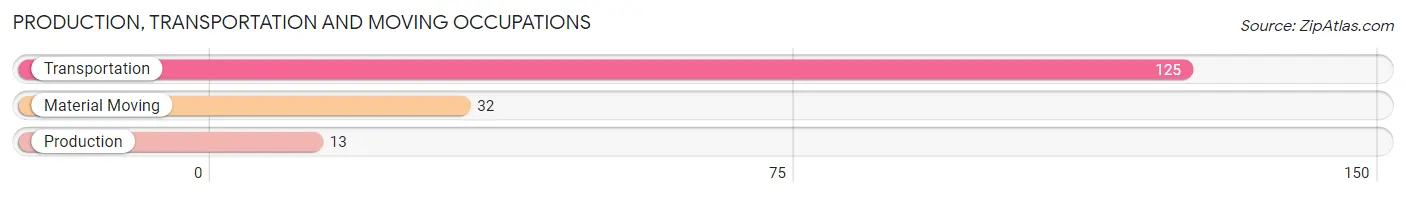
Production, Transportation and Moving Occupations by Sex
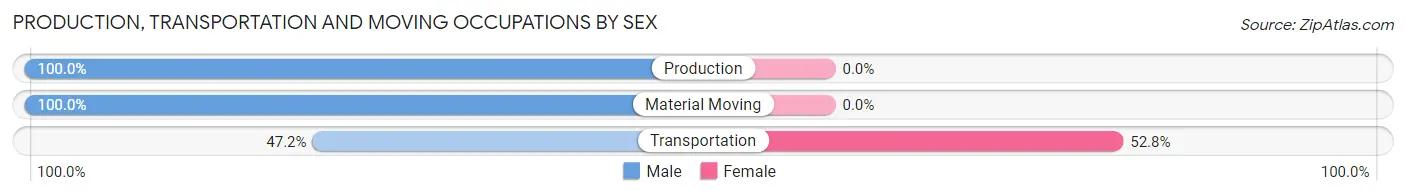
| Occupation | Male | Female |
| Production | 13 (100.0%) | 0 (0.0%) |
| Transportation | 59 (47.2%) | 66 (52.8%) |
| Material Moving | 32 (100.0%) | 0 (0.0%) |
| Total (Category) | 104 (61.2%) | 66 (38.8%) |
| Total (Overall) | 276 (42.6%) | 372 (57.4%) |
Employment Industries by Sex in China Spring
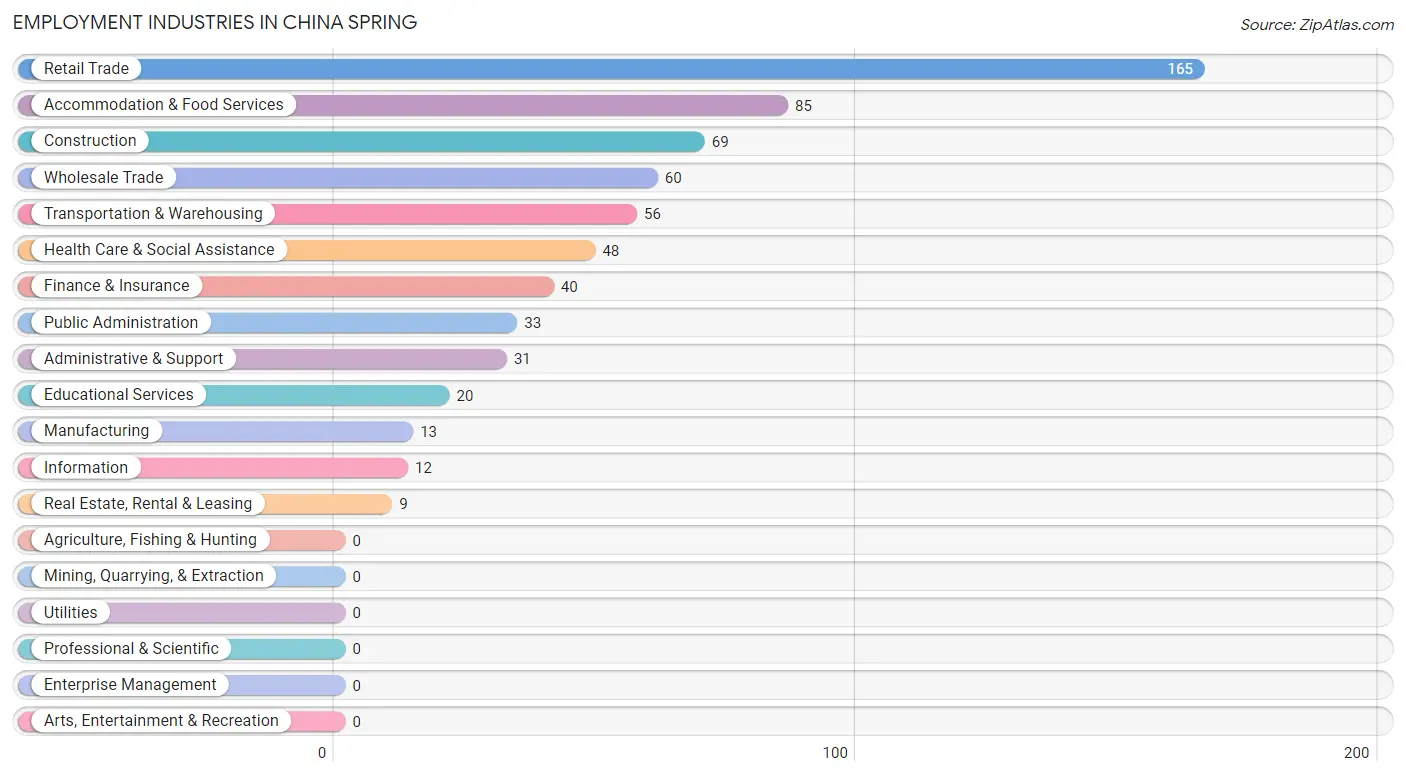
Employment Industries in China Spring
The major employment industries in China Spring include Retail Trade (165 | 25.5%), Accommodation & Food Services (85 | 13.1%), Construction (69 | 10.6%), Wholesale Trade (60 | 9.3%), and Transportation & Warehousing (56 | 8.6%).
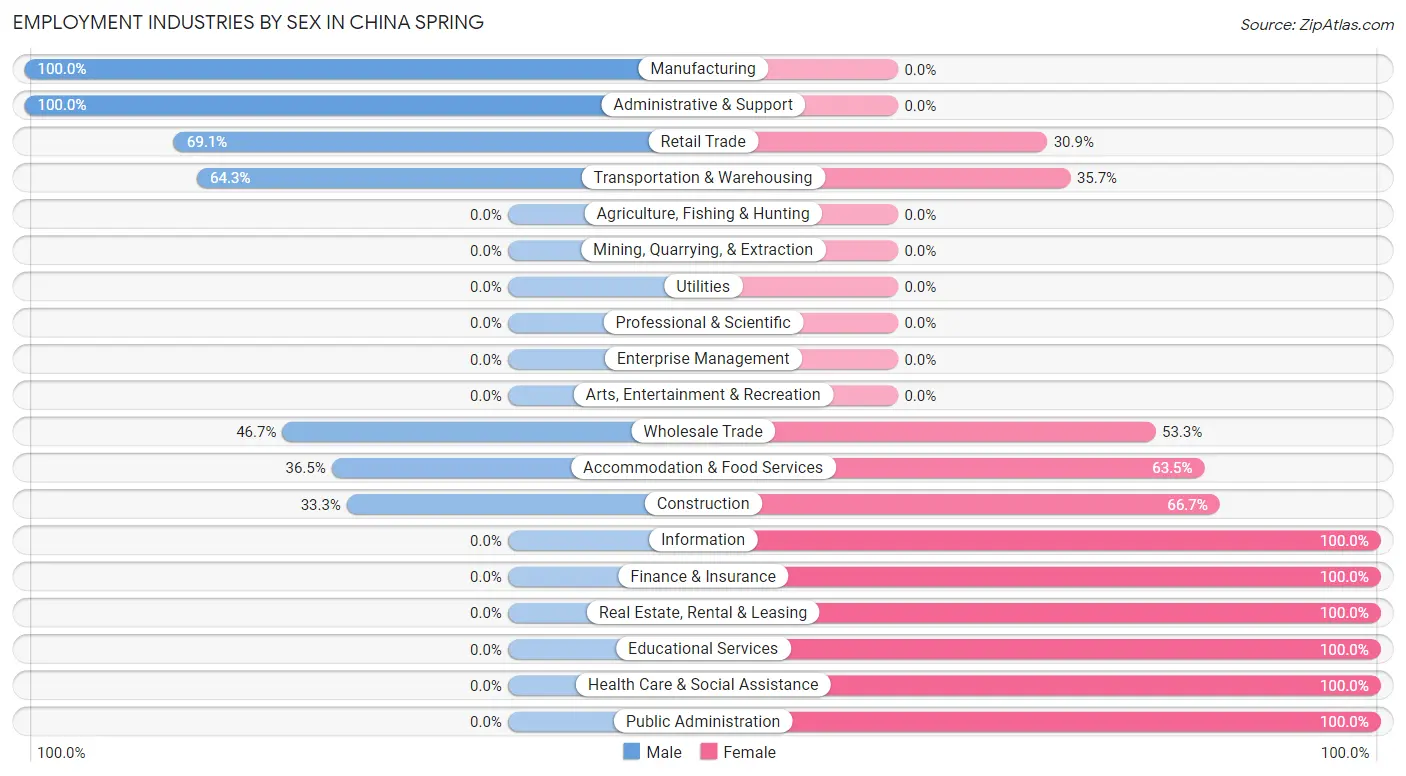
Employment Industries by Sex in China Spring
The China Spring industries that see more men than women are Manufacturing (100.0%), Administrative & Support (100.0%), and Retail Trade (69.1%), whereas the industries that tend to have a higher number of women are Information (100.0%), Finance & Insurance (100.0%), and Real Estate, Rental & Leasing (100.0%).
| Industry | Male | Female |
| Agriculture, Fishing & Hunting | 0 (0.0%) | 0 (0.0%) |
| Mining, Quarrying, & Extraction | 0 (0.0%) | 0 (0.0%) |
| Construction | 23 (33.3%) | 46 (66.7%) |
| Manufacturing | 13 (100.0%) | 0 (0.0%) |
| Wholesale Trade | 28 (46.7%) | 32 (53.3%) |
| Retail Trade | 114 (69.1%) | 51 (30.9%) |
| Transportation & Warehousing | 36 (64.3%) | 20 (35.7%) |
| Utilities | 0 (0.0%) | 0 (0.0%) |
| Information | 0 (0.0%) | 12 (100.0%) |
| Finance & Insurance | 0 (0.0%) | 40 (100.0%) |
| Real Estate, Rental & Leasing | 0 (0.0%) | 9 (100.0%) |
| Professional & Scientific | 0 (0.0%) | 0 (0.0%) |
| Enterprise Management | 0 (0.0%) | 0 (0.0%) |
| Administrative & Support | 31 (100.0%) | 0 (0.0%) |
| Educational Services | 0 (0.0%) | 20 (100.0%) |
| Health Care & Social Assistance | 0 (0.0%) | 48 (100.0%) |
| Arts, Entertainment & Recreation | 0 (0.0%) | 0 (0.0%) |
| Accommodation & Food Services | 31 (36.5%) | 54 (63.5%) |
| Public Administration | 0 (0.0%) | 33 (100.0%) |
| Total | 276 (42.6%) | 372 (57.4%) |
Education in China Spring
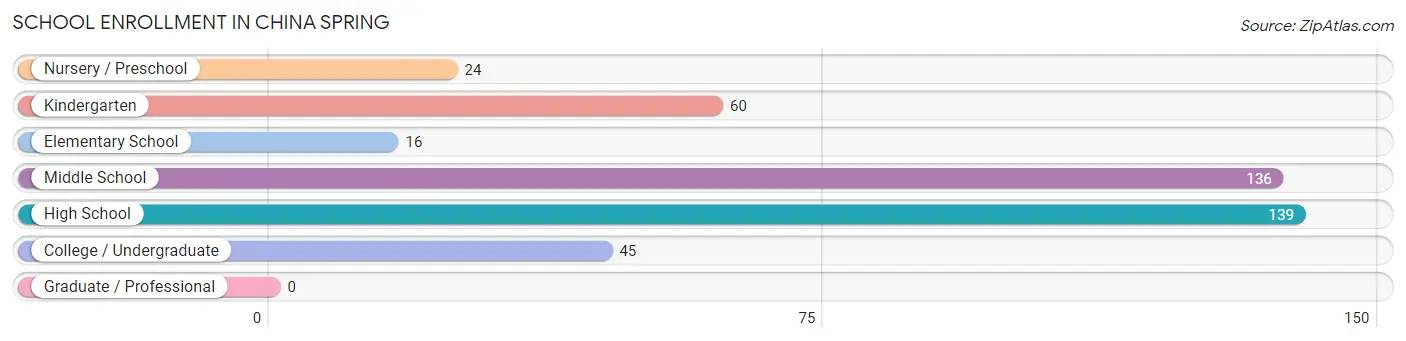
School Enrollment in China Spring
The most common levels of schooling among the 420 students in China Spring are high school (139 | 33.1%), middle school (136 | 32.4%), and kindergarten (60 | 14.3%).
| School Level | # Students | % Students |
| Nursery / Preschool | 24 | 5.7% |
| Kindergarten | 60 | 14.3% |
| Elementary School | 16 | 3.8% |
| Middle School | 136 | 32.4% |
| High School | 139 | 33.1% |
| College / Undergraduate | 45 | 10.7% |
| Graduate / Professional | 0 | 0.0% |
| Total | 420 | 100.0% |
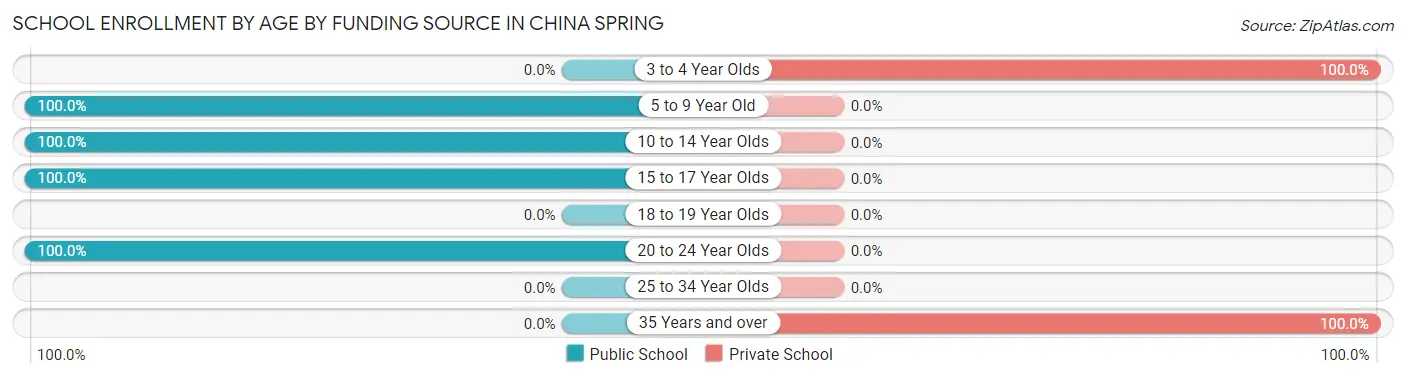
School Enrollment by Age by Funding Source in China Spring
Out of a total of 420 students who are enrolled in schools in China Spring, 54 (12.9%) attend a private institution, while the remaining 366 (87.1%) are enrolled in public schools. The age group of 3 to 4 year olds has the highest likelihood of being enrolled in private schools, with 24 (100.0% in the age bracket) enrolled. Conversely, the age group of 5 to 9 year old has the lowest likelihood of being enrolled in a private school, with 76 (100.0% in the age bracket) attending a public institution.
| Age Bracket | Public School | Private School |
| 3 to 4 Year Olds | 0 (0.0%) | 24 (100.0%) |
| 5 to 9 Year Old | 76 (100.0%) | 0 (0.0%) |
| 10 to 14 Year Olds | 136 (100.0%) | 0 (0.0%) |
| 15 to 17 Year Olds | 139 (100.0%) | 0 (0.0%) |
| 18 to 19 Year Olds | 0 (0.0%) | 0 (0.0%) |
| 20 to 24 Year Olds | 15 (100.0%) | 0 (0.0%) |
| 25 to 34 Year Olds | 0 (0.0%) | 0 (0.0%) |
| 35 Years and over | 0 (0.0%) | 30 (100.0%) |
| Total | 366 (87.1%) | 54 (12.9%) |
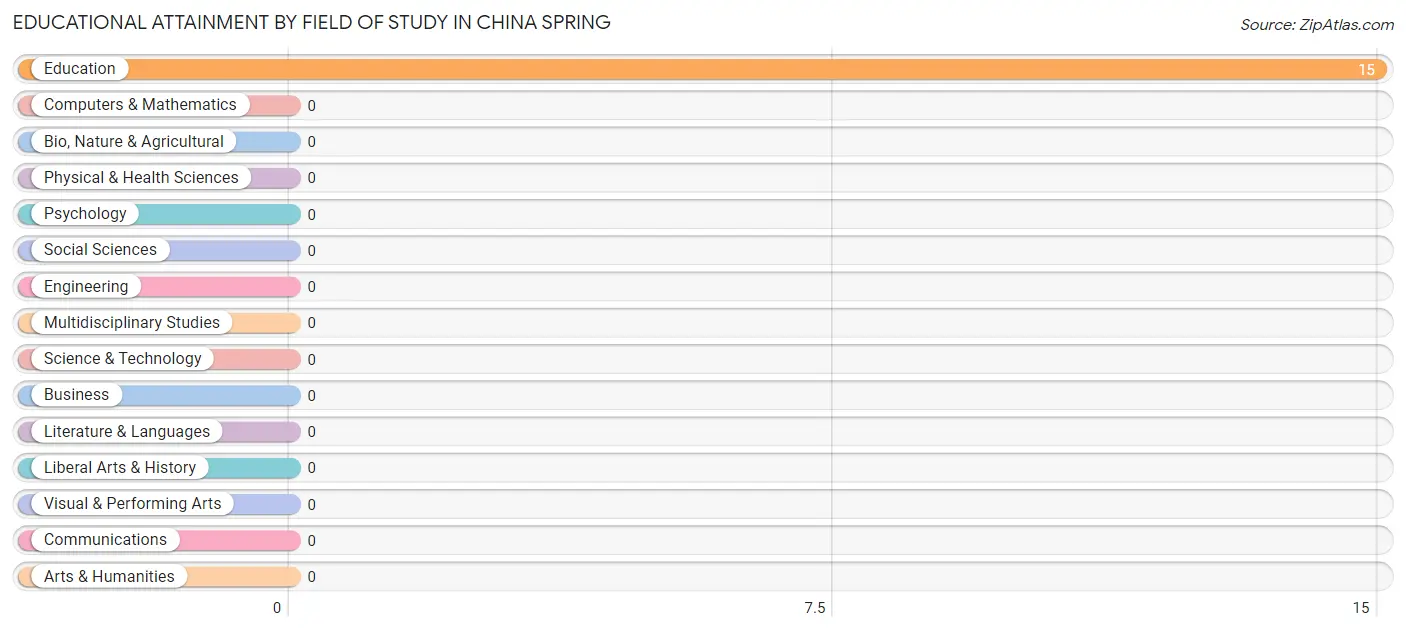
Educational Attainment by Field of Study in China Spring
, and education (15 | 100.0%) are the most common fields of study among 15 individuals in China Spring who have obtained a bachelor's degree or higher.
| Field of Study | # Graduates | % Graduates |
| Computers & Mathematics | 0 | 0.0% |
| Bio, Nature & Agricultural | 0 | 0.0% |
| Physical & Health Sciences | 0 | 0.0% |
| Psychology | 0 | 0.0% |
| Social Sciences | 0 | 0.0% |
| Engineering | 0 | 0.0% |
| Multidisciplinary Studies | 0 | 0.0% |
| Science & Technology | 0 | 0.0% |
| Business | 0 | 0.0% |
| Education | 15 | 100.0% |
| Literature & Languages | 0 | 0.0% |
| Liberal Arts & History | 0 | 0.0% |
| Visual & Performing Arts | 0 | 0.0% |
| Communications | 0 | 0.0% |
| Arts & Humanities | 0 | 0.0% |
| Total | 15 | 100.0% |
Transportation & Commute in China Spring
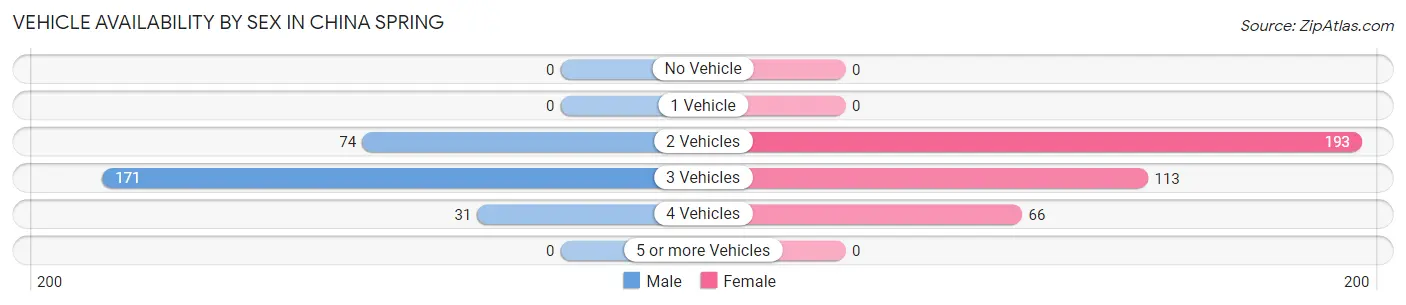
Vehicle Availability by Sex in China Spring
The most prevalent vehicle ownership categories in China Spring are males with 3 vehicles (171, accounting for 62.0%) and females with 3 vehicles (113, making up 46.0%).
| Vehicles Available | Male | Female |
| No Vehicle | 0 (0.0%) | 0 (0.0%) |
| 1 Vehicle | 0 (0.0%) | 0 (0.0%) |
| 2 Vehicles | 74 (26.8%) | 193 (51.9%) |
| 3 Vehicles | 171 (62.0%) | 113 (30.4%) |
| 4 Vehicles | 31 (11.2%) | 66 (17.7%) |
| 5 or more Vehicles | 0 (0.0%) | 0 (0.0%) |
| Total | 276 (100.0%) | 372 (100.0%) |
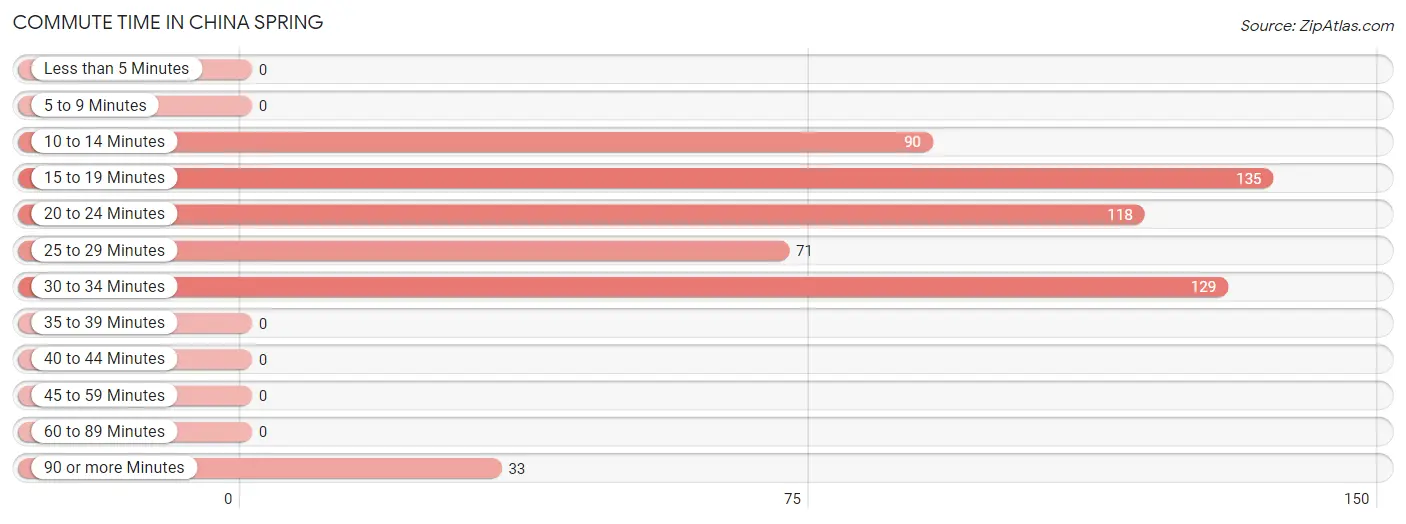
Commute Time in China Spring
The most frequently occuring commute durations in China Spring are 15 to 19 minutes (135 commuters, 23.4%), 30 to 34 minutes (129 commuters, 22.4%), and 20 to 24 minutes (118 commuters, 20.5%).
| Commute Time | # Commuters | % Commuters |
| Less than 5 Minutes | 0 | 0.0% |
| 5 to 9 Minutes | 0 | 0.0% |
| 10 to 14 Minutes | 90 | 15.6% |
| 15 to 19 Minutes | 135 | 23.4% |
| 20 to 24 Minutes | 118 | 20.5% |
| 25 to 29 Minutes | 71 | 12.3% |
| 30 to 34 Minutes | 129 | 22.4% |
| 35 to 39 Minutes | 0 | 0.0% |
| 40 to 44 Minutes | 0 | 0.0% |
| 45 to 59 Minutes | 0 | 0.0% |
| 60 to 89 Minutes | 0 | 0.0% |
| 90 or more Minutes | 33 | 5.7% |
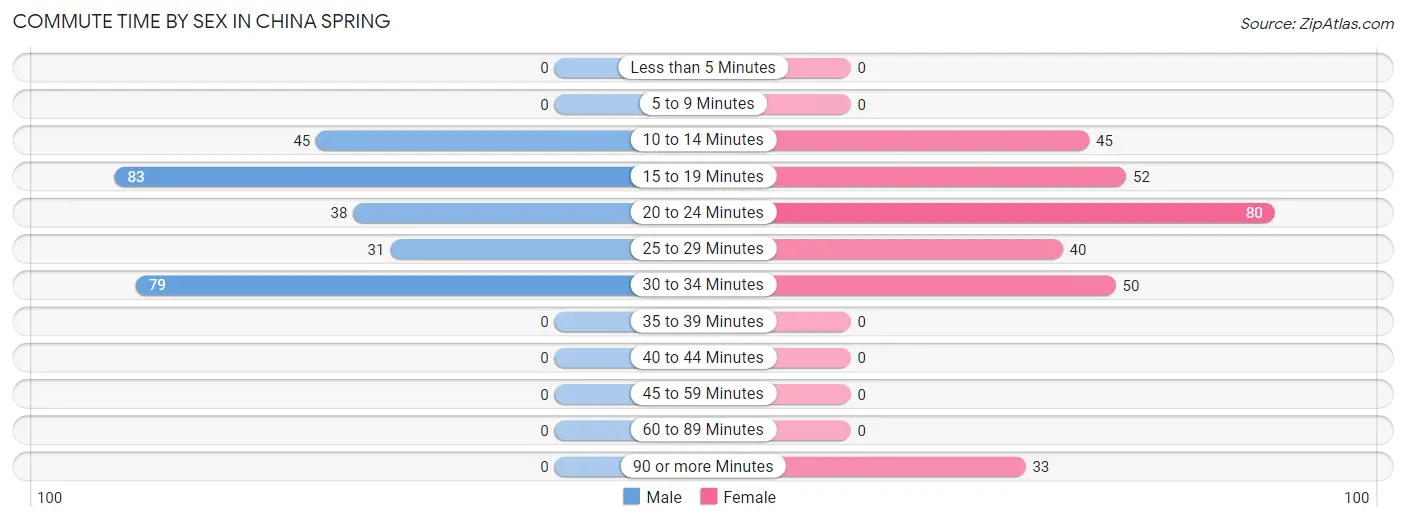
Commute Time by Sex in China Spring
The most common commute times in China Spring are 15 to 19 minutes (83 commuters, 30.1%) for males and 20 to 24 minutes (80 commuters, 26.7%) for females.
| Commute Time | Male | Female |
| Less than 5 Minutes | 0 (0.0%) | 0 (0.0%) |
| 5 to 9 Minutes | 0 (0.0%) | 0 (0.0%) |
| 10 to 14 Minutes | 45 (16.3%) | 45 (15.0%) |
| 15 to 19 Minutes | 83 (30.1%) | 52 (17.3%) |
| 20 to 24 Minutes | 38 (13.8%) | 80 (26.7%) |
| 25 to 29 Minutes | 31 (11.2%) | 40 (13.3%) |
| 30 to 34 Minutes | 79 (28.6%) | 50 (16.7%) |
| 35 to 39 Minutes | 0 (0.0%) | 0 (0.0%) |
| 40 to 44 Minutes | 0 (0.0%) | 0 (0.0%) |
| 45 to 59 Minutes | 0 (0.0%) | 0 (0.0%) |
| 60 to 89 Minutes | 0 (0.0%) | 0 (0.0%) |
| 90 or more Minutes | 0 (0.0%) | 33 (11.0%) |
Time of Departure to Work by Sex in China Spring
The most frequent times of departure to work in China Spring are 4:00 PM to 11:59 PM (99, 35.9%) for males and 6:00 AM to 6:29 AM (67, 22.3%) for females.
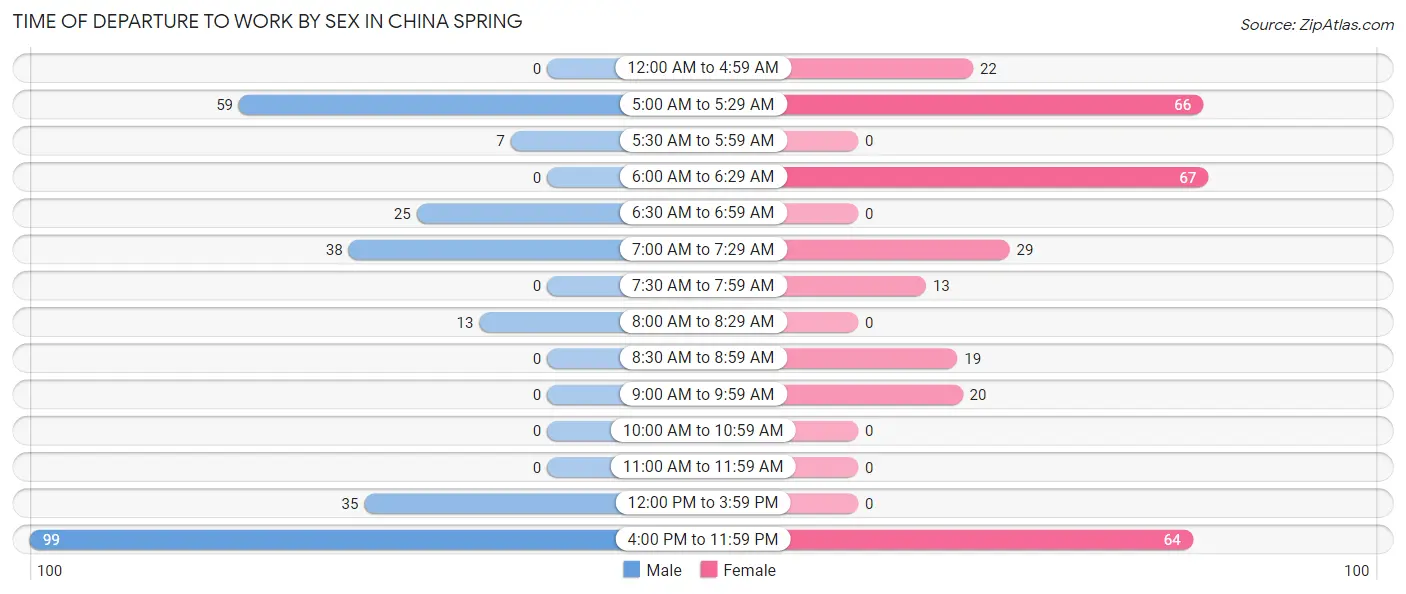
| Time of Departure | Male | Female |
| 12:00 AM to 4:59 AM | 0 (0.0%) | 22 (7.3%) |
| 5:00 AM to 5:29 AM | 59 (21.4%) | 66 (22.0%) |
| 5:30 AM to 5:59 AM | 7 (2.5%) | 0 (0.0%) |
| 6:00 AM to 6:29 AM | 0 (0.0%) | 67 (22.3%) |
| 6:30 AM to 6:59 AM | 25 (9.1%) | 0 (0.0%) |
| 7:00 AM to 7:29 AM | 38 (13.8%) | 29 (9.7%) |
| 7:30 AM to 7:59 AM | 0 (0.0%) | 13 (4.3%) |
| 8:00 AM to 8:29 AM | 13 (4.7%) | 0 (0.0%) |
| 8:30 AM to 8:59 AM | 0 (0.0%) | 19 (6.3%) |
| 9:00 AM to 9:59 AM | 0 (0.0%) | 20 (6.7%) |
| 10:00 AM to 10:59 AM | 0 (0.0%) | 0 (0.0%) |
| 11:00 AM to 11:59 AM | 0 (0.0%) | 0 (0.0%) |
| 12:00 PM to 3:59 PM | 35 (12.7%) | 0 (0.0%) |
| 4:00 PM to 11:59 PM | 99 (35.9%) | 64 (21.3%) |
| Total | 276 (100.0%) | 300 (100.0%) |
Housing Occupancy in China Spring
Occupancy by Ownership in China Spring
Of the total 422 dwellings in China Spring, owner-occupied units account for 357 (84.6%), while renter-occupied units make up 65 (15.4%).
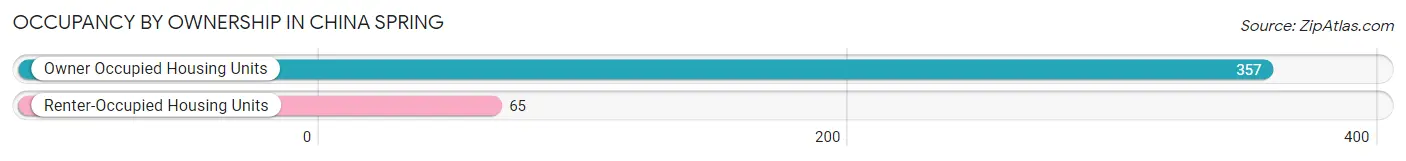
| Occupancy | # Housing Units | % Housing Units |
| Owner Occupied Housing Units | 357 | 84.6% |
| Renter-Occupied Housing Units | 65 | 15.4% |
| Total Occupied Housing Units | 422 | 100.0% |
Occupancy by Household Size in China Spring
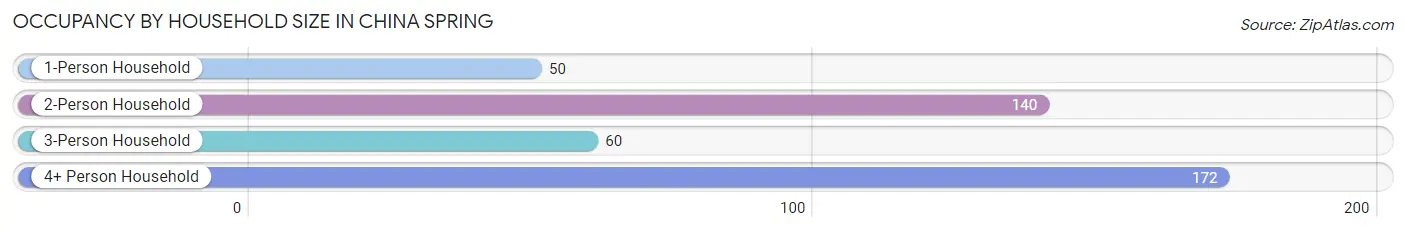
| Household Size | # Housing Units | % Housing Units |
| 1-Person Household | 50 | 11.8% |
| 2-Person Household | 140 | 33.2% |
| 3-Person Household | 60 | 14.2% |
| 4+ Person Household | 172 | 40.8% |
| Total Housing Units | 422 | 100.0% |
Occupancy by Ownership by Household Size in China Spring
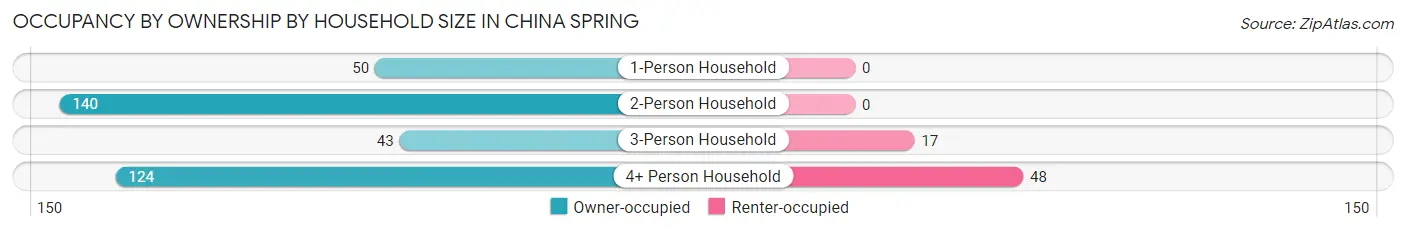
| Household Size | Owner-occupied | Renter-occupied |
| 1-Person Household | 50 (100.0%) | 0 (0.0%) |
| 2-Person Household | 140 (100.0%) | 0 (0.0%) |
| 3-Person Household | 43 (71.7%) | 17 (28.3%) |
| 4+ Person Household | 124 (72.1%) | 48 (27.9%) |
| Total Housing Units | 357 (84.6%) | 65 (15.4%) |
Occupancy by Educational Attainment in China Spring
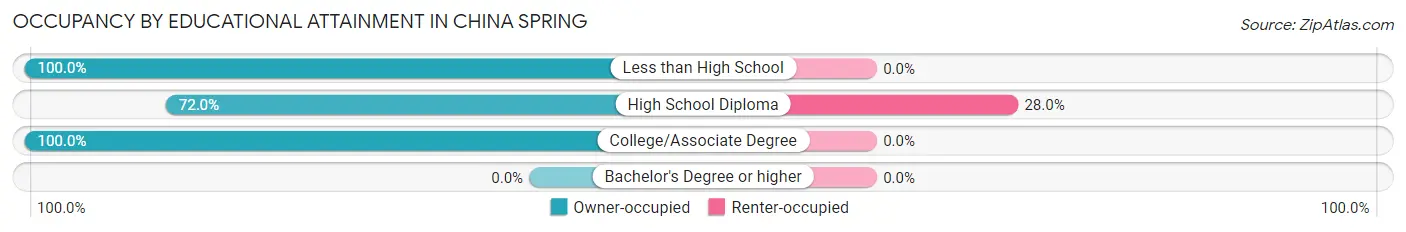
| Household Size | Owner-occupied | Renter-occupied |
| Less than High School | 25 (100.0%) | 0 (0.0%) |
| High School Diploma | 167 (72.0%) | 65 (28.0%) |
| College/Associate Degree | 165 (100.0%) | 0 (0.0%) |
| Bachelor's Degree or higher | 0 (0.0%) | 0 (0.0%) |
Occupancy by Age of Householder in China Spring
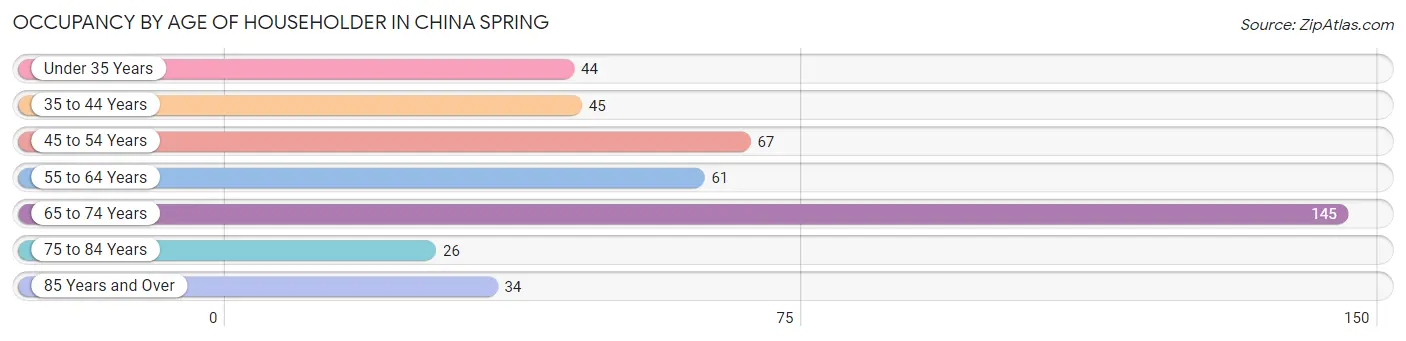
| Age Bracket | # Households | % Households |
| Under 35 Years | 44 | 10.4% |
| 35 to 44 Years | 45 | 10.7% |
| 45 to 54 Years | 67 | 15.9% |
| 55 to 64 Years | 61 | 14.4% |
| 65 to 74 Years | 145 | 34.4% |
| 75 to 84 Years | 26 | 6.2% |
| 85 Years and Over | 34 | 8.1% |
| Total | 422 | 100.0% |
Housing Finances in China Spring
Median Income by Occupancy in China Spring
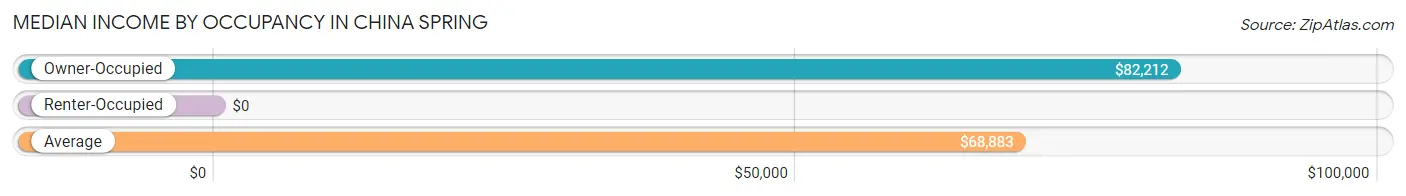
| Occupancy Type | # Households | Median Income |
| Owner-Occupied | 357 (84.6%) | $82,212 |
| Renter-Occupied | 65 (15.4%) | $0 |
| Average | 422 (100.0%) | $68,883 |
Occupancy by Householder Income Bracket in China Spring
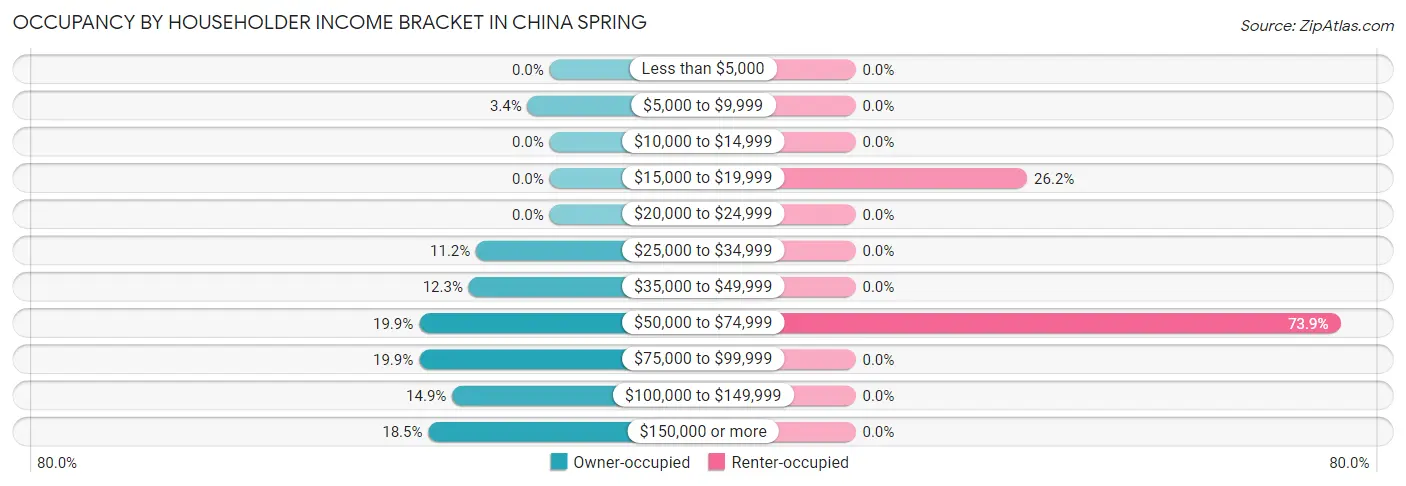
| Income Bracket | Owner-occupied | Renter-occupied |
| Less than $5,000 | 0 (0.0%) | 0 (0.0%) |
| $5,000 to $9,999 | 12 (3.4%) | 0 (0.0%) |
| $10,000 to $14,999 | 0 (0.0%) | 0 (0.0%) |
| $15,000 to $19,999 | 0 (0.0%) | 17 (26.2%) |
| $20,000 to $24,999 | 0 (0.0%) | 0 (0.0%) |
| $25,000 to $34,999 | 40 (11.2%) | 0 (0.0%) |
| $35,000 to $49,999 | 44 (12.3%) | 0 (0.0%) |
| $50,000 to $74,999 | 71 (19.9%) | 48 (73.9%) |
| $75,000 to $99,999 | 71 (19.9%) | 0 (0.0%) |
| $100,000 to $149,999 | 53 (14.8%) | 0 (0.0%) |
| $150,000 or more | 66 (18.5%) | 0 (0.0%) |
| Total | 357 (100.0%) | 65 (100.0%) |
Monthly Housing Cost Tiers in China Spring
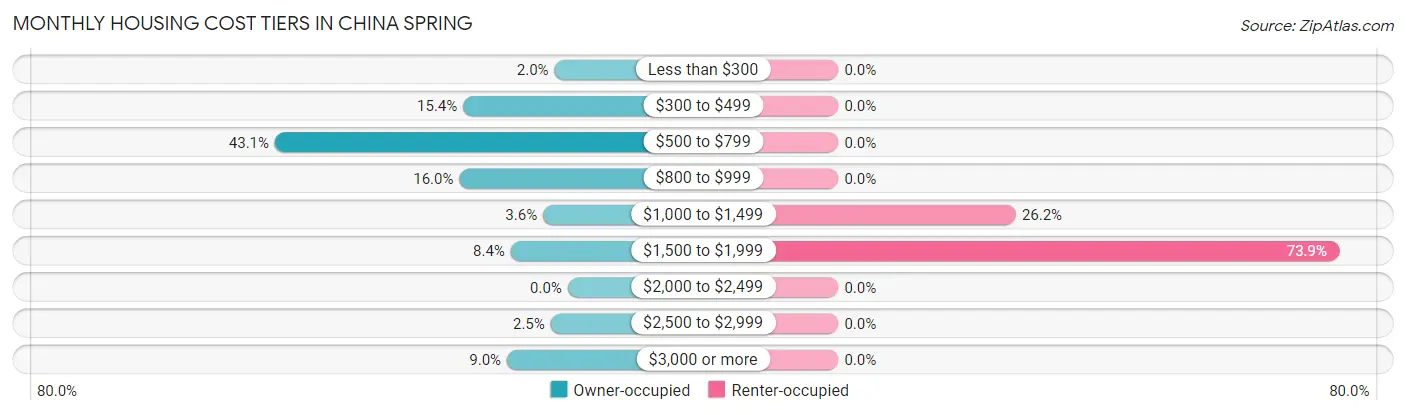
| Monthly Cost | Owner-occupied | Renter-occupied |
| Less than $300 | 7 (2.0%) | 0 (0.0%) |
| $300 to $499 | 55 (15.4%) | 0 (0.0%) |
| $500 to $799 | 154 (43.1%) | 0 (0.0%) |
| $800 to $999 | 57 (16.0%) | 0 (0.0%) |
| $1,000 to $1,499 | 13 (3.6%) | 17 (26.2%) |
| $1,500 to $1,999 | 30 (8.4%) | 48 (73.9%) |
| $2,000 to $2,499 | 0 (0.0%) | 0 (0.0%) |
| $2,500 to $2,999 | 9 (2.5%) | 0 (0.0%) |
| $3,000 or more | 32 (9.0%) | 0 (0.0%) |
| Total | 357 (100.0%) | 65 (100.0%) |
Physical Housing Characteristics in China Spring
Housing Structures in China Spring
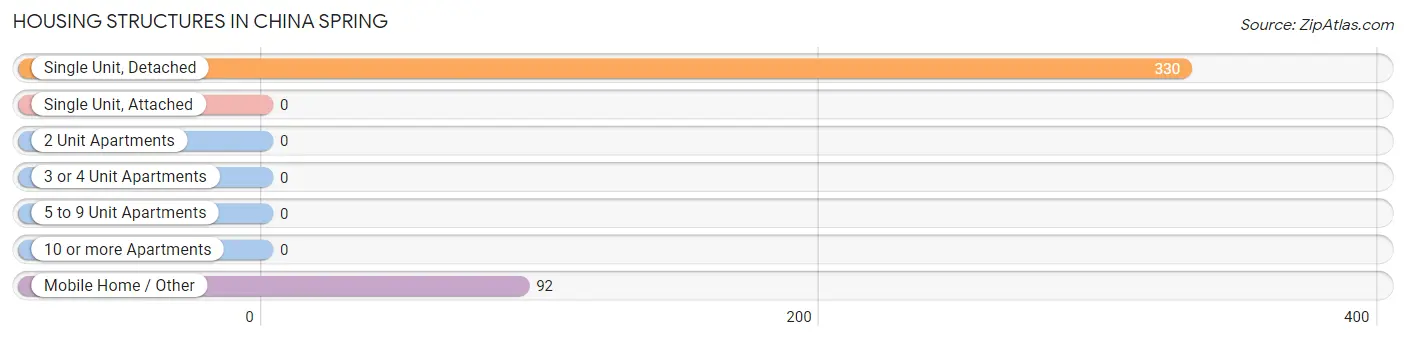
| Structure Type | # Housing Units | % Housing Units |
| Single Unit, Detached | 330 | 78.2% |
| Single Unit, Attached | 0 | 0.0% |
| 2 Unit Apartments | 0 | 0.0% |
| 3 or 4 Unit Apartments | 0 | 0.0% |
| 5 to 9 Unit Apartments | 0 | 0.0% |
| 10 or more Apartments | 0 | 0.0% |
| Mobile Home / Other | 92 | 21.8% |
| Total | 422 | 100.0% |
Housing Structures by Occupancy in China Spring
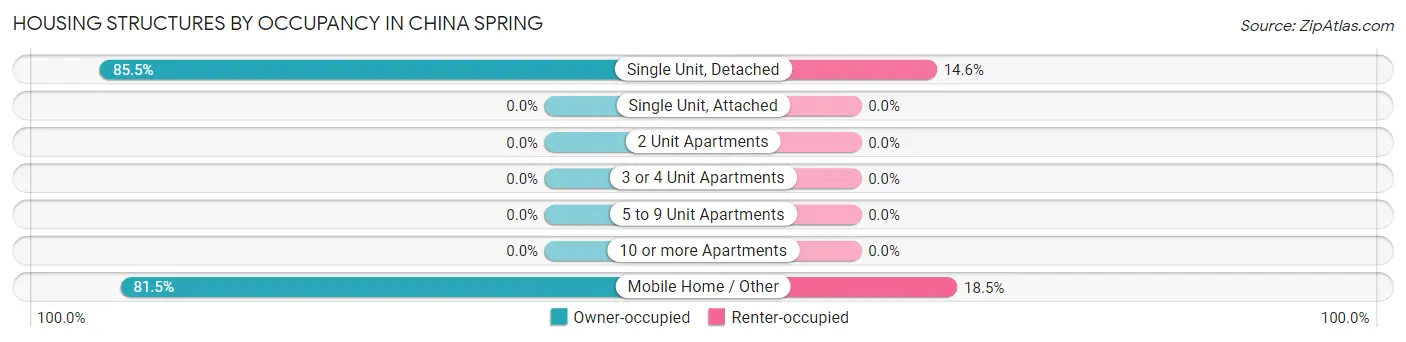
| Structure Type | Owner-occupied | Renter-occupied |
| Single Unit, Detached | 282 (85.5%) | 48 (14.5%) |
| Single Unit, Attached | 0 (0.0%) | 0 (0.0%) |
| 2 Unit Apartments | 0 (0.0%) | 0 (0.0%) |
| 3 or 4 Unit Apartments | 0 (0.0%) | 0 (0.0%) |
| 5 to 9 Unit Apartments | 0 (0.0%) | 0 (0.0%) |
| 10 or more Apartments | 0 (0.0%) | 0 (0.0%) |
| Mobile Home / Other | 75 (81.5%) | 17 (18.5%) |
| Total | 357 (84.6%) | 65 (15.4%) |
Housing Structures by Number of Rooms in China Spring
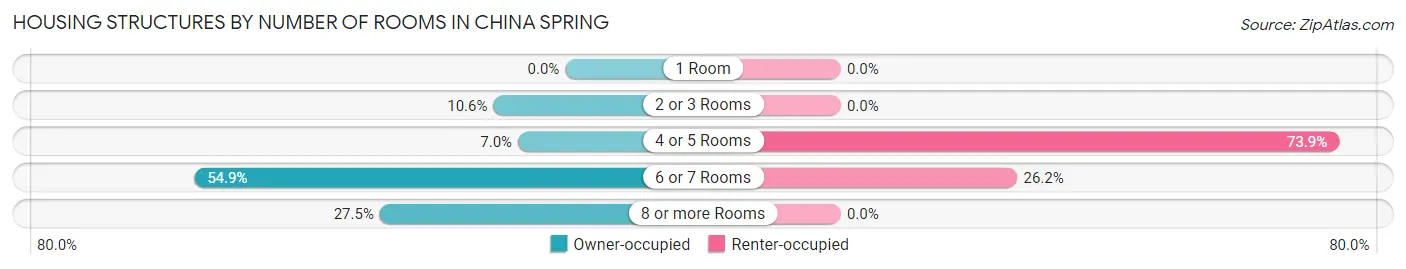
| Number of Rooms | Owner-occupied | Renter-occupied |
| 1 Room | 0 (0.0%) | 0 (0.0%) |
| 2 or 3 Rooms | 38 (10.6%) | 0 (0.0%) |
| 4 or 5 Rooms | 25 (7.0%) | 48 (73.9%) |
| 6 or 7 Rooms | 196 (54.9%) | 17 (26.2%) |
| 8 or more Rooms | 98 (27.5%) | 0 (0.0%) |
| Total | 357 (100.0%) | 65 (100.0%) |
Housing Structure by Heating Type in China Spring
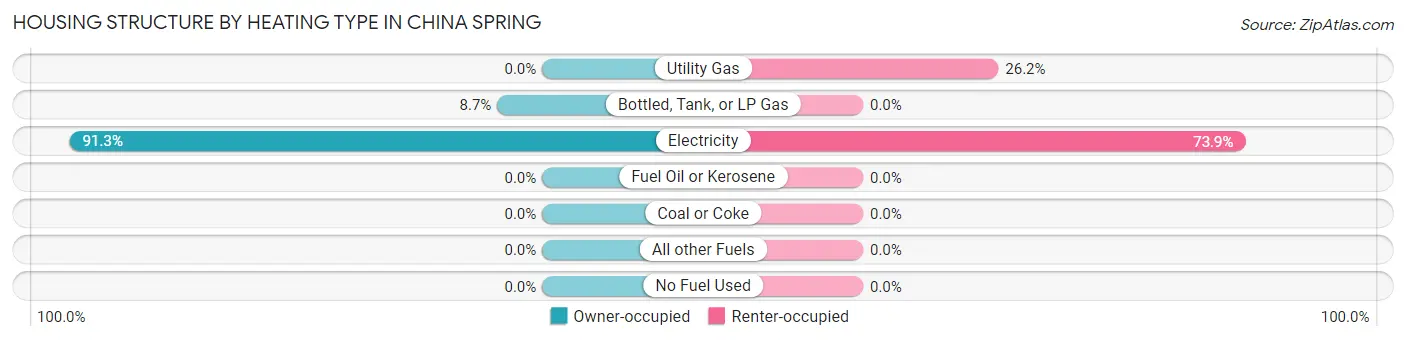
| Heating Type | Owner-occupied | Renter-occupied |
| Utility Gas | 0 (0.0%) | 17 (26.2%) |
| Bottled, Tank, or LP Gas | 31 (8.7%) | 0 (0.0%) |
| Electricity | 326 (91.3%) | 48 (73.9%) |
| Fuel Oil or Kerosene | 0 (0.0%) | 0 (0.0%) |
| Coal or Coke | 0 (0.0%) | 0 (0.0%) |
| All other Fuels | 0 (0.0%) | 0 (0.0%) |
| No Fuel Used | 0 (0.0%) | 0 (0.0%) |
| Total | 357 (100.0%) | 65 (100.0%) |
Household Vehicle Usage in China Spring
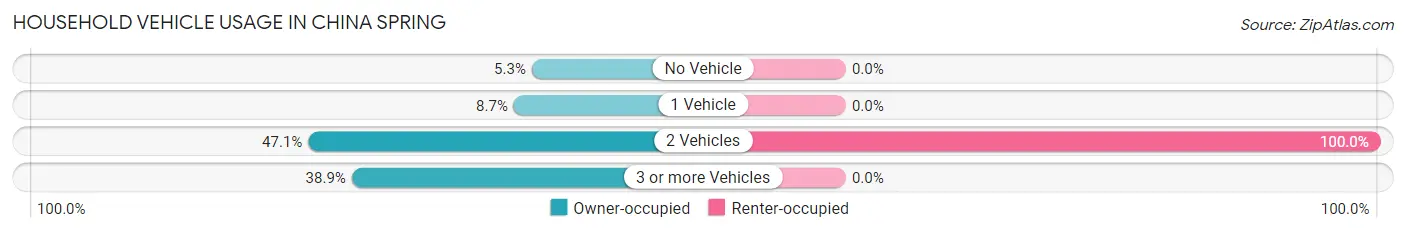
| Vehicles per Household | Owner-occupied | Renter-occupied |
| No Vehicle | 19 (5.3%) | 0 (0.0%) |
| 1 Vehicle | 31 (8.7%) | 0 (0.0%) |
| 2 Vehicles | 168 (47.1%) | 65 (100.0%) |
| 3 or more Vehicles | 139 (38.9%) | 0 (0.0%) |
| Total | 357 (100.0%) | 65 (100.0%) |
Real Estate & Mortgages in China Spring
Real Estate and Mortgage Overview in China Spring
| Characteristic | Without Mortgage | With Mortgage |
| Housing Units | 216 | 141 |
| Median Property Value | $238,400 | $155,800 |
| Median Household Income | $68,085 | $41 |
| Monthly Housing Costs | $585 | $32 |
| Real Estate Taxes | $2,122 | $31 |
Property Value by Mortgage Status in China Spring
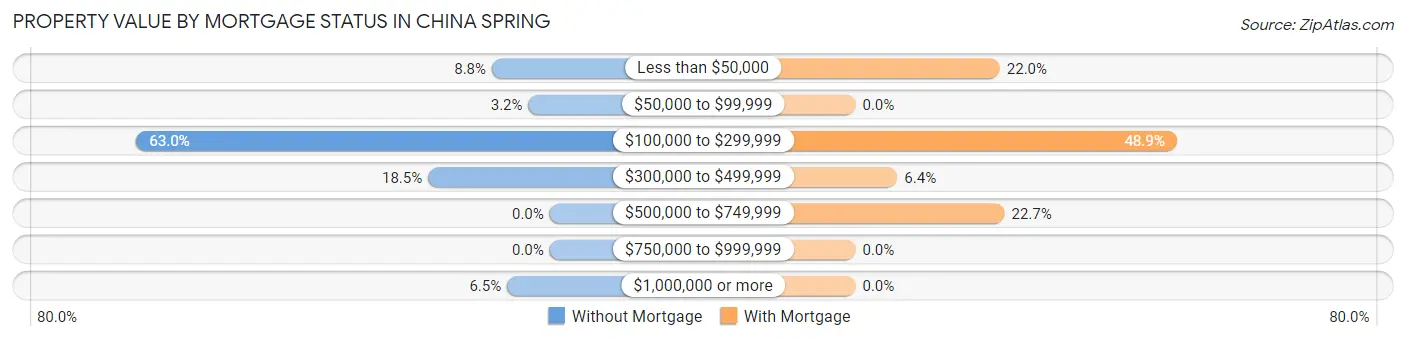
| Property Value | Without Mortgage | With Mortgage |
| Less than $50,000 | 19 (8.8%) | 31 (22.0%) |
| $50,000 to $99,999 | 7 (3.2%) | 0 (0.0%) |
| $100,000 to $299,999 | 136 (63.0%) | 69 (48.9%) |
| $300,000 to $499,999 | 40 (18.5%) | 9 (6.4%) |
| $500,000 to $749,999 | 0 (0.0%) | 32 (22.7%) |
| $750,000 to $999,999 | 0 (0.0%) | 0 (0.0%) |
| $1,000,000 or more | 14 (6.5%) | 0 (0.0%) |
| Total | 216 (100.0%) | 141 (100.0%) |
Household Income by Mortgage Status in China Spring
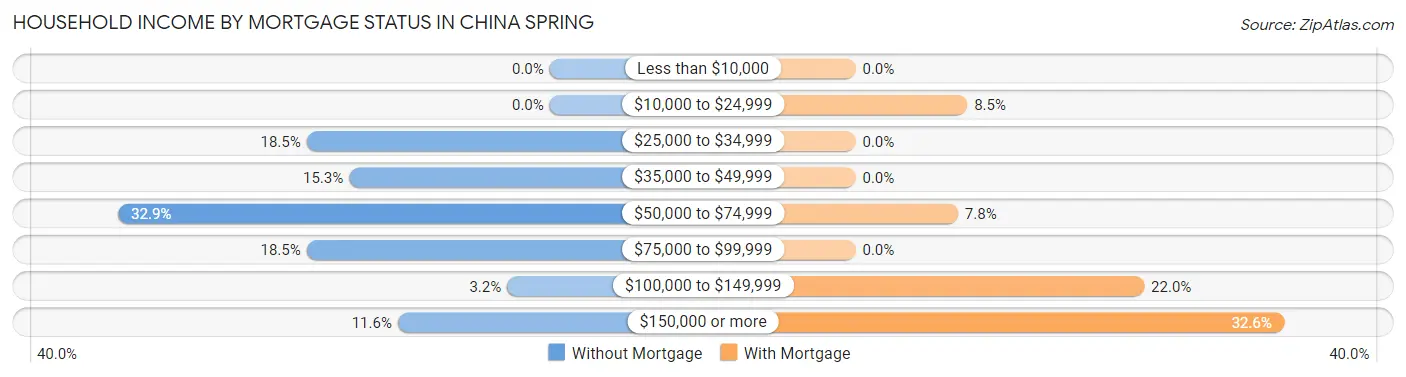
| Household Income | Without Mortgage | With Mortgage |
| Less than $10,000 | 0 (0.0%) | 0 (0.0%) |
| $10,000 to $24,999 | 0 (0.0%) | 12 (8.5%) |
| $25,000 to $34,999 | 40 (18.5%) | 0 (0.0%) |
| $35,000 to $49,999 | 33 (15.3%) | 0 (0.0%) |
| $50,000 to $74,999 | 71 (32.9%) | 11 (7.8%) |
| $75,000 to $99,999 | 40 (18.5%) | 0 (0.0%) |
| $100,000 to $149,999 | 7 (3.2%) | 31 (22.0%) |
| $150,000 or more | 25 (11.6%) | 46 (32.6%) |
| Total | 216 (100.0%) | 141 (100.0%) |
Property Value to Household Income Ratio in China Spring
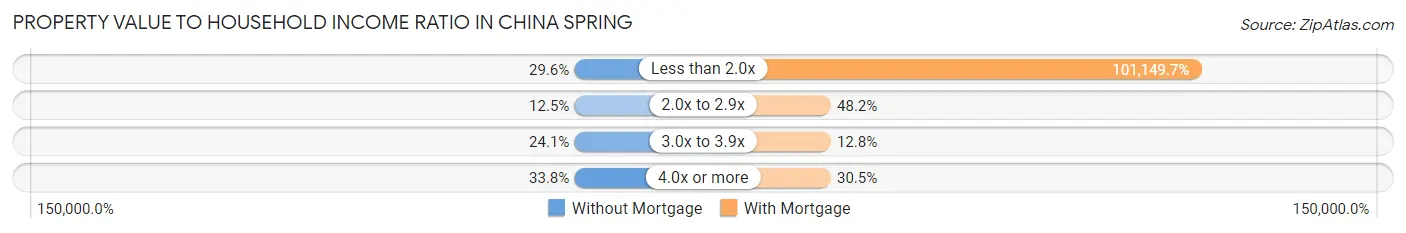
| Value-to-Income Ratio | Without Mortgage | With Mortgage |
| Less than 2.0x | 64 (29.6%) | 142,621 (101,149.6%) |
| 2.0x to 2.9x | 27 (12.5%) | 68 (48.2%) |
| 3.0x to 3.9x | 52 (24.1%) | 18 (12.8%) |
| 4.0x or more | 73 (33.8%) | 43 (30.5%) |
| Total | 216 (100.0%) | 141 (100.0%) |
Real Estate Taxes by Mortgage Status in China Spring
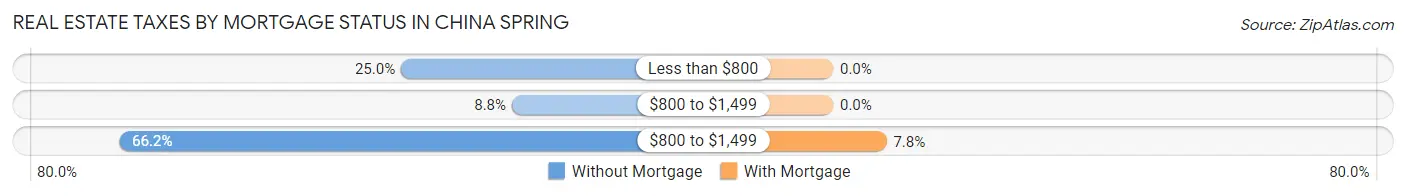
| Property Taxes | Without Mortgage | With Mortgage |
| Less than $800 | 54 (25.0%) | 0 (0.0%) |
| $800 to $1,499 | 19 (8.8%) | 0 (0.0%) |
| $800 to $1,499 | 143 (66.2%) | 11 (7.8%) |
| Total | 216 (100.0%) | 141 (100.0%) |
Health & Disability in China Spring
Health Insurance Coverage by Age in China Spring
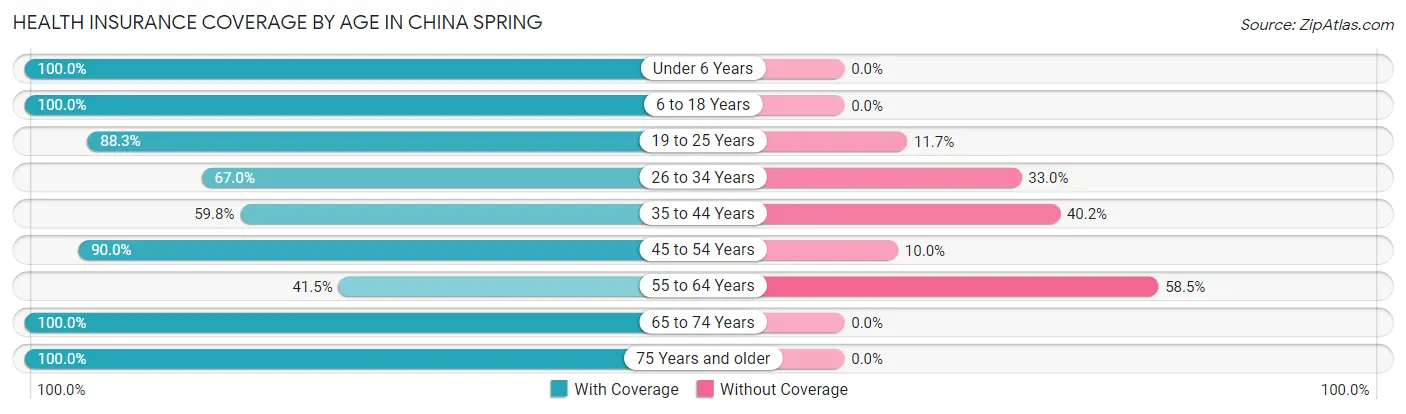
| Age Bracket | With Coverage | Without Coverage |
| Under 6 Years | 53 (100.0%) | 0 (0.0%) |
| 6 to 18 Years | 383 (100.0%) | 0 (0.0%) |
| 19 to 25 Years | 151 (88.3%) | 20 (11.7%) |
| 26 to 34 Years | 67 (67.0%) | 33 (33.0%) |
| 35 to 44 Years | 113 (59.8%) | 76 (40.2%) |
| 45 to 54 Years | 108 (90.0%) | 12 (10.0%) |
| 55 to 64 Years | 34 (41.5%) | 48 (58.5%) |
| 65 to 74 Years | 239 (100.0%) | 0 (0.0%) |
| 75 Years and older | 75 (100.0%) | 0 (0.0%) |
| Total | 1,223 (86.6%) | 189 (13.4%) |
Health Insurance Coverage by Citizenship Status in China Spring
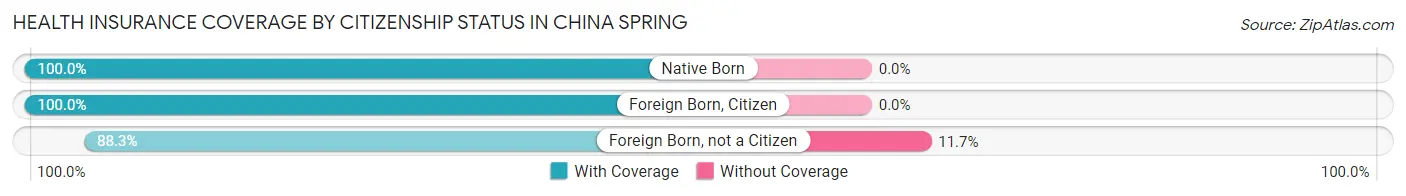
| Citizenship Status | With Coverage | Without Coverage |
| Native Born | 53 (100.0%) | 0 (0.0%) |
| Foreign Born, Citizen | 383 (100.0%) | 0 (0.0%) |
| Foreign Born, not a Citizen | 151 (88.3%) | 20 (11.7%) |
Health Insurance Coverage by Household Income in China Spring
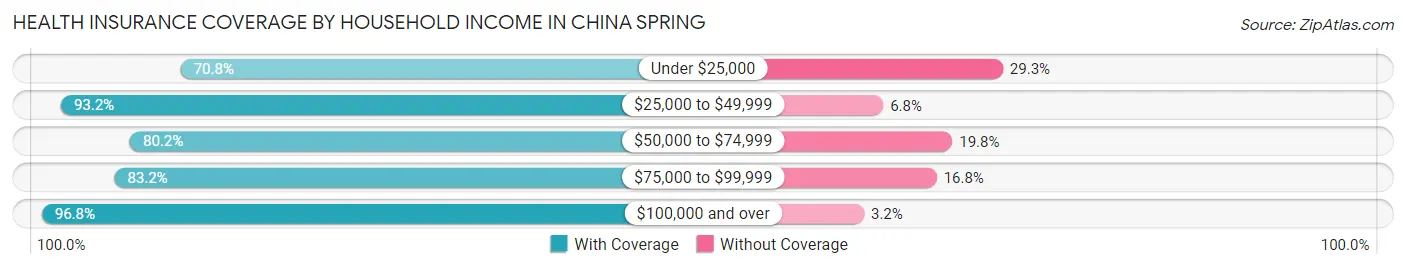
| Household Income | With Coverage | Without Coverage |
| Under $25,000 | 75 (70.8%) | 31 (29.2%) |
| $25,000 to $49,999 | 164 (93.2%) | 12 (6.8%) |
| $50,000 to $74,999 | 402 (80.2%) | 99 (19.8%) |
| $75,000 to $99,999 | 163 (83.2%) | 33 (16.8%) |
| $100,000 and over | 419 (96.8%) | 14 (3.2%) |
Public vs Private Health Insurance Coverage by Age in China Spring
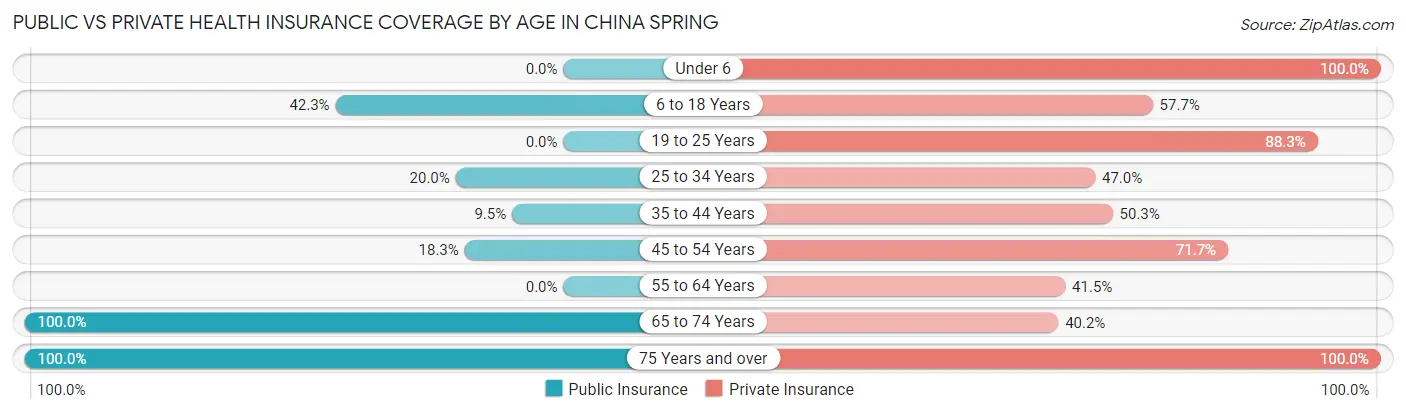
| Age Bracket | Public Insurance | Private Insurance |
| Under 6 | 0 (0.0%) | 53 (100.0%) |
| 6 to 18 Years | 162 (42.3%) | 221 (57.7%) |
| 19 to 25 Years | 0 (0.0%) | 151 (88.3%) |
| 25 to 34 Years | 20 (20.0%) | 47 (47.0%) |
| 35 to 44 Years | 18 (9.5%) | 95 (50.3%) |
| 45 to 54 Years | 22 (18.3%) | 86 (71.7%) |
| 55 to 64 Years | 0 (0.0%) | 34 (41.5%) |
| 65 to 74 Years | 239 (100.0%) | 96 (40.2%) |
| 75 Years and over | 75 (100.0%) | 75 (100.0%) |
| Total | 536 (38.0%) | 858 (60.8%) |
Disability Status by Sex by Age in China Spring
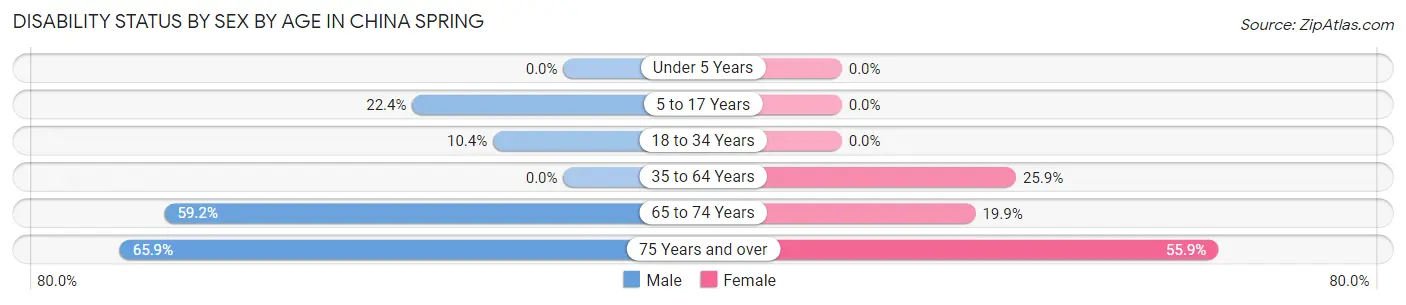
| Age Bracket | Male | Female |
| Under 5 Years | 0 (0.0%) | 0 (0.0%) |
| 5 to 17 Years | 48 (22.4%) | 0 (0.0%) |
| 18 to 34 Years | 19 (10.4%) | 0 (0.0%) |
| 35 to 64 Years | 0 (0.0%) | 81 (25.9%) |
| 65 to 74 Years | 61 (59.2%) | 27 (19.9%) |
| 75 Years and over | 27 (65.8%) | 19 (55.9%) |
Disability Class by Sex by Age in China Spring
Disability Class: Hearing Difficulty
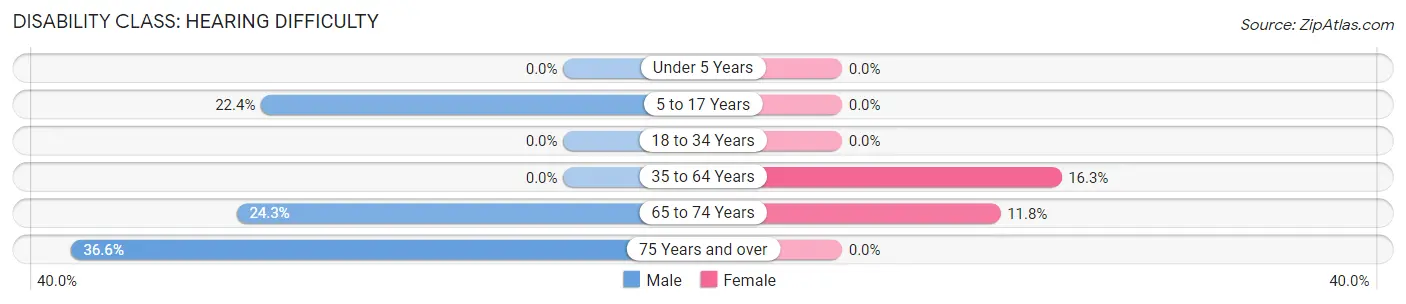
| Age Bracket | Male | Female |
| Under 5 Years | 0 (0.0%) | 0 (0.0%) |
| 5 to 17 Years | 48 (22.4%) | 0 (0.0%) |
| 18 to 34 Years | 0 (0.0%) | 0 (0.0%) |
| 35 to 64 Years | 0 (0.0%) | 51 (16.3%) |
| 65 to 74 Years | 25 (24.3%) | 16 (11.8%) |
| 75 Years and over | 15 (36.6%) | 0 (0.0%) |
Disability Class: Vision Difficulty
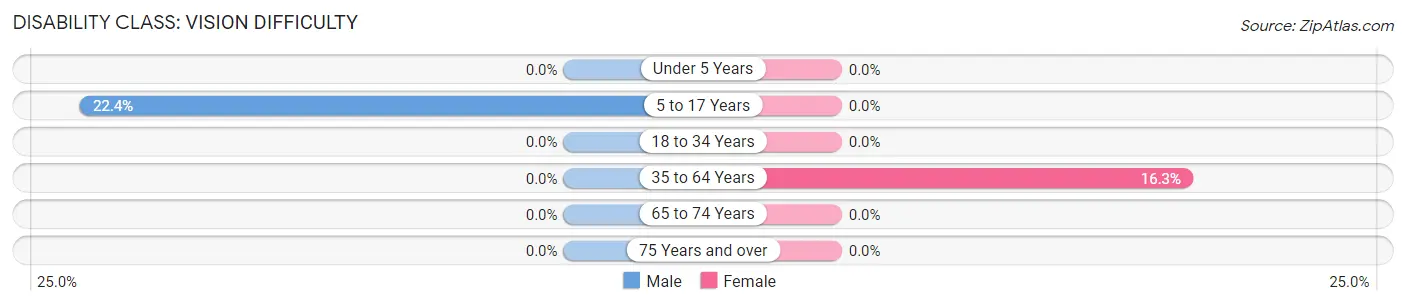
| Age Bracket | Male | Female |
| Under 5 Years | 0 (0.0%) | 0 (0.0%) |
| 5 to 17 Years | 48 (22.4%) | 0 (0.0%) |
| 18 to 34 Years | 0 (0.0%) | 0 (0.0%) |
| 35 to 64 Years | 0 (0.0%) | 51 (16.3%) |
| 65 to 74 Years | 0 (0.0%) | 0 (0.0%) |
| 75 Years and over | 0 (0.0%) | 0 (0.0%) |
Disability Class: Cognitive Difficulty
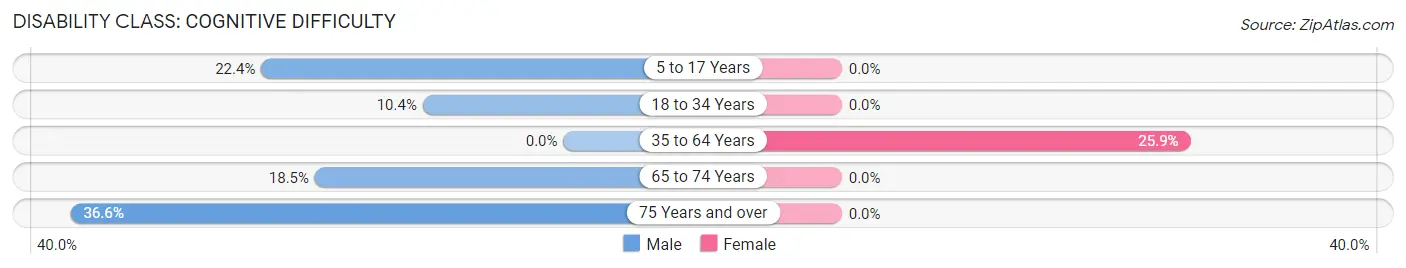
| Age Bracket | Male | Female |
| 5 to 17 Years | 48 (22.4%) | 0 (0.0%) |
| 18 to 34 Years | 19 (10.4%) | 0 (0.0%) |
| 35 to 64 Years | 0 (0.0%) | 81 (25.9%) |
| 65 to 74 Years | 19 (18.4%) | 0 (0.0%) |
| 75 Years and over | 15 (36.6%) | 0 (0.0%) |
Disability Class: Ambulatory Difficulty
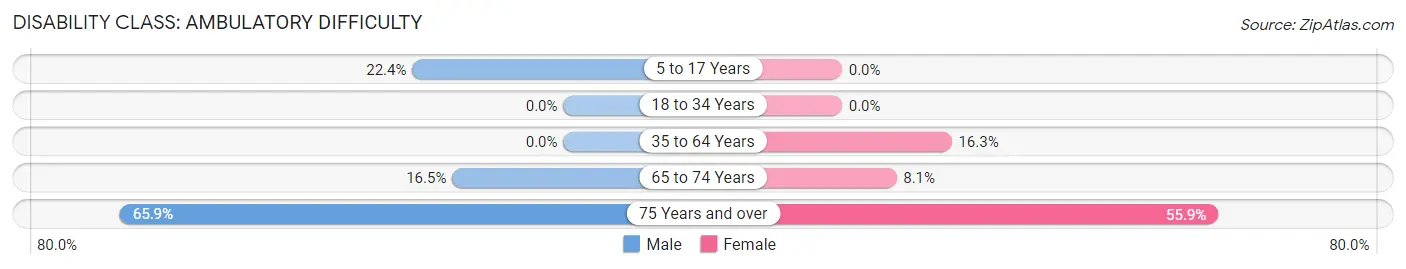
| Age Bracket | Male | Female |
| 5 to 17 Years | 48 (22.4%) | 0 (0.0%) |
| 18 to 34 Years | 0 (0.0%) | 0 (0.0%) |
| 35 to 64 Years | 0 (0.0%) | 51 (16.3%) |
| 65 to 74 Years | 17 (16.5%) | 11 (8.1%) |
| 75 Years and over | 27 (65.8%) | 19 (55.9%) |
Disability Class: Self-Care Difficulty
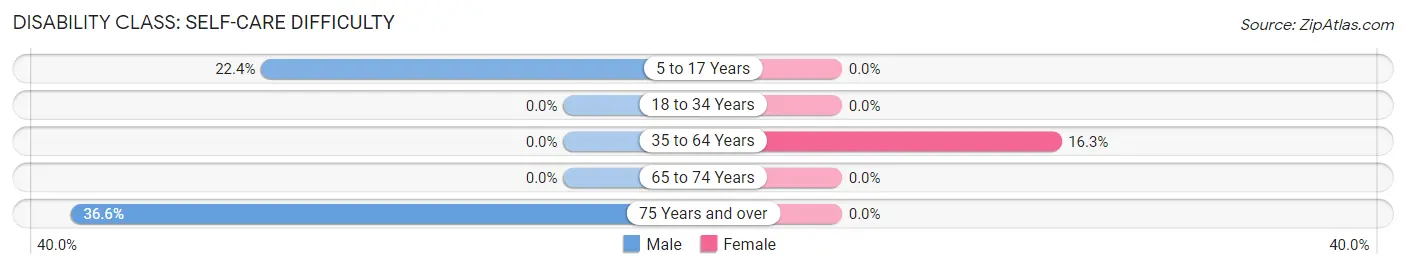
| Age Bracket | Male | Female |
| 5 to 17 Years | 48 (22.4%) | 0 (0.0%) |
| 18 to 34 Years | 0 (0.0%) | 0 (0.0%) |
| 35 to 64 Years | 0 (0.0%) | 51 (16.3%) |
| 65 to 74 Years | 0 (0.0%) | 0 (0.0%) |
| 75 Years and over | 15 (36.6%) | 0 (0.0%) |
Technology Access in China Spring
Computing Device Access in China Spring
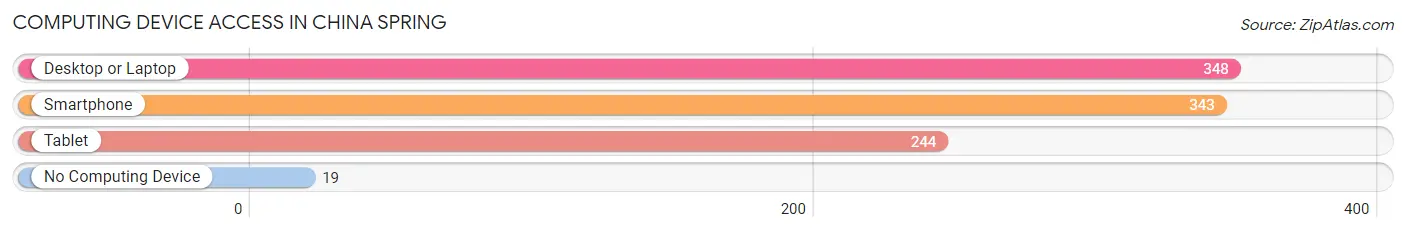
| Device Type | # Households | % Households |
| Desktop or Laptop | 348 | 82.5% |
| Smartphone | 343 | 81.3% |
| Tablet | 244 | 57.8% |
| No Computing Device | 19 | 4.5% |
| Total | 422 | 100.0% |
Internet Access in China Spring
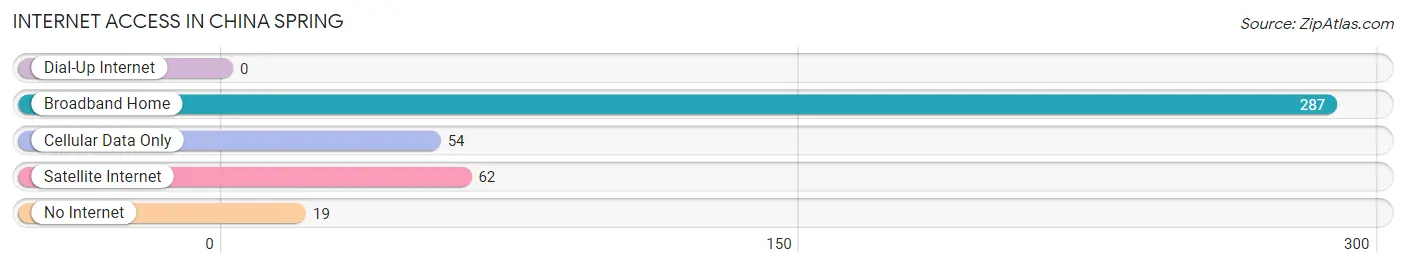
| Internet Type | # Households | % Households |
| Dial-Up Internet | 0 | 0.0% |
| Broadband Home | 287 | 68.0% |
| Cellular Data Only | 54 | 12.8% |
| Satellite Internet | 62 | 14.7% |
| No Internet | 19 | 4.5% |
| Total | 422 | 100.0% |
China Spring Summary
Spring, Texas is a suburban city located in the northern part of Harris County, Texas, United States. It is located approximately 25 miles north of downtown Houston and is part of the Houston–The Woodlands–Sugar Land metropolitan area. The city is situated in the Piney Woods region of East Texas and is part of the Greater Houston metropolitan area. As of the 2010 census, the city had a population of 54,298.
Geography
Spring is located at the intersection of Interstate 45 and the Hardy Toll Road. It is bordered by The Woodlands to the west, Conroe to the north, and Humble to the east. The city is located in the northern part of Harris County, Texas, and is part of the Houston–The Woodlands–Sugar Land metropolitan area. The city is situated in the Piney Woods region of East Texas and is part of the Greater Houston metropolitan area.
History
The area now known as Spring was originally inhabited by the Orcoquiza Native Americans. In 1836, the Texas General Council of the Provisional Government placed what is now the town of Spring in the Harrisburg municipality. In 1838, William Pierpont placed a trading post on Spring Creek. In 1840, the town of Spring had 153 residents. By the mid-1800s, many German immigrants had moved to the area and began farming.
In 1871, the International and Great Northern Railroad arrived, and the area began to grow. The town was renamed Spring after the creek that ran through it. In 1873, a post office was established in the town. By 1884, the town had grown to include several churches, a school, and a population of 200.
In the early 1900s, the town began to grow rapidly. In 1910, the population had grown to 1,200. By the 1920s, the population had grown to 3,500. In the 1930s, the population had grown to 5,000.
Economy
Spring is home to a variety of businesses, including retail, manufacturing, and service industries. The city is home to several major employers, including ExxonMobil, Hewlett-Packard, and Schlumberger. The city is also home to several small businesses, including restaurants, shops, and professional services.
Demographics
As of the 2010 census, the city had a population of 54,298. The racial makeup of the city was 73.3% White, 11.3% African American, 0.7% Native American, 5.2% Asian, 0.1% Pacific Islander, 6.2% from other races, and 3.2% from two or more races. Hispanic or Latino of any race were 19.3% of the population.
The median income for a household in the city was $60,945, and the median income for a family was $71,817. The per capita income for the city was $27,837. About 8.2% of families and 10.3% of the population were below the poverty line, including 14.3% of those under age 18 and 6.2% of those age 65 or over.
Spring is served by the Spring Independent School District. The district has one high school, two middle schools, and seven elementary schools. The city is also home to several private schools, including St. Thomas Episcopal School and The Woodlands Christian Academy.
Common Questions
What is Per Capita Income in China Spring?
Per Capita income in China Spring is $27,982.
What is the Median Family Income in China Spring?
Median Family Income in China Spring is $68,973.
What is the Median Household income in China Spring?
Median Household Income in China Spring is $68,883.
What is Income or Wage Gap in China Spring?
Income or Wage Gap in China Spring is 4.9%.
Women in China Spring earn 95.1 cents for every dollar earned by a man.
What is Inequality or Gini Index in China Spring?
Inequality or Gini Index in China Spring is 0.36.
What is the Total Population of China Spring?
Total Population of China Spring is 1,412.
What is the Total Male Population of China Spring?
Total Male Population of China Spring is 642.
What is the Total Female Population of China Spring?
Total Female Population of China Spring is 770.
What is the Ratio of Males per 100 Females in China Spring?
There are 83.38 Males per 100 Females in China Spring.
What is the Ratio of Females per 100 Males in China Spring?
There are 119.94 Females per 100 Males in China Spring.
What is the Median Population Age in China Spring?
Median Population Age in China Spring is 35.0 Years.
What is the Average Family Size in China Spring
Average Family Size in China Spring is 3.7 People.
What is the Average Household Size in China Spring
Average Household Size in China Spring is 3.4 People.
How Large is the Labor Force in China Spring?
There are 648 People in the Labor Forcein in China Spring.
What is the Percentage of People in the Labor Force in China Spring?
57.1% of People are in the Labor Force in China Spring.