Racine, WV Map & Demographics
Racine Map
Racine Overview
$24,757
PER CAPITA INCOME
$70,815
AVG HOUSEHOLD INCOME
62.3%
WAGE / INCOME GAP [ % ]
37.7¢/ $1
WAGE / INCOME GAP [ $ ]
0.29
INEQUALITY / GINI INDEX
457
TOTAL POPULATION
171
MALE POPULATION
286
FEMALE POPULATION
59.79
MALES / 100 FEMALES
167.25
FEMALES / 100 MALES
49.3
MEDIAN AGE
3.4
AVG FAMILY SIZE
3.9
AVG HOUSEHOLD SIZE
221
LABOR FORCE [ PEOPLE ]
51.8%
PERCENT IN LABOR FORCE
43.9%
UNEMPLOYMENT RATE
Racine Zip Codes
Racine Area Codes
Income in Racine
Income Overview in Racine
| Characteristic | Number | Measure |
| Per Capita Income | 457 | $24,757 |
| Median Family Income | 78 | $0 |
| Mean Family Income | 78 | $62,495 |
| Median Household Income | 116 | $70,815 |
| Mean Household Income | 116 | $68,213 |
| Income Deficit | 78 | $0 |
| Wage / Income Gap (%) | 457 | 62.30% |
| Wage / Income Gap ($) | 457 | 37.70¢ per $1 |
| Gini / Inequality Index | 457 | 0.29 |
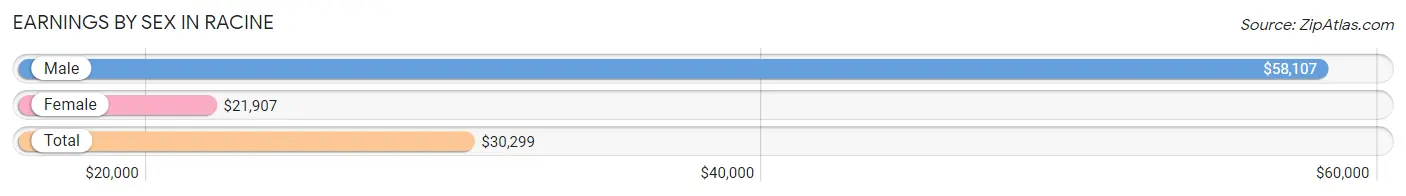
Earnings by Sex in Racine
Average Earnings in Racine are $30,299, $58,107 for men and $21,907 for women, a difference of 62.3%.
| Sex | Number | Average Earnings |
| Male | 73 (33.0%) | $58,107 |
| Female | 148 (67.0%) | $21,907 |
| Total | 221 (100.0%) | $30,299 |
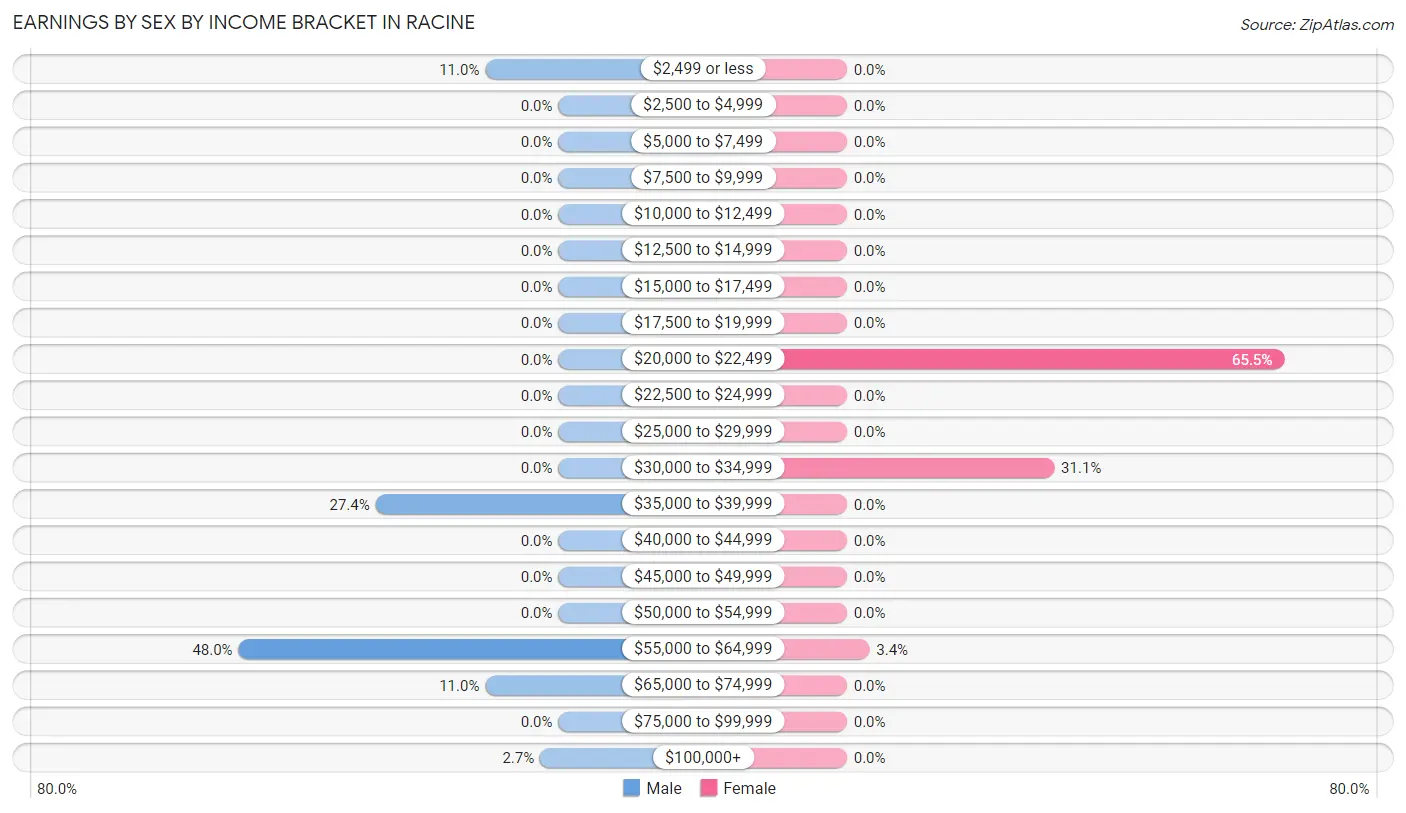
Earnings by Sex by Income Bracket in Racine
The most common earnings brackets in Racine are $55,000 to $64,999 for men (35 | 47.9%) and $20,000 to $22,499 for women (97 | 65.5%).
| Income | Male | Female |
| $2,499 or less | 8 (11.0%) | 0 (0.0%) |
| $2,500 to $4,999 | 0 (0.0%) | 0 (0.0%) |
| $5,000 to $7,499 | 0 (0.0%) | 0 (0.0%) |
| $7,500 to $9,999 | 0 (0.0%) | 0 (0.0%) |
| $10,000 to $12,499 | 0 (0.0%) | 0 (0.0%) |
| $12,500 to $14,999 | 0 (0.0%) | 0 (0.0%) |
| $15,000 to $17,499 | 0 (0.0%) | 0 (0.0%) |
| $17,500 to $19,999 | 0 (0.0%) | 0 (0.0%) |
| $20,000 to $22,499 | 0 (0.0%) | 97 (65.5%) |
| $22,500 to $24,999 | 0 (0.0%) | 0 (0.0%) |
| $25,000 to $29,999 | 0 (0.0%) | 0 (0.0%) |
| $30,000 to $34,999 | 0 (0.0%) | 46 (31.1%) |
| $35,000 to $39,999 | 20 (27.4%) | 0 (0.0%) |
| $40,000 to $44,999 | 0 (0.0%) | 0 (0.0%) |
| $45,000 to $49,999 | 0 (0.0%) | 0 (0.0%) |
| $50,000 to $54,999 | 0 (0.0%) | 0 (0.0%) |
| $55,000 to $64,999 | 35 (47.9%) | 5 (3.4%) |
| $65,000 to $74,999 | 8 (11.0%) | 0 (0.0%) |
| $75,000 to $99,999 | 0 (0.0%) | 0 (0.0%) |
| $100,000+ | 2 (2.7%) | 0 (0.0%) |
| Total | 73 (100.0%) | 148 (100.0%) |
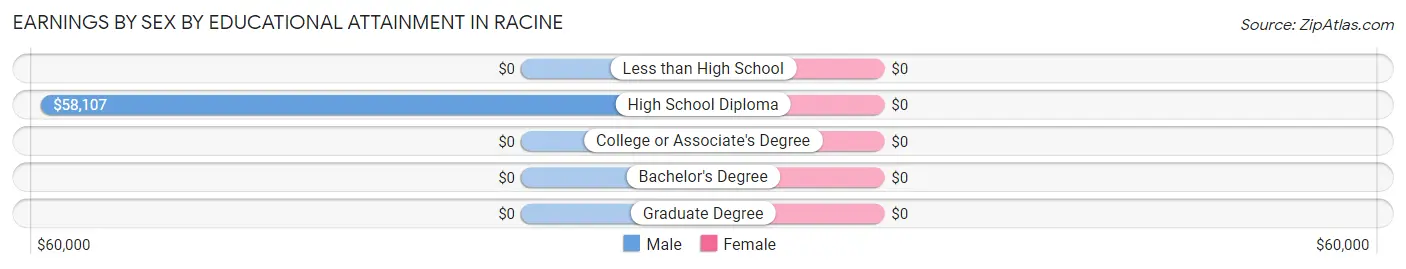
Earnings by Sex by Educational Attainment in Racine
| Educational Attainment | Male Income | Female Income |
| Less than High School | - | - |
| High School Diploma | $58,107 | $0 |
| College or Associate's Degree | - | - |
| Bachelor's Degree | - | - |
| Graduate Degree | - | - |
| Total | $58,393 | $21,907 |
Family Income in Racine
Family Income Brackets in Racine
According to the Racine family income data, there are 46 families falling into the $25,000 to $34,999 income range, which is the most common income bracket and makes up 59.0% of all families.
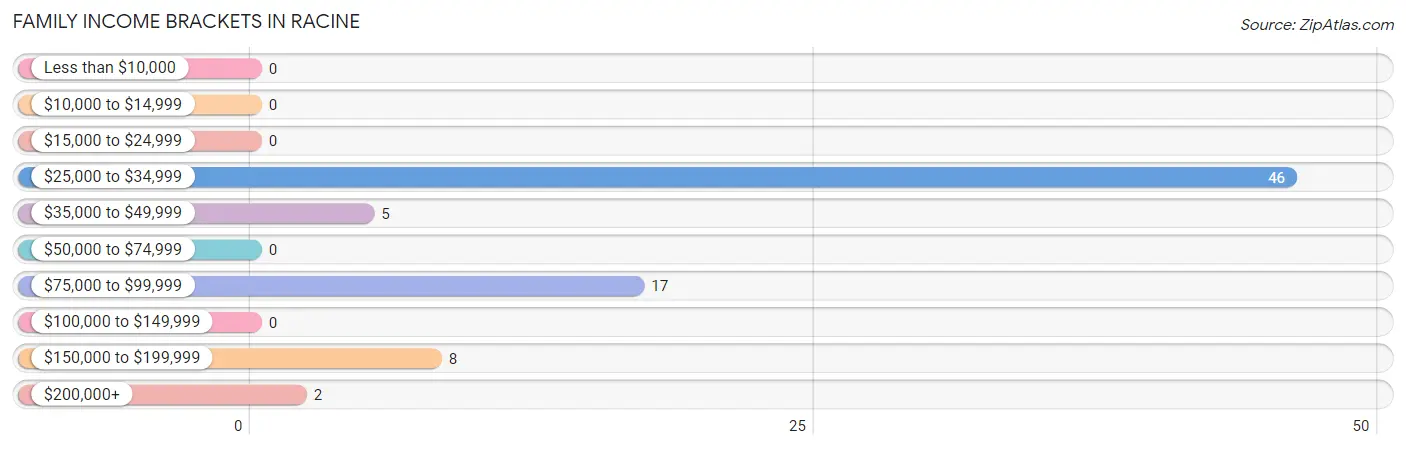
| Income Bracket | # Families | % Families |
| Less than $10,000 | 0 | 0.0% |
| $10,000 to $14,999 | 0 | 0.0% |
| $15,000 to $24,999 | 0 | 0.0% |
| $25,000 to $34,999 | 46 | 59.0% |
| $35,000 to $49,999 | 5 | 6.4% |
| $50,000 to $74,999 | 0 | 0.0% |
| $75,000 to $99,999 | 17 | 21.8% |
| $100,000 to $149,999 | 0 | 0.0% |
| $150,000 to $199,999 | 8 | 10.3% |
| $200,000+ | 2 | 2.6% |
Family Income by Famaliy Size in Racine
| Income Bracket | # Families | Median Income |
| 2-Person Families | 48 (61.5%) | $0 |
| 3-Person Families | 5 (6.4%) | $0 |
| 4-Person Families | 25 (32.1%) | $0 |
| 5-Person Families | 0 (0.0%) | $0 |
| 6-Person Families | 0 (0.0%) | $0 |
| 7+ Person Families | 0 (0.0%) | $0 |
| Total | 78 (100.0%) | $0 |
Family Income by Number of Earners in Racine
| Number of Earners | # Families | Median Income |
| No Earners | 5 (6.4%) | $0 |
| 1 Earner | 65 (83.3%) | $0 |
| 2 Earners | 0 (0.0%) | $0 |
| 3+ Earners | 8 (10.3%) | $0 |
| Total | 78 (100.0%) | $0 |
Household Income in Racine
Household Income Brackets in Racine
With 54 households falling in the category, the $50,000 to $74,999 income range is the most frequent in Racine, accounting for 46.6% of all households.
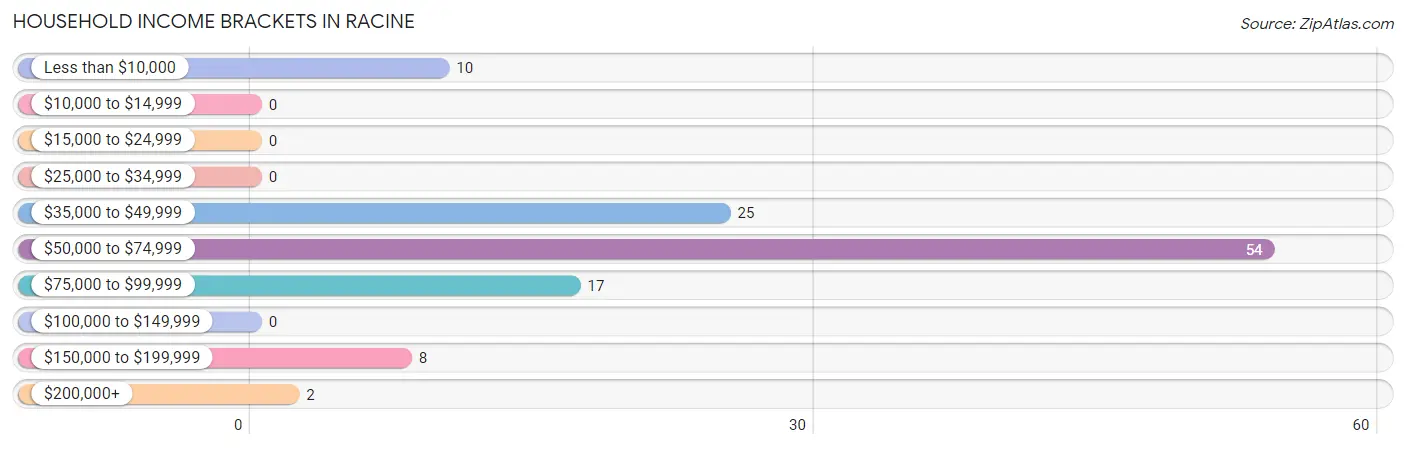
| Income Bracket | # Households | % Households |
| Less than $10,000 | 10 | 8.6% |
| $10,000 to $14,999 | 0 | 0.0% |
| $15,000 to $24,999 | 0 | 0.0% |
| $25,000 to $34,999 | 0 | 0.0% |
| $35,000 to $49,999 | 25 | 21.6% |
| $50,000 to $74,999 | 54 | 46.6% |
| $75,000 to $99,999 | 17 | 14.7% |
| $100,000 to $149,999 | 0 | 0.0% |
| $150,000 to $199,999 | 8 | 6.9% |
| $200,000+ | 2 | 1.7% |
Household Income by Householder Age in Racine
The median household income in Racine is $70,815, with the highest median household income of $71,522 found in the 45 to 64 years age bracket for the primary householder. A total of 56 households (48.3%) fall into this category.
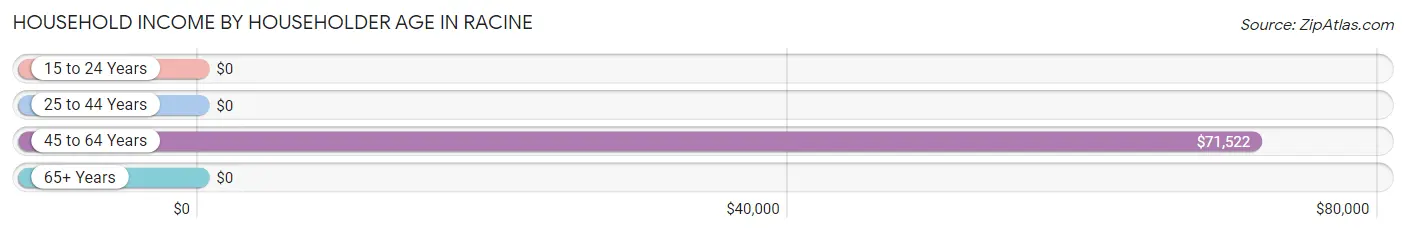
| Income Bracket | # Households | Median Income |
| 15 to 24 Years | 0 (0.0%) | $0 |
| 25 to 44 Years | 20 (17.2%) | $0 |
| 45 to 64 Years | 56 (48.3%) | $71,522 |
| 65+ Years | 40 (34.5%) | $0 |
| Total | 116 (100.0%) | $70,815 |
Poverty in Racine
Income Below Poverty by Sex and Age in Racine
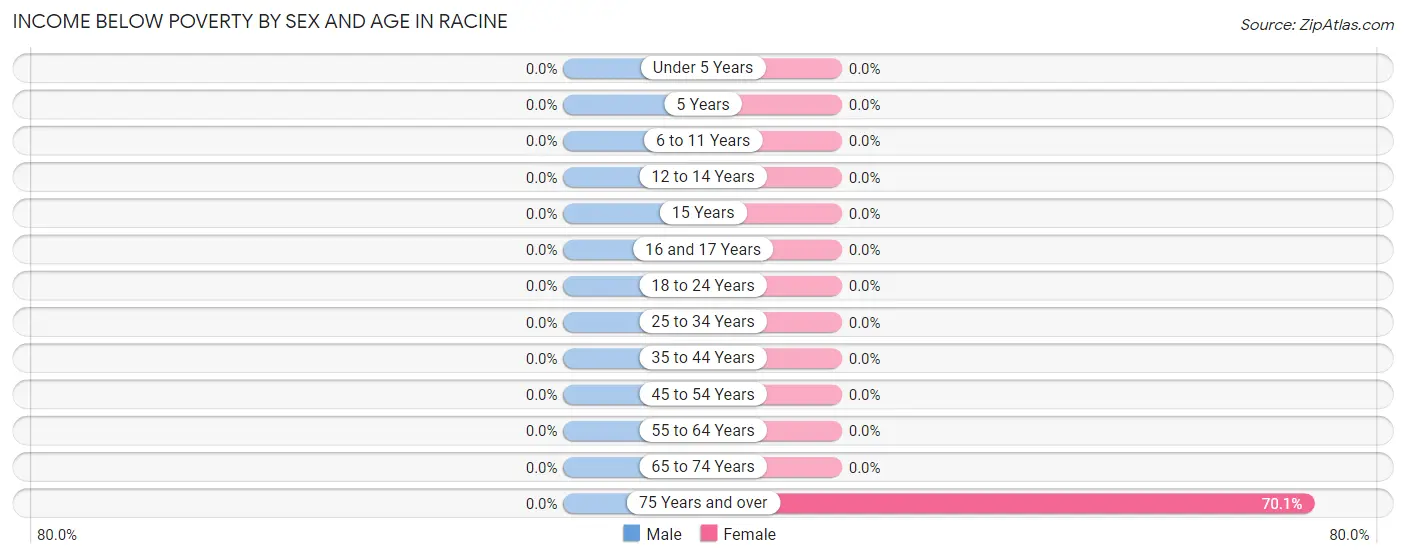
| Age Bracket | Male | Female |
| Under 5 Years | 0 (0.0%) | 0 (0.0%) |
| 5 Years | 0 (0.0%) | 0 (0.0%) |
| 6 to 11 Years | 0 (0.0%) | 0 (0.0%) |
| 12 to 14 Years | 0 (0.0%) | 0 (0.0%) |
| 15 Years | 0 (0.0%) | 0 (0.0%) |
| 16 and 17 Years | 0 (0.0%) | 0 (0.0%) |
| 18 to 24 Years | 0 (0.0%) | 0 (0.0%) |
| 25 to 34 Years | 0 (0.0%) | 0 (0.0%) |
| 35 to 44 Years | 0 (0.0%) | 0 (0.0%) |
| 45 to 54 Years | 0 (0.0%) | 0 (0.0%) |
| 55 to 64 Years | 0 (0.0%) | 0 (0.0%) |
| 65 to 74 Years | 0 (0.0%) | 0 (0.0%) |
| 75 Years and over | 0 (0.0%) | 54 (70.1%) |
| Total | 0 (0.0%) | 54 (18.9%) |
Income Above Poverty by Sex and Age in Racine
According to the poverty statistics in Racine, males aged 12 to 14 years and females aged 6 to 11 years are the age groups that are most secure financially, with 100.0% of males and 100.0% of females in these age groups living above the poverty line.
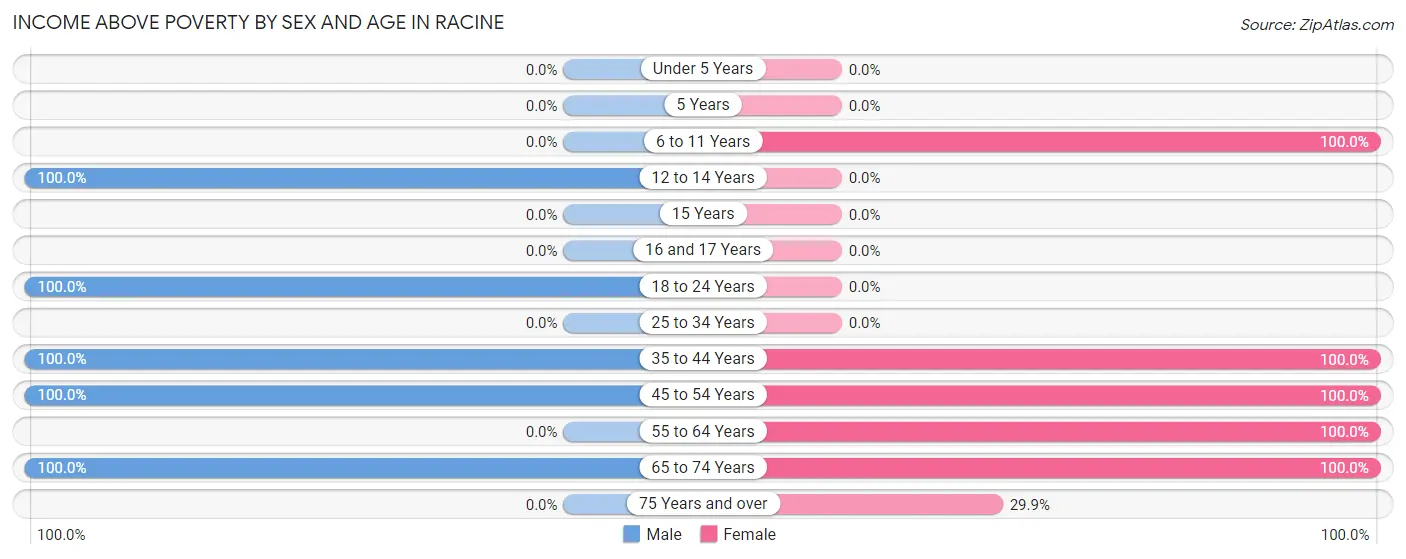
| Age Bracket | Male | Female |
| Under 5 Years | 0 (0.0%) | 0 (0.0%) |
| 5 Years | 0 (0.0%) | 0 (0.0%) |
| 6 to 11 Years | 0 (0.0%) | 22 (100.0%) |
| 12 to 14 Years | 8 (100.0%) | 0 (0.0%) |
| 15 Years | 0 (0.0%) | 0 (0.0%) |
| 16 and 17 Years | 0 (0.0%) | 0 (0.0%) |
| 18 to 24 Years | 69 (100.0%) | 0 (0.0%) |
| 25 to 34 Years | 0 (0.0%) | 0 (0.0%) |
| 35 to 44 Years | 67 (100.0%) | 16 (100.0%) |
| 45 to 54 Years | 10 (100.0%) | 148 (100.0%) |
| 55 to 64 Years | 0 (0.0%) | 18 (100.0%) |
| 65 to 74 Years | 17 (100.0%) | 5 (100.0%) |
| 75 Years and over | 0 (0.0%) | 23 (29.9%) |
| Total | 171 (100.0%) | 232 (81.1%) |
Income Below Poverty Among Married-Couple Families in Racine
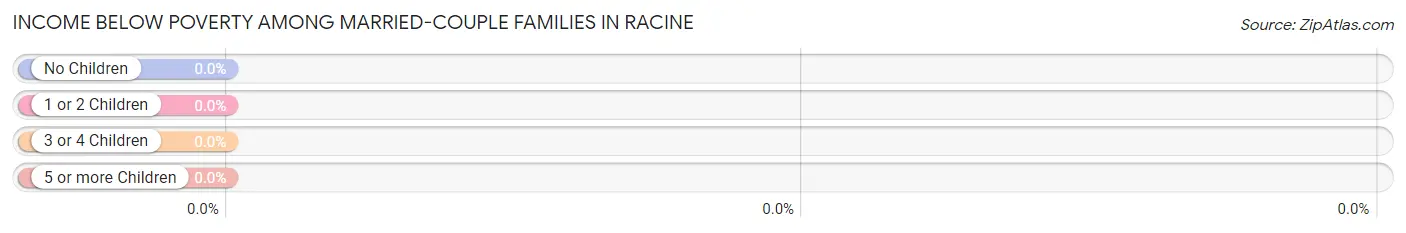
| Children | Above Poverty | Below Poverty |
| No Children | 0 (0.0%) | 0 (0.0%) |
| 1 or 2 Children | 25 (100.0%) | 0 (0.0%) |
| 3 or 4 Children | 0 (0.0%) | 0 (0.0%) |
| 5 or more Children | 0 (0.0%) | 0 (0.0%) |
| Total | 25 (100.0%) | 0 (0.0%) |
Income Below Poverty Among Single-Parent Households in Racine
| Children | Single Father | Single Mother |
| No Children | 0 (0.0%) | 0 (0.0%) |
| 1 or 2 Children | 0 (0.0%) | 0 (0.0%) |
| 3 or 4 Children | 0 (0.0%) | 0 (0.0%) |
| 5 or more Children | 0 (0.0%) | 0 (0.0%) |
| Total | 0 (0.0%) | 0 (0.0%) |
Income Below Poverty Among Married-Couple vs Single-Parent Households in Racine
| Children | Married-Couple Families | Single-Parent Households |
| No Children | 0 (0.0%) | 0 (0.0%) |
| 1 or 2 Children | 0 (0.0%) | 0 (0.0%) |
| 3 or 4 Children | 0 (0.0%) | 0 (0.0%) |
| 5 or more Children | 0 (0.0%) | 0 (0.0%) |
| Total | 0 (0.0%) | 0 (0.0%) |
Race in Racine
The most populous races in Racine are , and White / Caucasian (457 | 100.0%).
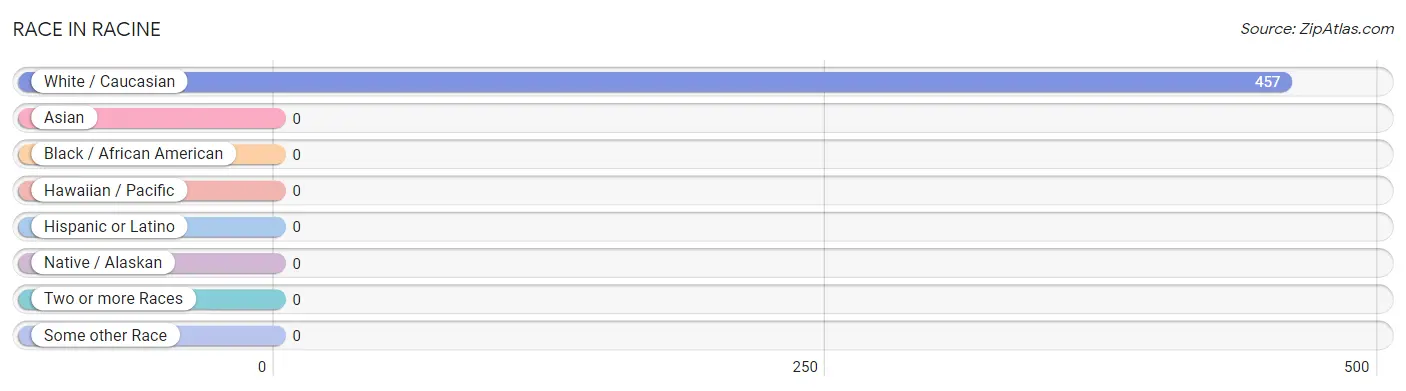
| Race | # Population | % Population |
| Asian | 0 | 0.0% |
| Black / African American | 0 | 0.0% |
| Hawaiian / Pacific | 0 | 0.0% |
| Hispanic or Latino | 0 | 0.0% |
| Native / Alaskan | 0 | 0.0% |
| White / Caucasian | 457 | 100.0% |
| Two or more Races | 0 | 0.0% |
| Some other Race | 0 | 0.0% |
| Total | 457 | 100.0% |
Ancestry in Racine
The most populous ancestries reported in Racine are German (29 | 6.4%), Hungarian (24 | 5.2%), and English (5 | 1.1%), together accounting for 12.7% of all Racine residents.
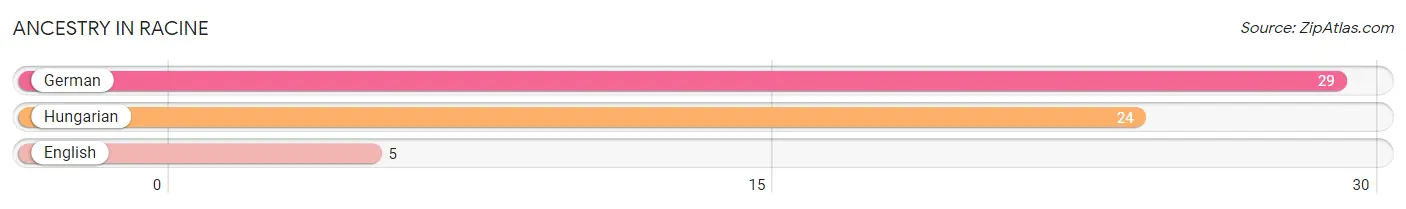
| Ancestry | # Population | % Population |
| English | 5 | 1.1% |
| German | 29 | 6.4% |
| Hungarian | 24 | 5.2% | View All 3 Rows |
Immigrants in Racine

| Immigration Origin | # Population | % Population | View All 0 Rows |
Sex and Age in Racine
Sex and Age in Racine
The most populous age groups in Racine are 20 to 24 Years (66 | 38.6%) for men and 45 to 49 Years (148 | 51.7%) for women.
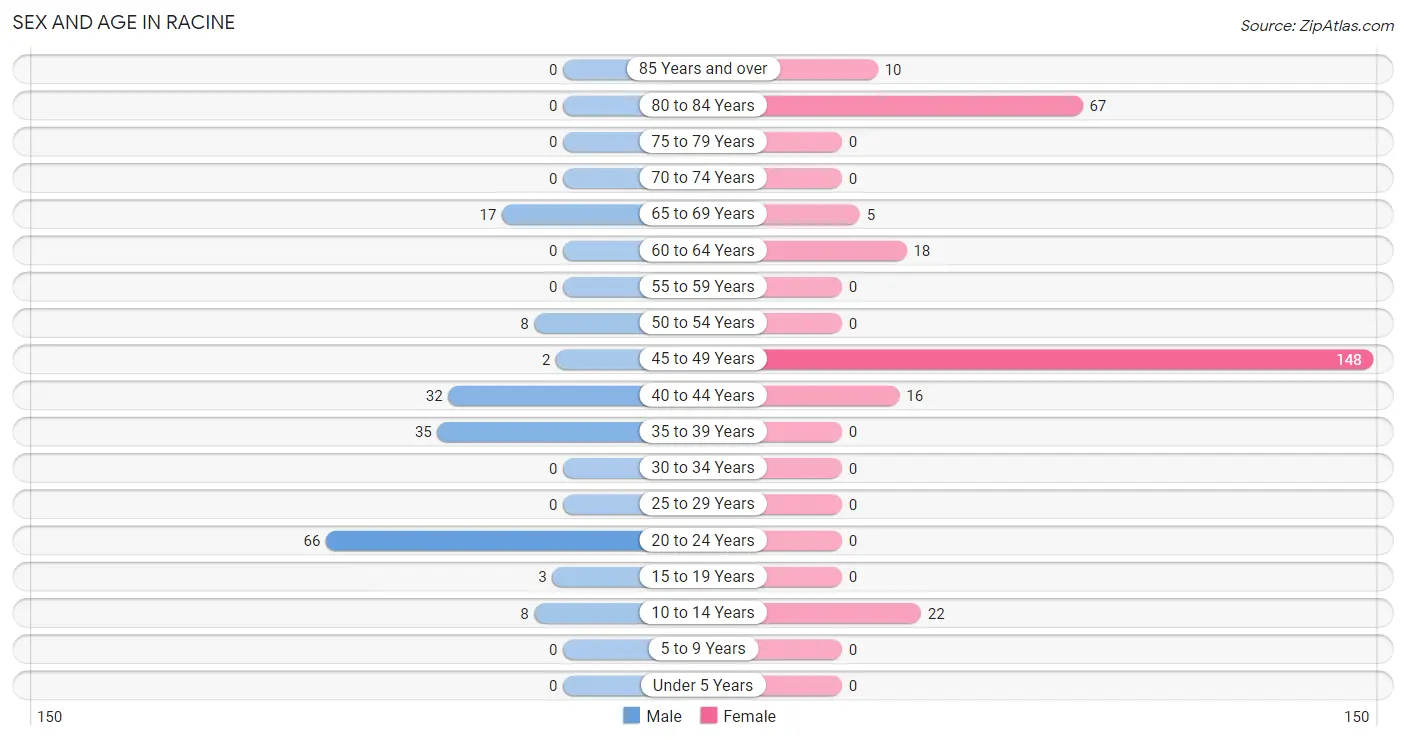
| Age Bracket | Male | Female |
| Under 5 Years | 0 (0.0%) | 0 (0.0%) |
| 5 to 9 Years | 0 (0.0%) | 0 (0.0%) |
| 10 to 14 Years | 8 (4.7%) | 22 (7.7%) |
| 15 to 19 Years | 3 (1.8%) | 0 (0.0%) |
| 20 to 24 Years | 66 (38.6%) | 0 (0.0%) |
| 25 to 29 Years | 0 (0.0%) | 0 (0.0%) |
| 30 to 34 Years | 0 (0.0%) | 0 (0.0%) |
| 35 to 39 Years | 35 (20.5%) | 0 (0.0%) |
| 40 to 44 Years | 32 (18.7%) | 16 (5.6%) |
| 45 to 49 Years | 2 (1.2%) | 148 (51.7%) |
| 50 to 54 Years | 8 (4.7%) | 0 (0.0%) |
| 55 to 59 Years | 0 (0.0%) | 0 (0.0%) |
| 60 to 64 Years | 0 (0.0%) | 18 (6.3%) |
| 65 to 69 Years | 17 (9.9%) | 5 (1.8%) |
| 70 to 74 Years | 0 (0.0%) | 0 (0.0%) |
| 75 to 79 Years | 0 (0.0%) | 0 (0.0%) |
| 80 to 84 Years | 0 (0.0%) | 67 (23.4%) |
| 85 Years and over | 0 (0.0%) | 10 (3.5%) |
| Total | 171 (100.0%) | 286 (100.0%) |
Families and Households in Racine
Median Family Size in Racine
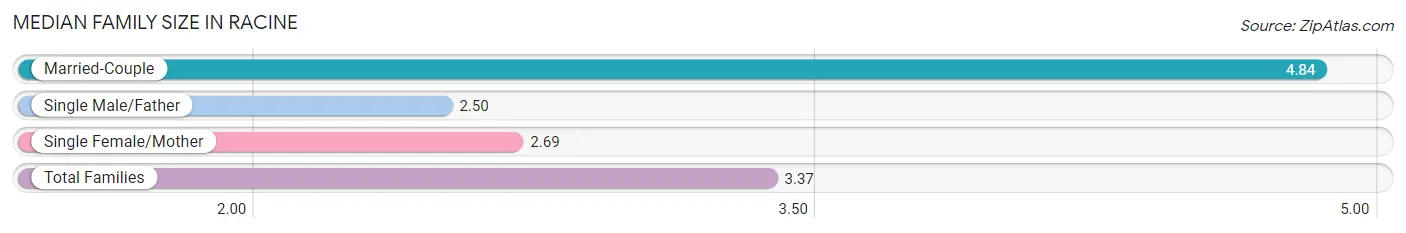
The median family size in Racine is 3.37 persons per family, with married-couple families (25 | 32.1%) accounting for the largest median family size of 4.84 persons per family. On the other hand, single male/father families (2 | 2.6%) represent the smallest median family size with 2.50 persons per family.
| Family Type | # Families | Family Size |
| Married-Couple | 25 (32.1%) | 4.84 |
| Single Male/Father | 2 (2.6%) | 2.50 |
| Single Female/Mother | 51 (65.4%) | 2.69 |
| Total Families | 78 (100.0%) | 3.37 |
Median Household Size in Racine
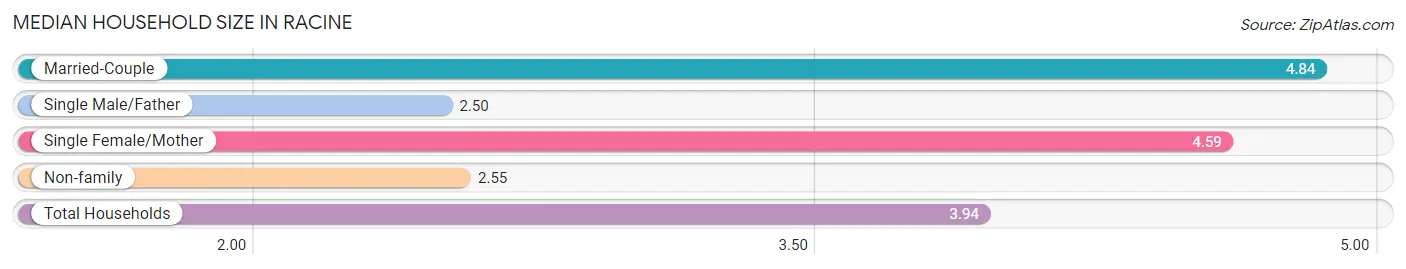
The median household size in Racine is 3.94 persons per household, with married-couple households (25 | 21.5%) accounting for the largest median household size of 4.84 persons per household. single male/father households (2 | 1.7%) represent the smallest median household size with 2.50 persons per household.
| Household Type | # Households | Household Size |
| Married-Couple | 25 (21.5%) | 4.84 |
| Single Male/Father | 2 (1.7%) | 2.50 |
| Single Female/Mother | 51 (44.0%) | 4.59 |
| Non-family | 38 (32.8%) | 2.55 |
| Total Households | 116 (100.0%) | 3.94 |
Household Size by Marriage Status in Racine
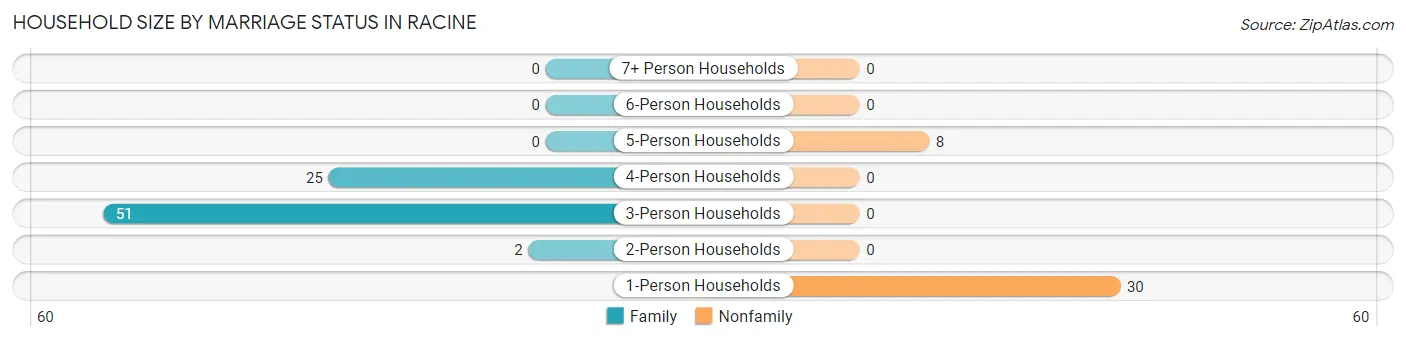
Out of a total of 116 households in Racine, 78 (67.2%) are family households, while 38 (32.8%) are nonfamily households. The most numerous type of family households are 3-person households, comprising 51, and the most common type of nonfamily households are 1-person households, comprising 30.
| Household Size | Family Households | Nonfamily Households |
| 1-Person Households | - | 30 (25.9%) |
| 2-Person Households | 2 (1.7%) | 0 (0.0%) |
| 3-Person Households | 51 (44.0%) | 0 (0.0%) |
| 4-Person Households | 25 (21.5%) | 0 (0.0%) |
| 5-Person Households | 0 (0.0%) | 8 (6.9%) |
| 6-Person Households | 0 (0.0%) | 0 (0.0%) |
| 7+ Person Households | 0 (0.0%) | 0 (0.0%) |
| Total | 78 (67.2%) | 38 (32.8%) |
Female Fertility in Racine
Fertility by Age in Racine
| Age Bracket | Women with Births | Births / 1,000 Women |
| 15 to 19 years | 0 (0.0%) | 0.0 |
| 20 to 34 years | 0 (0.0%) | 0.0 |
| 35 to 50 years | 0 (0.0%) | 0.0 |
| Total | 0 (0.0%) | 0.0 |
Fertility by Age by Marriage Status in Racine
| Age Bracket | Married | Unmarried |
| 15 to 19 years | 0 (0.0%) | 0 (0.0%) |
| 20 to 34 years | 0 (0.0%) | 0 (0.0%) |
| 35 to 50 years | 0 (0.0%) | 0 (0.0%) |
| Total | 0 (0.0%) | 0 (0.0%) |
Fertility by Education in Racine
| Educational Attainment | Women with Births | Births / 1,000 Women |
| Less than High School | 0 (0.0%) | 0.0 |
| High School Diploma | 0 (0.0%) | 0.0 |
| College or Associate's Degree | 0 (0.0%) | 0.0 |
| Bachelor's Degree | 0 (0.0%) | 0.0 |
| Graduate Degree | 0 (0.0%) | 0.0 |
| Total | 0 (0.0%) | 0.0 |
Fertility by Education by Marriage Status in Racine
| Educational Attainment | Married | Unmarried |
| Less than High School | 0 (0.0%) | 0 (0.0%) |
| High School Diploma | 0 (0.0%) | 0 (0.0%) |
| College or Associate's Degree | 0 (0.0%) | 0 (0.0%) |
| Bachelor's Degree | 0 (0.0%) | 0 (0.0%) |
| Graduate Degree | 0 (0.0%) | 0 (0.0%) |
| Total | 0 (0.0%) | 0 (0.0%) |
Employment Characteristics in Racine
Employment by Class of Employer in Racine
Among the 124 employed individuals in Racine, local government employees (51 | 41.1%), private company employees (43 | 34.7%), and self-employed (incorporated) (22 | 17.7%) make up the most common classes of employment.
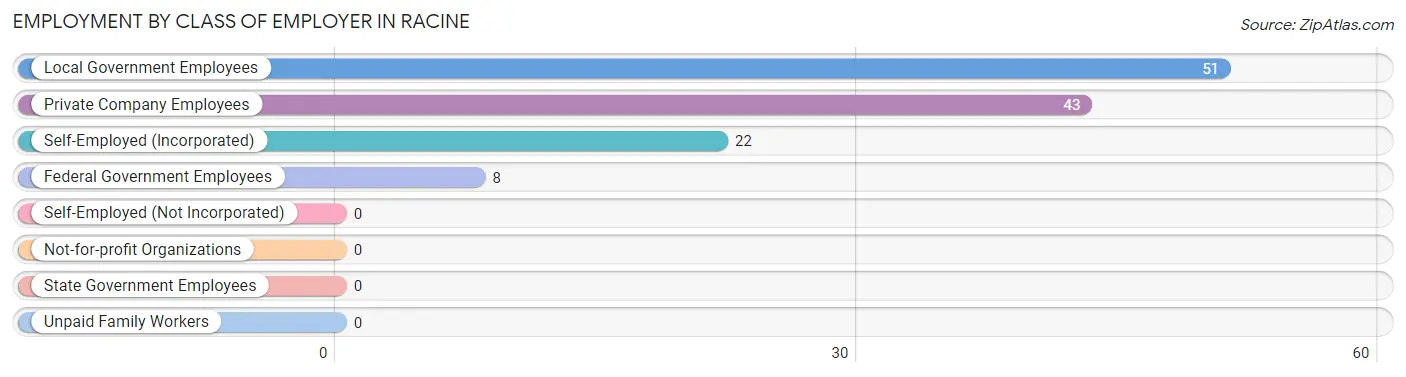
| Employer Class | # Employees | % Employees |
| Private Company Employees | 43 | 34.7% |
| Self-Employed (Incorporated) | 22 | 17.7% |
| Self-Employed (Not Incorporated) | 0 | 0.0% |
| Not-for-profit Organizations | 0 | 0.0% |
| Local Government Employees | 51 | 41.1% |
| State Government Employees | 0 | 0.0% |
| Federal Government Employees | 8 | 6.5% |
| Unpaid Family Workers | 0 | 0.0% |
| Total | 124 | 100.0% |
Employment Status by Age in Racine
According to the labor force statistics for Racine, out of the total population over 16 years of age (427), 51.8% or 221 individuals are in the labor force, with 43.9% or 97 of them unemployed. The age group with the highest labor force participation rate is 45 to 54 years, with 100.0% or 158 individuals in the labor force. Within the labor force, the 45 to 54 years age range has the highest percentage of unemployed individuals, with 61.4% or 97 of them being unemployed.
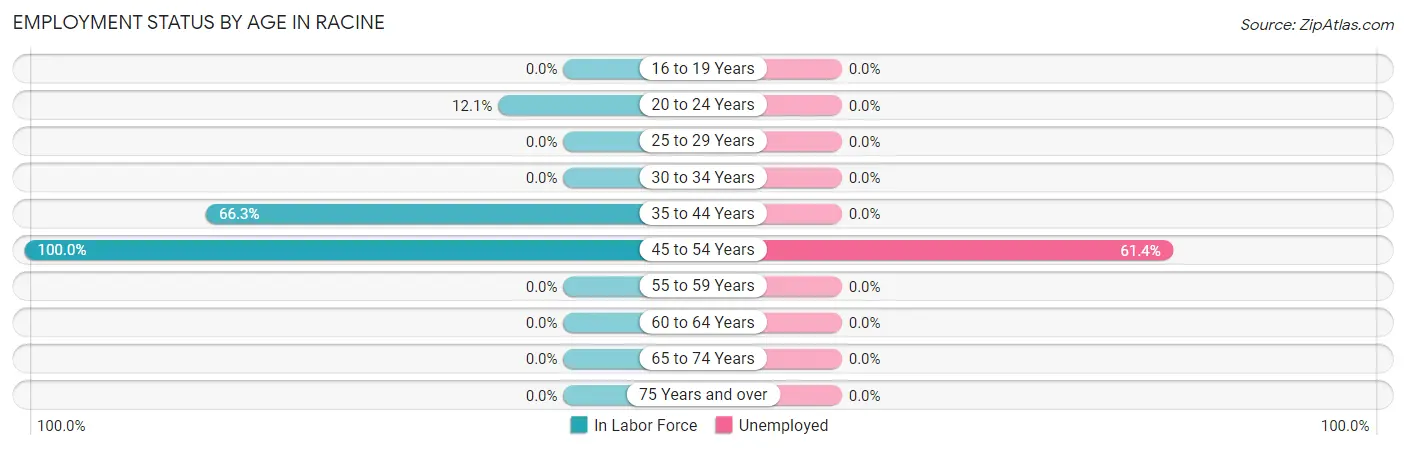
| Age Bracket | In Labor Force | Unemployed |
| 16 to 19 Years | 0 (0.0%) | 0 (0.0%) |
| 20 to 24 Years | 8 (12.1%) | 0 (0.0%) |
| 25 to 29 Years | 0 (0.0%) | 0 (0.0%) |
| 30 to 34 Years | 0 (0.0%) | 0 (0.0%) |
| 35 to 44 Years | 55 (66.3%) | 0 (0.0%) |
| 45 to 54 Years | 158 (100.0%) | 97 (61.4%) |
| 55 to 59 Years | 0 (0.0%) | 0 (0.0%) |
| 60 to 64 Years | 0 (0.0%) | 0 (0.0%) |
| 65 to 74 Years | 0 (0.0%) | 0 (0.0%) |
| 75 Years and over | 0 (0.0%) | 0 (0.0%) |
| Total | 221 (51.8%) | 97 (43.9%) |
Employment Status by Educational Attainment in Racine
According to labor force statistics for Racine, 82.2% of individuals (213) out of the total population between 25 and 64 years of age (259) are in the labor force, with 45.5% or 97 of them being unemployed. The group with the highest labor force participation rate are those with the educational attainment of bachelor's degree or higher, with 100.0% or 5 individuals in the labor force. Within the labor force, individuals with college / associate degree education have the highest percentage of unemployment, with 64.2% or 97 of them being unemployed.
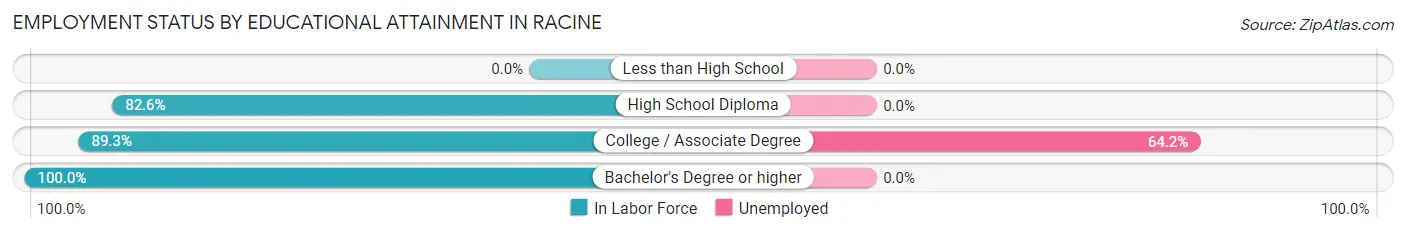
| Educational Attainment | In Labor Force | Unemployed |
| Less than High School | 0 (0.0%) | 0 (0.0%) |
| High School Diploma | 57 (82.6%) | 0 (0.0%) |
| College / Associate Degree | 151 (89.3%) | 108 (64.2%) |
| Bachelor's Degree or higher | 5 (100.0%) | 0 (0.0%) |
| Total | 213 (82.2%) | 118 (45.5%) |
Employment Occupations by Sex in Racine
Management, Business, Science and Arts Occupations
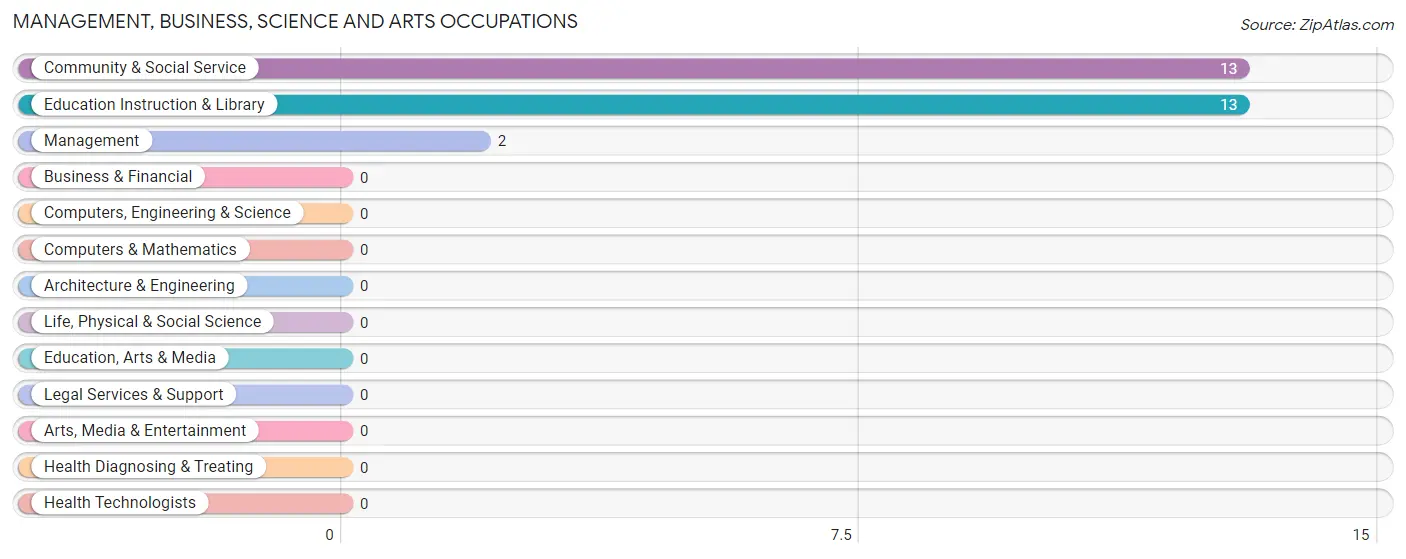
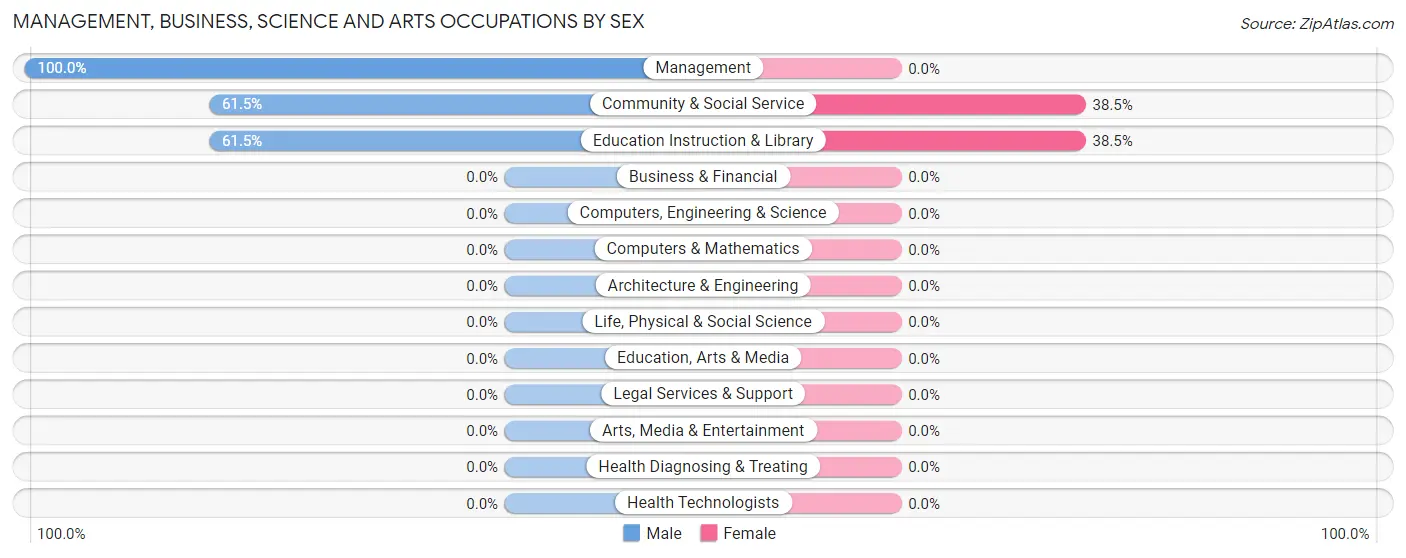
The most common Management, Business, Science and Arts occupations in Racine are Community & Social Service (13 | 10.5%), Education Instruction & Library (13 | 10.5%), and Management (2 | 1.6%).
Management, Business, Science and Arts Occupations by Sex
Within the Management, Business, Science and Arts occupations in Racine, the most male-oriented occupations are Management (100.0%), Community & Social Service (61.5%), and Education Instruction & Library (61.5%), while the most female-oriented occupations are Community & Social Service (38.5%), and Education Instruction & Library (38.5%).
| Occupation | Male | Female |
| Management | 2 (100.0%) | 0 (0.0%) |
| Business & Financial | 0 (0.0%) | 0 (0.0%) |
| Computers, Engineering & Science | 0 (0.0%) | 0 (0.0%) |
| Computers & Mathematics | 0 (0.0%) | 0 (0.0%) |
| Architecture & Engineering | 0 (0.0%) | 0 (0.0%) |
| Life, Physical & Social Science | 0 (0.0%) | 0 (0.0%) |
| Community & Social Service | 8 (61.5%) | 5 (38.5%) |
| Education, Arts & Media | 0 (0.0%) | 0 (0.0%) |
| Legal Services & Support | 0 (0.0%) | 0 (0.0%) |
| Education Instruction & Library | 8 (61.5%) | 5 (38.5%) |
| Arts, Media & Entertainment | 0 (0.0%) | 0 (0.0%) |
| Health Diagnosing & Treating | 0 (0.0%) | 0 (0.0%) |
| Health Technologists | 0 (0.0%) | 0 (0.0%) |
| Total (Category) | 10 (66.7%) | 5 (33.3%) |
| Total (Overall) | 73 (58.9%) | 51 (41.1%) |
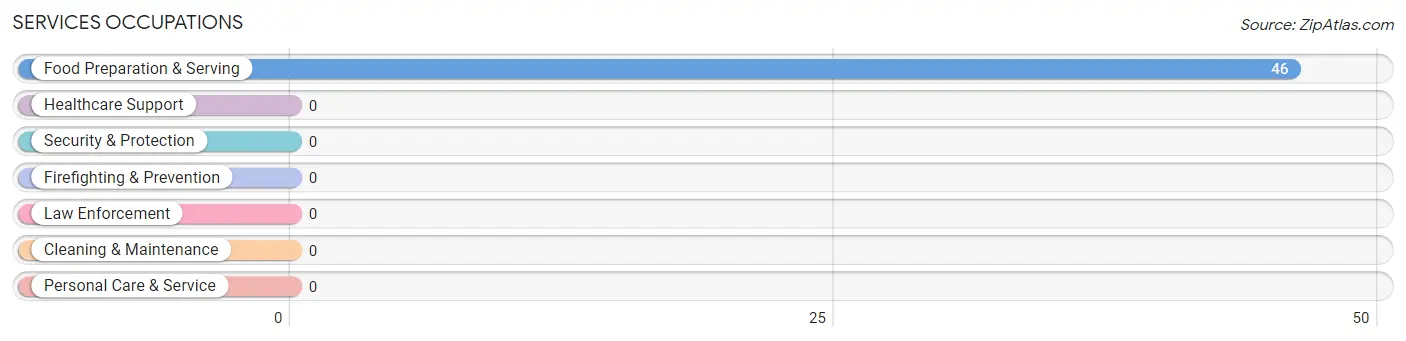
Services Occupations
The most common Services occupations in Racine are , and Food Preparation & Serving (46 | 37.1%).
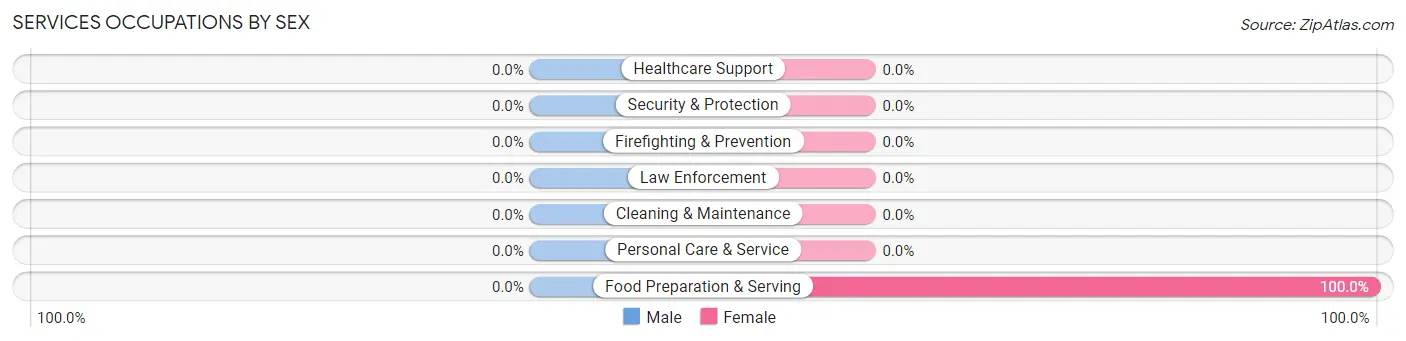
Services Occupations by Sex
| Occupation | Male | Female |
| Healthcare Support | 0 (0.0%) | 0 (0.0%) |
| Security & Protection | 0 (0.0%) | 0 (0.0%) |
| Firefighting & Prevention | 0 (0.0%) | 0 (0.0%) |
| Law Enforcement | 0 (0.0%) | 0 (0.0%) |
| Food Preparation & Serving | 0 (0.0%) | 46 (100.0%) |
| Cleaning & Maintenance | 0 (0.0%) | 0 (0.0%) |
| Personal Care & Service | 0 (0.0%) | 0 (0.0%) |
| Total (Category) | 0 (0.0%) | 46 (100.0%) |
| Total (Overall) | 73 (58.9%) | 51 (41.1%) |
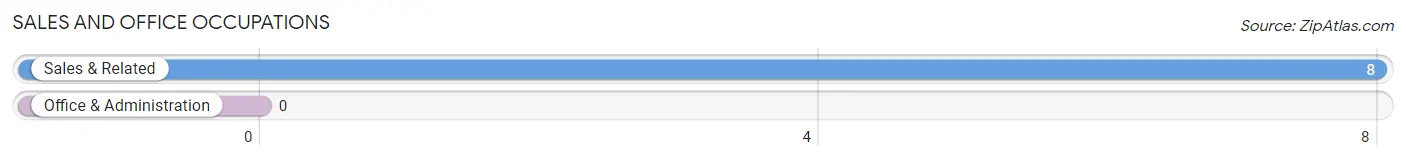
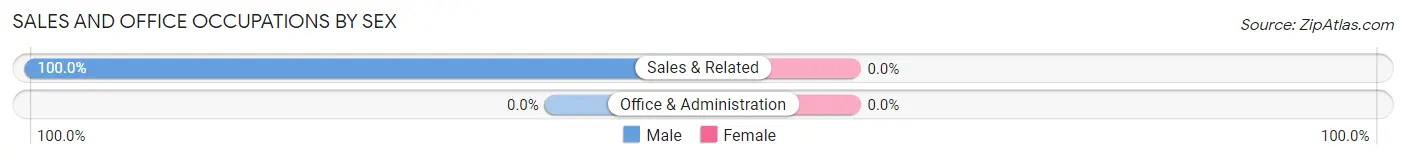
Sales and Office Occupations
The most common Sales and Office occupations in Racine are , and Sales & Related (8 | 6.5%).
Sales and Office Occupations by Sex
| Occupation | Male | Female |
| Sales & Related | 8 (100.0%) | 0 (0.0%) |
| Office & Administration | 0 (0.0%) | 0 (0.0%) |
| Total (Category) | 8 (100.0%) | 0 (0.0%) |
| Total (Overall) | 73 (58.9%) | 51 (41.1%) |
Natural Resources, Construction and Maintenance Occupations
The most common Natural Resources, Construction and Maintenance occupations in Racine are , and Installation, Maintenance & Repair (20 | 16.1%).
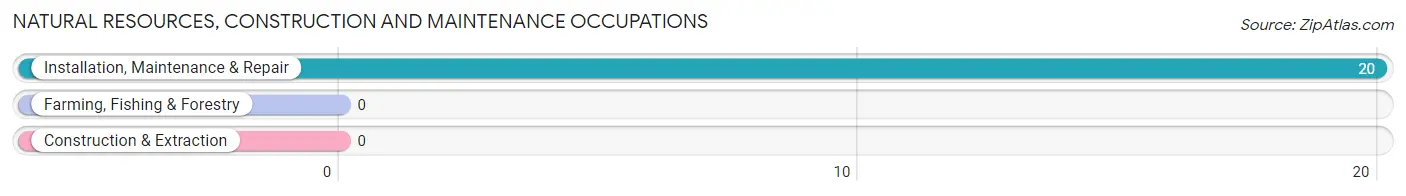
Natural Resources, Construction and Maintenance Occupations by Sex
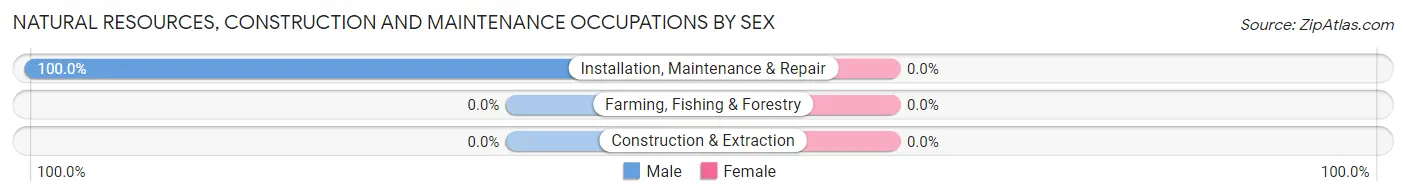
| Occupation | Male | Female |
| Farming, Fishing & Forestry | 0 (0.0%) | 0 (0.0%) |
| Construction & Extraction | 0 (0.0%) | 0 (0.0%) |
| Installation, Maintenance & Repair | 20 (100.0%) | 0 (0.0%) |
| Total (Category) | 20 (100.0%) | 0 (0.0%) |
| Total (Overall) | 73 (58.9%) | 51 (41.1%) |
Production, Transportation and Moving Occupations
The most common Production, Transportation and Moving occupations in Racine are , and Transportation (35 | 28.2%).
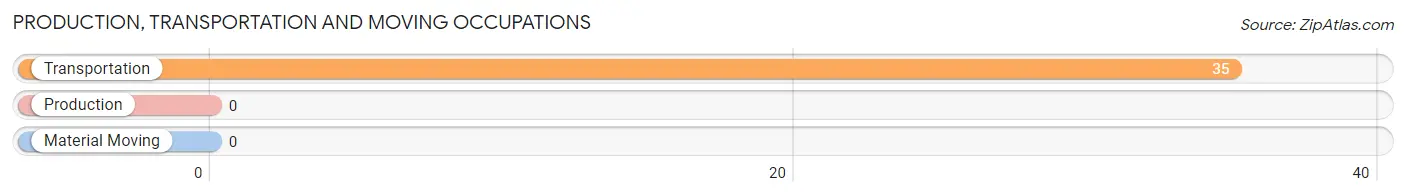
Production, Transportation and Moving Occupations by Sex
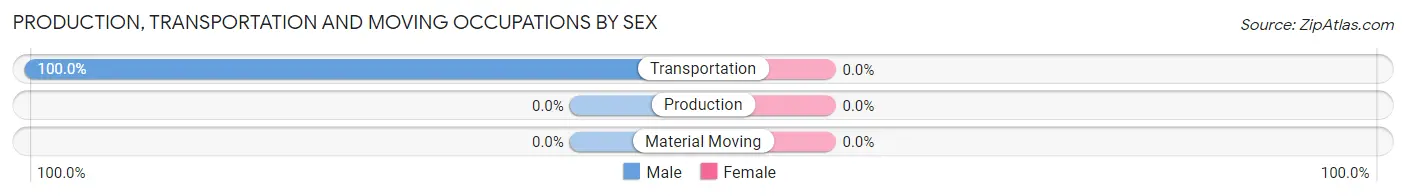
| Occupation | Male | Female |
| Production | 0 (0.0%) | 0 (0.0%) |
| Transportation | 35 (100.0%) | 0 (0.0%) |
| Material Moving | 0 (0.0%) | 0 (0.0%) |
| Total (Category) | 35 (100.0%) | 0 (0.0%) |
| Total (Overall) | 73 (58.9%) | 51 (41.1%) |
Employment Industries by Sex in Racine
Employment Industries in Racine
The major employment industries in Racine include Educational Services (51 | 41.1%), Transportation & Warehousing (43 | 34.7%), Construction (20 | 16.1%), Retail Trade (8 | 6.5%), and Administrative & Support (2 | 1.6%).
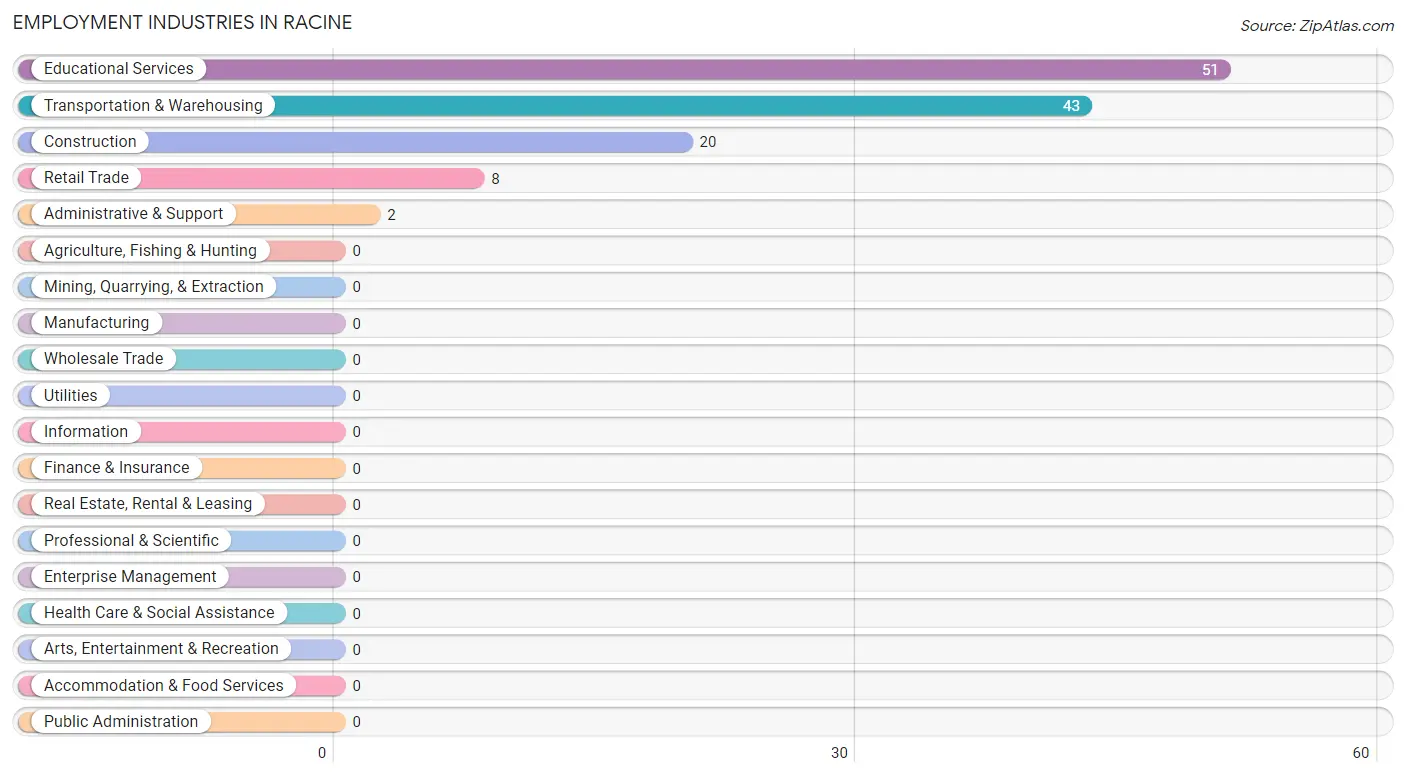
Employment Industries by Sex in Racine
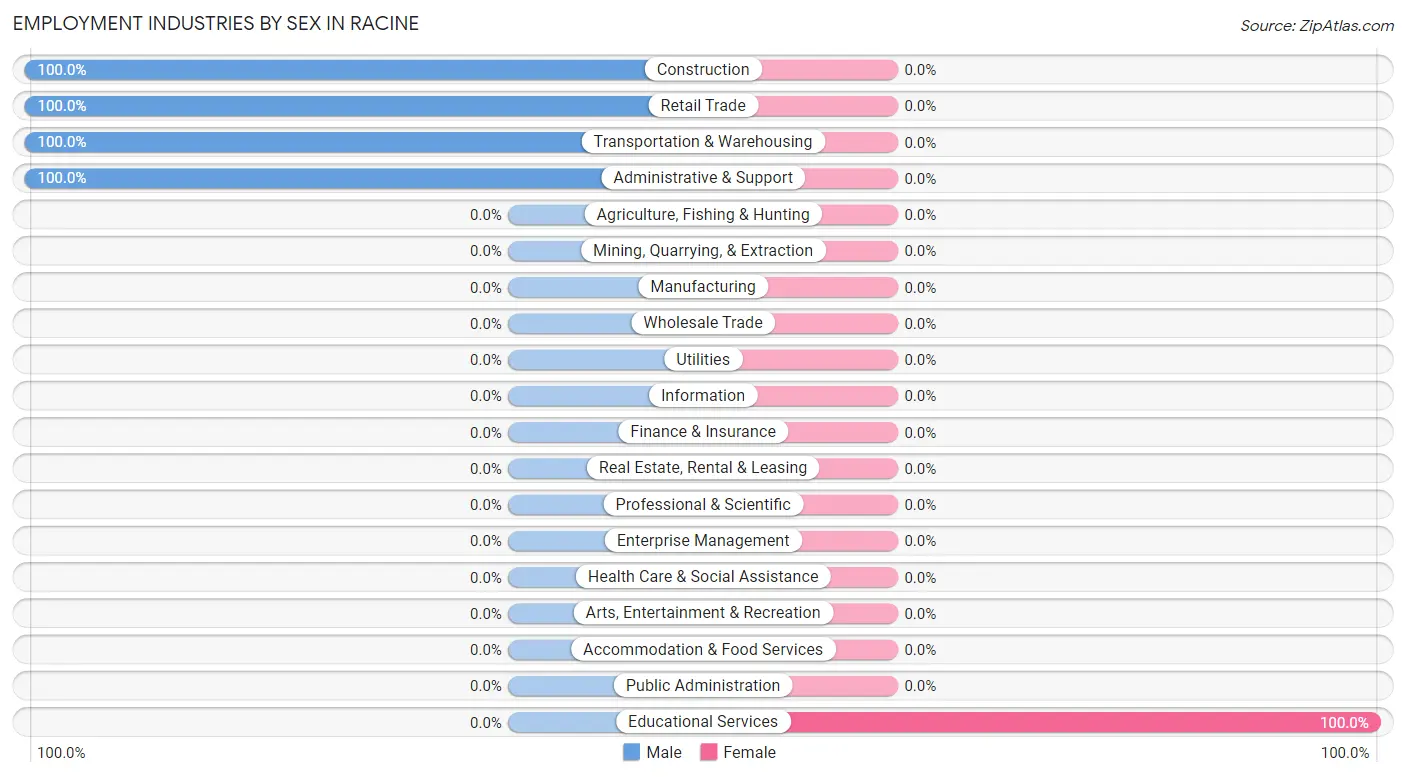
| Industry | Male | Female |
| Agriculture, Fishing & Hunting | 0 (0.0%) | 0 (0.0%) |
| Mining, Quarrying, & Extraction | 0 (0.0%) | 0 (0.0%) |
| Construction | 20 (100.0%) | 0 (0.0%) |
| Manufacturing | 0 (0.0%) | 0 (0.0%) |
| Wholesale Trade | 0 (0.0%) | 0 (0.0%) |
| Retail Trade | 8 (100.0%) | 0 (0.0%) |
| Transportation & Warehousing | 43 (100.0%) | 0 (0.0%) |
| Utilities | 0 (0.0%) | 0 (0.0%) |
| Information | 0 (0.0%) | 0 (0.0%) |
| Finance & Insurance | 0 (0.0%) | 0 (0.0%) |
| Real Estate, Rental & Leasing | 0 (0.0%) | 0 (0.0%) |
| Professional & Scientific | 0 (0.0%) | 0 (0.0%) |
| Enterprise Management | 0 (0.0%) | 0 (0.0%) |
| Administrative & Support | 2 (100.0%) | 0 (0.0%) |
| Educational Services | 0 (0.0%) | 51 (100.0%) |
| Health Care & Social Assistance | 0 (0.0%) | 0 (0.0%) |
| Arts, Entertainment & Recreation | 0 (0.0%) | 0 (0.0%) |
| Accommodation & Food Services | 0 (0.0%) | 0 (0.0%) |
| Public Administration | 0 (0.0%) | 0 (0.0%) |
| Total | 73 (58.9%) | 51 (41.1%) |
Education in Racine
School Enrollment in Racine
The most common levels of schooling among the 88 students in Racine are college / undergraduate (58 | 65.9%), elementary school (22 | 25.0%), and middle school (8 | 9.1%).
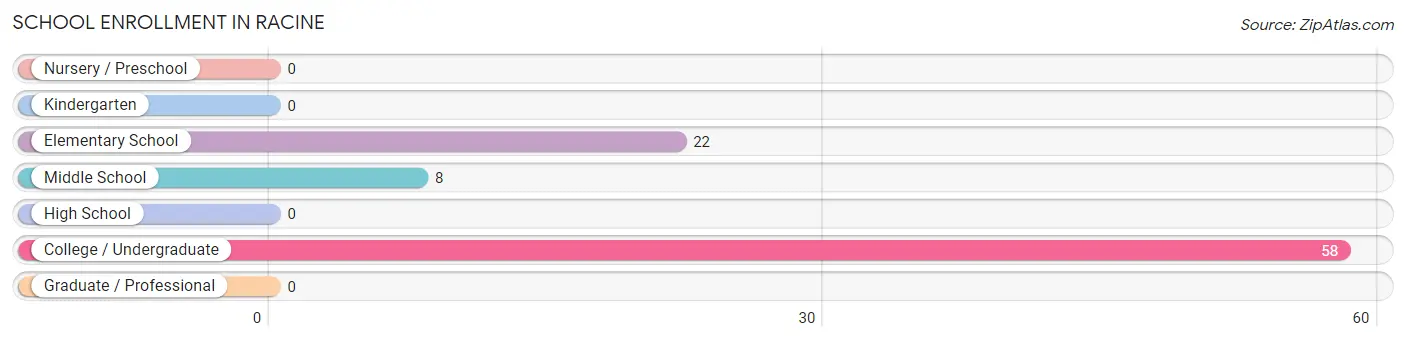
| School Level | # Students | % Students |
| Nursery / Preschool | 0 | 0.0% |
| Kindergarten | 0 | 0.0% |
| Elementary School | 22 | 25.0% |
| Middle School | 8 | 9.1% |
| High School | 0 | 0.0% |
| College / Undergraduate | 58 | 65.9% |
| Graduate / Professional | 0 | 0.0% |
| Total | 88 | 100.0% |
School Enrollment by Age by Funding Source in Racine
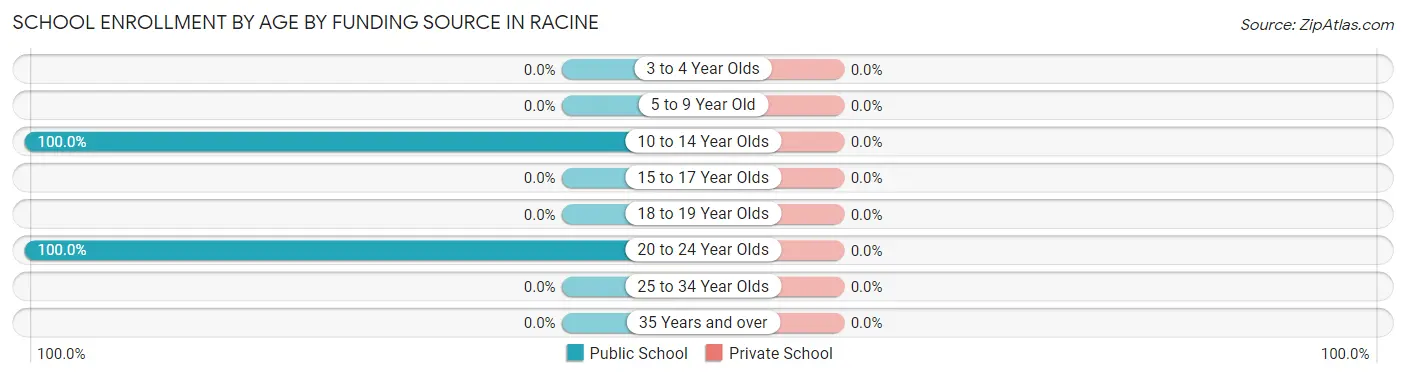
| Age Bracket | Public School | Private School |
| 3 to 4 Year Olds | 0 (0.0%) | 0 (0.0%) |
| 5 to 9 Year Old | 0 (0.0%) | 0 (0.0%) |
| 10 to 14 Year Olds | 30 (100.0%) | 0 (0.0%) |
| 15 to 17 Year Olds | 0 (0.0%) | 0 (0.0%) |
| 18 to 19 Year Olds | 0 (0.0%) | 0 (0.0%) |
| 20 to 24 Year Olds | 58 (100.0%) | 0 (0.0%) |
| 25 to 34 Year Olds | 0 (0.0%) | 0 (0.0%) |
| 35 Years and over | 0 (0.0%) | 0 (0.0%) |
| Total | 88 (100.0%) | 0 (0.0%) |
Educational Attainment by Field of Study in Racine
, and education (50 | 100.0%) are the most common fields of study among 50 individuals in Racine who have obtained a bachelor's degree or higher.
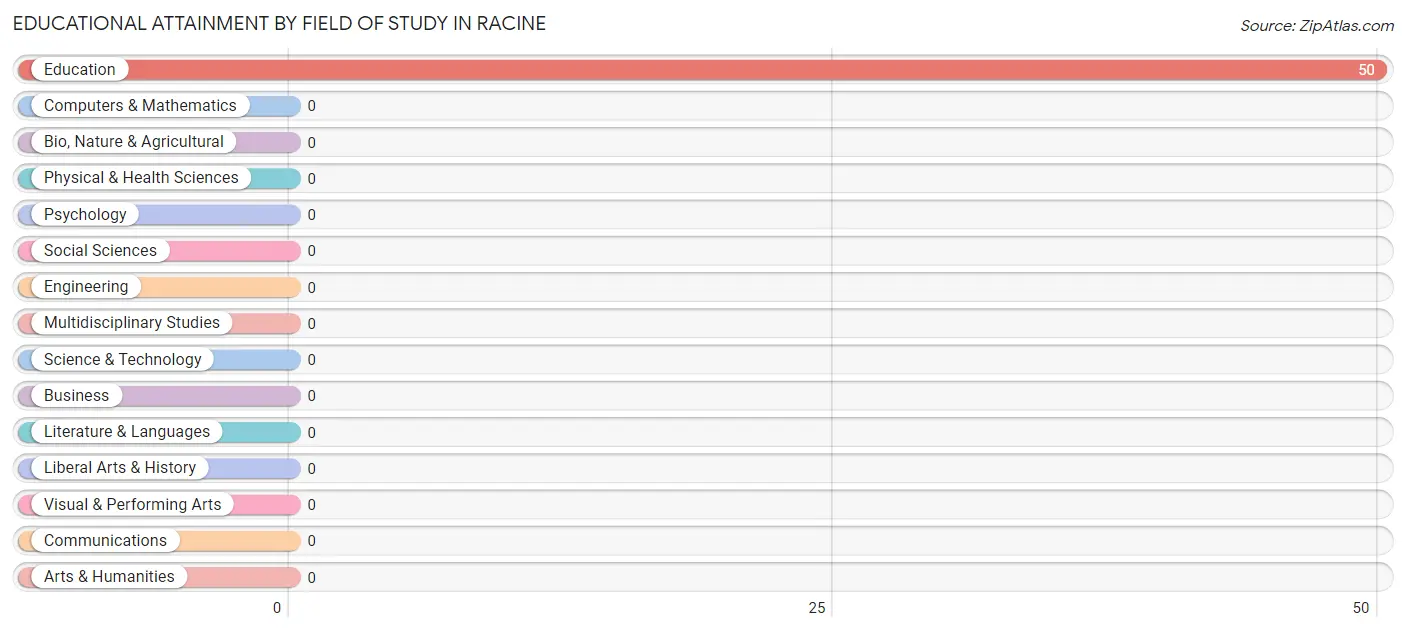
| Field of Study | # Graduates | % Graduates |
| Computers & Mathematics | 0 | 0.0% |
| Bio, Nature & Agricultural | 0 | 0.0% |
| Physical & Health Sciences | 0 | 0.0% |
| Psychology | 0 | 0.0% |
| Social Sciences | 0 | 0.0% |
| Engineering | 0 | 0.0% |
| Multidisciplinary Studies | 0 | 0.0% |
| Science & Technology | 0 | 0.0% |
| Business | 0 | 0.0% |
| Education | 50 | 100.0% |
| Literature & Languages | 0 | 0.0% |
| Liberal Arts & History | 0 | 0.0% |
| Visual & Performing Arts | 0 | 0.0% |
| Communications | 0 | 0.0% |
| Arts & Humanities | 0 | 0.0% |
| Total | 50 | 100.0% |
Transportation & Commute in Racine
Vehicle Availability by Sex in Racine
The most prevalent vehicle ownership categories in Racine are males with 3 vehicles (71, accounting for 97.3%) and females with 3 vehicles (5, making up 139.2%).
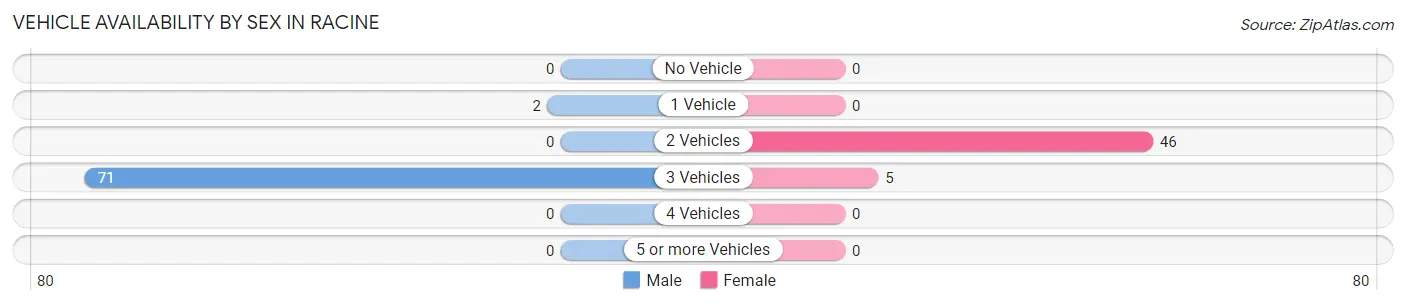
| Vehicles Available | Male | Female |
| No Vehicle | 0 (0.0%) | 0 (0.0%) |
| 1 Vehicle | 2 (2.7%) | 0 (0.0%) |
| 2 Vehicles | 0 (0.0%) | 46 (90.2%) |
| 3 Vehicles | 71 (97.3%) | 5 (9.8%) |
| 4 Vehicles | 0 (0.0%) | 0 (0.0%) |
| 5 or more Vehicles | 0 (0.0%) | 0 (0.0%) |
| Total | 73 (100.0%) | 51 (100.0%) |
Commute Time in Racine
The most frequently occuring commute durations in Racine are 5 to 9 minutes (59 commuters, 56.7%), 10 to 14 minutes (35 commuters, 33.7%), and 30 to 34 minutes (8 commuters, 7.7%).
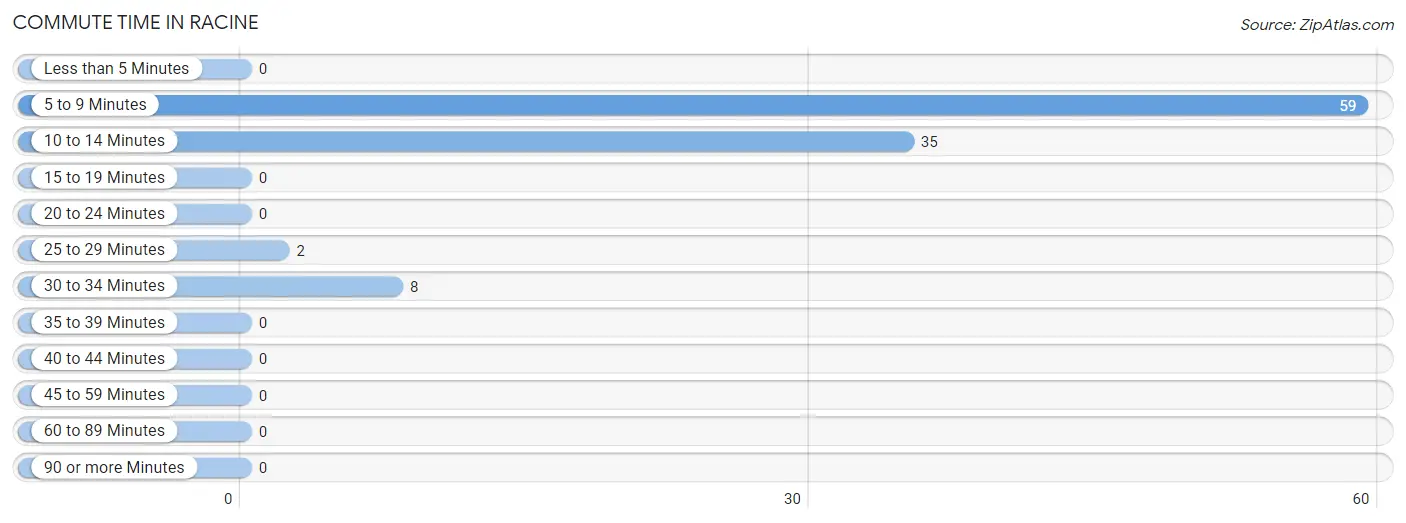
| Commute Time | # Commuters | % Commuters |
| Less than 5 Minutes | 0 | 0.0% |
| 5 to 9 Minutes | 59 | 56.7% |
| 10 to 14 Minutes | 35 | 33.7% |
| 15 to 19 Minutes | 0 | 0.0% |
| 20 to 24 Minutes | 0 | 0.0% |
| 25 to 29 Minutes | 2 | 1.9% |
| 30 to 34 Minutes | 8 | 7.7% |
| 35 to 39 Minutes | 0 | 0.0% |
| 40 to 44 Minutes | 0 | 0.0% |
| 45 to 59 Minutes | 0 | 0.0% |
| 60 to 89 Minutes | 0 | 0.0% |
| 90 or more Minutes | 0 | 0.0% |
Commute Time by Sex in Racine
The most common commute times in Racine are 10 to 14 minutes (35 commuters, 66.0%) for males and 5 to 9 minutes (51 commuters, 100.0%) for females.
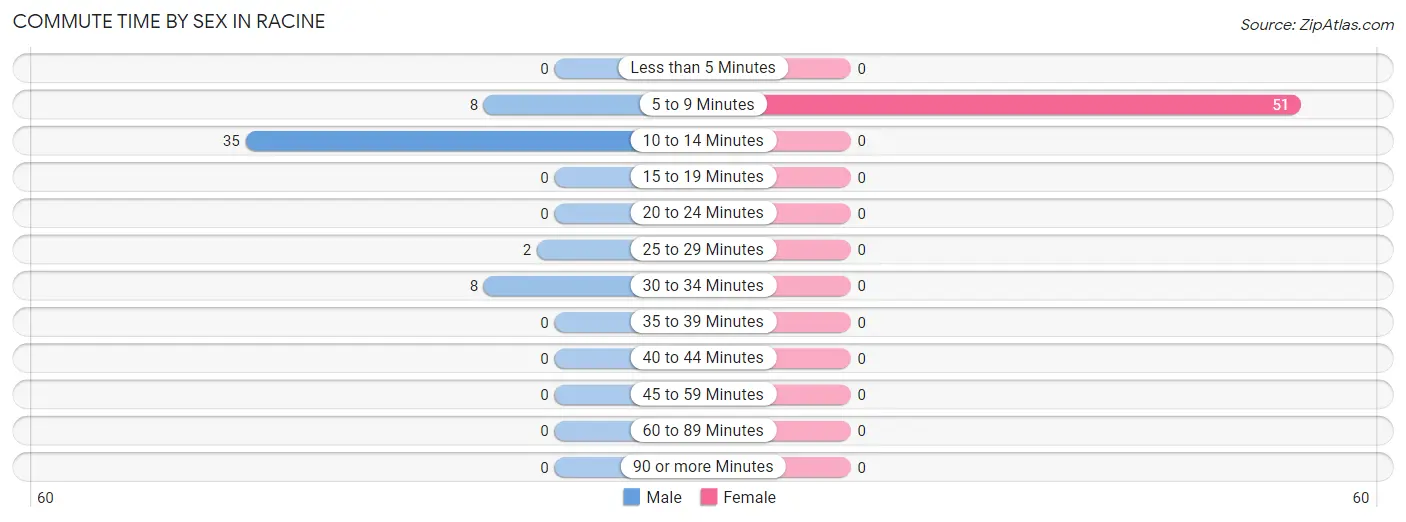
| Commute Time | Male | Female |
| Less than 5 Minutes | 0 (0.0%) | 0 (0.0%) |
| 5 to 9 Minutes | 8 (15.1%) | 51 (100.0%) |
| 10 to 14 Minutes | 35 (66.0%) | 0 (0.0%) |
| 15 to 19 Minutes | 0 (0.0%) | 0 (0.0%) |
| 20 to 24 Minutes | 0 (0.0%) | 0 (0.0%) |
| 25 to 29 Minutes | 2 (3.8%) | 0 (0.0%) |
| 30 to 34 Minutes | 8 (15.1%) | 0 (0.0%) |
| 35 to 39 Minutes | 0 (0.0%) | 0 (0.0%) |
| 40 to 44 Minutes | 0 (0.0%) | 0 (0.0%) |
| 45 to 59 Minutes | 0 (0.0%) | 0 (0.0%) |
| 60 to 89 Minutes | 0 (0.0%) | 0 (0.0%) |
| 90 or more Minutes | 0 (0.0%) | 0 (0.0%) |
Time of Departure to Work by Sex in Racine
The most frequent times of departure to work in Racine are 12:00 AM to 4:59 AM (35, 66.0%) for males and 5:00 AM to 5:29 AM (46, 90.2%) for females.
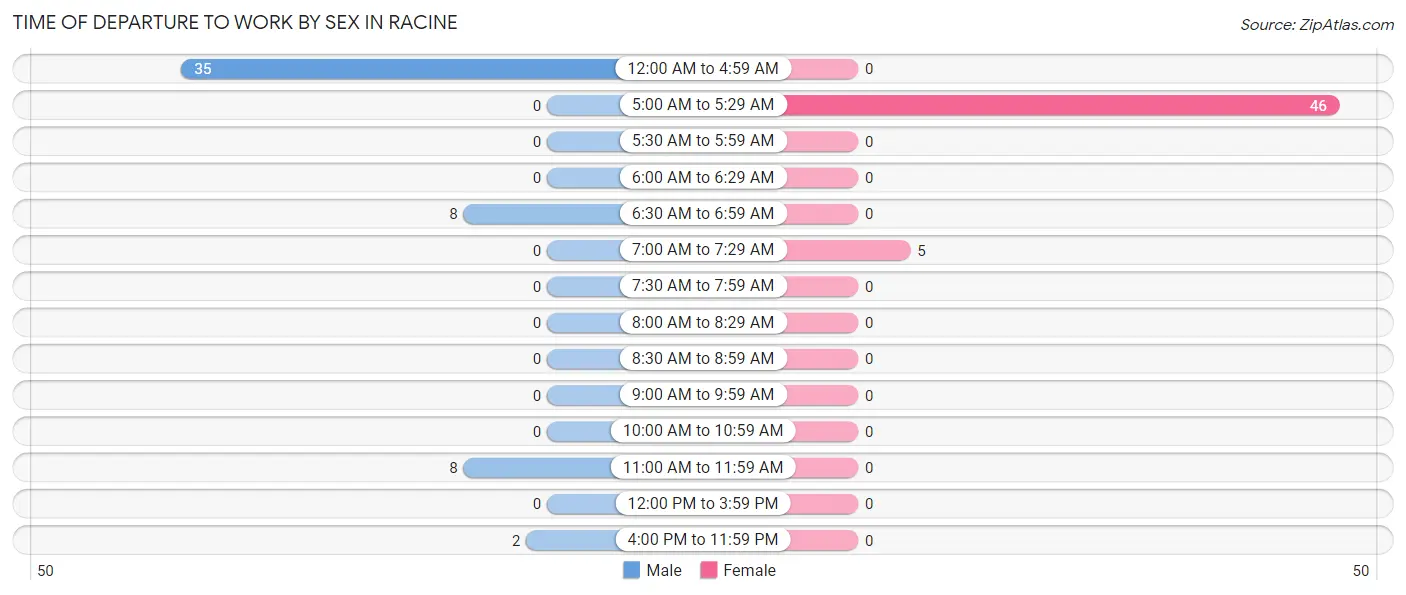
| Time of Departure | Male | Female |
| 12:00 AM to 4:59 AM | 35 (66.0%) | 0 (0.0%) |
| 5:00 AM to 5:29 AM | 0 (0.0%) | 46 (90.2%) |
| 5:30 AM to 5:59 AM | 0 (0.0%) | 0 (0.0%) |
| 6:00 AM to 6:29 AM | 0 (0.0%) | 0 (0.0%) |
| 6:30 AM to 6:59 AM | 8 (15.1%) | 0 (0.0%) |
| 7:00 AM to 7:29 AM | 0 (0.0%) | 5 (9.8%) |
| 7:30 AM to 7:59 AM | 0 (0.0%) | 0 (0.0%) |
| 8:00 AM to 8:29 AM | 0 (0.0%) | 0 (0.0%) |
| 8:30 AM to 8:59 AM | 0 (0.0%) | 0 (0.0%) |
| 9:00 AM to 9:59 AM | 0 (0.0%) | 0 (0.0%) |
| 10:00 AM to 10:59 AM | 0 (0.0%) | 0 (0.0%) |
| 11:00 AM to 11:59 AM | 8 (15.1%) | 0 (0.0%) |
| 12:00 PM to 3:59 PM | 0 (0.0%) | 0 (0.0%) |
| 4:00 PM to 11:59 PM | 2 (3.8%) | 0 (0.0%) |
| Total | 53 (100.0%) | 51 (100.0%) |
Housing Occupancy in Racine
Occupancy by Ownership in Racine
Of the total 116 dwellings in Racine, owner-occupied units account for 116 (100.0%), while renter-occupied units make up 0 (0.0%).
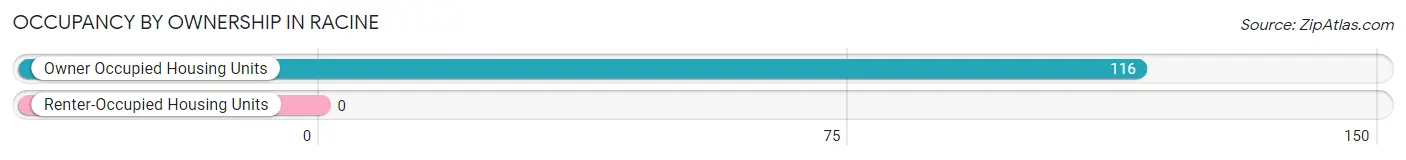
| Occupancy | # Housing Units | % Housing Units |
| Owner Occupied Housing Units | 116 | 100.0% |
| Renter-Occupied Housing Units | 0 | 0.0% |
| Total Occupied Housing Units | 116 | 100.0% |
Occupancy by Household Size in Racine

| Household Size | # Housing Units | % Housing Units |
| 1-Person Household | 30 | 25.9% |
| 2-Person Household | 2 | 1.7% |
| 3-Person Household | 51 | 44.0% |
| 4+ Person Household | 33 | 28.4% |
| Total Housing Units | 116 | 100.0% |
Occupancy by Ownership by Household Size in Racine
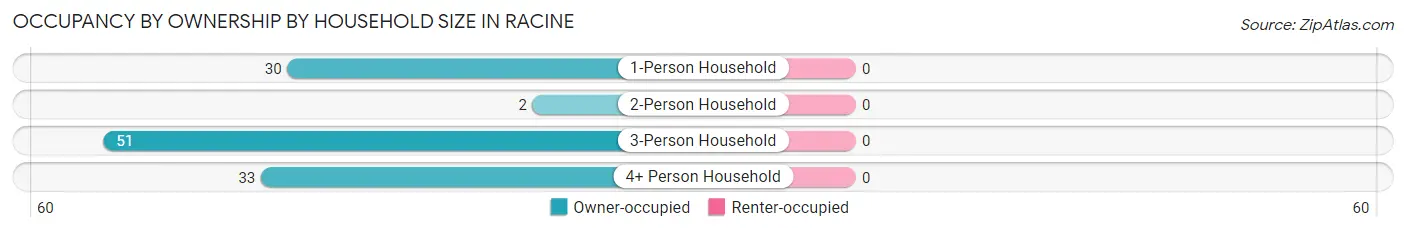
| Household Size | Owner-occupied | Renter-occupied |
| 1-Person Household | 30 (100.0%) | 0 (0.0%) |
| 2-Person Household | 2 (100.0%) | 0 (0.0%) |
| 3-Person Household | 51 (100.0%) | 0 (0.0%) |
| 4+ Person Household | 33 (100.0%) | 0 (0.0%) |
| Total Housing Units | 116 (100.0%) | 0 (0.0%) |
Occupancy by Educational Attainment in Racine
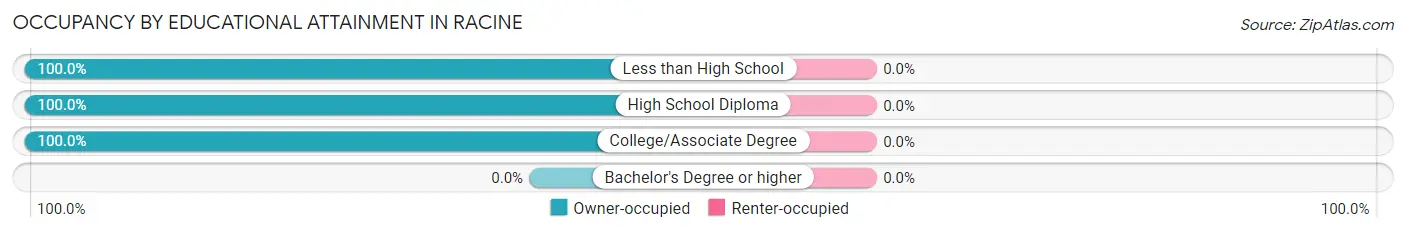
| Household Size | Owner-occupied | Renter-occupied |
| Less than High School | 18 (100.0%) | 0 (0.0%) |
| High School Diploma | 27 (100.0%) | 0 (0.0%) |
| College/Associate Degree | 71 (100.0%) | 0 (0.0%) |
| Bachelor's Degree or higher | 0 (0.0%) | 0 (0.0%) |
Occupancy by Age of Householder in Racine
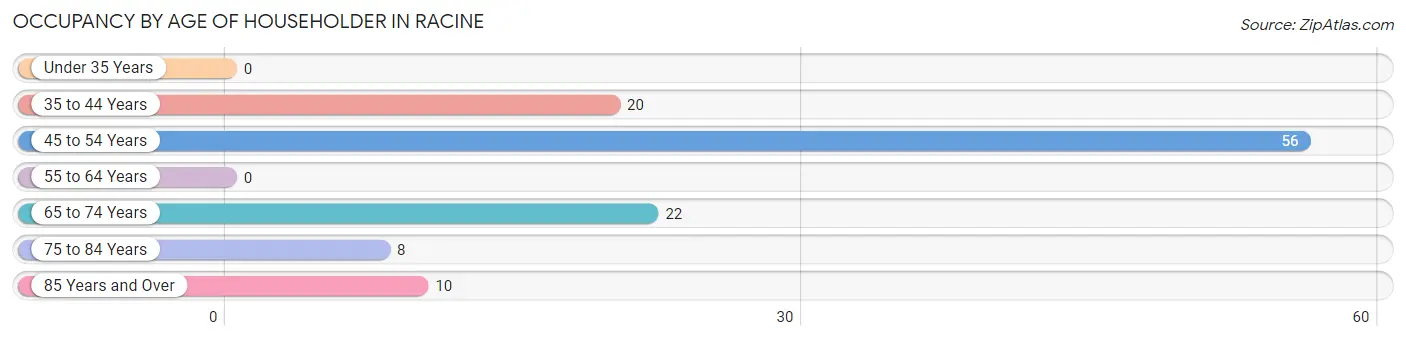
| Age Bracket | # Households | % Households |
| Under 35 Years | 0 | 0.0% |
| 35 to 44 Years | 20 | 17.2% |
| 45 to 54 Years | 56 | 48.3% |
| 55 to 64 Years | 0 | 0.0% |
| 65 to 74 Years | 22 | 19.0% |
| 75 to 84 Years | 8 | 6.9% |
| 85 Years and Over | 10 | 8.6% |
| Total | 116 | 100.0% |
Housing Finances in Racine
Median Income by Occupancy in Racine
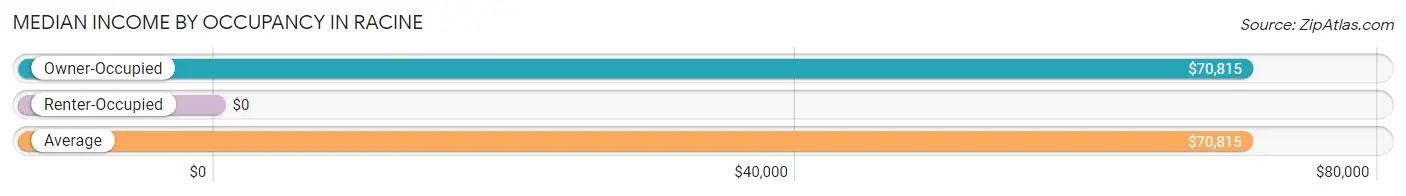
| Occupancy Type | # Households | Median Income |
| Owner-Occupied | 116 (100.0%) | $70,815 |
| Renter-Occupied | 0 (0.0%) | $0 |
| Average | 116 (100.0%) | $70,815 |
Occupancy by Householder Income Bracket in Racine
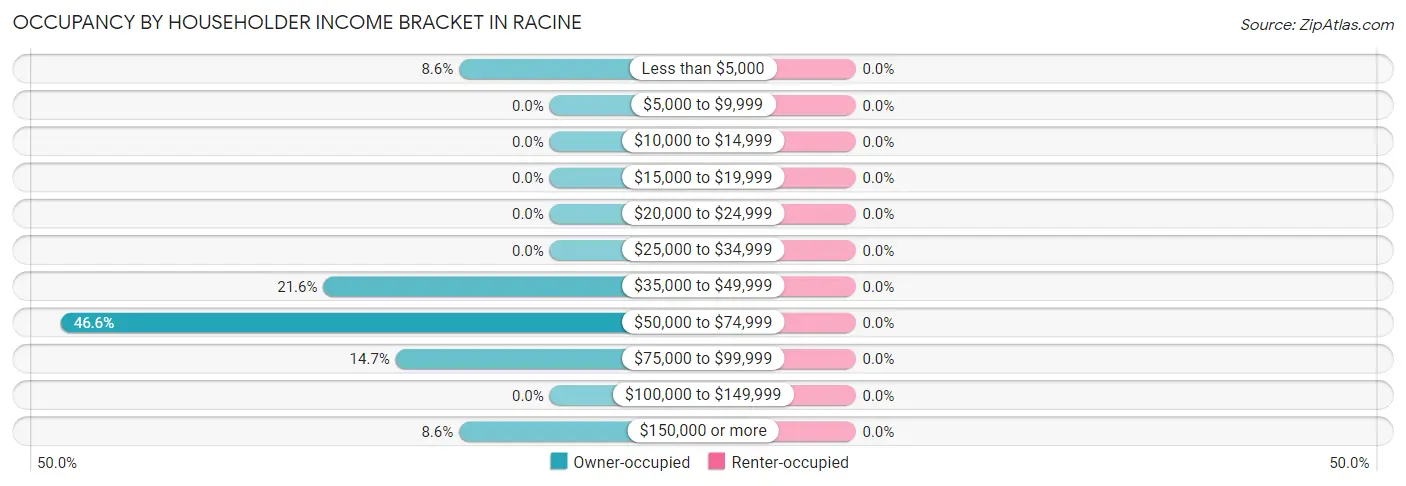
| Income Bracket | Owner-occupied | Renter-occupied |
| Less than $5,000 | 10 (8.6%) | 0 (0.0%) |
| $5,000 to $9,999 | 0 (0.0%) | 0 (0.0%) |
| $10,000 to $14,999 | 0 (0.0%) | 0 (0.0%) |
| $15,000 to $19,999 | 0 (0.0%) | 0 (0.0%) |
| $20,000 to $24,999 | 0 (0.0%) | 0 (0.0%) |
| $25,000 to $34,999 | 0 (0.0%) | 0 (0.0%) |
| $35,000 to $49,999 | 25 (21.5%) | 0 (0.0%) |
| $50,000 to $74,999 | 54 (46.6%) | 0 (0.0%) |
| $75,000 to $99,999 | 17 (14.7%) | 0 (0.0%) |
| $100,000 to $149,999 | 0 (0.0%) | 0 (0.0%) |
| $150,000 or more | 10 (8.6%) | 0 (0.0%) |
| Total | 116 (100.0%) | 0 (0.0%) |
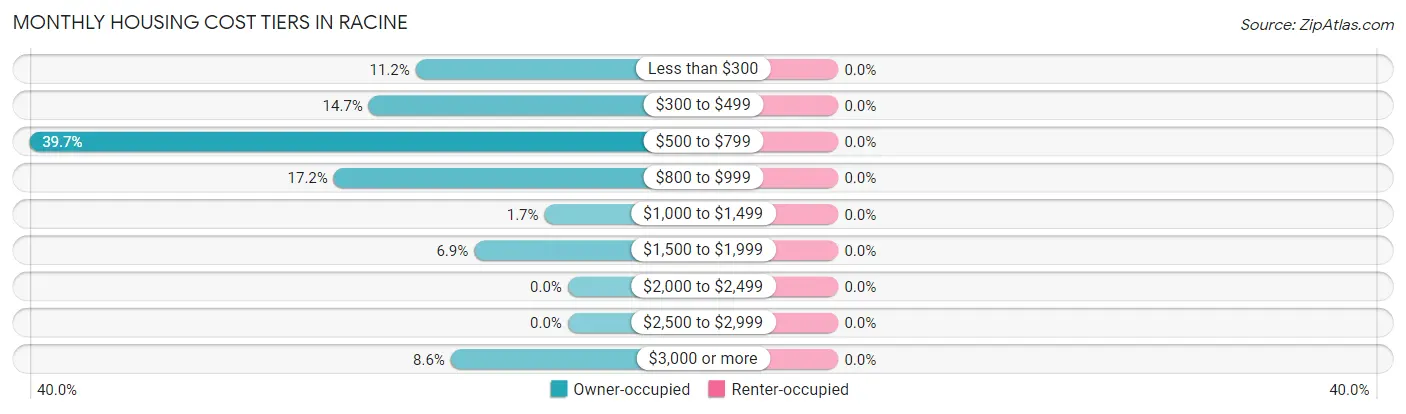
Monthly Housing Cost Tiers in Racine
| Monthly Cost | Owner-occupied | Renter-occupied |
| Less than $300 | 13 (11.2%) | 0 (0.0%) |
| $300 to $499 | 17 (14.7%) | 0 (0.0%) |
| $500 to $799 | 46 (39.7%) | 0 (0.0%) |
| $800 to $999 | 20 (17.2%) | 0 (0.0%) |
| $1,000 to $1,499 | 2 (1.7%) | 0 (0.0%) |
| $1,500 to $1,999 | 8 (6.9%) | 0 (0.0%) |
| $2,000 to $2,499 | 0 (0.0%) | 0 (0.0%) |
| $2,500 to $2,999 | 0 (0.0%) | 0 (0.0%) |
| $3,000 or more | 10 (8.6%) | 0 (0.0%) |
| Total | 116 (100.0%) | 0 (0.0%) |
Physical Housing Characteristics in Racine
Housing Structures in Racine
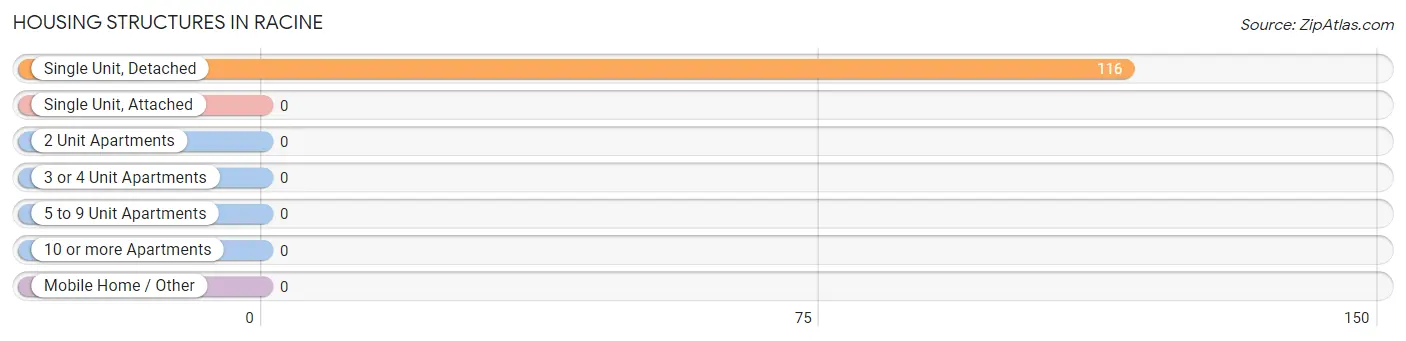
| Structure Type | # Housing Units | % Housing Units |
| Single Unit, Detached | 116 | 100.0% |
| Single Unit, Attached | 0 | 0.0% |
| 2 Unit Apartments | 0 | 0.0% |
| 3 or 4 Unit Apartments | 0 | 0.0% |
| 5 to 9 Unit Apartments | 0 | 0.0% |
| 10 or more Apartments | 0 | 0.0% |
| Mobile Home / Other | 0 | 0.0% |
| Total | 116 | 100.0% |
Housing Structures by Occupancy in Racine
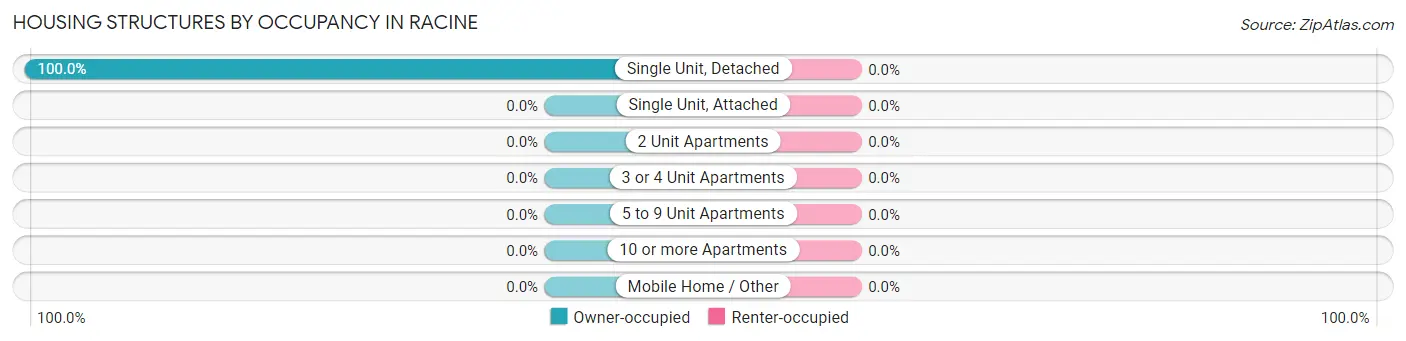
| Structure Type | Owner-occupied | Renter-occupied |
| Single Unit, Detached | 116 (100.0%) | 0 (0.0%) |
| Single Unit, Attached | 0 (0.0%) | 0 (0.0%) |
| 2 Unit Apartments | 0 (0.0%) | 0 (0.0%) |
| 3 or 4 Unit Apartments | 0 (0.0%) | 0 (0.0%) |
| 5 to 9 Unit Apartments | 0 (0.0%) | 0 (0.0%) |
| 10 or more Apartments | 0 (0.0%) | 0 (0.0%) |
| Mobile Home / Other | 0 (0.0%) | 0 (0.0%) |
| Total | 116 (100.0%) | 0 (0.0%) |
Housing Structures by Number of Rooms in Racine
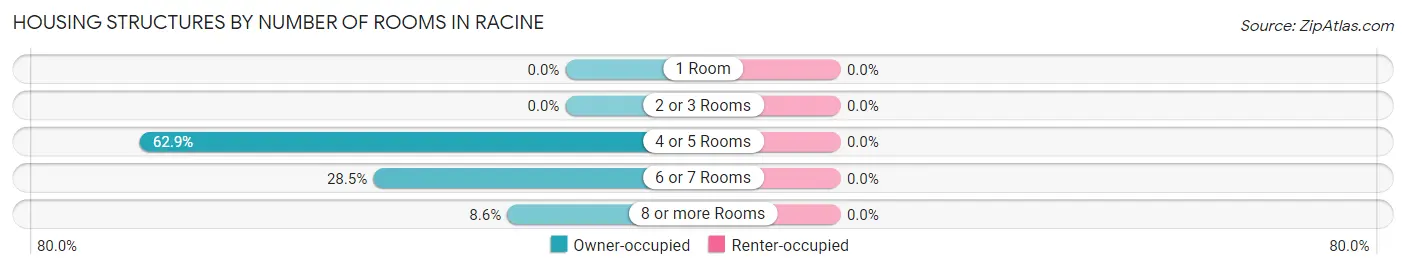
| Number of Rooms | Owner-occupied | Renter-occupied |
| 1 Room | 0 (0.0%) | 0 (0.0%) |
| 2 or 3 Rooms | 0 (0.0%) | 0 (0.0%) |
| 4 or 5 Rooms | 73 (62.9%) | 0 (0.0%) |
| 6 or 7 Rooms | 33 (28.4%) | 0 (0.0%) |
| 8 or more Rooms | 10 (8.6%) | 0 (0.0%) |
| Total | 116 (100.0%) | 0 (0.0%) |
Housing Structure by Heating Type in Racine
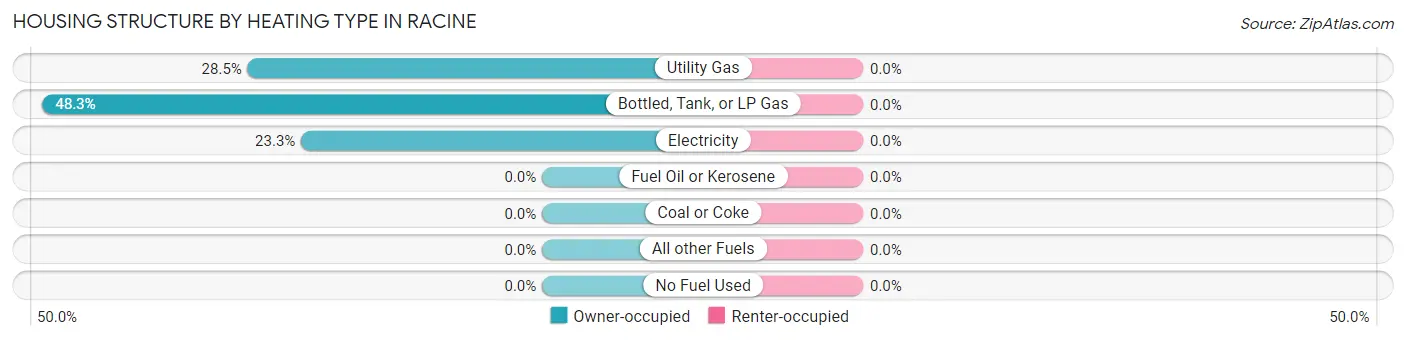
| Heating Type | Owner-occupied | Renter-occupied |
| Utility Gas | 33 (28.4%) | 0 (0.0%) |
| Bottled, Tank, or LP Gas | 56 (48.3%) | 0 (0.0%) |
| Electricity | 27 (23.3%) | 0 (0.0%) |
| Fuel Oil or Kerosene | 0 (0.0%) | 0 (0.0%) |
| Coal or Coke | 0 (0.0%) | 0 (0.0%) |
| All other Fuels | 0 (0.0%) | 0 (0.0%) |
| No Fuel Used | 0 (0.0%) | 0 (0.0%) |
| Total | 116 (100.0%) | 0 (0.0%) |
Household Vehicle Usage in Racine
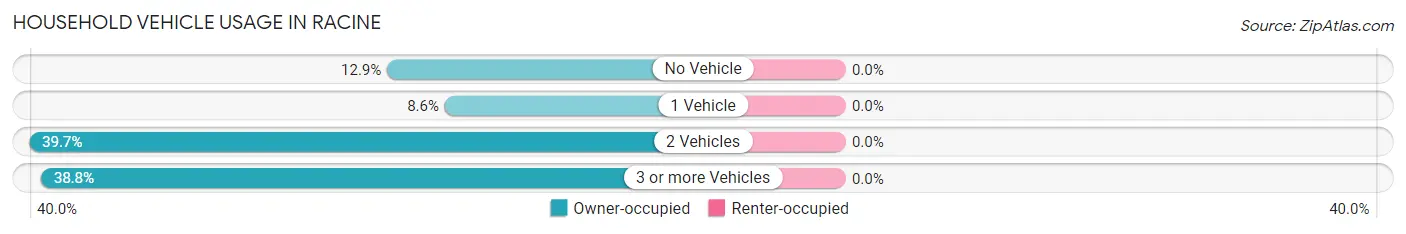
| Vehicles per Household | Owner-occupied | Renter-occupied |
| No Vehicle | 15 (12.9%) | 0 (0.0%) |
| 1 Vehicle | 10 (8.6%) | 0 (0.0%) |
| 2 Vehicles | 46 (39.7%) | 0 (0.0%) |
| 3 or more Vehicles | 45 (38.8%) | 0 (0.0%) |
| Total | 116 (100.0%) | 0 (0.0%) |
Real Estate & Mortgages in Racine
Real Estate and Mortgage Overview in Racine
| Characteristic | Without Mortgage | With Mortgage |
| Housing Units | 88 | 28 |
| Median Property Value | $105,600 | $0 |
| Median Household Income | $71,141 | $8 |
| Monthly Housing Costs | $630 | $0 |
| Real Estate Taxes | $628 | $0 |
Property Value by Mortgage Status in Racine
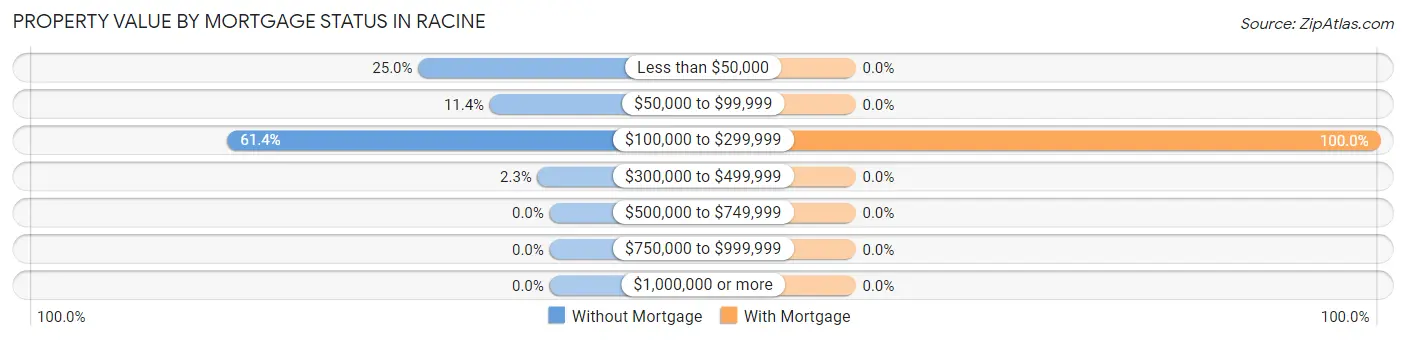
| Property Value | Without Mortgage | With Mortgage |
| Less than $50,000 | 22 (25.0%) | 0 (0.0%) |
| $50,000 to $99,999 | 10 (11.4%) | 0 (0.0%) |
| $100,000 to $299,999 | 54 (61.4%) | 28 (100.0%) |
| $300,000 to $499,999 | 2 (2.3%) | 0 (0.0%) |
| $500,000 to $749,999 | 0 (0.0%) | 0 (0.0%) |
| $750,000 to $999,999 | 0 (0.0%) | 0 (0.0%) |
| $1,000,000 or more | 0 (0.0%) | 0 (0.0%) |
| Total | 88 (100.0%) | 28 (100.0%) |
Household Income by Mortgage Status in Racine
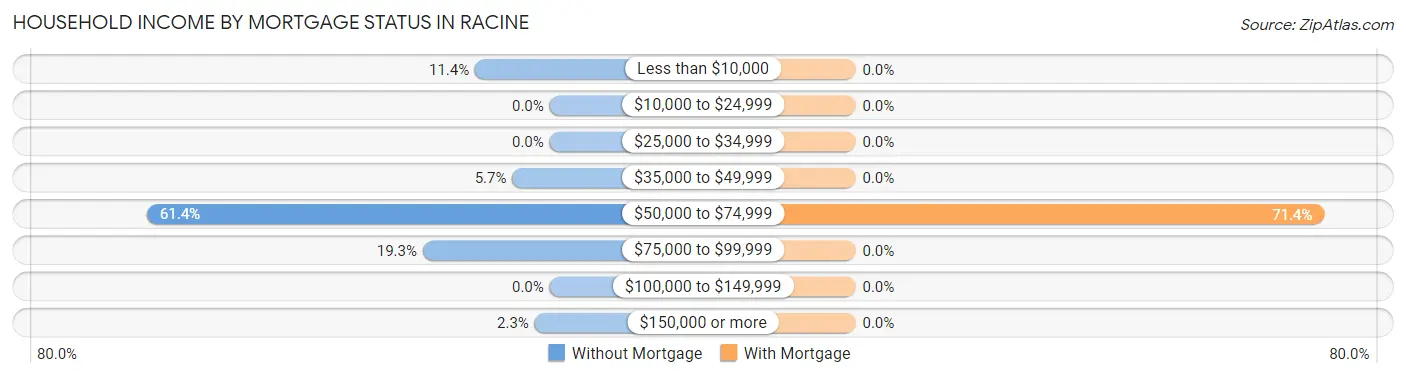
| Household Income | Without Mortgage | With Mortgage |
| Less than $10,000 | 10 (11.4%) | 0 (0.0%) |
| $10,000 to $24,999 | 0 (0.0%) | 0 (0.0%) |
| $25,000 to $34,999 | 0 (0.0%) | 0 (0.0%) |
| $35,000 to $49,999 | 5 (5.7%) | 0 (0.0%) |
| $50,000 to $74,999 | 54 (61.4%) | 20 (71.4%) |
| $75,000 to $99,999 | 17 (19.3%) | 0 (0.0%) |
| $100,000 to $149,999 | 0 (0.0%) | 0 (0.0%) |
| $150,000 or more | 2 (2.3%) | 0 (0.0%) |
| Total | 88 (100.0%) | 28 (100.0%) |
Property Value to Household Income Ratio in Racine
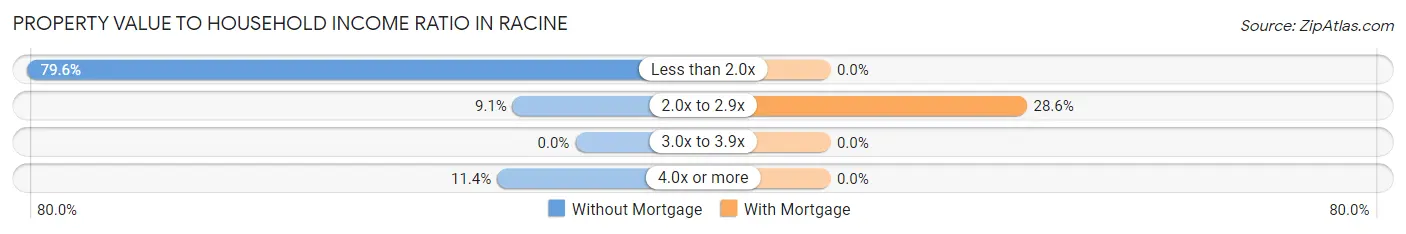
| Value-to-Income Ratio | Without Mortgage | With Mortgage |
| Less than 2.0x | 70 (79.5%) | 0 (0.0%) |
| 2.0x to 2.9x | 8 (9.1%) | 8 (28.6%) |
| 3.0x to 3.9x | 0 (0.0%) | 0 (0.0%) |
| 4.0x or more | 10 (11.4%) | 0 (0.0%) |
| Total | 88 (100.0%) | 28 (100.0%) |
Real Estate Taxes by Mortgage Status in Racine
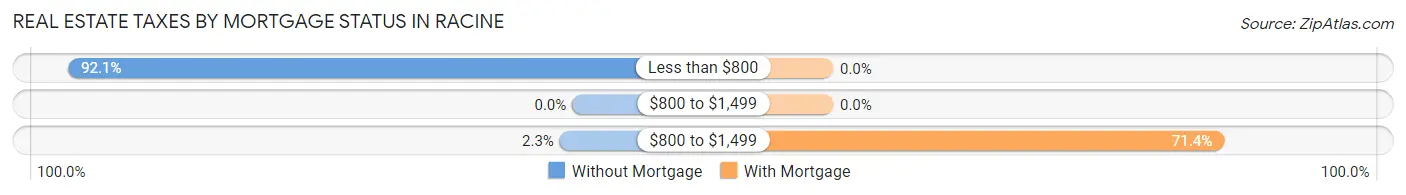
| Property Taxes | Without Mortgage | With Mortgage |
| Less than $800 | 81 (92.0%) | 0 (0.0%) |
| $800 to $1,499 | 0 (0.0%) | 0 (0.0%) |
| $800 to $1,499 | 2 (2.3%) | 20 (71.4%) |
| Total | 88 (100.0%) | 28 (100.0%) |
Health & Disability in Racine
Health Insurance Coverage by Age in Racine
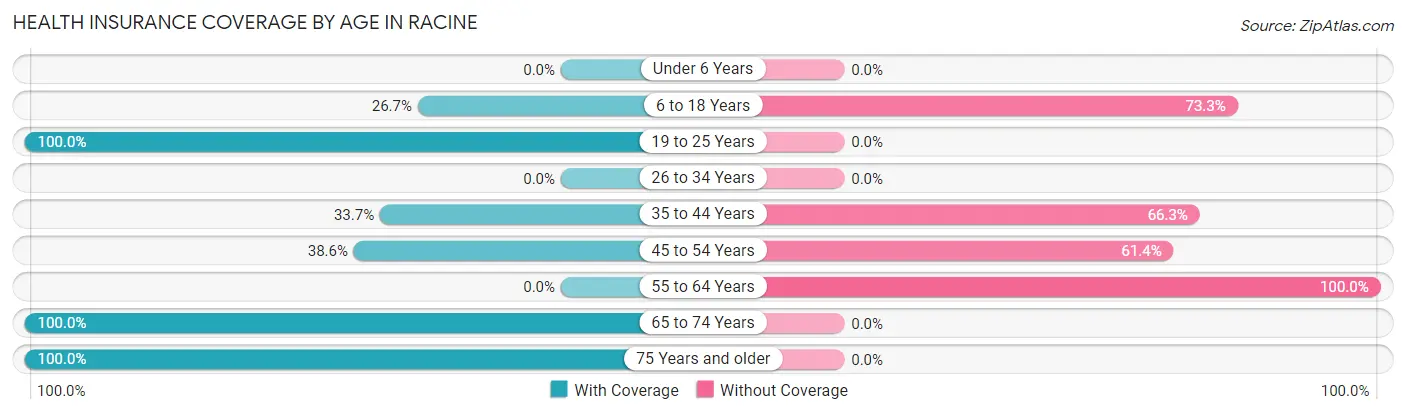
| Age Bracket | With Coverage | Without Coverage |
| Under 6 Years | 0 (0.0%) | 0 (0.0%) |
| 6 to 18 Years | 8 (26.7%) | 22 (73.3%) |
| 19 to 25 Years | 69 (100.0%) | 0 (0.0%) |
| 26 to 34 Years | 0 (0.0%) | 0 (0.0%) |
| 35 to 44 Years | 28 (33.7%) | 55 (66.3%) |
| 45 to 54 Years | 61 (38.6%) | 97 (61.4%) |
| 55 to 64 Years | 0 (0.0%) | 18 (100.0%) |
| 65 to 74 Years | 22 (100.0%) | 0 (0.0%) |
| 75 Years and older | 77 (100.0%) | 0 (0.0%) |
| Total | 265 (58.0%) | 192 (42.0%) |
Health Insurance Coverage by Citizenship Status in Racine
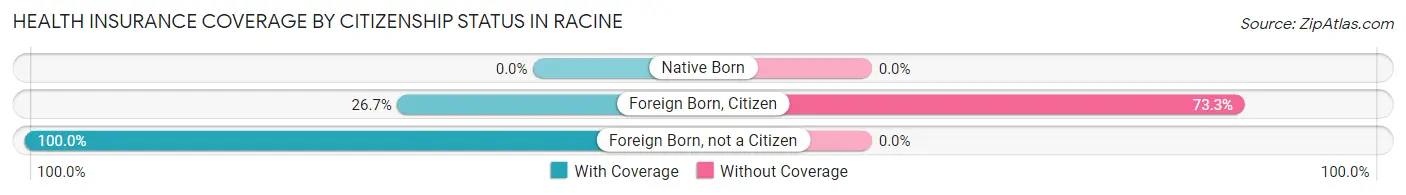
| Citizenship Status | With Coverage | Without Coverage |
| Native Born | 0 (0.0%) | 0 (0.0%) |
| Foreign Born, Citizen | 8 (26.7%) | 22 (73.3%) |
| Foreign Born, not a Citizen | 69 (100.0%) | 0 (0.0%) |
Health Insurance Coverage by Household Income in Racine
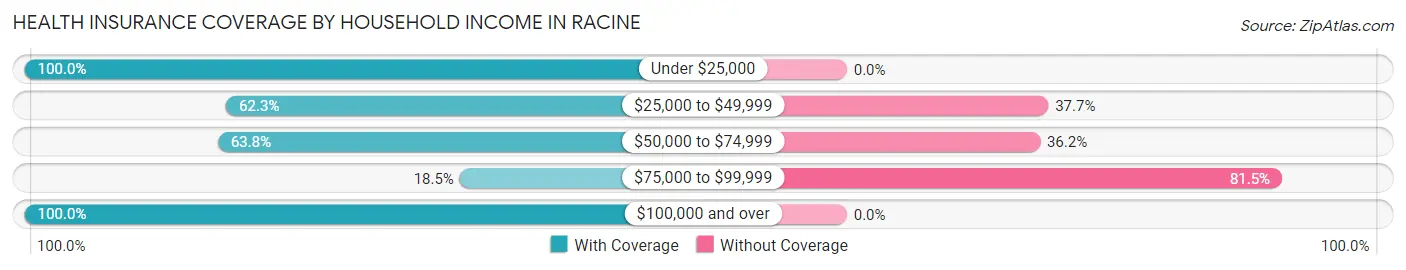
| Household Income | With Coverage | Without Coverage |
| Under $25,000 | 10 (100.0%) | 0 (0.0%) |
| $25,000 to $49,999 | 33 (62.3%) | 20 (37.7%) |
| $50,000 to $74,999 | 171 (63.8%) | 97 (36.2%) |
| $75,000 to $99,999 | 17 (18.5%) | 75 (81.5%) |
| $100,000 and over | 34 (100.0%) | 0 (0.0%) |
Public vs Private Health Insurance Coverage by Age in Racine
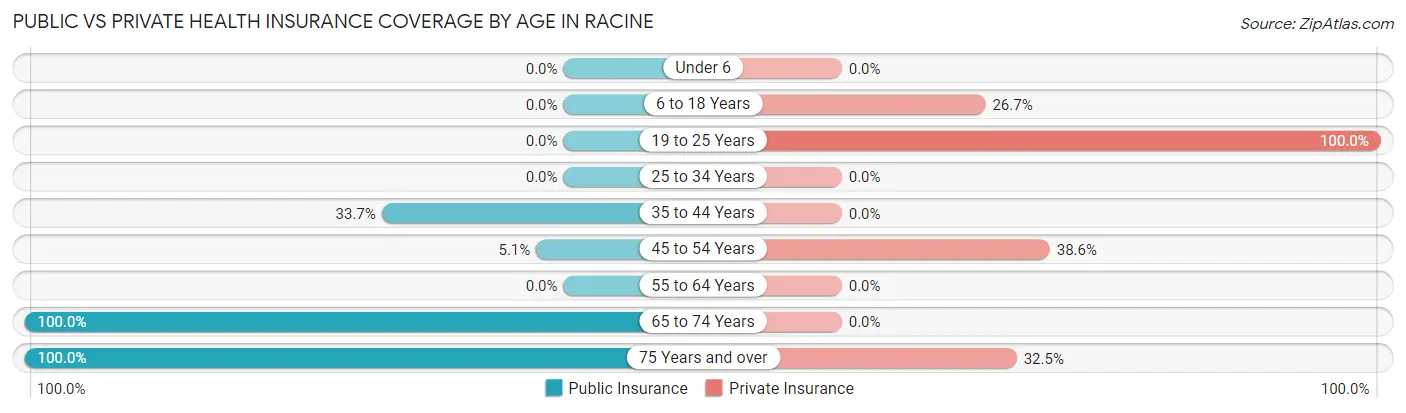
| Age Bracket | Public Insurance | Private Insurance |
| Under 6 | 0 (0.0%) | 0 (0.0%) |
| 6 to 18 Years | 0 (0.0%) | 8 (26.7%) |
| 19 to 25 Years | 0 (0.0%) | 69 (100.0%) |
| 25 to 34 Years | 0 (0.0%) | 0 (0.0%) |
| 35 to 44 Years | 28 (33.7%) | 0 (0.0%) |
| 45 to 54 Years | 8 (5.1%) | 61 (38.6%) |
| 55 to 64 Years | 0 (0.0%) | 0 (0.0%) |
| 65 to 74 Years | 22 (100.0%) | 0 (0.0%) |
| 75 Years and over | 77 (100.0%) | 25 (32.5%) |
| Total | 135 (29.5%) | 163 (35.7%) |
Disability Status by Sex by Age in Racine
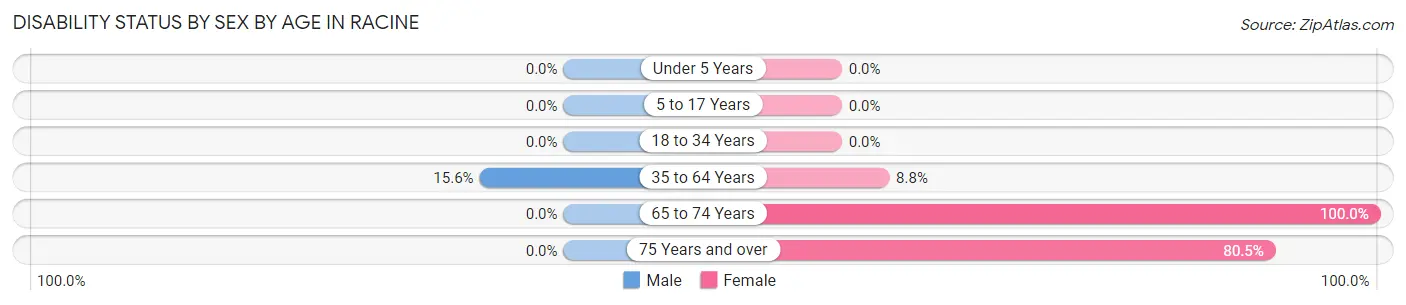
| Age Bracket | Male | Female |
| Under 5 Years | 0 (0.0%) | 0 (0.0%) |
| 5 to 17 Years | 0 (0.0%) | 0 (0.0%) |
| 18 to 34 Years | 0 (0.0%) | 0 (0.0%) |
| 35 to 64 Years | 12 (15.6%) | 16 (8.8%) |
| 65 to 74 Years | 0 (0.0%) | 5 (100.0%) |
| 75 Years and over | 0 (0.0%) | 62 (80.5%) |
Disability Class by Sex by Age in Racine
Disability Class: Hearing Difficulty
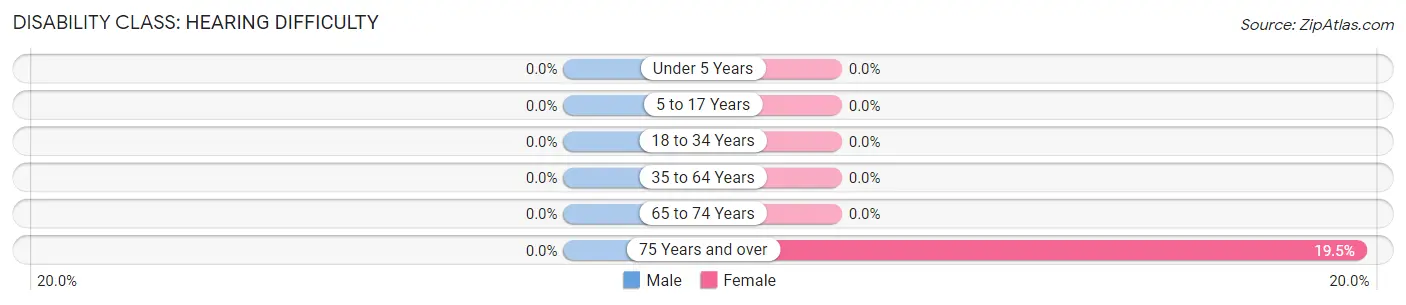
| Age Bracket | Male | Female |
| Under 5 Years | 0 (0.0%) | 0 (0.0%) |
| 5 to 17 Years | 0 (0.0%) | 0 (0.0%) |
| 18 to 34 Years | 0 (0.0%) | 0 (0.0%) |
| 35 to 64 Years | 0 (0.0%) | 0 (0.0%) |
| 65 to 74 Years | 0 (0.0%) | 0 (0.0%) |
| 75 Years and over | 0 (0.0%) | 15 (19.5%) |
Disability Class: Vision Difficulty
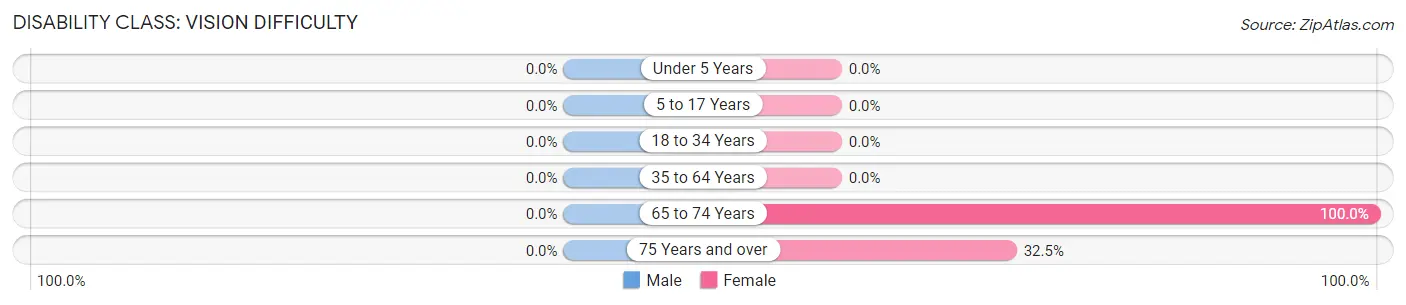
| Age Bracket | Male | Female |
| Under 5 Years | 0 (0.0%) | 0 (0.0%) |
| 5 to 17 Years | 0 (0.0%) | 0 (0.0%) |
| 18 to 34 Years | 0 (0.0%) | 0 (0.0%) |
| 35 to 64 Years | 0 (0.0%) | 0 (0.0%) |
| 65 to 74 Years | 0 (0.0%) | 5 (100.0%) |
| 75 Years and over | 0 (0.0%) | 25 (32.5%) |
Disability Class: Cognitive Difficulty
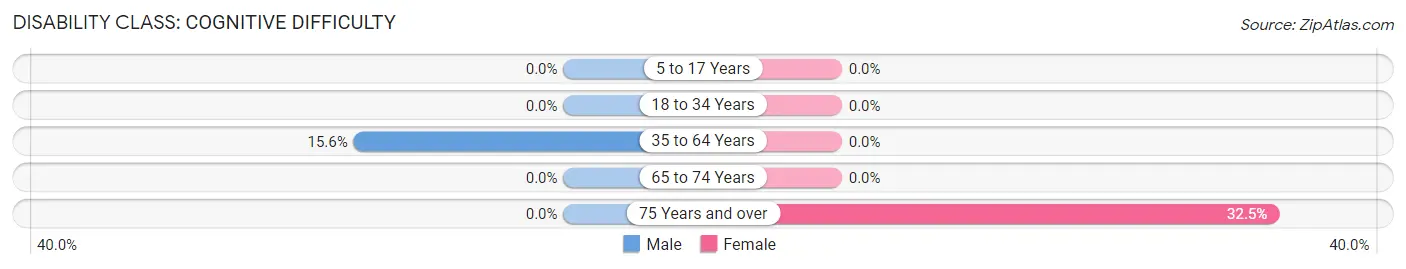
| Age Bracket | Male | Female |
| 5 to 17 Years | 0 (0.0%) | 0 (0.0%) |
| 18 to 34 Years | 0 (0.0%) | 0 (0.0%) |
| 35 to 64 Years | 12 (15.6%) | 0 (0.0%) |
| 65 to 74 Years | 0 (0.0%) | 0 (0.0%) |
| 75 Years and over | 0 (0.0%) | 25 (32.5%) |
Disability Class: Ambulatory Difficulty
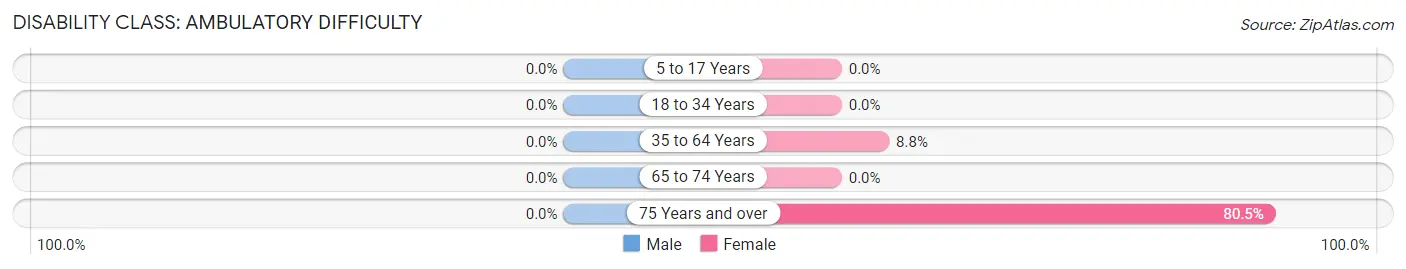
| Age Bracket | Male | Female |
| 5 to 17 Years | 0 (0.0%) | 0 (0.0%) |
| 18 to 34 Years | 0 (0.0%) | 0 (0.0%) |
| 35 to 64 Years | 0 (0.0%) | 16 (8.8%) |
| 65 to 74 Years | 0 (0.0%) | 0 (0.0%) |
| 75 Years and over | 0 (0.0%) | 62 (80.5%) |
Disability Class: Self-Care Difficulty
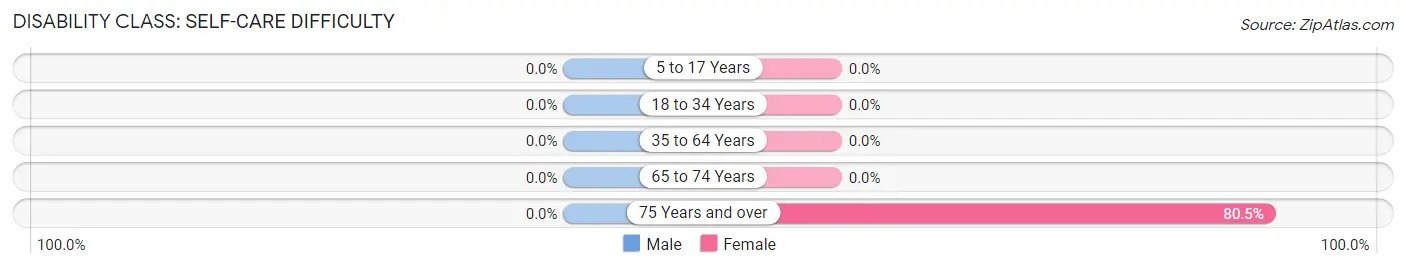
| Age Bracket | Male | Female |
| 5 to 17 Years | 0 (0.0%) | 0 (0.0%) |
| 18 to 34 Years | 0 (0.0%) | 0 (0.0%) |
| 35 to 64 Years | 0 (0.0%) | 0 (0.0%) |
| 65 to 74 Years | 0 (0.0%) | 0 (0.0%) |
| 75 Years and over | 0 (0.0%) | 62 (80.5%) |
Technology Access in Racine
Computing Device Access in Racine
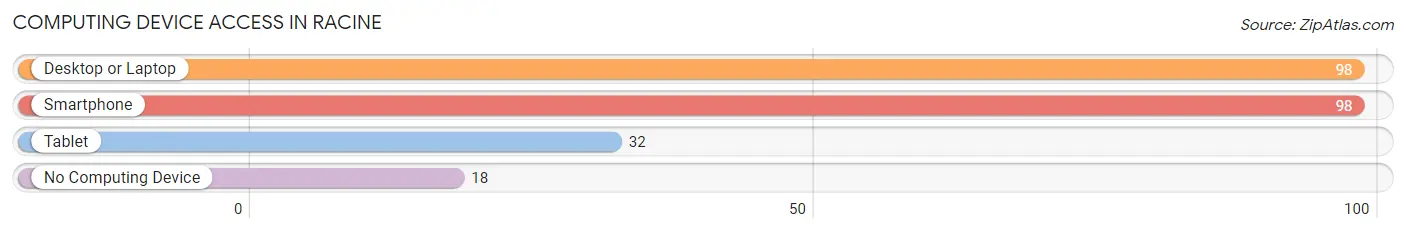
| Device Type | # Households | % Households |
| Desktop or Laptop | 98 | 84.5% |
| Smartphone | 98 | 84.5% |
| Tablet | 32 | 27.6% |
| No Computing Device | 18 | 15.5% |
| Total | 116 | 100.0% |
Internet Access in Racine
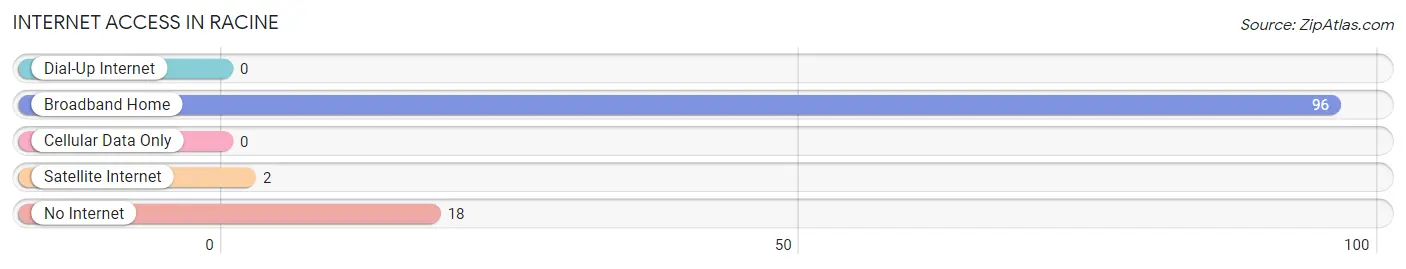
| Internet Type | # Households | % Households |
| Dial-Up Internet | 0 | 0.0% |
| Broadband Home | 96 | 82.8% |
| Cellular Data Only | 0 | 0.0% |
| Satellite Internet | 2 | 1.7% |
| No Internet | 18 | 15.5% |
| Total | 116 | 100.0% |
Racine Summary
Racine is a small unincorporated community located in the northern part of Jackson County, West Virginia. It is situated along the banks of the Ohio River, just south of the city of Ravenswood. The community was founded in the early 1800s and has a rich history of coal mining, farming, and river transportation.
Geography
Racine is located in the northern part of Jackson County, West Virginia, along the banks of the Ohio River. It is situated just south of the city of Ravenswood, and is approximately 25 miles south of Parkersburg. The community is surrounded by rolling hills and lush forests, and is home to a variety of wildlife. The climate in Racine is generally mild, with temperatures ranging from the mid-30s in the winter to the mid-80s in the summer.
Economy
Racine’s economy is largely based on coal mining, farming, and river transportation. The community is home to several coal mines, which provide employment for many of the residents. The Ohio River is also an important part of the local economy, as it provides a means of transportation for goods and services. In addition, the river is a popular destination for recreational activities such as fishing and boating.
Demographics
As of the 2010 census, Racine had a population of 1,072. The racial makeup of the community was 97.2% White, 0.9% African American, 0.2% Native American, 0.2% Asian, 0.1% Pacific Islander, and 1.4% from two or more races. The median household income was $30,938, and the median family income was $37,813. The per capita income was $15,945.
Conclusion
Racine is a small unincorporated community located in the northern part of Jackson County, West Virginia. It is situated along the banks of the Ohio River, just south of the city of Ravenswood. The community was founded in the early 1800s and has a rich history of coal mining, farming, and river transportation. Racine’s economy is largely based on coal mining, farming, and river transportation, and the community is home to a variety of wildlife. As of the 2010 census, Racine had a population of 1,072, with a median household income of $30,938 and a median family income of $37,813.
Common Questions
What is Per Capita Income in Racine?
Per Capita income in Racine is $24,757.
What is the Median Household income in Racine?
Median Household Income in Racine is $70,815.
What is Income or Wage Gap in Racine?
Income or Wage Gap in Racine is 62.3%.
Women in Racine earn 37.7 cents for every dollar earned by a man.
What is Inequality or Gini Index in Racine?
Inequality or Gini Index in Racine is 0.29.
What is the Total Population of Racine?
Total Population of Racine is 457.
What is the Total Male Population of Racine?
Total Male Population of Racine is 171.
What is the Total Female Population of Racine?
Total Female Population of Racine is 286.
What is the Ratio of Males per 100 Females in Racine?
There are 59.79 Males per 100 Females in Racine.
What is the Ratio of Females per 100 Males in Racine?
There are 167.25 Females per 100 Males in Racine.
What is the Median Population Age in Racine?
Median Population Age in Racine is 49.3 Years.
What is the Average Family Size in Racine
Average Family Size in Racine is 3.4 People.
What is the Average Household Size in Racine
Average Household Size in Racine is 3.9 People.
How Large is the Labor Force in Racine?
There are 221 People in the Labor Forcein in Racine.
What is the Percentage of People in the Labor Force in Racine?
51.8% of People are in the Labor Force in Racine.
What is the Unemployment Rate in Racine?
Unemployment Rate in Racine is 43.9%.