Ewing, VA Map & Demographics
Ewing Map
Ewing Overview
$23,933
PER CAPITA INCOME
$71,344
AVG FAMILY INCOME
$71,344
AVG HOUSEHOLD INCOME
22.7%
WAGE / INCOME GAP [ % ]
77.3¢/ $1
WAGE / INCOME GAP [ $ ]
0.19
INEQUALITY / GINI INDEX
476
TOTAL POPULATION
230
MALE POPULATION
246
FEMALE POPULATION
93.50
MALES / 100 FEMALES
106.96
FEMALES / 100 MALES
51.4
MEDIAN AGE
2.5
AVG FAMILY SIZE
2.6
AVG HOUSEHOLD SIZE
235
LABOR FORCE [ PEOPLE ]
56.8%
PERCENT IN LABOR FORCE
Ewing Zip Codes
Ewing Area Codes
Income in Ewing
Income Overview in Ewing
Per Capita Income in Ewing is $23,933, while median incomes of families and households are $71,344 and $71,344 respectively.
| Characteristic | Number | Measure |
| Per Capita Income | 476 | $23,933 |
| Median Family Income | 183 | $71,344 |
| Mean Family Income | 183 | $65,632 |
| Median Household Income | 183 | $71,344 |
| Mean Household Income | 183 | $66,989 |
| Income Deficit | 183 | $0 |
| Wage / Income Gap (%) | 476 | 22.67% |
| Wage / Income Gap ($) | 476 | 77.33¢ per $1 |
| Gini / Inequality Index | 476 | 0.19 |
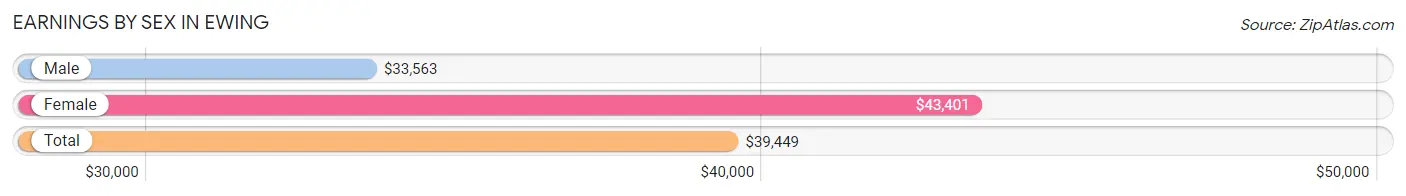
Earnings by Sex in Ewing
Average Earnings in Ewing are $39,449, $33,563 for men and $43,401 for women, a difference of 22.7%.
| Sex | Number | Average Earnings |
| Male | 114 (48.5%) | $33,563 |
| Female | 121 (51.5%) | $43,401 |
| Total | 235 (100.0%) | $39,449 |
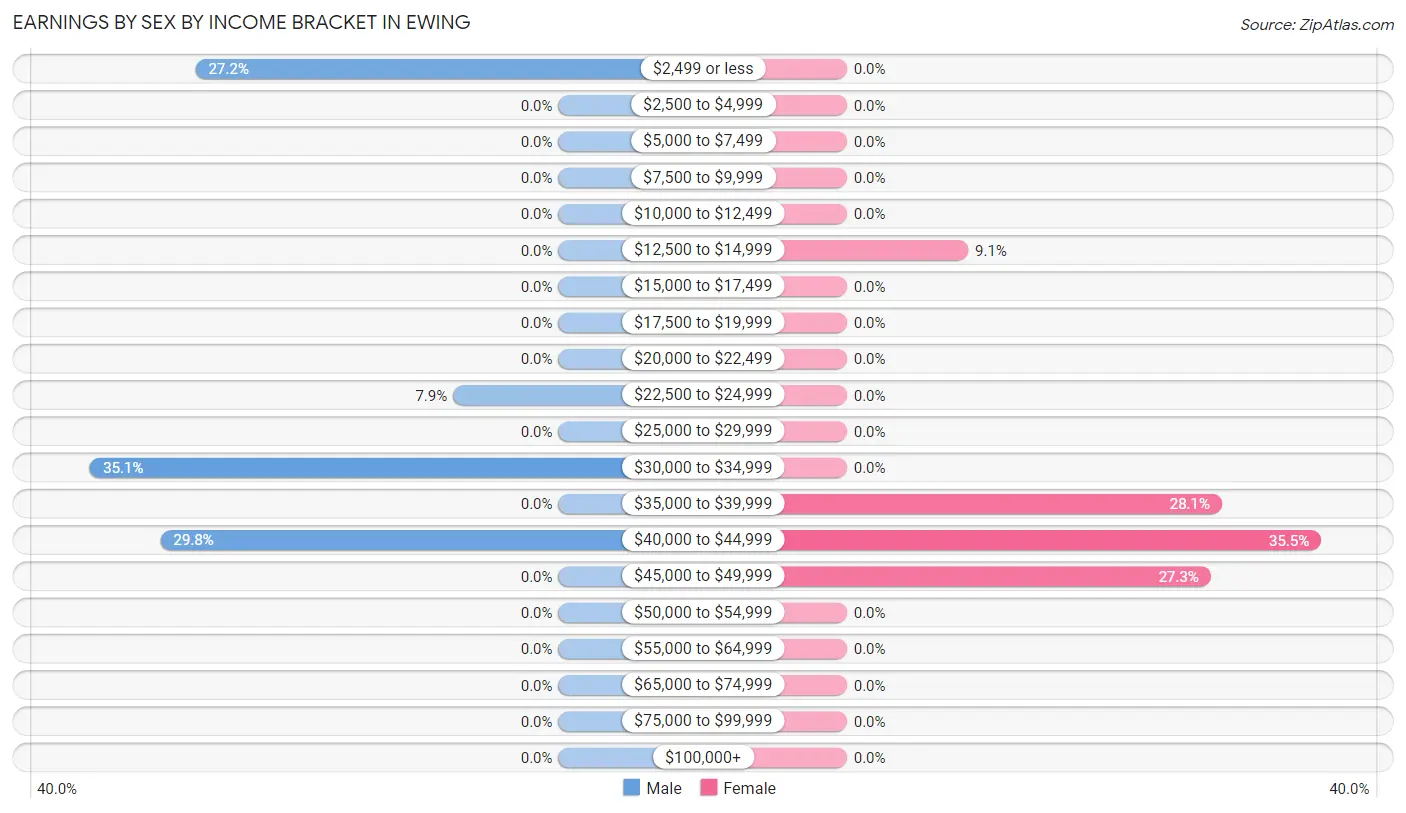
Earnings by Sex by Income Bracket in Ewing
The most common earnings brackets in Ewing are $30,000 to $34,999 for men (40 | 35.1%) and $40,000 to $44,999 for women (43 | 35.5%).
| Income | Male | Female |
| $2,499 or less | 31 (27.2%) | 0 (0.0%) |
| $2,500 to $4,999 | 0 (0.0%) | 0 (0.0%) |
| $5,000 to $7,499 | 0 (0.0%) | 0 (0.0%) |
| $7,500 to $9,999 | 0 (0.0%) | 0 (0.0%) |
| $10,000 to $12,499 | 0 (0.0%) | 0 (0.0%) |
| $12,500 to $14,999 | 0 (0.0%) | 11 (9.1%) |
| $15,000 to $17,499 | 0 (0.0%) | 0 (0.0%) |
| $17,500 to $19,999 | 0 (0.0%) | 0 (0.0%) |
| $20,000 to $22,499 | 0 (0.0%) | 0 (0.0%) |
| $22,500 to $24,999 | 9 (7.9%) | 0 (0.0%) |
| $25,000 to $29,999 | 0 (0.0%) | 0 (0.0%) |
| $30,000 to $34,999 | 40 (35.1%) | 0 (0.0%) |
| $35,000 to $39,999 | 0 (0.0%) | 34 (28.1%) |
| $40,000 to $44,999 | 34 (29.8%) | 43 (35.5%) |
| $45,000 to $49,999 | 0 (0.0%) | 33 (27.3%) |
| $50,000 to $54,999 | 0 (0.0%) | 0 (0.0%) |
| $55,000 to $64,999 | 0 (0.0%) | 0 (0.0%) |
| $65,000 to $74,999 | 0 (0.0%) | 0 (0.0%) |
| $75,000 to $99,999 | 0 (0.0%) | 0 (0.0%) |
| $100,000+ | 0 (0.0%) | 0 (0.0%) |
| Total | 114 (100.0%) | 121 (100.0%) |
Earnings by Sex by Educational Attainment in Ewing
| Educational Attainment | Male Income | Female Income |
| Less than High School | - | - |
| High School Diploma | - | - |
| College or Associate's Degree | - | - |
| Bachelor's Degree | - | - |
| Graduate Degree | - | - |
| Total | $34,531 | $43,401 |
Family Income in Ewing
Family Income Brackets in Ewing
According to the Ewing family income data, there are 73 families falling into the $50,000 to $74,999 income range, which is the most common income bracket and makes up 39.9% of all families.
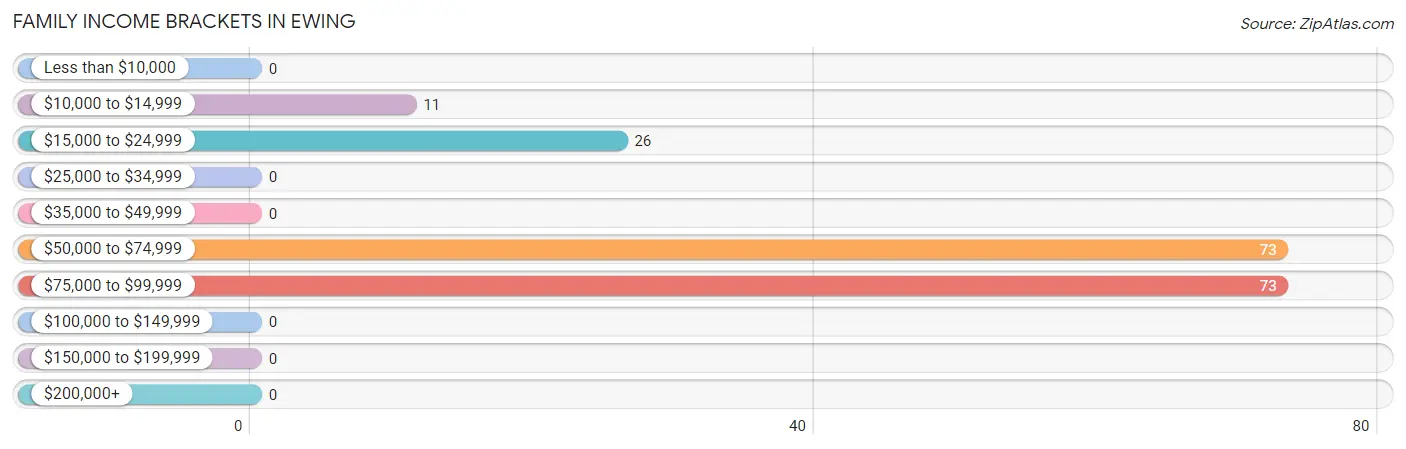
| Income Bracket | # Families | % Families |
| Less than $10,000 | 0 | 0.0% |
| $10,000 to $14,999 | 11 | 6.0% |
| $15,000 to $24,999 | 26 | 14.2% |
| $25,000 to $34,999 | 0 | 0.0% |
| $35,000 to $49,999 | 0 | 0.0% |
| $50,000 to $74,999 | 73 | 39.9% |
| $75,000 to $99,999 | 73 | 39.9% |
| $100,000 to $149,999 | 0 | 0.0% |
| $150,000 to $199,999 | 0 | 0.0% |
| $200,000+ | 0 | 0.0% |
Family Income by Famaliy Size in Ewing
2-person families (100 | 54.6%) account for the highest median family income in Ewing with $58,485 per family, while 2-person families (100 | 54.6%) have the highest median income of $29,242 per family member.
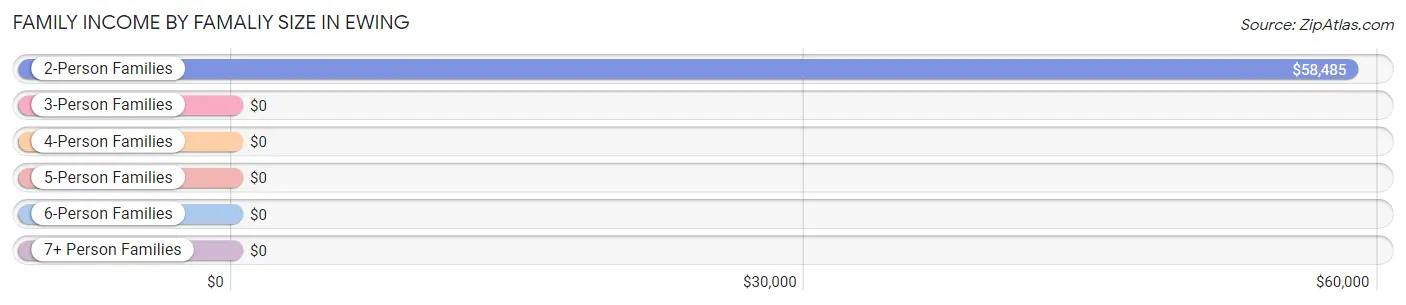
| Income Bracket | # Families | Median Income |
| 2-Person Families | 100 (54.6%) | $58,485 |
| 3-Person Families | 40 (21.9%) | $0 |
| 4-Person Families | 0 (0.0%) | $0 |
| 5-Person Families | 43 (23.5%) | $0 |
| 6-Person Families | 0 (0.0%) | $0 |
| 7+ Person Families | 0 (0.0%) | $0 |
| Total | 183 (100.0%) | $71,344 |
Family Income by Number of Earners in Ewing
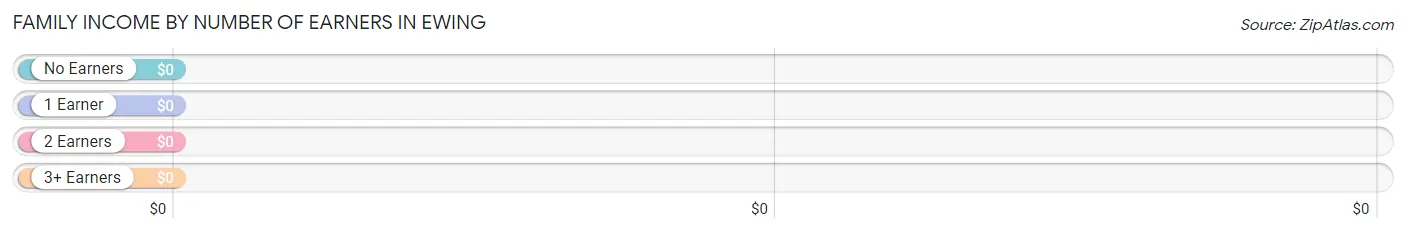
| Number of Earners | # Families | Median Income |
| No Earners | 56 (30.6%) | $0 |
| 1 Earner | 44 (24.0%) | $0 |
| 2 Earners | 40 (21.9%) | $0 |
| 3+ Earners | 43 (23.5%) | $0 |
| Total | 183 (100.0%) | $71,344 |
Household Income in Ewing
Household Income Brackets in Ewing
With 73 households falling in the category, the $50,000 to $74,999 income range is the most frequent in Ewing, accounting for 39.9% of all households.
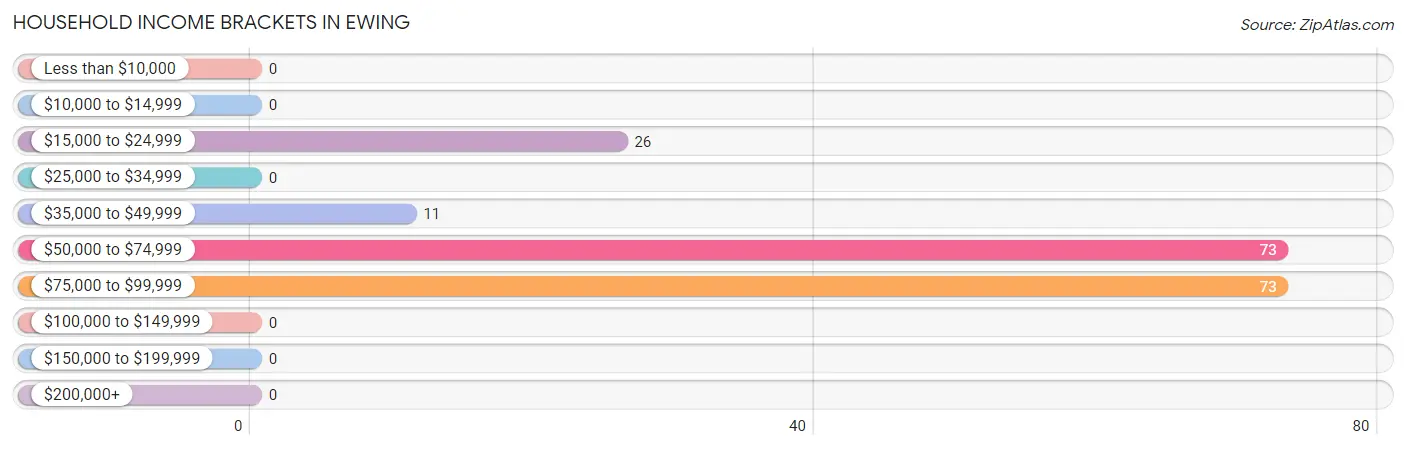
| Income Bracket | # Households | % Households |
| Less than $10,000 | 0 | 0.0% |
| $10,000 to $14,999 | 0 | 0.0% |
| $15,000 to $24,999 | 26 | 14.2% |
| $25,000 to $34,999 | 0 | 0.0% |
| $35,000 to $49,999 | 11 | 6.0% |
| $50,000 to $74,999 | 73 | 39.9% |
| $75,000 to $99,999 | 73 | 39.9% |
| $100,000 to $149,999 | 0 | 0.0% |
| $150,000 to $199,999 | 0 | 0.0% |
| $200,000+ | 0 | 0.0% |
Household Income by Householder Age in Ewing
The median household income in Ewing is $71,344, with the highest median household income of $59,848 found in the 45 to 64 years age bracket for the primary householder. A total of 84 households (45.9%) fall into this category.
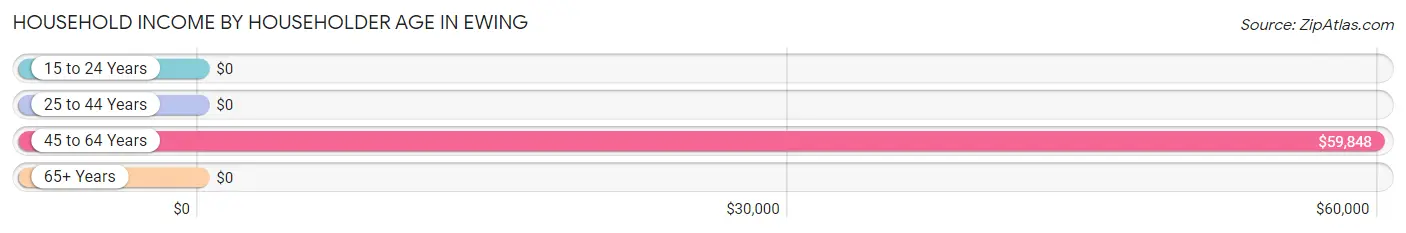
| Income Bracket | # Households | Median Income |
| 15 to 24 Years | 0 (0.0%) | $0 |
| 25 to 44 Years | 43 (23.5%) | $0 |
| 45 to 64 Years | 84 (45.9%) | $59,848 |
| 65+ Years | 56 (30.6%) | $0 |
| Total | 183 (100.0%) | $71,344 |
Poverty in Ewing
Income Below Poverty by Sex and Age in Ewing
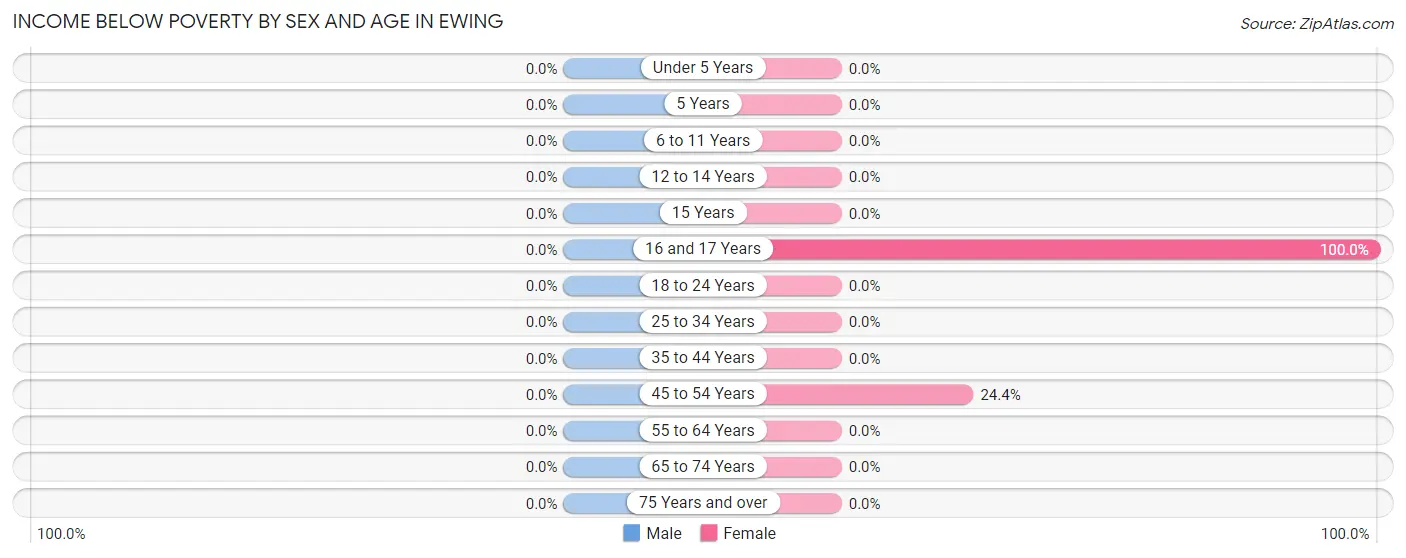
| Age Bracket | Male | Female |
| Under 5 Years | 0 (0.0%) | 0 (0.0%) |
| 5 Years | 0 (0.0%) | 0 (0.0%) |
| 6 to 11 Years | 0 (0.0%) | 0 (0.0%) |
| 12 to 14 Years | 0 (0.0%) | 0 (0.0%) |
| 15 Years | 0 (0.0%) | 0 (0.0%) |
| 16 and 17 Years | 0 (0.0%) | 12 (100.0%) |
| 18 to 24 Years | 0 (0.0%) | 0 (0.0%) |
| 25 to 34 Years | 0 (0.0%) | 0 (0.0%) |
| 35 to 44 Years | 0 (0.0%) | 0 (0.0%) |
| 45 to 54 Years | 0 (0.0%) | 11 (24.4%) |
| 55 to 64 Years | 0 (0.0%) | 0 (0.0%) |
| 65 to 74 Years | 0 (0.0%) | 0 (0.0%) |
| 75 Years and over | 0 (0.0%) | 0 (0.0%) |
| Total | 0 (0.0%) | 23 (9.3%) |
Income Above Poverty by Sex and Age in Ewing
According to the poverty statistics in Ewing, males aged 16 and 17 years and females aged 6 to 11 years are the age groups that are most secure financially, with 100.0% of males and 100.0% of females in these age groups living above the poverty line.
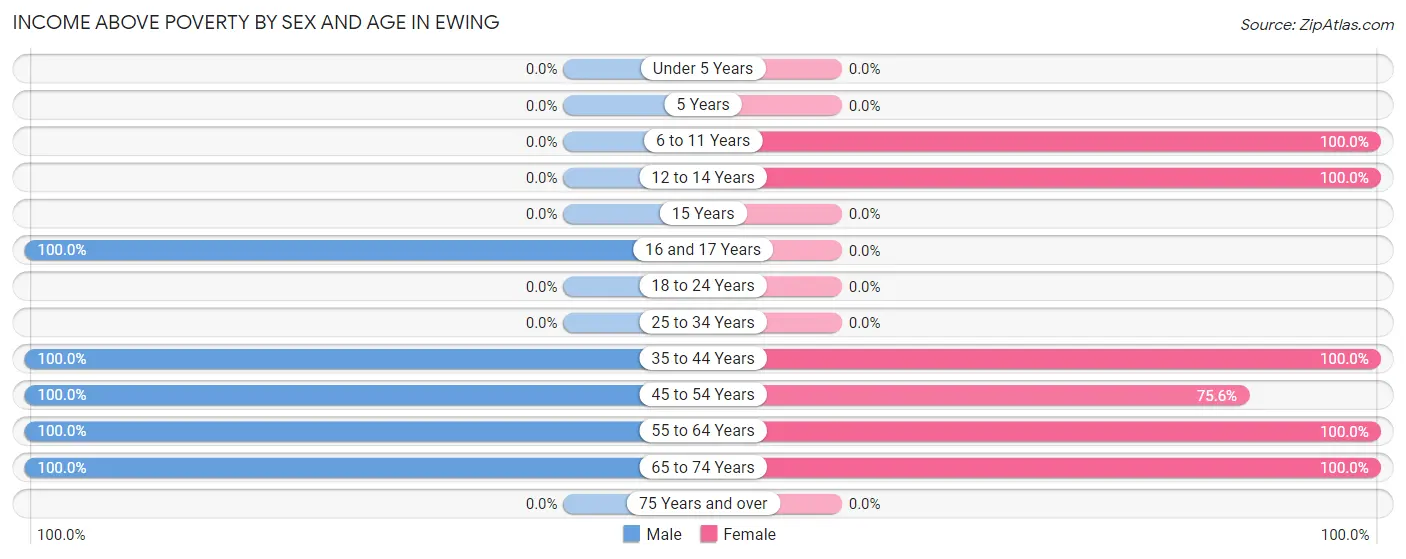
| Age Bracket | Male | Female |
| Under 5 Years | 0 (0.0%) | 0 (0.0%) |
| 5 Years | 0 (0.0%) | 0 (0.0%) |
| 6 to 11 Years | 0 (0.0%) | 31 (100.0%) |
| 12 to 14 Years | 0 (0.0%) | 31 (100.0%) |
| 15 Years | 0 (0.0%) | 0 (0.0%) |
| 16 and 17 Years | 60 (100.0%) | 0 (0.0%) |
| 18 to 24 Years | 0 (0.0%) | 0 (0.0%) |
| 25 to 34 Years | 0 (0.0%) | 0 (0.0%) |
| 35 to 44 Years | 34 (100.0%) | 43 (100.0%) |
| 45 to 54 Years | 40 (100.0%) | 34 (75.6%) |
| 55 to 64 Years | 40 (100.0%) | 33 (100.0%) |
| 65 to 74 Years | 56 (100.0%) | 51 (100.0%) |
| 75 Years and over | 0 (0.0%) | 0 (0.0%) |
| Total | 230 (100.0%) | 223 (90.6%) |
Income Below Poverty Among Married-Couple Families in Ewing
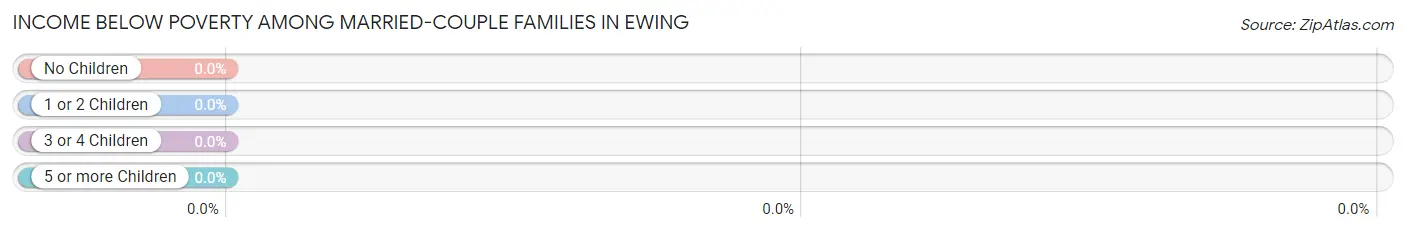
| Children | Above Poverty | Below Poverty |
| No Children | 89 (100.0%) | 0 (0.0%) |
| 1 or 2 Children | 40 (100.0%) | 0 (0.0%) |
| 3 or 4 Children | 43 (100.0%) | 0 (0.0%) |
| 5 or more Children | 0 (0.0%) | 0 (0.0%) |
| Total | 172 (100.0%) | 0 (0.0%) |
Income Below Poverty Among Single-Parent Households in Ewing
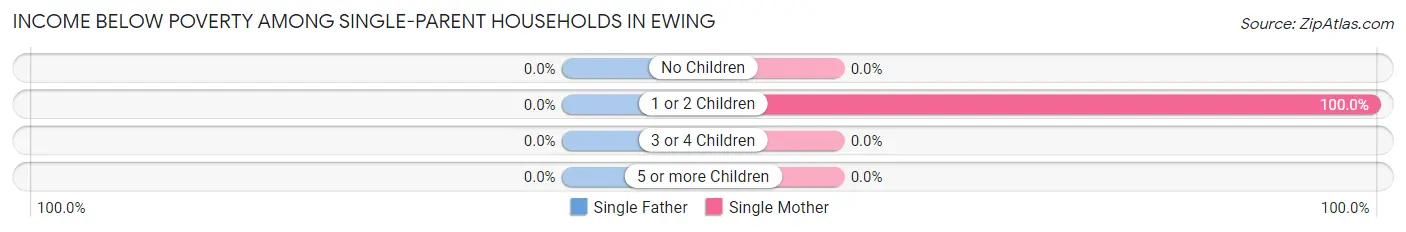
| Children | Single Father | Single Mother |
| No Children | 0 (0.0%) | 0 (0.0%) |
| 1 or 2 Children | 0 (0.0%) | 11 (100.0%) |
| 3 or 4 Children | 0 (0.0%) | 0 (0.0%) |
| 5 or more Children | 0 (0.0%) | 0 (0.0%) |
| Total | 0 (0.0%) | 11 (100.0%) |
Income Below Poverty Among Married-Couple vs Single-Parent Households in Ewing
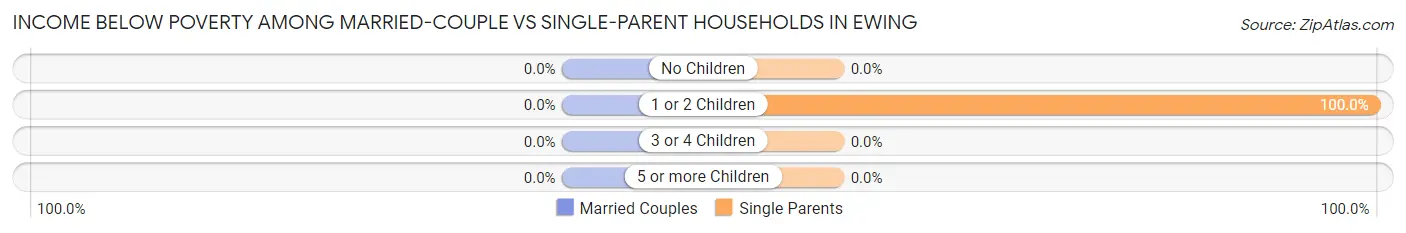
| Children | Married-Couple Families | Single-Parent Households |
| No Children | 0 (0.0%) | 0 (0.0%) |
| 1 or 2 Children | 0 (0.0%) | 11 (100.0%) |
| 3 or 4 Children | 0 (0.0%) | 0 (0.0%) |
| 5 or more Children | 0 (0.0%) | 0 (0.0%) |
| Total | 0 (0.0%) | 11 (100.0%) |
Race in Ewing
The most populous races in Ewing are , and White / Caucasian (476 | 100.0%).
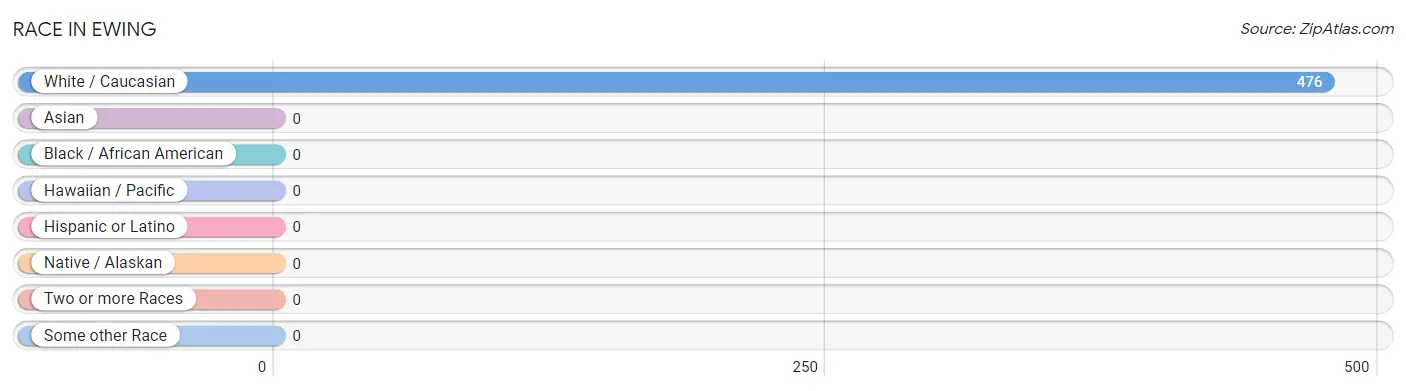
| Race | # Population | % Population |
| Asian | 0 | 0.0% |
| Black / African American | 0 | 0.0% |
| Hawaiian / Pacific | 0 | 0.0% |
| Hispanic or Latino | 0 | 0.0% |
| Native / Alaskan | 0 | 0.0% |
| White / Caucasian | 476 | 100.0% |
| Two or more Races | 0 | 0.0% |
| Some other Race | 0 | 0.0% |
| Total | 476 | 100.0% |
Ancestry in Ewing
The most populous ancestries reported in Ewing are American (203 | 42.6%), and English (192 | 40.3%), together accounting for 83.0% of all Ewing residents.
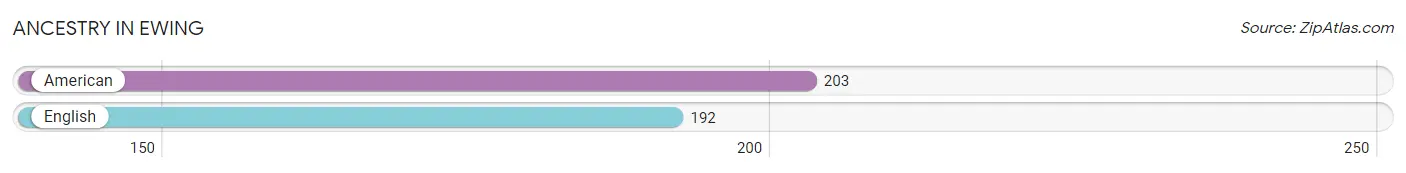
| Ancestry | # Population | % Population |
| American | 203 | 42.6% |
| English | 192 | 40.3% | View All 2 Rows |
Immigrants in Ewing

| Immigration Origin | # Population | % Population | View All 0 Rows |
Sex and Age in Ewing
Sex and Age in Ewing
The most populous age groups in Ewing are 15 to 19 Years (60 | 26.1%) for men and 10 to 14 Years (62 | 25.2%) for women.
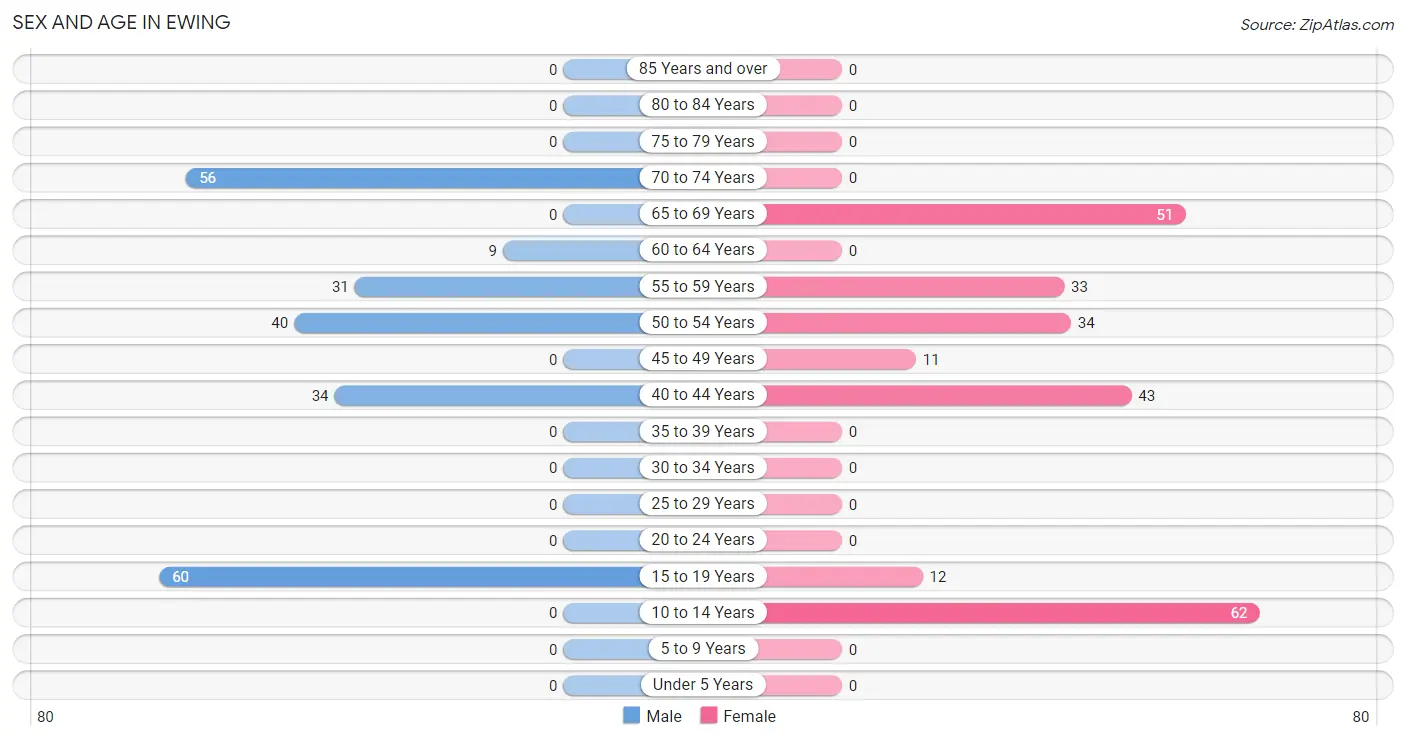
| Age Bracket | Male | Female |
| Under 5 Years | 0 (0.0%) | 0 (0.0%) |
| 5 to 9 Years | 0 (0.0%) | 0 (0.0%) |
| 10 to 14 Years | 0 (0.0%) | 62 (25.2%) |
| 15 to 19 Years | 60 (26.1%) | 12 (4.9%) |
| 20 to 24 Years | 0 (0.0%) | 0 (0.0%) |
| 25 to 29 Years | 0 (0.0%) | 0 (0.0%) |
| 30 to 34 Years | 0 (0.0%) | 0 (0.0%) |
| 35 to 39 Years | 0 (0.0%) | 0 (0.0%) |
| 40 to 44 Years | 34 (14.8%) | 43 (17.5%) |
| 45 to 49 Years | 0 (0.0%) | 11 (4.5%) |
| 50 to 54 Years | 40 (17.4%) | 34 (13.8%) |
| 55 to 59 Years | 31 (13.5%) | 33 (13.4%) |
| 60 to 64 Years | 9 (3.9%) | 0 (0.0%) |
| 65 to 69 Years | 0 (0.0%) | 51 (20.7%) |
| 70 to 74 Years | 56 (24.3%) | 0 (0.0%) |
| 75 to 79 Years | 0 (0.0%) | 0 (0.0%) |
| 80 to 84 Years | 0 (0.0%) | 0 (0.0%) |
| 85 Years and over | 0 (0.0%) | 0 (0.0%) |
| Total | 230 (100.0%) | 246 (100.0%) |
Families and Households in Ewing
Median Family Size in Ewing
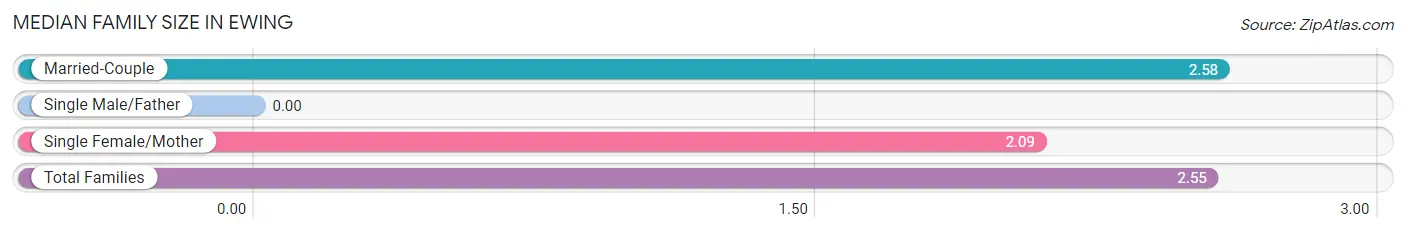
| Family Type | # Families | Family Size |
| Married-Couple | 172 (94.0%) | 2.58 |
| Single Male/Father | 0 (0.0%) | - |
| Single Female/Mother | 11 (6.0%) | 2.09 |
| Total Families | 183 (100.0%) | 2.55 |
Median Household Size in Ewing
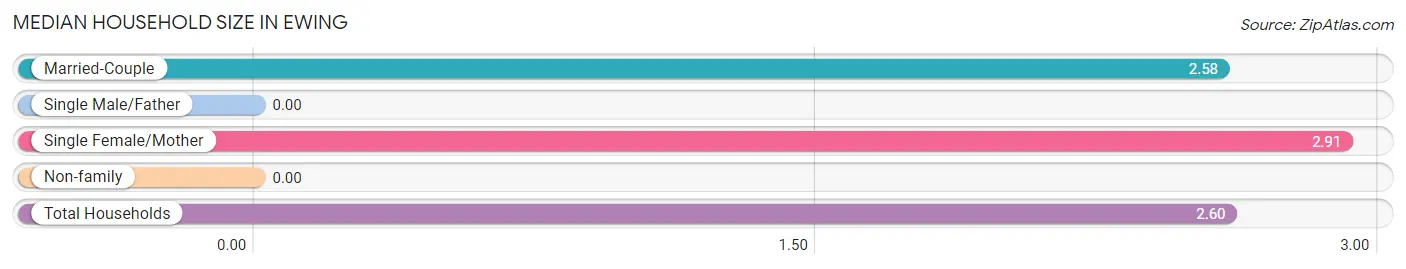
| Household Type | # Households | Household Size |
| Married-Couple | 172 (94.0%) | 2.58 |
| Single Male/Father | 0 (0.0%) | - |
| Single Female/Mother | 11 (6.0%) | 2.91 |
| Non-family | 0 (0.0%) | - |
| Total Households | 183 (100.0%) | 2.60 |
Household Size by Marriage Status in Ewing
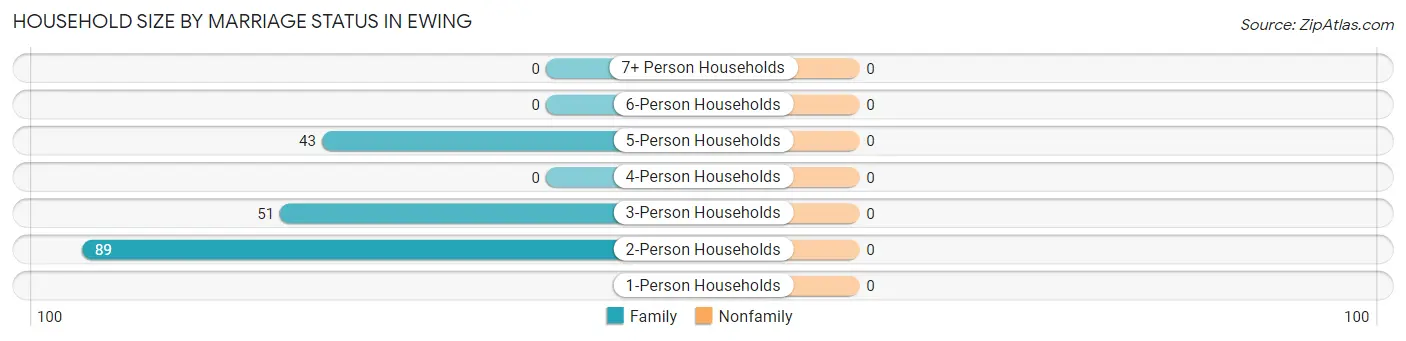
| Household Size | Family Households | Nonfamily Households |
| 1-Person Households | - | 0 (0.0%) |
| 2-Person Households | 89 (48.6%) | 0 (0.0%) |
| 3-Person Households | 51 (27.9%) | 0 (0.0%) |
| 4-Person Households | 0 (0.0%) | 0 (0.0%) |
| 5-Person Households | 43 (23.5%) | 0 (0.0%) |
| 6-Person Households | 0 (0.0%) | 0 (0.0%) |
| 7+ Person Households | 0 (0.0%) | 0 (0.0%) |
| Total | 183 (100.0%) | 0 (0.0%) |
Female Fertility in Ewing
Fertility by Age in Ewing
| Age Bracket | Women with Births | Births / 1,000 Women |
| 15 to 19 years | 0 (0.0%) | 0.0 |
| 20 to 34 years | 0 (0.0%) | 0.0 |
| 35 to 50 years | 0 (0.0%) | 0.0 |
| Total | 0 (0.0%) | 0.0 |
Fertility by Age by Marriage Status in Ewing
| Age Bracket | Married | Unmarried |
| 15 to 19 years | 0 (0.0%) | 0 (0.0%) |
| 20 to 34 years | 0 (0.0%) | 0 (0.0%) |
| 35 to 50 years | 0 (0.0%) | 0 (0.0%) |
| Total | 0 (0.0%) | 0 (0.0%) |
Fertility by Education in Ewing
| Educational Attainment | Women with Births | Births / 1,000 Women |
| Less than High School | 0 (0.0%) | 0.0 |
| High School Diploma | 0 (0.0%) | 0.0 |
| College or Associate's Degree | 0 (0.0%) | 0.0 |
| Bachelor's Degree | 0 (0.0%) | 0.0 |
| Graduate Degree | 0 (0.0%) | 0.0 |
| Total | 0 (0.0%) | 0.0 |
Fertility by Education by Marriage Status in Ewing
| Educational Attainment | Married | Unmarried |
| Less than High School | 0 (0.0%) | 0 (0.0%) |
| High School Diploma | 0 (0.0%) | 0 (0.0%) |
| College or Associate's Degree | 0 (0.0%) | 0 (0.0%) |
| Bachelor's Degree | 0 (0.0%) | 0 (0.0%) |
| Graduate Degree | 0 (0.0%) | 0 (0.0%) |
| Total | 0 (0.0%) | 0 (0.0%) |
Employment Characteristics in Ewing
Employment by Class of Employer in Ewing
Among the 235 employed individuals in Ewing, private company employees (98 | 41.7%), local government employees (45 | 19.2%), and state government employees (43 | 18.3%) make up the most common classes of employment.
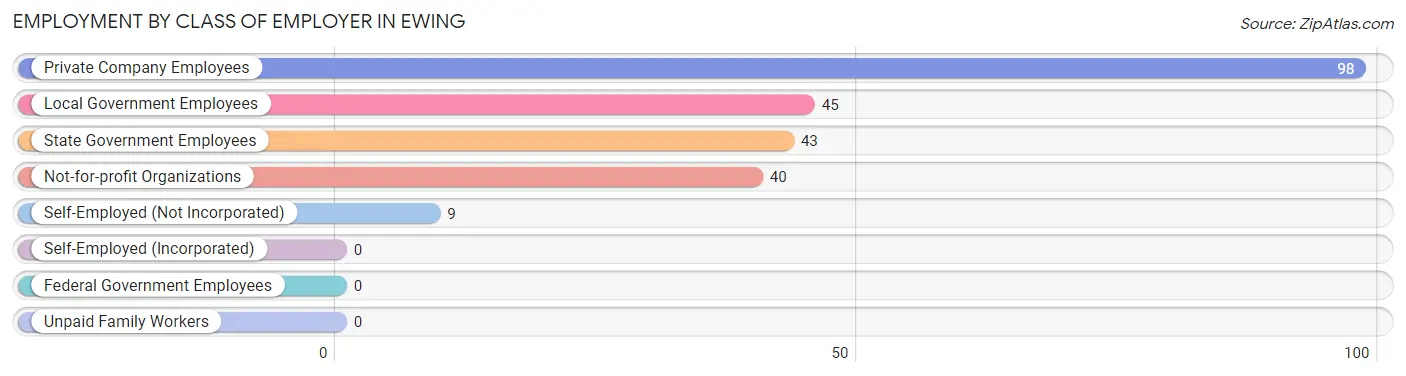
| Employer Class | # Employees | % Employees |
| Private Company Employees | 98 | 41.7% |
| Self-Employed (Incorporated) | 0 | 0.0% |
| Self-Employed (Not Incorporated) | 9 | 3.8% |
| Not-for-profit Organizations | 40 | 17.0% |
| Local Government Employees | 45 | 19.2% |
| State Government Employees | 43 | 18.3% |
| Federal Government Employees | 0 | 0.0% |
| Unpaid Family Workers | 0 | 0.0% |
| Total | 235 | 100.0% |
Employment Status by Age in Ewing
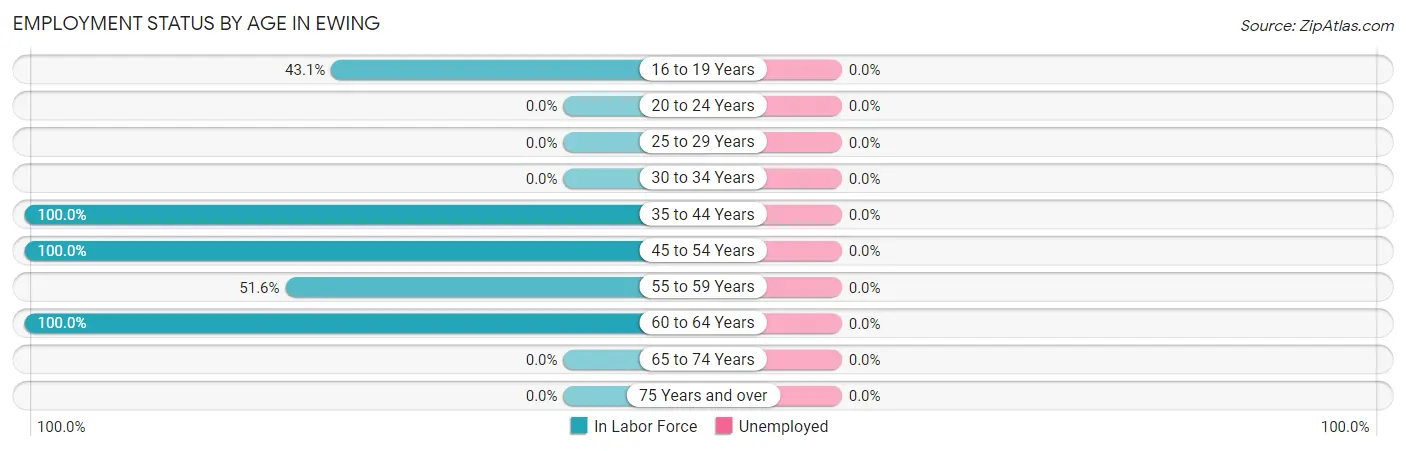
| Age Bracket | In Labor Force | Unemployed |
| 16 to 19 Years | 31 (43.1%) | 0 (0.0%) |
| 20 to 24 Years | 0 (0.0%) | 0 (0.0%) |
| 25 to 29 Years | 0 (0.0%) | 0 (0.0%) |
| 30 to 34 Years | 0 (0.0%) | 0 (0.0%) |
| 35 to 44 Years | 77 (100.0%) | 0 (0.0%) |
| 45 to 54 Years | 85 (100.0%) | 0 (0.0%) |
| 55 to 59 Years | 33 (51.6%) | 0 (0.0%) |
| 60 to 64 Years | 9 (100.0%) | 0 (0.0%) |
| 65 to 74 Years | 0 (0.0%) | 0 (0.0%) |
| 75 Years and over | 0 (0.0%) | 0 (0.0%) |
| Total | 235 (56.8%) | 0 (0.0%) |
Employment Status by Educational Attainment in Ewing
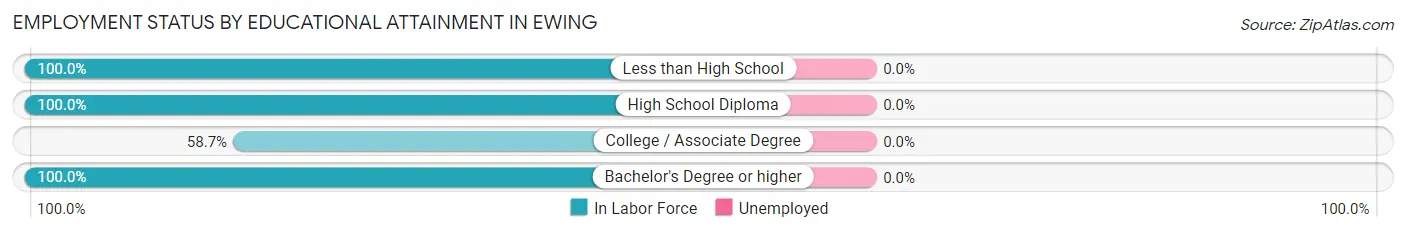
| Educational Attainment | In Labor Force | Unemployed |
| Less than High School | 49 (100.0%) | 0 (0.0%) |
| High School Diploma | 34 (100.0%) | 0 (0.0%) |
| College / Associate Degree | 44 (58.7%) | 0 (0.0%) |
| Bachelor's Degree or higher | 77 (100.0%) | 0 (0.0%) |
| Total | 204 (86.8%) | 0 (0.0%) |
Employment Occupations by Sex in Ewing
Management, Business, Science and Arts Occupations
The most common Management, Business, Science and Arts occupations in Ewing are Community & Social Service (88 | 37.4%), Education Instruction & Library (88 | 37.4%), and Management (43 | 18.3%).
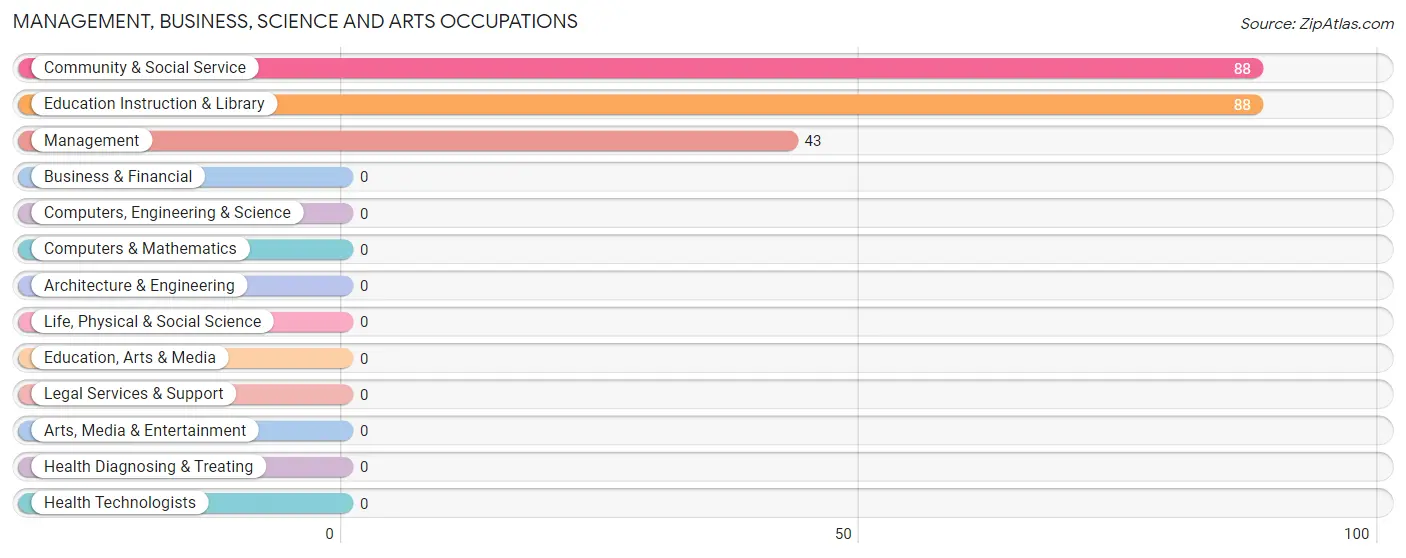
Management, Business, Science and Arts Occupations by Sex
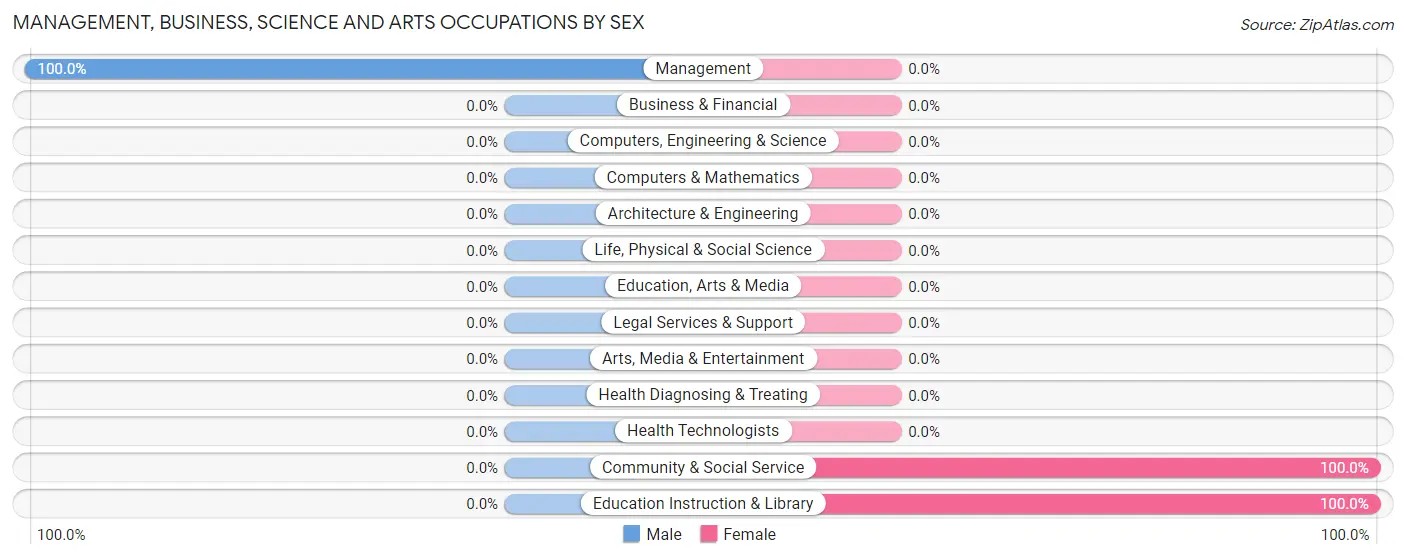
| Occupation | Male | Female |
| Management | 43 (100.0%) | 0 (0.0%) |
| Business & Financial | 0 (0.0%) | 0 (0.0%) |
| Computers, Engineering & Science | 0 (0.0%) | 0 (0.0%) |
| Computers & Mathematics | 0 (0.0%) | 0 (0.0%) |
| Architecture & Engineering | 0 (0.0%) | 0 (0.0%) |
| Life, Physical & Social Science | 0 (0.0%) | 0 (0.0%) |
| Community & Social Service | 0 (0.0%) | 88 (100.0%) |
| Education, Arts & Media | 0 (0.0%) | 0 (0.0%) |
| Legal Services & Support | 0 (0.0%) | 0 (0.0%) |
| Education Instruction & Library | 0 (0.0%) | 88 (100.0%) |
| Arts, Media & Entertainment | 0 (0.0%) | 0 (0.0%) |
| Health Diagnosing & Treating | 0 (0.0%) | 0 (0.0%) |
| Health Technologists | 0 (0.0%) | 0 (0.0%) |
| Total (Category) | 43 (32.8%) | 88 (67.2%) |
| Total (Overall) | 114 (48.5%) | 121 (51.5%) |
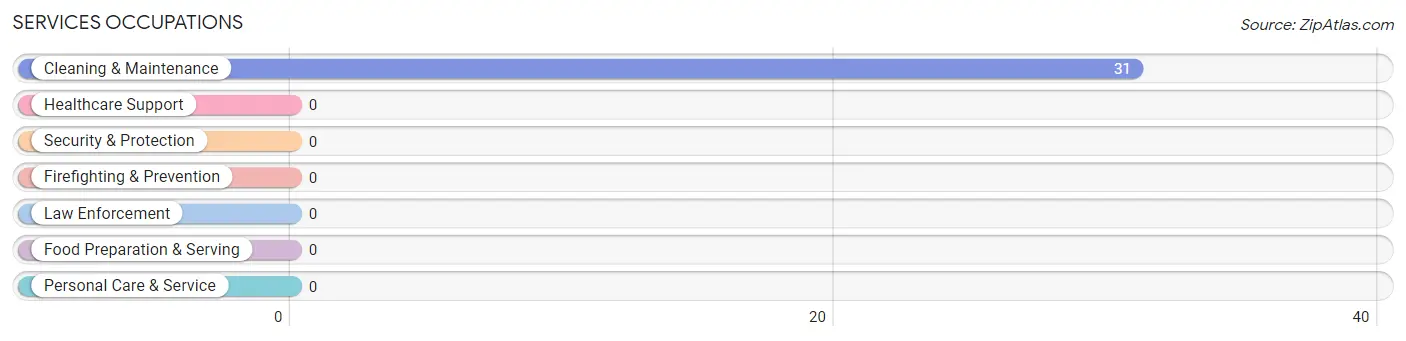
Services Occupations
The most common Services occupations in Ewing are , and Cleaning & Maintenance (31 | 13.2%).
Services Occupations by Sex
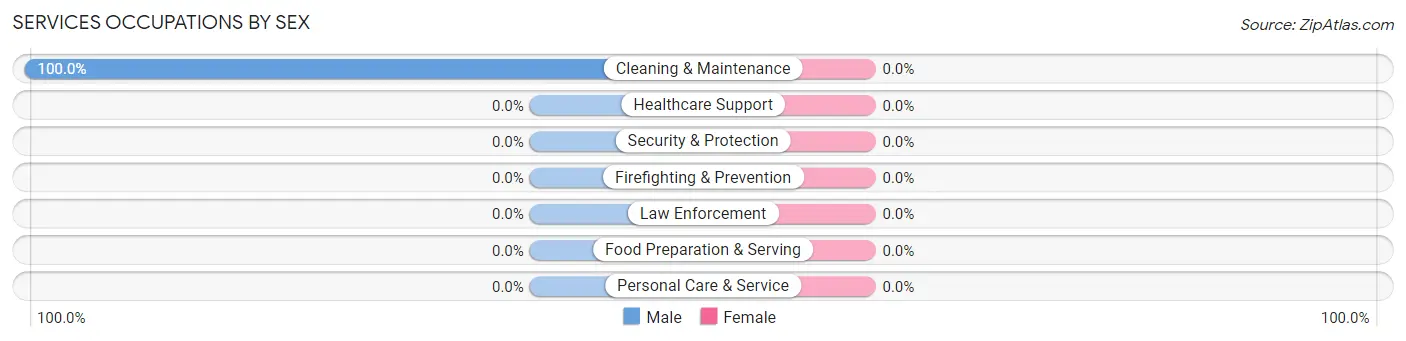
| Occupation | Male | Female |
| Healthcare Support | 0 (0.0%) | 0 (0.0%) |
| Security & Protection | 0 (0.0%) | 0 (0.0%) |
| Firefighting & Prevention | 0 (0.0%) | 0 (0.0%) |
| Law Enforcement | 0 (0.0%) | 0 (0.0%) |
| Food Preparation & Serving | 0 (0.0%) | 0 (0.0%) |
| Cleaning & Maintenance | 31 (100.0%) | 0 (0.0%) |
| Personal Care & Service | 0 (0.0%) | 0 (0.0%) |
| Total (Category) | 31 (100.0%) | 0 (0.0%) |
| Total (Overall) | 114 (48.5%) | 121 (51.5%) |
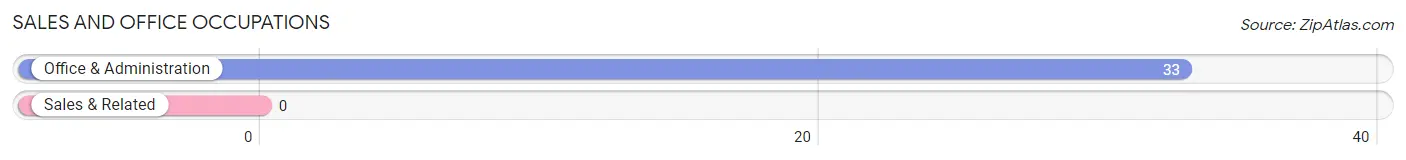
Sales and Office Occupations
The most common Sales and Office occupations in Ewing are , and Office & Administration (33 | 14.0%).
Sales and Office Occupations by Sex
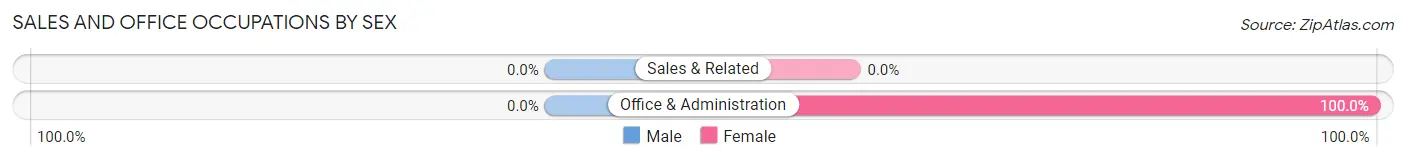
| Occupation | Male | Female |
| Sales & Related | 0 (0.0%) | 0 (0.0%) |
| Office & Administration | 0 (0.0%) | 33 (100.0%) |
| Total (Category) | 0 (0.0%) | 33 (100.0%) |
| Total (Overall) | 114 (48.5%) | 121 (51.5%) |
Natural Resources, Construction and Maintenance Occupations
The most common Natural Resources, Construction and Maintenance occupations in Ewing are , and Installation, Maintenance & Repair (40 | 17.0%).
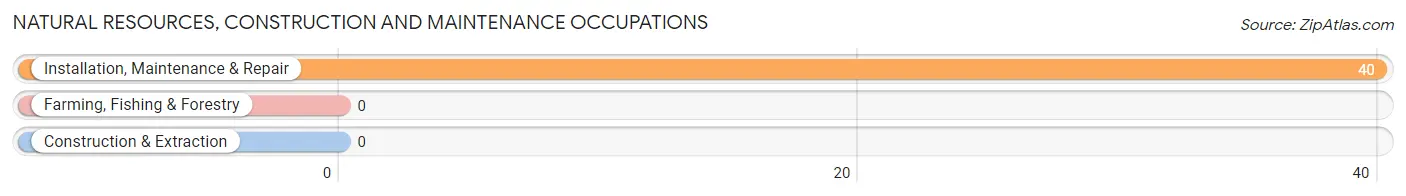
Natural Resources, Construction and Maintenance Occupations by Sex
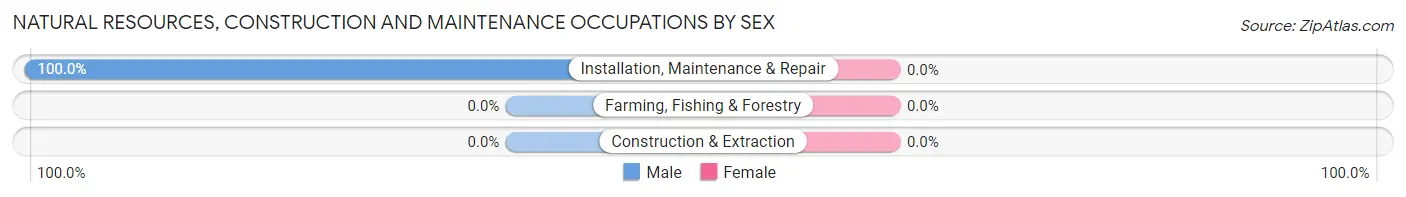
| Occupation | Male | Female |
| Farming, Fishing & Forestry | 0 (0.0%) | 0 (0.0%) |
| Construction & Extraction | 0 (0.0%) | 0 (0.0%) |
| Installation, Maintenance & Repair | 40 (100.0%) | 0 (0.0%) |
| Total (Category) | 40 (100.0%) | 0 (0.0%) |
| Total (Overall) | 114 (48.5%) | 121 (51.5%) |
Production, Transportation and Moving Occupations
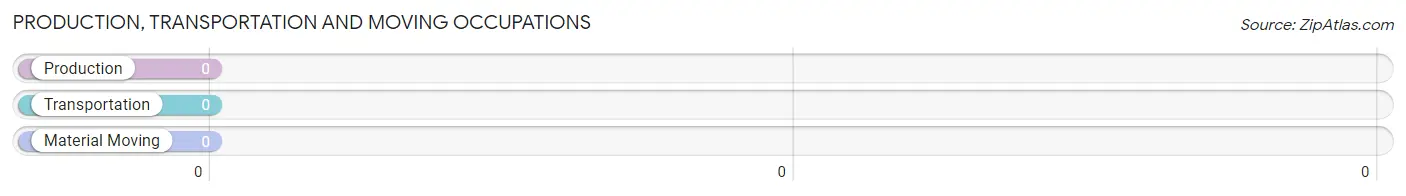
Production, Transportation and Moving Occupations by Sex
| Occupation | Male | Female |
| Production | 0 (0.0%) | 0 (0.0%) |
| Transportation | 0 (0.0%) | 0 (0.0%) |
| Material Moving | 0 (0.0%) | 0 (0.0%) |
| Total (Category) | 0 (0.0%) | 0 (0.0%) |
| Total (Overall) | 114 (48.5%) | 121 (51.5%) |
Employment Industries by Sex in Ewing
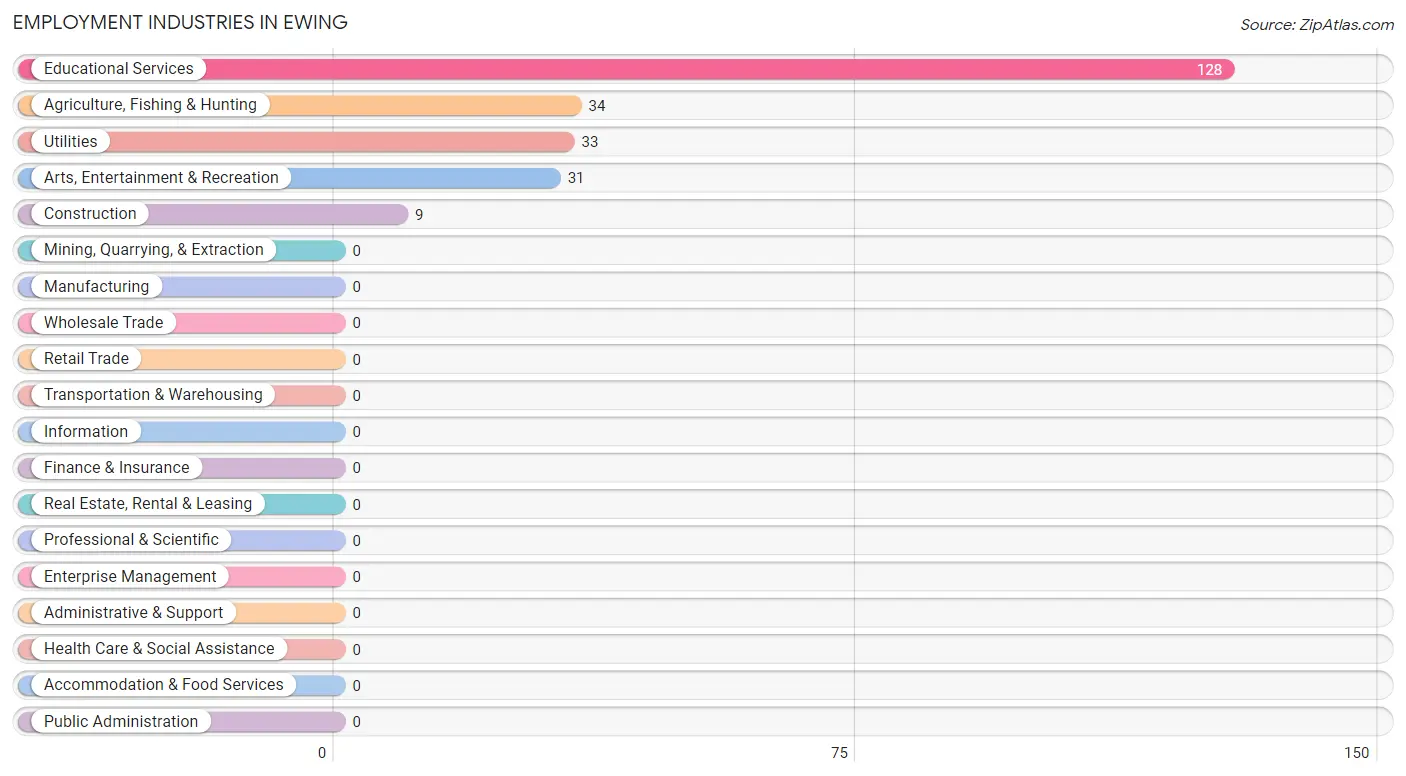
Employment Industries in Ewing
The major employment industries in Ewing include Educational Services (128 | 54.5%), Agriculture, Fishing & Hunting (34 | 14.5%), Utilities (33 | 14.0%), Arts, Entertainment & Recreation (31 | 13.2%), and Construction (9 | 3.8%).
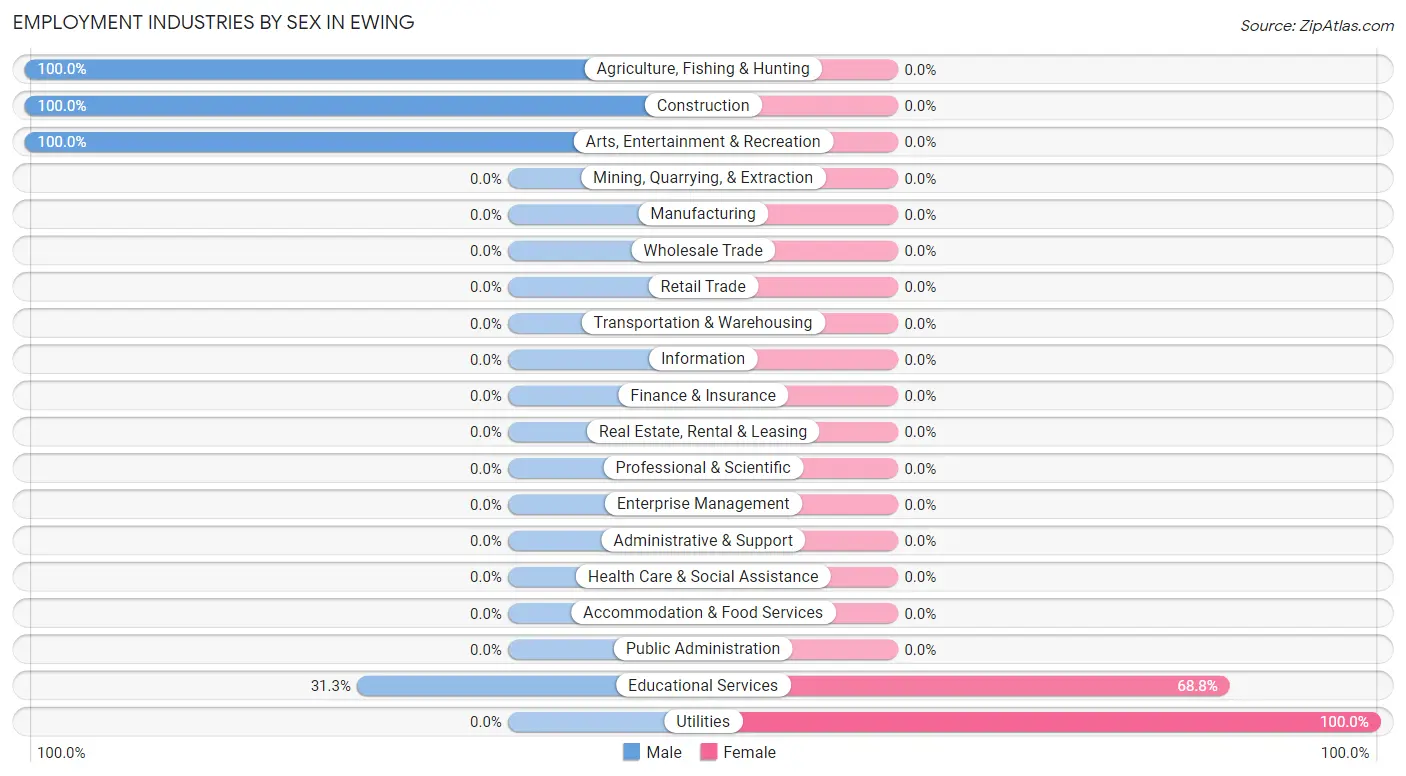
Employment Industries by Sex in Ewing
The Ewing industries that see more men than women are Agriculture, Fishing & Hunting (100.0%), Construction (100.0%), and Arts, Entertainment & Recreation (100.0%), whereas the industries that tend to have a higher number of women are Utilities (100.0%), and Educational Services (68.8%).
| Industry | Male | Female |
| Agriculture, Fishing & Hunting | 34 (100.0%) | 0 (0.0%) |
| Mining, Quarrying, & Extraction | 0 (0.0%) | 0 (0.0%) |
| Construction | 9 (100.0%) | 0 (0.0%) |
| Manufacturing | 0 (0.0%) | 0 (0.0%) |
| Wholesale Trade | 0 (0.0%) | 0 (0.0%) |
| Retail Trade | 0 (0.0%) | 0 (0.0%) |
| Transportation & Warehousing | 0 (0.0%) | 0 (0.0%) |
| Utilities | 0 (0.0%) | 33 (100.0%) |
| Information | 0 (0.0%) | 0 (0.0%) |
| Finance & Insurance | 0 (0.0%) | 0 (0.0%) |
| Real Estate, Rental & Leasing | 0 (0.0%) | 0 (0.0%) |
| Professional & Scientific | 0 (0.0%) | 0 (0.0%) |
| Enterprise Management | 0 (0.0%) | 0 (0.0%) |
| Administrative & Support | 0 (0.0%) | 0 (0.0%) |
| Educational Services | 40 (31.2%) | 88 (68.8%) |
| Health Care & Social Assistance | 0 (0.0%) | 0 (0.0%) |
| Arts, Entertainment & Recreation | 31 (100.0%) | 0 (0.0%) |
| Accommodation & Food Services | 0 (0.0%) | 0 (0.0%) |
| Public Administration | 0 (0.0%) | 0 (0.0%) |
| Total | 114 (48.5%) | 121 (51.5%) |
Education in Ewing
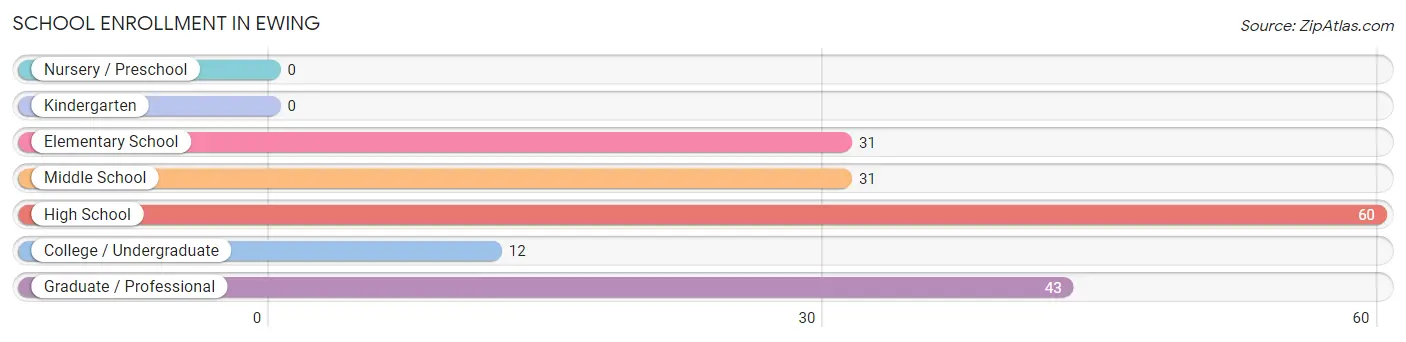
School Enrollment in Ewing
The most common levels of schooling among the 177 students in Ewing are high school (60 | 33.9%), graduate / professional (43 | 24.3%), and elementary school (31 | 17.5%).
| School Level | # Students | % Students |
| Nursery / Preschool | 0 | 0.0% |
| Kindergarten | 0 | 0.0% |
| Elementary School | 31 | 17.5% |
| Middle School | 31 | 17.5% |
| High School | 60 | 33.9% |
| College / Undergraduate | 12 | 6.8% |
| Graduate / Professional | 43 | 24.3% |
| Total | 177 | 100.0% |
School Enrollment by Age by Funding Source in Ewing
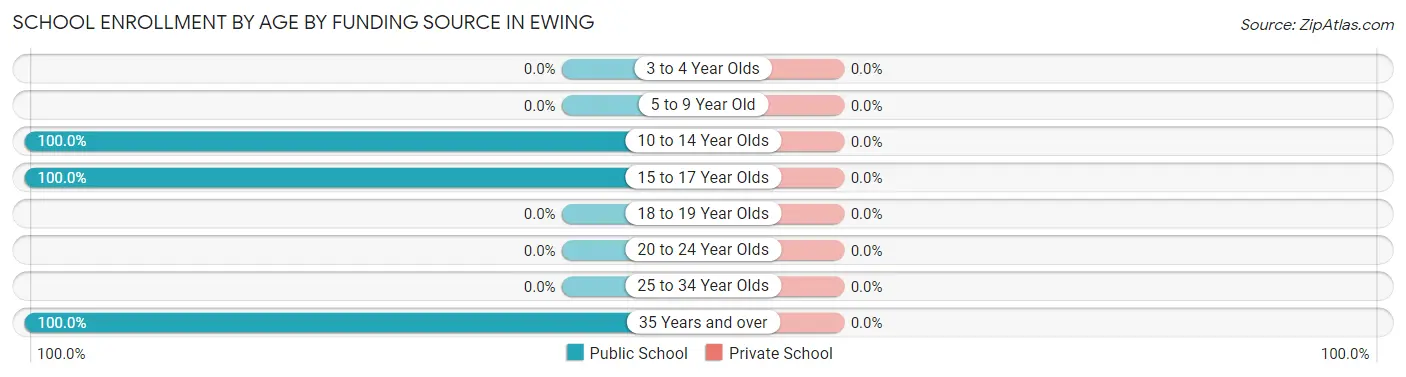
| Age Bracket | Public School | Private School |
| 3 to 4 Year Olds | 0 (0.0%) | 0 (0.0%) |
| 5 to 9 Year Old | 0 (0.0%) | 0 (0.0%) |
| 10 to 14 Year Olds | 62 (100.0%) | 0 (0.0%) |
| 15 to 17 Year Olds | 72 (100.0%) | 0 (0.0%) |
| 18 to 19 Year Olds | 0 (0.0%) | 0 (0.0%) |
| 20 to 24 Year Olds | 0 (0.0%) | 0 (0.0%) |
| 25 to 34 Year Olds | 0 (0.0%) | 0 (0.0%) |
| 35 Years and over | 43 (100.0%) | 0 (0.0%) |
| Total | 177 (100.0%) | 0 (0.0%) |
Educational Attainment by Field of Study in Ewing
, and education (134 | 100.0%) are the most common fields of study among 134 individuals in Ewing who have obtained a bachelor's degree or higher.
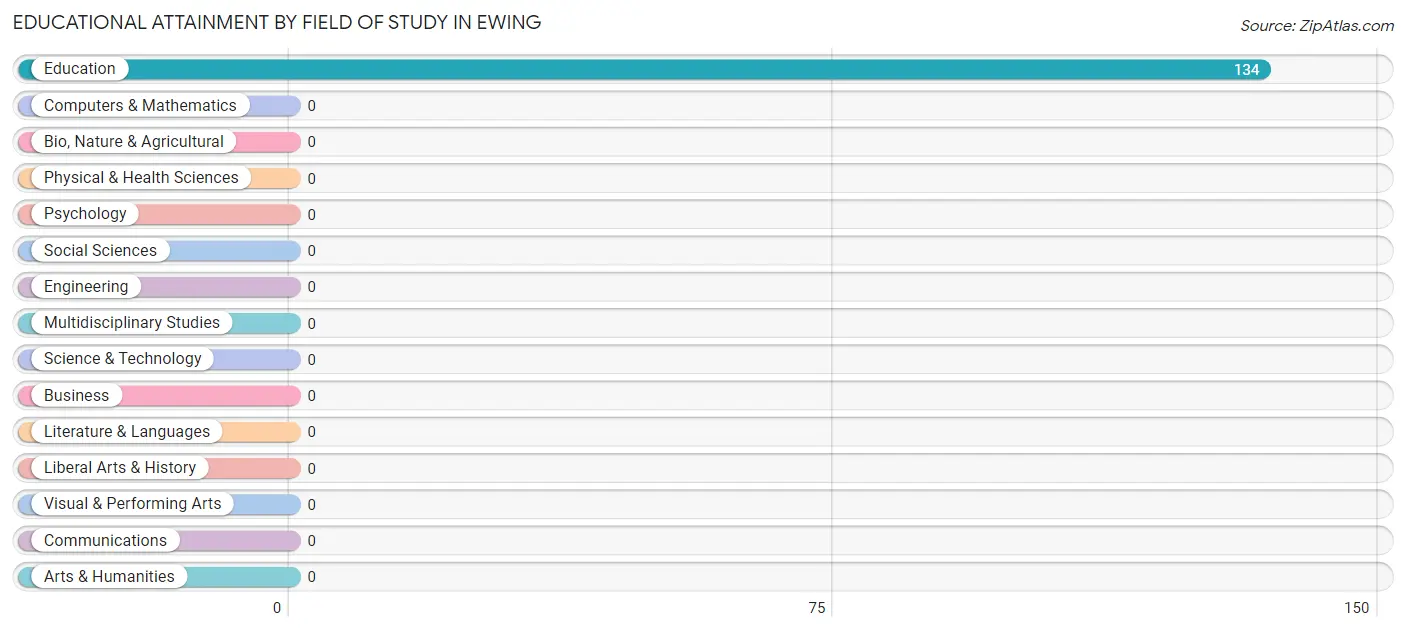
| Field of Study | # Graduates | % Graduates |
| Computers & Mathematics | 0 | 0.0% |
| Bio, Nature & Agricultural | 0 | 0.0% |
| Physical & Health Sciences | 0 | 0.0% |
| Psychology | 0 | 0.0% |
| Social Sciences | 0 | 0.0% |
| Engineering | 0 | 0.0% |
| Multidisciplinary Studies | 0 | 0.0% |
| Science & Technology | 0 | 0.0% |
| Business | 0 | 0.0% |
| Education | 134 | 100.0% |
| Literature & Languages | 0 | 0.0% |
| Liberal Arts & History | 0 | 0.0% |
| Visual & Performing Arts | 0 | 0.0% |
| Communications | 0 | 0.0% |
| Arts & Humanities | 0 | 0.0% |
| Total | 134 | 100.0% |
Transportation & Commute in Ewing
Vehicle Availability by Sex in Ewing
The most prevalent vehicle ownership categories in Ewing are males with 3 vehicles (114, accounting for 100.0%) and females with 3 vehicles (88, making up 94.2%).
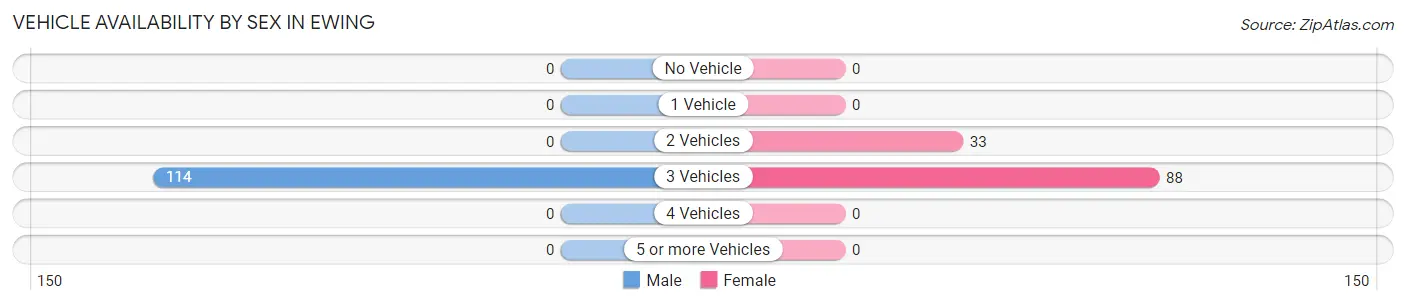
| Vehicles Available | Male | Female |
| No Vehicle | 0 (0.0%) | 0 (0.0%) |
| 1 Vehicle | 0 (0.0%) | 0 (0.0%) |
| 2 Vehicles | 0 (0.0%) | 33 (27.3%) |
| 3 Vehicles | 114 (100.0%) | 88 (72.7%) |
| 4 Vehicles | 0 (0.0%) | 0 (0.0%) |
| 5 or more Vehicles | 0 (0.0%) | 0 (0.0%) |
| Total | 114 (100.0%) | 121 (100.0%) |
Commute Time in Ewing
The most frequently occuring commute durations in Ewing are 5 to 9 minutes (114 commuters, 50.4%), 10 to 14 minutes (45 commuters, 19.9%), and less than 5 minutes (34 commuters, 15.0%).
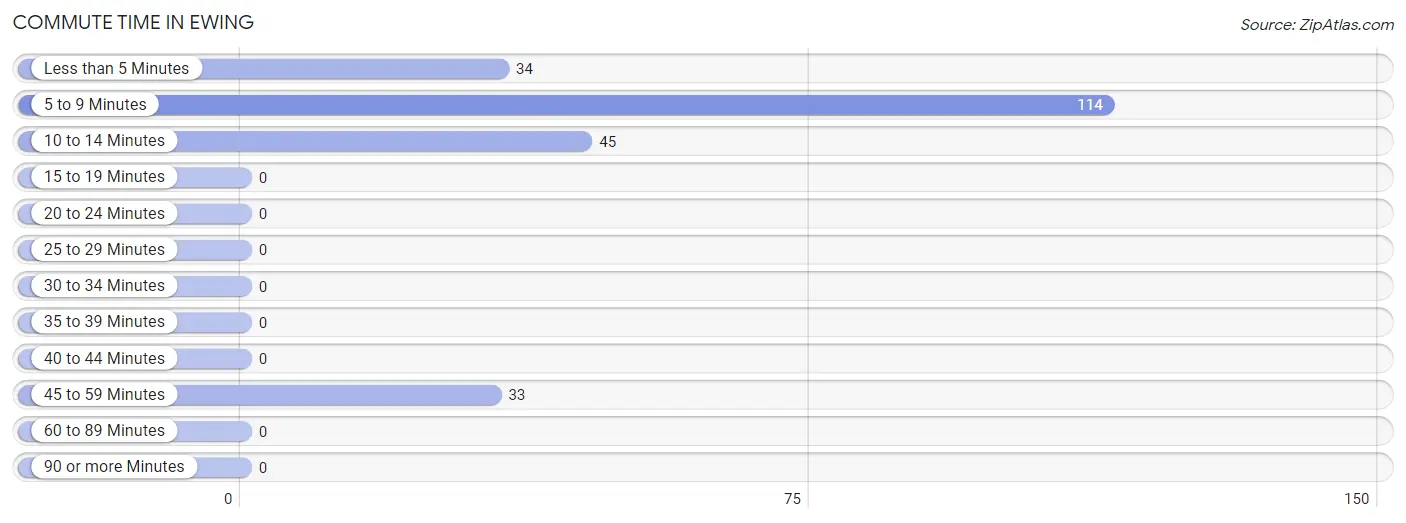
| Commute Time | # Commuters | % Commuters |
| Less than 5 Minutes | 34 | 15.0% |
| 5 to 9 Minutes | 114 | 50.4% |
| 10 to 14 Minutes | 45 | 19.9% |
| 15 to 19 Minutes | 0 | 0.0% |
| 20 to 24 Minutes | 0 | 0.0% |
| 25 to 29 Minutes | 0 | 0.0% |
| 30 to 34 Minutes | 0 | 0.0% |
| 35 to 39 Minutes | 0 | 0.0% |
| 40 to 44 Minutes | 0 | 0.0% |
| 45 to 59 Minutes | 33 | 14.6% |
| 60 to 89 Minutes | 0 | 0.0% |
| 90 or more Minutes | 0 | 0.0% |
Commute Time by Sex in Ewing
The most common commute times in Ewing are 5 to 9 minutes (71 commuters, 67.6%) for males and 10 to 14 minutes (45 commuters, 37.2%) for females.
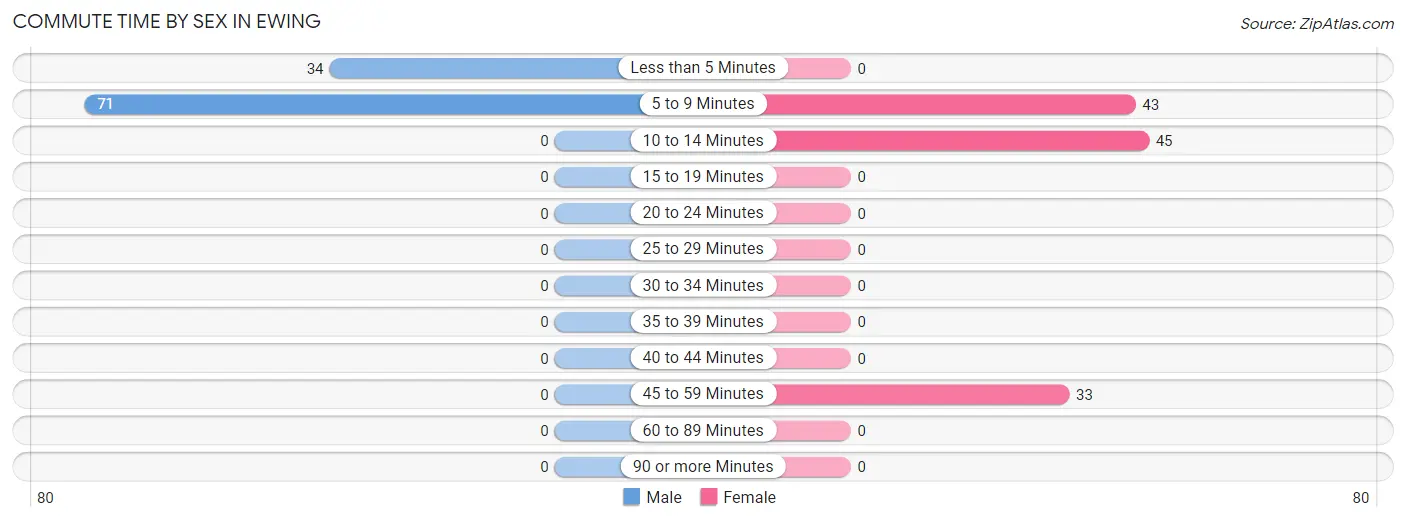
| Commute Time | Male | Female |
| Less than 5 Minutes | 34 (32.4%) | 0 (0.0%) |
| 5 to 9 Minutes | 71 (67.6%) | 43 (35.5%) |
| 10 to 14 Minutes | 0 (0.0%) | 45 (37.2%) |
| 15 to 19 Minutes | 0 (0.0%) | 0 (0.0%) |
| 20 to 24 Minutes | 0 (0.0%) | 0 (0.0%) |
| 25 to 29 Minutes | 0 (0.0%) | 0 (0.0%) |
| 30 to 34 Minutes | 0 (0.0%) | 0 (0.0%) |
| 35 to 39 Minutes | 0 (0.0%) | 0 (0.0%) |
| 40 to 44 Minutes | 0 (0.0%) | 0 (0.0%) |
| 45 to 59 Minutes | 0 (0.0%) | 33 (27.3%) |
| 60 to 89 Minutes | 0 (0.0%) | 0 (0.0%) |
| 90 or more Minutes | 0 (0.0%) | 0 (0.0%) |
Time of Departure to Work by Sex in Ewing
The most frequent times of departure to work in Ewing are 7:30 AM to 7:59 AM (40, 38.1%) for males and 7:30 AM to 7:59 AM (67, 55.4%) for females.
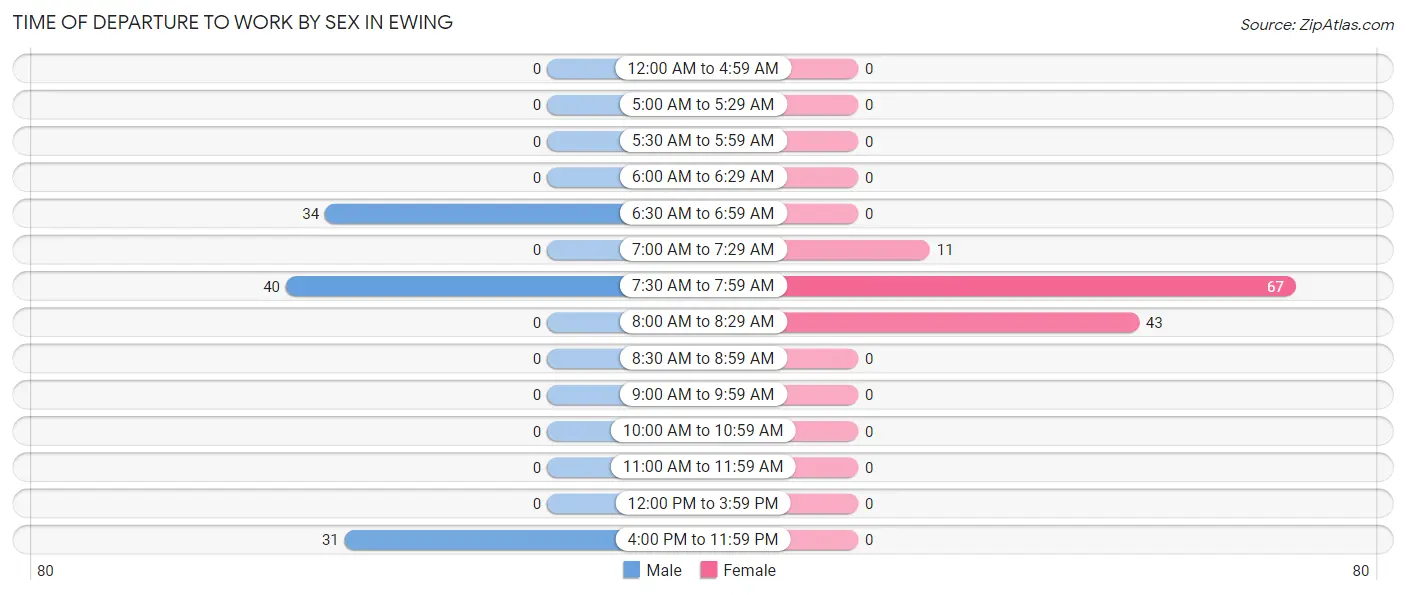
| Time of Departure | Male | Female |
| 12:00 AM to 4:59 AM | 0 (0.0%) | 0 (0.0%) |
| 5:00 AM to 5:29 AM | 0 (0.0%) | 0 (0.0%) |
| 5:30 AM to 5:59 AM | 0 (0.0%) | 0 (0.0%) |
| 6:00 AM to 6:29 AM | 0 (0.0%) | 0 (0.0%) |
| 6:30 AM to 6:59 AM | 34 (32.4%) | 0 (0.0%) |
| 7:00 AM to 7:29 AM | 0 (0.0%) | 11 (9.1%) |
| 7:30 AM to 7:59 AM | 40 (38.1%) | 67 (55.4%) |
| 8:00 AM to 8:29 AM | 0 (0.0%) | 43 (35.5%) |
| 8:30 AM to 8:59 AM | 0 (0.0%) | 0 (0.0%) |
| 9:00 AM to 9:59 AM | 0 (0.0%) | 0 (0.0%) |
| 10:00 AM to 10:59 AM | 0 (0.0%) | 0 (0.0%) |
| 11:00 AM to 11:59 AM | 0 (0.0%) | 0 (0.0%) |
| 12:00 PM to 3:59 PM | 0 (0.0%) | 0 (0.0%) |
| 4:00 PM to 11:59 PM | 31 (29.5%) | 0 (0.0%) |
| Total | 105 (100.0%) | 121 (100.0%) |
Housing Occupancy in Ewing
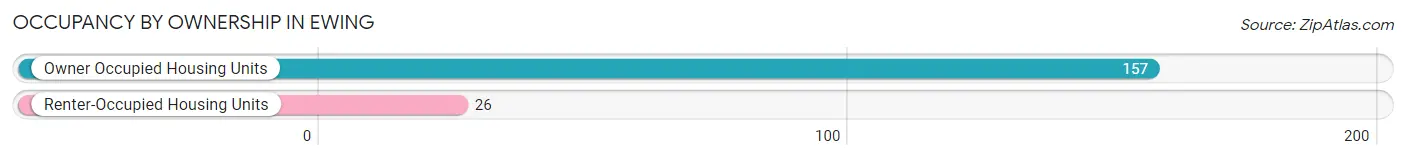
Occupancy by Ownership in Ewing
Of the total 183 dwellings in Ewing, owner-occupied units account for 157 (85.8%), while renter-occupied units make up 26 (14.2%).
| Occupancy | # Housing Units | % Housing Units |
| Owner Occupied Housing Units | 157 | 85.8% |
| Renter-Occupied Housing Units | 26 | 14.2% |
| Total Occupied Housing Units | 183 | 100.0% |
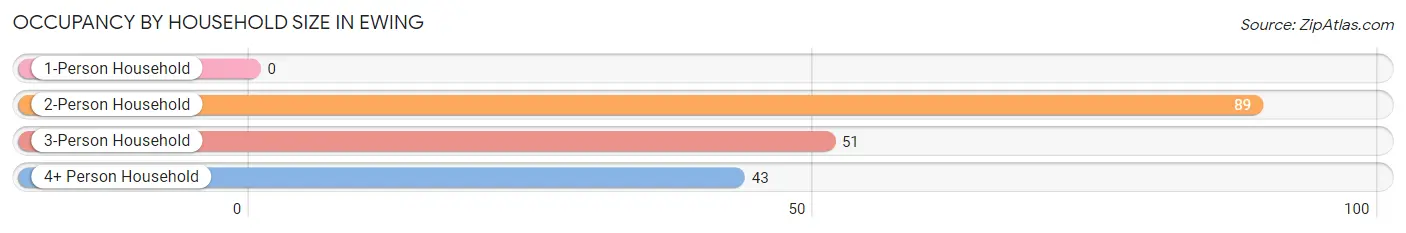
Occupancy by Household Size in Ewing
| Household Size | # Housing Units | % Housing Units |
| 1-Person Household | 0 | 0.0% |
| 2-Person Household | 89 | 48.6% |
| 3-Person Household | 51 | 27.9% |
| 4+ Person Household | 43 | 23.5% |
| Total Housing Units | 183 | 100.0% |
Occupancy by Ownership by Household Size in Ewing
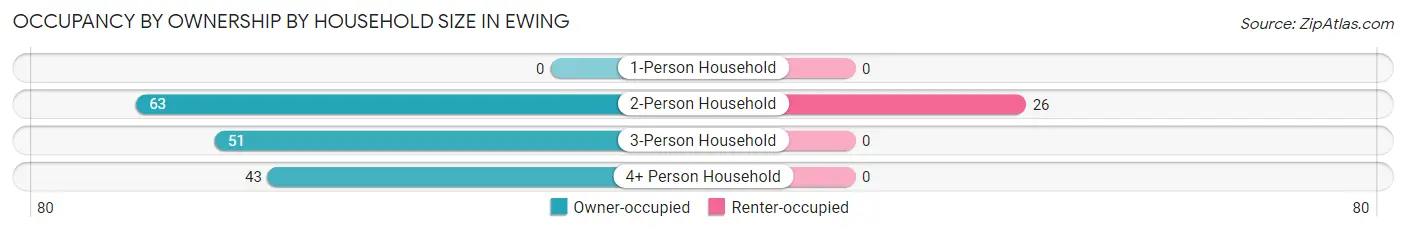
| Household Size | Owner-occupied | Renter-occupied |
| 1-Person Household | 0 (0.0%) | 0 (0.0%) |
| 2-Person Household | 63 (70.8%) | 26 (29.2%) |
| 3-Person Household | 51 (100.0%) | 0 (0.0%) |
| 4+ Person Household | 43 (100.0%) | 0 (0.0%) |
| Total Housing Units | 157 (85.8%) | 26 (14.2%) |
Occupancy by Educational Attainment in Ewing
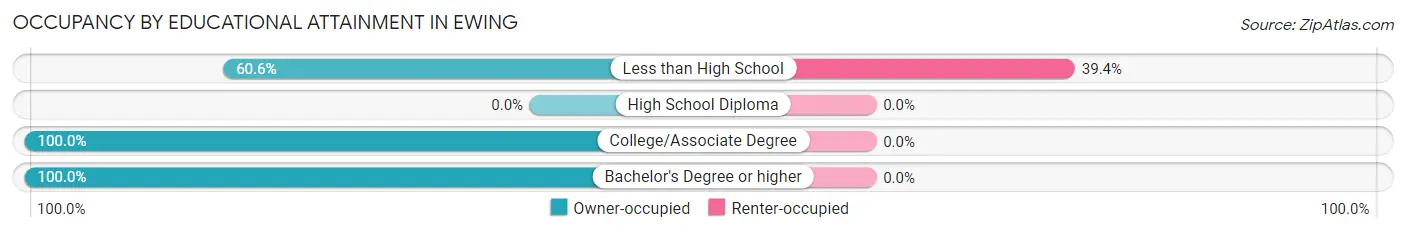
| Household Size | Owner-occupied | Renter-occupied |
| Less than High School | 40 (60.6%) | 26 (39.4%) |
| High School Diploma | 0 (0.0%) | 0 (0.0%) |
| College/Associate Degree | 44 (100.0%) | 0 (0.0%) |
| Bachelor's Degree or higher | 73 (100.0%) | 0 (0.0%) |
Occupancy by Age of Householder in Ewing
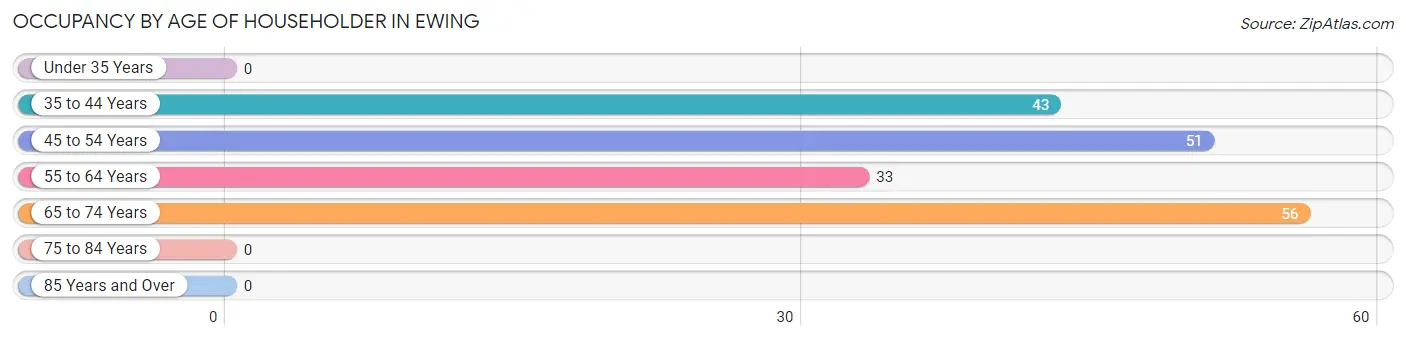
| Age Bracket | # Households | % Households |
| Under 35 Years | 0 | 0.0% |
| 35 to 44 Years | 43 | 23.5% |
| 45 to 54 Years | 51 | 27.9% |
| 55 to 64 Years | 33 | 18.0% |
| 65 to 74 Years | 56 | 30.6% |
| 75 to 84 Years | 0 | 0.0% |
| 85 Years and Over | 0 | 0.0% |
| Total | 183 | 100.0% |
Housing Finances in Ewing
Median Income by Occupancy in Ewing
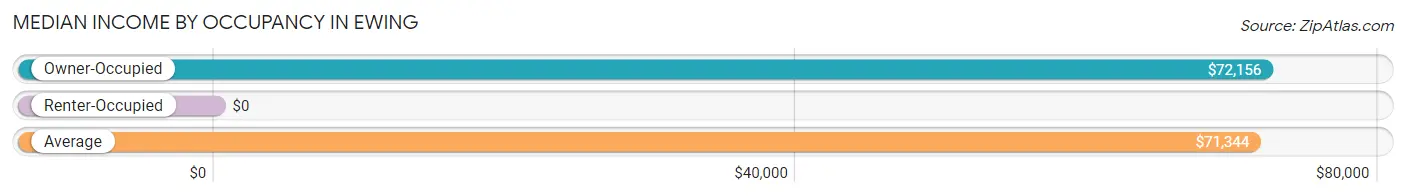
| Occupancy Type | # Households | Median Income |
| Owner-Occupied | 157 (85.8%) | $72,156 |
| Renter-Occupied | 26 (14.2%) | $0 |
| Average | 183 (100.0%) | $71,344 |
Occupancy by Householder Income Bracket in Ewing
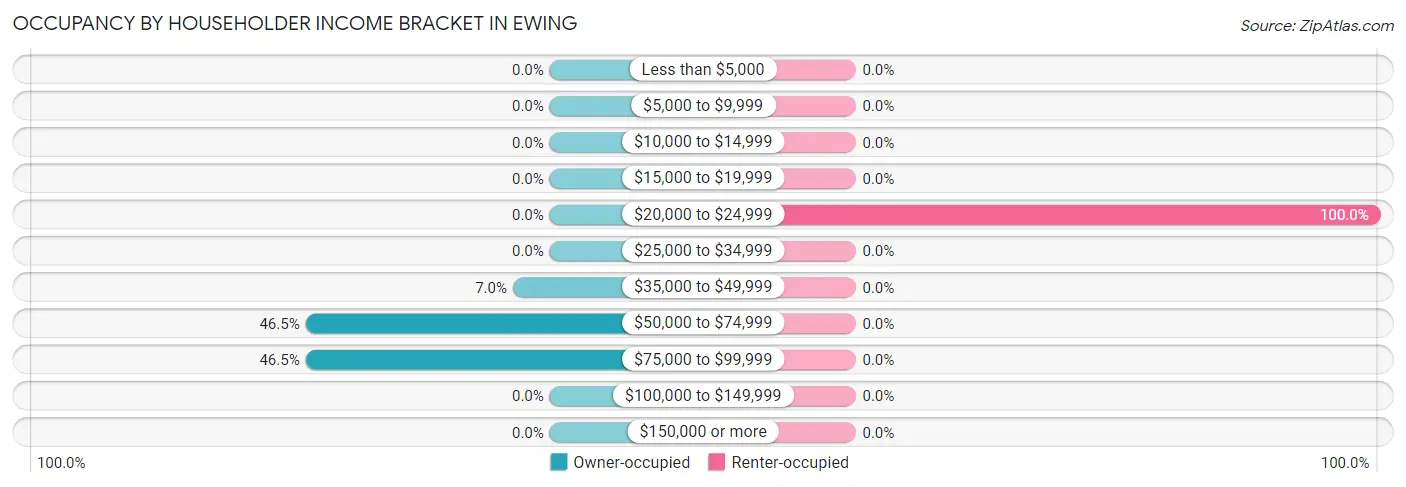
| Income Bracket | Owner-occupied | Renter-occupied |
| Less than $5,000 | 0 (0.0%) | 0 (0.0%) |
| $5,000 to $9,999 | 0 (0.0%) | 0 (0.0%) |
| $10,000 to $14,999 | 0 (0.0%) | 0 (0.0%) |
| $15,000 to $19,999 | 0 (0.0%) | 0 (0.0%) |
| $20,000 to $24,999 | 0 (0.0%) | 26 (100.0%) |
| $25,000 to $34,999 | 0 (0.0%) | 0 (0.0%) |
| $35,000 to $49,999 | 11 (7.0%) | 0 (0.0%) |
| $50,000 to $74,999 | 73 (46.5%) | 0 (0.0%) |
| $75,000 to $99,999 | 73 (46.5%) | 0 (0.0%) |
| $100,000 to $149,999 | 0 (0.0%) | 0 (0.0%) |
| $150,000 or more | 0 (0.0%) | 0 (0.0%) |
| Total | 157 (100.0%) | 26 (100.0%) |
Monthly Housing Cost Tiers in Ewing
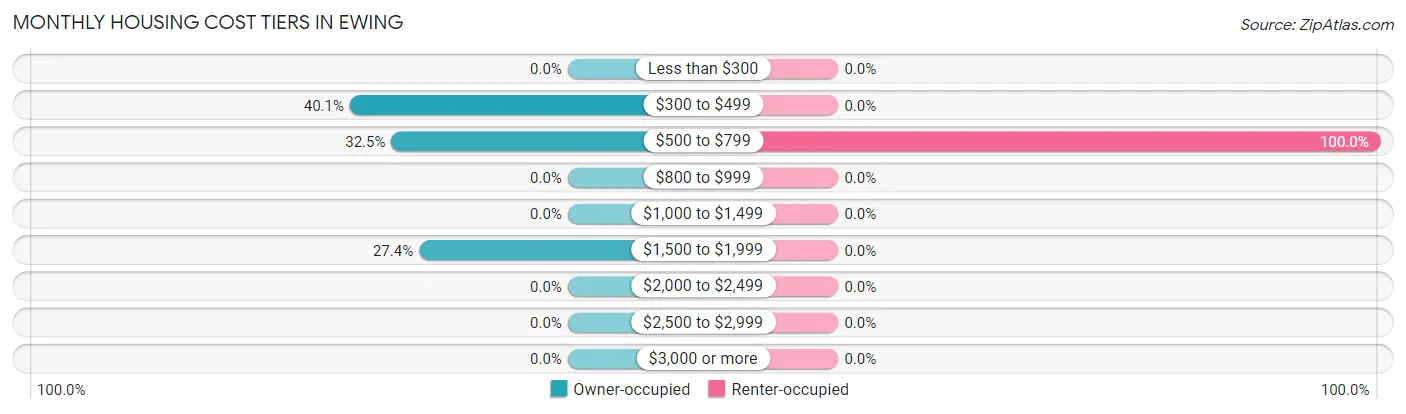
| Monthly Cost | Owner-occupied | Renter-occupied |
| Less than $300 | 0 (0.0%) | 0 (0.0%) |
| $300 to $499 | 63 (40.1%) | 0 (0.0%) |
| $500 to $799 | 51 (32.5%) | 26 (100.0%) |
| $800 to $999 | 0 (0.0%) | 0 (0.0%) |
| $1,000 to $1,499 | 0 (0.0%) | 0 (0.0%) |
| $1,500 to $1,999 | 43 (27.4%) | 0 (0.0%) |
| $2,000 to $2,499 | 0 (0.0%) | 0 (0.0%) |
| $2,500 to $2,999 | 0 (0.0%) | 0 (0.0%) |
| $3,000 or more | 0 (0.0%) | 0 (0.0%) |
| Total | 157 (100.0%) | 26 (100.0%) |
Physical Housing Characteristics in Ewing
Housing Structures in Ewing
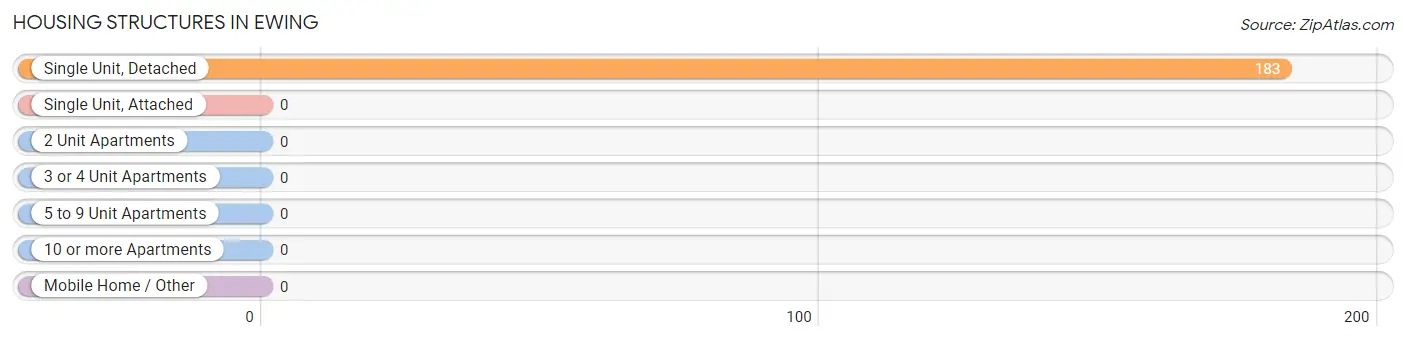
| Structure Type | # Housing Units | % Housing Units |
| Single Unit, Detached | 183 | 100.0% |
| Single Unit, Attached | 0 | 0.0% |
| 2 Unit Apartments | 0 | 0.0% |
| 3 or 4 Unit Apartments | 0 | 0.0% |
| 5 to 9 Unit Apartments | 0 | 0.0% |
| 10 or more Apartments | 0 | 0.0% |
| Mobile Home / Other | 0 | 0.0% |
| Total | 183 | 100.0% |
Housing Structures by Occupancy in Ewing
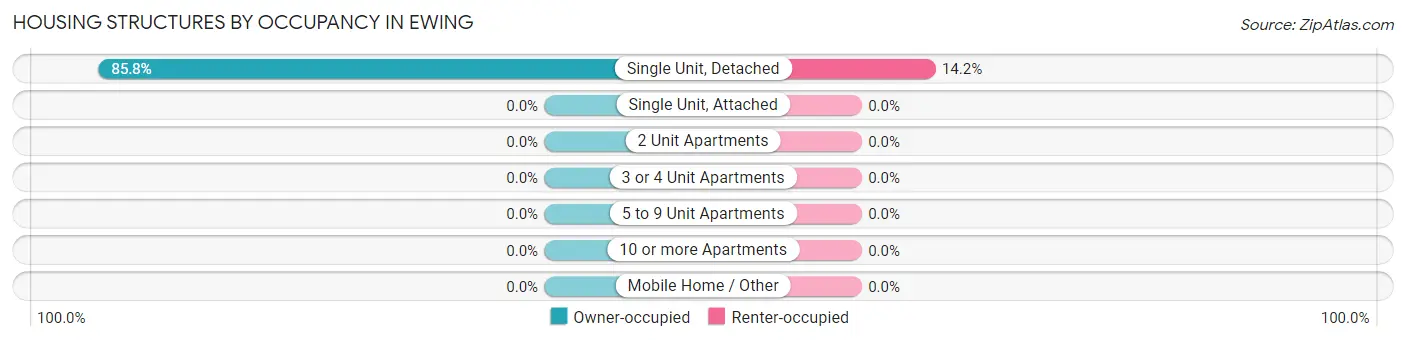
| Structure Type | Owner-occupied | Renter-occupied |
| Single Unit, Detached | 157 (85.8%) | 26 (14.2%) |
| Single Unit, Attached | 0 (0.0%) | 0 (0.0%) |
| 2 Unit Apartments | 0 (0.0%) | 0 (0.0%) |
| 3 or 4 Unit Apartments | 0 (0.0%) | 0 (0.0%) |
| 5 to 9 Unit Apartments | 0 (0.0%) | 0 (0.0%) |
| 10 or more Apartments | 0 (0.0%) | 0 (0.0%) |
| Mobile Home / Other | 0 (0.0%) | 0 (0.0%) |
| Total | 157 (85.8%) | 26 (14.2%) |
Housing Structures by Number of Rooms in Ewing
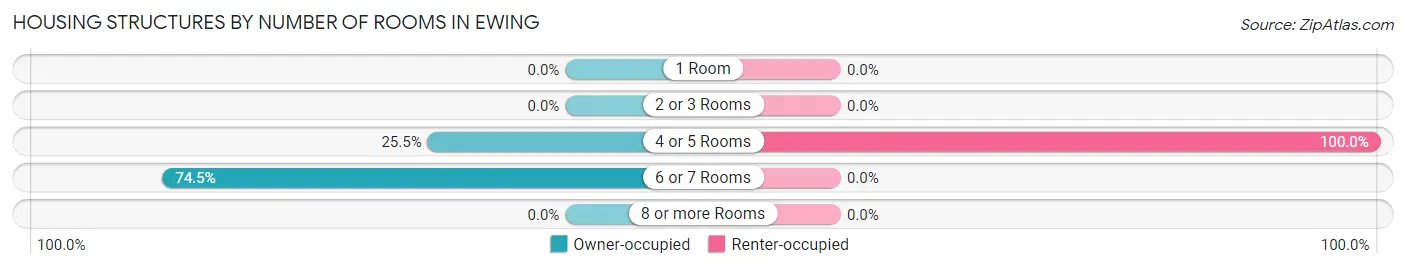
| Number of Rooms | Owner-occupied | Renter-occupied |
| 1 Room | 0 (0.0%) | 0 (0.0%) |
| 2 or 3 Rooms | 0 (0.0%) | 0 (0.0%) |
| 4 or 5 Rooms | 40 (25.5%) | 26 (100.0%) |
| 6 or 7 Rooms | 117 (74.5%) | 0 (0.0%) |
| 8 or more Rooms | 0 (0.0%) | 0 (0.0%) |
| Total | 157 (100.0%) | 26 (100.0%) |
Housing Structure by Heating Type in Ewing
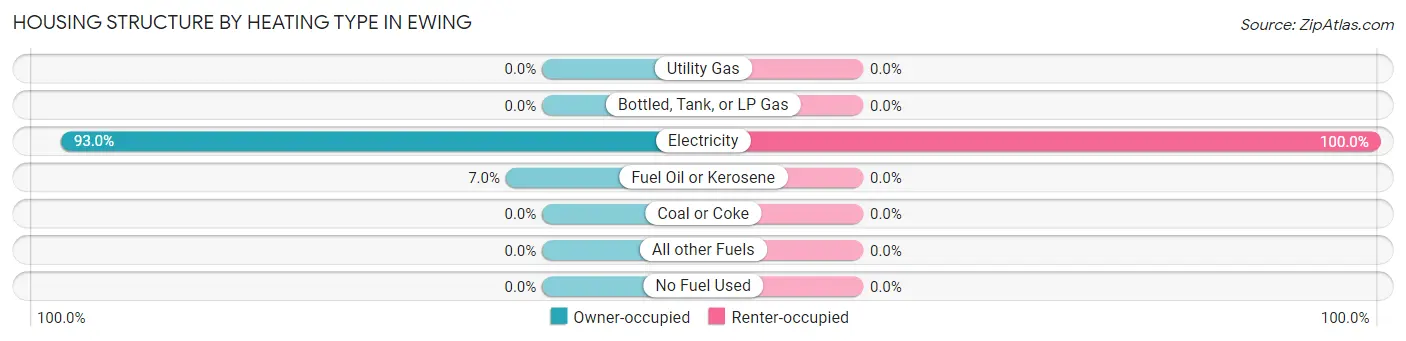
| Heating Type | Owner-occupied | Renter-occupied |
| Utility Gas | 0 (0.0%) | 0 (0.0%) |
| Bottled, Tank, or LP Gas | 0 (0.0%) | 0 (0.0%) |
| Electricity | 146 (93.0%) | 26 (100.0%) |
| Fuel Oil or Kerosene | 11 (7.0%) | 0 (0.0%) |
| Coal or Coke | 0 (0.0%) | 0 (0.0%) |
| All other Fuels | 0 (0.0%) | 0 (0.0%) |
| No Fuel Used | 0 (0.0%) | 0 (0.0%) |
| Total | 157 (100.0%) | 26 (100.0%) |
Household Vehicle Usage in Ewing
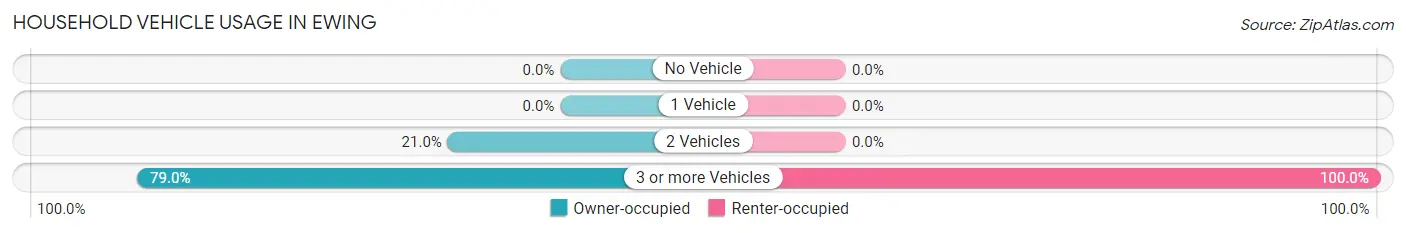
| Vehicles per Household | Owner-occupied | Renter-occupied |
| No Vehicle | 0 (0.0%) | 0 (0.0%) |
| 1 Vehicle | 0 (0.0%) | 0 (0.0%) |
| 2 Vehicles | 33 (21.0%) | 0 (0.0%) |
| 3 or more Vehicles | 124 (79.0%) | 26 (100.0%) |
| Total | 157 (100.0%) | 26 (100.0%) |
Real Estate & Mortgages in Ewing
Real Estate and Mortgage Overview in Ewing
| Characteristic | Without Mortgage | With Mortgage |
| Housing Units | 41 | 116 |
| Median Property Value | - | - |
| Median Household Income | - | - |
| Monthly Housing Costs | - | - |
| Real Estate Taxes | - | - |
Property Value by Mortgage Status in Ewing
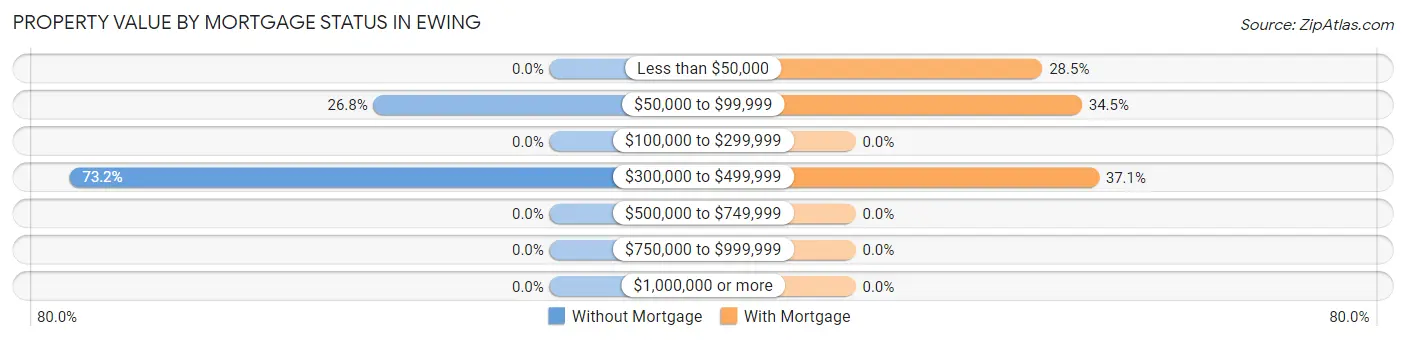
| Property Value | Without Mortgage | With Mortgage |
| Less than $50,000 | 0 (0.0%) | 33 (28.4%) |
| $50,000 to $99,999 | 11 (26.8%) | 40 (34.5%) |
| $100,000 to $299,999 | 0 (0.0%) | 0 (0.0%) |
| $300,000 to $499,999 | 30 (73.2%) | 43 (37.1%) |
| $500,000 to $749,999 | 0 (0.0%) | 0 (0.0%) |
| $750,000 to $999,999 | 0 (0.0%) | 0 (0.0%) |
| $1,000,000 or more | 0 (0.0%) | 0 (0.0%) |
| Total | 41 (100.0%) | 116 (100.0%) |
Household Income by Mortgage Status in Ewing
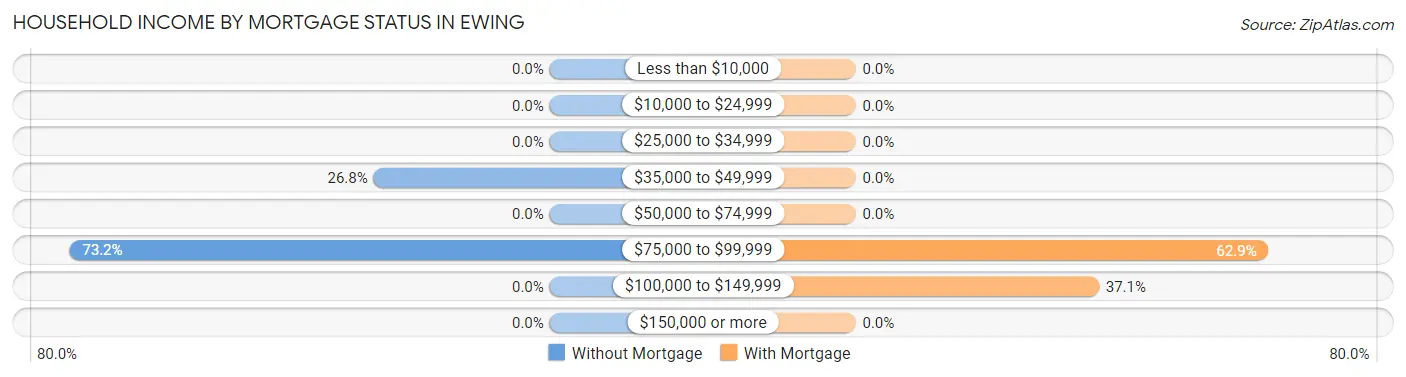
| Household Income | Without Mortgage | With Mortgage |
| Less than $10,000 | 0 (0.0%) | 0 (0.0%) |
| $10,000 to $24,999 | 0 (0.0%) | 0 (0.0%) |
| $25,000 to $34,999 | 0 (0.0%) | 0 (0.0%) |
| $35,000 to $49,999 | 11 (26.8%) | 0 (0.0%) |
| $50,000 to $74,999 | 0 (0.0%) | 0 (0.0%) |
| $75,000 to $99,999 | 30 (73.2%) | 73 (62.9%) |
| $100,000 to $149,999 | 0 (0.0%) | 43 (37.1%) |
| $150,000 or more | 0 (0.0%) | 0 (0.0%) |
| Total | 41 (100.0%) | 116 (100.0%) |
Property Value to Household Income Ratio in Ewing
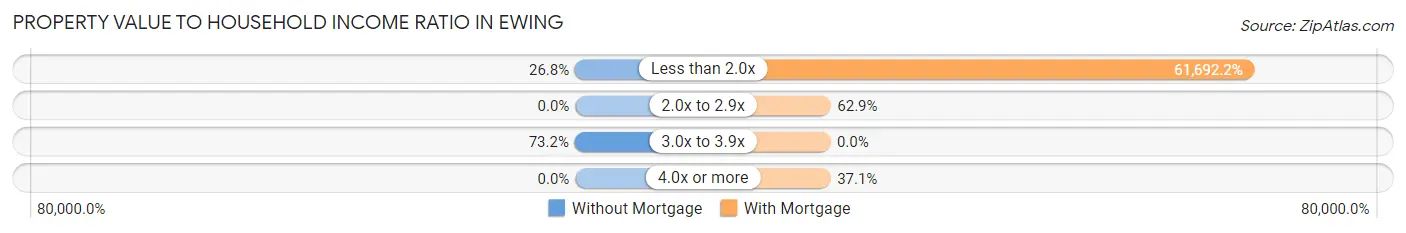
| Value-to-Income Ratio | Without Mortgage | With Mortgage |
| Less than 2.0x | 11 (26.8%) | 71,563 (61,692.2%) |
| 2.0x to 2.9x | 0 (0.0%) | 73 (62.9%) |
| 3.0x to 3.9x | 30 (73.2%) | 0 (0.0%) |
| 4.0x or more | 0 (0.0%) | 43 (37.1%) |
| Total | 41 (100.0%) | 116 (100.0%) |
Real Estate Taxes by Mortgage Status in Ewing
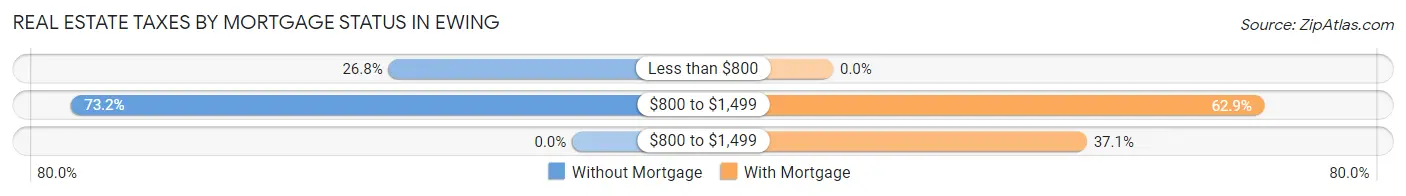
| Property Taxes | Without Mortgage | With Mortgage |
| Less than $800 | 11 (26.8%) | 0 (0.0%) |
| $800 to $1,499 | 30 (73.2%) | 73 (62.9%) |
| $800 to $1,499 | 0 (0.0%) | 43 (37.1%) |
| Total | 41 (100.0%) | 116 (100.0%) |
Health & Disability in Ewing
Health Insurance Coverage by Age in Ewing
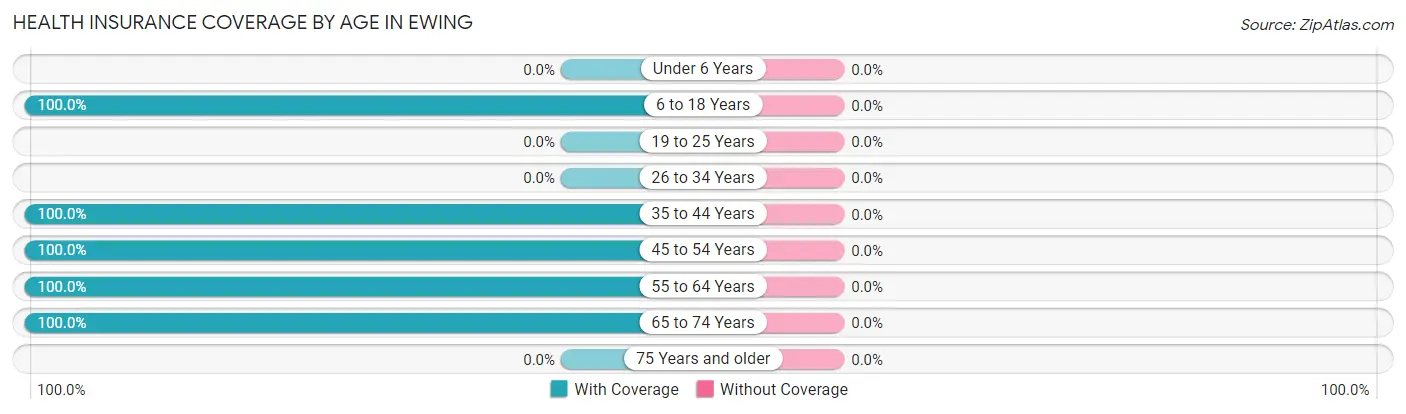
| Age Bracket | With Coverage | Without Coverage |
| Under 6 Years | 0 (0.0%) | 0 (0.0%) |
| 6 to 18 Years | 134 (100.0%) | 0 (0.0%) |
| 19 to 25 Years | 0 (0.0%) | 0 (0.0%) |
| 26 to 34 Years | 0 (0.0%) | 0 (0.0%) |
| 35 to 44 Years | 77 (100.0%) | 0 (0.0%) |
| 45 to 54 Years | 85 (100.0%) | 0 (0.0%) |
| 55 to 64 Years | 73 (100.0%) | 0 (0.0%) |
| 65 to 74 Years | 107 (100.0%) | 0 (0.0%) |
| 75 Years and older | 0 (0.0%) | 0 (0.0%) |
| Total | 476 (100.0%) | 0 (0.0%) |
Health Insurance Coverage by Citizenship Status in Ewing
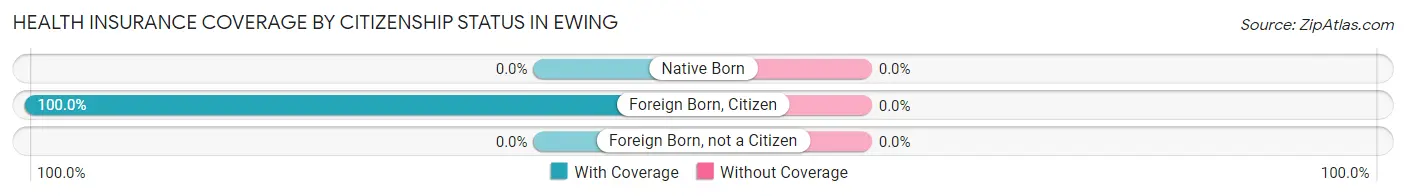
| Citizenship Status | With Coverage | Without Coverage |
| Native Born | 0 (0.0%) | 0 (0.0%) |
| Foreign Born, Citizen | 134 (100.0%) | 0 (0.0%) |
| Foreign Born, not a Citizen | 0 (0.0%) | 0 (0.0%) |
Health Insurance Coverage by Household Income in Ewing
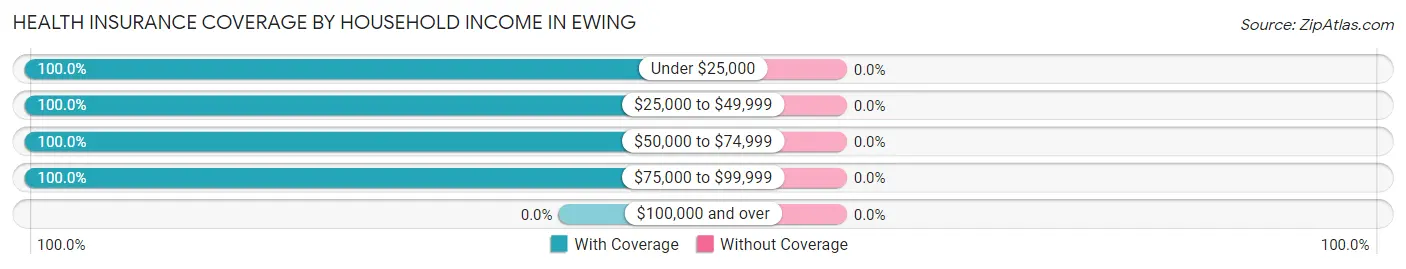
| Household Income | With Coverage | Without Coverage |
| Under $25,000 | 50 (100.0%) | 0 (0.0%) |
| $25,000 to $49,999 | 32 (100.0%) | 0 (0.0%) |
| $50,000 to $74,999 | 167 (100.0%) | 0 (0.0%) |
| $75,000 to $99,999 | 227 (100.0%) | 0 (0.0%) |
| $100,000 and over | 0 (0.0%) | 0 (0.0%) |
Public vs Private Health Insurance Coverage by Age in Ewing
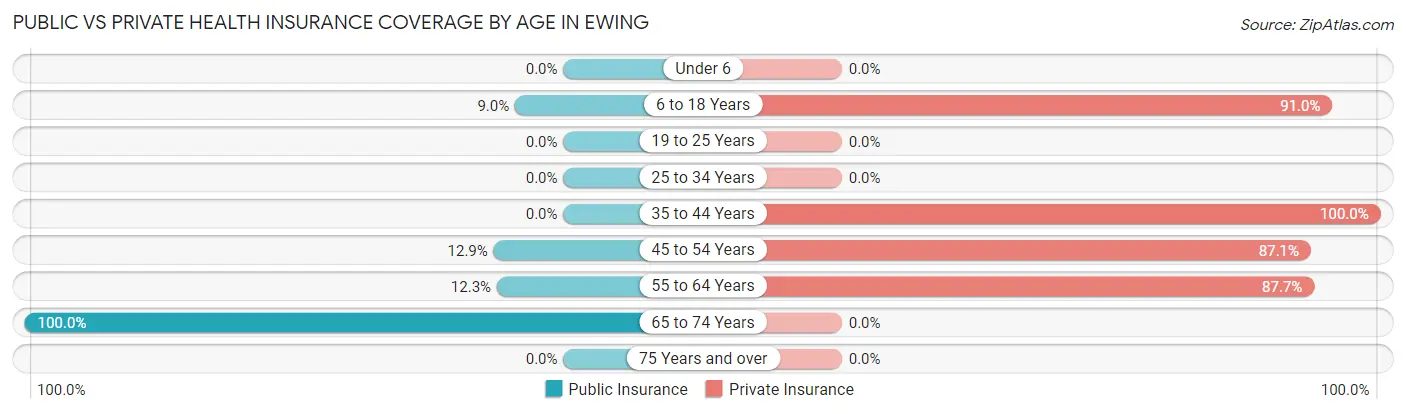
| Age Bracket | Public Insurance | Private Insurance |
| Under 6 | 0 (0.0%) | 0 (0.0%) |
| 6 to 18 Years | 12 (9.0%) | 122 (91.0%) |
| 19 to 25 Years | 0 (0.0%) | 0 (0.0%) |
| 25 to 34 Years | 0 (0.0%) | 0 (0.0%) |
| 35 to 44 Years | 0 (0.0%) | 77 (100.0%) |
| 45 to 54 Years | 11 (12.9%) | 74 (87.1%) |
| 55 to 64 Years | 9 (12.3%) | 64 (87.7%) |
| 65 to 74 Years | 107 (100.0%) | 0 (0.0%) |
| 75 Years and over | 0 (0.0%) | 0 (0.0%) |
| Total | 139 (29.2%) | 337 (70.8%) |
Disability Status by Sex by Age in Ewing
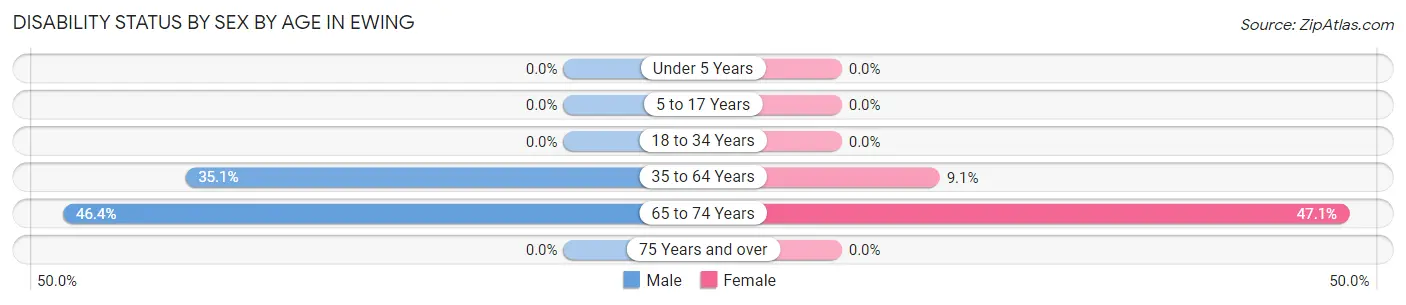
| Age Bracket | Male | Female |
| Under 5 Years | 0 (0.0%) | 0 (0.0%) |
| 5 to 17 Years | 0 (0.0%) | 0 (0.0%) |
| 18 to 34 Years | 0 (0.0%) | 0 (0.0%) |
| 35 to 64 Years | 40 (35.1%) | 11 (9.1%) |
| 65 to 74 Years | 26 (46.4%) | 24 (47.1%) |
| 75 Years and over | 0 (0.0%) | 0 (0.0%) |
Disability Class by Sex by Age in Ewing
Disability Class: Hearing Difficulty
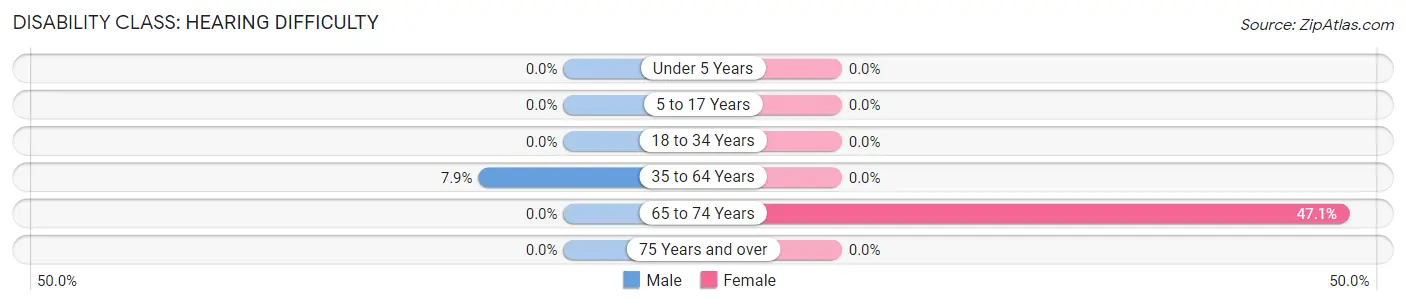
| Age Bracket | Male | Female |
| Under 5 Years | 0 (0.0%) | 0 (0.0%) |
| 5 to 17 Years | 0 (0.0%) | 0 (0.0%) |
| 18 to 34 Years | 0 (0.0%) | 0 (0.0%) |
| 35 to 64 Years | 9 (7.9%) | 0 (0.0%) |
| 65 to 74 Years | 0 (0.0%) | 24 (47.1%) |
| 75 Years and over | 0 (0.0%) | 0 (0.0%) |
Disability Class: Vision Difficulty
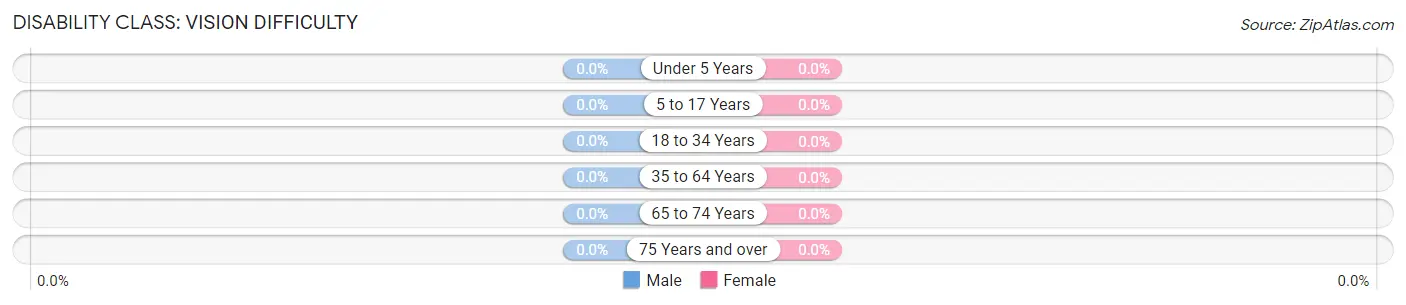
| Age Bracket | Male | Female |
| Under 5 Years | 0 (0.0%) | 0 (0.0%) |
| 5 to 17 Years | 0 (0.0%) | 0 (0.0%) |
| 18 to 34 Years | 0 (0.0%) | 0 (0.0%) |
| 35 to 64 Years | 0 (0.0%) | 0 (0.0%) |
| 65 to 74 Years | 0 (0.0%) | 0 (0.0%) |
| 75 Years and over | 0 (0.0%) | 0 (0.0%) |
Disability Class: Cognitive Difficulty
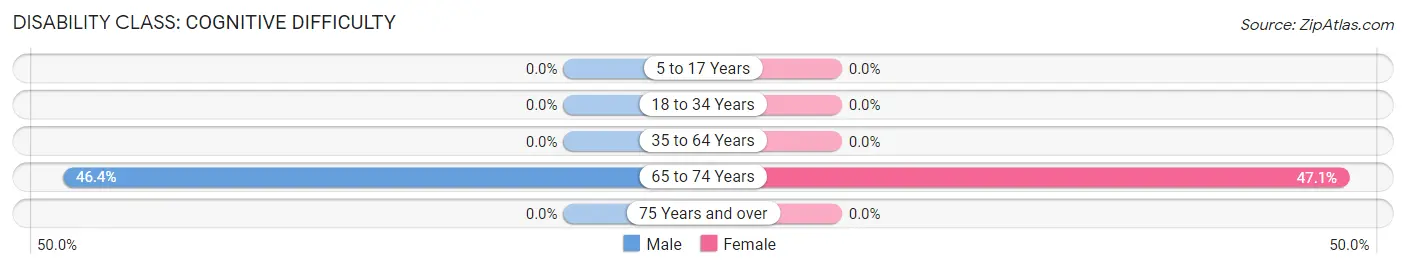
| Age Bracket | Male | Female |
| 5 to 17 Years | 0 (0.0%) | 0 (0.0%) |
| 18 to 34 Years | 0 (0.0%) | 0 (0.0%) |
| 35 to 64 Years | 0 (0.0%) | 0 (0.0%) |
| 65 to 74 Years | 26 (46.4%) | 24 (47.1%) |
| 75 Years and over | 0 (0.0%) | 0 (0.0%) |
Disability Class: Ambulatory Difficulty
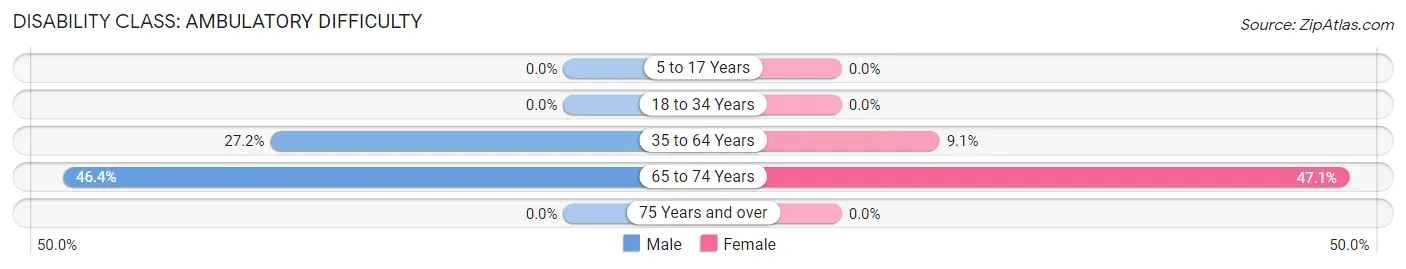
| Age Bracket | Male | Female |
| 5 to 17 Years | 0 (0.0%) | 0 (0.0%) |
| 18 to 34 Years | 0 (0.0%) | 0 (0.0%) |
| 35 to 64 Years | 31 (27.2%) | 11 (9.1%) |
| 65 to 74 Years | 26 (46.4%) | 24 (47.1%) |
| 75 Years and over | 0 (0.0%) | 0 (0.0%) |
Disability Class: Self-Care Difficulty
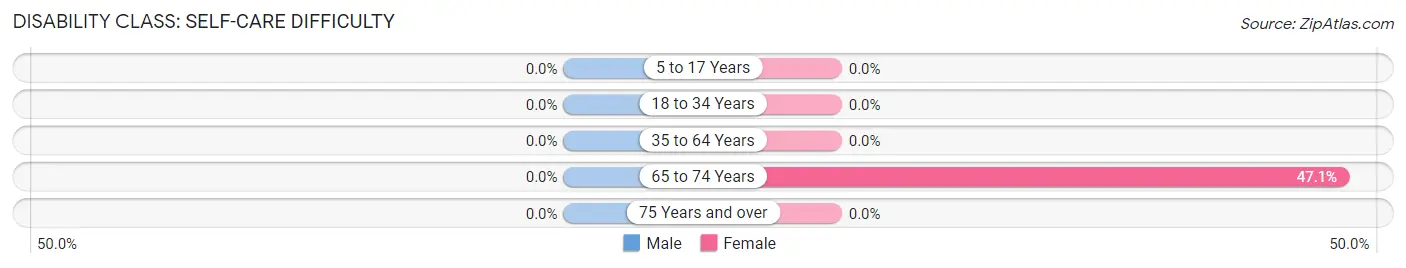
| Age Bracket | Male | Female |
| 5 to 17 Years | 0 (0.0%) | 0 (0.0%) |
| 18 to 34 Years | 0 (0.0%) | 0 (0.0%) |
| 35 to 64 Years | 0 (0.0%) | 0 (0.0%) |
| 65 to 74 Years | 0 (0.0%) | 24 (47.1%) |
| 75 Years and over | 0 (0.0%) | 0 (0.0%) |
Technology Access in Ewing
Computing Device Access in Ewing
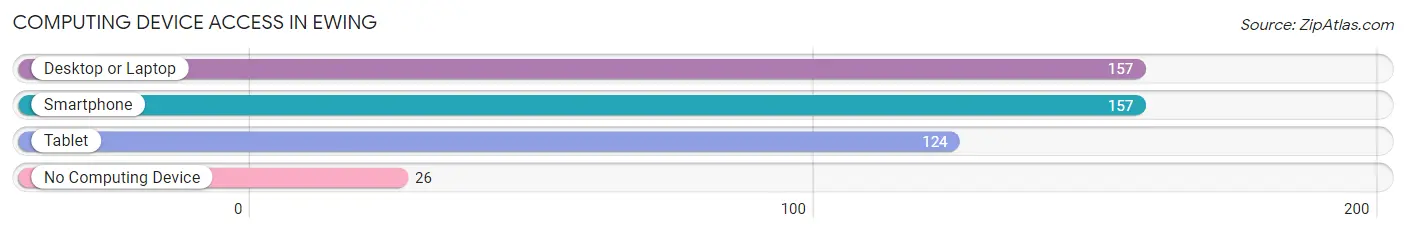
| Device Type | # Households | % Households |
| Desktop or Laptop | 157 | 85.8% |
| Smartphone | 157 | 85.8% |
| Tablet | 124 | 67.8% |
| No Computing Device | 26 | 14.2% |
| Total | 183 | 100.0% |
Internet Access in Ewing
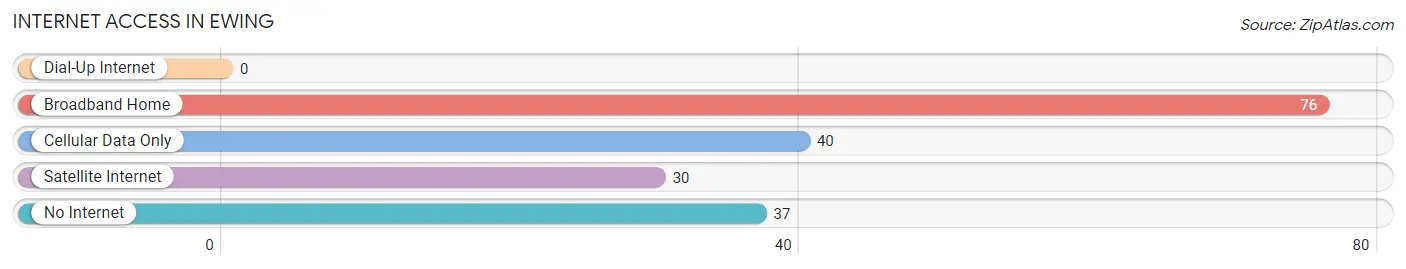
| Internet Type | # Households | % Households |
| Dial-Up Internet | 0 | 0.0% |
| Broadband Home | 76 | 41.5% |
| Cellular Data Only | 40 | 21.9% |
| Satellite Internet | 30 | 16.4% |
| No Internet | 37 | 20.2% |
| Total | 183 | 100.0% |
Ewing Summary
Ewing is a small town located in Lee County, Virginia, United States. It is situated in the Appalachian Mountains, and is part of the Appalachian Regional Commission. The town has a population of approximately 1,000 people, and is located in the foothills of the Blue Ridge Mountains.
History
Ewing was first settled in the late 1700s by a group of settlers from North Carolina. The town was named after the Ewing family, who were among the first settlers. The town was officially incorporated in 1883.
In the late 1800s, Ewing was a thriving community, with a variety of businesses, including a sawmill, a gristmill, a blacksmith shop, and a general store. The town also had a post office, a school, and a church.
In the early 1900s, the town began to decline, as the railroad bypassed Ewing and the local economy shifted away from agriculture. The town was nearly abandoned by the 1950s, but was revitalized in the 1970s when the Appalachian Regional Commission began to invest in the area.
Geography
Ewing is located in the Appalachian Mountains, in the foothills of the Blue Ridge Mountains. The town is situated in a valley, surrounded by mountains on all sides. The town is located at an elevation of 1,400 feet (427 meters).
The climate in Ewing is temperate, with hot summers and cold winters. The average annual temperature is around 55°F (13°C). The average annual precipitation is around 40 inches (102 cm).
Economy
The economy of Ewing is largely based on agriculture and tourism. The town is home to several farms, which produce a variety of crops, including corn, soybeans, and hay. The town also has a number of small businesses, including restaurants, shops, and a bed and breakfast.
Tourism is an important part of the local economy. The town is home to several attractions, including the Ewing Historical Museum, the Ewing Nature Center, and the Ewing Arts Center. The town also hosts a number of festivals and events throughout the year, including the Ewing Fall Festival and the Ewing Bluegrass Festival.
Demographics
As of the 2010 census, the population of Ewing was 1,000. The racial makeup of the town was 97.2% White, 0.7% African American, 0.3% Native American, 0.2% Asian, 0.1% Pacific Islander, and 1.5% from other races. The median household income was $30,000, and the median family income was $35,000.
Conclusion
Ewing is a small town located in Lee County, Virginia, United States. It is situated in the Appalachian Mountains, and is part of the Appalachian Regional Commission. The town has a population of approximately 1,000 people, and is located in the foothills of the Blue Ridge Mountains. The economy of Ewing is largely based on agriculture and tourism, and the town is home to several attractions, including the Ewing Historical Museum, the Ewing Nature Center, and the Ewing Arts Center. As of the 2010 census, the population of Ewing was 1,000, and the median household income was $30,000.
Common Questions
What is Per Capita Income in Ewing?
Per Capita income in Ewing is $23,933.
What is the Median Family Income in Ewing?
Median Family Income in Ewing is $71,344.
What is the Median Household income in Ewing?
Median Household Income in Ewing is $71,344.
What is Income or Wage Gap in Ewing?
Income or Wage Gap in Ewing is 22.7%.
Women in Ewing earn 77.3 cents for every dollar earned by a man.
What is Inequality or Gini Index in Ewing?
Inequality or Gini Index in Ewing is 0.19.
What is the Total Population of Ewing?
Total Population of Ewing is 476.
What is the Total Male Population of Ewing?
Total Male Population of Ewing is 230.
What is the Total Female Population of Ewing?
Total Female Population of Ewing is 246.
What is the Ratio of Males per 100 Females in Ewing?
There are 93.50 Males per 100 Females in Ewing.
What is the Ratio of Females per 100 Males in Ewing?
There are 106.96 Females per 100 Males in Ewing.
What is the Median Population Age in Ewing?
Median Population Age in Ewing is 51.4 Years.
What is the Average Family Size in Ewing
Average Family Size in Ewing is 2.5 People.
What is the Average Household Size in Ewing
Average Household Size in Ewing is 2.6 People.
How Large is the Labor Force in Ewing?
There are 235 People in the Labor Forcein in Ewing.
What is the Percentage of People in the Labor Force in Ewing?
56.8% of People are in the Labor Force in Ewing.