Glen Acres, NM Map & Demographics
Glen Acres Map
Glen Acres Overview
$28,445
PER CAPITA INCOME
$96,250
AVG HOUSEHOLD INCOME
70.3%
WAGE / INCOME GAP [ % ]
29.7¢/ $1
WAGE / INCOME GAP [ $ ]
0.22
INEQUALITY / GINI INDEX
306
TOTAL POPULATION
122
MALE POPULATION
184
FEMALE POPULATION
66.30
MALES / 100 FEMALES
150.82
FEMALES / 100 MALES
40.9
MEDIAN AGE
4.1
AVG FAMILY SIZE
4.0
AVG HOUSEHOLD SIZE
155
LABOR FORCE [ PEOPLE ]
59.6%
PERCENT IN LABOR FORCE
8.4%
UNEMPLOYMENT RATE
Income in Glen Acres
Income Overview in Glen Acres
| Characteristic | Number | Measure |
| Per Capita Income | 306 | $28,445 |
| Median Family Income | 48 | $0 |
| Mean Family Income | 48 | $72,402 |
| Median Household Income | 77 | $96,250 |
| Mean Household Income | 77 | $90,406 |
| Income Deficit | 48 | $0 |
| Wage / Income Gap (%) | 306 | 70.33% |
| Wage / Income Gap ($) | 306 | 29.67¢ per $1 |
| Gini / Inequality Index | 306 | 0.22 |
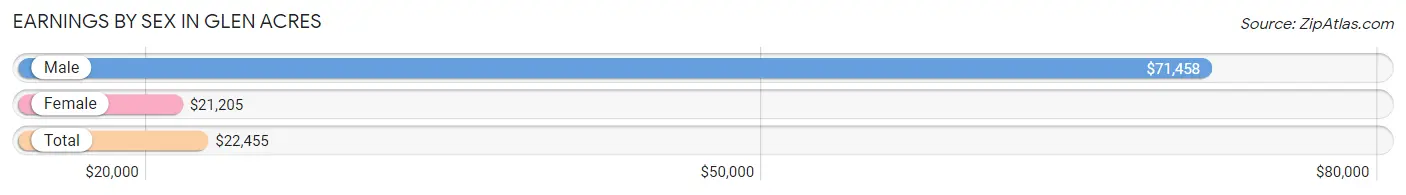
Earnings by Sex in Glen Acres
Average Earnings in Glen Acres are $22,455, $71,458 for men and $21,205 for women, a difference of 70.3%.
| Sex | Number | Average Earnings |
| Male | 54 (34.8%) | $71,458 |
| Female | 101 (65.2%) | $21,205 |
| Total | 155 (100.0%) | $22,455 |
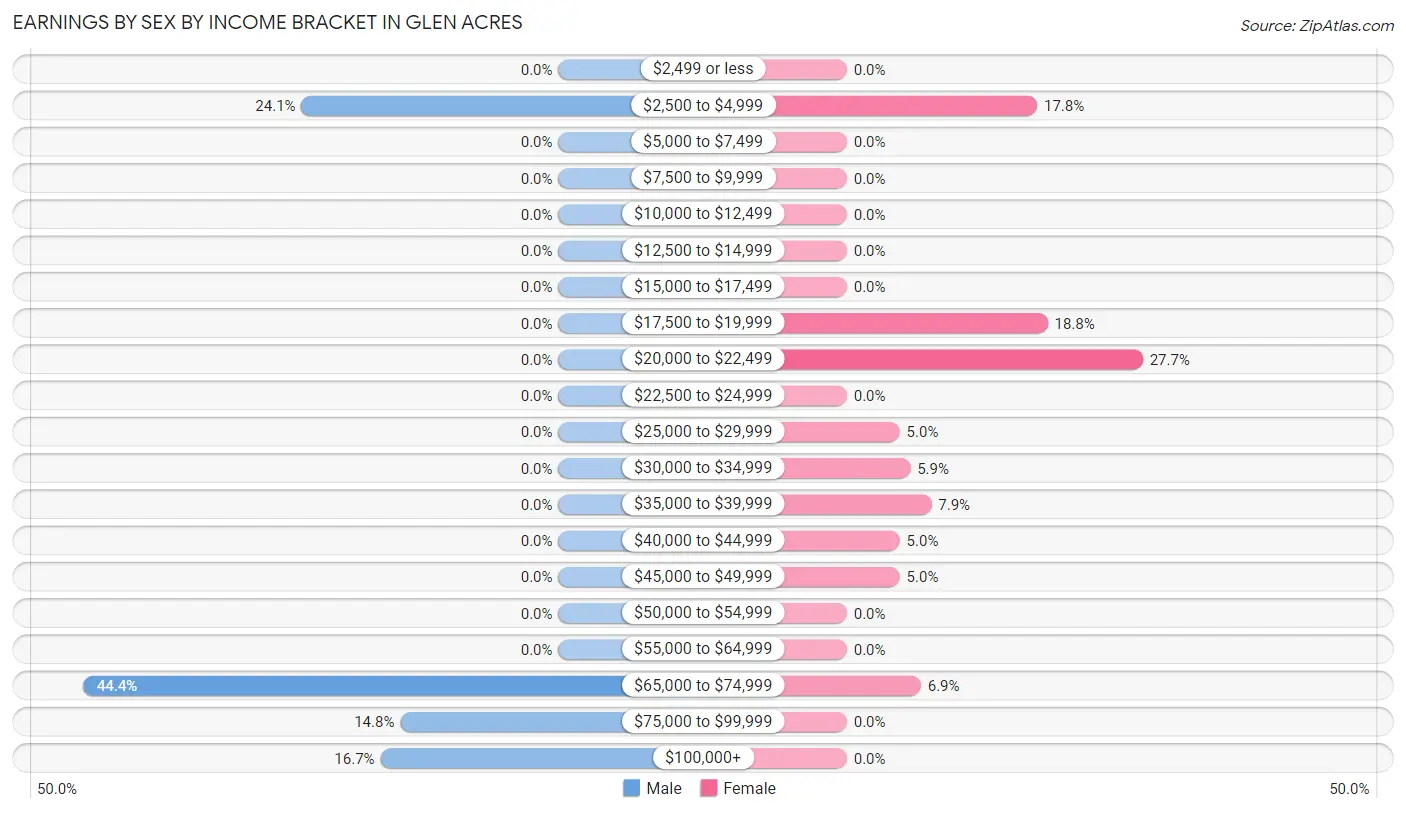
Earnings by Sex by Income Bracket in Glen Acres
The most common earnings brackets in Glen Acres are $65,000 to $74,999 for men (24 | 44.4%) and $20,000 to $22,499 for women (28 | 27.7%).
| Income | Male | Female |
| $2,499 or less | 0 (0.0%) | 0 (0.0%) |
| $2,500 to $4,999 | 13 (24.1%) | 18 (17.8%) |
| $5,000 to $7,499 | 0 (0.0%) | 0 (0.0%) |
| $7,500 to $9,999 | 0 (0.0%) | 0 (0.0%) |
| $10,000 to $12,499 | 0 (0.0%) | 0 (0.0%) |
| $12,500 to $14,999 | 0 (0.0%) | 0 (0.0%) |
| $15,000 to $17,499 | 0 (0.0%) | 0 (0.0%) |
| $17,500 to $19,999 | 0 (0.0%) | 19 (18.8%) |
| $20,000 to $22,499 | 0 (0.0%) | 28 (27.7%) |
| $22,500 to $24,999 | 0 (0.0%) | 0 (0.0%) |
| $25,000 to $29,999 | 0 (0.0%) | 5 (5.0%) |
| $30,000 to $34,999 | 0 (0.0%) | 6 (5.9%) |
| $35,000 to $39,999 | 0 (0.0%) | 8 (7.9%) |
| $40,000 to $44,999 | 0 (0.0%) | 5 (5.0%) |
| $45,000 to $49,999 | 0 (0.0%) | 5 (5.0%) |
| $50,000 to $54,999 | 0 (0.0%) | 0 (0.0%) |
| $55,000 to $64,999 | 0 (0.0%) | 0 (0.0%) |
| $65,000 to $74,999 | 24 (44.4%) | 7 (6.9%) |
| $75,000 to $99,999 | 8 (14.8%) | 0 (0.0%) |
| $100,000+ | 9 (16.7%) | 0 (0.0%) |
| Total | 54 (100.0%) | 101 (100.0%) |
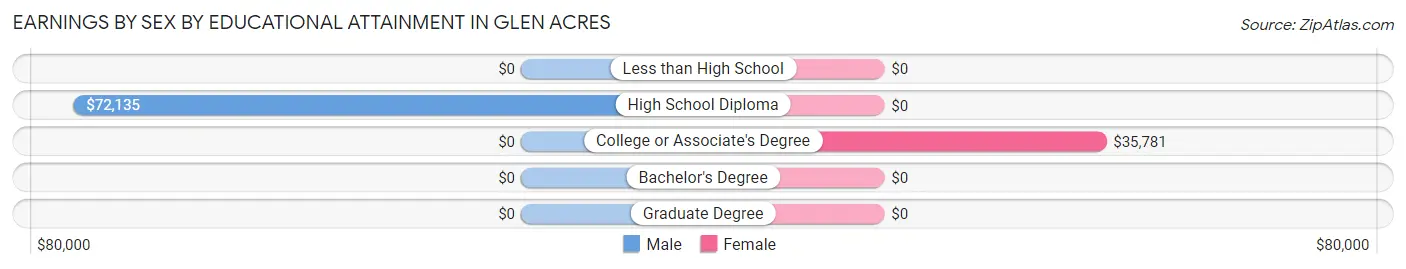
Earnings by Sex by Educational Attainment in Glen Acres
Average earnings in Glen Acres are $72,135 for men and $32,292 for women, a difference of 55.2%. Men with an educational attainment of high school diploma enjoy the highest average annual earnings of $72,135, while those with high school diploma education earn the least with $72,135. Women with an educational attainment of college or associate's degree earn the most with the average annual earnings of $35,781, while those with college or associate's degree education have the smallest earnings of $35,781.
| Educational Attainment | Male Income | Female Income |
| Less than High School | - | - |
| High School Diploma | $72,135 | $0 |
| College or Associate's Degree | - | - |
| Bachelor's Degree | - | - |
| Graduate Degree | - | - |
| Total | $72,135 | $32,292 |
Family Income in Glen Acres
Family Income Brackets in Glen Acres
According to the Glen Acres family income data, there are 15 families falling into the $15,000 to $24,999 income range, which is the most common income bracket and makes up 31.2% of all families.
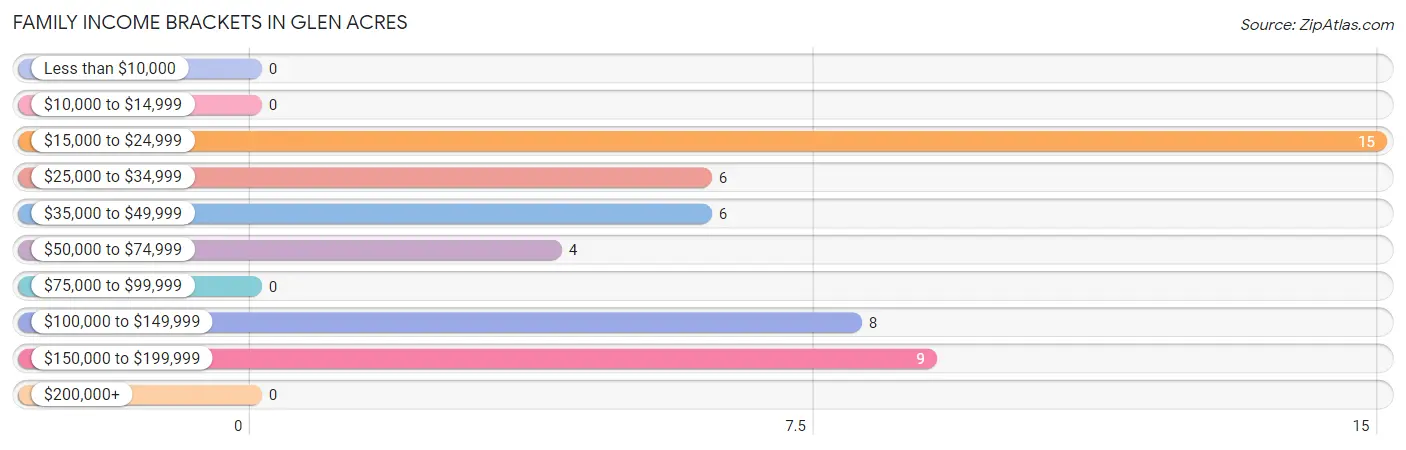
| Income Bracket | # Families | % Families |
| Less than $10,000 | 0 | 0.0% |
| $10,000 to $14,999 | 0 | 0.0% |
| $15,000 to $24,999 | 15 | 31.3% |
| $25,000 to $34,999 | 6 | 12.5% |
| $35,000 to $49,999 | 6 | 12.5% |
| $50,000 to $74,999 | 4 | 8.3% |
| $75,000 to $99,999 | 0 | 0.0% |
| $100,000 to $149,999 | 8 | 16.7% |
| $150,000 to $199,999 | 9 | 18.8% |
| $200,000+ | 0 | 0.0% |
Family Income by Famaliy Size in Glen Acres
| Income Bracket | # Families | Median Income |
| 2-Person Families | 15 (31.2%) | $0 |
| 3-Person Families | 3 (6.2%) | $0 |
| 4-Person Families | 24 (50.0%) | $0 |
| 5-Person Families | 0 (0.0%) | $0 |
| 6-Person Families | 6 (12.5%) | $0 |
| 7+ Person Families | 0 (0.0%) | $0 |
| Total | 48 (100.0%) | $0 |
Family Income by Number of Earners in Glen Acres
| Number of Earners | # Families | Median Income |
| No Earners | 6 (12.5%) | $0 |
| 1 Earner | 13 (27.1%) | $0 |
| 2 Earners | 29 (60.4%) | $0 |
| 3+ Earners | 0 (0.0%) | $0 |
| Total | 48 (100.0%) | $0 |
Household Income in Glen Acres
Household Income Brackets in Glen Acres
With 22 households falling in the category, the $75,000 to $99,999 income range is the most frequent in Glen Acres, accounting for 28.6% of all households.
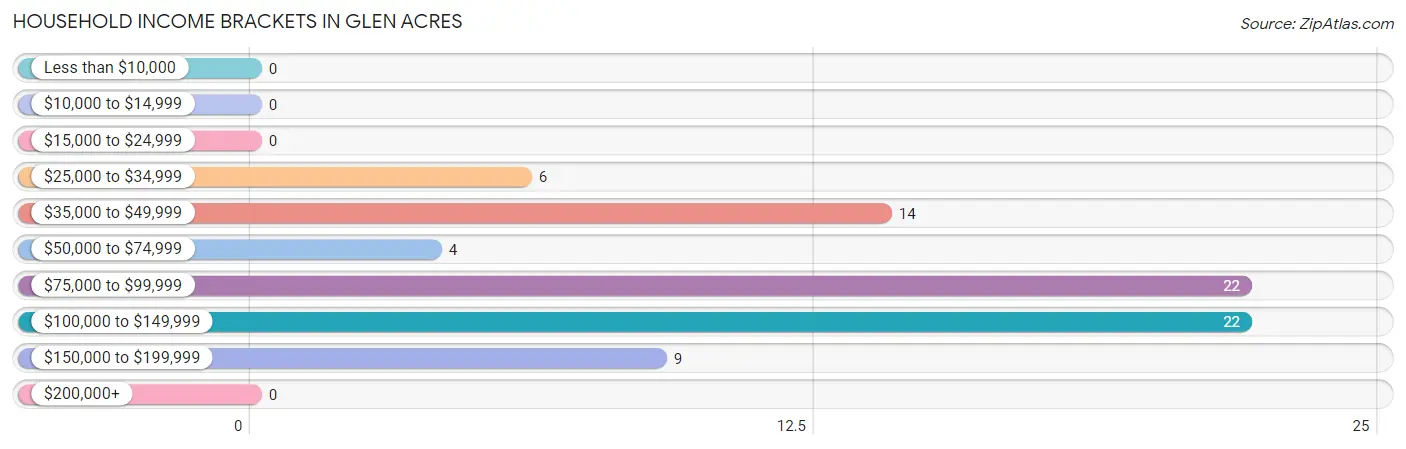
| Income Bracket | # Households | % Households |
| Less than $10,000 | 0 | 0.0% |
| $10,000 to $14,999 | 0 | 0.0% |
| $15,000 to $24,999 | 0 | 0.0% |
| $25,000 to $34,999 | 6 | 7.8% |
| $35,000 to $49,999 | 14 | 18.2% |
| $50,000 to $74,999 | 4 | 5.2% |
| $75,000 to $99,999 | 22 | 28.6% |
| $100,000 to $149,999 | 22 | 28.6% |
| $150,000 to $199,999 | 9 | 11.7% |
| $200,000+ | 0 | 0.0% |
Household Income by Householder Age in Glen Acres
The median household income in Glen Acres is $96,250, with the highest median household income of $100,625 found in the 65+ years age bracket for the primary householder. A total of 27 households (35.1%) fall into this category.
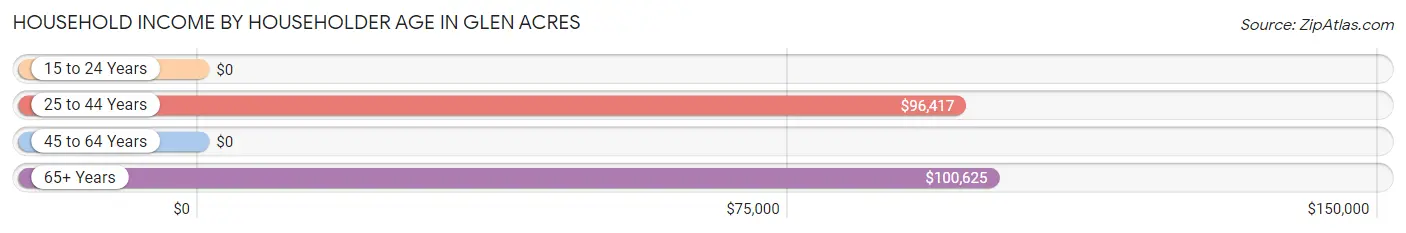
| Income Bracket | # Households | Median Income |
| 15 to 24 Years | 0 (0.0%) | $0 |
| 25 to 44 Years | 31 (40.3%) | $96,417 |
| 45 to 64 Years | 19 (24.7%) | $0 |
| 65+ Years | 27 (35.1%) | $100,625 |
| Total | 77 (100.0%) | $96,250 |
Poverty in Glen Acres
Income Below Poverty by Sex and Age in Glen Acres
With 32.8% poverty level for males and 29.3% for females among the residents of Glen Acres, 12 to 14 year old males and 6 to 11 year old females are the most vulnerable to poverty, with 11 males (100.0%) and 14 females (100.0%) in their respective age groups living below the poverty level.
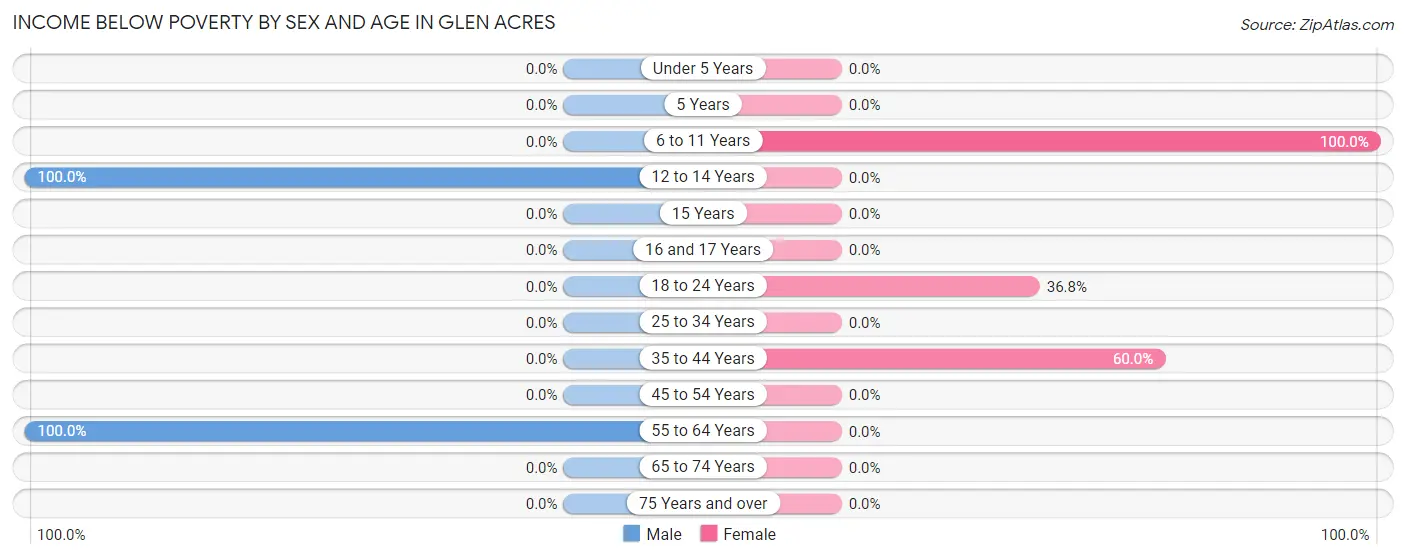
| Age Bracket | Male | Female |
| Under 5 Years | 0 (0.0%) | 0 (0.0%) |
| 5 Years | 0 (0.0%) | 0 (0.0%) |
| 6 to 11 Years | 0 (0.0%) | 14 (100.0%) |
| 12 to 14 Years | 11 (100.0%) | 0 (0.0%) |
| 15 Years | 0 (0.0%) | 0 (0.0%) |
| 16 and 17 Years | 0 (0.0%) | 0 (0.0%) |
| 18 to 24 Years | 0 (0.0%) | 25 (36.8%) |
| 25 to 34 Years | 0 (0.0%) | 0 (0.0%) |
| 35 to 44 Years | 0 (0.0%) | 15 (60.0%) |
| 45 to 54 Years | 0 (0.0%) | 0 (0.0%) |
| 55 to 64 Years | 29 (100.0%) | 0 (0.0%) |
| 65 to 74 Years | 0 (0.0%) | 0 (0.0%) |
| 75 Years and over | 0 (0.0%) | 0 (0.0%) |
| Total | 40 (32.8%) | 54 (29.3%) |
Income Above Poverty by Sex and Age in Glen Acres
According to the poverty statistics in Glen Acres, males aged under 5 years and females aged under 5 years are the age groups that are most secure financially, with 100.0% of males and 100.0% of females in these age groups living above the poverty line.
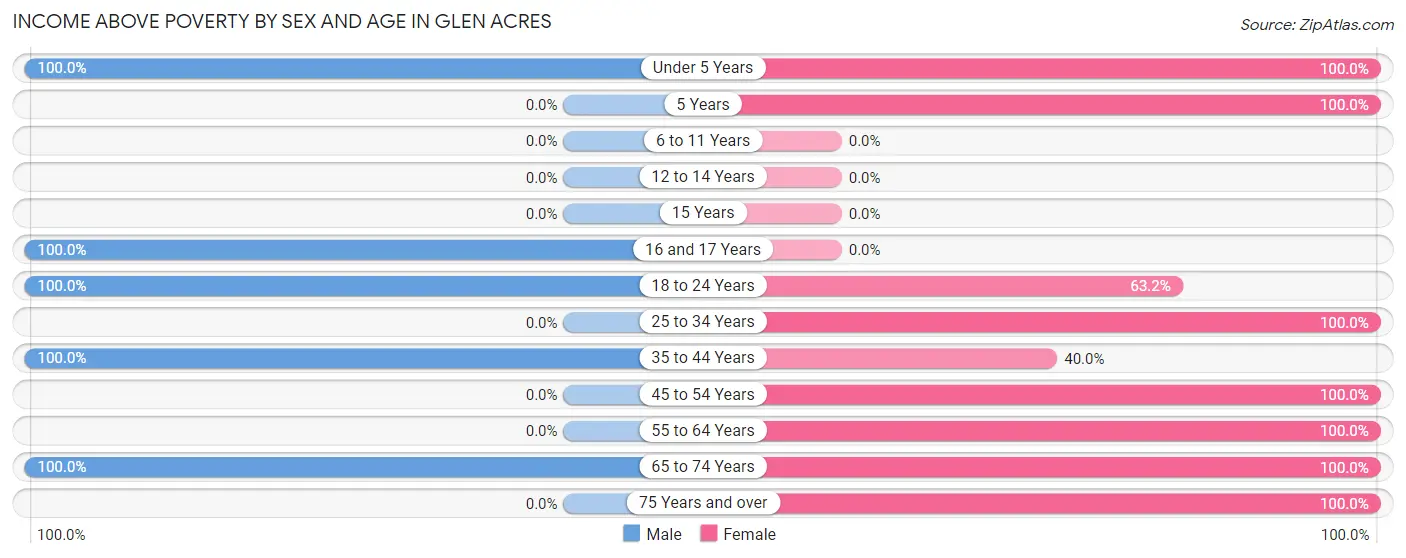
| Age Bracket | Male | Female |
| Under 5 Years | 9 (100.0%) | 3 (100.0%) |
| 5 Years | 0 (0.0%) | 9 (100.0%) |
| 6 to 11 Years | 0 (0.0%) | 0 (0.0%) |
| 12 to 14 Years | 0 (0.0%) | 0 (0.0%) |
| 15 Years | 0 (0.0%) | 0 (0.0%) |
| 16 and 17 Years | 6 (100.0%) | 0 (0.0%) |
| 18 to 24 Years | 13 (100.0%) | 43 (63.2%) |
| 25 to 34 Years | 0 (0.0%) | 7 (100.0%) |
| 35 to 44 Years | 41 (100.0%) | 10 (40.0%) |
| 45 to 54 Years | 0 (0.0%) | 13 (100.0%) |
| 55 to 64 Years | 0 (0.0%) | 16 (100.0%) |
| 65 to 74 Years | 13 (100.0%) | 20 (100.0%) |
| 75 Years and over | 0 (0.0%) | 9 (100.0%) |
| Total | 82 (67.2%) | 130 (70.7%) |
Income Below Poverty Among Married-Couple Families in Glen Acres
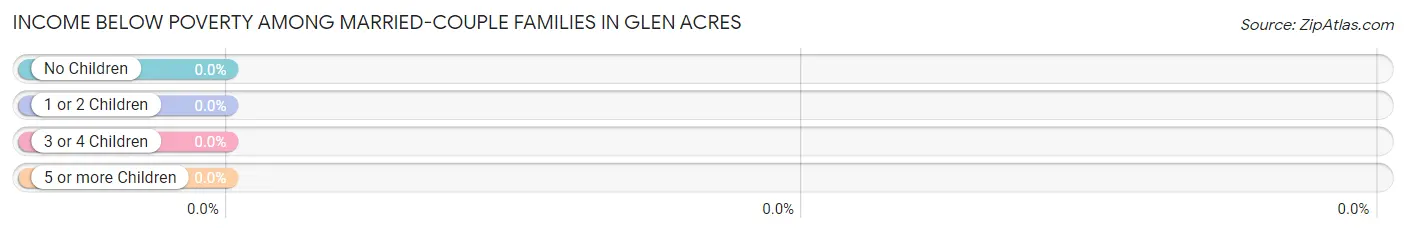
| Children | Above Poverty | Below Poverty |
| No Children | 18 (100.0%) | 0 (0.0%) |
| 1 or 2 Children | 9 (100.0%) | 0 (0.0%) |
| 3 or 4 Children | 0 (0.0%) | 0 (0.0%) |
| 5 or more Children | 0 (0.0%) | 0 (0.0%) |
| Total | 27 (100.0%) | 0 (0.0%) |
Income Below Poverty Among Single-Parent Households in Glen Acres
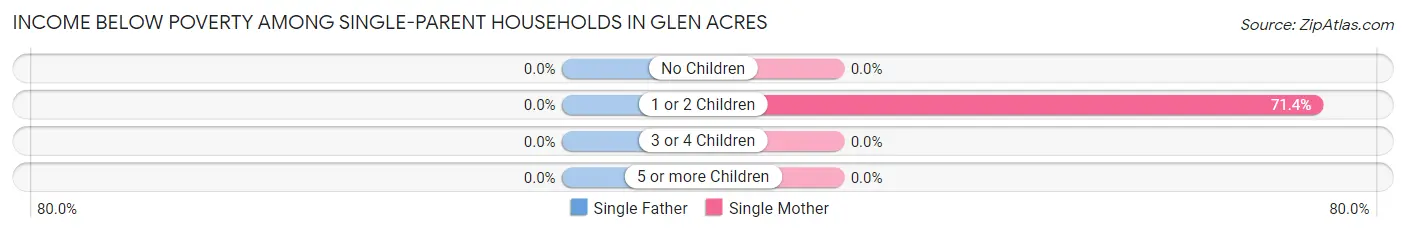
| Children | Single Father | Single Mother |
| No Children | 0 (0.0%) | 0 (0.0%) |
| 1 or 2 Children | 0 (0.0%) | 15 (71.4%) |
| 3 or 4 Children | 0 (0.0%) | 0 (0.0%) |
| 5 or more Children | 0 (0.0%) | 0 (0.0%) |
| Total | 0 (0.0%) | 15 (71.4%) |
Income Below Poverty Among Married-Couple vs Single-Parent Households in Glen Acres
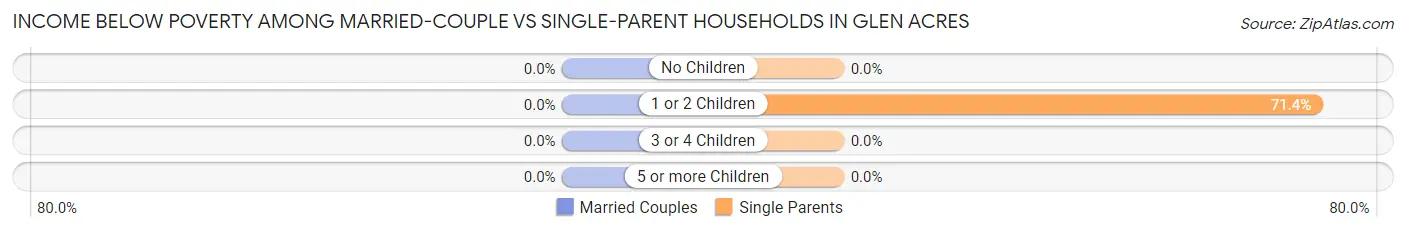
| Children | Married-Couple Families | Single-Parent Households |
| No Children | 0 (0.0%) | 0 (0.0%) |
| 1 or 2 Children | 0 (0.0%) | 15 (71.4%) |
| 3 or 4 Children | 0 (0.0%) | 0 (0.0%) |
| 5 or more Children | 0 (0.0%) | 0 (0.0%) |
| Total | 0 (0.0%) | 15 (71.4%) |
Race in Glen Acres
The most populous races in Glen Acres are Hispanic or Latino (264 | 86.3%), White / Caucasian (206 | 67.3%), and Two or more Races (86 | 28.1%).
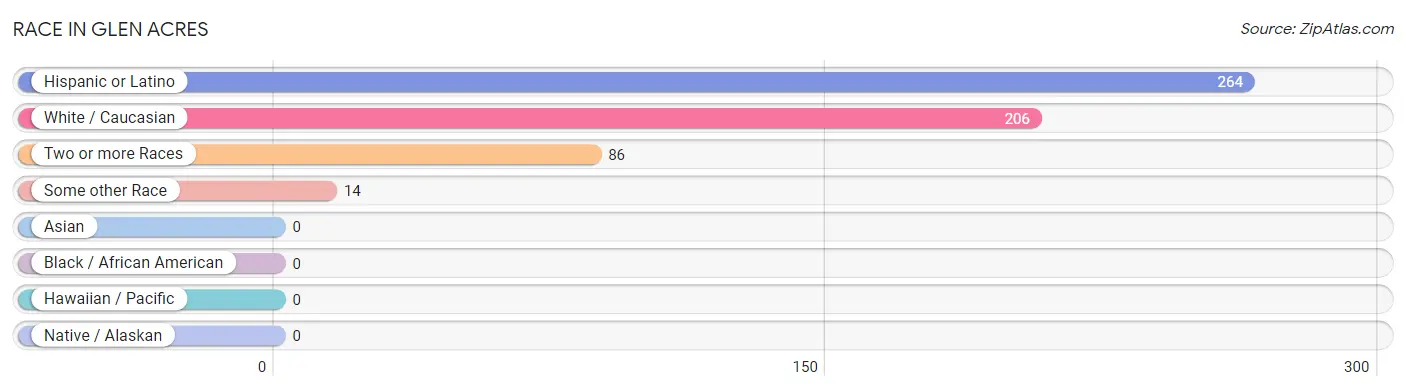
| Race | # Population | % Population |
| Asian | 0 | 0.0% |
| Black / African American | 0 | 0.0% |
| Hawaiian / Pacific | 0 | 0.0% |
| Hispanic or Latino | 264 | 86.3% |
| Native / Alaskan | 0 | 0.0% |
| White / Caucasian | 206 | 67.3% |
| Two or more Races | 86 | 28.1% |
| Some other Race | 14 | 4.6% |
| Total | 306 | 100.0% |
Ancestry in Glen Acres
The most populous ancestries reported in Glen Acres are Mexican (264 | 86.3%), Austrian (14 | 4.6%), French (14 | 4.6%), German (11 | 3.6%), and English (6 | 2.0%), together accounting for 101.0% of all Glen Acres residents.
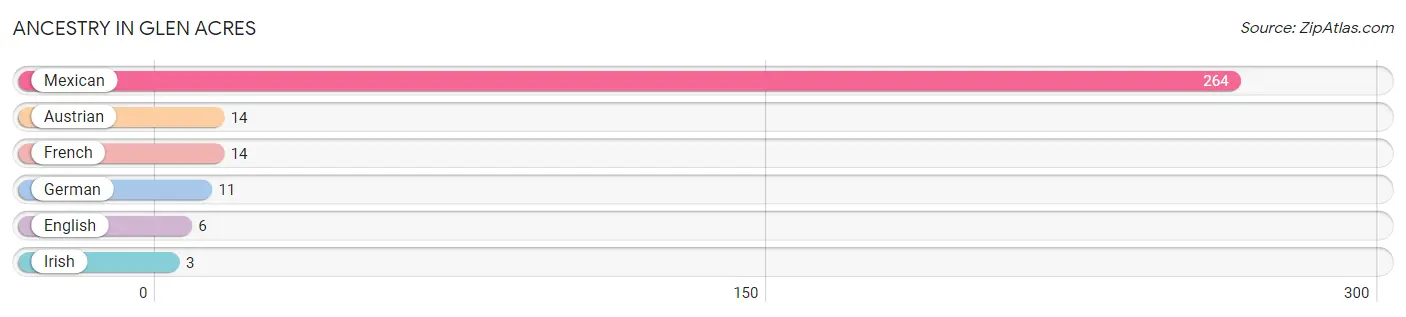
| Ancestry | # Population | % Population |
| Austrian | 14 | 4.6% |
| English | 6 | 2.0% |
| French | 14 | 4.6% |
| German | 11 | 3.6% |
| Irish | 3 | 1.0% |
| Mexican | 264 | 86.3% | View All 6 Rows |
Immigrants in Glen Acres
The most numerous immigrant groups reported in Glen Acres came from Central America (10 | 3.3%), Latin America (10 | 3.3%), and Mexico (10 | 3.3%), together accounting for 9.8% of all Glen Acres residents.
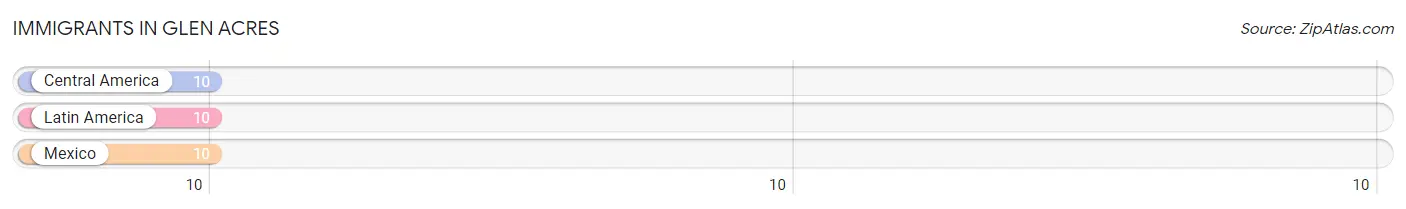
| Immigration Origin | # Population | % Population |
| Central America | 10 | 3.3% |
| Latin America | 10 | 3.3% |
| Mexico | 10 | 3.3% | View All 3 Rows |
Sex and Age in Glen Acres
Sex and Age in Glen Acres
The most populous age groups in Glen Acres are 40 to 44 Years (41 | 33.6%) for men and 20 to 24 Years (50 | 27.2%) for women.
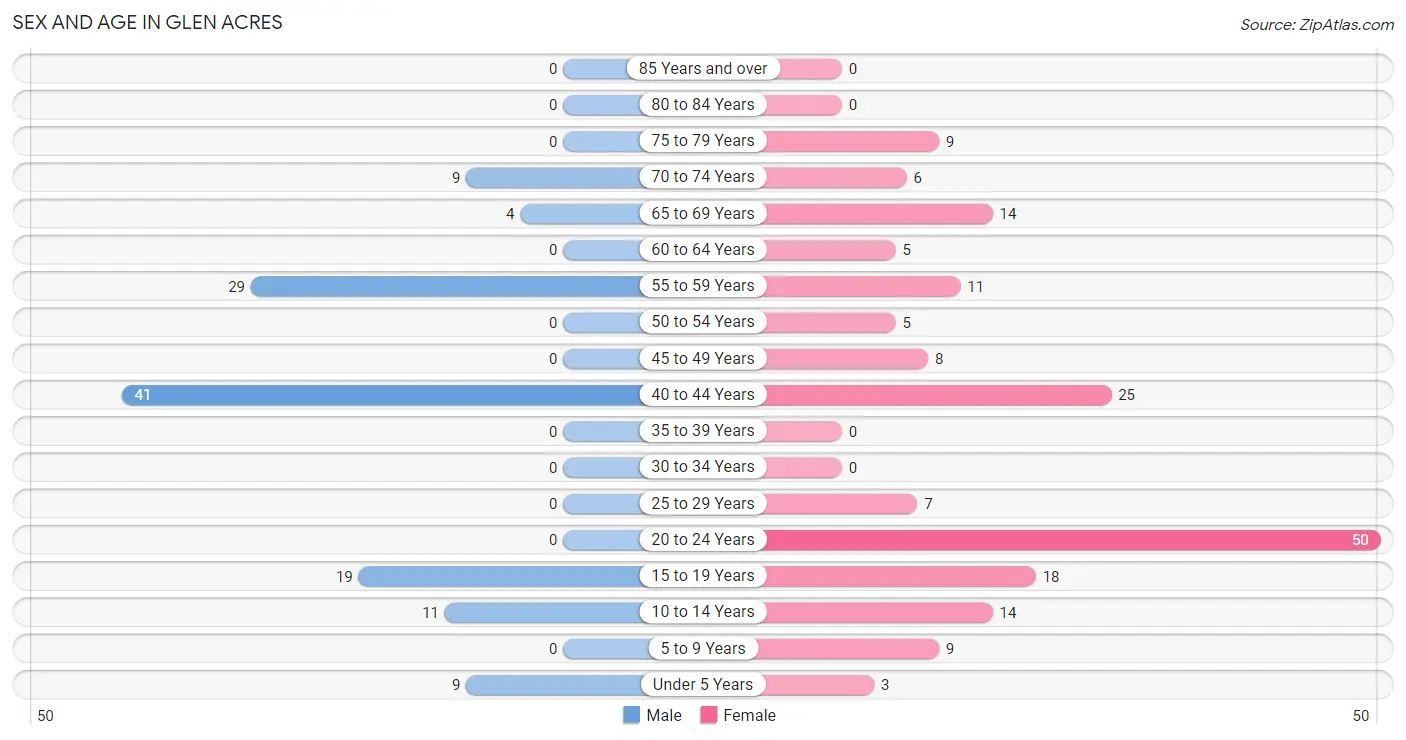
| Age Bracket | Male | Female |
| Under 5 Years | 9 (7.4%) | 3 (1.6%) |
| 5 to 9 Years | 0 (0.0%) | 9 (4.9%) |
| 10 to 14 Years | 11 (9.0%) | 14 (7.6%) |
| 15 to 19 Years | 19 (15.6%) | 18 (9.8%) |
| 20 to 24 Years | 0 (0.0%) | 50 (27.2%) |
| 25 to 29 Years | 0 (0.0%) | 7 (3.8%) |
| 30 to 34 Years | 0 (0.0%) | 0 (0.0%) |
| 35 to 39 Years | 0 (0.0%) | 0 (0.0%) |
| 40 to 44 Years | 41 (33.6%) | 25 (13.6%) |
| 45 to 49 Years | 0 (0.0%) | 8 (4.3%) |
| 50 to 54 Years | 0 (0.0%) | 5 (2.7%) |
| 55 to 59 Years | 29 (23.8%) | 11 (6.0%) |
| 60 to 64 Years | 0 (0.0%) | 5 (2.7%) |
| 65 to 69 Years | 4 (3.3%) | 14 (7.6%) |
| 70 to 74 Years | 9 (7.4%) | 6 (3.3%) |
| 75 to 79 Years | 0 (0.0%) | 9 (4.9%) |
| 80 to 84 Years | 0 (0.0%) | 0 (0.0%) |
| 85 Years and over | 0 (0.0%) | 0 (0.0%) |
| Total | 122 (100.0%) | 184 (100.0%) |
Families and Households in Glen Acres
Median Family Size in Glen Acres
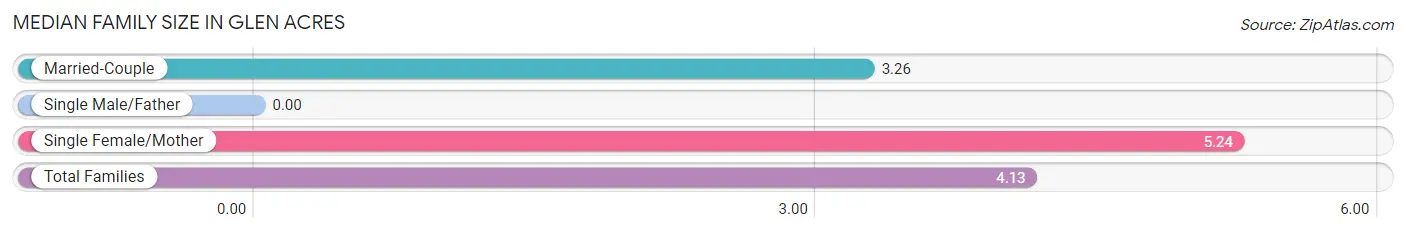
| Family Type | # Families | Family Size |
| Married-Couple | 27 (56.2%) | 3.26 |
| Single Male/Father | 0 (0.0%) | - |
| Single Female/Mother | 21 (43.8%) | 5.24 |
| Total Families | 48 (100.0%) | 4.13 |
Median Household Size in Glen Acres
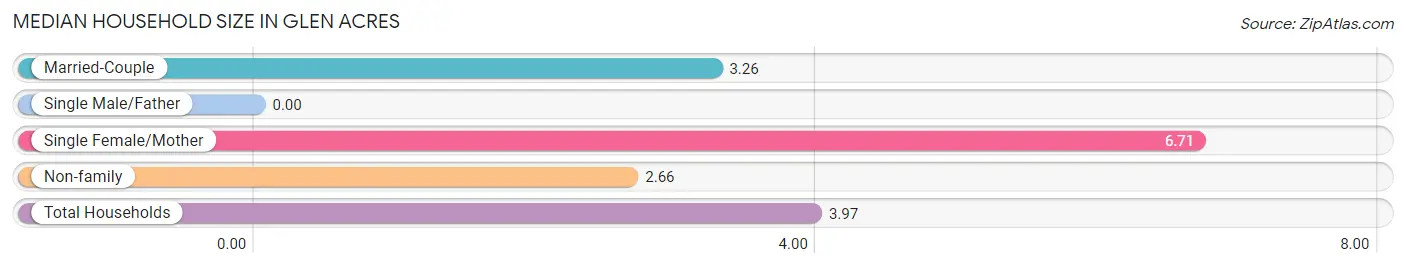
| Household Type | # Households | Household Size |
| Married-Couple | 27 (35.1%) | 3.26 |
| Single Male/Father | 0 (0.0%) | - |
| Single Female/Mother | 21 (27.3%) | 6.71 |
| Non-family | 29 (37.7%) | 2.66 |
| Total Households | 77 (100.0%) | 3.97 |
Household Size by Marriage Status in Glen Acres
Out of a total of 77 households in Glen Acres, 48 (62.3%) are family households, while 29 (37.7%) are nonfamily households. The most numerous type of family households are 2-person households, comprising 15, and the most common type of nonfamily households are 2-person households, comprising 21.
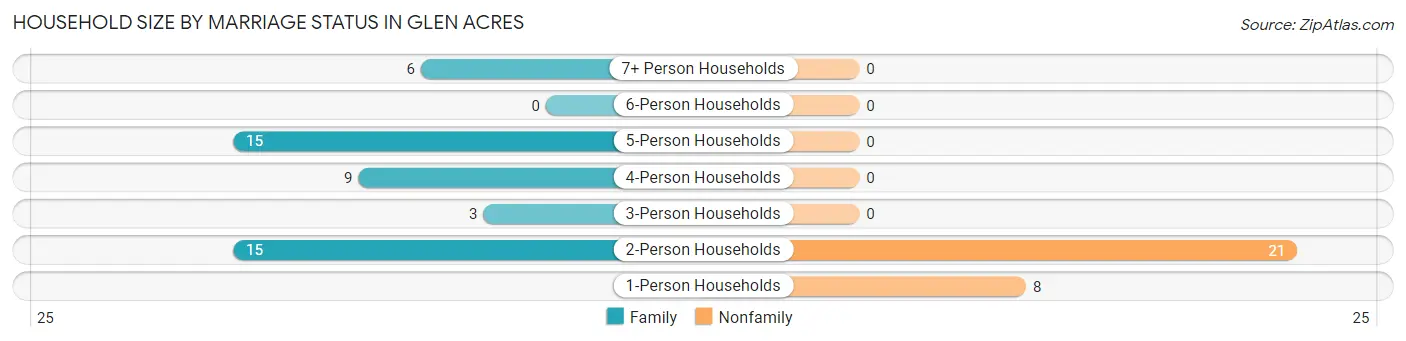
| Household Size | Family Households | Nonfamily Households |
| 1-Person Households | - | 8 (10.4%) |
| 2-Person Households | 15 (19.5%) | 21 (27.3%) |
| 3-Person Households | 3 (3.9%) | 0 (0.0%) |
| 4-Person Households | 9 (11.7%) | 0 (0.0%) |
| 5-Person Households | 15 (19.5%) | 0 (0.0%) |
| 6-Person Households | 0 (0.0%) | 0 (0.0%) |
| 7+ Person Households | 6 (7.8%) | 0 (0.0%) |
| Total | 48 (62.3%) | 29 (37.7%) |
Female Fertility in Glen Acres
Fertility by Age in Glen Acres
Average fertility rate in Glen Acres is 65.0 births per 1,000 women. Women in the age bracket of 20 to 34 years have the highest fertility rate with 123.0 births per 1,000 women. Women in the age bracket of 20 to 34 years acount for 100.0% of all women with births.
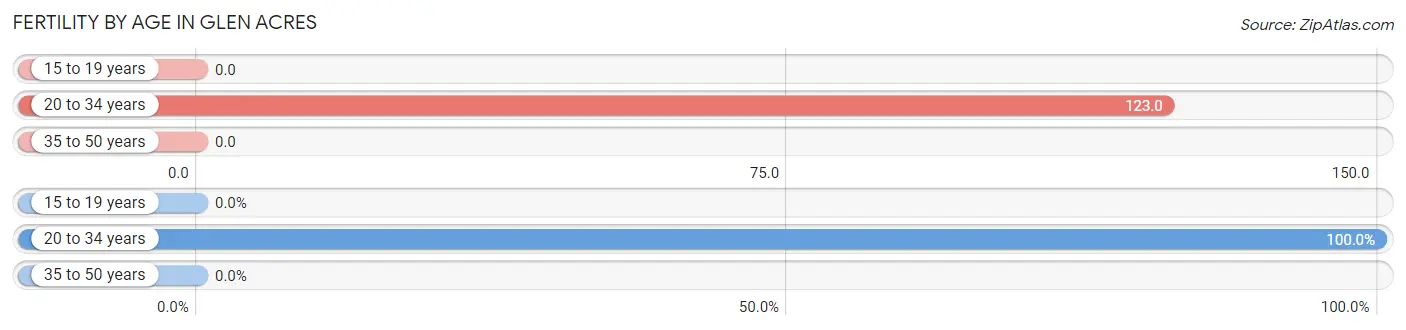
| Age Bracket | Women with Births | Births / 1,000 Women |
| 15 to 19 years | 0 (0.0%) | 0.0 |
| 20 to 34 years | 7 (100.0%) | 123.0 |
| 35 to 50 years | 0 (0.0%) | 0.0 |
| Total | 7 (100.0%) | 65.0 |
Fertility by Age by Marriage Status in Glen Acres
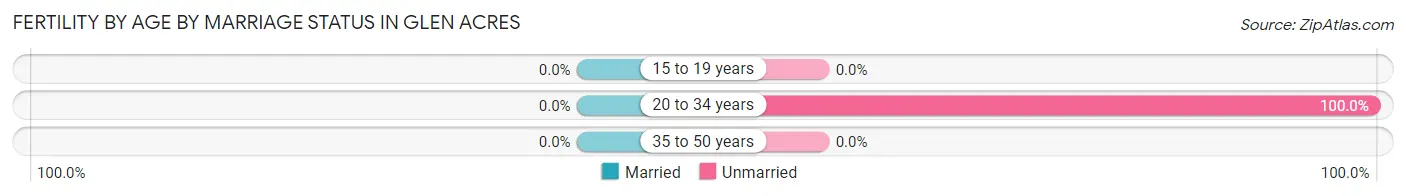
| Age Bracket | Married | Unmarried |
| 15 to 19 years | 0 (0.0%) | 0 (0.0%) |
| 20 to 34 years | 0 (0.0%) | 7 (100.0%) |
| 35 to 50 years | 0 (0.0%) | 0 (0.0%) |
| Total | 0 (0.0%) | 7 (100.0%) |
Fertility by Education in Glen Acres
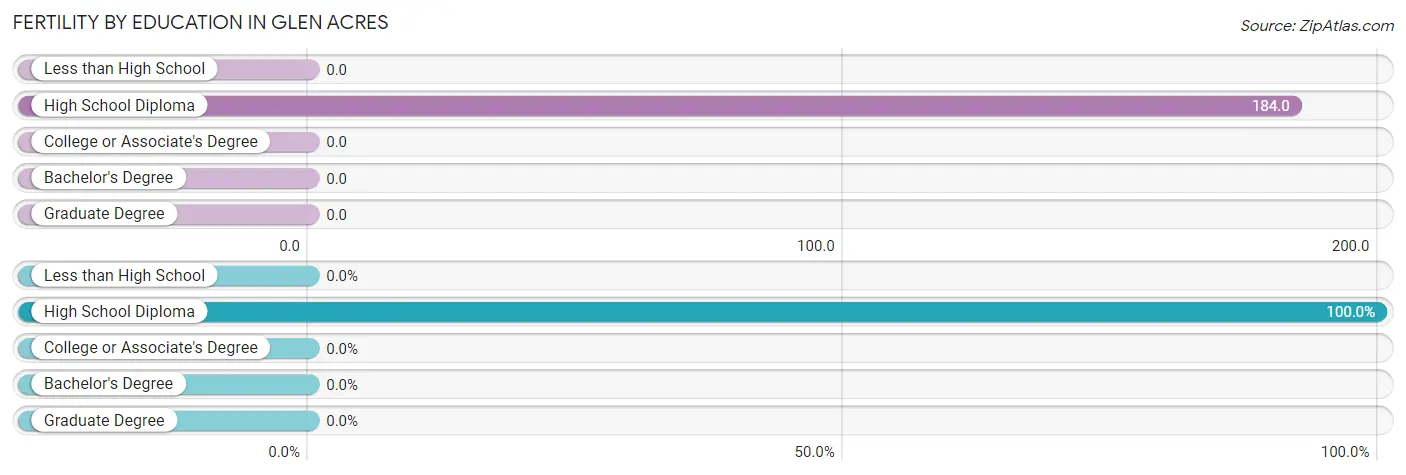
| Educational Attainment | Women with Births | Births / 1,000 Women |
| Less than High School | 0 (0.0%) | 0.0 |
| High School Diploma | 7 (100.0%) | 184.0 |
| College or Associate's Degree | 0 (0.0%) | 0.0 |
| Bachelor's Degree | 0 (0.0%) | 0.0 |
| Graduate Degree | 0 (0.0%) | 0.0 |
| Total | 7 (100.0%) | 65.0 |
Fertility by Education by Marriage Status in Glen Acres
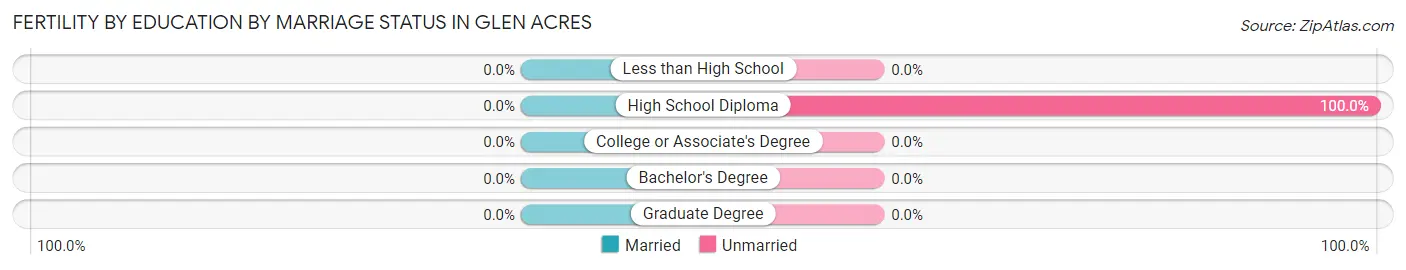
| Educational Attainment | Married | Unmarried |
| Less than High School | 0 (0.0%) | 0 (0.0%) |
| High School Diploma | 0 (0.0%) | 7 (100.0%) |
| College or Associate's Degree | 0 (0.0%) | 0 (0.0%) |
| Bachelor's Degree | 0 (0.0%) | 0 (0.0%) |
| Graduate Degree | 0 (0.0%) | 0 (0.0%) |
| Total | 0 (0.0%) | 7 (100.0%) |
Employment Characteristics in Glen Acres
Employment by Class of Employer in Glen Acres
Among the 142 employed individuals in Glen Acres, private company employees (88 | 62.0%), federal government employees (33 | 23.2%), and local government employees (16 | 11.3%) make up the most common classes of employment.
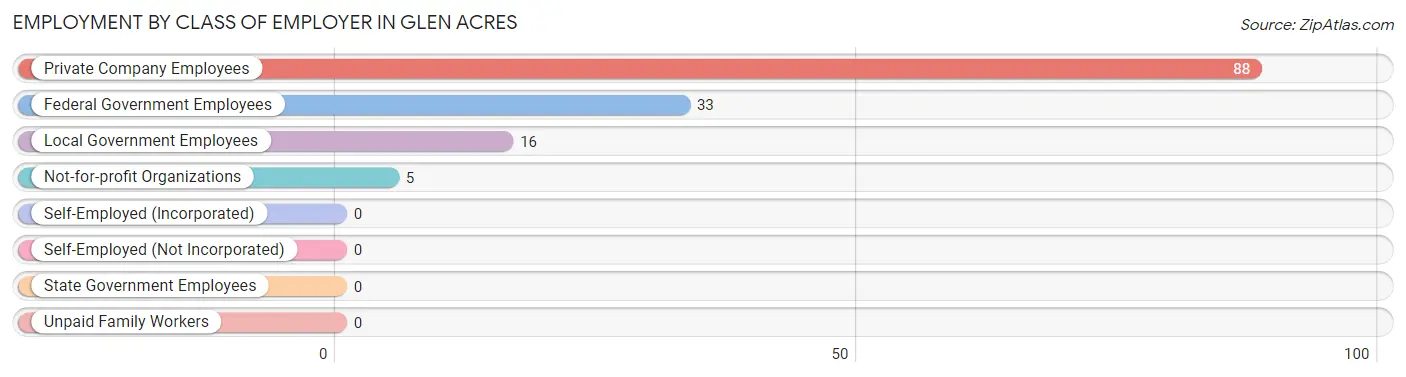
| Employer Class | # Employees | % Employees |
| Private Company Employees | 88 | 62.0% |
| Self-Employed (Incorporated) | 0 | 0.0% |
| Self-Employed (Not Incorporated) | 0 | 0.0% |
| Not-for-profit Organizations | 5 | 3.5% |
| Local Government Employees | 16 | 11.3% |
| State Government Employees | 0 | 0.0% |
| Federal Government Employees | 33 | 23.2% |
| Unpaid Family Workers | 0 | 0.0% |
| Total | 142 | 100.0% |
Employment Status by Age in Glen Acres
According to the labor force statistics for Glen Acres, out of the total population over 16 years of age (260), 59.6% or 155 individuals are in the labor force, with 8.4% or 13 of them unemployed. The age group with the highest labor force participation rate is 25 to 29 years, with 100.0% or 7 individuals in the labor force. Within the labor force, the 16 to 19 years age range has the highest percentage of unemployed individuals, with 41.9% or 13 of them being unemployed.
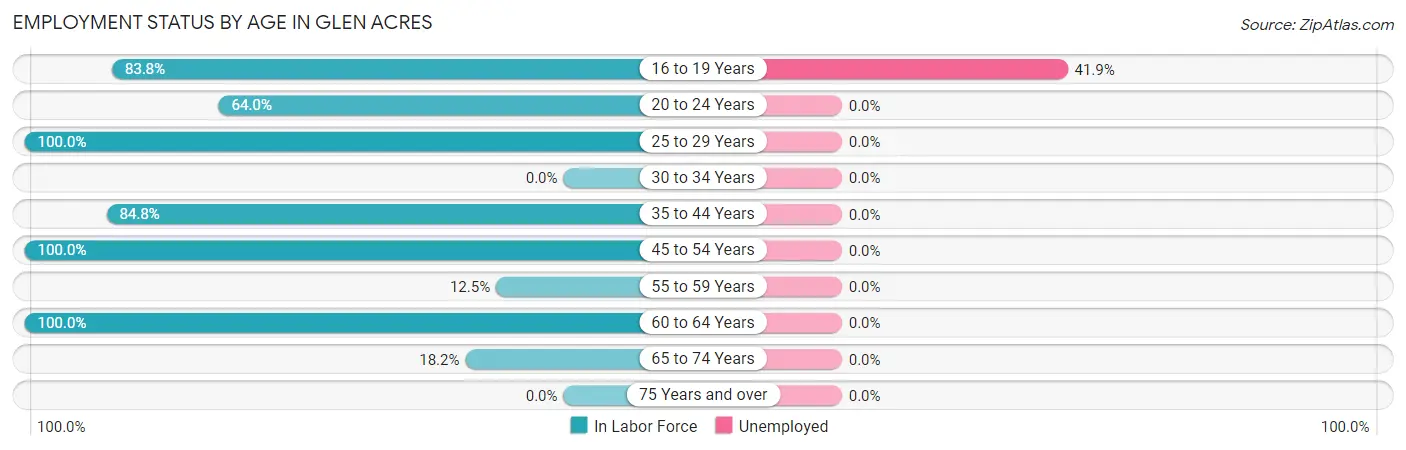
| Age Bracket | In Labor Force | Unemployed |
| 16 to 19 Years | 31 (83.8%) | 13 (41.9%) |
| 20 to 24 Years | 32 (64.0%) | 0 (0.0%) |
| 25 to 29 Years | 7 (100.0%) | 0 (0.0%) |
| 30 to 34 Years | 0 (0.0%) | 0 (0.0%) |
| 35 to 44 Years | 56 (84.8%) | 0 (0.0%) |
| 45 to 54 Years | 13 (100.0%) | 0 (0.0%) |
| 55 to 59 Years | 5 (12.5%) | 0 (0.0%) |
| 60 to 64 Years | 5 (100.0%) | 0 (0.0%) |
| 65 to 74 Years | 6 (18.2%) | 0 (0.0%) |
| 75 Years and over | 0 (0.0%) | 0 (0.0%) |
| Total | 155 (59.6%) | 13 (8.4%) |
Employment Status by Educational Attainment in Glen Acres
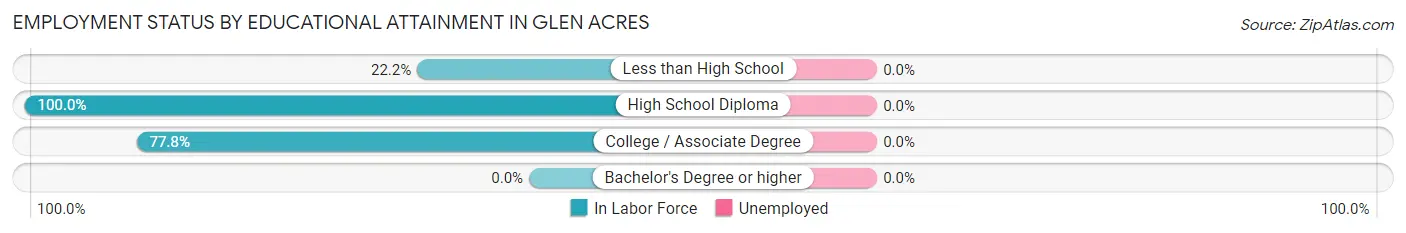
| Educational Attainment | In Labor Force | Unemployed |
| Less than High School | 10 (22.2%) | 0 (0.0%) |
| High School Diploma | 41 (100.0%) | 0 (0.0%) |
| College / Associate Degree | 35 (77.8%) | 0 (0.0%) |
| Bachelor's Degree or higher | 0 (0.0%) | 0 (0.0%) |
| Total | 86 (65.6%) | 0 (0.0%) |
Employment Occupations by Sex in Glen Acres
Management, Business, Science and Arts Occupations
The most common Management, Business, Science and Arts occupations in Glen Acres are Management (10 | 7.0%), and Health Diagnosing & Treating (7 | 4.9%).
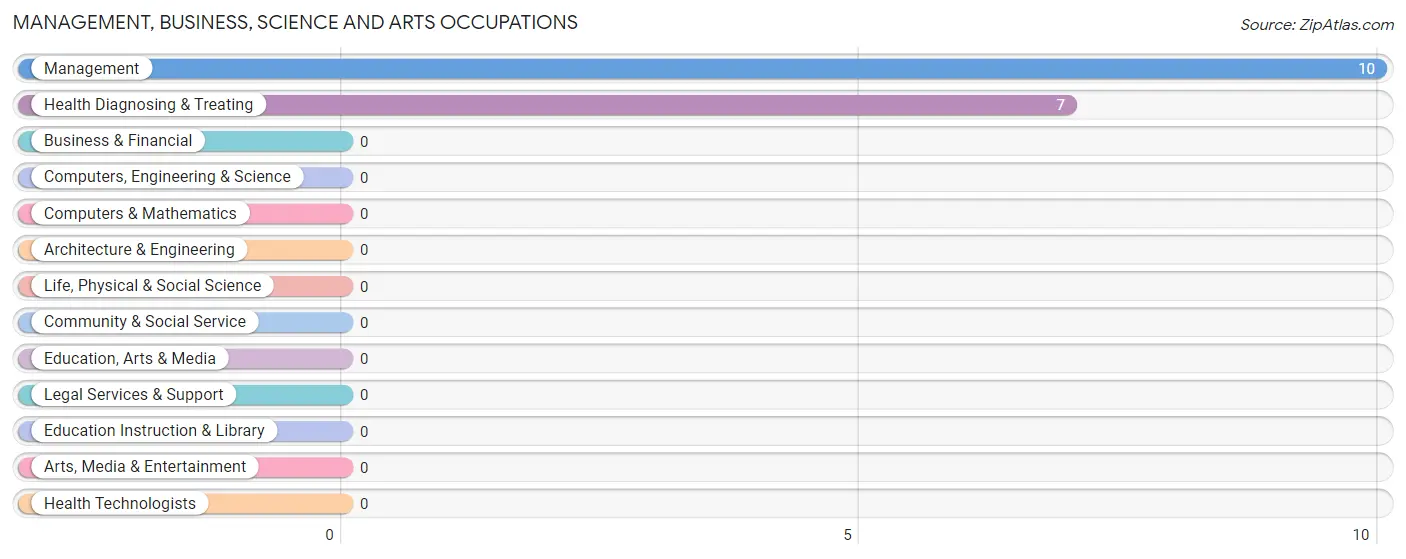
Management, Business, Science and Arts Occupations by Sex
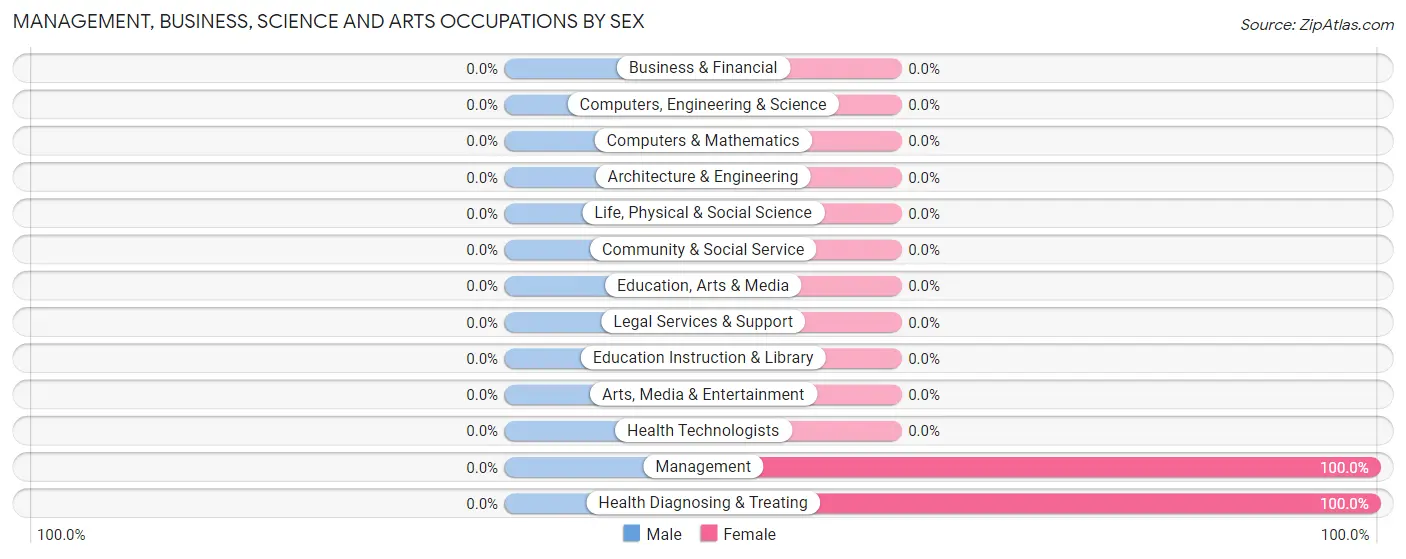
| Occupation | Male | Female |
| Management | 0 (0.0%) | 10 (100.0%) |
| Business & Financial | 0 (0.0%) | 0 (0.0%) |
| Computers, Engineering & Science | 0 (0.0%) | 0 (0.0%) |
| Computers & Mathematics | 0 (0.0%) | 0 (0.0%) |
| Architecture & Engineering | 0 (0.0%) | 0 (0.0%) |
| Life, Physical & Social Science | 0 (0.0%) | 0 (0.0%) |
| Community & Social Service | 0 (0.0%) | 0 (0.0%) |
| Education, Arts & Media | 0 (0.0%) | 0 (0.0%) |
| Legal Services & Support | 0 (0.0%) | 0 (0.0%) |
| Education Instruction & Library | 0 (0.0%) | 0 (0.0%) |
| Arts, Media & Entertainment | 0 (0.0%) | 0 (0.0%) |
| Health Diagnosing & Treating | 0 (0.0%) | 7 (100.0%) |
| Health Technologists | 0 (0.0%) | 0 (0.0%) |
| Total (Category) | 0 (0.0%) | 17 (100.0%) |
| Total (Overall) | 41 (28.9%) | 101 (71.1%) |
Services Occupations
The most common Services occupations in Glen Acres are Healthcare Support (13 | 9.1%), and Cleaning & Maintenance (6 | 4.2%).
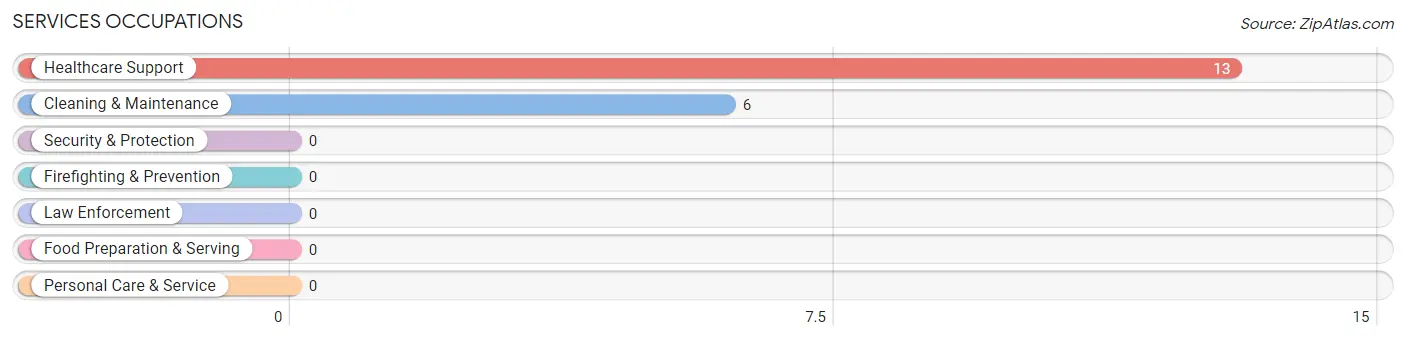
Services Occupations by Sex
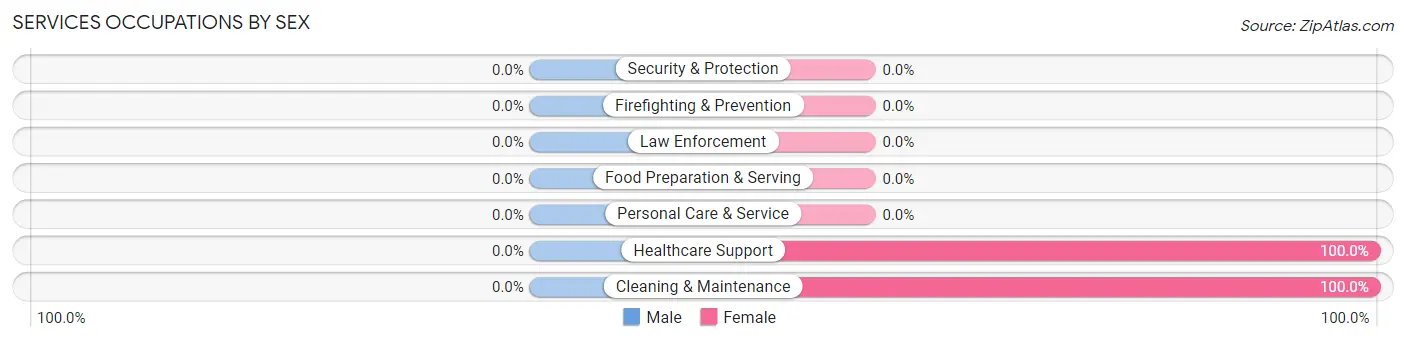
| Occupation | Male | Female |
| Healthcare Support | 0 (0.0%) | 13 (100.0%) |
| Security & Protection | 0 (0.0%) | 0 (0.0%) |
| Firefighting & Prevention | 0 (0.0%) | 0 (0.0%) |
| Law Enforcement | 0 (0.0%) | 0 (0.0%) |
| Food Preparation & Serving | 0 (0.0%) | 0 (0.0%) |
| Cleaning & Maintenance | 0 (0.0%) | 6 (100.0%) |
| Personal Care & Service | 0 (0.0%) | 0 (0.0%) |
| Total (Category) | 0 (0.0%) | 19 (100.0%) |
| Total (Overall) | 41 (28.9%) | 101 (71.1%) |
Sales and Office Occupations
The most common Sales and Office occupations in Glen Acres are Office & Administration (15 | 10.6%), and Sales & Related (13 | 9.1%).
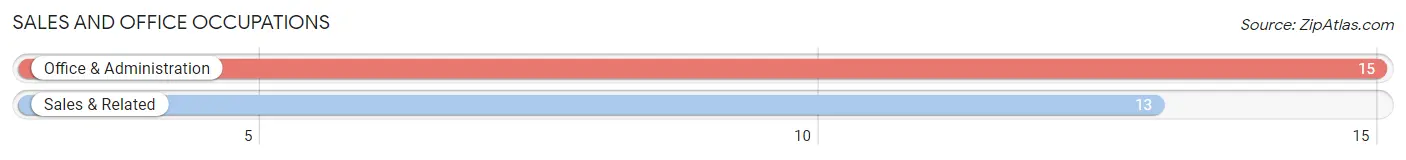
Sales and Office Occupations by Sex
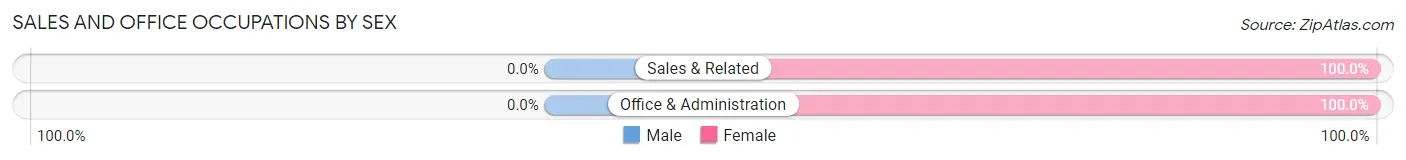
| Occupation | Male | Female |
| Sales & Related | 0 (0.0%) | 13 (100.0%) |
| Office & Administration | 0 (0.0%) | 15 (100.0%) |
| Total (Category) | 0 (0.0%) | 28 (100.0%) |
| Total (Overall) | 41 (28.9%) | 101 (71.1%) |
Natural Resources, Construction and Maintenance Occupations
The most common Natural Resources, Construction and Maintenance occupations in Glen Acres are , and Construction & Extraction (17 | 12.0%).
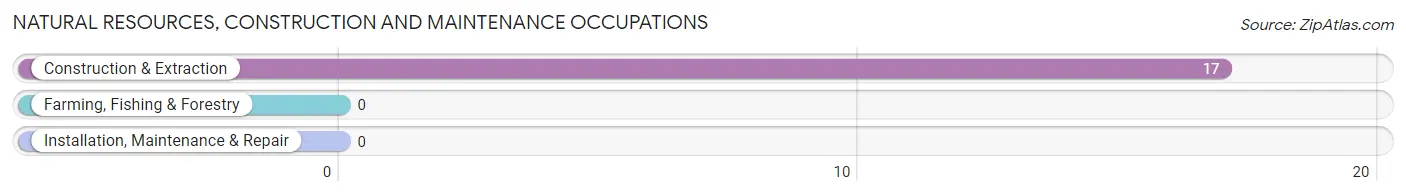
Natural Resources, Construction and Maintenance Occupations by Sex
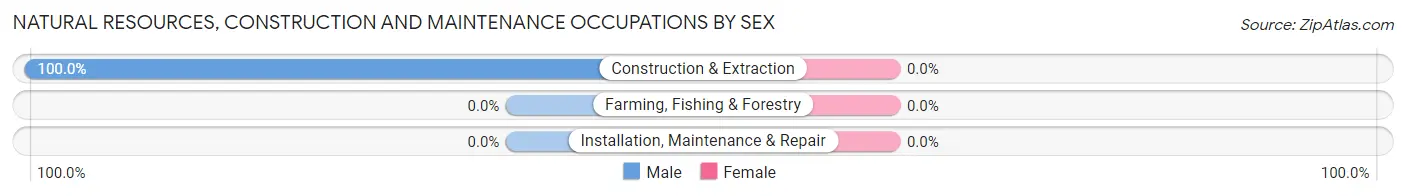
| Occupation | Male | Female |
| Farming, Fishing & Forestry | 0 (0.0%) | 0 (0.0%) |
| Construction & Extraction | 17 (100.0%) | 0 (0.0%) |
| Installation, Maintenance & Repair | 0 (0.0%) | 0 (0.0%) |
| Total (Category) | 17 (100.0%) | 0 (0.0%) |
| Total (Overall) | 41 (28.9%) | 101 (71.1%) |
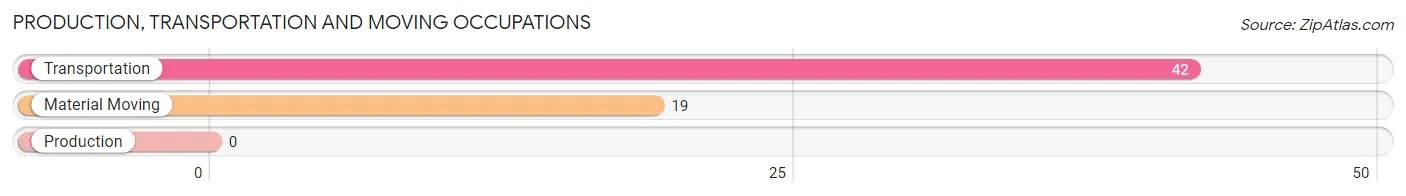
Production, Transportation and Moving Occupations
The most common Production, Transportation and Moving occupations in Glen Acres are Transportation (42 | 29.6%), and Material Moving (19 | 13.4%).
Production, Transportation and Moving Occupations by Sex
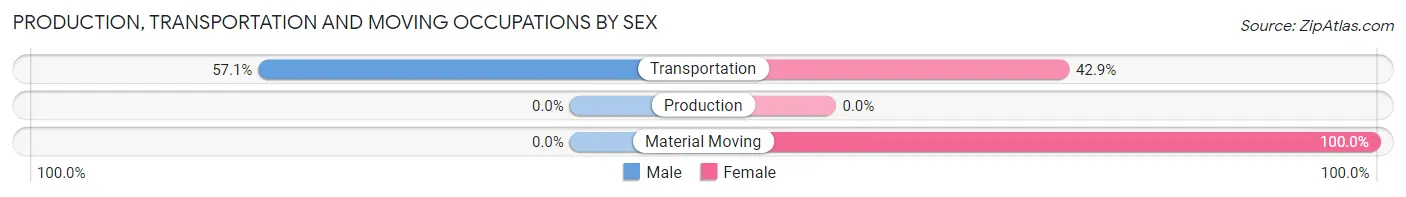
| Occupation | Male | Female |
| Production | 0 (0.0%) | 0 (0.0%) |
| Transportation | 24 (57.1%) | 18 (42.9%) |
| Material Moving | 0 (0.0%) | 19 (100.0%) |
| Total (Category) | 24 (39.3%) | 37 (60.7%) |
| Total (Overall) | 41 (28.9%) | 101 (71.1%) |
Employment Industries by Sex in Glen Acres
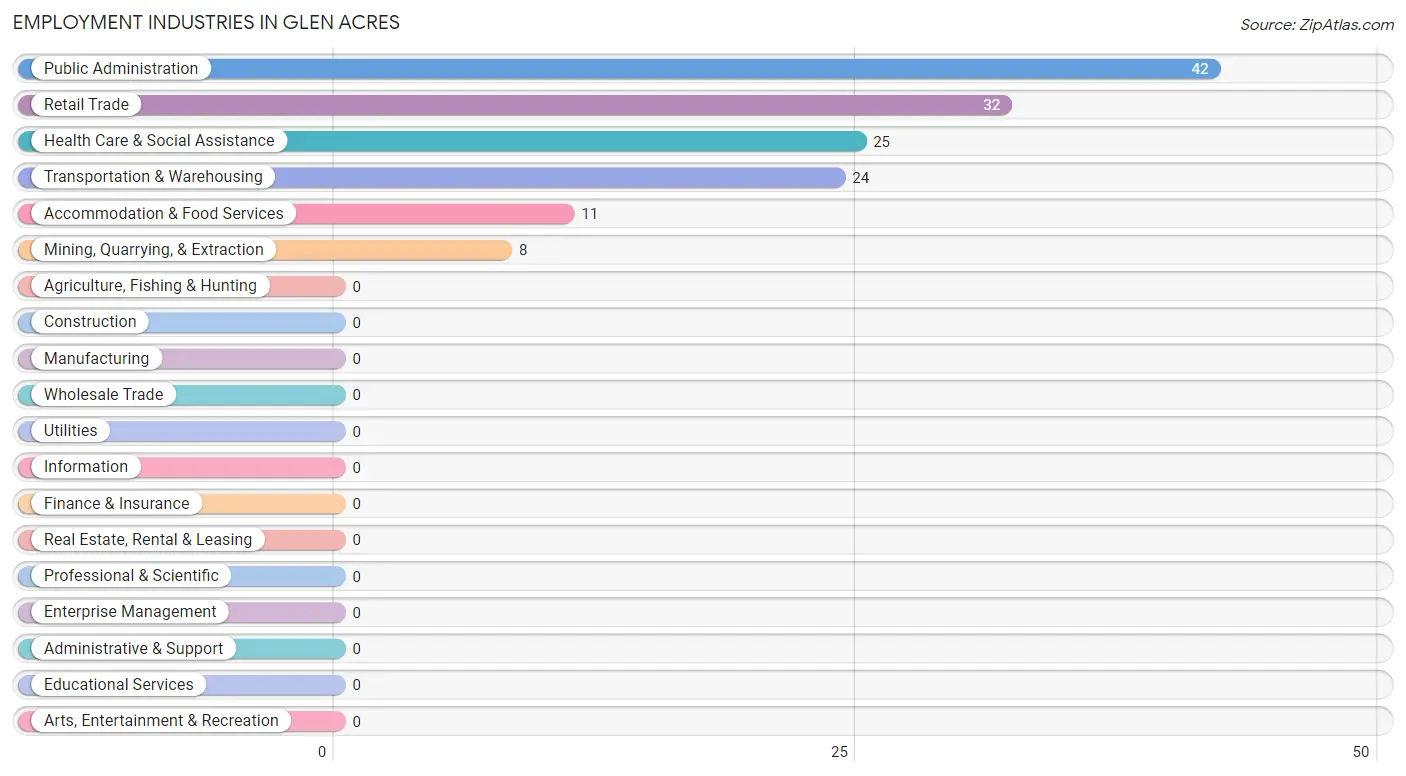
Employment Industries in Glen Acres
The major employment industries in Glen Acres include Public Administration (42 | 29.6%), Retail Trade (32 | 22.5%), Health Care & Social Assistance (25 | 17.6%), Transportation & Warehousing (24 | 16.9%), and Accommodation & Food Services (11 | 7.7%).
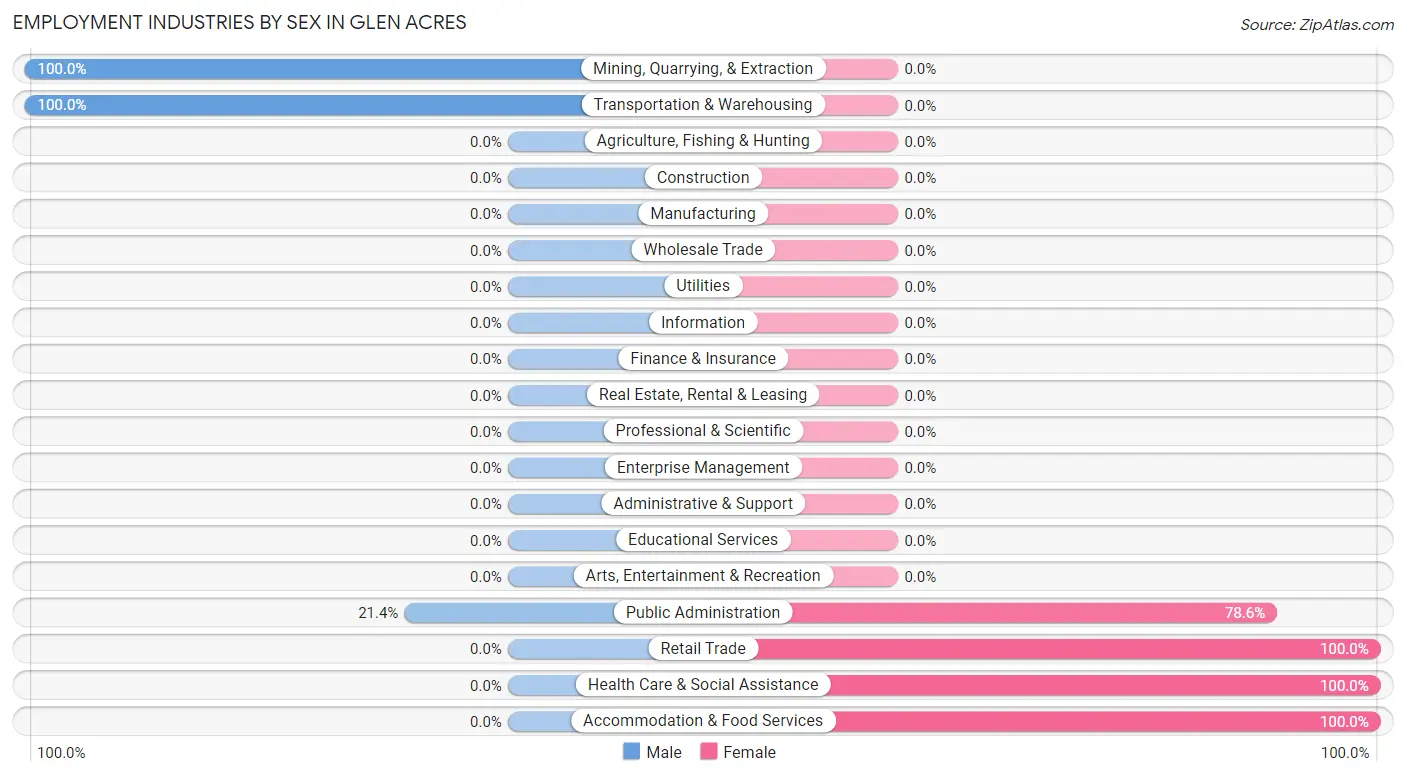
Employment Industries by Sex in Glen Acres
The Glen Acres industries that see more men than women are Mining, Quarrying, & Extraction (100.0%), Transportation & Warehousing (100.0%), and Public Administration (21.4%), whereas the industries that tend to have a higher number of women are Retail Trade (100.0%), Health Care & Social Assistance (100.0%), and Accommodation & Food Services (100.0%).
| Industry | Male | Female |
| Agriculture, Fishing & Hunting | 0 (0.0%) | 0 (0.0%) |
| Mining, Quarrying, & Extraction | 8 (100.0%) | 0 (0.0%) |
| Construction | 0 (0.0%) | 0 (0.0%) |
| Manufacturing | 0 (0.0%) | 0 (0.0%) |
| Wholesale Trade | 0 (0.0%) | 0 (0.0%) |
| Retail Trade | 0 (0.0%) | 32 (100.0%) |
| Transportation & Warehousing | 24 (100.0%) | 0 (0.0%) |
| Utilities | 0 (0.0%) | 0 (0.0%) |
| Information | 0 (0.0%) | 0 (0.0%) |
| Finance & Insurance | 0 (0.0%) | 0 (0.0%) |
| Real Estate, Rental & Leasing | 0 (0.0%) | 0 (0.0%) |
| Professional & Scientific | 0 (0.0%) | 0 (0.0%) |
| Enterprise Management | 0 (0.0%) | 0 (0.0%) |
| Administrative & Support | 0 (0.0%) | 0 (0.0%) |
| Educational Services | 0 (0.0%) | 0 (0.0%) |
| Health Care & Social Assistance | 0 (0.0%) | 25 (100.0%) |
| Arts, Entertainment & Recreation | 0 (0.0%) | 0 (0.0%) |
| Accommodation & Food Services | 0 (0.0%) | 11 (100.0%) |
| Public Administration | 9 (21.4%) | 33 (78.6%) |
| Total | 41 (28.9%) | 101 (71.1%) |
Education in Glen Acres
School Enrollment in Glen Acres
The most common levels of schooling among the 44 students in Glen Acres are high school (25 | 56.8%), graduate / professional (10 | 22.7%), and kindergarten (9 | 20.4%).
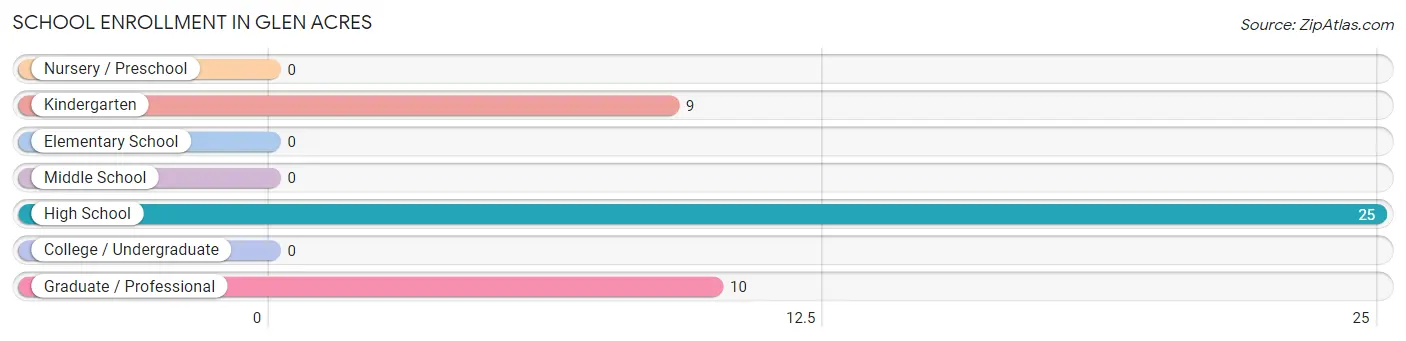
| School Level | # Students | % Students |
| Nursery / Preschool | 0 | 0.0% |
| Kindergarten | 9 | 20.4% |
| Elementary School | 0 | 0.0% |
| Middle School | 0 | 0.0% |
| High School | 25 | 56.8% |
| College / Undergraduate | 0 | 0.0% |
| Graduate / Professional | 10 | 22.7% |
| Total | 44 | 100.0% |
School Enrollment by Age by Funding Source in Glen Acres
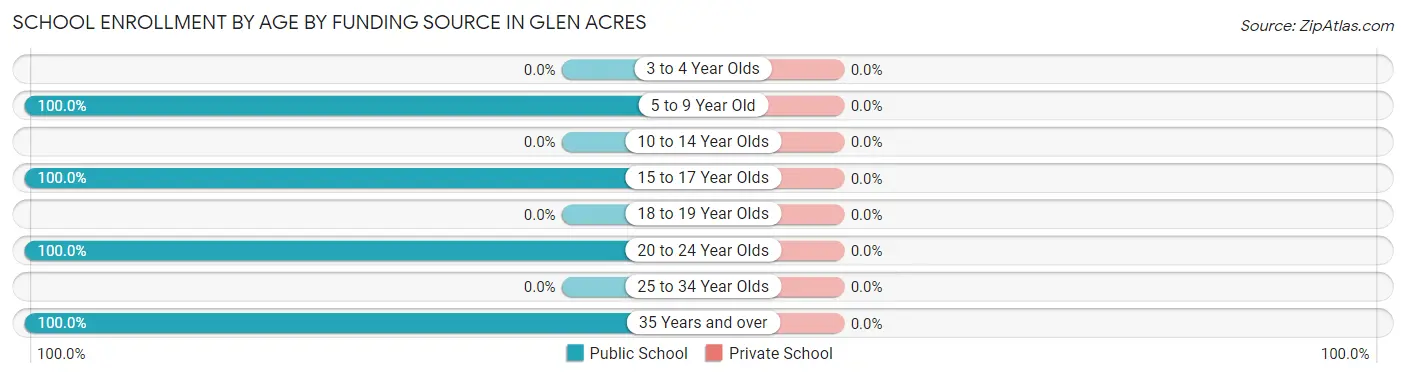
| Age Bracket | Public School | Private School |
| 3 to 4 Year Olds | 0 (0.0%) | 0 (0.0%) |
| 5 to 9 Year Old | 9 (100.0%) | 0 (0.0%) |
| 10 to 14 Year Olds | 0 (0.0%) | 0 (0.0%) |
| 15 to 17 Year Olds | 6 (100.0%) | 0 (0.0%) |
| 18 to 19 Year Olds | 0 (0.0%) | 0 (0.0%) |
| 20 to 24 Year Olds | 19 (100.0%) | 0 (0.0%) |
| 25 to 34 Year Olds | 0 (0.0%) | 0 (0.0%) |
| 35 Years and over | 10 (100.0%) | 0 (0.0%) |
| Total | 44 (100.0%) | 0 (0.0%) |
Educational Attainment by Field of Study in Glen Acres
, and education (14 | 100.0%) are the most common fields of study among 14 individuals in Glen Acres who have obtained a bachelor's degree or higher.
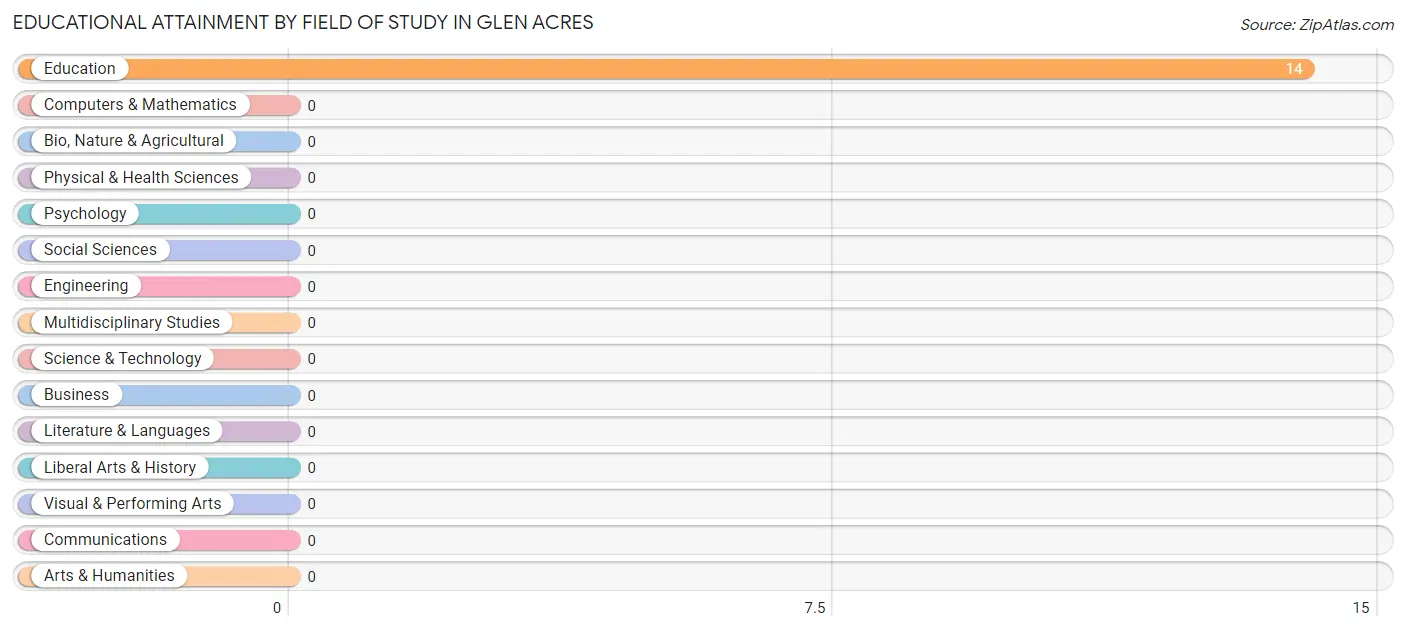
| Field of Study | # Graduates | % Graduates |
| Computers & Mathematics | 0 | 0.0% |
| Bio, Nature & Agricultural | 0 | 0.0% |
| Physical & Health Sciences | 0 | 0.0% |
| Psychology | 0 | 0.0% |
| Social Sciences | 0 | 0.0% |
| Engineering | 0 | 0.0% |
| Multidisciplinary Studies | 0 | 0.0% |
| Science & Technology | 0 | 0.0% |
| Business | 0 | 0.0% |
| Education | 14 | 100.0% |
| Literature & Languages | 0 | 0.0% |
| Liberal Arts & History | 0 | 0.0% |
| Visual & Performing Arts | 0 | 0.0% |
| Communications | 0 | 0.0% |
| Arts & Humanities | 0 | 0.0% |
| Total | 14 | 100.0% |
Transportation & Commute in Glen Acres
Vehicle Availability by Sex in Glen Acres
The most prevalent vehicle ownership categories in Glen Acres are males with 3 vehicles (32, accounting for 78.0%) and females with 3 vehicles (46, making up 31.7%).
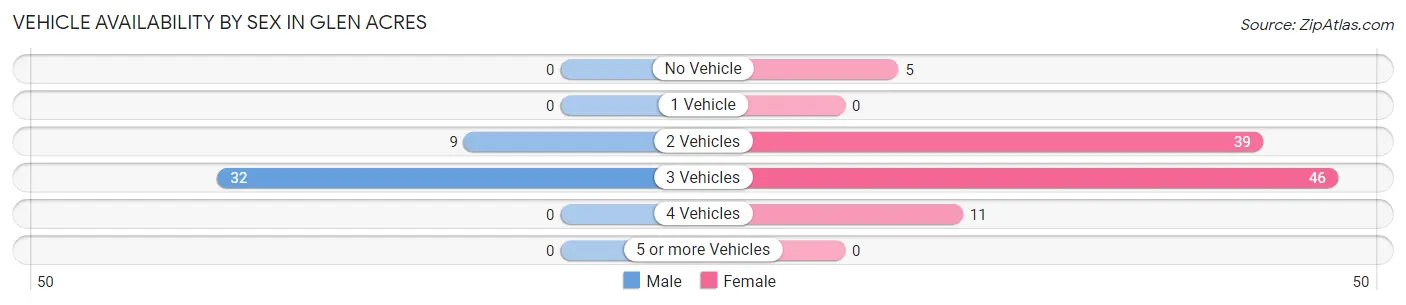
| Vehicles Available | Male | Female |
| No Vehicle | 0 (0.0%) | 5 (5.0%) |
| 1 Vehicle | 0 (0.0%) | 0 (0.0%) |
| 2 Vehicles | 9 (22.0%) | 39 (38.6%) |
| 3 Vehicles | 32 (78.0%) | 46 (45.5%) |
| 4 Vehicles | 0 (0.0%) | 11 (10.9%) |
| 5 or more Vehicles | 0 (0.0%) | 0 (0.0%) |
| Total | 41 (100.0%) | 101 (100.0%) |
Commute Time in Glen Acres
The most frequently occuring commute durations in Glen Acres are 10 to 14 minutes (90 commuters, 63.4%), 60 to 89 minutes (24 commuters, 16.9%), and 5 to 9 minutes (20 commuters, 14.1%).
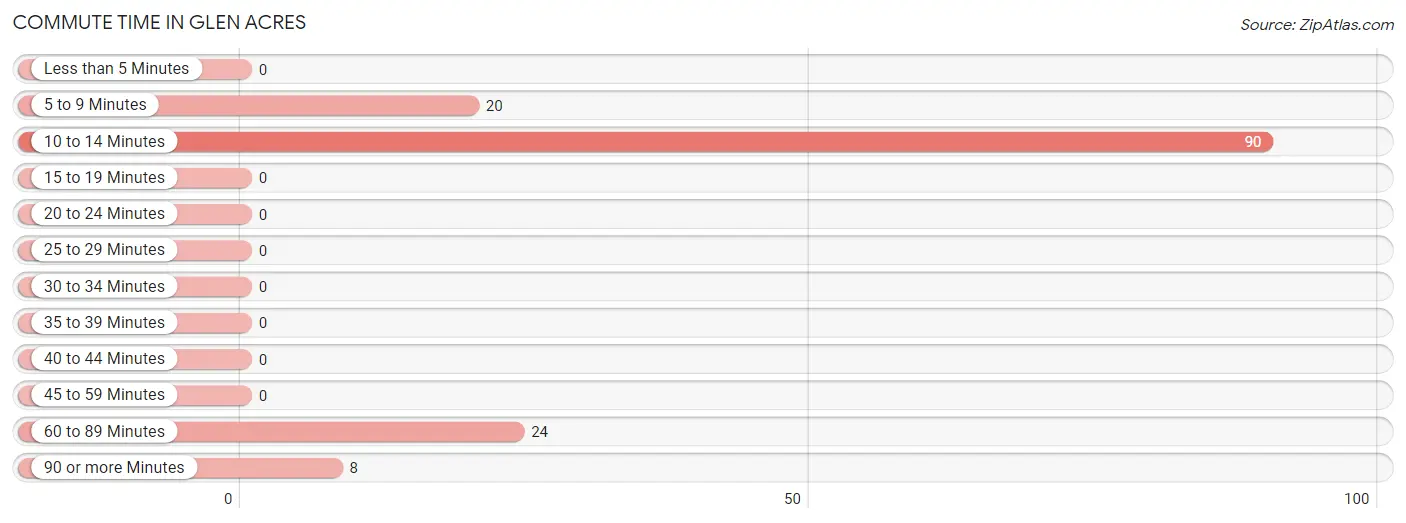
| Commute Time | # Commuters | % Commuters |
| Less than 5 Minutes | 0 | 0.0% |
| 5 to 9 Minutes | 20 | 14.1% |
| 10 to 14 Minutes | 90 | 63.4% |
| 15 to 19 Minutes | 0 | 0.0% |
| 20 to 24 Minutes | 0 | 0.0% |
| 25 to 29 Minutes | 0 | 0.0% |
| 30 to 34 Minutes | 0 | 0.0% |
| 35 to 39 Minutes | 0 | 0.0% |
| 40 to 44 Minutes | 0 | 0.0% |
| 45 to 59 Minutes | 0 | 0.0% |
| 60 to 89 Minutes | 24 | 16.9% |
| 90 or more Minutes | 8 | 5.6% |
Commute Time by Sex in Glen Acres
The most common commute times in Glen Acres are 60 to 89 minutes (24 commuters, 58.5%) for males and 10 to 14 minutes (90 commuters, 89.1%) for females.
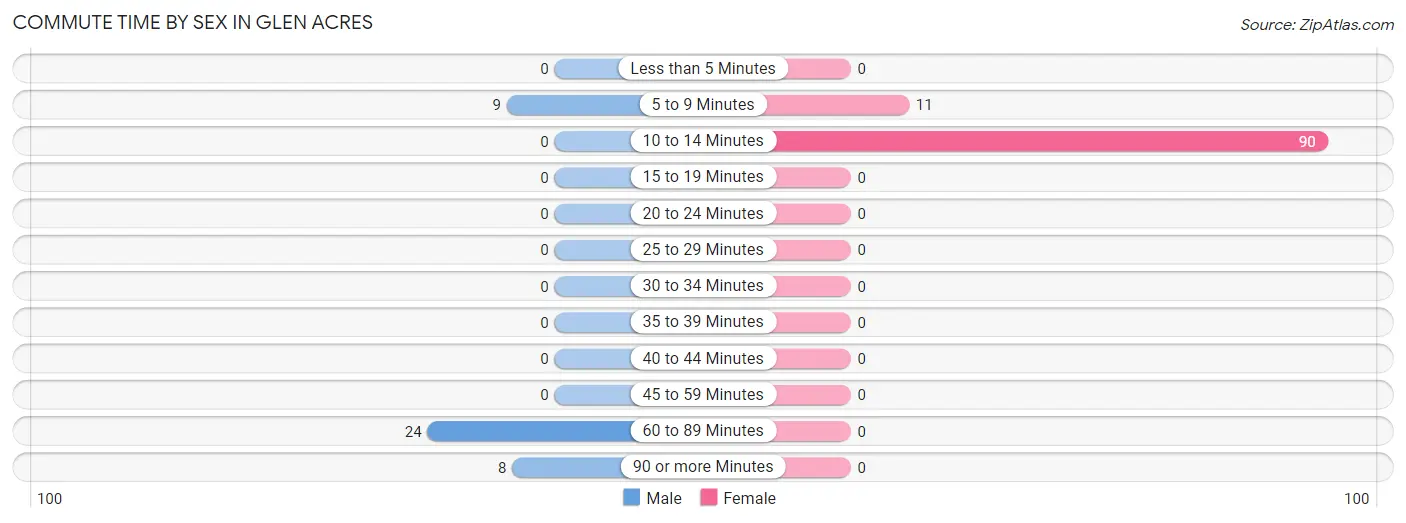
| Commute Time | Male | Female |
| Less than 5 Minutes | 0 (0.0%) | 0 (0.0%) |
| 5 to 9 Minutes | 9 (22.0%) | 11 (10.9%) |
| 10 to 14 Minutes | 0 (0.0%) | 90 (89.1%) |
| 15 to 19 Minutes | 0 (0.0%) | 0 (0.0%) |
| 20 to 24 Minutes | 0 (0.0%) | 0 (0.0%) |
| 25 to 29 Minutes | 0 (0.0%) | 0 (0.0%) |
| 30 to 34 Minutes | 0 (0.0%) | 0 (0.0%) |
| 35 to 39 Minutes | 0 (0.0%) | 0 (0.0%) |
| 40 to 44 Minutes | 0 (0.0%) | 0 (0.0%) |
| 45 to 59 Minutes | 0 (0.0%) | 0 (0.0%) |
| 60 to 89 Minutes | 24 (58.5%) | 0 (0.0%) |
| 90 or more Minutes | 8 (19.5%) | 0 (0.0%) |
Time of Departure to Work by Sex in Glen Acres
The most frequent times of departure to work in Glen Acres are 5:00 AM to 5:29 AM (24, 58.5%) for males and 9:00 AM to 9:59 AM (32, 31.7%) for females.
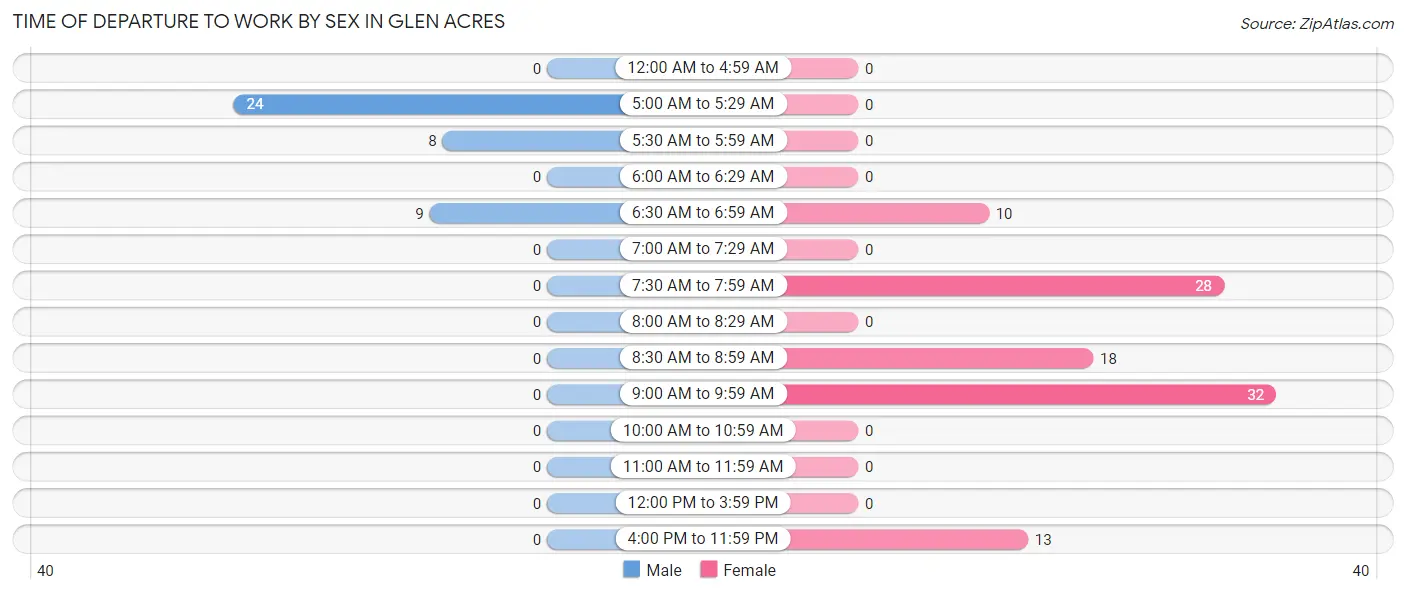
| Time of Departure | Male | Female |
| 12:00 AM to 4:59 AM | 0 (0.0%) | 0 (0.0%) |
| 5:00 AM to 5:29 AM | 24 (58.5%) | 0 (0.0%) |
| 5:30 AM to 5:59 AM | 8 (19.5%) | 0 (0.0%) |
| 6:00 AM to 6:29 AM | 0 (0.0%) | 0 (0.0%) |
| 6:30 AM to 6:59 AM | 9 (22.0%) | 10 (9.9%) |
| 7:00 AM to 7:29 AM | 0 (0.0%) | 0 (0.0%) |
| 7:30 AM to 7:59 AM | 0 (0.0%) | 28 (27.7%) |
| 8:00 AM to 8:29 AM | 0 (0.0%) | 0 (0.0%) |
| 8:30 AM to 8:59 AM | 0 (0.0%) | 18 (17.8%) |
| 9:00 AM to 9:59 AM | 0 (0.0%) | 32 (31.7%) |
| 10:00 AM to 10:59 AM | 0 (0.0%) | 0 (0.0%) |
| 11:00 AM to 11:59 AM | 0 (0.0%) | 0 (0.0%) |
| 12:00 PM to 3:59 PM | 0 (0.0%) | 0 (0.0%) |
| 4:00 PM to 11:59 PM | 0 (0.0%) | 13 (12.9%) |
| Total | 41 (100.0%) | 101 (100.0%) |
Housing Occupancy in Glen Acres
Occupancy by Ownership in Glen Acres
Of the total 77 dwellings in Glen Acres, owner-occupied units account for 57 (74.0%), while renter-occupied units make up 20 (26.0%).
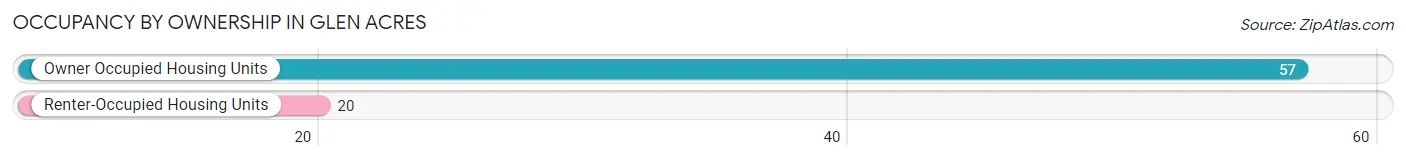
| Occupancy | # Housing Units | % Housing Units |
| Owner Occupied Housing Units | 57 | 74.0% |
| Renter-Occupied Housing Units | 20 | 26.0% |
| Total Occupied Housing Units | 77 | 100.0% |
Occupancy by Household Size in Glen Acres
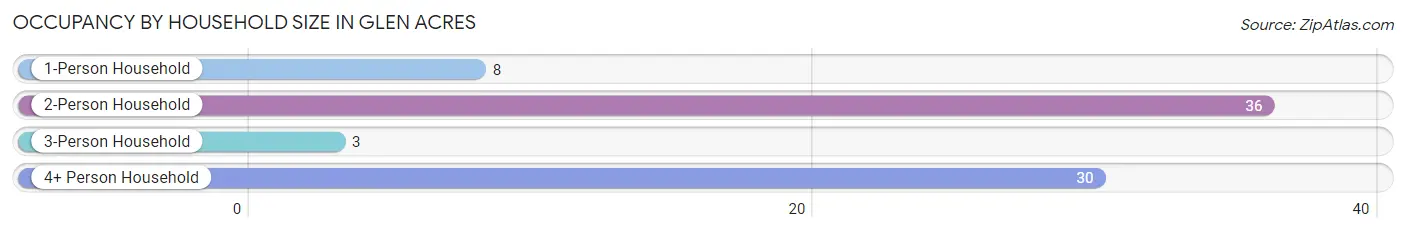
| Household Size | # Housing Units | % Housing Units |
| 1-Person Household | 8 | 10.4% |
| 2-Person Household | 36 | 46.8% |
| 3-Person Household | 3 | 3.9% |
| 4+ Person Household | 30 | 39.0% |
| Total Housing Units | 77 | 100.0% |
Occupancy by Ownership by Household Size in Glen Acres
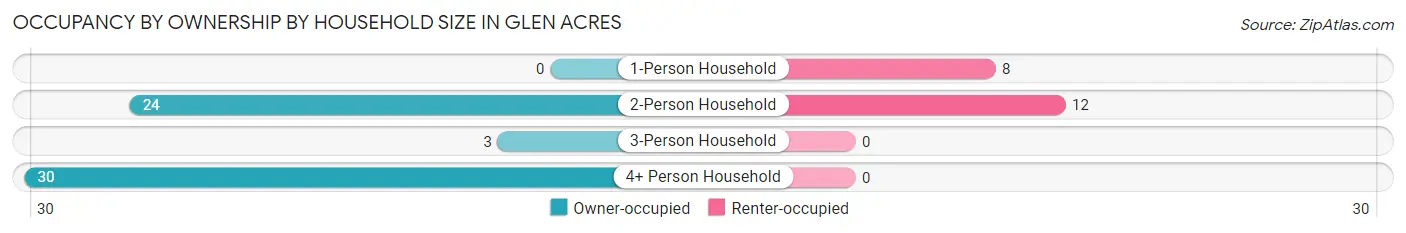
| Household Size | Owner-occupied | Renter-occupied |
| 1-Person Household | 0 (0.0%) | 8 (100.0%) |
| 2-Person Household | 24 (66.7%) | 12 (33.3%) |
| 3-Person Household | 3 (100.0%) | 0 (0.0%) |
| 4+ Person Household | 30 (100.0%) | 0 (0.0%) |
| Total Housing Units | 57 (74.0%) | 20 (26.0%) |
Occupancy by Educational Attainment in Glen Acres
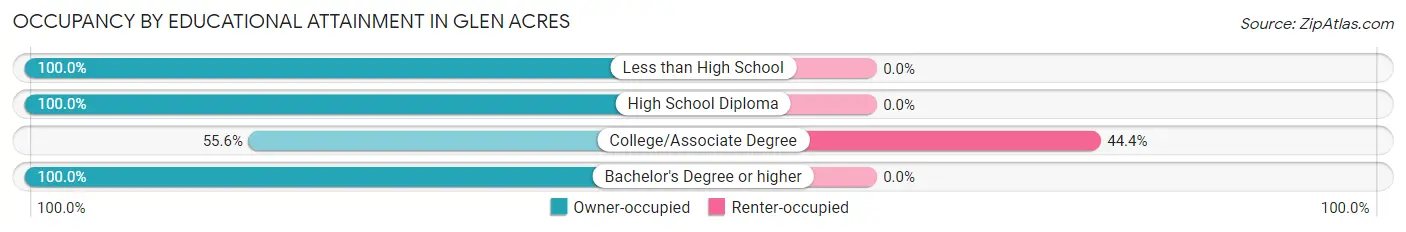
| Household Size | Owner-occupied | Renter-occupied |
| Less than High School | 6 (100.0%) | 0 (0.0%) |
| High School Diploma | 12 (100.0%) | 0 (0.0%) |
| College/Associate Degree | 25 (55.6%) | 20 (44.4%) |
| Bachelor's Degree or higher | 14 (100.0%) | 0 (0.0%) |
Occupancy by Age of Householder in Glen Acres
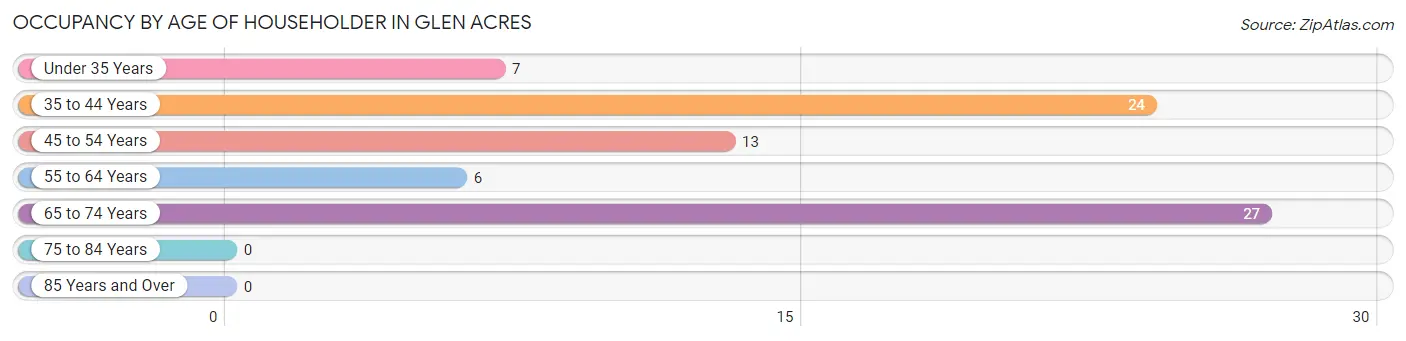
| Age Bracket | # Households | % Households |
| Under 35 Years | 7 | 9.1% |
| 35 to 44 Years | 24 | 31.2% |
| 45 to 54 Years | 13 | 16.9% |
| 55 to 64 Years | 6 | 7.8% |
| 65 to 74 Years | 27 | 35.1% |
| 75 to 84 Years | 0 | 0.0% |
| 85 Years and Over | 0 | 0.0% |
| Total | 77 | 100.0% |
Housing Finances in Glen Acres
Median Income by Occupancy in Glen Acres
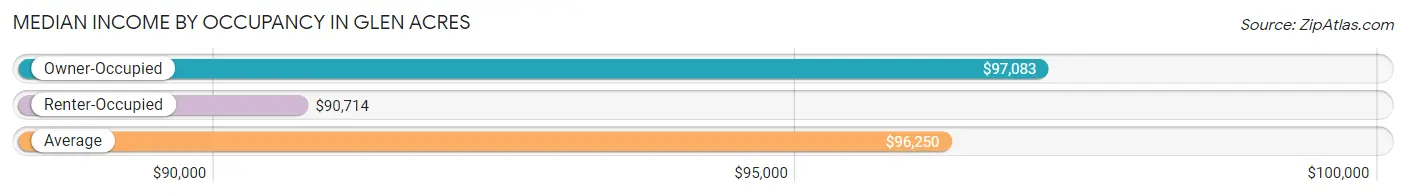
| Occupancy Type | # Households | Median Income |
| Owner-Occupied | 57 (74.0%) | $97,083 |
| Renter-Occupied | 20 (26.0%) | $90,714 |
| Average | 77 (100.0%) | $96,250 |
Occupancy by Householder Income Bracket in Glen Acres
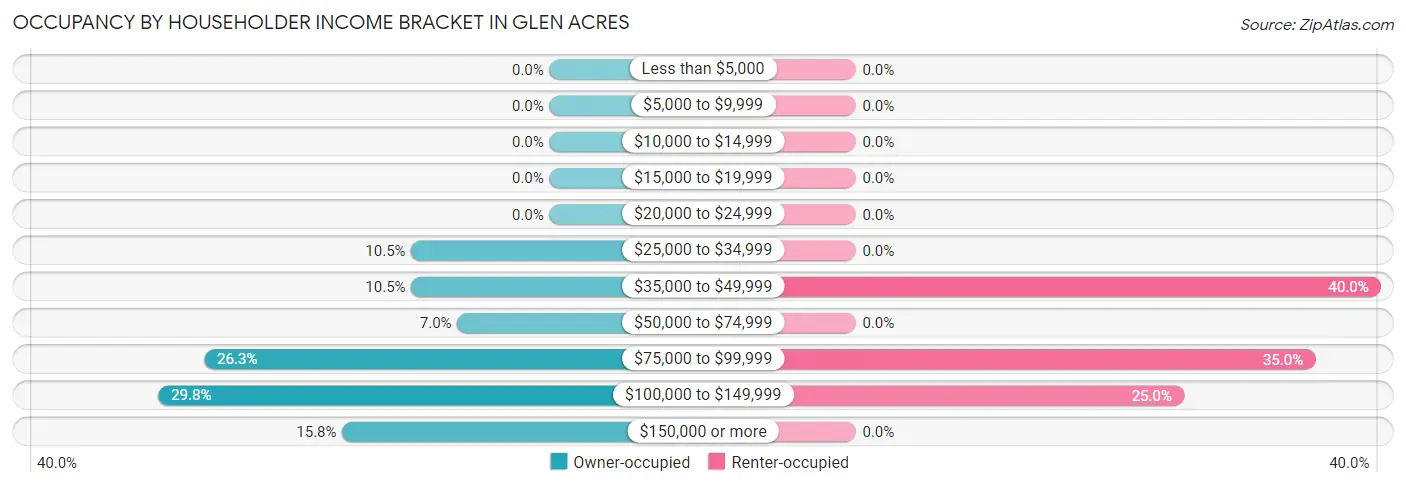
| Income Bracket | Owner-occupied | Renter-occupied |
| Less than $5,000 | 0 (0.0%) | 0 (0.0%) |
| $5,000 to $9,999 | 0 (0.0%) | 0 (0.0%) |
| $10,000 to $14,999 | 0 (0.0%) | 0 (0.0%) |
| $15,000 to $19,999 | 0 (0.0%) | 0 (0.0%) |
| $20,000 to $24,999 | 0 (0.0%) | 0 (0.0%) |
| $25,000 to $34,999 | 6 (10.5%) | 0 (0.0%) |
| $35,000 to $49,999 | 6 (10.5%) | 8 (40.0%) |
| $50,000 to $74,999 | 4 (7.0%) | 0 (0.0%) |
| $75,000 to $99,999 | 15 (26.3%) | 7 (35.0%) |
| $100,000 to $149,999 | 17 (29.8%) | 5 (25.0%) |
| $150,000 or more | 9 (15.8%) | 0 (0.0%) |
| Total | 57 (100.0%) | 20 (100.0%) |
Monthly Housing Cost Tiers in Glen Acres
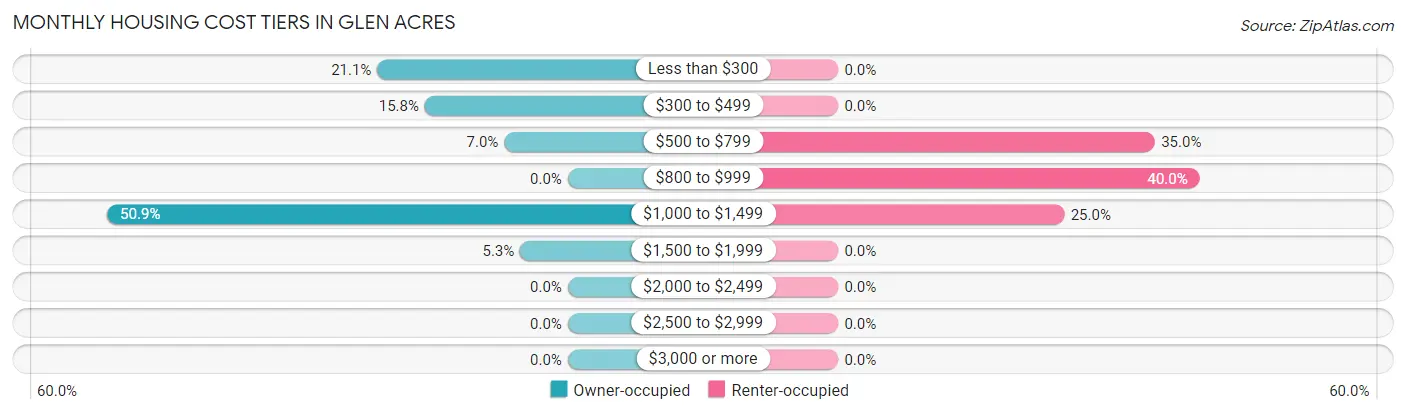
| Monthly Cost | Owner-occupied | Renter-occupied |
| Less than $300 | 12 (21.0%) | 0 (0.0%) |
| $300 to $499 | 9 (15.8%) | 0 (0.0%) |
| $500 to $799 | 4 (7.0%) | 7 (35.0%) |
| $800 to $999 | 0 (0.0%) | 8 (40.0%) |
| $1,000 to $1,499 | 29 (50.9%) | 5 (25.0%) |
| $1,500 to $1,999 | 3 (5.3%) | 0 (0.0%) |
| $2,000 to $2,499 | 0 (0.0%) | 0 (0.0%) |
| $2,500 to $2,999 | 0 (0.0%) | 0 (0.0%) |
| $3,000 or more | 0 (0.0%) | 0 (0.0%) |
| Total | 57 (100.0%) | 20 (100.0%) |
Physical Housing Characteristics in Glen Acres
Housing Structures in Glen Acres
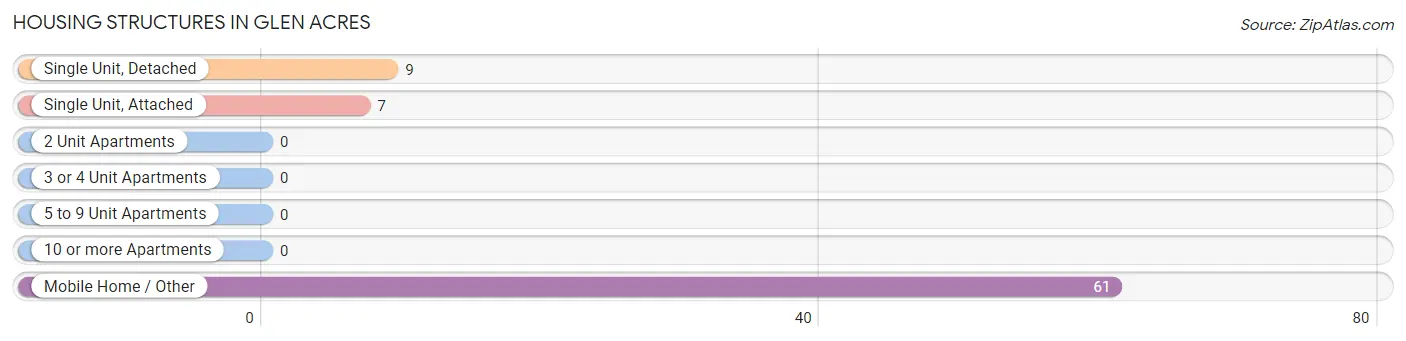
| Structure Type | # Housing Units | % Housing Units |
| Single Unit, Detached | 9 | 11.7% |
| Single Unit, Attached | 7 | 9.1% |
| 2 Unit Apartments | 0 | 0.0% |
| 3 or 4 Unit Apartments | 0 | 0.0% |
| 5 to 9 Unit Apartments | 0 | 0.0% |
| 10 or more Apartments | 0 | 0.0% |
| Mobile Home / Other | 61 | 79.2% |
| Total | 77 | 100.0% |
Housing Structures by Occupancy in Glen Acres
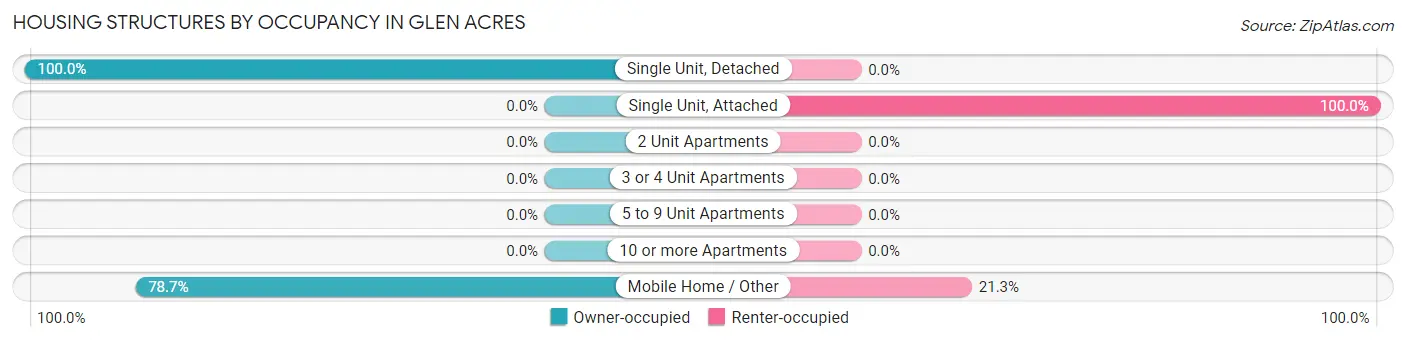
| Structure Type | Owner-occupied | Renter-occupied |
| Single Unit, Detached | 9 (100.0%) | 0 (0.0%) |
| Single Unit, Attached | 0 (0.0%) | 7 (100.0%) |
| 2 Unit Apartments | 0 (0.0%) | 0 (0.0%) |
| 3 or 4 Unit Apartments | 0 (0.0%) | 0 (0.0%) |
| 5 to 9 Unit Apartments | 0 (0.0%) | 0 (0.0%) |
| 10 or more Apartments | 0 (0.0%) | 0 (0.0%) |
| Mobile Home / Other | 48 (78.7%) | 13 (21.3%) |
| Total | 57 (74.0%) | 20 (26.0%) |
Housing Structures by Number of Rooms in Glen Acres
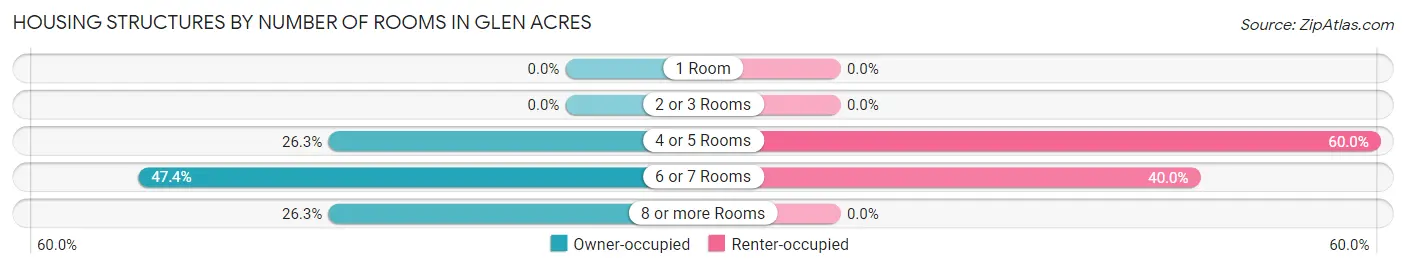
| Number of Rooms | Owner-occupied | Renter-occupied |
| 1 Room | 0 (0.0%) | 0 (0.0%) |
| 2 or 3 Rooms | 0 (0.0%) | 0 (0.0%) |
| 4 or 5 Rooms | 15 (26.3%) | 12 (60.0%) |
| 6 or 7 Rooms | 27 (47.4%) | 8 (40.0%) |
| 8 or more Rooms | 15 (26.3%) | 0 (0.0%) |
| Total | 57 (100.0%) | 20 (100.0%) |
Housing Structure by Heating Type in Glen Acres
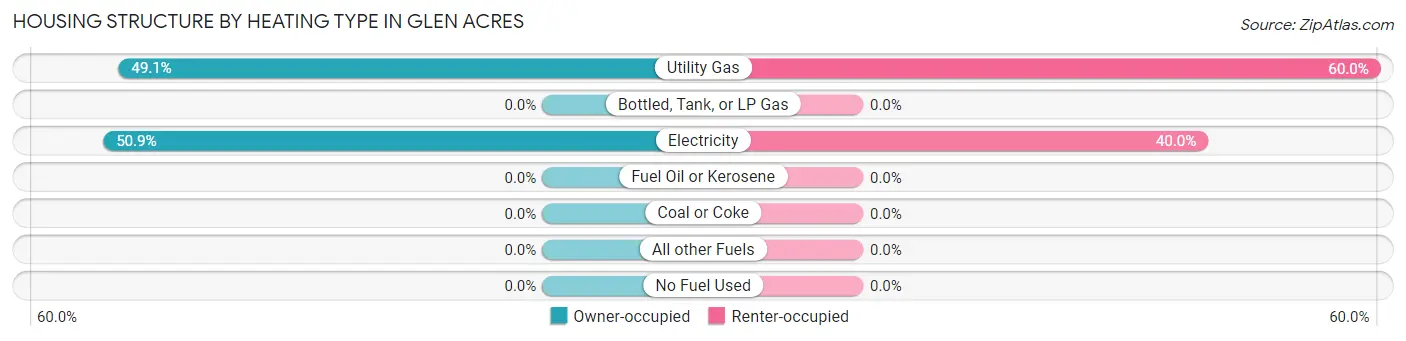
| Heating Type | Owner-occupied | Renter-occupied |
| Utility Gas | 28 (49.1%) | 12 (60.0%) |
| Bottled, Tank, or LP Gas | 0 (0.0%) | 0 (0.0%) |
| Electricity | 29 (50.9%) | 8 (40.0%) |
| Fuel Oil or Kerosene | 0 (0.0%) | 0 (0.0%) |
| Coal or Coke | 0 (0.0%) | 0 (0.0%) |
| All other Fuels | 0 (0.0%) | 0 (0.0%) |
| No Fuel Used | 0 (0.0%) | 0 (0.0%) |
| Total | 57 (100.0%) | 20 (100.0%) |
Household Vehicle Usage in Glen Acres
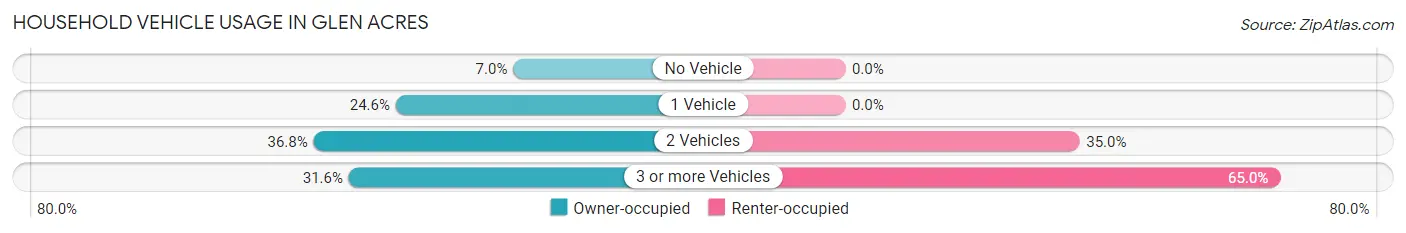
| Vehicles per Household | Owner-occupied | Renter-occupied |
| No Vehicle | 4 (7.0%) | 0 (0.0%) |
| 1 Vehicle | 14 (24.6%) | 0 (0.0%) |
| 2 Vehicles | 21 (36.8%) | 7 (35.0%) |
| 3 or more Vehicles | 18 (31.6%) | 13 (65.0%) |
| Total | 57 (100.0%) | 20 (100.0%) |
Real Estate & Mortgages in Glen Acres
Real Estate and Mortgage Overview in Glen Acres
| Characteristic | Without Mortgage | With Mortgage |
| Housing Units | 39 | 18 |
| Median Property Value | - | - |
| Median Household Income | $100,625 | $0 |
| Monthly Housing Costs | - | - |
| Real Estate Taxes | $657 | $0 |
Property Value by Mortgage Status in Glen Acres
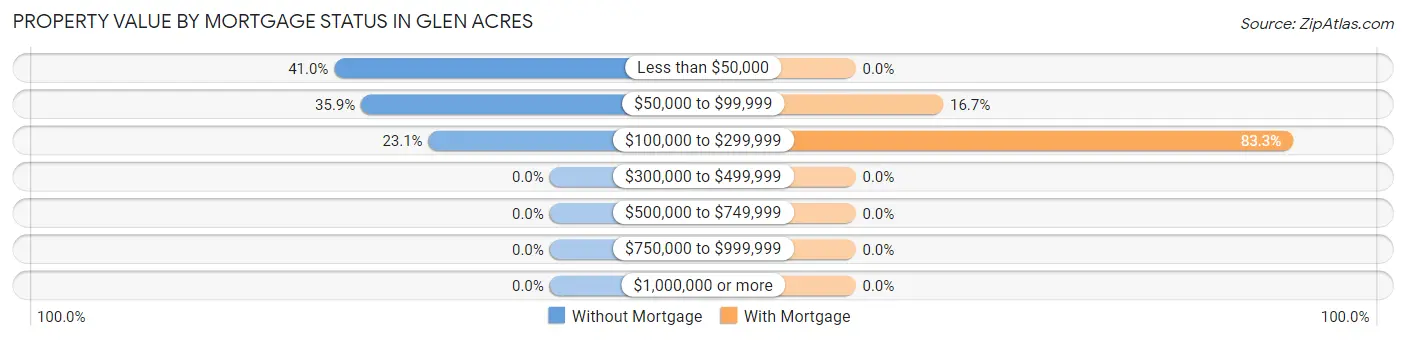
| Property Value | Without Mortgage | With Mortgage |
| Less than $50,000 | 16 (41.0%) | 0 (0.0%) |
| $50,000 to $99,999 | 14 (35.9%) | 3 (16.7%) |
| $100,000 to $299,999 | 9 (23.1%) | 15 (83.3%) |
| $300,000 to $499,999 | 0 (0.0%) | 0 (0.0%) |
| $500,000 to $749,999 | 0 (0.0%) | 0 (0.0%) |
| $750,000 to $999,999 | 0 (0.0%) | 0 (0.0%) |
| $1,000,000 or more | 0 (0.0%) | 0 (0.0%) |
| Total | 39 (100.0%) | 18 (100.0%) |
Household Income by Mortgage Status in Glen Acres
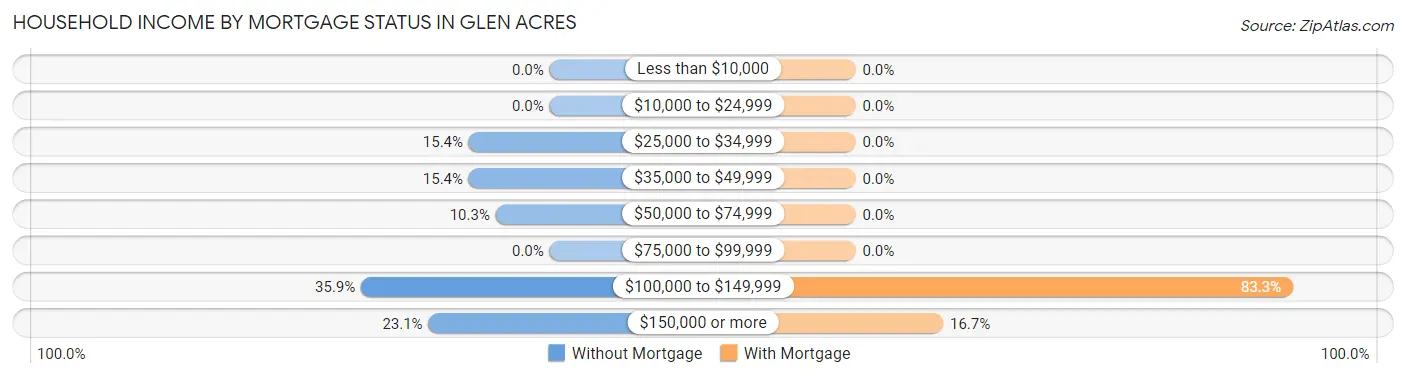
| Household Income | Without Mortgage | With Mortgage |
| Less than $10,000 | 0 (0.0%) | 0 (0.0%) |
| $10,000 to $24,999 | 0 (0.0%) | 0 (0.0%) |
| $25,000 to $34,999 | 6 (15.4%) | 0 (0.0%) |
| $35,000 to $49,999 | 6 (15.4%) | 0 (0.0%) |
| $50,000 to $74,999 | 4 (10.3%) | 0 (0.0%) |
| $75,000 to $99,999 | 0 (0.0%) | 0 (0.0%) |
| $100,000 to $149,999 | 14 (35.9%) | 15 (83.3%) |
| $150,000 or more | 9 (23.1%) | 3 (16.7%) |
| Total | 39 (100.0%) | 18 (100.0%) |
Property Value to Household Income Ratio in Glen Acres
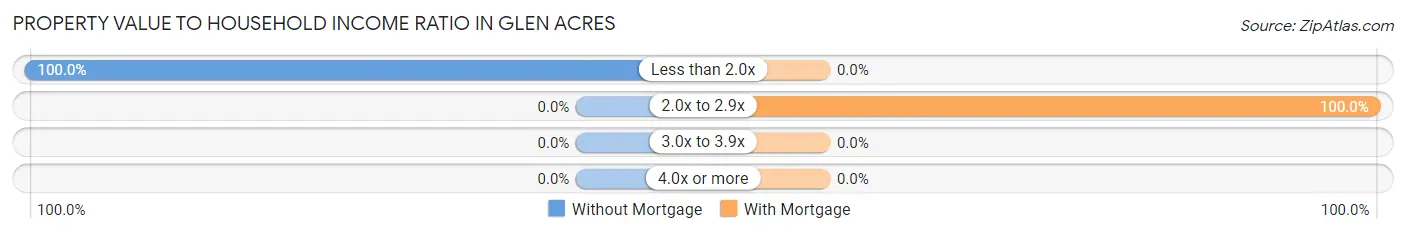
| Value-to-Income Ratio | Without Mortgage | With Mortgage |
| Less than 2.0x | 39 (100.0%) | 0 (0.0%) |
| 2.0x to 2.9x | 0 (0.0%) | 18 (100.0%) |
| 3.0x to 3.9x | 0 (0.0%) | 0 (0.0%) |
| 4.0x or more | 0 (0.0%) | 0 (0.0%) |
| Total | 39 (100.0%) | 18 (100.0%) |
Real Estate Taxes by Mortgage Status in Glen Acres
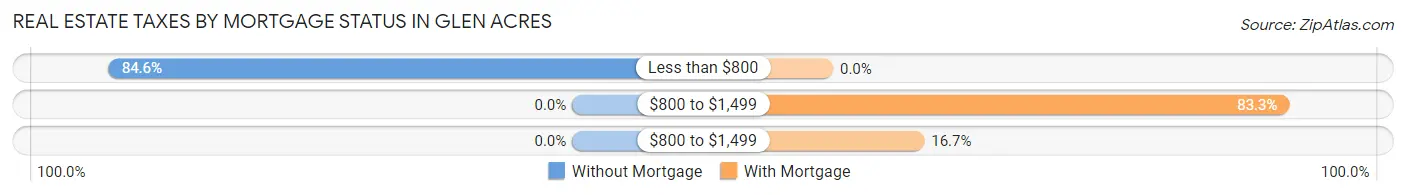
| Property Taxes | Without Mortgage | With Mortgage |
| Less than $800 | 33 (84.6%) | 0 (0.0%) |
| $800 to $1,499 | 0 (0.0%) | 15 (83.3%) |
| $800 to $1,499 | 0 (0.0%) | 3 (16.7%) |
| Total | 39 (100.0%) | 18 (100.0%) |
Health & Disability in Glen Acres
Health Insurance Coverage by Age in Glen Acres
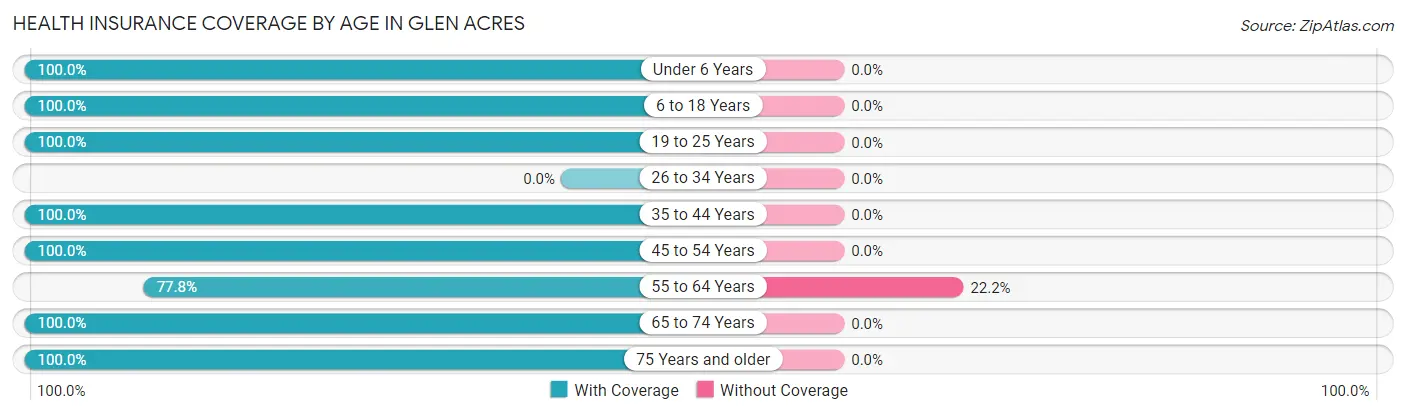
| Age Bracket | With Coverage | Without Coverage |
| Under 6 Years | 21 (100.0%) | 0 (0.0%) |
| 6 to 18 Years | 31 (100.0%) | 0 (0.0%) |
| 19 to 25 Years | 88 (100.0%) | 0 (0.0%) |
| 26 to 34 Years | 0 (0.0%) | 0 (0.0%) |
| 35 to 44 Years | 66 (100.0%) | 0 (0.0%) |
| 45 to 54 Years | 13 (100.0%) | 0 (0.0%) |
| 55 to 64 Years | 35 (77.8%) | 10 (22.2%) |
| 65 to 74 Years | 33 (100.0%) | 0 (0.0%) |
| 75 Years and older | 9 (100.0%) | 0 (0.0%) |
| Total | 296 (96.7%) | 10 (3.3%) |
Health Insurance Coverage by Citizenship Status in Glen Acres
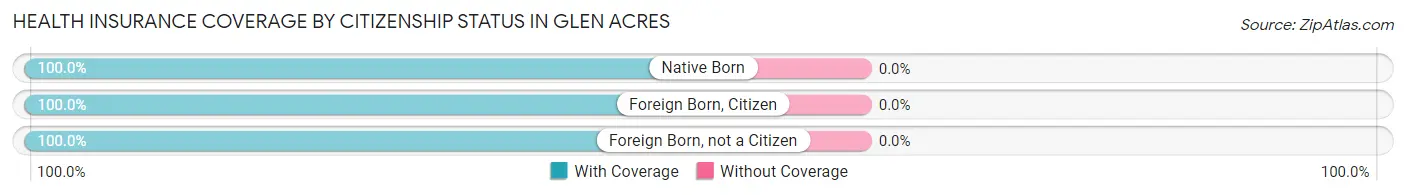
| Citizenship Status | With Coverage | Without Coverage |
| Native Born | 21 (100.0%) | 0 (0.0%) |
| Foreign Born, Citizen | 31 (100.0%) | 0 (0.0%) |
| Foreign Born, not a Citizen | 88 (100.0%) | 0 (0.0%) |
Health Insurance Coverage by Household Income in Glen Acres
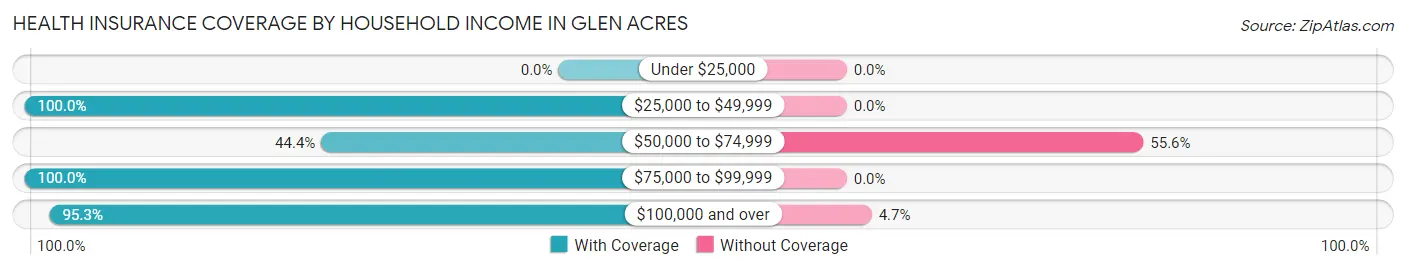
| Household Income | With Coverage | Without Coverage |
| Under $25,000 | 0 (0.0%) | 0 (0.0%) |
| $25,000 to $49,999 | 82 (100.0%) | 0 (0.0%) |
| $50,000 to $74,999 | 4 (44.4%) | 5 (55.6%) |
| $75,000 to $99,999 | 108 (100.0%) | 0 (0.0%) |
| $100,000 and over | 102 (95.3%) | 5 (4.7%) |
Public vs Private Health Insurance Coverage by Age in Glen Acres
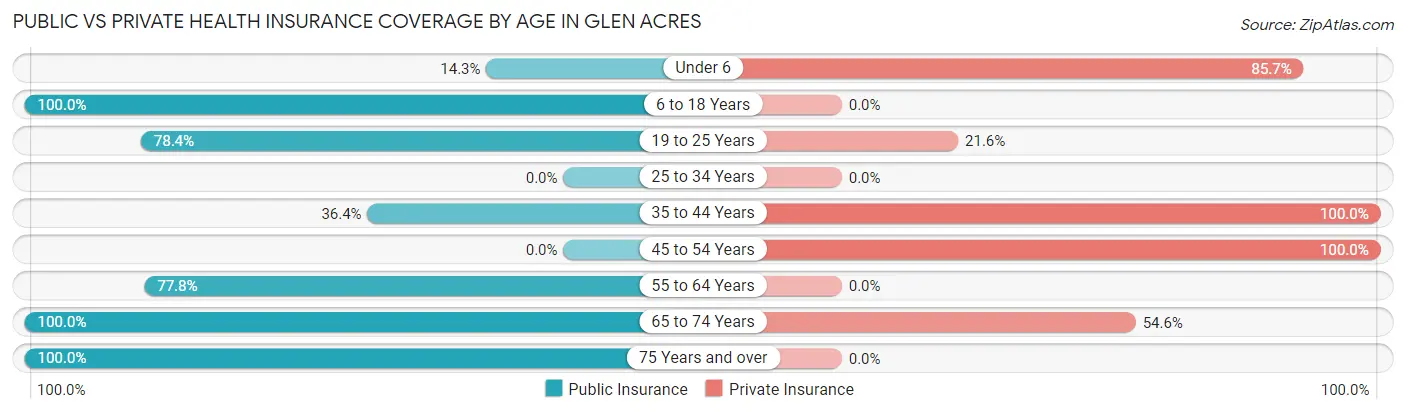
| Age Bracket | Public Insurance | Private Insurance |
| Under 6 | 3 (14.3%) | 18 (85.7%) |
| 6 to 18 Years | 31 (100.0%) | 0 (0.0%) |
| 19 to 25 Years | 69 (78.4%) | 19 (21.6%) |
| 25 to 34 Years | 0 (0.0%) | 0 (0.0%) |
| 35 to 44 Years | 24 (36.4%) | 66 (100.0%) |
| 45 to 54 Years | 0 (0.0%) | 13 (100.0%) |
| 55 to 64 Years | 35 (77.8%) | 0 (0.0%) |
| 65 to 74 Years | 33 (100.0%) | 18 (54.5%) |
| 75 Years and over | 9 (100.0%) | 0 (0.0%) |
| Total | 204 (66.7%) | 134 (43.8%) |
Disability Status by Sex by Age in Glen Acres
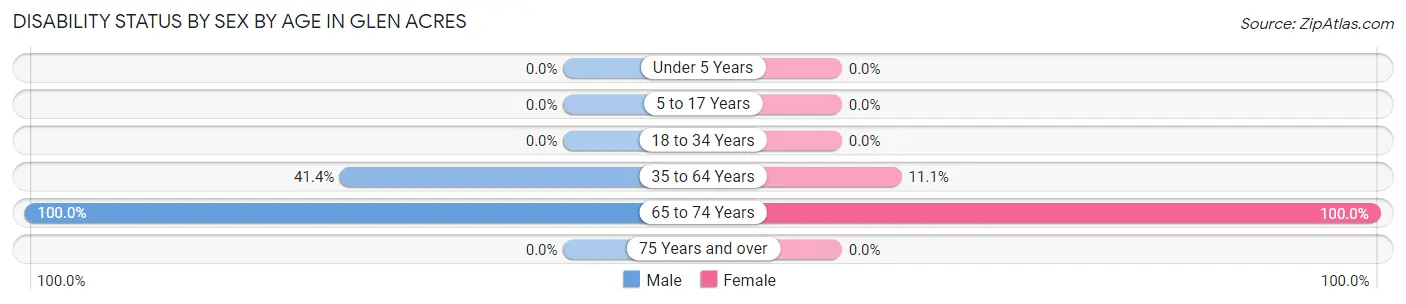
| Age Bracket | Male | Female |
| Under 5 Years | 0 (0.0%) | 0 (0.0%) |
| 5 to 17 Years | 0 (0.0%) | 0 (0.0%) |
| 18 to 34 Years | 0 (0.0%) | 0 (0.0%) |
| 35 to 64 Years | 29 (41.4%) | 6 (11.1%) |
| 65 to 74 Years | 13 (100.0%) | 20 (100.0%) |
| 75 Years and over | 0 (0.0%) | 0 (0.0%) |
Disability Class by Sex by Age in Glen Acres
Disability Class: Hearing Difficulty
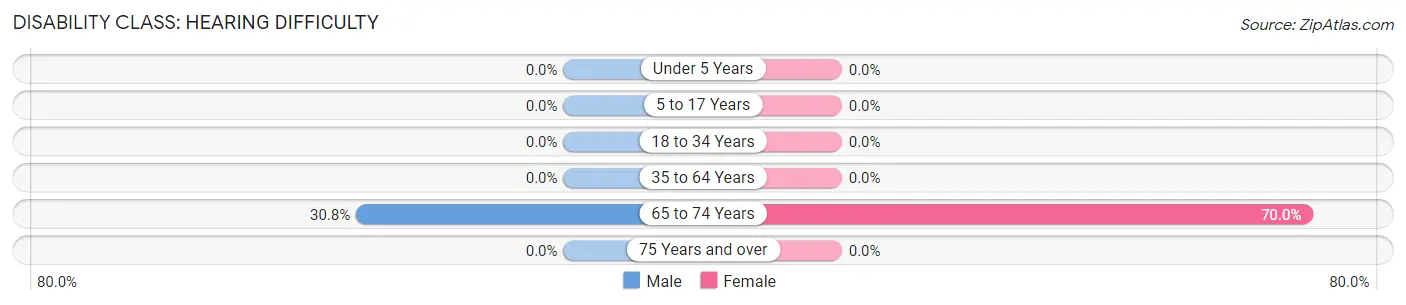
| Age Bracket | Male | Female |
| Under 5 Years | 0 (0.0%) | 0 (0.0%) |
| 5 to 17 Years | 0 (0.0%) | 0 (0.0%) |
| 18 to 34 Years | 0 (0.0%) | 0 (0.0%) |
| 35 to 64 Years | 0 (0.0%) | 0 (0.0%) |
| 65 to 74 Years | 4 (30.8%) | 14 (70.0%) |
| 75 Years and over | 0 (0.0%) | 0 (0.0%) |
Disability Class: Vision Difficulty
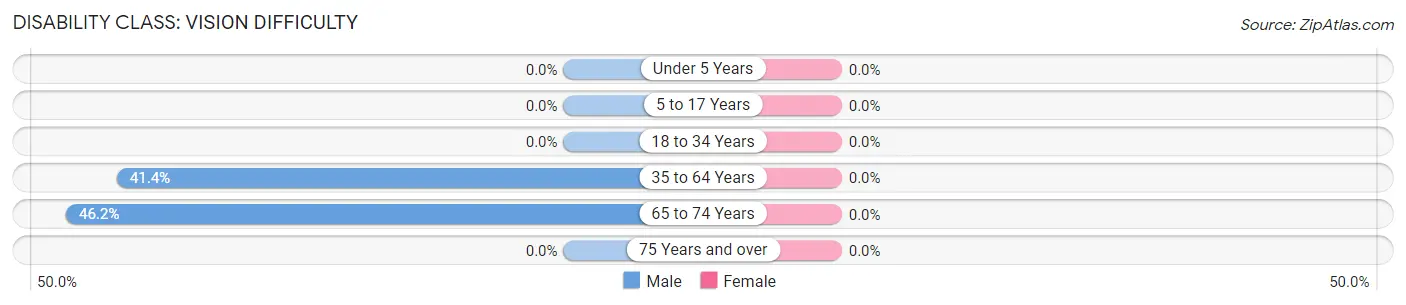
| Age Bracket | Male | Female |
| Under 5 Years | 0 (0.0%) | 0 (0.0%) |
| 5 to 17 Years | 0 (0.0%) | 0 (0.0%) |
| 18 to 34 Years | 0 (0.0%) | 0 (0.0%) |
| 35 to 64 Years | 29 (41.4%) | 0 (0.0%) |
| 65 to 74 Years | 6 (46.2%) | 0 (0.0%) |
| 75 Years and over | 0 (0.0%) | 0 (0.0%) |
Disability Class: Cognitive Difficulty
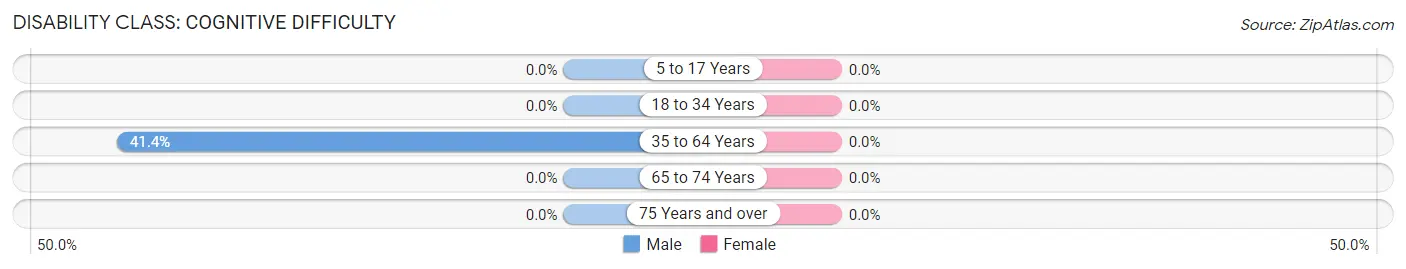
| Age Bracket | Male | Female |
| 5 to 17 Years | 0 (0.0%) | 0 (0.0%) |
| 18 to 34 Years | 0 (0.0%) | 0 (0.0%) |
| 35 to 64 Years | 29 (41.4%) | 0 (0.0%) |
| 65 to 74 Years | 0 (0.0%) | 0 (0.0%) |
| 75 Years and over | 0 (0.0%) | 0 (0.0%) |
Disability Class: Ambulatory Difficulty
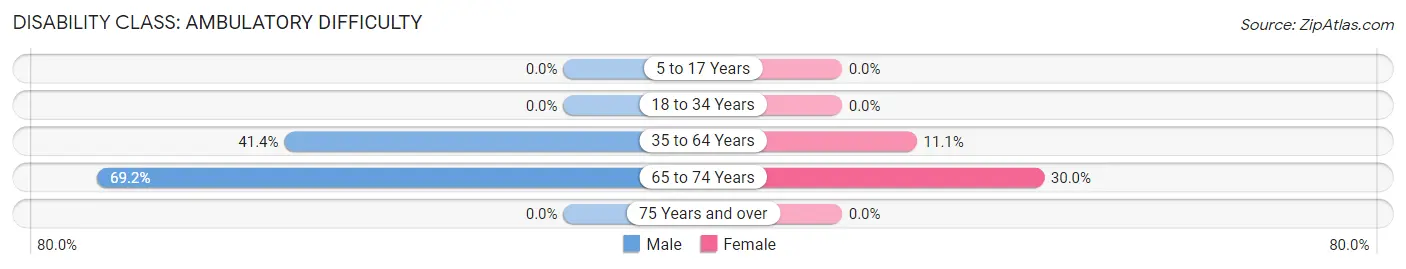
| Age Bracket | Male | Female |
| 5 to 17 Years | 0 (0.0%) | 0 (0.0%) |
| 18 to 34 Years | 0 (0.0%) | 0 (0.0%) |
| 35 to 64 Years | 29 (41.4%) | 6 (11.1%) |
| 65 to 74 Years | 9 (69.2%) | 6 (30.0%) |
| 75 Years and over | 0 (0.0%) | 0 (0.0%) |
Disability Class: Self-Care Difficulty
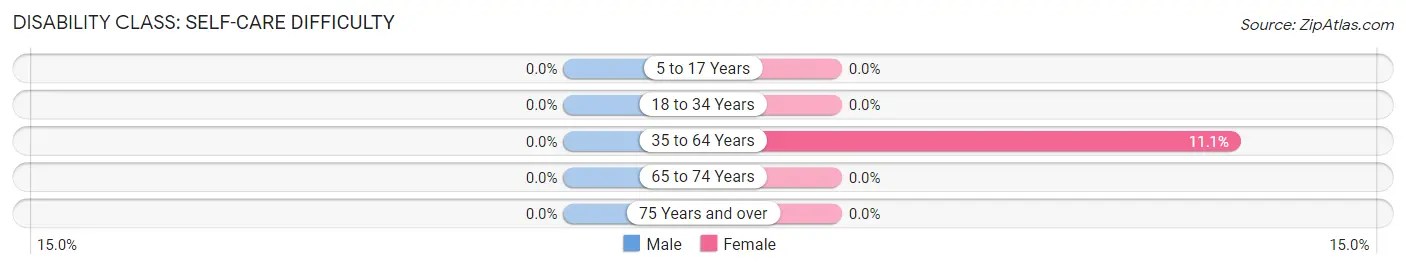
| Age Bracket | Male | Female |
| 5 to 17 Years | 0 (0.0%) | 0 (0.0%) |
| 18 to 34 Years | 0 (0.0%) | 0 (0.0%) |
| 35 to 64 Years | 0 (0.0%) | 6 (11.1%) |
| 65 to 74 Years | 0 (0.0%) | 0 (0.0%) |
| 75 Years and over | 0 (0.0%) | 0 (0.0%) |
Technology Access in Glen Acres
Computing Device Access in Glen Acres
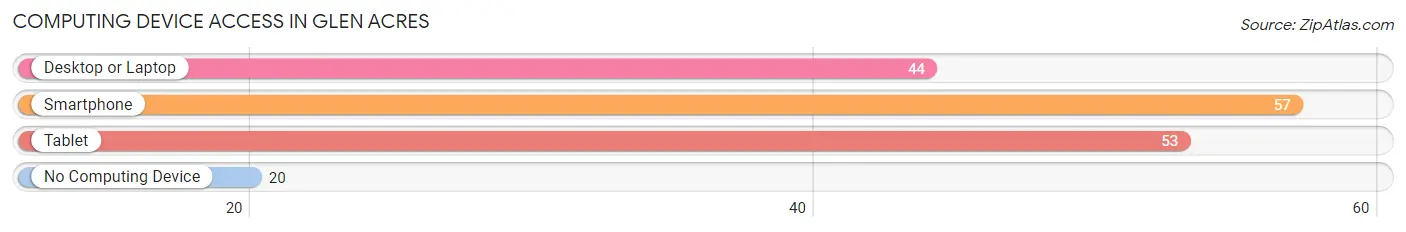
| Device Type | # Households | % Households |
| Desktop or Laptop | 44 | 57.1% |
| Smartphone | 57 | 74.0% |
| Tablet | 53 | 68.8% |
| No Computing Device | 20 | 26.0% |
| Total | 77 | 100.0% |
Internet Access in Glen Acres
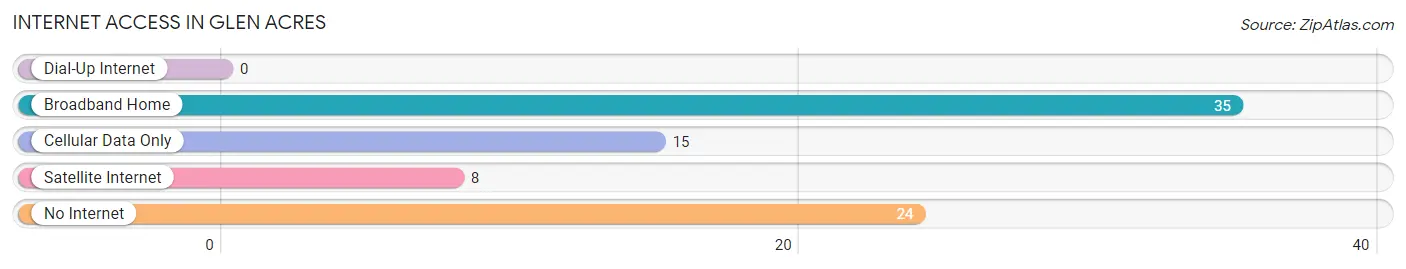
| Internet Type | # Households | % Households |
| Dial-Up Internet | 0 | 0.0% |
| Broadband Home | 35 | 45.5% |
| Cellular Data Only | 15 | 19.5% |
| Satellite Internet | 8 | 10.4% |
| No Internet | 24 | 31.2% |
| Total | 77 | 100.0% |
Glen Acres Summary
Glen Acres is a small unincorporated community located in the state of New Mexico. It is situated in the foothills of the Sangre de Cristo Mountains, approximately 25 miles south of Santa Fe. The community is home to a population of approximately 500 people, and is known for its rural charm and scenic beauty.
History
Glen Acres was founded in the late 1800s by a group of settlers from the Midwest. The settlers were attracted to the area by its abundant natural resources and its proximity to Santa Fe. The community was originally known as “Glen Acres” due to the abundance of oak trees in the area. The settlers built a small church and a general store, and the community quickly grew.
In the early 1900s, the community was home to a number of small businesses, including a blacksmith, a livery stable, and a saloon. The community also had a school, which was attended by the children of the settlers.
In the mid-1900s, the community began to decline as many of the settlers moved away. However, the community was revitalized in the late 1970s when a group of artists and craftspeople moved to the area. The artists and craftspeople opened a number of galleries and shops, which helped to attract tourists to the area.
Geography
Glen Acres is located in the foothills of the Sangre de Cristo Mountains, approximately 25 miles south of Santa Fe. The community is situated at an elevation of 6,000 feet, and is surrounded by rolling hills and lush forests. The area is known for its scenic beauty, and is home to a variety of wildlife, including deer, elk, and mountain lions.
Economy
The economy of Glen Acres is largely based on tourism. The community is home to a number of galleries and shops, which attract visitors from all over the world. The community is also home to a number of small businesses, including a general store, a restaurant, and a gas station.
Demographics
As of the 2010 census, the population of Glen Acres was 498. The racial makeup of the community was 94.2% White, 0.2% African American, 0.4% Native American, 0.2% Asian, 0.2% Pacific Islander, and 4.8% from other races. The median household income was $37,500, and the median age was 44.5 years. The community is predominantly Catholic, with a small number of other religious affiliations.
Common Questions
What is Per Capita Income in Glen Acres?
Per Capita income in Glen Acres is $28,445.
What is the Median Household income in Glen Acres?
Median Household Income in Glen Acres is $96,250.
What is Income or Wage Gap in Glen Acres?
Income or Wage Gap in Glen Acres is 70.3%.
Women in Glen Acres earn 29.7 cents for every dollar earned by a man.
What is Inequality or Gini Index in Glen Acres?
Inequality or Gini Index in Glen Acres is 0.22.
What is the Total Population of Glen Acres?
Total Population of Glen Acres is 306.
What is the Total Male Population of Glen Acres?
Total Male Population of Glen Acres is 122.
What is the Total Female Population of Glen Acres?
Total Female Population of Glen Acres is 184.
What is the Ratio of Males per 100 Females in Glen Acres?
There are 66.30 Males per 100 Females in Glen Acres.
What is the Ratio of Females per 100 Males in Glen Acres?
There are 150.82 Females per 100 Males in Glen Acres.
What is the Median Population Age in Glen Acres?
Median Population Age in Glen Acres is 40.9 Years.
What is the Average Family Size in Glen Acres
Average Family Size in Glen Acres is 4.1 People.
What is the Average Household Size in Glen Acres
Average Household Size in Glen Acres is 4.0 People.
How Large is the Labor Force in Glen Acres?
There are 155 People in the Labor Forcein in Glen Acres.
What is the Percentage of People in the Labor Force in Glen Acres?
59.6% of People are in the Labor Force in Glen Acres.
What is the Unemployment Rate in Glen Acres?
Unemployment Rate in Glen Acres is 8.4%.