Pilot Station, AK Map & Demographics
Pilot Station Map
Pilot Station Overview
$14,838
PER CAPITA INCOME
$38,750
AVG FAMILY INCOME
$41,964
AVG HOUSEHOLD INCOME
17.0%
WAGE / INCOME GAP [ % ]
83.0¢/ $1
WAGE / INCOME GAP [ $ ]
0.46
INEQUALITY / GINI INDEX
380
TOTAL POPULATION
208
MALE POPULATION
172
FEMALE POPULATION
120.93
MALES / 100 FEMALES
82.69
FEMALES / 100 MALES
23.4
MEDIAN AGE
4.1
AVG FAMILY SIZE
4.6
AVG HOUSEHOLD SIZE
133
LABOR FORCE [ PEOPLE ]
54.3%
PERCENT IN LABOR FORCE
21.1%
UNEMPLOYMENT RATE
Pilot Station Zip Codes
Pilot Station Area Codes
Income in Pilot Station
Income Overview in Pilot Station
Per Capita Income in Pilot Station is $14,838, while median incomes of families and households are $38,750 and $41,964 respectively.
| Characteristic | Number | Measure |
| Per Capita Income | 380 | $14,838 |
| Median Family Income | 83 | $38,750 |
| Mean Family Income | 83 | $49,358 |
| Median Household Income | 83 | $41,964 |
| Mean Household Income | 83 | $71,680 |
| Income Deficit | 83 | $0 |
| Wage / Income Gap (%) | 380 | 17.02% |
| Wage / Income Gap ($) | 380 | 82.98¢ per $1 |
| Gini / Inequality Index | 380 | 0.46 |
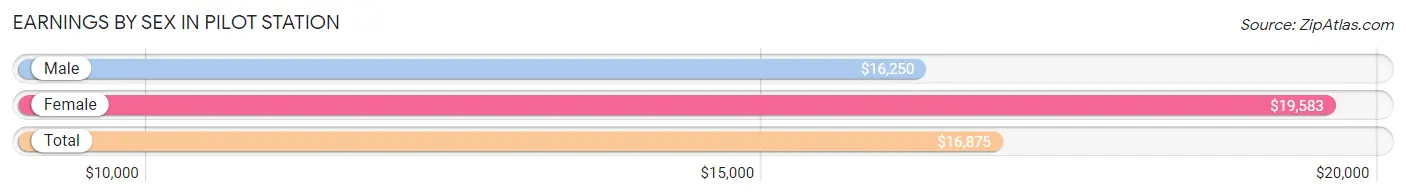
Earnings by Sex in Pilot Station
Average Earnings in Pilot Station are $16,875, $16,250 for men and $19,583 for women, a difference of 17.0%.
| Sex | Number | Average Earnings |
| Male | 88 (59.1%) | $16,250 |
| Female | 61 (40.9%) | $19,583 |
| Total | 149 (100.0%) | $16,875 |
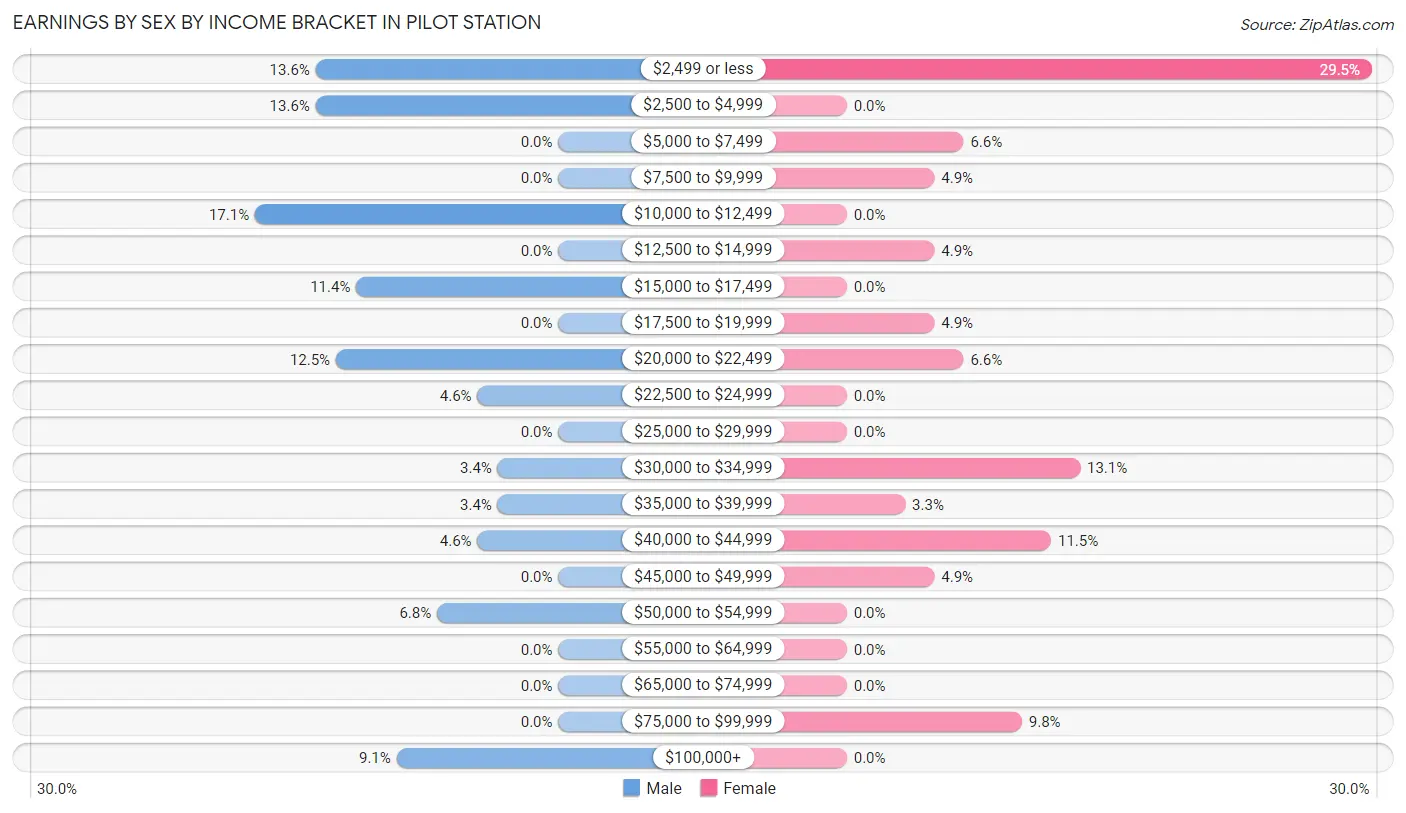
Earnings by Sex by Income Bracket in Pilot Station
The most common earnings brackets in Pilot Station are $10,000 to $12,499 for men (15 | 17.1%) and $2,499 or less for women (18 | 29.5%).
| Income | Male | Female |
| $2,499 or less | 12 (13.6%) | 18 (29.5%) |
| $2,500 to $4,999 | 12 (13.6%) | 0 (0.0%) |
| $5,000 to $7,499 | 0 (0.0%) | 4 (6.6%) |
| $7,500 to $9,999 | 0 (0.0%) | 3 (4.9%) |
| $10,000 to $12,499 | 15 (17.1%) | 0 (0.0%) |
| $12,500 to $14,999 | 0 (0.0%) | 3 (4.9%) |
| $15,000 to $17,499 | 10 (11.4%) | 0 (0.0%) |
| $17,500 to $19,999 | 0 (0.0%) | 3 (4.9%) |
| $20,000 to $22,499 | 11 (12.5%) | 4 (6.6%) |
| $22,500 to $24,999 | 4 (4.5%) | 0 (0.0%) |
| $25,000 to $29,999 | 0 (0.0%) | 0 (0.0%) |
| $30,000 to $34,999 | 3 (3.4%) | 8 (13.1%) |
| $35,000 to $39,999 | 3 (3.4%) | 2 (3.3%) |
| $40,000 to $44,999 | 4 (4.5%) | 7 (11.5%) |
| $45,000 to $49,999 | 0 (0.0%) | 3 (4.9%) |
| $50,000 to $54,999 | 6 (6.8%) | 0 (0.0%) |
| $55,000 to $64,999 | 0 (0.0%) | 0 (0.0%) |
| $65,000 to $74,999 | 0 (0.0%) | 0 (0.0%) |
| $75,000 to $99,999 | 0 (0.0%) | 6 (9.8%) |
| $100,000+ | 8 (9.1%) | 0 (0.0%) |
| Total | 88 (100.0%) | 61 (100.0%) |
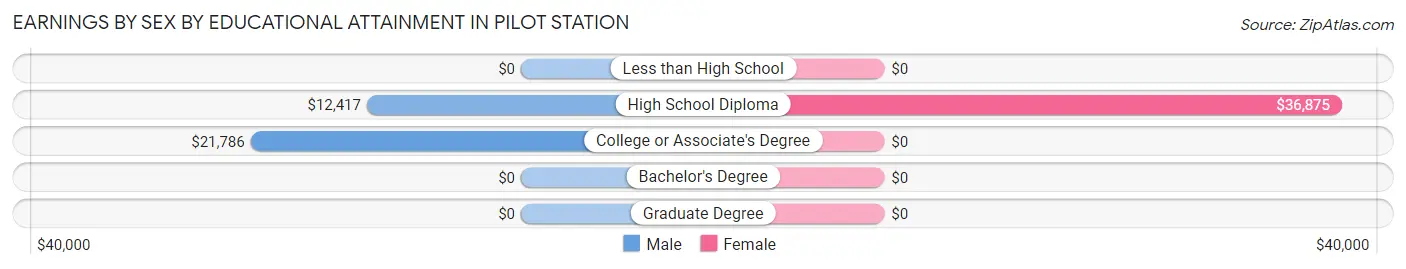
Earnings by Sex by Educational Attainment in Pilot Station
Average earnings in Pilot Station are $20,341 for men and $30,938 for women, a difference of 34.3%. Men with an educational attainment of college or associate's degree enjoy the highest average annual earnings of $21,786, while those with high school diploma education earn the least with $12,417. Women with an educational attainment of high school diploma earn the most with the average annual earnings of $36,875, while those with high school diploma education have the smallest earnings of $36,875.
| Educational Attainment | Male Income | Female Income |
| Less than High School | - | - |
| High School Diploma | $12,417 | $36,875 |
| College or Associate's Degree | $21,786 | $0 |
| Bachelor's Degree | - | - |
| Graduate Degree | - | - |
| Total | $20,341 | $30,938 |
Family Income in Pilot Station
Family Income Brackets in Pilot Station
According to the Pilot Station family income data, there are 18 families falling into the $35,000 to $49,999 income range, which is the most common income bracket and makes up 21.7% of all families.
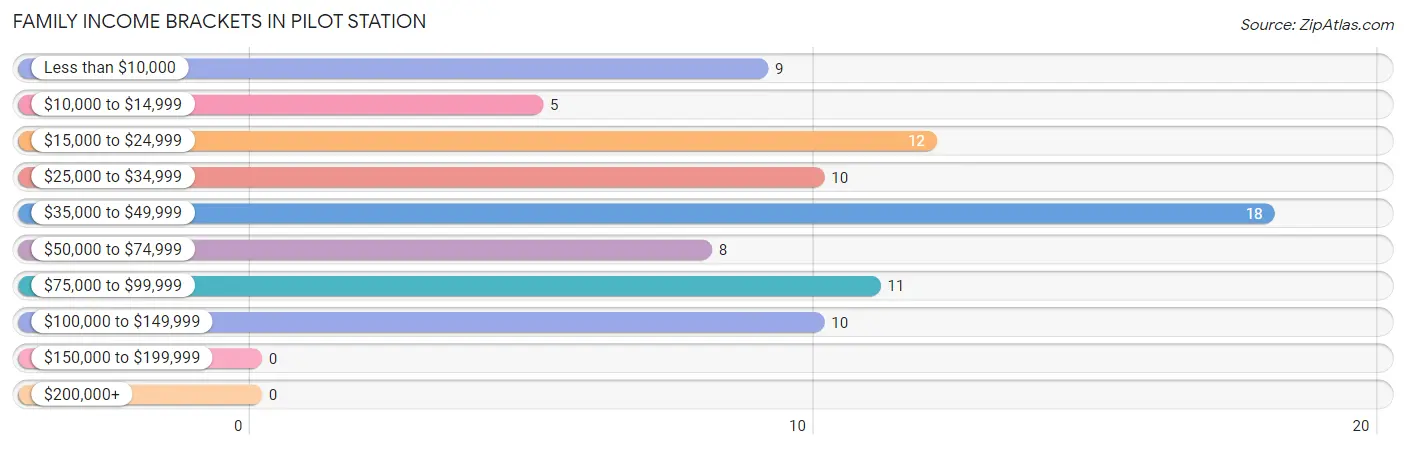
| Income Bracket | # Families | % Families |
| Less than $10,000 | 9 | 10.8% |
| $10,000 to $14,999 | 5 | 6.0% |
| $15,000 to $24,999 | 12 | 14.5% |
| $25,000 to $34,999 | 10 | 12.0% |
| $35,000 to $49,999 | 18 | 21.7% |
| $50,000 to $74,999 | 8 | 9.6% |
| $75,000 to $99,999 | 11 | 13.3% |
| $100,000 to $149,999 | 10 | 12.0% |
| $150,000 to $199,999 | 0 | 0.0% |
| $200,000+ | 0 | 0.0% |
Family Income by Famaliy Size in Pilot Station
5-person families (26 | 31.3%) account for the highest median family income in Pilot Station with $56,250 per family, while 2-person families (24 | 28.9%) have the highest median income of $12,500 per family member.
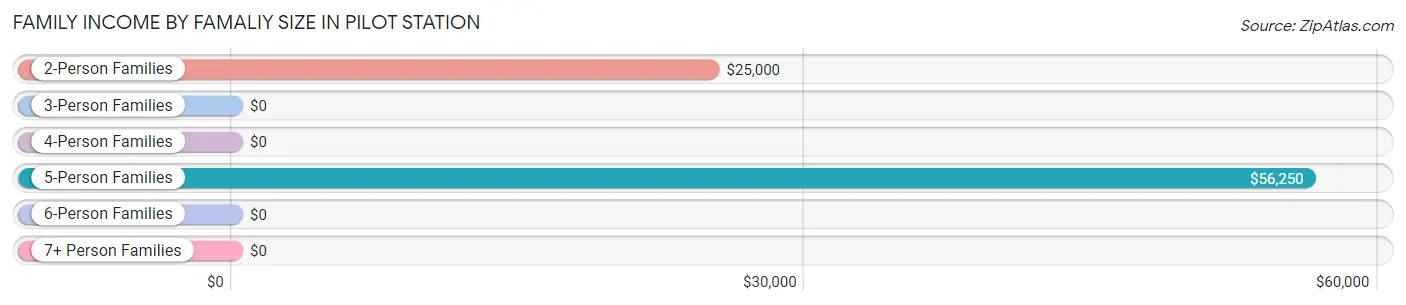
| Income Bracket | # Families | Median Income |
| 2-Person Families | 24 (28.9%) | $25,000 |
| 3-Person Families | 8 (9.6%) | $0 |
| 4-Person Families | 11 (13.3%) | $0 |
| 5-Person Families | 26 (31.3%) | $56,250 |
| 6-Person Families | 3 (3.6%) | $0 |
| 7+ Person Families | 11 (13.3%) | $0 |
| Total | 83 (100.0%) | $38,750 |
Family Income by Number of Earners in Pilot Station
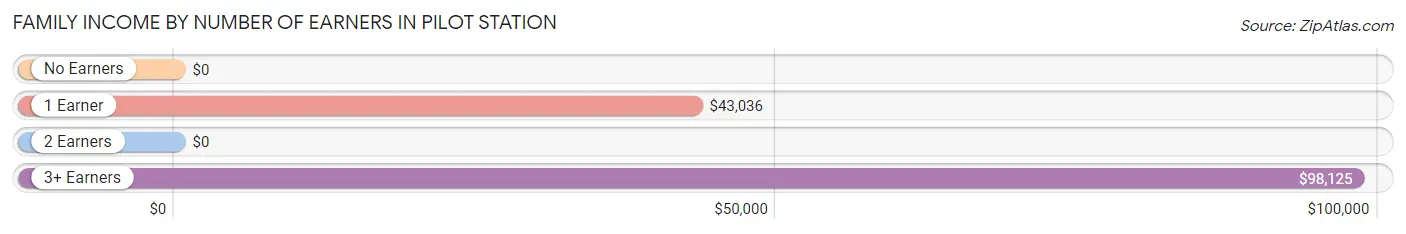
| Number of Earners | # Families | Median Income |
| No Earners | 23 (27.7%) | $0 |
| 1 Earner | 27 (32.5%) | $43,036 |
| 2 Earners | 13 (15.7%) | $0 |
| 3+ Earners | 20 (24.1%) | $98,125 |
| Total | 83 (100.0%) | $38,750 |
Household Income in Pilot Station
Household Income Brackets in Pilot Station
With 25 households falling in the category, the $35,000 to $49,999 income range is the most frequent in Pilot Station, accounting for 30.1% of all households.
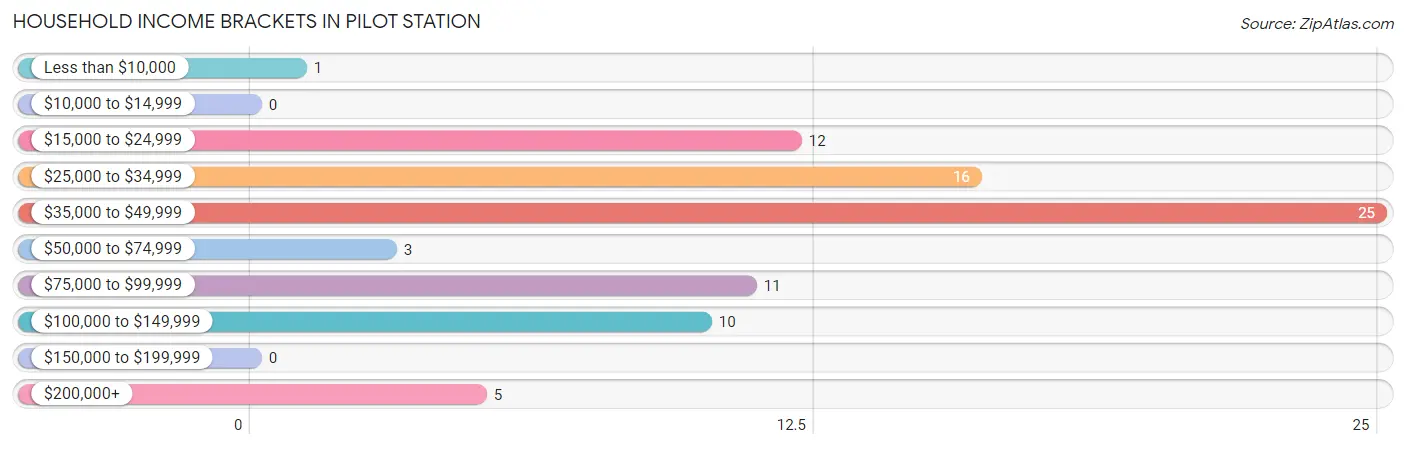
| Income Bracket | # Households | % Households |
| Less than $10,000 | 1 | 1.2% |
| $10,000 to $14,999 | 0 | 0.0% |
| $15,000 to $24,999 | 12 | 14.5% |
| $25,000 to $34,999 | 16 | 19.3% |
| $35,000 to $49,999 | 25 | 30.1% |
| $50,000 to $74,999 | 3 | 3.6% |
| $75,000 to $99,999 | 11 | 13.3% |
| $100,000 to $149,999 | 10 | 12.0% |
| $150,000 to $199,999 | 0 | 0.0% |
| $200,000+ | 5 | 6.0% |
Household Income by Householder Age in Pilot Station
The median household income in Pilot Station is $41,964, with the highest median household income of $81,875 found in the 45 to 64 years age bracket for the primary householder. A total of 23 households (27.7%) fall into this category.
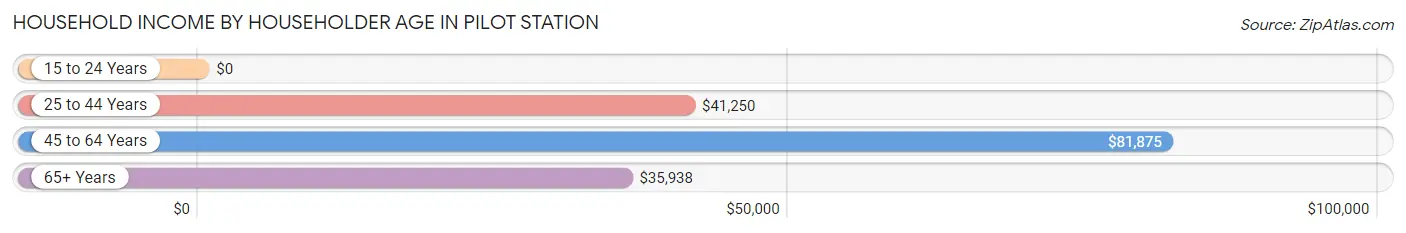
| Income Bracket | # Households | Median Income |
| 15 to 24 Years | 0 (0.0%) | $0 |
| 25 to 44 Years | 35 (42.2%) | $41,250 |
| 45 to 64 Years | 23 (27.7%) | $81,875 |
| 65+ Years | 25 (30.1%) | $35,938 |
| Total | 83 (100.0%) | $41,964 |
Poverty in Pilot Station
Income Below Poverty by Sex and Age in Pilot Station
With 39.9% poverty level for males and 38.7% for females among the residents of Pilot Station, 16 and 17 year old males and 12 to 14 year old females are the most vulnerable to poverty, with 4 males (100.0%) and 11 females (73.3%) in their respective age groups living below the poverty level.
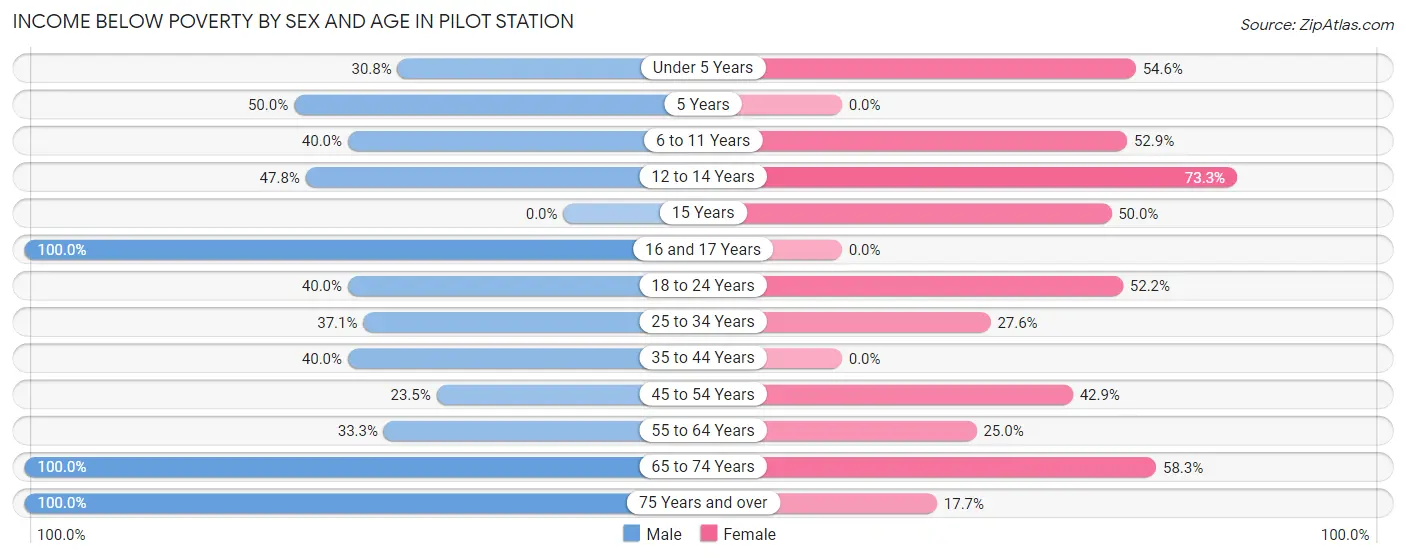
| Age Bracket | Male | Female |
| Under 5 Years | 8 (30.8%) | 6 (54.5%) |
| 5 Years | 4 (50.0%) | 0 (0.0%) |
| 6 to 11 Years | 4 (40.0%) | 9 (52.9%) |
| 12 to 14 Years | 11 (47.8%) | 11 (73.3%) |
| 15 Years | 0 (0.0%) | 3 (50.0%) |
| 16 and 17 Years | 4 (100.0%) | 0 (0.0%) |
| 18 to 24 Years | 12 (40.0%) | 12 (52.2%) |
| 25 to 34 Years | 13 (37.1%) | 8 (27.6%) |
| 35 to 44 Years | 10 (40.0%) | 0 (0.0%) |
| 45 to 54 Years | 4 (23.5%) | 3 (42.9%) |
| 55 to 64 Years | 3 (33.3%) | 3 (25.0%) |
| 65 to 74 Years | 5 (100.0%) | 7 (58.3%) |
| 75 Years and over | 1 (100.0%) | 3 (17.6%) |
| Total | 79 (39.9%) | 65 (38.7%) |
Income Above Poverty by Sex and Age in Pilot Station
According to the poverty statistics in Pilot Station, males aged 15 years and females aged 16 and 17 years are the age groups that are most secure financially, with 100.0% of males and 100.0% of females in these age groups living above the poverty line.
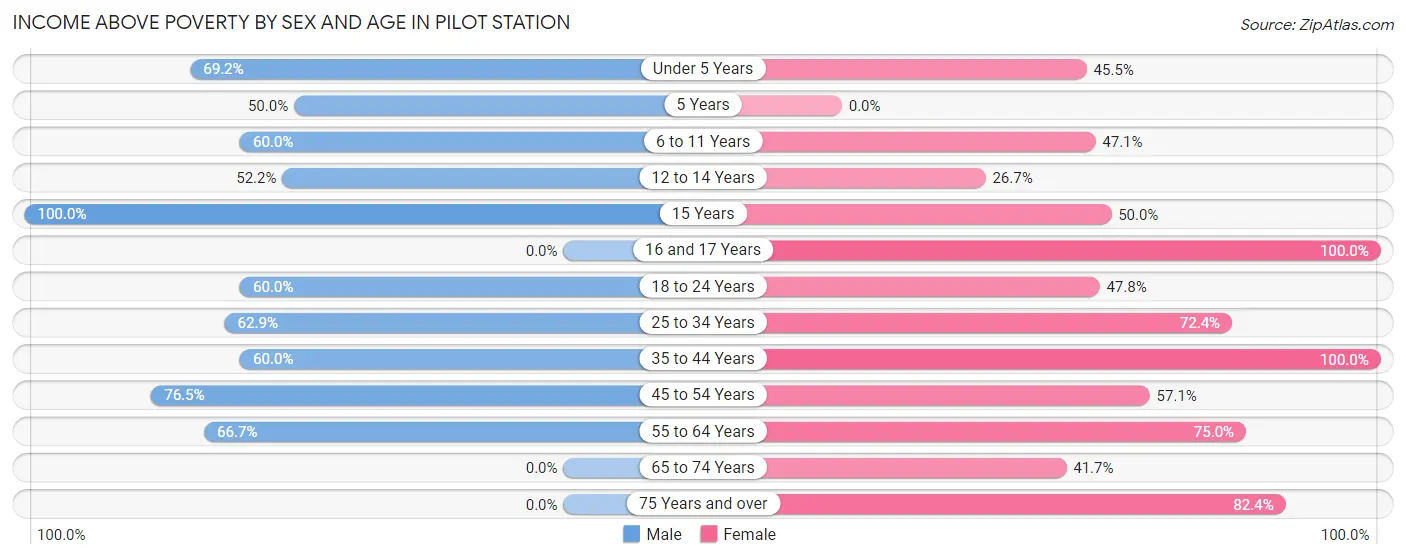
| Age Bracket | Male | Female |
| Under 5 Years | 18 (69.2%) | 5 (45.5%) |
| 5 Years | 4 (50.0%) | 0 (0.0%) |
| 6 to 11 Years | 6 (60.0%) | 8 (47.1%) |
| 12 to 14 Years | 12 (52.2%) | 4 (26.7%) |
| 15 Years | 5 (100.0%) | 3 (50.0%) |
| 16 and 17 Years | 0 (0.0%) | 6 (100.0%) |
| 18 to 24 Years | 18 (60.0%) | 11 (47.8%) |
| 25 to 34 Years | 22 (62.9%) | 21 (72.4%) |
| 35 to 44 Years | 15 (60.0%) | 13 (100.0%) |
| 45 to 54 Years | 13 (76.5%) | 4 (57.1%) |
| 55 to 64 Years | 6 (66.7%) | 9 (75.0%) |
| 65 to 74 Years | 0 (0.0%) | 5 (41.7%) |
| 75 Years and over | 0 (0.0%) | 14 (82.4%) |
| Total | 119 (60.1%) | 103 (61.3%) |
Income Below Poverty Among Married-Couple Families in Pilot Station
The poverty statistics for married-couple families in Pilot Station show that 35.1% or 13 of the total 37 families live below the poverty line. Families with 3 or 4 children have the highest poverty rate of 57.1%, comprising of 4 families. On the other hand, families with 5 or more children have the lowest poverty rate of 0.0%, which includes 0 families.
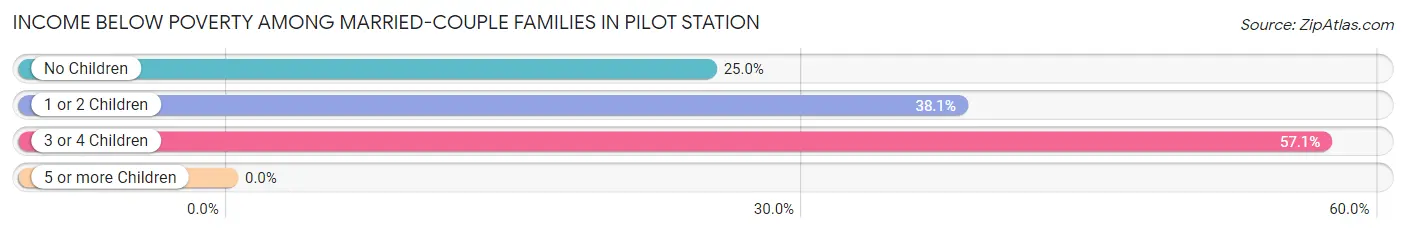
| Children | Above Poverty | Below Poverty |
| No Children | 3 (75.0%) | 1 (25.0%) |
| 1 or 2 Children | 13 (61.9%) | 8 (38.1%) |
| 3 or 4 Children | 3 (42.9%) | 4 (57.1%) |
| 5 or more Children | 5 (100.0%) | 0 (0.0%) |
| Total | 24 (64.9%) | 13 (35.1%) |
Income Below Poverty Among Single-Parent Households in Pilot Station
According to the poverty data in Pilot Station, 58.8% or 10 single-father households and 17.2% or 5 single-mother households are living below the poverty line. Among single-father households, those with 1 or 2 children have the highest poverty rate, with 10 households (100.0%) experiencing poverty. Likewise, among single-mother households, those with 3 or 4 children have the highest poverty rate, with 3 households (100.0%) falling below the poverty line.
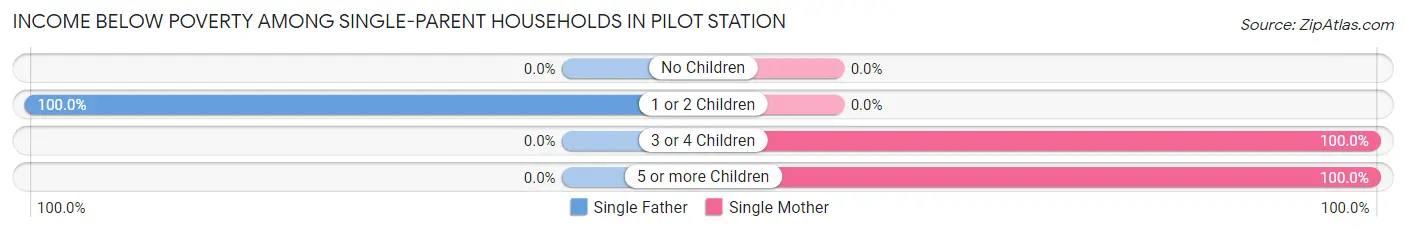
| Children | Single Father | Single Mother |
| No Children | 0 (0.0%) | 0 (0.0%) |
| 1 or 2 Children | 10 (100.0%) | 0 (0.0%) |
| 3 or 4 Children | 0 (0.0%) | 3 (100.0%) |
| 5 or more Children | 0 (0.0%) | 2 (100.0%) |
| Total | 10 (58.8%) | 5 (17.2%) |
Income Below Poverty Among Married-Couple vs Single-Parent Households in Pilot Station
The poverty data for Pilot Station shows that 13 of the married-couple family households (35.1%) and 15 of the single-parent households (32.6%) are living below the poverty level. Within the married-couple family households, those with 3 or 4 children have the highest poverty rate, with 4 households (57.1%) falling below the poverty line. Among the single-parent households, those with 3 or 4 children have the highest poverty rate, with 3 household (100.0%) living below poverty.
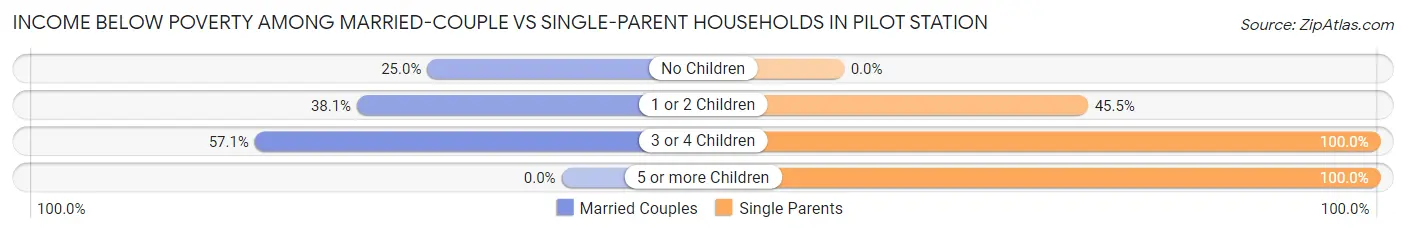
| Children | Married-Couple Families | Single-Parent Households |
| No Children | 1 (25.0%) | 0 (0.0%) |
| 1 or 2 Children | 8 (38.1%) | 10 (45.5%) |
| 3 or 4 Children | 4 (57.1%) | 3 (100.0%) |
| 5 or more Children | 0 (0.0%) | 2 (100.0%) |
| Total | 13 (35.1%) | 15 (32.6%) |
Race in Pilot Station
The most populous races in Pilot Station are Native / Alaskan (363 | 95.5%), and Two or more Races (17 | 4.5%).
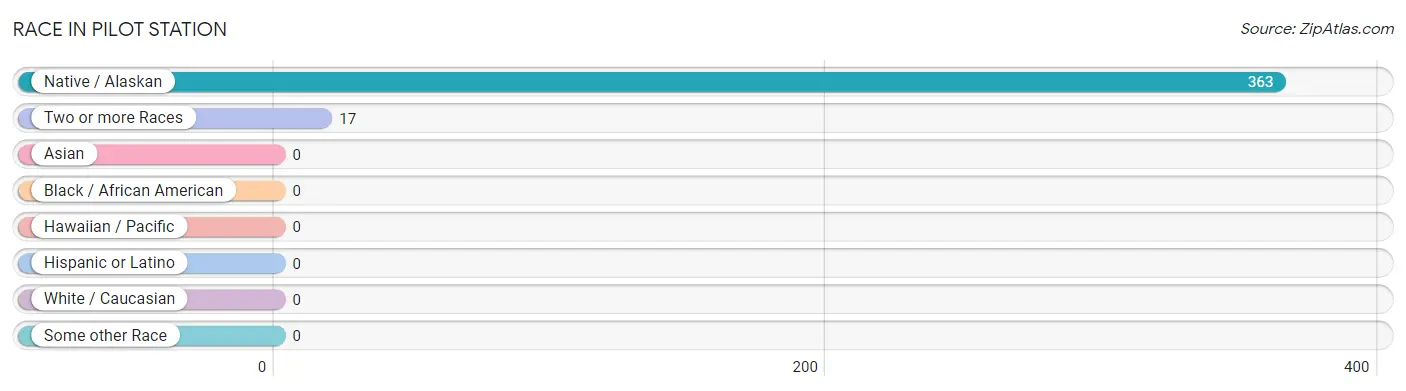
| Race | # Population | % Population |
| Asian | 0 | 0.0% |
| Black / African American | 0 | 0.0% |
| Hawaiian / Pacific | 0 | 0.0% |
| Hispanic or Latino | 0 | 0.0% |
| Native / Alaskan | 363 | 95.5% |
| White / Caucasian | 0 | 0.0% |
| Two or more Races | 17 | 4.5% |
| Some other Race | 0 | 0.0% |
| Total | 380 | 100.0% |
Ancestry in Pilot Station
The most populous ancestries reported in Pilot Station are Yup'ik (277 | 72.9%), Alaska Native (86 | 22.6%), and English (2 | 0.5%), together accounting for 96.1% of all Pilot Station residents.
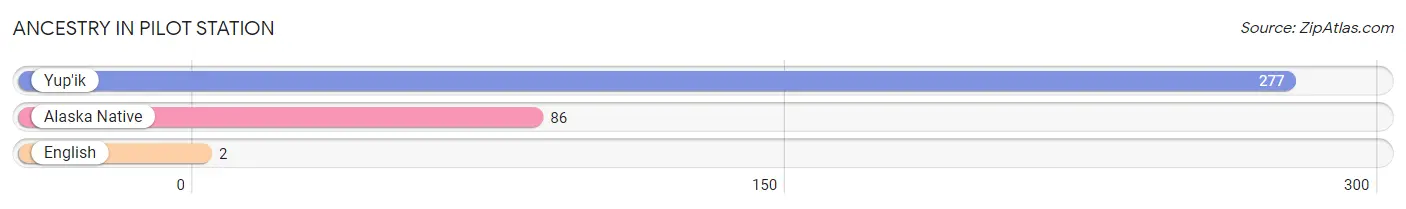
| Ancestry | # Population | % Population |
| Alaska Native | 86 | 22.6% |
| English | 2 | 0.5% |
| Yup'ik | 277 | 72.9% | View All 3 Rows |
Immigrants in Pilot Station

| Immigration Origin | # Population | % Population | View All 0 Rows |
Sex and Age in Pilot Station
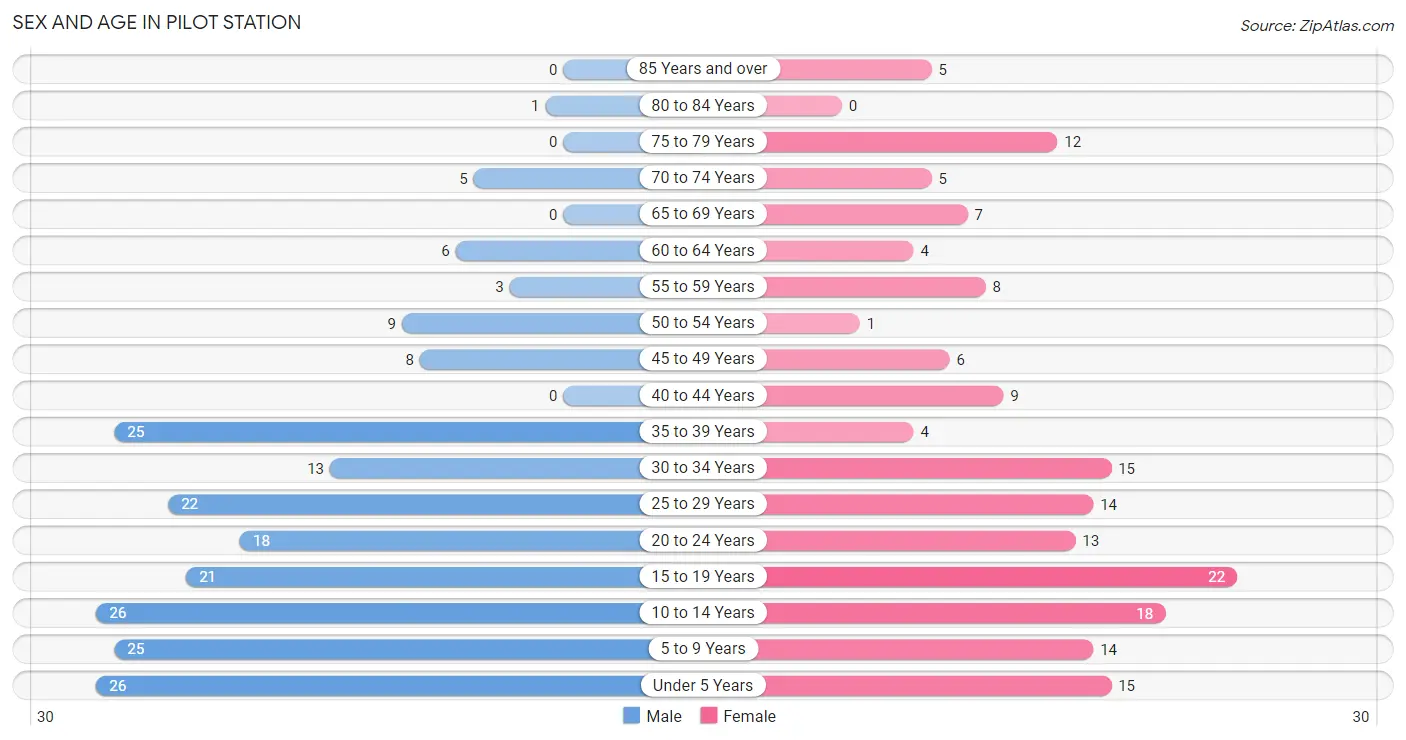
Sex and Age in Pilot Station
The most populous age groups in Pilot Station are Under 5 Years (26 | 12.5%) for men and 15 to 19 Years (22 | 12.8%) for women.
| Age Bracket | Male | Female |
| Under 5 Years | 26 (12.5%) | 15 (8.7%) |
| 5 to 9 Years | 25 (12.0%) | 14 (8.1%) |
| 10 to 14 Years | 26 (12.5%) | 18 (10.5%) |
| 15 to 19 Years | 21 (10.1%) | 22 (12.8%) |
| 20 to 24 Years | 18 (8.6%) | 13 (7.6%) |
| 25 to 29 Years | 22 (10.6%) | 14 (8.1%) |
| 30 to 34 Years | 13 (6.2%) | 15 (8.7%) |
| 35 to 39 Years | 25 (12.0%) | 4 (2.3%) |
| 40 to 44 Years | 0 (0.0%) | 9 (5.2%) |
| 45 to 49 Years | 8 (3.8%) | 6 (3.5%) |
| 50 to 54 Years | 9 (4.3%) | 1 (0.6%) |
| 55 to 59 Years | 3 (1.4%) | 8 (4.6%) |
| 60 to 64 Years | 6 (2.9%) | 4 (2.3%) |
| 65 to 69 Years | 0 (0.0%) | 7 (4.1%) |
| 70 to 74 Years | 5 (2.4%) | 5 (2.9%) |
| 75 to 79 Years | 0 (0.0%) | 12 (7.0%) |
| 80 to 84 Years | 1 (0.5%) | 0 (0.0%) |
| 85 Years and over | 0 (0.0%) | 5 (2.9%) |
| Total | 208 (100.0%) | 172 (100.0%) |
Families and Households in Pilot Station
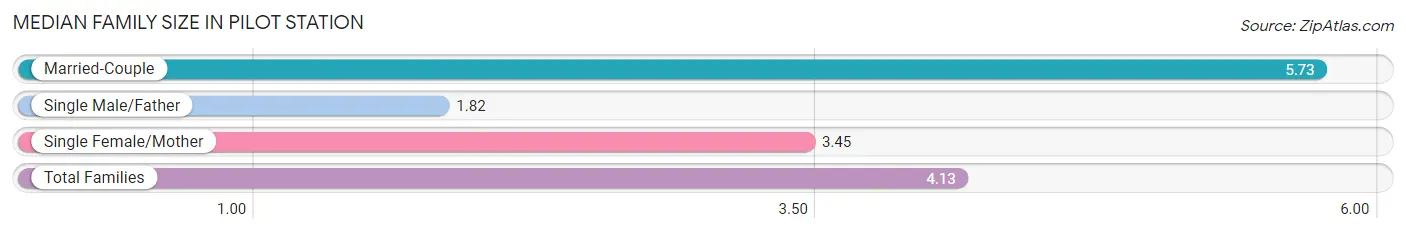
Median Family Size in Pilot Station
The median family size in Pilot Station is 4.13 persons per family, with married-couple families (37 | 44.6%) accounting for the largest median family size of 5.73 persons per family. On the other hand, single male/father families (17 | 20.5%) represent the smallest median family size with 1.82 persons per family.
| Family Type | # Families | Family Size |
| Married-Couple | 37 (44.6%) | 5.73 |
| Single Male/Father | 17 (20.5%) | 1.82 |
| Single Female/Mother | 29 (34.9%) | 3.45 |
| Total Families | 83 (100.0%) | 4.13 |
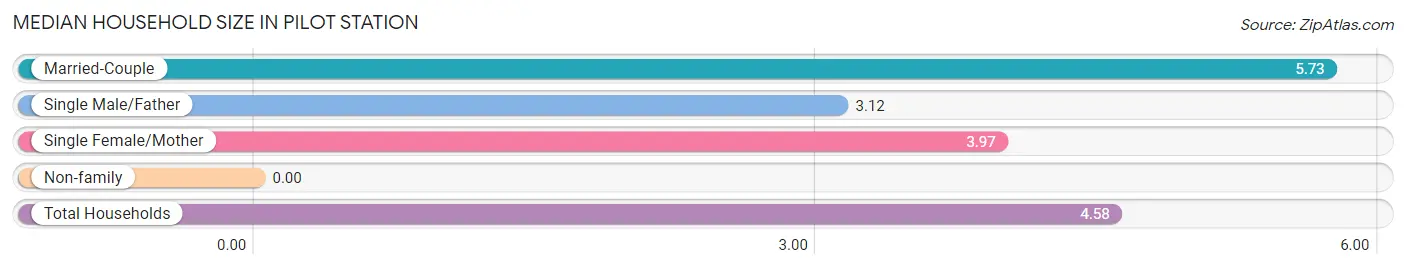
Median Household Size in Pilot Station
| Household Type | # Households | Household Size |
| Married-Couple | 37 (44.6%) | 5.73 |
| Single Male/Father | 17 (20.5%) | 3.12 |
| Single Female/Mother | 29 (34.9%) | 3.97 |
| Non-family | 0 (0.0%) | - |
| Total Households | 83 (100.0%) | 4.58 |
Household Size by Marriage Status in Pilot Station
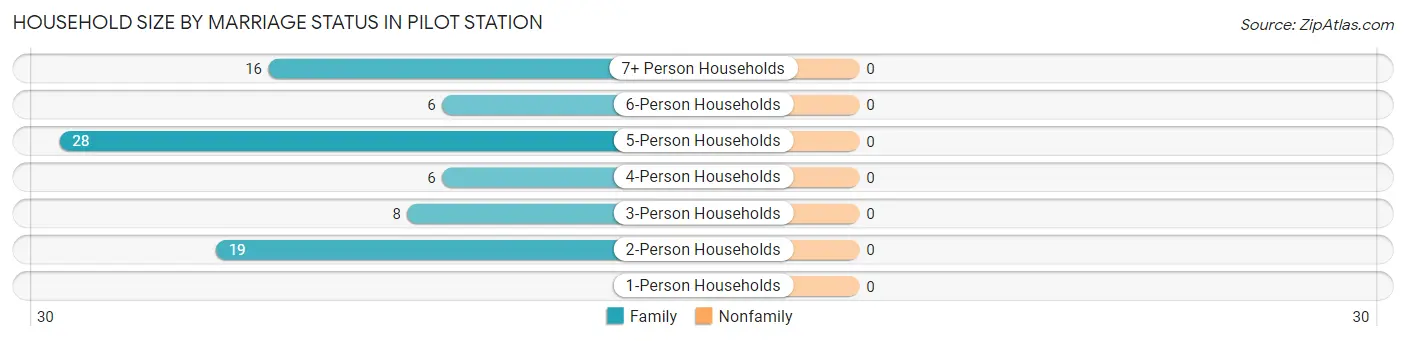
| Household Size | Family Households | Nonfamily Households |
| 1-Person Households | - | 0 (0.0%) |
| 2-Person Households | 19 (22.9%) | 0 (0.0%) |
| 3-Person Households | 8 (9.6%) | 0 (0.0%) |
| 4-Person Households | 6 (7.2%) | 0 (0.0%) |
| 5-Person Households | 28 (33.7%) | 0 (0.0%) |
| 6-Person Households | 6 (7.2%) | 0 (0.0%) |
| 7+ Person Households | 16 (19.3%) | 0 (0.0%) |
| Total | 83 (100.0%) | 0 (0.0%) |
Female Fertility in Pilot Station
Fertility by Age in Pilot Station
Average fertility rate in Pilot Station is 60.0 births per 1,000 women. Women in the age bracket of 15 to 19 years have the highest fertility rate with 91.0 births per 1,000 women. Women in the age bracket of 20 to 34 years acount for 60.0% of all women with births.
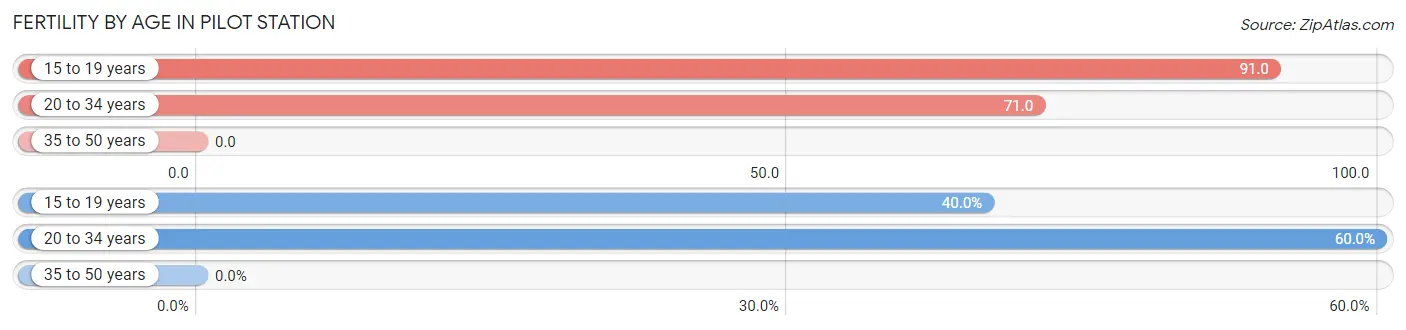
| Age Bracket | Women with Births | Births / 1,000 Women |
| 15 to 19 years | 2 (40.0%) | 91.0 |
| 20 to 34 years | 3 (60.0%) | 71.0 |
| 35 to 50 years | 0 (0.0%) | 0.0 |
| Total | 5 (100.0%) | 60.0 |
Fertility by Age by Marriage Status in Pilot Station
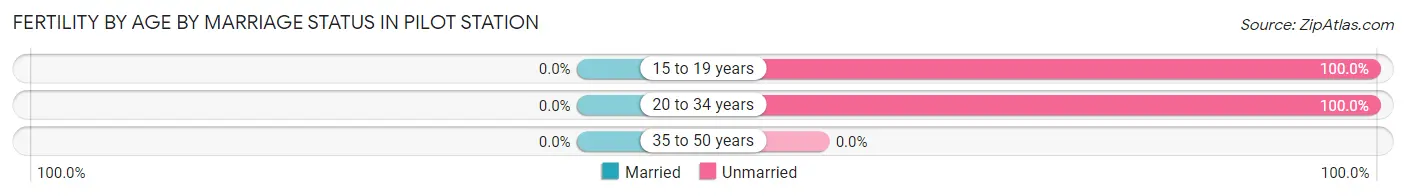
| Age Bracket | Married | Unmarried |
| 15 to 19 years | 0 (0.0%) | 2 (100.0%) |
| 20 to 34 years | 0 (0.0%) | 3 (100.0%) |
| 35 to 50 years | 0 (0.0%) | 0 (0.0%) |
| Total | 0 (0.0%) | 5 (100.0%) |
Fertility by Education in Pilot Station
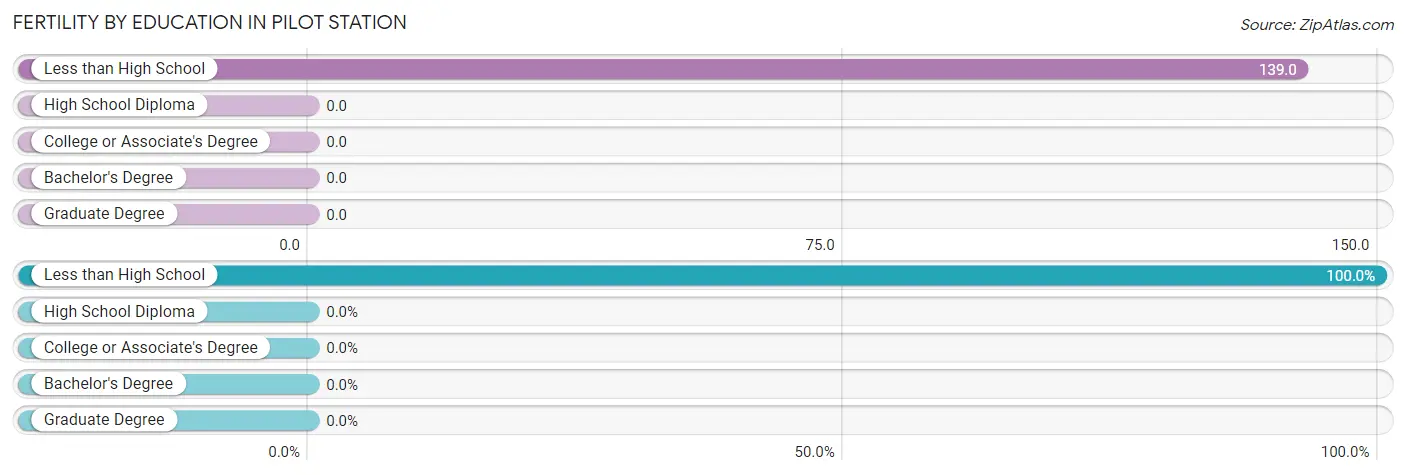
| Educational Attainment | Women with Births | Births / 1,000 Women |
| Less than High School | 5 (100.0%) | 139.0 |
| High School Diploma | 0 (0.0%) | 0.0 |
| College or Associate's Degree | 0 (0.0%) | 0.0 |
| Bachelor's Degree | 0 (0.0%) | 0.0 |
| Graduate Degree | 0 (0.0%) | 0.0 |
| Total | 5 (100.0%) | 60.0 |
Fertility by Education by Marriage Status in Pilot Station
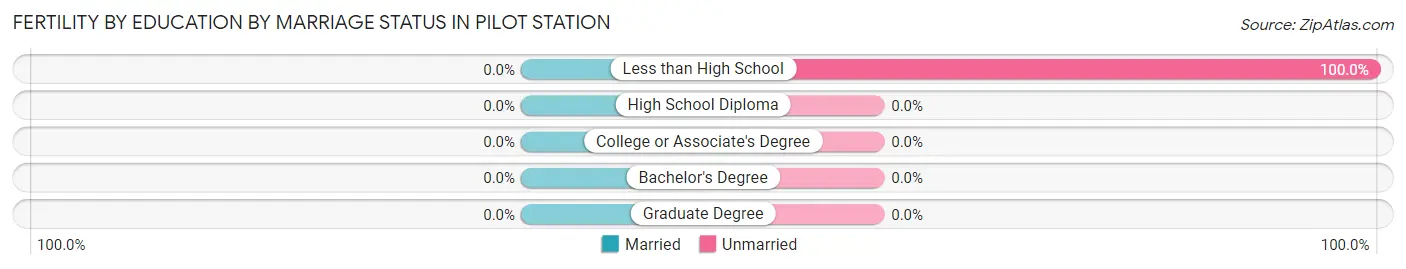
| Educational Attainment | Married | Unmarried |
| Less than High School | 0 (0.0%) | 5 (100.0%) |
| High School Diploma | 0 (0.0%) | 0 (0.0%) |
| College or Associate's Degree | 0 (0.0%) | 0 (0.0%) |
| Bachelor's Degree | 0 (0.0%) | 0 (0.0%) |
| Graduate Degree | 0 (0.0%) | 0 (0.0%) |
| Total | 0 (0.0%) | 5 (100.0%) |
Employment Characteristics in Pilot Station
Employment by Class of Employer in Pilot Station
Among the 102 employed individuals in Pilot Station, local government employees (44 | 43.1%), private company employees (29 | 28.4%), and not-for-profit organizations (12 | 11.8%) make up the most common classes of employment.
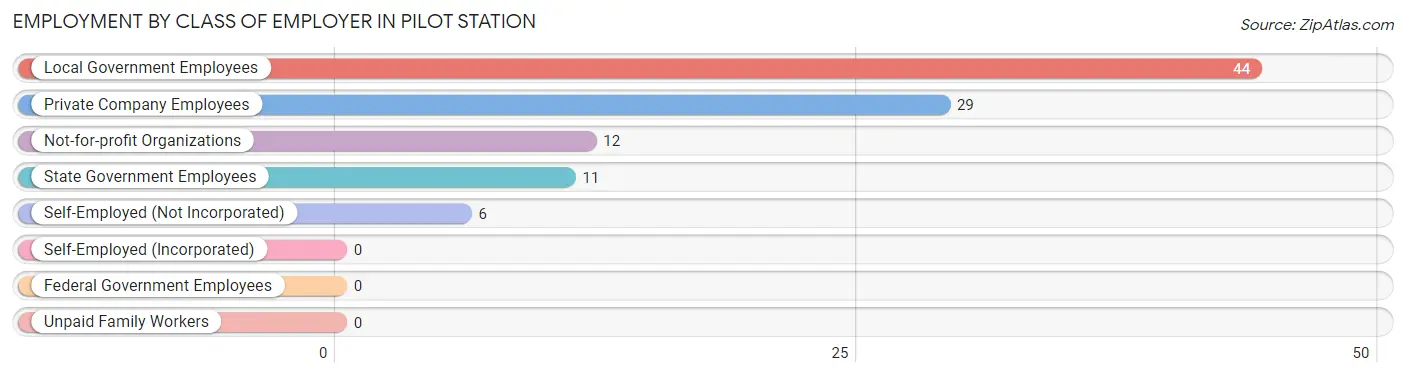
| Employer Class | # Employees | % Employees |
| Private Company Employees | 29 | 28.4% |
| Self-Employed (Incorporated) | 0 | 0.0% |
| Self-Employed (Not Incorporated) | 6 | 5.9% |
| Not-for-profit Organizations | 12 | 11.8% |
| Local Government Employees | 44 | 43.1% |
| State Government Employees | 11 | 10.8% |
| Federal Government Employees | 0 | 0.0% |
| Unpaid Family Workers | 0 | 0.0% |
| Total | 102 | 100.0% |
Employment Status by Age in Pilot Station
According to the labor force statistics for Pilot Station, out of the total population over 16 years of age (245), 54.3% or 133 individuals are in the labor force, with 21.1% or 28 of them unemployed. The age group with the highest labor force participation rate is 35 to 44 years, with 89.5% or 34 individuals in the labor force. Within the labor force, the 30 to 34 years age range has the highest percentage of unemployed individuals, with 45.5% or 10 of them being unemployed.
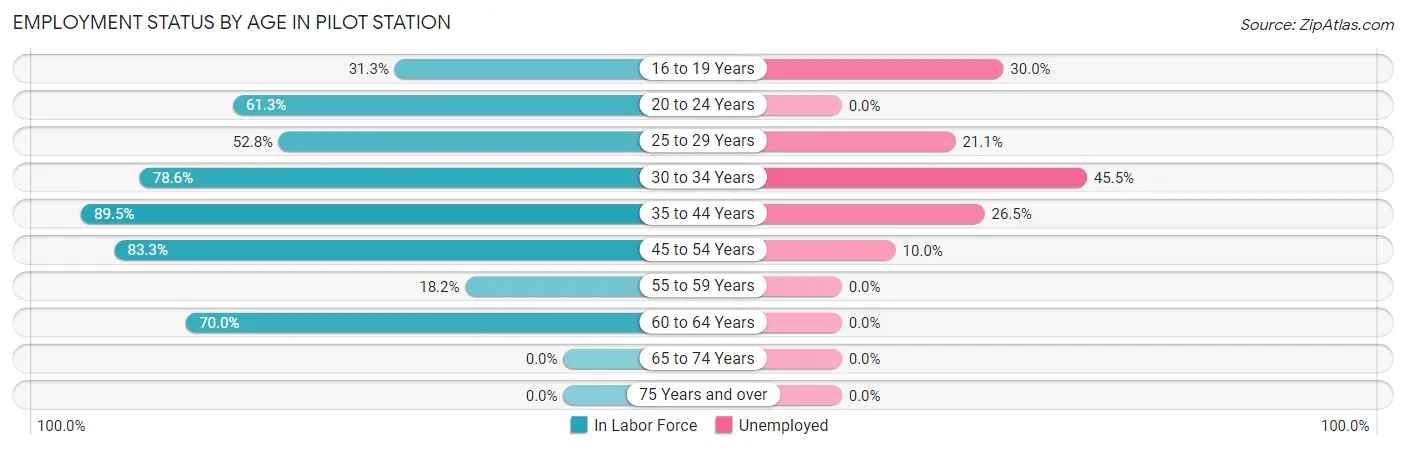
| Age Bracket | In Labor Force | Unemployed |
| 16 to 19 Years | 10 (31.3%) | 3 (30.0%) |
| 20 to 24 Years | 19 (61.3%) | 0 (0.0%) |
| 25 to 29 Years | 19 (52.8%) | 4 (21.1%) |
| 30 to 34 Years | 22 (78.6%) | 10 (45.5%) |
| 35 to 44 Years | 34 (89.5%) | 9 (26.5%) |
| 45 to 54 Years | 20 (83.3%) | 2 (10.0%) |
| 55 to 59 Years | 2 (18.2%) | 0 (0.0%) |
| 60 to 64 Years | 7 (70.0%) | 0 (0.0%) |
| 65 to 74 Years | 0 (0.0%) | 0 (0.0%) |
| 75 Years and over | 0 (0.0%) | 0 (0.0%) |
| Total | 133 (54.3%) | 28 (21.1%) |
Employment Status by Educational Attainment in Pilot Station
According to labor force statistics for Pilot Station, 70.7% of individuals (104) out of the total population between 25 and 64 years of age (147) are in the labor force, with 24.0% or 25 of them being unemployed. The group with the highest labor force participation rate are those with the educational attainment of bachelor's degree or higher, with 100.0% or 4 individuals in the labor force. Within the labor force, individuals with less than high school education have the highest percentage of unemployment, with 50.0% or 11 of them being unemployed.
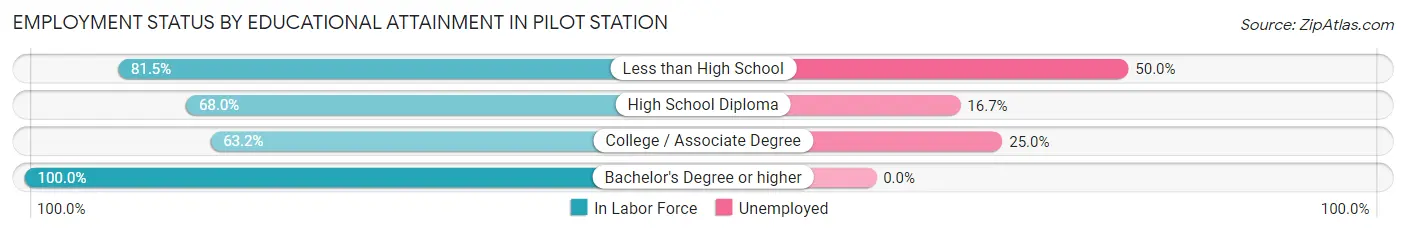
| Educational Attainment | In Labor Force | Unemployed |
| Less than High School | 22 (81.5%) | 14 (50.0%) |
| High School Diploma | 66 (68.0%) | 16 (16.7%) |
| College / Associate Degree | 12 (63.2%) | 5 (25.0%) |
| Bachelor's Degree or higher | 4 (100.0%) | 0 (0.0%) |
| Total | 104 (70.7%) | 35 (24.0%) |
Employment Occupations by Sex in Pilot Station
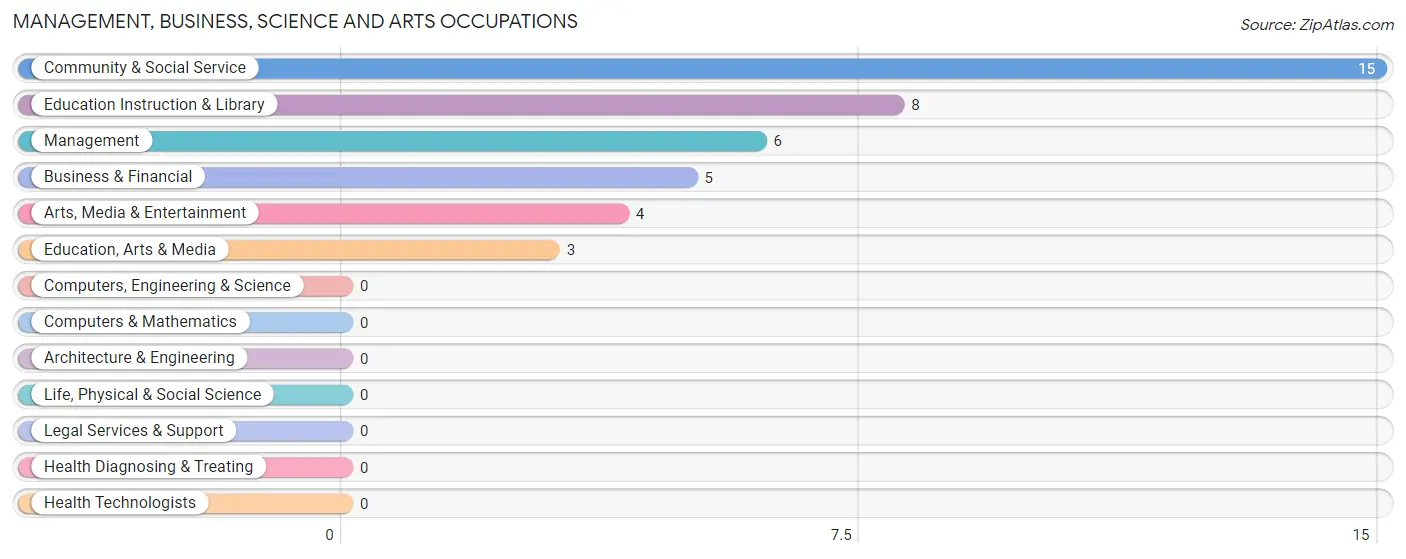
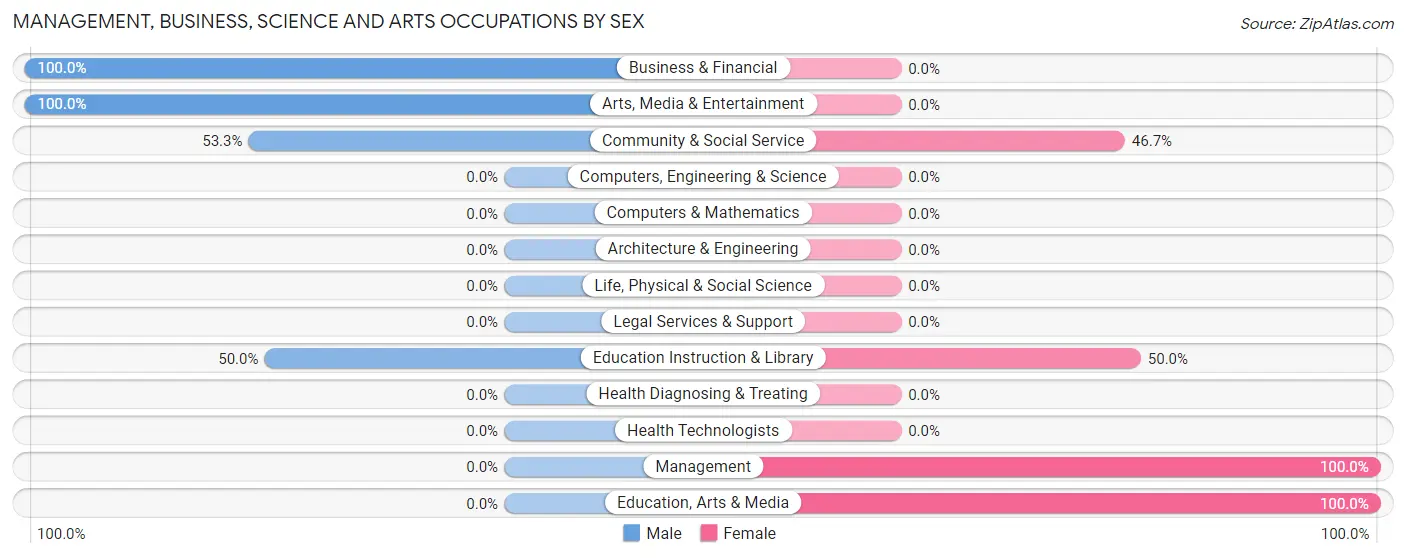
Management, Business, Science and Arts Occupations
The most common Management, Business, Science and Arts occupations in Pilot Station are Community & Social Service (15 | 14.3%), Education Instruction & Library (8 | 7.6%), Management (6 | 5.7%), Business & Financial (5 | 4.8%), and Arts, Media & Entertainment (4 | 3.8%).
Management, Business, Science and Arts Occupations by Sex
Within the Management, Business, Science and Arts occupations in Pilot Station, the most male-oriented occupations are Business & Financial (100.0%), Arts, Media & Entertainment (100.0%), and Community & Social Service (53.3%), while the most female-oriented occupations are Management (100.0%), Education, Arts & Media (100.0%), and Education Instruction & Library (50.0%).
| Occupation | Male | Female |
| Management | 0 (0.0%) | 6 (100.0%) |
| Business & Financial | 5 (100.0%) | 0 (0.0%) |
| Computers, Engineering & Science | 0 (0.0%) | 0 (0.0%) |
| Computers & Mathematics | 0 (0.0%) | 0 (0.0%) |
| Architecture & Engineering | 0 (0.0%) | 0 (0.0%) |
| Life, Physical & Social Science | 0 (0.0%) | 0 (0.0%) |
| Community & Social Service | 8 (53.3%) | 7 (46.7%) |
| Education, Arts & Media | 0 (0.0%) | 3 (100.0%) |
| Legal Services & Support | 0 (0.0%) | 0 (0.0%) |
| Education Instruction & Library | 4 (50.0%) | 4 (50.0%) |
| Arts, Media & Entertainment | 4 (100.0%) | 0 (0.0%) |
| Health Diagnosing & Treating | 0 (0.0%) | 0 (0.0%) |
| Health Technologists | 0 (0.0%) | 0 (0.0%) |
| Total (Category) | 13 (50.0%) | 13 (50.0%) |
| Total (Overall) | 66 (62.9%) | 39 (37.1%) |
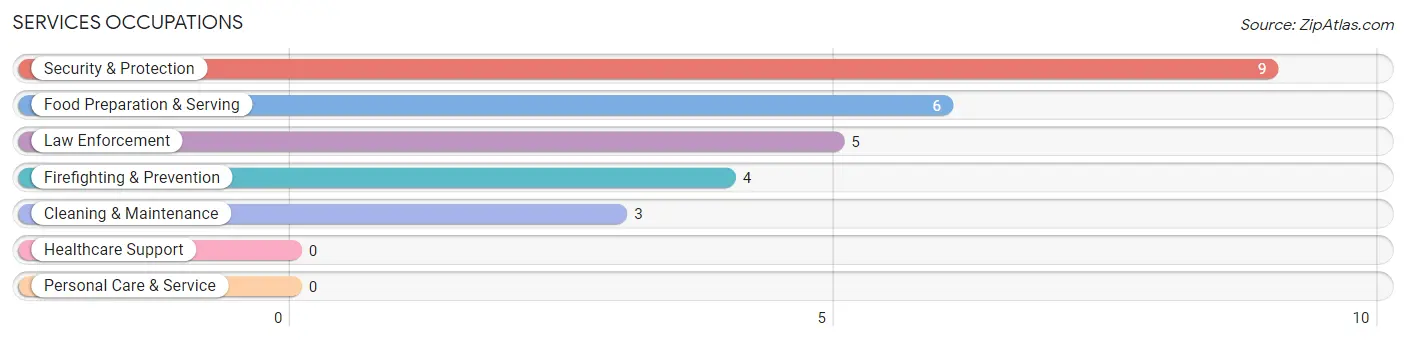
Services Occupations
The most common Services occupations in Pilot Station are Security & Protection (9 | 8.6%), Food Preparation & Serving (6 | 5.7%), Law Enforcement (5 | 4.8%), Firefighting & Prevention (4 | 3.8%), and Cleaning & Maintenance (3 | 2.9%).
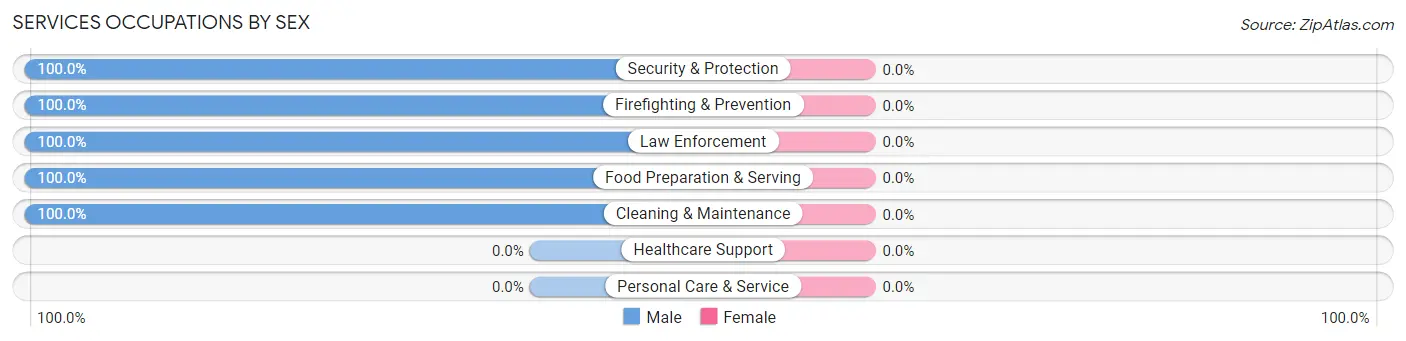
Services Occupations by Sex
| Occupation | Male | Female |
| Healthcare Support | 0 (0.0%) | 0 (0.0%) |
| Security & Protection | 9 (100.0%) | 0 (0.0%) |
| Firefighting & Prevention | 4 (100.0%) | 0 (0.0%) |
| Law Enforcement | 5 (100.0%) | 0 (0.0%) |
| Food Preparation & Serving | 6 (100.0%) | 0 (0.0%) |
| Cleaning & Maintenance | 3 (100.0%) | 0 (0.0%) |
| Personal Care & Service | 0 (0.0%) | 0 (0.0%) |
| Total (Category) | 18 (100.0%) | 0 (0.0%) |
| Total (Overall) | 66 (62.9%) | 39 (37.1%) |
Sales and Office Occupations
The most common Sales and Office occupations in Pilot Station are Office & Administration (17 | 16.2%), and Sales & Related (4 | 3.8%).

Sales and Office Occupations by Sex

| Occupation | Male | Female |
| Sales & Related | 0 (0.0%) | 4 (100.0%) |
| Office & Administration | 0 (0.0%) | 17 (100.0%) |
| Total (Category) | 0 (0.0%) | 21 (100.0%) |
| Total (Overall) | 66 (62.9%) | 39 (37.1%) |
Natural Resources, Construction and Maintenance Occupations
The most common Natural Resources, Construction and Maintenance occupations in Pilot Station are , and Farming, Fishing & Forestry (3 | 2.9%).

Natural Resources, Construction and Maintenance Occupations by Sex

| Occupation | Male | Female |
| Farming, Fishing & Forestry | 0 (0.0%) | 3 (100.0%) |
| Construction & Extraction | 0 (0.0%) | 0 (0.0%) |
| Installation, Maintenance & Repair | 0 (0.0%) | 0 (0.0%) |
| Total (Category) | 0 (0.0%) | 3 (100.0%) |
| Total (Overall) | 66 (62.9%) | 39 (37.1%) |
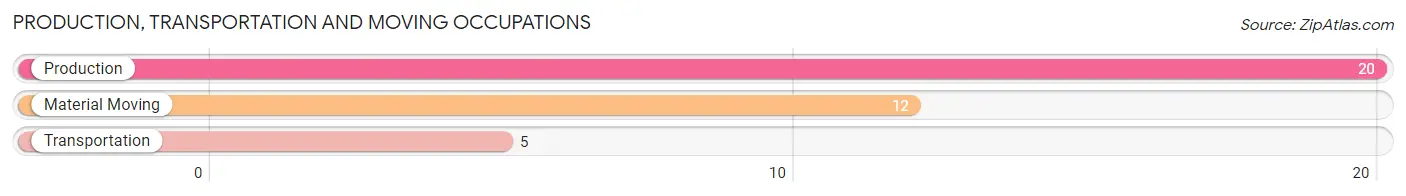
Production, Transportation and Moving Occupations
The most common Production, Transportation and Moving occupations in Pilot Station are Production (20 | 19.1%), Material Moving (12 | 11.4%), and Transportation (5 | 4.8%).
Production, Transportation and Moving Occupations by Sex
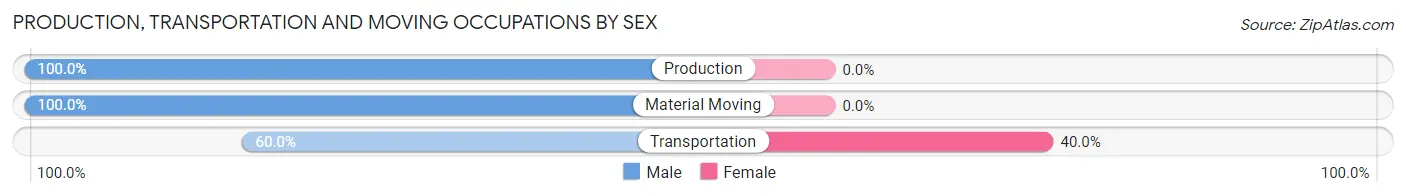
| Occupation | Male | Female |
| Production | 20 (100.0%) | 0 (0.0%) |
| Transportation | 3 (60.0%) | 2 (40.0%) |
| Material Moving | 12 (100.0%) | 0 (0.0%) |
| Total (Category) | 35 (94.6%) | 2 (5.4%) |
| Total (Overall) | 66 (62.9%) | 39 (37.1%) |
Employment Industries by Sex in Pilot Station
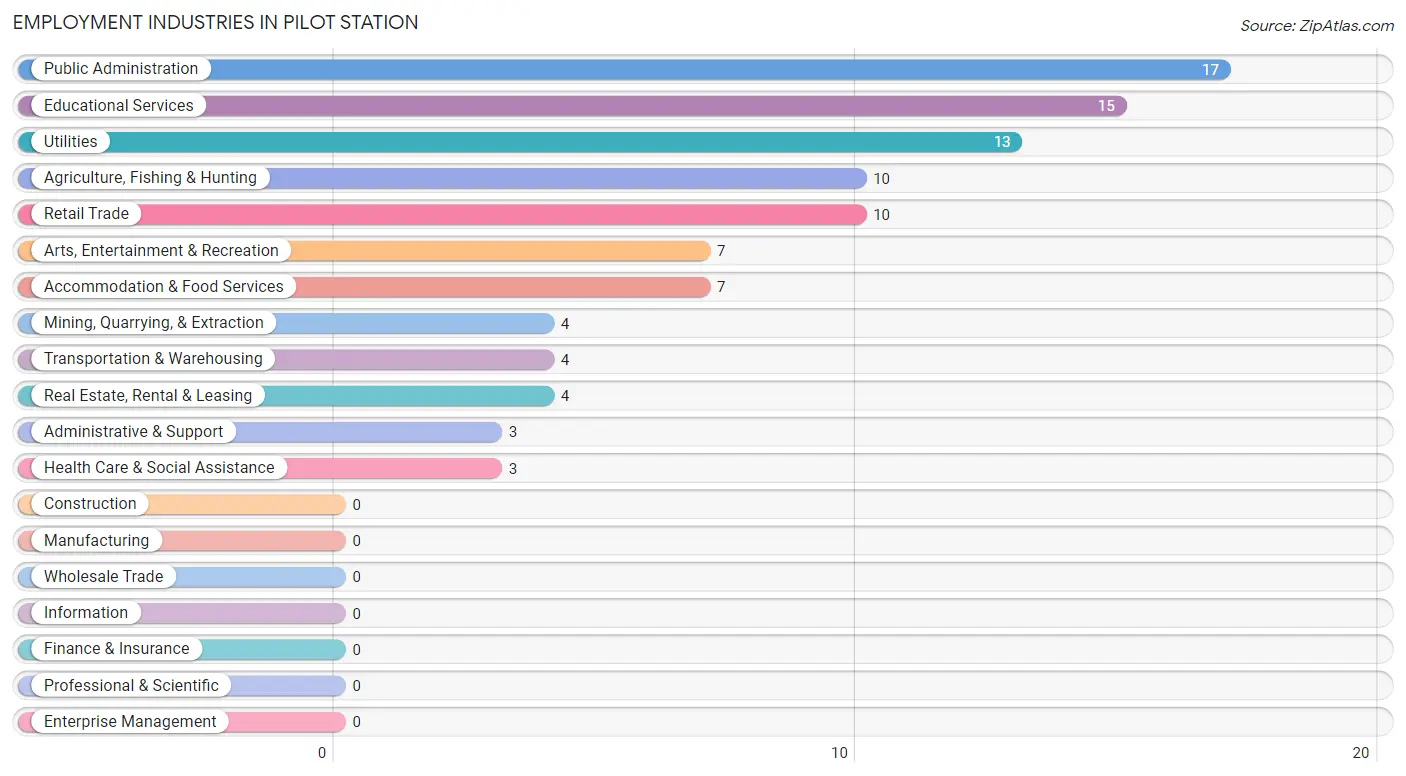
Employment Industries in Pilot Station
The major employment industries in Pilot Station include Public Administration (17 | 16.2%), Educational Services (15 | 14.3%), Utilities (13 | 12.4%), Agriculture, Fishing & Hunting (10 | 9.5%), and Retail Trade (10 | 9.5%).
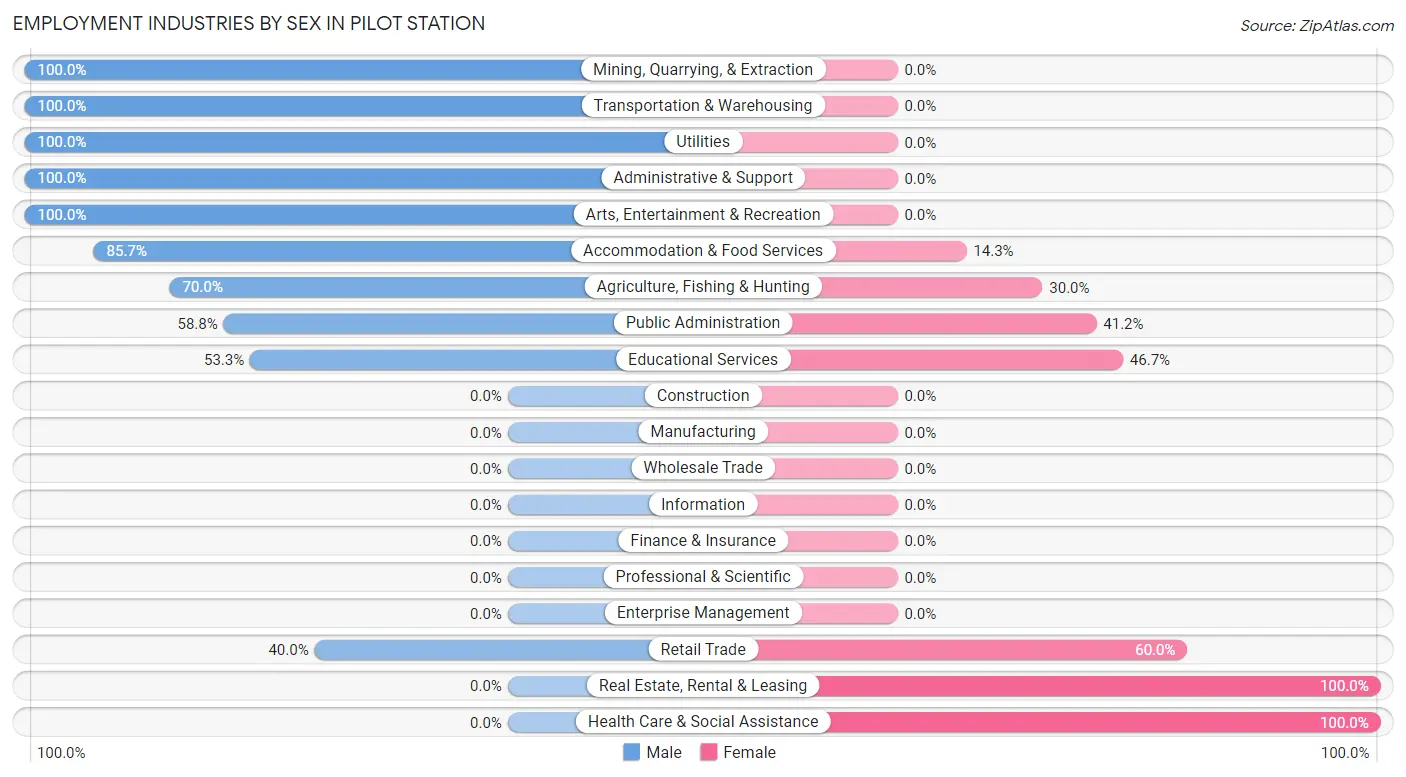
Employment Industries by Sex in Pilot Station
The Pilot Station industries that see more men than women are Mining, Quarrying, & Extraction (100.0%), Transportation & Warehousing (100.0%), and Utilities (100.0%), whereas the industries that tend to have a higher number of women are Real Estate, Rental & Leasing (100.0%), Health Care & Social Assistance (100.0%), and Retail Trade (60.0%).
| Industry | Male | Female |
| Agriculture, Fishing & Hunting | 7 (70.0%) | 3 (30.0%) |
| Mining, Quarrying, & Extraction | 4 (100.0%) | 0 (0.0%) |
| Construction | 0 (0.0%) | 0 (0.0%) |
| Manufacturing | 0 (0.0%) | 0 (0.0%) |
| Wholesale Trade | 0 (0.0%) | 0 (0.0%) |
| Retail Trade | 4 (40.0%) | 6 (60.0%) |
| Transportation & Warehousing | 4 (100.0%) | 0 (0.0%) |
| Utilities | 13 (100.0%) | 0 (0.0%) |
| Information | 0 (0.0%) | 0 (0.0%) |
| Finance & Insurance | 0 (0.0%) | 0 (0.0%) |
| Real Estate, Rental & Leasing | 0 (0.0%) | 4 (100.0%) |
| Professional & Scientific | 0 (0.0%) | 0 (0.0%) |
| Enterprise Management | 0 (0.0%) | 0 (0.0%) |
| Administrative & Support | 3 (100.0%) | 0 (0.0%) |
| Educational Services | 8 (53.3%) | 7 (46.7%) |
| Health Care & Social Assistance | 0 (0.0%) | 3 (100.0%) |
| Arts, Entertainment & Recreation | 7 (100.0%) | 0 (0.0%) |
| Accommodation & Food Services | 6 (85.7%) | 1 (14.3%) |
| Public Administration | 10 (58.8%) | 7 (41.2%) |
| Total | 66 (62.9%) | 39 (37.1%) |
Education in Pilot Station
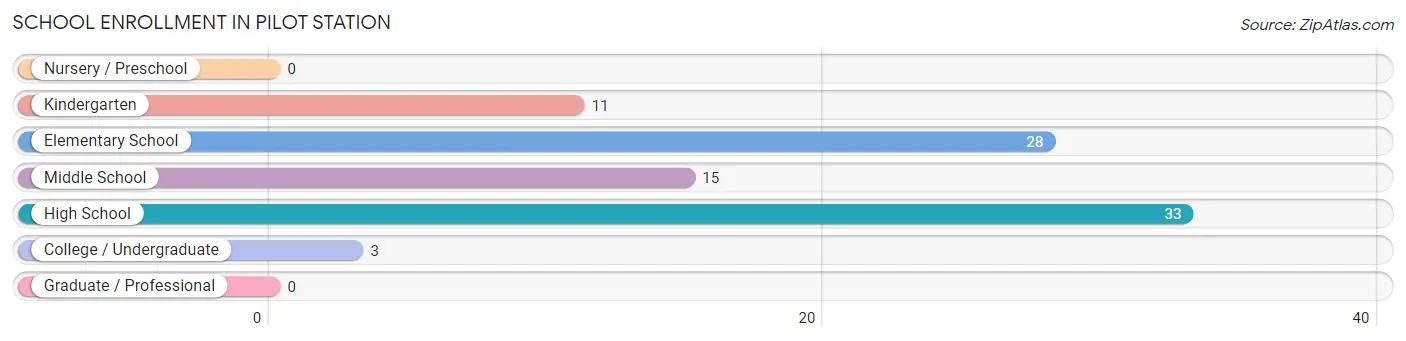
School Enrollment in Pilot Station
The most common levels of schooling among the 90 students in Pilot Station are high school (33 | 36.7%), elementary school (28 | 31.1%), and middle school (15 | 16.7%).
| School Level | # Students | % Students |
| Nursery / Preschool | 0 | 0.0% |
| Kindergarten | 11 | 12.2% |
| Elementary School | 28 | 31.1% |
| Middle School | 15 | 16.7% |
| High School | 33 | 36.7% |
| College / Undergraduate | 3 | 3.3% |
| Graduate / Professional | 0 | 0.0% |
| Total | 90 | 100.0% |
School Enrollment by Age by Funding Source in Pilot Station
Out of a total of 90 students who are enrolled in schools in Pilot Station, 6 (6.7%) attend a private institution, while the remaining 84 (93.3%) are enrolled in public schools. The age group of 10 to 14 year olds has the highest likelihood of being enrolled in private schools, with 3 (11.1% in the age bracket) enrolled. Conversely, the age group of 3 to 4 year olds has the lowest likelihood of being enrolled in a private school, with 4 (100.0% in the age bracket) attending a public institution.
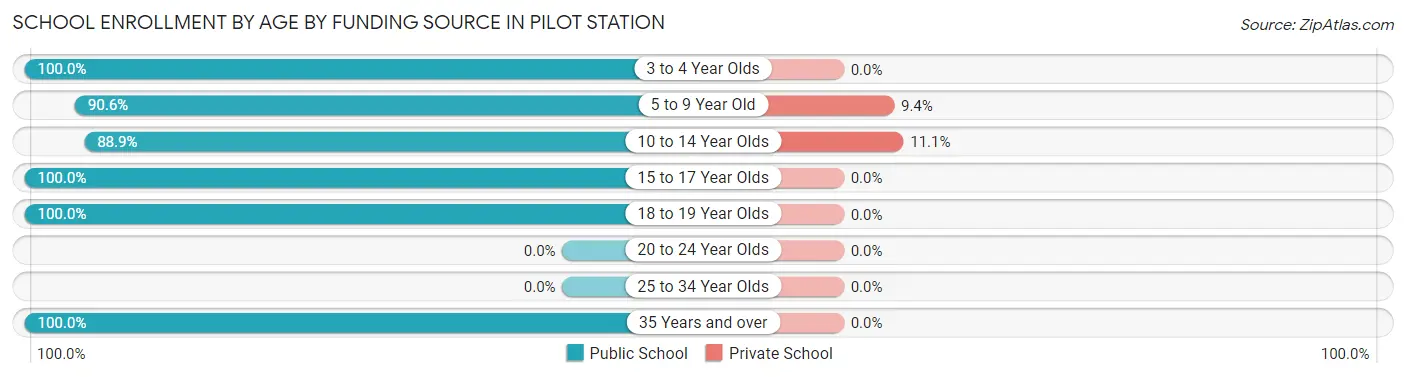
| Age Bracket | Public School | Private School |
| 3 to 4 Year Olds | 4 (100.0%) | 0 (0.0%) |
| 5 to 9 Year Old | 29 (90.6%) | 3 (9.4%) |
| 10 to 14 Year Olds | 24 (88.9%) | 3 (11.1%) |
| 15 to 17 Year Olds | 15 (100.0%) | 0 (0.0%) |
| 18 to 19 Year Olds | 9 (100.0%) | 0 (0.0%) |
| 20 to 24 Year Olds | 0 (0.0%) | 0 (0.0%) |
| 25 to 34 Year Olds | 0 (0.0%) | 0 (0.0%) |
| 35 Years and over | 3 (100.0%) | 0 (0.0%) |
| Total | 84 (93.3%) | 6 (6.7%) |
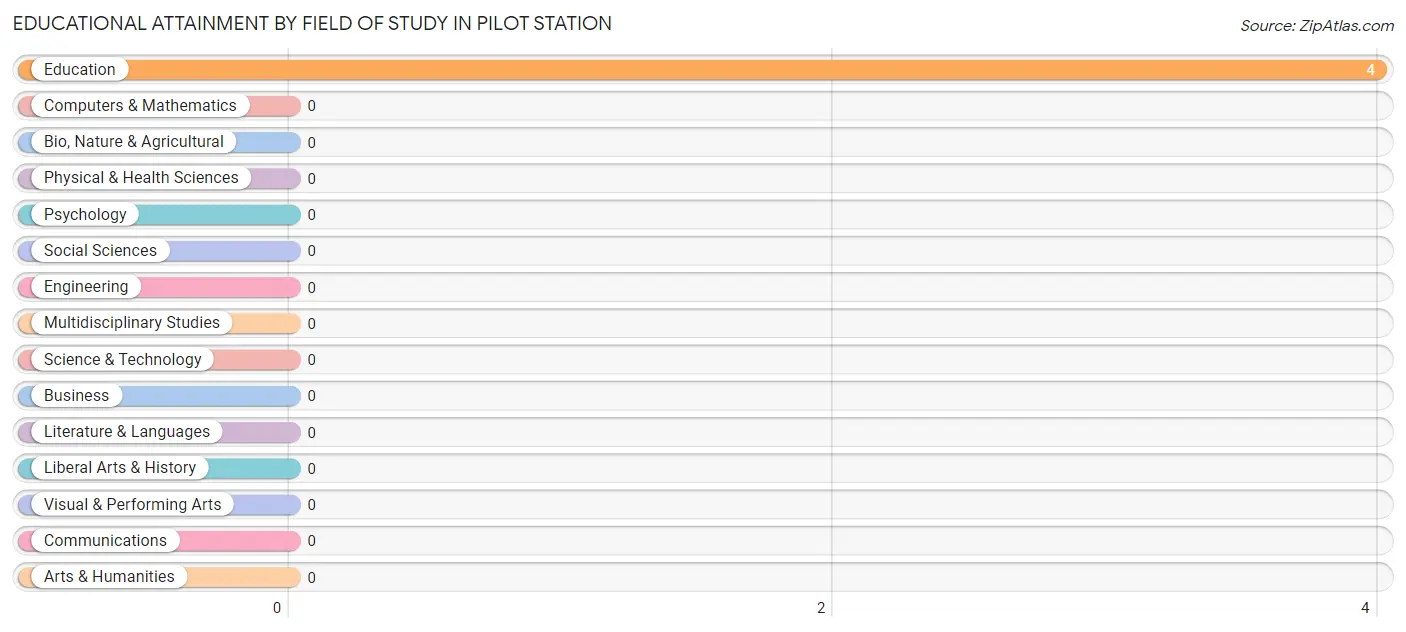
Educational Attainment by Field of Study in Pilot Station
, and education (4 | 100.0%) are the most common fields of study among 4 individuals in Pilot Station who have obtained a bachelor's degree or higher.
| Field of Study | # Graduates | % Graduates |
| Computers & Mathematics | 0 | 0.0% |
| Bio, Nature & Agricultural | 0 | 0.0% |
| Physical & Health Sciences | 0 | 0.0% |
| Psychology | 0 | 0.0% |
| Social Sciences | 0 | 0.0% |
| Engineering | 0 | 0.0% |
| Multidisciplinary Studies | 0 | 0.0% |
| Science & Technology | 0 | 0.0% |
| Business | 0 | 0.0% |
| Education | 4 | 100.0% |
| Literature & Languages | 0 | 0.0% |
| Liberal Arts & History | 0 | 0.0% |
| Visual & Performing Arts | 0 | 0.0% |
| Communications | 0 | 0.0% |
| Arts & Humanities | 0 | 0.0% |
| Total | 4 | 100.0% |
Transportation & Commute in Pilot Station
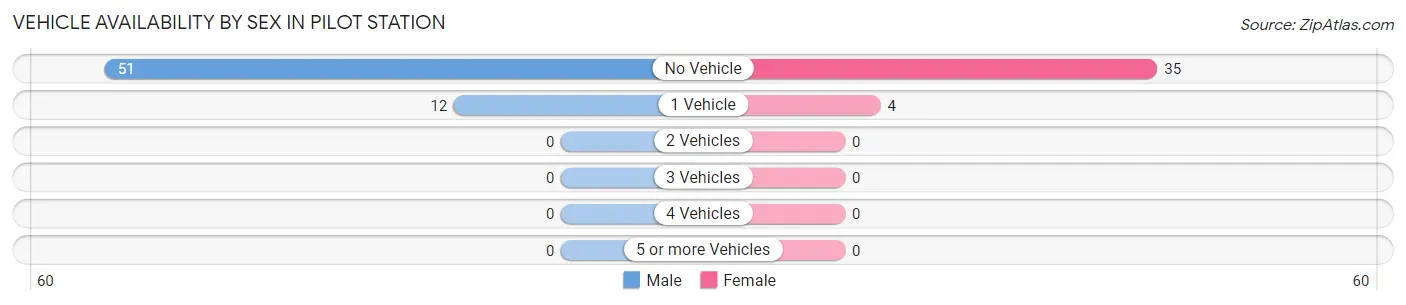
Vehicle Availability by Sex in Pilot Station
The most prevalent vehicle ownership categories in Pilot Station are males with no vehicle (51, accounting for 80.9%) and females with no vehicle (35, making up 130.8%).
| Vehicles Available | Male | Female |
| No Vehicle | 51 (80.9%) | 35 (89.7%) |
| 1 Vehicle | 12 (19.1%) | 4 (10.3%) |
| 2 Vehicles | 0 (0.0%) | 0 (0.0%) |
| 3 Vehicles | 0 (0.0%) | 0 (0.0%) |
| 4 Vehicles | 0 (0.0%) | 0 (0.0%) |
| 5 or more Vehicles | 0 (0.0%) | 0 (0.0%) |
| Total | 63 (100.0%) | 39 (100.0%) |
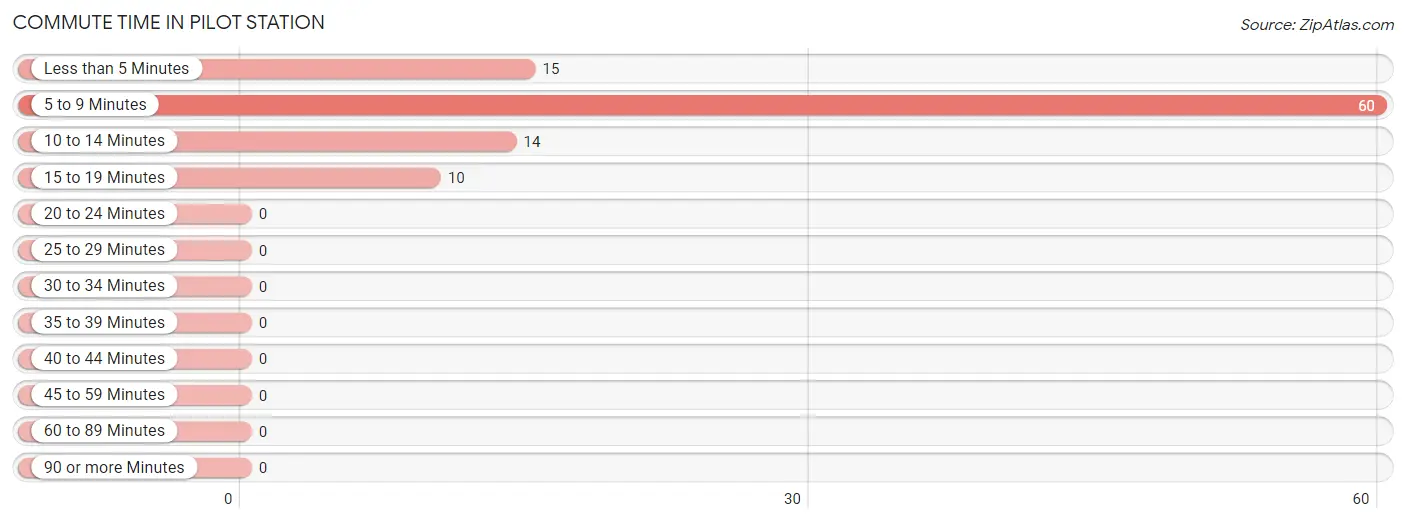
Commute Time in Pilot Station
The most frequently occuring commute durations in Pilot Station are 5 to 9 minutes (60 commuters, 60.6%), less than 5 minutes (15 commuters, 15.1%), and 10 to 14 minutes (14 commuters, 14.1%).
| Commute Time | # Commuters | % Commuters |
| Less than 5 Minutes | 15 | 15.1% |
| 5 to 9 Minutes | 60 | 60.6% |
| 10 to 14 Minutes | 14 | 14.1% |
| 15 to 19 Minutes | 10 | 10.1% |
| 20 to 24 Minutes | 0 | 0.0% |
| 25 to 29 Minutes | 0 | 0.0% |
| 30 to 34 Minutes | 0 | 0.0% |
| 35 to 39 Minutes | 0 | 0.0% |
| 40 to 44 Minutes | 0 | 0.0% |
| 45 to 59 Minutes | 0 | 0.0% |
| 60 to 89 Minutes | 0 | 0.0% |
| 90 or more Minutes | 0 | 0.0% |
Commute Time by Sex in Pilot Station
The most common commute times in Pilot Station are 5 to 9 minutes (33 commuters, 55.0%) for males and 5 to 9 minutes (27 commuters, 69.2%) for females.
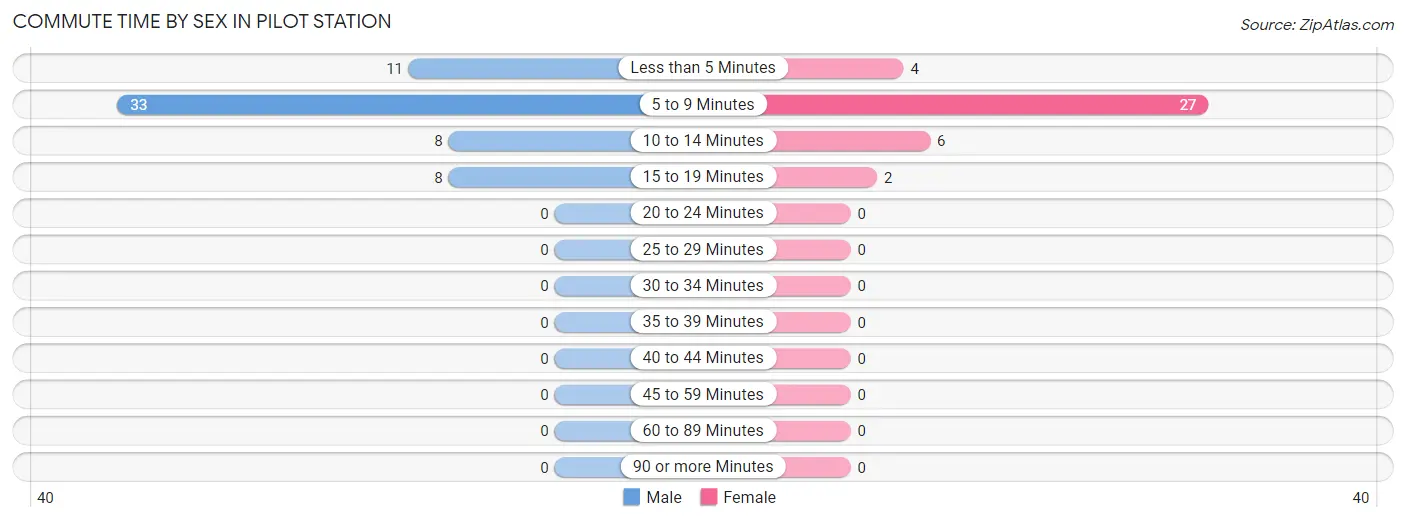
| Commute Time | Male | Female |
| Less than 5 Minutes | 11 (18.3%) | 4 (10.3%) |
| 5 to 9 Minutes | 33 (55.0%) | 27 (69.2%) |
| 10 to 14 Minutes | 8 (13.3%) | 6 (15.4%) |
| 15 to 19 Minutes | 8 (13.3%) | 2 (5.1%) |
| 20 to 24 Minutes | 0 (0.0%) | 0 (0.0%) |
| 25 to 29 Minutes | 0 (0.0%) | 0 (0.0%) |
| 30 to 34 Minutes | 0 (0.0%) | 0 (0.0%) |
| 35 to 39 Minutes | 0 (0.0%) | 0 (0.0%) |
| 40 to 44 Minutes | 0 (0.0%) | 0 (0.0%) |
| 45 to 59 Minutes | 0 (0.0%) | 0 (0.0%) |
| 60 to 89 Minutes | 0 (0.0%) | 0 (0.0%) |
| 90 or more Minutes | 0 (0.0%) | 0 (0.0%) |
Time of Departure to Work by Sex in Pilot Station
The most frequent times of departure to work in Pilot Station are 8:30 AM to 8:59 AM (13, 21.7%) for males and 8:00 AM to 8:29 AM (11, 28.2%) for females.
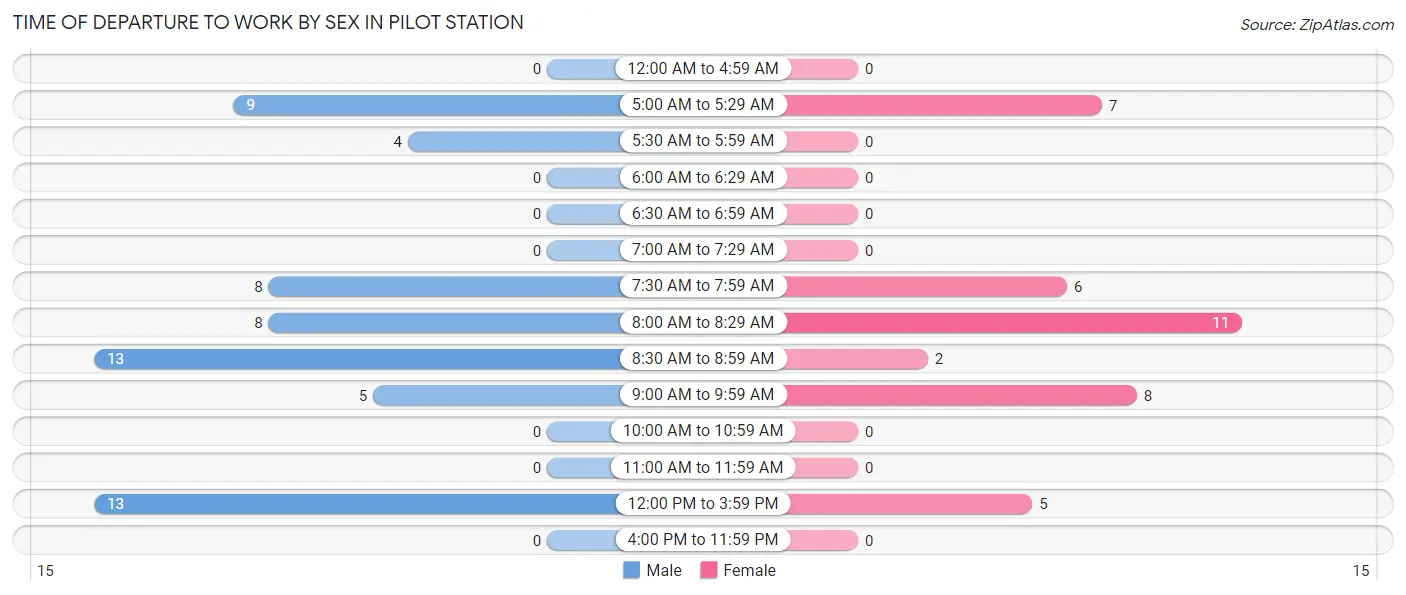
| Time of Departure | Male | Female |
| 12:00 AM to 4:59 AM | 0 (0.0%) | 0 (0.0%) |
| 5:00 AM to 5:29 AM | 9 (15.0%) | 7 (17.9%) |
| 5:30 AM to 5:59 AM | 4 (6.7%) | 0 (0.0%) |
| 6:00 AM to 6:29 AM | 0 (0.0%) | 0 (0.0%) |
| 6:30 AM to 6:59 AM | 0 (0.0%) | 0 (0.0%) |
| 7:00 AM to 7:29 AM | 0 (0.0%) | 0 (0.0%) |
| 7:30 AM to 7:59 AM | 8 (13.3%) | 6 (15.4%) |
| 8:00 AM to 8:29 AM | 8 (13.3%) | 11 (28.2%) |
| 8:30 AM to 8:59 AM | 13 (21.7%) | 2 (5.1%) |
| 9:00 AM to 9:59 AM | 5 (8.3%) | 8 (20.5%) |
| 10:00 AM to 10:59 AM | 0 (0.0%) | 0 (0.0%) |
| 11:00 AM to 11:59 AM | 0 (0.0%) | 0 (0.0%) |
| 12:00 PM to 3:59 PM | 13 (21.7%) | 5 (12.8%) |
| 4:00 PM to 11:59 PM | 0 (0.0%) | 0 (0.0%) |
| Total | 60 (100.0%) | 39 (100.0%) |
Housing Occupancy in Pilot Station
Occupancy by Ownership in Pilot Station
Of the total 83 dwellings in Pilot Station, owner-occupied units account for 81 (97.6%), while renter-occupied units make up 2 (2.4%).
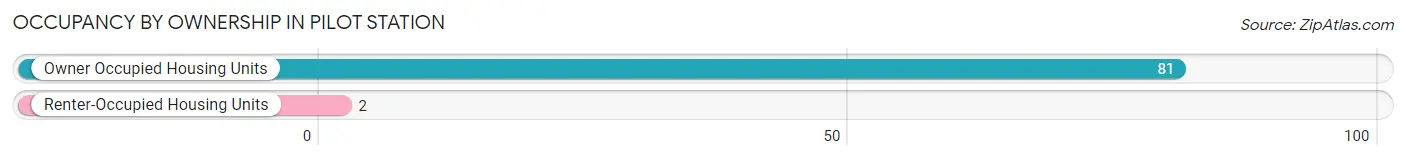
| Occupancy | # Housing Units | % Housing Units |
| Owner Occupied Housing Units | 81 | 97.6% |
| Renter-Occupied Housing Units | 2 | 2.4% |
| Total Occupied Housing Units | 83 | 100.0% |
Occupancy by Household Size in Pilot Station
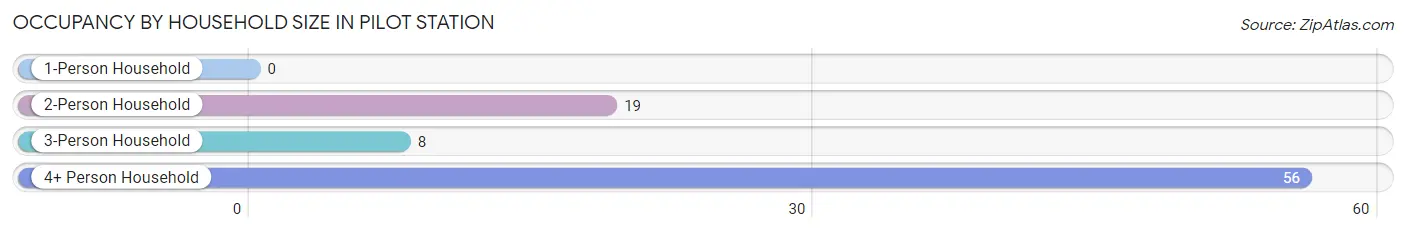
| Household Size | # Housing Units | % Housing Units |
| 1-Person Household | 0 | 0.0% |
| 2-Person Household | 19 | 22.9% |
| 3-Person Household | 8 | 9.6% |
| 4+ Person Household | 56 | 67.5% |
| Total Housing Units | 83 | 100.0% |
Occupancy by Ownership by Household Size in Pilot Station
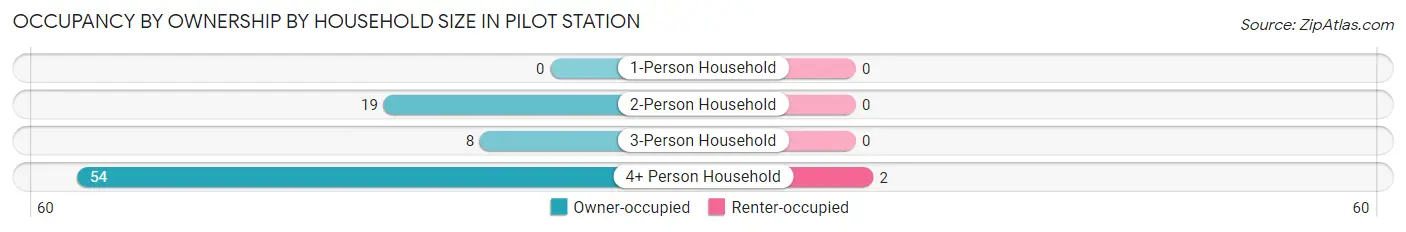
| Household Size | Owner-occupied | Renter-occupied |
| 1-Person Household | 0 (0.0%) | 0 (0.0%) |
| 2-Person Household | 19 (100.0%) | 0 (0.0%) |
| 3-Person Household | 8 (100.0%) | 0 (0.0%) |
| 4+ Person Household | 54 (96.4%) | 2 (3.6%) |
| Total Housing Units | 81 (97.6%) | 2 (2.4%) |
Occupancy by Educational Attainment in Pilot Station
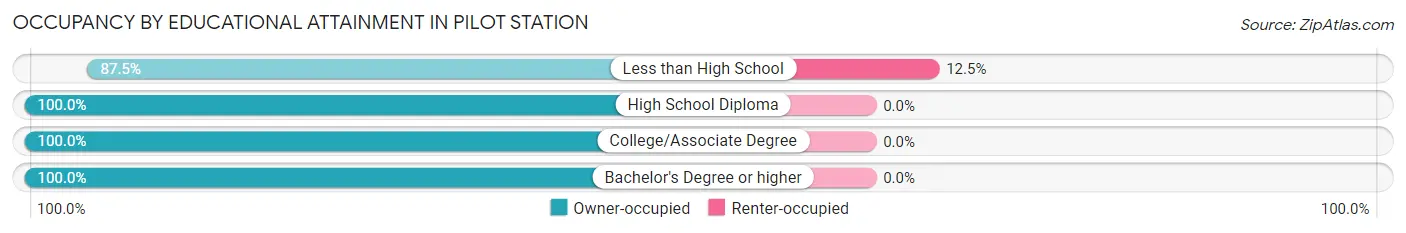
| Household Size | Owner-occupied | Renter-occupied |
| Less than High School | 14 (87.5%) | 2 (12.5%) |
| High School Diploma | 47 (100.0%) | 0 (0.0%) |
| College/Associate Degree | 16 (100.0%) | 0 (0.0%) |
| Bachelor's Degree or higher | 4 (100.0%) | 0 (0.0%) |
Occupancy by Age of Householder in Pilot Station
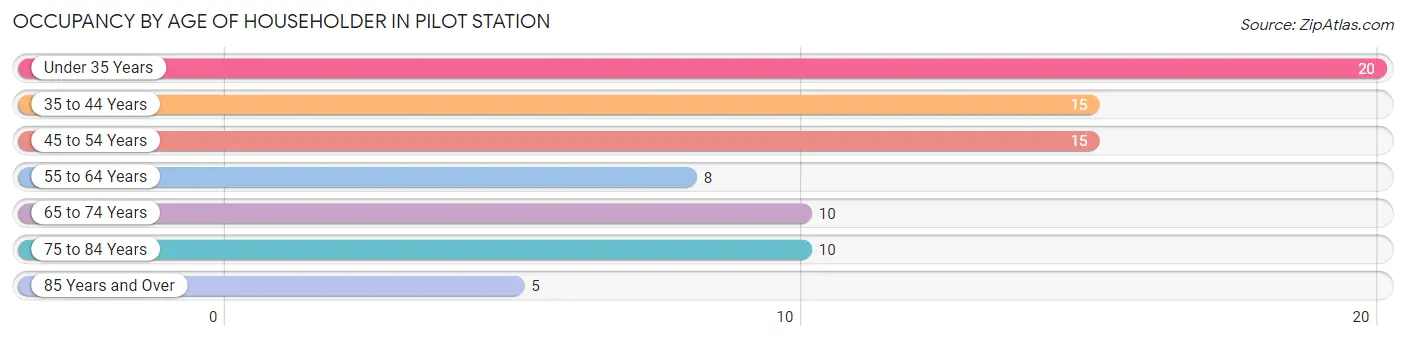
| Age Bracket | # Households | % Households |
| Under 35 Years | 20 | 24.1% |
| 35 to 44 Years | 15 | 18.1% |
| 45 to 54 Years | 15 | 18.1% |
| 55 to 64 Years | 8 | 9.6% |
| 65 to 74 Years | 10 | 12.0% |
| 75 to 84 Years | 10 | 12.0% |
| 85 Years and Over | 5 | 6.0% |
| Total | 83 | 100.0% |
Housing Finances in Pilot Station
Median Income by Occupancy in Pilot Station
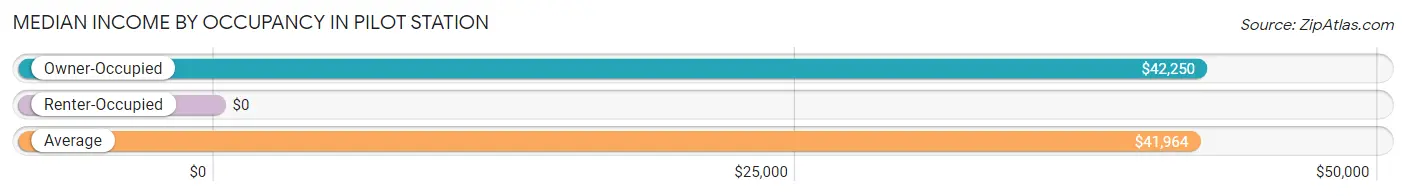
| Occupancy Type | # Households | Median Income |
| Owner-Occupied | 81 (97.6%) | $42,250 |
| Renter-Occupied | 2 (2.4%) | $0 |
| Average | 83 (100.0%) | $41,964 |
Occupancy by Householder Income Bracket in Pilot Station
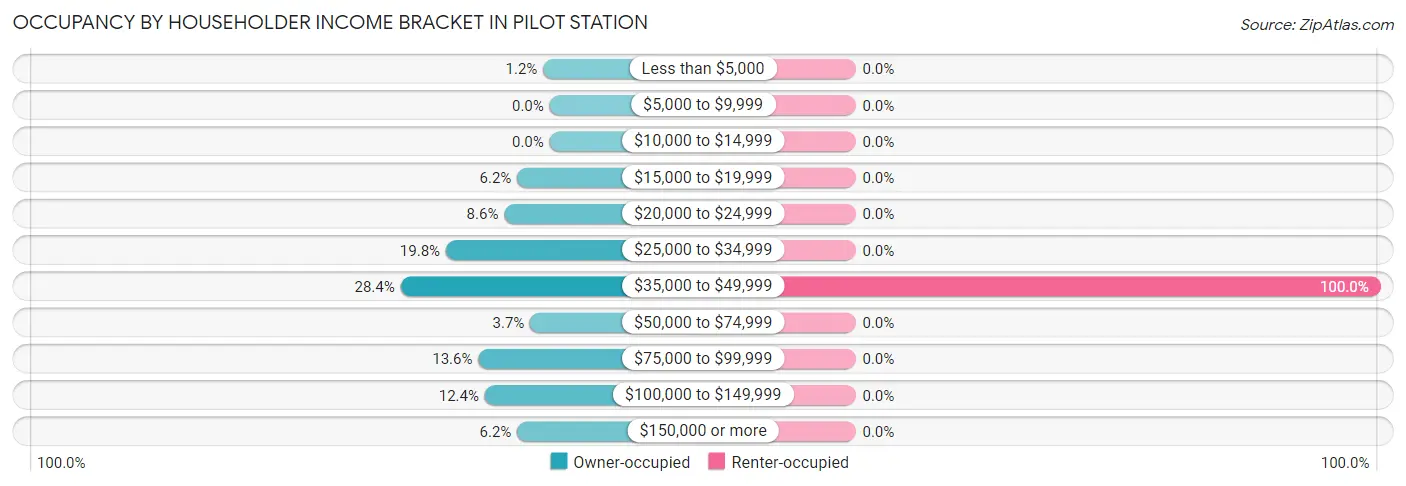
| Income Bracket | Owner-occupied | Renter-occupied |
| Less than $5,000 | 1 (1.2%) | 0 (0.0%) |
| $5,000 to $9,999 | 0 (0.0%) | 0 (0.0%) |
| $10,000 to $14,999 | 0 (0.0%) | 0 (0.0%) |
| $15,000 to $19,999 | 5 (6.2%) | 0 (0.0%) |
| $20,000 to $24,999 | 7 (8.6%) | 0 (0.0%) |
| $25,000 to $34,999 | 16 (19.8%) | 0 (0.0%) |
| $35,000 to $49,999 | 23 (28.4%) | 2 (100.0%) |
| $50,000 to $74,999 | 3 (3.7%) | 0 (0.0%) |
| $75,000 to $99,999 | 11 (13.6%) | 0 (0.0%) |
| $100,000 to $149,999 | 10 (12.3%) | 0 (0.0%) |
| $150,000 or more | 5 (6.2%) | 0 (0.0%) |
| Total | 81 (100.0%) | 2 (100.0%) |
Monthly Housing Cost Tiers in Pilot Station
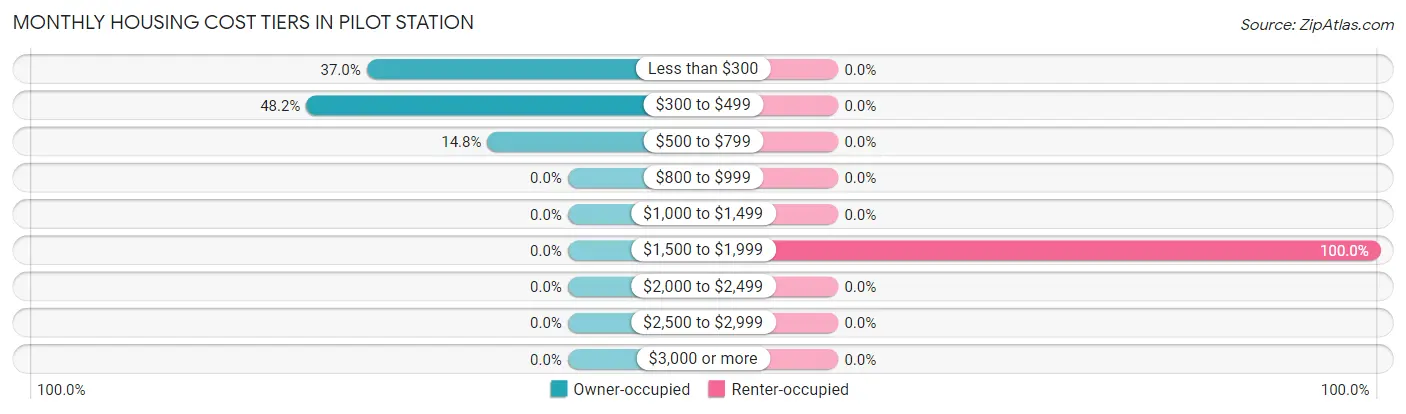
| Monthly Cost | Owner-occupied | Renter-occupied |
| Less than $300 | 30 (37.0%) | 0 (0.0%) |
| $300 to $499 | 39 (48.1%) | 0 (0.0%) |
| $500 to $799 | 12 (14.8%) | 0 (0.0%) |
| $800 to $999 | 0 (0.0%) | 0 (0.0%) |
| $1,000 to $1,499 | 0 (0.0%) | 0 (0.0%) |
| $1,500 to $1,999 | 0 (0.0%) | 2 (100.0%) |
| $2,000 to $2,499 | 0 (0.0%) | 0 (0.0%) |
| $2,500 to $2,999 | 0 (0.0%) | 0 (0.0%) |
| $3,000 or more | 0 (0.0%) | 0 (0.0%) |
| Total | 81 (100.0%) | 2 (100.0%) |
Physical Housing Characteristics in Pilot Station
Housing Structures in Pilot Station
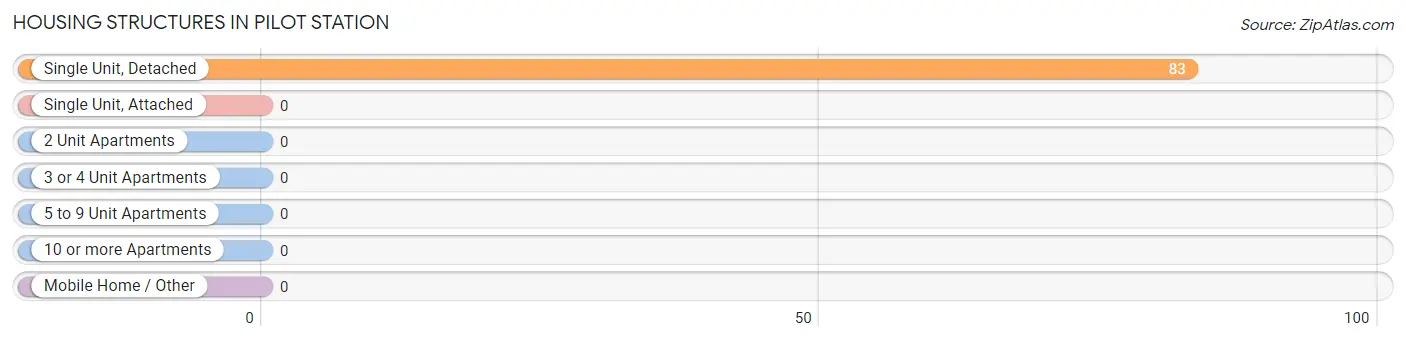
| Structure Type | # Housing Units | % Housing Units |
| Single Unit, Detached | 83 | 100.0% |
| Single Unit, Attached | 0 | 0.0% |
| 2 Unit Apartments | 0 | 0.0% |
| 3 or 4 Unit Apartments | 0 | 0.0% |
| 5 to 9 Unit Apartments | 0 | 0.0% |
| 10 or more Apartments | 0 | 0.0% |
| Mobile Home / Other | 0 | 0.0% |
| Total | 83 | 100.0% |
Housing Structures by Occupancy in Pilot Station
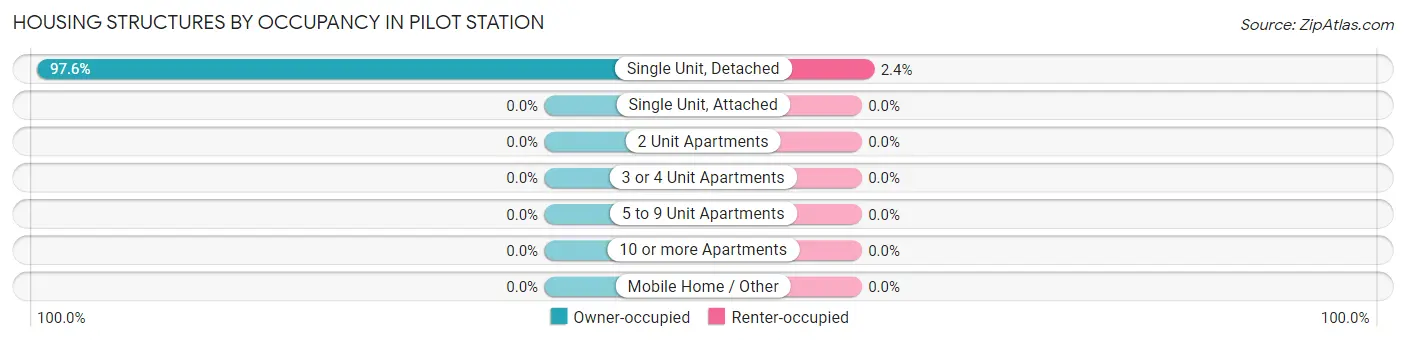
| Structure Type | Owner-occupied | Renter-occupied |
| Single Unit, Detached | 81 (97.6%) | 2 (2.4%) |
| Single Unit, Attached | 0 (0.0%) | 0 (0.0%) |
| 2 Unit Apartments | 0 (0.0%) | 0 (0.0%) |
| 3 or 4 Unit Apartments | 0 (0.0%) | 0 (0.0%) |
| 5 to 9 Unit Apartments | 0 (0.0%) | 0 (0.0%) |
| 10 or more Apartments | 0 (0.0%) | 0 (0.0%) |
| Mobile Home / Other | 0 (0.0%) | 0 (0.0%) |
| Total | 81 (97.6%) | 2 (2.4%) |
Housing Structures by Number of Rooms in Pilot Station
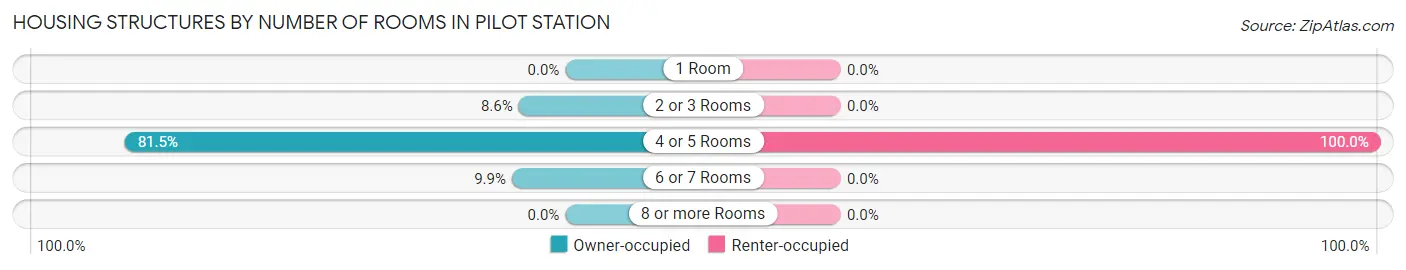
| Number of Rooms | Owner-occupied | Renter-occupied |
| 1 Room | 0 (0.0%) | 0 (0.0%) |
| 2 or 3 Rooms | 7 (8.6%) | 0 (0.0%) |
| 4 or 5 Rooms | 66 (81.5%) | 2 (100.0%) |
| 6 or 7 Rooms | 8 (9.9%) | 0 (0.0%) |
| 8 or more Rooms | 0 (0.0%) | 0 (0.0%) |
| Total | 81 (100.0%) | 2 (100.0%) |
Housing Structure by Heating Type in Pilot Station
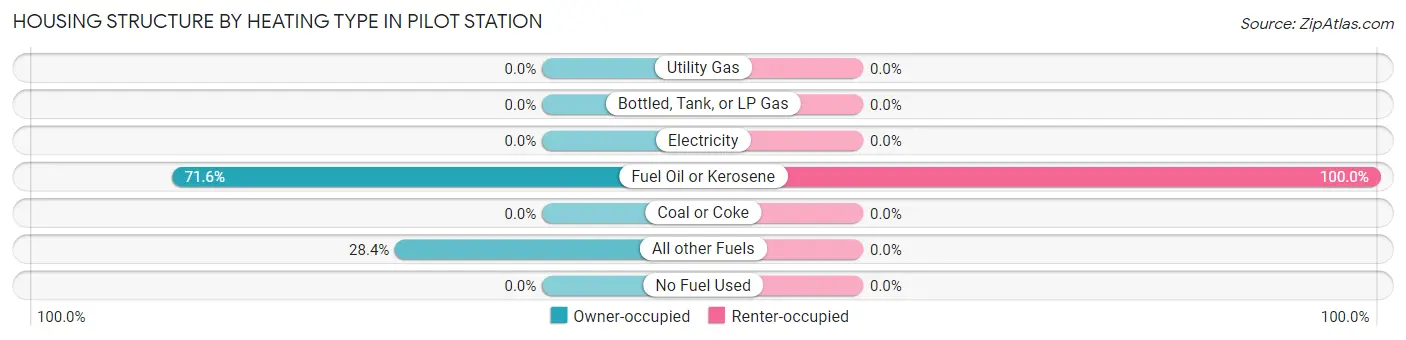
| Heating Type | Owner-occupied | Renter-occupied |
| Utility Gas | 0 (0.0%) | 0 (0.0%) |
| Bottled, Tank, or LP Gas | 0 (0.0%) | 0 (0.0%) |
| Electricity | 0 (0.0%) | 0 (0.0%) |
| Fuel Oil or Kerosene | 58 (71.6%) | 2 (100.0%) |
| Coal or Coke | 0 (0.0%) | 0 (0.0%) |
| All other Fuels | 23 (28.4%) | 0 (0.0%) |
| No Fuel Used | 0 (0.0%) | 0 (0.0%) |
| Total | 81 (100.0%) | 2 (100.0%) |
Household Vehicle Usage in Pilot Station
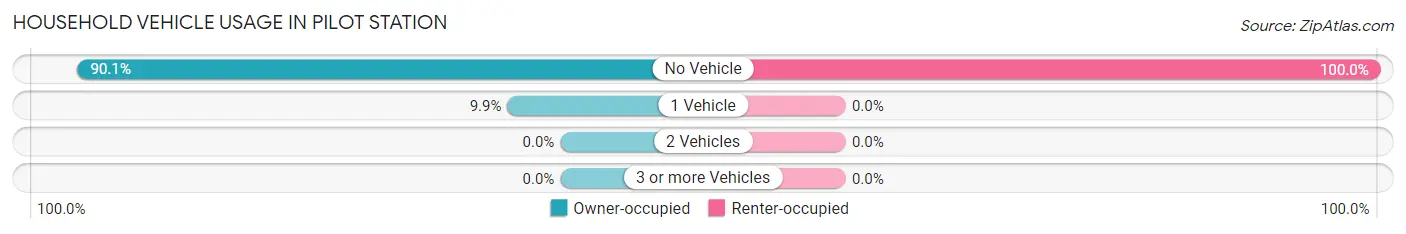
| Vehicles per Household | Owner-occupied | Renter-occupied |
| No Vehicle | 73 (90.1%) | 2 (100.0%) |
| 1 Vehicle | 8 (9.9%) | 0 (0.0%) |
| 2 Vehicles | 0 (0.0%) | 0 (0.0%) |
| 3 or more Vehicles | 0 (0.0%) | 0 (0.0%) |
| Total | 81 (100.0%) | 2 (100.0%) |
Real Estate & Mortgages in Pilot Station
Real Estate and Mortgage Overview in Pilot Station
| Characteristic | Without Mortgage | With Mortgage |
| Housing Units | 77 | 4 |
| Median Property Value | $33,800 | $0 |
| Median Household Income | $41,250 | $0 |
| Monthly Housing Costs | $361 | $0 |
| Real Estate Taxes | $199 | $4 |
Property Value by Mortgage Status in Pilot Station
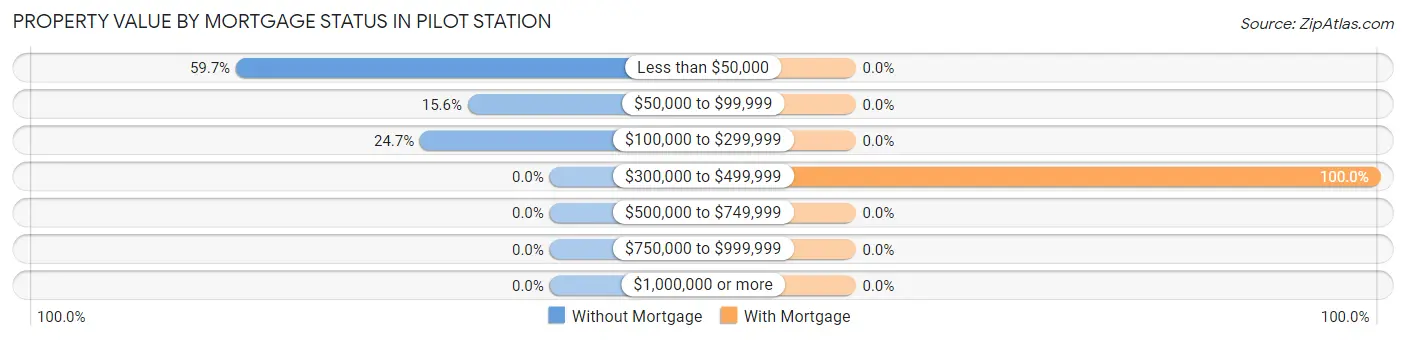
| Property Value | Without Mortgage | With Mortgage |
| Less than $50,000 | 46 (59.7%) | 0 (0.0%) |
| $50,000 to $99,999 | 12 (15.6%) | 0 (0.0%) |
| $100,000 to $299,999 | 19 (24.7%) | 0 (0.0%) |
| $300,000 to $499,999 | 0 (0.0%) | 4 (100.0%) |
| $500,000 to $749,999 | 0 (0.0%) | 0 (0.0%) |
| $750,000 to $999,999 | 0 (0.0%) | 0 (0.0%) |
| $1,000,000 or more | 0 (0.0%) | 0 (0.0%) |
| Total | 77 (100.0%) | 4 (100.0%) |
Household Income by Mortgage Status in Pilot Station
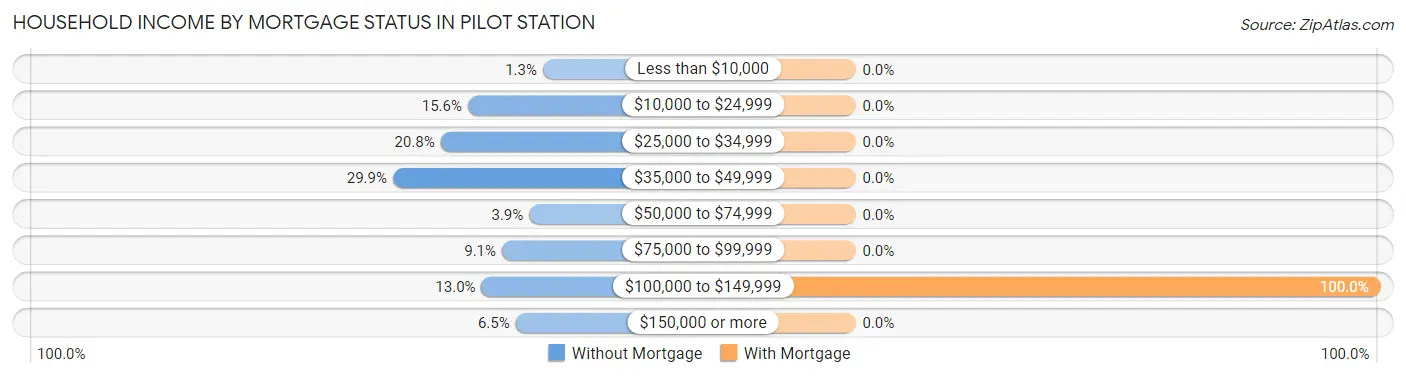
| Household Income | Without Mortgage | With Mortgage |
| Less than $10,000 | 1 (1.3%) | 0 (0.0%) |
| $10,000 to $24,999 | 12 (15.6%) | 0 (0.0%) |
| $25,000 to $34,999 | 16 (20.8%) | 0 (0.0%) |
| $35,000 to $49,999 | 23 (29.9%) | 0 (0.0%) |
| $50,000 to $74,999 | 3 (3.9%) | 0 (0.0%) |
| $75,000 to $99,999 | 7 (9.1%) | 0 (0.0%) |
| $100,000 to $149,999 | 10 (13.0%) | 4 (100.0%) |
| $150,000 or more | 5 (6.5%) | 0 (0.0%) |
| Total | 77 (100.0%) | 4 (100.0%) |
Property Value to Household Income Ratio in Pilot Station
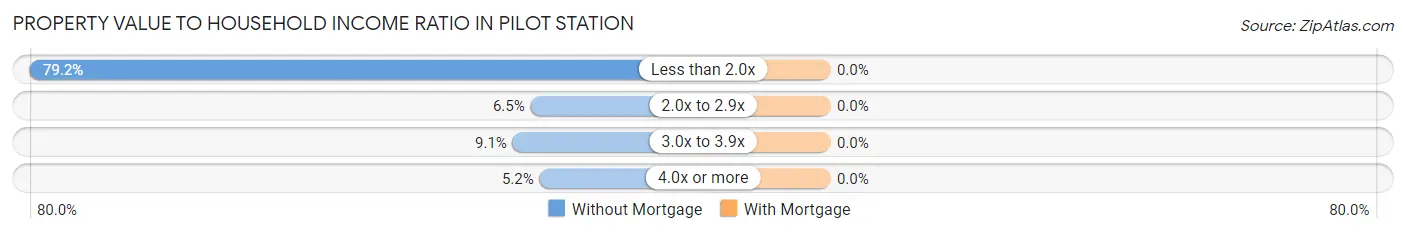
| Value-to-Income Ratio | Without Mortgage | With Mortgage |
| Less than 2.0x | 61 (79.2%) | 0 (0.0%) |
| 2.0x to 2.9x | 5 (6.5%) | 0 (0.0%) |
| 3.0x to 3.9x | 7 (9.1%) | 0 (0.0%) |
| 4.0x or more | 4 (5.2%) | 0 (0.0%) |
| Total | 77 (100.0%) | 4 (100.0%) |
Real Estate Taxes by Mortgage Status in Pilot Station
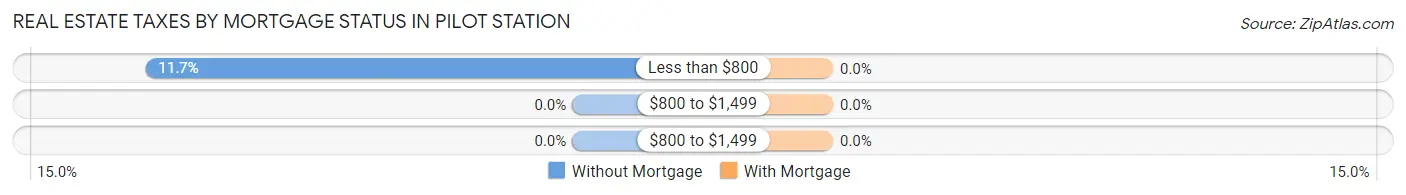
| Property Taxes | Without Mortgage | With Mortgage |
| Less than $800 | 9 (11.7%) | 0 (0.0%) |
| $800 to $1,499 | 0 (0.0%) | 0 (0.0%) |
| $800 to $1,499 | 0 (0.0%) | 0 (0.0%) |
| Total | 77 (100.0%) | 4 (100.0%) |
Health & Disability in Pilot Station
Health Insurance Coverage by Age in Pilot Station
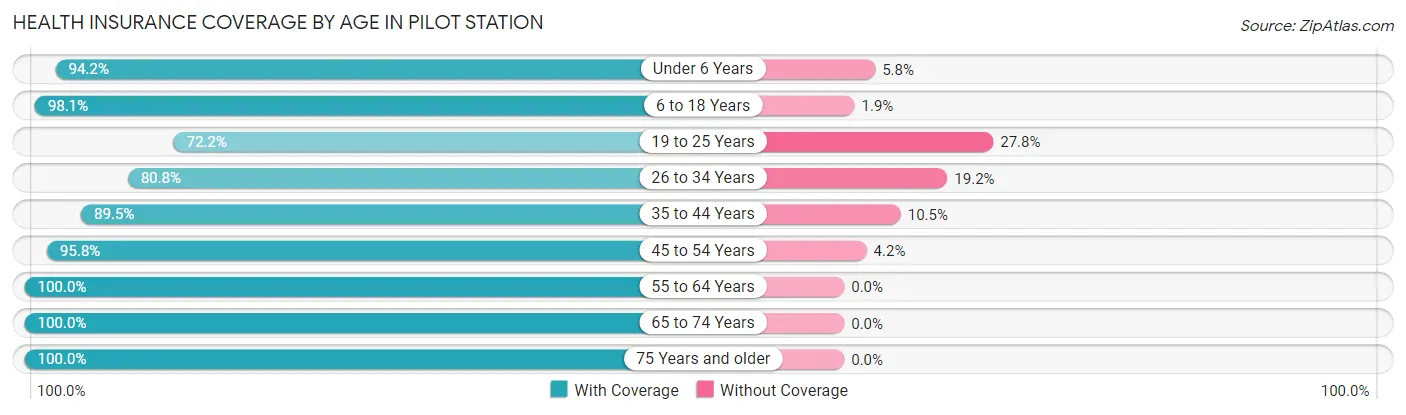
| Age Bracket | With Coverage | Without Coverage |
| Under 6 Years | 49 (94.2%) | 3 (5.8%) |
| 6 to 18 Years | 102 (98.1%) | 2 (1.9%) |
| 19 to 25 Years | 39 (72.2%) | 15 (27.8%) |
| 26 to 34 Years | 42 (80.8%) | 10 (19.2%) |
| 35 to 44 Years | 34 (89.5%) | 4 (10.5%) |
| 45 to 54 Years | 23 (95.8%) | 1 (4.2%) |
| 55 to 64 Years | 21 (100.0%) | 0 (0.0%) |
| 65 to 74 Years | 17 (100.0%) | 0 (0.0%) |
| 75 Years and older | 18 (100.0%) | 0 (0.0%) |
| Total | 345 (90.8%) | 35 (9.2%) |
Health Insurance Coverage by Citizenship Status in Pilot Station

| Citizenship Status | With Coverage | Without Coverage |
| Native Born | 49 (94.2%) | 3 (5.8%) |
| Foreign Born, Citizen | 102 (98.1%) | 2 (1.9%) |
| Foreign Born, not a Citizen | 39 (72.2%) | 15 (27.8%) |
Health Insurance Coverage by Household Income in Pilot Station
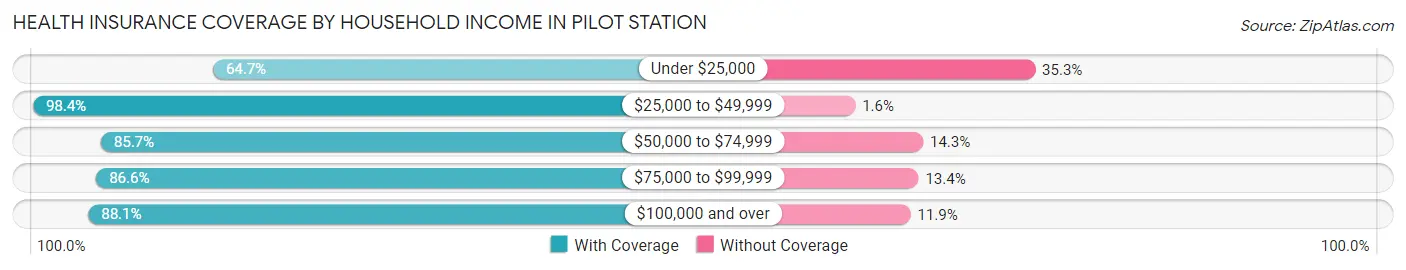
| Household Income | With Coverage | Without Coverage |
| Under $25,000 | 22 (64.7%) | 12 (35.3%) |
| $25,000 to $49,999 | 188 (98.4%) | 3 (1.6%) |
| $50,000 to $74,999 | 18 (85.7%) | 3 (14.3%) |
| $75,000 to $99,999 | 58 (86.6%) | 9 (13.4%) |
| $100,000 and over | 59 (88.1%) | 8 (11.9%) |
Public vs Private Health Insurance Coverage by Age in Pilot Station
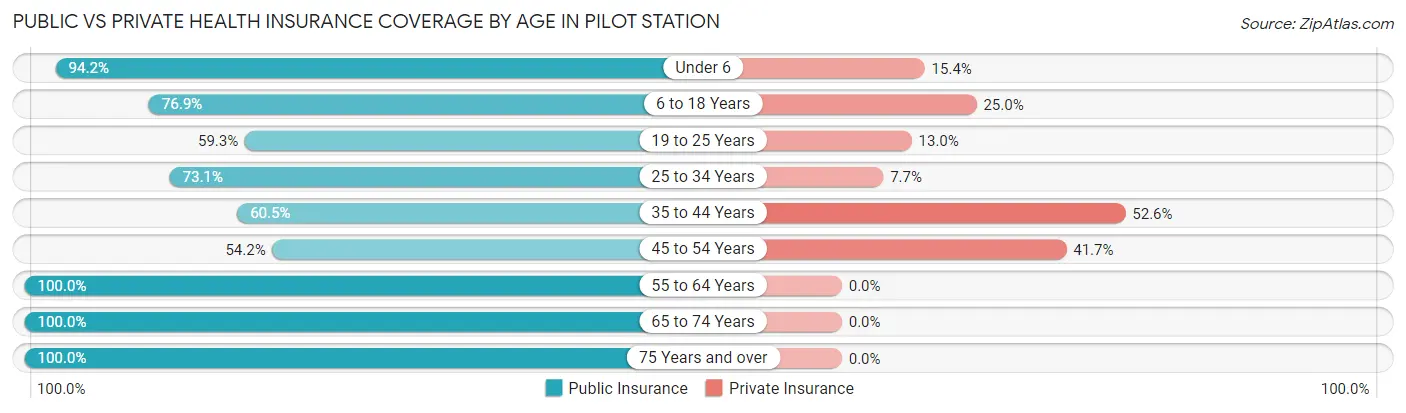
| Age Bracket | Public Insurance | Private Insurance |
| Under 6 | 49 (94.2%) | 8 (15.4%) |
| 6 to 18 Years | 80 (76.9%) | 26 (25.0%) |
| 19 to 25 Years | 32 (59.3%) | 7 (13.0%) |
| 25 to 34 Years | 38 (73.1%) | 4 (7.7%) |
| 35 to 44 Years | 23 (60.5%) | 20 (52.6%) |
| 45 to 54 Years | 13 (54.2%) | 10 (41.7%) |
| 55 to 64 Years | 21 (100.0%) | 0 (0.0%) |
| 65 to 74 Years | 17 (100.0%) | 0 (0.0%) |
| 75 Years and over | 18 (100.0%) | 0 (0.0%) |
| Total | 291 (76.6%) | 75 (19.7%) |
Disability Status by Sex by Age in Pilot Station
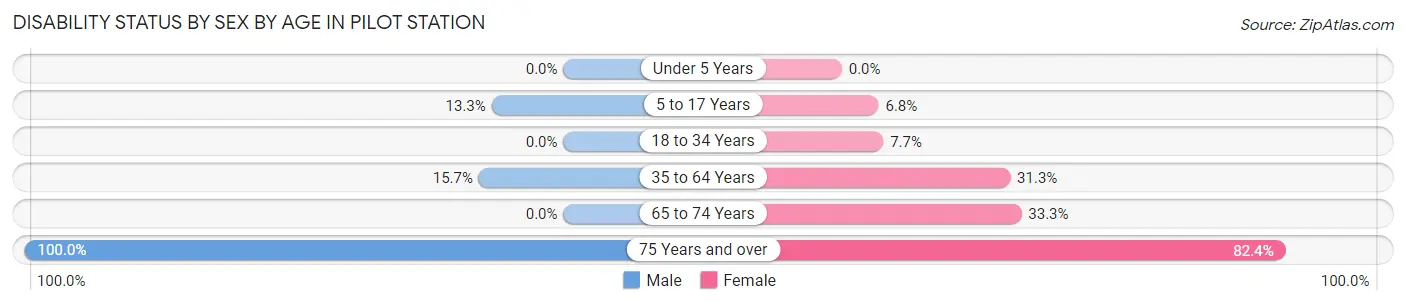
| Age Bracket | Male | Female |
| Under 5 Years | 0 (0.0%) | 0 (0.0%) |
| 5 to 17 Years | 8 (13.3%) | 3 (6.8%) |
| 18 to 34 Years | 0 (0.0%) | 4 (7.7%) |
| 35 to 64 Years | 8 (15.7%) | 10 (31.2%) |
| 65 to 74 Years | 0 (0.0%) | 4 (33.3%) |
| 75 Years and over | 1 (100.0%) | 14 (82.4%) |
Disability Class by Sex by Age in Pilot Station
Disability Class: Hearing Difficulty
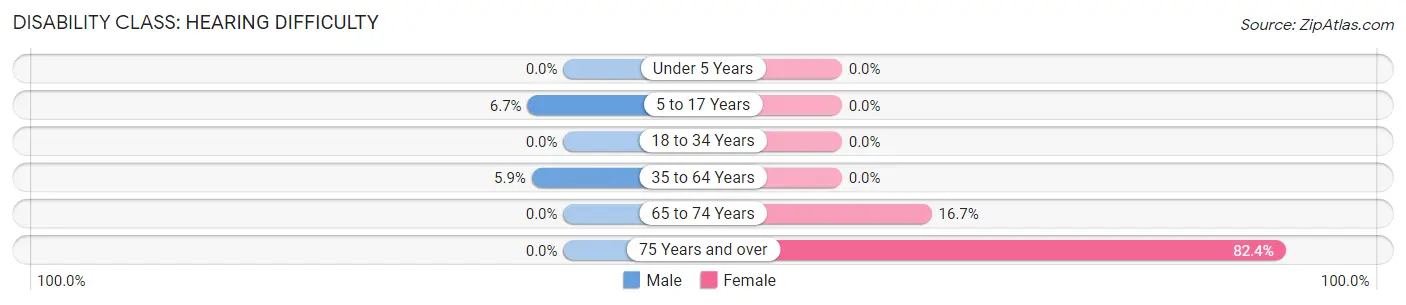
| Age Bracket | Male | Female |
| Under 5 Years | 0 (0.0%) | 0 (0.0%) |
| 5 to 17 Years | 4 (6.7%) | 0 (0.0%) |
| 18 to 34 Years | 0 (0.0%) | 0 (0.0%) |
| 35 to 64 Years | 3 (5.9%) | 0 (0.0%) |
| 65 to 74 Years | 0 (0.0%) | 2 (16.7%) |
| 75 Years and over | 0 (0.0%) | 14 (82.4%) |
Disability Class: Vision Difficulty
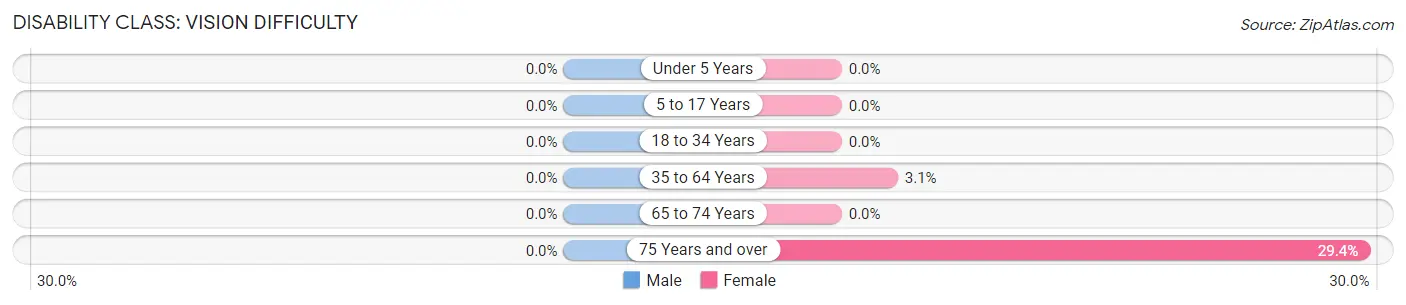
| Age Bracket | Male | Female |
| Under 5 Years | 0 (0.0%) | 0 (0.0%) |
| 5 to 17 Years | 0 (0.0%) | 0 (0.0%) |
| 18 to 34 Years | 0 (0.0%) | 0 (0.0%) |
| 35 to 64 Years | 0 (0.0%) | 1 (3.1%) |
| 65 to 74 Years | 0 (0.0%) | 0 (0.0%) |
| 75 Years and over | 0 (0.0%) | 5 (29.4%) |
Disability Class: Cognitive Difficulty

| Age Bracket | Male | Female |
| 5 to 17 Years | 4 (6.7%) | 3 (6.8%) |
| 18 to 34 Years | 0 (0.0%) | 0 (0.0%) |
| 35 to 64 Years | 0 (0.0%) | 0 (0.0%) |
| 65 to 74 Years | 0 (0.0%) | 0 (0.0%) |
| 75 Years and over | 1 (100.0%) | 5 (29.4%) |
Disability Class: Ambulatory Difficulty
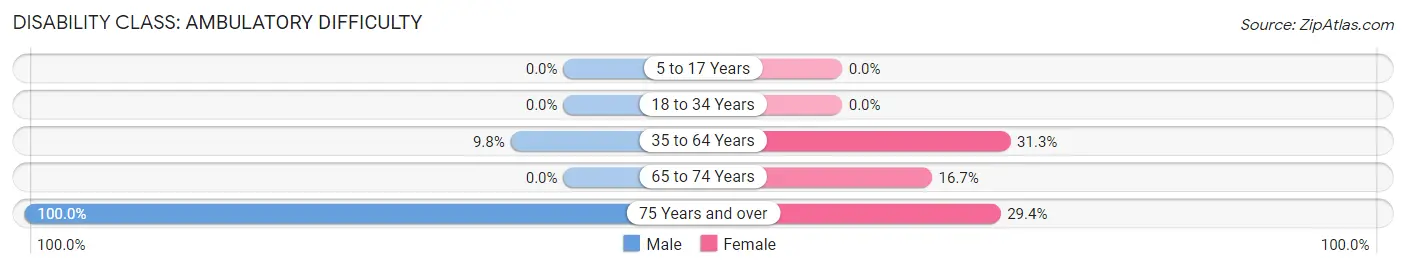
| Age Bracket | Male | Female |
| 5 to 17 Years | 0 (0.0%) | 0 (0.0%) |
| 18 to 34 Years | 0 (0.0%) | 0 (0.0%) |
| 35 to 64 Years | 5 (9.8%) | 10 (31.2%) |
| 65 to 74 Years | 0 (0.0%) | 2 (16.7%) |
| 75 Years and over | 1 (100.0%) | 5 (29.4%) |
Disability Class: Self-Care Difficulty

| Age Bracket | Male | Female |
| 5 to 17 Years | 4 (6.7%) | 0 (0.0%) |
| 18 to 34 Years | 0 (0.0%) | 4 (7.7%) |
| 35 to 64 Years | 0 (0.0%) | 0 (0.0%) |
| 65 to 74 Years | 0 (0.0%) | 2 (16.7%) |
| 75 Years and over | 1 (100.0%) | 0 (0.0%) |
Technology Access in Pilot Station
Computing Device Access in Pilot Station
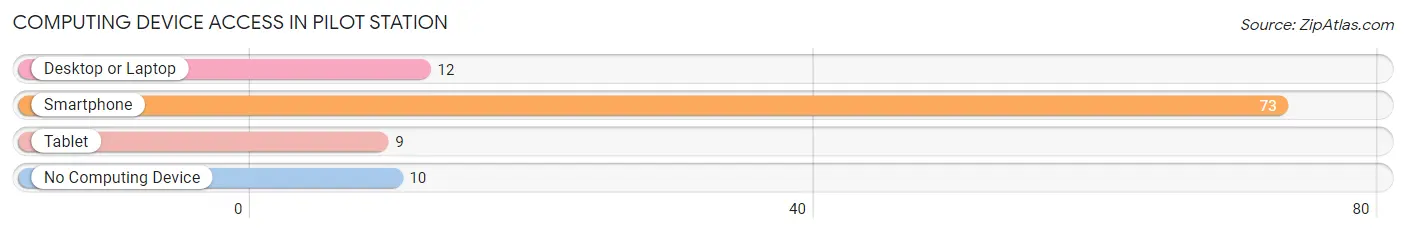
| Device Type | # Households | % Households |
| Desktop or Laptop | 12 | 14.5% |
| Smartphone | 73 | 87.9% |
| Tablet | 9 | 10.8% |
| No Computing Device | 10 | 12.0% |
| Total | 83 | 100.0% |
Internet Access in Pilot Station
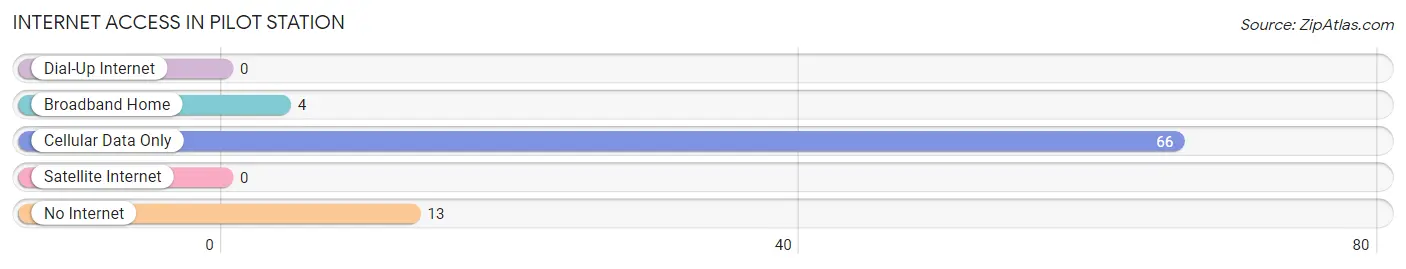
| Internet Type | # Households | % Households |
| Dial-Up Internet | 0 | 0.0% |
| Broadband Home | 4 | 4.8% |
| Cellular Data Only | 66 | 79.5% |
| Satellite Internet | 0 | 0.0% |
| No Internet | 13 | 15.7% |
| Total | 83 | 100.0% |
Pilot Station Summary
Pilot Station is a small unincorporated community located in the Yukon-Kuskokwim Delta region of Alaska. It is situated on the north bank of the Yukon River, approximately 40 miles east of Bethel. The population of Pilot Station was estimated to be around 200 people in 2020.
History
The area around Pilot Station has been inhabited by the Yup'ik people for centuries. The first recorded contact with Europeans was in 1838, when the Russian explorer Vasilii Zagoskin visited the area. In 1867, the United States purchased Alaska from Russia, and the area around Pilot Station became part of the newly formed Alaska Territory.
In the late 19th century, the area around Pilot Station was used as a trading post by the Alaska Commercial Company. In the early 20th century, the area was used as a fishing camp by the local Yup'ik people. In the 1950s, the Alaska Native Claims Settlement Act (ANCSA) was passed, which allowed the Yup'ik people to claim land in the area.
In the 1960s, the Alaska Department of Transportation began to build a road from Bethel to Pilot Station. This road was completed in the 1970s, and it allowed for increased access to the area. In the 1980s, the Alaska Department of Fish and Game began to stock the Yukon River with salmon, which allowed for increased fishing opportunities in the area.
Geography
Pilot Station is located in the Yukon-Kuskokwim Delta region of Alaska. It is situated on the north bank of the Yukon River, approximately 40 miles east of Bethel. The area around Pilot Station is mostly flat, with some rolling hills. The climate is subarctic, with cold winters and mild summers.
The Yukon River is the main source of transportation in the area. The river is used for fishing, transportation, and recreation. The Kuskokwim River is also nearby, and it is used for fishing and transportation.
Economy
The economy of Pilot Station is largely based on subsistence activities, such as fishing, hunting, and gathering. The local Yup'ik people rely heavily on the Yukon River for subsistence activities. The area is also home to several small businesses, such as a general store, a gas station, and a restaurant.
The Alaska Department of Fish and Game stocks the Yukon River with salmon, which provides additional fishing opportunities for the local population. The area is also home to several small-scale tourism businesses, such as guided fishing trips and river tours.
Demographics
The population of Pilot Station was estimated to be around 200 people in 2020. The majority of the population is Yup'ik, and the primary language spoken is Yup'ik. The median household income in Pilot Station is $25,000, and the median age is 33.
Conclusion
Pilot Station is a small unincorporated community located in the Yukon-Kuskokwim Delta region of Alaska. It has a long history of Yup'ik inhabitation, and the local economy is largely based on subsistence activities. The population of Pilot Station is estimated to be around 200 people, and the majority of the population is Yup'ik. The area is home to several small businesses, and it is also a popular destination for fishing and river tours.
Common Questions
What is Per Capita Income in Pilot Station?
Per Capita income in Pilot Station is $14,838.
What is the Median Family Income in Pilot Station?
Median Family Income in Pilot Station is $38,750.
What is the Median Household income in Pilot Station?
Median Household Income in Pilot Station is $41,964.
What is Income or Wage Gap in Pilot Station?
Income or Wage Gap in Pilot Station is 17.0%.
Women in Pilot Station earn 83.0 cents for every dollar earned by a man.
What is Inequality or Gini Index in Pilot Station?
Inequality or Gini Index in Pilot Station is 0.46.
What is the Total Population of Pilot Station?
Total Population of Pilot Station is 380.
What is the Total Male Population of Pilot Station?
Total Male Population of Pilot Station is 208.
What is the Total Female Population of Pilot Station?
Total Female Population of Pilot Station is 172.
What is the Ratio of Males per 100 Females in Pilot Station?
There are 120.93 Males per 100 Females in Pilot Station.
What is the Ratio of Females per 100 Males in Pilot Station?
There are 82.69 Females per 100 Males in Pilot Station.
What is the Median Population Age in Pilot Station?
Median Population Age in Pilot Station is 23.4 Years.
What is the Average Family Size in Pilot Station
Average Family Size in Pilot Station is 4.1 People.
What is the Average Household Size in Pilot Station
Average Household Size in Pilot Station is 4.6 People.
How Large is the Labor Force in Pilot Station?
There are 133 People in the Labor Forcein in Pilot Station.
What is the Percentage of People in the Labor Force in Pilot Station?
54.3% of People are in the Labor Force in Pilot Station.
What is the Unemployment Rate in Pilot Station?
Unemployment Rate in Pilot Station is 21.1%.