Cerulean, KY Map & Demographics
Cerulean Map
Cerulean Overview
$24,195
PER CAPITA INCOME
$77,750
AVG FAMILY INCOME
$54,330
AVG HOUSEHOLD INCOME
0.34
INEQUALITY / GINI INDEX
419
TOTAL POPULATION
216
MALE POPULATION
203
FEMALE POPULATION
106.40
MALES / 100 FEMALES
93.98
FEMALES / 100 MALES
48.8
MEDIAN AGE
2.5
AVG FAMILY SIZE
2.1
AVG HOUSEHOLD SIZE
199
LABOR FORCE [ PEOPLE ]
49.5%
PERCENT IN LABOR FORCE
Cerulean Zip Codes
Income in Cerulean
Income Overview in Cerulean
Per Capita Income in Cerulean is $24,195, while median incomes of families and households are $77,750 and $54,330 respectively.
| Characteristic | Number | Measure |
| Per Capita Income | 419 | $24,195 |
| Median Family Income | 153 | $77,750 |
| Mean Family Income | 153 | $68,876 |
| Median Household Income | 195 | $54,330 |
| Mean Household Income | 195 | $57,424 |
| Income Deficit | 153 | $0 |
| Wage / Income Gap (%) | 419 | 0.00% |
| Wage / Income Gap ($) | 419 | 100.00¢ per $1 |
| Gini / Inequality Index | 419 | 0.34 |
Earnings by Sex in Cerulean
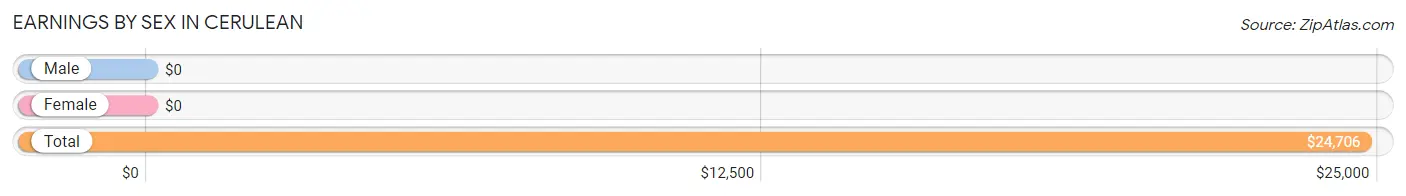
| Sex | Number | Average Earnings |
| Male | 95 (40.6%) | $0 |
| Female | 139 (59.4%) | $0 |
| Total | 234 (100.0%) | $24,706 |
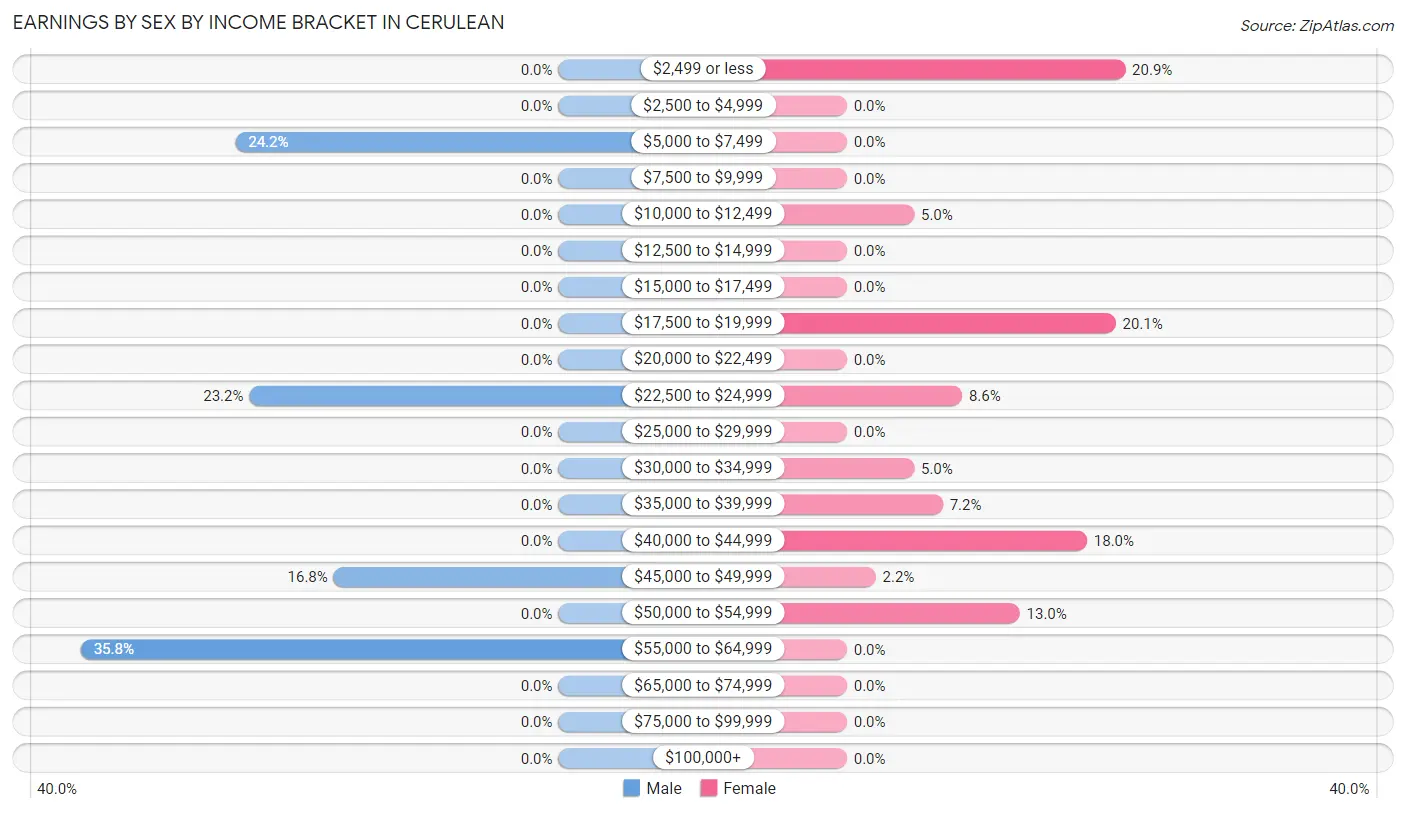
Earnings by Sex by Income Bracket in Cerulean
The most common earnings brackets in Cerulean are $55,000 to $64,999 for men (34 | 35.8%) and $2,499 or less for women (29 | 20.9%).
| Income | Male | Female |
| $2,499 or less | 0 (0.0%) | 29 (20.9%) |
| $2,500 to $4,999 | 0 (0.0%) | 0 (0.0%) |
| $5,000 to $7,499 | 23 (24.2%) | 0 (0.0%) |
| $7,500 to $9,999 | 0 (0.0%) | 0 (0.0%) |
| $10,000 to $12,499 | 0 (0.0%) | 7 (5.0%) |
| $12,500 to $14,999 | 0 (0.0%) | 0 (0.0%) |
| $15,000 to $17,499 | 0 (0.0%) | 0 (0.0%) |
| $17,500 to $19,999 | 0 (0.0%) | 28 (20.1%) |
| $20,000 to $22,499 | 0 (0.0%) | 0 (0.0%) |
| $22,500 to $24,999 | 22 (23.2%) | 12 (8.6%) |
| $25,000 to $29,999 | 0 (0.0%) | 0 (0.0%) |
| $30,000 to $34,999 | 0 (0.0%) | 7 (5.0%) |
| $35,000 to $39,999 | 0 (0.0%) | 10 (7.2%) |
| $40,000 to $44,999 | 0 (0.0%) | 25 (18.0%) |
| $45,000 to $49,999 | 16 (16.8%) | 3 (2.2%) |
| $50,000 to $54,999 | 0 (0.0%) | 18 (13.0%) |
| $55,000 to $64,999 | 34 (35.8%) | 0 (0.0%) |
| $65,000 to $74,999 | 0 (0.0%) | 0 (0.0%) |
| $75,000 to $99,999 | 0 (0.0%) | 0 (0.0%) |
| $100,000+ | 0 (0.0%) | 0 (0.0%) |
| Total | 95 (100.0%) | 139 (100.0%) |
Earnings by Sex by Educational Attainment in Cerulean
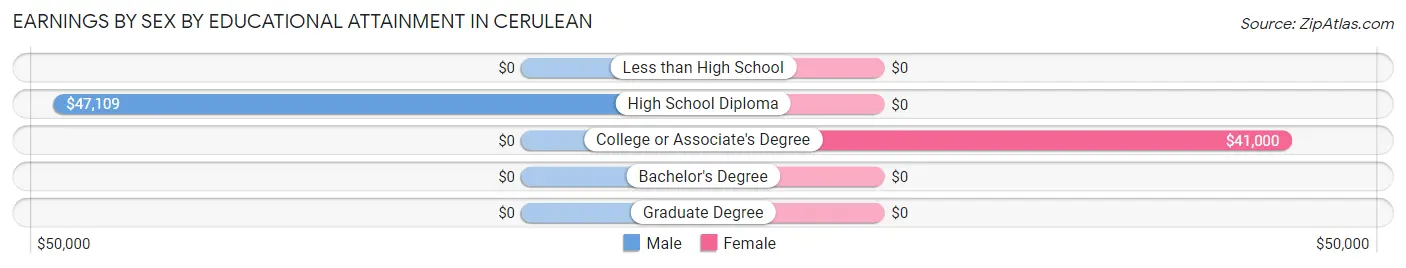
| Educational Attainment | Male Income | Female Income |
| Less than High School | - | - |
| High School Diploma | $47,109 | $0 |
| College or Associate's Degree | - | - |
| Bachelor's Degree | - | - |
| Graduate Degree | - | - |
| Total | - | - |
Family Income in Cerulean
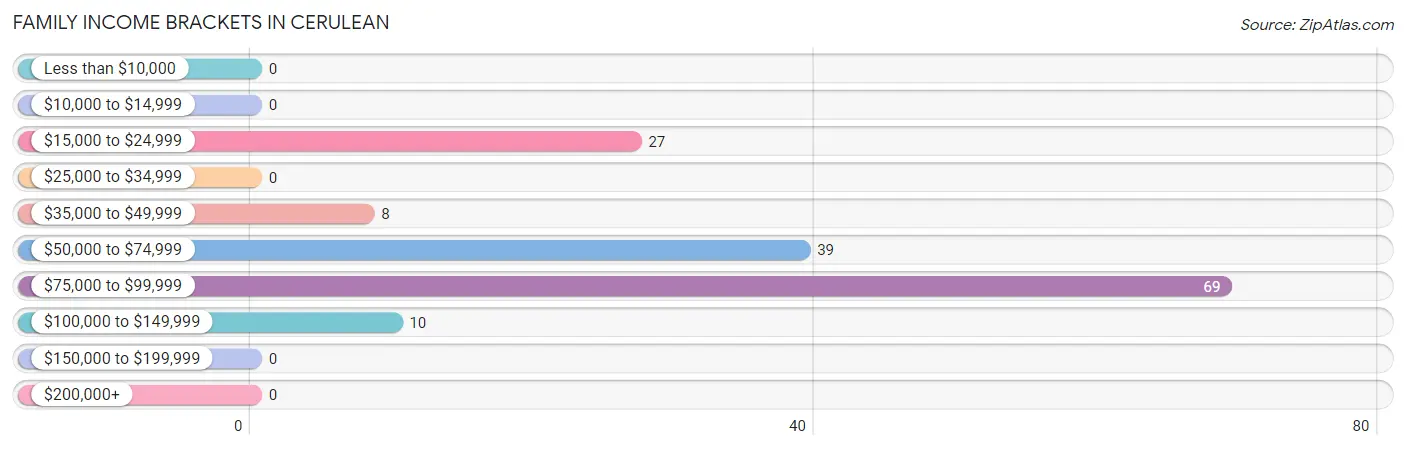
Family Income Brackets in Cerulean
According to the Cerulean family income data, there are 69 families falling into the $75,000 to $99,999 income range, which is the most common income bracket and makes up 45.1% of all families.
| Income Bracket | # Families | % Families |
| Less than $10,000 | 0 | 0.0% |
| $10,000 to $14,999 | 0 | 0.0% |
| $15,000 to $24,999 | 27 | 17.6% |
| $25,000 to $34,999 | 0 | 0.0% |
| $35,000 to $49,999 | 8 | 5.2% |
| $50,000 to $74,999 | 39 | 25.5% |
| $75,000 to $99,999 | 69 | 45.1% |
| $100,000 to $149,999 | 10 | 6.5% |
| $150,000 to $199,999 | 0 | 0.0% |
| $200,000+ | 0 | 0.0% |
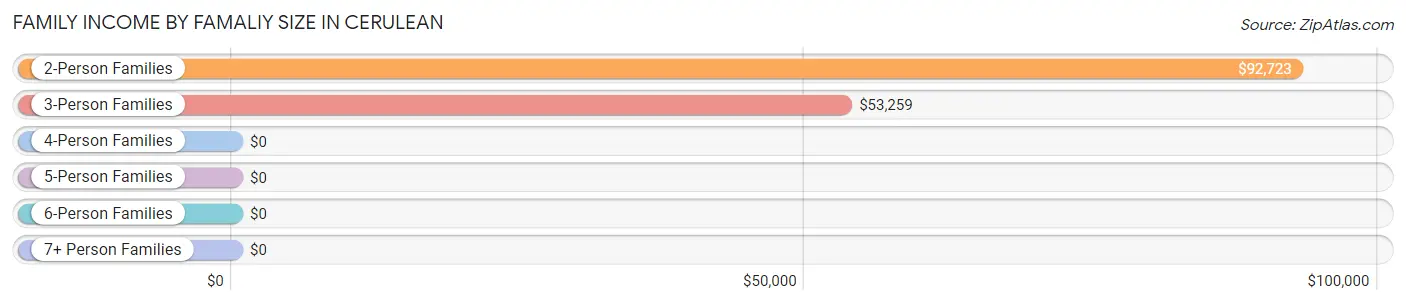
Family Income by Famaliy Size in Cerulean
2-person families (71 | 46.4%) account for the highest median family income in Cerulean with $92,723 per family, while 2-person families (71 | 46.4%) have the highest median income of $46,362 per family member.
| Income Bracket | # Families | Median Income |
| 2-Person Families | 71 (46.4%) | $92,723 |
| 3-Person Families | 71 (46.4%) | $53,259 |
| 4-Person Families | 0 (0.0%) | $0 |
| 5-Person Families | 11 (7.2%) | $0 |
| 6-Person Families | 0 (0.0%) | $0 |
| 7+ Person Families | 0 (0.0%) | $0 |
| Total | 153 (100.0%) | $77,750 |
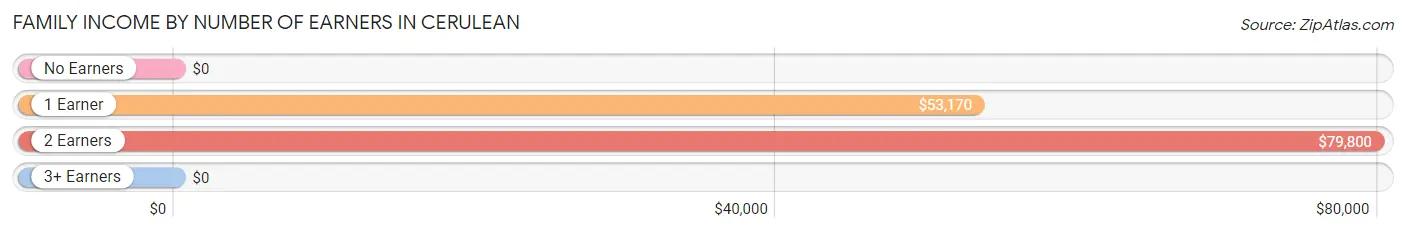
Family Income by Number of Earners in Cerulean
| Number of Earners | # Families | Median Income |
| No Earners | 0 (0.0%) | $0 |
| 1 Earner | 61 (39.9%) | $53,170 |
| 2 Earners | 92 (60.1%) | $79,800 |
| 3+ Earners | 0 (0.0%) | $0 |
| Total | 153 (100.0%) | $77,750 |
Household Income in Cerulean
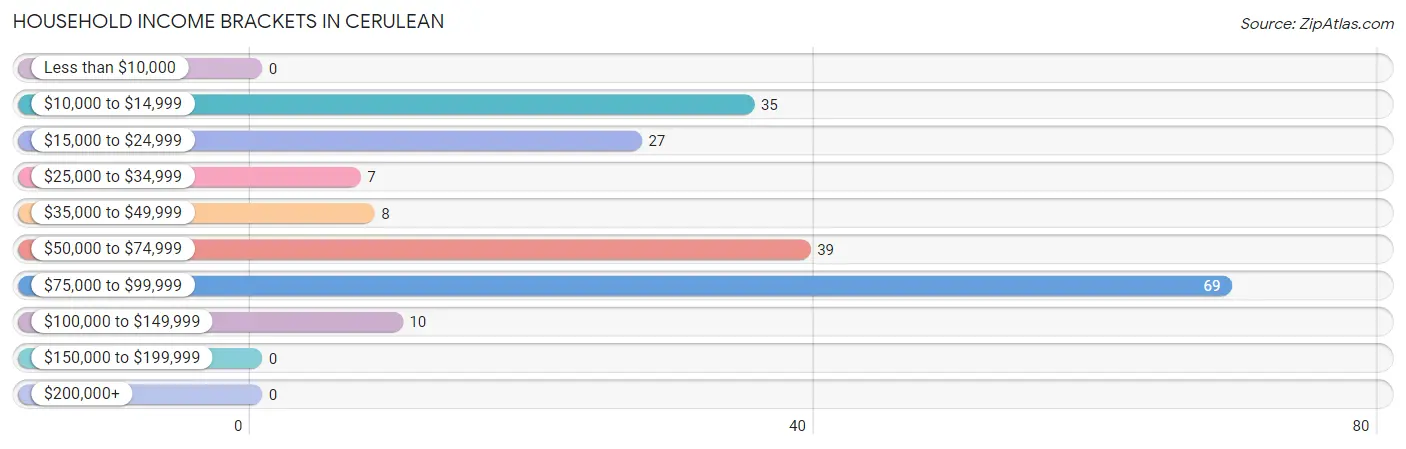
Household Income Brackets in Cerulean
With 69 households falling in the category, the $75,000 to $99,999 income range is the most frequent in Cerulean, accounting for 35.4% of all households.
| Income Bracket | # Households | % Households |
| Less than $10,000 | 0 | 0.0% |
| $10,000 to $14,999 | 35 | 17.9% |
| $15,000 to $24,999 | 27 | 13.8% |
| $25,000 to $34,999 | 7 | 3.6% |
| $35,000 to $49,999 | 8 | 4.1% |
| $50,000 to $74,999 | 39 | 20.0% |
| $75,000 to $99,999 | 69 | 35.4% |
| $100,000 to $149,999 | 10 | 5.1% |
| $150,000 to $199,999 | 0 | 0.0% |
| $200,000+ | 0 | 0.0% |
Household Income by Householder Age in Cerulean
The median household income in Cerulean is $54,330, with the highest median household income of $78,950 found in the 45 to 64 years age bracket for the primary householder. A total of 129 households (66.1%) fall into this category.
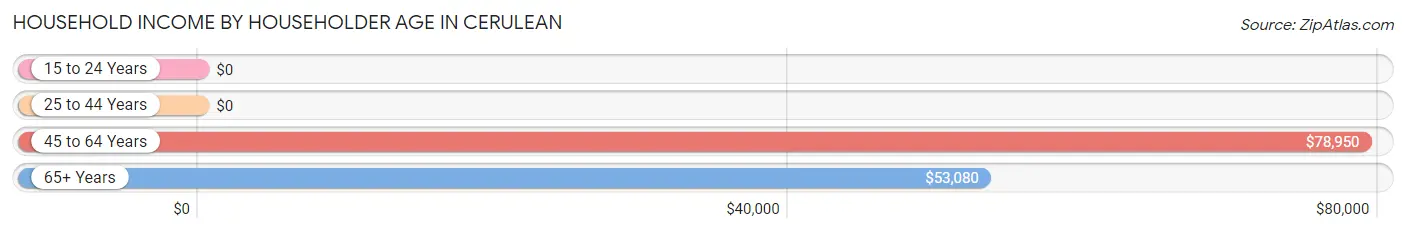
| Income Bracket | # Households | Median Income |
| 15 to 24 Years | 0 (0.0%) | $0 |
| 25 to 44 Years | 23 (11.8%) | $0 |
| 45 to 64 Years | 129 (66.1%) | $78,950 |
| 65+ Years | 43 (22.1%) | $53,080 |
| Total | 195 (100.0%) | $54,330 |
Poverty in Cerulean
Income Below Poverty by Sex and Age in Cerulean
With 33.8% poverty level for males and 33.5% for females among the residents of Cerulean, 55 to 64 year old males and 18 to 24 year old females are the most vulnerable to poverty, with 50 males (100.0%) and 29 females (100.0%) in their respective age groups living below the poverty level.
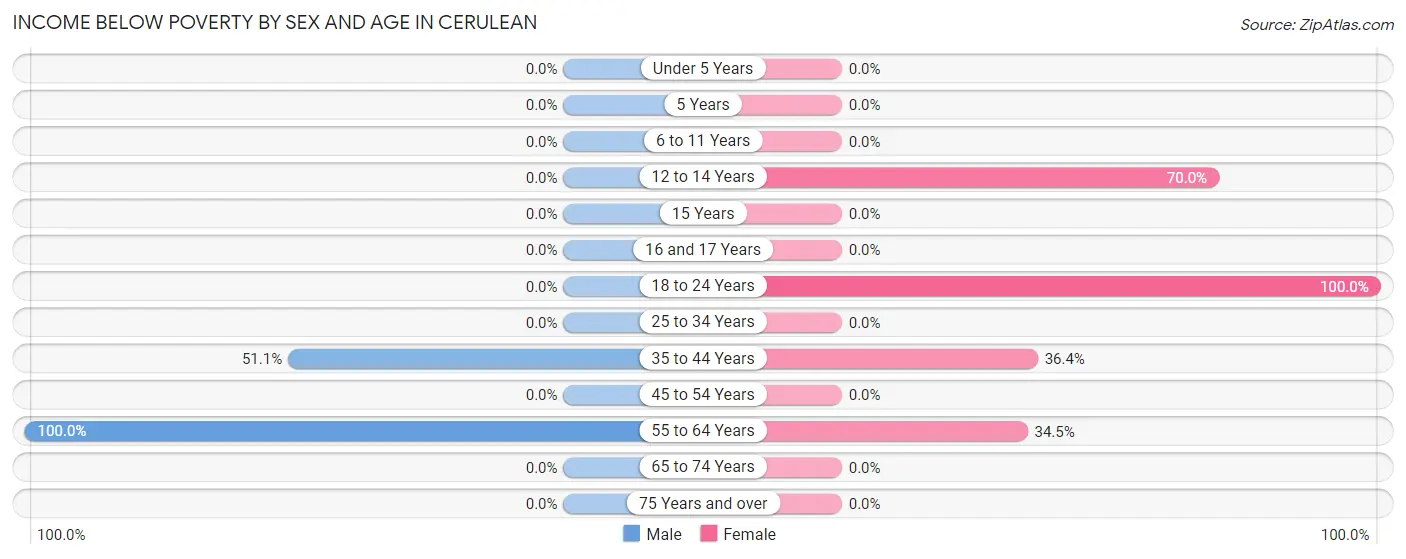
| Age Bracket | Male | Female |
| Under 5 Years | 0 (0.0%) | 0 (0.0%) |
| 5 Years | 0 (0.0%) | 0 (0.0%) |
| 6 to 11 Years | 0 (0.0%) | 0 (0.0%) |
| 12 to 14 Years | 0 (0.0%) | 7 (70.0%) |
| 15 Years | 0 (0.0%) | 0 (0.0%) |
| 16 and 17 Years | 0 (0.0%) | 0 (0.0%) |
| 18 to 24 Years | 0 (0.0%) | 29 (100.0%) |
| 25 to 34 Years | 0 (0.0%) | 0 (0.0%) |
| 35 to 44 Years | 23 (51.1%) | 12 (36.4%) |
| 45 to 54 Years | 0 (0.0%) | 0 (0.0%) |
| 55 to 64 Years | 50 (100.0%) | 20 (34.5%) |
| 65 to 74 Years | 0 (0.0%) | 0 (0.0%) |
| 75 Years and over | 0 (0.0%) | 0 (0.0%) |
| Total | 73 (33.8%) | 68 (33.5%) |
Income Above Poverty by Sex and Age in Cerulean
According to the poverty statistics in Cerulean, males aged under 5 years and females aged under 5 years are the age groups that are most secure financially, with 100.0% of males and 100.0% of females in these age groups living above the poverty line.
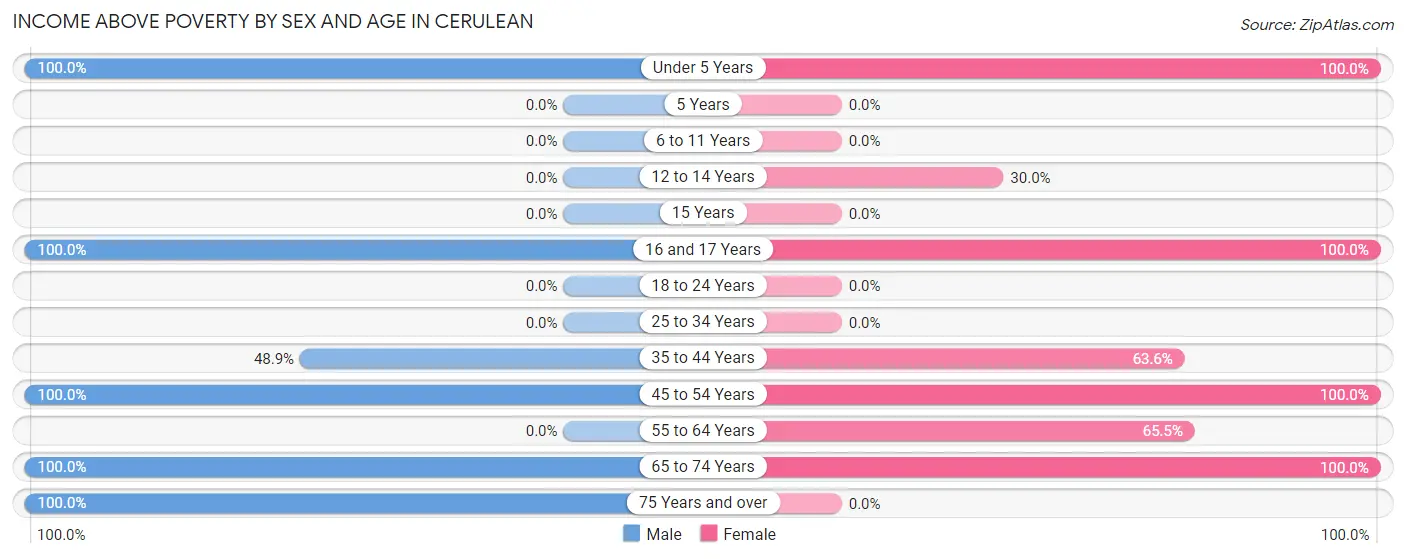
| Age Bracket | Male | Female |
| Under 5 Years | 3 (100.0%) | 4 (100.0%) |
| 5 Years | 0 (0.0%) | 0 (0.0%) |
| 6 to 11 Years | 0 (0.0%) | 0 (0.0%) |
| 12 to 14 Years | 0 (0.0%) | 3 (30.0%) |
| 15 Years | 0 (0.0%) | 0 (0.0%) |
| 16 and 17 Years | 15 (100.0%) | 30 (100.0%) |
| 18 to 24 Years | 0 (0.0%) | 0 (0.0%) |
| 25 to 34 Years | 0 (0.0%) | 0 (0.0%) |
| 35 to 44 Years | 22 (48.9%) | 21 (63.6%) |
| 45 to 54 Years | 26 (100.0%) | 32 (100.0%) |
| 55 to 64 Years | 0 (0.0%) | 38 (65.5%) |
| 65 to 74 Years | 62 (100.0%) | 7 (100.0%) |
| 75 Years and over | 15 (100.0%) | 0 (0.0%) |
| Total | 143 (66.2%) | 135 (66.5%) |
Income Below Poverty Among Married-Couple Families in Cerulean
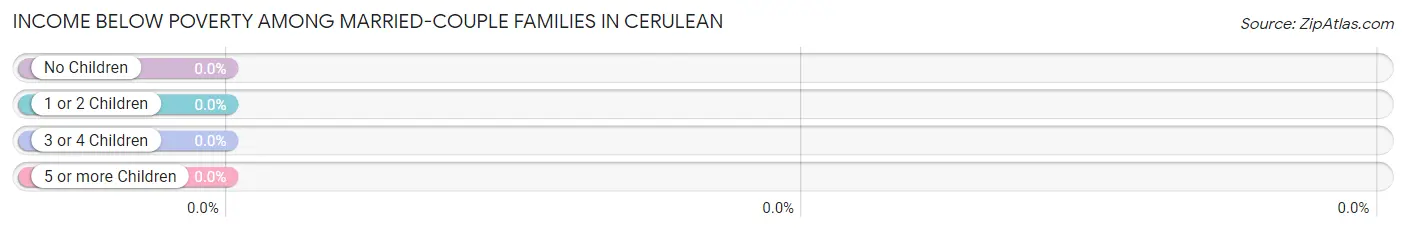
| Children | Above Poverty | Below Poverty |
| No Children | 46 (100.0%) | 0 (0.0%) |
| 1 or 2 Children | 16 (100.0%) | 0 (0.0%) |
| 3 or 4 Children | 11 (100.0%) | 0 (0.0%) |
| 5 or more Children | 0 (0.0%) | 0 (0.0%) |
| Total | 73 (100.0%) | 0 (0.0%) |
Income Below Poverty Among Single-Parent Households in Cerulean
According to the poverty data in Cerulean, 34.9% or 15 single-father households and 32.4% or 12 single-mother households are living below the poverty line. Among single-father households, those with no children have the highest poverty rate, with 15 households (100.0%) experiencing poverty. Likewise, among single-mother households, those with 1 or 2 children have the highest poverty rate, with 12 households (100.0%) falling below the poverty line.
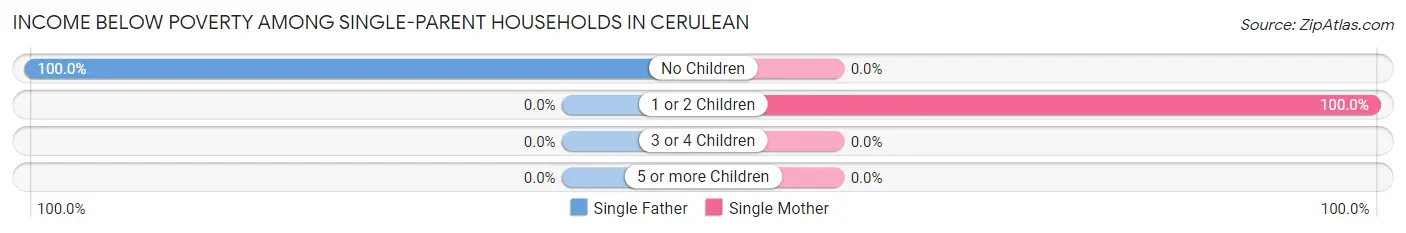
| Children | Single Father | Single Mother |
| No Children | 15 (100.0%) | 0 (0.0%) |
| 1 or 2 Children | 0 (0.0%) | 12 (100.0%) |
| 3 or 4 Children | 0 (0.0%) | 0 (0.0%) |
| 5 or more Children | 0 (0.0%) | 0 (0.0%) |
| Total | 15 (34.9%) | 12 (32.4%) |
Income Below Poverty Among Married-Couple vs Single-Parent Households in Cerulean
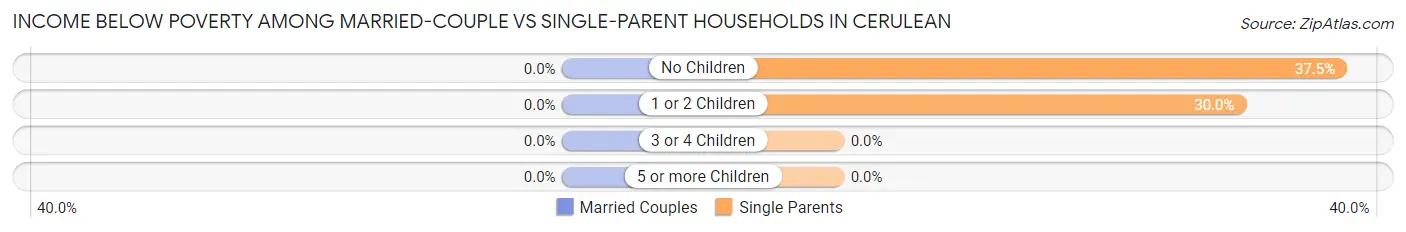
| Children | Married-Couple Families | Single-Parent Households |
| No Children | 0 (0.0%) | 15 (37.5%) |
| 1 or 2 Children | 0 (0.0%) | 12 (30.0%) |
| 3 or 4 Children | 0 (0.0%) | 0 (0.0%) |
| 5 or more Children | 0 (0.0%) | 0 (0.0%) |
| Total | 0 (0.0%) | 27 (33.8%) |
Race in Cerulean
The most populous races in Cerulean are Black / African American (232 | 55.4%), White / Caucasian (163 | 38.9%), and Two or more Races (18 | 4.3%).
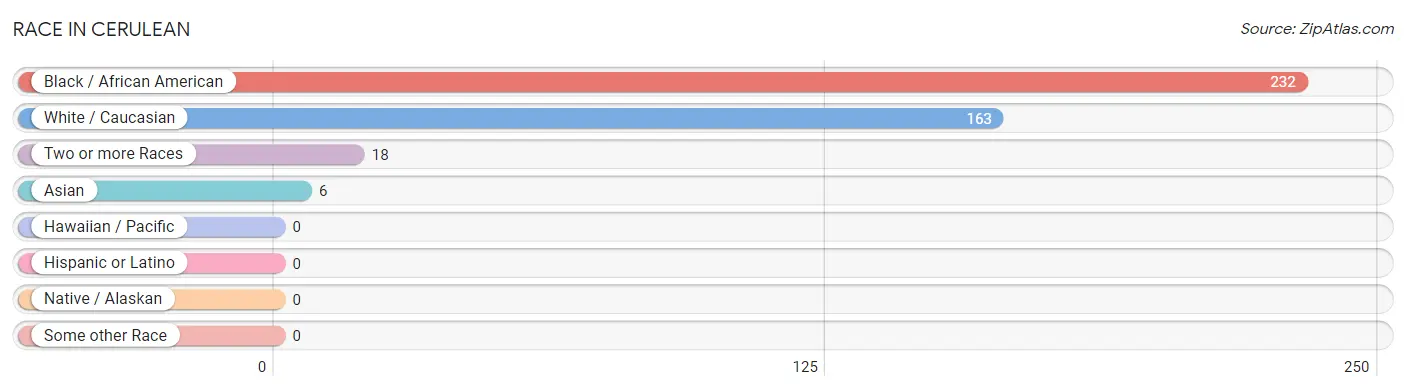
| Race | # Population | % Population |
| Asian | 6 | 1.4% |
| Black / African American | 232 | 55.4% |
| Hawaiian / Pacific | 0 | 0.0% |
| Hispanic or Latino | 0 | 0.0% |
| Native / Alaskan | 0 | 0.0% |
| White / Caucasian | 163 | 38.9% |
| Two or more Races | 18 | 4.3% |
| Some other Race | 0 | 0.0% |
| Total | 419 | 100.0% |
Ancestry in Cerulean
The most populous ancestries reported in Cerulean are American (87 | 20.8%), and Korean (13 | 3.1%), together accounting for 23.9% of all Cerulean residents.
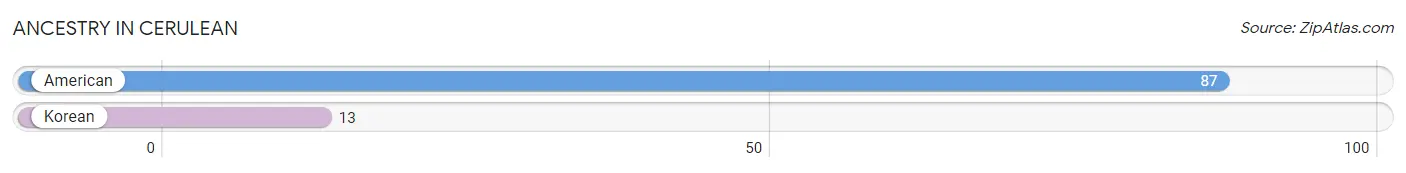
| Ancestry | # Population | % Population |
| American | 87 | 20.8% |
| Korean | 13 | 3.1% | View All 2 Rows |
Immigrants in Cerulean
The most numerous immigrant groups reported in Cerulean came from Asia (6 | 1.4%), Philippines (6 | 1.4%), and South Eastern Asia (6 | 1.4%), together accounting for 4.3% of all Cerulean residents.
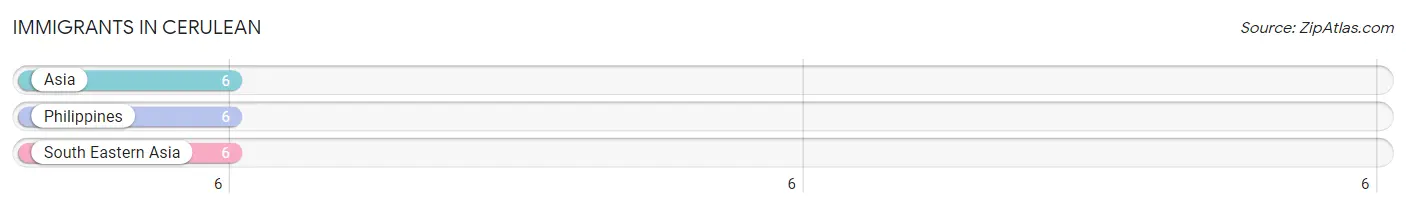
| Immigration Origin | # Population | % Population |
| Asia | 6 | 1.4% |
| Philippines | 6 | 1.4% |
| South Eastern Asia | 6 | 1.4% | View All 3 Rows |
Sex and Age in Cerulean
Sex and Age in Cerulean
The most populous age groups in Cerulean are 60 to 64 Years (50 | 23.2%) for men and 45 to 49 Years (32 | 15.8%) for women.
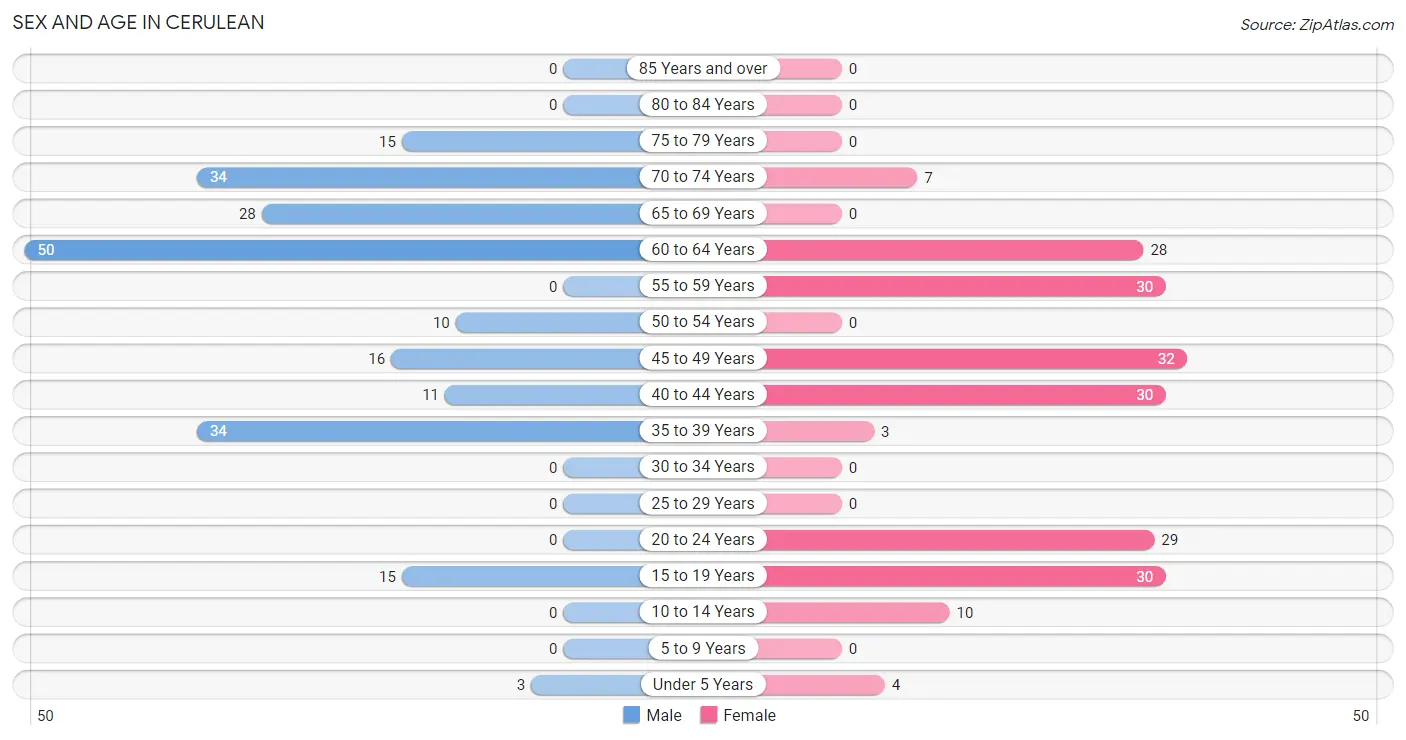
| Age Bracket | Male | Female |
| Under 5 Years | 3 (1.4%) | 4 (2.0%) |
| 5 to 9 Years | 0 (0.0%) | 0 (0.0%) |
| 10 to 14 Years | 0 (0.0%) | 10 (4.9%) |
| 15 to 19 Years | 15 (6.9%) | 30 (14.8%) |
| 20 to 24 Years | 0 (0.0%) | 29 (14.3%) |
| 25 to 29 Years | 0 (0.0%) | 0 (0.0%) |
| 30 to 34 Years | 0 (0.0%) | 0 (0.0%) |
| 35 to 39 Years | 34 (15.7%) | 3 (1.5%) |
| 40 to 44 Years | 11 (5.1%) | 30 (14.8%) |
| 45 to 49 Years | 16 (7.4%) | 32 (15.8%) |
| 50 to 54 Years | 10 (4.6%) | 0 (0.0%) |
| 55 to 59 Years | 0 (0.0%) | 30 (14.8%) |
| 60 to 64 Years | 50 (23.2%) | 28 (13.8%) |
| 65 to 69 Years | 28 (13.0%) | 0 (0.0%) |
| 70 to 74 Years | 34 (15.7%) | 7 (3.5%) |
| 75 to 79 Years | 15 (6.9%) | 0 (0.0%) |
| 80 to 84 Years | 0 (0.0%) | 0 (0.0%) |
| 85 Years and over | 0 (0.0%) | 0 (0.0%) |
| Total | 216 (100.0%) | 203 (100.0%) |
Families and Households in Cerulean
Median Family Size in Cerulean
The median family size in Cerulean is 2.46 persons per family, with single male/father families (43 | 28.1%) accounting for the largest median family size of 3.12 persons per family. On the other hand, married-couple families (73 | 47.7%) represent the smallest median family size with 2.18 persons per family.
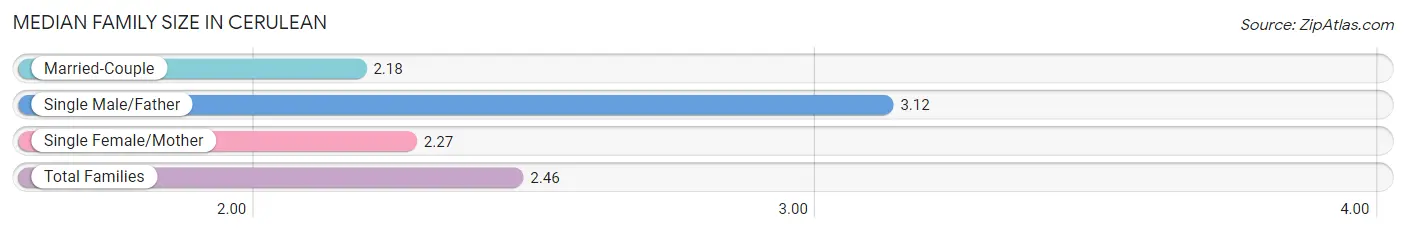
| Family Type | # Families | Family Size |
| Married-Couple | 73 (47.7%) | 2.18 |
| Single Male/Father | 43 (28.1%) | 3.12 |
| Single Female/Mother | 37 (24.2%) | 2.27 |
| Total Families | 153 (100.0%) | 2.46 |
Median Household Size in Cerulean
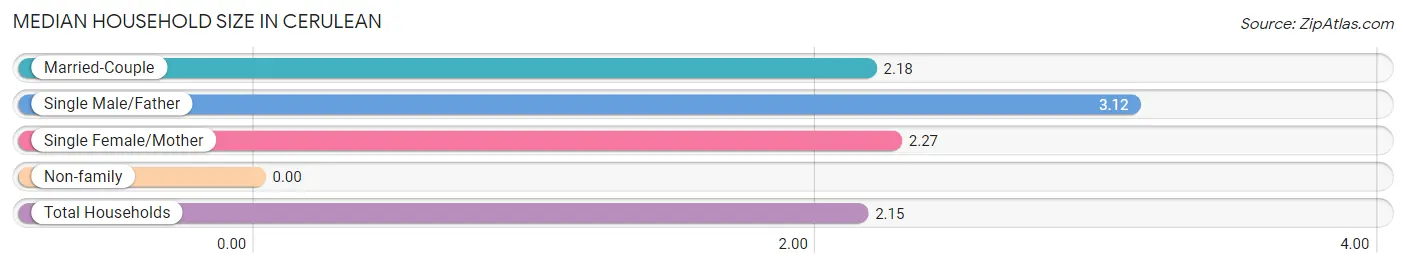
| Household Type | # Households | Household Size |
| Married-Couple | 73 (37.4%) | 2.18 |
| Single Male/Father | 43 (22.1%) | 3.12 |
| Single Female/Mother | 37 (19.0%) | 2.27 |
| Non-family | 42 (21.5%) | - |
| Total Households | 195 (100.0%) | 2.15 |
Household Size by Marriage Status in Cerulean
Out of a total of 195 households in Cerulean, 153 (78.5%) are family households, while 42 (21.5%) are nonfamily households. The most numerous type of family households are 2-person households, comprising 71, and the most common type of nonfamily households are 1-person households, comprising 42.
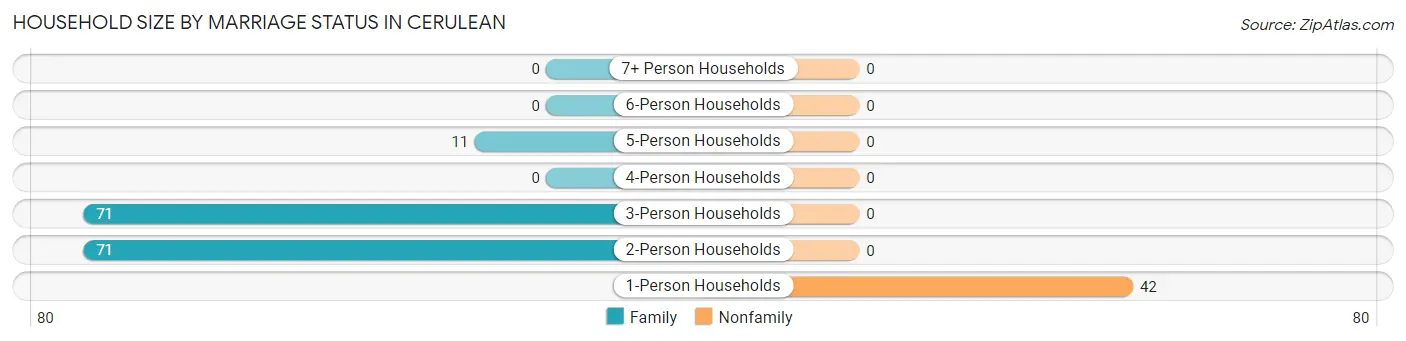
| Household Size | Family Households | Nonfamily Households |
| 1-Person Households | - | 42 (21.5%) |
| 2-Person Households | 71 (36.4%) | 0 (0.0%) |
| 3-Person Households | 71 (36.4%) | 0 (0.0%) |
| 4-Person Households | 0 (0.0%) | 0 (0.0%) |
| 5-Person Households | 11 (5.6%) | 0 (0.0%) |
| 6-Person Households | 0 (0.0%) | 0 (0.0%) |
| 7+ Person Households | 0 (0.0%) | 0 (0.0%) |
| Total | 153 (78.5%) | 42 (21.5%) |
Female Fertility in Cerulean
Fertility by Age in Cerulean
| Age Bracket | Women with Births | Births / 1,000 Women |
| 15 to 19 years | 0 (0.0%) | 0.0 |
| 20 to 34 years | 0 (0.0%) | 0.0 |
| 35 to 50 years | 0 (0.0%) | 0.0 |
| Total | 0 (0.0%) | 0.0 |
Fertility by Age by Marriage Status in Cerulean
| Age Bracket | Married | Unmarried |
| 15 to 19 years | 0 (0.0%) | 0 (0.0%) |
| 20 to 34 years | 0 (0.0%) | 0 (0.0%) |
| 35 to 50 years | 0 (0.0%) | 0 (0.0%) |
| Total | 0 (0.0%) | 0 (0.0%) |
Fertility by Education in Cerulean
| Educational Attainment | Women with Births | Births / 1,000 Women |
| Less than High School | 0 (0.0%) | 0.0 |
| High School Diploma | 0 (0.0%) | 0.0 |
| College or Associate's Degree | 0 (0.0%) | 0.0 |
| Bachelor's Degree | 0 (0.0%) | 0.0 |
| Graduate Degree | 0 (0.0%) | 0.0 |
| Total | 0 (0.0%) | 0.0 |
Fertility by Education by Marriage Status in Cerulean
| Educational Attainment | Married | Unmarried |
| Less than High School | 0 (0.0%) | 0 (0.0%) |
| High School Diploma | 0 (0.0%) | 0 (0.0%) |
| College or Associate's Degree | 0 (0.0%) | 0 (0.0%) |
| Bachelor's Degree | 0 (0.0%) | 0 (0.0%) |
| Graduate Degree | 0 (0.0%) | 0 (0.0%) |
| Total | 0 (0.0%) | 0 (0.0%) |
Employment Characteristics in Cerulean
Employment by Class of Employer in Cerulean
Among the 199 employed individuals in Cerulean, private company employees (144 | 72.4%), self-employed (not incorporated) (45 | 22.6%), and federal government employees (10 | 5.0%) make up the most common classes of employment.
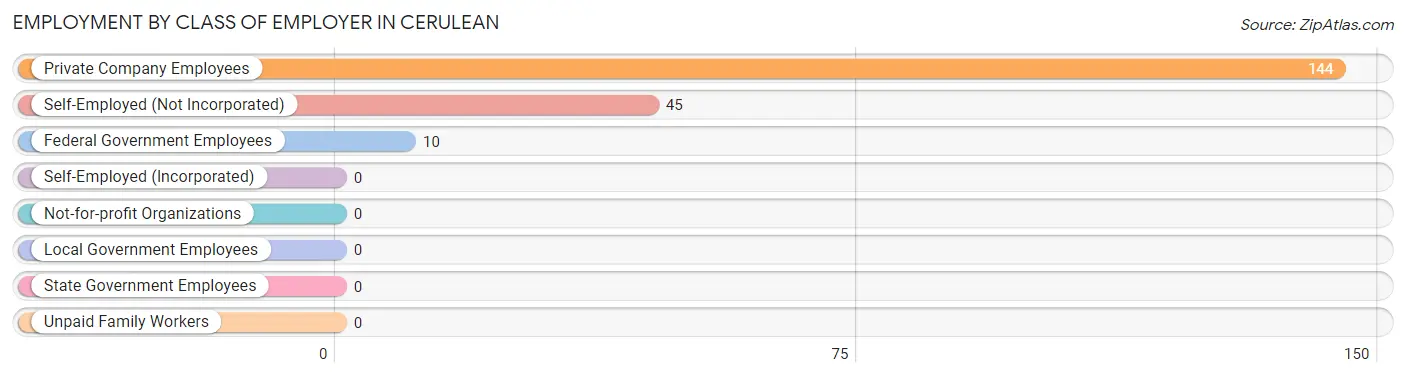
| Employer Class | # Employees | % Employees |
| Private Company Employees | 144 | 72.4% |
| Self-Employed (Incorporated) | 0 | 0.0% |
| Self-Employed (Not Incorporated) | 45 | 22.6% |
| Not-for-profit Organizations | 0 | 0.0% |
| Local Government Employees | 0 | 0.0% |
| State Government Employees | 0 | 0.0% |
| Federal Government Employees | 10 | 5.0% |
| Unpaid Family Workers | 0 | 0.0% |
| Total | 199 | 100.0% |
Employment Status by Age in Cerulean
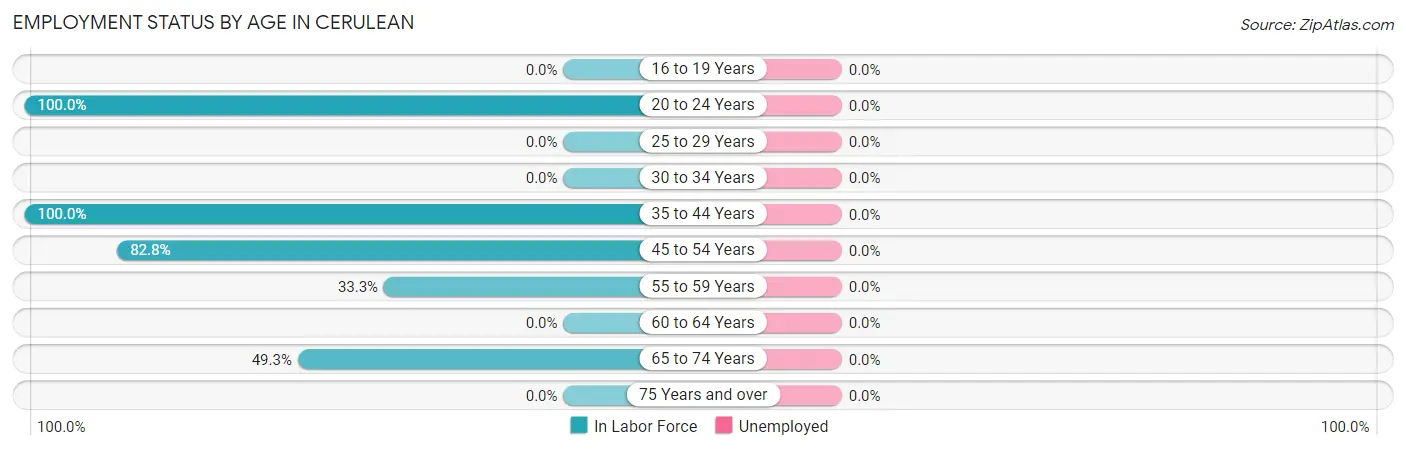
| Age Bracket | In Labor Force | Unemployed |
| 16 to 19 Years | 0 (0.0%) | 0 (0.0%) |
| 20 to 24 Years | 29 (100.0%) | 0 (0.0%) |
| 25 to 29 Years | 0 (0.0%) | 0 (0.0%) |
| 30 to 34 Years | 0 (0.0%) | 0 (0.0%) |
| 35 to 44 Years | 78 (100.0%) | 0 (0.0%) |
| 45 to 54 Years | 48 (82.8%) | 0 (0.0%) |
| 55 to 59 Years | 10 (33.3%) | 0 (0.0%) |
| 60 to 64 Years | 0 (0.0%) | 0 (0.0%) |
| 65 to 74 Years | 34 (49.3%) | 0 (0.0%) |
| 75 Years and over | 0 (0.0%) | 0 (0.0%) |
| Total | 199 (49.5%) | 0 (0.0%) |
Employment Status by Educational Attainment in Cerulean
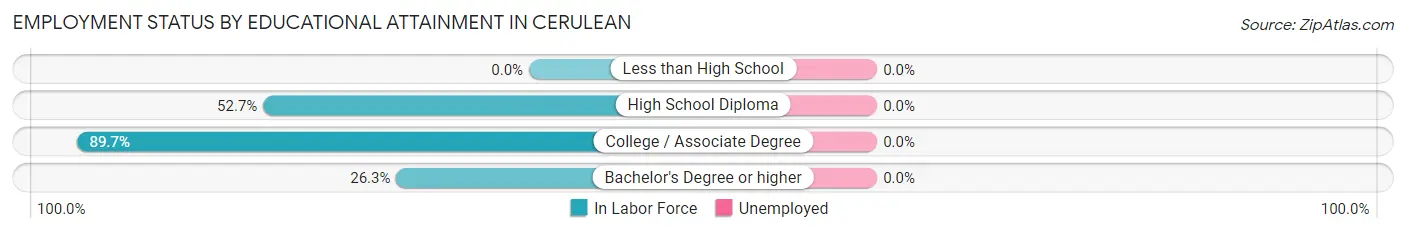
| Educational Attainment | In Labor Force | Unemployed |
| Less than High School | 0 (0.0%) | 0 (0.0%) |
| High School Diploma | 39 (52.7%) | 0 (0.0%) |
| College / Associate Degree | 87 (89.7%) | 0 (0.0%) |
| Bachelor's Degree or higher | 10 (26.3%) | 0 (0.0%) |
| Total | 136 (55.7%) | 0 (0.0%) |
Employment Occupations by Sex in Cerulean
Management, Business, Science and Arts Occupations
The most common Management, Business, Science and Arts occupations in Cerulean are , and Management (57 | 28.6%).
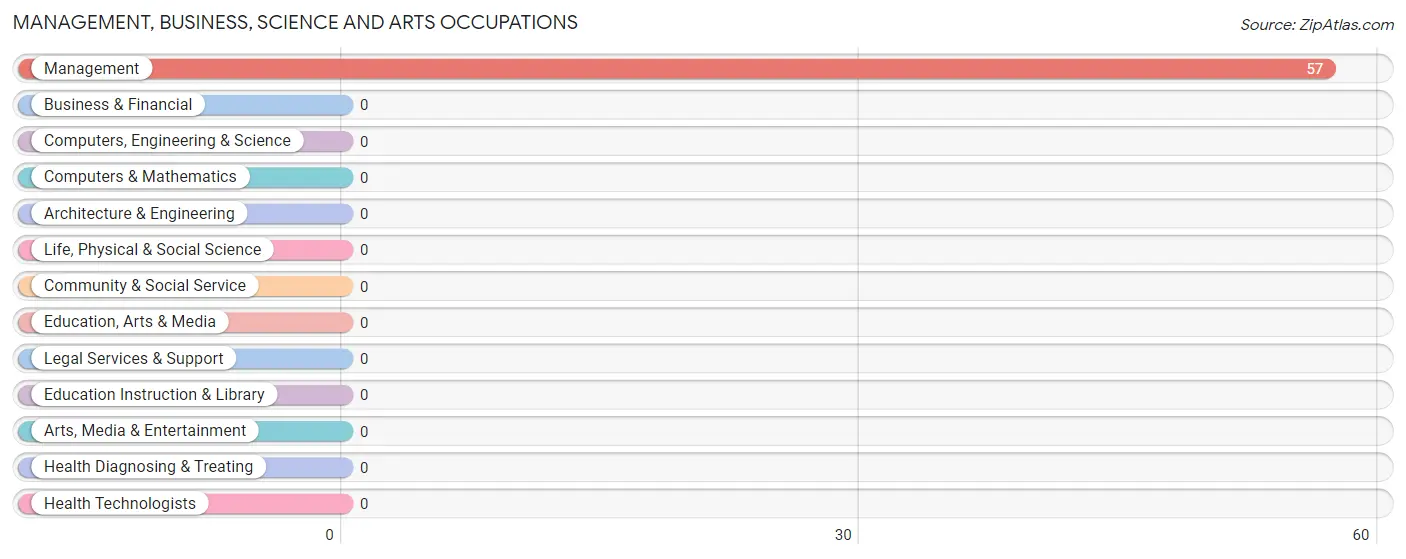
Management, Business, Science and Arts Occupations by Sex
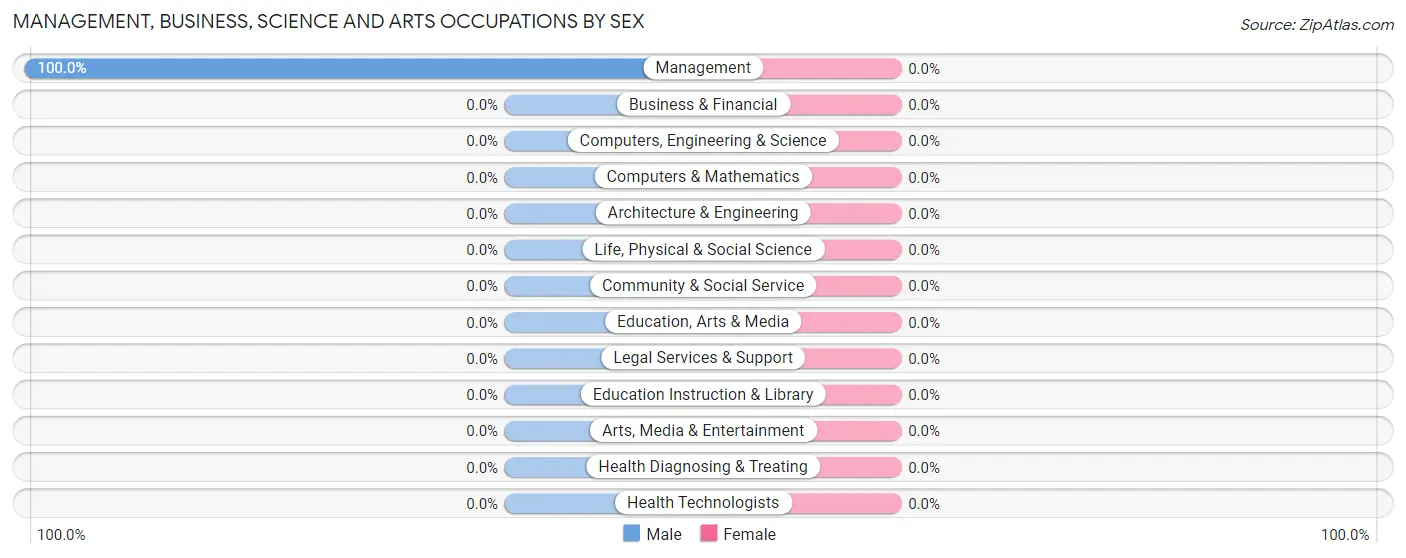
| Occupation | Male | Female |
| Management | 57 (100.0%) | 0 (0.0%) |
| Business & Financial | 0 (0.0%) | 0 (0.0%) |
| Computers, Engineering & Science | 0 (0.0%) | 0 (0.0%) |
| Computers & Mathematics | 0 (0.0%) | 0 (0.0%) |
| Architecture & Engineering | 0 (0.0%) | 0 (0.0%) |
| Life, Physical & Social Science | 0 (0.0%) | 0 (0.0%) |
| Community & Social Service | 0 (0.0%) | 0 (0.0%) |
| Education, Arts & Media | 0 (0.0%) | 0 (0.0%) |
| Legal Services & Support | 0 (0.0%) | 0 (0.0%) |
| Education Instruction & Library | 0 (0.0%) | 0 (0.0%) |
| Arts, Media & Entertainment | 0 (0.0%) | 0 (0.0%) |
| Health Diagnosing & Treating | 0 (0.0%) | 0 (0.0%) |
| Health Technologists | 0 (0.0%) | 0 (0.0%) |
| Total (Category) | 57 (100.0%) | 0 (0.0%) |
| Total (Overall) | 95 (47.7%) | 104 (52.3%) |
Services Occupations
The most common Services occupations in Cerulean are Food Preparation & Serving (29 | 14.6%), Security & Protection (11 | 5.5%), and Law Enforcement (11 | 5.5%).
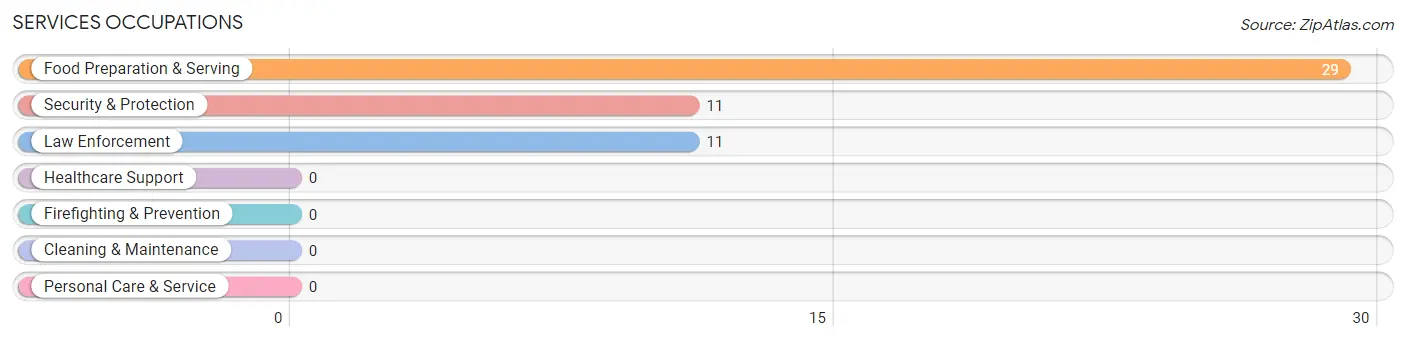
Services Occupations by Sex
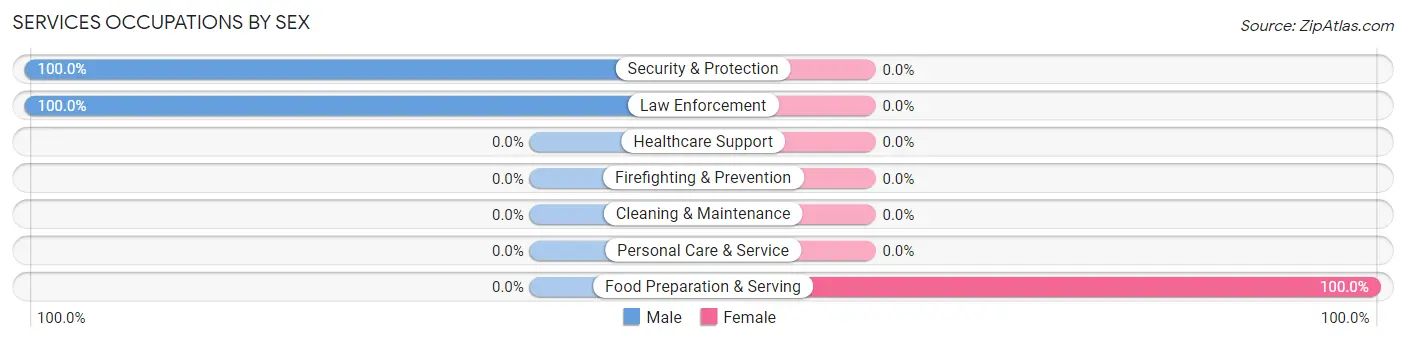
| Occupation | Male | Female |
| Healthcare Support | 0 (0.0%) | 0 (0.0%) |
| Security & Protection | 11 (100.0%) | 0 (0.0%) |
| Firefighting & Prevention | 0 (0.0%) | 0 (0.0%) |
| Law Enforcement | 11 (100.0%) | 0 (0.0%) |
| Food Preparation & Serving | 0 (0.0%) | 29 (100.0%) |
| Cleaning & Maintenance | 0 (0.0%) | 0 (0.0%) |
| Personal Care & Service | 0 (0.0%) | 0 (0.0%) |
| Total (Category) | 11 (27.5%) | 29 (72.5%) |
| Total (Overall) | 95 (47.7%) | 104 (52.3%) |
Sales and Office Occupations
The most common Sales and Office occupations in Cerulean are Office & Administration (33 | 16.6%), and Sales & Related (3 | 1.5%).
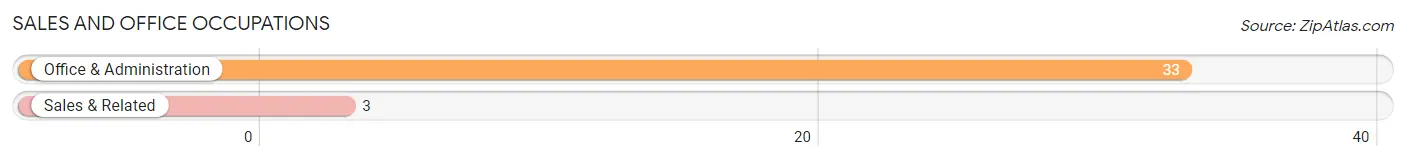
Sales and Office Occupations by Sex
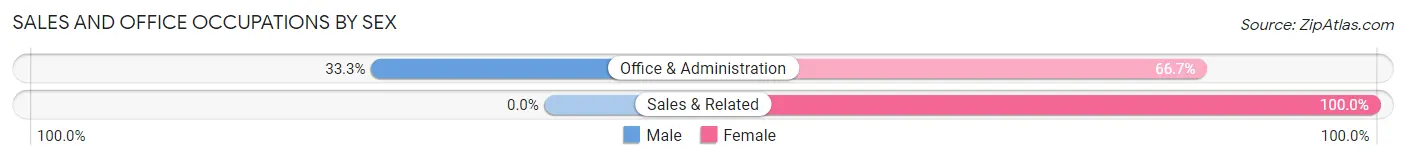
| Occupation | Male | Female |
| Sales & Related | 0 (0.0%) | 3 (100.0%) |
| Office & Administration | 11 (33.3%) | 22 (66.7%) |
| Total (Category) | 11 (30.6%) | 25 (69.4%) |
| Total (Overall) | 95 (47.7%) | 104 (52.3%) |
Natural Resources, Construction and Maintenance Occupations
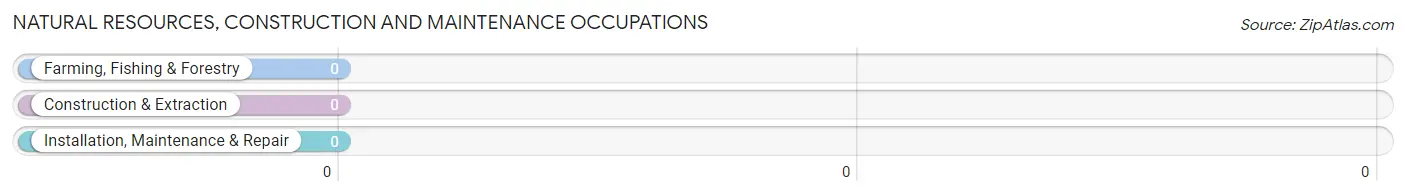
Natural Resources, Construction and Maintenance Occupations by Sex
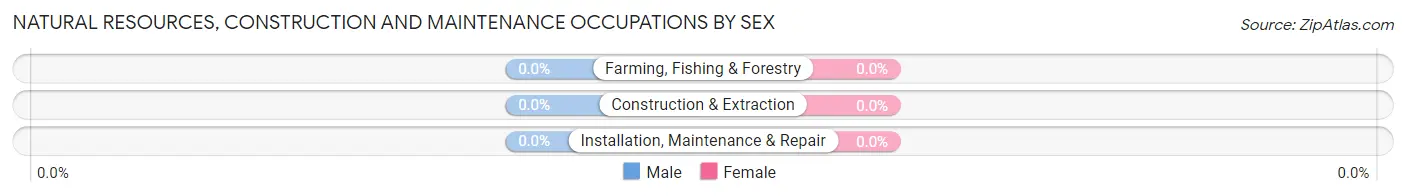
| Occupation | Male | Female |
| Farming, Fishing & Forestry | 0 (0.0%) | 0 (0.0%) |
| Construction & Extraction | 0 (0.0%) | 0 (0.0%) |
| Installation, Maintenance & Repair | 0 (0.0%) | 0 (0.0%) |
| Total (Category) | 0 (0.0%) | 0 (0.0%) |
| Total (Overall) | 95 (47.7%) | 104 (52.3%) |
Production, Transportation and Moving Occupations
The most common Production, Transportation and Moving occupations in Cerulean are Production (41 | 20.6%), and Transportation (25 | 12.6%).
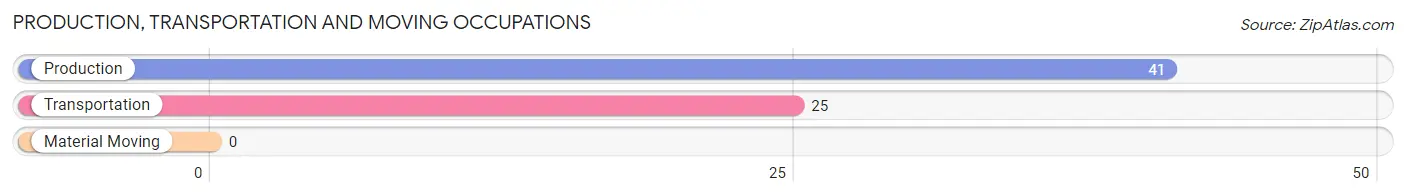
Production, Transportation and Moving Occupations by Sex
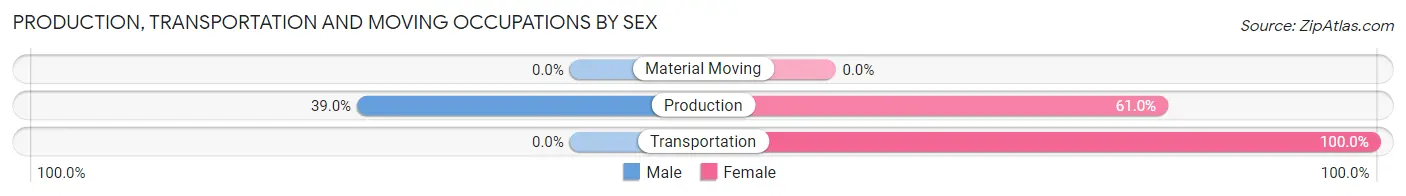
| Occupation | Male | Female |
| Production | 16 (39.0%) | 25 (61.0%) |
| Transportation | 0 (0.0%) | 25 (100.0%) |
| Material Moving | 0 (0.0%) | 0 (0.0%) |
| Total (Category) | 16 (24.2%) | 50 (75.8%) |
| Total (Overall) | 95 (47.7%) | 104 (52.3%) |
Employment Industries by Sex in Cerulean
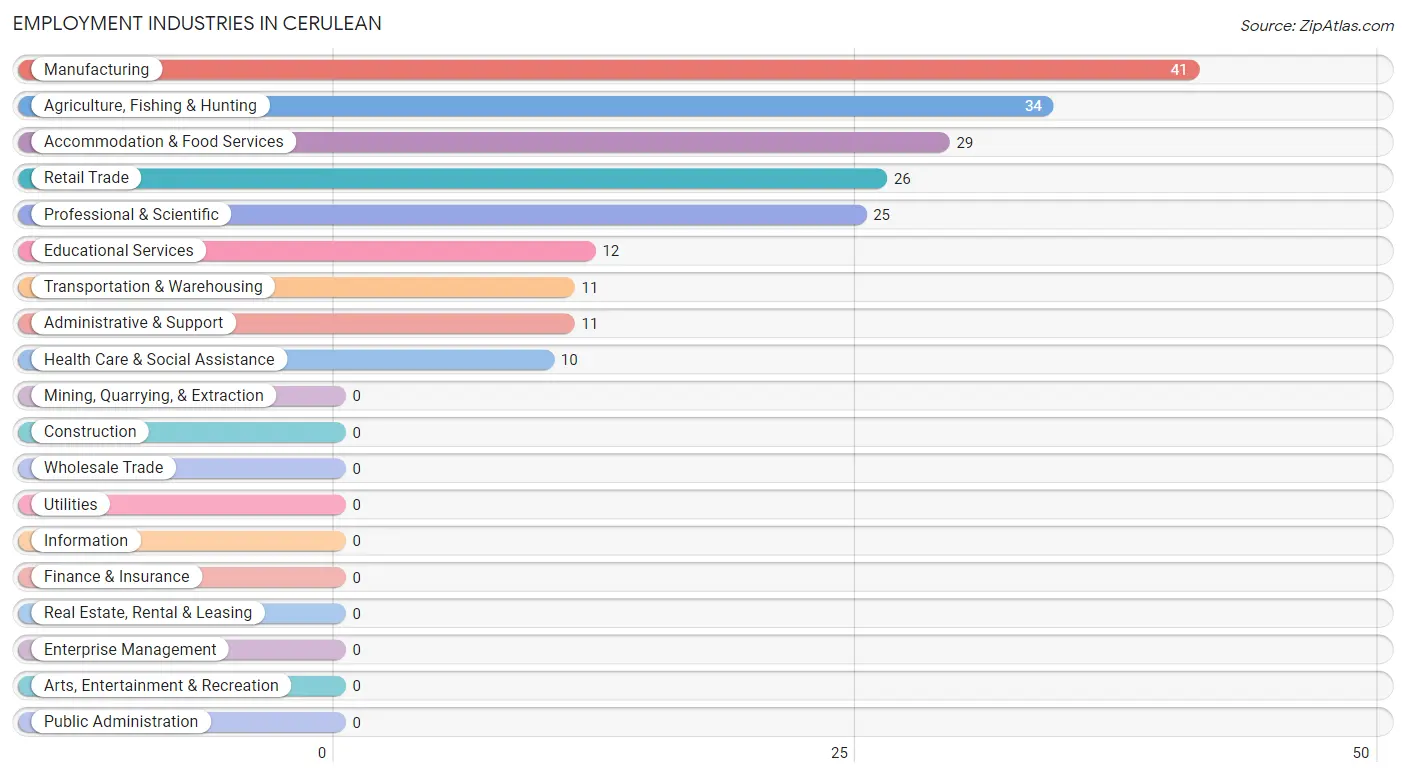
Employment Industries in Cerulean
The major employment industries in Cerulean include Manufacturing (41 | 20.6%), Agriculture, Fishing & Hunting (34 | 17.1%), Accommodation & Food Services (29 | 14.6%), Retail Trade (26 | 13.1%), and Professional & Scientific (25 | 12.6%).
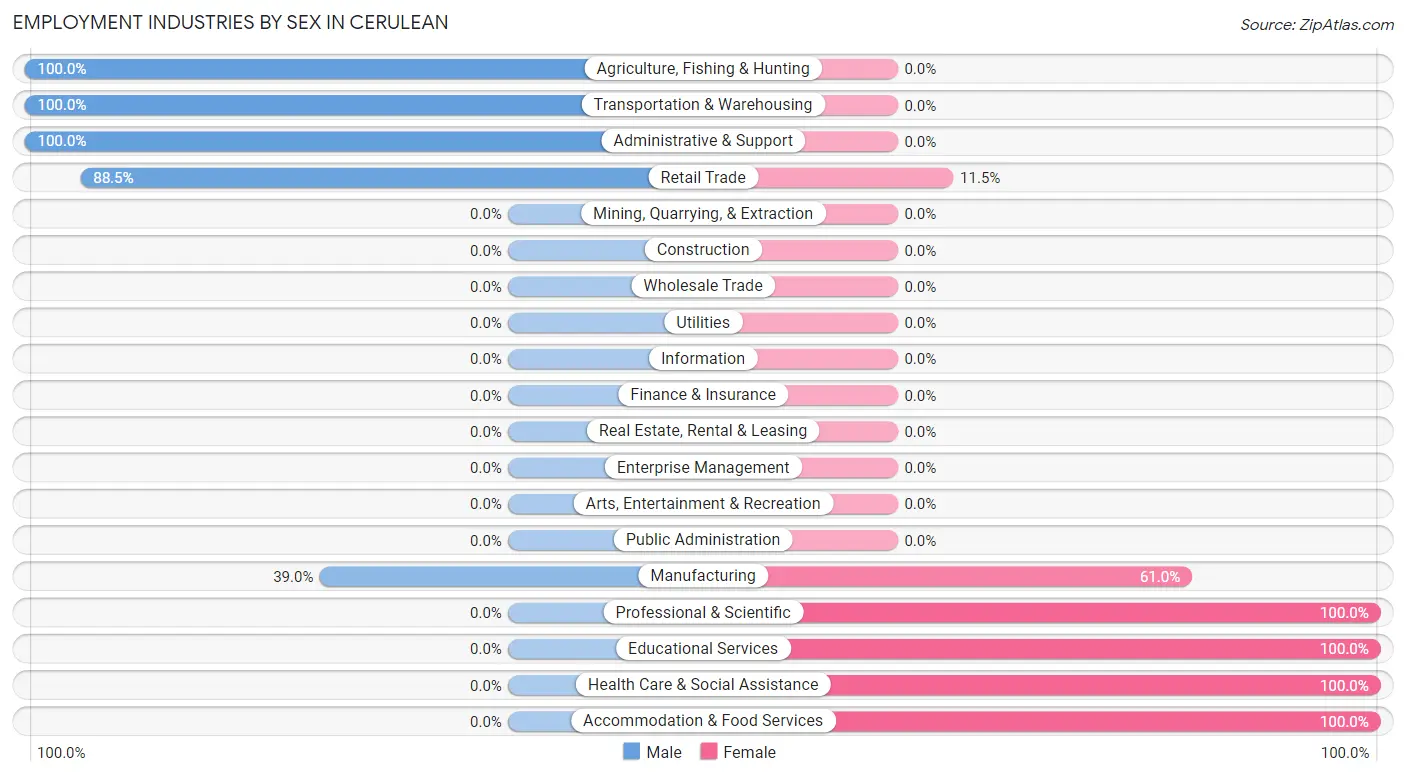
Employment Industries by Sex in Cerulean
The Cerulean industries that see more men than women are Agriculture, Fishing & Hunting (100.0%), Transportation & Warehousing (100.0%), and Administrative & Support (100.0%), whereas the industries that tend to have a higher number of women are Professional & Scientific (100.0%), Educational Services (100.0%), and Health Care & Social Assistance (100.0%).
| Industry | Male | Female |
| Agriculture, Fishing & Hunting | 34 (100.0%) | 0 (0.0%) |
| Mining, Quarrying, & Extraction | 0 (0.0%) | 0 (0.0%) |
| Construction | 0 (0.0%) | 0 (0.0%) |
| Manufacturing | 16 (39.0%) | 25 (61.0%) |
| Wholesale Trade | 0 (0.0%) | 0 (0.0%) |
| Retail Trade | 23 (88.5%) | 3 (11.5%) |
| Transportation & Warehousing | 11 (100.0%) | 0 (0.0%) |
| Utilities | 0 (0.0%) | 0 (0.0%) |
| Information | 0 (0.0%) | 0 (0.0%) |
| Finance & Insurance | 0 (0.0%) | 0 (0.0%) |
| Real Estate, Rental & Leasing | 0 (0.0%) | 0 (0.0%) |
| Professional & Scientific | 0 (0.0%) | 25 (100.0%) |
| Enterprise Management | 0 (0.0%) | 0 (0.0%) |
| Administrative & Support | 11 (100.0%) | 0 (0.0%) |
| Educational Services | 0 (0.0%) | 12 (100.0%) |
| Health Care & Social Assistance | 0 (0.0%) | 10 (100.0%) |
| Arts, Entertainment & Recreation | 0 (0.0%) | 0 (0.0%) |
| Accommodation & Food Services | 0 (0.0%) | 29 (100.0%) |
| Public Administration | 0 (0.0%) | 0 (0.0%) |
| Total | 95 (47.7%) | 104 (52.3%) |
Education in Cerulean
School Enrollment in Cerulean
The most common levels of schooling among the 103 students in Cerulean are high school (52 | 50.5%), college / undergraduate (41 | 39.8%), and graduate / professional (7 | 6.8%).
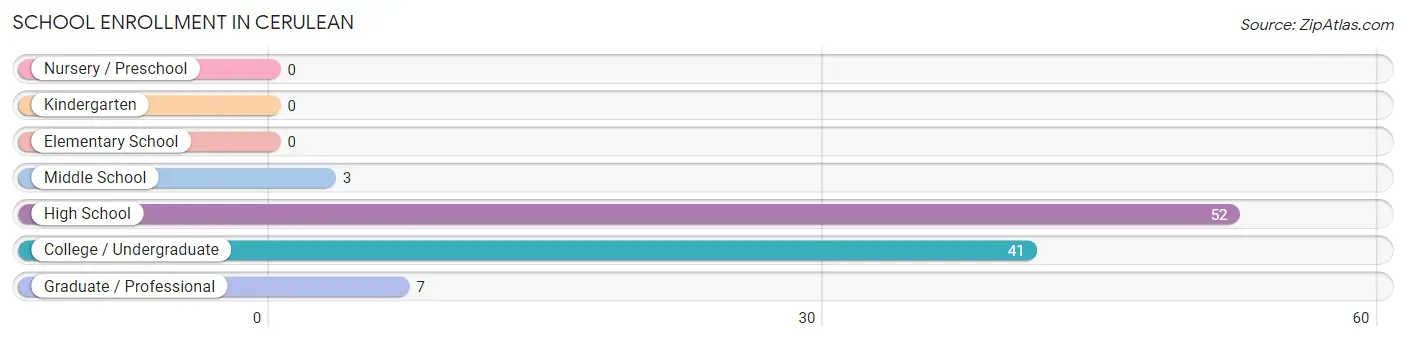
| School Level | # Students | % Students |
| Nursery / Preschool | 0 | 0.0% |
| Kindergarten | 0 | 0.0% |
| Elementary School | 0 | 0.0% |
| Middle School | 3 | 2.9% |
| High School | 52 | 50.5% |
| College / Undergraduate | 41 | 39.8% |
| Graduate / Professional | 7 | 6.8% |
| Total | 103 | 100.0% |
School Enrollment by Age by Funding Source in Cerulean
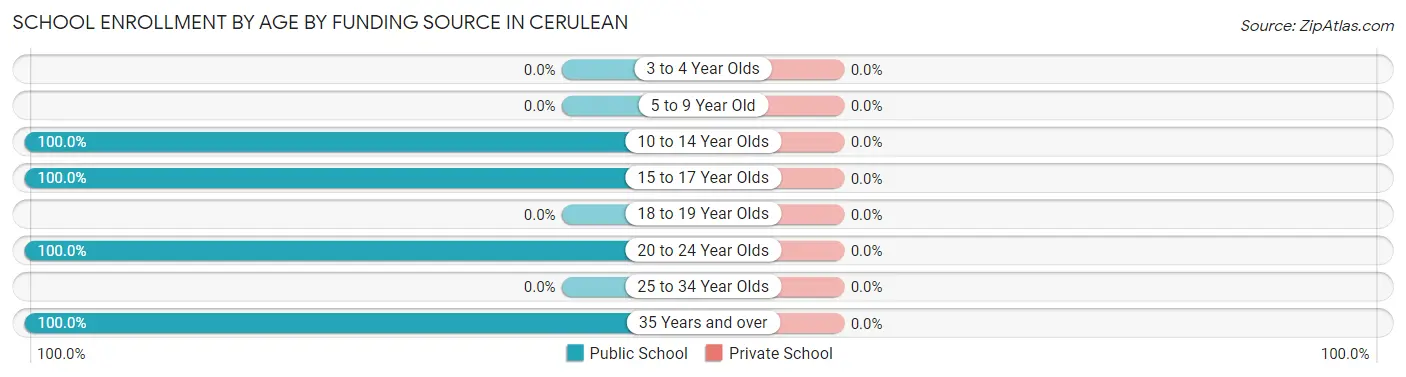
| Age Bracket | Public School | Private School |
| 3 to 4 Year Olds | 0 (0.0%) | 0 (0.0%) |
| 5 to 9 Year Old | 0 (0.0%) | 0 (0.0%) |
| 10 to 14 Year Olds | 10 (100.0%) | 0 (0.0%) |
| 15 to 17 Year Olds | 45 (100.0%) | 0 (0.0%) |
| 18 to 19 Year Olds | 0 (0.0%) | 0 (0.0%) |
| 20 to 24 Year Olds | 29 (100.0%) | 0 (0.0%) |
| 25 to 34 Year Olds | 0 (0.0%) | 0 (0.0%) |
| 35 Years and over | 19 (100.0%) | 0 (0.0%) |
| Total | 103 (100.0%) | 0 (0.0%) |
Educational Attainment by Field of Study in Cerulean
, and education (38 | 100.0%) are the most common fields of study among 38 individuals in Cerulean who have obtained a bachelor's degree or higher.
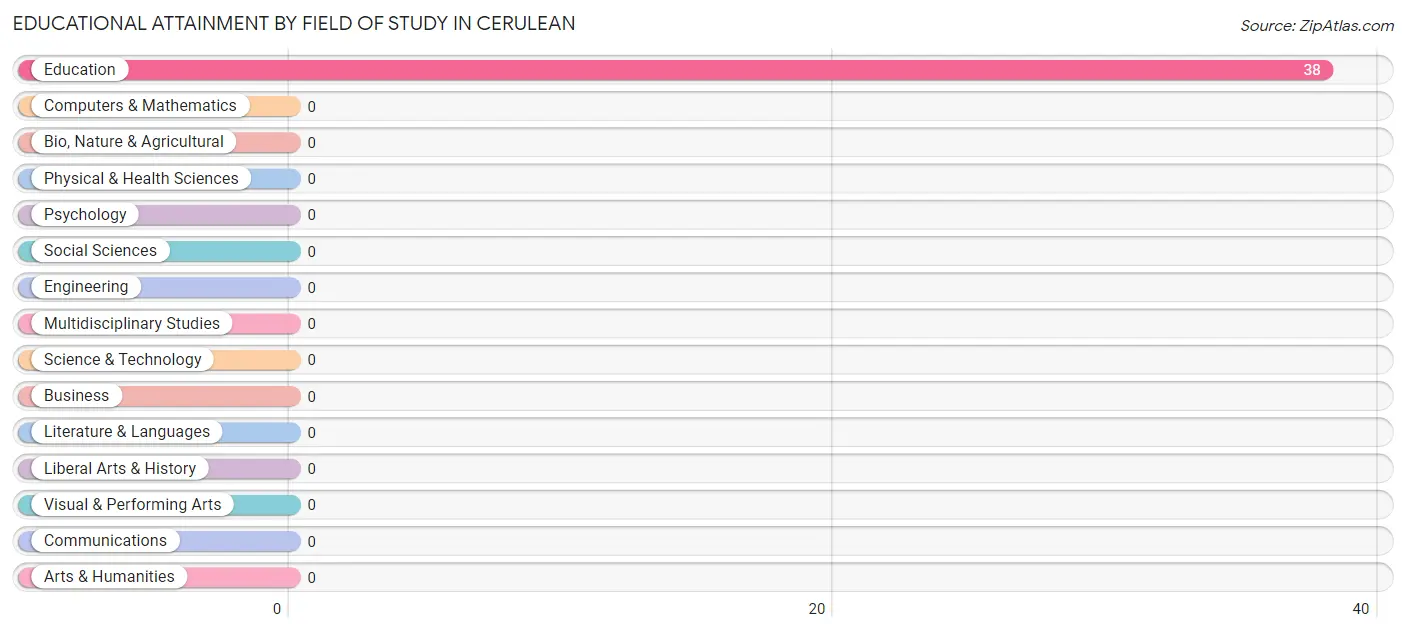
| Field of Study | # Graduates | % Graduates |
| Computers & Mathematics | 0 | 0.0% |
| Bio, Nature & Agricultural | 0 | 0.0% |
| Physical & Health Sciences | 0 | 0.0% |
| Psychology | 0 | 0.0% |
| Social Sciences | 0 | 0.0% |
| Engineering | 0 | 0.0% |
| Multidisciplinary Studies | 0 | 0.0% |
| Science & Technology | 0 | 0.0% |
| Business | 0 | 0.0% |
| Education | 38 | 100.0% |
| Literature & Languages | 0 | 0.0% |
| Liberal Arts & History | 0 | 0.0% |
| Visual & Performing Arts | 0 | 0.0% |
| Communications | 0 | 0.0% |
| Arts & Humanities | 0 | 0.0% |
| Total | 38 | 100.0% |
Transportation & Commute in Cerulean
Vehicle Availability by Sex in Cerulean
The most prevalent vehicle ownership categories in Cerulean are males with 2 vehicles (50, accounting for 52.6%) and females with 2 vehicles (48, making up 48.1%).
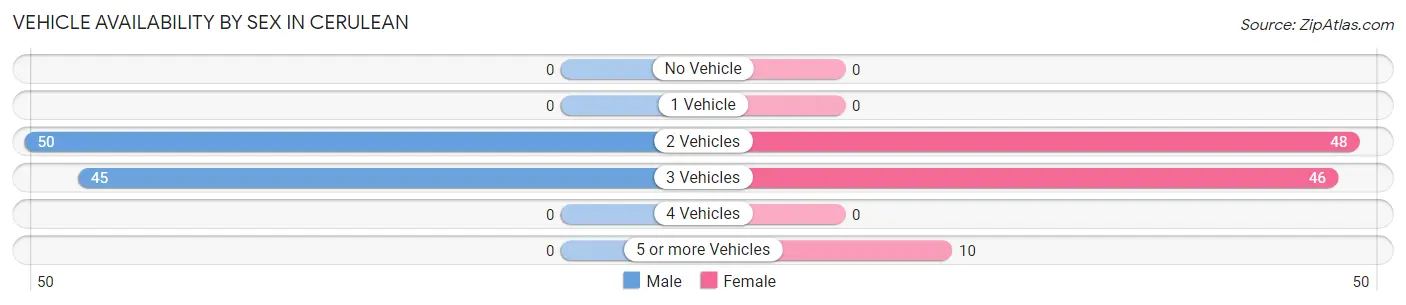
| Vehicles Available | Male | Female |
| No Vehicle | 0 (0.0%) | 0 (0.0%) |
| 1 Vehicle | 0 (0.0%) | 0 (0.0%) |
| 2 Vehicles | 50 (52.6%) | 48 (46.2%) |
| 3 Vehicles | 45 (47.4%) | 46 (44.2%) |
| 4 Vehicles | 0 (0.0%) | 0 (0.0%) |
| 5 or more Vehicles | 0 (0.0%) | 10 (9.6%) |
| Total | 95 (100.0%) | 104 (100.0%) |
Commute Time in Cerulean
The most frequently occuring commute durations in Cerulean are 40 to 44 minutes (39 commuters, 24.7%), 5 to 9 minutes (34 commuters, 21.5%), and 25 to 29 minutes (25 commuters, 15.8%).
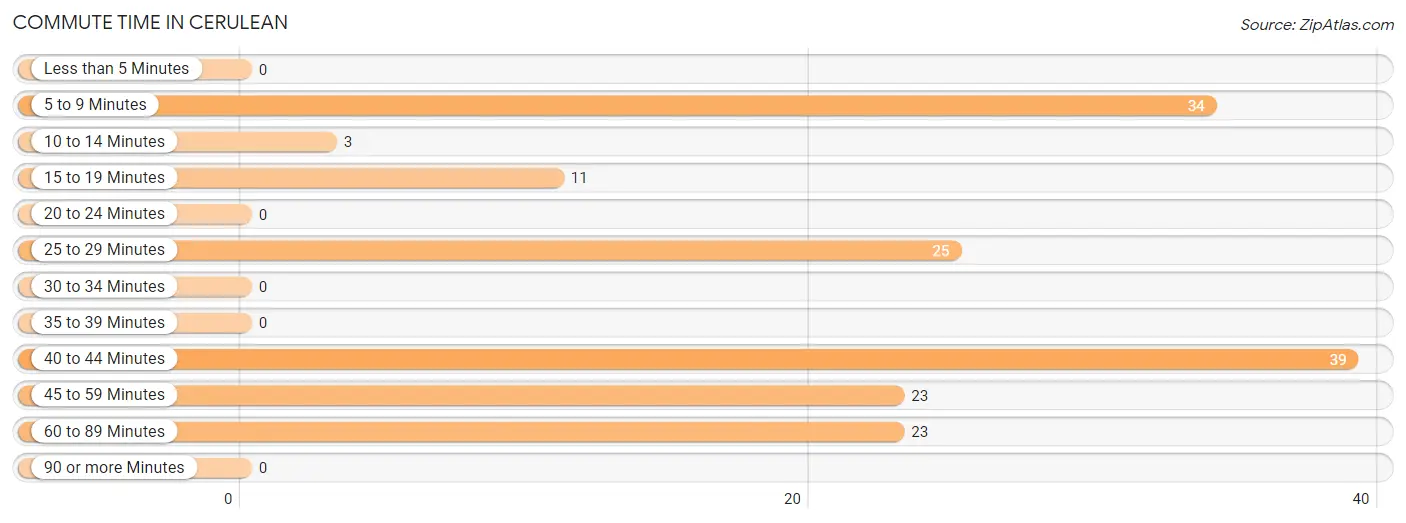
| Commute Time | # Commuters | % Commuters |
| Less than 5 Minutes | 0 | 0.0% |
| 5 to 9 Minutes | 34 | 21.5% |
| 10 to 14 Minutes | 3 | 1.9% |
| 15 to 19 Minutes | 11 | 7.0% |
| 20 to 24 Minutes | 0 | 0.0% |
| 25 to 29 Minutes | 25 | 15.8% |
| 30 to 34 Minutes | 0 | 0.0% |
| 35 to 39 Minutes | 0 | 0.0% |
| 40 to 44 Minutes | 39 | 24.7% |
| 45 to 59 Minutes | 23 | 14.6% |
| 60 to 89 Minutes | 23 | 14.6% |
| 90 or more Minutes | 0 | 0.0% |
Commute Time by Sex in Cerulean
The most common commute times in Cerulean are 5 to 9 minutes (34 commuters, 35.8%) for males and 40 to 44 minutes (28 commuters, 44.4%) for females.
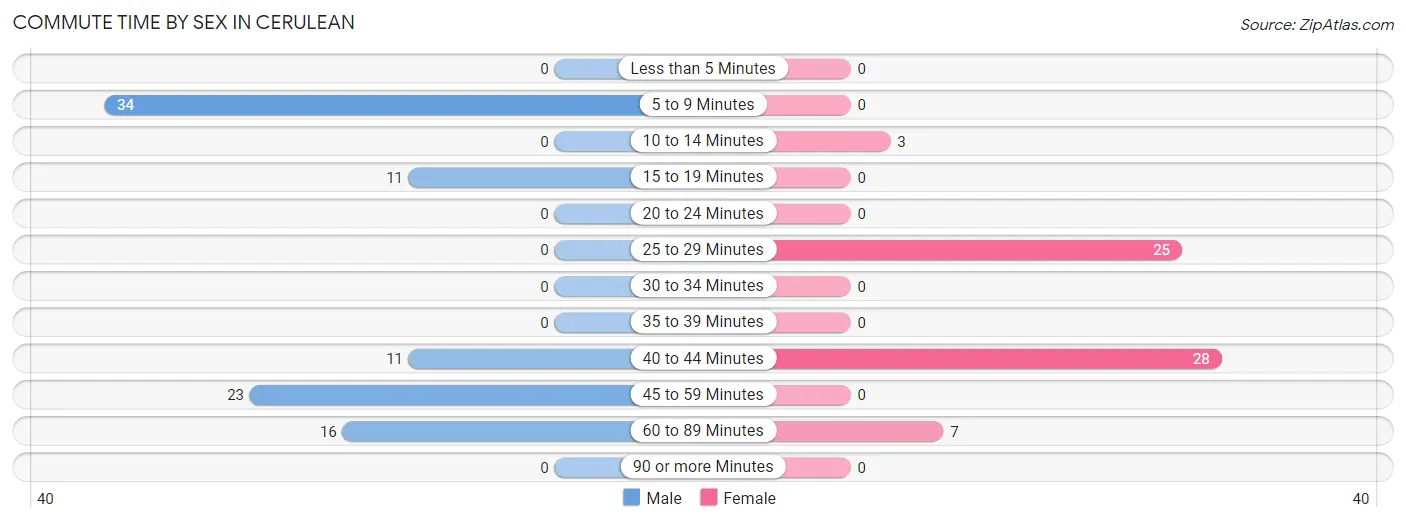
| Commute Time | Male | Female |
| Less than 5 Minutes | 0 (0.0%) | 0 (0.0%) |
| 5 to 9 Minutes | 34 (35.8%) | 0 (0.0%) |
| 10 to 14 Minutes | 0 (0.0%) | 3 (4.8%) |
| 15 to 19 Minutes | 11 (11.6%) | 0 (0.0%) |
| 20 to 24 Minutes | 0 (0.0%) | 0 (0.0%) |
| 25 to 29 Minutes | 0 (0.0%) | 25 (39.7%) |
| 30 to 34 Minutes | 0 (0.0%) | 0 (0.0%) |
| 35 to 39 Minutes | 0 (0.0%) | 0 (0.0%) |
| 40 to 44 Minutes | 11 (11.6%) | 28 (44.4%) |
| 45 to 59 Minutes | 23 (24.2%) | 0 (0.0%) |
| 60 to 89 Minutes | 16 (16.8%) | 7 (11.1%) |
| 90 or more Minutes | 0 (0.0%) | 0 (0.0%) |
Time of Departure to Work by Sex in Cerulean
The most frequent times of departure to work in Cerulean are 12:00 AM to 4:59 AM (39, 41.0%) for males and 7:00 AM to 7:29 AM (35, 55.6%) for females.
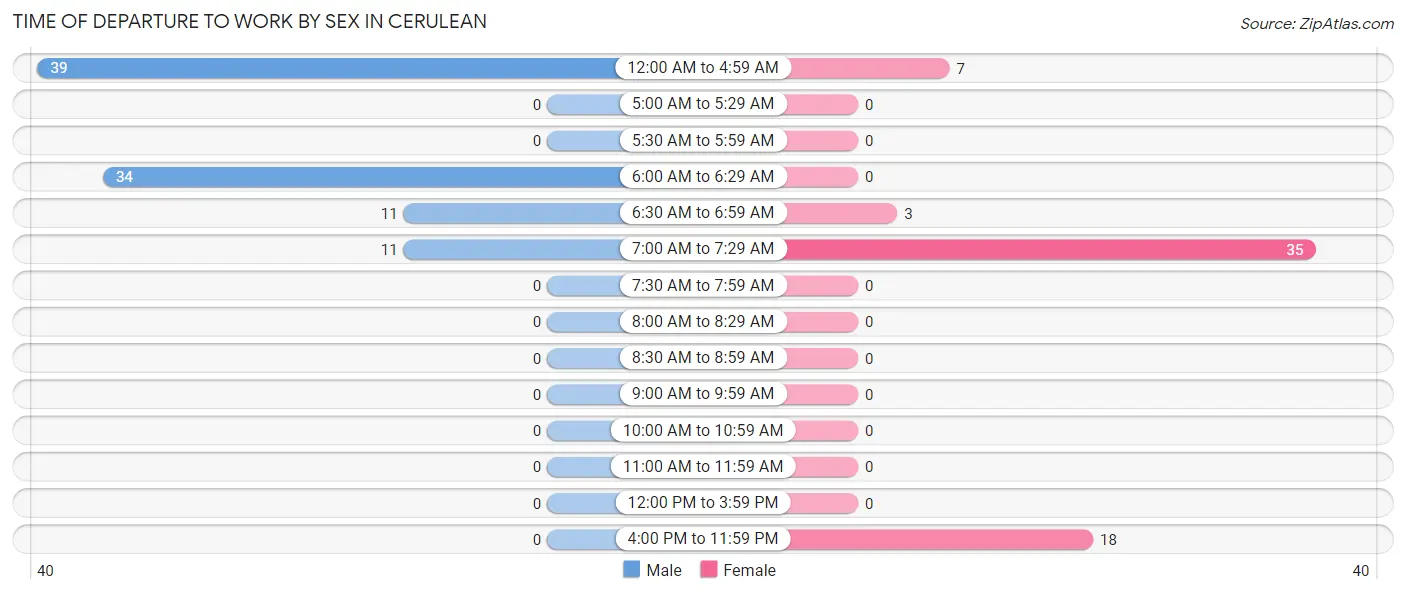
| Time of Departure | Male | Female |
| 12:00 AM to 4:59 AM | 39 (41.0%) | 7 (11.1%) |
| 5:00 AM to 5:29 AM | 0 (0.0%) | 0 (0.0%) |
| 5:30 AM to 5:59 AM | 0 (0.0%) | 0 (0.0%) |
| 6:00 AM to 6:29 AM | 34 (35.8%) | 0 (0.0%) |
| 6:30 AM to 6:59 AM | 11 (11.6%) | 3 (4.8%) |
| 7:00 AM to 7:29 AM | 11 (11.6%) | 35 (55.6%) |
| 7:30 AM to 7:59 AM | 0 (0.0%) | 0 (0.0%) |
| 8:00 AM to 8:29 AM | 0 (0.0%) | 0 (0.0%) |
| 8:30 AM to 8:59 AM | 0 (0.0%) | 0 (0.0%) |
| 9:00 AM to 9:59 AM | 0 (0.0%) | 0 (0.0%) |
| 10:00 AM to 10:59 AM | 0 (0.0%) | 0 (0.0%) |
| 11:00 AM to 11:59 AM | 0 (0.0%) | 0 (0.0%) |
| 12:00 PM to 3:59 PM | 0 (0.0%) | 0 (0.0%) |
| 4:00 PM to 11:59 PM | 0 (0.0%) | 18 (28.6%) |
| Total | 95 (100.0%) | 63 (100.0%) |
Housing Occupancy in Cerulean
Occupancy by Ownership in Cerulean
Of the total 195 dwellings in Cerulean, owner-occupied units account for 158 (81.0%), while renter-occupied units make up 37 (19.0%).
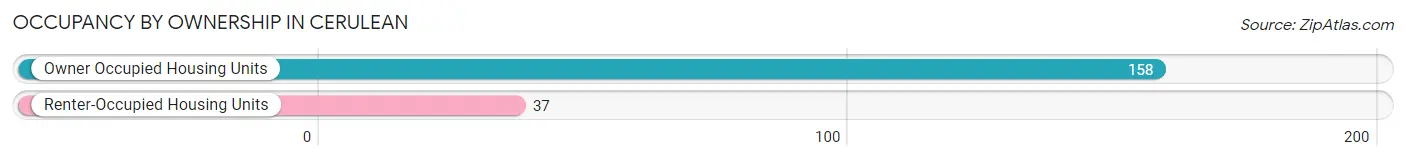
| Occupancy | # Housing Units | % Housing Units |
| Owner Occupied Housing Units | 158 | 81.0% |
| Renter-Occupied Housing Units | 37 | 19.0% |
| Total Occupied Housing Units | 195 | 100.0% |
Occupancy by Household Size in Cerulean
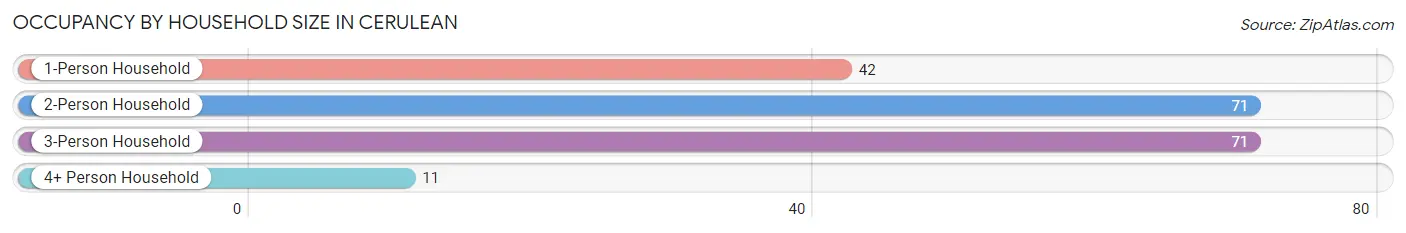
| Household Size | # Housing Units | % Housing Units |
| 1-Person Household | 42 | 21.5% |
| 2-Person Household | 71 | 36.4% |
| 3-Person Household | 71 | 36.4% |
| 4+ Person Household | 11 | 5.6% |
| Total Housing Units | 195 | 100.0% |
Occupancy by Ownership by Household Size in Cerulean
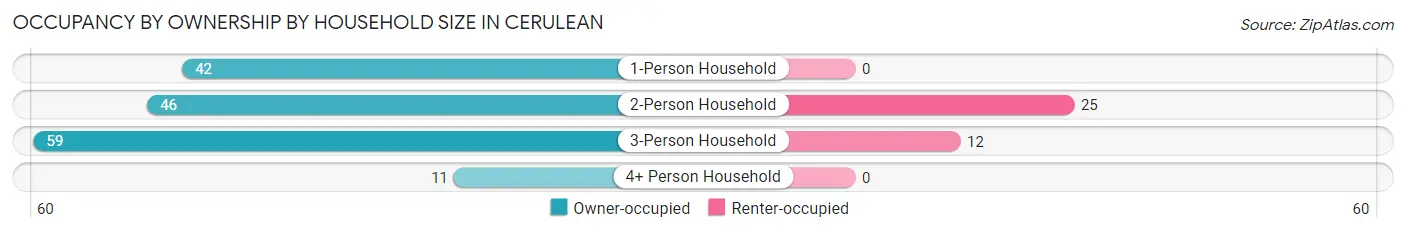
| Household Size | Owner-occupied | Renter-occupied |
| 1-Person Household | 42 (100.0%) | 0 (0.0%) |
| 2-Person Household | 46 (64.8%) | 25 (35.2%) |
| 3-Person Household | 59 (83.1%) | 12 (16.9%) |
| 4+ Person Household | 11 (100.0%) | 0 (0.0%) |
| Total Housing Units | 158 (81.0%) | 37 (19.0%) |
Occupancy by Educational Attainment in Cerulean
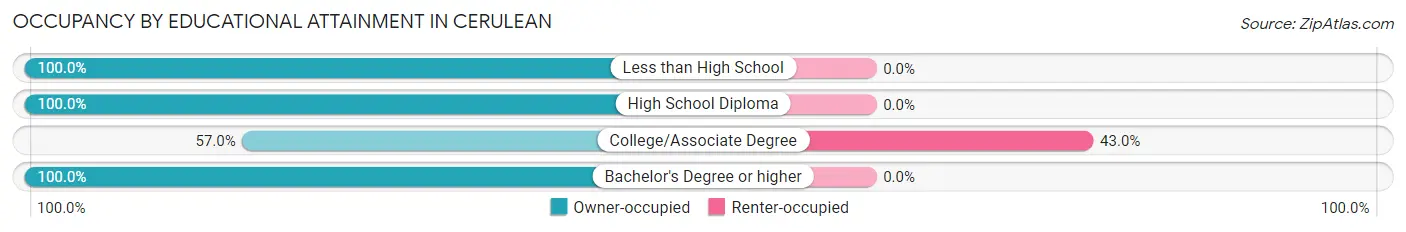
| Household Size | Owner-occupied | Renter-occupied |
| Less than High School | 35 (100.0%) | 0 (0.0%) |
| High School Diploma | 46 (100.0%) | 0 (0.0%) |
| College/Associate Degree | 49 (57.0%) | 37 (43.0%) |
| Bachelor's Degree or higher | 28 (100.0%) | 0 (0.0%) |
Occupancy by Age of Householder in Cerulean
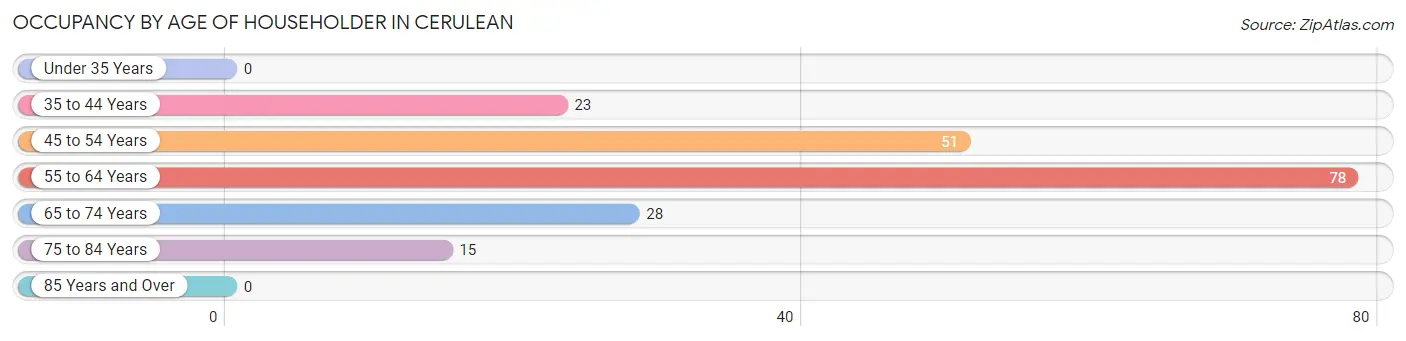
| Age Bracket | # Households | % Households |
| Under 35 Years | 0 | 0.0% |
| 35 to 44 Years | 23 | 11.8% |
| 45 to 54 Years | 51 | 26.2% |
| 55 to 64 Years | 78 | 40.0% |
| 65 to 74 Years | 28 | 14.4% |
| 75 to 84 Years | 15 | 7.7% |
| 85 Years and Over | 0 | 0.0% |
| Total | 195 | 100.0% |
Housing Finances in Cerulean
Median Income by Occupancy in Cerulean
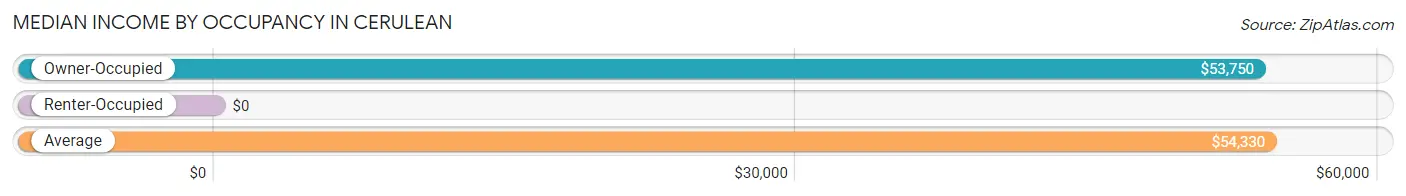
| Occupancy Type | # Households | Median Income |
| Owner-Occupied | 158 (81.0%) | $53,750 |
| Renter-Occupied | 37 (19.0%) | $0 |
| Average | 195 (100.0%) | $54,330 |
Occupancy by Householder Income Bracket in Cerulean
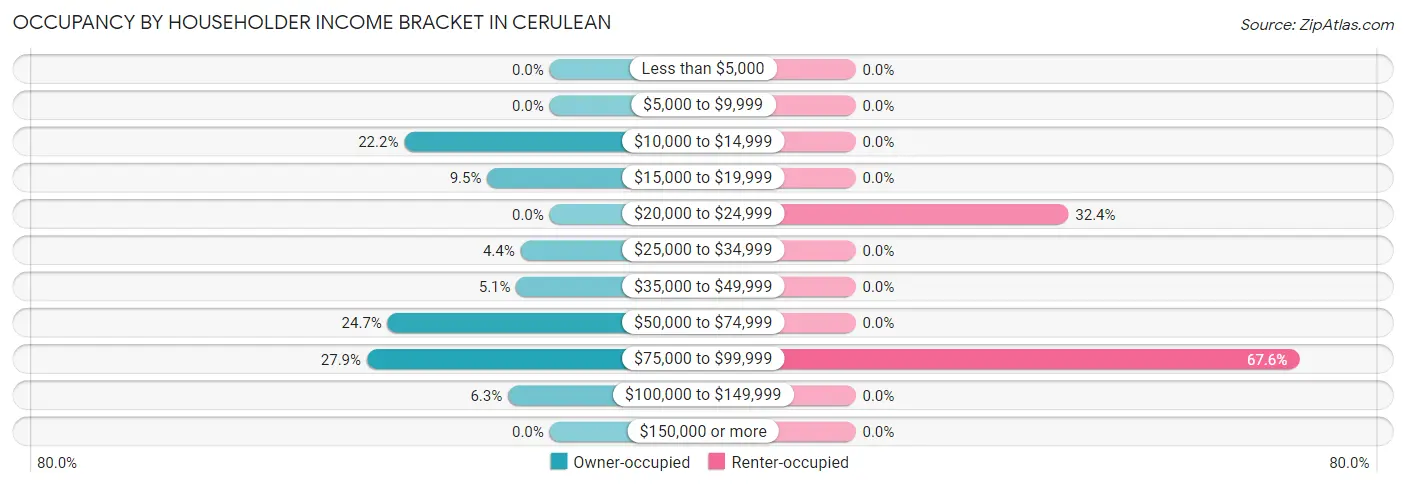
| Income Bracket | Owner-occupied | Renter-occupied |
| Less than $5,000 | 0 (0.0%) | 0 (0.0%) |
| $5,000 to $9,999 | 0 (0.0%) | 0 (0.0%) |
| $10,000 to $14,999 | 35 (22.2%) | 0 (0.0%) |
| $15,000 to $19,999 | 15 (9.5%) | 0 (0.0%) |
| $20,000 to $24,999 | 0 (0.0%) | 12 (32.4%) |
| $25,000 to $34,999 | 7 (4.4%) | 0 (0.0%) |
| $35,000 to $49,999 | 8 (5.1%) | 0 (0.0%) |
| $50,000 to $74,999 | 39 (24.7%) | 0 (0.0%) |
| $75,000 to $99,999 | 44 (27.9%) | 25 (67.6%) |
| $100,000 to $149,999 | 10 (6.3%) | 0 (0.0%) |
| $150,000 or more | 0 (0.0%) | 0 (0.0%) |
| Total | 158 (100.0%) | 37 (100.0%) |
Monthly Housing Cost Tiers in Cerulean
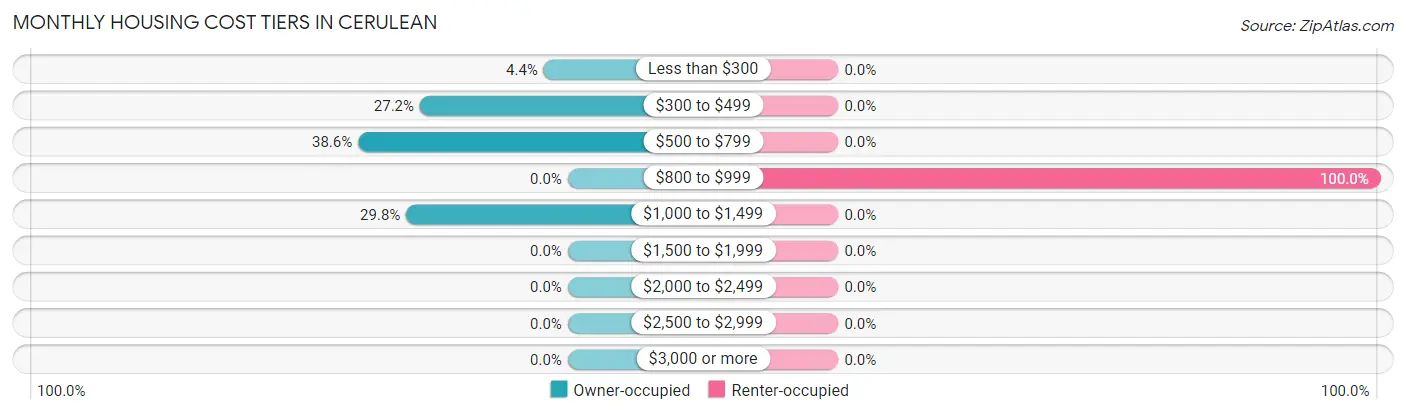
| Monthly Cost | Owner-occupied | Renter-occupied |
| Less than $300 | 7 (4.4%) | 0 (0.0%) |
| $300 to $499 | 43 (27.2%) | 0 (0.0%) |
| $500 to $799 | 61 (38.6%) | 0 (0.0%) |
| $800 to $999 | 0 (0.0%) | 37 (100.0%) |
| $1,000 to $1,499 | 47 (29.7%) | 0 (0.0%) |
| $1,500 to $1,999 | 0 (0.0%) | 0 (0.0%) |
| $2,000 to $2,499 | 0 (0.0%) | 0 (0.0%) |
| $2,500 to $2,999 | 0 (0.0%) | 0 (0.0%) |
| $3,000 or more | 0 (0.0%) | 0 (0.0%) |
| Total | 158 (100.0%) | 37 (100.0%) |
Physical Housing Characteristics in Cerulean
Housing Structures in Cerulean
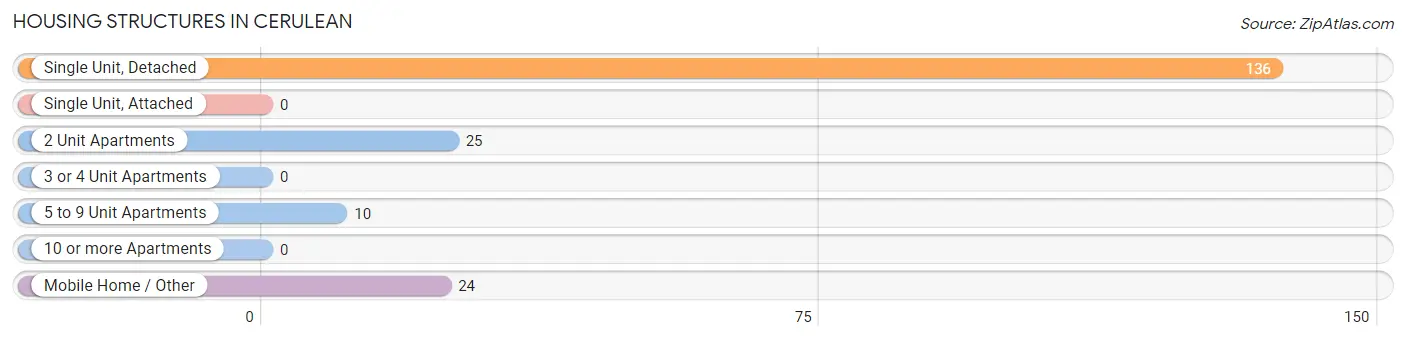
| Structure Type | # Housing Units | % Housing Units |
| Single Unit, Detached | 136 | 69.7% |
| Single Unit, Attached | 0 | 0.0% |
| 2 Unit Apartments | 25 | 12.8% |
| 3 or 4 Unit Apartments | 0 | 0.0% |
| 5 to 9 Unit Apartments | 10 | 5.1% |
| 10 or more Apartments | 0 | 0.0% |
| Mobile Home / Other | 24 | 12.3% |
| Total | 195 | 100.0% |
Housing Structures by Occupancy in Cerulean
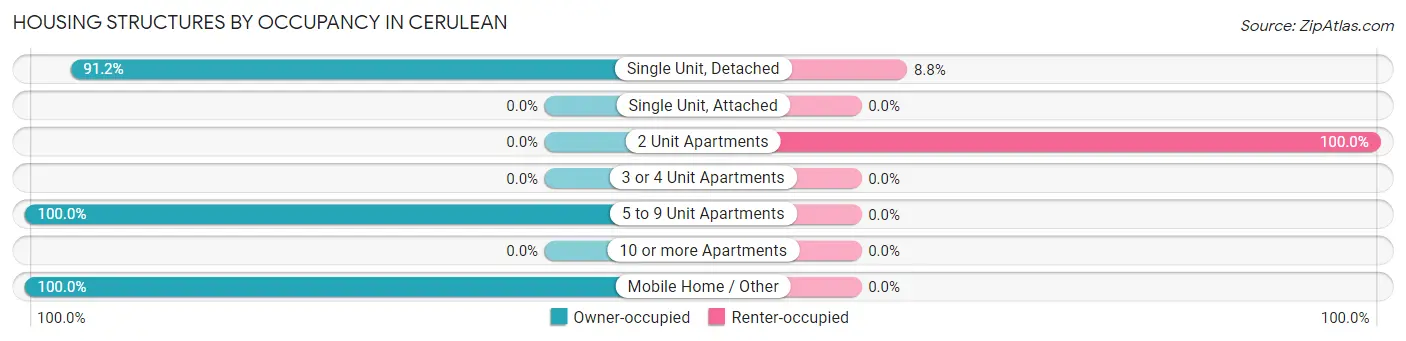
| Structure Type | Owner-occupied | Renter-occupied |
| Single Unit, Detached | 124 (91.2%) | 12 (8.8%) |
| Single Unit, Attached | 0 (0.0%) | 0 (0.0%) |
| 2 Unit Apartments | 0 (0.0%) | 25 (100.0%) |
| 3 or 4 Unit Apartments | 0 (0.0%) | 0 (0.0%) |
| 5 to 9 Unit Apartments | 10 (100.0%) | 0 (0.0%) |
| 10 or more Apartments | 0 (0.0%) | 0 (0.0%) |
| Mobile Home / Other | 24 (100.0%) | 0 (0.0%) |
| Total | 158 (81.0%) | 37 (19.0%) |
Housing Structures by Number of Rooms in Cerulean
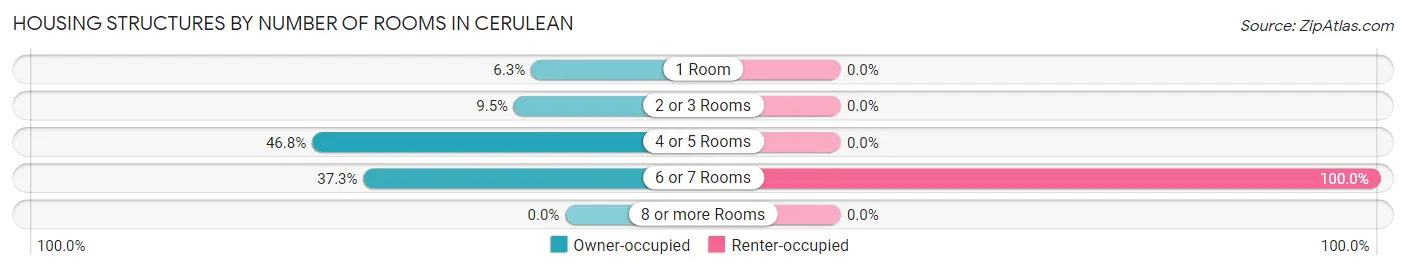
| Number of Rooms | Owner-occupied | Renter-occupied |
| 1 Room | 10 (6.3%) | 0 (0.0%) |
| 2 or 3 Rooms | 15 (9.5%) | 0 (0.0%) |
| 4 or 5 Rooms | 74 (46.8%) | 0 (0.0%) |
| 6 or 7 Rooms | 59 (37.3%) | 37 (100.0%) |
| 8 or more Rooms | 0 (0.0%) | 0 (0.0%) |
| Total | 158 (100.0%) | 37 (100.0%) |
Housing Structure by Heating Type in Cerulean
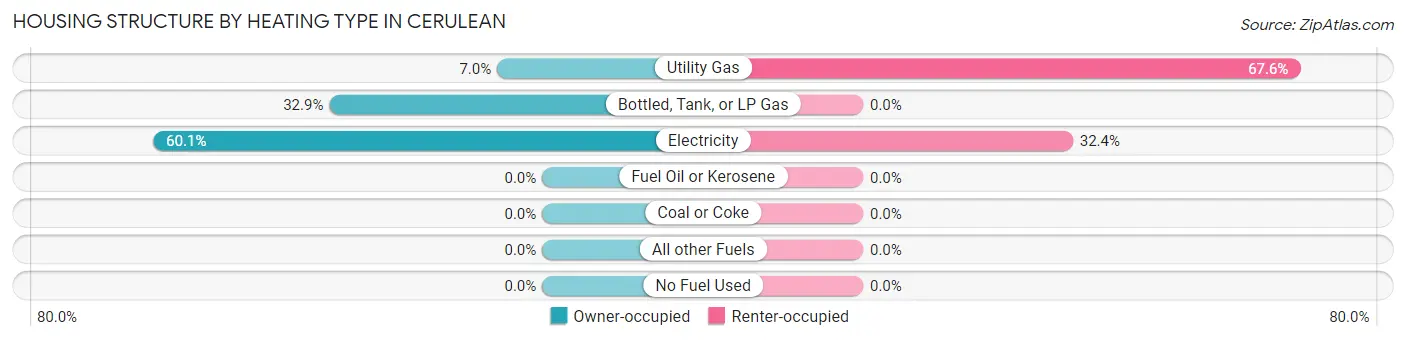
| Heating Type | Owner-occupied | Renter-occupied |
| Utility Gas | 11 (7.0%) | 25 (67.6%) |
| Bottled, Tank, or LP Gas | 52 (32.9%) | 0 (0.0%) |
| Electricity | 95 (60.1%) | 12 (32.4%) |
| Fuel Oil or Kerosene | 0 (0.0%) | 0 (0.0%) |
| Coal or Coke | 0 (0.0%) | 0 (0.0%) |
| All other Fuels | 0 (0.0%) | 0 (0.0%) |
| No Fuel Used | 0 (0.0%) | 0 (0.0%) |
| Total | 158 (100.0%) | 37 (100.0%) |
Household Vehicle Usage in Cerulean
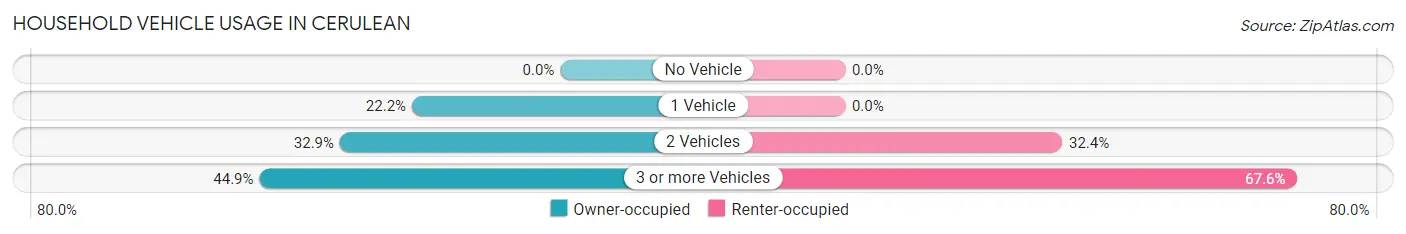
| Vehicles per Household | Owner-occupied | Renter-occupied |
| No Vehicle | 0 (0.0%) | 0 (0.0%) |
| 1 Vehicle | 35 (22.2%) | 0 (0.0%) |
| 2 Vehicles | 52 (32.9%) | 12 (32.4%) |
| 3 or more Vehicles | 71 (44.9%) | 25 (67.6%) |
| Total | 158 (100.0%) | 37 (100.0%) |
Real Estate & Mortgages in Cerulean
Real Estate and Mortgage Overview in Cerulean
| Characteristic | Without Mortgage | With Mortgage |
| Housing Units | 60 | 98 |
| Median Property Value | $78,200 | $0 |
| Median Household Income | $53,214 | $0 |
| Monthly Housing Costs | $391 | $0 |
| Real Estate Taxes | $199 | $0 |
Property Value by Mortgage Status in Cerulean
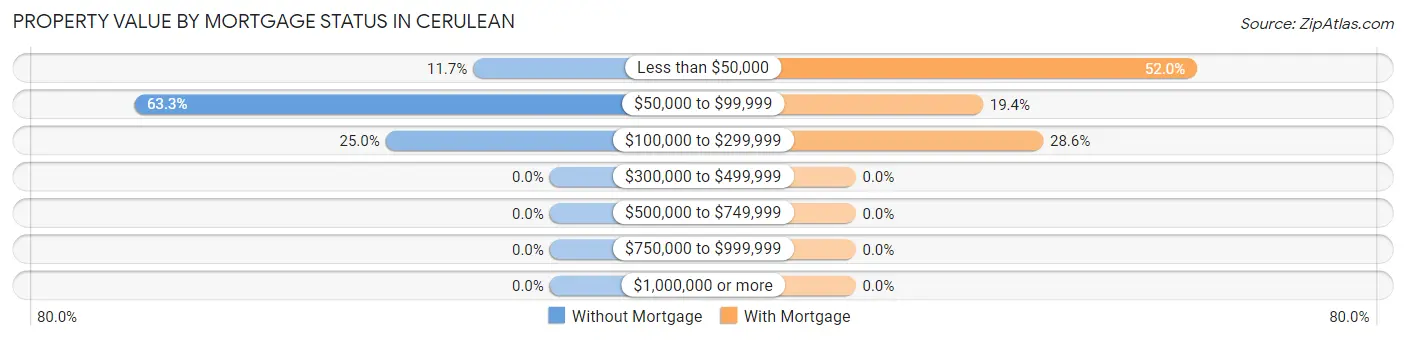
| Property Value | Without Mortgage | With Mortgage |
| Less than $50,000 | 7 (11.7%) | 51 (52.0%) |
| $50,000 to $99,999 | 38 (63.3%) | 19 (19.4%) |
| $100,000 to $299,999 | 15 (25.0%) | 28 (28.6%) |
| $300,000 to $499,999 | 0 (0.0%) | 0 (0.0%) |
| $500,000 to $749,999 | 0 (0.0%) | 0 (0.0%) |
| $750,000 to $999,999 | 0 (0.0%) | 0 (0.0%) |
| $1,000,000 or more | 0 (0.0%) | 0 (0.0%) |
| Total | 60 (100.0%) | 98 (100.0%) |
Household Income by Mortgage Status in Cerulean
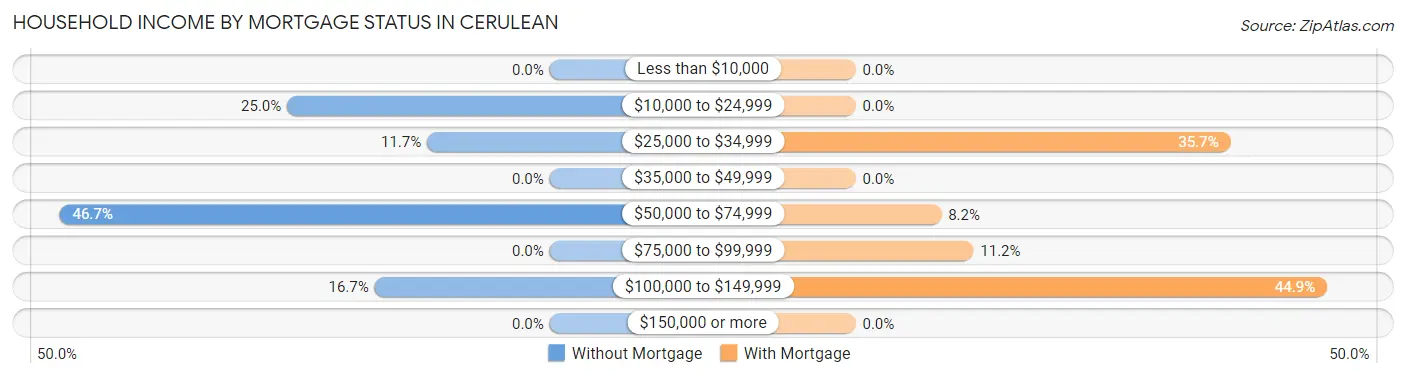
| Household Income | Without Mortgage | With Mortgage |
| Less than $10,000 | 0 (0.0%) | 0 (0.0%) |
| $10,000 to $24,999 | 15 (25.0%) | 0 (0.0%) |
| $25,000 to $34,999 | 7 (11.7%) | 35 (35.7%) |
| $35,000 to $49,999 | 0 (0.0%) | 0 (0.0%) |
| $50,000 to $74,999 | 28 (46.7%) | 8 (8.2%) |
| $75,000 to $99,999 | 0 (0.0%) | 11 (11.2%) |
| $100,000 to $149,999 | 10 (16.7%) | 44 (44.9%) |
| $150,000 or more | 0 (0.0%) | 0 (0.0%) |
| Total | 60 (100.0%) | 98 (100.0%) |
Property Value to Household Income Ratio in Cerulean
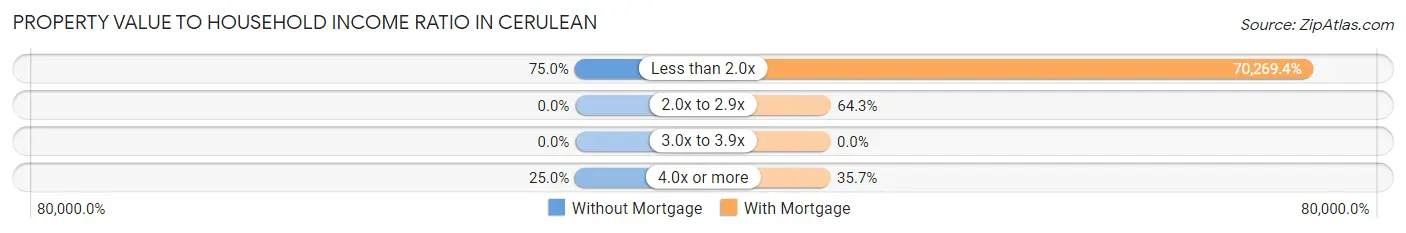
| Value-to-Income Ratio | Without Mortgage | With Mortgage |
| Less than 2.0x | 45 (75.0%) | 68,864 (70,269.4%) |
| 2.0x to 2.9x | 0 (0.0%) | 63 (64.3%) |
| 3.0x to 3.9x | 0 (0.0%) | 0 (0.0%) |
| 4.0x or more | 15 (25.0%) | 35 (35.7%) |
| Total | 60 (100.0%) | 98 (100.0%) |
Real Estate Taxes by Mortgage Status in Cerulean
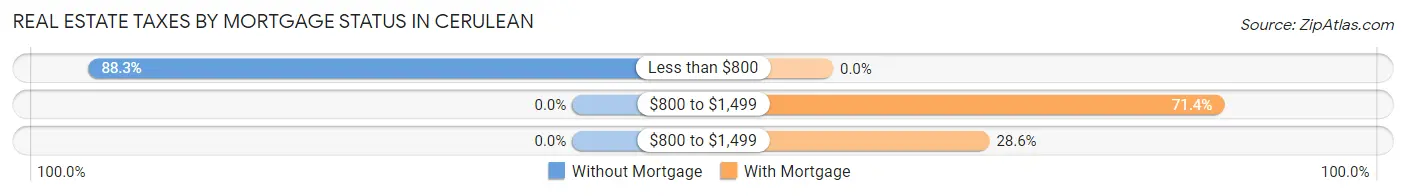
| Property Taxes | Without Mortgage | With Mortgage |
| Less than $800 | 53 (88.3%) | 0 (0.0%) |
| $800 to $1,499 | 0 (0.0%) | 70 (71.4%) |
| $800 to $1,499 | 0 (0.0%) | 28 (28.6%) |
| Total | 60 (100.0%) | 98 (100.0%) |
Health & Disability in Cerulean
Health Insurance Coverage by Age in Cerulean
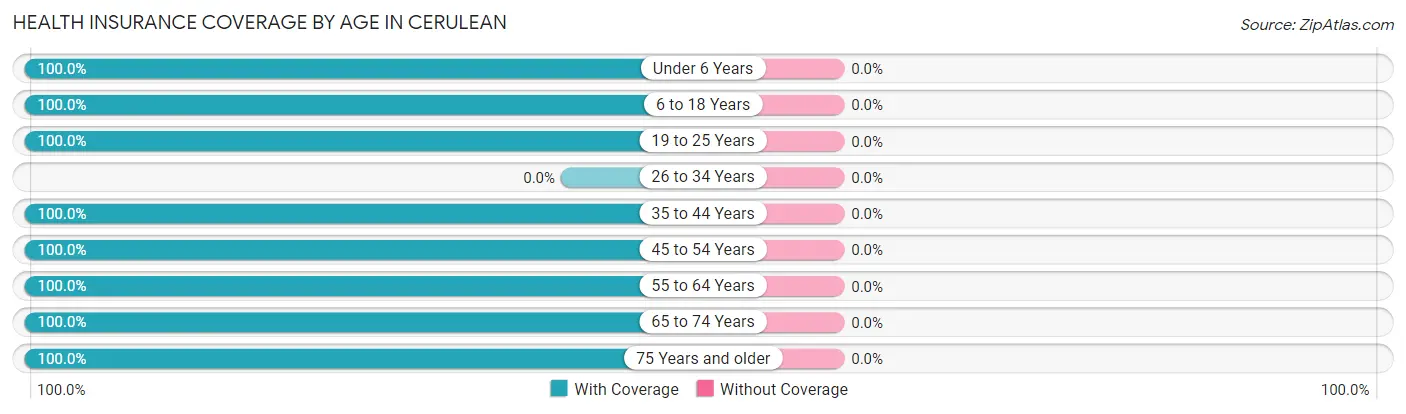
| Age Bracket | With Coverage | Without Coverage |
| Under 6 Years | 7 (100.0%) | 0 (0.0%) |
| 6 to 18 Years | 55 (100.0%) | 0 (0.0%) |
| 19 to 25 Years | 29 (100.0%) | 0 (0.0%) |
| 26 to 34 Years | 0 (0.0%) | 0 (0.0%) |
| 35 to 44 Years | 78 (100.0%) | 0 (0.0%) |
| 45 to 54 Years | 58 (100.0%) | 0 (0.0%) |
| 55 to 64 Years | 108 (100.0%) | 0 (0.0%) |
| 65 to 74 Years | 69 (100.0%) | 0 (0.0%) |
| 75 Years and older | 15 (100.0%) | 0 (0.0%) |
| Total | 419 (100.0%) | 0 (0.0%) |
Health Insurance Coverage by Citizenship Status in Cerulean
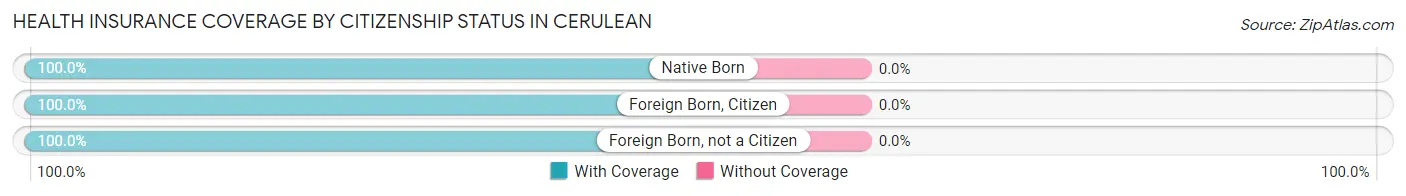
| Citizenship Status | With Coverage | Without Coverage |
| Native Born | 7 (100.0%) | 0 (0.0%) |
| Foreign Born, Citizen | 55 (100.0%) | 0 (0.0%) |
| Foreign Born, not a Citizen | 29 (100.0%) | 0 (0.0%) |
Health Insurance Coverage by Household Income in Cerulean
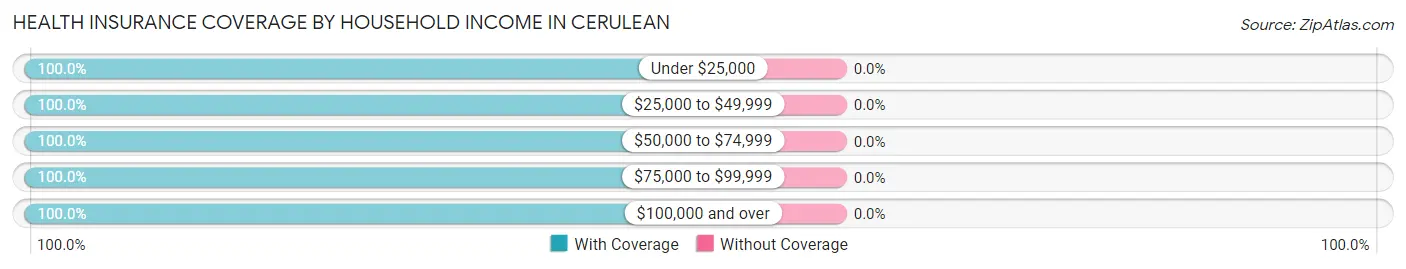
| Household Income | With Coverage | Without Coverage |
| Under $25,000 | 141 (100.0%) | 0 (0.0%) |
| $25,000 to $49,999 | 22 (100.0%) | 0 (0.0%) |
| $50,000 to $74,999 | 100 (100.0%) | 0 (0.0%) |
| $75,000 to $99,999 | 136 (100.0%) | 0 (0.0%) |
| $100,000 and over | 20 (100.0%) | 0 (0.0%) |
Public vs Private Health Insurance Coverage by Age in Cerulean
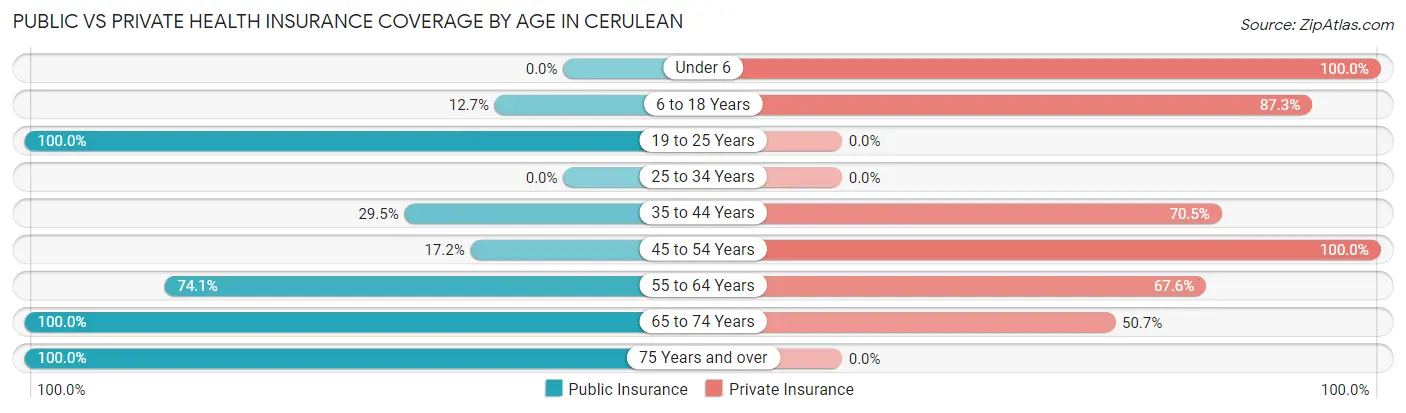
| Age Bracket | Public Insurance | Private Insurance |
| Under 6 | 0 (0.0%) | 7 (100.0%) |
| 6 to 18 Years | 7 (12.7%) | 48 (87.3%) |
| 19 to 25 Years | 29 (100.0%) | 0 (0.0%) |
| 25 to 34 Years | 0 (0.0%) | 0 (0.0%) |
| 35 to 44 Years | 23 (29.5%) | 55 (70.5%) |
| 45 to 54 Years | 10 (17.2%) | 58 (100.0%) |
| 55 to 64 Years | 80 (74.1%) | 73 (67.6%) |
| 65 to 74 Years | 69 (100.0%) | 35 (50.7%) |
| 75 Years and over | 15 (100.0%) | 0 (0.0%) |
| Total | 233 (55.6%) | 276 (65.9%) |
Disability Status by Sex by Age in Cerulean
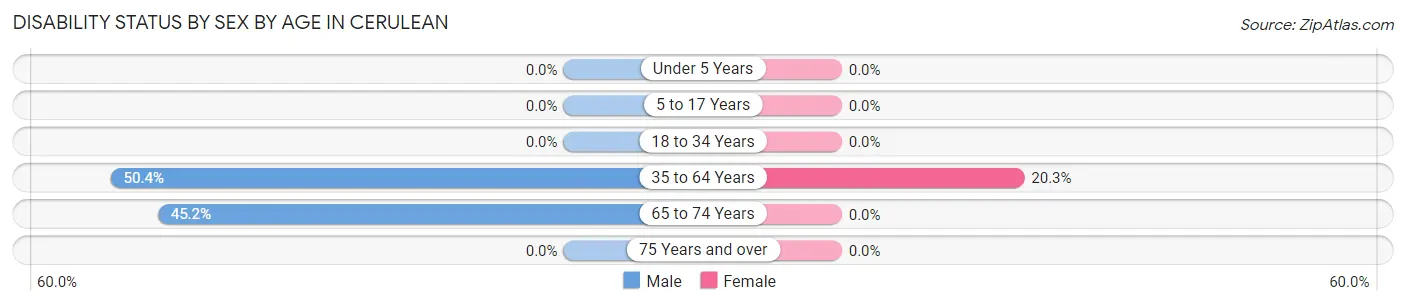
| Age Bracket | Male | Female |
| Under 5 Years | 0 (0.0%) | 0 (0.0%) |
| 5 to 17 Years | 0 (0.0%) | 0 (0.0%) |
| 18 to 34 Years | 0 (0.0%) | 0 (0.0%) |
| 35 to 64 Years | 61 (50.4%) | 25 (20.3%) |
| 65 to 74 Years | 28 (45.2%) | 0 (0.0%) |
| 75 Years and over | 0 (0.0%) | 0 (0.0%) |
Disability Class by Sex by Age in Cerulean
Disability Class: Hearing Difficulty
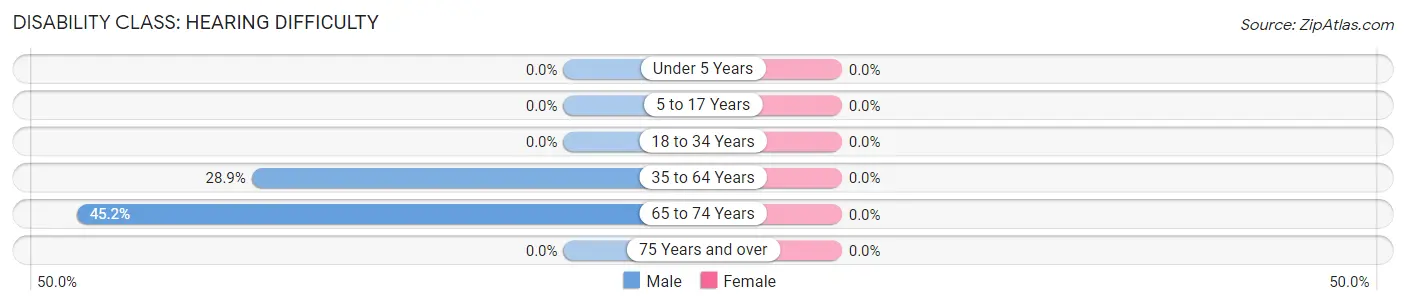
| Age Bracket | Male | Female |
| Under 5 Years | 0 (0.0%) | 0 (0.0%) |
| 5 to 17 Years | 0 (0.0%) | 0 (0.0%) |
| 18 to 34 Years | 0 (0.0%) | 0 (0.0%) |
| 35 to 64 Years | 35 (28.9%) | 0 (0.0%) |
| 65 to 74 Years | 28 (45.2%) | 0 (0.0%) |
| 75 Years and over | 0 (0.0%) | 0 (0.0%) |
Disability Class: Vision Difficulty
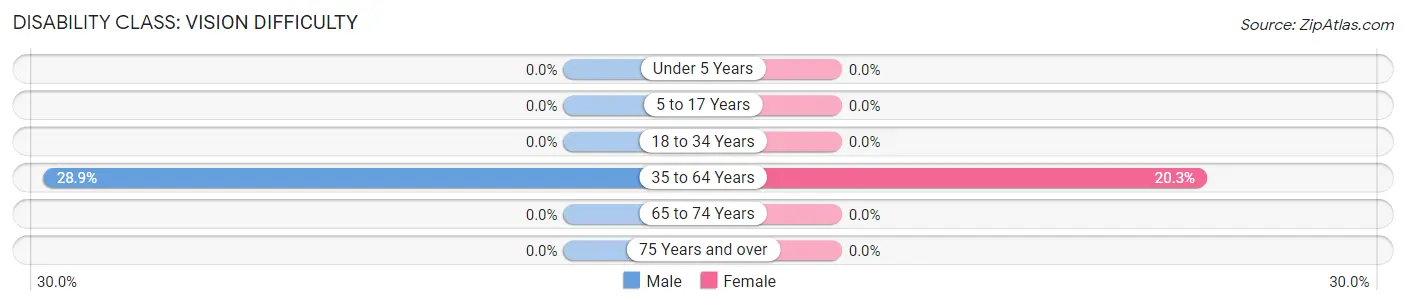
| Age Bracket | Male | Female |
| Under 5 Years | 0 (0.0%) | 0 (0.0%) |
| 5 to 17 Years | 0 (0.0%) | 0 (0.0%) |
| 18 to 34 Years | 0 (0.0%) | 0 (0.0%) |
| 35 to 64 Years | 35 (28.9%) | 25 (20.3%) |
| 65 to 74 Years | 0 (0.0%) | 0 (0.0%) |
| 75 Years and over | 0 (0.0%) | 0 (0.0%) |
Disability Class: Cognitive Difficulty
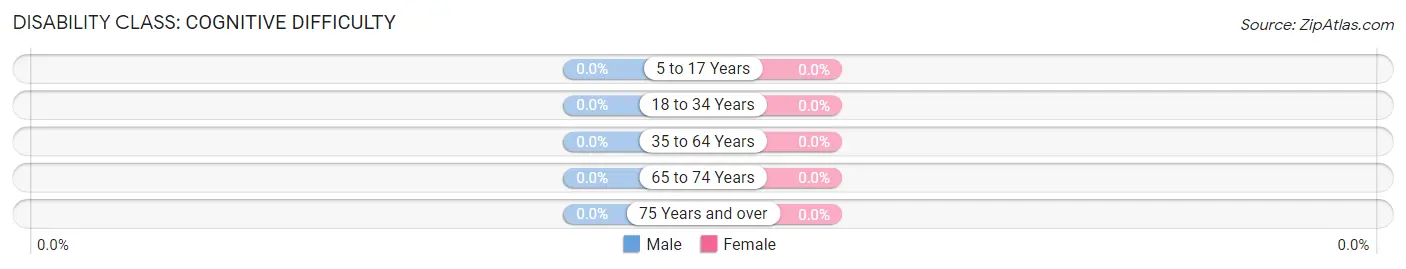
| Age Bracket | Male | Female |
| 5 to 17 Years | 0 (0.0%) | 0 (0.0%) |
| 18 to 34 Years | 0 (0.0%) | 0 (0.0%) |
| 35 to 64 Years | 0 (0.0%) | 0 (0.0%) |
| 65 to 74 Years | 0 (0.0%) | 0 (0.0%) |
| 75 Years and over | 0 (0.0%) | 0 (0.0%) |
Disability Class: Ambulatory Difficulty
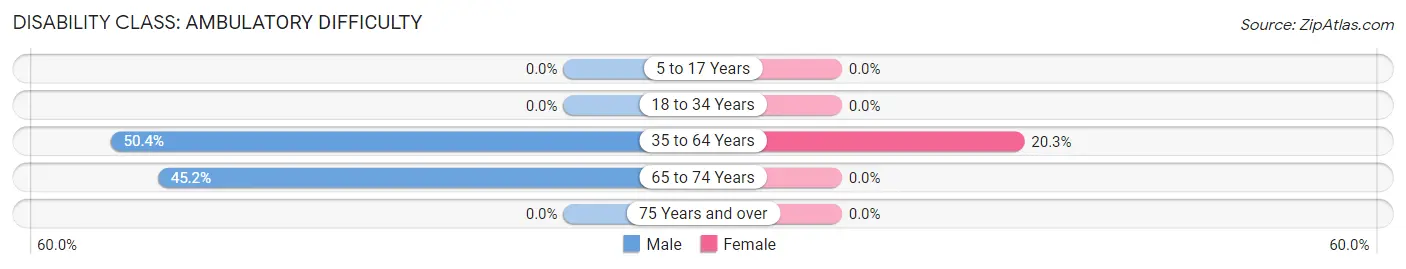
| Age Bracket | Male | Female |
| 5 to 17 Years | 0 (0.0%) | 0 (0.0%) |
| 18 to 34 Years | 0 (0.0%) | 0 (0.0%) |
| 35 to 64 Years | 61 (50.4%) | 25 (20.3%) |
| 65 to 74 Years | 28 (45.2%) | 0 (0.0%) |
| 75 Years and over | 0 (0.0%) | 0 (0.0%) |
Disability Class: Self-Care Difficulty
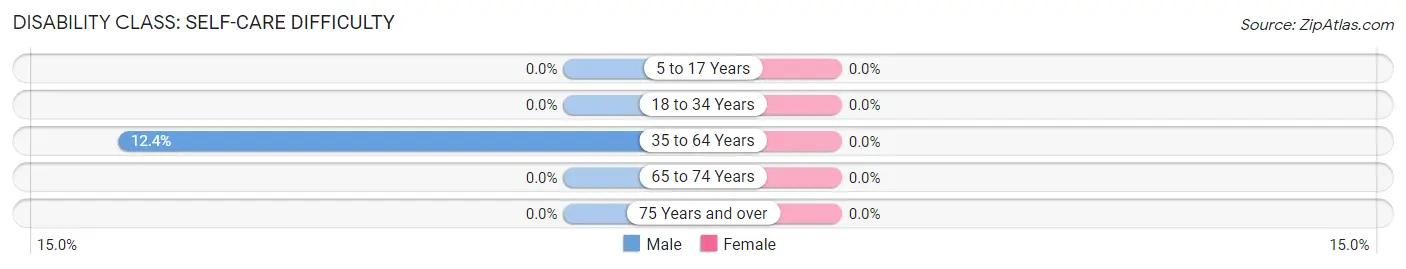
| Age Bracket | Male | Female |
| 5 to 17 Years | 0 (0.0%) | 0 (0.0%) |
| 18 to 34 Years | 0 (0.0%) | 0 (0.0%) |
| 35 to 64 Years | 15 (12.4%) | 0 (0.0%) |
| 65 to 74 Years | 0 (0.0%) | 0 (0.0%) |
| 75 Years and over | 0 (0.0%) | 0 (0.0%) |
Technology Access in Cerulean
Computing Device Access in Cerulean
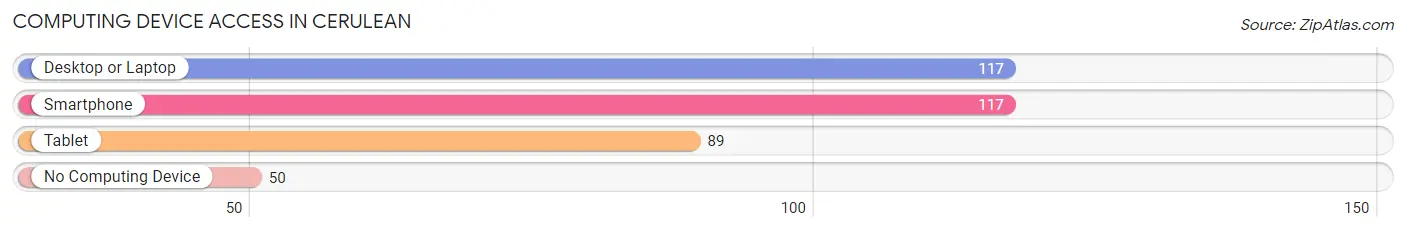
| Device Type | # Households | % Households |
| Desktop or Laptop | 117 | 60.0% |
| Smartphone | 117 | 60.0% |
| Tablet | 89 | 45.6% |
| No Computing Device | 50 | 25.6% |
| Total | 195 | 100.0% |
Internet Access in Cerulean
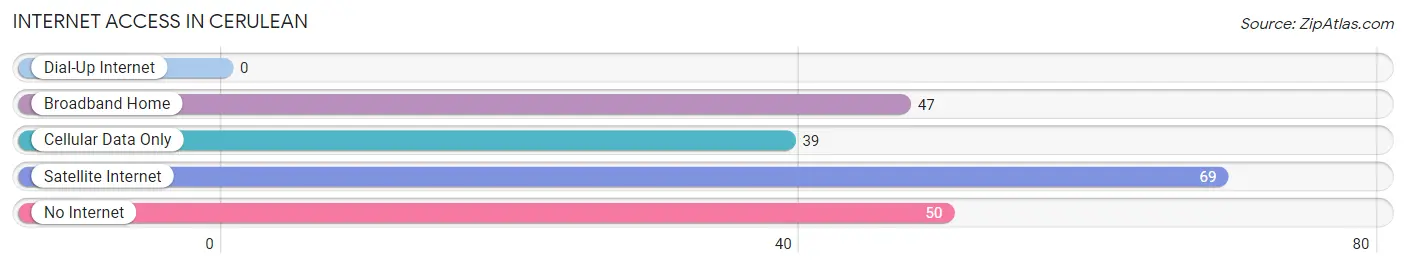
| Internet Type | # Households | % Households |
| Dial-Up Internet | 0 | 0.0% |
| Broadband Home | 47 | 24.1% |
| Cellular Data Only | 39 | 20.0% |
| Satellite Internet | 69 | 35.4% |
| No Internet | 50 | 25.6% |
| Total | 195 | 100.0% |
Cerulean Summary
Cerulean is a small city located in Christian County, Kentucky. It is situated in the western part of the state, about 20 miles north of the Tennessee border. The city has a population of approximately 1,500 people and is part of the Hopkinsville, Kentucky Metropolitan Statistical Area.
History
Cerulean was founded in 1820 by a group of settlers from Virginia. The city was named after the blue-green color of the nearby Cumberland River. The city was incorporated in 1837 and has remained a small, rural community ever since.
The city was an important stop on the Louisville and Nashville Railroad, which ran through the city from 1859 to 1971. The railroad brought economic growth to the area, and the city was home to several factories and businesses.
Geography
Cerulean is located in western Kentucky, about 20 miles north of the Tennessee border. The city is situated in the Pennyrile region of the state, which is characterized by rolling hills and fertile farmland. The city is located on the banks of the Cumberland River, which provides a scenic backdrop for the city.
The city has a total area of 1.3 square miles, all of which is land. The city is located at an elevation of 486 feet above sea level.
Economy
Cerulean’s economy is largely based on agriculture. The city is home to several farms, which produce a variety of crops, including corn, soybeans, and wheat. The city is also home to several small businesses, including restaurants, retail stores, and service providers.
Demographics
As of the 2010 census, Cerulean had a population of 1,500 people. The racial makeup of the city was 95.3% White, 2.7% African American, 0.2% Native American, 0.2% Asian, 0.2% from other races, and 1.3% from two or more races. Hispanic or Latino of any race were 0.7% of the population.
The median income for a household in the city was $31,250, and the median income for a family was $37,500. The per capita income for the city was $15,945. About 15.3% of families and 17.3% of the population were below the poverty line, including 22.2% of those under age 18 and 11.1% of those age 65 or over.
Conclusion
Cerulean is a small city located in western Kentucky. It was founded in 1820 and has remained a small, rural community ever since. The city is situated on the banks of the Cumberland River and is home to several farms and small businesses. The city has a population of 1,500 people, with a median income of $31,250. Cerulean is a peaceful, rural community that offers a unique quality of life.
Common Questions
What is Per Capita Income in Cerulean?
Per Capita income in Cerulean is $24,195.
What is the Median Family Income in Cerulean?
Median Family Income in Cerulean is $77,750.
What is the Median Household income in Cerulean?
Median Household Income in Cerulean is $54,330.
What is Inequality or Gini Index in Cerulean?
Inequality or Gini Index in Cerulean is 0.34.
What is the Total Population of Cerulean?
Total Population of Cerulean is 419.
What is the Total Male Population of Cerulean?
Total Male Population of Cerulean is 216.
What is the Total Female Population of Cerulean?
Total Female Population of Cerulean is 203.
What is the Ratio of Males per 100 Females in Cerulean?
There are 106.40 Males per 100 Females in Cerulean.
What is the Ratio of Females per 100 Males in Cerulean?
There are 93.98 Females per 100 Males in Cerulean.
What is the Median Population Age in Cerulean?
Median Population Age in Cerulean is 48.8 Years.
What is the Average Family Size in Cerulean
Average Family Size in Cerulean is 2.5 People.
What is the Average Household Size in Cerulean
Average Household Size in Cerulean is 2.1 People.
How Large is the Labor Force in Cerulean?
There are 199 People in the Labor Forcein in Cerulean.
What is the Percentage of People in the Labor Force in Cerulean?
49.5% of People are in the Labor Force in Cerulean.